Embed Size (px)
Citation preview

The Astrophysical Journal, 726:35 (17pp), 2011 January 1 doi:10.1088/0004-637X/726/1/35C© 2011. The American Astronomical Society. All rights reserved. Printed in the U.S.A.
FERMI-LAT SEARCH FOR PULSAR WIND NEBULAE AROUND GAMMA-RAY PULSARS
M. Ackermann1, M. Ajello
1, L. Baldini
2, J. Ballet
3, G. Barbiellini
4,5, D. Bastieri
6,7, K. Bechtol
1, R. Bellazzini
2,
B. Berenji1, E. D. Bloom
1, E. Bonamente
8,9, A. W. Borgland
1, A. Bouvier
1, J. Bregeon
2, A. Brez
2, M. Brigida
10,11,
P. Bruel12
, R. Buehler1, S. Buson
6,7, G. A. Caliandro
13, R. A. Cameron
1, F. Camilo
14, P. A. Caraveo
15,
J. M. Casandjian3, C. Cecchi
8,9, O. Celik
16,17,18, E. Charles
1, A. Chekhtman
19,20, C. C. Cheung
19,21, J. Chiang
1,
S. Ciprini9, R. Claus
1, I. Cognard
22,23, J. Cohen-Tanugi
24, J. Conrad
25,26,58, C. D. Dermer
19, A. de Angelis
27,
A. de Luca28
, F. de Palma10,11
, S. W. Digel1, E. do Couto e Silva
1, P. S. Drell
1, R. Dubois
1, D. Dumora
29, C. Favuzzi
10,11,
W. B. Focke1, M. Frailis
27,30, Y. Fukazawa
31, S. Funk
1, P. Fusco
10,11, F. Gargano
11, S. Germani
8,9, N. Giglietto
10,11,
P. Giommi32
, F. Giordano10,11
, M. Giroletti33
, T. Glanzman1, G. Godfrey
1, I. A. Grenier
3, M.-H. Grondin
29, J. E. Grove
19,
L. Guillemot29,34
, S. Guiriec35
, D. Hadasch13
, Y. Hanabata31
, A. K. Harding16
, K. Hayashi31
, E. Hays16
, G. Hobbs36
,
R. E. Hughes37
, G. Johannesson1, A. S. Johnson
1, W. N. Johnson
19, S. Johnston
36, T. Kamae
1, H. Katagiri
31,
J. Kataoka38
, M. Keith36
, M. Kerr39
, J. Knodlseder40
, M. Kramer34,41
, M. Kuss2, J. Lande
1, L. Latronico
2, S.-H. Lee
1,
M. Lemoine-Goumard29
, F. Longo4,5
, F. Loparco10,11
, M. N. Lovellette19
, P. Lubrano8,9
, A. G. Lyne41
, A. Makeev19,20
,
M. Marelli15
, M. N. Mazziotta11
, J. E. McEnery16,42
, J. Mehault24
, P. F. Michelson1, T. Mizuno
31, A. A. Moiseev
17,42,
C. Monte10,11
, M. E. Monzani1, A. Morselli
43, I. V. Moskalenko
1, S. Murgia
1, T. Nakamori
38, M. Naumann-Godo
3,
P. L. Nolan1, A. Noutsos
34, E. Nuss
24, T. Ohsugi
44, A. Okumura
45, J. F. Ormes
46, D. Paneque
1, J. H. Panetta
1,
D. Parent19,20
, V. Pelassa24
, M. Pepe8,9
, M. Pesce-Rollins2, F. Piron
24, T. A. Porter
1, S. Raino
10,11, R. Rando
6,7,
S. M. Ransom47
, P. S. Ray19
, M. Razzano2, N. Rea
13, A. Reimer
1,48, O. Reimer
1,48, T. Reposeur
29, J. Ripken
25,26, S. Ritz
49,
R. W. Romani1, H. F.-W. Sadrozinski
49, A. Sander
37, P. M. Saz Parkinson
49, C. Sgro
2, E. J. Siskind
50, D. A. Smith
29,
P. D. Smith37
, G. Spandre2, P. Spinelli
10,11, M. S. Strickman
19, D. J. Suson
51, H. Takahashi
44, T. Takahashi
45, T. Tanaka
1,
J. B. Thayer1, J. G. Thayer
1, G. Theureau
22,23, D. J. Thompson
16, S. E. Thorsett
49, L. Tibaldo
3,6,7,59, D. F. Torres
13,52,
G. Tosti8,9
, A. Tramacere1,53,54
, Y. Uchiyama1, T. Uehara
31, T. L. Usher
1, J. Vandenbroucke
1, A. Van Etten
1,
V. Vasileiou17,18
, N. Vilchez40
, V. Vitale43,55
, A. P. Waite1, P. Wang
1, P. Weltevrede
41, B. L. Winer
37, K. S. Wood
19,
Z. Yang25,26
, T. Ylinen26,56,57
, and M. Ziegler49
1 W. W. Hansen Experimental Physics Laboratory, Kavli Institute for Particle Astrophysics and Cosmology, Department of Physics and SLAC National AcceleratorLaboratory, Stanford University, Stanford, CA 94305, USA; [email protected], [email protected]
2 Istituto Nazionale di Fisica Nucleare, Sezione di Pisa, I-56127 Pisa, Italy3 Laboratoire AIM, CEA-IRFU/CNRS/Universite Paris Diderot, Service d’Astrophysique, CEA Saclay, 91191 Gif sur Yvette, France
4 Istituto Nazionale di Fisica Nucleare, Sezione di Trieste, I-34127 Trieste, Italy5 Dipartimento di Fisica, Universita di Trieste, I-34127 Trieste, Italy
6 Istituto Nazionale di Fisica Nucleare, Sezione di Padova, I-35131 Padova, Italy7 Dipartimento di Fisica “G. Galilei,” Universita di Padova, I-35131 Padova, Italy8 Istituto Nazionale di Fisica Nucleare, Sezione di Perugia, I-06123 Perugia, Italy9 Dipartimento di Fisica, Universita degli Studi di Perugia, I-06123 Perugia, Italy
10 Dipartimento di Fisica “M. Merlin” dell’Universita e del Politecnico di Bari, I-70126 Bari, Italy11 Istituto Nazionale di Fisica Nucleare, Sezione di Bari, 70126 Bari, Italy
12 Laboratoire Leprince-Ringuet, Ecole polytechnique, CNRS/IN2P3, Palaiseau, France13 Institut de Ciencies de l’Espai (IEEC-CSIC), Campus UAB, 08193 Barcelona, Spain
14 Columbia Astrophysics Laboratory, Columbia University, New York, NY 10027, USA15 INAF-Istituto di Astrofisica Spaziale e Fisica Cosmica, I-20133 Milano, Italy
16 NASA Goddard Space Flight Center, Greenbelt, MD 20771, USA; [email protected] Center for Research and Exploration in Space Science and Technology (CRESST) and NASA Goddard Space Flight Center, Greenbelt, MD 20771, USA
18 Department of Physics and Center for Space Sciences and Technology, University of Maryland Baltimore County, Baltimore, MD 21250, USA19 Space Science Division, Naval Research Laboratory, Washington, DC 20375, USA
20 George Mason University, Fairfax, VA 22030, USA21 National Research Council Research Associate, National Academy of Sciences, Washington, DC 20001, USA
22 Laboratoire de Physique et Chemie de l’Environnement, LPCE UMR 6115 CNRS, F-45071 Orleans Cedex 02, France23 Station de radioastronomie de Nancay, Observatoire de Paris, CNRS/INSU, F-18330 Nancay, France
24 Laboratoire de Physique Theorique et Astroparticules, Universite Montpellier 2, CNRS/IN2P3, Montpellier, France25 Department of Physics, Stockholm University, AlbaNova, SE-106 91 Stockholm, Sweden
26 The Oskar Klein Centre for Cosmoparticle Physics, AlbaNova, SE-106 91 Stockholm, Sweden27 Dipartimento di Fisica, Universita di Udine and Istituto Nazionale di Fisica Nucleare, Sezione di Trieste, Gruppo Collegato di Udine, I-33100 Udine, Italy
28 Istituto Universitario di Studi Superiori (IUSS), I-27100 Pavia, Italy29 Universite Bordeaux 1, CNRS/IN2p3, Centre d’Etudes Nucleaires de Bordeaux Gradignan, 33175 Gradignan, France; [email protected],
[email protected] Osservatorio Astronomico di Trieste, Istituto Nazionale di Astrofisica, I-34143 Trieste, Italy
31 Department of Physical Sciences, Hiroshima University, Higashi-Hiroshima, Hiroshima 739-8526, Japan32 Agenzia Spaziale Italiana (ASI) Science Data Center, I-00044 Frascati (Roma), Italy
33 INAF Istituto di Radioastronomia, 40129 Bologna, Italy34 Max-Planck-Institut fur Radioastronomie, Auf dem Hugel 69, 53121 Bonn, Germany
35 Center for Space Plasma and Aeronomic Research (CSPAR), University of Alabama in Huntsville, Huntsville, AL 35899, USA36 Australia Telescope National Facility, CSIRO, Epping NSW 1710, Australia
37 Department of Physics, Center for Cosmology and Astro-Particle Physics, The Ohio State University, Columbus, OH 43210, USA38 Research Institute for Science and Engineering, Waseda University, 3-4-1, Okubo, Shinjuku, Tokyo, 169-8555 Japan
39 Department of Physics, University of Washington, Seattle, WA 98195-1560, USA40 Centre d’Etude Spatiale des Rayonnements, CNRS/UPS, BP 44346, F-30128 Toulouse Cedex 4, France
1

The Astrophysical Journal, 726:35 (17pp), 2011 January 1 Ackermann et al.
41 Jodrell Bank Centre for Astrophysics, School of Physics and Astronomy, The University of Manchester, M13 9PL, UK42 Department of Physics and Department of Astronomy, University of Maryland, College Park, MD 20742, USA
43 Istituto Nazionale di Fisica Nucleare, Sezione di Roma “Tor Vergata,” I-00133 Roma, Italy44 Hiroshima Astrophysical Science Center, Hiroshima University, Higashi-Hiroshima, Hiroshima 739-8526, Japan45 Institute of Space and Astronautical Science, JAXA, 3-1-1 Yoshinodai, Sagamihara, Kanagawa 229-8510, Japan
46 Department of Physics and Astronomy, University of Denver, Denver, CO 80208, USA47 National Radio Astronomy Observatory (NRAO), Charlottesville, VA 22903, USA
48 Institut fur Astro- und Teilchenphysik and Institut fur Theoretische Physik, Leopold-Franzens-Universitat Innsbruck, A-6020 Innsbruck, Austria49 Santa Cruz Institute for Particle Physics, Department of Physics and Department of Astronomy and Astrophysics, University of California at Santa Cruz,
Santa Cruz, CA 95064, USA50 NYCB Real-Time Computing Inc., Lattingtown, NY 11560-1025, USA
51 Department of Chemistry and Physics, Purdue University Calumet, Hammond, IN 46323-2094, USA52 Institucio Catalana de Recerca i Estudis Avancats (ICREA), Barcelona, Spain
53 Consorzio Interuniversitario per la Fisica Spaziale (CIFS), I-10133 Torino, Italy54 INTEGRAL Science Data Centre, CH-1290 Versoix, Switzerland
55 Dipartimento di Fisica, Universita di Roma “Tor Vergata,” I-00133 Roma, Italy56 Department of Physics, Royal Institute of Technology (KTH), AlbaNova, SE-106 91 Stockholm, Sweden
57 School of Pure and Applied Natural Sciences, University of Kalmar, SE-391 82 Kalmar, SwedenReceived 2010 July 1; accepted 2010 October 28; published 2010 December 13
ABSTRACT
The high sensitivity of the Fermi-LAT (Large Area Telescope) offers the first opportunity to study faint and extendedGeV sources such as pulsar wind nebulae (PWNe). After one year of observation the LAT detected and identifiedthree PWNe: the Crab Nebula, Vela-X, and the PWN inside MSH 15–52. In the meantime, the list of LAT detectedpulsars increased steadily. These pulsars are characterized by high energy loss rates (E) from ∼3 × 1033 erg s−1
to 5 × 1038 erg s−1 and are therefore likely to power a PWN. This paper summarizes the search for PWNe inthe off-pulse windows of 54 LAT-detected pulsars using 16 months of survey observations. Ten sources showsignificant emission, seven of these likely being of magnetospheric origin. The detection of significant emission inthe off-pulse interval offers new constraints on the γ -ray emitting regions in pulsar magnetospheres. The three othersources with significant emission are the Crab Nebula, Vela-X, and a new PWN candidate associated with the LATpulsar PSR J1023−5746, coincident with the TeV source HESS J1023−575. We further explore the associationbetween the HESS and the Fermi source by modeling its spectral energy distribution. Flux upper limits derived forthe 44 remaining sources are used to provide new constraints on famous PWNe that have been detected at keVand/or TeV energies.
Key words: catalogs – gamma rays: general – pulsars: general
Online-only material: color figures
1. INTRODUCTION
Since the launch of the Fermi Gamma-Ray Space Telescope(formerly GLAST) the number of detected pulsars in thegamma-ray domain has dramatically increased. The list ofLarge Area Telescope (LAT) pulsars now contains 56 brightsources and certainly many more will be detected in the comingmonths. Yet most of the pulsar spin-down luminosity is notobserved as pulsed photon emission and is instead carried awayas a magnetized particle wind (Gaensler & Slane 2006). Thedeceleration of the pulsar-driven wind as it sweeps up ejectafrom the supernova explosion generates a termination shockat which the particles are pitch-angle scattered and furtheraccelerated to ultra-relativistic energies. The pulsar wind nebula(PWN) emission, including synchrotron and inverse Comptoncomponents, extends across the electromagnetic spectrum fromradio to TeV energies. PWNe studies can supply information onparticle acceleration mechanisms at relativistic shocks, on theevolution of the pulsar spin down and, at later phases, on theambient interstellar gas.
Despite the detection of 271 sources, EGRET could not firmlyidentify any PWNe besides the bright Crab Nebula. Most of
58 Royal Swedish Academy of Sciences Research Fellow, funded by a grantfrom the K. A. Wallenberg Foundation.59 Partially supported by the International Doctorate on Astroparticle Physics(IDAPP) program.
the 170 unidentified EGRET sources at low Galactic latitudes(|b| � 5◦) are associated with star-forming regions and hencemay be pulsars, PWNe, supernova remnants (SNRs), windsfrom massive stars, or high-mass X-ray binaries (e.g., Kaaret& Cottam 1996; Yadigaroglu & Romani 1997; Romero et al.1999). The early LAT observations (Abdo et al. 2010a) showthat Fermi is detecting many nearby young pulsars. All Fermi-LAT pulsars have a high energy loss rate (E), ranging from∼3 × 1033 erg s−1 to 5 × 1038 erg s−1. About a third of thesepulsars are associated with PWNe candidates observed in theTeV energy range by Cherenkov telescopes. These pulsars arethus likely to power a PWN detectable by Fermi. However, upto ∼10 GeV, the pulsed emission dominates the signal from theassociated PWN, as can be seen with the example of Vela-X(Pellizzoni et al. 2009; Abdo et al. 2010c). A search for PWNecandidates around all detected Fermi-LAT pulsars thus requiresthat one first removes the pulsar signal, thereby selecting onlythe unpulsed photons.
Here, we report on the analysis of the off-pulse emission of 54pulsars detected in the gamma-ray domain by Fermi-LAT using16 months of survey observations: 45 pulsars60 reported in Abdoet al. (2010a), the eight new blind search pulsars (Saz Parkinsonet al. 2010), and the millisecond pulsar PSR J0034−0534 (Abdo
60 The pulsar PSR J1747−2958 and its associated off-pulse emission will bestudied individually due to its proximity to the Galactic center.
2

The Astrophysical Journal, 726:35 (17pp), 2011 January 1 Ackermann et al.
et al. 2010e). The study of the PWN in MSH 15–52, reportedin Abdo et al. (2010h), did not require the selection of off-pulsephotons. Therefore, its associated pulsar PSR B1509−58 is notadded to our list of sources.
The primary objective of this study is to examine the proper-ties of the off-pulse emission of each pulsar and attempt to detectthe potential emission associated with its PWN. This first pop-ulation study in high-energy gamma rays allows us to addressastrophysical questions such as:
1. Do we see PWNe in all Fermi-LAT gamma-ray pulsars ? Ifnot, is it because of some specific properties of the pulsarwind or of the ambient medium ?
2. What is the gamma-ray efficiency of PWNe and whatphysical parameters determine its value in addition to thespin-down luminosity of the pulsar ?
3. What fraction of TeV PWNe candidates are detected in theFermi-LAT energy range?
The structure of the paper is as follows. Section 2 describesthe LAT, Sections 3 and 4 present the timing and spectralanalyses, and the results are described in Section 5. Finally,our conclusions are summarized in Section 6.
2. LAT DESCRIPTION AND OBSERVATIONS
The LAT is a gamma-ray telescope that detects photonsby conversion into electron–positron pairs and operates in theenergy range between 20 MeV and 300 GeV. It is made ofa high-resolution converter tracker (direction measurement ofthe incident gamma-rays), a CsI(Tl) crystal calorimeter (energymeasurement), and an anti-coincidence detector to identifythe background of charged particles (Atwood et al. 2009).In comparison to EGRET, the LAT has a larger effectivearea (∼8000 cm2 on-axis above 1 GeV), a broader field ofview (∼2.4 sr), and superior angular resolution (∼0.◦6 68%containment at 1 GeV for events converting in the front sectionof the tracker). Details of the instruments and data processingare given in Atwood et al. (2009). The on-orbit calibration isdescribed in Abdo et al. (2009a).
The following analysis used 16 months of data collectedfrom 2008 August 4 (MJD 54682), to 2009 December 16(MJD 55181), except for some pulsars for which portions ofthe observation period were rejected due to inadequate pulsarephemerides, reported in Table 1. The Diffuse class events wereselected (with the tightest background rejection). From thissample, we excluded gamma rays with a zenith angle largerthan 105◦ because of the possible contamination from Earthlimb photons. We used P6 V3 post-launch instrument responsefunctions (IRFs) that take into account pile-up and accidentalcoincidence effects in the detector subsystems.61
3. TIMING ANALYSIS
Most of the pulsars detected by Fermi-LAT are bright pointsources in the gamma-ray sky up to ∼10 GeV, though the Velapulsar is well detected up to 25 GeV (Abdo et al. 2010b).The study of their associated PWNe thus requires us to assignphases to the gamma-ray photons and select only those in an off-pulse window, thereby minimizing contributions from pulsars.We phase-folded photon dates using both the Fermi plug-inprovided by the LAT team and distributed with the TEMPO2
61 See http://fermi.gsfc.nasa.gov/ssc/data/analysis/documentation/Cicerone/Cicerone_LAT_IRFs/IRF_overview.html for more details.
pulsar timing package,62 as well as accurate timing solutionseither based on radio timing observations made at the JodrellBank (Hobbs et al. 2004), Nancay (Theureau et al. 2005), Parkes(Weltevrede et al. 2009) or Green Bank telescopes (Kaplan et al.2005), or on gamma-ray data recorded by the LAT (Ray et al.2010). Whenever possible, data from multiple radio telescopeswere combined to build timing solutions, thereby improvingtheir accuracy and expanding their time coverage.
The origins of the timing solutions used in this analysis canbe found in Table 1. For each pulsar, we list the observatoriesthat provided the data used to build the timing model. Forsome pulsars, we could not produce a timing solution providingaccurate knowledge of the rotational phase over the wholeobservation range due to glitch activity. In these cases, the timeintervals over which we lost phase-coherence were rejected.These intervals are given in the last column. Also listed in Table 1are the pulsar distance (see Abdo et al. 2010a; Saz Parkinsonet al. 2010; Theureau et al. 2010, for PSR J0248+6021) andthe definition of the off-pulse region. These off-pulse intervalsare chosen using the definition reported in previous Fermi-LATstudies (Abdo et al. 2010a, 2010e; Saz Parkinson et al. 2010)but narrowed slightly to minimize the contamination by pulsedphotons. A few notes on these timing solutions:
1. The rms of the timing residuals is below 0.5% of the pulsar’srotational period in most cases, but ranges as high as 3.6%for PSR J1846+0919 which has one of the lowest gamma-ray fluxes. This is adequate for the analysis performed forthis paper, as timing solutions are used only for rejectingpulsed photons.
2. Glitch activity was observed for 12 pulsars over the timerange considered here. These pulsars are labeled with a gin Table 1. In all cases, it was possible to model the glitchparameters in such a way that all the timing data couldbe used except for PSRs J0205+6449, J1413−6205, andJ1813−1246 where some data had to be rejected as shownin Table 1.
3. Timing solutions were built using radio timing datafor all radio-emitting pulsars except PSRs J1124−5916,J1741−2054, J1907+0602, and J2032+4127. The first isvery faint in radio and was more easily timed in gammarays. The three others were discovered recently (Camiloet al. 2009; Abdo et al. 2010g) and radio timing observa-tions were therefore unavailable for most of the gamma-raydata considered here. For pulsars without radio emission,timing solutions were built using the data recorded by theFermi-LAT only.
4. ANALYSIS OF THE Fermi-LAT DATA
The spectral analysis was performed using a maximum-likelihood method (Mattox et al. 1996) implemented in theFermi Science Support Center science tools as the “gtlike” code.This tool fits a source model to the data along with modelsfor the diffuse backgrounds. Owing to uncertainties in theinstrument performance still under investigation at low energies,only events in the 100 MeV–100 GeV energy band are analyzed.We used the map cube file gll iem v02.fit to model the Galacticdiffuse emission together with the corresponding tabulatedmodel isotropic iem v02.txt for the extragalactic diffuse andthe residual instrument emission.63 The off-pulse spectra were
62 http://sourceforge.net/projects/tempo2/63 Available from http://fermi.gsfc.nasa.gov/ssc/data/access/lat/BackgroundModels.html
3

The Astrophysical Journal, 726:35 (17pp), 2011 January 1 Ackermann et al.
Table 1Observatories, Off-pulse Definitions, and Distances of the 54 Pulsars Analyzed
PSR ObsID Off-pulse Definition Distance (kpc) Observation Period Rejected (MJD)
J0007+7303 g L 0.4–0.8 1.4 ± 0.3J0030+0451 N 0.7–1.1 0.300 ± 0.090J0034-0534 N 0.45–0.85J0205+6449 g G, J 0.7–1.0 2.6–3.2 54870–54940J0218+4232 N 0.9–1.1 2.5–4J0248+6021 g N 0.7–1.1 2.0 ± 0.2 55161–55181J0357+32 L 0.35–0.85J0437 − 4715 P 0.7–1.2 0.1563 ± 0.0013J0534+2200 N, J 0.5–0.85 2.0 ± 0.5J0613 − 0200 N 0.6–1.05 0.48+0.19
−0.11
J0631+1036 g N, J 0.9–1.15 0.75–3.62J0633+0632 L 0.6–0.8J0633+1746 L 0.67–0.87 0.250+0.120
−0.062
J0659+1414 N, J 0.45–1.0 0.288+0.033−0.027
J0742 − 2822 g N, J 0.8–1.4 2.07+1.38−1.07
J0751+1807 N 0.7–1.05 0.6+0.6−0.2
J0835 − 4510 P 0.7–1.0 0.287+0.019−0.017
J1023 − 5746 g L 0.85–1.13 2.4J1028 − 5819 P 0.8–1.05 2.33 ± 0.70J1044 − 5737 L 0.75–1.1 1.5J1048 − 5832 P 0.7–1.05 2.71 ± 0.81J1057 − 5226 P 0.7–0.2 0.72 ± 0.2J1124 − 5916 g L 0.92–0.08 4.8+0.7
−1.2
J1413 − 6205 g L 0.7–0.15 1.4 54682–54743J1418 − 6058 L 0.55–0.90 2–5J1420 − 6048 P 0.6–1.1 5.6 ± 1.7J1429 − 5911 L 0.85–0.1 1.6J1459 − 60 L 0.34–0.69J1509 − 5850 P 0.6–1.0 2.6 ± 0.8J1614 − 2230 G 0.92–1.14 1.27 ± 0.39J1709 − 4429 g P 0.65–1.1 1.4–3.6J1718 − 3825 N, P 0.65–1.15 3.82 ± 1.15J1732 − 31 L 0.54–0.89J1741 − 2054 L 0.67–1.18 0.38 ± 0.11J1744 − 1134 N 0.15–0.35 0.357+0.043
−0.035
J1809 − 2332 L 0.45–0.85 1.7 ± 1.0J1813 − 1246 g L 0.72–0.84 55084–55181J1826 − 1256 L 0.60–0.90J1833 − 1034 G 0.75–1.1 4.7 ± 0.4J1836+5925 L 0.16–0.28 <0.8J1846+0919 L 0.65–1.0 1.2J1907+06 L 0.51–0.91J1952+3252 J, N 0.7–1.0 2.0 ± 0.5J1954+2836 L 0.85–0.2 1.7J1957+5033 L 0.6–0.05 0.9J1958+2846 L 0.55–0.90J2021+3651 g G 0.75–1.05 2.1+2.1
−1.0
J2021+4026 L 0.16–0.36 1.5 ± 0.45J2032+4127 L 0.30–0.45 & 0.90–0.05 1.6–3.6J2043+2740 N, J 0.68–0.08 1.80 ± 0.54J2055+2539 L 0.6–0.1 0.4J2124 − 3358 N 0.1–0.5 0.25+0.25
−0.08
J2229+6114 g G, J 0.68–1.08 0.8–6.5J2238+59 L 0.65–0.90
Notes. Column 1 lists the pulsars; a “g” indicates that one or several glitches occurred during the observation period. For somepulsars, these glitches led us to restrict the data set to avoid any contamination of pulsed emission during the glitch: the observationperiod rejected in these cases is indicated in Column 5 (modified Julian day). Column 2 indicates the observatories that providedephemerides: “G,” Green Bank Telescope; “J,” Lovell telescope at Jodrell Bank; “L,” Large Area Telescope; “N,” Nancay RadioTelescope; “P,” Parkes radio telescope. Column 3 lists the off-pulse phase range used in the spectral analysis. Column 4 presents thebest-known distances of 54 the pulsars analyzed in this paper.
4

The Astrophysical Journal, 726:35 (17pp), 2011 January 1 Ackermann et al.
fit with a power-law model assuming a point source located atthe position of the pulsar. Nearby sources in the field of vieware extracted from Abdo et al. (2010i) and taken into accountin the study. Sources within 5◦ of the pulsar of interest andshowing a significant curvature index (Abdo et al. 2010i) wereleft free for the analysis assuming an exponential cut-off power-law model, while other neighboring sources were assigned fixedpower-law spectra unless the residuals showed clear indicationof variability from the 1FGL catalog.
To provide better estimates of the source spectrum and searchfor the best PWN candidates, we split the energy range intothree bands, from 100 MeV to 1 GeV, 1 to 10 GeV, and 10 to100 GeV. The uncertainties on the parameters were estimatedusing the quadratic development of the log(likelihood) aroundthe best fit. In addition to the spectral index Γ, which is a freeparameter in the fit, the important physical quantities are thephoton flux F0.1–100 (in units of photons cm−2 s−1) and theenergy flux G0.1–100 (in units of erg cm−2 s−1):
F0.1–100 =∫ 100 GeV
0.1 GeV
dN
dEdE, (1)
G0.1–100 =∫ 100 GeV
0.1 GeVE
dN
dEdE. (2)
These derived quantities are obtained from the primary fitparameters and corrected for the decreased exposure representedby the restriction to the off-pulse phase window. Their statisticaluncertainties are obtained using their derivatives with respect tothe primary parameters and the covariance matrix obtained fromthe fitting process. The estimate from the sum of the three bandsis on average within 30% of the flux obtained for the globalpower-law fit.
An additional difficulty with this search is that we mustaddress cases where the source flux is not significant in oneor all energy bands. For each off-pulse source analyzed, gtlikeprovides the test statistic, TS = 2Δlog(likelihood) betweenmodels with and without the source. The TS is therefore ameasure of the source significance, with TS = 25 correspondingto a significance of just over 4.5σ . Many sources have a TSvalue smaller than 25 in several bands or even in the completeenergy interval. In such cases, we replace the flux value from thelikelihood analysis by a 95% C.L. upper limit in Tables 2 and3. These upper limits were obtained using the Bayesian methodproposed by Helene (1983), assuming a photon index Γ = 2.
All fluxes and upper limits as well as the statistical uncertain-ties obtained using this procedure are summarized in Tables 2and 3 and were all cross-checked using an analysis tool de-veloped by the LAT team called “Sourcelike.” In this method,likelihood fitting is iterated through the data set to simultane-ously optimize the position and potential extension of a source,assuming spatially extended source models and taking into ac-count nearby sources as well as Galactic diffuse and isotropiccomponents in the fits. The results from this analysis, assum-ing a point-source model, are consistent with those from thelikelihood analysis.
In addition to this cross-check using sourcelike, we performeda second fit to the data with gtlike incorporating the results fromthe first maximum likelihood analysis for all sources other thanthe one being considered, so it has a good representation of thesurroundings of the source. This step returns a full TS maparound each source of interest. These TS maps do not show any
extended emission that could contaminate our source of interest(due to badly resolved diffuse background) at a TS level higherthan 16.
5. RESULTS
PWNe candidates were selected using two different criteria:
1. TS > 25 in the whole energy range (100 MeV–100 GeV).2. TS > 25 in one of the three energy bands (100 MeV–1 GeV,
1–10 GeV, 10–100 GeV).
As can be seen from Tables 2 and 3, 10 of the 54pulsars studied here satisfy one of these detection criteria:J0034−0534, J0534+2200 associated with the Crab Nebula(Abdo et al. 2010d), J0633+1746 (Geminga), J0835−4510 asso-ciated with the Vela-X PWN (Abdo et al. 2010c), J1023−5746,J1813−1246, J1836+5925, J2021+4026, J2055+2539, andJ2124−3358. A detailed study of the Crab Nebula with a modeladapted to the synchrotron component at low energy was per-formed in Abdo et al. (2010d) and enabled its clear detection andidentification by Fermi-LAT. Similarly, a detailed morphologi-cal and spectral analysis allowed the detection of the extendedemission from the Vela-X PWN (Abdo et al. 2010c).
Aside from the Crab and Vela pulsars, J1023−5746 is theonly candidate that shows off-pulse emission predominantlyabove 10 GeV, whereas the seven others are mainly detectedat low energy (below 10 GeV) which suggests a low energycutoff and therefore a pulsar origin. To provide further detailson these seven sources and ensure that the emission detected inthe off-pulse interval does not have a pulsar origin, we re-fittedall candidates using an exponential cutoff power-law spectralmodel; the results on the off-pulse emission of J1023−5746 arepresented in Section 5.2.
5.1. Magnetospheric Emission in the Off-pulse Window
We explored whether the exponential cutoff power-law spec-tral model is preferred over a simple power-law model bycomputing TScutoff = 2Δlog(likelihood) (comparable to a χ2
distribution with 1 degree of freedom) between the mod-els with and without the cutoff. The pulsars J0633+1746,J1836+5925, J2021+4026, and J2055+2539 present a signifi-cant cutoff (TScutoff � 9), J2124−3358 being at the edge. Pul-sars with TScutoff < 9 have poorly measured cutoff energies; inthis case (for J1813 −1246), we report in Table 4 the fit param-eters assuming a simple power law. We also determined if anextended uniform disk model (compared to the point-source hy-pothesis) better fits the data for each candidate. For this step, weused sourcelike and computed TSext = TSdisk − TSpoint. We didnot find any candidates with significant extension (TSext > 9).
The Fermi-LAT spectral points for each source listed inTable 4 were obtained by dividing the 100 MeV–60 GeV rangeinto six logarithmically spaced energy bins and performing amaximum likelihood spectral analysis in each interval, assuminga power-law shape for the source with a fixed photon index. Theresults, renormalized to the total phase interval, are presented inFigures 1 and 2 together with the maximum likelihood fit in thewhole energy range, assuming an exponential cutoff power law(dashed blue line) or a power law (dot-dashed green line). Thisanalysis is more reliable than a direct fit to the spectral pointsof Figures 1 and 2 since it accounts for Poisson statistics of thedata.
Three different systematic uncertainties can affect the resultsderived with this analysis. The main systematic at low energy
5
The Astrophysical Journal, 726:35 (17pp), 2011 January 1 Ackermann et al.
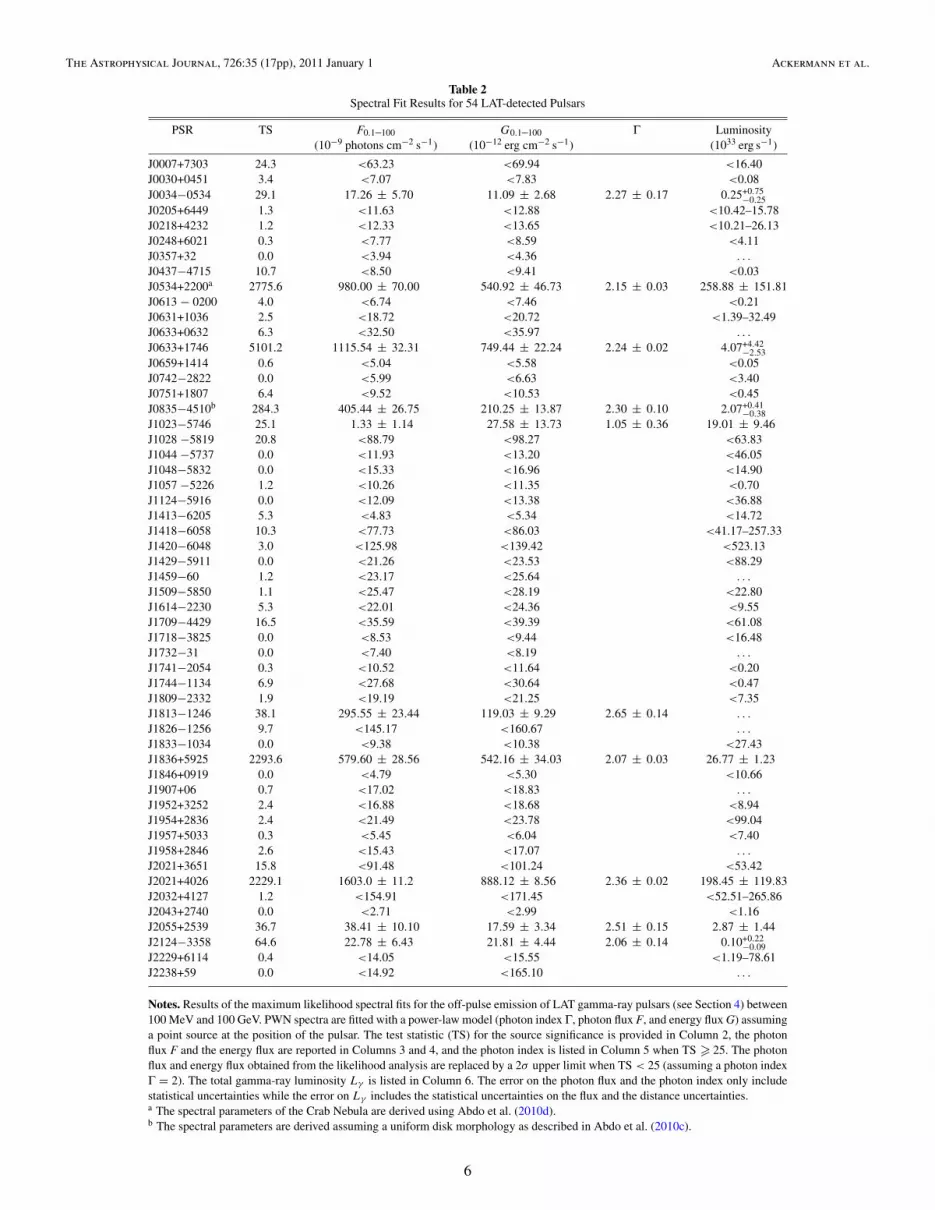
Table 2Spectral Fit Results for 54 LAT-detected Pulsars
PSR TS F0.1–100 G0.1–100 Γ Luminosity(10−9 photons cm−2 s−1) (10−12 erg cm−2 s−1) (1033 erg s−1)
J0007+7303 24.3 <63.23 <69.94 <16.40J0030+0451 3.4 <7.07 <7.83 <0.08J0034−0534 29.1 17.26 ± 5.70 11.09 ± 2.68 2.27 ± 0.17 0.25+0.75
−0.25J0205+6449 1.3 <11.63 <12.88 <10.42–15.78J0218+4232 1.2 <12.33 <13.65 <10.21–26.13J0248+6021 0.3 <7.77 <8.59 <4.11J0357+32 0.0 <3.94 <4.36 . . .
J0437−4715 10.7 <8.50 <9.41 <0.03J0534+2200a 2775.6 980.00 ± 70.00 540.92 ± 46.73 2.15 ± 0.03 258.88 ± 151.81J0613 − 0200 4.0 <6.74 <7.46 <0.21J0631+1036 2.5 <18.72 <20.72 <1.39–32.49J0633+0632 6.3 <32.50 <35.97 . . .
J0633+1746 5101.2 1115.54 ± 32.31 749.44 ± 22.24 2.24 ± 0.02 4.07+4.42−2.53
J0659+1414 0.6 <5.04 <5.58 <0.05J0742−2822 0.0 <5.99 <6.63 <3.40J0751+1807 6.4 <9.52 <10.53 <0.45J0835−4510b 284.3 405.44 ± 26.75 210.25 ± 13.87 2.30 ± 0.10 2.07+0.41
−0.38J1023−5746 25.1 1.33 ± 1.14 27.58 ± 13.73 1.05 ± 0.36 19.01 ± 9.46J1028 −5819 20.8 <88.79 <98.27 <63.83J1044 −5737 0.0 <11.93 <13.20 <46.05J1048−5832 0.0 <15.33 <16.96 <14.90J1057 −5226 1.2 <10.26 <11.35 <0.70J1124−5916 0.0 <12.09 <13.38 <36.88J1413−6205 5.3 <4.83 <5.34 <14.72J1418−6058 10.3 <77.73 <86.03 <41.17–257.33J1420−6048 3.0 <125.98 <139.42 <523.13J1429−5911 0.0 <21.26 <23.53 <88.29J1459−60 1.2 <23.17 <25.64 . . .
J1509−5850 1.1 <25.47 <28.19 <22.80J1614−2230 5.3 <22.01 <24.36 <9.55J1709−4429 16.5 <35.59 <39.39 <61.08J1718−3825 0.0 <8.53 <9.44 <16.48J1732−31 0.0 <7.40 <8.19 . . .
J1741−2054 0.3 <10.52 <11.64 <0.20J1744−1134 6.9 <27.68 <30.64 <0.47J1809−2332 1.9 <19.19 <21.25 <7.35J1813−1246 38.1 295.55 ± 23.44 119.03 ± 9.29 2.65 ± 0.14 . . .
J1826−1256 9.7 <145.17 <160.67 . . .
J1833−1034 0.0 <9.38 <10.38 <27.43J1836+5925 2293.6 579.60 ± 28.56 542.16 ± 34.03 2.07 ± 0.03 26.77 ± 1.23J1846+0919 0.0 <4.79 <5.30 <10.66J1907+06 0.7 <17.02 <18.83 . . .
J1952+3252 2.4 <16.88 <18.68 <8.94J1954+2836 2.4 <21.49 <23.78 <99.04J1957+5033 0.3 <5.45 <6.04 <7.40J1958+2846 2.6 <15.43 <17.07 . . .
J2021+3651 15.8 <91.48 <101.24 <53.42J2021+4026 2229.1 1603.0 ± 11.2 888.12 ± 8.56 2.36 ± 0.02 198.45 ± 119.83J2032+4127 1.2 <154.91 <171.45 <52.51–265.86J2043+2740 0.0 <2.71 <2.99 <1.16J2055+2539 36.7 38.41 ± 10.10 17.59 ± 3.34 2.51 ± 0.15 2.87 ± 1.44J2124−3358 64.6 22.78 ± 6.43 21.81 ± 4.44 2.06 ± 0.14 0.10+0.22
−0.09J2229+6114 0.4 <14.05 <15.55 <1.19–78.61J2238+59 0.0 <14.92 <165.10 . . .
Notes. Results of the maximum likelihood spectral fits for the off-pulse emission of LAT gamma-ray pulsars (see Section 4) between100 MeV and 100 GeV. PWN spectra are fitted with a power-law model (photon index Γ, photon flux F, and energy flux G) assuminga point source at the position of the pulsar. The test statistic (TS) for the source significance is provided in Column 2, the photonflux F and the energy flux are reported in Columns 3 and 4, and the photon index is listed in Column 5 when TS � 25. The photonflux and energy flux obtained from the likelihood analysis are replaced by a 2σ upper limit when TS < 25 (assuming a photon indexΓ = 2). The total gamma-ray luminosity Lγ is listed in Column 6. The error on the photon flux and the photon index only includestatistical uncertainties while the error on Lγ includes the statistical uncertainties on the flux and the distance uncertainties.a The spectral parameters of the Crab Nebula are derived using Abdo et al. (2010d).b The spectral parameters are derived assuming a uniform disk morphology as described in Abdo et al. (2010c).
6

The Astrophysical Journal, 726:35 (17pp), 2011 January 1 Ackermann et al.
Table 3Spectral Fit Results for 54 LAT-detected Pulsars
PSR 0.1–1 GeV 1–10 GeV 10–100 GeV
TS F0.1–1 Γ TS F1–10 Γ TS F10–100 Γ(10−9 photons cm−2 s−1) (10−9 photons cm−2 s−1) (10−9 photons cm−2 s−1)
J0007+7303 22.8 <54.39 9.2 <2.75 0.0 <0.24J0030+0451 6.3 <17.11 3.7 <0.67 0.0 <0.18J0034-0534 26.9 12.36 ± 7.15 1.47 ± 0.60 16.5 0.97 ± 0.35 3.14 ± 0.78 0.0 <0.17J0205+6449 0.0 <12.35 2.5 <1.99 1.6 <0.30J0218+4232 0.3 <24.46 1.1 <1.39 0.0 <0.47J0248+6021 0.0 <5.40 0.0 <0.35 0.3 <0.25J0357+32 0.0 <9.15 0.0 <0.56 0.0 <0.14J0437−4715 4.1 <13.83 8.7 <0.94 0.0 <0.18J0534+2200a 1054.5 785.14 ± 45.37 3.20 ± 0.07 1206.9 22.93 ± 1.44 1.59 ± 0.10 830.7 5.12 ± 0.56 1.91 ± 0.19J0613−0200 5.5 <26.97 0.5 <0.72 0.0 <0.16J0631+1036 4.6 <49.87 0.27 <0.18 0.0 <1.11J0633+0632 7.4 <67.47 1.3 <2.85 0.0 <0.42J0633+1746 3377.3 837.66 ± 32.20 1.81 ± 0.05 2028.4 65.41 ± 3.08 3.26 ± 0.11 0.0 <0.35J0659+1414 0.5 <11.94 1.7 <0.59 0.0 <0.13J0742−2822 0.0 <24.54 0.0 <0.94 0.0 <0.13J0751+1807 1.7 <13.99 11.4 <1.46 0.0 <0.19J0835−4510b 199.8 329.76 ± 34.54 2.15 ± 0.11 97.9 18.36 ± 2.33 2.22 ± 0.20 2.4 <0.89J1023−5746 0.0 <12.55 0.9 <2.42 17.2 0.46 ± 0.22 1.02 ± 0.73J1028−5819 15.8 <180.07 15.0 <7.18 0.0 <0.53J1044−5737 0.6 <45.53 0.0 <1.46 0.0 <0.36J1048−5832 0.0 <40.52 0.4 <2.12 0.0 <0.33J1057−5226 0.8 <22.44 2.4 <1.33 0.0 <0.21J1124−5916 0.0 <49.42 0.2 <2.52 0.0 <0.49J1413−6205 2.8 <55.63 11.8 <6.77 0.0 <0.37J1418−6058 5.2 <94.24 6.9 <10.28 1.1 <0.66J1420−6048 6.7 <291.45 0.0 <9.62 1.1 <0.83J1429−5911 0.0 <54.23 0.0 <3.25 0.0 <0.48J1459−60 5.0 <68.17 0.1 <1.76 1.5 <0.56J1509−5850 0.7 <65.47 0.4 <3.33 0.0 <0.33J1614−2230 2.5 <34.37 7.7 <2.30 0.0 <0.43J1709−4429 15.5 <96.67 3.3 <2.36 0.0 <0.22J1718−3825 0.5 <56.84 0.0 <0.92 0.1 <0.24J1732−31 0.0 <35.79 0.0 <1.09 0.0 <0.25J1741−2054 0.9 <27.77 4.4 <1.40 0.0 <0.14J1744−1134 10.3 <71.71 4.9 <1.92 0.0 <0.45J1809−2332 2.8 <50.50 8.8 <2.40 1.2 <0.27J1813−1246 32.7 261.21 ± 73.15 2.25 ± 0.27 16.3 8.43 ± 2.57 3.05 ± 0.69 3.6 <1.09J1826−1256 9.5 <251.30 3.4 <5.81 0.1 <0.38J1833−1034 0.0 <13.33 0.1 <1.67 0.2 <0.40J1836+5925 1381.5 401.84 ± 27.39 1.56 ± 0.09 1014.1 51.36 ± 3.89 2.93 ± 0.16 0.0 <0.74J1846+0919 0.0 <17.79 0.0 <0.61 0.0 <0.19J1907+06 1.9 <70.95 0.9 <2.33 0.0 <0.20J1952+3252 1.4 <50.81 1.3 <1.58 0.0 <0.23J1954+2836 1.4 <47.98 2.6 <2.55 0.0 <0.25J1957+5033 1.2 <16.35 0.2 <0.57 0.0 <0.17J1958+2846 0.0 <27.14 5.3 <1.78 0.0 <0.26J2021+3651 17.7 85.90 ± 30.02 1.90 ± 0.31 13.2 <4.50 0.0 <0.25J2021+4026 1718.2 1344.75 ± 55.56 2.03 ± 0.05 936.2 73.76 ± 3.93 3.04 ± 0.11 12.16 <1.24J2032+4127 3.5 <133.39 0.0 <2.08 1.3 <0.56J2043+2740 0.0 <9.73 0.0 <0.76 0.0 <0.17J2055+2539 35.3 16.06 ± 10.90 1.23 ± 0.76 23.3 1.53 ± 0.42 4.89 ± 0.75 0.0 <0.13J2124−3358 16.0 16.75 ± 12.17 1.83 ± 0.70 56.6 2.41 ± 0.54 2.34 ± 0.37 0.0 <0.21J2229+6114 4.2 <49.68 0.0 <1.36 0.0 <0.28J2238+59 2.5 <55.91 0.0 <1.54 0.0 <0.38
Notes. Results of the maximum likelihood spectral fits for the off-pulse emission of LAT gamma-ray pulsars (see Section 4). The off-pulse spectra were fit with apower-law model (photon index Γ and photon flux F) assuming a point source at the position of the pulsar. The results for the fits in the three energy bands are reported.The test statistic (TS) for the source significance is provided in Columns 2 (0.1–1 GeV)), 5 (1–10 GeV), and 8 (10–100 GeV). The photon flux F for each energy bandis reported in Columns 3, 6, and 9; it is replaced by a 2σ upper limit when TS < 25 (assuming a photon index Γ = 2). Columns 4, 7, and 10 list the photon index Γfor each energy band when TS � 25. Only statistical uncertainties are reported on the photon flux and the photon index.a The spectral parameters of the Crab Nebula are derived using Abdo et al. (2010d).b The spectral parameters are derived assuming a uniform disk morphology as described in Abdo et al. (2010c).
7

The Astrophysical Journal, 726:35 (17pp), 2011 January 1 Ackermann et al.
Energy (MeV)
210 310 410
]-1
s-2
dN
/dE
[er
g c
m2
E
-1210
-1110
Energy (MeV)
210 310 410
]-1
s-2
dN
/dE
[er
g c
m2
E
-1210
-1110
-1010
Energy (MeV)
210 310 410
]-1
s-2
dN
/dE
[er
g c
m2
E -1110
-1010
Energy (MeV)
210 310 410
]-1
s-2
dN
/dE
[er
g c
m2
E
-1110
-1010
Figure 1. Spectral energy distributions of the off-pulse emission of J0034−0534 (top left), J0633+1746 (top right), J1813−1246 (bottom left), and J1836+5925(bottom right), renormalized to the total phase interval. The LAT spectral points are obtained using the maximum likelihood method described in Section 5.1 intosix logarithmically spaced energy bins. The dot-dashed green line presents the result obtained by fitting a power law to the data in the 100 MeV–60 GeV energyrange using a maximum likelihood fit. The dashed blue line presents the exponential cutoff power-law model when it is favored with respect to a simple power law(TScutoff � 9, see Section 5.1). The statistical errors are shown in black, while the red lines take into account both the statistical and systematic errors as discussed inSection 5.1. A 95% C.L. upper limit is computed when the statistical significance is lower than 3σ .
(A color version of this figure is available in the online journal.)
Table 4Spectral Fitting of Pulsar Wind Nebula Candidates with Low Energy Component
PSR G0.1−100 Γ Ecutoff TScutoff
(10−12 erg cm−2 s−1) (GeV)
J0034−0534 7.33 ± 2.01 ± 1.30 0.62 ± 1.05 ± 0.27 0.7 ± 0.48 ± 0.10 9.0J0633+1746 544.01 ± 13.91 ± 54.58 1.51 ± 0.06 ± 0.12 1.41 ± 0.14 ± 0.09 247.2J1813−1246 116.24 ± 22.92 ± 79.28 2.65 ± 0.14 ± 0.26 1.2J1836+5925 349.64 ± 16.04 ± 28.05 1.33 ± 0.10 ± 0.06 1.60 ± 0.25 ± 0.04 99.8J2021+4026 737.14 ± 21.77 ± 125.06 1.87 ± 0.06 ± 0.20 2.24 ± 0.37 ± 0.51 110.2J2055+2539 12.23 ± 6.14 ± 6.09 0.30 ± 1.40 ± 0.69 0.43 ± 0.31 ± 0.07 22.4J2124−3358 13.27 ± 3.02 ± 2.77 0.88 ± 0.74 ± 0.34 1.71 ± 1.06 ± 0.59 10.4
Notes. Results of the maximum likelihood spectral fits for pulsars showing a significant signal in their off-pulse at low energy. The fits used anexponentially cutoff power-law model with the energy flux G0.1–100, photon index Γ, and cutoff energy Ecutoff are given in Columns 2–4. Thefirst errors represent the statistical error on the fit parameters, while the second ones are the systematic uncertainties as discussed in Section 5.1.The significance of an exponential cutoff (as compared to a simple power law) is indicated by TScutoff in Column 5. A value TScutoff < 9indicates that the two models are comparable and we report the fit parameters assuming a simple power-law model.
8

The Astrophysical Journal, 726:35 (17pp), 2011 January 1 Ackermann et al.
Energy (MeV)
210 310 410
]-1
s-2
dN
/dE
[er
g c
m2
E -1110
-1010
Energy (MeV)
210 310 410
]-1
s-2
dN
/dE
[er
g c
m2
E
-1210
-1110
Energy (MeV)
210 310 410
]-1
s-2
dN
/dE
[er
g c
m2
E
-1210
-1110
Figure 2. Spectral energy distributions of the off-pulse emission of J2021+4026 (top left), J2055+2539 (top right), and J2124−3358 (bottom), renormalized to thetotal phase interval. Same conventions as for Figure 1.
(A color version of this figure is available in the online journal.)
is due to the uncertainty in the Galactic diffuse emission.Different versions of the Galactic diffuse emission generatedby GALPROP were used to estimate this error in the case ofthe SNRs W51C and W49 (Abdo et al. 2009b, 2010k). Thedifference with the best-fit diffuse model is found to be � 6%.Therefore, we estimated this systematic error by changing thenormalization of the Galactic diffuse model artificially by ±6%.The second uncertainty, common to every source analyzedwith the LAT, is due to the uncertainties in the effectivearea. This systematic is estimated by using modified IRFswhose effective area bracket that of our nominal IRF. These“biased” IRFs are defined by envelopes above and below thenominal dependence of the effective area with energy by linearlyconnecting differences of (10%, 5%, 20%) at log(E) equal to(2, 2.75, 4), respectively. The third systematic is related to themorphology and spectrum of the source. Taking a power-lawspectral shape and a point-source morphology at the pulsarposition are strong assumptions that can affect the flux andthe spectral indices of the off-pulse component derived withthis simple analysis, as has been demonstrated for the case ofthe Vela-X pulsar (Abdo et al. 2010c). A more detailed analysis
of each source is beyond the scope of this paper and must behandled on a case-by-case basis. We combine the other twosystematic errors in quadrature to estimate the total systematicerror at each energy and propagate it through the fit modelparameters reported in Table 4.
The lack of extended emission and the significant spectral cut-offs at low energies (from 0.43 to 1.71 GeV) suggest that the off-pulse emission detected by Fermi-LAT is likely magnetosphericand that we do not observe PWNe for J0633+1736, J1836+5925,J2021+4026, J2055+2539, and J2124−3358. This was alreadysuggested in previous Fermi-LAT publications on the first twopulsars, J0633+1746 (Abdo et al. 2010j) and J1836+5925 (Abdoet al. 2010f).
The cases of the Fermi-LAT pulsar PSR J1813−1246 andthe millisecond pulsar J0034−0534 are harder to handle due tothe limited statistics. For J0034−0534 an unpulsed componentof emission from particle acceleration in the wind terminationshock might be expected since this pulsar is in a binary system,though the two-pole caustic (TPC) model also predicts a faintsignal in the off-pulse window of J0034−0534. In the case ofJ1813−1246, which shows a steep spectrum with no significant
9

The Astrophysical Journal, 726:35 (17pp), 2011 January 1 Ackermann et al.
cutoff, we cannot rule out the PWN origin with the currentstatistics. We therefore cannot definitely determine the origin ofthe emission detected by Fermi-LAT for these two candidates.
5.2. A Plausible Pulsar Wind Nebula Candidate Powered byPSR J1023−5746
5.2.1. Fermi-LAT Results on the Off-pulse Emission ofPSR J1023 −5746
In 2007, HESS reported the detection of very high energygamma rays from an extended source, HESS J1023−575,in the direction of the young stellar cluster Westerlund 2(Aharonian et al. 2007). Four scenarios to explain the TeVemission were suggested: colliding stellar winds in the WR20a binary system (although this scenario can hardly reproducethe observed source extension of 0.◦18), collective effects ofstellar winds in the Westerlund 2 cluster (although the clusterangular extent is smaller than that of the very high energygamma ray emission), diffusive shock acceleration in the wind-blown bubble itself, and supersonic winds breaking out into theinterstellar medium. Recently, Fermi-LAT discovered the veryyoung (characteristic age of 4.6 kyr) and energetic (spin-downpower of 1.1 × 1037 erg s−1) pulsar J1023−5746, coincidentwith the TeV source HESS J1023−575 (Saz Parkinson et al.2010).
As noted above, J1023−5746 is the only candidate that doesnot show any off-pulse emission below 10 GeV, whereas itssignal above 10 GeV is >3σ . Therefore, an exponential cutoffpower-law model, as used for the seven other candidates, willnot represent the data properly. For these reasons, we decidedto analyze this source separately.
We searched for a significant source extension using source-like with a uniform disk hypothesis (compared to the point-source hypothesis). The difference in TS between the uniformdisk and the point-source hypothesis is negligible which demon-strates that the two models fit equally well with the current lim-ited statistics. We have also examined the correspondence of thegamma-ray emission with different source shapes by using gt-like with assumed multi-frequency templates. For this exercisewe compared the TS values of the point source, uniform disk,and Gaussian spatial models with values derived when using amorphological template from the HESS gamma-ray excess map(Aharonian et al. 2007). We did not find any significant improve-ment (difference in TS ∼ 3) between the different models andwe therefore cannot rule out a simple point-source morphology.
To further investigate the off-pulse spectrum and avoidreliance on a given spectral shape, we derived the spectralpoints by dividing the 100 MeV–100 GeV range into sixlogarithmically spaced energy bins and performing a maximumlikelihood spectral analysis in each interval assuming a pointsource at the position of the pulsar (as explained in Section 5.1).The result, renormalized to the total phase interval, is presentedin Figure 3 with a red point and arrows. The signal is onlysignificant above 10 GeV and is consistent with the HESSspectral points.
5.2.2. Broadband Modeling
The connection between the GeV flux as observed by Fermiand the TeV flux as seen by HESS supports a common originfor the gamma-ray emission. The extension of the HESS source,the off-pulse Fermi signal, and the energetics of this youngpulsar point toward a PWN origin. The very large number ofPWNe detected in the TeV energy range (the most numerous
Figure 3. Spectral energy distributions of the off-pulse emission ofPSR J1023−5746. The LAT spectral points (red) are obtained using the max-imum likelihood method described in Section 5.2.1 in seven logarithmicallyspaced energy bins. A 95% C.L. upper limit is computed when the statisticalsignificance is lower than 3σ . The blue points represent the HESS spectralpoints (Aharonian et al. 2007). The Suzaku upper limit is shown with a greenarrow (Fujita et al. 2009). The black line denotes the total synchrotron andCompton emission from the nebula as described in Section 5.2.2. Thin curvesindicate the Compton components from scattering on the CMB (long-dashed),IR (medium-dashed), and stellar (dotted) photons.
(A color version of this figure is available in the online journal.)
class of Galactic TeV sources) and the significant number ofPWNe associated with Fermi-LAT pulsars make this scenariohighly probable. Analysis of CO emission and 21 cm absorptionalong the line of sight to Westerlund 2 gives a kinematicdistance of 6.0 ± 1.0 kpc to the star cluster (Dame 2007). Theassumption that TeV emission stems from the pulsar associatingPSR J1023−5746 with Westerlund 2 is problematic, however.The 8′ separation of the pulsar and the cluster imply an extremelyhigh transverse velocity of ∼ 3000 km s−1 for a 6 kpc distanceand the pulsar’s characteristic age of 4.6 kyr. In addition,the 0.◦18 extension of HESS J1023−757 is equivalent to 19pc at a distance of 6 kpc, which predicts a very fast meanexpansion velocity of 4000 km s−1 over 4.6 kyr. The pulsarpseudo-luminosity distance places it much closer at 2.4 kpc(based on inferred beaming and gamma-ray efficiencies), thoughthe scatter in inferred luminosities in radio-loud LAT pulsarstranslates to uncertainties in this estimate of the order of factorsof 2–3 (Saz Parkinson et al. 2010). Both pulsar efficiency andPWN expansion velocity would be anomalously high at 6 kpc,so we adopt the pseudo-distance of 2.4 kpc. At this distance thepulsar spin-down power (1.1 × 1037 erg s−1) can easily accountfor the Very High Energy (VHE) luminosity above 380 GeV of1.4 × 1034 d2
2.4 erg s−1.At longer wavelengths the vicinity of Westerlund 2 has
undergone extensive study. Archival Chandra data indicatea faint source coincident with PSR J1023−5746, with anX-ray index of Γ = 1.2 ± 0.1, and unabsorbed 0.5–8 keVflux of 1.3+0.5
−0.3 × 10⁻¹³ erg cm−2 s−1, though this does not affectmodeling of the extended nebula. Recent Suzaku observations(Fujita et al. 2009) found no sign of diffuse non-thermal
10

The Astrophysical Journal, 726:35 (17pp), 2011 January 1 Ackermann et al.
emission within the TeV contours and placed a 0.7–2 keV upperlimit on the diffuse flux from the entire XIS field of view of2.6×10−12 erg cm−2 s−1. Fujita and Collaborators also note thatit is unlikely that strong X-ray emission extends beyond this fieldsince their upper limit is consistent with the one derived usingthe wide HXD field (34′ × 34′). Investigations of molecularclouds toward Westerlund 2 (Fukui et al. 2009) show features ofa few ×104M�, though CO observations indicate a low densityof gas (likely n < 1 cm−3) in the region that coincides with thebulk of the TeV emission. Radio observations of RCW 49 (theH ii complex surrounding Westerlund 2) found a flux of 210 Jy at843 MHz in the core (Whiteoak & Uchida 1997); this providesa non-constraining upper limit on the radio flux correspondingto the gamma-ray source.
We computed SEDs (spectral energy distributions) fromevolving electron populations over the lifetime of the pulsarin a series of time steps, as described in Abdo et al. (2010c). Aspulsars spin down, they dissipate rotational kinetic energy via
E = IΩΩ (3)
with Ω being the angular frequency and I the neutron star’smoment of inertia, assumed to be 1045 g cm2. This energy goesinto a magnetized particle wind, and for magnetic dipole spindown of the pulsar
Ω ∝ Ω3. (4)
Integrating Equation (2) yields the age of the system (Manch-ester & Taylor 1977):
T = P
2P
(1 −
(P0
P
)2)
, (5)
where P0 is the initial spin period and P is the period derivative.For P0 � P this equation reduces to the characteristic age ofthe pulsar τc ≡ P/2P . The spin-down luminosity of the pulsarevolves as (Pacini & Salvati 1973)
E = E0
(1 +
t
τ0
)−2
(6)
with the initial spin-down timescale defined as
τ0 ≡ P0
2P0(7)
with P0 being the initial spin period derivative. Given thatthe current P, P , and E are known, once an initial periodis selected the age and spin-down history of the system aredetermined according to the equations above. We assume aparticle-dominated wind such that the wind magnetizationparameter σ ∼ 10−3. Therefore the power injected in the formof electron/positron pairs is Ee = 0.999E.
As the distribution of particles expand with the PWN, theylose energy through adiabatic cooling, though synchrotroncooling typically dominates for the earliest phase of PWNeevolution. We assume that the radius R of the PWN scaleslinearly with time, and we select a magnetic field dependenceof B ∝ t−1.5. Both these behaviors closely mimic the behaviorof B and R computed by Gelfand et al. (2009) for early stagePWN evolution prior to the compression and reexpansion phasescaused by the interaction of the reverse shock. Selection of
appropriate photon fields is crucial to accurate determination ofIC fluxes. We therefore follow Porter et al. (2006) in estimatingphoton fields (Cosmic Microwave Background Radiation, dustIR, and starlight) at the appropriate Galactic radii, unless localstudies provide better estimates than these Galactic averages.
To compute the PWN SED we inject at each time step apower-law spectrum of relativistic electrons with a high energyexponential cutoff. We also employ a low energy cutoff of10 GeV for the electron spectrum, which is within the realmof minimum particle energies considered by Kennel & Coroniti(1984). The energy content of this particle population varieswith time following the pulsar spin down (Equation (4)), thoughwe treat the index and cutoff energies as static. We then adjustthe size and magnetic field according to the models describedabove. Finally, we calculate the subsequent particle spectrum attime t + δt by calculating the energy loss of the particles due toadiabatic losses as well as radiation losses from synchrotron andIC (including Klein–Nishina effects). Injection (and evolution)occurs in time steps much smaller than the assumed age.
Model fitting is achieved by minimizing the χ2 betweenmodel and data using the downhill simplex method described inPress et al. (1992). We consider three variables: the initial spinperiod, electron slope, and high energy electron cutoff. Withonly an X-ray upper limit, the mean magnetic field within thegamma-ray source is poorly constrained, so we fix the currentmagnetic field to 5 μG (which is the best value obtained whenwe allow the magnetic field to vary), or ∼ 2 mG at pulsar birth.For each ensemble of these three variables we evolve the systemover the pulsar lifetime and calculate χ2. The simplex routinesubsequently varies the parameters of interest to minimize thefit statistic. We estimate parameter errors by computing χ2 for asampling of points near the best-fit values and using these pointsto fit the three-dimensional ellipsoid describing the surface ofΔχ2 = 2.71. Under the assumption of Gaussian errors, theminima and maxima of this surface give the 90% errors of theparameters.
For the assumed Galactic radius of PSR J1023−5746, dustIR photons typically peak at ≈ T = 30 K with a density ≈ 1eV cm−3, while stellar photons peak at ≈ T = 2500 K witha density ≈ 2 eV cm−3 (Porter et al. 2006). With these photonfields (and Cosmic Microwave Background Radiation) we applythe model described above. Figure 3 indicates that IR photonsdominate IC scattering above 10 GeV, with all three photonfields contributing for lower energies. For the best fit we findχ2 = 13.7 for 8 degrees of freedom, with an electron power-law index of 2.44 ± 0.06, high energy cutoff at 60 ± 45 TeV,and initial spin period of 63 ± 17 ms. These parameters imply≈ 3 × 1048 erg have been injected in the form of electrons, andan age of 3100 years.
A hadronic origin for the observed gamma rays is alsopossible, and we follow Kelner et al. (2006) in calculatingthe photons from proton–proton interactions and subsequent π0
and η-meson decay. Proton–proton interactions also yield π±mesons which decay into secondary electrons, which we evolvein time. The timescale for pion production via p–p interactionsis given by τpp ≈ 1.5 × 10⁸ (n/1 cm−3)−1 years (Blumenthal1970); this timescale is significantly greater than the expectedage of the system, so the proton spectrum is treated as static.We are able to fit the gamma-ray data only if the energy inprotons exceeds 2 × 1050 (n/1 cm−3) d2.4 erg, with a χ2 ≈ 15for 8 degrees of freedom. A hadronic origin for the gamma-rays is therefore energetically disfavored unless the gas densityis much greater than 1 cm−3 throughout the bulk of the VHE
11

The Astrophysical Journal, 726:35 (17pp), 2011 January 1 Ackermann et al.
emitting region. Yet we cannot rule out such an origin in theconfused region around Westerlund 2, even though a PWNorigin is reasonable given the fit parameters discussed above.
Independent of the origin of the gamma rays, the lack ofX-rays from the immediate vicinity of PSR J1023−5746 isperplexing given its extremely high spin-down luminosity. Onepossibility is that electrons rapidly escape from the inner nebulainto a low pressure bubble with correspondingly low magneticfield. For an electron conversion efficiency of ∼ 1, at the currentE after a mere ≈ 2 years enough electrons are present in theinner nebula to recreate the observed X-ray flux for a 20 μGfield appropriate for a termination shock. This timescale iscomparable to the time for particles to reach the terminationshock. Post-shock flow in PWNe, as determined by torus fitting,is typically ≈ 0.7 c (Ng & Romani 2008); at this velocityparticles will traverse the ∼ 8′′ X-ray nebula surrounding J1023in ∼ 0.5d2.4 year.
6. DISCUSSION
6.1. Constraints on Pulsar Modeling
The high-quality statistics obtained with the Fermi-LAT bothon the light curves and the spectra of the 54 pulsars detectedallow a more detailed comparison with theoretical modelsthan previously possible. The detection or lack of significantemission in the off-pulse interval can also be used to discriminatebetween the different models. Currently, there are two classesof models that differ in the location of the emission region.The first comprises polar cap (PC) models which place theemission near the magnetic poles of the neutron star (Daugherty& Harding 1996). The second class of outer magnetospheremodels consists of the outer gap (OG) models (Romani 1996),in which the emission extends between the null charge surfaceand the light cylinder, the TPC models (Dyks & Rudak 2003)which might be realized in slot gap (SG) acceleration models(Muslimov & Harding 2004), in which the emission takes placebetween the neutron star surface and the light cylinder alongthe last open field lines; separatrix layer (SL) models (Bai& Spitkovsky 2010), in which emission takes place from theneutron star surface to outside the light cylinder; and finally pair-starved polar cap (PSPC) models (Muslimov & Harding 2004),where emission takes place throughout the entire open fieldregion. Observations by Fermi of simple exponential cutoffsin the spectrum of Vela and other bright pulsars (Abdo et al.2009a, 2010b), instead of super-exponential cutoffs expectedin PC models, have clearly ruled out this class of model forFermi pulsar emission. The outer magnetosphere models makedifferent predictions for the level of off-pulse emission. ClassicOG models (Romani & Yadigaroglu 1995; Cheng et al. 2000;Romani & Watters 2010), for which there is no emission belowthe null charge surface, predict no off-pulse emission except atvery small inclination angles and large viewing angles near90◦. TPC models predict pulsed emission over most of therotational phase at a level that depends on inclination, viewingangle, and gap width (Venter et al. 2009; Romani & Watters2010). In general, light curves for larger gap widths, expectedfor middle-aged and older pulsars in the SG model and whenthe viewing direction makes a large angle to the magneticaxis, have higher levels of off-pulse emission. The force-freemagnetosphere SL model (Bai & Spitkovsky 2010) also predictslight curves with off-pulse emission, since some radiation in thiscase also comes from below the null surface. PSPC models areexpected to operate in old and millisecond pulsars and predict
off-pulse emission as well (C. Venter & A. K. Harding 2010, inpreparation).
Among the 54 pulsars analyzed in this paper, only 10 showa significant signal in their off-pulse, seven of which arelikely of magnetospheric origin (J0034−0534, J0633+1746,J1813−1246, J1836+5925, J2021+4026, J2055+2539,J2124−3358). Two of the seven showing off-pulse emis-sion, J0034−0534 and J2124−3358, are millisecond pulsars.J1836+5925 with E = 1.2 × 1034 erg s−1, J2055+2539 withE = 5 × 1033 erg s−1, and J0633+1746 (Geminga) with E =3.3 × 1034 erg s−1 have among the lowest spin-down luminosi-ties of the normal Fermi detected pulsars. While J1813−1246and J2021+4026 have higher E (6.3 × 1036 erg s−1 and 1.1 ×1035 erg s−1, respectively), both have unusually wide gamma-ray pulses.
As can be seen in the light curves presented in Figures 4and 5, the level of off-pulse emission of these seven pulsarsgreatly varies. The highest levels of off-pulse emission are foundfor J2021+4026 with ∼ 40%, J1836+5925 with ∼ 35%, J0034−0534 and J2124−3358, with ∼ 20% of the peak heights, whilelower levels are found for J2055+2539 and J1813 −1246 with∼ 10% and Geminga with ∼ 5% of the peak heights. In thecase of TPC models, the highest off-pulse levels in light curveswith two widely spaced peaks are produced for inclination angleα > 80◦ and viewing angle ζ < 40◦ or α < 40◦ and ζ > 80◦(Venter et al. 2009). In the case of OG models and wide peakseparations, high levels of off-pulse emission are produced onlyfor α > 85◦ and ζ < 30◦ (Romani & Watters 2010). Forboth types of model, α and ζ must be very different (i.e., weare viewing the gamma-ray emission at a large angle to themagnetic axis) and these are precisely the conditions for whichour line of sight does not cross the radio beam, and for whichthe pulsar should be radio quiet or radio weak. In fact, all ofthe non-millisecond pulsars with significant levels of off-pulseemission are radio quiet (Saz Parkinson et al. 2010; Ray et al.2010). In the case of the millisecond pulsars having large PCsand small magnetospheres, the radio beams are thought to bemuch larger and a significant fraction of the gamma-ray beamsize. Therefore, we may still view the radio beams at large anglefrom the magnetic pole. The light curve of J0034−0534 showstwo narrowly spaced peaks which can be fit in both TPC andOG models for α = 30◦ and ζ = 70◦, but off-pulse emission ispredicted in this case only for TPC models ((Abdo et al. 2010e);C. Venter & A. K. Harding 2010, in preparation). The lightcurve of J2124−3358 has actually been best fit with a PSPCmodel α = 40◦ and ζ = 80◦ (Venter et al. 2009), which alsopredicts off-pulse emission. In general, the detection of off-pulseemission in these pulsars constrains the OG solutions to a muchgreater degree than for TPC/SG or SL solutions.
6.2. Constraints on Pulsar Wind Nebulae Candidates
We searched for significant emission in the off-pulse windowof 54 gamma-ray pulsars detected by Fermi-LAT and foundonly one convincing PWN candidate, J1023−5746 (besides theCrab Nebula and Vela-X). However, flux upper limits derivedon the steady emission from the nebulae offer new constraintson sources already detected in the TeV range (e.g., the PWNein the Kookaburra complex). Additionally, some PWNe wereproposed by Bednarek & Bartosik (2005) as promising sourcesof γ -ray emission in the GeV energy range, especially PSRJ0205+6449 and PSR J2229+6114. We review some interestingcases in the following.
12

The Astrophysical Journal, 726:35 (17pp), 2011 January 1 Ackermann et al.
Pulsar Phase0 0.2 0.4 0.6 0.8 1 1.2 1.4 1.6 1.8 2
Co
un
ts
0
10
20
30
40
50
60
Off-Pulse
PSR J0034-0534
Pulsar Phase0 0.2 0.4 0.6 0.8 1 1.2 1.4 1.6 1.8 2
Co
un
ts
0
2000
4000
6000
8000
10000 Off-
Pulse
PSR J0633+1746
Pulsar Phase0 0.2 0.4 0.6 0.8 1 1.2 1.4 1.6 1.8 2
Co
un
ts
0
100
200
300
400
500
600
Off-
Pulse
PSR J1813-1246
Pulsar Phase0 0.2 0.4 0.6 0.8 1 1.2 1.4 1.6 1.8 2
Co
un
ts
0
100
200
300
400
500
600
700
Off-
Pulse
PSR J1836+5925
Figure 4. Light curves obtained with photons above 100 MeV in a region of 1◦ around J0034−0534 (top left), J0633+1746 (top right), J1813−1246 (bottom left),and J1836+5925 (bottom right). The dashed horizontal line represents the estimated background level, as derived from the model used in the spectral fitting. The twodashed vertical lines represent the definition of the off-pulse window, as defined in Table 1. Two rotations are shown and 25 bins per rotation.
6.2.1. PSR J0205+6449 and the PWN 3C 58
The radio source 3C 58 was recognized early to be an SNR(G130.7+3.1) and classified as a PWN by Weiler & Panagia(1978). X-ray observations revealed a non-thermal spectrumwith the photon index becoming steeper toward the outer regionof the nebula (Slane et al. 2004). Flat spectrum radio emissionSν ∝ ν−0.12 covering roughly 10′ ×6′ extends up to ∼ 100 GHz(Green 1986; Morsi & Reich 1987; Salter et al. 1989) andcorresponds well with infrared (Slane et al. 2008), and X-ray(Slane et al. 2004) morphologies. Subsequent Chandra X-rayObservatory observations detected the central pulsar of 3C 58,PSR J0205+6449. The pulsar has a very high spin-down powerof 2.7 × 1037 erg s−1 and a characteristic age of 5400 years.3C 58 has often been associated with SN 1181 (Stephensonet al. 2002). However, recent investigations of the dynamics ofthe system (Chevalier 2005), and the velocities of both the radioexpansion and optical knots imply an age of ∼ 2500 years,closer to the characteristic age of PSR J0205+6449. At TeVenergies, both the VERITAS and MAGIC telescopes observed
this source and did not find any evidence for γ -ray emission atthe position of the pulsar (Anderhub et al. 2010; Aliu 2008).The upper limits derived from their observations are consistentwith the Fermi upper limits obtained in the 100 MeV–100 GeVenergy range of < 12.9 × 10⁻¹² erg cm−2 s−1. This upper limitimplies a non-constraining 100 MeV–100 GeV efficiency of< 4 × 10⁻⁴–6 × 10⁻⁴ at a distance of 2.6–3.2 kpc.
6.2.2. PSR J0633+1746 Geminga
The Geminga pulsar is the first representative of a populationof radio-quiet gamma-ray pulsars, and has been intenselystudied since its discovery as a gamma-ray source by SAS-2,more than 30 years ago (Fichtel et al. 1975; Kniffen et al. 1975).The subsequent ROSAT detection of periodic X-rays from thissource (Halpern & Holt 1992) prompted a successful search forperiodicity in high-energy gamma rays with EGRET (Bertschet al. 1992) X-ray observations with XMM-Newton and Chandraobservations indicate a highly structured PWN extending ∼ 50′from the pulsar (Pavlov et al. 2010).
13

The Astrophysical Journal, 726:35 (17pp), 2011 January 1 Ackermann et al.
Pulsar Phase0 0.2 0.4 0.6 0.8 1 1.2 1.4 1.6 1.8 2
Co
un
ts
0
200
400
600
800
1000
1200
1400
Off-
Pulse
PSR J2021+4026
Pulsar Phase0 0.2 0.4 0.6 0.8 1 1.2 1.4 1.6 1.8 2
Co
un
ts
0
20
40
60
80
100
120
140
160
Off-
Pulse
PSR J2055+2539
Pulsar Phase0 0.2 0.4 0.6 0.8 1 1.2 1.4 1.6 1.8 2
Co
un
ts
0
20
40
60
80
100
Off-Pulse
PSR J2124-3358
Figure 5. Light curves obtained with photons above 100 MeV in a region of 1◦ around J2021+4026 (top left), J2055+2539 (top right), and J2124−3358 (bottom).Same conventions as for Figure 4.
The Milagro Collaboration recently reported a 3.5σ sourcecoincident with Geminga of extent ∼ 2.◦6, likely the result ofa PWN (Abdo et al. 2009e). While VHE emission from thevicinity of this unique pulsar is certainly of interest, the Fermiupper limits on off-pulse emission above 10 GeV are not veryconstraining to SED modeling of the single VHE point. The lackof data, compounded by the lack of X-ray data covering the scaleof the Milagro source, renders SED modeling uninformative.
6.2.3. PWNe in the Kookaburra Complex: the Rabbit and K3
The complex of compact and extended radio sources calledKookaburra (Roberts et al. 1999) covers nearly 1 deg2 alongthe Galactic plane around l = 313.◦4. This region has beenextensively studied to understand the nature of the unidentifiedEGRET source 3EG J1420−6038 (Hartman et al. 1999). In thenorth wing of the Kookaburra, D’Amico et al. (2001) discoveredthe radio pulsar PSR J1420−6048, a young energetic pulsarwith period 68 ms, characteristic age τc = 13 kyr, and spin-down power E = 1.0 × 1037 erg s−1. Subsequent ASCA andChandra observations revealed an X-ray nebula surrounding
the pulsar called K3. In the southwestern wing, a bright X-rayemission called the Rabbit has been proposed as a plausiblePWN contributing to the γ -ray signal detected by EGRET. AtTeV energies, the HESS Collaboration reported the detection oftwo bright sources coincident with the Kookaburra complex(Aharonian et al. 2006). HESS J1420−607 is centered justnorth of PSR J1420−6048, with best-fit position overlappingthe pulsar position. HESS J1418−609 appears to correspondto the Rabbit nebula. However, the gaps in spectral coveragebetween HESS and EGRET did not allow a clear statementif the EGRET source is really associated with the X-ray andTeV emission. Finally, the γ -ray detection by Fermi-LAT ofthe radio-loud pulsar PSR J1420−6048 and the discovery of aradio-quiet PSR J1418−6058, likely powering the Rabbit PWN,brought a new light on this region.
In this paper, we searched for γ -ray emission in the off-pulseof both pulsars, PSR J1420−6048 and PSR J1418−6058, anddid not detect any significant signal. The 95% CL upper limitsreported in Tables 2 and 3 are consistent with the predictionmade by Van Etten & Romani (2010) that do not expect any
14
The Astrophysical Journal, 726:35 (17pp), 2011 January 1 Ackermann et al.
detection by Fermi before 10 years of observations in the mostoptimistic scenario for PSR J1420−6048. The VHE spectrumof the Rabbit nebula is very similar to that of K3, so similaremission mechanisms from the Rabbit would correspondinglypredict little chance of Fermi detection.
6.2.4. PSR J1833 −1034 and G21.5−0.9
G21.5−0.9 was classified as one of about 10 Crab-like SNRand predicted in 1995 to be a gamma-ray source (de Jager &Harding 1995). Chandra observations revealed the compositenature of the remnant, consisting of a centrally peaked PWNand a 4′ shell (Bocchino et al. 2005; Safi-Harb et al. 2001).The 61.8 ms pulsar PSR J1833−1034 powering the PWN wasdiscovered recently through its faint radio emission (Camiloet al. 2006). With a spin-down power of E = 3.3×1037 erg s−1,PSR J1833−1034 is one of the most energetic pulsars in theGalaxy. INTEGRAL observations revealed that the PWN is alsobright in the hard X-ray regime (de Rosa et al. 2009). At TeVenergies, G21.5−0.9 was recently detected by HESS and hasa point-like nature and a hard spectrum (Γ = 2.08 ± 0.22)(Djannati-Atai et al. 2007). The flux of this source is only 2%of that of the Crab Nebula. Although the spin-down age of thisextremely energetic pulsar is 4.6 kyr, VLA measurements of thePWN expansion speed place the age at 870200
−150 yr (Bietenholz& Bartel 2008). Kinematic H i and CO distance measurementsplace G21.5−0.9 some 4.7 kpc distant (Tian & Leahy 2008).The lack of detection is consistent with previous modelingundertaken by de Jager et al. (2008), which predicted GeVgamma-ray flux well below the Fermi upper limits.
6.2.5. PSR J1907+0602 and its TeV PWN
The TeV source MGRO J1908+06 was discovered byMILAGRO at a median energy of 20 TeV (Abdo et al. 2007) witha flux ∼ 80% of the Crab at these energies. It was subsequentlydetected in the 300 GeV–20 TeV range by the HESS (Aharonianet al. 2009) and VERITAS (Ward 2008) experiments. The Fermidiscovery of the radio-quiet pulsar PSR J1907+0602 (Abdo et al.2009d) within the extent of the TeV source strongly suggeststhat HESS J1908+063 is the PWN of PSR J1907+0602.
The upper limits derived on its off-pulse emission (seeTable 2) are consistent with those previously reported in Abdoet al. (2010g) assuming a source extension of 0.◦3 and stronglysuggest that the spectrum of HESS J1908+063 has a low-energyturnover between 20 GeV and 300 GeV. The pulsar is offset fromthe HESS centroid by 15′, and assuming this marks the pulsarbirthsite implies a velocity of ≈ 400 km s−1 for a distance of3.2 kpc and an age of 20 kyr. Abdo et al. (2010g) estimated anupper limit on the 2–10 keV X-ray flux from the pulsar and anyarcminute-scale nebula of 10−13 erg cm−2 s−1, though given theHESS extension is 20′ we cannot constrain the magnetic fieldwithin the larger nebula. Therefore, without any data outside theVHE regime we can only conclude that a cooling break appearsaround 1 TeV. Determining whether that break occurs from oldelectrons in a low magnetic field or younger electrons in a highmagnetic field requires either an X-ray detection or upper limiton the extended region.
6.2.6. PSR J2032+4127 and TeV 2032+4130
TeV J2032+4130 was the first unclassified TeV source,initially detected by HEGRA (Aharonian et al. 2002), and laterconfirmed by MAGIC (Albert et al. 2008). Subsequent XMM-Newton observations revealed a faint diffuse X-ray structure
centered on the position of TeV J2032+4130 with the same6′ extension as the VHE source (Horns et al. 2007). Within theTeV error box Abdo et al. (2009d) discovered PSR J2032+4127,later confirmed by the radio detection of the pulsar (Camiloet al. 2009), hinting at a PWN origin for the TeV emission. Thelimited radio data and large errors on the XMM-Newton X-rayand VHE data prevent precise modeling of all PWN parameters,however, and the Fermi upper limits are approximately an orderof magnitude too high to be constraining.
6.2.7. PSR J2229+6114 and the Boomerang PWN
The pulsar PSR J2229+6114 is as young as the Vela pulsar(characteristic age τc = 10 kyr), and as energetic (E = 2.2 ×1037 erg s−1), and powers the small boomerang-shaped radioand X-ray emitting PWN which is part of the SNR G106.3+2.7(Halpern et al. 2001a). The pulsar distance estimated from X-rayabsorption is ∼ 3 kpc (Halpern et al. 2001a), while the dispersionmeasure used in conjunction with the NE2001 model (Cordes& Lazio 2002) yields a distance of 7.5 kpc (Abdo et al. 2009c);polarization studies and velocity maps of H i and CO emissionimply a distance of 800 pc (Kothes et al. 2006). In this paper,we have used the range 0.8–6.5 kpc as reported in Table 1.
At TeV energies, the MAGIC Collaboration placed a con-straining point-source upper limit of 3.95 × 10⁻¹² cm−2 s−1
at the position of the pulsar (Anderhub et al. 2010). However,recently, both the MILAGRO and the VERITAS Collabora-tion reported a significant detection in this region. The cen-troid of the extended emission (full angular extent of 0.◦6 by0.◦4) detected by VERITAS is located 0.◦4 away from the pulsarPSR J2229+6114 (Acciari et al. 2009). The signal detected byMILAGRO is spread over a broad ∼ 1◦ area encompassing thepulsar position and the main bulk of the remnant, which doesnot allow a definitive association with a particular region of theSNR/pulsar complex (Abdo et al. 2009e).
Using 16 months of Fermi-LAT data, we do not report anysignificant detection at the position of the pulsar using its off-pulse photons. The upper limits derived are compatible withthe non-detection reported by the MAGIC Collaboration at TeVenergies (Anderhub et al. 2010). An offset between the pul-sar J2229+6114 and its PWN is thus required if the emissiondetected at TeV energies by VERITAS and MILAGRO is pro-duced by the PWN. This is the case for several PWNe alreadydetected by Cherenkov telescopes, such as HESS J1825−137and Vela-X, and can be explained by the supernova explosionthat occurred in an inhomogeneous medium leading to an asym-metric reverse shock that displaced the PWN (Blondin 2001)toward lower densities. However, the TeV emission detected byVERITAS is coincident with the location of molecular cloudswhich disfavors such a scenario and supports a hadronic ori-gin where γ -rays are produced via proton–proton interactionswithin the molecular clouds.
6.3. Population Study of Pulsar Wind Nebulae asObserved by Fermi-LAT
Among the large sample of pulsars analyzed in this paper,two sources are firmly identified as PWNe (the Crab Nebula andVela-X), one source is suggested as a highly plausible candidate(the emission in the off-pulse of PSR J1023−5746), in additionto the PWN in MSH 15–52 (Abdo et al. 2010h). As can be seenin Figure 6, the pulsars powering these PWNe are all young(in the range 1–10 kyr) and bright (E � 7 × 1036 erg s−1);their associated PWNe are detected by Cherenkov telescopesin the TeV range. Remarkably, these four PWNe candidates
15

The Astrophysical Journal, 726:35 (17pp), 2011 January 1 Ackermann et al.
log(Age [yr])
2 3 4 5 6 7 8 9 10 11 12
])
−2 k
pc
−1 [
erg
s2
/dE
log
(
26
28
30
32
34
36
38
Crab NebulaVela−X
J1023−5746
MSH 15−52
Figure 6. Spin-down flux at Earth as a function of age for pulsars in the ATNFcatalog; Fermi-LAT detected pulsars are marked with black circles. Pulsar windnebulae candidates are marked with red stars; LAT pulsars showing a significantoff-pulse emission with a plausible magnetospheric origin are marked with bluesquares. For pulsars with a distance range in Table 1, we use the geometric meanof the minimum and maximum values. Note that inaccurate distance estimatescan introduce artificially low spin-down fluxes, which might account for thehandful of pulsar detections below 1033 erg s−1 kpc−2.
(A color version of this figure is available in the online journal.)
have a low γ -ray efficiency in the Fermi-LAT energy range,LPWN
E< 10−2, Vela-X, Crab and MSH 15–52 having even
lower LPWN
E(see Figure 7). This implies that most of the 44
upper limits derived using 16 months of LAT observations arenot yet constraining. However, for three objects (J0659+1414,J1833−1034, and J0205+6449) the upper limits in Figure 7 arewell below 2 × 10⁻³E suggesting that some pulsars are lessefficient at producing GeV PWN flux than J1023−5746 andB1509−58. Table 2 indicates three potential PWNe candidatesat 4σ level: J0007+7303, J1028−5819, and J1709−4429. Moredata are needed to confirm the detection of these three sourcesand significantly probe the variation of the PWN flux with thespin-down power or with the ambient medium. One can alsonote two pulsars with significant emission in their off-pulsewindow and very high efficiency: J1836+5925 and J2021+4026.These two pulsars show a similar gamma-ray luminosity in theoff-pulse and in the on-pulse intervals (renormalized to the totalphase interval); their luminosities are greater than the spin-downpower, assuming a uniform phase-averaged beaming acrossthe sky. However, the association distances for the gamma-rayselected pulsars must be treated with caution.
Reporting the Fermi detection of HESS J1640−465, Slaneet al. (2010) invoked an excess of low energy electrons toaccount for the GeV data and to explain the continuity in photonspectral index between the Fermi and HESS energy bands.While many of the upper limits on PWNe flux cataloged here areinsufficiently constraining to rule out such a situation, we alsosee no evidence in support of such an electron spectrum for anyobject in the catalog. We also see no indication of dual electronpopulations, as proposed to explain Vela-X (Abdo et al. 2010c).The GeV and TeV peaks in Vela-X are comparable in flux, andthis would put the GeV flux very near the Fermi sensitivity for
])−1 [erg sElog(
33 34 35 36 37 38 39
])
−1 [
erg
sP
WN
log
(L
31
32
33
34
35
36Crab Nebula
Vela−X
J1023−5746
MSH 15−52
Figure 7. Dependence of the PWN luminosity and the pulsar spin-down powerfor LAT detected pulsars. Pulsar wind nebulae candidates are marked withred stars; pulsars showing a significant off-pulse emission with a plausiblemagnetospheric origin are marked with blue squares. Deleted and modifiedin the figure: potential candidates with test statistic values between 16 and25 (discussed in Section 6.3) are marked with blue triangles. Only pulsarswith estimated distances reported in Table 1 are plotted. Error bars take intoaccount both the statistical uncertainties on the luminosity and the uncertaintyon the distance of the pulsar. Lines correspond to constant γ -ray efficiency:100% (dashed), 10% (dotted), and 1% (dot-dashed). Pulsars with two distanceestimates have two markers connected with green dashed error bars. Theluminosity of the PWN in MSH 15–52 is taken from Abdo et al. (2010h).
(A color version of this figure is available in the online journal.)
a number of Vela-like pulsars with TeV counterparts: PSRsJ1418−6058, J1420−6048, J1709−4429, and J1907+0602.Indeed, if most PWNe boast simple electron populations witha power-law index of ∼2.3, the majority of these PWNe mayprove elusive to Fermi.
The Fermi-LAT Collaboration acknowledges generous ongo-ing support from a number of agencies and institutes that havesupported both the development and the operation of the LAT aswell as scientific data analysis. These include the National Aero-nautics and Space Administration and the Department of Energyin the United States, the Commissariat a l’Energie Atomique andthe Centre National de la Recherche Scientifique/Institut Na-tional de Physique Nucleaire et de Physique des Particules inFrance, the Agenzia Spaziale Italiana and the Istituto Nazionaledi Fisica Nucleare in Italy, the Ministry of Education, Culture,Sports, Science and Technology (MEXT), High Energy Accel-erator Research Organization (KEK), and Japan Aerospace Ex-ploration Agency (JAXA) in Japan, and the K. A. WallenbergFoundation, the Swedish Research Council, and the SwedishNational Space Board in Sweden.
Additional support for science analysis during the operationsphase from the Istituto Nazionale di Astrofisica in Italy andthe Centre National d’Etudes Spatiales in France is gratefullyacknowledged.
The Parkes radio telescope is part of the Australia Telescopewhich is funded by the Commonwealth Government for oper-ation as a National Facility managed by CSIRO. We thank ourcolleagues for their assistance with the radio timing observa-
16

The Astrophysical Journal, 726:35 (17pp), 2011 January 1 Ackermann et al.
tions. The Green Bank Telescope is operated by the NationalRadio Astronomy Observatory, a facility of the National ScienceFoundation operated under cooperative agreement by Associ-ated Universities, Inc. The Nancay Radio Observatory is oper-ated by the Paris Observatory, associated with the French CentreNational de la Recherche Scientifique (CNRS). The Lovell Tele-scope is owned and operated by the University of Manchesteras part of the Jodrell Bank Centre for Astrophysics with sup-port from the Science and Technology Facilities Council of theUnited Kingdom.
REFERENCES
Abdo, A. A., et al. (MILAGRO Collaboration) 2007, ApJ, 664, L91Abdo, A. A., et al. 2009a, ApJ, 696, 1084Abdo, A. A., et al. 2009b, ApJ, 706, L1Abdo, A. A., et al. 2009c, ApJ, 706, 1331Abdo, A. A., et al. 2009d, Science, 325, 840Abdo, A. A., et al. (MILAGRO Collaboration) 2009e, ApJ, 700, L127Abdo, A. A., et al. 2010a, ApJS, 187, 460Abdo, A. A., et al. 2010b, ApJ, 713, 154Abdo, A. A., et al. 2010c, ApJ, 713, 146Abdo, A. A., et al. 2010d, ApJ, 708, 1254Abdo, A. A., et al. 2010e, ApJ, 712, 957Abdo, A. A., et al. 2010f, ApJ, 712, 1209Abdo, A. A., et al. 2010g, ApJ, 711, 64Abdo, A. A., et al. 2010h, ApJ, 714, 927Abdo, A. A., et al. 2010i, ApJS, 188, 405Abdo, A. A., et al. 2010j, ApJ, 720, 272Abdo, A. A., et al. 2010k, ApJ, 722, 1303Acciari, V. A., et al. 2009, ApJ, 703, L6Aharonian, F., et al. 2002, A&A, 393, L37Aharonian, F., et al. (HESS Collaboration) 2006, A&A, 456, 245Aharonian, F., et al. (HESS Collaboration) 2007, A&A, 467, 1075Aharonian, F., et al. (HESS Collaboration) 2009, A&A, 499, 723Albert, J., et al. 2008, ApJ, 675, L25Aliu, E. 2008, in AIP Conf. Proc. 1085, Proc. 4th Int. Meeting on High Energy
Gamma-Ray Astronomy, ed. F. A. Aharonian, W. Hofmann, & F. Rieger(Melville, NY: AIP), 324
Anderhub, H., et al. 2010, ApJ, 710, 828Atwood, W. B., et al. 2009, ApJ, 697, 1071Bai, X.-N., & Spitkovsky, A. 2010, ApJ, 715, 1282Bednarek, W., & Bartosik, M. 2005, J. Phys. G: Nucl. Part. Phys., 31, 1465Bertsch, D. L., et al. 1992, Nature, 357, 306Bietenholz, M. F., & Bartel, N. 2008, MNRAS, 386, 1411Blondin, J. M. 2001, ApJ, 563, 806Blumenthal, G. R. 1970, Phys. Rev. D, 1, 1596Bocchino, F., et al. 2005, A&A, 442, 539Camilo, F., et al. 2006, ApJ, 637, 456Camilo, F., et al. 2009, ApJ, 705, 1Cheng, K. S., Ruderman, M. A., & Zhang, L. 2000, ApJ, 537, 964Chevalier, R. A. 2005, ApJ, 619, 839Cordes, J. M., & Lazio, T. J. W. 2002, arXiv:astro-ph/0207156D’Amico, N., et al. 2001, ApJ, 552, L45Dame, T. M. 2007, ApJ, 665, L163Daugherty, J. K., & Harding, A. K. 1996, ApJ, 458, 278de Jager, O. C., Ferreira, S. E. S., & Djannati-Atai, A. 2008, in AIP Conf. Proc.
1085, Proc. 4th Int. Meeting on High Energy Gamma-Ray Astronomy, ed.F. A. Aharonian, W. Hofmann, & F. Rieger (Melville, NY: AIP), 199
de Jager, O. C., & Harding, A. K. 1995, in 24th Int. Cosmic Ray Conf., (Rome),2, 528
De Rosa, A., Ubertini, P., Campana, R., Bazzano, A., Dean, A. J., & Bassani,L. 2009, MNRAS, 393, 527
Djannati-Atai, A., et al. 2007, in Proc. 30th ICRC (Merida), 2, 823Dyks, J., & Rudak, B. 2003, ApJ, 598, 1201Fichtel, C. E., Hartman, R. C., Kniffen, D. A., Thompson, D. J., Ogelman, H.,
Ozel, M. E., Tumer, T., & Bignami, G. F. 1975, ApJ, 198, 163
Fujita, Y., Hayashida, K., Takahashi, H., & Takahara, F. 2009, PASJ, 61, 1229Fukui, Y., et al. 2009, PASJ, 61, L23Gaensler, B. M., & Slane, P. O. 2006, ARA&A, 44, 17Gelfand, J. D., Slane, P. O., & Zhang, W. 2009, ApJ, 703, 2051Green, D. A. 1986, MNRAS, 218, 533Halpern, J. P., Camilo, F., Gotthelf, K. M., & Helfand, D. J. 2001a, ApJ, 552,
L125Halpern, J. P., Gotthelf, E. V., Leighly, K. M., & Helfand, D. J. 2001b, ApJ, 547,
323Halpern, J. P., & Holt, S. S. 1992, Nature, 357, 222Hartman, R. C., et al. 1999, ApJS, 123, 79HHelene, O. 1983, Nucl. Instrum. Methods.Phys. Res., 212, 319Hobbs, G. B., Lyne, A. G., Kramer, M., Martin, C. E., & Jordan, C. 2004,
MNRAS, 353, 1311Horns, D., Hoffmann, A. I. D., Santangelo, A., Aharonian, F. A., & Rowell, G.
P. 2007, A&A, 469, L17Kaaret, P., & Cottam, J. 1996, ApJ, 462, L35Kaplan, D. L., et al. 2005, PASP, 117, 643Kelner, S. R., Aharonian, F. A., & Bugayov, V. V. 2006, Phys. Rev. D, 74,
034018Kennel, C. F., & Coroniti, F. V. 1984, ApJ, 283, 710Kniffen, D. A., Fichtel, C. E., Hartman, R. C., Thompson, D. J., Ozel, M. E.,
Tumer, T., Bignami, G. F., & Ogelman, H. 1975, in 14th ICRC (Munich), 1,100
Kothes, R., Reich, W., & Uyaniker, B. 2006, ApJ, 638, 225Manchester, R. N., & Taylor, J. H. 1977, Pulsars (San Francisco, CA: Freeman),
281Mattox, J. R., et al. 1996, ApJ, 461, 396Morsi, H. W., & Reich, W. 1987, A&AS, 69, 533Muslimov, A. G., & Harding, A. K. 2004, ApJ, 617, 471Ng, C.-Y., & Romani, R. W. 2008, ApJ, 673, 411Pacini, F., & Salvati, M. 1973, ApJ, 186, 249Pavlov, G. G., Bhattacharyya, S., & Zavlin, V. E. 2010, ApJ, 715, 66Pellizzoni, A., et al. 2009, Science, 327, 663Porter, T. A., Moskalenko, I. V., & Strong, A. W. 2006, ApJ, 648, L29Press, W. H., Teukolsky, S. A., Vetterling, W. T., & Flannery, B. P. 1992,
Numerical Recipes in C: The Art of Scientific Computing (2nd ed.;Cambridge: Cambridge Univ. Press)
Ray, P. S., et al. 2010, ApJ, submitted (arXiv:1011.2468)Roberts, M. S. E., Romani, R. W., Johnston, S., & Green, A. 1999, ApJ, 515,
712Romani, R. W. 1996, ApJ, 470, 469Romani, R. W., & Yadigaroglu, I. A. 1995, ApJ, 438, 314Romani, R. W., & Watters, K. 2010, ApJ, 714, 810Romero, G. E., Benaglia, P., & Torres, D. F. 1999, A&A, 348, 868Safi-Harb, S., Harrus, I. M., Petre, R., Pavlov, G. G., Koptsevich, A. B., &
Sanwal, D. 2001, ApJ, 561, 308Salter, C. J., Reynolds, S. P., Hogg, D. E., Payne, J. M., & Rhodes, P. J. 1989, ApJ,
338, 171Saz Parkinson, P. M., et al. 2010, ApJ, 725, 571Slane, P., Castro, D., Funk, S., Uchiyama, Y., Lemiere, A., Gelfand, J. D., &
Lemoine-Goumard, M. 2010, ApJ, 720, 266Slane, P., Helfand, D. J., Reynolds, S. P., Gaensler, B. M., Lemiere, A., & Wang,
Z. 2008, ApJ, 676, L33Slane, P., Helfand, D. J., van der Swaluw, E., & Murray, S. S. 2004, ApJ, 616,
403Stephenson, F. R., & Green, D. A. 2002, Historical Supernovae and their
Remnants (New York: Oxford Univ. Press)Theureau, G., et al. 2005, A&A, 430, 373Theureau, G., et al. 2010, A&A, in press (arXiv:1010.4230)Tian, W. W., & Leahy, D. A. 2008, MNRAS, 391, L54Van Etten, A., & Romani, R. 2010, ApJ, 711, 1168Venter, C., Harding, A. K., & Guillemot, L. 2009, ApJ, 707, 800Ward, J. E. 2008, in AIP Conf. Proc. 1085, High Energy Gamma-Ray
Astronomy, ed. F. A. Aharonian, W. Hofmann, & F. Rieger (Melville, NY:AIP), 301
Weiler, K. W., & Panagia, N. 1978, A&A, 70, 419Weltevrede, P., et al. 2009, PASA, 27, 64Whiteoak, J. B. Z., & Uchida, K. I. 1997, A&A, 317, 563Yadigaroglu, I.-A., & Romani, R. W. 1997, ApJ, 476, 347
17


![EXAM WITH SOLUTIONS [ Pulsars and Supernovae ] Part II](https://img.pdfslide.net/doc/110x75/633b3750b04c9ea6d00227a9/exam-with-solutions-pulsars-and-supernovae-part-ii.jpg)


