Embed Size (px)
Citation preview

The completed Central Susquehanna Valley Transportation River Bridge in Northumberland County Photo by PennDOT Photogrammetry and Surveys Section
DRAFT PENNSYLVANIA’S
STATEWIDE TRANSPORTATION IMPROVEMENT PROGRAM
FFY 2023-2026 EXECUTIVE SUMMARY
AUGUST 17, 2022
DRAFT

DRAFT

CONTENTS Section Page OVERVIEW ...................................................................................................................................................... 1 PROGRAM DEVELOPMENT GUIDANCE: Financial Guidance .......................................................................................................................... 3 General and Procedural Guidance .................................................................................................. 4 STATE TRANSPORTATION IMPROVEMENT PROGRAM: Highway and Bridge Summary ........................................................................................................ 5 Transit Summary ............................................................................................................................. 8 Statewide Programs ..................................................................................................................... 11 TRANSPORTATION PERFORMANCE MANAGEMENT ................................................................................................ 18 MANAGING STIP FUNDING .............................................................................................................................. 31 AIR QUALITY ................................................................................................................................................. 33 PUBLIC PARTICIPATION SUMMARY INFORMATION ................................................................................................. 34 CONSULTATION WITH RURAL LOCAL OFFICIALS .................................................................................................... 36 STATE CERTIFICATION OF THE PLANNING PROCESS ................................................................................................ 36 LONG RANGE PLANNING.................................................................................................................................. 36 FFY 2021-2024 STIP PLANNING FINDINGS ....................................................................................................... 37 APPENDICES: Appendix 1: State Transportation Program Funding Summary ................................................ 41 Appendix 2: Financial Guidance ................................................................................................ 45 Appendix 3: General and Procedural Guidance ........................................................................ 89 Appendix 4: Secretary’s “Spike” Decisions Project Listing ...................................................... 137 Appendix 5: Other Transportation Funding ............................................................................ 143 Appendix 6: Categorical Funding Definitions .......................................................................... 145 Appendix 7: MPMS Highway STIP Summary ........................................................................... 149 Appendix 8: Highway Federal Funds Balances ........................................................................ 151 Appendix 9: MPMS Transit STIP Summary .............................................................................. 153 Appendix 10: National Highway Freight Program Projects ....................................................... 155 Appendix 11: Railway-Highway Crossing Projects .................................................................... 157 Appendix 12: HSIP Set Aside Projects ....................................................................................... 159 Appendix 13: Transportation Alternatives Program Projects ................................................... 161 Appendix 14: Transportation Infrastructure Investment Fund Projects .................................. 163 Appendix 15: Performance Based Planning and Programming Provisions .............................. 165 Appendix 16: Transportation Asset Management Plan Implementation ................................. 181 Appendix 17: FHWA-FTA-PENNDOT MOU for STIP/TIP Revisions ........................................... 189 Appendix 18: Pennsylvania Areas Requiring Transportation Conformity ................................ 195 Appendix 19: MPO/RPO TIP and LRTP Dates ............................................................................ 199 Appendix 20: State Certification of the Planning Process ........................................................ 201 Appendix 21: Pennsylvania FFY 2021-2024 STIP Planning Findings ......................................... 203 Appendix 22: Wayne County TIP Materials .............................................................................. 219
DRAFT

DRAFT

OVERVIEW In compliance with all applicable State and Federal requirements, the Pennsylvania Department of Transportation (PennDOT), in cooperation with the Federal Highway Administration (FHWA), the Federal Transit Administration (FTA) and its Planning Partners at the county and regional levels, developed the Federal Fiscal Year (FFY) 2023-2026 Statewide Transportation Improvement Program (STIP), also referred to as the 2023 STIP. The 2023 STIP includes $23.5 billion ($16.1 billion for Highway/Bridge and $7.4 billion for Transit) in federal, state, local and private resources over the four-year period for capital improvements. The STIP consists of a list of prioritized projects/project phases identified for funding by federal fiscal year. The 2023 STIP includes Transportation Improvement Programs (TIPs) as adopted by each Metropolitan Planning Organization (MPO) and Rural Planning Organization (RPO) as well as the TIP for Wayne County and the centrally managed Interstate Management (IM) and the Statewide Items (STWD) TIPs. The 2023 STIP submission includes air quality conformity determinations, public comment information and other supporting documentation. In addition to the STIP funding for capital improvements, PennDOT’s budget provides dedicated and sustainable revenues for the operation and maintenance of our Transportation System. Appendix 1 shows a Transportation Program Funding Summary from the Governor’s Executive Budget 2022-2023 as well as the sources and uses of funds to support PennDOT’s programs. Pennsylvania continues to follow a Performance Based Planning and Programming (PBPP) process, with a focus on collaboration between PennDOT, FHWA, FTA, and MPO/RPOs at the county and regional levels. The 2023 STIP was developed as part of a cooperative, continuing, and comprehensive (3C) planning process which guides the development of many PBPP documents. This includes the Financial Guidance and General and Procedural documents (Appendix 2, Appendix 3) for the 2023 Program update PennDOT, FHWA and all MPO/RPOs concurred with the guidance prior to final issuance. Key aspects in the development of the 2023 STIP were:
• Final Financial Guidance and General and Procedural Guidance for the 2023 Program development were issued on June 29, 2021 after PennDOT and the MPO/RPOs reached consensus.
• Following the enactment of the Infrastructure Investment and Jobs Act (IIJA), also known as the Bipartisan Infrastructure Law (BIL) on November 15, 2021, the Financial Guidance Work Group reconvened on November 18, 2021 and December 1, 2021. Updated 2023 Financial Guidance was issued on March 8, 2022.
• The State Transportation Commission (STC), PennDOT, and MPOs/RPOs coordinated an early public involvement process that featured an open comment period held from March 1 to April 14, 2021. This open comment period featured an online survey and Online Public Forum hosted by Secretary of the Pennsylvania Department of Transportation and STC Chair, Yassmin Gramian on March 23, 2021.
• MPOs/RPOs, with input from PennDOT, the STC and transit providers produced draft TIPs for their regions and submitted them to PennDOT by December 31, 2021, for review and response.
1
DRAFT

• Project funding information, Public Narratives, and Air Quality information for the 2023 STIP have been entered into PennDOT’s Multimodal Project Management System (MPMS).
• To align with Federal requirements and existing needs the information depicted in the MPO/RPOs TIPs continue to reflect the change to move additional funding to the Interstate system (beginning with $150 million in 2021 and increasing by $50 million per year through 2028) to get an annual investment of $1 Billion by 2028. The move was agreed upon during the development of the 2021 Financial Guidance.
• The Secretary’s “Spike” funding recommendations were provided toward the front end of the program development process. This assisted the regions in their overall planning efforts for the 2023 Program update.
• Air quality analyses were undertaken in ozone and PM2.5 non-attainment and maintenance areas and draft conformity determinations were completed. Conformity determinations were also conducted for the 1997 ozone orphan areas.
• Federal and state agencies utilized an interagency consultation process to review and comment on the draft conformity determinations.
• Subsequently, the MPOs/RPOs held public comment periods, considered comments, and adopted their respective TIP.
• A separate STIP 15-day public comment period was held. PennDOT considered comments and developed responses.
• MPO/RPO TIPs are incorporated directly into the STIP, without modification. • With the adoption of the Commonwealth’s TYP on August 17, 2022 the STC thereby
endorsed the 2023 STIP (First Four Years of the TYP). • The STIP is a financially responsible and fiscally constrained program. It reflects an
estimate of federal, state, local, and private funds expected to be available over the next four years.
• The 2023 STIP is consistent with PennDOT’s 2045 statewide long-range transportation plan (LRTP), statewide freight plan and MPO/RPO regional LRTPs.
• The Highway and Bridge portion of the STIP continues the Commonwealth’s asset management philosophy, while advancing a PBPP approach to address federal Transportation Performance Management (TPM) requirements by providing funding to advance safety improvements and promoting improvement in the condition and performance of Pennsylvania’s highway system. The capacity expansion and new facility projects are consistent with the statewide LRTP and MPO/RPO regional LRTPs.
• The Public Transit portion of the STIP is based on the projects and line items included on the MPO/RPO TIPs as developed in cooperation with transit agencies.
• The STIP includes all statewide and regionally significant projects regardless of funding source.
The following sections of this document summarize the funding in both the highway/bridge and transit portions of the STIP. Additional information is provided on air quality conformity, public participation and other specifics related to STIP development and management. MPO/RPO submissions include regional TIP listings, air quality conformity reports, public comment documentation, TIP revision procedures, and various resolutions where required.
2
DRAFT

PROGRAM DEVELOPMENT GUIDANCE Financial Guidance (Appendix 2) and General and Procedural Guidance (Appendix 3) documents provide the basis for the development of the 2023 Program. PennDOT, FHWA and the MPOs/RPOs jointly developed the guidance documents, first through two respective workgroups, and later through agreement by all parties. This guidance was reviewed with all MPOs/RPOs during the spring Planning Partners meeting on June 29, 2021, and unanimous concurrence was achieved. Final Financial Guidance and General and Procedural Guidance were issued on July 15, 2021. Financial Guidance Financial Guidance provides funding levels available for the development of the STIP for all anticipated federal and state funding over the FFY 2023-2026 period. For highways and bridges, federal funding assumptions are based upon the Infrastructure Investment and Jobs Act (IIJA), also known as the Bipartisan Infrastructure Law (BIL) which was enacted on November 15, 2021. Financial Guidance was re-issued on March 8, 2022. State revenues are based on the budget estimates for highway and bridge capital appropriations. Allocations are provided to each MPO/RPO for highway and bridge funds based on jointly developed formulas. A portion of highway funding is reserved for distribution by the Secretary of Transportation (referred to as Spike funding) to offset the impact of high-cost projects, special initiatives, or program spikes, which are beyond a region’s allocation. The Spike funded projects for the 2023 Program (Appendix 4) continued previous “Spike” funded project commitments, aligned with the Department’s investment initiatives. The Financial Guidance Work Group recommended that the IM Program, the National Highway Freight Program (NHFP/NFP) and Railway-Highway Crossings Program (Section 130/RRX) continue to be centrally managed. Funds associated with the newly established Carbon Reduction, Electric Vehicles and PROTECT formula programs are assigned to the statewide program due to timing with the 2023 Program Update, implementing guidance and apportionments. Necessary updates to the 2023 Program will take place after STIP adoption in October 2022. For transit, the Financial Guidance includes a combination of federal and state resources. Federal funding is based on Fixing America's Surface Transportation (FAST) Act levels due to timing with the 2023 Program Update and the availability of IIJA/BIL funding data and information. Any necessary updates to the 2023 Program due to IIJA/BIL will take place after adoption in October 2022. State funding is based on formulas established in Act 26 of 1991, Act 3 of 1997, Act 44 of 2007 and Act 89 of 2013. As part of an agreement between the Commonwealth and the transit agencies, a total of $25 million per year in federal highway funding is reserved to be flexed to transit agencies. Each transit operator is responsible for determining specific amounts for capital improvements and operating assistance.
3
DRAFT

General and Procedural Guidance The General and Procedural Guidance provides direction for the 2023 Program development process within the context of multiple interrelated, intergovernmental planning functions. It contains information related to the general planning process, along with policies, requirements and guidance directly related to Program development and administration. It includes the schedule, procedures, and documentation necessary to complete the Program update. Noteworthy policy and requirements for the 2023 Program update included the Federal TPM requirements and the PennDOT Connects/Local Government Collaboration policy. TPM is a strategic approach that uses data to make investment and policy decisions to achieve national performance goals. 23 CFR 490 outlines the national performance goal areas for the Federal-aid program. In addition, PennDOT integrated its Transportation Asset Management Plan (TAMP) into the General and Procedural Guidance. The TAMP commits PennDOT to two overarching requirements:
• Meeting FHWA minimum condition thresholds for National Highway System (NHS) pavements and bridges.
• Transitioning from “worst-first” programming to lowest life-cycle cost (LLCC) asset management.
Achieving both requirements is challenging, primarily because funding is inadequate to cover the size and age of Pennsylvania’s NHS roads and bridges. Additionally, meeting condition targets and managing to LLCC can be conflicting approaches when funding is insufficient to invest in reducing the percentage of poor pavements and bridges while also investing in preventative maintenance on structures in good and fair condition. The PennDOT Connects initiative provides a collaborative approach to project planning and development by requiring collaboration with local and regional stakeholders before project scopes are developed. The Department will meet with local governments, MPOs and RPOs to discuss issues such as safety, bicycle/pedestrian accommodations, transit access, stormwater management, utilities, freight-generating land uses and other documented issues to consider for inclusion in projects. This collaboration will have the benefit of encouraging MPOs and RPOs to track major changes to county and municipal comprehensive plans and zoning ordinances, further strengthening the linkage between land use, transportation, and economic development decision making and their effect on the development of current and future Transportation Programs. Program Management and monitoring systems, corridor studies, project development screening forms, needs and feasibility studies, and environmental studies are examples of documentation that may be used in the development of TIPs and LRTPs. The PennDOT Connects/Local Government coordination requirement applies to all projects where the Preliminary Engineering phase began after July 1, 2016.
4
DRAFT

STATE TRANSPORTATION IMPROVEMENT PROGRAM Highway and Bridge Summary Funding contained in the highway and bridge portion of the STIP includes all federal and state capital funds anticipated over the next four years, FFY 2023–2026. This funding has been assigned to projects consistent with an integrated and cooperative process between PennDOT and the MPO/RPOs. Local and other sources of revenue are included as identified for individual projects. PennDOT and MPOs/RPOs worked together to set performance measure targets that guide state and regional investment decisions. Aligning goals and performance objectives across national (FHWA), state (PennDOT) and regions (MPOs/RPOs) provide a common framework for decision-making that aligns with TPM requirements. The 2023 STIP includes funding for capital improvements, restoration of the existing system, safety improvements, congestion reduction, operational improvements, and preservation of bridges. While operations and maintenance are addressed, the STIP does not account for the state maintenance appropriation, except where maintenance funds are used to match federal funds, or other unique circumstances. Appendix 5 provides a summary and a chart by MPO/RPO showing available funding outside of the TIP that supports transportation operation and maintenance needs in the commonwealth. The following table shows a summary of funding contained in the highway and bridge portion of the STIP from all sources by federal fiscal year. STIP – Highway and Bridge Funding Summary ($M)
Source 2021 2022 2023 2024 Total
Federal $2,694 $2,752 $2,785 $2,813 $11,044 State $1,013 $1,097 $1,224 $1,457 $4,791 Other $147 $82 $49 $49 $327
Totals $3,854 $3,931 $4,058 $4,319 $16,162 Assumptions The following summarizes the funding assumptions for the highway and bridge portion of the STIP:
• Available funds are consistent with Financial Guidance with certain exceptions noted below.
• The 2023 STIP assumes new funding levels established in IIJA/BIL which was enacted on November 15, 2021.
• State funds are based on reasonable budget estimates in the years covered by the STIP.
5
DRAFT

• Most federal funding categories assume a four-year apportionment. Although the Commonwealth has balances of various federal funding categories, these balances were not considered except to adjust for certain types of projects. Overall fiscal constraint is maintained.
• Financial Guidance doesn’t assume any reserve balance of State highway or bridge funds. However, historically there are balances in both categories. The 2023 STIP includes approximately $100 million in reserve highway funds and $100 million in reserve bridge funds.
• Certain federal funds are associated with specific projects and/or programs and are available as additional financial resources above and beyond the dollar amounts shown in Financial Guidance. This includes categories such as earmarked Special Federal Funds (SXF) and various federal discretionary program funds.
Financial Constraint The 2023 STIP available funds versus programmed funds table shown below provides additional detail of all highway and bridge funding. The table is divided by core funding categories and those categories which bring additional resources to the STIP. Funding category definitions are provided in Appendix 6 and total federal, state, and other funding amounts are provided by fund category in Appendix 7. The table below demonstrates the financial capacity of the STIP. The amount of funding identified in Financial Guidance and the programmed amount do not always match exactly in some of the categories. The section “Additional Funding in the STIP” accounts for some of the differences along with PennDOT managing fiscal constraint based on available balances in state and federal categories, coupled with the transferability provisions of the federal program. Appendix 8 shows Pennsylvania’s Highway Federal funds balances as of July 29, 2022. The STIP contains slightly more federal funds than potential apportionments in some years. This is managed throughout the implementation of the STIP in the following ways:
• The annual obligation limitation will ultimately control the level of federal dollars obligated in any year.
• PennDOT develops all transportation projects based on federal procedures and requirements to allow greater flexibility in programming both state and federal funds. This approach allows PennDOT to react to variations in annual obligation authority because project development based on state standards alone does not allow a switch to federal funding.
• Programmed projects reflect Year of Expenditure (YOE) requirements.
6
DRAFT

FFY 2023-2026 Statewide Transportation Improvement Program Highway and Bridge Funding Summary Chart
Available Funds vs. Programmed Funds ($000)
7
DRAFT

Transit Summary Funding for transit improvements in Pennsylvania is a combination of federal, state and local monies. Federal funding of FTA programs is authorized by the IIJA/BIL which amended Chapter 53 of Title 49 of the U.S. Code. Federal funding includes various categories of funds, including those related to urban formula, rural, fixed guideway, new starts, elderly and persons with disabilities, and bus related facilities. State funding for transit programs is provided for in Act 44 of 2007 as amended by Act 89 of 2013. Act 44 of 2007 established the Public Transportation Trust Fund (PTTF) to fund public transportation programs and projects. Public transportation funds from various sources—Turnpike, Sales and Use Tax, Public Transportation Assistance Fund (PTAF), Capital Bond Funds, Lottery, transfers from the Motor License Fund that are not restricted to highway purposes and various fines—are deposited into the PTTF. Act 44, as amended, authorizes six major public transportation programs:
• Operating Program (Section 1513) • Asset Improvement Program for Capital projects (Section 1514) • Capital Improvement Program (Section 1517) • Alternative Energy Program (Section 1517.1) • New Initiatives Program (Section 1515) • Programs of Statewide Significance (Section 1516)
Congressional projects and Capital Investment Grant projects (such as New Start projects) are incorporated in the transit portion of the STIP. In addition, state capital budget funding is released annually for capital improvements. The regional TIPs include Coordinated Public Transit-Human Services Transportation Plans as required by the Final Rule issued on February 14, 2007. The following table provides a summary of funds included in the transit portion of the STIP. STIP – Transit Funding Summary ($M)
Source 2023 2024 2025 2026 Total
Federal $591 $561 $566 $542 $2,260 State $1,061 $932 $933 $933 $3,859 Other $449 $232 $288 $287 $1,256
Totals $2,101 $1,725 $1,787 $1,762 $7,375
8
DRAFT

Assumptions The following summarizes the funding assumptions for the transit portion of the STIP:
• The IIJA/BIL of 2021 substantially increased public transportation funding over FAST Act levels. The increases varied by transit agency and program, but overall transit funding increased approximately 36% over the final year of the FAST Act.
• The 2023 STIP assumes funding growth between 2% and 3% annually, as identified in the IIJA/BIL.
• State funds are based on the latest budget estimates in the years covered by the STIP and include increased revenues generated by the passage of Act 89 of 2013.
• A total of $25 million in federal highway funding per year will be flexed to transit. Financial Constraint The 2023 STIP Available Funds versus Programmed Funds table shown below provides additional detail of all transit funding. The table is also divided by core funding categories and those categories which bring additional resources to the STIP. Funding category definitions are provided in Appendix 6. Appendix 9 reflects all federal, state, and other transit funding. Programmed projects reflect year of expenditure requirements. Specific projects for included line items are determined early in the calendar year (CY). Once funding is committed through a grant, the appropriate federal or state MPMS funding codes are applied to the project (which may have been previously programmed with MPMS funds codes OTH-F or OTH-S) and funding is reduced in the corresponding federal funding line item. Please note that line items or actual projects are programmed for some agencies. This reflects an anticipation of funds or approved projects carried over from a previous STIP.
9
DRAFT

10
DRAFT

Statewide Programs The STIP includes several Highway and Bridge Statewide Programs that are centrally managed by PennDOT’s Center for Program Development and Management (CPDM). The Statewide Programs are developed and managed through a Continuing, Comprehensive, and Cooperative process with input from PennDOT, MPOs, RPOs, FHWA, STC and any other involved interested parties. Interstate Management Program The Interstate Management (IM) Program is a separate TIP that is centrally developed and managed based on statewide needs. Pennsylvania has one of the largest Interstate Systems in the nation, with more than 2,743 miles of roadway and 2,216 bridges. Based on asset condition it is estimated that the annual need on the Interstates is $1.2 billion to meet basic maintenance and preservation needs. Currently, we spend between $700-$750 million per year on the Interstate System. From a programming standpoint, the IM Program is constrained to an annual funding level provided as part of Financial Guidance. Working in collaboration with our MPOs/RPOs, PennDOT issued Financial Guidance that increases Interstate Investments by $50 million per year beginning in FFY 2021 up to $1 billion in FFY 2028. With the passage of the IIJA/BIL, Pennsylvania’s highway and bridge share will increase by $4 billion over five years. The anticipated funding has been distributed statewide utilizing existing formulas and data established as part of Financial Guidance process. The Interstate Program will receive an approximately $70 million a year in bridge funds from the IIJA/BIL. To manage the significant needs of the Statewide Interstate System more efficiently, PennDOT formed an Interstate Steering Committee (ISC). The ISC contains representation from PennDOT’s CPDM, the Bureau of Operations (BOO), the Bureau of Design and Delivery, and the PennDOT Engineering Districts (Districts). The ISC works with PennDOT, MPO/RPOs, FHWA and STC on the development and management of the IM Program. They assist with project prioritization and re-evaluate projects during Program updates. The ISC meets at least quarterly and assists with the management of the IM Program. Strategic planning is being conducted to update the roles and responsibilities of the ISC moving forward. As part of the 2023 Program Update, the ISC requested each District provide a presentation on Interstate conditions, needs, challenges, and best practices occurring within their jurisdiction. The presentations occurred in August 2021. All presentations were available via web conference so MPO/RPOs, FHWA, other Districts and PennDOT Central Office staff could participate. The Interstate presentations provided a statewide perspective of current conditions and offered an opportunity to review currently planned and potential projects. TPM measures and targets are outlined in the TPM section of this document. The TPM section will also outline how the IM program performance will be evaluated.
11
DRAFT

Project Prioritization In coordination with the District presentations, the individual Districts provided prioritized lists of Interstate needs. These lists were compiled into a statewide prioritized Interstate needs list and reviewed by the Asset Management Division as well as Operations and Safety. District priorities were given great consideration and Central Office BOO staff provided needs for the next four years. The District-prioritized project needs were also reviewed against performance-based documents. Initial programming consideration will be given to currently programmed Interstate projects without regular obligation/encumbrance or with Advance Construct (AC) obligation that need to be carried over from the current Program. Once the financial magnitude of the carry-over projects has been determined, an estimate can be made on the amount of program funds available for new IM projects, with consideration of current project schedules. Previous priority lists were shared with Districts. To help evaluate and prioritize projects, the Bridge Asset Management System (BAMS) and Pavement Asset Management System (PAMS) were utilized to provide an optimized program based on Lowest Life-Cycle Cost (LLCC) principles. BAMS and PAMS were utilized to review how well committed projects aligned with LLCC principals as well as to help ensure no known needs were missed. Candidate projects were then compared and rated with a high-medium-low rating against the LLCC principals from the fiscally unconstrained runs. Project bridge and pavement data and guidance from Chapter 13 of Publication 242 were also used in project selection. Pennsylvania’s Transportation Asset Management Plan (TAMP) defines how LLCC is required and applied to planning and programming. During development of the IM Program, consideration was given to Intelligent Transportation Systems (ITS) and various safety measures. Line items were programmed for ITS and All-weather Pavement Markings (AWPM), each of which will be ramped up over the first 4-years of the Interstate Program. The ITS line item will focus on addressing antiquated devices, new devices, and equipment gaps on the Interstate system. The AWPM line item will focus on the deployment of AWPMs as the center line for Interstates statewide. New LLCC principal projects were selected for the balance of funds available for the 2023 IM Program. The District-prioritized lists were compared with the BAMS and PAMS runs. Projects with high District and high Asset Management Division Priorities were added to the Program as new projects. Funds that were not allocated to projects were programmed in a set-aside line item to address programmatic contingencies, emergencies, and necessary project cost adjustments (increases and decreases). The line item will also be utilized to account for any obligation conversions that were anticipated to occur prior to end of the 2021 program and didn’t get converted. The line item is continually monitored and if not necessary for programmatic contingencies or emergencies, it is used to advance other prioritized needs.
12
DRAFT

The draft IM Program was shared with the ISC, Districts and MPO/RPOs on January 24, 2022. A final draft was shared with MPO/RPOs on February 8, 2022. Secretary’s Discretionary Funding on the Interstate As part of the Secretary’s discretionary (Spike) funded projects for the 2023 Program, several major Interstate Projects were included that otherwise would not have been able to advance and are vitally important to maintaining and improving our Interstate infrastructure. These projects are in support of Preventative Maintenance, Performance Based Planning and Programming, the Pennsylvania TAMP, and other state initiatives. Previously approved projects were reviewed and support state initiatives. The Spike-funded Interstate projects are included in the 2023 IM Program and are listed on the recommended Spike-funded projects for the 2023 Program. National Highway Freight Program The National Highway Freight Program (NHFP) was a new program authorized under the FAST Act to improve the efficient movement of freight on the National Highway Freight Network (NHFN) and support several important goals, including: (1) investing in infrastructure and operational improvements that strengthen economic competitiveness, reduce congestion, reduce the cost of freight transportation, improve reliability, and increase productivity; (2) improving the safety, security, efficiency, and resiliency of freight transportation in rural and urban areas; (3) improving the state of good repair of the NHFN; (4) using innovation and advanced technology to improve NHFN safety, efficiency, and reliability; (5) improving the efficiency and productivity of the NHFN; (6) improving State flexibility to support multi-State corridor planning and address highway freight connectivity; and (7) reducing the environmental impacts of freight movement on the NHFN. [23 U.S.C. 167 (a), (b)]. The Statutory citation for the NHFP is: FAST Act § 1116; 23 U.S.C. 167. Per 2023 Financial Guidance all NHFP funds continue to be allocated to the Interstates and included on the IM Program with the MPMS fund code NFP. Projects were based on the following considerations:
• Factors from the state’s Comprehensive Freight Movement Plan, including: o Freight bottlenecks; o Freight efficiency projects; and o Projects as identified by the state’s MPOs/RPOs.
• The Freight Bottleneck criterion supports the TPM bottleneck measure progress. • Estimated let dates: projects that haven’t been let but will be let within the Program
period. • Estimated construction costs: projects that had a cost greater than $50 million.
The table below includes all NHFP-funded projects that are programmed in the 2023 STIP. More information is available in Appendix 10.
13
DRAFT

National Highway Freight Program Projects:
County Project Title
Allegheny I-376: Commercial Street Bridge Dauphin I-83 East Shore (Section 3) Dauphin I-83 East Shore (Section 3B) Dauphin I-83 Eisenhower Interchange D Monroe I-80/Exit 308 Realignment Philadelphia I-95: Betsy Ross Ramps A&B Philadelphia I-95: Race – Shackamaxon Philadelphia I-95 Betsy Ross Mainline Southbound Philadelphia I-95 Southbound: Ann Street – Wheatsheaf Lane York I-83, North York Widening Central Office National Highway Freight Program Reserve
Statewide Items Program The STWD Items TIP contains approximately $602 million per year of transportation funding and is managed in PennDOT’s CPDM as a stand-alone TIP. It is comprised of a variety of statewide and multi-region projects, spending line items for routine transportation related work, and reserve line items that hold funds for a variety of programs. Statewide and multi-region projects generally have a scope of work that includes locations throughout Pennsylvania or with locations that span across more than one planning region or District. Statewide projects may also include research or demonstration projects funded with a specified allocation of state or federal funding. Other examples include projects coordinated with the Pennsylvania Turnpike Commission or other state agencies or commissions, projects coordinated with county and local government agencies, and projects coordinated with other business partners and associations. Statewide projects are of a statewide nature and would not typically be funded on an MPO/RPO Highway and Bridge TIP. Routine spending line items generally have predictable costs each year and cover various aspects of project development, construction, and asset management. They include funding for planning, Pooled Fund Studies, inter-agency environmental review, accounts for take-up of right-of-way claims for project closeout, training for, and inspection of, state and local bridges and other structures, the Local Technical Assistance Program, Disadvantaged Business Enterprise Supportive Services, Traffic Monitoring Site installation and repair, costs related to the deployment of Transportation Systems Management and Operations projects, costs associated with the Rapid Bridge Replacement program, and statewide oversight and management reserves. Reserve line items on the STWD Items TIP are used to maintain fiscal constraint of the overall STIP. They provide a STIP fiscal balancing facility to use when adding or removing projects, or when existing projects have cost savings or overruns, whether those projects are on the STWD Items TIP, or not. Reserve line items are held for state and federal highway and bridge funds, and a variety of other programs and fund types. For example, the Multimodal Reserve is used to
14
DRAFT

fund state multimodal projects on regional TIPs. The Transit Flex Reserve holds highway funds that are flexed to transit and used each year to add regional transit projects as determined by the Pennsylvania Public Transit Association in cooperation with PennDOT’s Bureau of Public Transit. The Department of Conservation and Natural Resources (DCNR) Recreation Trail Reserve provides funds for the Recreational Trails program continues to be a sub-allocation of the Transportation Alternatives Set-Aside. This program is operated by the DCNR in cooperation with PennDOT’s CPDM. Projects for education and administration of the program, as well as the Rec Trails projects themselves, are maintained on the STWD Items TIP. Rail-Highway Crossing Safety Program (RRX) Pennsylvania is allocated $7.2 million each year in federal Section 130 funding for the Rail-Highway Crossing Safety program. The RRX Program provides funding to eliminate hazards associated with at-grade highway and railroad crossings. Funding is used for installation of gates and flashing light warning systems, to upgrade existing warning systems, and for the removal of at-grade crossings. The RRX Reserve line Item is held on the STWD Items TIP, and projects are programmed on regional TIPs with the MPMS fund code RRX. The RRX program is developed by PennDOT CPDM and Bureau of Project Delivery staff in coordination with District Grade Crossing Engineers/Administrators (DGCE/As) at the annual Statewide Grade Crossing meeting held in December 2021. Projects without regular obligation, or with AC obligation, are carried on the 2023 STIP. New projects are cash-flowed to later years. Regular obligation of carry-over projects prior to 2023 STIP adoption frees up funding to advance new projects. RRX funding may only be used on open, public heavy (passenger and freight) rail crossings. Projects are prioritized first at locations in the top 25% highest hazard rating from the FRA Web Accident Prediction System (WBAPS). Other crossings along the same rail line can be included to form larger corridor projects. Local or railroad safety concerns, or MPO/RPO concerns communicated through their DGCE/A, which may not be identified in WBAPS, are also considered. These include issues such as increased train traffic, limited sight-distance, near-miss history, or antiquated warning devices. A list of RRX Program projects is included in Appendix 11. Highway Safety Improvement Program (HSIP) Set-aside The purpose of the HSIP is to achieve a significant reduction in fatalities and serious injuries on all public roads. Implementation of the Strategic Highway Safety Plan (SHSP) through data driven safety analysis supports achieving these reductions. Pennsylvania receives $125.9 million in HSIP funding in 2023 and increases by approximately 2.1% per year until 2026. 2026 funding levels hold level through twelve-year program. $40 million of HSIP funds is designated for the HSIP Set-aside. Utilization of low-cost safety improvements system-wide also supports fatal and serious injury reductions. The HSIP Set-aside is used to implement the low-cost, systematic safety countermeasures identified in the Roadway Departure Safety Implementation Plan (RDIP) and the Intersection Safety Implementation Plan (ISIP). The HSIP Set-aside is also used to advance larger safety projects by providing additional funding where necessary. The HSIP Set-aside
15
DRAFT

Reserve line Item is held on the STWD Items TIP, and projects are programmed on regional TIPs with the MPMS fund code sHSIP. HSIP funding proposals may be submitted by an MPO/RPO and are reviewed for eligibility through an approval workflow involving District and Central Office Safety and Planning staff prior to programming on a TIP. Communication announcing the HSIP Set-aside application period was shared on July 15, 2021. Set-aside funding applications were accepted from August 1 – September 30, 2021. A data-driven safety analysis in the form of Benefit/Cost (B/C) Life-Cycle analysis or Highway Safety Manual (HSM) analysis was required. Evaluation criteria were weighted, and each project was scored and ranked. Evaluation criteria included B/C analysis, HSM analysis, fatal and injury crashes, application of systematic improvements, improvement on local roads, and deliverability. Recommended projects meeting PennDOT’s eligibility requirements, including a minimum 1:1 B/C ratio, were selected based on evaluation criteria scoring. Selected projects demonstrate a significant potential safety return for the cost, within the current available funding. Carryover projects were approved in prior rounds of funding, or separately by the Program Management Committee (PMC) which is the central decision-making body for transportation improvement projects within PennDOT and was structured to cover impacts of changes to the capital funds program. Projects not recommended for funding will remain as candidate proposals to be considered as HSIP funds become available. FHWA has reviewed and concurs with the proposed program of projects. The HSIP Set-aside is continually monitored by Central Office CPDM and Bureau of Maintenance and Operations staff to maximize funding and project delivery. A list of HSIP Set-aside Program projects is included in Appendix 12. Transportation Alternatives Set-aside (TASA) The Transportation Alternatives Set-aside of the Surface Transportation Block Grant Program (TA Set-aside) provides $45 million per year for programs and projects defined as transportation alternatives, including on- and off-road pedestrian and bicycle facilities, infrastructure projects for improving non-driver access to public transportation and enhanced mobility, community improvement activities, environmental mitigation, trails that serve a transportation purpose, and safe routes to school projects. The IIJA/BIL further sub-allocates TA Set-aside funding based upon population. Funds available for any area of the state, urban areas with populations of 5,001 to 50,000, 50,000 to 200,000 and areas with population of 5,000 or less are centrally managed by PennDOT. PennDOT Central Office, with coordination and input from PennDOT Districts and MPOs/RPOs, selects projects through a statewide competitive application process. Projects are evaluated using PennDOT’s Core Principles, which are found in Design Manual 1. These Principles encourage transportation investments that are tailored to important local factors, including land use, financial concerns, and overall community context. Project deliverability, safety, and the ability to support Environmental Justice principles and enhance local or regional mobility are also considered during project evaluation. The planning and programming responsibilities for these TA Set-aside funds are handled by PennDOT CPDM and funding is fiscally constrained to an annual funding
16
DRAFT

level by Financial Guidance. The statewide TA Set-aside projects are programmed on regional TIPs with the MPMS fund code TAP. Selected projects are added to regional TIPs utilizing a Statewide Line Item to maintain fiscal constraint. Projects selected under previous application rounds without regular obligation or with AC obligation will be carried over from the current Program. The balance of funds from any carryover projects will remain in a Statewide Line Item on the Statewide Program. Additional information about the TA Set-aside can be found on PennDOT’s TA Set-aside Funding Site. A separate regional allocation of funding is available for urbanized areas with populations over 200,000. These funds are available for MPOs to administer competitive applications rounds to select eligible projects for inclusion on their regional TIPs. Funding is fiscally constrained based on annual funding amounts provided in Financial Guidance utilizing MPMS fund code TAU. The MPOs/RPOs will coordinate with the PennDOT CPDM TA Set-aside state coordinator prior to initiating a project selection round. A list of TAP projects is included in Appendix 13. Transportation Infrastructure Investment Fund (TIIF) $25 million per year in state highway capital funds is made available for improvements to eligible state-owned transportation facilities associated with economic development opportunities (designated as e581 on the TIPs). Project funding is authorized by the Governor of Pennsylvania through the office of the Secretary of the Department of Community and Economic Development (DCED). DCED works closely with PennDOT and the office of the Deputy Secretary for Planning to ensure project eligibility. Approved projects are administered in cooperation with PennDOT Districts and CPDM and programmed on regional TIPs. A list of TIIF Program projects is included in Appendix 14. Secretary’s Discretionary (Spike) As mentioned previously, a portion of highway funding is reserved for distribution by the Secretary of Transportation (referred to as Spike funding). The Secretary’s Spike funding is fiscally constrained to an annual funding level provided by Financial Guidance. The Spike funding planning and programming responsibilities are handled by PennDOT CPDM, based on direction provided from the Secretary. Historically, the Secretary of Transportation has selected projects to receive Spike funding to offset the impact of high-cost projects, implement special initiatives, or advance statewide priority projects. The Spike funding decisions typically continue previous Spike commitments, with any new project selections aligning with the Department’s strategic direction and investment goals. Selected Spike projects are included in regional TIPs or the Interstate Management TIP, utilizing Reserve Line Items from the STWD Items TIP to maintain overall STIP fiscal constraint. Spike projects are indicated with a lower-case “s” before the MPMS fund code (ex. sNHPP). To ensure Pennsylvania has a high-quality, well-functioning intelligent transportation system, $5 million of Spike funds was set-aside per year for the Transportation Systems Management and
17
DRAFT

Operations (TSMO) initiative. Projects were selected that promote and support the implementation of TSMO strategies to resolve key mobility and safety issues. MPO/RPO candidate projects were submitted for review from August 9, 2021 through September 30, 2021. Selected projects were shared with FHWA on November 15, 2021. Selected TSMO projects and Spike decisions were shared with MPO/RPOs and Districts on December 8, 2021. A list of SPIKE projects is included in Appendix 4. Independent County Wayne County is not part of a MPO or RPO and is considered an independent county. As an independent county, PennDOT, through the CPDM and Engineering District 4-0, develops and manages the Wayne County TIP as part of the STIP. Following Pennsylvania’s established transportation planning process, the Department coordinates with Wayne County officials on transportation needs and priorities. PennDOT District 4-0 uses various data sources along with knowledge of assets and project delivery to identify and prioritize needs. To help evaluate and prioritize needs, the Bridge Asset Management System (BAMS) and Pavement Asset Management System (PAMS) were utilized to provide an optimized program based on Lowest Life Cycle Cost (LLCC) principles. This information along with local input is used to identify which transportation projects need to be developed and advanced based on available funding. From a programming standpoint, the Wayne County TIP is fiscally constrained to an annual funding level provided as part of Financial Guidance. TPM measures and targets are outlined in the TPM section of this document. The TPM section will also outline how the Wayne County program performance will be evaluated. Supporting Wayne TIP documentation can be found in Appendix 22. TRANSPORTATION PERFORMANCE MANAGEMENT The IIJA/BIL continues the requirements established in Moving Ahead for Progress in the 21st Century Act (MAP-21) and the FAST Act for performance management. These requirements aim to promote the most efficient investment of Federal transportation funds. Performance-based planning ensures that PennDOT and the MPOs collectively invest Federal transportation funds efficiently towards achieving national goals. In Pennsylvania, the RPOs follow the same requirements as MPOs. Transportation Performance Management (TPM) is a strategic approach that uses data to make investment and policy decisions to achieve national performance goals. 23 USC 150(b) outlines the national performance goal areas for the Federal-aid program. This statute requires that FHWA and FTA establish specific performance measures for the system that address these national goal areas. The regulations for the national performance management measures are found in 23 CFR 490.
18
DRAFT

National Goal Areas
Safety To achieve a significant reduction in traffic fatalities and serious injuries on all public roads.
Infrastructure Condition
To maintain the highway infrastructure asset system in a state of good repair
Congestion Reduction
To achieve a significant reduction in congestion on the National Highway System
System Reliability To improve the efficiency of the surface transportation system Freight Movement and Economic Vitality
To improve the national freight network, strengthen the ability of rural communities to access national and international trade markets, and support regional economic development.
Environmental Sustainability
To enhance the performance of the transportation system while protecting and enhancing the natural environment
Reduced Project Delivery Delays
To reduce project costs, promote jobs and the economy, and expedite the movement of people and goods by accelerating project completion through eliminating delays in the project development and delivery process, including reducing regulatory burdens and improving agencies' work practices
Performance Based Planning and Programming Pennsylvania continues to follow a PBPP process, with a focus on collaboration between PennDOT, FHWA, FTA, MPOs/RPOs, and Transit Agencies at the county and regional levels. These activities are carried out as part of a 3C planning process which guides the development of many PBPP documents, including:
• Statewide and Regional Long Range Transportation Plans (LRTPs) • 12-Year Transportation Program (TYP) • State Transportation Improvement Program (STIP) • Regional Transportation Improvement Programs (TIPs) • Transportation Asset Management Plan (TAMP) • Transit Asset Management (TAM) Plans • Public Transportation Agency Safety Plans (PTASP) • Pennsylvania Strategic Highway Safety Plan (SHSP) • Comprehensive Freight Movement Plan (CFMP) • Congestion Mitigation and Air Quality (CMAQ) Performance Plan(s) • Congestion Management Process (CMP) • Regional Operations Plans (ROPs)
The above documents in combination with data resources including but not limited to PennDOT’s bridge and pavement management systems, crash databases, historical travel time archives, and the CMAQ public access system provide the resources to monitor federal performance measures and evaluate needs across the state. Based on these resources, PennDOT and MPOs/RPOs have worked together to (1) create data driven procedures that are based on principles of asset
19
DRAFT

management, safety improvement, congestion reduction, and improved air quality, (2) make investment decisions based on these processes, and (3) work to set targets that are predicted to be achieved from the programmed projects. Aligning goals and performance objectives across national (FHWA and FTA), state (PennDOT) and regions (MPOs/RPOs and Transit Agencies) provide a common framework for decision-making.
PennDOT, in cooperation with the MPOs/RPOs, has developed written provisions for how they will cooperatively develop and share information related to the key elements of the PBPP process including the selection and reporting of performance targets. These PBPP written provisions are provided in Appendix 15. In addition, PennDOT has updated their Financial Guidance to be consistent with the PBPP provisions. The Financial Guidance provides the near term revenues that support the STIP. Evaluating 2023-2026 STIP Performance The 2023 STIP supports the goal areas established in PennDOT’s 2045 long-range transportation plan. These include safety, mobility, equity, resilience, performance, and resources. The goals are aligned with the national goal areas and federal performance measures and guide PennDOT in addressing transportation priorities. The following sections provide an overview of the federal performance measures. Since asset management, reliability and CMAQ targets have not yet been set for the CY 2022-2025 performance period, the current project selection process for the 2023 STIP is highlighted and related to meeting future targets. Over the 4-year STIP, nearly 85% of the total funding is associated with highway and bridge reconstruction, preservation, and restoration projects. However, these projects are also anticipated to provide significant improvements to highway safety and traffic reliability for both passenger and freight travel. Through these performance measures, PennDOT will continue to track performance outcomes and program impacts on meeting the transportation goals and targets. Decision support tools including transportation data and project-level prioritization methods will be continually developed and enhanced to meet PennDOT and MPO/RPO needs. Dashboards and other reporting tools will be maintained to track and communicate performance to the public and decision-makers.
National Goals and
Performance Measures
Long-Range Transportation
and Twelve Year Program Plan
Goals
Project Prioritization• MPO/RPO CMP
and LRTP• Safety Plans
• TAMP
Performance Targets
Statewide Transportation Improvement
Program (STIP)
20
DRAFT

Safety Performance Measures Background The FHWA final rules for the National Performance Management Measures: Highway Safety Improvement Program (Safety PM) and Highway Safety Improvement Program (HSIP) were published in the Federal Register (81 FR 13881 and 81 FR 13722) on March 15, 2016, and became effective on April 14, 2016. These rules established five safety performance measures (commonly known as PM1). The current regulations are found at 23 CFR 490 Subpart B and 23 CFR 924. Targets for the safety measures are established on an annual basis. Data Source Data for the fatality-related measures are taken from the Fatality Analysis Reporting System (FARS) and data for the serious injury-related measures are taken from the State motor vehicle crash database. The Vehicle Miles of Travel (VMT) are derived from the Highway Performance Monitoring System (HPMS). 2022 Safety Measures and Targets (Statewide)
Measure Baseline (2016-2020)
Target (2018-2022)
Number of fatalities 1,140.6 1,113.7 Rate of fatalities per 100 million VMT 1.157 1.205 Number of serious injuries 4,445.6 4,490.8 Rate of Serious injuries per 100 VMT 4.510 4.86 Number of non-motorized fatalities & serious injuries 761.2 730.1
Methods for Developing Targets An analysis of Pennsylvania’s historic safety trends was utilized as the basis for PennDOT and MPO/RPO coordination on the State’s safety targets. The targets listed above are based on a 2% annual reduction for fatalities and maintaining levels for suspected serious injuries, which was derived from the actions listed in the Strategic Highway Safety Plan (SHSP), crash data analysis and the desire to support the national initiative Toward Zero Deaths. Progress Towards Target Achievement and Reporting: PennDOT and the MPOs/RPOs continue efforts to ensure the STIP, regional TIPs, and LRTPs are developed and managed to support progress toward the achievement of the statewide safety targets. At this time, only the Delaware Valley Regional Planning Commission (DVRPC) has elected to establish their own regional safety targets. All other MPOs/RPOs have adopted the statewide targets.
21
DRAFT

PennDOT’s SHSP serves as a blueprint to reduce fatalities and serious injuries on Pennsylvania roadways and targets 18 Safety Focus Areas (SFAs) that have the most influence on improving highway safety throughout the state. Within the SHSP, PennDOT identifies 3 key emphasis areas to improve safety – impaired driving, lane departure crashes, and pedestrian safety.
2022 SHSP Safety Focus Areas
Lane Departure Crashes Speed & Aggressive Driving Seat Belt Usage Impaired Driving
Intersection Safety Mature Driver Safety Local Road Safety Motorcycle Safety
Pedestrian Safety Bicycle Safety Commercial Vehicle Safety
Young & Inexperienced Drivers
Distracted Driving Traffic Records Data Work Zone Safety Transportation Systems Management & Operations
Emergency Medical Services Vehicle-Train Crashes
Pursuant to 23 CFR 490.211(c)(2), a State Department of Transportation (DOT) has met or made significant progress toward meeting its safety performance targets when at least 4 of the 5 safety performance targets established under 23 CFR 490.209(a) have been met or the actual outcome is better than the baseline performance for the year prior to the establishment of the target. For Pennsylvania’s 2020 targets, the FHWA determined in March 2022 that Pennsylvania did not meet the statewide targets and is subject to the provisions of 23 U.S.C. § 148 (i). This requires the Department to submit an implementation plan that identifies gaps, develops strategies, action steps and best practices, and includes a financial and performance review of all HSIP funded projects. In addition, the Department is required to obligate in Federal Fiscal Year (FFY) 2023 an amount equal to the FFY 2019 HSIP apportionment. As part of the Highway Safety Improvement Program Implementation Plan, the Department identified gaps and best practices to support further reducing serious injuries and fatalities. The following opportunities were identified as ways to assist with meeting future targets: (1) appropriate project selection, (2) expanding local road safety in HSIP, (3) assessing programs that support non-motorized safety, (4) expanding use of systemic safety projects, (5) improved project tracking for evaluation purposes and (6) project prioritization for greater effectiveness. PennDOT continues to provide feedback on statewide and MPO/RPO-specific progress towards target achievement. The progress helps regional MPOs/RPOs understand the impacts of their past safety investments and can guide future planning goals and strategy assessments. Evaluation of STIP for Target Achievement: The following has helped to ensure that planned projects in the STIP will help to achieve a significant reduction of traffic fatalities and serious injuries on all public roads:
• PennDOT receives federal funding for its Highway Safety Improvement Program (HSIP). The 2023 STIP includes $520 million of HSIP funding. The Department distributes nearly 70% of this funding to its regions based on fatalities, serious injuries, and reportable crashes. In addition, a portion of the HSIP funding is reserved for various safety initiatives statewide. A complete listing of the HSIP projects is included in Appendix 12.
22
DRAFT

• All projects utilizing HSIP funds are evaluated based on a Benefit/Cost (B/C) analysis, Highway Safety Manual (HSM) analysis, fatal and injury crashes, application of systemic improvements, improvements on high-risk rural roads, and deliverability. Specifically, as part of PennDOT’s HSIP application process, a data-driven safety analysis in the form of B/C analysis or HSM analysis is required. Performing this analysis early in the planning process for all projects will help ensure projects selected for inclusion in the TIP will support the fatality and serious injury reductions goals established under PM1.
• The process for selecting safety projects for inclusion in the TIP begins with the Network Screening Evaluation that the Department has performed on a statewide basis. Selecting locations with an excess crash frequency greater than zero from this network screening is key to identifying locations with a high potential to improve safety. This evaluation has been mapped and is included in PennDOT’s OneMap to ease use by PennDOT’s partners. At the current time, this is not all inclusive for every road in Pennsylvania. Locations not currently evaluated may be considered by performing the same type of excess crash frequency evaluation the Department utilizes. Once this analysis has been performed, the data is used by the Engineering Districts and planning partners to assist MPO/RPOs in evaluating different factors to address the safety concern.
• PennDOT continues to improve on the methods to perceive, define and analyze safety. This includes integration of Regionalized Safety Performance Functions (SPFs) that have been used to support network screening of over 20,000 locations.
• PennDOT continues to identify new strategies to improve safety performance. PennDOT is actively participating in EDC 5 to identify opportunities to improve pedestrian safety as well as reduce rural roadway departures. These efforts will lead to new strategies that will be incorporated into the future updates of the SHSP.
• Safety continues to be a project prioritization criterion used for selecting other STIP highway and bridge restoration or reconstruction projects. Many of these projects also provide important safety benefits.
• PennDOT continues to evaluate procedures to help in assessing how the STIP supports the achievement of the safety targets. As HSIP projects progress to the engineering and design phases, Highway Safety Manual (HSM) predictive analyses are completed for the project in accordance with PennDOT Publication 638. The HSM methods are the best available state of practice in safety analysis and provides quantitative ways to measure and make safety decisions related to safety performance. Some HSIP projects on the STIP are in an early planning stage and do not have HSM predictive analyses completed. PennDOT will continue to identify ways to expand the application of HSM analyses to support more detailed assessments of how the STIP is supporting achievement of the safety targets.
Pavement/Bridge Performance Measures Background The FHWA rule for the National Performance Management Measures; Assessing Pavement and Bridge Condition for the National Highway Performance Program was published in the Federal Register (82 FR 5886) on January 18, 2017 and became effective on February 17, 2017. This rule established six measures related to the condition of the infrastructure on the National Highway
23
DRAFT

System (NHS). The measures are commonly known as PM2. The current regulations are found at 23 CFR 490 Subpart C and Subpart D. Targets are established for these measures as part of a 4-year performance period, the first was CY 2018 to 2021. This TIP includes projects that will impact the second 4-year performance period of CY 2022 to 2025. Data Source Data for the pavement and bridge measures are based on information maintained in PennDOT’s Roadway Management System (RMS) and Bridge Management System (BMS). The VMT are derived from the Highway Performance Monitoring System (HPMS). 2022-2025 Pavement Performance Measure Targets (Statewide)
Measure Baseline 2021
2-year Target 2023
4-year Target 2025
% of Interstate pavements in Good condition TBD TBD TBD % of Interstate pavements in Poor condition TBD TBD TBD % of non-Interstate NHS pavements in Good condition TBD TBD TBD % of non-Interstate NHS pavements in Poor condition TBD TBD TBD
Bridge Performance Measure Targets (Statewide)
Measure Baseline 2021
2-year Target 2023
4-year Target 2025
% of NHS bridges by deck area in Good condition TBD TBD TBD % of NHS bridges by deck area in Poor condition TBD TBD TBD
Methods for Developing Targets Pennsylvania’s pavement and bridge targets will be established by October 2022 through extensive coordination with a Transportation Asset Management Plan (TAMP) steering committee and workshops with MPOs/RPOs and FHWA’s Pennsylvania Division. The targets will be consistent with PennDOT’s asset management objectives of maintaining the system at the desired state of good repair, managing to LLCC, and achieving national and state transportation goals. Targets are expected to be calculated based on general system degradation (deterioration curves) offset by improvements expected from delivery of the projects in the TIP along with planned state funded maintenance projects. Progress Towards Target Achievement and Reporting PennDOT continues to implement enterprise asset management for programming and decision-making as outlined in the TAMP. PennDOT is transitioning to the new TAMP that was finalized in the summer of 2022. The tools and methodologies are continually evaluated to prioritize state-of-good repair approaches that preserve transportation system assets. Within the TAMP, PennDOT identifies the following key objectives:
24
DRAFT

PennDOT’s analyses pertaining to life-cycle management, risk management, financial planning, and any performance gaps culminate in an investment strategy to support the objectives and targets established in the TAMP. Appendix 16 includes PennDOT’s annual TAMP Implementation Plan to FHWA and FHWA’s approval. PennDOT and the MPOs/RPOs continue to ensure the STIP, regional TIPs, and LRTPs are developed and managed to support progress toward the achievement of the statewide pavement/bridge objectives and targets that will be established for the 2022-2025 performance period. Pennsylvania’s pavement and bridge projects provided in the 2023 STIP were selected through extensive coordination with PennDOT’s Asset Management Section in accordance with the TAMP. The projects are consistent with PennDOT’s asset management objectives of maintaining the system at the desired state of good repair, managing to lowest life-cycle costs (LLCC), and achieving national and state transportation goals. Evaluation of STIP for Target Achievement The following has helped to ensure that planned projects in the STIP will help to achieve an improvement in bridge and pavement conditions for the state interstate and NHS roads:
• Nearly 85% of PennDOT’s STIP funding is directed to highway and bridge preservation, restoration, and reconstruction projects. Many of these projects are focused on our state’s interstate and NHS roadways.
• Pennsylvania’s investment strategy, reflected in the statewide 2023 TYP and 2023 STIP, is the result of numerous strategic decisions on which projects to advance at what time. PennDOT continues to address the challenges of addressing local needs and priorities, while ensuring a decision framework is applied consistently across the state.
• The TAMP provides a 12-year outlook that includes the financial strategy for various work types and is a driver for the TIP, STIP, TYP and LRTP development. The TAMP projects the levels of future investment necessary to meet the asset condition targets and contrasts them with expected funding levels. This helps PennDOT to make ongoing assessments and to re-evaluate data associated with its future investment decisions.
• In support of the STIP development, PennDOT and MPOs/RPOs jointly developed and approved General and Procedural Guidance and Transportation Program Financial Guidance documents. The guidance, which is consistent with the TAMP, formalizes the process for Districts, MPOs/RPOs and other interested parties as they identify projects, perform a project technical evaluation, and reach consensus on their portion of the program.
• The Procedural Guidance also helps standardize the project prioritization process. The guidance is key to resolving issues between programming to lowest life-cycle cost, managing current infrastructure issues and risk mitigation. The resulting methodology allows data-driven, asset management-based decisions to be made with human input and insight based on field evaluations to achieve maximum performance of the available funds. The guidance document is revised for each STIP cycle as PennDOT’s asset
TAMP Objectives•Sustain a desired state of good repair over the life-cycle of assets•Achieve the lowest practical life-cycle cost for assets•Achieve national and state goals
25
DRAFT

management tools and methods evolve and enhance its ability to program to lowest life-cycle cost.
• In the short term, candidate projects are defined, and the proposed program is compared to Pavement Asset Management System (PAMS) and Bridge Asset Management System (BAMS) outputs to verify that the program is developed to the lowest practical life-cycle cost. The percentages of good and poor can also be projected for evaluation of how the program may impact the national performance measures. When PAMS and BAMS are further implemented and improved, then planners can use the systems to optimize the selection of projects to achieve optimal performance within the funding constraints. Draft programs can then be analyzed in relation to the PM2 measures.
System Performance Measures (PM3) Background The FHWA final rule for the National Performance Management Measures; Assessing Performance of the National Highway System, Freight Movement on the Interstate System, and Congestion Mitigation and Air Quality Improvement Program was published in the Federal Register (82 FR 5970) on January 18, 2017 and became effective on May 20, 2017. This rule established six measures related to various aspects of the transportation system (commonly known as PM3). The current regulations are found at 23 CFR 490 Subparts E, F, G & H. Targets are established for these measures as part of a 4-year performance period, the first was 2018 to 2021. The STIP includes projects that will impact future performance periods based on when projects are constructed or completed. Data Source The Regional Integrated Transportation Information System (RITIS) software platform is used to generate all the travel time-based measures. Data from the American Community Survey (ACS) and FHWA’s CMAQ annual reporting system are used for the non-SOV travel and mobile source emissions measures, respectively.
Travel Time and Annual Peak Hour Excessive Delay Targets
Measure Baseline 2021
2-year Target 2023
4-year Target 2025
Interstate Reliability (Statewide) TBD TBD TBD Non-Interstate Reliability (Statewide) TBD TBD TBD Truck Reliability Index (Statewide) TBD TBD TBD
Annual Peak Hour Excessive Delay Hours Per Capita (Urbanized Area)
Philadelphia - TBD TBD TBD
Pittsburgh - TBD TBD TBD Reading – TBD TBD TBD
Allentown – TBD TBD TBD Harrisburg – TBD TBD TBD
York – TBD TBD TBD Lancaster - TBD TBD TBD
26
DRAFT

Non-SOV Travel Measure Targets
Measure Baseline 2021
2-year Target 2023
4-year Target 2025
Percent Non-Single Occupant Vehicle Travel (Urbanized Area)
Philadelphia – TBD TBD TBD
Pittsburgh - TBD TBD TBD
CMAQ Emission Targets
Measure 2-year Target 2023
4-year Target 2025
VOC Emissions (Statewide) TBD TBD NOx Emissions (Statewide) TBD TBD PM2.5 Emissions (Statewide) TBD TBD PM10 Emissions (Statewide) TBD TBD CO Emissions (Statewide) TBD TBD
Methods for Developing Targets The System Performance measure targets will be established by October 2022 in coordination with MPOs/RPOs within the state. PennDOT continues to evaluate historic variances in performance measures in relation to project completion to assist with the target setting process. Progress Towards Target Achievement and Reporting PennDOT and the MPOs/RPOs continue efforts to ensure the STIP, regional TIPs, and LRTPs are developed and managed to support the improvement of the reliability and CMAQ performance measures. This future progress will be measured against the targets established for the CY 2022-2025 performance period. PennDOT continues to monitor the impacts of completed investments on performance measures to better evaluate investment strategies. These efforts include evaluating the causes of historic reliability and delay issues, identifying freight bottlenecks, and assessing completed projects that provided the most benefits to reliability. PennDOT remains committed to expand and improve system mobility and integrate modal connections despite the large percentage of funding dedicated to infrastructure repair and maintenance. PennDOT’s LRTP provides objectives to address mobility across the transportation system that will guide investment decisions. The federal systems performance measures will be used to assess future progress in meeting these objectives and the associated targets.
27
DRAFT

Evaluation of STIP for Target Achievement The following has helped to ensure that planned projects in the STIP will help to achieve an improvement in the system performance measures for the statewide interstate and NHS road system:
• PennDOT continues to emphasize their TSMO initiatives to program low-cost technology solutions to optimize infrastructure performance. This has included the development of Regional Operations Plans (ROPs) that integrate with the MPO Congestion Management Process (CMP) to identify STIP projects. A TSMO funding initiative was established in 2018 to further support these efforts. The 2023 STIP includes over $289 million of funding dedicated to congestion relief projects.
• PennDOT has funded Interstate projects to address regional bottlenecks. Mainline capacity increasing projects are limited to locations where they are needed most. These investments will provide significant improvements to mobility that support meeting the Interstate and freight reliability targets.
• The statewide CMAQ program provides over $440 million of funding on the STIP for projects that benefit regional air quality. PennDOT has worked with Districts and MPO/RPOs to develop more robust CMAQ project selection procedures to maximize the air quality benefits from these projects.
• Over $210 million is provided in the STIP for multimodal alternatives. This includes funding for transit operating costs, transit and rail infrastructure, support for regional carpooling, and other bike and pedestrian infrastructure within the state. These projects provide opportunities to reduce VMT and increase the percentage of non-single occupant vehicles.
• At this time, the potential impact of past and planned STIP investments on PM-3 performance measures is still being evaluated. The timeline for project implementation often prevents an assessment of measurable results until a number of years after project completion. PennDOT continues to monitor the impact of recently completed projects on the reliability and delay measures. As more data is obtained, these insights will help PennDOT in evaluating potential project impacts in relation to other factors including incidents and weather on system reliability and delay.
Transit Performance Measures Background In July 2016, FTA issued a final rule (TAM Rule) requiring transit agencies to maintain and document minimum Transit Asset Management (TAM) standards, policies, procedures, and performance targets. The TAM rule applies to all recipients of Chapter 53 funds that either own, operate, or manage federally funded capital assets used in providing public transportation services. The TAM rule divides transit agencies into two categories (tier I and II) based on size and mode. The TAM process requires agencies to annually set performance measure targets and report performance against those targets. For more information see: Transit Asset Management | FTA (dot.gov)
28
DRAFT

Data Source The TAM rule requires states to participate and/or lead the development of a group plan for recipients of Section 5311 and Section 5310 funding, and additionally allows other tier II providers to join a group plan at their discretion. All required agencies (Section 5311 and 5310) and remaining tier II systems except for Centre Area Transportation Authority (CATA), have elected to participate in the PennDOT Group Plan. The Group Plan is available on PennDOT’s website at PennDOT Group Plan. The group plan is updated annually with new targets as well as the current performance of the group.
Transit Asset Management Targets (for all agencies in PennDOT Group Plan)
Measure Asset Class FY 2020-21 Target
Current Performance
FY 2021-22 Target
Rolling Stock (Revenue Vehicles)
Age % of revenue vehicles within a particular asset class that have
met or exceeded their Estimated Service Life (ESL)
AO-Automobile 16% 18% 18% BR-Over-the-road Bus 12% 18% 18%
BU-Bus 29% 28% 28% CU-Cutaway 42% 52% 52%
VN-Van 64% 63% 63% SV-Sports Utility Vehicle 17% 33% 33%
Equipment (Non-Revenue Vehicles) Age
% of non-revenue/service vehicles within a particular asset class that have met or
exceeded their ESL
Automobiles 46% 57% 57%
Trucks/Rubber Tire Vehicles 50% 27% 27%
Facilities Condition
% of facilities with a condition rating below 3.0 on the FTA
TERM scale
Administrative / Maintenance Facilities 30% 14% 14%
Passenger / Parking Facilities 83% 84% 84%
Methods for Developing Targets PennDOT annually updates performance targets based on two primary elements: the prior year’s performance and anticipated/obligated funding levels. PennDOT requires rolling stock and non-revenue vehicles (equipment) to meet both age and mileage ESL standards prior to being replaced. While the identified annual targets represent only age and condition in line with FTA guidelines, PennDOT will continue to apply age and mileage when making investment decisions. Progress Towards Target Achievement and Reporting The Pennsylvania TAM Group Plan fulfills the PBPP requirement and encourages communication between transit agencies and their respective MPOs and RPOs. In accordance with the plan, the following actions take place that fulfill the PBPP requirement:
29
DRAFT

• PennDOT provides asset performance reports to transit agencies by August 31 of each year that measure performance against established targets for the previous fiscal year.
• Transit agencies review the content for accuracy and confirm with PennDOT that information related to transportation asset performance has been received and is accurate.
• Transit agencies share performance data with their respective planning partner by the end of each calendar year, or earlier as decided between the partners.
• New performance goals for the upcoming fiscal year are established no later than September 15 of each year and communicated to transit agencies covered under the group plan.
• Transit agencies continue regular coordination regarding the local TIP and other planning initiatives of the local planning partner.
All transit agencies are required to utilize Pennsylvania’s transit Capital Planning Tool (CPT) as part of their capital planning process and integrate it into their TAM process. The CPT is an asset management and capital planning application that works as the central repository for all Pennsylvania transit asset and performance management activities. Consistent with available resources and in coordination with the PennDOT BPT, transit agencies are responsible for submitting projects consistent with the CPT for the development of the transit portion of the Program. This ensures that projects identified on the TIP are consistent with the TAM approach and respective TAM plans. PennDOT CPDM will update this project information in MPMS and share it with the MPOs/RPOs, PennDOT BPT, and the transit agencies. Evaluation of STIP for Target Achievement The STIP includes an investment prioritization process using established decision support tools. The investment prioritization process occurs annually as part of the capital budgeting process. To prioritize investments at an agency level and at a statewide level, the following basic actions take place:
• Update inventory in the CPT to include age, mileage, condition, and operational status • Identify assets that are not in a state-of-good-repair, using the following priority process:
o Vehicles that surpass age and mileage ESL o Vehicles that surpass age or mileage ESL and are rated in poor condition or
represent a safety hazard o Facilities that have a condition rating of less than 3 on the TERM Scale, with
priority given to facilities that are the lowest in the scale and represent a critical need to maintain operational capacity
• Determine available funding based on federal and state funding sources • Develop projects within the CPT Planner based upon funds availability • Import CPT Planner into DotGrants for the execution of capital grants
Throughout the process, PennDOT reviews projects and works with agencies to approve and move projects forward through the grant process.
30
DRAFT

Public Transit Safety Performance Measures In addition to the Transit Asset Management Performance, FTA issued a final rule on Public Transportation Agency Safety Plans (PTASP), effective July 19, 2019. The PTASP final rule (49 C.F.R. Part 673) is meant to enhance safety by creating a framework for transit agencies to manage safety risks in their organization. It requires recipients of FTA funding to develop and implement safety plans that support the implementation of Safety Management Systems (SMS). At this time, recipients of only Section 5311 (Formula Grants for Rural Areas) or Section 5310 (Enhanced Mobility of Seniors and Individuals with Disabilities Program) are exempt from the PTASP requirement. As part of the plan development process, performance targets must be established for the following areas:
1. Fatalities, 2. Injuries, 3. Safety Events, and System Reliability
All public transit agencies in the Commonwealth have written safety plans compliant with Part 673 as of July 20, 2021. These safety plans must be updated annually based on agency specific execution dates and shared with PennDOT BPT. It is also the transit agency’s responsibility to share the updated plan with their respective MPO/RPO, so the new targets and measures can be incorporated into regional planning practices.
MANAGING STIP FUNDING Funding included in the 2023 STIP and summarized in the earlier tables includes resources that can reasonably be assumed to be available over the 4-year period. Actual obligation of federal funds will be controlled by annual obligation limitations as determined through annual Federal Transportation Appropriation Acts. Funding categories for specific highway and bridge categories does not precisely match funding anticipated over the four-year period. As has been past practice, PennDOT will manage the STIP within the core fund categories. This includes managing between federal and state dollars. PennDOT, if necessary, will utilize transfer provisions to provide necessary funding for the STIP priorities. Due to annual obligation limitations, Pennsylvania’s balance of federal funds continues to increase. Therefore, balances of a specific category may be available and can be directed to projects in accordance with MPO/RPO and PennDOT priorities. A summary of the Highway Federal funds balances is included in Appendix 8. PennDOT, FHWA and the FTA have a Memorandum of Understanding (MOU) establishing the procedures for STIP modifications. This agreement is included in Appendix 17. The STIP will be managed in each planning region based on agreed upon TIP modification procedures. Each MPO/RPO has adopted specific procedures for their area. These TIP modification procedures
31
DRAFT

define an amendment and an administrative modification. They define how the MPO or RPO will act upon these items and set thresholds for approval authority. As part of a MOU with FHWA and FTA, PennDOT has agreed to provide each MPO/RPO and FHWA with quarterly and year-end status reports that indicate federal funds obligated and state funds encumbered/spent for projects listed on each region’s TIP. Line Items Reserve line-item funding has been used in several ways throughout the development of the TIPs and STIP:
• Within specific TIPs, line items are used for certain types of projects such as, but not limited to, Betterments, Bridge Preservation, and Low-Cost Safety Initiatives. Individual projects will be identified at a future date and will be drawn down from the line item.
• At the Statewide level, line items are used to reserve funding for specific purposes. Some examples include the Statewide Highway-Rail Grade Crossing (RRX) program, Statewide HSIP set-aside, Statewide Rapid Bridge Replacement (RBR) program, Transportation Infrastructure Investment Fund (TIIF) reserve, Statewide Transit Flex reserve, contracts with Environmental Review Agencies, and State and Local bridge inspection. This also applies to Surface Transportation Block Grant Program Set-aside (TAP) funds, which involves a statewide application, review and selection process.
• Transit statewide line items are used for unallocated and reserved transit funding. Cash Flow Programming Cash flow programming continues to be employed as part of the programming process. The 2023 STIP lists funds required to complete a project or phases of a project. If federal funds were obligated or state funds previously encumbered, they do not appear in the Program. PennDOT will continue to use tools such as AC and partial conversions to manage federal funds required for each project/phase. Project Cost Estimating and Scheduling The Bureau of Design and Delivery developed cost estimating guidance to update the processes and procedures found in the Estimating Manual, Publication 352. The cost estimating guidance covers planning through the Final Design Office Meeting. The guidance emphasizes updates of construction cost estimates at the project milestones of Program development, Engineering and Environmental Scoping, NEPA Approval, Design Field View, Final Design Office Meeting, and Final Estimate. The document highlights the need to carefully consider the cost estimate at the planning and programming phase. This guidance also emphasizes the importance of documentation and review of estimates. Tools were developed to facilitate documentation with respect to analyzing the cost drivers that affect the project estimate and the Estimate Review Report. Training has been offered to all Engineering Districts.
32
DRAFT

AIR QUALITY In order to receive transportation funding and approvals from FHWA and/or FTA, state and local transportation agencies must demonstrate that their plans, programs, and projects meet the transportation conformity requirements of the Clean Air Act (CAA), as set forth in the transportation conformity rule. Under the transportation conformity rule, transportation plans are expected to conform to the applicable State Implementation Plan (SIP) in nonattainment or maintenance areas, as defined by the Environmental Protection Agency (EPA). The integration of transportation and air quality planning is intended to ensure that transportation plans, programs, and projects will not:
• Cause or contribute to any new violation of any applicable National Ambient Air Quality Standard (NAAQS).
• Increase the frequency or severity of any existing violation of any applicable NAAQS. • Delay timely attainment of any applicable NAAQS, any required interim emissions
reductions, or other NAAQS milestones. PennDOT has worked with its MPOs/RPOs to complete and document conformity determinations for the 2023 STIP. The conformity determinations address the current NAAQS that are applicable to each region. These include the 1997 8-hour ozone, 2006 24-hour fine particulate (PM2.5), 2008 8-hour ozone, 2012 annual PM2.5, and 2015 8-hour ozone NAAQS. A table and map documenting the areas that require Transportation Conformity can be found in Appendix 18. The transportation conformity determination typically includes an assessment of future highway emissions for defined analysis years. Emissions are estimated using the latest available planning assumptions and available analytical tools, including the EPA’s latest approved on-highway mobile sources emissions model, the Motor Vehicle Emission Simulator (MOVES). The conformity determination provides a tabulation of the analysis results for applicable precursor pollutants, showing that the required conformity test was met for each analysis year. In 2018, the EPA issued guidance that addresses how transportation conformity determinations can be made in areas subject to the 1997 8-hour ozone NAAQS standard. The guidance is based on a February 16, 2018 District of Columbia Circuit court decision for South Coast Air Quality Mgmt. District v. EPA (“South Coast II,” 882 F.3d1138). Conformity determinations for the 1997 8-hour ozone NAAQS do not require an emissions analysis. As required by the federal transportation conformity rule, the conformity process includes a significant level of cooperative interaction among federal, state, and local agencies. To meet this requirement, PennDOT and the MPOs/RPOs have a formalized Interagency Consultation Process. The process was developed and documented in collaboration with the Statewide Interagency Consultation Group (ICG). The consultation process included conference calls and meetings of the Pennsylvania Transportation and Air Quality Work Group. Participants of this work group include PennDOT, Pennsylvania Department of Environmental Protection (DEP), EPA, FHWA, FTA and representatives from larger MPOs within the state. Meetings and conference calls were conducted to review all input planning assumptions, methodologies, and analysis years. PennDOT used a SharePoint website to share project narrative lists and air quality reports with consultation partners and to obtain and manage comments. In addition, weekly email updates were sent to consultation partners identifying the critical reviews based on the start date of the
33
DRAFT

MPO’s/RPO’s public comment period. This process provided for collaboration and efficient reviews of draft materials. In addition to coordination with the ICG, PennDOT hosted a training session with FHWA, EPA, and MPOs/RPOs to educate stakeholders on Air Quality requirements and discuss the transportation conformity process and procedures for the 2023 STIP update.
PUBLIC PARTICIPATION SUMMARY INFORMATION
PennDOT and all MPO and RPOs, along with the STC, jointly conducted public involvement for the development of Pennsylvania’s 2023 Transportation Program.
In preparation for the 2023 program update, the STC evaluated the performance of Pennsylvania’s transportation system and released its findings in the 2021 Transportation Performance Report. The report assesses the condition of the PA transportation system with available resources in the areas of safety, mobility, preservation, accountability, and funding. The public was asked to consider the report findings and offer feedback for consideration in the 2023 Program update.
The STC accepted public comments for six weeks from March 1, 2021 through April 14, 2021. The STC uses many outreach tools to provide the public with accessible opportunities to provide feedback, among them:
• A statewide online public forum hosted by PennDOT Secretary Yassmin Gramian was heldon March 23, 2021. State Transportation Commissioner Ronald Drnevich and DeputySecretary of Planning Larry Shifflet were presenters and keynote speakers at the forum.
• A customized, interactive online survey (also available via paper upon request) invitedparticipants to rank their transportation system priorities, develop their version of atransportation budget and map their transportation concerns.
These public feedback tools were promoted and made available on the STC’s website, www.talkpatransportation.com. The STC, along with PennDOT and MPOs/RPOs across the Commonwealth promoted the 2023 TYP Open Comment Period through a series of email blasts, social media posts (Facebook and Twitter), and traditional press releases. Through this cooperative effort, over 7,400 customers visited the online survey and identified nearly 2,500 transportation issues.
The STC posted the results of the Open Comment Period on the website so the MPOs/RPOs could utilize the data for their regional TIPs and, in some regions, LRTPs.
The 2023 TYP is available on www.talkpatransportation.com.
After TIPs were developed and air quality conformity determinations were completed, a minimum 30-day public comment period was conducted for each region per their regional public participation plans. Public comment period dates are included in Appendix 19. Block advertisements were placed in area newspapers, and in some cases, public service announcements were aired on local radio or TV stations. The publicly shared documents (including the TIP, air quality conformity determination, if appropriate, and the TIP Modification Procedures) were available electronically, and in some cases, were placed in public buildings and
34
DRAFT

other locations accessible to the public via appointment. MPOs/RPOs placed documents on their websites, and PennDOT provided links to each MPO/RPO website through the STC website. In addition, all MPOs/RPOs held public meetings during the public comment period. Before the 30-day comment periods were opened, each MPO/RPO and PennDOT began the Environmental Justice (EJ) outreach efforts using Census Track information and other data to determine the locations and concentrations of traditionally underserved populations within the study area. Outreach efforts were then initiated through local elected officials, community/civic leaders, religious organizations, housing projects, and others to obtain comments on the documents. MPOs/RPOs led efforts to consider the potential impacts of the TIP to low-income and minority populations and the Environmental Justice analysis can be found in each regional TIP. Efforts will continue to refine and improve public outreach efforts to traditionally underserved populations to gather more input early and often on long-range and short-range programs. Additionally, each MPO/RPO provided copies of their respective TIP documents to representatives of Federally Recognized Native American Tribes and Nations with interests within their geographic areas of responsibility so that the tribal leaders could provide comments and feedback. The list of tribal contacts included the Absentee-Shawnee Tribe of Oklahoma, the Cayuga Nation, the Delaware Nation, the Delaware Tribe of Indians, the Eastern Shawnee Tribe of Oklahoma, the Oneida Indian Nation, the Oneida Nation of Wisconsin, the Onondaga Nation, the Seneca Nation of Indians, the Seneca-Cayuga Tribe of Oklahoma, the Shawnee Tribe, the St. Regis Mohawk Tribe, the Stockbridge-Munsee Band of Mohican Nation of Wisconsin, the Tonawanda Seneca Nation, and the Tuscarora Nation. To address “Visualization in Planning” requirements, PennDOT provided the TIPs on a Commonwealth website with links between projects, location maps, video logs, and the MPOs’/RPOs’ websites. Upon approval of the 2023 STIP, PennDOT will utilize mapping tools to provide more detailed information for those projects that can be mapped. In accordance with the Statewide Public Participation Plan (PPP), a STIP 15-day public comment period was held from June 15 through June 30, 2022. The statewide Interstate, Statewide Items, and Independent County TIPs were included for review during this period. PennDOT provided copies of STIP documents to representatives of the above referenced Federally Recognized Native American Tribes and Nations to provide comments and feedback. All comments, concerns and questions were summarized after the 15-day and 30-day comment periods. The MPO/RPO, transit authority/authorities and PennDOT coordinated/collaborated and then met to consider the comments and prepare appropriate responses for consideration. In each metropolitan and rural area, these summaries are attached to the TIPs and are included as part of the 2023 STIP submission. The current PennDOT Statewide PPP was updated and posted on PennDOT’s website.
35
DRAFT

PennDOT will make all reasonable modifications to policies, programs, and documents to ensure that people with disabilities and those with limited English proficiency have an equal opportunity to enjoy all its programs, services, and activities. To request a copy of the STIP in alternative formats, contact the Bureau of Equal Opportunity at (800) 468-4201. CONSULTATION WITH RURAL LOCAL OFFICIALS Pennsylvania’s planning and programming process has led PennDOT and its rural Planning Organizations into many joint planning and programming ventures. As with the development of previous STIPs, the 2023 STIP was guided by a schedule and procedures developed by PennDOT, FHWA, FTA and Planning Partners. Each RPO that is under contract to PennDOT, functions much like their MPO counterparts across the state. PennDOT and each RPO, work together cooperatively to develop the TIP for that region. PennDOT continues to work with each RPO to maintain and update LRTPs. PennDOT, in accordance with 23 CFR 450.210 (b) requested feedback from the Non-Metropolitan Local Officials on the effectiveness of PennDOT’s consultation process in the development of statewide LRTP and STIP. Feedback indicated an appreciation of the collaboration, communication and openness in the planning and programming process. STATE CERTIFICATION OF THE PLANNING PROCESS As with the MPO self-certifications, the state certification has been updated and expanded to reflect any new requirements. Deputy Secretary of Planning, Larry S. Shifflet, has signed this certification, and it is included as Appendix 20 to this document. LONG-RANGE PLANNING In December 2021, PennDOT completed the most recent update to its statewide Long-Range Transportation Plan (LRTP). The 2045 LRTP, as it is titled, is a multimodal long-range policy plan completed through extensive collaboration with the public, MPO/RPO partners, and other multimodal transportation agencies and stakeholders in Pennsylvania. In addition to 2045 LRTP, an updated functional Freight Movement Plan (FMP) planning process was simultaneously conducted in accordance with the FAST Act. The 2045 FMP, updates Pennsylvania’s PAOnTrack Comprehensive Freight Movement Plan from 2016 in accordance with the FAST Act update requirements for state freight plans. At the time of this writing, the FMP is pending federal guidance associated with the historic passing of the IIJA/BIL. While federal guidance is pending, PAOnTrack remains the current Pennsylvania Freight Movement Plan of record. The 2045 LRTP and the 2045 FMP both include interrelated sets of common long-range goals for continuity in long-range transportation planning in Pennsylvania and within the unique planning regions of its planning partners. This is especially valuable because of rapid near-term change occurring in our world. Instead of merely reacting and constantly changing course, adhering to a consistent long-term vision enables systematic progress forward. This is especially
36
DRAFT
true given the variety of needs and the multi-year nature of transportation project development, from planning through design and construction to ongoing maintenance. The recommended goals associated with the 2045 LRTP and the 2045 FMP articulate what aspects of the transportation systems are important to Pennsylvanians, and what broad types of outcomes are desired over the 20-year planning horizon. For example, safety will always be a priority, even though advances in automated vehicles may change PennDOT’s activities toward enhancing transportation safety. Similar to the policy framework outlined in the plans, near-term actions for adaptation in 2045 LRTP are also presented and based on rigorous analysis of trends and likely future conditions. For certain, new issues and influences will arise over the coming years. This reality is accommodated in the implementation approach to the Plans. Objectives and actions identify schedules, and individual tasks that will advance each plan’s goals and objectives over the next five years. These actions will be monitored and modified as appropriate to ensure that activity is strategically adapted to address changing needs and opportunities. The 2045 LRTP is considered a “living document” to be adjusted as conditions warrant, with the aim of ensuring that Pennsylvania mobility is poised to meet dynamic needs for decades to come. The 2023 STIP supports the 2045 Statewide LRTP as well as the regional LRTPs. The table included in Appendix 19 highlights the status of long-range planning in the Commonwealth for the MPOs and RPOs. While long-range plans are not required by federal regulations for RPOs, PennDOT continues to encourage each RPO to maintain and update a long-range plan. FFY 2021-2024 STIP PLANNING FINDINGS FTA Region III and FHWA Pennsylvania Division documented Planning Findings for the Pennsylvania 2021 STIP and all incorporated TIPs as part of its approval. The Planning Findings identified areas of the statewide and metropolitan transportation planning processes that work well, as well as other areas that need improvements or enhancements by the 2023 STIP update. A complete copy of the Pennsylvania 2021 STIP Planning Finding can be found in Appendix 21. Also included in Appendix 21 is a matrix used to track progress of the findings for the 2023 STIP.
37
DRAFT

38
DRAFT

APPENDICES
39
DRAFT

40
DRAFT

GOVERNOR’S EXECUTIVE BUDGET 2022-2023
Transportation
E41-8
Program Funding Summary (Dollar Amounts in Thousands)
2020-21 2021-22 2022-23 2023-24 2024-25 2025-26 2026-27
Actual Available Budget Estimated Estimated Estimated Estimated
TRANSPORTATION SUPPORT SERVICES:
GENERAL FUND ................ $ 1,900 $ 1,900 $ - $ - $ - $ - $ -
MOTOR LICENSE FUND ... 65,400 71,100 75,693 75,693 75,693 75,693 75,693
LOTTERY FUND ................ - - - - - - -
FEDERAL FUNDS .............. 160,550 3,500 - - - - -
AUGMENTATIONS ............ 1,182 1,754 1,754 1,754 1,754 1,754 1,754
RESTRICTED ..................... - 325 325 325 325 325 325
OTHER FUNDS .................. 13 105 4 4 4 4 4
SUBCATEGORY TOTAL .... $ 229,045 $ 78,684 $ 77,776 $ 77,776 $ 77,776 $ 77,776 $ 77,776
HIGHWAYS AND BRIDGES:
GENERAL FUND ................ $ - $ - $ - $ - $ - $ - $ -
MOTOR LICENSE FUND ... 1,250,111 1,380,994 1,670,703 1,610,083 1,657,748 1,680,373 1,697,979
LOTTERY FUND ................ - - - - - - -
FEDERAL FUNDS .............. 1,750,005 3,371,179 2,741,704 2,771,049 2,816,282 2,862,419 1,978,665
AUGMENTATIONS ............ 50,777 88,494 63,229 64,281 64,281 64,281 64,281
RESTRICTED ..................... 1,397,880 1,539,886 1,588,440 1,575,537 1,570,339 1,565,218 1,560,181
OTHER FUNDS .................. 42,850 42,350 30,350 30,350 30,350 30,350 30,350
SUBCATEGORY TOTAL .... $ 4,491,623 $ 6,422,903 $ 6,094,426 $ 6,051,300 $ 6,139,000 $ 6,202,641 $ 5,331,456
LOCAL HIGHWAY AND BRIDGE ASSISTANCE:
GENERAL FUND ................ $ - $ - $ - $ - $ - $ - $ -
MOTOR LICENSE FUND ... 289,816 309,361 328,458 331,062 330,095 329,153 328,231
LOTTERY FUND ................ - - - - - - -
FEDERAL FUNDS .............. 17,565 12,751 12,551 12,500 12,500 12,500 12,500
AUGMENTATIONS ............ 363 175 100 100 100 100 100
RESTRICTED ..................... 506,605 553,156 563,447 559,696 558,856 558,051 557,258
OTHER FUNDS .................. 24,964 29,906 28,923 29,245 29,136 29,032 28,928
SUBCATEGORY TOTAL .... $ 839,313 $ 905,349 $ 933,479 $ 932,603 $ 930,687 $ 928,836 $ 927,017
Appendix 1 - State Transportation Program Funding Summary
41
DRAFT

GOVERNOR’S EXECUTIVE BUDGET 2022-2023
Transportation
E41-9
Program Funding Summary (Dollar Amounts in Thousands)
2020-21 2021-22 2022-23 2023-24 2024-25 2025-26 2026-27
Actual Available Budget Estimated Estimated Estimated Estimated
MULTIMODAL TRANSPORTATION:
GENERAL FUND ................ $ - $ - $ - $ - $ - $ - $ -
MOTOR LICENSE FUND ... - - - - - - -
LOTTERY FUND ................ 170,907 170,907 170,907 170,907 170,907 170,907 170,907
FEDERAL FUNDS .............. 249,528 246,350 246,560 236,161 236,161 236,161 236,161
AUGMENTATIONS ............ 331 500 500 540 540 540 540
RESTRICTED ..................... 16,218 18,780 15,864 15,864 15,364 15,364 15,364
OTHER FUNDS .................. 2,440,181 2,455,031 2,024,966 2,063,776 2,101,185 2,143,253 2,178,103
SUBCATEGORY TOTAL .... $ 2,877,165 $ 2,891,568 $ 2,458,797 $ 2,487,248 $ 2,524,157 $ 2,566,225 $ 2,601,075
DRIVER AND VEHICLE SERVICES:
GENERAL FUND ................ $ 1,228 $ 1,070 $ 1,129 $ 1,129 $ 1,129 $ 1,129 $ 1,129
MOTOR LICENSE FUND ... 221,304 251,735 272,393 272,393 272,393 272,393 272,393
LOTTERY FUND ................ - - - - - - -
FEDERAL FUNDS .............. 4,000 4,000 4,000 4,000 4,000 4,000 4,000
AUGMENTATIONS ............ 32,316 34,453 34,453 34,453 34,453 34,453 34,453
RESTRICTED ..................... 13,788 20,000 20,000 20,000 20,000 20,000 20,000
OTHER FUNDS .................. 44 151 16 16 16 16 16
SUBCATEGORY TOTAL .... $ 272,680 $ 311,409 $ 331,991 $ 331,991 $ 331,991 $ 331,991 $ 331,991
ALL PROGRAMS:
GENERAL FUND ................ $ 3,128 $ 2,970 $ 1,129 $ 1,129 $ 1,129 $ 1,129 $ 1,129
MOTOR LICENSE FUND ... 1,826,631 2,013,190 2,347,247 2,289,231 2,335,929 2,357,612 2,374,296
LOTTERY FUND ................ 170,907 170,907 170,907 170,907 170,907 170,907 170,907
FEDERAL FUNDS .............. 2,181,648 3,637,780 3,004,815 3,023,710 3,068,943 3,115,080 2,231,326
AUGMENTATIONS ............ 84,969 125,376 100,036 101,128 101,128 101,128 101,128
RESTRICTED ..................... 1,934,491 2,132,147 2,188,076 2,171,422 2,164,884 2,158,958 2,153,128
OTHER FUNDS .................. 2,508,052 2,527,543 2,084,259 2,123,391 2,160,691 2,202,655 2,237,401
DEPARTMENT TOTAL ...... $ 8,709,826 $ 10,609,913 $ 9,896,469 $ 9,880,918 $ 10,003,611 $ 10,107,469 $ 9,269,315
42
DRAFT

MLF Non-Restricted
Federal FundsHighways
Other Funds Highways
Organ & Tissue Donation
Awareness Fund
General Fund Bonds General Fund
Act 44 (2007) Public Trans. Trust Fund
Act 26 (1991) Public Trans.
Assistance Fund Lottery Fund
Federal Funds Public Trans. and
Other
2,879,738 2,276,165 211,736 80 175,000 129,616 1,410,781 259,569 170,907 205,750
MLF RestrictedHighways
Federal Pass Through Funds
PA InfrastructureBank Multimodal Fund MLF Restricted
Aviation Federal & Other Funds Aviation
Federal & Other Funds Rail
Freight
1,894,961 223,335 30,000 146,600 11,780 41,451 1,025
Aviation Rail Freight 63,231 41,025
Highway & BridgeMaintenance
Highway & Bridge Improvement
Payments toLocal Govt Mass Transit Multimodal State Police
MLF Capital Debt Highway &
Bridge
1,931,274 3,122,668 911,397 1,795,350 146,600 683,331 130,375
Driver & Vehicle Services
Gen GovtOperations
PA InfrastructureBank
Free & SharedTransit Tort Payments PA Turnpike
312,158 70,354 30,000 170,907 9,000 163,782
PennDOTFacilities
WelcomeCenters Refunds & Other Rural & Intercity
Transit Other Agencies General Fund Capital Debt
16,000 4,115 3,550 207,650 136,081 119,646
Debt Service & Other Agencies1,242,215
Highway Related Public Transportation
8,826,279PennDOT
TOTAL10,068,494
DEPARTMENT OF TRANSPORTATION - ENACTED BUDGETSOURCES & USES OF FUNDS TO SUPPORT 21-22 PROGRAMS
($ in thousands)
6,401,516 2,173,907
REVENUE SOURCES
PROGRAMUSES
Aviation Grants (EA) 6,720 Rail Freight Grants (EA) 11,197 Passenger Rail Grants (EA) 8,959 Ports and Waterways Grants (EA) 11,197 Bicycle and Pedestrian Facilities Grants (EA) 2,239 Statewide Programs Grants (EA) 40,000 Multimodal Administration and Oversight (EA) 4,317 Transfer to Commonwealth Financing Authority (EA) 61,971
General Fund Bond Detail General Fund Detail: Transit 125,000 Vehicle Services/ Voter Reg 1,070 Aviation 10,000 Veh. Code Fines for Locals 7,000 Rail Freight 40,000 Capital Debt 119,646 Total 175,000 Total 127,716
43
DRAFT

44
DRAFT

Updated March 8, 2022
PENNSYLVANIA 2023 TRANSPORTATION PROGRAM
FINANCIAL GUIDANCE
INTRODUCTION ................................................................................................................. 1
2023 TRANSPORTATION PROGRAM UPDATE ......................................................... 1
FUNDING ............................................................................................................................... 3 Highway and Bridge Funding Distribution ............................................................................ 3 Public Transit Funding Distribution ....................................................................................... 8
APPENDICIES Appendix 1: Available Funds – Highway and Bridge......................................................... 11 Appendix 2: Highway and Bridge Base Funding Allocations for Each Region ............... 13 Appendix 3: Rapid Bridge Replacement Program .............................................................. 28 Appendix 4: Asset Management Factor ............................................................................... 30 Appendix 5: 2023 Financial Guidance Formula Summary................................................. 32 Appendix 6: State Transit Funding ....................................................................................... 33 Appendix 7: Federal Transit Funding................................................................................... 38 Appendix 8: Federal and State Transit Funding by Region ................................................ 43
Appendix 2 - Financial Guidance
45
DRAFT

INTRODUCTION
One of the first crucial steps in the biennial update of Pennsylvania’s 12-Year Program (TYP), Statewide Transportation Improvement Program (STIP) and each regional Transportation Improvement Program (TIP) is the development of Financial Guidance. The purpose of this document is to describe the available revenues and funding distribution strategies that form the foundation in developing the next update of these programs, hereafter referred to as the Program.
Financial Guidance is developed by a collaboration of representatives from Metropolitan Planning Organizations (MPOs), Rural Planning Organizations (RPOs), the Federal Highway Administration (FHWA) and PennDOT, collectively known as the Financial Guidance Work Group.
The Financial Guidance Work Group is directed by principles that Financial Guidance must be based on:
• A cooperative effort
• A long-term strategic viewpoint
• A Commonwealth perspective
• Existing and readily available data
• Statewide and regional needs-based decision-making
• Responsiveness to near-term issues and priorities
• Coordination with other agencies and initiatives.
2023 TRANSPORTATION PROGRAM UPDATE
The Financial Guidance Work Group reached general agreement on draft financial guidance components on June 15, 2021 with the following recommendations:
• The National Highway Performance Program (NHPP), Surface Transportation BlockGrant Program (STP), Off-System Bridge (BOF) and State Highway and Bridge fundswill utilize the new formulas established during the 2021 Program Update for all twelveyears of the Program that reflect Transportation Performance Management (TPM)requirements and an asset management philosophy based upon lowest life cycle costs.
• The Highway Safety Improvement Program (HSIP) will utilize a new formula whilemaintaining existing program set-asides and base funding allocations.
• Remaining funding categories will utilize existing formulas.
• State Highway and Bridge Funds reflect estimated revenues to the Motor License Fund.
146
DRAFT
• State Transit funding is based on estimated revenues to the Public Transportation TrustFund.
• The Interstate Management Program will continue to be managed with an enhanced levelof funding.
• The Statewide Program will continue to cover 50% of the costs of the Rapid BridgeReplacement (RBR) program with the remaining 50% coming from each region’s percentshare of RBR associated deck area. The source of the regional share is split evenlybetween state bridge funding and state highway (capital) funding. These funds arededucted from each region’s distribution and are reserved in a separate item for theStatewide Program.
The MPOs, RPOs, FHWA and the Department achieved consensus to move forward with the Pennsylvania 2023 Transportation Program Financial Guidance and Pennsylvania 2023 Transportation Program General and Procedural Guidance at the Planning Partners Meeting, on June 29, 2021.
Following enactment of the Infrastructure Investment and Jobs Act (IIJA), also known as the Bipartisan Infrastructure Law (BIL) on November 15, 2021, the Financial Guidance Work Group reconvened on November 18, 2021 and December 1, 2021 with additional or updated recommendations:
• Existing formulas and data will continue to be utilized.
• Anticipated available federal highway, bridge and transit funds will reflect IIJA/BILauthorized amounts for the first four years then remain flat for the remaining eight yearsof the Program.
• The set-aside for the Highway Safety Improvement Program will be increased to $40million.
• Bridge Formula Investment Program funds will be distributed based upon a formulausing STP and NHPP bridge themes and data.
• Due to time constraints with the 2023 Program update and the lack of full yearappropriations and guidance for the new Carbon Reduction and PROTECT formula fundprograms, all funds will be held in a statewide line item, until further guidance isprovided from FHWA. Any necessary updates to the program will take place afteradoption in October 2022.
• Due to time constraints with the 2023 Program update and the lack of full yearappropriations and information from the Federal Transit Administration (FTA), thetransit portion of the financial guidance remains unchanged. When FTA updates full yearappropriations, it will be communicated with transit agencies and planning partners. Anynecessary updates to the program will take place after adoption in October 2022.
247
DRAFT

FUNDING
Pennsylvania’s 2023 Transportation Program will include all Federal and State capital funding that is expected to be available over the next twelve years. This includes:
• All anticipated federal highway and bridge funding apportionments or allocations to theCommonwealth
• State Appropriation 581 funding for highway capital projects• State Appropriations 185 (state owned) and 183 (locally owned) funding for bridge
capital projects• Estimated federal and state transit funding
The funding distribution tables that comprise the Appendices establish the annual funding constraint for each MPO and RPO and the Statewide and Interstate Programs in accordance with the requirements for fiscal constraint included in the General and Procedural Guidance. Projects and funding will be assigned to the appropriate years based upon project readiness, schedules, estimated funding availability and expected expenditure of funds (cash flow). Certain categories of discretionary, earmarked and maintenance funding are not included in the funding distribution tables and are considered to be additional funds to the program.
Highway and Bridge Funding Distribution
The distribution of federal funds is provided through formulas and policy decisions that were determined during meetings of the Financial Guidance Work Group. This guidance continues to assume the practice of programming to the authorization level rather than a lower obligation level. Program funding levels and implementation funding levels may differ due to the annual federal obligation limitation and the state budget.
• National Highway Performance Program (NHPP):o The Interstate Management Program will continue to be managed on a
statewide basis with the programming of funds occurring centrally by theDepartment of Transportation in accordance with the Transportation AssetManagement Plan (TAMP) and Performance Based Planning and Programming.An amount equal to 26/55ths of available NHPP funds were set-aside for theInterstate Management Program in the first year of the 2021 Program. Anadditional $50 million is provided for Interstates in each subsequent year until atotal of $1 billion is realized by year 2028 of the TYP.
o Twenty percent of the balance of NHPP funds remaining after these additionalfunds for the Interstate System are set-aside will be held in a statewide reserveto advance projects on the National Highway System (NHS) in accordance withthe TAMP and performance management principles.
o An average of $7.5 million per year will be reserved for State and Local BridgeInspection.
o Remaining funds will be distributed amongst MPOs and RPOs for bridges andhighways on the NHS based upon the regional share of these factors:
348
DRAFT

2023 through 2034 40% Bridge
> 20 feet3/4 Deck Area All Bridges (30%) 1/4 Bridge AMF (10%)
60% Highway
1/4 Lane Miles (15%) 1/4 VMT (15%) 1/4 Truck VMT (15%) 1/4 Pavement AMF (15%)
o AMF represents an Asset Management Factor. The factor considers necessarytreatment needs to maintain existing pavements and bridges in a state of goodrepair consistent with Pennsylvania’s TAMP. More information on the AMF isincluded in Appendix 7.
• Surface Transportation Block Grant Program (STP, STN, STR):o Twenty percent of STP funding will be held in reserve at the discretion of the
Secretary of Transportation. Funding will be utilized to offset the impact of highcost projects or programs ("spikes") which are beyond a region’s allocation, orother statewide priorities.
o An average of $17 million per year will be reserved for State and Local BridgeInspection, Environmental Resource Agencies, and other related statewide lineitems.
o Remaining funds will be distributed to MPOs and RPOs based upon the regionalshare of these factors:
• Surface Transportation Block Grant Program-Urban (STU):o Funding is allocated to each MPO with populations greater than 200,000 based on
current federal formula. The federal formula sub-allocates STP funds within eachstate between urbanized areas with populations greater than 200,000 and the restof the state in proportion to their relative share of the total state population as wellas the total state urbanized area population in proportion to all other states totalurbanized area population.
o The sub-allocation formula is currently based on the 2010 Federal Census.
2023 through 2034 40% Bridge
> 20 feet Deck Area All Bridges (40%)
60% Highway
1/2 Lane Miles (30%)
1/4 VMT (15%)
1/4 Truck VMT (15%)
4
49
DRAFT

• Off System Bridges (BOF):o Funding for minor collector and local functional class bridges will utilize the
following formula:
2023 through 2034
Deck Area All Bridges (100%)
o Bridge data utilized in this formula include state and locally owned bridges over20 feet in length.
o Funding for off-system bridges comes from Surface Transportation Block GrantProgram and the Bridge Formula Investment Program set-asides.
• Bridge Formula Investment Program (BRIP):o Funding for the replacement, rehabilitation, preservation, protection or
construction of highway bridges over 20 feet in length will be distributed toMPOs, RPOs and the Interstate Program based upon the share of these factors:
• Highway Safety Improvement Program (HSIP):o $40 million in funding for this program will be reserved statewide for various
safety initiatives.o $12 million is divided evenly amongst the urban and rural regions to provide a
$500,000 base amount of funding as a means to address systemic safety projects.o The remaining funding will be allocated to MPOs and RPOs based on a 39:1
crash severity weighting for all reportable crashes. The ratio is based on the costof fatal and injury crashes compared to property damage only crashes.
• Congestion Mitigation and Air Quality (CMAQ):o In accordance with agreements reached in conjunction with Pennsylvania Act 3 of
1997, $25 million is reserved each year in federal funds to flex to transit inaccordance with agreements reached in conjunction with the enactment ofPennsylvania Act 3 of 1997. CMAQ funding will comprise more than $23 millionof this reservation. Remaining funds will be from the STP category.
o Remaining funding is distributed to air quality non-attainment and maintenanceareas according to factors which consider each county’s air quality classification.Previous “insufficient data” and “orphan maintenance” (as currently defined forthe 1997 ozone NAAQS maintenance areas) counties no longer receive CMAQfunding.
2023 through 2034 40% STP Bridges
Deck Area Non-NHS State and Local Bridges > 20 Feet
60% NHS Bridges
¾ Bridge Deck Area NHS and Interstate Bridges > 20 Feet
¼ Bridge AMF
5
50
DRAFT

• National Highway Freight Program (NFP):o Funding for this program will be allocated to the Interstate Management Program.
• Surface Transportation Block Grant Program Set-Aside (former TransportationAlternatives Program) (TAP, TAU):
o Federal Law requires that 59% of the funds are sub-allocated by population and41% are available to any area of the state. Part of the 59% sub-allocated bypopulation is assigned, by federal formula, to regions with populations greaterthan 200,000 (TAU). The remaining funds sub-allocated by population and the41% available to any area of the state (TAP) are held in statewide reserve asmandated by regulations that prohibit the regional distribution of funds andrequire a statewide competitive process for selection of projects.
• Railway-Highway Crossings, Section 130 (RRX):o Funding for this program will continue to be managed on a statewide basis with
the programming of funds occurring centrally by PennDOT.o Centralized management of this program allows for a formalized project selection
process and promotes the higher utilization of funding and the ability to initiatehigher costs projects.
• Carbon Reduction Program (CRP, CRPU):o Funds will be held in a statewide line item pending further guidance from FHWA.o 65% of apportioned funds are sub-allocated by population. Part of the sub-
allocation is assigned, by federal formula, to regions with populations greaterthan 200,000 (CRPU).
• Promoting Resilient Operations for Transformative, Efficient and Cost-savingTransportation (PROTECT) formula program (PRTCT):
o Funds will be held in a statewide line item pending further guidance from FHWA.
• Highway (Capital) Funding (State):o Act 89 of 2013 requires 15% of available state highway and bridge funds be held
in reserve for use at the discretion of the Secretary of Transportation.o $25 million per year in State Highway (Capital) funds for transportation
improvements associated with economic development opportunities are reservedfor the Transportation Infrastructure Investment Fund (TIIF). Decisions onhow to utilize this funding will be at the discretion of the Secretary of theDepartment of Transportation in consultation with the Department ofCommunity and Economic Development and Governor.
o An average of $31 million per year will be reserved for State and Local BridgeInspection, Environmental Resource Agencies, and other related statewide lineitems.
o Remaining state highway funds will be distributed based upon the regional shareof these factors:
2023 through 2034 1/4 VMT (25%)
1/4 Truck VMT (25%) 1/2 Lane Miles (50%)
6
51
DRAFT

• Bridge Funding (State):o Bridge funding will be allocated to MPOs and RPOs based upon the regional
share of these factors:
2023 through 2034
Deck Area All Bridges (100%)
o Bridge data utilized in this formula include state-owned bridges over 8 feet inlength and local-owned bridges over 20 feet in length.
The following funding categories have limitations on how and where they may be used and will be considered as additional funds to the Transportation Program. The tables that are included in the appendices of this document do not include these funding sources.
• Special Federal Funding (SXF):o This funding is earmarked for specific projects that were authorized by federal
legislation.
• Appalachia Development Highway (APD/APL):o Federal funds from SAFETEA-LU, recent appropriations legislation and the
IIJA/BIL may only be used for eligible capital improvements on routes that havebeen designated as Appalachia highway corridors and which are included in themost recent Appalachia Development Highway System (ADHS) Cost toComplete Estimate. Funding may also be utilized for Local Access Road projectswhich are identified and approved in coordination with the Department ofCommunity and Economic Development (DCED) and the AppalachianRegional Commission (ARC).
• National Electric Vehicle Infrastructure Formula Program (EV):o Federal funds for the deployment of electric vehicle charging infrastructure are
required to be used along designated Alternative Fuel Corridors in accordancewith the State EV Infrastructure Deployment Plan and will be allocated to theStatewide program.
• All Discretionary Federal Funding:o Funding awards and allocations through the Federal Discretionary Programs that
are determined by the United States Department of Transportation. Examples ofthis type of funding programs could include, but are not limited to: Rebuilding American Infrastructure with Sustainability and Equity
(RAISE) Infrastructure for Rebuilding America (INFRA) Advanced Transportation and Congestion Management Technologies
deployment (ATCMTD)
7
52
DRAFT

• Discretionary State Funding:o The decision to include funding associated with state discretionary programs
including, but not limited to, the Multimodal Transportation Fund (MTF), Green-Light-Go (GLG) and Automated Red Light Enforcement (ARLE) will be aPennDOT decision based on funding availability and project awards.
• State Maintenance Funding:o State Appropriations 582 (Maintenance) and 409 (Expanded Maintenance
Program) funding is used for highway maintenance activities. It is allocated toindividual PennDOT County Maintenance Offices under a formula established bythe State General Assembly. This funding may serve as matching funds forFederally Funded Highway Restoration and Preservation projects and, in suchcases, will represent additional funding for the Transportation Program. Thedecision to include any state Appropriations 582 and 409 funding in the Programwill be a PennDOT decision based on an assessment of project priorities andfunding availability within the individual counties.
• Appropriation 179:o Since 2014, this funding, established by Act 26 of 1991, is provided to Counties
directly through liquid fuel payments. A limited amount of funding remainsavailable for previously approved county-owned bridge projects inunderprivileged counties.
• Local and Private Funding:o Local and private funding is not included in the tables and can be considered
additional funding above that which is shown, if documentation supports thefunds are reasonably expected to be available.
• Turnpike Funding:o The Pennsylvania Turnpike Commission (PTC) receives funding from a variety of
sources, including toll revenues, state funding earmarked in Act 26 of 1991, Act 3of 1997 and Act 89 of 2013, and special federal funding earmarked by Congress.These funds are not reflected in this financial guidance. The authority for theprogramming of projects using these funding sources rests with the PTC. ThePTC does implement projects that qualify for regular federal funds. If the PTCdesires to pursue regular federal funding, projects will be presented forconsideration with other state and local projects within the appropriate planningregion. However, all regionally significant Turnpike projects, regardless of thefunding source, should be included on regional TIPs as required by statewideplanning regulations.
Public Transit Funding Distribution
Funding sources for transit improvements in Pennsylvania are federal, state, and local monies. Federal funding assumptions are based on FFY 2021 via the FAST Act.
As part of an agreement between the Commonwealth and the transit community during the enactment of Act 3 of 1997, a total of $25 million per year in federal highway funding is flexed
8
53
DRAFT
to transit agencies for their projects. This funding is reserved in the highway financial guidance discussed previously. Federal and state funding, which is available for public transit programming, is included in Appendices 3 through 5. Federal funding is based on most recent FAST Act authorizations only and is held flat through the period. Federal funding includes a mix of urban formula, fixed guideway, seniors and persons with disabilities, rural formula, and bus project funding. Additional federal fund authorizations are not included in the tables.
State funding for transit programs is provided for in Act 44 of 2007 as amended by Act 89 of 2013. Act 44 of 2007 established the Public Transportation Trust Fund (PTTF) to fund public transportation programs and projects. Public transportation funds are derived from the following sources: Turnpike, Sales and Use Tax, Public Transportation Assistance Fund (PTAF), Capital Bond Funds, Lottery, transfers from the Motor License Fund that are not restricted to highway purposes and various fines. These funds are deposited into the PTTF.
Note:
In FY 2022/2023, the Public Transportation law shifts funding sources as follows: • The PTC contribution is reduced to $50 million and;• $450 million in motor vehicle sales tax is deposited into the PTTF.
Because this shift would divert funding from the PA General Fund, there remains some uncertainly as to whether this will be the ultimate funding solution.
PUBLIC TRANSPORTATION FUNDING PROGRAMS
Act 44, as amended, authorizes six major public transportation programs:
• Operating Program (Section 1513) – Operating funds are allocated among publictransportation providers based on:
1. The operating assistance received in the prior fiscal year plus funding growth.2. Funding growth over the prior year is distributed on four operating statistics:
a. Total passengersb. Senior passengersc. Revenue vehicle milesd. Revenue vehicle hours
The local match requirement is 15% of state funding or 5% growth in local match, whichever is less. Act 44 also includes performance criteria for the evaluation of public transportation services. This program also provides for free transit for seniors on any fixed route service.
• Asset Improvement Program for Capital projects (Section 1514) – The AssetImprovement Program is the program into which funds are deposited for the publictransportation capital program. Source funding includes Turnpike funds, other fees, andCapital Bond funds. In accordance with Act 89 provisions, PennDOT receives adiscretionary set aside equal to 5% of available funding. The balance is allocated toSEPTA (69.4%), Port Authority (22.6%) and the remainder (8%) to all other transitsystems. These funds require a local match equal to 3.33% of the state grant.
9
54
DRAFT

• Capital Improvement Program (Section 1517) – While still included as a capitalprogram in the public transportation legislation, no new funding was deposited in thisprogram after December 31, 2013. Since the creation of Act 89, capital funding wasincluded as part of Section 1514 – Asset Improvement.
• Alternative Energy Capital Investment Program (Section 1517.1) – The AlternativeEnergy program is used to implement capital improvements conversion to an alternativeenergy source, in most cases Compressed Natural Gas (CNG). If the Department hasprojects to fund in the program, funding is transferred from Section 1514 prior todistributing Section 1514 funding as outlined previously.
• New Initiatives Program (Section 1515) – This program provides the framework toadvance new or expansion of existing fixed guideway systems. Act 44 specifies criteriathat must be met to receive funding under this program. The local match is established at3.33% of the state funding. NOTE: No funding has been available for this program sinceit has not been appropriated by the legislature.
• Programs of Statewide Significance (Section 1516) – Programs such as Persons withDisabilities, Welfare to Work, intercity bus and rail service, as well as technicalassistance and demonstration projects, are funded using a dedicated portion of PTTF.The match requirement varies by program.
In addition to the programs authorized by Act 44, as amended, the State Lottery Law authorizes the Reduced Fare Shared-Ride Program for Senior Citizens (Shared-Ride Program). Lottery Funds are used to replace 85% of the fare for senior citizens 65 and older on shared ride, advanced reservation, curb to curb transportation services.
The funding in the transit tables is for planning purposes only. The actual Federal and State funding that is ultimately available each year will be determined during the annual appropriations and budgeting processes. For the purposes of this document, we have assumed that funding shifts from the General Fund via the Vehicle Sales Tax will occur in FY 2022/23.
The information in these documents is based on the availability of these funds and is subject to change based on changes in available funding amounts and/or legislative updates.
10
55
DRAFT

Federal Funds 2023 2024 2025 2026 TotalNational Highway Performance Program (NHPP)* 1,172,758 1,196,213 1,220,137 1,244,540 4,833,648Surface Transportation Block Grant Program (STP)* 570,531 581,941 593,580 605,452 2,351,505Highway Safety Improvement Program (HSIP)* 125,942 128,604 131,320 134,090 519,956Congestion Mitigation and Air Quality (CMAQ)* 113,817 116,093 118,415 120,784 469,110National Highway Freight Program* 56,879 58,016 59,177 60,360 234,432Railway-Highway Safety Crossings (RRX) 7,184 7,184 7,184 7,184 28,737Carbon Reduction Program (CRP) 64,634 65,672 66,731 67,811 264,848PROTECT Formula Program (PRTCT) 73,493 74,674 75,878 77,106 301,151Bridge Formula Program (BRIP) 327,179 327,179 327,179 327,179 1,308,714Subtotal -- Federal Funds 2,374,289 2,415,232 2,456,993 2,499,589 9,746,102
State Funds 2023 2024 2025 2026 TotalState Highway (Capital) 479,000 508,000 516,000 555,000 2,058,000State Bridge 282,000 277,000 277,000 276,000 1,112,000Subtotal -- State Funds 761,000 785,000 793,000 831,000 3,170,000Grand Total 3,135,289 3,200,232 3,249,993 3,330,589 12,916,102*numbers reflect 2% set-aside for Statewide Planning and Research
National Highway Performance Program 2023 2024 2025 2026 TotalNHPP Apportionment 1,172,758 1,196,213 1,220,137 1,244,540 4,833,648Enhanced Interstate Management 250,947 300,947 350,947 400,947 1,303,788Remaining 921,811 895,266 869,190 843,593 3,529,86020% Statewide Reserve 184,362 179,053 173,838 168,719 705,972Less Local Bridge Inspection 6,152 7,998 7,998 7,998 30,145Less Interstate Management Traditional 317,378 317,378 317,378 317,378 1,269,512NHPP Funds to Distribute 413,919 390,837 369,977 349,499 1,524,232
Surface Transportation Block Grant Program 2023 2024 2025 2026 TotalSTP Apportionment 570,531 581,941 593,580 605,452 2,351,505Less Transportation Alternatives (10%) 47,404 48,352 49,319 50,305 195,379Less STP-Urban Mandatory Distribution 178,760 182,336 185,982 189,702 736,780Less Set-Aside for Off-System Bridges 98,396 98,396 98,396 98,396 393,582Less Transit Flex 1,745 1,745 1,745 1,745 6,979Miscellaneous Inspection/Inventory/Training 8,552 10,398 10,398 10,398 39,745Less Environmental Resource Agencies 3,312 3,415 3,518 3,623 13,868Less Oversight and Management 2,000 2,000 2,000 2,000 8,000Remaining STP 230,362 235,301 242,224 249,284 957,171Less Spike (20% of Remaining STP) 46,072 47,060 48,445 49,857 191,434STP Funds to Distribute 184,290 188,241 193,779 199,427 765,737
Highway Safety Improvement Program 2023 2024 2025 2026 TotalHSIP Apportionment 125,942 128,604 131,320 134,090 519,956Less Base of $500K to each MPO/RPO 12,000 12,000 12,000 12,000 48,000Less Statewide Reserve 40,000 40,000 40,000 40,000 160,000HSIP Funds to Distribute 73,942 76,604 79,320 82,090 311,956
Congestion Mitigation and Air Quality 2023 2024 2025 2026 TotalCMAQ Apportionment 113,817 116,093 118,415 120,784 469,110Less Transit Flex 23,255 23,255 23,255 23,255 93,021CMAQ Funds to distribute 90,562 92,838 95,160 97,528 376,089
National Highway Freight Program 2023 2024 2025 2026 TotalInterstate Program 56,879 58,016 59,177 60,360 234,432
Transportation Alternatives 2023 2024 2025 2026 TotalTransportation Alternatives Apportionment 47,404 48,352 49,319 50,305 195,379Less Recreational Trails 1,991 1,991 1,991 1,991 7,965Mandatory Distribution for Urban Areas 16,647 16,994 17,349 17,710 68,700TAP Funds -- Statewide Competitive Program 28,766 29,366 29,979 30,604 118,714
Railway-Highway Safety Crossings 2023 2024 2025 2026 TotalStatewide Program 7,184 7,184 7,184 7,184 28,737
Bridge Formula Program 2023 2024 2025 2026 TotalSpecial Bridge Formula Program Apportionment 327,179 327,179 327,179 327,179 1,308,71415% Off System Bridge Funds to Distribute 49,077 49,077 49,077 49,077 196,307Special Bridge Formula Funds to Distribute 278,102 278,102 278,102 278,102 1,112,407
Carbon Reduction Program 2023 2024 2025 2026 TotalCarbon Reduction Apportionment 64,634 65,672 66,731 67,811 264,848Carbon Reduction Program 64,634 65,672 66,731 67,811 264,848
PROTECT Formula Program 2023 2024 2025 2026 TotalPROTECT Formula Program 73,493 74,674 75,878 77,106 301,151
Appendix 1: Available Funds2023 Financial Guidance FINAL
Highway and Bridge Funds ($000)
Federal and State Funds Subject to Distribution via Base Allocation Formulas ($000)
11
56
DRAFT

State Funds 2023 2024 2025 2026 TotalState Highway (Capital) 479,000 508,000 516,000 555,000 2,058,000State Bridge 282,000 277,000 277,000 276,000 1,112,000Total State Funds (for Discretionary Calculation) 761,000 785,000 793,000 831,000 3,170,000Mandatory 15% Discretionary (Highway Funds) 114,150 117,750 118,950 124,650 475,500
State Highway (Capital) 2023 2024 2025 2026 Total
Highway (Capital) After Discretionary Set-Aside 364,850 390,250 397,050 430,350 1,582,500Less Environmental Resource Agencies 828 854 879 906 3,467Less State Bridge Inspection 25,886 26,663 27,463 28,287 108,299
Less Oversight and Management 3,400 3,400 3,400 3,400 13,600Less TIIF (Economic Development) 25,000 25,000 25,000 25,000 100,000State Highway (Capital) Funds to Distribute 309,736 334,333 340,308 372,757 1,357,134
State Bridge 2023 2024 2025 2026 TotalState Bridge Funds to Distribute 282,000 277,000 277,000 276,000 1,112,000
Total Distributed/Statewide Reserve 3,125,222 3,186,799 3,236,510 3,317,047 12,865,578
Amounts in Bold are further reflected on the regional distribution charts.
2023 Financial GuidanceHighway and Bridge Funds ($000)
Appendix 1: Available Funds
12
57
DRAFT

Region NHPP STPState
Highway (Capital)
State Bridge
Off System Bridges (BOF)
HSIPHighway Freight
Program
Rail Highway
SafetyCMAQ STP TAP
Set-AsideSTP-
UrbanCarbon
Reduction PROTECT
Bridge Formula Program (BRIP)
Total
DVRPC 121,609 27,899 43,021 38,354 18,698 24,528 0 0 39,553 7,932 85,174 0 0 41,313 448,080SPC 93,590 38,926 45,969 49,056 34,128 13,550 0 0 22,909 3,657 39,272 0 0 52,795 393,854Harrisburg 23,190 8,533 11,130 10,690 6,913 3,897 0 0 4,968 938 10,067 0 0 11,432 91,758Scranton/WB 17,218 7,168 8,494 8,712 5,382 4,142 0 0 0 805 8,641 0 0 8,584 69,145Lehigh Valley 19,691 6,836 9,906 7,581 5,514 5,224 0 0 6,386 1,333 14,320 0 0 7,848 84,638NEPA 8,306 7,844 8,319 4,458 5,291 3,292 0 0 536 0 0 0 0 5,055 43,101SEDA-COG 19,685 9,795 12,409 12,650 9,239 2,377 0 0 0 0 0 0 0 12,018 78,172Altoona 3,167 2,345 2,293 2,674 2,297 1,302 0 0 0 0 0 0 0 2,472 16,550Johnstown 6,765 2,524 3,642 3,328 2,106 1,133 0 0 1,418 0 0 0 0 3,005 23,920Centre County 4,634 2,065 2,711 1,955 1,356 1,117 0 0 0 0 0 0 0 1,969 15,806Williamsport 5,467 3,370 3,734 4,001 3,152 1,084 0 0 0 0 0 0 0 3,749 24,558Erie 5,537 3,744 4,820 3,376 2,703 2,096 0 0 0 0 0 0 0 3,013 25,288Lancaster 15,401 8,532 10,283 7,903 6,712 3,820 0 0 5,125 848 9,105 0 0 7,827 75,556York 6,062 5,953 7,963 3,551 3,478 2,930 0 0 4,291 489 5,256 0 0 3,509 43,483Reading 15,658 5,183 7,899 6,246 4,043 3,331 0 0 4,059 562 6,031 0 0 6,743 59,755Lebanon 2,006 1,915 2,526 1,372 1,372 1,363 0 0 1,318 0 0 0 0 1,265 13,137Mercer 1,895 3,031 3,317 2,424 2,575 1,128 0 0 0 83 894 0 0 2,319 17,667Adams 3,759 1,897 2,813 1,075 1,361 1,046 0 0 0 0 0 0 0 1,304 13,256Franklin 1,939 2,625 3,097 1,475 1,712 1,330 0 0 0 0 0 0 0 1,458 13,635Total Urban 375,579 150,183 194,348 170,880 118,033 78,689 0 0 90,562 16,647 178,760 0 0 177,677 1,551,358Northwest 10,189 8,375 10,365 6,677 6,672 1,713 0 0 0 0 0 0 0 6,816 50,808N. Central 9,017 7,911 9,333 5,808 6,302 1,611 0 0 0 0 0 0 0 6,191 46,173N. Tier 10,140 8,729 11,422 8,563 8,094 1,492 0 0 0 0 0 0 0 8,388 56,829S. Alleghenies 8,993 7,360 8,667 7,784 7,124 1,634 0 0 0 0 0 0 0 7,659 49,222Wayne County 0 1,732 2,125 948 1,247 802 0 0 0 0 0 0 0 941 7,795Total Rural 38,340 34,107 41,912 29,780 29,440 7,253 0 0 0 0 0 0 0 29,994 210,826Interstate Program 568,325 0 57,918 65,782 0 0 56,879 0 0 0 0 0 0 70,430 819,334Statewide Program 0 0 0 0 0 0 0 7,184 0 28,766 0 64,634 73,493 0 174,077Statewide Reserve 184,362 0 114,150 0 0 40,000 0 0 0 0 0 0 0 0 338,512RBR Regional Share 0 0 15,558 15,558 0 0 0 0 0 0 0 0 0 0 31,115GRAND TOTAL 1,166,606 184,290 423,886 282,000 147,472 125,942 56,879 7,184 90,562 45,412 178,760 64,634 73,493 278,102 3,125,222
Appendix 2: FFY 2023 -- Highway/Bridge Base Funding Allocation ($000)
State Highway and State Bridge fund regional distributions do not include funds distributed but reserved for the Rapid Bridge Replacement (RBR) Program; Off-System Bridges include set-asides from the Surface Transportation Block Grant Program and the Bridge Investment Program
1358
DRAFT

Region NHPP STPState
Highway (Capital)
State Bridge
Off System Bridges (BOF)
HSIPHighway Freight
Program
Rail Highway
SafetyCMAQ STP TAP
Set-AsideSTP-
UrbanCarbon
Reduction PROTECT
Bridge Formula Program (BRIP)
Total
DVRPC 114,828 28,497 46,455 37,669 18,698 25,394 0 0 40,547 8,097 86,877 0 0 41,313 448,374SPC 88,372 39,760 49,993 48,082 34,128 14,020 0 0 23,485 3,733 40,058 0 0 52,795 394,426Harrisburg 21,897 8,715 12,062 10,487 6,913 4,019 0 0 5,092 957 10,269 0 0 11,432 91,844Scranton/WB 16,258 7,321 9,186 8,552 5,382 4,273 0 0 0 821 8,814 0 0 8,584 69,192Lehigh Valley 18,593 6,982 10,749 7,431 5,514 5,394 0 0 6,546 1,361 14,606 0 0 7,848 85,025NEPA 7,842 8,012 9,076 4,352 5,291 3,392 0 0 550 0 0 0 0 5,055 43,570SEDA-COG 18,587 10,005 13,435 12,414 9,239 2,445 0 0 0 0 0 0 0 12,018 78,143Altoona 2,990 2,395 2,484 2,624 2,297 1,331 0 0 0 0 0 0 0 2,472 16,594Johnstown 6,388 2,579 3,937 3,267 2,106 1,156 0 0 1,453 0 0 0 0 3,005 23,889Centre County 4,375 2,109 2,949 1,914 1,356 1,139 0 0 0 0 0 0 0 1,969 15,811Williamsport 5,162 3,443 4,047 3,926 3,152 1,105 0 0 0 0 0 0 0 3,749 24,583Erie 5,228 3,824 5,206 3,315 2,703 2,153 0 0 0 0 0 0 0 3,013 25,442Lancaster 14,542 8,715 11,161 7,745 6,712 3,939 0 0 5,254 866 9,288 0 0 7,827 76,048York 5,723 6,081 8,623 3,480 3,478 3,018 0 0 4,399 500 5,361 0 0 3,509 44,173Reading 14,784 5,294 8,538 6,132 4,043 3,432 0 0 4,161 573 6,151 0 0 6,743 59,853Lebanon 1,894 1,956 2,729 1,347 1,372 1,394 0 0 1,351 0 0 0 0 1,265 13,308Mercer 1,790 3,095 3,586 2,380 2,575 1,151 0 0 0 85 912 0 0 2,319 17,893Adams 3,550 1,938 3,074 1,046 1,361 1,066 0 0 0 0 0 0 0 1,304 13,339Franklin 1,831 2,681 3,355 1,446 1,712 1,359 0 0 0 0 0 0 0 1,458 13,841Total Urban 354,635 153,403 210,643 167,609 118,033 81,181 0 0 92,838 16,994 182,336 0 0 177,677 1,555,349Northwest 9,621 8,555 11,249 6,542 6,672 1,757 0 0 0 0 0 0 0 6,816 51,211N. Central 8,514 8,080 10,165 5,679 6,302 1,651 0 0 0 0 0 0 0 6,191 46,583N. Tier 9,575 8,916 12,407 8,390 8,094 1,528 0 0 0 0 0 0 0 8,388 57,297S. Alleghenies 8,492 7,518 9,437 7,623 7,124 1,675 0 0 0 0 0 0 0 7,659 49,528Wayne County 0 1,769 2,303 929 1,247 813 0 0 0 0 0 0 0 941 8,002Total Rural 36,202 34,838 45,560 29,163 29,440 7,424 0 0 0 0 0 0 0 29,994 212,621Interstate Program 618,325 0 62,518 64,615 0 0 58,016 0 0 0 0 0 0 70,430 873,905Statewide Program 0 0 0 0 0 0 0 7,184 0 29,366 0 65,672 74,674 0 176,896Statewide Reserve 179,053 0 117,750 0 0 40,000 0 0 0 0 0 0 0 0 336,803RBR Regional Share 0 0 15,613 15,613 0 0 0 0 0 0 0 0 0 0 31,225GRAND TOTAL 1,188,215 188,241 452,083 277,000 147,472 128,604 58,016 7,184 92,838 46,360 182,336 65,672 74,674 278,102 3,186,799
Appendix 2: FFY 2024 -- Highway/Bridge Base Funding Allocation ($000)
State Highway and State Bridge fund regional distributions do not include funds distributed but reserved for the Rapid Bridge Replacement (RBR) Program; Off-System Bridges include set-asides from the Surface Transportation Block Grant Program and the Bridge Investment Program
14
59
DRAFT

Region NHPP STPState
Highway (Capital)
State Bridge
Off System Bridges (BOF)
HSIPHighway Freight
Program
Rail Highway
SafetyCMAQ STP TAP
Set-AsideSTP-
UrbanCarbon
Reduction PROTECT
Bridge Formula Program (BRIP)
Total
DVRPC 108,699 29,335 47,289 37,669 18,698 26,276 0 0 41,561 8,266 88,615 0 0 41,313 447,720SPC 83,655 40,930 50,966 48,073 34,128 14,499 0 0 24,072 3,811 40,859 0 0 52,795 393,789Harrisburg 20,729 8,972 12,287 10,486 6,913 4,144 0 0 5,220 977 10,474 0 0 11,432 91,634Scranton/WB 15,390 7,537 9,355 8,551 5,382 4,407 0 0 0 839 8,990 0 0 8,584 69,035Lehigh Valley 17,601 7,188 10,953 7,429 5,514 5,568 0 0 6,710 1,390 14,898 0 0 7,848 85,098NEPA 7,424 8,248 9,258 4,350 5,291 3,495 0 0 564 0 0 0 0 5,055 43,684SEDA-COG 17,595 10,300 13,684 12,413 9,239 2,514 0 0 0 0 0 0 0 12,018 77,762Altoona 2,831 2,466 2,531 2,624 2,297 1,360 0 0 0 0 0 0 0 2,472 16,580Johnstown 6,047 2,654 4,008 3,267 2,106 1,179 0 0 1,490 0 0 0 0 3,005 23,755Centre County 4,142 2,172 3,006 1,913 1,356 1,162 0 0 0 0 0 0 0 1,969 15,719Williamsport 4,887 3,544 4,122 3,925 3,152 1,126 0 0 0 0 0 0 0 3,749 24,506Erie 4,949 3,937 5,299 3,315 2,703 2,212 0 0 0 0 0 0 0 3,013 25,428Lancaster 13,766 8,971 11,373 7,744 6,712 4,061 0 0 5,385 884 9,473 0 0 7,827 76,197York 5,418 6,260 8,783 3,480 3,478 3,107 0 0 4,509 510 5,468 0 0 3,509 44,522Reading 13,995 5,450 8,693 6,132 4,043 3,536 0 0 4,265 585 6,274 0 0 6,743 59,718Lebanon 1,793 2,014 2,778 1,347 1,372 1,426 0 0 1,385 0 0 0 0 1,265 13,379Mercer 1,694 3,187 3,651 2,380 2,575 1,174 0 0 0 87 930 0 0 2,319 17,996Adams 3,360 1,995 3,137 1,045 1,361 1,086 0 0 0 0 0 0 0 1,304 13,288Franklin 1,733 2,760 3,417 1,445 1,712 1,390 0 0 0 0 0 0 0 1,458 13,915Total Urban 335,707 157,916 214,590 167,589 118,033 83,722 0 0 95,160 17,349 185,982 0 0 177,677 1,553,725Northwest 9,107 8,806 11,462 6,541 6,672 1,801 0 0 0 0 0 0 0 6,816 51,206N. Central 8,060 8,318 10,366 5,677 6,302 1,692 0 0 0 0 0 0 0 6,191 46,606N. Tier 9,064 9,178 12,645 8,388 8,094 1,564 0 0 0 0 0 0 0 8,388 57,321S. Alleghenies 8,039 7,739 9,623 7,621 7,124 1,717 0 0 0 0 0 0 0 7,659 49,522Wayne County 0 1,821 2,346 928 1,247 824 0 0 0 0 0 0 0 941 8,108Total Rural 34,270 35,863 46,443 29,155 29,440 7,598 0 0 0 0 0 0 0 29,994 212,763Interstate Program 668,325 0 63,635 64,615 0 0 59,177 0 0 0 0 0 0 70,430 926,182Statewide Program 0 0 0 0 0 0 0 7,184 0 29,979 0 66,731 75,878 0 179,772Statewide Reserve 173,838 0 118,950 0 0 40,000 0 0 0 0 0 0 0 0 332,788RBR Regional Share 0 0 15,640 15,640 0 0 0 0 0 0 0 0 0 0 31,280GRAND TOTAL 1,212,140 193,779 459,258 277,000 147,472 131,320 59,177 7,184 95,160 47,327 185,982 66,731 75,878 278,102 3,236,510
Appendix 2: FFY 2025 -- Highway/Bridge Base Funding Allocation ($000)
State Highway and State Bridge fund regional distributions do not include funds distributed but reserved for the Rapid Bridge Replacement (RBR) Program; Off-System Bridges include set-asides from the Surface Transportation Block Grant Program and the Bridge Investment Program
15
60
DRAFT

Region NHPP STPState
Highway (Capital)
State Bridge
Off System Bridges (BOF)
HSIPHighway Freight
Program
Rail Highway
SafetyCMAQ STP TAP
Set-AsideSTP-
UrbanCarbon
Reduction PROTECT
Bridge Formula Program (BRIP)
Total
DVRPC 102,682 30,190 51,819 37,531 18,698 27,176 0 0 42,595 8,438 90,387 0 0 41,313 450,830SPC 79,025 42,123 56,278 47,863 34,128 14,988 0 0 24,671 3,891 41,676 0 0 52,795 397,438Harrisburg 19,581 9,233 13,516 10,444 6,913 4,271 0 0 5,350 997 10,684 0 0 11,432 92,421Scranton/WB 14,538 7,756 10,269 8,519 5,382 4,543 0 0 0 856 9,170 0 0 8,584 69,618Lehigh Valley 16,627 7,397 12,066 7,397 5,514 5,745 0 0 6,877 1,419 15,196 0 0 7,848 86,085NEPA 7,013 8,488 10,257 4,325 5,291 3,599 0 0 578 0 0 0 0 5,055 44,606SEDA-COG 16,621 10,600 15,039 12,364 9,239 2,584 0 0 0 0 0 0 0 12,018 78,464Altoona 2,674 2,538 2,783 2,614 2,297 1,390 0 0 0 0 0 0 0 2,472 16,767Johnstown 5,712 2,732 4,396 3,255 2,106 1,203 0 0 1,527 0 0 0 0 3,005 23,935Centre County 3,912 2,235 3,320 1,904 1,356 1,185 0 0 0 0 0 0 0 1,969 15,881Williamsport 4,616 3,647 4,534 3,909 3,152 1,148 0 0 0 0 0 0 0 3,749 24,757Erie 4,675 4,051 5,808 3,303 2,703 2,272 0 0 0 0 0 0 0 3,013 25,825Lancaster 13,004 9,233 12,532 7,710 6,712 4,186 0 0 5,519 902 9,663 0 0 7,827 77,288York 5,118 6,442 9,654 3,464 3,478 3,198 0 0 4,622 521 5,578 0 0 3,509 45,584Reading 13,221 5,609 9,535 6,109 4,043 3,642 0 0 4,372 597 6,400 0 0 6,743 60,271Lebanon 1,694 2,073 3,046 1,342 1,372 1,458 0 0 1,419 0 0 0 0 1,265 13,668Mercer 1,600 3,279 4,005 2,371 2,575 1,198 0 0 0 89 949 0 0 2,319 18,384Adams 3,174 2,053 3,482 1,037 1,361 1,106 0 0 0 0 0 0 0 1,304 13,518Franklin 1,637 2,840 3,758 1,439 1,712 1,421 0 0 0 0 0 0 0 1,458 14,265Total Urban 317,126 162,519 236,096 166,899 118,033 86,314 0 0 97,528 17,710 189,702 0 0 177,677 1,569,604Northwest 8,603 9,063 12,628 6,511 6,672 1,847 0 0 0 0 0 0 0 6,816 52,140N. Central 7,614 8,560 11,465 5,647 6,302 1,733 0 0 0 0 0 0 0 6,191 47,514N. Tier 8,562 9,446 13,945 8,350 8,094 1,601 0 0 0 0 0 0 0 8,388 58,386S. Alleghenies 7,594 7,964 10,640 7,586 7,124 1,759 0 0 0 0 0 0 0 7,659 50,326Wayne County 0 1,874 2,580 924 1,247 836 0 0 0 0 0 0 0 941 8,402Total Rural 32,373 36,908 51,259 29,019 29,440 7,776 0 0 0 0 0 0 0 29,994 216,769Interstate Program 718,325 0 69,703 64,382 0 0 60,360 0 0 0 0 0 0 70,430 983,200Statewide Program 0 0 0 0 0 0 0 7,184 0 30,604 0 67,811 77,106 0 182,705Statewide Reserve 168,719 0 124,650 0 0 40,000 0 0 0 0 0 0 0 0 333,369RBR Regional Share 0 0 15,700 15,700 0 0 0 0 0 0 0 0 0 0 31,400GRAND TOTAL 1,236,542 199,427 497,407 276,000 147,472 134,090 60,360 7,184 97,528 48,314 189,702 67,811 77,106 278,102 3,317,047
Appendix 2: FFY 2026 -- Highway/Bridge Base Funding Allocation ($000)
State Highway and State Bridge fund regional distributions do not include funds distributed but reserved for the Rapid Bridge Replacement (RBR) Program; Off-System Bridges include set-asides from the Surface Transportation Block Grant Program and the Bridge Investment Program
16
61
DRAFT

Region NHPP STPState
Highway (Capital)
State Bridge
Off System Bridges (BOF)
HSIPHighway Freight
Program
Rail Highway
SafetyCMAQ STP TAP
Set-AsideSTP-
UrbanCarbon
Reduction PROTECT
Bridge Formula Program (BRIP)
Total
DVRPC 447,818 115,921 188,583 151,224 74,792 103,374 0 0 164,255 32,733 351,053 0 0 165,250 1,795,004SPC 344,641 161,739 203,206 193,075 136,513 57,058 0 0 95,137 15,093 161,865 0 0 211,179 1,579,506Harrisburg 85,397 35,453 48,995 42,107 27,653 16,330 0 0 20,629 3,869 41,494 0 0 45,730 367,658Scranton/WB 63,403 29,782 37,303 34,334 21,527 17,366 0 0 0 3,321 35,615 0 0 34,338 276,989Lehigh Valley 72,512 28,403 43,674 29,838 22,055 21,930 0 0 26,518 5,503 59,020 0 0 31,392 340,846NEPA 30,585 32,591 36,911 17,484 21,163 13,778 0 0 2,228 0 0 0 0 20,221 174,960SEDA-COG 72,488 40,700 54,567 49,841 36,955 9,919 0 0 0 0 0 0 0 48,070 312,542Altoona 11,662 9,744 10,091 10,536 9,189 5,384 0 0 0 0 0 0 0 9,887 66,492Johnstown 24,911 10,489 15,983 13,117 8,422 4,672 0 0 5,887 0 0 0 0 12,018 95,500Centre County 17,063 8,581 11,986 7,686 5,422 4,603 0 0 0 0 0 0 0 7,876 63,217Williamsport 20,133 14,004 16,438 15,761 12,609 4,463 0 0 0 0 0 0 0 14,996 98,404Erie 20,388 15,556 21,133 13,309 10,812 8,732 0 0 0 0 0 0 0 12,053 101,982Lancaster 56,714 35,450 45,349 31,102 26,848 16,006 0 0 21,283 3,499 37,529 0 0 31,307 305,088York 22,321 24,736 35,024 13,975 13,914 12,254 0 0 17,822 2,020 21,663 0 0 14,035 177,762Reading 57,658 21,535 34,665 24,620 16,172 13,942 0 0 16,857 2,318 24,856 0 0 26,974 239,597Lebanon 7,387 7,958 11,079 5,407 5,489 5,640 0 0 5,473 0 0 0 0 5,060 53,493Mercer 6,980 12,592 14,558 9,554 10,300 4,651 0 0 0 344 3,685 0 0 9,275 71,940Adams 13,843 7,882 12,507 4,203 5,446 4,303 0 0 0 0 0 0 0 5,217 53,402Franklin 7,141 10,905 13,626 5,805 6,848 5,500 0 0 0 0 0 0 0 5,830 55,656Total Urban 1,383,046 624,022 855,676 672,978 472,131 329,906 0 0 376,089 68,700 736,780 0 0 710,709 6,230,036Northwest 37,521 34,800 45,705 26,272 26,688 7,118 0 0 0 0 0 0 0 27,262 205,365N. Central 33,205 32,869 41,330 22,811 25,209 6,687 0 0 0 0 0 0 0 24,764 186,876N. Tier 37,341 36,269 50,420 33,691 32,376 6,186 0 0 0 0 0 0 0 33,551 229,833S. Alleghenies 33,118 30,581 38,366 30,615 28,497 6,784 0 0 0 0 0 0 0 30,637 198,598Wayne County 0 7,197 9,353 3,729 4,989 3,275 0 0 0 0 0 0 0 3,763 32,307Total Rural 141,185 141,715 185,174 117,117 117,759 30,051 0 0 0 0 0 0 0 119,978 852,979Interstate Program 2,573,300 0 253,774 259,395 0 0 234,432 0 0 0 0 0 0 281,721 3,602,622Statewide Program 0 0 0 0 0 0 0 28,737 0 118,714 0 264,848 301,151 0 713,449Statewide Reserve 705,972 0 475,500 0 0 160,000 0 0 0 0 0 0 0 0 1,341,472RBR Regional Share 0 0 62,510 62,510 0 0 0 0 0 0 0 0 0 0 125,020GRAND TOTAL 4,803,504 765,737 1,832,634 1,112,000 589,890 519,956 234,432 28,737 376,089 187,414 736,780 264,848 301,151 1,112,407 12,865,578
Appendix 2: Total FFY 2023-2026 -- Highway/Bridge Base Funding Allocation ($000)
State Highway and State Bridge fund regional distributions do not include funds distributed but reserved for the Rapid Bridge Replacement (RBR) Program; Off-System Bridges include set-asides from the Surface Transportation Block Grant Program and the Bridge Investment Program
17
62
DRAFT

Region NHPP STPState
Highway (Capital)
State Bridge
Off System Bridges (BOF)
HSIPHighway Freight
Program
Rail Highway
SafetyCMAQ
STP TAP Set-
Aside
STP-Urban
Carbon Reduction PROTECT
Bridge Formula Program (BRIP)
Total
DVRPC 90,931 30,190 51,818 37,531 18,698 27,176 0 0 42,595 8,438 90,387 0 0 41,313 439,077SPC 69,980 42,123 56,262 47,847 34,128 14,988 0 0 24,671 3,891 41,676 0 0 52,795 388,362Harrisburg 17,340 9,233 13,514 10,442 6,913 4,271 0 0 5,350 997 10,684 0 0 11,432 90,176Scranton/WB 12,874 7,756 10,268 8,518 5,382 4,543 0 0 0 856 9,170 0 0 8,584 67,952Lehigh Valley 14,724 7,397 12,064 7,394 5,514 5,745 0 0 6,877 1,419 15,196 0 0 7,848 84,177NEPA 6,210 8,488 10,253 4,321 5,291 3,599 0 0 578 0 0 0 0 5,055 43,795SEDA-COG 14,719 10,600 15,037 12,363 9,239 2,584 0 0 0 0 0 0 0 12,018 76,559Altoona 2,368 2,538 2,782 2,613 2,297 1,390 0 0 0 0 0 0 0 2,472 16,461Johnstown 5,058 2,732 4,396 3,255 2,106 1,203 0 0 1,527 0 0 0 0 3,005 23,281Centre County 3,465 2,235 3,319 1,903 1,356 1,185 0 0 0 0 0 0 0 1,969 15,432Williamsport 4,088 3,647 4,534 3,909 3,152 1,148 0 0 0 0 0 0 0 3,749 24,227Erie 4,140 4,051 5,808 3,303 2,703 2,272 0 0 0 0 0 0 0 3,013 25,289Lancaster 11,516 9,233 12,529 7,707 6,712 4,186 0 0 5,519 902 9,663 0 0 7,827 75,794York 4,532 6,442 9,653 3,463 3,478 3,198 0 0 4,622 521 5,578 0 0 3,509 44,996Reading 11,708 5,609 9,534 6,108 4,043 3,642 0 0 4,372 597 6,400 0 0 6,743 58,757Lebanon 1,500 2,073 3,046 1,342 1,372 1,458 0 0 1,419 0 0 0 0 1,265 13,474Mercer 1,417 3,279 4,004 2,370 2,575 1,198 0 0 0 89 949 0 0 2,319 18,201Adams 2,811 2,053 3,481 1,036 1,361 1,106 0 0 0 0 0 0 0 1,304 13,152Franklin 1,450 2,840 3,757 1,439 1,712 1,421 0 0 0 0 0 0 0 1,458 14,076Total Urban 280,831 162,519 236,059 166,863 118,033 86,314 0 0 97,528 17,710 189,702 0 0 177,677 1,533,236Northwest 7,619 9,063 12,626 6,509 6,672 1,847 0 0 0 0 0 0 0 6,816 51,151N. Central 6,742 8,560 11,461 5,644 6,302 1,733 0 0 0 0 0 0 0 6,191 46,635N. Tier 7,582 9,446 13,942 8,347 8,094 1,601 0 0 0 0 0 0 0 8,388 57,400S. Alleghenies 6,725 7,964 10,636 7,582 7,124 1,759 0 0 0 0 0 0 0 7,659 49,450Wayne County 0 1,874 2,580 924 1,247 836 0 0 0 0 0 0 0 941 8,401Total Rural 28,668 36,908 51,245 29,005 29,440 7,776 0 0 0 0 0 0 0 29,994 213,036Interstate Program 768,325 0 69,703 64,382 0 0 60,360 0 0 0 0 0 0 70,430 1,033,200Statewide Program 0 0 0 0 0 0 0 7,184 0 30,604 0 55,088 62,639 0 155,515Statewide Reserve 158,719 0 124,650 0 0 40,000 0 0 0 0 0 0 0 0 323,369RBR Regional Share 0 0 15,750 15,750 0 0 0 0 0 0 0 0 0 0 31,500GRAND TOTAL 1,236,542 199,427 497,407 276,000 147,472 134,090 60,360 7,184 97,528 48,314 189,702 55,088 62,639 278,102 3,289,857
Appendix 2: FFY 2027 -- Highway/Bridge Base Funding Allocation ($000)
State Highway and State Bridge fund regional distributions do not include funds distributed but reserved for the Rapid Bridge Replacement (RBR) Program; Off-System Bridges include set-asides from the Surface Transportation Block Grant Program and the Bridge Investment Program
18
63
DRAFT

Region NHPP STPState
Highway (Capital)
State Bridge
Off System Bridges (BOF)
HSIPHighway Freight
Program
Rail Highway
SafetyCMAQ
STP TAP Set-
Aside
STP-Urban
Carbon Reduction PROTECT
Bridge Formula Program (BRIP)
Total
DVRPC 82,180 30,190 51,817 37,530 18,698 27,176 0 0 42,595 8,438 90,387 0 0 41,313 430,324SPC 63,246 42,123 56,243 47,828 34,128 14,988 0 0 24,671 3,891 41,676 0 0 52,795 381,589Harrisburg 15,671 9,233 13,511 10,439 6,913 4,271 0 0 5,350 997 10,684 0 0 11,432 88,503Scranton/WB 11,635 7,756 10,267 8,517 5,382 4,543 0 0 0 856 9,170 0 0 8,584 66,712Lehigh Valley 13,307 7,397 12,061 7,392 5,514 5,745 0 0 6,877 1,419 15,196 0 0 7,848 82,755NEPA 5,613 8,488 10,248 4,316 5,291 3,599 0 0 578 0 0 0 0 5,055 43,188SEDA-COG 13,302 10,600 15,035 12,360 9,239 2,584 0 0 0 0 0 0 0 12,018 75,138Altoona 2,140 2,538 2,782 2,613 2,297 1,390 0 0 0 0 0 0 0 2,472 16,232Johnstown 4,571 2,732 4,396 3,255 2,106 1,203 0 0 1,527 0 0 0 0 3,005 22,793Centre County 3,131 2,235 3,318 1,902 1,356 1,185 0 0 0 0 0 0 0 1,969 15,096Williamsport 3,695 3,647 4,533 3,908 3,152 1,148 0 0 0 0 0 0 0 3,749 23,832Erie 3,741 4,051 5,808 3,303 2,703 2,272 0 0 0 0 0 0 0 3,013 24,891Lancaster 10,408 9,233 12,526 7,704 6,712 4,186 0 0 5,519 902 9,663 0 0 7,827 74,680York 4,096 6,442 9,652 3,462 3,478 3,198 0 0 4,622 521 5,578 0 0 3,509 44,557Reading 10,581 5,609 9,534 6,108 4,043 3,642 0 0 4,372 597 6,400 0 0 6,743 57,629Lebanon 1,356 2,073 3,045 1,342 1,372 1,458 0 0 1,419 0 0 0 0 1,265 13,330Mercer 1,281 3,279 4,004 2,370 2,575 1,198 0 0 0 89 949 0 0 2,319 18,064Adams 2,540 2,053 3,479 1,034 1,361 1,106 0 0 0 0 0 0 0 1,304 12,878Franklin 1,310 2,840 3,756 1,438 1,712 1,421 0 0 0 0 0 0 0 1,458 13,936Total Urban 253,806 162,519 236,016 166,819 118,033 86,314 0 0 97,528 17,710 189,702 0 0 177,677 1,506,124Northwest 6,886 9,063 12,623 6,506 6,672 1,847 0 0 0 0 0 0 0 6,816 50,411N. Central 6,094 8,560 11,457 5,639 6,302 1,733 0 0 0 0 0 0 0 6,191 45,976N. Tier 6,853 9,446 13,938 8,343 8,094 1,601 0 0 0 0 0 0 0 8,388 56,662S. Alleghenies 6,078 7,964 10,632 7,578 7,124 1,759 0 0 0 0 0 0 0 7,659 48,794Wayne County 0 1,874 2,579 923 1,247 836 0 0 0 0 0 0 0 941 8,401Total Rural 25,909 36,908 51,229 28,989 29,440 7,776 0 0 0 0 0 0 0 29,994 210,245Interstate Program 805,555 0 69,703 64,382 0 0 60,360 0 0 0 0 0 0 70,430 1,070,430Statewide Program 0 0 0 0 0 0 0 7,184 0 30,604 0 55,088 62,639 0 155,515Statewide Reserve 151,273 0 124,650 0 0 40,000 0 0 0 0 0 0 0 0 315,923RBR Regional Share 0 0 15,810 15,810 0 0 0 0 0 0 0 0 0 0 31,620GRAND TOTAL 1,236,542 199,427 497,407 276,000 147,472 134,090 60,360 7,184 97,528 48,314 189,702 55,088 62,639 278,102 3,289,857
Appendix 2: FFY 2028 -- Highway/Bridge Base Funding Allocation ($000)
State Highway and State Bridge fund regional distributions do not include funds distributed but reserved for the Rapid Bridge Replacement (RBR) Program; Off-System Bridges include set-asides from the Surface Transportation Block Grant Program and the Bridge Investment Program
19
64
DRAFT
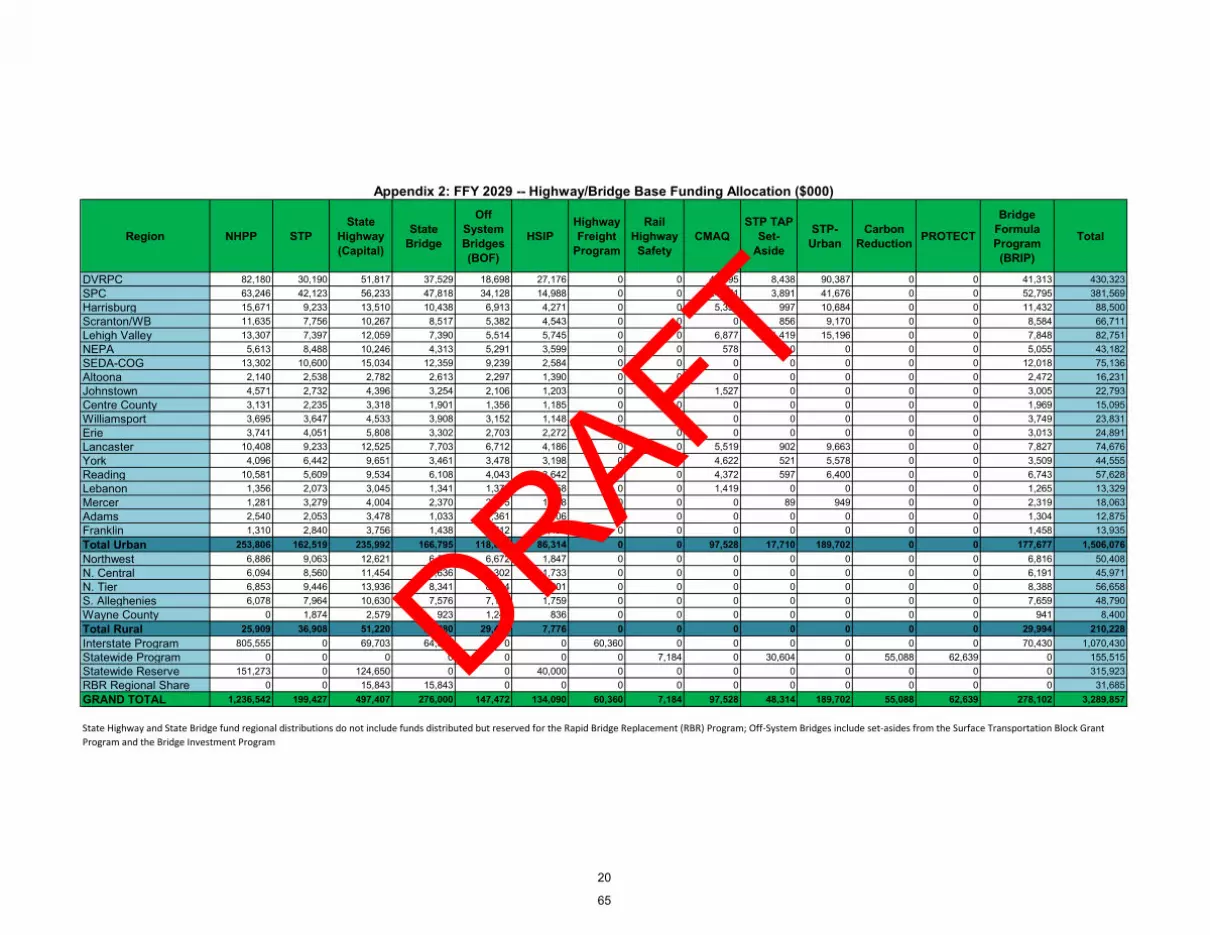
Region NHPP STPState
Highway (Capital)
State Bridge
Off System Bridges (BOF)
HSIPHighway Freight
Program
Rail Highway
SafetyCMAQ
STP TAP Set-
Aside
STP-Urban
Carbon Reduction PROTECT
Bridge Formula Program (BRIP)
Total
DVRPC 82,180 30,190 51,817 37,529 18,698 27,176 0 0 42,595 8,438 90,387 0 0 41,313 430,323SPC 63,246 42,123 56,233 47,818 34,128 14,988 0 0 24,671 3,891 41,676 0 0 52,795 381,569Harrisburg 15,671 9,233 13,510 10,438 6,913 4,271 0 0 5,350 997 10,684 0 0 11,432 88,500Scranton/WB 11,635 7,756 10,267 8,517 5,382 4,543 0 0 0 856 9,170 0 0 8,584 66,711Lehigh Valley 13,307 7,397 12,059 7,390 5,514 5,745 0 0 6,877 1,419 15,196 0 0 7,848 82,751NEPA 5,613 8,488 10,246 4,313 5,291 3,599 0 0 578 0 0 0 0 5,055 43,182SEDA-COG 13,302 10,600 15,034 12,359 9,239 2,584 0 0 0 0 0 0 0 12,018 75,136Altoona 2,140 2,538 2,782 2,613 2,297 1,390 0 0 0 0 0 0 0 2,472 16,231Johnstown 4,571 2,732 4,396 3,254 2,106 1,203 0 0 1,527 0 0 0 0 3,005 22,793Centre County 3,131 2,235 3,318 1,901 1,356 1,185 0 0 0 0 0 0 0 1,969 15,095Williamsport 3,695 3,647 4,533 3,908 3,152 1,148 0 0 0 0 0 0 0 3,749 23,831Erie 3,741 4,051 5,808 3,302 2,703 2,272 0 0 0 0 0 0 0 3,013 24,891Lancaster 10,408 9,233 12,525 7,703 6,712 4,186 0 0 5,519 902 9,663 0 0 7,827 74,676York 4,096 6,442 9,651 3,461 3,478 3,198 0 0 4,622 521 5,578 0 0 3,509 44,555Reading 10,581 5,609 9,534 6,108 4,043 3,642 0 0 4,372 597 6,400 0 0 6,743 57,628Lebanon 1,356 2,073 3,045 1,341 1,372 1,458 0 0 1,419 0 0 0 0 1,265 13,329Mercer 1,281 3,279 4,004 2,370 2,575 1,198 0 0 0 89 949 0 0 2,319 18,063Adams 2,540 2,053 3,478 1,033 1,361 1,106 0 0 0 0 0 0 0 1,304 12,875Franklin 1,310 2,840 3,756 1,438 1,712 1,421 0 0 0 0 0 0 0 1,458 13,935Total Urban 253,806 162,519 235,992 166,795 118,033 86,314 0 0 97,528 17,710 189,702 0 0 177,677 1,506,076Northwest 6,886 9,063 12,621 6,504 6,672 1,847 0 0 0 0 0 0 0 6,816 50,408N. Central 6,094 8,560 11,454 5,636 6,302 1,733 0 0 0 0 0 0 0 6,191 45,971N. Tier 6,853 9,446 13,936 8,341 8,094 1,601 0 0 0 0 0 0 0 8,388 56,658S. Alleghenies 6,078 7,964 10,630 7,576 7,124 1,759 0 0 0 0 0 0 0 7,659 48,790Wayne County 0 1,874 2,579 923 1,247 836 0 0 0 0 0 0 0 941 8,400Total Rural 25,909 36,908 51,220 28,980 29,440 7,776 0 0 0 0 0 0 0 29,994 210,228Interstate Program 805,555 0 69,703 64,382 0 0 60,360 0 0 0 0 0 0 70,430 1,070,430Statewide Program 0 0 0 0 0 0 0 7,184 0 30,604 0 55,088 62,639 0 155,515Statewide Reserve 151,273 0 124,650 0 0 40,000 0 0 0 0 0 0 0 0 315,923RBR Regional Share 0 0 15,843 15,843 0 0 0 0 0 0 0 0 0 0 31,685GRAND TOTAL 1,236,542 199,427 497,407 276,000 147,472 134,090 60,360 7,184 97,528 48,314 189,702 55,088 62,639 278,102 3,289,857
Appendix 2: FFY 2029 -- Highway/Bridge Base Funding Allocation ($000)
State Highway and State Bridge fund regional distributions do not include funds distributed but reserved for the Rapid Bridge Replacement (RBR) Program; Off-System Bridges include set-asides from the Surface Transportation Block Grant Program and the Bridge Investment Program
20
65
DRAFT

Region NHPP STPState
Highway (Capital)
State Bridge
Off System Bridges (BOF)
HSIPHighway Freight
Program
Rail Highway
SafetyCMAQ
STP TAP Set-
Aside
STP-Urban
Carbon Reduction PROTECT
Bridge Formula Program (BRIP)
Total
DVRPC 82,180 30,190 51,816 37,528 18,698 27,176 0 0 42,595 8,438 90,387 0 0 41,313 430,322SPC 63,246 42,123 56,213 47,798 34,128 14,988 0 0 24,671 3,891 41,676 0 0 52,795 381,529Harrisburg 15,671 9,233 13,508 10,435 6,913 4,271 0 0 5,350 997 10,684 0 0 11,432 88,495Scranton/WB 11,635 7,756 10,266 8,516 5,382 4,543 0 0 0 856 9,170 0 0 8,584 66,709Lehigh Valley 13,307 7,397 12,056 7,387 5,514 5,745 0 0 6,877 1,419 15,196 0 0 7,848 82,745NEPA 5,613 8,488 10,241 4,308 5,291 3,599 0 0 578 0 0 0 0 5,055 43,172SEDA-COG 13,302 10,600 15,032 12,357 9,239 2,584 0 0 0 0 0 0 0 12,018 75,131Altoona 2,140 2,538 2,781 2,612 2,297 1,390 0 0 0 0 0 0 0 2,472 16,230Johnstown 4,571 2,732 4,395 3,254 2,106 1,203 0 0 1,527 0 0 0 0 3,005 22,793Centre County 3,131 2,235 3,316 1,900 1,356 1,185 0 0 0 0 0 0 0 1,969 15,092Williamsport 3,695 3,647 4,532 3,907 3,152 1,148 0 0 0 0 0 0 0 3,749 23,830Erie 3,741 4,051 5,807 3,302 2,703 2,272 0 0 0 0 0 0 0 3,013 24,890Lancaster 10,408 9,233 12,521 7,699 6,712 4,186 0 0 5,519 902 9,663 0 0 7,827 74,670York 4,096 6,442 9,649 3,459 3,478 3,198 0 0 4,622 521 5,578 0 0 3,509 44,552Reading 10,581 5,609 9,533 6,107 4,043 3,642 0 0 4,372 597 6,400 0 0 6,743 57,627Lebanon 1,356 2,073 3,045 1,341 1,372 1,458 0 0 1,419 0 0 0 0 1,265 13,329Mercer 1,281 3,279 4,004 2,370 2,575 1,198 0 0 0 89 949 0 0 2,319 18,063Adams 2,540 2,053 3,476 1,031 1,361 1,106 0 0 0 0 0 0 0 1,304 12,871Franklin 1,310 2,840 3,755 1,437 1,712 1,421 0 0 0 0 0 0 0 1,458 13,934Total Urban 253,806 162,519 235,946 166,750 118,033 86,314 0 0 97,528 17,710 189,702 0 0 177,677 1,505,985Northwest 6,886 9,063 12,618 6,501 6,672 1,847 0 0 0 0 0 0 0 6,816 50,402N. Central 6,094 8,560 11,450 5,632 6,302 1,733 0 0 0 0 0 0 0 6,191 45,962N. Tier 6,853 9,446 13,932 8,336 8,094 1,601 0 0 0 0 0 0 0 8,388 56,650S. Alleghenies 6,078 7,964 10,625 7,572 7,124 1,759 0 0 0 0 0 0 0 7,659 48,781Wayne County 0 1,874 2,579 923 1,247 836 0 0 0 0 0 0 0 941 8,399Total Rural 25,909 36,908 51,203 28,963 29,440 7,776 0 0 0 0 0 0 0 29,994 210,194Interstate Program 805,555 0 69,703 64,382 0 0 60,360 0 0 0 0 0 0 70,430 1,070,430Statewide Program 0 0 0 0 0 0 0 7,184 0 30,604 0 55,088 62,639 0 155,515Statewide Reserve 151,273 0 124,650 0 0 40,000 0 0 0 0 0 0 0 0 315,923RBR Regional Share 0 0 15,905 15,905 0 0 0 0 0 0 0 0 0 0 31,810GRAND TOTAL 1,236,542 199,427 497,407 276,000 147,472 134,090 60,360 7,184 97,528 48,314 189,702 55,088 62,639 278,102 3,289,857
Appendix 2: FFY 2030 -- Highway/Bridge Base Funding Allocation ($000)
State Highway and State Bridge fund regional distributions do not include funds distributed but reserved for the Rapid Bridge Replacement (RBR) Program; Off-System Bridges include set-asides from the Surface Transportation Block Grant Program and the Bridge Investment Program
21
66
DRAFT

Region NHPP STPState
Highway (Capital)
State Bridge
Off System Bridges (BOF)
HSIPHighway Freight
Program
Rail Highway
SafetyCMAQ
STP TAP Set-
Aside
STP-Urban
Carbon Reduction PROTECT
Bridge Formula Program (BRIP)
Total
DVRPC 337,471 120,761 207,267 150,118 74,792 108,705 0 0 170,381 33,754 361,548 0 0 165,250 1,730,046SPC 259,718 168,492 224,950 191,292 136,513 59,953 0 0 98,685 15,563 166,704 0 0 211,179 1,533,049Harrisburg 64,354 36,934 54,043 41,754 27,653 17,084 0 0 21,399 3,990 42,735 0 0 45,730 355,674Scranton/WB 47,780 31,026 41,067 34,067 21,527 18,174 0 0 0 3,424 36,680 0 0 34,338 268,083Lehigh Valley 54,644 29,588 48,240 29,563 22,055 22,978 0 0 27,507 5,675 60,785 0 0 31,392 332,429NEPA 23,048 33,952 40,988 17,257 21,163 14,397 0 0 2,311 0 0 0 0 20,221 173,337SEDA-COG 54,626 42,400 60,137 49,439 36,955 10,336 0 0 0 0 0 0 0 48,070 301,964Altoona 8,788 10,151 11,127 10,450 9,189 5,562 0 0 0 0 0 0 0 9,887 65,154Johnstown 18,773 10,927 17,583 13,018 8,422 4,813 0 0 6,106 0 0 0 0 12,018 91,659Centre County 12,858 8,939 13,271 7,607 5,422 4,740 0 0 0 0 0 0 0 7,876 60,714Williamsport 15,172 14,589 18,131 15,631 12,609 4,592 0 0 0 0 0 0 0 14,996 95,720Erie 15,364 16,206 23,230 13,210 10,812 9,086 0 0 0 0 0 0 0 12,053 99,961Lancaster 42,739 36,930 50,102 30,813 26,848 16,743 0 0 22,076 3,608 38,651 0 0 31,307 299,819York 16,821 25,768 38,605 13,845 13,914 12,793 0 0 18,486 2,083 22,310 0 0 14,035 178,660Reading 43,451 22,434 38,135 24,431 16,172 14,570 0 0 17,486 2,390 25,599 0 0 26,974 231,642Lebanon 5,566 8,291 12,182 5,366 5,489 5,832 0 0 5,677 0 0 0 0 5,060 53,462Mercer 5,260 13,118 16,016 9,480 10,300 4,790 0 0 0 354 3,796 0 0 9,275 72,390Adams 10,432 8,211 13,913 4,133 5,446 4,424 0 0 0 0 0 0 0 5,217 51,776Franklin 5,381 11,361 15,025 5,751 6,848 5,684 0 0 0 0 0 0 0 5,830 55,880Total Urban 1,042,248 650,076 944,013 667,227 472,131 345,255 0 0 390,114 70,841 758,808 0 0 710,709 6,051,422Northwest 28,275 36,253 50,487 26,019 26,688 7,387 0 0 0 0 0 0 0 27,262 202,372N. Central 25,023 34,241 45,822 22,550 25,209 6,934 0 0 0 0 0 0 0 24,764 184,544N. Tier 28,140 37,783 55,748 33,366 32,376 6,406 0 0 0 0 0 0 0 33,551 227,370S. Alleghenies 24,957 31,857 42,523 30,308 28,497 7,036 0 0 0 0 0 0 0 30,637 195,816Wayne County 0 7,498 10,317 3,692 4,989 3,342 0 0 0 0 0 0 0 3,763 33,601Total Rural 106,396 147,632 204,897 115,937 117,759 31,105 0 0 0 0 0 0 0 119,978 843,703Interstate Program 3,184,990 0 278,811 257,529 0 0 241,441 0 0 0 0 0 0 281,721 4,244,492Statewide Program 0 0 0 0 0 0 0 28,737 0 122,414 0 220,352 250,556 0 622,058Statewide Reserve 612,536 0 498,600 0 0 160,000 0 0 0 0 0 0 0 0 1,271,136RBR Regional Share 0 0 63,308 63,308 0 0 0 0 0 0 0 0 0 0 126,615GRAND TOTAL 4,946,170 797,708 1,989,629 1,104,000 589,890 536,360 241,441 28,737 390,114 193,255 758,808 220,352 250,556 1,112,407 13,159,426
Appendix 2: Total FFY 2026-2030 -- Highway/Bridge Base Funding Allocation ($000)
State Highway and State Bridge fund regional distributions do not include funds distributed but reserved for the Rapid Bridge Replacement (RBR) Program; Off-System Bridges include set-asides from the Surface Transportation Block Grant Program and the Bridge Investment Program
22
67
DRAFT

Region NHPP STPState
Highway (Capital)
State Bridge
Off System Bridges (BOF)
HSIPHighway Freight
Program
Rail Highway
SafetyCMAQ
STP TAP Set-
Aside
STP-Urban
Carbon Reduction PROTECT
Bridge Formula Program (BRIP)
Total
DVRPC 82,180 30,190 51,815 37,528 18,698 27,176 0 0 42,595 8,438 90,387 0 0 41,313 430,320SPC 63,246 42,123 56,195 47,781 34,128 14,988 0 0 24,671 3,891 41,676 0 0 52,795 381,495Harrisburg 15,671 9,233 13,506 10,433 6,913 4,271 0 0 5,350 997 10,684 0 0 11,432 88,491Scranton/WB 11,635 7,756 10,265 8,515 5,382 4,543 0 0 0 856 9,170 0 0 8,584 66,707Lehigh Valley 13,307 7,397 12,054 7,384 5,514 5,745 0 0 6,877 1,419 15,196 0 0 7,848 82,740NEPA 5,613 8,488 10,236 4,304 5,291 3,599 0 0 578 0 0 0 0 5,055 43,163SEDA-COG 13,302 10,600 15,030 12,355 9,239 2,584 0 0 0 0 0 0 0 12,018 75,128Altoona 2,140 2,538 2,781 2,612 2,297 1,390 0 0 0 0 0 0 0 2,472 16,230Johnstown 4,571 2,732 4,395 3,254 2,106 1,203 0 0 1,527 0 0 0 0 3,005 22,792Centre County 3,131 2,235 3,315 1,899 1,356 1,185 0 0 0 0 0 0 0 1,969 15,090Williamsport 3,695 3,647 4,531 3,906 3,152 1,148 0 0 0 0 0 0 0 3,749 23,828Erie 3,741 4,051 5,807 3,302 2,703 2,272 0 0 0 0 0 0 0 3,013 24,890Lancaster 10,408 9,233 12,519 7,696 6,712 4,186 0 0 5,519 902 9,663 0 0 7,827 74,664York 4,096 6,442 9,648 3,458 3,478 3,198 0 0 4,622 521 5,578 0 0 3,509 44,550Reading 10,581 5,609 9,532 6,107 4,043 3,642 0 0 4,372 597 6,400 0 0 6,743 57,626Lebanon 1,356 2,073 3,045 1,341 1,372 1,458 0 0 1,419 0 0 0 0 1,265 13,329Mercer 1,281 3,279 4,004 2,370 2,575 1,198 0 0 0 89 949 0 0 2,319 18,062Adams 2,540 2,053 3,474 1,029 1,361 1,106 0 0 0 0 0 0 0 1,304 12,868Franklin 1,310 2,840 3,755 1,436 1,712 1,421 0 0 0 0 0 0 0 1,458 13,932Total Urban 253,806 162,519 235,906 166,710 118,033 86,314 0 0 97,528 17,710 189,702 0 0 177,677 1,505,905Northwest 6,886 9,063 12,615 6,498 6,672 1,847 0 0 0 0 0 0 0 6,816 50,396N. Central 6,094 8,560 11,445 5,627 6,302 1,733 0 0 0 0 0 0 0 6,191 45,953N. Tier 6,853 9,446 13,928 8,333 8,094 1,601 0 0 0 0 0 0 0 8,388 56,643S. Alleghenies 6,078 7,964 10,622 7,568 7,124 1,759 0 0 0 0 0 0 0 7,659 48,774Wayne County 0 1,874 2,578 922 1,247 836 0 0 0 0 0 0 0 941 8,398Total Rural 25,909 36,908 51,188 28,948 29,440 7,776 0 0 0 0 0 0 0 29,994 210,164Interstate Program 805,555 0 69,703 64,382 0 0 60,360 0 0 0 0 0 0 70,430 1,070,430Statewide Program 0 0 0 0 0 0 0 7,184 0 30,604 0 55,088 62,639 0 155,515Statewide Reserve 151,273 0 124,650 0 0 40,000 0 0 0 0 0 0 0 0 315,923RBR Regional Share 0 0 15,960 15,960 0 0 0 0 0 0 0 0 0 0 31,920GRAND TOTAL 1,236,542 199,427 497,407 276,000 147,472 134,090 60,360 7,184 97,528 48,314 189,702 55,088 62,639 278,102 3,289,857
Appendix 2: FFY 2031 -- Highway/Bridge Base Funding Allocation ($000)
State Highway and State Bridge fund regional distributions do not include funds distributed but reserved for the Rapid Bridge Replacement (RBR) Program; Off-System Bridges include set-asides from the Surface Transportation Block Grant Program and the Bridge Investment Program
23
68
DRAFT

Region NHPP STPState
Highway (Capital)
State Bridge
Off System Bridges (BOF)
HSIPHighway Freight
Program
Rail Highway
SafetyCMAQ
STP TAP Set-
Aside
STP-Urban
Carbon Reduction PROTECT
Bridge Formula Program (BRIP)
Total
DVRPC 82,180 30,190 51,814 37,527 18,698 27,176 0 0 42,595 8,438 90,387 0 0 41,313 430,318SPC 63,246 42,123 56,174 47,760 34,128 14,988 0 0 24,671 3,891 41,676 0 0 52,795 381,452Harrisburg 15,671 9,233 13,503 10,430 6,913 4,271 0 0 5,350 997 10,684 0 0 11,432 88,485Scranton/WB 11,635 7,756 10,264 8,514 5,382 4,543 0 0 0 856 9,170 0 0 8,584 66,705Lehigh Valley 13,307 7,397 12,051 7,381 5,514 5,745 0 0 6,877 1,419 15,196 0 0 7,848 82,734NEPA 5,613 8,488 10,231 4,298 5,291 3,599 0 0 578 0 0 0 0 5,055 43,152SEDA-COG 13,302 10,600 15,027 12,353 9,239 2,584 0 0 0 0 0 0 0 12,018 75,123Altoona 2,140 2,538 2,780 2,611 2,297 1,390 0 0 0 0 0 0 0 2,472 16,229Johnstown 4,571 2,732 4,395 3,254 2,106 1,203 0 0 1,527 0 0 0 0 3,005 22,791Centre County 3,131 2,235 3,314 1,898 1,356 1,185 0 0 0 0 0 0 0 1,969 15,087Williamsport 3,695 3,647 4,530 3,905 3,152 1,148 0 0 0 0 0 0 0 3,749 23,826Erie 3,741 4,051 5,807 3,302 2,703 2,272 0 0 0 0 0 0 0 3,013 24,890Lancaster 10,408 9,233 12,515 7,693 6,712 4,186 0 0 5,519 902 9,663 0 0 7,827 74,657York 4,096 6,442 9,647 3,457 3,478 3,198 0 0 4,622 521 5,578 0 0 3,509 44,547Reading 10,581 5,609 9,532 6,106 4,043 3,642 0 0 4,372 597 6,400 0 0 6,743 57,625Lebanon 1,356 2,073 3,045 1,341 1,372 1,458 0 0 1,419 0 0 0 0 1,265 13,329Mercer 1,281 3,279 4,003 2,369 2,575 1,198 0 0 0 89 949 0 0 2,319 18,062Adams 2,540 2,053 3,472 1,027 1,361 1,106 0 0 0 0 0 0 0 1,304 12,864Franklin 1,310 2,840 3,754 1,436 1,712 1,421 0 0 0 0 0 0 0 1,458 13,931Total Urban 253,806 162,519 235,857 166,660 118,033 86,314 0 0 97,528 17,710 189,702 0 0 177,677 1,505,806Northwest 6,886 9,063 12,612 6,495 6,672 1,847 0 0 0 0 0 0 0 6,816 50,389N. Central 6,094 8,560 11,440 5,622 6,302 1,733 0 0 0 0 0 0 0 6,191 45,943N. Tier 6,853 9,446 13,924 8,328 8,094 1,601 0 0 0 0 0 0 0 8,388 56,634S. Alleghenies 6,078 7,964 10,617 7,563 7,124 1,759 0 0 0 0 0 0 0 7,659 48,764Wayne County 0 1,874 2,578 922 1,247 836 0 0 0 0 0 0 0 941 8,397Total Rural 25,909 36,908 51,170 28,930 29,440 7,776 0 0 0 0 0 0 0 29,994 210,127Interstate Program 805,555 0 69,703 64,382 0 0 60,360 0 0 0 0 0 0 70,430 1,070,430Statewide Program 0 0 0 0 0 0 0 7,184 0 30,604 0 55,088 62,639 0 155,515Statewide Reserve 151,273 0 124,650 0 0 40,000 0 0 0 0 0 0 0 0 315,923RBR Regional Share 0 0 16,028 16,028 0 0 0 0 0 0 0 0 0 0 32,055GRAND TOTAL 1,236,542 199,427 497,407 276,000 147,472 134,090 60,360 7,184 97,528 48,314 189,702 55,088 62,639 278,102 3,289,857
Appendix 2: FFY 2032 -- Highway/Bridge Base Funding Allocation ($000)
State Highway and State Bridge fund regional distributions do not include funds distributed but reserved for the Rapid Bridge Replacement (RBR) Program; Off-System Bridges include set-asides from the Surface Transportation Block Grant Program and the Bridge Investment Program
24
69
DRAFT

Region NHPP STPState
Highway (Capital)
State Bridge
Off System Bridges (BOF)
HSIPHighway Freight
Program
Rail Highway
SafetyCMAQ
STP TAP Set-
Aside
STP-Urban
Carbon Reduction PROTECT
Bridge Formula Program (BRIP)
Total
DVRPC 82,180 30,190 51,813 37,526 18,698 27,176 0 0 42,595 8,438 90,387 0 0 41,313 430,317SPC 63,246 42,123 56,162 47,748 34,128 14,988 0 0 24,671 3,891 41,676 0 0 52,795 381,428Harrisburg 15,671 9,233 13,501 10,429 6,913 4,271 0 0 5,350 997 10,684 0 0 11,432 88,482Scranton/WB 11,635 7,756 10,263 8,513 5,382 4,543 0 0 0 856 9,170 0 0 8,584 66,704Lehigh Valley 13,307 7,397 12,049 7,379 5,514 5,745 0 0 6,877 1,419 15,196 0 0 7,848 82,730NEPA 5,613 8,488 10,228 4,295 5,291 3,599 0 0 578 0 0 0 0 5,055 43,146SEDA-COG 13,302 10,600 15,026 12,352 9,239 2,584 0 0 0 0 0 0 0 12,018 75,120Altoona 2,140 2,538 2,780 2,611 2,297 1,390 0 0 0 0 0 0 0 2,472 16,228Johnstown 4,571 2,732 4,395 3,253 2,106 1,203 0 0 1,527 0 0 0 0 3,005 22,791Centre County 3,131 2,235 3,313 1,897 1,356 1,185 0 0 0 0 0 0 0 1,969 15,086Williamsport 3,695 3,647 4,530 3,905 3,152 1,148 0 0 0 0 0 0 0 3,749 23,825Erie 3,741 4,051 5,807 3,302 2,703 2,272 0 0 0 0 0 0 0 3,013 24,890Lancaster 10,408 9,233 12,513 7,691 6,712 4,186 0 0 5,519 902 9,663 0 0 7,827 74,653York 4,096 6,442 9,646 3,456 3,478 3,198 0 0 4,622 521 5,578 0 0 3,509 44,545Reading 10,581 5,609 9,531 6,106 4,043 3,642 0 0 4,372 597 6,400 0 0 6,743 57,624Lebanon 1,356 2,073 3,045 1,341 1,372 1,458 0 0 1,419 0 0 0 0 1,265 13,329Mercer 1,281 3,279 4,003 2,369 2,575 1,198 0 0 0 89 949 0 0 2,319 18,062Adams 2,540 2,053 3,471 1,026 1,361 1,106 0 0 0 0 0 0 0 1,304 12,861Franklin 1,310 2,840 3,754 1,435 1,712 1,421 0 0 0 0 0 0 0 1,458 13,930Total Urban 253,806 162,519 235,830 166,633 118,033 86,314 0 0 97,528 17,710 189,702 0 0 177,677 1,505,752Northwest 6,886 9,063 12,610 6,493 6,672 1,847 0 0 0 0 0 0 0 6,816 50,385N. Central 6,094 8,560 11,437 5,619 6,302 1,733 0 0 0 0 0 0 0 6,191 45,937N. Tier 6,853 9,446 13,921 8,326 8,094 1,601 0 0 0 0 0 0 0 8,388 56,629S. Alleghenies 6,078 7,964 10,614 7,561 7,124 1,759 0 0 0 0 0 0 0 7,659 48,759Wayne County 0 1,874 2,577 921 1,247 836 0 0 0 0 0 0 0 941 8,397Total Rural 25,909 36,908 51,160 28,920 29,440 7,776 0 0 0 0 0 0 0 29,994 210,107Interstate Program 805,555 0 69,703 64,382 0 0 60,360 0 0 0 0 0 0 70,430 1,070,430Statewide Program 0 0 0 0 0 0 0 7,184 0 30,604 0 55,088 62,639 0 155,515Statewide Reserve 151,273 0 124,650 0 0 40,000 0 0 0 0 0 0 0 0 315,923RBR Regional Share 0 0 16,065 16,065 0 0 0 0 0 0 0 0 0 0 32,130GRAND TOTAL 1,236,542 199,427 497,407 276,000 147,472 134,090 60,360 7,184 97,528 48,314 189,702 55,088 62,639 278,102 3,289,857
Appendix 2: FFY 2033 -- Highway/Bridge Base Funding Allocation ($000)
State Highway and State Bridge fund regional distributions do not include funds distributed but reserved for the Rapid Bridge Replacement (RBR) Program; Off-System Bridges include set-asides from the Surface Transportation Block Grant Program and the Bridge Investment Program
25
70
DRAFT

Region NHPP STPState
Highway (Capital)
State Bridge
Off System Bridges (BOF)
HSIPHighway Freight
Program
Rail Highway
SafetyCMAQ
STP TAP Set-
Aside
STP-Urban
Carbon Reduction PROTECT
Bridge Formula Program (BRIP)
Total
DVRPC 82,180 30,190 51,812 37,525 18,698 27,176 0 0 42,595 8,438 90,387 0 0 41,313 430,315SPC 63,246 42,123 56,140 47,726 34,128 14,988 0 0 24,671 3,891 41,676 0 0 52,795 381,384Harrisburg 15,671 9,233 13,499 10,426 6,913 4,271 0 0 5,350 997 10,684 0 0 11,432 88,477Scranton/WB 11,635 7,756 10,262 8,512 5,382 4,543 0 0 0 856 9,170 0 0 8,584 66,701Lehigh Valley 13,307 7,397 12,045 7,376 5,514 5,745 0 0 6,877 1,419 15,196 0 0 7,848 82,723NEPA 5,613 8,488 10,222 4,289 5,291 3,599 0 0 578 0 0 0 0 5,055 43,135SEDA-COG 13,302 10,600 15,024 12,349 9,239 2,584 0 0 0 0 0 0 0 12,018 75,115Altoona 2,140 2,538 2,779 2,610 2,297 1,390 0 0 0 0 0 0 0 2,472 16,227Johnstown 4,571 2,732 4,394 3,253 2,106 1,203 0 0 1,527 0 0 0 0 3,005 22,791Centre County 3,131 2,235 3,312 1,896 1,356 1,185 0 0 0 0 0 0 0 1,969 15,083Williamsport 3,695 3,647 4,529 3,904 3,152 1,148 0 0 0 0 0 0 0 3,749 23,823Erie 3,741 4,051 5,807 3,302 2,703 2,272 0 0 0 0 0 0 0 3,013 24,889Lancaster 10,408 9,233 12,509 7,687 6,712 4,186 0 0 5,519 902 9,663 0 0 7,827 74,646York 4,096 6,442 9,644 3,454 3,478 3,198 0 0 4,622 521 5,578 0 0 3,509 44,542Reading 10,581 5,609 9,531 6,105 4,043 3,642 0 0 4,372 597 6,400 0 0 6,743 57,623Lebanon 1,356 2,073 3,045 1,341 1,372 1,458 0 0 1,419 0 0 0 0 1,265 13,328Mercer 1,281 3,279 4,003 2,369 2,575 1,198 0 0 0 89 949 0 0 2,319 18,061Adams 2,540 2,053 3,468 1,023 1,361 1,106 0 0 0 0 0 0 0 1,304 12,857Franklin 1,310 2,840 3,753 1,435 1,712 1,421 0 0 0 0 0 0 0 1,458 13,929Total Urban 253,806 162,519 235,779 166,582 118,033 86,314 0 0 97,528 17,710 189,702 0 0 177,677 1,505,650Northwest 6,886 9,063 12,606 6,489 6,672 1,847 0 0 0 0 0 0 0 6,816 50,378N. Central 6,094 8,560 11,432 5,614 6,302 1,733 0 0 0 0 0 0 0 6,191 45,926N. Tier 6,853 9,446 13,917 8,321 8,094 1,601 0 0 0 0 0 0 0 8,388 56,620S. Alleghenies 6,078 7,964 10,609 7,556 7,124 1,759 0 0 0 0 0 0 0 7,659 48,750Wayne County 0 1,874 2,577 921 1,247 836 0 0 0 0 0 0 0 941 8,396Total Rural 25,909 36,908 51,141 28,901 29,440 7,776 0 0 0 0 0 0 0 29,994 210,069Interstate Program 805,555 0 69,703 64,382 0 0 60,360 0 0 0 0 0 0 70,430 1,070,430Statewide Program 0 0 0 0 0 0 0 7,184 0 30,604 0 55,088 62,639 0 155,515Statewide Reserve 151,273 0 124,650 0 0 40,000 0 0 0 0 0 0 0 0 315,923RBR Regional Share 0 0 16,135 16,135 0 0 0 0 0 0 0 0 0 0 32,270GRAND TOTAL 1,236,542 199,427 497,407 276,000 147,472 134,090 60,360 7,184 97,528 48,314 189,702 55,088 62,639 278,102 3,289,857
Appendix 2: FFY 2034 -- Highway/Bridge Base Funding Allocation ($000)
State Highway and State Bridge fund regional distributions do not include funds distributed but reserved for the Rapid Bridge Replacement (RBR) Program; Off-System Bridges include set-asides from the Surface Transportation Block Grant Program and the Bridge Investment Program
26
71
DRAFT

Region NHPP STPState
Highway (Capital)
State Bridge
Off System Bridges (BOF)
HSIPHighway Freight
Program
Rail Highway
SafetyCMAQ
STP TAP Set-
Aside
STP-Urban
Carbon Reduction PROTECT
Bridge Formula Program (BRIP)
Total
DVRPC 328,720 120,761 207,254 150,105 74,792 108,705 0 0 170,381 33,754 361,548 0 0 165,250 1,721,270SPC 252,983 168,492 224,672 191,014 136,513 59,953 0 0 98,685 15,563 166,704 0 0 211,179 1,525,759Harrisburg 62,686 36,934 54,008 41,719 27,653 17,084 0 0 21,399 3,990 42,735 0 0 45,730 353,936Scranton/WB 46,541 31,026 41,054 34,054 21,527 18,174 0 0 0 3,424 36,680 0 0 34,338 266,817Lehigh Valley 53,227 29,588 48,198 29,521 22,055 22,978 0 0 27,507 5,675 60,785 0 0 31,392 330,927NEPA 22,451 33,952 40,916 17,186 21,163 14,397 0 0 2,311 0 0 0 0 20,221 172,597SEDA-COG 53,210 42,400 60,107 49,409 36,955 10,336 0 0 0 0 0 0 0 48,070 300,486Altoona 8,561 10,151 11,120 10,444 9,189 5,562 0 0 0 0 0 0 0 9,887 64,913Johnstown 18,286 10,927 17,579 13,014 8,422 4,813 0 0 6,106 0 0 0 0 12,018 91,165Centre County 12,525 8,939 13,254 7,590 5,422 4,740 0 0 0 0 0 0 0 7,876 60,347Williamsport 14,779 14,589 18,119 15,619 12,609 4,592 0 0 0 0 0 0 0 14,996 95,303Erie 14,966 16,206 23,228 13,208 10,812 9,086 0 0 0 0 0 0 0 12,053 99,558Lancaster 41,631 36,930 50,056 30,768 26,848 16,743 0 0 22,076 3,608 38,651 0 0 31,307 298,620York 16,385 25,768 38,584 13,825 13,914 12,793 0 0 18,486 2,083 22,310 0 0 14,035 178,183Reading 42,324 22,434 38,127 24,423 16,172 14,570 0 0 17,486 2,390 25,599 0 0 26,974 230,499Lebanon 5,422 8,291 12,180 5,364 5,489 5,832 0 0 5,677 0 0 0 0 5,060 53,315Mercer 5,123 13,118 16,013 9,477 10,300 4,790 0 0 0 354 3,796 0 0 9,275 72,247Adams 10,162 8,211 13,884 4,105 5,446 4,424 0 0 0 0 0 0 0 5,217 51,450Franklin 5,242 11,361 15,016 5,742 6,848 5,684 0 0 0 0 0 0 0 5,830 55,723Total Urban 1,015,223 650,076 943,371 666,585 472,131 345,255 0 0 390,114 70,841 758,808 0 0 710,709 6,023,113Northwest 27,542 36,253 50,443 25,974 26,688 7,387 0 0 0 0 0 0 0 27,262 201,549N. Central 24,374 34,241 45,754 22,482 25,209 6,934 0 0 0 0 0 0 0 24,764 183,759N. Tier 27,410 37,783 55,690 33,308 32,376 6,406 0 0 0 0 0 0 0 33,551 226,524S. Alleghenies 24,310 31,857 42,462 30,248 28,497 7,036 0 0 0 0 0 0 0 30,637 195,047Wayne County 0 7,498 10,310 3,686 4,989 3,342 0 0 0 0 0 0 0 3,763 33,588Total Rural 103,637 147,632 204,659 115,699 117,759 31,105 0 0 0 0 0 0 0 119,978 840,468Interstate Program 3,222,220 0 278,811 257,529 0 0 241,441 0 0 0 0 0 0 281,721 4,281,722Statewide Program 0 0 0 0 0 0 0 28,737 0 122,414 0 220,352 250,556 0 622,058Statewide Reserve 605,090 0 498,600 0 0 160,000 0 0 0 0 0 0 0 0 1,263,690RBR Regional Share 0 0 64,188 64,188 0 0 0 0 0 0 0 0 0 0 128,375GRAND TOTAL 4,946,170 797,708 1,989,629 1,104,000 589,890 536,360 241,441 28,737 390,114 193,255 758,808 220,352 250,556 1,112,407 13,159,426
Appendix 2: Total FFY 2031-2034 -- Highway/Bridge Base Funding Allocation ($000)
State Highway and State Bridge fund regional distributions do not include funds distributed but reserved for the Rapid Bridge Replacement (RBR) Program; Off-System Bridges include set-asides from the Surface Transportation Block Grant Program and the Bridge Investment Program
27
72
DRAFT

MPO/RPO RBR Deck Area % Share 2023 2024 2025 2026 TIP TOTAL 2027 2028 2029 2030 2031 2032 2033 2034 Total TYP
DVRPC 12,755.5 1.46% 226.89 227.69 228.09 228.97 911.63 229.69 230.57 231.04 231.96 232.76 233.74 234.29 235.31 2,770.99SPC 276,302.9 31.59% 4,914.71 4,932.09 4,940.77 4,959.73 19,747.30 4,975.52 4,994.48 5,004.74 5,024.49 5,041.86 5,063.19 5,075.03 5,097.15 60,023.76Harrisburg 34,925.0 3.99% 621.23 623.42 624.52 626.92 2,496.08 628.91 631.31 632.61 635.10 637.30 639.99 641.49 644.29 7,587.07Scranton/WB 13,629.0 1.56% 242.42 243.28 243.71 244.65 974.06 245.42 246.36 246.87 247.84 248.70 249.75 250.33 251.42 2,960.75Lehigh Valley 41,874.0 4.79% 744.83 747.46 748.78 751.65 2,992.72 754.05 756.92 758.47 761.47 764.10 767.33 769.13 772.48 9,096.66NEPA 70,903.5 8.11% 1,261.19 1,265.65 1,267.88 1,272.74 5,067.45 1,276.79 1,281.66 1,284.29 1,289.36 1,293.82 1,299.29 1,302.33 1,308.00 15,403.00SEDA-COG 30,389.6 3.47% 540.55 542.46 543.42 545.50 2,171.94 547.24 549.33 550.45 552.63 554.54 556.88 558.19 560.62 6,601.81Altoona 6,584.4 0.75% 117.12 117.53 117.74 118.19 470.59 118.57 119.02 119.26 119.74 120.15 120.66 120.94 121.47 1,430.39Johnstown 3,702.1 0.42% 65.85 66.08 66.20 66.45 264.59 66.67 66.92 67.06 67.32 67.55 67.84 68.00 68.30 804.24Centre County 16,835.4 1.92% 299.46 300.52 301.05 302.20 1,203.22 303.16 304.32 304.94 306.15 307.21 308.50 309.23 310.57 3,657.30Williamsport 11,654.8 1.33% 207.31 208.04 208.41 209.21 832.97 209.87 210.67 211.11 211.94 212.67 213.57 214.07 215.00 2,531.88Erie 2,079.0 0.24% 36.98 37.11 37.18 37.32 148.59 37.44 37.58 37.66 37.81 37.94 38.10 38.19 38.35 451.64Lancaster 45,475.8 5.20% 808.90 811.76 813.19 816.31 3,250.14 818.91 822.02 823.71 826.96 829.82 833.33 835.28 838.92 9,879.12York 20,394.8 2.33% 362.77 364.05 364.69 366.09 1,457.61 367.26 368.66 369.42 370.87 372.16 373.73 374.60 376.24 4,430.55Reading 8,141.2 0.93% 144.81 145.32 145.58 146.14 581.85 146.60 147.16 147.46 148.05 148.56 149.19 149.53 150.19 1,768.59Lebanon 1,655.0 0.19% 29.44 29.54 29.59 29.71 118.28 29.80 29.92 29.98 30.10 30.20 30.33 30.40 30.53 359.53Mercer 3,586.9 0.41% 63.80 64.03 64.14 64.39 256.35 64.59 64.84 64.97 65.23 65.45 65.73 65.88 66.17 779.21Adams 28,042.5 3.21% 498.80 500.57 501.45 503.37 2,004.19 504.98 506.90 507.94 509.94 511.71 513.87 515.07 517.32 6,091.92Franklin 8,918.4 1.02% 158.64 159.20 159.48 160.09 637.40 160.60 161.21 161.54 162.18 162.74 163.43 163.81 164.52 1,937.42
0.00%Northwest 44,543.1 5.09% 792.31 795.11 796.51 799.56 3,183.48 802.11 805.17 806.82 810.00 812.80 816.24 818.15 821.72 9,676.50N. Central 67,603.4 7.73% 1,202.49 1,206.74 1,208.87 1,213.50 4,831.60 1,217.37 1,222.01 1,224.52 1,229.35 1,233.60 1,238.82 1,241.72 1,247.13 14,686.09N. Tier 57,527.4 6.58% 1,023.26 1,026.88 1,028.69 1,032.64 4,111.47 1,035.92 1,039.87 1,042.01 1,046.12 1,049.74 1,054.18 1,056.64 1,061.25 12,497.19S. Alleghenies 60,493.3 6.92% 1,076.02 1,079.82 1,081.72 1,085.87 4,323.44 1,089.33 1,093.48 1,095.73 1,100.05 1,103.86 1,108.53 1,111.12 1,115.96 13,141.50Wayne 6,618.9 0.76% 117.73 118.15 118.36 118.81 473.05 119.19 119.64 119.89 120.36 120.78 121.29 121.57 122.10 1,437.88Total (No IM) 874,635.9 100.00% 15,557.50 15,612.50 15,640.00 15,700.00 62,510.00 15,750.00 15,810.00 15,842.50 15,905.00 15,960.00 16,027.50 16,065.00 16,135.00 190,005.00
Appendix 3 -- Rapid Bridge Replacement Program -- MPO/RPO Share ($000) (50% A-581)
Rapid Bridge Replacement Program -- MPO/RPO Share ($000) (50% A-185)
28
73
DRAFT

MPO/RPO RBR Deck Area % Share 2023 2024 2025 2026 TIP TOTAL 2027 2028 2029 2030 2031 2032 2033 2034 Total TYP
DVRPC 12,755.5 1.46% 453.77 455.38 456.18 457.93 1,823.26 459.39 461.14 462.09 463.91 465.51 467.48 468.58 470.62 5,541.98SPC 276,302.9 31.59% 9,829.42 9,864.17 9,881.55 9,919.45 39,494.59 9,951.05 9,988.95 10,009.49 10,048.98 10,083.73 10,126.37 10,150.07 10,194.29 120,047.51Harrisburg 34,925.0 3.99% 1,242.45 1,246.84 1,249.04 1,253.83 4,992.16 1,257.82 1,262.62 1,265.21 1,270.20 1,274.59 1,279.99 1,282.98 1,288.57 15,174.14Scranton/WB 13,629.0 1.56% 484.85 486.56 487.42 489.29 1,948.12 490.85 492.72 493.73 495.68 497.39 499.50 500.67 502.85 5,921.50Lehigh Valley 41,874.0 4.79% 1,489.66 1,494.93 1,497.56 1,503.30 5,985.45 1,508.09 1,513.84 1,516.95 1,522.93 1,528.20 1,534.66 1,538.25 1,544.96 18,193.33NEPA 70,903.5 8.11% 2,522.38 2,531.30 2,535.75 2,545.48 10,134.91 2,553.59 2,563.32 2,568.59 2,578.72 2,587.64 2,598.58 2,604.66 2,616.01 30,806.01SEDA-COG 30,389.6 3.47% 1,081.10 1,084.93 1,086.84 1,091.01 4,343.87 1,094.48 1,098.65 1,100.91 1,105.25 1,109.07 1,113.76 1,116.37 1,121.24 13,203.61Altoona 6,584.4 0.75% 234.24 235.07 235.48 236.38 941.17 237.14 238.04 238.53 239.47 240.30 241.32 241.88 242.93 2,860.78Johnstown 3,702.1 0.42% 131.70 132.17 132.40 132.91 529.18 133.33 133.84 134.11 134.64 135.11 135.68 136.00 136.59 1,608.48Centre County 16,835.4 1.92% 598.92 601.03 602.09 604.40 2,406.44 606.33 608.64 609.89 612.29 614.41 617.01 618.45 621.15 7,314.61Williamsport 11,654.8 1.33% 414.62 416.08 416.82 418.41 1,665.93 419.75 421.35 422.21 423.88 425.34 427.14 428.14 430.01 5,063.75Erie 2,079.0 0.24% 73.96 74.22 74.35 74.64 297.17 74.88 75.16 75.31 75.61 75.87 76.19 76.37 76.71 903.28Lancaster 45,475.8 5.20% 1,617.79 1,623.51 1,626.37 1,632.61 6,500.29 1,637.81 1,644.05 1,647.43 1,653.93 1,659.65 1,666.67 1,670.57 1,677.85 19,758.23York 20,394.8 2.33% 725.54 728.11 729.39 732.19 2,915.22 734.52 737.32 738.83 741.75 744.31 747.46 749.21 752.47 8,861.09Reading 8,141.2 0.93% 289.62 290.65 291.16 292.27 1,163.70 293.21 294.32 294.93 296.09 297.11 298.37 299.07 300.37 3,537.17Lebanon 1,655.0 0.19% 58.88 59.08 59.19 59.42 236.56 59.60 59.83 59.95 60.19 60.40 60.65 60.80 61.06 719.06Mercer 3,586.9 0.41% 127.60 128.05 128.28 128.77 512.71 129.18 129.67 129.94 130.45 130.90 131.46 131.77 132.34 1,558.43Adams 28,042.5 3.21% 997.61 1,001.13 1,002.90 1,006.74 4,008.38 1,009.95 1,013.80 1,015.88 1,019.89 1,023.42 1,027.74 1,030.15 1,034.64 12,183.85Franklin 8,918.4 1.02% 317.27 318.39 318.95 320.18 1,274.79 321.20 322.42 323.08 324.36 325.48 326.86 327.62 329.05 3,874.85
0.00% 0.00 0.00 0.00 0.00 0.00 0.00 0.00 0.00 0.00Northwest 44,543.1 5.09% 1,584.61 1,590.21 1,593.02 1,599.13 6,366.97 1,604.22 1,610.33 1,613.64 1,620.01 1,625.61 1,632.48 1,636.30 1,643.43 19,352.99N. Central 67,603.4 7.73% 2,404.98 2,413.48 2,417.73 2,427.01 9,663.19 2,434.74 2,444.01 2,449.03 2,458.70 2,467.20 2,477.63 2,483.43 2,494.25 29,372.19N. Tier 57,527.4 6.58% 2,046.53 2,053.76 2,057.38 2,065.27 8,222.94 2,071.85 2,079.74 2,084.02 2,092.24 2,099.47 2,108.35 2,113.29 2,122.49 24,994.39S. Alleghenies 60,493.3 6.92% 2,152.04 2,159.65 2,163.45 2,171.75 8,646.88 2,178.67 2,186.97 2,191.46 2,200.11 2,207.71 2,217.05 2,222.24 2,231.92 26,283.00Wayne 6,618.9 0.76% 235.47 236.30 236.71 237.62 946.10 238.38 239.29 239.78 240.73 241.56 242.58 243.15 244.21 2,875.77Total (No IM) 874,635.9 100.00% 31,115.00 31,225.00 31,280.00 31,400.00 125,020.00 31,500.00 31,620.00 31,685.00 31,810.00 31,920.00 32,055.00 32,130.00 32,270.00 380,010.00
Appendix 3: Rapid Bridge Replacement Program -- MPO/RPO Share ($000) Total (A-581 + A-185)
29
74
DRAFT
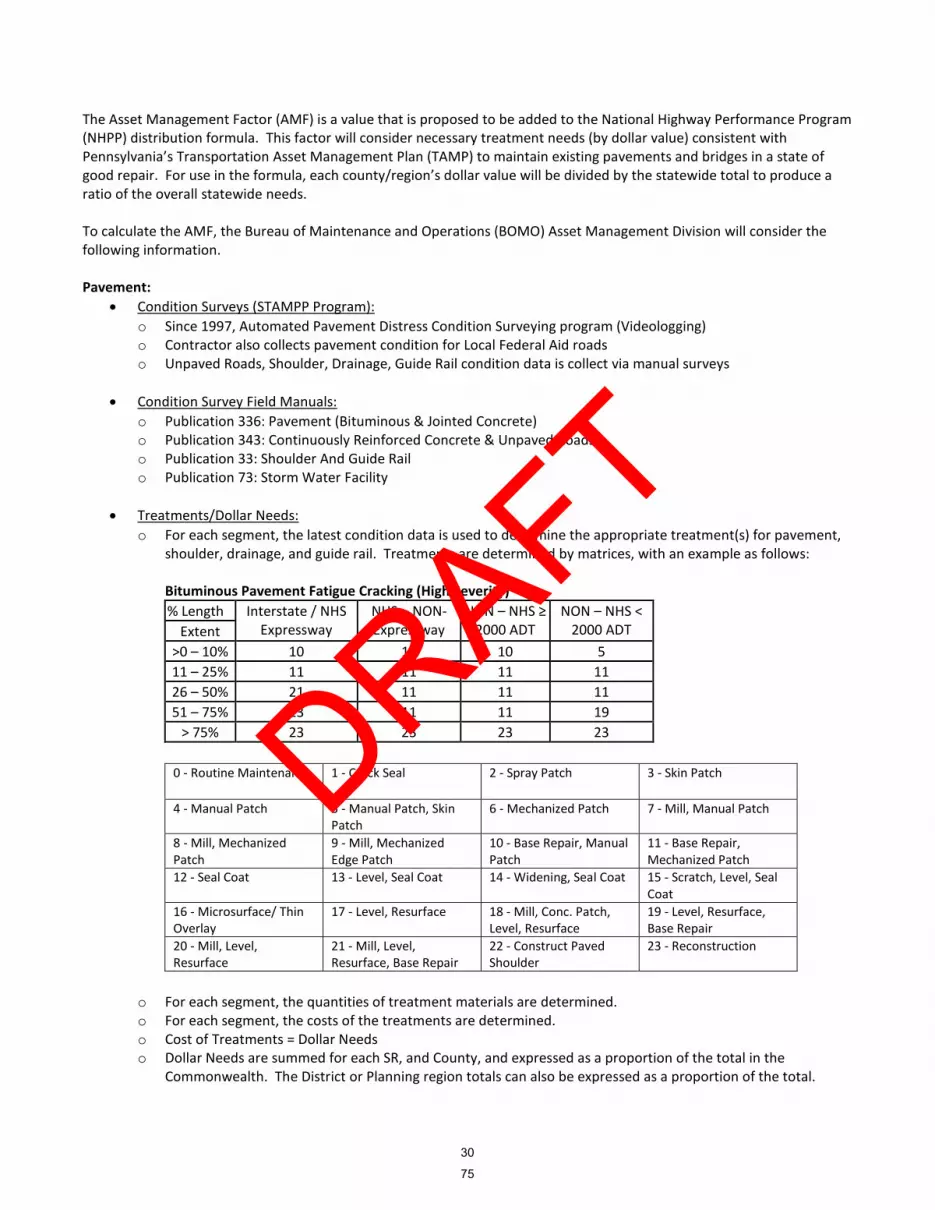
The Asset Management Factor (AMF) is a value that is proposed to be added to the National Highway Performance Program (NHPP) distribution formula. This factor will consider necessary treatment needs (by dollar value) consistent with Pennsylvania’s Transportation Asset Management Plan (TAMP) to maintain existing pavements and bridges in a state of good repair. For use in the formula, each county/region’s dollar value will be divided by the statewide total to produce a ratio of the overall statewide needs.
To calculate the AMF, the Bureau of Maintenance and Operations (BOMO) Asset Management Division will consider the following information.
Pavement: • Condition Surveys (STAMPP Program):
o Since 1997, Automated Pavement Distress Condition Surveying program (Videologging)o Contractor also collects pavement condition for Local Federal Aid roadso Unpaved Roads, Shoulder, Drainage, Guide Rail condition data is collect via manual surveys
• Condition Survey Field Manuals:o Publication 336: Pavement (Bituminous & Jointed Concrete)o Publication 343: Continuously Reinforced Concrete & Unpaved Roadso Publication 33: Shoulder And Guide Railo Publication 73: Storm Water Facility
• Treatments/Dollar Needs:o For each segment, the latest condition data is used to determine the appropriate treatment(s) for pavement,
shoulder, drainage, and guide rail. Treatments are determined by matrices, with an example as follows:
Bituminous Pavement Fatigue Cracking (High Severity)% Length Interstate / NHS
Expressway NHS – NON-Expressway
NON – NHS ≥ 2000 ADT
NON – NHS < 2000 ADT Extent
>0 – 10% 10 10 10 5 11 – 25% 11 11 11 11 26 – 50% 21 11 11 11 51 – 75% 23 11 11 19
> 75% 23 23 23 23
0 - Routine Maintenance 1 - Crack Seal 2 - Spray Patch 3 - Skin Patch
4 - Manual Patch 5 - Manual Patch, Skin Patch
6 - Mechanized Patch 7 - Mill, Manual Patch
8 - Mill, Mechanized Patch
9 - Mill, Mechanized Edge Patch
10 - Base Repair, Manual Patch
11 - Base Repair, Mechanized Patch
12 - Seal Coat 13 - Level, Seal Coat 14 - Widening, Seal Coat 15 - Scratch, Level, Seal Coat
16 - Microsurface/ Thin Overlay
17 - Level, Resurface 18 - Mill, Conc. Patch, Level, Resurface
19 - Level, Resurface, Base Repair
20 - Mill, Level, Resurface
21 - Mill, Level, Resurface, Base Repair
22 - Construct Paved Shoulder
23 - Reconstruction
o For each segment, the quantities of treatment materials are determined.o For each segment, the costs of the treatments are determined.o Cost of Treatments = Dollar Needso Dollar Needs are summed for each SR, and County, and expressed as a proportion of the total in the
Commonwealth. The District or Planning region totals can also be expressed as a proportion of the total.
30
75
DRAFT

Bridges • Condition Surveys
o Bridge inspections have been performed through progressive Federal minimum standards since 1971o Bridges are inspected every 2 years or less, depending on condition
• Condition Survey Field Manualo Publication 100A
• Treatment / Dollar needso For each bridge, the latest condition data is used to determine the appropriate treatment(s) for the
structure. Treatments are determined by matrices, with an example as follows:o For each bridge, the treatment and cost are determined.o Total cost of treatments = Dollar Needso Dollar Needs are summed for each County, and expressed as a proportion of the total in the
Commonwealth. The District or Planning region totals can also be expressed as a proportion of the total.
31
76
DRAFT

Category3/4 Deck Area Non-Interstate NHS Bridges > 20 feet
1/4 Bridge AMF*1/4 Non-Interstate NHS Lane Miles
1/4 Non-Interstate NHS VMT1/4 Non-Interstate NHS Truck VMT
1/4 Pavement AMF*
1/2 Non-NHS Lane Miles1/4 Non-NHS VMT
1/4 Non-NHS Truck VMT
State BridgeFederal Off-System
Bridge
RailNHFP
CMAQ
TAP
STP-Urban
3/4 Bridge Deck Area NHS and Interstate Bridges > 20 feet
1/4 Bridge AMF*
2023 Financial Guidance
40% Bridge
60% Highway
39:1 Crash Severity Weighting(Fatal and Injury Crashses versus Property Damage only Crashes)
* Asset Management Factor
HSIP
40% Bridge Deck Area Non-NHS State and Local Bridges > 20 feet
60% Highway
1/4 VMT1/4 Truck VMT
Deck Area State and Local Bridges > 20 feet
Statewide ProgramInterstate Program
Population with CMAQ Factor Multiplier Based upon regional air quality classification for non-attainment/maintenance counties
State Highway
STP
Statewide Program; funds designated to urban areas distributed according to federal formula
Funds distributed according to federal formula
60% NHS Bridges
Deck Area Non-NHS State and Local Bridges > 20 feet40% STP Bridge
Bridge Investment Program
Appendix 5: Financial Guidance Distribution Formula Summary
$500,000 base to each Planning Region, $35 million Statewide
NHPP
Interstate -- 26/55ths of Apportionment in 2021; $50,000,000 additional in each subsequent year to a maximum of $1 billion for the entire program
1/2 Lane MilesDeck Area State bridges > 8 feet and Local bridges > 20 feet
32
77
DRAFT

SEPTA 364,290 711,527 15,100 1,090,917 Krapf's Coach - Chester 0 18 0 18 Upper Merion 0 19 0 19PAAC 118,630 244,850 12,500 375,980AMTRAN -- Blair 0 3,316 0 3,316BCTA -- Beaver 0 4,195 591 4,786CAT -- Dauphin 0 9,437 1,380 10,817CATA -- Centre 0 7,631 293 7,924CCTA -- Cambria 0 7,527 921 8,448COLTS -- Lackawanna 0 7,563 1,946 9,509CPTA -- Adams, Columbia, Cumberland, Franklin, Montour, Northumberland, Perry, Snyder, Union and York 0 7,620 5,700 13,320EMTA -- Erie 0 10,882 1,216 12,098FACT -- Fayette 0 1,326 577 1,903HPT -- Hazleton 0 2,175 0 2,175LANTA -- Lehigh-Northampton 0 19,085 3,628 22,713LCTA -- Luzerne 0 6,412 694 7,106 Martz 0 13 0 13LT -- Lebanon 0 2,157 581 2,738MMVTA -- Mid Mon Valley 0 3,173 0 3,173MCTA -- Monroe 0 2,233 1,372 3,605Pottstown -- Montgomery 0 1,407 0 1,407SCTA -- South Central 0 17,665 4,612 22,277SVSS -- Shenango Valley 0 868 963 1,831WCTA -- Washington 0 1,639 2,215 3,854WBT -- Williamsport 0 4,643 0 4,643WCTA -- Westmoreland 0 4,351 1,657 6,008Unallocated Other Urban Systems 0 0 0 0
Urban Total 482,920 1,081,732 55,946 1,620,598ATA 0 6,001 453 6,454BTA -- Butler 0 1,031 0 1,031Carbon 0 273 506 779CATA -- Crawford 0 1,518 785 2,303EMTA -- Endless Mtns. 0 1,149 1,291 2,440ICTA -- Indiana 0 1,855 408 2,263Mid-County -- Armstrong 0 657 315 972Mt. Carmel 0 342 0 342NCATA -- New Castle 0 4,783 0 4,783STS -- Schuylkill 0 1,747 1,032 2,779TAWC -- Warren 0 755 498 1,253
Rural Total 0 20,111 5,288 25,399ALLIED COORD. TRANS. (Lawrence Co.) 0 0 420 420BLAIR COUNTY SENIOR SERVICES 0 0 1,156 1,156BUCKS COUNTY TRANSPORT, INC. 0 0 2,897 2,897BUTLER COUNTY 0 0 457 457CENTRE COUNTY 0 0 653 653CLARION COUNTY 0 0 470 470COMMUNITY TRANS OF DELAWARE 0 0 3,012 3,012FOREST COUNTY 0 0 358 358GREENE COUNTY 0 0 379 379HUNTINGDON-BEDFORD-FULTON AAA 0 0 1,159 1,159K-CAB (Columbia Co.) 0 0 0 0KRAPF'S (Chester Co.) 0 0 2,715 2,715MIFFLIN-JUNIATA AA ON AGING 0 0 430 430PERRY COUNTY 0 0 0 0PIKE COUNTY 0 0 470 470SOMERSET COUNTY 0 0 249 249STEP (Clinton/ Lycoming) 0 0 1,015 1,015SUBURBAN TRANS (Montgomery) 0 0 4,390 4,390Susquehanna Co. 0 0 812 812UNION-SNYDER TRANS. ALLIANCE 0 0 0 0WAYNE COUNTY 0 0 1,147 1,147
Shared-Ride Total 0 0 22,189 22,189Bucks County Transport 0 638 0 638Chester County TMA 0 929 0 929Philadelphia Unemployment Project 0 367 0 367Philly Phlash 0 918 0 918ACTA 0 668 0 668Heritage Health Foundation 0 887 0 887
Other Agency Total 0 4,407 0 4,407PennDOT Discretion 27,630 0 0 27,630
Other Unallocated (Urban/Rural) 41,990 27,656 0 69,646GRAND TOTAL 552,540 1,133,906 83,423 1,769,869
Date Prepared: 5/25/2021
Appendix 6: 2023 Estimated State Transit Funds ($000)
URBA
N
@ Shared Ride allocation in SFY 18-19 equal the actual grants for both the Shared-Ride and PwD Programs. In subsequent years, the FY 18-19 Shared-Ride amounts are prorated based on the reduction of available lottery funding for the program in FY 19-20. PwD amounts remain constant.
OPERATOR Asset * Improvement
Operating # Assistance Shared Ride @ Total
RURA
LSh
ared
-Rid
e O
nly
Oth
er
Agen
cies
* Act 89 allocates Asset Improvement funds in the following way - PennDOT 5%, the remaining 95% is distributed as follows - SEPTA 69.4%, PAAC 22.6% and other systems 8%. This projection is for SFY 22-23.
# Distribution for all fiscal years is based on FY 2018-19 operating statistics and uses SFY20-21 allocations. Additional operating funding is projected using estimated revenues. The additional funding will be distributed using performance factors from the prior year and is captured on the "Other Unallocated" line, under the 1513 Operating column.
33
78
DRAFT

SEPTA 369,550 711,527 15,100 1,096,177 Krapf's Coach - Chester 0 18 0 18 Upper Merion 0 19 0 19PAAC 120,340 244,850 12,500 377,690AMTRAN -- Blair 0 3,316 0 3,316BCTA -- Beaver 0 4,195 591 4,786CAT -- Dauphin 0 9,437 1,380 10,817CATA -- Centre 0 7,631 293 7,924CCTA -- Cambria 0 7,527 921 8,448COLTS -- Lackawanna 0 7,563 1,946 9,509CPTA -- Adams, Columbia, Cumberland, Franklin, Montour, Northumberland, Perry, Snyder, Union and York 0 7,620 5,700 13,320EMTA -- Erie 0 10,882 1,216 12,098FACT -- Fayette 0 1,326 577 1,903HPT -- Hazleton 0 2,175 0 2,175LANTA -- Lehigh-Northampton 0 19,085 3,628 22,713LCTA -- Luzerne 0 6,412 694 7,106 Martz 0 13 0 13LT -- Lebanon 0 2,157 581 2,738MMVTA -- Mid Mon Valley 0 3,173 0 3,173MCTA -- Monroe 0 2,233 1,372 3,605Pottstown -- Montgomery 0 1,407 0 1,407SCTA -- South Central 0 17,665 4,612 22,277SVSS -- Shenango Valley 0 868 963 1,831WCTA -- Washington 0 1,639 2,215 3,854WBT -- Williamsport 0 4,643 0 4,643WCTA -- Westmoreland 0 4,351 1,657 6,008Unallocated Other Urban Systems 0 0 0 0
Urban Total 489,890 1,081,732 55,946 1,627,568ATA 0 6,001 453 6,454BTA -- Butler 0 1,031 0 1,031Carbon 0 273 506 779CATA -- Crawford 0 1,518 785 2,303EMTA -- Endless Mtns. 0 1,149 1,291 2,440ICTA -- Indiana 0 1,855 408 2,263Mid-County -- Armstrong 0 657 315 972Mt. Carmel 0 342 0 342NCATA -- New Castle 0 4,783 0 4,783STS -- Schuylkill 0 1,747 1,032 2,779TAWC -- Warren 0 755 498 1,253
Rural Total 0 20,111 5,288 25,399ALLIED COORD. TRANS. (Lawrence Co.) 0 0 420 420BLAIR COUNTY SENIOR SERVICES 0 0 1,156 1,156BUCKS COUNTY TRANSPORT, INC. 0 0 2,897 2,897BUTLER COUNTY 0 0 457 457CENTRE COUNTY 0 0 653 653CLARION COUNTY 0 0 470 470COMMUNITY TRANS OF DELAWARE 0 0 3,012 3,012FOREST COUNTY 0 0 358 358GREENE COUNTY 0 0 379 379HUNTINGDON-BEDFORD-FULTON AAA 0 0 1,159 1,159K-CAB (Columbia Co.) 0 0 0 0KRAPF'S (Chester Co.) 0 0 2,715 2,715MIFFLIN-JUNIATA AA ON AGING 0 0 430 430PERRY COUNTY 0 0 0 0PIKE COUNTY 0 0 470 470SOMERSET COUNTY 0 0 249 249STEP (Clinton/ Lycoming) 0 0 1,015 1,015SUBURBAN TRANS (Montgomery) 0 0 4,390 4,390Susquehanna Co. 0 0 812 812UNION-SNYDER TRANS. ALLIANCE 0 0 0 0WAYNE COUNTY 0 0 1,147 1,147
Shared-Ride Total 0 0 22,189 22,189Bucks County Transport 0 638 0 638Chester County TMA 0 929 0 929Philadelphia Unemployment Project 0 367 0 367Philly Phlash 0 918 0 918ACTA 0 668 0 668Heritage Health Foundation 0 887 0 887
Other Agency Total 0 4,407 0 4,407PennDOT Discretion 28,030 0 0 28,030
Other Unallocated (Urban/Rural) 42,600 56,004 0 98,604GRAND TOTAL 560,520 1,162,254 83,423 1,806,197
Date Prepared: 5/25/2021
Appendix 6: 2024 Estimated State Transit Funds ($000)
URBA
N
@ Shared Ride allocation in SFY 18-19 equal the actual grants for both the Shared-Ride and PwD Programs. In subsequent years, the FY 18-19 Shared-Ride amounts are prorated based on the reduction of available lottery funding for the program in FY 19-20. PwD amounts remain constant.
OPERATOR Asset * Improvement
Operating # Assistance Shared Ride @ Total
RURA
LSh
ared
-Rid
e O
nly
Oth
er
Agen
cies
* Act 89 allocates Asset Improvement funds in the following way - PennDOT 5%, the remaining 95% is distributed as follows - SEPTA 69.4%, PAAC 22.6% and other systems 8%. This projection is for SFY 23-24.
# Distribution for all fiscal years is based on FY 2018-19 operating statistics and uses SFY20-21 allocations. Additional operating funding is projected using estimated revenues. The additional funding will be distributed using performance factors from the prior year and is captured on the "Other Unallocated" line, under the 1513 Operating column.
3479
DRAFT

SEPTA 373,780 711,527 15,100 1,100,407 Krapf's Coach - Chester 0 18 0 18 Upper Merion 0 19 0 19PAAC 121,720 244,850 12,500 379,070AMTRAN -- Blair 0 3,316 0 3,316BCTA -- Beaver 0 4,195 591 4,786CAT -- Dauphin 0 9,437 1,380 10,817CATA -- Centre 0 7,631 293 7,924CCTA -- Cambria 0 7,527 921 8,448COLTS -- Lackawanna 0 7,563 1,946 9,509CPTA -- Adams, Columbia, Cumberland, Franklin, Montour, Northumberland, Perry, Snyder, Union and York 0 7,620 5,700 13,320EMTA -- Erie 0 10,882 1,216 12,098FACT -- Fayette 0 1,326 577 1,903HPT -- Hazleton 0 2,175 0 2,175LANTA -- Lehigh-Northampton 0 19,085 3,628 22,713LCTA -- Luzerne 0 6,412 694 7,106 Martz 0 13 0 13LT -- Lebanon 0 2,157 581 2,738MMVTA -- Mid Mon Valley 0 3,173 0 3,173MCTA -- Monroe 0 2,233 1,372 3,605Pottstown -- Montgomery 0 1,407 0 1,407SCTA -- South Central 0 17,665 4,612 22,277SVSS -- Shenango Valley 0 868 963 1,831WCTA -- Washington 0 1,639 2,215 3,854WBT -- Williamsport 0 4,643 0 4,643WCTA -- Westmoreland 0 4,351 1,657 6,008Unallocated Other Urban Systems 0 0 0 0
Urban Total 495,500 1,081,732 55,946 1,633,178ATA 0 6,001 453 6,454BTA -- Butler 0 1,031 0 1,031Carbon 0 273 506 779CATA -- Crawford 0 1,518 785 2,303EMTA -- Endless Mtns. 0 1,149 1,291 2,440ICTA -- Indiana 0 1,855 408 2,263Mid-County -- Armstrong 0 657 315 972Mt. Carmel 0 342 0 342NCATA -- New Castle 0 4,783 0 4,783STS -- Schuylkill 0 1,747 1,032 2,779TAWC -- Warren 0 755 498 1,253
Rural Total 0 20,111 5,288 25,399ALLIED COORD. TRANS. (Lawrence Co.) 0 0 420 420BLAIR COUNTY SENIOR SERVICES 0 0 1,156 1,156BUCKS COUNTY TRANSPORT, INC. 0 0 2,897 2,897BUTLER COUNTY 0 0 457 457CENTRE COUNTY 0 0 653 653CLARION COUNTY 0 0 470 470COMMUNITY TRANS OF DELAWARE 0 0 3,012 3,012FOREST COUNTY 0 0 358 358GREENE COUNTY 0 0 379 379HUNTINGDON-BEDFORD-FULTON AAA 0 0 1,159 1,159K-CAB (Columbia Co.) 0 0 0 0KRAPF'S (Chester Co.) 0 0 2,715 2,715MIFFLIN-JUNIATA AA ON AGING 0 0 430 430PERRY COUNTY 0 0 0 0PIKE COUNTY 0 0 470 470SOMERSET COUNTY 0 0 249 249STEP (Clinton/ Lycoming) 0 0 1,015 1,015SUBURBAN TRANS (Montgomery) 0 0 4,390 4,390Susquehanna Co. 0 0 812 812UNION-SNYDER TRANS. ALLIANCE 0 0 0 0WAYNE COUNTY 0 0 1,147 1,147
Shared-Ride Total 0 0 22,189 22,189Bucks County Transport 0 638 0 638Chester County TMA 0 929 0 929Philadelphia Unemployment Project 0 367 0 367Philly Phlash 0 918 0 918ACTA 0 668 0 668Heritage Health Foundation 0 887 0 887
Other Agency Total 0 4,407 0 4,407PennDOT Discretion 28,350 0 0 28,350
Other Unallocated (Urban/Rural) 43,090 85,060 0 128,150GRAND TOTAL 566,940 1,191,310 83,423 1,841,673
Date Prepared: 5/25/2021
@ Shared Ride allocation in SFY 18-19 equal the actual grants for both the Shared-Ride and PwD Programs. In subsequent
Appendix 6: 2025 Estimated State Transit Funds ($000)
UR
BA
NR
UR
AL
Shar
ed-R
ide
Onl
yO
ther
A
genc
ies
* Act 89 allocates Asset Improvement funds in the following way - PennDOT 5%, the remaining 95% is distributed as follows -SEPTA 69.4%, PAAC 22.6% and other systems 8%. This projection is for SFY 24-25.
# Distribution for all fiscal years is based on FY 2018-19 operating statistics and uses SFY20-21 allocations. Additional operating funding is projected using estimated revenues. The additional funding will be distributed using performance factors from the prior year and is captured on the "Other Unallocated" line, under the 1513 Operating column.
OPERATOR Asset * Improvement
Operating # Assistance Shared Ride @ Total
35
80
DRAFT
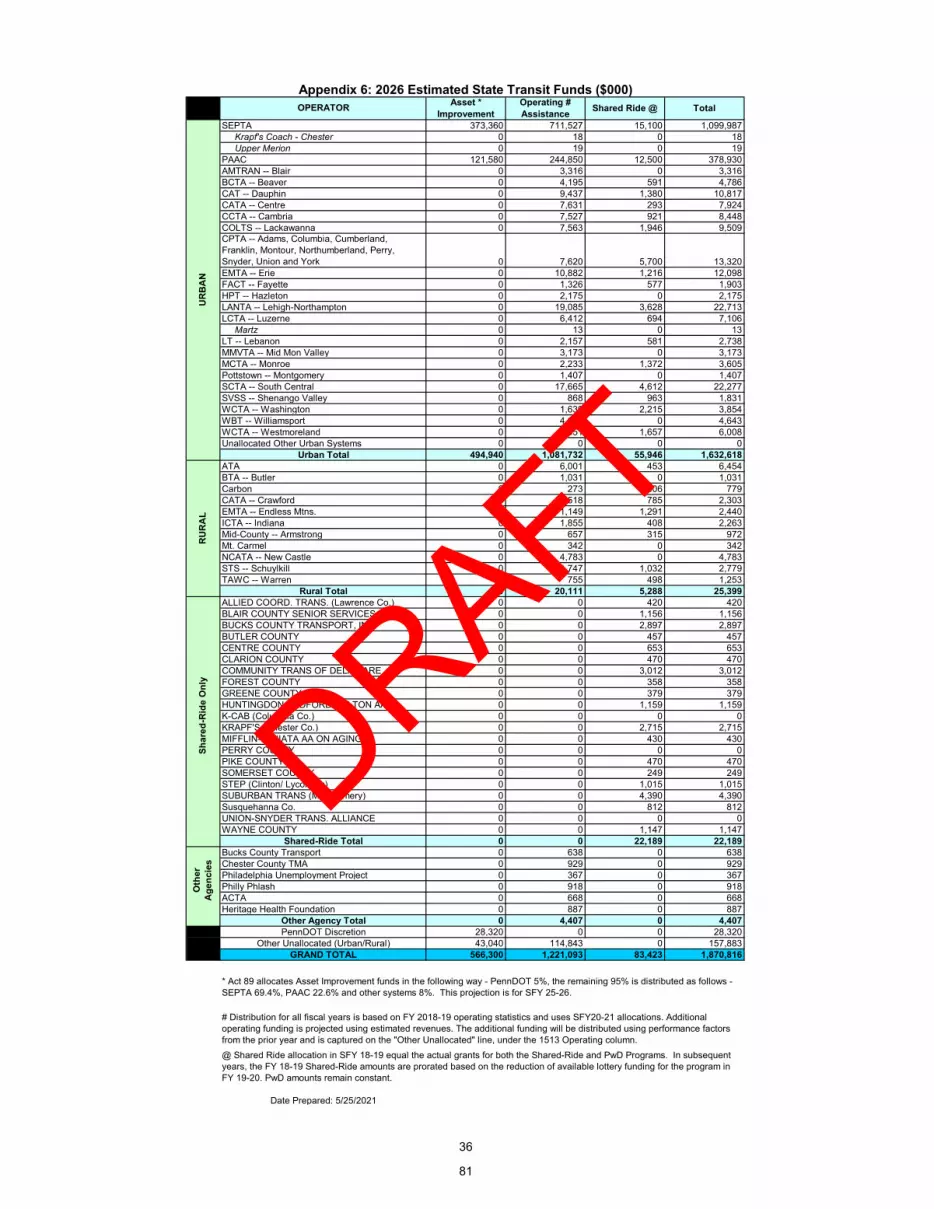
SEPTA 373,360 711,527 15,100 1,099,987 Krapf's Coach - Chester 0 18 0 18 Upper Merion 0 19 0 19PAAC 121,580 244,850 12,500 378,930AMTRAN -- Blair 0 3,316 0 3,316BCTA -- Beaver 0 4,195 591 4,786CAT -- Dauphin 0 9,437 1,380 10,817CATA -- Centre 0 7,631 293 7,924CCTA -- Cambria 0 7,527 921 8,448COLTS -- Lackawanna 0 7,563 1,946 9,509CPTA -- Adams, Columbia, Cumberland, Franklin, Montour, Northumberland, Perry, Snyder, Union and York 0 7,620 5,700 13,320EMTA -- Erie 0 10,882 1,216 12,098FACT -- Fayette 0 1,326 577 1,903HPT -- Hazleton 0 2,175 0 2,175LANTA -- Lehigh-Northampton 0 19,085 3,628 22,713LCTA -- Luzerne 0 6,412 694 7,106 Martz 0 13 0 13LT -- Lebanon 0 2,157 581 2,738MMVTA -- Mid Mon Valley 0 3,173 0 3,173MCTA -- Monroe 0 2,233 1,372 3,605Pottstown -- Montgomery 0 1,407 0 1,407SCTA -- South Central 0 17,665 4,612 22,277SVSS -- Shenango Valley 0 868 963 1,831WCTA -- Washington 0 1,639 2,215 3,854WBT -- Williamsport 0 4,643 0 4,643WCTA -- Westmoreland 0 4,351 1,657 6,008Unallocated Other Urban Systems 0 0 0 0
Urban Total 494,940 1,081,732 55,946 1,632,618ATA 0 6,001 453 6,454BTA -- Butler 0 1,031 0 1,031Carbon 0 273 506 779CATA -- Crawford 0 1,518 785 2,303EMTA -- Endless Mtns. 0 1,149 1,291 2,440ICTA -- Indiana 0 1,855 408 2,263Mid-County -- Armstrong 0 657 315 972Mt. Carmel 0 342 0 342NCATA -- New Castle 0 4,783 0 4,783STS -- Schuylkill 0 1,747 1,032 2,779TAWC -- Warren 0 755 498 1,253
Rural Total 0 20,111 5,288 25,399ALLIED COORD. TRANS. (Lawrence Co.) 0 0 420 420BLAIR COUNTY SENIOR SERVICES 0 0 1,156 1,156BUCKS COUNTY TRANSPORT, INC. 0 0 2,897 2,897BUTLER COUNTY 0 0 457 457CENTRE COUNTY 0 0 653 653CLARION COUNTY 0 0 470 470COMMUNITY TRANS OF DELAWARE 0 0 3,012 3,012FOREST COUNTY 0 0 358 358GREENE COUNTY 0 0 379 379HUNTINGDON-BEDFORD-FULTON AAA 0 0 1,159 1,159K-CAB (Columbia Co.) 0 0 0 0KRAPF'S (Chester Co.) 0 0 2,715 2,715MIFFLIN-JUNIATA AA ON AGING 0 0 430 430PERRY COUNTY 0 0 0 0PIKE COUNTY 0 0 470 470SOMERSET COUNTY 0 0 249 249STEP (Clinton/ Lycoming) 0 0 1,015 1,015SUBURBAN TRANS (Montgomery) 0 0 4,390 4,390Susquehanna Co. 0 0 812 812UNION-SNYDER TRANS. ALLIANCE 0 0 0 0WAYNE COUNTY 0 0 1,147 1,147
Shared-Ride Total 0 0 22,189 22,189Bucks County Transport 0 638 0 638Chester County TMA 0 929 0 929Philadelphia Unemployment Project 0 367 0 367Philly Phlash 0 918 0 918ACTA 0 668 0 668Heritage Health Foundation 0 887 0 887
Other Agency Total 0 4,407 0 4,407PennDOT Discretion 28,320 0 0 28,320
Other Unallocated (Urban/Rural) 43,040 114,843 0 157,883GRAND TOTAL 566,300 1,221,093 83,423 1,870,816
Date Prepared: 5/25/2021
@ Shared Ride allocation in SFY 18-19 equal the actual grants for both the Shared-Ride and PwD Programs. In subsequent years, the FY 18-19 Shared-Ride amounts are prorated based on the reduction of available lottery funding for the program in FY 19-20. PwD amounts remain constant.
UR
BA
NR
UR
AL
Shar
ed-R
ide
Onl
yO
ther
A
genc
ies
* Act 89 allocates Asset Improvement funds in the following way - PennDOT 5%, the remaining 95% is distributed as follows -SEPTA 69.4%, PAAC 22.6% and other systems 8%. This projection is for SFY 25-26.
# Distribution for all fiscal years is based on FY 2018-19 operating statistics and uses SFY20-21 allocations. Additional operating funding is projected using estimated revenues. The additional funding will be distributed using performance factors from the prior year and is captured on the "Other Unallocated" line, under the 1513 Operating column.
Appendix 6: 2026 Estimated State Transit Funds ($000)OPERATOR Asset *
ImprovementOperating # Assistance Shared Ride @ Total
36
81
DRAFT

SEPTA 1,480,980 2,846,108 60,400 4,387,488 Krapf's Coach - Chester 0 72 0 72 Upper Merion 0 76 0 76PAAC 482,270 979,400 50,000 1,511,670AMTRAN -- Blair 0 13,264 0 13,264BCTA -- Beaver 0 16,780 2,364 19,144CAT -- Dauphin 0 37,748 5,520 43,268CATA -- Centre 0 30,524 1,172 31,696CCTA -- Cambria 0 30,108 3,684 33,792COLTS -- Lackawanna 0 30,252 7,784 38,036CPTA -- Adams, Columbia, Cumberland, Franklin, Montour, Northumberland, Perry, Snyder, Union and York 0 30,480 22,800 53,280EMTA -- Erie 0 43,528 4,864 48,392FACT -- Fayette 0 5,304 2,308 7,612HPT -- Hazleton 0 8,700 0 8,700LANTA -- Lehigh-Northampton 0 76,340 14,512 90,852LCTA -- Luzerne 0 25,648 2,776 28,424 Martz 0 52 0 52LT -- Lebanon 0 8,628 2,324 10,952MMVTA -- Mid Mon Valley 0 12,692 0 12,692MCTA -- Monroe 0 8,932 5,488 14,420Pottstown -- Montgomery 0 5,628 0 5,628SCTA -- South Central 0 70,660 18,448 89,108SVSS -- Shenango Valley 0 3,472 3,852 7,324WCTA -- Washington 0 6,556 8,860 15,416WBT -- Williamsport 0 18,572 0 18,572WCTA -- Westmoreland 0 17,404 6,628 24,032Unallocated Other Urban Systems 0 0 0 0
Urban Total 1,963,250 4,326,928 223,784 6,513,962ATA 0 24,004 1,812 25,816BTA -- Butler 0 4,124 0 4,124Carbon 0 1,092 2,024 3,116CATA -- Crawford 0 6,072 3,140 9,212EMTA -- Endless Mtns. 0 4,596 5,164 9,760ICTA -- Indiana 0 7,420 1,632 9,052Mid-County -- Armstrong 0 2,628 1,260 3,888Mt. Carmel 0 1,368 0 1,368NCATA -- New Castle 0 19,132 0 19,132STS -- Schuylkill 0 6,988 4,128 11,116TAWC -- Warren 0 3,020 1,992 5,012
Rural Total 0 80,444 21,152 101,596ALLIED COORD. TRANS. (Lawrence Co.) 0 0 1,680 1,680BLAIR COUNTY SENIOR SERVICES 0 0 4,624 4,624BUCKS COUNTY TRANSPORT, INC. 0 0 11,588 11,588BUTLER COUNTY 0 0 1,828 1,828CENTRE COUNTY 0 0 2,612 2,612CLARION COUNTY 0 0 1,880 1,880COMMUNITY TRANS OF DELAWARE 0 0 12,048 12,048FOREST COUNTY 0 0 1,432 1,432GREENE COUNTY 0 0 1,516 1,516HUNTINGDON-BEDFORD-FULTON AAA 0 0 4,636 4,636K-CAB (Columbia Co.) 0 0 0 0KRAPF'S (Chester Co.) 0 0 10,860 10,860MIFFLIN-JUNIATA AA ON AGING 0 0 1,720 1,720PERRY COUNTY 0 0 0 0PIKE COUNTY 0 0 1,880 1,880SOMERSET COUNTY 0 0 996 996STEP (Clinton/ Lycoming) 0 0 4,060 4,060SUBURBAN TRANS (Montgomery) 0 0 17,560 17,560Susquehanna Co. 0 0 3,248 3,248UNION-SNYDER TRANS. ALLIANCE 0 0 0 0WAYNE COUNTY 0 0 4,588 4,588
Shared-Ride Total 0 0 88,756 88,756Bucks County Transport 0 2,552 0 2,552Chester County TMA 0 3,716 0 3,716Philadelphia Unemployment Project 0 1,468 0 1,468Philly Phlash 0 3,672 0 3,672ACTA 0 2,672 0 2,672Heritage Health Foundation 0 3,548 0 3,548
Other Agency Total 0 17,628 0 17,628PennDOT Discretion 112,330 0 0 112,330
Other Unallocated (Urban/Rural) 170,720 283,563 0 454,283GRAND TOTAL 2,246,300 4,708,563 333,692 7,288,555
Date Prepared: 5/25/2021
Appendix 6: 2023-2026 Estimated State Transit Funds ($000)OPERATOR Asset *
ImprovementOperating # Assistance Shared Ride @ Total
@ Shared Ride allocation in SFY 18-19 equal the actual grants for both the Shared-Ride and PwD Programs. In subsequent years, the FY 18-19 Shared-Ride amounts are prorated based on the reduction of available lottery funding for the program in FY 19-20. PwD amounts remain constant.
UR
BA
NR
UR
AL
Shar
ed-R
ide
Onl
yO
ther
A
genc
ies
* Act 89 allocates Asset Improvement funds in the following way - PennDOT 5%, the remaining 95% is distributed as follows -SEPTA 69.4%, PAAC 22.6% and other systems 8%.
# Distribution for all fiscal years is based on FY 2018-19 operating statistics and uses SFY20-21 allocations. Additional operating funding is projected using estimated revenues. The additional funding will be distributed using performance factors from the prior year and is captured on the "Other Unallocated" line, under the 1513 Operating column.
37
82
DRAFT

Appendix 7 Financial Guidance
Federal Transit Funding 2023-2026 ($000)
Federal Transit
Urban Area Urbanized Area (5307 & 5340)
5337 (State of Good Repair) 5310 5311+ Appalachia
Funds+5339 (Bus and Bus Facilities) Total
Allentown-Bethlehem* 7,602 0 700 0 0 925 9,227Altoona* 1,316 0 0 0 0 0 1,316East Stroudsburg* 1,222 0 0 0 0 0 1,222Erie* 4,261 0 0 0 0 0 4,261Harrisburg* 5,534 0 457 0 0 582 6,573Hanover* 1,000 0 0 0 0 0 1,000Hazleton* 886 0 0 0 0 0 886Johnstown* 1,612 14 0 0 0 0 1,626Lancaster* 4,823 0 437 0 0 535 5,795Lebanon* 1,148 0 0 0 0 0 1,148Monessen* 1,482 0 0 0 0 0 1,482Philadelphia** 105,112 123,572 3,499 0 0 8,529 240,712Pittsburgh** 34,721 22,434 1,905 0 0 3,291 62,351Pottstown* 1,431 0 0 0 0 0 1,431Reading* 3,728 0 282 0 0 425 4,435Scranton/Wilkes-Barre* 5,009 0 449 0 0 568 6,026Sharon* 725 0 51 0 0 74 850State College* 3,389 0 0 0 0 0 3,389Uniontown-Connellsville* 1,260 0 0 0 0 0 1,260Williamsport* 2,579 0 0 0 0 0 2,579York* 3,326 0 243 0 0 383 3,952
Large Urban 6,601 3,903 0 0 0 0 10,504Small Urban 1,656 0 2,224 0 0 1,888 5,768
Large or Small Urban 0 11,785 0 0 0 3,500 15,285Non Urbanized 0 0 2,486 21,578 0 0 24,064Intercity Bus 0 0 0 3,808 0 0 3,808
Appalachian Counties 0 0 0 0 4,788 0 4,788TOTALS 200,423 161,708 12,733 25,386 4,788 20,700 425,738
Date prepared: 5/25/2021
FFY 2023
+These funds can be used for operating, capital or technical assistance* Systems that can use a portion of their federal 5307 funds for operating assistance** Systems are not able to use their federal section 5307 funds for operating assistance
38
83
DRAFT

Appendix 7 Financial Guidance
Federal Transit Funding 2023-2026 ($000)
Federal Transit
Urban Area Urbanized Area (5307 & 5340)
5337 (State of Good Repair) 5310 5311+ Appalachian
Funds+5339 (Bus and Bus Facilities) Total
Allentown-Bethlehem* 7,602 0 700 0 0 925 9,227Altoona* 1,316 0 0 0 0 0 1,316East Stroudsburg* 1,222 0 0 0 0 0 1,222Erie* 4,261 0 0 0 0 0 4,261Harrisburg* 5,534 0 457 0 0 582 6,573Hanover* 1,000 0 0 0 0 0 1,000Hazleton* 886 0 0 0 0 0 886Johnstown* 1,612 14 0 0 0 0 1,626Lancaster* 4,823 0 437 0 0 535 5,795Lebanon* 1,148 0 0 0 0 0 1,148Monessen* 1,482 0 0 0 0 0 1,482Philadelphia** 105,112 123,572 3,499 0 0 8,529 240,712Pittsburgh** 34,721 22,434 1,905 0 0 3,291 62,351Pottstown* 1,431 0 0 0 0 0 1,431Reading* 3,728 0 282 0 0 425 4,435Scranton/Wilkes-Barre* 5,009 0 449 0 0 568 6,026Sharon* 725 0 51 0 0 74 850State College* 3,389 0 0 0 0 0 3,389Uniontown-Connellsville* 1,260 0 0 0 0 0 1,260Williamsport* 2,579 0 0 0 0 0 2,579York* 3,326 0 243 0 0 383 3,952
Large Urban 6,601 3,903 0 0 0 0 10,504Small Urban 1,656 0 2,224 0 0 1,888 5,768
Large or Small Urban 0 11,785 0 0 0 3,500 15,285Non Urbanized 0 0 2,486 21,578 0 0 24,064Intercity Bus 0 0 0 3,808 0 0 3,808
Appalachian Counties 0 0 0 0 4,788 0 4,788TOTALS 200,423 161,708 12,733 25,386 4,788 20,700 425,738
Date prepared: 5/25/2021
FFY 2024
* Systems that can use a portion of their federal 5307 funds for operating assistance** Systems are not able to use their federal section 5307 funds for operating assistance
+These funds can be used for operating, capital or technical assistance
39
84
DRAFT

Appendix 7 Financial Guidance
Federal Transit Funding 2023-2026 ($000)
Federal Transit
Urban Area Urbanized Area (5307 & 5340)
5337 (State of Good Repair) 5310 5311+ Appalachian
Funds+5339 (Bus and Bus Facilities) Total
Allentown-Bethlehem* 7,602 0 700 0 0 925 9,227Altoona* 1,316 0 0 0 0 0 1,316East Stroudsburg* 1,222 0 0 0 0 0 1,222Erie* 4,261 0 0 0 0 0 4,261Harrisburg* 5,534 0 457 0 0 582 6,573Hanover* 1,000 0 0 0 0 0 1,000Hazleton* 886 0 0 0 0 0 886Johnstown* 1,612 14 0 0 0 0 1,626Lancaster* 4,823 0 437 0 0 535 5,795Lebanon* 1,148 0 0 0 0 0 1,148Monessen* 1,482 0 0 0 0 0 1,482Philadelphia** 105,112 123,572 3,499 0 0 8,529 240,712Pittsburgh** 34,721 22,434 1,905 0 0 3,291 62,351Pottstown* 1,431 0 0 0 0 0 1,431Reading* 3,728 0 282 0 0 425 4,435Scranton/Wilkes-Barre* 5,009 0 449 0 0 568 6,026Sharon* 725 0 51 0 0 74 850State College* 3,389 0 0 0 0 0 3,389Uniontown-Connellsville* 1,260 0 0 0 0 0 1,260Williamsport* 2,579 0 0 0 0 0 2,579York* 3,326 0 243 0 0 383 3,952
Large Urban 6,601 3,903 0 0 0 0 10,504Small Urban 1,656 0 2,224 0 0 1,888 5,768
Large or Small Urban 0 11,785 0 0 0 3,500 15,285Non Urbanized 0 0 2,486 21,578 0 0 24,064Intercity Bus 0 0 0 3,808 0 0 3,808
Appalachian Counties 0 0 0 0 4,788 0 4,788TOTALS 200,423 161,708 12,733 25,386 4,788 20,700 425,738
Date prepared: 5/25/2021
FFY 2025
* Systems that can use a portion of their federal 5307 funds for operating assistance+These funds can be used for operating, capital or technical assistance
** Systems are not able to use their federal section 5307 funds for operating assistance
40
85
DRAFT

Appendix 7 Financial Guidance
Federal Transit Funding 2023-2026 ($000)
Federal Transit
Urban Area Urbanized Area (5307 & 5340)
5337 (State of Good Repair) 5310 5311+ Appalachian
Funds+5339 (Bus and Bus Facilities) Total
Allentown-Bethlehem* 7,602 0 700 0 0 925 9,227Altoona* 1,316 0 0 0 0 0 1,316East Stroudsburg* 1,222 0 0 0 0 0 1,222Erie* 4,261 0 0 0 0 0 4,261Harrisburg* 5,534 0 457 0 0 582 6,573Hanover* 1,000 0 0 0 0 0 1,000Hazleton* 886 0 0 0 0 0 886Johnstown* 1,612 14 0 0 0 0 1,626Lancaster* 4,823 0 437 0 0 535 5,795Lebanon* 1,148 0 0 0 0 0 1,148Monessen* 1,482 0 0 0 0 0 1,482Philadelphia** 105,112 123,572 3,499 0 0 8,529 240,712Pittsburgh** 34,721 22,434 1,905 0 0 3,291 62,351Pottstown* 1,431 0 0 0 0 0 1,431Reading* 3,728 0 282 0 0 425 4,435Scranton/Wilkes-Barre* 5,009 0 449 0 0 568 6,026Sharon* 725 0 51 0 0 74 850State College* 3,389 0 0 0 0 0 3,389Uniontown-Connellsville* 1,260 0 0 0 0 0 1,260Williamsport* 2,579 0 0 0 0 0 2,579York* 3,326 0 243 0 0 383 3,952
Large Urban 6,601 3,903 0 0 0 0 10,504Small Urban 1,656 0 2,224 0 0 1,888 5,768
Large or Small Urban 0 11,785 0 0 0 3,500 15,285Non Urbanized 0 0 2,486 21,578 0 0 24,064Intercity Bus 0 0 0 3,808 0 0 3,808
Appalachian Counties 0 0 0 0 4,788 0 4,788TOTALS 200,423 161,708 12,733 25,386 4,788 20,700 425,738
Date prepared: 5/25/2021
FFY 2026
+These funds can be used for operating, capital or technical assistance* Systems that can use a portion of their federal 5307 funds for operating assistance** Systems are not able to use their federal section 5307 funds for operating assistance
41
86
DRAFT

Appendix 7 Financial Guidance
Federal Transit Funding 2023-2026 ($000)
Federal Transit
Urban Area Urbanized Area (5307 & 5340)
5337 (State of Good Repair) 5310 5311+ Appalachian
Funds+5339 (Bus and Bus Facilities) Total
Allentown-Bethlehem* 30,408 0 2,800 0 0 3,700 36,908Altoona* 5,264 0 0 0 0 0 5,264East Stroudsburg* 4,888 0 0 0 0 0 4,888Erie* 17,044 0 0 0 0 0 17,044Harrisburg* 22,136 0 1,828 0 0 2,328 26,292Hanover* 4,000 0 0 0 0 0 4,000Hazleton* 3,544 0 0 0 0 0 3,544Johnstown* 6,448 56 0 0 0 0 6,504Lancaster* 19,292 0 1,748 0 0 2,140 23,180Lebanon* 4,592 0 0 0 0 0 4,592Monessen* 5,928 0 0 0 0 0 5,928Philadelphia** 420,448 494,288 13,996 0 0 34,116 962,848Pittsburgh** 138,884 89,736 7,620 0 0 13,164 249,404Pottstown* 5,724 0 0 0 0 0 5,724Reading* 14,912 0 1,128 0 0 1,700 17,740Scranton/Wilkes-Barre* 20,036 0 1,796 0 0 2,272 24,104Sharon* 2,900 0 206 0 0 296 3,402State College* 13,556 0 0 0 0 0 13,556Uniontown-Connellsville* 5,040 0 0 0 0 0 5,040Williamsport* 10,316 0 0 0 0 0 10,316York* 13,304 0 972 0 0 1,532 15,808
Large Urban 26,404 15,612 0 0 0 0 42,016Small Urban 6,624 0 8,896 0 0 7,552 23,072
Large or Small Urban 0 47,140 0 0 0 14,000 61,140Non Urbanized 0 0 9,944 86,312 0 0 96,256Intercity Bus 0 0 0 15,232 0 0 15,232
Appalachian Counties 0 0 0 0 19,152 0 19,152TOTALS 801,692 646,832 50,934 101,544 19,152 82,800 1,702,954
Date prepared: 5/25/2021
Total FFY 2023 - FFY 2026
+These funds can be used for operating, capital or technical assistance* Systems that can use a portion of their federal 5307 funds for operating assistance** Systems are not able to use their federal section 5307 funds for operating assistance
42
87
DRAFT

Appendix 82023-2026 Federal and State Transit Funding by Region
($000)
Federal Transit
State Transit Total Federal
TransitState
Transit Total Federal Transit
State Transit Total Federal
TransitState
Transit Total Federal Transit
State Transit Total
DVRPC 242,143 1,108,227 1,350,370 242,143 1,113,487 1,355,630 242,143 1,117,717 1,359,860 242,143 1,117,297 1,359,440 968,572 4,456,728 5,425,300SPC 65,093 407,564 472,657 65,093 409,274 474,367 65,093 410,654 475,747 65,093 410,514 475,607 260,372 1,638,006 1,898,378Harrisburg 6,573 10,817 17,390 6,573 10,817 17,390 6,573 10,817 17,390 6,573 10,817 17,390 26,292 43,268 69,560Scranton/WB 6,912 18,803 25,715 6,912 18,803 25,715 6,912 18,803 25,715 6,912 18,803 25,715 27,648 75,212 102,860Lehigh Valley 9,227 22,713 31,940 9,227 22,713 31,940 9,227 22,713 31,940 9,227 22,713 31,940 36,908 90,852 127,760NEPA 1,222 7,633 8,855 1,222 7,633 8,855 1,222 7,633 8,855 1,222 7,633 8,855 4,888 30,532 35,420SEDA-COG 0 772 772 0 772 772 0 772 772 0 772 772 0 3,088 3,088Altoona 1,316 4,472 5,788 1,316 4,472 5,788 1,316 4,472 5,788 1,316 4,472 5,788 5,264 17,888 23,152Johnstown 1,626 8,448 10,074 1,626 8,448 10,074 1,626 8,448 10,074 1,626 8,448 10,074 6,504 33,792 40,296Centre County 3,389 8,577 11,966 3,389 8,577 11,966 3,389 8,577 11,966 3,389 8,577 11,966 13,556 34,308 47,864Williamsport 2,579 5,658 8,237 2,579 5,658 8,237 2,579 5,658 8,237 2,579 5,658 8,237 10,316 22,632 32,948Erie 4,261 12,098 16,359 4,261 12,098 16,359 4,261 12,098 16,359 4,261 12,098 16,359 17,044 48,392 65,436Lancaster 5,795 0 5,795 5,795 0 5,795 5,795 0 5,795 5,795 0 5,795 23,180 0 23,180York 4,952 0 4,952 4,952 0 4,952 4,952 0 4,952 4,952 0 4,952 19,808 0 19,808Reading 4,435 0 4,435 4,435 0 4,435 4,435 0 4,435 4,435 0 4,435 17,740 0 17,740Lebanon 1,148 2,738 3,886 1,148 2,738 3,886 1,148 2,738 3,886 1,148 2,738 3,886 4,592 10,952 15,544Mercer 850 1,831 2,681 850 1,831 2,681 850 1,831 2,681 850 1,831 2,681 3,402 7,324 10,726Adams 0 0 0 0 0 0 0 0 0 0 0 0 0 0 0Franklin 0 0 0 0 0 0 0 0 0 0 0 0 0 0 0Total Urban 361,521 1,620,351 1,981,872 361,521 1,627,321 1,988,842 361,521 1,632,931 1,994,452 361,521 1,632,371 1,993,892 1,446,086 6,512,974 7,959,060Northwest 0 4,384 4,384 0 4,384 4,384 0 4,384 4,384 0 4,384 4,384 0 17,536 17,536N. Central 0 6,454 6,454 0 6,454 6,454 0 6,454 6,454 0 6,454 6,454 0 25,816 25,816N. Tier 0 3,252 3,252 0 3,252 3,252 0 3,252 3,252 0 3,252 3,252 0 13,008 13,008S. Alleghenies 0 1,408 1,408 0 1,408 1,408 0 1,408 1,408 0 1,408 1,408 0 5,632 5,632Wayne County 0 1,147 1,147 0 1,147 1,147 0 1,147 1,147 0 1,147 1,147 0 4,588 4,588Total Rural 0 16,645 16,645 0 16,645 16,645 0 16,645 16,645 0 16,645 16,645 0 66,580 66,580Unallocated 64,217 97,276 161,493 64,217 126,634 190,851 64,217 156,500 220,717 64,217 186,203 250,420 256,868 566,613 823,481Multiple -- SCTA* 0 22,277 22,277 0 22,277 22,277 0 22,277 22,277 0 22,277 22,277 0 89,108 89,108Multiple -- CPTA* 0 13,320 13,320 0 13,320 13,320 0 13,320 13,320 0 13,320 13,320 0 53,280 53,280Grand Total 425,738 1,769,869 2,195,608 425,738 1,806,197 2,231,935 425,738 1,841,673 2,267,412 425,738 1,870,816 2,296,554 1,702,954 7,288,555 8,991,509
* Operating assistance for Central Pennsylvania Transportation Authority is shared amongst Adams, SEDA-COG, Harrisburg, Franklin and York MPOs* Operating Assistance for South Central Transit is shared by the Lancaster and Reading MPOs
TOTAL
* Section 5311 Federal Funding is discretionary and based on annual approval of budget deficits up to total amount appropriated for Pennsylvania.
2026Region
2023 2024 2025
43
88
DRAFT

June 29, 2021
PENNSYLVANIA’S 2023 TRANSPORTATION PROGRAM GENERAL AND PROCEDURAL
GUIDANCE
Appendix 3 - General and Procedural Guidance
89
DRAFT

2023 Transportation Program General and Procedural Guidance
INTRODUCTION ............................................................................................................................................. 1 REQUIREMENTS ............................................................................................................................................ 2
Public Participation ................................................................................................................................. 4 Title VI ..................................................................................................................................................... 5 Tribal Consultation ................................................................................................................................. 6 Self-Certification ..................................................................................................................................... 6 Project Selection ..................................................................................................................................... 7 PennDOT Connects ................................................................................................................................. 8 Long Range Transportation Plans ........................................................................................................... 9 Transportation Performance Management ......................................................................................... 10 Safety .................................................................................................................................................... 13 Pavement and Bridge Asset Management ........................................................................................... 16 System Performance ............................................................................................................................ 19 Transportation Systems Management and Operations ....................................................................... 20 The National Highway Freight Program ............................................................................................... 22 Congestion Mitigation and Air Quality Program .................................................................................. 22 Congestion Management Process ........................................................................................................ 25 Environmental Justice .......................................................................................................................... 26 Transit ................................................................................................................................................... 27
FISCAL CONSTRAINT .................................................................................................................................... 28 Line Items ............................................................................................................................................. 29 Programming ........................................................................................................................................ 29
AIR QUALITY CONFORMITY ......................................................................................................................... 30 STATEWIDE PROGRAMS.............................................................................................................................. 33
Interstate Program ............................................................................................................................... 33 Railway-Highway Crossings Program ................................................................................................... 34 Transportation Alternatives Set-Aside ................................................................................................. 34 Spike Funding ....................................................................................................................................... 35
PUBLIC COMMENT ...................................................................................................................................... 35 TIP SUBMISSION .......................................................................................................................................... 37 PROGRAM ADMINISTRATION ..................................................................................................................... 38 APPENDICES
Appendix 1 – 2023 Transportation Program Development Schedule.................................................. 40 Appendix 2 – PennDOT Design Manual 1A (Process Chart) ................................................................. 42 Appendix 3 – TIP Submission Checklist ................................................................................................ 43
90
DRAFT

2023 Transportation Program General and Procedural Guidance
INTRODUCTION
The purpose of this General and Procedural Guidance document is to meet federal and state requirements for the development and documentation of the Pennsylvania 2023-2026 Statewide Transportation Improvement Program (STIP) and the regional Transportation Improvement Programs (TIPs). This includes, but is not limited to, 23 USC Section 134, 23 USC Section 135, 23 CFR 450.200, 23 CFR 450.300, and 23 CFR 490, as well as PA Consolidated Statute (CS) Title 74 and PA Code Title 67. As referenced in the Pennsylvania FFY 2021-2024 STIP Federal Planning Finding, these regulations guide the development process of the 2023 Transportation Program within the context of multiple inter-related, intergovernmental planning functions. The Moving Ahead for Progress in the 21st Century (MAP-21) Act required the use of a performance-based approach to transportation planning which was continued under the Fixing America’s Surface Transportation (FAST) Act. Performance-Based Planning and Programming (PBPP) refers to the application of performance management within the planning and programming process to achieve the desired performance outcomes for Pennsylvania’s transportation system.
The Pennsylvania Department of Transportation (PennDOT) undertakes these activities together with other agencies, stakeholders, and the public to ensure that transportation investment decisions align with established targets and goals. These activities are carried out as part of a cooperative, continuing, and comprehensive (3C) planning process which guides the development of many PBPP documents, including:
• Statewide and Regional Long Range Transportation Plans (LRTPs)• 12-Year Transportation Program (TYP)• State Transportation Improvement Program (STIP)• Regional Transportation Improvement Programs (TIPs)• Transportation Asset Management Plan (TAMP)• Transit Asset Management (TAM) Plans• Pennsylvania Strategic Highway Safety Plan (SHSP)• Comprehensive Freight Movement Plan (CFMP)• Congestion Mitigation and Air Quality (CMAQ) Performance Plan(s)• Congestion Management Process (CMP)
This guidance document is a collaborative product jointly developed by PennDOT [PennDOT Executives, the Center for Program Development and Management (CPDM), Bureau of Maintenance and Operations (BOMO), Bureau of Project Delivery (BPD), Bureau of Public Transportation (BPT), Bureau of Equal Opportunity (BEO), and Engineering Districts], the Metropolitan Planning Organizations (MPOs) and Rural Planning Organizations (RPOs), and Federal Partners, including the Federal Highway Administration (FHWA) and Federal Transit Administration (FTA).
This guidance reflects the performance-based planning approach to transportation planning, underscores the importance of the 3C process and identifies opportunities for collaboration. This guidance also lays out requirements for the documentation of the TIP development process and describes how project selection and prioritization will support Transportation Performance Management (TPM). With these changes, the regional TIPs will continue to evolve into more narrative-based planning documents, similar to the regional LRTPs.
191
DRAFT

2023 Transportation Program General and Procedural Guidance
This document will oversee the development process of the 2023 Transportation Program (STIP, TIPs, and TYP) and demonstrate the implementation of the TAMP. The transportation planning process is by its very nature fluid and subject to change. By working closely together, PennDOT, the MPOs/RPOs, and FHWA/FTA will strive to continuously improve the program development process. Therefore, this guidance document will be updated every two years to reflect changes in state or federal legislation, regulation, or policy. This document includes numerous hyperlinks that support program development.
REQUIREMENTS
This guidance document provides references and links included in the text as support tools that users may find helpful in developing a broader understanding of the program development process.
The planning context for program development is a complex process that involves multiple elements, including planning and programming rules and regulations, transportation plans, data systems, and other programs that support and inform the program development process. To help understand the complex planning requirements for all stakeholders, PennDOT, in cooperation with the MPOs/RPOs and FHWA/FTA, developed the Guidebook for Pennsylvania’s MPOs and RPOs. This guidebook provides a core source of information for planning and programming in Pennsylvania, including an initial documentation of roles, responsibilities, and requirements.
The initial part of the program development process is the update of the Financial Guidance and General and Procedural Guidance documents. Representation from PennDOT Central Office, PennDOT Districts, the MPOs/RPOs, and FHWA/FTA participate in work groups to update these documents. These two documents are the foundation of the program update process. The 2023 Transportation Program development schedule is available in Appendix 1.
PA Act 120 of 1970, enacted from Senate Bill 408, created PennDOT and the State Transportation Commission (STC). The STC is a 15-member body, chaired by the Pennsylvania Secretary of Transportation, which serves as the Board of Directors to PennDOT. The STC provides policy driven direction with respect to the development of Pennsylvania’s TYP. PennDOT and STC work together with the MPOs/RPOs to develop several transportation planning documents, including the TYP. To satisfy the requirements of Act 120, PennDOT must prepare, update, and submit Pennsylvania’s TYP to the STC for approval every two years.
The TYP is the Commonwealth’s official transportation program and is a multimodal, fiscally constrained program of transportation improvements spanning a 12-year period. The TYP is divided into three four-year periods, with the first four years corresponding to the STIP and the regional TIPs. The TYP must be consistent with federal programming documents, such as the statewide and regional LRTPs.
12-Year Program Cycle for Federal Fiscal Year (FFY) 2023-2034FFY
2023 FFY
2024 FFY
2025 FFY
2026 FFY
2027 FFY
2028 FFY
2029 FFY
2030 FFY
2031 FFY
2032 FFY
2033 FFY
2034 1st Four Years (STIP/TIPs) 2nd Four Years 3rd Four Years
TYP TAMP
292
DRAFT

2023 Transportation Program General and Procedural Guidance
Pennsylvania is required under 49 USC 5304(g) and 23 USC 135(g) to develop a STIP. Pennsylvania’s STIP is a fiscally constrained four-year program of highway, bridge, and transit projects. The STIP is developed in cooperation with the MPOs/RPOs and public transportation agencies in the state and is consistent with the regional TIPs. The transportation projects on the STIP are consistent with the statewide and regional LRTPs. All projects that use Federal-aid funds must be listed in the STIP.
The STIP is the entire transportation program for the Commonwealth, which includes the Interstate and Statewide programs as well as the regional TIPs:
The Pennsylvania STIP is comprised of 26 individual TIPs: • MPO TIPs (19)• RPO TIPs (4)• Independent County TIP (1)• Statewide Items TIP (1)• Interstate Management (IM) Program TIP (1)
PennDOT is responsible for statewide planning, while the MPOs/RPOs are responsible for transportation planning in their regions. Federal planning requirements 49 USC 5303(j) and 23 USC 134(j) require each MPO to develop a TIP at the local level. In Pennsylvania, the TIP is the first four years of the TYP. PennDOT has developed agreements with RPOs that position them as equals to MPOs. Therefore, in Pennsylvania, RPOs are held to the same requirements as MPOs with regards to the planning and programming process, which includes the development of individual TIPs, Statewide Items TIP, and Interstate Management (IM) Program TIP. PennDOT takes the lead in developing the independent county TIP. Each MPO/RPO TIP is a fiscally constrained program of upcoming transportation projects that reflect regional and local priorities over the next four years. Federal law requires TIPs to be updated at least every four years. In Pennsylvania the STIP/TIPs are updated every two years during the TYP process, based on the requirements of Act 120.
Within Pennsylvania, the characteristics of the PennDOT Engineering Districts and MPOs/RPOs vary greatly, between the land area and population of the region, the number of transportation resources present, and the staff available to support operations. PennDOT, the MPOs/RPOs, transit agencies, and FHWA/FTA recognize this and agree to work cooperatively to meet the federal and state program requirements.
The STIP and MPO/RPO TIPs are developed based upon mutual trust, data sharing, open communication and coordination at each program development step, which results in a consensus between PennDOT, the MPOs/RPOs, FHWA/FTA, and other interested stakeholders regarding the most effective use of
393
DRAFT

2023 Transportation Program General and Procedural Guidance
limited transportation resources. To kick off this process, PennDOT and FHWA/FTA recommend that MPOs/RPOs and PennDOT Engineering Districts schedule an early coordination meeting at the beginning of the TIP development process to discuss and agree upon roles and responsibilities, overall schedule, and key deadlines. PennDOT CPDM liaisons and FHWA/FTA planning staff are available to participate and assist, as needed. PennDOT and FHWA/FTA have developed a new coordination worksheet to aid this discussion. The worksheet can be found in the 2023 General and Procedural Guidance Support Documents folder in SharePoint.
Each MPO/RPO, in coordination with their PennDOT CPDM representatives and their PennDOT District(s), will document the process used for regional TIP development. This documentation should include the project selection process, a description of the anticipated effect of the TIP toward achieving the performance targets, the individual roles and responsibilities of the MPO/RPO, PennDOT District(s) and Central Office, and a timeline. Examples can be found in the 2023 General and Procedural Guidance Support Documents folder in SharePoint.
The project selection documentation described above is integral to the process and should be submitted in draft form with the draft list of projects in accordance with the 2023 Transportation Program development schedule available in Appendix 1. This will allow for early coordination with PennDOT Districts, CPDM, FHWA, and FTA for review and feedback prior to the draft TIP public comment period.
Public Participation
Public outreach is a key component of updating the Program. The release of the 2021 Transportation Performance Report (TPR) by the STC on February 18, 2021 was the official start of the 2023 Program update process in Pennsylvania. PennDOT, the STC and the MPOs/RPOs welcomed the public to review the TPR prior to providing input and feedback on transportation priorities to help identify projects for the 2023 Program. The 2023 TYP update open public comment period took place from March 1 to April 14, 2021. During this comment period, the public was encouraged to take an online transportation survey to share their transportation priorities and concerns on STC’s Public Outreach page and attend an Online Public Meeting hosted by the Secretary of Transportation, who is also STC Chair. During the Public Meeting, the findings of the 2021 TPR were presented and the public was given the opportunity to ask questions.
To increase public participation and gather as much feedback as possible, PennDOT, the STC and the MPOs/RPOs reinforced this public outreach effort by informing stakeholders and the public about the Transportation Survey and encouraging participation through both social and traditional media.
The public feedback collected through the transportation survey will be used to shape the 2023 TYP as well as the 2045 LRTP and the CFMP. Feedback was also shared with the BPT, Districts and MPOs/RPOs, who will consider these results in their project selection process for the TIP. The same process is utilized for the respective regional portions of the Program. STC’s How It Works describes how PennDOT, the STC and the Transportation Advisory Committee (TAC) use a variety of tools including programs, plans and reports to complete the TYP Update Planning Process.
An integral part of the program development process involves meaningful public outreach and involvement. A Public Participation Plan (PPP) is a key element to ensure that all transportation related
494
DRAFT

2023 Transportation Program General and Procedural Guidance
activities are communicated and involve all members of the public, including traditionally underserved and protected populations. PennDOT Central Office, in coordination with the MPOs/RPOs and FHWA/FTA, develops and utilizes a Statewide PPP in accordance with 23 CFR 450.210.
FHWA provides guidance to the MPOs/RPOs regarding public involvement requirements. The MPOs/RPOs are responsible for developing their own regional PPPs that outline the processes by which they ensure adequate involvement and input from various stakeholders, including elected officials, transportation agencies and service providers, businesses, special interest groups, disadvantaged populations, and the public. The MPOs/RPOs must post their own regional PPPs on their respective websites. The MPO/RPO PPPs must specifically identify how the MPOs/RPOs will notify the public of meetings, ensure access to meetings, and demonstrate how they will consider and respond to public input.
Title VI
As a recipient of federal funding, MPOs and RPOs must be in compliance with Title VI as outlined in the Code of Federal Regulations (CFR) 49 CFR § 21 (Nondiscrimination In Federally-Assisted Programs Of The Department Of Transportation - Effectuation Of Title VI Of The Civil Rights Act Of 1964) and the FTA Circular 4702.1B (Title VI Requirements and Guidelines for Federal Transit Administration Recipients). The FTA Circular 4702.1B requires that MPOs/RPOs (sub-recipients of federal funds) document their compliance by creating and submitting an approved Title VI Program document to PennDOT (the primary recipient). MPOs and RPOs should continue to coordinate with PennDOT through the Bureau of Equal Opportunity (BEO), Bureau of Public Transportation (BPT), and CPDM as well as with FTA and FHWA, as needed, for guidance, resources, and assistance in maintaining compliance. Recently, FTA Region III shared resources on the FTA Circular 4702.1B requirements for MPOs/RPOs along with a document of PennDOT’s efforts to meet these requirements. To learn more about Title VI and the overarching requirements of this and related statutes and authorities, please refer to PennDOT’s Title VI webpage which addresses the full scope of the Department’s civil rights obligations. Resources referenced above are available in the Title VI folder on SharePoint.
Planning processes must comply with Title VI of the Civil Rights Act of 1964 that prohibits exclusion from participation in, denial of the benefits of, and discrimination under federally assisted programs on grounds of race, color, or national origin. Furthermore, PennDOT must comply with other federal and Commonwealth statutes and authorities that prohibit discrimination based on an individual or group’s sex, age, religious creed, and/or disability. PennDOT’s Title VI Compliance and Implementation Plan defines the policies and procedures by which the Department administers its Title VI activities and ensures its programs comply with Title VI requirements both within PennDOT and among its federal-aid sub-recipients.
PennDOT BEO, in coordination with PennDOT CPDM and FHWA, has crafted a template that can be used by the MPOs/RPOs as a general Title VI policy statement and complaint procedural notice. MPOs/RPOs that already maintain a Title VI Policy statement that addresses the principle points articulated in this template may maintain their existing statements or choose to modify this template to meet their organizational needs. Any Title VI statement should include the organization’s name and Title VI Coordinator contact information. The Title VI Coordinator should be fully versed in the organization’s
595
DRAFT

2023 Transportation Program General and Procedural Guidance
complaint and accommodation procedures and designated as the point of contact for public concerns and requests.
It is recommended that this Title VI template or a comparable statement be applied as an appendix or preface to the TIP document that is made available for public comment. Additionally, it is recommended to apply this template or a comparable statement to other publicly facing documents and communications, including the MPO/RPO PPP and respective websites.
Tribal Consultation
Although there are no areas in Pennsylvania currently under the jurisdiction of Tribal governments, PennDOT recognizes the importance of tribal consultation and considers federally recognized Tribes and Nations to be interested parties. Therefore, PennDOT and MPOs/RPOs shall consult with federally recognized Tribes and Nations that have regions of interests in Pennsylvania to provide opportunities for review and comment on key planning documents, such as the TIP, LRTP, and PPP. For the 2023 TIP update, this includes notifying Tribes and Nations of the opportunity to participate in any TIP public meetings and review the draft TIP during the public comment period. However, this effort to consult with individual Tribes and Nations needs to be a separate public involvement effort that occurs during the public comment period. The consultation letter to inform the Tribes and Nations of the public involvement opportunity should be specific and tailored to the individual Tribe or Nation that maintains an area of interest within the boundaries of each respective planning partner and should not be included in mass email alerts/notices to the general public. Because of the importance of government-to-government consultation with Tribes and Nations, the letter should come directly from PennDOT or the MPO/RPO staff and cannot be sent by a consultant.
Please note that some of the Tribes and Nations accept email correspondence while others may require a paper copy of documents. For the Tribes and Nations that require paper copies, please include a printed version of the TIP with the consultation letter to reduce any barriers to participation, and freedom for review, and comment. A list of federally-recognized Tribes and Nations contacts as well as a sample coordination letter are available in the Tribal Coordination folder in SharePoint.
Self-Certification
All Pennsylvania’s MPOs are required by 23 CFR 450.336(a) to complete self-certification resolutions concurrent with their TIP updates, which state that the metropolitan transportation planning process is being carried out in accordance with all applicable requirements. These self-certification resolutions are part of the TIP submission documentation sent to PennDOT CPDM. Non-TMA MPOs, metropolitan areas with populations less than 200,000 as deemed by the US Census, and RPOs must include documentation to indicate compliance as part of their TIP submissions. MPOs that are in Transportation Management Areas (TMAs), metropolitan areas with populations exceeding 200,000 as deemed by the US Census, are required to have Federal certification reviews performed by FHWA/FTA every four years, in accordance with 23 CFR 450.336(b). Based on the higher level of oversight by FHWA/FTA, the TMA MPOs aren’t asked to provide the additional compliance documents because those materials are reviewed as part of the Federal certification review process. The regulatory requirements and citations to include in the Self-Certification resolution can be found at 23 CFR 450.336. Examples of self-certification resolutions
696
DRAFT

2023 Transportation Program General and Procedural Guidance
and documentation can be found in the 2023 General and Procedural Guidance Support Documents folder in SharePoint.
Project Selection
To the maximum extent practicable, project selection, evaluation, and prioritization should be a clear and transparent process. To kick off this process, PennDOT and FHWA/FTA recommend that MPOs/RPOs and PennDOT Districts schedule an early coordination meeting at the beginning of the TIP development process to discuss and agree upon roles and responsibilities, overall schedule, and key deadlines. PennDOT CPDM liaisons and FHWA/FTA planning staff are available to participate and assist, as needed. PennDOT and FHWA/FTA have developed a new coordination worksheet to aid this discussion. The worksheet can be found in the 2023 General and Procedural Guidance Support Documents folder in SharePoint.
PennDOT District and CPDM staff will work with the MPOs/RPOs to document the project identification, prioritization, and selection process used for the highway/bridge portion of the Program. The MPOs/RPOs will work with public transit agencies in their regions to document the project identification, prioritization, and selection process used for the public transit portion of the Program. These project selection processes will vary by District, MPO/RPO, and public transit agency, but should reflect the key elements established in this guidance, be documented in the regional TIP development process mentioned above, and be included as part of the MPO/RPO TIP submissions. A draft version of the regional project selection documentation should be submitted to PennDOT CPDM with the draft list of projects in accordance with the 2023 Transportation Program development schedule available in Appendix 1. This will allow for early coordination with PennDOT Districts, CPDM, FHWA, and FTA for review and feedback prior to the draft TIP public comment period.
PennDOT District and MPO/RPO staff will work together to identify candidate projects for the highway/bridge portion of the 2023 Program. Initial focus should be placed on carryover projects which must be carried forward onto the 2023 Program from a previous Program. These include:
• Projects that are still advancing through the project delivery process• Projects with unforeseen cost increases• Projects with anticipated Advance Construct (AC) conversions
Highway/bridge carryover project scopes, costs, and schedules will be reviewed and updated based on information obtained through project management and from local input/outreach sources such as the STC Public Survey, MPO/RPO public involvement, PennDOT Connects (PennDOT’s municipal outreach policy), and Environmental Justice analysis. PennDOT Districts must ensure that timely and accurate project information is input into PennDOT’s Multimodal Project Management System (MPMS) and share this information with the MPOs/RPOs and PennDOT CPDM. Project public narratives and MPMS data entry should follow Pub 227 and strike-off letters available in the 2023 General and Procedural Guidance Support Documents folder in SharePoint.
Clear and understandable project descriptions guarantee that details including the location and scope of work are easily understood by the public and will even reduce potential confusion during TIP Negotiations, Air Quality Conformity, federal funds eligibility review, and funds obligation. As the project
797
DRAFT

2023 Transportation Program General and Procedural Guidance
progresses, it is important to update the project description to reflect changes in scope and/or alternatives analysis.
PennDOT District staff and MPO/RPO staff should then cooperatively meet to evaluate highway/bridge project ideas or additional needs that have been identified through the TPM process and informed by the TAMP, transportation performance measures, the statewide and regional LRTPs, and the local input/outreach sources mentioned above. PennDOT CPDM will ensure that adequate coordination meetings are occurring and appropriately documented for the STIP/TIP submission.
The MPO/RPO’s in consultation with the Engineering Districts, should consider cross asset optimization of these multiple project focus areas when considering whether or not to adopt the statewide targets that have been established. Tools like OneMap and other GIS based applications may be utilized to assist with analyzing these various performance areas.
Based upon this continued coordination throughout the TIP development process, PennDOT District staff will create project scopes, costs, and schedules in MPMS for the mutually agreed-upon new projects. To allow for open discussion and collaboration, cooperative discussions about candidate projects under consideration should occur between the MPOs/RPOs and the Districts prior to preparation of a fiscally constrained project list.
PennDOT Connects
Overarching guidance for PennDOT’s project development and delivery process is provided by Design Manual Part 1A (DM1A). It provides guidance on the collection, validation, sharing and documentation of the information necessary to advance a project. As detailed in DM1A, new projects must follow the PennDOT Connects collaborative planning process approach in Appendix 2. The local government outreach and collaboration achieved through the PennDOT Connects policy leads to positive outcomes, including clearer scopes of work and more accurate schedules and budgets when projects are programmed. This information is carried forward into the scoping and environmental review processes. PennDOT Connects collaboration may occur throughout the planning process. However, PennDOT Connects Project Initiation Forms (PIFs) should be completed for new TIP projects prior to programming. Additional guidance is currently being developed to address PennDOT Connects scalability for projects funded outside of Financial Guidance.
PennDOT Connects identifies community needs and contextual concerns early in project planning through a collaborative process. It is also a mechanism where PennDOT and the MPOs/RPOs can hold discussions on emerging topics like Environmental Justice in the state’s transportation programs. PennDOT and the MPO/RPOs coordinate with local governments to identify opportunities to incorporate community-related features into potential projects prior to adding those projects to the Program. However, this is only the beginning of the PennDOT Connects collaborative approach. While community-focused project features are identified in planning, it is often not until the Preliminary Engineering (PE) process is conducted that a determination can be made on whether these features can reasonably be incorporated into the project. Issues such as environmental impacts and other design considerations, such as right-of-way and utilities, are all considerations that factor into decision-making entering the final design of a project. Local governments must be kept informed throughout the decision-making processes involved in project development and delivery.
898
DRAFT

2023 Transportation Program General and Procedural Guidance
The identification and consideration of cultural resources is one aspect of PennDOT Connects collaboration that can be particularly valuable. “Cultural resources” is a term that is typically used synonymously with the term “historic properties”, which are defined in the National Historic Preservation Act of 1966 (NHPA) (54 USC § 300308) as buildings, sites, districts, structures and objects included in, or eligible for inclusion in, the National Register of Historic Places. Section 106 of the NHPA requires that federal agencies consider the effects of their actions on historic properties following the Advisory Council on Historic Preservation’s implementing regulations at 36 CFR 800. Identifying historic properties present, or likely present, in a project area during project planning provides the best means for protecting and preserving cultural properties important to Pennsylvania’s communities and benefits the efficiency and utility of the Section 106 process. As part of the PennDOT Connects process, the MPOs/RPOs and PennDOT Districts should discuss if cultural resources are present, or likely present, in the project area. Collaboration with the State Historic Preservation Officer (SHPO) and/or the PennDOT District Cultural Resource Professionals (District archaeologist and District architectural historian) may also inform the process. Pennsylvania’s Statewide Historic Preservation Plan for 2018-2023 outlines a five-year plan for collaboration on historic preservation that should be considered as part of project planning.
Long Range Transportation Plans
PA On Track is Pennsylvania’s current LRTP and CFMP. They were developed with the cooperation and input from dozens of state, regional and local transportation agencies. PA On Track sets goal areas that include system preservation, safety, personal and freight mobility, and investment. Pennsylvania’s Statewide LRTP and CFMP are currently being updated for 2045 to meet the federal requirement to update the State Freight Plans every five years.
Pennsylvania MPOs and RPOs are required to have their own regional LRTPs. They are maintained and updated as needed in accordance with the current federal transportation legislation requirements - at least every four years in air quality nonattainment and maintenance areas and at least every five years in attainment areas. PennDOT provides guidance to MPOs/RPOs in the development of regional LRTPs in its Developing Regional Long Range Plans, PennDOT Publication (PUB) 575, which is currently being updated. PennDOT has also created Freight Planning Guidance (PUB 790).
The regional LRTPs are consistent with the goals laid out in the statewide LRTP, are based on extensive public and stakeholder involvement, and include a list of fiscally constrained projects that support
999
DRAFT

2023 Transportation Program General and Procedural Guidance
regional goals and objectives. These projects are prioritized with a strong emphasis on preservation and operating efficiency of the existing infrastructure for all modes to ensure consistency between regional LRTPs, comprehensive plans, and regional TIPs. The MPOs/RPOs shall make their regional LRTPs available on their websites.
Transportation Performance Management
Transportation Performance Management (TPM) requirements are a key component of the project decision making process. TPM planning requirements were established by the Moving Ahead for Progress in the 21st Century (MAP-21) Act and reaffirmed in the Fixing America’s Surface Transportation (FAST) Act. Under these rules, PennDOT and its MPOs/RPOs are required to establish targets related to safety, bridge and pavement condition, air quality, freight movement, public transportation asset management and safety, and the performance of the National Highway System, and to use performance measures to track their progress toward meeting these targets.
Information on TPM rules and other resources on performance management are available on FHWA’s Transportation Performance Management webpage and through FTA’s Performance Based Planning webpage. Additional information on PBPP can be found on FHWA’s Performance Based Planning and Programming Guidebook and is illustrated in the flowchart shown below.
10100
DRAFT

2023 Transportation Program General and Procedural Guidance
The TPM Resource Toolbox has been created to support PennDOT and the MPOs/RPOs with the integration of the federal performance measures in the transportation planning process. The toolbox includes:
• Ability to ask questions for which PennDOT will work to create formal responses• Handouts to provide further guidance in TPM implementation• Examples of noteworthy practices and select case studies• Key contacts and resources• Ways to communicate the TPM measures to the public
PennDOT and the MPOs/RPOs are required to comply with 23 USC 150, which provides strategies for the most efficient investment of Federal transportation funds by refocusing on national transportation goals, increasing the accountability and transparency of the Federal-aid highway program, and improving project decision making through PBPP.
23 CFR 450.314(h) requires PennDOT, MPOs/RPOs, and public transit agencies to create jointly agreed-upon written provisions for how they will cooperatively develop and share information related to five key elements of PBPP:
• Transportation performance data• Selection of performance targets• Reporting of performance targets• Reporting of performance to be used in tracking critical outcomes for each region• Collection of data for the State asset management plan for the National Highway System (NHS)
PennDOT, in cooperation with its MPOs/RPOs, developed the Pennsylvania Transportation Performance Management Performance-Based Planning and Programming Procedures document to serve as Pennsylvania’s jointly-written provisions for the highway/bridge PBPP roles and responsibilities. It also more fully documents the roles for PennDOT and the MPOs/RPOs regarding target setting coordination, data collection, data analysis and reporting. To ensure compliance with 23 CFR 450.314, the MPOs/RPOs have provided written acknowledgement that the Pennsylvania PBPP written provisions were cooperatively developed and agreed-upon with PennDOT.
MAP-21 established three categories of performance measures, which are collectively referred to as the PM1, PM2, and PM3 measures:
• PM1 – measures of safety performance• PM2 – measures for the condition of NHS pavements, Interstate pavements, and bridges
carrying the NHS• PM3 – measures for the performance of the NHS, freight movement on the Interstate, and the
CMAQ Program
The PM1, PM2, and PM3 measures each have multiple targets. Based on the jointly-written provisions, the statewide targets for the above measures were set in coordination between PennDOT and the MPOs/RPOs. Currently, all MPOs/RPOs have adopted PennDOT’s statewide targets. Documentation on the currently approved targets is available on PennDOT’s Transportation Performance Management SharePoint page.
11101
DRAFT

2023 Transportation Program General and Procedural Guidance
Public Transit Agencies are also required by FTA to develop performance targets related to asset management and safety. These targets are discussed in more detail in the Transit section below.
In accordance with 23 CFR 450.218(q), PennDOT CPDM, BPT and BOMO will describe in the STIP documentation how the Statewide Program of projects contributes to the achievement of the performance targets identified in the state performance-based plans, linking investment priorities to those targets. The narrative will document the PBPP objectives, investment strategies, performance measures and targets from the performance-based plans that are being implemented through the Program of projects in the STIP.
Similarly, in accordance with CFR 450.326(d), the MPOs/RPOs, in coordination with PennDOT Districts and transit agencies, will describe in their TIP documentation how their regional programs contribute to the achievement of their performance targets in the regional performance-based plans, again linking investment priorities to those targets. The narratives should document the PBPP objectives, investment strategies, performance measures and targets from the performance-based plans that are being implemented through the program of projects in the MPO/RPO TIPs.
The narrative descriptions in the STIP/TIPs should also include a description of how the other performance-based plans are being implemented through the STIP and TIPs. For example, the narrative should describe how the objectives, investment strategies, performance measures and targets from the PennDOT TAMP, Pennsylvania SHSP, the Highway Safety Improvement Program (HSIP), the Pennsylvania CFMP, TMA CMAQ Performance Plans (see 23 U.S.C. 149(l)), regional CMP plans, transit asset management plans, and other performance-based plans are being implemented through the program of projects in the STIP/TIPs. As part of the regional TIP development process, the MPOs/RPOs and Districts must also document the differences between the PennDOT asset management system treatment and funding level recommendations and their selected projects as part of their TIP submissions. They must also document the coordination with the PennDOT District(s) and Central Office that occurred as part of this decision-making process. This information will be used by PennDOT BOMO AMD to improve future asset management system recommendations.
The narrative should specifically describe these linkages and answer the following questions: • How were the projects included in the STIP/TIPs selected/prioritized?• What is the anticipated effect of the STIP/TIP towards the achievement of the performance
targets?• How are the STIP/TIPs consistent with the other performance-based planning documents?
Documentation of how the TIP supports achievement of the performance targets should be incorporated into the project selection and program development narrative submitted by MPOs/RPOs. This information is critical to the TIP development process and should be submitted to PennDOT CDPM in draft form with the draft list of projects in accordance with the 2023 Transportation Program development schedule available in Appendix 1. This will allow for early coordination with PennDOT Districts, CPDM, FHWA, and FTA for review and feedback prior to the draft TIP public comment. Additional template tools and examples will be made available in the 2023 General and Procedural Guidance Support Documents folder in SharePoint as well as the TPM Resource Toolbox.
12102
DRAFT
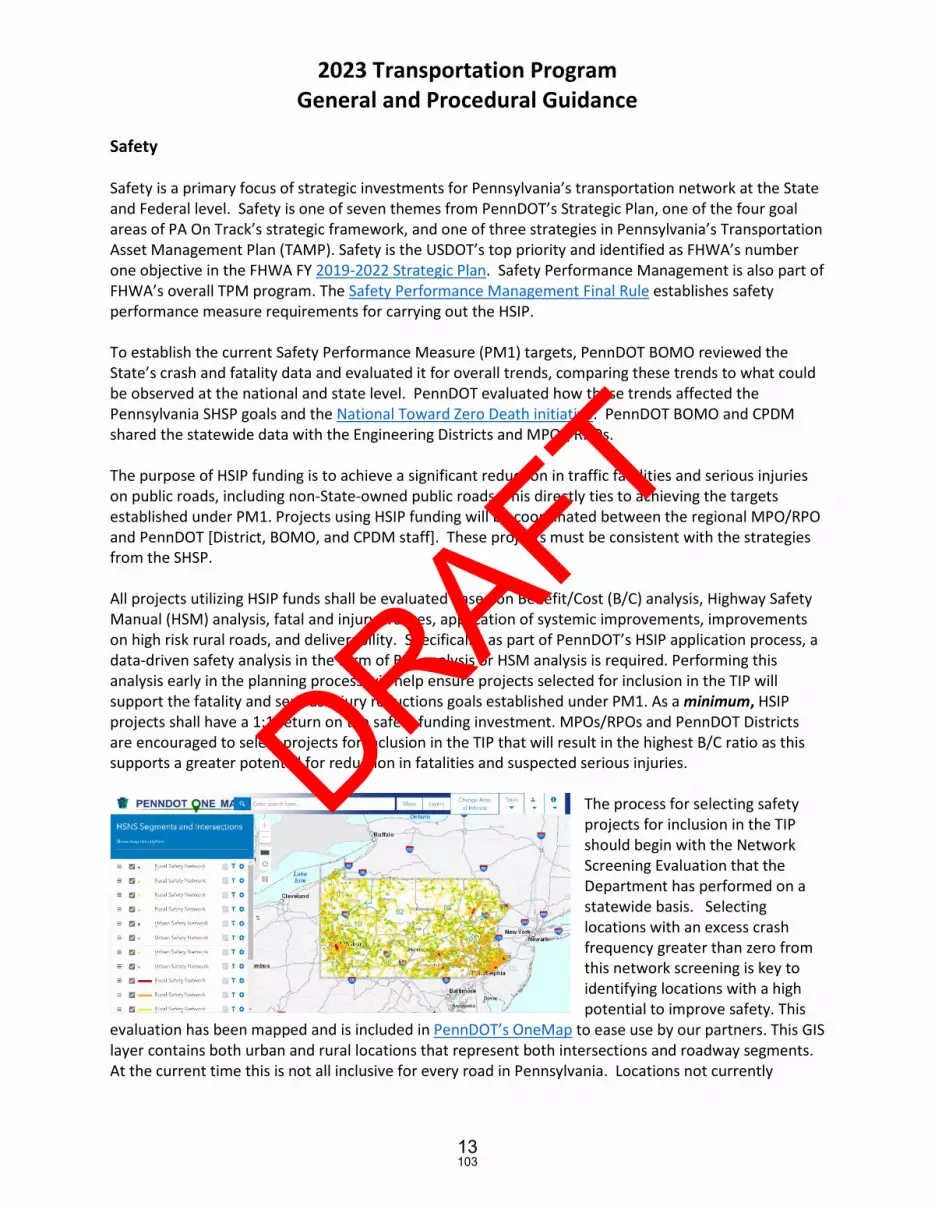
2023 Transportation Program General and Procedural Guidance
Safety
Safety is a primary focus of strategic investments for Pennsylvania’s transportation network at the State and Federal level. Safety is one of seven themes from PennDOT’s Strategic Plan, one of the four goal areas of PA On Track’s strategic framework, and one of three strategies in Pennsylvania’s Transportation Asset Management Plan (TAMP). Safety is the USDOT’s top priority and identified as FHWA’s number one objective in the FHWA FY 2019-2022 Strategic Plan. Safety Performance Management is also part of FHWA’s overall TPM program. The Safety Performance Management Final Rule establishes safety performance measure requirements for carrying out the HSIP.
To establish the current Safety Performance Measure (PM1) targets, PennDOT BOMO reviewed the State’s crash and fatality data and evaluated it for overall trends, comparing these trends to what could be observed at the national and state level. PennDOT evaluated how these trends affected the Pennsylvania SHSP goals and the National Toward Zero Death initiative. PennDOT BOMO and CPDM shared the statewide data with the Engineering Districts and MPOs/RPOs.
The purpose of HSIP funding is to achieve a significant reduction in traffic fatalities and serious injuries on public roads, including non-State-owned public roads. This directly ties to achieving the targets established under PM1. Projects using HSIP funding will be coordinated between the regional MPO/RPO and PennDOT [District, BOMO, and CPDM staff]. These projects must be consistent with the strategies from the SHSP.
All projects utilizing HSIP funds shall be evaluated based on Benefit/Cost (B/C) analysis, Highway Safety Manual (HSM) analysis, fatal and injury crashes, application of systemic improvements, improvements on high risk rural roads, and deliverability. Specifically, as part of PennDOT’s HSIP application process, a data-driven safety analysis in the form of B/C analysis or HSM analysis is required. Performing this analysis early in the planning process will help ensure projects selected for inclusion in the TIP will support the fatality and serious injury reductions goals established under PM1. As a minimum, HSIP projects shall have a 1:1 return on the safety funding investment. MPOs/RPOs and PennDOT Districts are encouraged to select projects for inclusion in the TIP that will result in the highest B/C ratio as this supports a greater potential for reduction in fatalities and suspected serious injuries.
The process for selecting safety projects for inclusion in the TIP should begin with the Network Screening Evaluation that the Department has performed on a statewide basis. Selecting locations with an excess crash frequency greater than zero from this network screening is key to identifying locations with a high potential to improve safety. This
evaluation has been mapped and is included in PennDOT’s OneMap to ease use by our partners. This GIS layer contains both urban and rural locations that represent both intersections and roadway segments. At the current time this is not all inclusive for every road in Pennsylvania. Locations not currently
13103
DRAFT

2023 Transportation Program General and Procedural Guidance
evaluated may be considered by performing the same type of excess crash frequency evaluation the Department utilizes. The difference in the expected number of crashes and predicted number of crashes is computed as an ‘excess crash frequency’. A positive excess crash frequency shows a potential for safety improvement, while a negative excess crash frequency indicates there are fewer expected crashes than predicted. The greater the difference between the expected number of crashes and the predicted number of crashes (excess crash frequency), the greater the potential for safety improvement. If the expected number of crashes is fewer than the predicted number of crashes, the excess crash frequency will be negative, and it is assumed there is little room for safety improvement. Use of the Highway Safety Manual and PUB 638A will assist in performing this evaluation manually.
Locations in OneMap are color coded to easily identify potential safety project locations. The locations identified in yellow, orange, or red have an increasing potential for improving safety with the red locations having the greatest opportunity to improve safety. Locations in green are locations that are already performing safely statistically and are included so that partners understand that there may be limited improvement of safety by selecting one of these locations for inclusion on the TIP.
Once safety candidate location(s) have been prioritized for further analysis using the network screening, an assessment of the type of project that needs to be done to address the safety needs should be performed. This analysis must be performed so that project delivery and funding level considerations can be factored into TIP development. Through crash data, the MPO/RPO’s and
Engineering Districts can get an idea of whether the safety needs can be addressed by using proven countermeasures or whether a more significant infrastructure improvement is necessary. To assist in this, partners can use one of two systems: (1) Crash Data Analysis Retrieval Tool (CDART)(2) Pennsylvania Crash Information Tool (PCIT)
14104
DRAFT

2023 Transportation Program General and Procedural Guidance
Once this analysis has been performed, data should be used by the Engineering Districts and planning partners to assist MPO/RPO’s in evaluating different factors to address the safety concern. By starting with the Crash Modification Factors Clearinghouse the Engineering Districts can help narrow down treatments that are applicable to a given location and dataset. MPO/RPO’s should use this information to assess
the complexity of the project needed. For example, can a situation involving roadway departure crashes be addressed by the addition of curve warning signs and high friction surface treatments or do a series of curves in the roadway need removed. Obviously the more complex the solution is the greater the funding levels will be, but it also increases other project delivery aspects like environmental clearances and right-of-way impacts. Both areas can affect how much funding is tied to a given year on the TIP as well as the total number of years the project will need carried on the TIP to reach completion. All of these factors are important considerations when selecting safety projects because delivery of safety that have the greatest potential for return on reduction in crashes is key to the Commonwealth achieving its established safety performance targets.
These analysis options are explored in more detail at the following locations: • Highway Safety Benefit-Cost Analysis Guide• Highway Safety Benefit-Cost Analysis Tool: Reference Guide• HSM Analysis [Crash Modification Factor (CMF) Clearinghouse]
Guidance on performing a data-driven safety analysis can be found in the following locations: • PUB 638 – District Highway Safety Guidance Manual• PUB 638A – Pennsylvania Safety Predictive Analysis Methods Manual• PennDOT Safety Website• AASHTO Highway Safety Manual• FHWA Crash Costs for Highway Safety Analysis• FHWA Countermeasure Service Life Guide
More information on HSIP project eligibility and requirements, including federal share pro rata, can be found at the following links:
• FHWA – Project Eligibility• FHWA – Eligibility Guidance• 23 USC 120 – Federal Share Payable• 23 USC 148 – Highway Safety Improvement Program
15105
DRAFT

2023 Transportation Program General and Procedural Guidance
The SharePoint HSIP funding site provides a single point of communication for all HSIP eligibility and funding requests. Applications submitted through this process will document all the processes discussed earlier in this section. Project applications can be initiated either by an MPO/RPO or an Engineering District. The applications are reviewed through an approval workflow involving the PennDOT Engineering District, BOMO safety and CPDM staff. To ensure that there are no conflicts between the approved TIP and safety performance measures this application should be created as early in the planning process as possible. Failure to do this could result in projects being included in the TIP that do not meet the minimum 1:1 benefit cost ratio for utilization of HSIP funding. The HSIP projects should be continually monitored by the MPOs/RPOs, PennDOT Engineering Districts, CPDM, BOMO, and FHWA to ensure approved applications match any TIP adjustments. If situations arise where either the MPOs/RPOs or Engineering Districts believe additional funding is needed for the safety project an amendment shall be processed through this HSIP SharePoint system to ensure that the 1:1 benefit cost ratio can be maintained at the increased funding level. These HSIP application amendments shall be initiated by either the MPOs/RPOs or the Engineering Districts in conjunction with any TIP adjustments. This approach will not only ensure that Pennsylvania is working towards the SHSP goals but will also allow the PennDOT Districts and MPOs/RPOs to quantify the safety improvements of the selected projects relative to the safety performance targets. It will also assist in ensuring that delivery and funding issues do not arise during the project development process. Pennsylvania sets aside $35 million of HSIP funds per FFY to advance projects statewide. The HSIP set-aside is managed as a statewide program by PennDOT CPDM in coordination with BOMO. Projects are evaluated, ranked, and selected based on their potential significant safety return on investment and their deliverability. The remainder of the state’s HSIP authorization is allocated regionally. Each MPO/RPO receives a base funding level of $500,000 for supporting low cost safety improvements and systemic safety. The remaining HSIP funding is allocated at a 39:1 ratio based on actual crash data. It should be noted however that the allocated HSIP funding can still be utilized for systemic safety treatments because it has been determined that these types of projects have a much greater return on the safety investment in Pennsylvania. Further documentation on this process is included in the Financial Guidance Document.
Pavement and Bridge Asset Management
Preserving Pennsylvania’s pavement and bridges is a critical part of the strategic investment strategy for Pennsylvania’s transportation network at the State and Federal level. System preservation is another goal area of PA On Track’s strategic framework. With limitations on available resources, the preservation of pavement and bridge assets using sound asset management practices is critical. Asset management is a key piece of FHWA’s TPM program and is a vital force behind infrastructure performance. TPM is the approach to managing transportation system performance outcomes, while asset management is the application used to manage the condition of the infrastructure assets.
PennDOT’s TAMP, required by 23 USC 119 and 23 CFR 515.13(b)(2), formally defines its framework for asset management, which is a data-driven approach coupled with a risk-based methodology. It outlines
16106
DRAFT

2023 Transportation Program General and Procedural Guidance
the investment strategies for infrastructure condition targets and documents asset management objectives for addressing risk, maintaining the system at the desired state of good repair, managing to lowest life cycle costs (LLCC), and achieving national and state transportation goals identified in 23 USC 150(b). The TAMP is developed by PennDOT BOMO’s Asset Management Division (AMD) in consultation with PennDOT Executive leadership, CPDM, Bureau of Planning and Research (BPR), PennDOT Districts, the Pennsylvania Turnpike Commission (PTC), the MPOs/RPOs and FHWA.
The TAMP projects the levels of future investment necessary to meet the asset condition targets and contrasts them with expected funding levels. This helps PennDOT to make ongoing assessments and to reevaluate data associated with its investment decisions for this Program update as well as future updates. Analyses done during the development of the TAMP were utilized to establish the current Pavement and Bridge Condition Performance Measure (PM2) targets.
With each program update, PennDOT has made substantial advances in its asset management tools and practices. A risk-based, data-driven approach to project selection helps ensure that the right projects are prioritized, and the transportation system is managed optimally to the lowest practical life-cycle cost. PennDOT’s Pavement Asset Management System (PAMS) and Bridge Asset Management System (BAMS) are the foundations for this asset management approach. Information from these systems informs the development of the TAMP. Step by step guidelines on utilizing PAMS and BAMS to review treatments and develop projects can be found in the TPM Resource Toolbox. PennDOT’s asset management systems forecast condition and investment needs by asset class and work type using deterioration models and cost matrices developed for PennDOT infrastructure and based on historical data. PennDOT has developed both predictive and deterministic models that support multi-objective decision-making based on current average work costs and estimated treatment lifespans. These models allow PennDOT to predict infrastructure investment needs and future conditions under a range of scenarios.
As part of its asset management strategy, PennDOT strives to maintain as many highway and bridge assets as possible in a state of good repair, per 23 CFR 515.9 (d)(1). PennDOT defines its desired state of good repair as meeting the FHWA minimum condition thresholds for pavements and bridges: no more than 5 percent of NHS Interstate lane-miles shall be rated in poor condition (23 CFR part 490.315(a), Subpart C) and no more than 10 percent of total NHS bridge deck area shall be rated as poor (23 USC 119(f)(1)). However, the ability to achieve these condition thresholds is funding dependent.
Within its asset management framework, it was necessary for PennDOT to transition away from a “worst-first” programming methodology to a true overall risk-based prioritization and selection of projects for its system assets based on LLCC. “Worst-first” prioritization focuses work on the poorest condition assets at the expense of rehabilitation and preventative maintenance on other assets in better condition. PennDOT’s revised strategy reflects its asset management motto and guiding principle: “The right treatment at the right time.” This is reflective of Federal TAMP requirements that are centered on investing limited funding resources in the right place at the right time to produce the most cost-effective life cycle performance for a given investment, per 23 CFR 515.7 and 23 CFR 515.9.
PennDOT will use its PAMS and BAMS systems to assist with prioritizing preservation activities to extend asset life. This methodology will allow PennDOT to manage assets to both specific targets and to the lowest practical life-cycle cost and help it to make progress toward achieving its targets for asset
17107
DRAFT
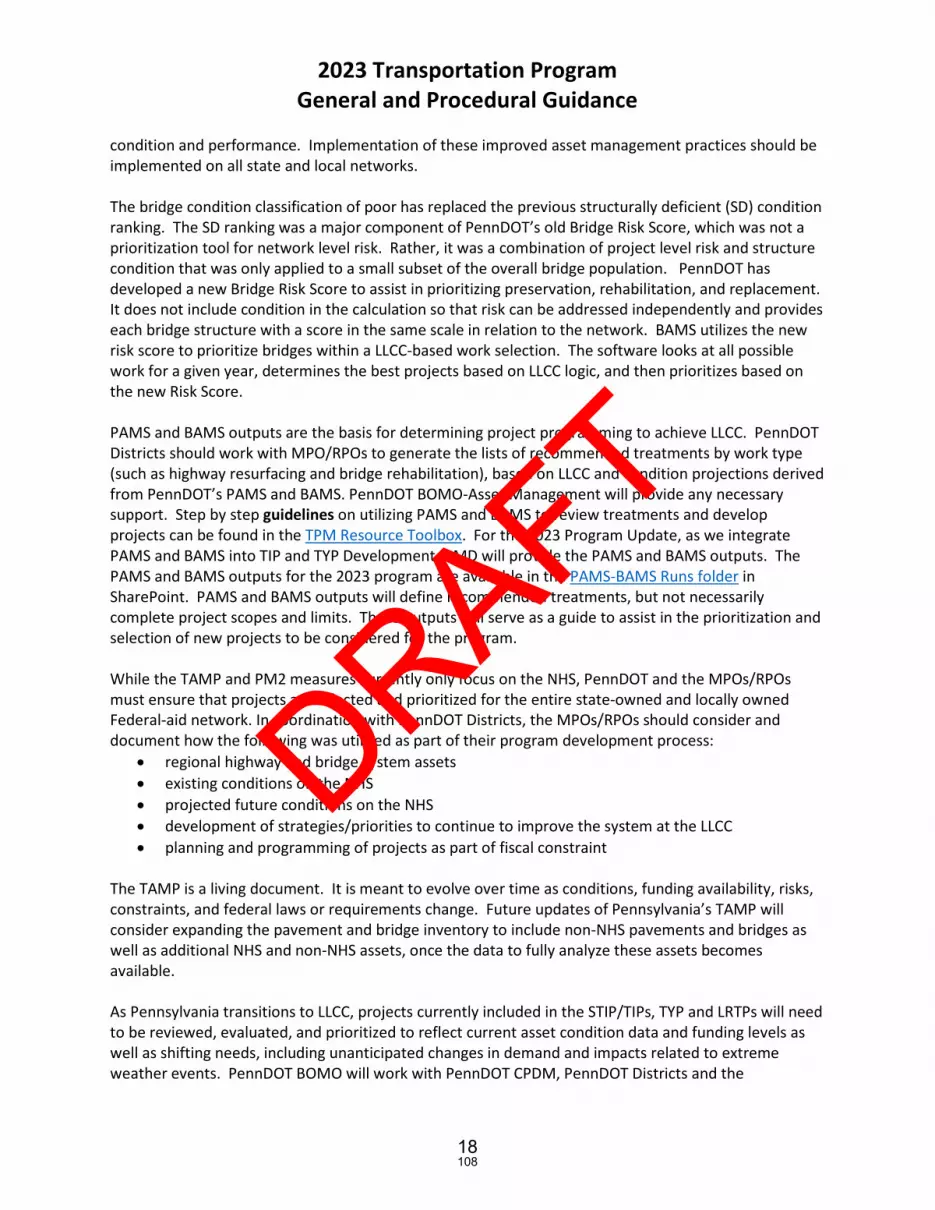
2023 Transportation Program General and Procedural Guidance
condition and performance. Implementation of these improved asset management practices should be implemented on all state and local networks.
The bridge condition classification of poor has replaced the previous structurally deficient (SD) condition ranking. The SD ranking was a major component of PennDOT’s old Bridge Risk Score, which was not a prioritization tool for network level risk. Rather, it was a combination of project level risk and structure condition that was only applied to a small subset of the overall bridge population. PennDOT has developed a new Bridge Risk Score to assist in prioritizing preservation, rehabilitation, and replacement. It does not include condition in the calculation so that risk can be addressed independently and provides each bridge structure with a score in the same scale in relation to the network. BAMS utilizes the new risk score to prioritize bridges within a LLCC-based work selection. The software looks at all possible work for a given year, determines the best projects based on LLCC logic, and then prioritizes based on the new Risk Score.
PAMS and BAMS outputs are the basis for determining project programming to achieve LLCC. PennDOT Districts should work with MPO/RPOs to generate the lists of recommended treatments by work type (such as highway resurfacing and bridge rehabilitation), based on LLCC and condition projections derived from PennDOT’s PAMS and BAMS. PennDOT BOMO-Asset Management will provide any necessary support. Step by step guidelines on utilizing PAMS and BAMS to review treatments and develop projects can be found in the TPM Resource Toolbox. For the 2023 Program Update, as we integrate PAMS and BAMS into TIP and TYP Development, AMD will provide the PAMS and BAMS outputs. The PAMS and BAMS outputs for the 2023 program are available in the PAMS-BAMS Runs folder in SharePoint. PAMS and BAMS outputs will define recommended treatments, but not necessarily complete project scopes and limits. These outputs will serve as a guide to assist in the prioritization and selection of new projects to be considered for the program.
While the TAMP and PM2 measures currently only focus on the NHS, PennDOT and the MPOs/RPOs must ensure that projects are selected and prioritized for the entire state-owned and locally owned Federal-aid network. In coordination with PennDOT Districts, the MPOs/RPOs should consider and document how the following was utilized as part of their program development process:
• regional highway and bridge system assets• existing conditions on the NHS• projected future conditions on the NHS• development of strategies/priorities to continue to improve the system at the LLCC• planning and programming of projects as part of fiscal constraint
The TAMP is a living document. It is meant to evolve over time as conditions, funding availability, risks, constraints, and federal laws or requirements change. Future updates of Pennsylvania’s TAMP will consider expanding the pavement and bridge inventory to include non-NHS pavements and bridges as well as additional NHS and non-NHS assets, once the data to fully analyze these assets becomes available.
As Pennsylvania transitions to LLCC, projects currently included in the STIP/TIPs, TYP and LRTPs will need to be reviewed, evaluated, and prioritized to reflect current asset condition data and funding levels as well as shifting needs, including unanticipated changes in demand and impacts related to extreme weather events. PennDOT BOMO will work with PennDOT CPDM, PennDOT Districts and the
18108
DRAFT

2023 Transportation Program General and Procedural Guidance
MPOs/RPOs to recommend the prioritization of specific bridge projects over specific roadway projects and vice versa to prevent bridge or pavement conditions from falling below FHWA minimum condition thresholds. This prioritization will be undertaken using a combination of advanced asset management tools, professional engineering judgment by Central Office and District personnel, and local MPO/RPO input. Flexible Federal and State funding may need to be utilized to help achieve NHS performance targets, if available. This will be based on coordination between PennDOT BOMO AMD, PennDOT CPDM and the MPOs/RPOs, in consideration of other required performance measures and state initiatives.
As part of the regional TIP development process mentioned above, the MPOs/RPOs and PennDOT Districts must document the differences between the PennDOT asset management system treatment and funding level recommendations and their selected projects as part of their TIP submissions. They must also document the coordination with the PennDOT District(s) and Central Office that occurred as part of this decision-making process. This information will be used by PennDOT BOMO AMD to improve future asset management system recommendations.
System Performance
Pennsylvania’s transportation system is critical to the efficient movement of people and goods. State and Federal initiatives are in place to maintain and improve system mobility. Personal and Freight Mobility is another goal area of PA On Track’s strategic framework. Improving reliability and traffic flow are also part of FHWA’s overall TPM program. FHWA’s System Performance/Freight/CMAQ Final Rule established performance measure requirements for system performance, freight, and congestion, known as the PM3 measures.
The PM3 measures are used by PennDOT and the MPOs/RPOs to evaluate the system reliability of the Interstate and non-Interstate NHS to help carry out the National Highway Performance Program (NHPP), to assess goods movement on the Interstate NHS to help implement the National Highway Freight Program (NHFP), and to measure traffic congestion and on-road mobile source emissions on the NHS to help carry out the Congestion Mitigation and Air Quality (CMAQ) program.
The current PM3 Targets were established using historic trends for each measure in combination with regional mobility goals established in the statewide and regional LRTPs. At this time, limited historical information may hinder the assessment of trends for the traffic congestion and reliability measures. The assessment of trends may also include the evaluation of data used within the CMP, Transportation Systems Management and Operations (TSMO), and CMAQ processes.
Data for the reliability and delay measures are taken from the National Performance Management Research Data Set (NPMRDS). This data set includes average travel times on the National Highway System (NHS) for use in performance measures and management activities. This data set is available to MPOs and PennDOT and more information can be found on the FHWA Operations Performance Measurement website. The NPMRDS is part of the Regional Integrated Transportation Information System (RITIS) which is the current platform for reporting the PM3 travel time measures. RITIS provides a portfolio of analytical tools and features for summarizing the measures and evaluating trends. The CENSUS American Community Survey (ACS) and FHWA CMAQ Public Access System provide the data sources for the Non-Single Occupant Vehicle (SOV) and emission measures, respectively. The VMT are
19109
DRAFT

2023 Transportation Program General and Procedural Guidance
derived from the Highway Performance Monitoring System (HPMS). Segment-level metrics for the reliability and delay measures are also submitted by PennDOT to HPMS annually.
PennDOT BOMO will review the State’s reliability and delay data and evaluate it for overall trends and provide PennDOT CPDM with statewide data to share with the MPOs/RPOs. PennDOT BOMO and CPDM will work together to develop additional regional performance measure summaries to share with the MPOs/RPOs to aid in regional target assessment and progress. This may consist of tables or online maps of travel congestion and reliability measures.
With support from the MPOs/RPOs, PennDOT CPDM and BOMO will monitor the road network for significant changes in the reliability metrics from year to year. Monitoring the network will help identify such projects as capacity enhancements or traffic signal coordination projects on primary roadways. These project impacts will help assess the benefits of historic funding and the potential benefits of future investments on traffic congestion and reliability. Identifying project impacts will require the evaluation of performance measures before construction, during construction and after project completion.
PennDOT and the MPOs/RPOs should program projects that address congestion and reliability issues identified in the (Regional Operations Plans) ROPs, CMPs, and LRTPs in order to support progress towards achievement of the PM3 targets. Methods for PM3 for integration will remain flexible for each agency.
Transportation Systems Management and Operations
The mission of PennDOT’s TSMO Program is to move people and goods from Point A to Point B, as efficiently, safely, and reliably as possible. TSMO is a way to address the reliability, mobility, and congestion of roadways by using operations-focused strategies instead of building extra capacity. Higher reliability means more consistent travel times on NHS roadways. TSMO strategies must first be considered before the implementation of a capacity-adding project. TSMO strategies may be implemented through independent projects or as part of other projects. All projects must consider impacts to the PM3 performance measures to ensure that the targets are being met.
Significant causes of congestion and unreliable travel are non-recurring events, such as crashes, and transportation network disruptions, such as severe weather and other special events. TSMO enables agencies to target the underlying operational causes of congestion and unreliable travel through innovative solutions that typically cost less and are quicker to implement than adding capacity. TSMO expands the range of mobility choices available to system users, including shared mobility and nonmotorized options. The connection between TSMO and planning is increasingly critical as connected and automated vehicles, advances in intelligent transportation systems (ITS), and other developing technologies impact transportation networks.
PennDOT has developed a TSMO Guidebook (PUB 851) on how to implement its approach to integrating TSMO into planning and programming and how to connect operations-related planning efforts with other Pennsylvania planning efforts. Stakeholders should consider the applicability of TSMO solutions for every project as part of the design process outlined in PennDOT’s DM1 manual.
20110
DRAFT

2023 Transportation Program General and Procedural Guidance
TSMO Relationship with the Planning Process
TSMO projects should be consistent with FHWA operations guidance, as well as Regional Operations Plans (ROPs) and ITS Architectures. ROPs play a significant role in regional LRTP and TIP/TYP processes by helping to prioritize projects that incorporate TSMO solutions. Keeping ROPs up to date is critical to ensure that they maintain the proper role in implementing TSMO-related projects in a systematic manner, rather than through ad-hoc additions to other capital projects. Through the ROP development and update process, the existing ITS and Operations infrastructure needs, visions and goals are identified to prioritize future operations-focused projects and performance measures that are in harmony with regional, state and federal policies.
ROPs have been developed for each of Pennsylvania’s four TSMO regions to better align the planning of operations with PennDOT’s four Regional Traffic Management Centers (RTMC).
21111
DRAFT

2023 Transportation Program General and Procedural Guidance
The RTMC manages the ROPs with support from the various MPOs/RPOs in the region. Each ROP identifies the regional approach to traffic operations and sets the stage for regional implementation of TSMO strategies. ROPs will be updated to align with the TIP 4-year cycle. The ROPs will, at a minimum, identify which projects could be undertaken within the next four years, aligning these projects for potential inclusion on the TIP/TYP/LRTP.
The National Highway Freight Program
The National Highway Freight Program (NFP) was authorized under the FAST Act to improve the efficient movement of freight on the National Highway Freight Network (NHFN) and support several important goals, as specified by 23 USC 167:
• Investing in infrastructure and operational improvements that strengthen economiccompetitiveness, reduce congestion, reduce the cost of freight transportation, improvereliability, and increase productivity.
• Improving the safety, security, efficiency, and resiliency of freight transportation in rural andurban areas.
• Improving the state of good repair of the NHFN.• Using innovation and advanced technology to improve NHFN safety, efficiency, and reliability.• Improving the efficiency and productivity of the NHFN.• Improving State flexibility to support multi-State corridor planning and address highway freight
connectivity.• Reducing the environmental impacts of freight movement on the NHFN.
NFP funds are financially constrained to an annual funding level provided as part of Financial Guidance and have strategically been allocated to the IM Program. Pennsylvania’s CFMP must include a list of fiscally constrained NFP funded projects. PennDOT CPDM will prioritize and select projects to utilize NFP funding that are consistent with the CFMP. All projects should consider impacts to truck reliability to support progress towards achieving the performance measures. Factors from the CFMP such as freight bottlenecks and freight efficiency projects, projects identified by MPOs/RPOs, and project schedules and costs will be used in conjunction with asset management principles to prioritize project selection. Initial programming consideration will be given to currently programmed projects without regular obligation. If any changes to the projects and/or NFP funding within the projects are necessary based on the Program update, the CFMP will be updated concurrently.
Congestion Mitigation and Air Quality Program
The purpose of the CMAQ program is to give priority to cost-effective transportation projects or programs that will contribute to attainment or maintenance of the National Ambient Air Quality Standards (NAAQS) for the ozone, carbon monoxide (CO), and particulate matter (PM2.5/10) criteria pollutants. Financial Guidance directs CMAQ funding only to those areas designated as in maintenance or nonattainment of the current NAAQS. Previous “insufficient data” and “orphan maintenance” (as currently defined for the 1997 ozone NAAQS maintenance areas) counties no longer receive CMAQ funding. A map of the transportation conformity areas in Pennsylvania can be found in the Transportation Conformity folder in SharePoint.
22112
DRAFT

2023 Transportation Program General and Procedural Guidance
FHWA and FTA cooperatively developed the CMAQ Interim Program Guidance in November 2013 to assist States and MPOs with administering the CMAQ program. It outlines several key criteria for CMAQ eligibility. Each CMAQ project must meet three basic criteria:
1. it must be a transportation project,2. it must generate an emissions reduction, and3. it must be located in or benefit a nonattainment or maintenance area.
In addition, there are types of projects that are ineligible for CMAQ funds even if they include potentially eligible components. These include:
• Projects that add new capacity for SOVs are ineligible for CMAQ funding unless construction islimited to high-occupancy vehicle (HOV) lanes.
• Routine maintenance and rehabilitation projects (e.g., replacement-in-kind of track or otherequipment, reconstruction of bridges, stations, and other facilities, and repaving or repairingroads) are ineligible for CMAQ funding as they only maintain existing levels of highway andtransit service, and therefore do not reduce emissions.
• Models and Monitors—Acquisition, operation, or development of models or monitoringnetworks are not eligible for CMAQ funds. As modeling or monitoring emissions, trafficoperations, travel demand or other related variables do not directly lead to an emissionsreduction, these activities or acquisitions are not eligible.
• General studies that fall outside specific project development do not qualify for CMAQ funding.• Please review the Interim Program Guidance for more details on eligibility.
PennDOT CPDM works with the MPOs/RPOs and District Offices to identify projects that may be funded through the CMAQ program, based on CMAQ eligibility requirements and project cost effectiveness. PennDOT CPDM coordinates with FHWA on providing resources and training opportunities to further clarify the eligibility requirements and enhance the CMAQ project selection process.
The CMAQ Interim Program Guidance provides direction on how to develop a CMAQ project selection process to ensure that projects deemed most effective in reducing emissions and congestion are programmed in the TIP. Per the Guidance, “the CMAQ project selection process should be transparent, in writing, and publicly available. The process should identify the agencies involved in rating proposed projects, clarify how projects are rated, and name the committee or group responsible for making the final recommendation to the MPO board or other approving body. The selection process should also clearly identify the basis for rating projects, including emissions benefits, cost-effectiveness, and any other ancillary selection factors such as congestion relief, greenhouse gas reductions, safety, system preservation, access to opportunity, sustainable development and freight, reduced SOV reliance, multimodal benefits, and others.”
The Delaware Valley Regional Planning Commission (DVRPC) and the Southwestern Pennsylvania Commission (SPC) have formal processes to solicit and administer their CMAQ programs that include project identification, screening and selection procedures (including adherence to federal requirements regarding emissions impact quantification, consideration of cost effectiveness measures, and prioritization of projects).
23113
DRAFT
2023 Transportation Program General and Procedural Guidance
For CMAQ-eligible areas covered by MPOs that do not have a formal process, namely all areas except DVRPC and SPC, a simplified evaluation, selection, and eligibility determination process such as the one outlined below is recommended to meet this requirement:
• MPO and PennDOT District staff will conduct coordination meetings or conference calls toidentify candidate projects for potential CMAQ funding consideration.
• PennDOT CPDM, in coordination with FHWA, has developed an Excel template for MPOs toevaluate candidate CMAQ projects. The template is available in the CMAQ Project SelectionProcess folder in SharePoint.
• MPO and PennDOT District staff will select CMAQ projects using the criteria provided in thetemplate. These criteria will include eligibility classification, qualitative assessments of emissionbenefits (using FHWA’s Cost-Effectiveness Tables), project cost, deliverability/project readiness,and other factors. MPO and PennDOT District staff should use the template to assist in thedocumentation of their project selection process.
• PennDOT CPDM will review the selected projects to verify their CMAQ eligibility. If requested byPennDOT, FHWA will assist PennDOT in determining CMAQ eligibility or identifying anyineligibility issues or concerns.
Although the eligibility determination process outlined above gives priority to cost-effective projects, all projects ultimately selected for CMAQ funding require a quantitative emission analysis. These emission analyses are used to support project eligibility and provide key inputs to the CMAQ annual report submission to FHWA. PennDOT CPDM will assist PennDOT District and MPO staff in completing the analyses. Available tools for emission analyses include the Pennsylvania Air Quality Off-Network Estimator (PAQONE) tool and the FHWA CMAQ Emissions Calculator Toolkit.
Projects with proposed CMAQ funding are coded as such in MPMS and identified accordingly throughout the project evaluation, selection and program development processes. PennDOT District staff with support from CPDM will enter the CMAQ MPMS fields for emission benefits, analysis date, and project category. As part of the draft TIP review, PennDOT and FHWA/FTA review project eligibility. Once FHWA and FTA approve the STIP, PennDOT CPDM can move forward with obligating projects funded with CMAQ.
PennDOT CPDM prepares an annual report to FHWA using project information from the MPMS system. This information is compiled annually on a nationwide level and is submitted by FHWA to Congress. It provides a list of obligated projects and emissions analyses for those projects, which ensures that only CMAQ-eligible projects are being funded.
The emission analysis results within the annual report are also used for the CMAQ national emission performance measures. As such, all agencies should understand the importance of accurately reflecting CMAQ-funded projects in MPMS and estimating project emission impacts based on the best available tools. PennDOT CPDM will performance quality control checks on the reported CMAQ-funded projects and supporting emission estimates. These activities may include additional coordination with FHWA, PennDOT Districts, and MPOs.
24114
DRAFT

2023 Transportation Program General and Procedural Guidance
MAP-21 and the FAST Act require performance measures for State DOTs and MPOs to assess traffic congestion and on-road mobile source emissions for the purpose of carrying out the CMAQ program. There are three performance measures under the CMAQ program:
• Annual Hours of Peak Hour Excessive Delay (PHED) Per Capita;• Percent of Non-Single Occupancy Vehicle travel, also known as Non-SOV Travel; and• Total Emissions Reduction
MPOs currently serving an urbanized area population over 1,000,000 that includes an air quality nonattainment or maintenance area must develop a CMAQ Performance Plan. In the CMAQ Performance Plan and its biennial updates, MPOs must report 2 and 4 year targets for the CMAQ measures, describe how they plan to meet their targets, and detail their progress toward achieving the targets over the course of the performance period. The Performance Plan is submitted to PennDOT for inclusion in PennDOT’s biennial reports to FHWA. Currently, only the Pittsburgh, Philadelphia and Lancaster MPOs are required to submit CMAQ Performance Plans. For the next performance period covering 2022-2025, all MPOs serving an urbanized population more than 200,000 that include an air quality nonattainment or maintenance area will be required to develop a plan.
Additional FHWA CMAQ resources: • Interim Program Guidance Under MAP-21• Fast Act – CMAQ Factsheet• Project Eligibility• CMAQ Performance Measures
Congestion Management Process
Projects that help to reduce congestion will also help to improve air quality. This approach is coordinated with a region’s CMP, which helps to identify corridor-based strategies to mitigate traffic congestion reflected in the PHED and percentage of non-single occupant vehicle (SOV) performance measures.
The CMP is a regional planning tool designed to provide a systematic way for helping manage congestion and provide information on transportation system performance. It identifies congested corridors and recommends strategies for congestion mitigation. The CMP includes methods to monitor and evaluate the performance of the multimodal transportation system along with a process for periodic assessment of the effectiveness of implemented strategies.
A CMP is required for the TMAs. It is prepared by the MPO for that area and is a systematic process for managing congestion that brings congestion management strategies to the funding and implementation stages of the project delivery process. The goal of the CMP is to improve the performance and reliability of the multimodal transportation system in the MPO’s region.
In TMAs designated as ozone or carbon monoxide non-attainment areas, the CMP becomes even more important. The limited number of capacity-adding projects to be considered for advancement in non-attainment TMAs must be consistent with the region’s CMP. Federal law prohibits projects that result in a significant increase in carrying capacity for SOVs from being programmed in such areas unless these projects are addressed in the regional CMP.
25115
DRAFT

2023 Transportation Program General and Procedural Guidance
Environmental Justice
Another key consideration in the project selection and prioritization process is Environmental Justice (EJ). Executive Order 12898 requires Federal agencies and Federal aid recipients to adhere to the following core principles:
• To avoid, minimize, or mitigate disproportionately high and adverse human health orenvironmental effects, including social and economic effects, on minority and low-incomepopulations.
• To ensure the full and fair participation by all potentially affected communities in thetransportation decision-making process.
• To prevent the denial of, reduction in, or significant delay in the receipt of benefits by minorityand low-income populations.
To develop a single consistent EJ analysis that can be applied statewide, the South Central MPOs in PennDOT District 8 generated a proposed methodology to evaluate the potential impacts of transportation plans and programs on EJ populations. The South Central PA MPO EJ Study, referred to as the Unified EJ Guide, includes several noteworthy practices adopted from MPOs around the country. As part of the 2021 TIP Environmental Justice Committee After Action Review (AAR), some aspects of the Unified EJ Guide will be modified and will be updated by November 2021.
FHWA PA Division and FTA Region III reviewed the MPO Unified Guide, and identified Core Elements of an effective approach to meet the intent of Executive Order 12898, Environmental Order 5610.2(a), FHWA Order 6640.23A, and FTA’s Environmental Justice Circular 4703.1. As part of the 2021 STIP/TIP update, PennDOT and many MPOs/RPOs incorporated this approach into their EJ analysis. For the TIP EJ Analysis, MPOs/RPOs should conduct the following steps:
• Identify low-income and minority populations• Assess conditions and identify needs• Develop the draft Program• Evaluate benefits and burdens of the Program• Identify and avoid, minimize, or mitigate any disproportionate and adverse impacts
As a continuation of the statewide analysis approach started with the 2021 TIP, Lycoming County Planning Commission will be completing the first two steps (Identification of Low-Income and Minority Populations and assessment of conditions and identification of needs for bridges, pavements and crashes) for all areas of the State for the 2023 TIP update. The results will be made available to each MPO/RPO in the Environmental Justice folder in SharePoint. MPOs/RPOs should work with the PennDOT Districts and CPDM to review, discuss and interpret the data and document the benefits and burdens analysis. The burdens and benefits analysis and the identification and addressing of disproportionate and adverse impacts will be unique to each area and examples may be found in the Unified EJ Guide.
The EJ analysis should be completed during program development and shared as part of the public comment period documentation. If disproportionately high and adverse impacts are identified, the MPO/RPO should work with PennDOT, FHWA and FTA to develop and document strategies to avoid, minimize or mitigate these impacts. It is important to note that determinations of disproportionately
26116
DRAFT

2023 Transportation Program General and Procedural Guidance
high and adverse effects take into consideration the mitigation and enhancement measures that are planned for the proposed action.
The EJ analysis process should be comprehensive and continuous, with each task informing and cycling back to influence the next stage. The outcomes of the analysis and feedback received in each outreach cycle should be considered by the MPOs/RPOs and PennDOT in future project selection processes and provided to PennDOT District staff to inform the project-level EJ analysis:
Transit
In July 2016, FTA issued a final rule requiring transit agencies to maintain and document minimum Transit Asset Management (TAM) standards, policies, procedures, and performance targets. The TAM rule applies to all recipients of Chapter 53 funds that either own, operate, or manage federally funded capital assets used in providing public transportation services. The TAM rule divides transit agencies into two categories based on size and mode:
• Tier Io Operates Rail Fixed Guideway (Section 5337) ORo Operates over 100 vehicles across all fixed route modes ORo Operates over 100 vehicles in one non-fixed route mode
• Tier IIo Urban and Rural Public Transportation (Section 5307, 5310, and 5311 eligible) ORo Operates up to and including 100 vehicles across all fixed route modes ORo Operates up to and including 100 vehicles in one non-fixed route mode
A list of Pennsylvania’s Tier I and II transit agencies is found in the 2023 General and Procedural Guidance Support Documents folder in SharePoint.
The TAM rule requires states to participate and/or lead the development of a group plan for recipients of Section 5311 and Section 5310 funding (Tier II), and additionally allows other Tier II providers to join a group plan at their discretion. All required agencies (Section 5311 and 5310) and remaining Tier II systems in Pennsylvania, except for the Centre Area Transportation Authority (CATA), elected to participate in the PennDOT Group Plan.
All transit agencies are required to utilize Pennsylvania’s transit Capital Planning Tool (CPT) as part of their capital planning process and integrate it into their TAM process. The CPT is an asset management
27117
DRAFT

2023 Transportation Program General and Procedural Guidance
and capital planning application that works as the central repository for all Pennsylvania transit asset and performance management activities.
Transit agencies update CPT data annually to provide a current picture of asset inventory and performance. From this data, PennDOT BPT updates performance targets for both the statewide inventory of Tier II agencies and for each individual agency in the plan based on two primary elements: the prior year’s performance and anticipated/obligated funding levels. PennDOT BPT then reports this information to FTA and shares it with the MPOs/RPOs, along with investment information on priority capital projects anticipated for the following year. Agencies that are Tier I or non-participating Tier II use similar CPT data to set independent TAM performance targets and report these directly to the MPOs/RPOs.
Consistent with available resources, transit agencies will be responsible for submitting projects consistent with the CPT for the development of the transit portion of the Program. PennDOT CPDM will update this project information in MPMS and share it with the MPOs/RPOs, PennDOT BPT, and the transit agencies.
FISCAL CONSTRAINT
An early part of the program development process is for PennDOT, FHWA/FTA and the MPOs/RPOs to jointly develop the 2023 Program Financial Guidance document, first through a Work Group, and later through agreement by all parties. This Guidance provides sufficient information to begin identifying projects, performing project technical evaluations, and negotiating and reaching consensus on the fiscally constrained regional programs.
Financial Guidance provides funding levels available for the development of the STIP/TYP for all anticipated federal and state funding sources. Due to the expiration of the FAST Act and uncertainty with the viability of the Highway Trust Fund, anticipated available federal highway, bridge and transit funds reflect zero percent revenue growth from the FAST Act authorized 2020 apportionment levels for the entire twelve years of the Program. State revenues are based on the latest budget estimates for highway and bridge capital appropriations. Allocations are provided to each MPO/RPO for highway and bridge funds based on jointly developed formulas. Allocations are also provided for the IMP, NFP, and Railway-Highway Crossings Program (Section 130/RRX). These continue to be centrally managed statewide programs. In addition, a portion of highway funding is reserved for distribution at the Secretary of Transportation’s discretion.
Transit Financial Guidance includes both federal and state resources. Federal funding is based on FAST Act levels. State funding is based on projected funding source revenues and applied by formulas established in Act 44 of 2007, as amended by Act 89 of 2013. In addition, as part of an agreement between the Commonwealth and the transit agencies, a total of $25 million per year in federal highway funding is reserved to be flexed to the transit agencies.
To program these funds, each transit agency works closely with PennDOT BPT to develop annual consolidated capital applications (CCA) and annual consolidated operating applications (COA). The CCA process includes federal, state, and local funds and prioritizes investments based on asset condition and replacement cycles in the CPT. This process promotes a true asset management approach where the
28118
DRAFT

2023 Transportation Program General and Procedural Guidance
assets in most need of replacement and/or rehabilitation are prioritized to receive funding, which allows transit agencies to move these assets toward a state-of-good-repair.
Operating allocations are formula-based, as discussed above, and PennDOT BPT works with agencies annually through the COA process to identify anticipated expenses and revenues and program federal, state, and local funds to meet anticipated operating deficits.
An important part of the project prioritization and selection process is to ensure that the Program of projects meets fiscal constraint, which means that the included projects can reasonably be expected to receive funding within the time allotted for Program implementation. The identified revenues are those that are reasonably anticipated to be available to operate and maintain Federal-aid highways and public transportation in accordance with 23 CFR 450.218(l) and 23 CFR 450.326(j).
The regional TIP narratives should include reference to the Financial Guidance process and the distribution of funds along with a form of visual documentation to demonstrate regional fiscal constraint. An example of such a visual aid is the fiscal constraint tab from the TIP Checklist.
The regional TIPs shall contain system-level estimates of state and local revenue sources beyond Financial Guidance that are reasonably expected to be available (but typically not programmed) to operate and maintain the Federal-aid highways (as defined by 23 USC 101(a)(6)) and public transportation (as defined by title 49 USC Chapter 53). PennDOT CPDM will provide regional estimated totals for state programs not included in Financial Guidance. When available, they will be placed in the 2023 General and Procedural Guidance Support Documents folder in SharePoint. MPOs/RPOs can work with local stakeholders to identify supplemental information that is readily available. Transit providers will supply estimates of county/city/local revenue sources/contributions. This information should be integrated into the regional TIPs. Statewide information will be included with the STIP.
Line Items
As part of the program development process, PennDOT CPDM, PennDOT Districts and the MPOs/RPOs should consider the inclusion of reserve line items. Every effort should be made as part of the program development process to identify projects for all available funding in the first 2 years of the TIP, to ensure project delivery and maximum utilization of funding. Line items should be used primarily for contingency purposes such as unforeseen project costs, including Accrued Unbilled Costs (AUC), unforeseen AC obligations, and other actions which might occur between program drafting and project initiation. Dedicated line items for specific regional issues such as slides, and sinkholes should be included based on historical needs. Selected project categories that are air quality exempt (e.g. betterment and Section 5310) may also be grouped into regional line items for inclusion in the Program, with project specific listings to be developed later by project sponsors. The excessive use of line items for other purposes is strongly discouraged by PennDOT CPDM and FHWA.
Programming
Projects and phases of projects in the Program must be financially constrained by FFY (October 1 – September 30), with respect to the anticipated available funding and within the bounds of Financial Guidance.
29119
DRAFT

2023 Transportation Program General and Procedural Guidance
The STIP/TIPs shall include a project, or a phase of a project, only if full funding can reasonably be anticipated to be available within the time period contemplated for completion of the project, based on the project phase start and end dates. This shall also include the estimated total cost of project construction, which may extend beyond the TIP and into the TYP and LRTP, in accordance with 23 CFR 450.326 (g) (2), (i) and (j). Cost estimates prepared during programming are critical in terms of setting funding, schedule, and scope for managing project development. Project cost estimates shall follow guidance provided in PennDOT Estimating Manual PUB 352. All phases of projects that are not fully funded on the TIP will be carried over and shown in the last eight years of the fiscally constrained TYP. For projects to advance beyond the PE phase, the project must be fully funded within the TIP/TYP/LRTP.
Projects/phases of projects should be programmed in the FFY in which the project is anticipated to be obligated/encumbered. Programmed funding should be spread out (cash-flowed) over several fiscal years where applicable, based on the anticipated project schedule and timing of expenditures to maximize available resources.
PennDOT Districts, MPOs/RPOs and transit agencies will work to ensure that all cash flow procedures such as highway AC obligation, public transportation letters of no prejudice, and full funding grant approvals are accounted for in the program development process. AC projects must appear on a TIP in order to be converted into a regular obligation. These AC costs need to be accounted for as part of the program development and management process. PennDOT CPDM, PennDOT Districts and the MPOs/RPOs should plan to carry sufficient federal funding for eligible projects/phases beyond the first two FFYs of the current Program, anticipating that AC conversion will be necessary.
The flexing of federal funds between highway and public transportation projects will be a collaborative decision involving local officials, the MPOs/RPOs, the public transportation agency or agencies, PennDOT, and FHWA/FTA.
The Program must account for inflation using the Year of Expenditure (YOE). The YOE factor should be 3% annually. PennDOT Districts will enter cost estimates in MPMS based on present day costs. MPMS provides calculations to apply the 3% annual YOE factor to this base cost for each year of the program. The amount programmed will be based on the year where funds will be programmed for initial expenditure. The YOE tool can be found under the HWY & BR tab in MPMS.
AIR QUALITY CONFORMITY
Transportation conformity is a process required by CAA Section 176(c), which establishes the framework for improving air quality to protect public health and the environment. The transportation conformity rule (40 CFR Part 93) provides the policy, criteria, and procedures for demonstrating conformity. The goal of transportation conformity is to ensure that FHWA/FTA funding and approvals are given to highway and transit activities that are consistent with air quality goals.
The Clean Air Act (CAA) requires that regional LRTPs, TIPs and Federal projects conform to the purpose of the State Implementation Plan (SIP). Pennsylvania’s SIP is a collection of regulations and documents used to reduce air pollution in areas that do not meet the National Ambient Air Quality Standards (NAAQS). Conformity to a SIP means that such activities will not cause or contribute to any new
30120
DRAFT

2023 Transportation Program General and Procedural Guidance
violations of the NAAQS, increase the frequency or severity of NAAQS violations, or delay timely attainment of the NAAQS or any required interim milestone.
Changes to the TIP or LRTP that involve non-exempt and regionally significant projects may or may not require the need for a conformity determination. As such, the interagency consultation process should be used to evaluate events that may trigger a new determination. Other administrative modifications affecting exempt projects, as defined in 23 CFR 450.104, do not require public review and comment, a demonstration of fiscal constraint, or a conformity determination.
Areas in maintenance or nonattainment of the current NAAQS for the criteria pollutants are required to demonstrate regional transportation air quality conformity. Per the February 16, 2018 D.C. Circuit decision in South Coast Air Quality Management District v. EPA (Case No. 15-1115), areas that were in maintenance for the revoked 1997 8-hour ozone but were designated in attainment for the 2008 ozone NAAQS must demonstrate transportation conformity without a regional emissions analysis, per 40 CFR 93.109(c). A status table of the Pennsylvania areas requiring transportation conformity can be found in the Transportation Conformity folder in SharePoint.
Note, the conformity analyses in the 1997 orphaned ozone areas must be updated every 4 years even though the LRTP is only required to be updated every 5 years. To address this and other timing issues, transportation conformity analyses should typically address both the TIP and LRTP, even if only one program is being updated.
Conformity analyses include all regionally significant transportation projects being advanced, whether the projects are to be funded under 23 USC Chapter 1, 23 USC Chapter 2, or 49 USC Chapter 53, as required in 23 CFR 450.326 (f). In addition, conformity analyses should also include regionally significant projects that do not use any federal funding. Regionally significant projects (as defined in 23 CFR 450.104) are transportation projects on a facility which serves regional transportation needs that result in an expansion of roadway capacity or a major increase in public transit service.
Exempt projects, as defined by the federal conformity regulations (40 CFR 93.126 and 40 CFR 93.127), are project types that typically do not have a significant impact on air quality and are exempt from the requirement to determine conformity. The decision on project exemption and/or regional significance status must include an interagency consultation process with federal, state, and local transportation and air quality partners. The consultation process is outlined in each region’s Conformity SIP. In specific, consultation should include PennDOT CPDM, FHWA PA Division, EPA Region III, DEP, local air agencies (if applicable) and the regional MPO/RPO.
A transportation conformity determination shows the total emissions projected for the nonattainment or maintenance area, including all regionally significant TIP/LRTP projects. The total emissions must be less than the on-road mobile source emissions limits (“MVEB-Mobile Source Emission Budgets”, or “budgets”) established by the SIP to protect public health for the NAAQS.
The regional conformity requirement is separate and apart from any conformity requirements that apply to specific projects, typically as part of the National Environmental Policy Act (NEPA) process. PennDOT CPDM is responsible for partnering in this process by ensuring that the TIPs (and by extension the STIP) are in conformance. Project-level conformity analyses and screening will be conducted by PennDOT using PennDOT’s Project-Level Air Quality Handbook (PUB 321).
31121
DRAFT

2023 Transportation Program General and Procedural Guidance
The completion of a regional TIP or LRTP conformity analysis includes the following key steps:
1. PennDOT CPDM will provide an air quality kick-off meeting / training session before eachbiennial TIP program cycle. The meeting will provide an overview of the conformity process andidentify roles and responsibilities for each agency. Required meeting attendees includePennDOT CPDM, District, and MPO/RPO staff that cover regions in nonattainment ormaintenance for the NAAQS. This includes areas that must address the 1997 ozone NAAQS.
2. PennDOT CPDM, PennDOT Districts, the Pennsylvania Turnpike Commission (PTC), and theMPO/RPOs will coordinate on the identification of air quality significant projects to be includedin the regional transportation conformity analyses using the PennDOT Project Review andClassification Guidelines for Regional Air Quality Conformity document as found in theTransportation Conformity folder in SharePoint. PennDOT CPDM and the PennDOT Districts willbe responsible for reviewing or developing clear project descriptions and providing regionalsignificance and exempt project coding within PennDOT’s Multimodal Project ManagementSystem (MPMS). This should be a joint, coordinated effort with the regional MPO and/or RPO.PennDOT CPDM, PennDOT Districts, or MPO/RPO staff will coordinate with PTC to obtain a listof Turnpike projects that may require analysis. The PTC and Interstate (IM) projects should bedistributed to the applicable MPOs/RPOs for inclusion in their regional programs.
3. Decisions on project-level air quality significance must also include an interagency consultationprocess with federal, state, and local transportation and air quality partners. PennDOT’sInteragency Consultation Group (ICG) reviews the proposed highway and transit project listsfrom each MPO/RPO before air quality conformity determination work begins by theMPOs/RPOs and/or PennDOT. The consultation process relies on the project descriptionsprovided in MPMS. The project descriptions must accurately and completely reflect the projectscope and schedule, so that a determination can be made whether the project is regionallysignificant. This includes facility names, project limits, location, if and how capacity (highwayand transit) will be expanded as part of the funded improvements. The consultation process isconducted using PennDOT’s Air Quality SharePoint site, which is maintained by PennDOT CPDM.Typically, a 2-week timeframe should be provided to the ICG for the review of air qualitysignificant projects.
4. PennDOT and the MPOs/RPOs conduct the conformity emission analyses using EPA’s approvedemission model and available transportation data. If one is available, the MPO/RPO’s traveldemand model is often the most effective tool to complete the conformity analysis. PennDOTCPDM provides support to the MPOs/RPOs in preparing the latest planning assumptions andcompleting the conformity analyses.
5. PennDOT and the MPOs/RPOs complete a transportation conformity report that includes theresults of the emissions modeling (if applicable) and a list of air quality significant projects.Note: emission modeling is not required for areas only in maintenance for the 1997 orphanedozone NAAQS. The transportation conformity report should be uploaded to PennDOT’s AirQuality SharePoint website and shared with the ICG for review and comment before the publiccomment period.
32122
DRAFT
2023 Transportation Program General and Procedural Guidance
6. The MPOs/RPOs must provide their regional air quality conformity determination for publicreview, as specified in their public participation plans and detailed in the Conformity Rule andFHWA’s Conformity Guide. MPOs /RPOs that do not perform their own air quality conformityanalysis should allow adequate time for completion of air quality conformity analysis byPennDOT’s consultants, keeping in mind that the 30-day TIP public comment period, Boardapproval of the TIP, and final TIP submission to PennDOT CPDM needs to occur in accordancewith the 2023 Transportation Program development schedule available in Appendix 1. PennDOTCPDM, FHWA, FTA and EPA verify the completion of air quality testing and analysis as part of theSTIP/TIP review process.
7. The MPOs/RPOs must complete all steps of the transportation conformity and programapproval process. These steps include (in order):
a. Review and brief applicable committees on the conformity reportb. Review and brief applicable committees on the TIP and/or LRTPc. Review and brief applicable committees and Board on response to public commentsd. Board adoption and approval of the air quality conformity report which includes a
summary of the public comment period and any responses to public comments,questions, or concerns.
e. Board adoption and approval of a formal air quality resolution. If requested, CPDM canprovide assistance in reviewing the air quality resolution.
f. Board adoption and approval of the TIP and/or LRTPg. Board adoption and approval of the self-certification resolution
STATEWIDE PROGRAMS
Interstate Program
The Interstate Management (IM) Program is a separate program developed and managed based on statewide needs. From a programming standpoint, the IM Program is fiscally constrained to an annual funding level that is provided as part of Financial Guidance. The IM Program planning and programming responsibilities are handled by PennDOT CPDM, in coordination with other PennDOT Central Office Bureaus, the PennDOT Districts and the MPOs/RPOs.
PennDOT formed an Interstate Steering Committee (ISC) in 2015 to more efficiently manage the significant needs of the statewide Interstate System. The ISC contains representation from PennDOT’s CPDM, BOMO, BPD, and Districts and works with FHWA and the MPOs/RPOs on the development and management of the Interstate Program. The ISC assists with project prioritization and re-evaluates projects during Program updates. The ISC meets monthly to assist with the management of the IM Program.
As part of the IM Program update process, the ISC holds District Interstate rides and presentations to get a statewide perspective of the current state of the Interstate System in Pennsylvania. Representatives from the ISC, FHWA, and PennDOT BOMO, CPDM, and Districts ride the entire Interstate System to assess current conditions and review both currently planned and potential projects. PennDOT Districts then provide presentations to the ISC with updates on conditions, challenges, best practices and needs
33123
DRAFT

2023 Transportation Program General and Procedural Guidance
in their respective areas. The presentations are provided via web conference so PennDOT Central Office and Districts, the MPOs/RPOs, and FHWA staff can participate.
Initial programming consideration will be given to currently programmed Interstate projects without regular obligation/encumbrance or with AC obligation that need to be carried over from the current Program. Once the financial magnitude of the carry-over projects has been determined, an estimate can be made on the amount of program funds available for new IM projects, with consideration of current project schedules.
The carry-over projects and any new projects will be evaluated based on current field conditions from the Interstate rides and asset management criteria provided by BOMO Asset Management. Project prioritization and selection will be consistent with the Interstate Management Program Guidelines (Chapter 13 of PUB 242), the TAMP, and system management to the network LLCC. The IM Program project prioritization and selection process will be documented as part of the STIP submission.
Railway-Highway Crossings Program
The Railway-Highway Crossings Program, also referred to as the Section 130 (RRX) Program, is another program developed and managed based on statewide needs. From a programming standpoint, the RRX Program is fiscally constrained to an annual funding level provided by Financial Guidance. The RRX Program planning and programming responsibilities are handled by PennDOT CPDM, based on coordination with PennDOT District and Central Office Grade Crossing Unit engineers, District planning and programming staff, and the MPOs/RPOs.
Initial programming consideration will be given to currently programmed projects without regular obligation/encumbrance or with AC obligation that need to be carried over from the current Program. New projects will be identified by PennDOT Districts in coordination with the MPOs/RPOs. Projects will be prioritized and selected based on locations with the highest hazard rating from the FRA Web Accident Prediction System and locations with other local or railroad safety concerns, including increased train traffic, near-miss history or antiquated warning devices. Consideration will also be given to the project development process and current project schedules when developing the RRX Program.
Selected projects will be added to regional MPO/RPO programs utilizing a Statewide Line Item from the Program to maintain fiscal constraint. The RRX Program project prioritization and selection process will be documented as part of the STIP submission.
Transportation Alternatives Set-Aside
The Transportation Alternatives Set-Aside of the Surface Transportation Block Grant Program (TA Set-Aside) provides funding for programs and projects defined as transportation alternatives, including on- and off-road pedestrian and bicycle facilities, infrastructure projects for improving non-driver access to public transportation and enhanced mobility, community improvement activities, environmental mitigation, trails that serve a transportation purpose, and safe routes to school projects.
The FAST Act further sub-allocates TA Set-Aside funding based upon population. Funds available for any area of the state, urban areas with populations of 5,001 to 200,000 and areas with population of 5,000
34124
DRAFT

2023 Transportation Program General and Procedural Guidance
or less are centrally managed by PennDOT. PennDOT Central Office, with coordination and input from PennDOT Districts and the MPOs/RPOs, selects projects through a statewide competitive application process. Projects are evaluated using PennDOT’s Core Principles, which are found in Design Manual 1. These Principles encourage transportation investments that are tailored to important local factors, including land use, financial concerns, and overall community context. Project deliverability, safety, and the ability to support EJ principles and enhance local or regional mobility are also considered during project evaluation. The planning and programming responsibilities for these TA Set-Aside funds are handled by PennDOT CPDM, and funding is fiscally constrained to an annual funding level by Financial Guidance.
Selected projects are added to regional MPO/RPO programs utilizing a Statewide Line Item to maintain fiscal constraint. Projects selected under previous application rounds without regular obligation or with AC obligation will be carried over from the current Program. The balance of funds from any carryover projects will remain in a Statewide Line Item on the Statewide Program until there is a new or continuing Federal Authorization that includes updated provisions for the TA Set-Aside program. Additional information about the TA Set-Aside can be found on PennDOT’s TA Set-Aside Funding Site.
A separate regional allocation of funding is available for urbanized areas with populations over 200,000. These funds are available for MPOs to administer competitive application rounds to select eligible projects for inclusion on their regional TIPs. Funding is fiscally constrained based on annual funding amounts provided in Financial Guidance. The MPOs/RPOs will coordinate with the PennDOT CPDM TA Set-Aside state coordinator prior to initiating a project selection round.
Spike Funding
Financial Guidance includes a set-aside of several flavors of highway funding reserved for the Secretary of Transportation’s discretion. The Secretary’s “Spike” funding is fiscally constrained to an annual funding level provided by Financial Guidance. The Spike funding planning and programming responsibilities are handled by PennDOT CPDM, based on direction provided from the Secretary.
Historically, the Secretary of Transportation has selected projects to receive Spike funding in order to offset the impact of high-cost projects, implement special initiatives, or advance statewide priority projects. The Spike funding decisions typically continue previous Spike commitments, with any new project selections aligning with the Department’s strategic direction and investment goals. Selected Spike projects are added to the regional MPO/RPO, IMP, or Statewide items TIP, utilizing Statewide Line Items from the Statewide Program to maintain fiscal constraint.
PUBLIC COMMENT
As part of their regional TIP development, the MPOs/RPOs will ensure that their regional highway/bridge and transit TIPs provide the following information:
• Sufficient detailed descriptive material to clarify the design concept and scope as well as thelocation of the improvement. The MPO/RPO and PennDOT District(s) must collaborate on theinformation for the public narrative.
• Projects or phases of projects assigned by year (e.g. FFY 2023, 2024, 2025, 2026) should bebased upon the latest project schedules and consistent with 23 CFR 450.326(g).
35125
DRAFT

2023 Transportation Program General and Procedural Guidance
• Detailed project and project phase costs should be delineated between federal, state, and localshares. Each project and its associated phase costs should depict the amount to beobligated/encumbered for each funding category on a per year basis.
• Phase estimates and total costs should reflect YOE in the TIP period, per Financial Guidance.• The estimated total project cost should be included, which may extend beyond the 4 years of
the TIP into the TYP/LRTP.• There should be identification of the agency or agencies responsible for implementing the
project or phase (i.e. the specific Transit agency, PennDOT District(s), MPO/RPO, localgovernment, or private partner). Each MPO/RPO will work with all project administrators toprovide any additional information that needs to be included with each project to be listed intheir regional Program.
PennDOT CPDM will provide the information above for Statewide-managed programs for the STIP.
The MPO/RPO TIPs, including the MPO/RPO portions of the IM TIP, must be made available for public comment for a minimum of 30 days and in accordance with the procedures outlined in the MPO/RPO PPPs. A formal public comment period for the regional TIPs must be established to gather all comments and concerns on the TIPs and related documents. A separate STIP 15-day public comment period will be established. PennDOT CPDM, PennDOT Districts and the MPOs/RPOs shall make STIP/TIP information (such as technical information and meeting notices) available in electronically accessible formats and means, such as websites and mobile devices.
Joint outreach efforts can result in a more effective program overall and more efficient use of labor across all MPOs/RPOs. Straightforward and comprehensive access to all public documentation (including the draft and final STIP, TIP and TYP project listings) should be made available to all members of the public, including those individuals with LEP. As part of their public outreach, MPOs/RPOs should take advantage of available resources, including translation services, social media tools, other online resources, and local community organizations.
All 2023 Transportation Program guidance documents will available at Talkpatransportation.com for program development use by the MPOs/RPOs and other interested parties. PennDOT and MPO/RPO websites shall be used to keep the public well informed, giving them access to the available data used in the Program update, informing them how they can get involved in the TIP update process, giving notice regarding public participation activities, and offering the opportunity for review and comment at key TIP development decision points. To provide a central location for regional public comment opportunities, PennDOT CPDM will post the regional public comment periods and links to the MPO/RPO websites on PennDOT’s website. The MPOs/RPOs must post the applicable TIP documents on their regional websites for public review and comment. The table located in the TIP Submission section below outlines the required documents that must be included for public comment.
After the public comment periods have ended, the PennDOT Districts will partner with the MPOs/RPOs to develop responses to the public comments. These responses will be documented as part of the regional TIP submissions that are sent to PennDOT CPDM.
36126
DRAFT

2023 Transportation Program General and Procedural Guidance
TIP SUBMISSION
MPOs/RPOs, PennDOT Districts, and CPDM will coordinate in the development of draft lists of projects. PennDOT Districts and CPDM are required to attach draft lists of projects in MPMS as noted on the 2023 Transportation Program development schedule available in Appendix 1. In addition to the project list being attached in MPMS, the MPOs/RPOs should submit a draft version of available TIP development documentation to CPDM which will then share with FHWA, FTA, BPT, and BOMO. This documentation should include the project selection process, a description of the anticipated effect of the TIP toward achieving the performance targets, the individual roles and responsibilities of the MPOs/RPOs, PennDOT Districts and Central Office, and a timeline. This will allow for early coordination with PennDOT Districts, CPDM, FHWA, and FTA for review and feedback prior to the draft TIP public comment period.
Following the draft TIP public comment period and the individual TIPs are approved by the MPOs/RPOs, they must be formally submitted to PennDOT CPDM. The formal submission should include a cover letter and all required documentation, along with the completed TIP Checklist in Appendix 3. The TIP Checklist will be verified by PennDOT CPDM, FHWA and FTA upon review of the TIP Submission package. The MPO/RPO TIP Submission requirements are summarized below:
TIP Submissions Must Include the Following: Include for Public Review and Comment
1 Cover Letter 2 TIP Development/Project Selection Process Documentation 3 TIP Development Timeline 4 TPM (PM1, PM2, and PM3) Narrative Documentation 5 Transit Performance Measures Narrative Documentation 6 Highway and Bridge TIP Listing with public narrative 7 Public Transportation TIP Listing with public narrative 8 Interstate TIP Listing with public narrative (regional portion) 9 TIP Financial Constraint Chart
10 Public Transportation Financial Capacity Analysis (MPO Only) 11 EJ Analysis and Documentation 12 Air Quality Conformity Determination Report (if applicable) 13 Air Quality Resolution (if applicable) 14 Public Comment Period Advertisement 15 Documented Public Comments received (if applicable) 16 Title VI Policy Statement 17 TIP Revision Procedures 18 Self-Certification Resolution 19 List of major projects from the previous TIP that were implemented 20 List of major regional projects from the previous TIP that were delayed 21 TIP Checklist
An electronic version of the regional TIP Submission must be provided to PennDOT CPDM, according to the 2023 Transportation Program development schedule in Appendix 1. The electronic version of the TIP Submission, including the TIP Checklist, should be submitted through SharePoint. PennDOT CPDM
37127
DRAFT

2023 Transportation Program General and Procedural Guidance
will verify that the items on the TIP Checklist have been completed and that all required documents have been included along with each TIP submission.
PennDOT CPDM will combine the individual TIPs to create the STIP. The STIP, which is included as the first four years of the TYP, will be submitted by PennDOT CPDM to the STC for their approval at their August 2022 meeting. After STC approval, PennDOT will submit the STIP on behalf of the Governor to FHWA/FTA for their 45-day review period. FHWA/FTA will issue their approval of the STIP, which is contained in the Planning Finding document, by the end of the 45-day period, which should occur before the start of the new 2023 FFY on October 1.
PROGRAM ADMINISTRATION
After adoption, the 2023 Transportation Program must continue to be modifiable based on necessary program changes. Adjustments to the 2023 Program are enacted through procedures for STIP/TIP Modification at both the State and MPO/RPO levels. The Statewide Memorandum of Understanding (MOU), which outlines the procedures for 2023 STIP modifications, is jointly developed by PennDOT, FHWA and FTA. The Statewide MOU sets the overarching principles agreed to between PennDOT and FHWA/FTA. Individual MOUs are then developed and adopted by the MPOs/RPOs, utilizing the Statewide MOU as a reference. The regional MOUs cannot be less restrictive than the Statewide MOU. The new procedures for TIP revision/modification must be part of the public comment period on the draft 2023 Program.
The modification procedures that were approved for the 2021 Program will be used as a starting point for the development of procedures for the 2023 Program. These procedures are required to permit the movement of projects or phases of projects within the STIP/TIP while maintaining year-by-year fiscal constraint. This process helps to ensure that the MPO/RPO TIPs and the STIP are consistent with the TYP and regional LRTPs, and vice versa. PennDOT CPDM will work with FHWA/FTA to develop and implement a streamlined revision process.
Changes to the TIPs and the delivery of completed projects are monitored by PennDOT CPDM, PennDOT Districts and the MPOs/RPOs and are the subject of various program status reports. PennDOT CPDM will track the progress of the highway Program and project implementation and share the findings with the MPOs/RPOs. PennDOT CPDM will send the MPOs/RPOs quarterly progress reports that detail current project obligations that have occurred in the current FFY.
In accordance with 23 CFR 450.334, all Pennsylvania MPOs/RPOs, transit agencies, and PennDOT will cooperatively develop an Annual Listing of Obligated Projects for which Federal funds have been obligated in the previous FFY. The listing must include all Federally funded projects authorized or revised to increase obligations in the preceding program year and, at a minimum, include the following for each project:
• the amount of funds requested on the TIP• Federal funding that was obligated during the preceding year• Federal funding remaining and available for subsequent years• sufficient description to identify the project or phase• identification of the agencies responsible for carrying out the project or phase
38128
DRAFT

2023 Transportation Program General and Procedural Guidance
PennDOT CPDM will continue to work with the MPOs/RPOs and transit agencies to assist them in developing the regional obligation reports. The listing of projects must be published on respective MPO/RPO websites annually by December 29 (within 90 calendar days of the end of the previous FFY), in accordance with their public participation criteria for the TIP. CPDM Funds Management will provide an annual listing of Highway/Bridge obligations and PennDOT administered executed transit grants. MPOs/RPOs should work with their respective transit agencies to acquire a list of any additional executed grants in which the agencies were the direct recipient of Federal Transit funding. The MPOs/RPOs should share the Annual Listing of Obligated Projects/Executed Grants with their respective Boards/Committees and post the reports on their websites.
39129
DRAFT

Activity Jan-21 Feb-21 Mar-21 Apr-21 May-21 Jun-21 Jul-21 Aug-21 Sep-21 Oct-21 Nov-21 Dec-21 Jan-22 Feb-22 Mar-22 Apr-22 May-22 Jun-22 Jul-22 Aug-22 Sep-22 Oct-22
STC releases Transportation Performance Report 2/17
STC-TYP public comment period 3/1 4/14
STC online public forum 3/23
General/Procedural Guidance Work Group Meetings
Financial Guidance Work Group Meetings
2023 TYP Public Outreach Feedback Provided to STC, MPOs/RPOs and PennDOT to consider for TIP/TYP
Spring/Summer Planning Partners Call 6/29
Draft Interstate carryover projects released
BOMO Asset Management provides PAMS/BAMS outputs for the 2023 Program Update
Districts, MPOs/RPOs and Central Office hold initial program update coordination meetings
Districts, MPOs/RPOs and Central Office meet to coordinate on carryover & candidate projects
Project updates are made in MPMS
Final Program Update Guidance documents released
Interstate Steering Committee Presentations
Statewide STIP MOU development/finalization
Validation of PennDOT Connects PIF forms conducted for new 2023 TIP projects
EJ conditions data (pavement, bridge, safety and transit, if available) made available to MPOs/RPOs
Spike decisions released
Draft Interstate and Statewide Projects announced
Fall Planning Partners Meeting
EJ analysis burdens and benefits analysis is conducted by MPOs/RPOs
PennDOT completes attaching draft TIP/TYP in MPMS 12/31
MPO/RPOs submit available Draft TIP documentation to CPDM and FHWA/FTA for review 12/31
2023 Program Development Schedule
Page 1 of 2
Appendix 1 – 2023 Transportation Program Development Schedule
40130
DRAFT

Activity Jan-21 Feb-21 Mar-21 Apr-21 May-21 Jun-21 Jul-21 Aug-21 Sep-21 Oct-21 Nov-21 Dec-21 Jan-22 Feb-22 Mar-22 Apr-22 May-22 Jun-22 Jul-22 Aug-22 Sep-22 Oct-22
2023 Program Development Schedule
Final IM and Statewide Program Distributed
PennDOT CPDM completes initial review of the preliminary draft TIPs
MPOs, RPOs, and PennDOT reach agreement on their respective portions of the program
PennDOT CPDM to hold draft program review discussions
Interagency air quality consultation
Central Office sends Draft TIPs to FHWA for eligibility review
MPOs, RPOs and PennDOT conduct air quality conformity analysis
STIP Executive Summary Development
TIP Public Comment Periods 6/15
STIP Public Comment Period (15 day)6/1-6/15
CPDM to review STIP public comments
MPOs/RPOs adopt regional TIPs
MPOs/RPOs submit regional TIPs to PennDOT CPDM 7/15
PennDOT CPDM reviews TIP submissions for STIP submittal
STC approves TYP
PennDOT submits STIP to FHWA/FTA on behalf of Governor
FHWA/FTA reviews and approves air quality conformity documents and STIP
2023 Program Begins 10/1
Page 2 of 2
Appendix 1 – 2023 Transportation Program Development Schedule
41131
DRAFT

Appendix 2 – PennDOT Design Manual 1A (Process Chart)
42132
DRAFT

2023-2026 Transportation Program Submission Checklist
Planning Partner:
Information ItemsGreen highlighted items require documentation be submitted.
Response CPDM FHWA FTA
Cover Letter which documents organization and date of TIP adoption Yes / No
Date TIP adopted by Planning Partner: Meeting Date
TIP Development/Project Selection Process Documentation Yes / No
MPO/RPO Specific TIP Development Timeline Yes / No
Does the documentation explain the project selection process, roles, responsibilities and/or project evaluation criteria procedures?
Yes / No
PM1 Narrative Documentation (includes established targets and analysis of progress towards targets)
Yes / No
PM2 Narrative Documentation (includes established targets and analysis of progress towards targets)
Yes / No
PM3 Narrative Documentation (includes established targets and analysis of progress towards targets)
Yes / No
Transit Performance Measures Documentation Yes/No/NA
TAMP narrative documentation demonstrates consistency with the TYP/TIP
Yes / No
4. Highway-BridgeProgram Projects:
Highway and Bridge Listing with public narrative Yes / No
5. PublicTransportationProgram:
Public Transportation Listing with public narrative Yes / No
Regional Portion of Interstate TIP Listing with public narrative Yes/No/NA
Regional Portion of Statewide TIP Listing (Spike, TAP, RRX, HSIP, other)
Yes/No/NA
Complete the tables in the Financial Constraint tab.
Yes / No
Is the TIP financially constrained, by year and by allocations?
Yes / No
Were the TIP projects screened against the federal/state funding program eligibility requirements?
Yes / No
Are estimated total costs to complete projects that extend beyond the TIP years shown in the TYP and LRTP?
Yes / No
[Click Here to View Pop-Up Directions]
Transportation Management Area:
1. Cover Letter:
MPO/RPO to Provide ResponseOthers Check to Indicate Response Verified
2. TIP Development:
3. PerformanceBased Planning andProgramming:
6. Interstate &Statewide ProgramProjects:
7. FinancialConstraint:
Yes No
Page 1 of 4
Appendix 3 – TIP Submission Checklist
43133
DRAFT

2023-2026 Transportation Program Submission Checklist
Planning Partner:
Information ItemsGreen highlighted items require documentation be submitted.
Response CPDM FHWA FTA
[Click Here to View Pop-Up Directions]
Transportation Management Area: MPO/RPO to Provide ResponseOthers Check to Indicate Response Verified
Yes No
Public Transportation Financial Capacity Analysis (MPO Only) Yes/No/NA
Documentation of Transit Asset Management (TAM) Plan Yes / No
EJ Documentation (demographic profile, conditions data, TIP project map, TIP benefits/burdens analysis)
Yes / No
Was EJ analysis incorporated into your TIP development process? Yes / No
Air Quality Conformity Determination Report Yes/No/NA
Air Quality Resolution Yes/No/NA
Is the area in an AQ non-attainment or maintenance area? Yes/No/NA
Have all projects been screened through an interagency consultation process? Yes/No/NA
Most recent air quality conformity determination date: Date/NA
Do projects contain sufficient detail for air quality analysis? Yes/No/NA
Public Comment Period Advertisement Yes / No
Public comment period: Date Range
Public meeting(s)-Date/Time/Location: Date/Time/ Location
Public meeting notices contain info about special needs/ADA Compliance? Yes / No
STIP/TIP public involvement outreach activities consistent with Public Participation Plan? Yes / No
Were any public comments (written or verbal) received? Yes / No
Documentation of Public Comments received Yes/No/NA
Were public comments addressed? Yes/No/NA
12. Title VI:
Has the MPO included information regarding Title VI and its applicability to the TIP, including the protections against discrimination and the availability of the TIP document in alternative formats upon request?
Yes / No
13. TIP RevisionProcedures:
MPO/RPO TIP Modification Procedures (MOU) Yes / No
8. PublicTransportation:
9. EnvironmentalJustice Evaluation ofBenefits andBurdens:
11. PublicParticipationDocumentation:
10. Air Quality:
Page 2 of 4
Appendix 3 – TIP Submission Checklist
44134
DRAFT

2023-2026 Transportation Program Submission Checklist
Planning Partner:
Information ItemsGreen highlighted items require documentation be submitted.
Response CPDM FHWA FTA
[Click Here to View Pop-Up Directions]
Transportation Management Area: MPO/RPO to Provide ResponseOthers Check to Indicate Response Verified
Yes No
Self-Certification Resolution Yes/No/NA
For the Non-TMAs, does the self certification contain documentation to indicate compliance? Yes/No/NA
List of regionally important projects from the previous TIP that were implemented, and projects impacted by significant delays.
Yes / No
Does the TIP contain regional system level estimates of state & local revenue sources beyond financial guidance?
Yes / No
List of annual obligated projects on website for FFY 2022 Yes / No
16. PennDOTConnects:
Municipal outreach/PIF forms initiated/completed for all TIP projects?
Yes / No
Is the TIP consistent with the LRTP? Yes / No
LRTP air quality conformity determination date: Date/NA
LRTP end year: Date
Anticipated MPO/RPO LRTP adoption date: Date
FHWA:
15. OtherRequirements:
14. MPO/RPO Self-CertificationResolution:
17. Long RangeTransportation Plan:
18. Completed/Reviewed by:
Note any noteworthy practices, issues or improvements that should be addressed by the next TIP update, or any other comments/questions here:
19. Comments:
FTA:
MPO/RPO:
Date:
Date:
Date:
Date: PennDOT CPDM:
Page 3 of 4
Appendix 3 – TIP Submission Checklist
45135
DRAFT

2023 - 2026 Transportation Program Development Checklist
Fund TypeFinancial Guidance
ProgrammedFinancial Guidance
ProgrammedFinancial Guidance
ProgrammedFinancial Guidance
Programmed
NHPP
STP
State Highway (581)
State Bridge (185/183)
BOF
HSIP
CMAQ
TAU
STU
Total $0 $0 $0 $0 $0 $0 $0 $0
Additional Funding Type FFY 2023 FFY 2024 FFY 2025 FFY 2026
Total $0 $0 $0 $0
Financial Constraint Tables
Comments
Compare the amount of funds programmed in each year of the TIP against Financial Guidance (FG) allocation, and explain any differences.
Identify the TOTAL amount and TYPES of additional funds programmed above FG allocations (i.e. Spike funds, Earmarks, Local, Other, etc.) by year:
FFY 2023 FFY 2024 FFY 2025 FFY 2026
Comments
Appendix 3 – TIP Submission Checklist
46136
DRAFT

MPMS Planning Partner District County Project Title Phase 2023 2024 2025 2026 2027 2028 2029 2030 2031-34 Total
76401 SEDA-COG 3 Snyder CSVT Southern Section CON 28,414,000 34,186,000 0 0 0 0 0 0 0 62,600,000106682 Interstate 4 Lackawanna Scranton Beltway/Turnpike CON 10,000,000 10,000,000 10,000,000 10,000,000 0 0 0 0 0 40,000,000116177 Interstate 4 Luzerne SR 424 over I-81 FD 0 2,000,000 0 0 0 0 0 0 0 2,000,000116177 Interstate 4 Luzerne SR 424 over I-81 CON 0 0 20,000,000 10,000,000 0 0 0 0 0 30,000,000
9128 Scranton/W-B 4 Luzerne SR 115 over I-81 CON 0 23,191,512 0 0 0 0 0 0 0 23,191,512110070 Lehigh Valley 5 Northampton 22 from Farmersville Rd to 512 CON 5,500,000 0 0 0 0 0 0 0 0 5,500,00014581 DVRPC 6 Chester US 1: PA 896 - PA 41 CON 0 0 0 0 0 15,000,000 15,000,000 0 0 30,000,00014698 DVRPC 6 Chester 422: Hanover-PA100 CON 0 0 36,000,000 20,000,000 0 0 0 0 0 56,000,000107551 DVRPC 6 Chester SR30/SR10 to Business 30 Int. Imp CON 0 0 0 20,000,000 20,000,000 0 0 0 0 40,000,000107553 DVRPC 6 Chester SR30 & Airport Rd Interchange Imp. CON 0 0 0 20,000,000 10,000,000 0 0 0 0 30,000,000107554 DVRPC 6 Chester US30 & PA82 Interchange Imp. CON 0 0 0 0 0 0 10,000,000 10,000,000 10,000,000 30,000,00090839 Franklin 8 Franklin Rocky Mountain Creek Br CON 3,400,000 0 0 0 0 0 0 0 0 3,400,00092931 Interstate 8 Dauphin Eisenhower Interchange CON 0 0 40,000,000 40,000,000 25,000,000 20,650,000 18,250,000 0 0 143,900,00097828 Interstate 8 Dauphin I-83 East Shore Section 3 CON 43,191,512 2,596,488 0 0 0 0 0 0 0 45,788,000113357 Interstate 8 Dauphin I-83 East Shore Section 3B CON 0 16,601,000 18,000,000 0 0 0 0 0 0 34,601,000113376 Interstate 8 Dauphin I-83 East Shore Section 3C CON 0 0 0 0 0 0 0 30,000,000 150,000,000 180,000,000113378 Interstate 8 Dauphin Eisenhower Interchange B ROW 0 0 6,000,000 0 0 0 0 0 0 6,000,000113378 Interstate 8 Dauphin Eisenhower Interchange B CON 0 0 0 0 10,000,000 30,000,000 35,000,000 30,000,000 74,201,000 179,201,000113380 Interstate 8 Dauphin Eisenhower Interchange C ROW 0 0 1,500,000 0 0 0 0 0 0 1,500,000113380 Interstate 8 Dauphin Eisenhower Interchange C CON 0 0 0 0 0 0 0 0 59,685,488 59,685,488113381 Interstate 8 Dauphin Eisenhower Interchange D ROW 0 0 900,000 0 0 0 0 0 0 900,000113381 Interstate 8 Dauphin Eisenhower Interchange D CON 0 0 0 0 0 0 0 0 25,000,000 25,000,000114698 Interstate 8 Dauphin I-83 Eisenhower RR Bridge CON 0 0 20,000,000 11,800,000 0 0 0 0 0 31,800,00092924 Interstate 8 York North York Widening #3 (Exit 21 & 22) ROW 9,000,000 0 0 0 0 0 0 0 0 9,000,00092924 Interstate 8 York North York Widening #3 (Exit 21 & 22) CON 0 0 0 0 24,517,000 20,000,000 0 0 0 44,517,000112540 Interstate 8 York Mill Creek Relocation CON 5,600,000 0 0 0 0 0 0 0 0 5,600,000112548 Interstate 8 York Sherman Street & Eberts Lane CON 12,068,000 0 0 0 0 0 0 0 0 12,068,000112549 Interstate 8 York North York Widening #1 (Exit 19) CON 0 0 0 0 0 0 20,738,488 30,650,000 83,711,512 135,100,000112550 Interstate 8 York North York Widening #2 (Codorus Creek Bridge) CON 41,588,000 62,348,000 0 0 0 0 0 0 0 103,936,000109618 Lancaster 8 Lancaster US 222 Reconstruction CON 0 0 20,000,000 0 0 0 0 0 0 20,000,00099874 Interstate 11 Allegheny Squirrel Hill Interchange CON 0 0 0 30,000,000 15,000,000 15,000,000 0 0 0 60,000,000105438 Interstate 11 Allegheny I-376, Commercial Street Bridge CON 25,000,000 25,901,000 0 0 0 0 0 0 0 50,901,000102466 STWD Items 99 Central Office NHPP Reserve CON 600,488 2,229,000 1,438,000 6,919,000 3,431,000 0 1,661,512 0 0 16,279,000117258 STWD Items 99 Central Office BIL Reserve CON 0 0 0 0 50,771,000 50,623,000 50,623,000 50,623,000 202,492,000 405,132,000
184,362,000 179,053,000 173,838,000 168,719,000 158,719,000 151,273,000 151,273,000 151,273,000 605,090,000 1,923,600,000
2023 Program - Spike Projects (NHPP)
Appendix 4 - Secretary's "Spike" Decisions Project Listing
137
DRAFT

MPMS Planning Partner District County Project Title Phase 2023 2024 2025 2026 2027 2028 2029 2030 2031-34 Total108952 Erie 1 Erie Central Bayfront Parkway Multimodal CON 3,650,000 0 0 0 0 0 0 0 0 3,650,000116638 Erie 1 Erie I-79 Erie County ITS Addition - Interchange - TSMO CON 79,625 79,625 0 0 0 0 0 0 0 159,250116639 Erie 1 Erie I-90 Erie County ITS Addition - SR 19 - TSMO CON 79,625 79,625 0 0 0 0 0 0 0 159,250116591 Northwest 1 Crawford I-79/SR 6 Crawford County ITS Addition - TSMO CON 79,625 79,625 0 0 0 0 0 0 0 159,250116641 SVTS 1 Mercer I-79 Mercer County ITS at Grove City - TSMO CON 79,625 79,625 0 0 0 0 0 0 0 159,250
2898 Centre 2 Centre T-633, Potter Run Bridge FD 254,616 0 0 0 0 0 0 0 0 254,6162898 Centre 2 Centre T-633, Potter Run Bridge ROW 42,436 0 0 0 0 0 0 0 0 42,4362898 Centre 2 Centre T-633, Potter Run Bridge UTL 42,436 0 0 0 0 0 0 0 0 42,4362898 Centre 2 Centre T-633, Potter Run Bridge CON 0 707,824 0 0 0 0 0 0 0 707,8242963 Centre 2 Centre T-467, Fishing Creek Bridge FD 212,180 0 0 0 0 0 0 0 0 212,1802963 Centre 2 Centre T-467, Fishing Creek Bridge ROW 42,436 0 0 0 0 0 0 0 0 42,4362963 Centre 2 Centre T-467, Fishing Creek Bridge UTL 42,436 0 0 0 0 0 0 0 0 42,4362963 Centre 2 Centre T-467, Fishing Creek Bridge CON 0 655,636 0 0 0 0 0 0 0 655,636
95971 SEDA-COG 2 Mifflin T-439 ov Kishacoquillas CON 0 2,000,000 0 0 0 0 0 0 0 2,000,000118008 Northern Tier 3 Bradford Sayre Traffic Signal Improvements CON 150,000 0 0 0 0 0 0 0 0 150,000116059 NEPA 4 Pike Shohola Falls Road over Balliard Creek PE 361,000 0 0 0 0 0 0 0 0 361,000116059 NEPA 4 Pike Shohola Falls Road over Balliard Creek FD 209,000 0 0 0 0 0 0 0 0 209,000116059 NEPA 4 Pike Shohola Falls Road over Balliard Creek ROW 22,000 0 0 0 0 0 0 0 0 22,000116059 NEPA 4 Pike Shohola Falls Road over Balliard Creek UTL 20,000 0 0 0 0 0 0 0 0 20,000116059 NEPA 4 Pike Shohola Falls Road over Balliard Creek CON 0 728,000 0 0 0 0 0 0 0 728,000116060 NEPA 4 Pike Carlton Hill Road over Taylor Creek PE 235,000 0 0 0 0 0 0 0 0 235,000116060 NEPA 4 Pike Carlton Hill Road over Taylor Creek FD 166,000 0 0 0 0 0 0 0 0 166,000116060 NEPA 4 Pike Carlton Hill Road over Taylor Creek ROW 28,000 0 0 0 0 0 0 0 0 28,000116060 NEPA 4 Pike Carlton Hill Road over Taylor Creek UTL 10,000 0 0 0 0 0 0 0 0 10,000116060 NEPA 4 Pike Carlton Hill Road over Taylor Creek CON 0 231,000 0 0 0 0 0 0 0 231,000117103 Scranton/W-B 4 Lackawanna Lackawanna County Capital Budget Paving 2021 CON 0 2,000,000 0 0 0 0 0 0 0 2,000,000113521 Scranton/W-B 4 Luzerne Hillside Road over Tobys Creek FD 250,000 0 0 0 0 0 0 0 0 250,000113521 Scranton/W-B 4 Luzerne Hillside Road over Tobys Creek ROW 50,000 0 0 0 0 0 0 0 0 50,000113521 Scranton/W-B 4 Luzerne Hillside Road over Tobys Creek UTL 50,000 0 0 0 0 0 0 0 0 50,000113521 Scranton/W-B 4 Luzerne Hillside Road over Tobys Creek CON 0 1,500,000 0 0 0 0 0 0 0 1,500,000
9833 Wayne 4 Wayne Carley Brook Bridge 2 CON 1,700,000 0 0 0 0 0 0 0 0 1,700,00068190 Lehigh Valley 5 Lehigh Freeway Service Patrol CON 77,490 77,490 0 0 0 0 0 0 0 154,980110086 Lehigh Valley 5 Lehigh LVTS Urban ITS CON 293,125 293,125 0 0 0 0 0 0 0 586,250116727 NEPA 5 Carbon Dynamic Curve Warning Signs - NEPA CON 62,069 0 0 0 0 0 0 0 0 62,069110329 NEPA 5 Schuylkill Co. Br. 114 (Zimmerman Br) over L. L. Swatara Crk. CON 525,593 0 0 0 0 0 0 0 0 525,593115014 NEPA 5 Schuylkill Relocate Existing Message Board (78 WB to 81 NB) CON 45,000 0 0 0 0 0 0 0 0 45,00061972 Reading 5 Berks US 222 Widening CON 0 0 0 0 11,717,324 0 0 0 0 11,717,32494900 Reading 5 Berks Freeway Service Patrol CON 142,458 142,458 0 0 0 0 0 0 0 284,916114439 Reading 5 Berks West Shore Bypass - Phase 1 CON 0 0 0 0 0 35,000,000 35,000,000 35,000,000 140,238,924 245,238,924116752 Reading 5 Berks Dynamic Curve Warning Signs - RATS CON 0 70,841 0 0 0 0 0 0 0 70,841110091 DVRPC 6 Bucks King Rd Bridge o/ Herkaken Cr ROW 30,000 0 0 0 0 0 0 0 0 30,000110091 DVRPC 6 Bucks King Rd Bridge o/ Herkaken Cr UTL 20,000 0 0 0 0 0 0 0 0 20,000110091 DVRPC 6 Bucks King Rd Bridge o/ Herkaken Cr CON 0 1,350,000 0 0 0 0 0 0 0 1,350,00086276 DVRPC 6 Chester Twp Co Brg 297 o/ W BigElk ROW 40,000 0 0 0 0 0 0 0 0 40,00086276 DVRPC 6 Chester Twp Co Brg 297 o/ W BigElk UTL 40,000 0 0 0 0 0 0 0 0 40,00086276 DVRPC 6 Chester Twp Co Brg 297 o/ W BigElk CON 0 1,270,000 0 0 0 0 0 0 0 1,270,000103528 DVRPC 6 Delaware Mattson O/W Br Chester Cr FD 300,000 0 0 0 0 0 0 0 0 300,000103528 DVRPC 6 Delaware Mattson O/W Br Chester Cr ROW 20,000 0 0 0 0 0 0 0 0 20,000103528 DVRPC 6 Delaware Mattson O/W Br Chester Cr UTL 15,000 0 0 0 0 0 0 0 0 15,000103528 DVRPC 6 Delaware Mattson O/W Br Chester Cr CON 0 1,315,000 0 0 0 0 0 0 0 1,315,000103372 DVRPC 6 Montgomery Waverly Rd O/Tacony Cr ROW 25,000 0 0 0 0 0 0 0 0 25,000103372 DVRPC 6 Montgomery Waverly Rd O/Tacony Cr UTL 25,000 0 0 0 0 0 0 0 0 25,000103372 DVRPC 6 Montgomery Waverly Rd O/Tacony Cr CON 0 1,300,000 0 0 0 0 0 0 0 1,300,000
2023 Program - Spike Projects (STP)
138
DRAFT

MPMS Planning Partner District County Project Title Phase 2023 2024 2025 2026 2027 2028 2029 2030 2031-34 Total
2023 Program - Spike Projects (STP)
102134 DVRPC 6 Philadelphia Henry Ave Congested Corr2 (C) CON 325,000 0 0 0 0 0 0 0 0 325,000106264 DVRPC 6 Philadelphia Penn's Landing Project Development CON 28,465,867 13,816,540 19,093,593 20,619,000 0 0 0 0 0 81,995,000111515 DVRPC 6 Philadelphia Cherokee St. o/ Valley Green Rd. CON 0 1,660,000 0 0 0 0 0 0 0 1,660,000117825 Harrisburg 8 Dauphin I-283 ITS Fiber Inter CON 176,900 176,900 0 0 0 0 0 0 0 353,800117824 Harrisburg 8 Perry US 22/322 Devices CON 402,970 402,970 0 0 0 0 0 0 0 805,940110280 York 8 York College Avenue Bridge CON 0 2,000,000 0 0 0 0 0 0 0 2,000,000117635 Altoona 9 Blair I-99 Fiber Repair and Upgrade PE 10,000 0 0 0 0 0 0 0 0 10,000117635 Altoona 9 Blair I-99 Fiber Repair and Upgrade CON 0 160,000 0 0 0 0 0 0 0 160,000117633 S. Alleghenies 9 Fulton I-70 Curve Warning System CON 115,000 0 0 0 0 0 0 0 0 115,000117634 S. Alleghenies 9 Fulton I-70 Intelligent Transportation System (ITS) Gap CON 232,500 232,500 0 0 0 0 0 0 0 465,00085574 SPC 10 Armstrong Margaret Rd Intersection CON 0 6,453,000 11,479,407 6,828,793 0 0 0 0 0 24,761,20024471 SPC 10 Butler CO #24 Kelly Bridge PE 420,000 0 0 0 0 0 0 0 0 420,00024471 SPC 10 Butler CO #24 Kelly Bridge FD 300,000 0 0 0 0 0 0 0 0 300,00024471 SPC 10 Butler CO #24 Kelly Bridge ROW 23,000 0 0 0 0 0 0 0 0 23,00024471 SPC 10 Butler CO #24 Kelly Bridge UTL 130,000 0 0 0 0 0 0 0 0 130,00024471 SPC 10 Butler CO #24 Kelly Bridge CON 0 1,127,000 0 0 0 0 0 0 0 1,127,000116661 SPC 10 Butler I-79 Seneca Ramps - TSMO FD 75,000 0 0 0 0 0 0 0 0 75,000116661 SPC 10 Butler I-79 Seneca Ramps - TSMO CON 0 350,000 0 0 0 0 0 0 0 350,00027225 SPC 11 Allegheny 2048 Wm Penn Hwy/I-376 Ramp to PA 48 CON 225,000 225,000 0 0 0 0 0 0 0 450,000115277 SPC 11 Allegheny Western Regional TMC Upgrade PE 175,000 0 0 0 0 0 0 0 0 175,000113607 SPC 11 Beaver I-376, ITS Installation - Beaver County CON 500,000 500,000 0 0 0 0 0 0 0 1,000,00086225 SPC 12 Greene Greene County #75 FD 180,000 0 0 0 0 0 0 0 0 180,00086225 SPC 12 Greene Greene County #75 ROW 70,000 0 0 0 0 0 0 0 0 70,00086225 SPC 12 Greene Greene County #75 UTL 50,000 0 0 0 0 0 0 0 0 50,00086225 SPC 12 Greene Greene County #75 CON 0 1,100,000 0 0 0 0 0 0 0 1,100,000112595 SPC 12 Greene Greene County #73 FD 175,000 0 0 0 0 0 0 0 0 175,000112595 SPC 12 Greene Greene County #73 UTL 10,000 0 0 0 0 0 0 0 0 10,000115214 SPC 12 Washington D12 I-70 Cameras Exit 39-43 CON 0 0 0 130,000 147,000 0 0 0 0 277,000115218 SPC 12 Washington D12 I-70 Fiber Installation-1 CON 0 0 0 110,000 124,088 0 0 0 0 234,088115220 SPC 12 Washington D12 I-70 Fiber Installation-2 CON 0 0 0 110,000 124,088 0 0 0 0 234,088108140 SPC 12 Westmoreland LVTIP: Pleasant Unity to Airport CON 0 0 9,000,000 13,511,207 7,488,793 0 0 0 0 30,000,000117516 SPC 12 Westmoreland I-70 Fiber Installation (Segments 404-434) CON 0 401,048 0 0 0 0 0 0 0 401,048117519 SPC 12 Westmoreland I-70 Fiber Installation Segment 0474-0494 CON 0 294,580 0 0 0 0 0 0 0 294,580117520 SPC 12 Westmoreland I-70 Fiber Installation Segment 0554-0570 CON 0 223,936 0 0 0 0 0 0 0 223,936102620 STWD Items 99 Central Office STP Reserve CON 1,270,000 1,296,000 1,322,000 1,348,000 16,513,883 720,000 720,000 720,000 2,640,076 26,549,959111145 STWD Items 99 Central Office TSMO Reserve CON 0 0 5,000,000 4,650,000 4,604,824 5,000,000 5,000,000 5,000,000 20,000,000 49,254,824112699 STWD Items 99 Central Office Statewide INRIX Contract PRA 1,523,988 980,652 0 0 0 0 0 0 0 2,504,640112701 STWD Items 99 Central Office Statewide Fiber Plan Development PRA 50,000 50,000 0 0 0 0 0 0 0 100,000114552 STWD Items 99 Central Office Historic Metal Truss Bridge Preservation Reserve CON 1,000,000 1,000,000 2,000,000 2,000,000 2,000,000 2,000,000 2,000,000 2,000,000 8,000,000 22,000,000116554 STWD Items 99 Central Office TSMO Program Plan Development PRA 100,000 100,000 0 0 0 0 0 0 0 200,000117258 STWD Items 99 Central Office BIL Reserve CON 0 0 0 0 6,587,000 6,587,000 6,587,000 6,587,000 26,348,000 52,696,000118052 STWD Items 99 Central Office PennDOT Pollinator Initiative CON 550,000 550,000 550,000 550,000 550,000 550,000 550,000 550,000 2,200,000 6,600,000
46,072,000 47,060,000 48,445,000 49,857,000 49,857,000 49,857,000 49,857,000 49,857,000 199,427,000 590,289,000
139
DRAFT

MPMS Planning Partner District County Project Title Phase 2023 2024 2025 Tot 2026 2027 2028 2029 2030 2031-34 Total
99603 Northwest 1 Crawford US 322: Pine Rd to US 6 CON 0 0 1,900,000 0 0 0 0 0 0 1,900,000112784 Centre 2 Centre State College Area Connector PE 0 5,000,000 0 0 0 0 0 0 0 5,000,000112784 Centre 2 Centre State College Area Connector FD 0 0 5,000,000 5,000,000 12,036,000 10,000,000 7,964,000 0 0 40,000,000112784 Centre 2 Centre State College Area Connector ROW 0 0 0 0 0 0 0 0 28,000,000 28,000,000112784 Centre 2 Centre State College Area Connector UTL 0 0 0 0 10,000,000 10,000,000 9,000,000 0 0 29,000,000112784 Centre 2 Centre State College Area Connector CON 0 0 0 0 0 0 0 0 179,000,000 179,000,00095989 North Central 2 Cameron T-330, Salt Run UTL 10,000 0 0 0 0 0 0 0 0 10,00095989 North Central 2 Cameron T-330, Salt Run CON 0 75,000 0 0 0 0 0 0 0 75,0003608 North Central 2 Clearfield T-206 Anderson Creek UTL 10,000 0 0 0 0 0 0 0 0 10,0003608 North Central 2 Clearfield T-206 Anderson Creek CON 0 100,000 0 0 0 0 0 0 0 100,000
95990 North Central 2 Clearfield T-566 over Clearfield Crk UTL 10,000 0 0 0 0 0 0 0 0 10,00095990 North Central 2 Clearfield T-566 over Clearfield Crk CON 0 150,000 0 0 0 0 0 0 0 150,0004383 North Central 2 McKean T-437 Oswayo Creek UTL 10,000 0 0 0 0 0 0 0 0 10,0004383 North Central 2 McKean T-437 Oswayo Creek CON 0 100,000 0 0 0 0 0 0 0 100,000
85535 North Central 2 Potter T-351 over Oswayo Creek, UTL 10,000 0 0 0 0 0 0 0 0 10,00085535 North Central 2 Potter T-351 over Oswayo Creek, CON 0 75,000 0 0 0 0 0 0 0 75,0003763 SEDA-COG 2 Clinton T-537 over Fishing Creek Bridge UTL 10,000 0 0 0 0 0 0 0 0 10,0003763 SEDA-COG 2 Clinton T-537 over Fishing Creek Bridge CON 0 100,000 0 0 0 0 0 0 0 100,000
110175 SEDA-COG 2 Mifflin T-420 over Kish Creek UTL 10,000 0 0 0 0 0 0 0 0 10,000110175 SEDA-COG 2 Mifflin T-420 over Kish Creek CON 0 250,000 0 0 0 0 0 0 0 250,000103841 SEDA-COG 3 Montour T-308 over Beaver Run Bridge Removal CON 0 80,000 0 0 0 0 0 0 0 80,000106671 SEDA-COG 3 Montour T-392 over Mud Run Bridge Removal CON 0 585,000 0 0 0 0 0 0 0 585,000102810 SEDA-COG 3 Northumberland CSVT to SR 11 CON 0 5,000,000 5,000,000 5,070,562 0 0 0 0 0 15,070,5627588 SEDA-COG 3 Snyder Cent. Susq. Val. Sty FD 11,500,000 0 0 0 0 0 0 0 0 11,500,0007588 SEDA-COG 3 Snyder Cent. Susq. Val. Sty ROW 0 0 0 3,000,000 0 0 0 0 0 3,000,0007588 SEDA-COG 3 Snyder Cent. Susq. Val. Sty UTL 0 2,000,000 2,000,000 3,500,000 0 0 0 0 0 7,500,0007588 SEDA-COG 3 Snyder Cent. Susq. Val. Sty CON 0 0 0 2,300,000 0 0 0 0 0 2,300,00076402 SEDA-COG 3 Snyder CSVT Structures South Sec CON 0 10,000,000 10,000,000 10,000,000 10,000,000 15,000,000 15,000,000 15,000,000 25,000,000 110,000,00076403 SEDA-COG 3 Snyder CSVT Paving South Sec CON 0 0 0 10,000,000 15,000,000 17,693,810 20,000,000 25,000,000 47,306,190 135,000,000102811 SEDA-COG 3 Snyder CSVT ITS CON 0 0 0 8,000,000 8,603,297 0 0 0 0 16,603,297110337 SEDA-COG 3 Union T-357 ov N Branch of Buffalo Creek Bridge Removal UTL 10,000 0 0 0 0 0 0 0 0 10,000110337 SEDA-COG 3 Union T-357 ov N Branch of Buffalo Creek Bridge Removal CON 0 150,000 0 0 0 0 0 0 0 150,000114079 Northern Tier 4 Susquehanna Susquehanna County Paving CON 0 0 0 0 2,000,000 0 0 0 0 2,000,00096423 Lehigh Valley 5 Northampton Pave PA 33_I-78 to US 22 CON 0 0 0 0 8,000,000 0 0 0 0 8,000,00096470 NEPA 5 Schuylkill St.Clair to Frackville Reconstruction CON 8,500,000 8,500,000 0 0 0 0 0 0 0 17,000,00061972 Reading 5 Berks US 222 Widening CON 0 0 0 0 0 2,929,331 0 0 0 2,929,331114439 Reading 5 Berks West Shore Bypass - Phase 1 CON 0 0 0 0 0 0 12,000,000 16,240,000 33,069,731 61,309,73158137 Adams 8 Adams Eisenhower Drive Extension CON 0 0 0 2,500,000 2,500,000 0 0 0 0 5,000,00092931 Interstate 8 Dauphin Eisenhower Interchange UTL 6,300,000 4,000,000 4,000,000 0 0 0 0 0 0 14,300,00097828 Interstate 8 Dauphin I-83 East Shore Section 3 ROW 4,000,000 8,000,000 8,000,000 0 0 0 0 0 0 20,000,00097828 Interstate 8 Dauphin I-83 East Shore Section 3 UTL 4,000,000 0 0 0 0 0 0 0 0 4,000,000113357 Interstate 8 Dauphin I-83 East Shore Section 3B FD 5,000,000 0 0 0 0 0 0 0 0 5,000,000113357 Interstate 8 Dauphin I-83 East Shore Section 3B ROW 5,400,000 0 0 0 0 0 0 0 0 5,400,000113357 Interstate 8 Dauphin I-83 East Shore Section 3B UTL 0 2,200,000 0 0 0 0 0 0 0 2,200,000113376 Interstate 8 Dauphin I-83 East Shore Section 3C FD 1,000,000 0 0 0 0 0 0 0 0 1,000,000113376 Interstate 8 Dauphin I-83 East Shore Section 3C ROW 0 0 0 5,800,000 0 0 0 0 0 5,800,000113376 Interstate 8 Dauphin I-83 East Shore Section 3C UTL 0 0 0 2,400,000 0 0 0 0 0 2,400,000113378 Interstate 8 Dauphin Eisenhower Interchange B FD 0 0 6,000,000 6,000,000 6,000,000 5,000,000 0 0 0 23,000,000113380 Interstate 8 Dauphin Eisenhower Interchange C FD 0 0 7,000,000 6,000,000 3,100,000 0 0 0 0 16,100,000113381 Interstate 8 Dauphin Eisenhower Interchange D FD 0 0 0 0 0 0 9,000,000 18,600,000 0 27,600,00092924 Interstate 8 York North York Widening #3 (Exit 21 & 22) FD 2,500,000 0 0 0 0 0 0 0 0 2,500,00092924 Interstate 8 York North York Widening #3 (Exit 21 & 22) UTL 5,000,000 4,300,000 0 0 0 0 0 0 0 9,300,000112540 Interstate 8 York Mill Creek Relocation FD 1,200,000 0 0 0 0 0 0 0 0 1,200,000112540 Interstate 8 York Mill Creek Relocation ROW 0 4,500,000 4,500,000 0 0 0 0 0 0 9,000,000112540 Interstate 8 York Mill Creek Relocation UTL 0 2,459,000 2,141,000 0 0 0 0 0 0 4,600,000112548 Interstate 8 York Sherman Street & Eberts Lane UTL 2,000,000 1,300,000 0 0 0 0 0 0 0 3,300,000112549 Interstate 8 York North York Widening #1 (Exit 19) FD 0 5,000,000 5,000,000 0 0 0 0 0 0 10,000,000112549 Interstate 8 York North York Widening #1 (Exit 19) ROW 0 0 0 8,782,438 9,457,406 10,060,156 0 0 0 28,300,000
2023 Program - Spike Projects (State)
140
DRAFT

MPMS Planning Partner District County Project Title Phase 2023 2024 2025 Tot 2026 2027 2028 2029 2030 2031-34 Total
2023 Program - Spike Projects (State)
112549 Interstate 8 York North York Widening #1 (Exit 19) UTL 0 0 0 0 6,453,297 7,346,703 0 0 0 13,800,000112550 Interstate 8 York North York Widening #2 (Codorus Creek Bridge) FD 4,200,000 0 0 0 0 0 0 0 0 4,200,000112550 Interstate 8 York North York Widening #2 (Codorus Creek Bridge) ROW 12,774,000 12,000,000 10,226,000 0 0 0 0 0 0 35,000,000112550 Interstate 8 York North York Widening #2 (Codorus Creek Bridge) UTL 4,100,000 4,000,000 0 0 0 0 0 0 0 8,100,000100343 Lebanon 8 Lebanon Allentown Blvd/Trib Racc CON 0 1,000,000 0 0 0 0 0 0 0 1,000,000108154 S. Alleghenies 9 Bedford US 30 - Scenic Rd to SR 4010 CON 0 0 2,000,000 1,300,000 0 0 0 0 0 3,300,00025944 North Central 10 Jefferson T-396 Seldom Seen Bridge CON 100,000 0 0 0 0 0 0 0 0 100,00098132 North Central 10 Jefferson T-385 Dobson Road Bridge CON 80,000 0 0 0 0 0 0 0 0 80,00097027 Interstate 11 Allegheny I-376/Carnegie Interchange PE 500,000 0 0 0 0 0 0 0 0 500,00097029 Interstate 11 Allegheny I-376/Greentree Interchange PE 800,000 0 0 0 0 0 0 0 0 800,00099874 Interstate 11 Allegheny Squirrel Hill Interchange PE 0 0 6,000,000 0 0 0 0 0 0 6,000,00099874 Interstate 11 Allegheny Squirrel Hill Interchange FD 0 0 1,903,000 7,097,000 0 0 0 0 0 9,000,00099874 Interstate 11 Allegheny Squirrel Hill Interchange ROW 0 0 3,000,000 3,000,000 0 0 0 0 0 6,000,00099874 Interstate 11 Allegheny Squirrel Hill Interchange UTL 0 0 2,000,000 2,000,000 0 0 0 0 0 4,000,000105438 Interstate 11 Allegheny I-376, Commercial Street Bridge FD 4,000,000 0 0 0 0 0 0 0 0 4,000,000105438 Interstate 11 Allegheny I-376, Commercial Street Bridge ROW 0 600,000 0 0 0 0 0 0 0 600,000105438 Interstate 11 Allegheny I-376, Commercial Street Bridge UTL 0 5,000,000 0 0 0 0 0 0 0 5,000,00091796 SPC 11 Allegheny Streets Run Road CON 0 0 0 0 0 6,000,000 6,000,000 8,000,000 0 20,000,000100789 SPC 11 Allegheny Saw Mill Run Blvd: PA 88 to I376 CON 0 0 0 0 0 9,000,000 9,000,000 0 0 18,000,000100956 SPC 11 Allegheny West End Bridge CON 0 0 0 0 0 0 5,000,000 10,000,000 50,000,000 65,000,000110601 Interstate 99 Central Office INFRA Support CON 0 0 2,000,000 1,500,000 0 0 0 0 0 3,500,00084337 STWD Items 99 Central Office State (15%) Reserve CON 0 0 0 0 0 0 0 0 7,848,079 7,848,079106136 STWD Items 99 Central Office P3 RBR Payments CON 15,558,000 15,613,000 15,640,000 15,700,000 15,750,000 15,810,000 15,843,000 15,905,000 64,188,000 190,007,000106136 STWD Items 99 Central Office P3 RBR Payments CON 15,558,000 15,613,000 15,640,000 15,700,000 15,750,000 15,810,000 15,843,000 15,905,000 64,188,000 190,007,000
114,150,000 117,750,000 118,950,000 124,650,000 124,650,000 124,650,000 124,650,000 124,650,000 498,600,000 1,472,700,000
141
DRAFT

142
DRAFT

In addition to the baseline STIP/TIP funding identified in PennDOT’s Financial Guidance, there are multiple funding sources that are distributed statewide to counties, municipalities and through PennDOT maintenance. This funding includes:
o County/Municipal Liquid Fuels Tax Fund Allocationso PennDOT County Maintenance A-582/A-409o Statewide Distribution of Funds:
Green Light Go Highway Transfer/Turnback Program Highway Systems Technology Debt Service Pennsylvania Infrastructure Bank (PIB) Act 44 Bridge $5 County Fee for Local Use Fund Marcellus Shale A-409 Discretionary
As defined by 23 USC 450.218(m), the STIP and regional TIPs are required to contain system-level estimates of costs and state and local revenue sources beyond Financial Guidance that are reasonably expected to be available to adequately operate and maintain Federal-aid highways and public transportation. The term “asset management” means a strategic and systematic process of operating, maintaining, and improving physical assets, with a focus on both engineering and economic analysis based upon quality information, to identify a structured sequence of maintenance, preservation, repair, rehabilitation, and replacement actions that will achieve and sustain a desired state of good repair over the lifecycle of the assets at minimum practicable cost.
Beyond the baseline federal and state funding, Pennsylvania invests more than $2.4 Billion annually to operate and maintain the Commonwealth’s transportation network. This funding plays an important role in maintaining transportation infrastructure across the Commonwealth of Pennsylvania and contributes significantly to providing a state of good repair. It should be noted that, in Pennsylvania, the existing and future transportation needs are much greater than what existing financial resources can provide. These needs go beyond traditional highway and bridge infrastructure. They also include multi-modal assets like public transit, aviation, rail, marine, ports, bicycle, pedestrian, etc.
Appendix 5 - Other Transportation Funding
143
DRAFT

PLANNING PARTNER SFY 22-23 SFY 23-24 SFY 24-25 SFY 25-26 SFY 26-27Adams 19,114,035 19,255,658 19,375,200 19,496,118 19,619,337 Altoona 19,364,477 19,501,176 19,612,400 19,726,052 19,838,012 Centre 25,223,766 25,407,481 25,569,614 25,733,222 25,894,213 DVRPC 305,173,495 307,784,830 309,783,168 311,800,650 313,826,783 Erie 40,801,091 41,104,004 41,355,348 41,604,624 41,859,603 Franklin 24,102,060 24,280,719 24,426,824 24,577,454 24,726,500 Harrisburg 79,347,584 79,942,312 80,437,719 80,937,937 81,431,577 Johnstown 27,824,990 28,026,026 28,196,862 28,369,227 28,543,979 Lancaster 53,323,144 53,740,398 54,064,694 54,391,568 54,719,689 Lebanon 17,250,654 17,368,767 17,460,420 17,554,518 17,645,967 Lehigh Valley 63,973,494 64,460,911 64,821,877 65,192,796 65,564,221 NEPA 86,103,206 86,798,675 87,423,042 88,056,892 88,688,880 North Central 91,065,020 91,773,979 92,421,172 93,075,639 93,733,088 Northern Tier 108,078,041 108,982,859 109,863,810 110,738,082 111,626,417 Northwest 91,686,350 92,382,032 93,025,595 93,667,554 94,317,604 Reading 44,367,025 44,722,797 44,997,451 45,281,419 45,564,394 S. Alleghenies 85,817,486 89,800,734 90,464,689 91,133,384 91,802,319 Scranton-WB 89,051,682 100,063,489 100,714,505 101,367,123 102,011,979 SEDA-COG 99,344,245 86,477,905 87,099,730 87,721,635 88,344,399 SPC 416,574,593 420,046,564 423,074,710 426,097,771 429,143,430 SVTS 28,255,281 28,462,092 28,641,993 28,825,408 29,006,219 Wayne County 24,789,734 25,019,272 25,246,971 25,476,927 25,702,090 Williamsport 29,690,052 29,915,679 30,116,217 30,322,258 30,525,681 York 52,248,480 52,639,627 52,947,973 53,260,726 53,571,604 Statewide 578,364,000 577,210,000 594,772,000 607,039,000 639,189,000TOTAL 2,500,933,985 2,515,167,984 2,545,913,984 2,571,447,985 2,616,896,985
Pennsylvania Transportation Funding Not Included in the STIP
144
DRAFT
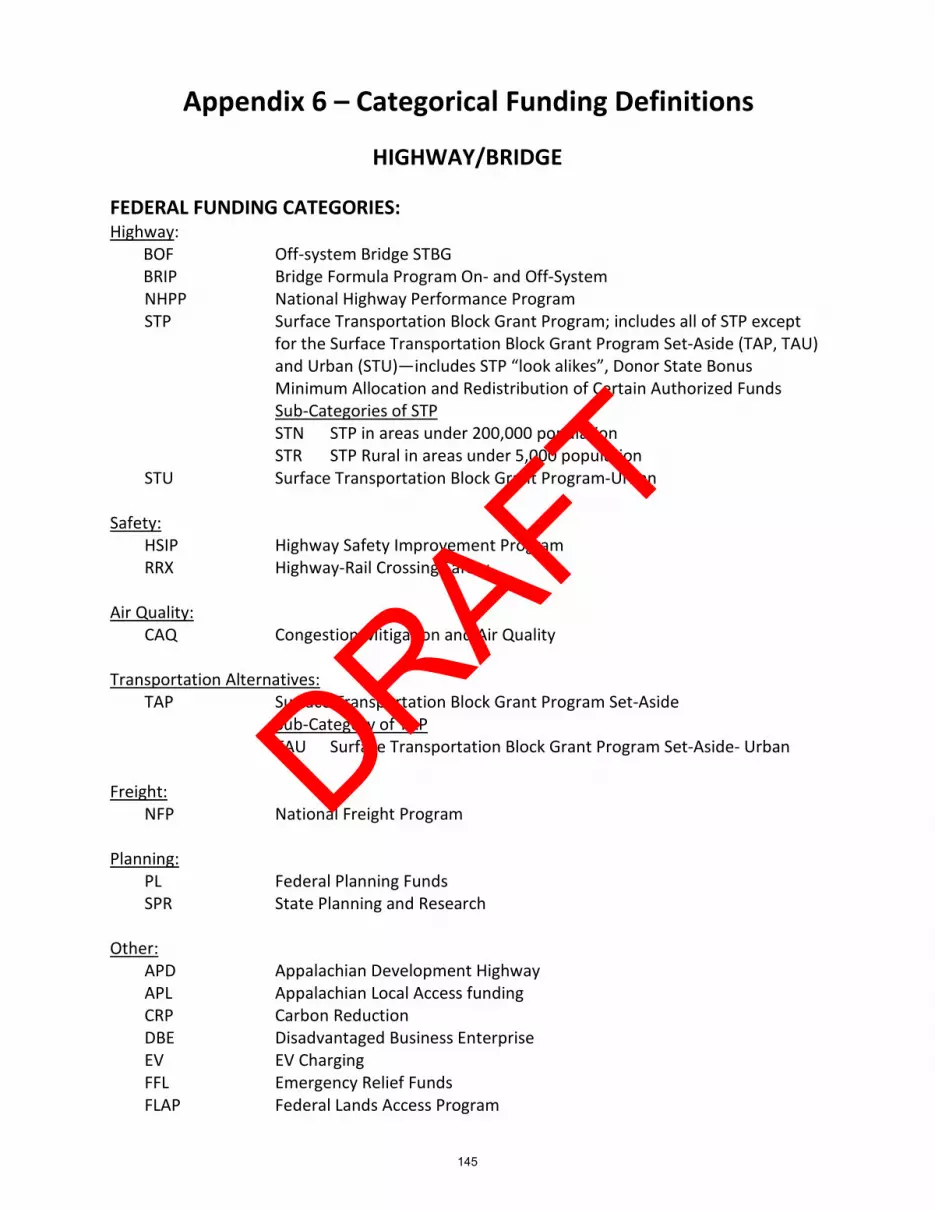
Appendix 6 – Categorical Funding Definitions
HIGHWAY/BRIDGE
FEDERAL FUNDING CATEGORIES: Highway:
BOF Off-system Bridge STBG BRIP Bridge Formula Program On- and Off-System
NHPP National Highway Performance Program STP Surface Transportation Block Grant Program; includes all of STP except
for the Surface Transportation Block Grant Program Set-Aside (TAP, TAU) and Urban (STU)—includes STP “look alikes”, Donor State Bonus Minimum Allocation and Redistribution of Certain Authorized Funds Sub-Categories of STP STN STP in areas under 200,000 population STR STP Rural in areas under 5,000 population
STU Surface Transportation Block Grant Program-Urban
Safety: HSIP Highway Safety Improvement Program RRX Highway-Rail Crossing Safety
Air Quality: CAQ Congestion Mitigation and Air Quality
Transportation Alternatives: TAP Surface Transportation Block Grant Program Set-Aside
Sub-Category of TAP TAU Surface Transportation Block Grant Program Set-Aside- Urban
Freight: NFP National Freight Program
Planning: PL Federal Planning Funds SPR State Planning and Research
Other: APD Appalachian Development Highway APL Appalachian Local Access funding CRP Carbon Reduction DBE Disadvantaged Business Enterprise EV EV Charging FFL Emergency Relief Funds FLAP Federal Lands Access Program
145
DRAFT

FRB Ferry Boat HCB Historic Covered Bridge INFRA Infrastructure for Rebuilding America Discretionary Grant Program OTH-F Other Federal funding being contributed to projects PRTCT PROTECT RAISE Rebuilding American Infrastructure with Sustainability and Equity
Discretionary Grant Program REC Recreational Trails SRTSF Federal Safe Routes to Schools SXF Special Federal Funds; Includes high priority Congressional projects from
ISTEA, TEA-21, SAFETEA-LU, Appropriations Acts
STATE FUNDING CATEGORIES: Highway:
581 Highway Capital Construction (Formerly State Appropriation 185)
Bridge: 179 Act 26 Counties (Formerly Appropriation 232) 183 Local Bridge Construction (Formerly Appropriation 284) 185 State Bridge Construction (Formerly Appropriation 289) MBP3 Major Bridge P3 Initiative
Maintenance: 582 Highway Maintenance; funds used for highway maintenance and
allocated to individual counties under a formula established by the State General Assembly (Formerly Appropriation 187)
409 Highway Maintenance; funds used for highway maintenance contracts and materials, allocated to individual counties under a formula established by the State General Assembly under Act 89
Multimodal: 403 Aviation Grants 404 Rail Freight Grants 405 Passenger Rail Grants 406 Port and Waterways Grants 407 Bicycle & Pedestrian Facilities Grant 408 Multimodal Admin and Oversight 411 Statewide Program Grants – Non Highway
Other: 073 Green Light-Go Grant 244 Automated Red Light Enforcement (ARLE) Grant OTH-S Other State funding being contributed to projects TPK Pennsylvania Turnpike Commission funding
146
DRAFT

LOCAL/OTHER FUNDING CATEGORIES: LOC Local government funds being contributed to projects PRIV Private funding being contributed to projects
TRANSIT
FEDERAL FUNDING CATEGORIES: Section 5307 Urbanized Area Formula Program Section 5308 Clean Fuels Formula Program Section 5309 Capital Investment Grant Program Section 5310 Elderly and Persons with Disabilities Program Section 5311 Non-urbanized Area Formula Program Section 5312 Public Transportation Innovation Program Section 5313 State Planning and Research Section 5316 Job Access and Reverse Commute Program Section 5317 New Freedom Program Section 5320 Alternative Transportation in Parks & Park Land Section 5329 State Safety Oversight Program Section 5337 State of Good Repair Section 5339 Bus and Bus Facility Formula Grants TIGGR Transit Investment for Greenhouse Gas Energy Reduction FTAD FTA Discretionary Funds
STATE FUNDING CATEGORIES: 338 Mass Transit Operating (Section 1513 of Act 44 as amended) 339 Capital Budget/Asset Improvement Discretionary (Section 1514 of Act 44
as amended) 340 Capital Improvements (Section 1517 of Act 44 as amended) 341 Programs of Statewide Significance (Section 1516 of Act 44 as amended) ACT3 Base Supplemental and Asset Maintenance Assistance Grants CB Capital Bond Non-Highway PTAF/164 Act 26 PA Transportation Assist Fund OTH-S Other State funding being contributed to projects
LOCAL/OTHER FUNDING CATEGORIES: LOC Local government funds being contributed to projects OTH-F Other Federal funding being contributed to projects
147
DRAFT

148
DRAFT

APD $59,750,000 $45,750,000 $45,750,000 $40,750,000 $192,000,000
APL $3,623,742 $1,505,890 $0 $0 $5,129,632
BOF $144,471,500 $147,471,500 $147,471,500 $147,471,500 $586,886,000
BOF* $3,000,000 $0 $0 $0 $3,000,000
BRIP $278,102,500 $278,102,500 $278,102,500 $278,102,500 $1,112,410,000
CAQ $113,818,200 $116,093,200 $118,416,200 $120,785,200 $469,112,800
CRP $64,634,000 $65,672,000 $66,731,000 $67,811,000 $264,848,000
DBE $676,000 $676,000 $676,000 $676,000 $2,704,000
EV $40,650,000 $40,650,000 $40,650,000 $40,650,000 $162,600,000
FFL $676,776 $0 $0 $0 $676,776
FLAP $261,000 $0 $1,672,000 $0 $1,933,000
HSIP $122,592,000 $128,604,000 $131,320,000 $134,089,000 $516,605,000
HSIP* $3,350,000 $0 $0 $0 $3,350,000
INFRA $0 $21,012,220 $0 $0 $21,012,220
NFP $56,879,000 $58,016,000 $59,177,000 $60,360,000 $234,432,000
NHPP $1,051,314,969 $1,147,572,600 $1,181,638,600 $1,226,473,489 $4,606,999,658
NHPP* $121,442,031 $48,639,000 $38,500,000 $18,065,111 $226,646,142
OTH-F $1,602,000 $3,664,000 $12,543,515 $0 $17,809,515
PRTCT $73,493,000 $74,674,000 $75,878,000 $77,106,000 $301,151,000
REC $1,991,226 $1,991,226 $1,991,226 $1,991,226 $7,964,904
RRX $7,184,000 $7,184,000 $7,184,000 $7,184,000 $28,736,000
SPR $70,517,000 $73,298,000 $76,189,920 $79,197,517 $299,202,437
SRTSF $1,300,000 $1,300,000 $1,300,000 $1,300,000 $5,200,000
STP $236,795,000 $251,857,487 $259,886,944 $267,048,467 $1,015,587,898
STP* $9,178,000 $1,000,000 $0 $0 $10,178,000
STU $148,165,000 $176,517,000 $182,849,000 $189,703,000 $697,234,000
STU* $30,595,000 $5,819,000 $3,132,000 $0 $39,546,000
SXF $2,410,000 $8,728,000 $6,321,929 $5,808,000 $23,267,929
TAP $27,814,086 $29,367,000 $29,978,000 $30,604,000 $117,763,086
TAU $16,697,914 $16,993,000 $17,349,000 $17,710,000 $68,749,914
TAU* $900,000 $0 $0 $0 $900,000
MBP3 $105,970,000 $161,500,000 $288,809,065 $482,010,000 $1,038,289,065
OTH-S $5,781,437 $623,000 $0 $0 $6,404,437
073 $0 $7,000,000 $0 $0 $7,000,000
179 $522,750 $984,000 $250,000 $250,000 $2,006,750
183 $30,118,452 $27,446,196 $27,429,086 $28,569,217 $113,562,951
185 $292,440,548 $290,166,804 $290,208,914 $288,130,783 $1,160,947,049
411 $80,633,025 $81,958,000 $81,958,000 $83,636,000 $328,185,025
581 $497,299,051 $526,596,773 $534,926,866 $574,244,185 $2,133,066,875
582 $600,000 $600,000 $600,000 $600,000 $2,400,000
ACT13 $0 $2,500 $0 $0 $2,500
LOC $143,436,627 $56,215,306 $44,389,867 $44,494,834 $288,536,634
PRIV $3,176,000 $5,098,800 $4,498,800 $4,438,800 $17,212,400
TPK $0 $21,050,000 $0 $0 $21,050,000
Total Federal: $2,693,883,944 $2,752,157,623 $2,784,708,334 $2,812,886,010 $11,043,635,911
Total State: $1,013,365,263 $1,096,874,773 $1,224,181,931 $1,457,440,185 $4,791,862,152
Total Local/Other: $146,612,627 $82,366,606 $48,888,667 $48,933,634 $326,801,534
Date: 6/6/22 2:25PMRpt # TIP210
Highway & Bridge
2023 STIP
* indicates a conversion amount
1st Period 2nd Period 3rd Period 4th Period Fund Total
1st Period 2nd Period 3rd Period 4th Period Fund Total
1st Period 2nd Period 3rd Period 4th Period Fund Total
Federal
Federal
Federal
Federal
Federal
Federal
Federal
Federal
Federal
Federal
Federal
Federal
Federal
Federal
Federal
Federal
State
State
State
State
Local/Other
Local/Other
Federal
Federal
Federal
Federal
Federal
Federal
Federal
Federal
Federal
Federal
Federal
Federal
Federal
Federal
Federal
State
State
State
State
State
Local/Other
Local/Other
$3,853,861,834 $3,931,399,002 $4,057,778,932 $4,319,259,829 $16,162,299,597
Fund Category
Fund Category
Fund Category
Overall Totals:
Federal
State
Local/Other
Appendix 7 - MPMS Highway STIP Summary
149
DRAFT

150
DRAFT
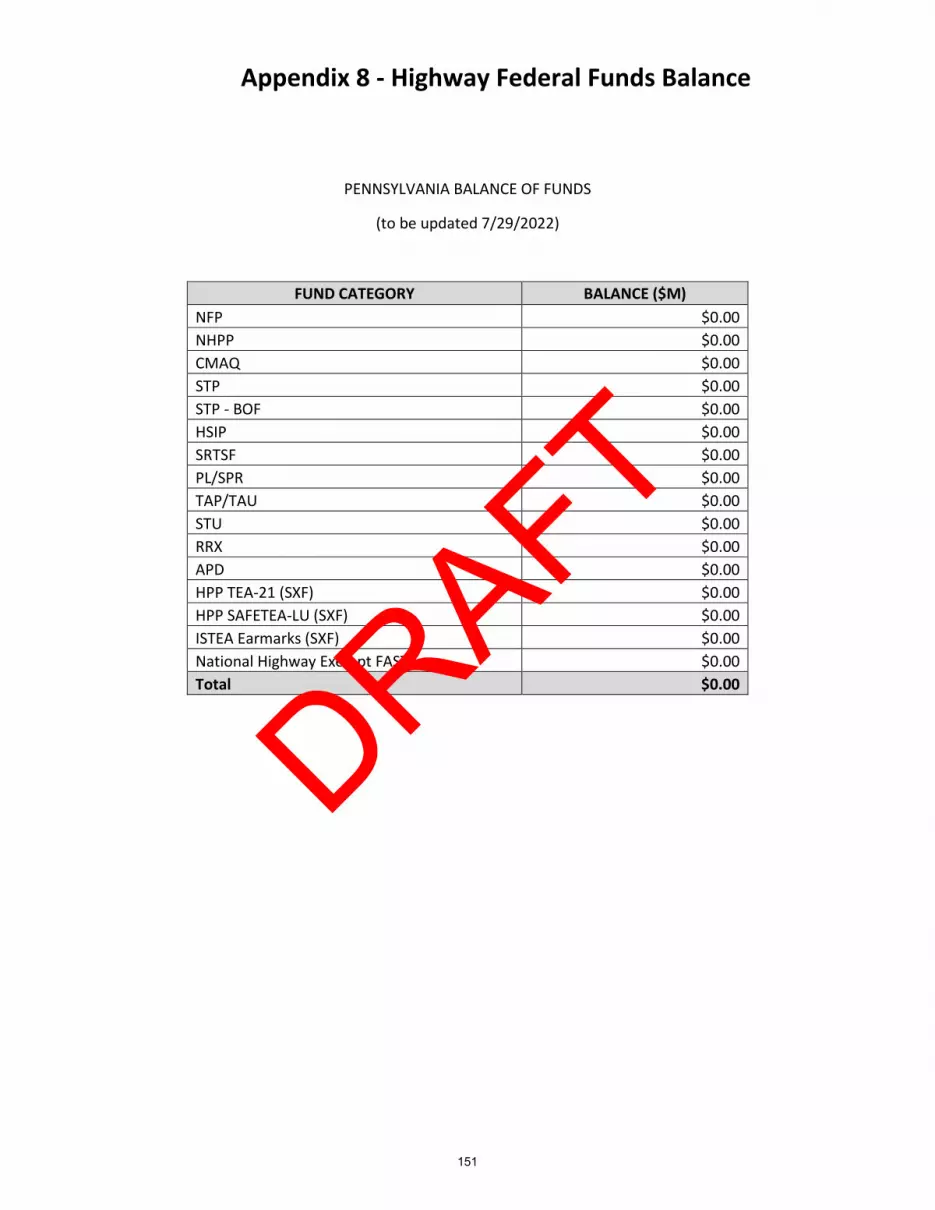
PENNSYLVANIA BALANCE OF FUNDS
(to be updated 7/29/2022)
FUND CATEGORY BALANCE ($M)
NFP $0.00
NHPP $0.00
CMAQ $0.00
STP $0.00
STP - BOF $0.00
HSIP $0.00
SRTSF $0.00
PL/SPR $0.00
TAP/TAU $0.00
STU $0.00
RRX $0.00
APD $0.00
HPP TEA-21 (SXF) $0.00
HPP SAFETEA-LU (SXF) $0.00
ISTEA Earmarks (SXF) $0.00
National Highway Exempt FAST $0.00
Total $0.00
Appendix 8 - Highway Federal Funds Balance
151
DRAFT

152
DRAFT

COVID $587,500 $187,500 $237,500 $237,500 $1,250,000
OTH-F $30,034,889 $10,903,342 $12,082,898 $18,872,000 $71,893,129
STP $284,000 $0 $0 $0 $284,000
SXF $4,480,000 $0 $0 $0 $4,480,000
5307 $233,308,423 $234,551,031 $235,083,719 $212,698,319 $915,641,492
5309 $400,000 $0 $0 $0 $400,000
5310 $16,130,252 $15,582,097 $16,005,104 $15,703,247 $63,420,700
5311 $39,223,000 $46,296,657 $47,043,000 $44,007,000 $176,569,657
5329 $1,590,267 $1,828,807 $1,975,112 $2,073,867 $7,468,053
5337 $233,977,000 $237,486,000 $240,540,000 $235,038,000 $947,041,000
5339 $30,054,948 $13,247,948 $12,917,948 $13,143,948 $69,364,792
OTH-S $154,161,415 $73,581,853 $65,129,126 $72,442,023 $365,314,416
PTAF $12,274,510 $12,276,510 $12,270,510 $12,273,510 $49,095,040
160 $45,000 $35,000 $55,000 $20,000 $155,000
164 $17,981,103 $17,975,303 $17,981,345 $17,977,720 $71,915,471
338 $349,401,444 $348,632,180 $349,572,176 $349,904,645 $1,397,510,445
339 $508,288,040 $463,495,687 $469,806,261 $468,494,839 $1,910,084,827
340 $12,161,638 $5,953,005 $8,244,156 $5,970,326 $32,329,125
341 $6,442,703 $10,422,986 $9,789,517 $5,419,275 $32,074,481
LOC $436,904,710 $227,208,602 $283,931,307 $283,658,540 $1,231,703,158
OTH $12,319,000 $4,342,000 $3,764,000 $3,660,000 $24,085,000
Total Federal: $590,070,279 $560,083,382 $565,885,281 $541,773,881 $2,257,812,823
Total State: $1,060,755,853 $932,372,524 $932,848,091 $932,502,338 $3,858,478,805
Total Local/Other: $449,223,710 $231,550,602 $287,695,307 $287,318,540 $1,255,788,158
Date: 6/6/22 2:34PMRpt # TIP210b
Public Transit
2023 STIP
* indicates a conversion amount
1st Period 2nd Period 3rd Period 4th Period Fund Total
1st Period 2nd Period 3rd Period 4th Period Fund Total
1st Period 2nd Period 3rd Period 4th Period Fund Total
Federal
Federal
Federal
Federal
Federal
Federal
State
State
State
State
Local/Other
Federal
Federal
Federal
Federal
Federal
State
State
State
State
Local/Other
$2,100,049,841 $1,724,006,507 $1,786,428,679 $1,761,594,759 $7,372,079,786
Fund Category
Fund Category
Fund Category
Overall Totals:
Federal
State
Local/Other
Appendix 9 - MPMS Transit STIP Summary
153
DRAFT

154
DRAFT

7/24/19
MPMS District County Project Title Phase 2023 2024 2025 2026 2027 2028 2029 2030 2031 2032 2033 2034 Total
105438 11 Allegheny I-376, Commercial Street Bridge CON 56,879,000 0 0 0 0 0 0 0 0 0 0 0 56,879,000
97828 8 Dauphin I-83 East Shore (Section 3) CON 0 58,016,000 0 0 0 0 0 0 0 0 0 0 58,016,000
113357 8 Dauphin I-83 East Shore (Section 3B) CON 0 0 59,177,000 0 0 0 0 0 0 0 0 0 59,177,000
92924 8 York I-83, North York Widening CON 0 0 0 60,360,000 0 0 0 0 0 0 0 0 60,360,000
79828 6 Philadelphia I-95: Race - Shackamaxon CON 0 0 0 0 60,360,000 0 0 0 0 0 0 0 60,360,000
103559 6 Philadelphia I-95 Btsy Rss Mainln SB CON 0 0 0 0 0 60,360,000 60,360,000 0 0 0 0 0 120,720,000
103558 6 Philadelphia I-95SB: Ann St-Wheatsheaf Lane CON 0 0 0 0 0 0 0 60,360,000 0 0 0 0 60,360,000
113380 8 Dauphin I-83 Eisenhower Interchange D CON 0 0 0 0 0 0 0 0 60,360,000 0 0 0 60,360,000
113378 8 Dauphin Eisenhower Interchange B CON 0 0 0 0 0 0 0 0 0 60,360,000 0 0 60,360,000
113376 8 Dauphin I-83 East Shore Section 3C CON 0 0 0 0 0 0 0 0 0 0 60,360,000 0 60,360,000
113381 8 Dauphin Eisenhower Interchange D CON 0 0 0 0 0 0 0 0 0 0 0 60,360,000 60,360,000
56,879,000 58,016,000 59,177,000 60,360,000 60,360,000 60,360,000 60,360,000 60,360,000 60,360,000 60,360,000 60,360,000 60,360,000 717,312,000
2023 National Highway Freight Program (NFP)
Appendix 10 - National Highway Freight Program Projects
155
DRAFT

156
DRAFT

MPMS Planning Partner District County Project Title Phase 2023 2024 2025 2026 2027 2028 2029 2030 2031-34 Total111147 Erie 1 Erie Huntley Road RR Crossing CON 350,000 0 0 0 0 0 0 0 0 350,000
113215 Erie 1 Erie Bayfront Parkway RRX CON 400,000 400,000 100,000 0 0 0 0 0 0 900,000
114480 Erie 1 Erie Norfolk Southern Erie County Circuitry Upgrade CON 0 0 229,000 300,000 300,000 300,000 0 0 0 1,129,000
106162 Northwest 1 Crawford Mt Pleasant Rd RR Crossing CON 0 0 318,500 0 0 0 0 0 0 318,500
111140 Northwest 1 Crawford Mead Ave RR Crossing CON 200,000 0 0 0 0 0 0 0 0 200,000
113216 Northwest 1 Crawford Shaw's Landing RRX CON 0 0 300,647 74,353 0 0 0 0 0 375,000
113217 Northwest 1 Venango 13th Street Franklin RRX CON 250,000 250,000 0 0 0 0 0 0 0 500,000
118221 Northwest 1 Venango Oil City Corridor WNYPA CON 0 0 400,000 400,000 400,000 300,000 0 0 0 1,500,000
106281 SVTS 1 Mercer Bessemer & Lake Erie RR Corridor CON 0 236,165 383,835 380,000 0 0 0 0 0 1,000,000
114047 North Central 2 Cameron Gardeau Rd RR Device Install CON 0 200,000 250,000 0 0 0 0 0 0 450,000
110875 North Central 2 Clearfield Cooper Rd, RR Warn Device CON 70,400 0 0 0 0 0 0 0 0 70,400
110878 North Central 2 Clearfield SR 36, ColDrake, RR Warn Device CON 0 0 0 0 350,000 0 0 0 0 350,000
114049 North Central 2 Clearfield McGees Mills RR Device Upgrade CON 0 0 0 350,000 0 0 0 0 0 350,000
111074 SEDA-COG 2 Juniata River Road RR Warning Device CON 351,500 0 0 0 0 0 0 0 0 351,500
114048 SEDA-COG 2 Mifflin Kish Pike RR Device Install CON 0 200,000 200,000 200,000 0 0 0 0 0 600,000
117782 SEDA-COG 2 Mifflin Walnut St RR Device Install CON 0 175,000 175,000 0 0 0 0 0 0 350,000
111352 SEDA-COG 3 Northumberland SVRR RRX Northumberland County CON 343,327 400,000 675,000 675,000 675,000 675,000 656,673 0 0 4,100,000
117901 SEDA-COG 3 Union West Shore RRX, SR 1011 and River Rd. CON 400,000 480,000 0 0 0 0 0 0 0 880,000
118218 Northern Tier 4 Susquehanna Susq County NYSW Corridor Crossing CON 0 0 300,000 0 0 0 0 0 0 300,000
106131 Scranton/W-B 4 Lackawanna SR 3014 Dalton Street Railroad Lights /Gates CON 0 0 0 0 0 0 0 0 64,688 64,688
106134 Scranton/W-B 4 Lackawanna SR 3017 Main Street Railroad Lights /Gates CON 0 0 0 0 0 0 0 0 51,750 51,750
111112 Scranton/W-B 4 Lackawanna Archbald Corridor CON 300,000 275,090 0 0 0 0 0 0 0 575,090
118217 Scranton/W-B 4 Lackawanna City of Scranton Corridor Crossing CON 0 200,000 200,000 200,000 0 0 0 0 0 600,000
103196 Scranton/W-B 4 Luzerne CP Pittston / Dupont Corridor CON 0 0 0 627,505 350,000 0 0 0 0 977,505
106127 Scranton/W-B 4 Luzerne SR 2027 McAlpine Street over Mill Creek CON 0 0 0 0 0 0 0 0 86,250 86,250
106324 Scranton/W-B 4 Luzerne Commerce Boulevard Crossing CON 400,000 0 0 0 0 0 0 0 0 400,000
111134 Scranton/W-B 4 Luzerne C and H Corridor CON 0 0 50,000 0 0 0 0 0 0 50,000
118219 Scranton/W-B 4 Luzerne Jaycee Drive RR Crossing CON 0 0 0 50,000 0 0 0 0 0 50,000
118283 Scranton/W-B 4 Luzerne LCRA Corridor 2 CON 0 200,000 250,000 0 0 0 0 0 0 450,000
102868 Lehigh Valley 5 Lehigh Ruppsville Rd CON 0 270,200 0 0 0 0 0 0 0 270,200
102870 Lehigh Valley 5 Lehigh Penn Ave Alburtis RRX CON 281,277 0 0 0 0 0 0 0 0 281,277
102979 Lehigh Valley 5 Lehigh Canal Rd Allentown RRX CON 200,000 150,000 0 0 0 0 0 0 0 350,000
98094 Lehigh Valley 5 Northampton Broad St Nazareth RRX CON 350,000 79,800 0 0 0 0 0 0 0 429,800
102864 Lehigh Valley 5 Northampton Bethlehem Corr. Safety CON 300,000 400,000 360,000 200,000 0 0 0 0 0 1,260,000
102869 Lehigh Valley 5 Northampton SR 512 (Midway Street) NS RRX CON 0 0 0 0 568,218 0 0 0 0 568,218
106140 Reading 5 Berks Reading NS RRX Corridor CON 200,000 200,000 192,018 0 0 0 0 0 0 592,018
117973 Reading 5 Berks Walnuttown Road Crossing CON 0 0 0 214,291 154,000 85,709 0 0 0 454,000
117975 Reading 5 Berks Manatawny Drive Crossing CON 0 0 0 380,000 0 0 0 0 0 380,000
118190 DVRPC 6 Bucks Fairview Rd RR Xing CON 0 0 0 0 0 0 0 0 325,000 325,000
115875 DVRPC 6 Chester Reese St RR WD CON 0 0 0 0 0 315,000 0 0 0 315,000
115876 DVRPC 6 Chester Center St RR WD CON 0 0 0 0 0 0 315,000 0 0 315,000
118183 DVRPC 6 Chester Lake Road West RR Xing CON 0 0 0 0 0 100,000 200,000 0 0 300,000
118184 DVRPC 6 Chester Lake Road East RR Xing CON 0 0 0 0 0 0 300,000 0 0 300,000
118185 DVRPC 6 Chester Woodland Ave. Xing CON 0 0 0 0 0 0 300,000 0 0 300,000
118186 DVRPC 6 Chester Kimble Road Xing CON 0 0 0 0 0 0 0 305,000 0 305,000
2023 Program - Rail-Highway Grade Crossing Safety (RRX)
Appendix 11 - Rail - Highway Crossing Projects
157
DRAFT

MPMS Planning Partner District County Project Title Phase 2023 2024 2025 2026 2027 2028 2029 2030 2031-34 Total2023 Program - Highway-Rail Grade Crossing Safety (RRX)
118188 DVRPC 6 Chester Mt. Pleasant Rd Xing CON 0 0 0 0 0 0 0 315,000 0 315,000
118189 DVRPC 6 Chester Crowl Toot Rd RR Xing CON 0 0 0 0 0 0 0 0 315,000 315,000
103217 DVRPC 6 Delaware Main Street Darby Boro. CON 369,000 0 0 0 0 0 0 0 0 369,000
113251 DVRPC 6 Delaware Highland Ave. Railroad Preemption CON 25,000 185,000 0 0 0 0 0 0 0 210,000
115872 DVRPC 6 Delaware 4th Street RR WD CON 55,000 220,000 0 0 0 0 0 0 0 275,000
115873 DVRPC 6 Delaware Wanamaker St. RR WD CON 50,000 220,000 0 0 0 0 0 0 0 270,000
115874 DVRPC 6 Delaware Jansen Ave. RR WD CON 50,000 190,000 0 0 0 0 0 0 0 240,000
118187 DVRPC 6 Montgomery Central Ave. Xing CON 0 0 0 0 0 0 0 325,000 0 325,000
95729 Adams 8 Adams Peach Glen RR Crossing CON 0 25,000 0 0 0 0 0 0 0 25,000
102974 Franklin 8 Franklin South Third St Crossing CON 21,141 0 0 0 0 0 0 0 0 21,141
115601 Harrisburg 8 Cumberland Old State Rd Crossing Closing CON 7,500 0 0 0 0 0 0 0 0 7,500
115861 Harrisburg 8 Dauphin Inglenook X-ing CON 7,500 0 0 0 0 0 0 0 0 7,500
114225 Lancaster 8 Lancaster New Holland Borough Crossings CON 500,000 525,000 500,000 0 0 0 0 0 0 1,525,000
114226 York 8 York Hokes Mill Road Crossing CON 0 0 0 0 624,137 0 0 0 0 624,137
117967 York 8 York Maple St RRX CON 0 25,000 0 0 0 0 0 0 0 25,000
106320 Altoona 9 Blair Church Street Railroad Grade Xing CON 0 300,000 300,000 300,000 300,000 300,000 0 0 0 1,500,000
103035 S. Alleghenies 9 Somerset CSX Grade Xing Improvemnt CON 0 0 0 0 0 260,000 2,500,000 0 0 2,760,000
106261 S. Alleghenies 9 Somerset Windber Borough 15th St Grade Crossing CON 0 0 0 0 0 0 0 50,000 150,000 200,000
106262 S. Alleghenies 9 Somerset Somerset Ave Grade Crossing CON 0 0 0 0 0 0 0 50,000 200,000 250,000
106263 S. Alleghenies 9 Somerset Mount Davis Road Grade Crossing CON 0 0 0 0 0 225,100 0 0 0 225,100
105576 North Central 10 Jefferson Rikers Road Crossing CON 0 225,000 0 0 0 0 0 0 0 225,000
105583 North Central 10 Jefferson Big Run Railroad Corridor CON 0 0 0 150,000 150,000 285,000 0 0 0 585,000
109387 North Central 10 Jefferson South Park Street Crossing CON 0 200,000 0 0 0 0 0 0 0 200,000
110767 North Central 10 Jefferson Mitchell Avenue Crossing CON 200,000 0 0 0 0 0 0 0 0 200,000
105574 SPC 10 Butler Zelienople Railroad Corridor CON 0 0 300,000 282,851 202,149 0 0 0 0 785,000
109385 SPC 10 Butler Slippery Rock Group Crossings CON 0 0 350,000 200,000 0 0 0 0 0 550,000
110766 SPC 10 Butler Maple Avenue Crossing CON 275,000 0 0 0 0 0 0 0 0 275,000
110768 SPC 10 Butler Evans City Corridor Crossings CON 0 0 250,000 250,000 0 0 0 0 0 500,000
105582 SPC 10 Indiana Olson Road Crossing CON 0 0 0 150,000 150,000 0 0 0 0 300,000
106078 SPC 11 Beaver NS RR Crossings in Darlington and Big Beaver CON 0 0 0 0 100,000 500,000 0 0 0 600,000
103187 SPC 12 Washington Besco St. Grade Crossing CON 0 0 0 0 0 328,000 0 0 0 328,000
106063 SPC 12 Washington Elco Corridor CON 0 0 0 0 0 0 650,000 0 0 650,000
114584 SPC 12 Washington Charleroi Coorridor RRX CON 0 0 0 400,000 500,000 400,000 400,000 0 0 1,700,000
118280 SPC 12 Washington West Brownsville RRX Cooridor CON 0 0 0 200,000 200,000 300,000 300,000 0 0 1,000,000
103190 SPC 12 Westmoreland Vine Street Grade Xing CON 0 0 0 0 0 337,700 0 0 0 337,700
113267 SPC 12 Westmoreland New Kensington Cooridor CON 800,000 600,000 600,000 600,000 600,000 600,000 600,000 2,000,000 0 6,400,000
98255 STWD Items 99 Central Office RRX Reserve CON 0 0 0 0 500,596 612,491 112,327 4,139,000 27,543,313 32,907,727
114537 STWD Items 99 Central Office Norfolk Southern Statewide LED Upgrades CON 427,355 352,745 500,000 500,000 559,900 660,000 250,000 0 0 3,250,000
114543 STWD Items 99 Central Office Norfolk Southern Statewide Circuitry Upgrade CON 0 0 0 100,000 500,000 600,000 600,000 0 0 1,800,000
7,184,000 7,184,000 7,184,000 7,184,000 7,184,000 7,184,000 7,184,000 7,184,000 28,736,001 86,208,001
158
DRAFT
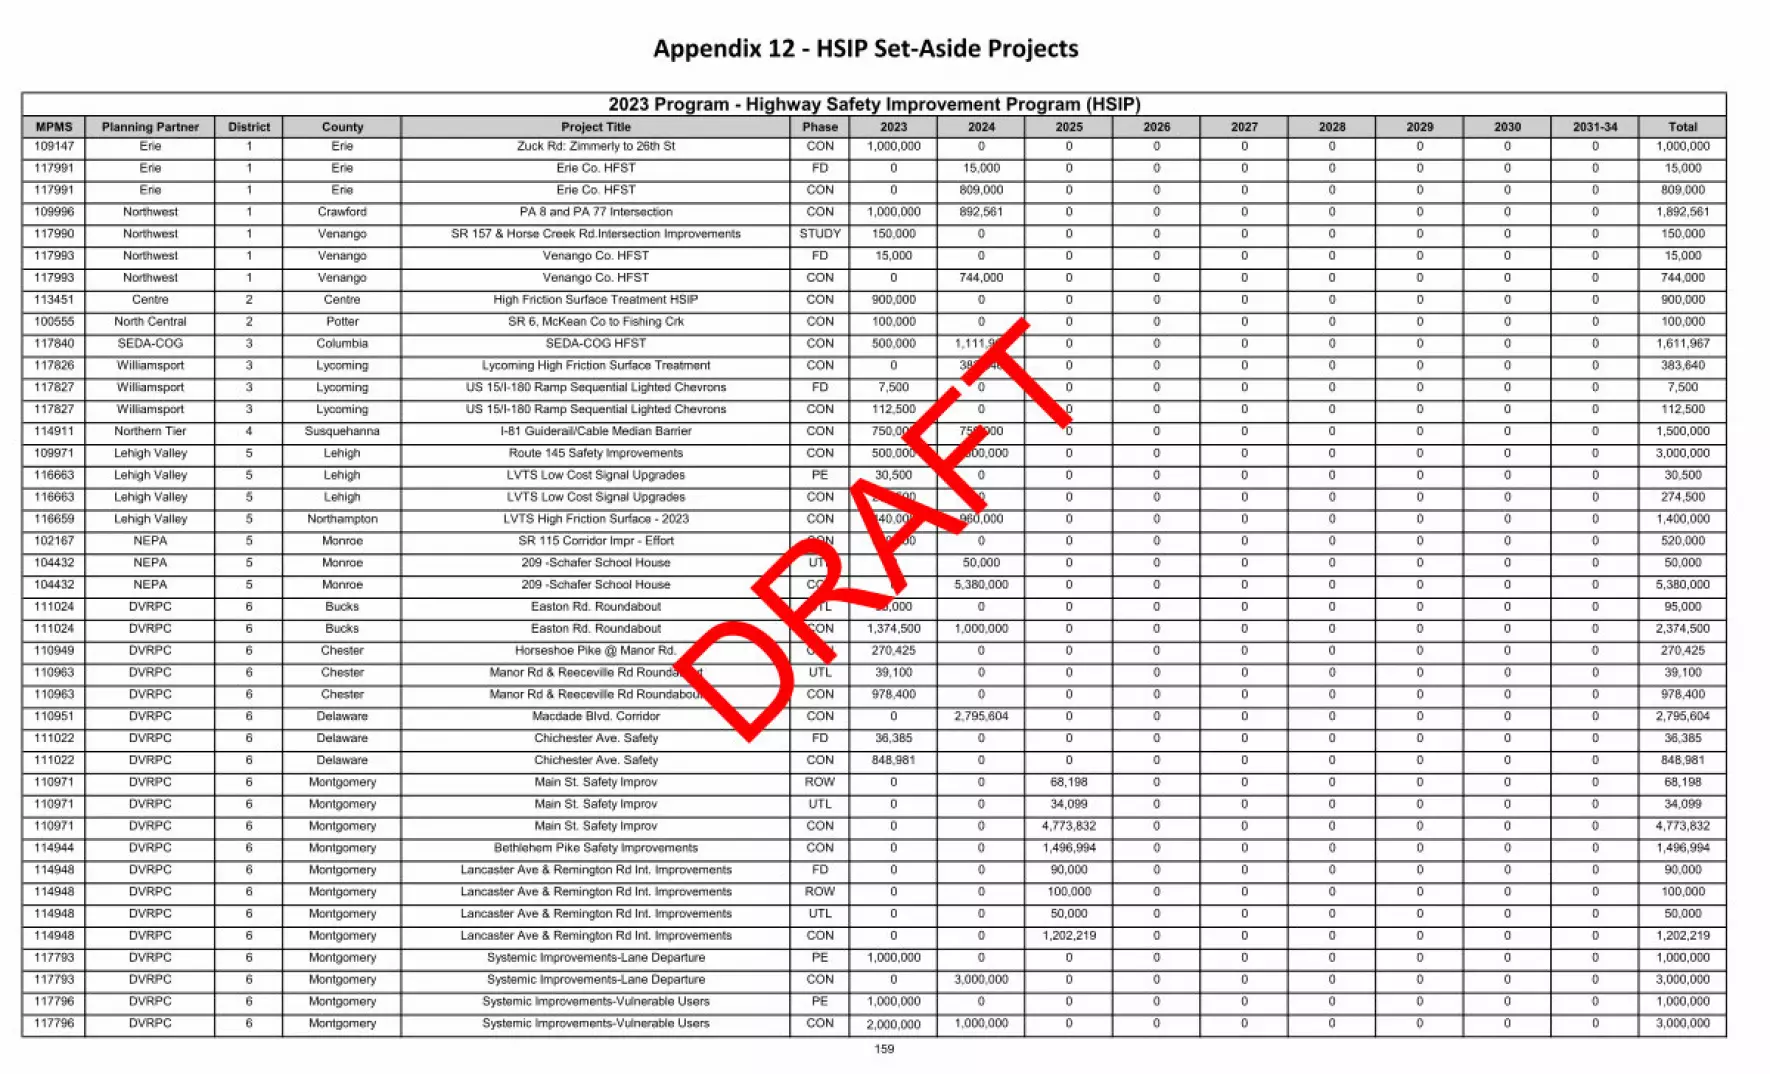
MPMS Planning Partner District County Project Title Phase 2023 2024 2025 2026 2027 2028 2029 2030 2031-34 Total109147 Erie 1 Erie Zuck Rd: Zimmerly to 26th St CON 1,000,000 0 0 0 0 0 0 0 0 1,000,000
117991 Erie 1 Erie Erie Co. HFST FD 0 15,000 0 0 0 0 0 0 0 15,000
117991 Erie 1 Erie Erie Co. HFST CON 0 809,000 0 0 0 0 0 0 0 809,000
109996 Northwest 1 Crawford PA 8 and PA 77 Intersection CON 1,000,000 892,561 0 0 0 0 0 0 0 1,892,561
117990 Northwest 1 Venango SR 157 & Horse Creek Rd.Intersection Improvements STUDY 150,000 0 0 0 0 0 0 0 0 150,000
117993 Northwest 1 Venango Venango Co. HFST FD 15,000 0 0 0 0 0 0 0 0 15,000
117993 Northwest 1 Venango Venango Co. HFST CON 0 744,000 0 0 0 0 0 0 0 744,000
113451 Centre 2 Centre High Friction Surface Treatment HSIP CON 900,000 0 0 0 0 0 0 0 0 900,000
100555 North Central 2 Potter SR 6, McKean Co to Fishing Crk CON 100,000 0 0 0 0 0 0 0 0 100,000
117840 SEDA-COG 3 Columbia SEDA-COG HFST CON 500,000 1,111,967 0 0 0 0 0 0 0 1,611,967
117826 Williamsport 3 Lycoming Lycoming High Friction Surface Treatment CON 0 383,640 0 0 0 0 0 0 0 383,640
117827 Williamsport 3 Lycoming US 15/I-180 Ramp Sequential Lighted Chevrons FD 7,500 0 0 0 0 0 0 0 0 7,500
117827 Williamsport 3 Lycoming US 15/I-180 Ramp Sequential Lighted Chevrons CON 112,500 0 0 0 0 0 0 0 0 112,500
114911 Northern Tier 4 Susquehanna I-81 Guiderail/Cable Median Barrier CON 750,000 750,000 0 0 0 0 0 0 0 1,500,000
109971 Lehigh Valley 5 Lehigh Route 145 Safety Improvements CON 500,000 2,500,000 0 0 0 0 0 0 0 3,000,000
116663 Lehigh Valley 5 Lehigh LVTS Low Cost Signal Upgrades PE 30,500 0 0 0 0 0 0 0 0 30,500
116663 Lehigh Valley 5 Lehigh LVTS Low Cost Signal Upgrades CON 274,500 0 0 0 0 0 0 0 0 274,500
116659 Lehigh Valley 5 Northampton LVTS High Friction Surface - 2023 CON 440,000 960,000 0 0 0 0 0 0 0 1,400,000
102167 NEPA 5 Monroe SR 115 Corridor Impr - Effort CON 520,000 0 0 0 0 0 0 0 0 520,000
104432 NEPA 5 Monroe 209 -Schafer School House UTL 0 50,000 0 0 0 0 0 0 0 50,000
104432 NEPA 5 Monroe 209 -Schafer School House CON 0 5,380,000 0 0 0 0 0 0 0 5,380,000
111024 DVRPC 6 Bucks Easton Rd. Roundabout UTL 95,000 0 0 0 0 0 0 0 0 95,000
111024 DVRPC 6 Bucks Easton Rd. Roundabout CON 1,374,500 1,000,000 0 0 0 0 0 0 0 2,374,500
110949 DVRPC 6 Chester Horseshoe Pike @ Manor Rd. CON 270,425 0 0 0 0 0 0 0 0 270,425
110963 DVRPC 6 Chester Manor Rd & Reeceville Rd Roundabout UTL 39,100 0 0 0 0 0 0 0 0 39,100
110963 DVRPC 6 Chester Manor Rd & Reeceville Rd Roundabout CON 978,400 0 0 0 0 0 0 0 0 978,400
110951 DVRPC 6 Delaware Macdade Blvd. Corridor CON 0 2,795,604 0 0 0 0 0 0 0 2,795,604
111022 DVRPC 6 Delaware Chichester Ave. Safety FD 36,385 0 0 0 0 0 0 0 0 36,385
111022 DVRPC 6 Delaware Chichester Ave. Safety CON 848,981 0 0 0 0 0 0 0 0 848,981
110971 DVRPC 6 Montgomery Main St. Safety Improv ROW 0 0 68,198 0 0 0 0 0 0 68,198
110971 DVRPC 6 Montgomery Main St. Safety Improv UTL 0 0 34,099 0 0 0 0 0 0 34,099
110971 DVRPC 6 Montgomery Main St. Safety Improv CON 0 0 4,773,832 0 0 0 0 0 0 4,773,832
114944 DVRPC 6 Montgomery Bethlehem Pike Safety Improvements CON 0 0 1,496,994 0 0 0 0 0 0 1,496,994
114948 DVRPC 6 Montgomery Lancaster Ave & Remington Rd Int. Improvements FD 0 0 90,000 0 0 0 0 0 0 90,000
114948 DVRPC 6 Montgomery Lancaster Ave & Remington Rd Int. Improvements ROW 0 0 100,000 0 0 0 0 0 0 100,000
114948 DVRPC 6 Montgomery Lancaster Ave & Remington Rd Int. Improvements UTL 0 0 50,000 0 0 0 0 0 0 50,000
114948 DVRPC 6 Montgomery Lancaster Ave & Remington Rd Int. Improvements CON 0 0 1,202,219 0 0 0 0 0 0 1,202,219
117793 DVRPC 6 Montgomery Systemic Improvements-Lane Departure PE 1,000,000 0 0 0 0 0 0 0 0 1,000,000
117793 DVRPC 6 Montgomery Systemic Improvements-Lane Departure CON 0 3,000,000 0 0 0 0 0 0 0 3,000,000
117796 DVRPC 6 Montgomery Systemic Improvements-Vulnerable Users PE 1,000,000 0 0 0 0 0 0 0 0 1,000,000
117796 DVRPC 6 Montgomery Systemic Improvements-Vulnerable Users CON 2,000,000 1,000,000 0 0 0 0 0 0 0 3,000,000
2023 Program - Highway Safety Improvement Program (HSIP)
Appendix 12 - HSIP Set-Aside Projects
159
DRAFT

MPMS Planning Partner District County Project Title Phase 2023 2024 2025 2026 2027 2028 2029 2030 2031-34 Total2023 Program - Highway Safety Improvement Program (HSIP)
106993 DVRPC 6 Philadelphia Frankford Avenue Signal Improvements CON 0 1,607,235 0 0 0 0 0 0 0 1,607,235
110958 DVRPC 6 Philadelphia Castor Ave. Roundabout CON 500,000 262,200 0 0 0 0 0 0 0 762,200
114942 DVRPC 6 Philadelphia Roosevelt Blvd IHSDM Study STUDY 0 0 950,000 0 0 0 0 0 0 950,000
114559 Harrisburg 8 Cumberland Systemic Low-Cost Improvements for Stop Controlled CON 274,443 0 0 0 0 0 0 0 0 274,443
114562 Harrisburg 8 Cumberland Systemic Roadway Departure Low Cost Safety Improve CON 171,691 1,253,737 0 0 0 0 0 0 0 1,425,428
114564 York 8 York York County Low Cost Signal Improvements CON 651,298 0 0 0 0 0 0 0 0 651,298
116673 S. Alleghenies 9 Bedford S Alleghenies Rumbles and HFST CON 0 798,050 0 0 0 0 0 0 0 798,050
116670 S. Alleghenies 9 Somerset Stutzmantown Rd Intrsctn Improvements CON 300,000 0 0 0 0 0 0 0 0 300,000
117197 North Central 10 Jefferson SR 322/SR 1830 Intersection ITS FD 10,000 0 0 0 0 0 0 0 0 10,000
117197 North Central 10 Jefferson SR 322/SR 1830 Intersection ITS CON 0 190,000 0 0 0 0 0 0 0 190,000
117211 Northwest 10 Clarion US 322 Bus Mong Intersection ITS FD 10,000 0 0 0 0 0 0 0 0 10,000
117211 Northwest 10 Clarion US 322 Bus Mong Intersection ITS CON 0 190,000 0 0 0 0 0 0 0 190,000
117907 SPC 10 Armstrong SR 85/SR 2001 Intersection ITS FD 10,000 0 0 0 0 0 0 0 0 10,000
117907 SPC 10 Armstrong SR 85/SR 2001 Intersection ITS CON 0 190,000 0 0 0 0 0 0 0 190,000
110783 SPC 10 Butler 10-2 SR 3021 Corridor Improvements CON 2,000,000 4,500,000 0 0 0 0 0 0 0 6,500,000
117903 SPC 10 Butler SR 8/SR 4010 Intersection ITS FD 10,000 0 0 0 0 0 0 0 0 10,000
117903 SPC 10 Butler SR 8/SR 4010 Intersection ITS CON 0 190,000 0 0 0 0 0 0 0 190,000
117905 SPC 10 Butler SR 4010/Harmony Intersection ITS FD 10,000 0 0 0 0 0 0 0 0 10,000
117905 SPC 10 Butler SR 4010/Harmony Intersection ITS CON 0 190,000 0 0 0 0 0 0 0 190,000
117909 SPC 10 Indiana SR 422/SR 403 Intersection ITS FD 10,000 0 0 0 0 0 0 0 0 10,000
117909 SPC 10 Indiana SR 422/SR 403 Intersection ITS CON 0 190,000 0 0 0 0 0 0 0 190,000
106773 SPC 11 Allegheny Liberty Ave FD 450,000 0 0 0 0 0 0 0 0 450,000
106773 SPC 11 Allegheny Liberty Ave CON 880,000 2,000,000 0 0 0 0 0 0 0 2,880,000
117911 SPC 11 Allegheny Wrong Way Detection System FD 0 250,000 0 0 0 0 0 0 0 250,000
117911 SPC 11 Allegheny Wrong Way Detection System CON 0 750,000 0 0 0 0 0 0 0 750,000
118000 SPC 12 Fayette PA 201/PA 217 Flashing Beacon 2021 UTL 50,000 0 0 0 0 0 0 0 0 50,000
118000 SPC 12 Fayette PA 201/PA 217 Flashing Beacon 2021 CON 300,000 0 0 0 0 0 0 0 0 300,000
118001 SPC 12 Fayette D12 Intersection Warning Signs CON 300,000 0 0 0 0 0 0 0 0 300,000
118002 SPC 12 Fayette US 40/PA 281 Turn Lane Upgrades CON 800,000 0 0 0 0 0 0 0 0 800,000
118003 SPC 12 Greene PA 18/PA 21 Safety Improvements UTL 500,000 0 0 0 0 0 0 0 0 500,000
118003 SPC 12 Greene PA 18/PA 21 Safety Improvements CON 1,000,000 1,000,000 0 0 0 0 0 0 0 2,000,000
101969 STWD Items 99 Central Office HSIP Set Aside Reserve CON 12,855,877 1,983,106 31,234,658 40,000,000 40,000,000 40,000,000 40,000,000 40,000,000 160,000,000 406,073,641
117915 STWD Items 99 Central Office PennDOT Highway Safety Network Screening update PRA 2,000,000 0 0 0 0 0 0 0 0 2,000,000
117918 STWD Items 99 Central Office Local Road Traffic Counts for MIRE Sept 2026 PRA 1,500,000 1,500,000 0 0 0 0 0 0 0 3,000,000
117944 STWD Items 99 Central Office New HSIP Application Website PRA 300,000 0 0 0 0 0 0 0 0 300,000
117954 STWD Items 99 Central Office Update Pennsylvania SPFs PRA 300,000 1,000,000 0 0 0 0 0 0 0 1,300,000
117956 STWD Items 99 Central Office Video Log Curve Data Collection PRA 563,900 563,900 0 0 0 0 0 0 0 1,127,800
117958 STWD Items 99 Central Office Vulnerable Users Safety Assessment PRA 300,000 0 0 0 0 0 0 0 0 300,000
40,000,000 40,000,000 40,000,000 40,000,000 40,000,000 40,000,000 40,000,000 40,000,000 160,000,000 480,000,000
160
DRAFT

MPMS Planning Partner District County Project Title Phase 2023 2024 2025 2026 2027 2028 2029 2030 2031-34 Total105066 Northern Tier 3 Tioga Marsh Creek Greenway North CON 0 750,000 750,000 0 0 0 0 0 0 1,500,000
111599 SEDA-COG 3 Montour Danville North Branch Canal Trail LeveeTrail CON 0 620,629 0 0 0 0 0 0 0 620,629
111625 Williamsport 3 Lycoming Miller's Run Greenway: BHP to Riverwalk CON 682,000 0 0 0 0 0 0 0 0 682,000
111628 Williamsport 3 Lycoming Willow Street Green Pathway CON 0 500,000 500,000 0 0 0 0 0 0 1,000,000
111466 Scranton/W-B 4 Lackawanna Keystone College Pedestrian and Trail Connections CON 700,000 217,815 0 0 0 0 0 0 0 917,815
111472 Scranton/W-B 4 Lackawanna Lack River Heritage Trail to Steamtown Ped Bridge CON 500,000 500,000 0 0 0 0 0 0 0 1,000,000
111473 Scranton/W-B 4 Luzerne Pittston North Main Street Streetscape CON 500,000 0 0 0 0 0 0 0 0 500,000
111464 DVRPC 6 Bucks Shady Retreat SRTS Trail(L) CON 985,000 0 0 0 0 0 0 0 0 985,000
111486 DVRPC 6 Delaware Octoraro Trail Phase 1 CON 663,000 500,000 0 0 0 0 0 0 0 1,163,000
111487 DVRPC 6 Delaware Walkable Chadds Ford(L) CON 1,000,000 0 0 0 0 0 0 0 0 1,000,000
111488 DVRPC 6 Delaware Ridge Road Stormwater CON 400,000 0 0 0 0 0 0 0 0 400,000
111492 DVRPC 6 Montgomery Limekiln Pike Sidewalk CON 750,000 0 0 0 0 0 0 0 0 750,000
111495 DVRPC 6 Montgomery Main Street/SR 29 Ped Imprv(L) CON 682,000 0 0 0 0 0 0 0 0 682,000
79830 DVRPC 6 Philadelphia N Dela GreenTrail Sec1(C) CON 500,000 0 0 0 0 0 0 0 0 500,000
111496 DVRPC 6 Philadelphia Franklin Square Ped Access CON 0 432,000 0 0 0 0 0 0 0 432,000
111500 DVRPC 6 Philadelphia Manayunk Canal Masonry Wall Restor CON 500,000 500,000 0 0 0 0 0 0 0 1,000,000
111505 DVRPC 6 Philadelphia Mid-Block Crossing U City CON 500,000 500,000 0 0 0 0 0 0 0 1,000,000
111506 DVRPC 6 Philadelphia Blvd Ped Safety & Direct Bus(L) CON 500,000 0 0 0 0 0 0 0 0 500,000
111507 DVRPC 6 Philadelphia Cramp Elementary Safety CON 595,000 400,000 0 0 0 0 0 0 0 995,000
111508 DVRPC 6 Philadelphia South Broad Street Sidepath CON 497,000 500,000 0 0 0 0 0 0 0 997,000
111396 Lebanon 8 Lebanon LVRT Phase 6B CON 500,000 0 0 0 0 0 0 0 0 500,000
111470 Altoona 9 Blair Logan Valley Streetcar Trail, Phase 1 CON 875,780 0 0 0 0 0 0 0 0 875,780
111408 SPC 11 Allegheny Critical Sidewalk Gap TAP CON 580,000 400,000 0 0 0 0 0 0 0 980,000
111422 SPC 11 Allegheny Pittsburgh SRTS Coordinator TAP CON 220,000 0 0 0 0 0 0 0 0 220,000
60560 STWD Items 99 Central Office TAP Reserve CON 15,684,306 23,546,556 28,728,000 30,604,000 30,604,000 30,604,000 30,604,000 30,604,000 122,414,000 343,392,862
27,814,086 29,367,000 29,978,000 30,604,000 30,604,000 30,604,000 30,604,000 30,604,000 122,414,000 362,593,086
2023 Program - Transportation Alternatives Set Aside (TAP)
Appendix 13 - Transportation Alternatives Program Projects
161
DRAFT

162
DRAFT

MPMS Planning Partner District County Project Title Phase 2023 2024 2025 2026 2027 2028 2029 2030 2031-34 Total113951 North Central 2 Elk City of St.Marys SR 120 Connector FD 145,000 0 0 0 0 0 0 0 0 145,000
113951 North Central 2 Elk City of St.Marys SR 120 Connector ROW 187,000 0 0 0 0 0 0 0 0 187,000
113951 North Central 2 Elk City of St.Marys SR 120 Connector UTL 35,000 0 0 0 0 0 0 0 0 35,000
113951 North Central 2 Elk City of St.Marys SR 120 Connector CON 2,721,624 0 0 0 0 0 0 0 0 2,721,624
113723 Scranton/W-B 4 Lackawanna Roadway Improvements SR 632 FD 225,000 0 0 0 0 0 0 0 0 225,000
113723 Scranton/W-B 4 Lackawanna Roadway Improvements SR 632 ROW 100,000 0 0 0 0 0 0 0 0 100,000
113723 Scranton/W-B 4 Lackawanna Roadway Improvements SR 632 UTL 50,000 0 0 0 0 0 0 0 0 50,000
113723 Scranton/W-B 4 Lackawanna Roadway Improvements SR 632 CON 0 2,275,000 0 0 0 0 0 0 0 2,275,000
112882 Lancaster 8 Lancaster Walnut Street Extension CON 3,000,000 3,840,000 0 0 0 0 0 0 0 6,840,000
115633 York 8 York Fairview Crossroads CON 1,000,000 800,000 0 0 0 0 0 0 0 1,800,000
111796 SPC 10 Indiana Indian Springs Road/Rustic Lodge Road Intersection ROW 175,226 0 0 0 0 0 0 0 0 175,226
111796 SPC 10 Indiana Indian Springs Road/Rustic Lodge Road Intersection UTL 87,613 0 0 0 0 0 0 0 0 87,613
111796 SPC 10 Indiana Indian Springs Road/Rustic Lodge Road Intersection CON 1,221,905 0 0 0 0 0 0 0 0 1,221,905
98125 SPC 11 Allegheny Bates Street Improvement PE 1,000,000 0 0 0 0 0 0 0 0 1,000,000
102661 SPC 11 Beaver Aliquippa East End Gateway, Ph 1 TIIF FD 700,000 0 0 0 0 0 0 0 0 700,000
102661 SPC 11 Beaver Aliquippa East End Gateway, Ph 1 TIIF ROW 0 275,000 0 0 0 0 0 0 0 275,000
102661 SPC 11 Beaver Aliquippa East End Gateway, Ph 1 TIIF UTL 0 520,000 0 0 0 0 0 0 0 520,000
102661 SPC 11 Beaver Aliquippa East End Gateway, Ph 1 TIIF CON 0 0 2,500,000 2,580,000 0 0 0 0 0 5,080,000
112022 SPC 11 Beaver Monaca Gateway MTF-TIIF-Smart FD 750,000 0 0 0 0 0 0 0 0 750,000
112022 SPC 11 Beaver Monaca Gateway MTF-TIIF-Smart ROW 800,000 0 0 0 0 0 0 0 0 800,000
112022 SPC 11 Beaver Monaca Gateway MTF-TIIF-Smart UTL 450,000 0 0 0 0 0 0 0 0 450,000
60469 STWD Items 99 Central Office TIIF Reserve CON 12,351,632 17,290,000 22,500,000 22,420,000 25,000,000 25,000,000 25,000,000 25,000,000 100,000,000 274,561,632
25,000,000 25,000,000 25,000,000 25,000,000 25,000,000 25,000,000 25,000,000 25,000,000 100,000,000 300,000,000
2023 Program - Transportation Infrastructure Investment Fund (TIIF)
Appendix 14 - Transportation Infrastructure Investment Fund Projects
163
DRAFT

164
DRAFT

Pennsylvania Transportation Performance Management Performance-based Planning and Programming Procedures
Page 1 of 15
The Moving Ahead for Progress in the 21st Century Act (MAP-21) and the Fixing America’s Surface Transportation (FAST) Act include performance management requirements. Performance-based planning will ensure that the Pennsylvania Department of Transportation (PennDOT) and Pennsylvania’s Metropolitan Planning Organizations (MPO) collectively invest Federal transportation funds efficiently towards achieving national goals. In Pennsylvania, the Rural Planning Organizations (RPO) follow the same requirements as MPOs.
Transportation Performance Management (TPM) is a strategic approach that uses data to make investment and policy decisions to achieve national performance goals. Title 23 Part 490 of the Code of Federal Regulations (23 CFR 490) outlines the national performance goals for the Federal-aid program. It establishes the seven goal areas: safety, infrastructure condition, congestion reduction, system reliability, freight, environmental sustainability and reduced project delivery delay.
The regulations require the United States Department of Transportation (DOT)/Federal Highway Administration (FHWA) to establish final rules on performance measures. The final rules address the seven areas in the legislation, identifying the following as performance measures for the system:
• pavement condition on the Interstate system and on the remainder of the NationalHighway System (NHS)
• performance (system reliability) of the Interstate system and the remainder of the NHS• bridge condition on the NHS• fatalities and serious injuries, both number and rate per vehicle mile traveled, on all public
roads• traffic congestion• on-road mobile source emissions• freight movement on the Interstate system
Performance Based Planning and Programming
Pennsylvania has long utilized a comprehensive planning and programming process, with a focus on collaboration between PennDOT, FHWA, and Planning Partners (MPOs/RPOs) at the county and regional levels. This approach will be applied to begin implementation of TPM and Performance Based Planning and Programming (PBPP).
PBPP requirements are outlined in Title 23 Part 450 of the Code of Federal Regulations (23 CFR 450). Subparts B & C requires the State Department of Transportation, MPO and operators of public transportation to jointly agree-upon written provisions for how they will cooperatively develop, and share information related to five key elements of PBPP:
• transportation performance data• the selection of performance targets• the reporting of performance targets
Appendix 15 - Performance Based Planning and Programming Provisions
165
DRAFT

Pennsylvania Transportation Performance Management Performance-based Planning and Programming Procedures
Page 2 of 15
• the reporting of performance to be used in tracking critical outcomes for the region ofthe MPO
• the collection of data for the State asset management plan for the National HighwaySystem (NHS)
PennDOT in cooperation with MPOs/RPOs developed this document to serve as Pennsylvania’s jointly-written provisions for PBPP roles and responsibilities per 23 CFR 450.314(h) for:
• PM1 measures – the safety performance measures• PM2 measures – the NHS pavements, bridges carrying the NHS, and pavements on the
Interstate measures• PM3 measures – the performance of the NHS, freight movement on the Interstate, and
the Congestion Mitigation and Air Quality Improvement (CMAQ) Program
PennDOT Executives, Center for Program Development and Management (CPDM), and Bureau of Maintenance and Operations (BOMO), Bureau of Project Delivery (BPD, Engineering Districts and MPOs/RPOs will coordinate to ensure the Statewide Long Range Transportation Plan (LRTP), Statewide Transportation Improvement Program (STIP), regional Transportation Improvement Programs (TIP) and regional LRTPs are developed and amended to meet the PBPP requirements of the planning rule and the performance measure rules.
This coordination will occur when setting targets to ensure consistency to the maximum extent possible. Each MPO/RPO will need to establish targets by either adoption of the State’s performance targets and support the State’s efforts in achieving those targets or establish their own quantifiable performance targets.
PennDOT CPDM in coordination with BOMO will include a description of the individual performance measures and targets for those measures in Statewide LRTPs moving forward. Each MPO/RPO will also include individual performance measures and targets for those measures in their regional LRTPs moving forward. In addition to including the performance measures and targets in the Statewide and Regional LRTPs, PennDOT CPDM, BOMO, Engineering Districts and each MPO/RPOs are also required to include a system performance report. That report provides an evaluation of system performance with respect to the performance targets. PennDOT CPDM and BOMO in coordination with Engineering Districts will include progress achieved by MPOs/RPOs in meeting the MPO performance targets in comparison with system performance recorded in previous reports [23 CFR 450.216(f)(2); 23 CFR 450.324(f)(4)]. For MPOs/RPOs that voluntarily elect to develop multiple scenarios when developing the regional LRTP, the MPO/RPO must conduct an analysis as part of the systems performance report on how the preferred scenario has improved the conditions and performance of the transportation system and how changes in local policies and investments have impacted the costs necessary to achieve the identified performance targets [23 CFR 450.324(f)(4)(ii)].
PennDOT and the MPOs/RPOs will include a description on progress towards each of the performance measures and targets as plans are updated. The progress explanation should
166
DRAFT

Pennsylvania Transportation Performance Management Performance-based Planning and Programming Procedures
Page 3 of 15
include the information that is available at the time of the plan adoption, such as information that has been reported as part of the reports required under 23 CFR 490.107. With subsequent adoptions of LRTPs, PennDOT and MPOs/RPOS must continue to include a system performance report. These reports must describe the progress of the MPO/RPOs in meeting the performance targets in comparison with system performance recorded in previous years.
Safety Performance Measures
The FHWA final rules for the National Performance Management Measures: Highway Safety Improvement Program (Safety PM) and Highway Safety Improvement Program (HSIP) were published in the Federal Register (81 FR 13881 and 81 FR 13722) on March 15, 2016, and became effective on April 14, 2016.
These final rules were the first in a series of three related rulemakings that together establish a set of performance measures for State DOTs and MPOs to use as required by MAP–21 and the FAST Act.
The HSIP Final Rule updates the HSIP regulation under 23 CFR Part 924 to be consistent with MAP-21 and the FAST Act while clarifying existing program requirements. The Safety PM Final Rule adds Part 490 to Title 23 of the Code of Federal Regulations (CFR) to implement the performance management requirements in 23 U.S.C. 150.
The Safety PM Final Rule, also referred to as PM1 Final Rule, establishes safety performance measure requirements for carrying out the HSIP and to assessing fatalities and serious injuries on all public roads.
The Safety PM Final Rule establishes five performance measures used in determining five-year rolling averages to include:
• Number of Fatalities• Rate of Fatalities per 100 million Vehicle Miles Traveled (VMT)• Number of Serious Injuries• Rate of Serious Injuries per 100 million VMT• Number of Non-Motorized Fatalities and Non-Motorized Serious Injuries
Target Setting:
Pennsylvania’s Strategic Highway Safety Plan (SHSP) serves as a blueprint to reduce fatalities and serious injuries on Pennsylvania roadways and targets priority Safety Focus Areas (SFAs) that have the most influence on improving highway safety throughout the state. The SHSP contains Pennsylvania’s statewide goals for fatalities and serious injuries. The SHSP has been developed and will be updated in conjunction with stakeholders including federal, state, local and private sector agencies including Pennsylvania’s MPOs/RPOs.
167
DRAFT

Pennsylvania Transportation Performance Management Performance-based Planning and Programming Procedures
Page 4 of 15
Pennsylvania established a Safety Planning workgroup with representation from PennDOT CPDM, BOMO, Engineering Districts, the MPOs/RPOs and FHWA. The group includes technical safety and planning professionals that meet regularly to discuss relative topics such as the SHSP and performance measures. PennDOT and the MPOs/RPOs will continue to utilize this workgroup to coordinate the State’s safety target setting. Information discussed as part of this workgroup will be shared at Statewide Planning Partner Meetings and conference calls.
PennDOT CPDM in coordination with BOMO will be responsible for scheduling and conducting Safety Planning Workgroup calls. PennDOT CPDM will be responsible for scheduling and conducting Planning Partner meetings and conference calls, where coordination on target setting will occur.
MPOs/RPOs will be responsible for ensuring there is adequate MPO/RPO representation on the Safety Planning Workgroup. All MPOs/RPOs will ensure they participate in Planning Partner meetings and conference calls to provide input into performance measure and target coordination.
PennDOT BOMO will submit the state safety targets as part of the annual Pennsylvania Highway Safety Plan submitted to NHTSA. The state targets for the number of fatalities, number of serious injury and rate of fatalities need to be identical to those submitted to FHWA. PennDOT will include state safety targets for all five of the safety performance measures as part of the annual Pennsylvania Highway Safety Improvement Program (HSIP) report submitted to FHWA.
PennDOT CPDM will share the annual submissions and/or another type of notification of the state targets with the MPOs/RPOs in a timely manner.
All Pennsylvania MPOs/RPOs will establish targets for each performance measure and communicate adoption to PennDOT CPDM within 180 days of PennDOT establishing targets either by agreeing to plan and program projects in support of PennDOT targets, or by committing to their own quantifiable targets. If an MPO/RPO chooses to establish their own performance targets, they would need to coordinate with PennDOT CPDM and BOMO on the selection of the targets and provide methodology, including VMT used to develop their targets to ensure consistency, to the maximum extent practicable.
Data Collection and Analysis:
Data for the fatality-related measures are taken from the Fatality Analysis Reporting System (FARS) and data for the serious injury-related measures are taken from the State crash database. The VMT are derived from the Highway Performance Monitoring System (HPMS).
PennDOT BOMO will review the State’s crash and fatality data and evaluate it for overall trends. PennDOT BOMO will compare these trends to what can be observed at the national level.
168
DRAFT

Pennsylvania Transportation Performance Management Performance-based Planning and Programming Procedures
Page 5 of 15
PennDOT BOMO will assess the state and national trends to determine how they relate to the SHSP Goals and the National Toward Zero Death initiative.
PennDOT BOMO will provide CPDM statewide data to share with the MPOs/RPOs to assist them in deciding whether they are going to support the State’s targets or adopt their own.
MPOs/RPOs should utilize their specific data from the Pennsylvania Crash Information Tool to further assist in their decision-making process as to whether they are going to support the State’s targets or adopt their own.
Progress Towards Target Achievement and Reporting:
PennDOT and the MPOs/RPOs will include safety performance measures and targets in the STIP, regional TIPs, and LRTPs.
PennDOT and the MPOs/RPOs will ensure the STIP, regional TIPs, and LRTPs are developed and managed to support progress toward target achievement.
PennDOT BOMO will include information on safety targets and progress towards meeting targets as part of annual Safety submissions to NHTSA and FHWA. FHWA will utilize data from a base line period for assessing significant progress. Four of the five measures will need to be met or significantly improve. FHWA will determine if Pennsylvania has met or made significant progress toward meeting its safety targets. When FHWA reports their findings to PennDOT, CPDM will share the findings with MPOs/RPOs.
When collaborating to set annual targets, PennDOT BOMO, CPDM and Engineering Districts will coordinate to provide feedback on statewide and MPO/RPO specific progress towards target achievement as it becomes available.
In accordance with 23 CFR 450.216(f), PennDOT CPDM in coordination with BOMO will include a description of the individual safety performance measures and targets for those measures for the Statewide LRTP moving forward. In addition to including safety performance measures and targets in the Statewide LRTP, PennDOT CPDM in coordination with BOMO will include a system performance report. That report must include an evaluation of system performance with respect to the performance targets. PennDOT CPDM in coordination with BOMO will include a description of progress achieved by the MPOs/RPOs in meeting the MPO/RPO performance targets in comparison with system performance recorded in previous reports [23 CFR 450.216(f)(2)]. The progress description will include the information that has been reported as part of the reports required under 23 CFR 490.107. With subsequent adoptions of Statewide LRTPs, PennDOT CPDM in coordination with BOMO will continue to include a system performance report describing the progress of meeting the performance targets in comparison with system performance recorded in previous years.
169
DRAFT

Pennsylvania Transportation Performance Management Performance-based Planning and Programming Procedures
Page 6 of 15
In accordance with 23 CFR 450.324(f)(3-4), MPOs/RPOs will include a description of the individual safety performance measures and targets for those measures for regional LRTPs moving forward. In addition to including performance measures and targets in the regional LRTPs, MPOs/RPOs will include a system performance report. That report must include an evaluation of system performance with respect to the performance targets. MPOs/RPOs will describe progress achieved in meeting the performance targets in comparison with system performance recorded in previous reports [23 CFR 450.324(f)(4)(i)]. The progress description will include the information that has been reported as part of the reports required under 23 CFR 490.107. With subsequent adoptions of regional LRTPs, MPOs/RPOs will continue to include a system performance report describing the progress of meeting the performance targets in comparison with system performance recorded in previous years.
In accordance with 23 CFR 450.218(q), PennDOT CPDM in coordination with BOMO will include a narrative description in the STIP on how the program of projects contributes to the achievement of the safety performance targets. The narratives should document PBPP objectives, investment strategies, performance measures and targets from the strategic highway safety plan (SHSP), highway safety improvement program (HSIP), and other performance-based plans are being implemented through the program of projects in the STIP.
In accordance with 23 CFR 450.326(d), MPOs/RPOs will include a narrative description in the TIP on how the program of projects contributes to the achievement of the safety performance targets. The narratives should document PBPP objectives, investment strategies, performance measures and targets from the strategic highway safety plan (SHSP), highway safety improvement program (HSIP), and other performance-based plans are being implemented through the program of projects in the TIP.
Pavement/Bridge Performance Measures
The FHWA final rule for the National Performance Management Measures; Assessing Pavement Condition for the National Highway Performance Program and Bridge was published in the Federal Register (82 FR 5886) on January 18, 2017 and became effective on February 17, 2017.
This final rule was the second in a series of three related rulemakings that together establishes a set of performance measures for State DOTs and MPOs to use as required by MAP–21 and the FAST Act.
The final rule established performance measures for all State DOTs to use to carry out the National Highway Performance Program (NHPP) and to assess the condition of pavements on the Interstate System, pavements on the NHS (excluding the Interstate System), bridges carrying the NHS which include on and off ramps connected to the NHS. The NHPP is a core Federal-aid highway program that provides support for the condition and performance of the NHS and the construction of new facilities on the NHS. The NHPP also ensures that investments of Federal-aid funds in highway construction are directed to support progress toward the achievement of
170
DRAFT
Pennsylvania Transportation Performance Management Performance-based Planning and Programming Procedures
Page 7 of 15
performance targets as established in a State's Transportation Asset Management Plan (TAMP) for the NHS. This final rule establishes regulations for the new performance aspects of the NHPP that address measures, targets, and reporting.
The pavement and bridge performance measures, collectively referred to as the PM2 measures include:
• % of Interstate pavements in Good condition• % of Interstate pavements in Poor condition• % of non-Interstate NHS pavements in Good condition• % of non-Interstate NHS pavements in Poor condition• % of NHS bridges by deck area classified in Good condition• % of NHS bridges by deck area classified in Poor condition
Target setting:
Pennsylvania established a TAMP Steering Committee with representation from PennDOT’s Executive staff, Engineering Districts, Asset Management Division, Center for Program Development and Management, Bureau of Planning and Research, Highway Safety and Traffic Operations Division, FHWA, the Pennsylvania Turnpike Commission (PTC) and MPOs/RPOs. The workgroups purpose is to manage and coordinate the development, submission, and implementation of the TAMP, and the pavement and bridge condition performance measures.
PennDOT CPDM, BOMO, Engineering Districts and the MPOs/RPOs will continue to utilize the committee to coordinate the State’s pavement and bridge target setting. Information discussed as part of the committee will be shared at Statewide Planning Partner Meetings and conference calls.
To satisfy 23 CFR 490.105(e)(2), PennDOT will coordinate with MPOs/RPOs on the development of the measures and selection of targets to ensure consistency, to the maximum extent practicable. PennDOT BOMO in coordination with CPDM will be responsible for scheduling and conducting TAMP Steering committee meetings. PennDOT CPDM will be responsible for scheduling and conducting Planning Partner meetings and conference calls, where coordination on target setting will occur.
MPOs/RPOs will be responsible for providing representation on the committee. All MPOs/RPOs will ensure they participate in Planning Partner meetings and conference calls to provide input into performance measure and target coordination.
PennDOT is required to set State 2-year and 4-year targets biennially. PennDOT will have the option to adjust the four-year targets in the Mid Performance Period Progress Report.
PennDOT will report the targets as part of FHWA required Performance Reporting.
171
DRAFT
Pennsylvania Transportation Performance Management Performance-based Planning and Programming Procedures
Page 8 of 15
PennDOT CPDM will share the reporting submissions and/or another type of notification of the state targets with the MPOs/RPOs in a timely manner.
All Pennsylvania MPOs/RPOs will establish targets for each performance measure and communicate adoption to PennDOT CPDM, within 180 days of PennDOT establishing (or amending) targets either by agreeing to plan and program projects in support of PennDOT targets, or by committing to their own quantifiable targets. If an MPO/RPO chooses to establish their own performance targets, they would need to coordinate with PennDOT CPDM and BOMO on the selection of the targets and provide methodology used to develop their targets in accordance with 23 U.S.C. 134(h)(2)(B)(i)(II) to ensure consistency, to the maximum extent practicable.
Data Collection and Analysis:
PennDOT BOMO will collect and perform the analysis of the data for the pavement and bridge performance measures.
Pavement Determining pavement condition requires rigorous data collection. In the past, all PennDOT data was collected for each roadway segment, which is approximately one-half-mile in length. Federal rulemaking 23 U.S.C. 119 now requires that all distress component information be collected for one-tenth-mile increments. PennDOT and its partners have adjusted their pavement data collection to meet FHWA standards. Data collection at the tenth-mile increment level began in 2017 for cracking, rutting, and faulting and will be used for this submission of the TAMP.
Pavement performance measures required for FHWA reporting include the following four distress components:
• International Roughness Index (IRI) – Quantifies how rough the pavement is by measuringthe longitudinal profile of a traveled wheel track and generating a standardized roughnessvalue in inches per mile
• Cracking – Measures the percentage of pavement surface that is cracked• Rutting – Measures the depth of ruts (surface depression) in bituminous pavement in
inches• Faulting – Quantifies the difference in elevation across transverse concrete pavement
joints in inches
These distress measurements translate to good, fair, or poor condition scores. The table below summarizes the pavement condition metrics for IRI, cracking percent, rutting, and faulting.
172
DRAFT

Pennsylvania Transportation Performance Management Performance-based Planning and Programming Procedures
Page 9 of 15
Rating (one-tenth-mile)
Good Fair Poor
IRI (inches/mile) <95 95–170 >170
Cracking Percentage (%) <5 CRCP: 5–10 Jointed: 5–15 Asphalt: 5–20
CRCP: >10 Jointed: >15 Asphalt: >20
Rutting (inches) <0.20 0.20–0.40 >0.40Faulting (inches) <0.10 0.10–0.15 >0.15
IRI and cracking apply to both bituminous and concrete pavements, while rutting is exclusively for bituminous pavement and faulting is exclusively for concrete pavement. Each one-tenth-mile pavement section is considered in good condition if all three of its distress components are rated as good, and in poor condition if two or more of its three distress components are rated as poor.
23 CFR part 490.315(a), Subpart C, requires that no more than 5 percent of a state’s NHS Interstate lane-miles be in poor pavement condition. If the threshold is not met, restrictions are placed on PennDOT’s federal funding—specifically, NHPP and Surface Transportation Program (STP) funds. FHWA has not established a minimum condition for NHS non-Interstate roadways but requires the State DOT to establish performance targets.
23 CFR 490.313(b)(4)(i) requires that the total mainline lane-miles of missing, invalid, or unresolved sections for the Interstate System and non-Interstate NHS shall be limited to no more than five percent of the total lane miles. A section is missing if any one of the data requirements specified in 23 CFR 490.309 and 23 CFR 490.311(c) are not met or if that reported section does not provide sufficient data to determine its overall condition.
PennDOT BOMO and Engineering Districts will utilize its pavement asset management tools and processes, which continue to be systematically expanded to analyze Pennsylvania’s pavements.
PennDOT’s pavement condition targets will be consistent with its asset management objectives of maintaining the system at the desired state of good repair, managing to lowest life cycle costs (LLCC), and achieving national and state transportation goals.
Bridge The FHWA final rulemaking also established performance measures for all mainline Interstate Highway System and non-Interstate NHS bridges regardless of ownership or maintenance responsibility, including bridges on ramps connecting to the NHS and NHS bridges that span a state border. FHWA’s performance measures aim to assess bridge condition by deriving the percentage of NHS bridges rated in good and poor condition by deck area on the NHS.
Separate bridge structure condition ratings are collected for deck, superstructure, and substructure components during regular inspections using the National Bridge Inventory (NBI) Standards. For culvert structures, only one condition rating is collected (the culvert rating). A
173
DRAFT

Pennsylvania Transportation Performance Management Performance-based Planning and Programming Procedures
Page 10 of 15
rating of 9 to 0 on the FHWA condition scale is assigned to each component. Based on its score, a component is given a good, fair, or poor condition score rating.
The table below summarizes the FHWA scoring system for bridge condition metrics for deck, superstructure, substructure, and culvert components.
Rating Good Fair Poor Deck ≥7 5 or 6 ≤4 Superstructure ≥7 5 or 6 ≤4 Substructure ≥7 5 or 6 ≤4 Culvert ≥7 5 or 6 ≤4
A structure’s overall condition rating is determined by the lowest rating of its deck, superstructure, substructure, and/or culvert. If any of the components of a structure qualify as poor, the structure is rated as poor.
23 CFR 490.411(a) requires that no more than 10 percent of a state’s total NHS bridges by deck area are in poor condition.
PennDOT BOMO and Engineering Districts will utilize its bridge asset management tools and processes, which continue to be systematically expanded to analyze Pennsylvania’s bridges.
PennDOT’s bridge condition targets will be consistent with its asset management objectives of maintaining the system at the desired state of good repair, managing to LLCC, and achieving national and state transportation goals.
Reporting on progress towards target achievement:
PennDOT and the MPOs/RPOs will include pavement and bridge performance measures and targets in the STIP, regional TIPs, and LRTPs.
PennDOT and the MPOs/RPOs will ensure the STIP, regional TIPs, and LRTPs are developed and managed to support progress toward target achievement.
When collaborating to set annual targets, PennDOT BOMO, CPDM and Engineering Districts will coordinate to provide feedback on statewide and MPO/RPO specific progress towards target achievement as it becomes available.
PennDOT will need to report baseline, mid period performance and full period performance as identified to FHWA. FHWA will determine if Pennsylvania has met or made significant progress toward meeting its pavement and bridge targets. When FHWA reports their findings to PennDOT, CPDM will share the findings with MPOs/RPOs.
174
DRAFT

Pennsylvania Transportation Performance Management Performance-based Planning and Programming Procedures
Page 11 of 15
In accordance with 23 CFR 450.216(f), PennDOT CPDM in coordination with BOMO will include a description of the individual pavement and bridge performance measures and targets for those measures for the Statewide LRTP moving forward. In addition to including pavement and bridge performance measures and targets in the Statewide LRTP, PennDOT CPDM in coordination with BOMO will include a system performance report. That report must include an evaluation of system performance with respect to the performance targets. PennDOT CPDM in coordination with BOMO will include a description of progress achieved by the MPOs/RPOs in meeting the MPO/RPO performance targets in comparison with system performance recorded in previous reports [23 CFR 450.216(f)(2)]. The progress description will include the information that has been reported as part of the reports required under 23 CFR 490.107. With subsequent adoptions of Statewide LRTPs, PennDOT CPDM in coordination with BOMO will continue to include a system performance report describing the progress of meeting the performance targets in comparison with system performance recorded in previous years.
In accordance with 23 CFR 450.324(f)(3-4), MPOs/RPOs will include a description of the individual pavement and bridge performance measures and targets for those measures for regional LRTPs moving forward. In addition to including performance measures and targets in the regional LRTPs, MPOs/RPOs will include a system performance report. That report must include an evaluation of system performance with respect to the performance targets. MPOs/RPOs will describe progress achieved in meeting the performance targets in comparison with system performance recorded in previous reports [23 CFR 450.324(f)(4)(i)]. The progress description will include the information that has been reported as part of the reports required under 23 CFR 490.107. With subsequent adoptions of regional LRTPs, MPOs/RPOs will continue to include a system performance report describing the progress of meeting the performance targets in comparison with system performance recorded in previous years.
In accordance with 23 CFR 450.218(q), PennDOT CPDM in coordination with BOMO will include a narrative description in the STIP on how the program of projects contributes to the achievement of the pavement and bridge performance targets. The narratives should document PBPP objectives, investment strategies, performance measures and targets from the asset management plans and other performance-based plans are being implemented through the program of projects in the STIP.
In accordance with 23 CFR 450.326(d), MPOs/RPOs will include a narrative description in the TIP on how the program of projects contributes to the achievement of the pavement and bridge performance targets. The narratives should document PBPP objectives, investment strategies, performance measures and targets from the asset management plans and other performance-based plans are being implemented through the program of projects in the TIP.
175
DRAFT

Pennsylvania Transportation Performance Management Performance-based Planning and Programming Procedures
Page 12 of 15
System Performance Measures
The FHWA final rule for the National Performance Management Measures; Assessing Performance of the National Highway System, Freight Movement on the Interstate System, and Congestion Mitigation and Air Quality Improvement Program was published in the Federal Register (82 FR 5970) on January 18, 2017, and became effective on May 20, 2017.
This final rule was the third in a series of three related rulemakings that together establish a set of performance measures for State DOTs and MPOs to use as required by MAP–21 and the FAST Act. The measures in this third final rule will be used by State DOTs and MPOs to assess the performance of the Interstate and non-Interstate NHS for the purpose of carrying out the NHPP; to assess freight movement on the Interstate System; and to assess traffic congestion and on-road mobile source emissions for the purpose of carrying out the Congestion Mitigation and Air Quality Improvement (CMAQ) Program. These system performance measures are collectively referred to as the PM3 measures.
The PM3 performance measures include: • Percent of Person-miles Traveled on the Interstate System that are Reliable• Percent of Person-miles Traveled on the Non-Interstate NHS that are Reliable• Interstate System Truck Travel Time Reliability Index• Annual Hours of Peak-Hour Excessive Delay (PHED) per Capita• Percent of Non-Single Occupant Vehicle (SOV) Travel• On-Road Mobile Source Emissions Reduction for CMAQ-funded Projects
Target setting:
In Pennsylvania, PennDOT CPDM in coordination with BOMO will take the lead and coordinate with MPO/RPO representatives as well as other necessary stakeholders, such as other State DOTs in urbanized areas, to utilize existing workgroups or organize a group to collaborate on the system performance measures and targets. This group will evaluate baseline performance measures tools, trends, and methodologies. Information discussed as part of these group(s) will be shared at Statewide Planning Partner Meetings and conference calls.
To satisfy 23 CFR 490.105(e)(2), PennDOT CPDM and BOMO will coordinate with MPOs/RPOs on the development of the measures and selection of targets to ensure consistency, to the maximum extent practicable. PennDOT CPDM in coordination with BOMO will be responsible for scheduling and conducting group meetings. PennDOT CPDM will be responsible for scheduling and conducting Planning Partner meetings and conference calls, where coordination on target setting will occur.
MPOs/RPOs will be responsible for providing representation on the group(s). All MPOs/RPOs will ensure they participate in Planning Partner meetings and conference calls to provide input into performance measure and target coordination.
176
DRAFT
Pennsylvania Transportation Performance Management Performance-based Planning and Programming Procedures
Page 13 of 15
PennDOT is required to set State 2-year and 4-year targets biennially. PennDOT will have the option to adjust the four-year targets in the Mid Performance Period Progress Report. PennDOT CPDM in coordination with BOMO will coordinate any adjustments to the targets with the MPOs/RPOs.
The targets for the traffic congestion measures [23 CFR 490.707(a) and (b)] reported by PennDOT and MPOs for an urbanized area must be identical [23 CFR 490.105(f)(5)]. If a multistate MPO is required to establish targets for the traffic congestion measures, all applicable MPOs and State DOTs must establish only one 2-year target and one 4-year target for the entire urbanized area for each traffic congestion measure. The MPOs and State DOTs will collectively develop and implement a mutually agreed upon coordination process so that both MPOs and State DOTs meet their respective target establishment and reporting deadlines.
PennDOT will report the targets as part of FHWA required Performance Reporting.
PennDOT CPDM will share the reporting submissions and/or another type of notification of the state targets with the MPOs/RPOs in a timely manner.
All Pennsylvania MPOs/RPOs will establish targets for each performance measure and communicate adoption to PennDOT CPDM, within 180 days of PennDOT establishing (or amending) targets either by agreeing to plan and program projects in support of PennDOT targets, or by committing to their own quantifiable targets. If an MPO/RPO chooses to establish their own performance targets, they would need to coordinate with PennDOT CPDM and BOMO (as appropriate) on the selection of the targets and provide methodology used to develop their targets in accordance with 23 U.S.C. 134(h)(2)(B)(i)(II) to ensure consistency, to the maximum extent practicable.
Data Collection and Analysis:
PennDOT CPDM and BOMO have worked to identify and evaluate the data and tools used to produce the baseline performance measures. The University of Maryland CATT Lab RITIS software platform is used to generate all the measures derived from the NPMRDS travel time data source. Data from the American Community Survey (ACS) and FHWA’s CMAQ annual reporting system are used for the non-SOV travel and mobile source emissions measures, respectively. Future revisions and modifications to these tools may impact the reported performance measures and established targets.
Due to potential tool enhancements, limited historic information, and the need for additional research to understand the variances and factors influencing each of the performance measures, PennDOT CPDM and BOMO will continue to identify and evaluate the data and tools necessary for the performance measures and establishing targets.
177
DRAFT

Pennsylvania Transportation Performance Management Performance-based Planning and Programming Procedures
Page 14 of 15
PennDOT CPDM and BOMO will take the lead along with required MPOs to track and evaluate data and targets.
Progress Towards Target Achievement and Reporting:
PennDOT and the MPOs/RPOs will include system performance measure and targets in the STIP, regional TIPs, and LRTPs.
PennDOT and the MPOs/RPOs will ensure the STIP, regional TIPs, and LRTPs are developed and managed to support progress toward target achievement.
PennDOT will need to report baseline, mid period performance and full period performance as identified to FHWA. FHWA will determine if Pennsylvania has met or made significant progress toward meeting its system performance targets. When FHWA reports their findings to PennDOT, CPDM will share the findings with MPOs/RPOs.
In accordance with 23 U.S.C. 149(l), each MPO serving a Transportation Management Area (TMA) with a population over 1 million representing nonattainment and maintenance areas must develop a CMAQ Performance Plan, updated biennially, to report baseline condition/performance, targets, projects that will contribute to the targets, and the progress toward achievement of targets for the CMAQ traffic congestion and on-road mobile source emissions measures. Likewise, 23 CFR 490.105(f)(5)(iii) requires these MPOs must establish both 2-year and 4-year targets for the metropolitan planning area. MPOs that must develop a CMAQperformance plan will ensure they are developed and submitted timely to PennDOT, so they canbe included in required FHWA reporting completed by PennDOT.
In accordance with 23 CFR 450.216(f), PennDOT CPDM in coordination with BOMO will include a description of the individual system performance measures and targets for those measures for the Statewide LRTP moving forward. In addition to including system performance measures and targets in the Statewide LRTP, PennDOT CPDM in coordination with BOMO will include a system performance report. That report must include an evaluation of system performance with respect to the performance targets. PennDOT CPDM in coordination with BOMO will include a description of progress achieved by the MPOs/RPOs in meeting the MPO/RPO performance targets in comparison with system performance recorded in previous reports [23 CFR 450.216(f)(2)]. The progress description will include the information that has been reported as part of the reports required under 23 CFR 490.107. With subsequent adoptions of Statewide LRTPs, PennDOT CPDM in coordination with BOMO will continue to include a system performance report describing the progress of meeting the performance targets in comparison with system performance recorded in previous years.
In accordance with 23 CFR 450.324(f)(3-4), MPOs/RPOs will include a description of the individual system performance measures and targets for those measures for regional LRTPs moving forward. In addition to including performance measures and targets in the regional LRTPs,
178
DRAFT

Pennsylvania Transportation Performance Management Performance-based Planning and Programming Procedures
Page 15 of 15
MPOs/RPOs will include a system performance report. That report must include an evaluation of system performance with respect to the performance targets. MPOs/RPOs will describe progress achieved in meeting the performance targets in comparison with system performance recorded in previous reports [23 CFR 450.324(f)(4)(i)]. The progress description will include the information that has been reported as part of the reports required under 23 CFR 490.107. With subsequent adoptions of regional LRTPs, MPOs/RPOs will continue to include a system performance report describing the progress of meeting the performance targets in comparison with system performance recorded in previous years.
In accordance with 23 CFR 450.218(q), PennDOT CPDM in coordination with BOMO will include a narrative description in the STIP on how the program of projects contributes to the achievement of the system performance targets. The narratives should document PBPP objectives, investment strategies, performance measures and targets from the freight plan, Congestion Mitigation and Air Quality (CMAQ) Performance Plan(s) [23 U.S.C. 149(l)], Congestion Management Process (CMP), and other performance-based plans are being implemented through the program of projects in the STIP.
In accordance with 23 CFR 450.326(d), MPOs/RPOs will include a narrative description in the TIP on how the program of projects contributes to the achievement of the system performance targets. The narratives should document PBPP objectives, investment strategies, performance measures and targets from the freight plan, Congestion Mitigation and Air Quality (CMAQ) Performance Plan(s) [23 U.S.C. 149(l)], Congestion Management Process (CMP), and other performance-based plans are being implemented through the program of projects in the TIP.
179
DRAFT

180
DRAFT

Pennsylvania 2019 Transportation Asset Management Plan IMPLEMENTATION 1
PennDOT Transportation Asset Management
Plan Implementation July 29, 2021
The Pennsylvania Department of Transportation (PennDOT) developed and submitted its 2019
Transportation Asset Management Plan (TAMP) in accordance with 23 U.S.C. 119 and Federal
Highway Administration (FHWA) rulemaking 2125-AF57.
This companion document verifies that PennDOT is implementing its TAMP, with the overall
aim of achieving and sustaining a state of good repair over the life cycle of Pennsylvania’s
transportation assets and preserving the condition of the National Highway System (NHS).
Integration of the TAMP into Planning Processes for STIP The TAMP commits PennDOT to two overarching requirements:
• Meeting FHWA minimum condition thresholds for NHS pavements and bridges.
• Transitioning from “worst-first” programming to lowest life-cycle cost (LLCC) asset
management.
Achieving both requirements is challenging, primarily because funding is inadequate to cover
the size and age of Pennsylvania’s NHS roads and bridges. Additionally, attempting to meet
condition targets while managing to LLCC is really two separate and largely conflicting
approaches, particularly when funding is insufficient to invest in reducing the percentage of
poor pavements and bridges while also investing in preventative maintenance on structures in
good and fair condition. Further, overall funding has become unhinged from the actual needs,
forcing needed projects further out in time and making little room for any new projects, let alone
a change in methodology to select them.
To address these issues and integrate the TAMP into the planning process for the State
Transportation Improvement Program (STIP), PennDOT has:
• Revised its General and Procedural Guidance documents, which can be viewed at
https://talkpatransportation.com/transportation-planning/STIP, that provide detailed
direction for Pennsylvania’s Metropolitan Planning Organizations and Rural Planning
Organizations (MPOs/RPOs) and PennDOT staff for selecting projects in a manner that
complies with state and federal requirements and is consistent with statewide priorities.
The document is to be used to develop Twelve-Year Plans and Transportation
Improvement Programs (TYPs/TIPs), which are rolled up into the STIP. Specifically, the
document:
Appendix 16 - Transportation Asset Management Plan Implementation
181
DRAFT

Transportation Asset Management Plan IMPLEMENTATION
Pennsylvania 2019 Transportation Asset Management Plan IMPLEMENTATION 2
o Incorporates the TAMP in the planning process.
o Allows previously programmed projects to continue to be delivered as scheduled, as
they have already been funded for design and/or other pre-construction phases, which
is reflected in the TAMP investment strategy.
o Explains LLCC asset management, and why it is an improvement over worst-first
prioritization.
o Discusses the new Bridge Risk Score that assists with risk-based project
prioritization.
o Advises how to handle TIP carryover projects in the transition to LLCC
programming.
o Discusses TAMP requirements in light of substantial needs on the non-NHS portion
of the system.
o Explains how the output of the Pavement Asset Management System (PAMS) and
Bridge Asset Management System (BAMS) should be used, in combination with
professional judgement, to meet condition targets while transitioning to LLCC.
• Revised its Financial Guidance document to introduce PennDOT’s new National
Highway Performance Program (NHPP) funding distribution formula to be applied
beginning in FFY 2023 to allocate highway and bridge funding in accordance with
the TAMP and LLCC. The funding formula includes a new Asset Management Factor
(AMF) that calculates a county’s relative need, considering its inventory of NHS
infrastructure, traffic volume, and asset condition. The new funding distribution is
outlined in the following table. AMF calculation is discussed in Appendix I of the
TAMP.
Allocation of PA NHPP Funds Remaining After Interstate Set-Asides and Statewide
Reserves Sub-Allocation
60% Highways
• 25% allocated by Lane-Miles factor• 25% allocated by VMT factor• 25% allocated by Truck VMT factor• 25% allocated by Pavement AMF factor
40% Bridges > 20 feet
• 75% allocated by Bridge Deck Area factor• 25% allocated by Bridge AMF factor
• Began distribution of guidance to MPOs/RPOs and the PennDOT Districts with
additional information on:
o Transitioning from worst-first to LLCC programming.
o Applying the new methodology to TIP adjustments.
o Moving toward “on-cycle” programming with the next TYP.
o Utilizing PAMS and BAMS tools to assist in TIP/TYP project selection.
182
DRAFT

Transportation Asset Management Plan IMPLEMENTATION
Pennsylvania 2019 Transportation Asset Management Plan IMPLEMENTATION 3
The guidance is offered by both PennDOT’s Asset Management Division and Center for
Program Development and Management. Further guidance and training will be provided
as PAMS and BAMS training continue and evolve.
• Continue the update of PUB 575, Developing Regional Long-Range Plans, which
includes information on the TAMP and a discussion of requirements and guidance for
MPOs/RPOs. The long-range transportation planning process guides development of the
TYP and TIP.
Availability of the TAMP to the Public
The TAMP is available to the public on PennDOT’s website at:
https://www.penndot.gov/ProjectAndPrograms/Asset-Management/Pages/default.aspx
Consistency between Actual and Planned Levels of Investment by Work Type
PennDOT’s FFY 2020 investments in capacity-adding, reconstruction, rehabilitation,
preservation, and maintenance projects were generally consistent with its planned levels of
investment during to the COVID-19 pandemic, which temporarily impacted both the ability to
perform work and the funding streams that pay for the work.
While the federal stimulus temporarily offset the financial impacts from COVID-19, the
pandemic has highlighted both the flaws in the mechanisms in which we collect funding and
the overall lack of appropriate funding from all partners for transportation. Specifically, while
the pandemic has not shown to have lingering impact on VMT or revenue, the pandemic has
proven that the gas tax model is no longer a reliable, practical or sustainable way to adequately
fund transportation investments. For more information on PennDOT’s revenue options, please
visit https://www.penndot.gov/about-us/funding/Pages/default.aspx.
In terms of specific impact, projects were not eliminated from the FFY 2020 letting program
by work type, but some were delayed until past PennDOT’s State FY end date of June 30.
This fiscal year delay, in conjunction with the $400M Federal stimulus, did not result in any
appreciable decrease to the work done in the FFY.
The following charts details the FFY 2020 MPMS-based planned vs. the ECMS- reported
construction costs based on committed project let dates. Please note that this is only for
construction costs, and does not include design, ROW or UTL costs, see the Data section for
more details.
183
DRAFT

Transportation Asset Management Plan IMPLEMENTATION
Pennsylvania 2019 Transportation Asset Management Plan IMPLEMENTATION 4
FFY 2020 PennDOT investment by asset type:
FFY 2020 PennDOT investment table:
$-
$200
$400
$600
$800
$1,000
$1,200
$1,400
$1,600
2020 Planned Bridge 2020 Actual Bridge 2020 Planned Pavement 2020 Actual Pavement
Mill
ion
s o
f D
olla
rs
Capacity-Adding Preservation Rehabilitation Replacement Maintenance
2020 Planned 2020 Actual 2020 Planned 2020 Actual
Capacity-Adding 73,121.00$ 18,272,591.70$ 221,391,015.00$ 178,407,511.24$
Preservation 81,470,945.00$ 37,197,965.69$ 146,895,828.00$ 132,114,759.89$
Rehabilitation 123,917,961.00$ 114,450,739.05$ 487,753,443.00$ 434,372,652.13$
Replacement 189,050,701.00$ 86,609,205.27$ 110,928,094.00$ 206,187,981.44$
Maintenance 310,991,530.40$ 310,991,530.40$ 466,487,295.60$ 466,487,295.60$
Total 705,504,258.40$ 567,522,032.11$ 1,433,455,675.60$ 1,417,570,200.30$
2020 Planned 2020 Actual 2020 Planned 2020 Actual
Capacity-Adding 0% 3% 15% 12%
Preservation 12% 5% 10% 9%
Rehabilitation 18% 16% 34% 30%
Replacement 27% 12% 8% 14%
Maintenance 44% 44% 33% 33%
Total 100% 80% 100% 99%
TAMP Work TypesBridge Pavement
TAMP Work TypesBridge Pavement
184
DRAFT

Transportation Asset Management Plan IMPLEMENTATION
Pennsylvania 2019 Transportation Asset Management Plan IMPLEMENTATION 5
Data:
These values are reported utilizing MPMS for planned and ECMS for actual, which are existing
and established systems within PennDOT that are designed for efficient planning and execution
of projects at a large state DOT. These systems were not designed to provide enterprise level
financial reporting, and so there is some approximation in calculations. Data pre-qualifications include:
• Data from ECMS and MPMS are as of 6/4/21
• Graphs 1 and 3 are limited to construction phase due to system limitations, i.e. difficulty
matching potentially multiple ECMS contracts for design, ROW, UTL to one
construction project and cross referencing that to MPMS.
• ECMS has carry-over spending that is currently difficult to exclude from the analysis
• Future submissions will try to address system limitations through planned system
upgrades and calendar based manual pulls.
For future investment forecasting, the following chart labeled “Planned Investment by Work
Type and Year” shows the MPMS-based planned investment by work type and BAMS/PAMS
based LLCC investment recommendation. As stated in the TAMP, previously programmed
projects would remain on the TIP to retain the investment already made in their planning and
project development. As projects are added to the TIP, there will be a focus on moving toward
LLCC project recommendations, such that we expect over the years that less of the planned
projects will be carryover and more will be LLCC based. Therefore, while directly comparing
BAMS/PAMS recommendations to previously programmed projects is not prudent, it is
valuable to look at the trend over time to verify that the mix of work types for planned projects
is becoming more similar to the ideal LLCC recommendations from BAMS/PAMS in each
subsequent year. It should be noted that the current forecasts include both the NHS and non-
NHS, as PennDOT must not lose focus on maintaining the existing non-NHS network and
intends to include them in the next TAMP.
185
DRAFT

Transportation Asset Management Plan IMPLEMENTATION
Pennsylvania 2019 Transportation Asset Management Plan IMPLEMENTATION 6
Planned Investment by Work Type and Year:
Note: Years 2029-2032 are the average of the 4 years
$0
$500
$1,000
$1,500
$2,000
$2,500
$3,000
Mill
ion
s o
f D
olla
rs
Capacity-Adding Preservation Rehabilitation Replacement Maintenance
186
DRAFT

Pennsylvania Division 228 Walnut Street, Room 508 Harrisburg, PA 17101-1720
(717) 221-3461
In Reply Refer To: PPM-PA
Transportation Asset Management Plan, Annual Consistency Determination
July 29, 2021
Michael Keiser, P.E. Acting Deputy Secretary for Highway Administration Pennsylvania Department of Transportation Harrisburg, Pennsylvania
Dear Mr. Keiser:
This letter serves as the Federal Highway Administration (FHWA) Pennsylvania Division’s consistency determination of the Pennsylvania Department of Transportation (DOT) 2021 Transportation Asset Management Plan (TAMP) Implementation, which is an evaluation whether the Pennsylvania DOT has implemented a TAMP that is consistent with the requirements established by 23 U.S.C. 119 and 23 CFR part 515. The Pennsylvania DOT provided implementation documentation dated June 16, 2021 and revised July 29, 2021. Based on the 2019 TAMP, as well as the documentation demonstrating implementation of the TAMP, the FHWA has determined the Pennsylvania DOT is implementing its TAMP as per 23 CFR 515.13(b)(2).
We would like to commend you and your staff for the broad participation in development and implementation of the TAMP in accordance with 23 U.S.C. 119. Your commitment to achieve and sustain a state of good repair over the life cycle of the assets and to improve or preserve the condition of the National Highway System (NHS) is noteworthy.
Thank you for all your efforts. If you have any questions, please contact Clint H. Beck, P.E. at [email protected] or (717) 221-3718.
Sincerely,
Alicia Nolan Division Administrator
187
DRAFT

2
ec: J. Michael Long, PennDOT Justin Bruner, PennDOT Brian Hare, PennDOT Kristin Mulkerin, PennDOT Clint Beck, FHWA Matt Smoker, FHWA Camille Otto, FHWA Jon Buck, FHWA Keith Lynch, FHWA
188
DRAFT

1
MEMORANDUM OF UNDERSTANDING Pennsylvania’s Statewide Procedures for 2023-2026
Statewide Transportation Improvement Program and Transportation Improvement Program Revisions
Background
This Memorandum of Understanding (MOU) between the Pennsylvania Department of Transportation (PennDOT), Federal Highway Administration (FHWA), and Federal Transit Administration (FTA) establishes procedures to be used in the Commonwealth of Pennsylvania for processing revisions to the 2023-2026 Statewide Transportation Improvement Program (STIP). The STIP is the aggregation of the Metropolitan Planning Organization (MPO) and Rural Planning Organization (RPO) Transportation Improvement Programs (TIPs), including the Interstate Management (IM) Program and other statewide managed programs (Statewide Programs).
The STIP is the official transportation improvement program document mandated by federal statute 23 CFR 450.218 and recognized by FHWA and FTA. The STIP includes a list of projects to be implemented over a four-year period as well as all supporting documentation required by federal statute. The STIP includes regional TIPs developed by the MPOs, RPOs and PennDOT developed Interstate Management (IM) Program and other Statewide Programs. Statewide Programs are coordinated initiatives, projects or funds that are managed by PennDOT’s Central Office on a statewide basis. Examples of Statewide Programs include, but are not limited to, the Secretary of Transportation’s Discretionary (Spike), the Major Bridge Public Private Partnership (MBP3) Program, the Rapid Bridge Replacement (RBR) Project developed via a Public Private Partnership (P3), Highway Safety Improvement Program (HSIP) set-a-side, Highway-Rail Grade Crossing Safety (RRX), Surface Transportation Block Grant Program set-a-side (TAP) funds, Green-Light-Go (GLG), Automated Red Light Enforcement (ARLE), Multi-Modal (MTF), Recreational (Rec) Trails, Transportation Infrastructure Investment Fund (TIIF), Statewide Transit and Keystone Corridor projects. The Interstate Management Program will remain its own individual program and includes prioritized statewide Interstate projects. The Commonwealth’s Twelve-Year Program (TYP), required by state law (Act 120 of 1970), includes the STIP/TIPs in the first four-year period. The TYP is not covered by Federal statute. Therefore, this MOU covers revisions only to the STIP/TIP.
For more information on the development of the STIP/TIP, see Pennsylvania’s 2023 Transportation Program General and Procedural Guidance and Pennsylvania’s 2023 Transportation Program Financial Guidance. These documents were both released on July 15, 2021 and can be found on the STIP page on the STC Website under 2023 Guidance Documents.
STIP/TIP Administration
FHWA and FTA will only authorize projects and approve grants for projects that are programmed in the current approved STIP. If a MPO/RPO, transit agency, or PennDOT wishes to proceed with a federally funded project not programmed on the STIP/TIP, a revision must be made.
The federal statewide and metropolitan planning regulations contained in 23 CFR 450 govern the provisions for revisions of the STIP and individual MPO TIPs. The intent of this federal regulation is to acknowledge the relative significance, importance, and/or complexity of individual programming amendments and administrative modifications. If necessary, 23 CFR 450.328 permits the use of alternative procedures by the cooperating parties to effectively manage amendments and/or administrative modifications encountered during a given TIP cycle. Cooperating parties include PennDOT, MPOs, RPOs, FHWA, FTA, and transit agencies. Any alternative procedures must be agreed upon and documented in the TIP.
Appendix 17 - FHWA-FTA PennDOT MOU for STIP/TIP Revisions
189
DRAFT

2
STIP/TIP revisions must be consistent with Pennsylvania’s Transportation Performance Management (TPM) requirements, Pennsylvania’s Long-Range Transportation Plan (LRTP), and the associated MPO’s/RPO’s LRTP. In addition, STIP/TIP revisions must support Pennsylvania’s Transportation Performance Measures, the Transportation Asset Management Plan (TAMP), the Transit Asset Management (TAM) Plan, the Strategic Highway Safety Plan (SHSP) and Congestion Management Plan (CMP), as well as PennDOT’s Connects policy. Over the years, Pennsylvania has utilized a comprehensive planning and programming process that focuses on collaboration between PennDOT, FHWA, FTA, and MPOs/RPOs at the county and regional levels. This approach will be applied to begin implementation of TPM and Performance Based Planning and Programming (PBPP). PBPP is PennDOT’s ongoing assessment, target setting, reporting and evaluation of performance data associated with the STIP/TIP investment decisions. This approach ensures that each dollar invested is being directed to meet strategic objectives and enhances the overall performance of the Commonwealth’s transportation system.
STIP/TIP revisions must correspond to the adopted provisions of the MPO’s/RPO’s Public Participation Plans (PPPs). A PPP is a documented broad-based public involvement process that describes how the MPO/RPO will involve and engage the public in the transportation planning process to ensure that comments, concerns, or issues of the public and interested parties are identified and addressed in the development of transportation plans and programs. A reasonable opportunity for public review and comment shall be provided for significant revisions to the STIP/TIP.
All projects within a non-attainment or maintenance area will be screened for Air Quality significance. PennDOT will coordinate with regional MPO/RPOs to screen Statewide Program projects for Air Quality significance. If a revision adds a project, deletes a project, or impacts the schedule or scope of work of an air quality significant project in a nonattainment or maintenance area, a new air quality conformity determination will be required if deemed appropriate by the PennDOT Air Quality Interagency Consultation Group (ICG). If a new conformity determination is deemed necessary, an amendment to the STIP and region’s TIP shall also be developed and approved by the MPO/RPO. The modified conformity determination would then be based on the amended TIP conformity analysis and public involvement procedures consistent with the MPO/RPO region’s PPP.
The federal planning regulations, 23 CFR 450.324(c), define update cycles for MPO/RPO LRTPs. If a MPO’s/RPO’s LRTP expires because the LRTP has not been updated in accordance with the planning cycle defined in the federal planning regulations, then the provisions of this MOU will not be utilized for that MPO/RPO. During a LRTP expiration, all STIP/TIP revisions that involve projects with federal funds within that MPO/RPO, where the LRTP expiration occurred, will be treated as an amendment, and require federal approval. There will be no administrative modifications to projects with any federal funds until the MPO’s/RPO’s LRTP is once again in compliance with the federal planning regulations.
Pennsylvania STIP/TIP Revisions
In accordance with the federal transportation planning regulations 23 CFR 450 revisions to the STIP/TIP will be handled as an Amendment or an Administrative Modification based on agreed upon procedures detailed below.
An Amendment is a revision to the STIP/TIP that: • Affects air quality conformity regardless of the cost of the project or the funding source;• Adds a new federally funded project, or federalizes a project that previously was 100% state
and/or locally funded. A new project is a project that is not programmed in the currentSTIP/TIP and does not have previous Federal obligations.
• Deletes a project that utilizes federal funds, except for projects that were fully obligated in theprevious STIP/TIP and no longer require funding. In this case, removal of the project will beconsidered an administrative modification.
190
DRAFT

3
• Adds a new phase(s), deletes a phase(s) or increases/decreases a phase(s) of an existingproject that utilizes federal funds where the total revision of federal funds exceeds thefollowing thresholds within the four years of the TIP:
o $10 million for the Interstate Management (IM) Program;o $7.5 million for MPOs with most recent US Census Urbanized Areas (UZA)
population ≥ 1,000,000;o $3 million for MPOs with most recent US Census Urbanized Areas (UZA)
population ≥ 200,000 but < 1,000,000;o $2 million for the remaining areas;o $1 million for other federally funded Statewide Programs.
• Involves a change in the scope of work to a project(s) that would:o Result in an air quality conformity reevaluation;o Result in a revised total project programmed amount that exceeds the thresholds
established between PennDOT and the MPO/RPO;o Results in a change in the scope of work on any federally funded project that is
significant enough to essentially constitute a new project.
Approval by the MPO/RPO is required for Amendments. The MPO/RPO must then initiate PennDOT Central Office approval using the eSTIP process. An eSTIP submission must include a Fiscal Constraint Chart (FCC) that clearly summarizes the before, requested adjustments, after changes, and detailed comments explaining the reason for the adjustment(s), and provides any supporting information that may have been prepared. The FCC documentation should include any administrative modifications that occurred along with or were presented with this amendment at the MPO/RPO meeting. The supporting documentation should include PennDOT Program Management Committee (PMC) and Center for Program Development and Management (CPDM) items/materials, if available.
All revisions associated with an amendment, including any supporting administrative modifications, should be shown on the same FCC, demonstrating both project and program fiscal constraint. The identified grouping of projects (the entire action) will require review and/or approval by the cooperating parties. In the case that a project phase is pushed out of the TIP period, the MPO/RPO and PennDOT will demonstrate, through a FCC, fiscal balance of the subject project phase in the second or third four years of the TYP and/or the respective regional LRTP.
The initial submission and approval process of the Interstate Program and other federally-funded Statewide Programs and increases/decreases to these programs which exceed the thresholds above will be considered an amendment and require approval by PennDOT and FHWA/FTA (subsequent placement of these individual projects or line items on respective MPO/RPO TIPs will be considered an administrative modification). In the case of Statewide Programs, including the IM Program and other federally funded statewide programs, approval by PennDOT’s PMC and FHWA is required. Statewide managed transit projects funded by FTA programs and delivered via Governor’s apportionment are selected by PennDOT pursuant to the Pennsylvania State Management Plan approved by FTA. These projects will be coordinated between FTA, PennDOT, the transit agency and associated MPO/RPO and should be programmed within the TIP of the urbanized area where the project is located. These projects and the initial drawdown will be considered an amendment to the Statewide Program.
An Administrative Modification is a minor revision to a STIP/TIP that: • Adds a new phase(s), deletes a phase(s) or increase/decreases a phase(s) of an existing project
that utilizes federal funds and does not exceed the thresholds established above;• Adds a project from a funding initiative or line item that utilizes 100 percent state or non-
federal funding;• Adds a project for emergency relief (ER) program, except those involving substantial
functional, location, or capacity changes;
191
DRAFT

4
• Adds a project, with any federal funding source, for immediate emergency repairs to ahighway, bridge or transit project where in consultation with the relevant federal fundingagencies, the parties agree that any delay would put the health, safety, or security of thepublic at risk due to damaged infrastructure;
• Draws down or returns funding from an existing STIP/TIP reserve line item and does notexceed the threshold established in the MOU between PennDOT and the MPO/RPO. Areserve line item holds funds that are not dedicated to a specific project(s) and may be used tocover cost increases or add an additional project phase(s) to an existing project;
• Adds federal or state capital funds from low-bid savings, de-obligations, release ofencumbrances, or savings on programmed phases to another programmed project phase orline item and does not exceed the above thresholds;
• Splits a project into two or more separate projects or combines two or more projects into oneproject to facilitate project delivery without a change of scope or type of funding;
• Adds, advances, or adjusts federal funding for a project based on FHWA AugustRedistribution based on documented August Redistribution Strategic Approach.
Administrative Modifications do not affect air quality conformity, nor involve a significant change in the scope of work to a project(s) that would trigger an air quality conformity re-evaluation; does not add a new federally-funded project or delete a federally-funded project; does not exceed the threshold established in the MOU between PennDOT and the MPO/RPO, or the threshold established by this MOU (as detailed in the Amendment Section aforementioned); and does not result in a change in scope, on any federally-funded project that is significant enough to essentially constitute a new project. A change in scope is a substantial alteration to the original intent or function of a programmed project.
Administrative Modifications do not require federal approval. PennDOT and the MPO/RPO will work cooperatively to address and respond to any FHWA and/or FTA comment(s). FHWA and FTA reserve the right to question any administrative modification that is not consistent with federal regulations or with this MOU where federal funds are being utilized.
Fiscal Constraint
Demonstration that STIP/TIP fiscal constraint is maintained takes place through an FCC. Real time versions of the STIP/TIP are available to FHWA and FTA through PennDOT’s Multimodal Project Management System (MPMS). All revisions must maintain year-to-year fiscal constraint, per 23 CFR 450.218(l) and 23 CFR 450.326(g)(j)&(k), for each of the four years of the STIP/TIP. All revisions shall account for year of expenditure (YOE) and maintain the estimated total cost of the project or project phase within the time-period [i.e., fiscal year(s)] contemplated for completion of the project, which may extend beyond the four years of the STIP/TIP. The arbitrary reduction of the overall cost of a project, or project phase(s), shall not be utilized for the advancement of another project.
STIP/TIP Financial Reporting
PennDOT will provide reports to each MPO/RPO and FHWA no later than 30 days after the end of each quarter and each Federal Fiscal Year (FFY). At a minimum, this report will include the actual federal obligations and state encumbrances for highway/bridge projects by MPO/RPO and Statewide. In addition, PennDOT will provide the Transit Federal Capital Projects report at the end of each FFY to all of the parties listed above and FTA. The reports can be used by the MPOs/RPOs as the basis for compiling information to meet the federal annual listing of obligated projects requirement 23 CFR 450.334. Additional content and any proposed changes to the report will be agreed upon by PennDOT, FHWA and FTA.
192
DRAFT

5
STIP/TIP Transportation Performance Management
In accordance with 23 CFR 450.326(c), PennDOT and the MPOs/RPOs will ensure that STIP/TIP revisions promote progress toward achievement of performance targets.
Statewide or Multi- UZA Transit Projects
Statewide managed transit projects funded by FTA programs and delivered via Governor’s apportionment are selected by PennDOT pursuant to the Pennsylvania State Management Plan approved by the FTA. These projects should be programmed within the TIP of the urbanized area where the project is located.
The Keystone Corridor (Pennsylvania portion) is the in-State and commuter rail service funded by PennDOT and FTA on the Amtrak rail line that runs between Philadelphia and Harrisburg. Keystone Corridor projects are funded within the three-contiguous large urbanized areas (UZA) – Harrisburg, Lancaster, and Philadelphia. The entire amount of federal funds applied to Keystone Corridor Projects shall be programmed on the TIP of the UZA from which the funds originate. If the Project is located within a UZA that is not the UZA from which the funds originate, then the Project shall be listed in the TIP (of the UZA where the Project is located) as a “Keystone Corridor Project”, the use of the funding and amount shall be noted in the project description, and the funding amount shall be entered as $0. The funds should only be noted for information and air quality conformity determination purposes, but not programmed, in the TIP where the Project is to avoid the double counting of programmed funds within the two TIPs. For instance, if federal funding from the Lancaster UZA is applied to the restoration of a Keystone Corridor station located in the Philadelphia UZA, then the full amount of the federal funding for the Project shall be programmed on the Lancaster TIP, and for information and air quality conformity purposes, the Project shall also be listed on the Delaware Valley Regional Planning Commission (DVRPC) TIP as “Keystone Corridor Station Restoration” along with notations per-above and the federal funding amount will be listed as $0.
MPO/RPO TIP Revision Procedures
As each MPO’s/RPO’s TIP is adopted, their respective MOU with PennDOT will be included with the TIP documentation. The MOU will clarify how the MPO/RPO will address all TIP revisions. In all cases, individual MPO/RPO revision procedures will be developed under the guidance umbrella of this document. If a MPO/RPO elects to set more stringent procedures, then FHWA and FTA will adhere to those more restrictive procedures, but the MPO/RPO established provisions cannot be less stringent than the statewide MOU.
This document will serve as the basis for PennDOT when addressing federally funded Statewide Program TIP revisions.
This Memorandum of Understanding will begin October 1, 2022, and remain in effect until September 30, 2024, unless revised or terminated. Furthermore, it is agreed that this MOU will be reaffirmed every two years.
193
DRAFT

194
DRAFT

Appendix 18 - Pennsylvania Areas Requiring Transportation Conformity
195
DRAFT

�
�������� ����� �������� ������������������������������������ ��������������� �������������������������� � !"�#$%&'(�)*&+, �%-./0,.1%-/$2-.3-+45&+$65./+5-7��-589��6$:;$<�$�=� >'7?@9��%,@5,(9��,./A/(,9�<&+54&3,(89��%-./0,.1%-/� ���B���� !��6++'/.��<�C"� �,./A/(,��&'+589��6� �,./A/(,� ��D������� #�#$%&'(�)*&+, �%-./0,.1%-/$2-.3-+45&+$65./+5-7��-589��6$:;$<�$�=� >'7?@9��%,@5,(9��,./A/(,9�<&+54&3,(89��%-./0,.1%-/� ���B���� E��F$G&'(��<�C" �%-./0,.1%-/$2-.3-+45&+9��6$:;$�=� >'7?@9��%,@5,(9��,./A/(,9�<&+54&3,(89��%-./0,.1%-/� </-+5,+/+7,�H���
� !��6++'/.��<�C"� 6..,4%,+8��&'+589��6� 6..,4%,+8� ��D������� #�#$%&'(�)*&+, �-55@I'(4%$>,/J,(��/..,89��6� 6..,4%,+89�6(3@5(&+49�>,/J,(9�>'5.,(9�K/8,55,9�2/@%-+45&+9�2,@53&(,./+0� ���B���� E��F$G&'(��<�C" �-55@I'(4%$>,/J,(��/..,89��6� 6..,4%,+8�L�M9�6(3@5(&+4�L�M9�>,/J,(9�>'5.,(9�N(,,+,�L�M9�O/A(,+7,�L�M9�2/@%-+45&+9�2,@53&(,./+0� </-+5,+/+7,�� E��F$G&'(��<�C" ;&%+@5&A+9��6� P+0-/+/�L�M� </-+5,+/+7,�� E��F$G&'(��<�C" O-I,(58$�./-(5&+9��6� 6..,4%,+8�L�M� ��D������!QQR�#$%&'(�)*&+, �.,/(S-,.0�/+0�P+0-/+/��&@9��6� P+0-/+/� )(1%/+�</-+5,+/+7,�!QQR�#$%&'(�)*&+, N(,,+,��&9��6� N(,,+,� )(1%/+�</-+5,+/+7,�!Q#R��F$G&'(��<! �./-(5&+�T�F�>&(&'4%@9��6� 6..,4%,+8�L�M� </-+5,+/+7,�!QR!��)� �-55@I'(4%9��6� 6..,4%,+8�L�M� O-3-5,0�</-+5,+/+7,�
UVVWXYZ[�\]�̂�_U�̀UUab�cdXedfgZhi�bhjhkl�mjnoW�
pqr196
DRAFT

Transportation Conformity Areas in Pennsylvania (06-12-19)
Erle
Warren McKean Crawford Potter
Mercer
Transportation Conformity Areas
- Ozone and PM2_5 Nonattainment or Maintenance Areas
D Only Ozone Nonattainment or Maintenance Areas
D Only PM2_5 Nonattainment or Maintenance Areas
Tioga Bradford
Areas Impacted by February 16, 2018 D.C. Circuit Decision on 1997 8-hour Ozone NAAQS Revocation (Referred to as "Orphan" Maintenance Areas)
I I Ozone and PM2_5 Nonattainment or Maintenance Areas
I I Only Ozone Nonattainment or Maintenance Areas
Applicable NAAQS: [1997·8�hoiirOzciiie; ig00B"B�hourOzciiie; lg015"8�hourO�(only Philadelphia 5 counties)�006 24-hour PM2]; [2012 Annual PM
2] (Allegheny, Lebanon, Delaware counties only)
132197
DRAFT

198
DRAFT

Public Participation Plan
Public Comment Start Date
Public Comment End Date
Final Conformity Report/Adoption
DateApproval Date Due Date
Current MPO/RPO
Adoption Date
Future MPO/RPO Adoption
Date *
LRTP Expiration
DateAdoption Date
Adams MPO 5/15/2022 6/15/2022 6/22/2022 7/26/2017 7/26/2022 7/26/2022 4/22/2015Altoona MPO 5/20/2022 6/20/2022 6/27/2022 2/10/2021 2/10/2026 2/10/2026 2/10/2016Centre County MPO 4/29/2022 5/30/2022 6/28/2022 9/22/2020 9/22/2025 3/4/2026 11/24/2015DVRPC MPO 5/27/2022 7/18/2022 7/28/2022 2/20/2019 2/20/2023 9/23/2021 9/23/2025 1/16/2022 7/26/2018Erie MPO 5/12/2022 6/10/2022 6/22/2022 3/9/2022 3/9/2027 3/9/2027 5/16/2007Franklin MPO 4/6/2022 5/6/2022 5/12/2022 11/14/2018 11/14/2023 8/12/2023 5/20/2020Harrisburg MPO 5/2/2022 6/2/2022 6/24/2022 9/8/2021 9/8/2025 9/24/2021 9/24/2025 12/16/2025 9/24/2021Johnstown MPO 5/12/2022 6/8/2022 6/29/2022 6/24/2020 6/24/2024 9/28/2024 6/24/2020Lancaster MPO 5/15/2022 6/13/2022 6/27/2022 8/17/2018 8/17/2022 6/22/2020 6/22/2024 9/28/2024 4/25/2016Lebanon MPO 5/15/2022 6/15/2022 6/16/2022 6/18/2020 6/18/2024 9/28/2024 6/18/2020LVTS MPO 5/2/2022 5/31/2022 6/15/2022 6/25/2020 6/25/2024 10/2/2019 10/2/2023 12/19/2023 10/4/2017NEPA MPO 5/2/2022 5/31/2022 6/21/2022 4/21/2020 4/21/2024 5/19/2024 11/18/2015North Central RPO 5/1/2022 5/31/2022 6/22/2022 7/11/2017 7/11/2022 7/11/2022 4/14/2020Northern Tier RPO 5/2/2022 5/31/2022 6/6/2022 4/13/2020 4/13/2025 9/28/2025 12/16/2016Northwest RPO 5/12/2022 6/10/2022 6/26/2022 6/23/2020 6/23/2025 6/23/2025 3/22/2016RATS MPO 6/1/2022 7/1/2022 7/14/2022 3/2/2021 3/2/2025 7/21/2022 7/21/2026 9/25/2022 7/20/2017Scranton/ Wilkes-Barre MPO 6/1/2022 7/6/2022 7/6/2022 11/4/2020 11/4/2024 2/3/2021 2/3/2026 6/14/2026 4/20/2016SEDA-COG MPO 4/22/2022 5/21/2022 6/10/2022 6/25/2021 6/25/2026 6/25/2026 12/1/2014Shenango Valley MPO 5/20/2022 6/20/2022 7/12/2022 1/13/2021 1/13/2025 11/9/2021 11/9/2026 11/9/2026 2/12/2019Southern Alleghenies RPO 5/2/2022 5/31/2022 7/13/2022 11/2/2017 11/2/2022 11/2/2022 3/2/2016SPC MPO 5/9/2022 6/8/2022 6/27/2022 12/15/2021 12/15/2025 6/24/2019 6/24/2023 10/25/2023 4/26/2021Wayne County (Independent) 6/15/2022 6/30/2022Williamsport MPO 4/5/2022 5/5/2022 6/13/2022 12/17/2018 12/17/2023 12/17/2023 1/27/2020York MPO 5/9/2022 6/9/2022 6/23/2022 10/30/2019 10/30/2023 6/24/2021 6/24/2025 9/29/2025 8/27/2017
PA Planning Partner Key Planning Dates
Transportation Management Area (TMA)
Certification Review 2023 Transportation Improvement Program (TIP)
MPO/RPOPlanning Partner
Long Range Transportation Plan (LRTP)
* Anticipated future MPO/RPO adoption date is based on the previous MPO/RPO adoption of the updated LRTP. For nonattainment and maintenance areas, the date listed is 4 years after the last MPO/RPO adoption date and is strictly intendedto provide sufficient time for FHWA, FTA, and US EPA to review and approve a new air quality conformity determination to meet the time requirement of 23 CFR 450.324(a) & (c).
Appendix 19 - MPO/RPO TIP and LRTP Dates
199
DRAFT

200
DRAFT
SELF-CERTIFICATION RESOLUTION FOR THE COMMONWEALTH OF PENNSYLVANIA’S
TRANSPORTATION PLANNING PROCESS
WHEREAS Title 23 CFR Part 450.220 legislation requires a State to certify that the transportation planning process is addressing the major issues in the state and is being conducted in accordance with all applicable requirements; and,
WHEREAS the Federal regulations specify that the transportation planning process be in conformance with Title 23 U.S.C. 134 and 135, 49 U.S.C. Section 5303 and 5304, and 23 CFR Part 450 subparts A, B and C; and,
WHEREAS in States containing nonattainment and maintenance areas, the requirements of Sections 174 and 176(c) and (d) of the Clean Air Act as amended (42 U.S.C. 7504, 7506(c) and (d)) and 40 CFR Part 93; and,
WHEREAS the requirements of Title VI of the Civil Rights Act of 1964, as amended (42 U.S.C. 2000d-1) and 49 CFR Part 21; and,
WHEREAS the requirements of 49 U.S.C. 5332, prohibiting discrimination on the basis of race, color, creed, national origin, sex or age in employment or business opportunity; and,
WHEREAS the requirements of Section 1101(b) of the Fast Act (Pub. L. 114-357) and 49 CFR Part 26 regarding the involvement of Disadvantaged Business Enterprises in USDOT funded planning projects; and,
WHEREAS the requirements of 23 CFR part 230, regarding the implementation of an equal employment opportunity program on Federal and Federal-aid highway construction contracts; and,
WHEREAS the provisions of the Americans with Disabilities Act of 1990 (42 U.S.C. 12101 et seq.) and 49 CFR Parts 27, 37, and 38; and,
WHEREAS the provisions of The Older Americans Act, as amended (42 U.S.C. 6101), prohibiting discrimination on the basis of age in programs or activities receiving Federal financial assistance; and,
WHEREAS the requirements of Title 23 U.S.C. 324, regarding prohibition of discrimination based on gender; and,
WHEREAS the requirements of Section 504 of the Rehabilitation Act of 1973 (29 U.S.C. 794) and 49 CFR Part 27 regarding discrimination against individuals with disabilities; and,
WHEREAS the requirements of Executive Order 12898 (Federal Order to Address Environmental Justice in Minority Populations and Low Income Populations); and
Appendix 20 - State Certification of the Planning Process - Draft
201
DRAFT

SELF-CERTIFICATION RESOLUTION FOR THE COMMONWEALTH OF PENNSYLVANIA’S
TRANSPORTATION PLANNING PROCESS
WHEREAS the provisions of 49 CFR Part 20 prohibiting recipients of federal funds from using those funds for lobbying purposes has been met.
NOW, THEREFORE, BE IT RESOLVED THAT the Commonwealth of Pennsylvania certifies that the Statewide transportation planning process is being carried out in conformance with all the applicable federal requirements and certifies that the statewide process to enhance the participation of the general-public, including the transportation disadvantaged, has been followed in developing all plans and programs, including the FFY 2023-2026 Statewide Transportation Improvement Program (STIP).
I hereby certify that the conditions of this resolution have been carried out by the Pennsylvania Department of Transportation.
ATTEST:
By Mr. Brian D. Hare, P.E., Director Mr. Larry S. Shifflet, Center for Program Development and Deputy Secretary for Planning Management Pennsylvania Department of Transportation Pennsylvania Department of Transportation
Date
202
DRAFT

U.S. Department Federal Transit Administration Federal Highway Administrationof Transportation Region III 228 Walnut Street, Room 508
1835 Market Street, Suite 1910 Harrisburg, PA 17101-1720 Philadelphia, PA 19103 (717) 221-3461(215) 656-7100 (717) 221-4553 (fax)(215) 656-7260 (fax)
Ms. Yassmin Gramian, P.E. Secretary of TransportationPennsylvania Department of Transportation Commonwealth of Pennsylvania Keystone Building 400 North St., Fifth Floor Harrisburg, Pennsylvania
Re: Pennsylvania FFY 2021-2024 Statewide Transportation Improvement Program & Air Quality Conformity Determinations
Dear Secretary Gramian:
The Federal Highway Administration (FHWA) and the Federal Transit Administration (FTA) have completed our joint review of the Pennsylvania Federal Fiscal Year (FFY) 2021-2024 Statewide Transportation Improvement Program (STIP) submitted with your letter dated August 13, 2020. Based on our review of the information provided, certifications of Statewide and Metropolitan transportation planning processes for and within the Commonwealth of Pennsylvania, and our participation in those transportation planning processes (including planning certification reviews conducted in Transportation Management Areas), we hereby take the following actions:
1. FHWA and FTA, in concurrence with the Environmental Protection Agency (EPA), havedetermined that the conformity determinations for the FFY 2021-2024 TIPs in allnonattainment and maintenance areas of the Commonwealth, adequately address andmeet the requirements as specified in the Transportation Conformity Rule [40 CFR Part93], as amended. This includes all ten (10) conformity determinations for areas that arecurrently designated under the existing National Ambient Air Quality Standards(NAAQS) and the nine (9) areas impacted by the U.S. Court of Appeals for the D.C.Eighth Circuit decision in South Coast Air Quality Management District v. EPAaddressing conformity requirements for former 1997 ozone “orphan” regions. (Please seethe enclosed table for the Pennsylvania regions requiring transportation conformity.) Theair quality conformity determination approval for these regions will reset the 4-yearconformity timeclock to begin on the date of this letter.
September 28, 2020
Appendix 21 - Pennsylvania FFY 2021 - 2024 STIP Planning Findings
203
DRAFT

Re: Pennsylvania FFY 2019-2022 Statewide Transportation Improvement page 2Program & Air Quality Conformity Determinations
2. The FHWA and FTA approve the Pennsylvania FFY 2021-2024 STIP, which includesthe individual Transportation Improvement Programs (TIPs) for all MetropolitanPlanning Organizations (MPOs), Rural Planning Organizations (RPOs), the IndependentCounty (Wayne), the Statewide Items TIP, and the PennDOT Interstate ManagementProgram.
3. The FHWA and FTA find that the projects contained in the STIP and MPO/RPO TIPs arebased on transportation planning processes that meet the requirements of the FAST Act,Fixing America’s Surface Transportation Act (P.L. 114-94); 23 U.S.C. Sections 134 and135; 49 U.S.C. Sections 5303 and 5304; and 23 CFR part 450.
4. Based on our joint review of the overall Pennsylvania statewide, metropolitan, and ruraltransportation planning processes, the FHWA and FTA are issuing the FFY 2021-2024STIP Federal Planning Finding, as enclosed.
5. In addition, several MPOs/RPOs have updated their Long Range Transportation Plan(LRTP) in accordance with 23 CFR Part 450.324. These areas include: Lancaster MPO,Lebanon MPO, Northern Tier RPO, and Johnstown Area Transportation Study (JATS)MPO. Two areas have amended their LRTP. These areas include: Delaware ValleyRegional Planning Commission (DVRPC) and Southwestern Pennsylvania Commission(SPC). FHWA and FTA, in concurrence with EPA, have determined that the conformitydeterminations for the above mentioned LRTPs adequately address and meet therequirements as specified in the Transportation Conformity Rule [40 CFR Part 93], asamended. The air quality conformity determination approval for Lancaster MPO,Lebanon MPO, and JATS MPO will reset the 4-year LRTP update timeclock to begin onthe date of this letter. Northern Tier RPO is designated as a former 1997 ozone “orphan”region and as such retains a 5-year LRTP update deadline which was reset when the RPOtook action to adopt the LRTP on April 13, 2020.
If you have any questions regarding this determination, please do not hesitate to contact either Jennifer Crobak, FHWA PA, at (717) 221-3440 or Laura Keeley, FTA Region III, at (215) 656-7111.
Sincerely,
Terry Garcia Crews Alicia Nolan Regional Administrator Division Administrator FTA Region III FHWA Pennsylvania Division
Enclosures
204
DRAFT

Re: Pennsylvania FFY 2019-2022 Statewide Transportation Improvement page 3Program & Air Quality Conformity Determinations
ec: Larry Shifflet, Deputy Secretary for Planning George McAuley, Jr., P.E. Executive Deputy Secretary Jennie Granger, AICP, Deputy Secretary for Multimodal TransportationMelissa J. Batula, P.E., Deputy Secretary for Highway AdministrationRobert L. Chiappelli, Deputy Secretary for Administration Brian D. Hare, P.E. Director, Center for Program Development and Management Laine Heltebridle, Director, Bureau of Planning and ResearchDanielle Spila, Director, Bureau of Public Transportation Kristin Mulkerin, Center for Program Development and Management Mark Tobin, Center for Program Development and Management Mike Gismondi, Center for Program Development and ManagementJessica Clark, Center for Program Development and Management Jackie Koons-Felion, Center for Program Development and ManagementMike Long, Bureau of Maintenance and Operations Doug Tomlinson, Bureau of Maintenance and OperationsJustin Bruner, Bureau of Maintenance and OperationsGavin Gray, Bureau of Maintenance and Operations Steve Gault, Bureau of Maintenance and Operations PennDOT District Executives MPO/RPO Executive Directors MPO/RPO Assistant Directors/Planners Susan Spielberger, EPA Greg Becoat, EPA Chris Trostle, PA Department of Environmental Protection Samantha Harmon, Department of Environmental Protection Kathleen Zubrzycki, FTA Region III Laura Keeley, FTA Region III Tim Lidiak, FTA Region III Keith Lynch, FHWA PA Spencer Stevens, FHWA PA Camille Otto, FHWA PA Jennifer Crobak, FHWA PA Matt Smoker, FHWA PA Jamie Lemon, FHWA PA Gene Porochniak, FHWA PA
205
DRAFT

1
Pennsylvania Areas Requiring Transportation Conformity Note: The table reflects the revocation of the 1997 PM2.5 NAAQS on October 24, 2016. The table includes the
1997 8-hour ozone NAAQS per the February 16, 2018 D.C Circuit decision in South Coast Air Quality Management District v. EPA (Case No. 15-1115). The impact of this court decision is only on areas that were
maintenance or nonattainment of the 1997 ozone NAAQS at the time of revocation and are designated as attainment for the 2008 and 2015 ozone NAAQS. These areas are referred to as “orphan” maintenance areas.
MPO/RPO Applicable NAAQS
Nonattainment / Maintenance Area Name
Counties in Area
Nonattainment Status
Reading 2008 8-hour Ozone Reading, PA Berks Marginal
Allentown
2008 8-hour Ozone
Allentown-Bethlehem-Easton, PA Lehigh, Northampton Marginal
2006 24-Hour PM2.5
Allentown, PA Lehigh, Northampton Maintenance
Harrisburg
2006 24-Hour PM2.5
Harrisburg-Lebanon-Carlisle-York, PA
Cumberland, Dauphin Maintenance
1997 8-hour Ozone
Harrisburg-Lebanon-Carlisle, PA
Cumberland, Dauphin, Perry
Orphan Maintenance
York
2006 24-Hour PM2.5
Harrisburg-Lebanon-Carlisle-York, PA York Maintenance
1997 8-hour Ozone York, PA York Orphan
Maintenance
Lancaster
2008 8-hour Ozone Lancaster, PA Lancaster Marginal
2006 24-Hour PM2.5
Lancaster, PA Lancaster Maintenance
Lebanon
2012 Annual PM2.5
Lebanon County, PA Lebanon Moderate
2006 24-Hour PM2.5
Harrisburg-Lebanon-Carlisle-York, PA Lebanon Maintenance
1997 8-hour Ozone
Harrisburg-Lebanon-Carlisle, PA Lebanon Orphan
Maintenance
Johnstown
1997 8-hour Ozone Johnstown, PA Cambria Orphan
Maintenance 2006
24-Hour PM2.5Johnstown, PA Cambria Maintenance
NEPA
2008 8-hour Ozone
Allentown-Bethlehem-Easton, PA Carbon Marginal
1997 8-hour Ozone Scranton-Wilkes-Barre, PA Monroe Orphan
Maintenance
206
DRAFT

2
MPO/RPO Applicable NAAQS
Nonattainment / Maintenance Area Name
Counties in Area
Nonattainment Status
DVRPC
2015 8-hour Ozone
Philadelphia-Wilmington-Atlantic City, PA-NJ-MD-DE
Bucks, Chester, Delaware,
Montgomery, Philadelphia
Marginal
2012 Annual PM2.5
Delaware County, PA Delaware Moderate
2008 8-hour Ozone
Philadelphia-Wilmington-Atlantic City, PA-NJ-MD-DE
Bucks, Chester, Delaware,
Montgomery, Philadelphia
Marginal
2006 24-Hour PM2.5
Philadelphia-Wilmington, PA-NJ-DE
Bucks, Chester, Delaware,
Montgomery, Philadelphia
Maintenance
SPC
2012 Annual PM2.5
Allegheny County, PA Allegheny Moderate
2008 8-hour Ozone Pittsburgh-Beaver Valley, PA
Allegheny, Armstrong, Beaver,
Butler, Fayette, Washington,
Westmoreland
Marginal
2006 24-Hour PM2.5
Pittsburgh-Beaver Valley, PA
Allegheny (P), Armstrong (P), Beaver, Butler,
Greene (P), Lawrence (P), Washington, Westmoreland
Maintenance
2006 24-Hour PM2.5
Johnstown, PA Indiana (P) Maintenance
2006 24-Hour PM2.5
Liberty-Clairton, PA Allegheny (P) Moderate
1997 8-hour Ozone
Clearfield and Indiana Cos, PA Indiana Orphan
Maintenance 1997
8-hour Ozone Greene Co, PA Greene Orphan Maintenance
1987 24-Hour PM10
Clairton & 4 Boroughs, PA Allegheny (P) Maintenance
1971 CO Pittsburgh, PA Allegheny (P) Limited Maintenance
207
DRAFT

3
MPO/RPO Applicable NAAQS
Nonattainment / Maintenance Area Name
Counties in Area
Nonattainment Status
Altoona 1997 8-hour Ozone Altoona, PA Blair
Orphan Maintenance
North Central 1997 8-hour Ozone
Clearfield and Indiana Cos, PA Clearfield
Orphan Maintenance
Erie 1997 8-hour Ozone Erie, PA Erie
Orphan Maintenance
Franklin 1997 8-hour Ozone Franklin Co, PA Franklin
Orphan Maintenance
Scranton 1997 8-hour Ozone Scranton-Wilkes-Barre, PA Lackawanna, Luzerne
Orphan Maintenance
Northern Tier
1997 8-hour Ozone Scranton-Wilkes-Barre, PA Wyoming
Orphan Maintenance
1997 8-hour Ozone Tioga Co, PA Tioga
Orphan Maintenance
Centre 1997 8-hour Ozone State College, PA Centre
Orphan Maintenance
Adams 1997 8-hour Ozone York, PA Adams
Orphan Maintenance
Shenango Valley
1997 8-hour Ozone
Youngstown-Warren-Sharon, OH-PA Mercer
Orphan Maintenance
(P) = designates partial county areas that are included in the nonattainment/maintenance area
208
DRAFT

Pennsylvania FFY 2021-2024 STIP Federal Planning Finding
1 | September 28, 2020
This is the documented Federal Planning Finding (FPF) for the Pennsylvania FFY 2021-2024 Statewide Transportation Improvement Program (STIP) and all incorporated Transportation Improvement Programs (TIPs). This FPF is issued by the Federal Highway Administration (FHWA) Pennsylvania Division and the Federal Transit Administration (FTA) Region III for Statewide, Nonmetropolitan, and Metropolitan Transportation Planning and Programming Processes.
The FHWA and FTA find that the Pennsylvania FFY 2021-2024 STIP substantially meets the requirements of 23 United States Code (U.S.C.) 134, 135; 49 U.S.C. 5303-5305; 23 CFR part 450, and 49 CFR part 613.
The FPF includes 7 Commendations where the Pennsylvania Department of Transportation (PennDOT) and Planning Partners have demonstrated excellence in the planning process and 7 Recommendations for continued improvement. There are no Corrective Actions. Please see the Findings on page 3 for details.
FHWA and FTA are committed to assisting PennDOT and the Planning Partners to review and address the Recommendations identified in the FPF. FHWA and FTA request the opportunity to meet with PennDOT within 90 days of the STIP approval to discuss the FPF and develop a collaborative action plan to make progress on the Recommendations and continue to strengthen the overall Pennsylvania planning process.
What is the Federal Planning Finding (FPF)?
The FPF is a formal action taken by FHWA and FTA to evaluate and ensure that STIPs and TIPs are developed according to Statewide and metropolitan transportation planning processes consistent with 23 U.S.C. 134 and 135 and 49 U.S.C. 5303 and 5304 and 23 CFR part 450 and 500, and 49 CFR part 613.
The FPF is a formal opportunity to highlight what works well and opportunities for improvement in the Statewide or metropolitan transportation planning process.
The FPF applies to both PennDOT and Planning Partners.
The FPF is a required prerequisite to FHWA’s and FTA’s joint approval of the STIP.
What are the statutory and regulatory requirements for the FPF?
• The Safe, Accountable, Flexible, Efficient Transportation Equity Act: A Legacy forUsers (SAFETEA-LU, Pub. L. 109-59) contained statutory requirements, codified inTitle 23 and Title 49, that the Secretary determine at least every four years whether thetransportation planning process through which statewide transportation plans andprograms are developed is consistent with 23 U.S.C. 134-135 and 49 U.S.C. 5303-5304.
209
DRAFT

Pennsylvania FFY 2021-2024 STIP Federal Planning Finding
2 | September 28, 2020
• A FPF is required for the approval of a STIP (23 U.S.C. 135(g)(7) and 49 U.S.C.5304(g)(7)).
• Moving Ahead for Progress in the 21st Century Act (MAP-21, Pub. L. 112-141) and theFixing America's Surface Transportation (FAST Act, Pub. L. 114-94)) maintain thisrequirement.
• The FHWA and FTA adopted joint implementing regulations for these requirements,found in 23 CFR part 450. Pursuant to the regulations, the requirement for the FPFapplies to both the STIP (23 CFR 400.220(b)) and MPO TIPs (23 CFR 450.330(a)).
How are the findings identified and tracked?
FHWA and FTA work collaboratively to identify potential observations to include in the FPF. These observations are identified through each agency’s involvement, stewardship and oversight activities with PennDOT, Metropolitan and Rural Planning Organizations (MPOs/RPOs), transit agencies, and key stakeholders. FHWA and FTA use several opportunities and methods to assess the quality of the Statewide and regional metropolitan transportation planning process, compliance with applicable statutes and regulations, and the level and type of technical assistance needed to enhance the effectiveness of the planning process. In addition to the STIP/TIP review, this involvement includes the Unified Planning Work Program (UPWP) approval, the Long Range Transportation Plan (LRTP) coordination, Air Quality (AQ) conformity determinations (in nonattainment and maintenance areas), as well as a range of other activities.
There are three finding categories:
1) Corrective Actions: Items identified where the activity does not meet statutory andregulatory requirements. Each Corrective Action requires action by the State and/orMPOs and provides a date to complete the Corrective Action(s).
2) Recommendations: Items that meet the statutory and regulatory requirements, but mayrepresent opportunities to improve the transportation planning processes.Recommendations could include enhancements to the planning processes, planningemphasis areas, emerging technologies, and agency initiatives.
3) Commendations: Activities or initiatives that demonstrate innovative, highly effective,well-thought out procedures for implementing the planning requirements or represent anational model for implementation and can be cited as an example for others.
210
DRAFT

Pennsylvania FFY 2021-2024 STIP Federal Planning Finding
3 | September 28, 2020
Findings:
The following Commendations of the Statewide and metropolitan transportation planning processes have been identified:
1. 2021 STIP/TIP Update Process:PennDOT and Planning Partners faced unprecedented challenges during the 2021STIP/TIP update. Across the State, PennDOT, MPOs/RPOs, transit agencies, and localgovernments rose to the occasion to identify innovative and collaborative solutions anddemonstrated the strength of the planning process in Pennsylvania. Without disruption,PennDOT and the Planning Partners quickly responded to continue operations, deploynew virtual public involvement tools, and meet federal planning requirements. FHWAand FTA commend all partners for their teamwork, determination, and commitment tothe planning process.
2. Annual Listing of Obligated Projects:The 2019 FPF identified the Corrective Action that all Planning Partners, transitagencies and PennDOT must cooperatively develop an Annual Listing of ObligatedProjects for which Federal funds have been obligated in the previous year in accordancewith 23 CFR 450.334. This Corrective Action has been resolved. FHWA and FTAcommend the collaborative efforts by PennDOT, MPOs/RPOs, and transit agencies tomeet this requirement. FHWA and FTA look forward to continuing to work withPennDOT, MPOs/RPOs, and transit agencies to better integrate and report on transitdata.
3. TIP General Procedural and Financial Guidance:PennDOT led efforts to overhaul the General Procedural Guidance to develop newprocesses to document clearer roles and responsibilities and incorporate PerformanceBased Planning and Programming (PBPP) and Transportation Performance Measures(TPM) into the TIP development process. The result is an exceptional resource whichestablishes clear requirements for documentation, and highlights the many resourcesavailable to identify and program projects that will help reach Performance Measuretargets.
In addition, FHWA and FTA commend the collaborative efforts of the FinancialGuidance Work Group to introduce new funding allocation formulas. The Work Groupincluded a wide representation of PennDOT Deputates, PennDOT Districts, FHWA PADivision staff and Planning Partners from across the Commonwealth. The Work Groupdeveloped the first-of-its-kind Asset Management Factor (AMF) to align the TIPFinancial Guidance with the Transportation Asset Management Plan (TAMP). Thiseffort represents a major accomplishment in support of implementing the TAMP. Inaddition, the Work Group prioritized essential funding to meet the significant needs ofthe Interstate Program. FHWA and FTA commend PennDOT and the MPOs/RPOs fortaking the hard, but important steps to evaluate investment strategies and focus criticalfunding to support Pennsylvania’s transportation system needs.
211
DRAFT

Pennsylvania FFY 2021-2024 STIP Federal Planning Finding
4 | September 28, 2020
4. Transit Asset Management (TAM) Plans:FTA and FHWA commend the assistance and support PennDOT has provided to theMPOs/RPOs and transit agencies in the development of and implementation of theTransit Asset Management Plans (TAM), targets, and planning requirements. Therequired use of PennDOT’s Capital Planning Tool (CPT) to serve as central repositoryfor all Pennsylvania transit asset and performance management activities has helped tomake sure agencies and MPOs/RPOs are operating in compliance with the TAMrequirements.
5. Transit TIPs:FTA and FHWA commend the increase in earlier coordination between FTA, PennDOT,transit agencies, and the MPOs/RPOs that resulted in FTA being able to providecomments on draft TIPs to help ensure compliance with the new PBPP requirements.
6. UPWP Update Process:FHWA and FTA commend PennDOT and the Planning Partners for their commitment toimproving the UPWP update process. PennDOT and MPOs/RPOs worked together todevelop a new approach to the UPWP update process which resulted in more customizedwork programs and enhanced collaboration between FHWA, MPOs/RPOs, PennDOT,transit agencies, and key stakeholders. FHWA and FTA commend PennDOT for itsefforts to provide guidance on the requirements of 2 CFR 200 and support MPOs/RPOsas they develop Indirect Cost Allocation Plans (ICAP)/Indirect Cost Rate Proposals(ICRP). FHWA and FTA look forward to continuing to work with PennDOT tostrengthen the UPWP review process, ICAP documentation, and invoicing procedures.
7. Environmental Justice (EJ) in Planning:PennDOT and MPOs/RPOs have made tremendous progress to improve the EJ analysisprocess in planning. FHWA and FTA commend PennDOT’s efforts to incorporate the EJCore Elements into the TIP General Procedural Guidance and to provide training, datasets, and technical assistance and resources to the MPOs/RPOs. FHWA and FTAcommend the MPOs/RPOs for their efforts to integrate the EJ Core Elements into theTIP development process and explore new ways to conduct outreach to traditionallyunderserved populations. These collaborative efforts have resulted in significantimprovements to the planning process across the Commonwealth. FHWA and FTArecommend that PennDOT and Planning Partners continue efforts to integrate EJ into theplanning process, update procedural documents and guidance, and share data resources.
212
DRAFT

Pennsylvania FFY 2021-2024 STIP Federal Planning Finding
5 | September 28, 2020
The following Recommendations for the Statewide and metropolitan transportation planning processes have been identified:
1. MPO/RPO LRTP Development Process:Since the 2019 FPF, progress has been made in many areas to improve the LRTP updateprocess and agency coordination; however, several issues have also demonstrated theneed for continued improvement and this finding is being carried over. FHWA and FTArecommend that PennDOT work with stakeholders to finalize the MPO/RPO LRTPGuidance Document to provide technical assistance and tools to meet state and federalplanning requirements. In addition, FHWA and FTA recommend that MPOs/RPOsschedule an LRTP update coordination meeting at least 30 months in advance of theLRTP deadline. This coordination meeting should include FHWA, FTA, PennDOTCentral Office and District Office staff, and other key partners. The meeting will servethe purpose of discussing roles and responsibilities, reviewing state and federal planningand transportation air quality requirements (where applicable), discussion on how toincorporate PBPP and TPM into the plan update, and identifying key milestones andresources.
2. Integration of the Performance Based Planning and Programming (PBPP) and theTransportation Asset Management Plan (TAMP):PennDOT and Planning Partners have made significant progress to integrate PBPP andmeet the federal planning requirements to support achievement of TransportationPerformance Measures (TPM) and national goals. These efforts are highlighted in theCommendations section.
In 2019, PennDOT developed the TAMP in accordance with 23 U.S.C. 119 and 23 CFRpart 515. The TAMP establishes a blueprint for achieving and sustaining a state of goodrepair over the life cycle of Pennsylvania’s transportation assets and preserving thecondition of the National Highway System (NHS). The TAMP commits PennDOT totwo overarching requirements:
• Meeting FHWA minimum condition thresholds for NHS pavements and bridges.• Transitioning from “worst-first” programming to lowest life-cycle cost (LLCC)
asset management.In July 2020, the FHWA PA Division determined that PennDOT is implementing the TAMP consistent with 23 CFR 515.13(b)(2). FHWA and FTA recognize efforts are underway to transition to the LLCC asset management approach and integrate the TAMP into the planning process. To support this effort, FHWA and FTA recommend that PennDOT develop and implement a method for communicating the TAMP investment strategies and continue to share the Bridge and Pavement Asset Management Systems (BAMS/PAMS) data resources with the MPOs/RPOs so that they can more effectively integrate the TAMP into their TIP and LRTP programs.
As Pennsylvania makes progress on these initiatives, FHWA and FTA recommend that PennDOT, MPOs/RPOs, and transit agencies review and evaluate their planning agreements and internal procedural documents to ensure they are updated to incorporate
213
DRAFT

Pennsylvania FFY 2021-2024 STIP Federal Planning Finding
6 | September 28, 2020
new requirements and clearly define and document their roles and responsibilities for carrying out 23 U.S.C 134, 23 U.S.C 150, and 23 CFR 450 Subpart C requirements.
3. Public Transportation Agency Safety Plans:FTA’s Public Transportation Agency Safety Plan (PTASP) regulation, 49 CFR Part 673,requires the state or transit agency that drafted the Agency Safety Plan to make its safetyperformance targets available to states and MPOs to aid in the planning process and tocoordinate with states and MPOs in the selection of state and MPO safety performancetargets. MPOs are required to reference the safety performance targets and PTASP intheir TIPs and LRTPs updated or amended after July 20, 2021. States will incorporatetransit agency safety performance targets into their STIP. In addition to the FHWAperformance measures, the planning products must include a description of the transitperformance measures and performance targets used in assessing the performance of thetransportation system, for transit asset management and safety. This should also include,to the maximum extent practicable, a description of the anticipated effect of the TIPtoward achieving the performance targets identified in the LRTP, linking investmentpriorities to those performance targets.
Due to the current circumstances, the PTASP did not need to be included in the 2021STIP/TIP. However, it does not appear there will be any delays in the requirement toreference the safety performance targets and PTASP in STIP/TIPs and LRTPs updated oramended after July 20, 2021. As such, FTA and FHWA recommend PennDOT work withMPOs/RPOs and transit agencies to integrate these requirements now, well in advance ofthe deadline to prevent any delays to STIP/TIP amendments or other approvals.
4. Statewide Public Participation Plan (PPP) and Public Involvement for theSTIP/TIPs:In 2020, PennDOT adopted the updated Statewide PPP (Publication 823), which outlinesits commitments to public involvement for the STIP, Twelve Year Program (TYP),Statewide Long Range Transportation Plan (SLRTP), and PPP. FHWA and FTAcommend PennDOT for the collaborative and comprehensive update process and foridentifying new strategies to engage the public. PennDOT plans to fully implement thenew STIP public involvement requirements for the 2023 STIP update.
As PennDOT prepares for this transition, FHWA and FTA recommend that PennDOTtake steps to better align and utilize the public outreach efforts that are conducted for theTYP with the STIP/TIP development process. The STIP and TYP are complementary inmany ways, with the STIP serving as the first four years of the TYP and the StateTransportation Commission (STC) taking formal action to adopt both documents at onetime. In addition, FHWA and FTA recommend that PennDOT evaluate and seek toimprove public notification, awareness and access to the STC meetings, agendas, andmaterials under consideration.
As part of the 2021 STIP/TIP update, PennDOT and Planning Partners deployed newvirtual public involvement (VPI) tools. FHWA and FTA commend these innovativeefforts and recommend that PennDOT and Planning Partners evaluate the effectiveness of
214
DRAFT

Pennsylvania FFY 2021-2024 STIP Federal Planning Finding
7 | September 28, 2020
VPI tools and consider adding VPI techniques to their respective Public Participation Plans.
5. Air Quality Programs:As part of the 2021 STIP/TIP update process, PennDOT and Planning Partners madesignificant strides to enhance the Air Quality (AQ) conformity process through proactivetraining, use of the AQ SharePoint site, and interagency coordination. These effortsresulted in a more collaborative and efficient AQ conformity process. FHWA and FTArecommend that PennDOT further build on this progress by updating the PennDOTProject Review and Classification Guidelines for Regional Air Quality Conformity(March 2014) to document the entire AQ conformity process for TIPs and LRTPs,describe roles and responsibilities, and include new program enhancements. In addition,FHWA and FTA recommend that MPOs/RPOs coordinate closely with PennDOT as theybegin their LRTP update process to map out a development timeline that provides forsufficient time to accommodate the AQ conformity process and interagency coordination.
6. State Freight Work Group and State Freight Plan:Since the 2017 FPF, PennDOT has made progress to expand participation in the StateFreight Work Group; however, this finding is carried forward with the recommendationto include private sector stakeholders. FHWA and FTA recommend that PennDOTcontinue to expand membership in the State Freight Work Group to include privatestakeholders and encourage the Freight Work Group to serve in an advisory role per theguidance in 49 U.S.C. 70201. Potential public and private stakeholders may include, butare not limited to, cargo carriers and logistics companies, and safety, community, energy,and environmental stakeholders.
In addition, FHWA and FTA recognize efforts are underway to update the State FreightPlan. The FAST Act requires the State Freight Plan to be updated at least once every fiveyears with a 5-year planning horizon per 49 U.S.C. 70202(d)-(e). PennDOT’s StateFreight Plan update is due November 17, 2022.
7. Keystone Corridor Funding:The Keystone Corridor (Pennsylvania portion) is the in-State and commuter rail servicefunded by PennDOT and FTA on the Amtrak rail line that runs between Philadelphia andHarrisburg. Keystone Corridor projects are funded within the three-contiguous largeurbanized areas (UZAs) which includes Harrisburg, Lancaster, and Philadelphia. Per theMemorandum of Understanding (MOU) between PennDOT, FTA, and FHWA forPennsylvania’s Statewide Procedures for 2021-2024 for STIP and TIP Revisions, theentire amount of federal funds applied to Keystone Corridor Projects shall beprogrammed on the TIP of the UZA from which the funds originate. There do not appearto be projects using Section 5337 funds programmed on the Harrisburg or Lancaster TIPsdespite those UZAs being apportioned Section 5337 formula funds. Keystone relatedprojects using Section 5307 funds do not appear on the Harrisburg and Lancaster TIPs.FTA and FHWA recommend that PennDOT coordinate with the MPOs associated withthe three UZAs where the funding originates to program Keystone Corridor projects ontheir respective TIPs in compliance with the MOU.
215
DRAFT

Pennsylvania 2019-2022 Statewide Transportation Improvement Program (STIP) and Air Quality Conformity Determination
2021 STIP Finding Recommendation Owner(s)Last
ModifiedCompletion
DateAction(s) Taken
MPO/RPO LRTP Development Process:Since the 2019 FPF, progress has been made in many areas to improve the LRTP update process and agency coordination; however, several issues have also demonstrated the need for continued improvement and this finding is being carried over. FHWA and FTA recommend that PennDOT work with stakeholders to finalize the MPO/RPO LRTP Guidance Document to provide technical assistance and tools to meet state and federal planning requirements.
In addition, FHWA and FTA recommend that MPOs/RPOs schedule an LRTP update coordination meeting at least 30 months in advance of the LRTP deadline. This coordination meeting should include FHWA, FTA, PennDOT Central Office and District Office staff, and other key partners. The meeting will serve the purpose of discussing roles and responsibilities, reviewing state and federal planning and transportation air quality requirements (where applicable), discussion on how to incorporate PBPP and TPM into the plan update, and identifying key milestones and resources.
Mike Rimer (PennDOT)Jen Crobak (FHWA)
06/01/22 On-going
A final Regional LRTP guidance document (PUB 575) is nearly completed. Provided comments are being addressed in the final document. After final editorial work is complete, PUB 575 will be sent to Office services for final design edits and publication to the “Documents” page on the PennDOT website later this year.
Integration of the Performance Based Planning and Programming (PBPP) and the Transportation Asset Management Plan (TAMP):In July 2020, the FHWA PA Division determined that PennDOT is implementing the TAMP consistent with 23 CFR 515.13(b)(2). FHWA and FTA recognize efforts are underway to transition to the lowest life-cycle cost (LLCC) asset management approach and integrate the TAMP into the planning process. To support this effort, FHWA and FTA recommend that PennDOT develop and implement a method for communicating the TAMP investment strategies and continue to share the Bridge and Pavement Asset Management Systems (BAMS/PAMS) data resources with the MPOs/RPOs so that they can more effectively integrate the TAMP into their TIP and LRTP programs.
As Pennsylvania makes progress on these initiatives, FHWA and FTA recommend that PennDOT, MPOs/RPOs, and transit agencies review and evaluate their planning agreements and internal procedural documents to ensure they are updated to incorporate new requirements and clearly define and document their roles and responsibilities for carrying out 23 U.S.C 134, 23 U.S.C 150, and 23 CFR 450 Subpart C requirements.
Casey Markey (PennDOT)Matt Smoker (FHWA)
06/01/22 On-going
A group of PennDOT District, PennDOT Central Office, FTA and FHWA PA Division representatives continue collaborate on the development of Transportation Performance Management resources. The groups efforts helped to inform General and Procedural Guidance for the 2023 Program update, as well as provided additional BAMS and PAMS guidance and regional trainings in fall of 2021. The Bureau of Operations – Asset Management Division provided initial outputs for each of the regional TIPs for the 2023 Program update.
A multimodal work group of PennDOT District, PennDOT Central Office, and FHWA PA Division representatives continue to focus on the project selection process applied in the development of TIPs, TYPs, and Regional LRTPs. The initial phase of their efforts is focusing on the documentation of current procedures District Offices, Planning Partners, the Interstate Steering Committee, and Public Transit Agencies apply in project selection for TIPs and TYPs. Future phases will focus on the integration of best practices, asset management tools, and other considerations to enhancement the project selection process.
Public Transportation Agency Safety Plans:Due to the current circumstances, FTA’s Public Transportation Agency Safety Plan (PTASP) did not need to be included in the 2021 STIP/TIP. However, it does not appear there will be any delays in the requirement to reference the safety performance targets and PTASP in STIP/TIPs and LRTPs updated or amended after July 20, 2021. As such, FTA and FHWA recommend PennDOT work with MPOs/RPOs and transit agencies to integrate these requirements now, well in advance of the deadline to prevent any delays to STIP/TIP amendments or other approvals.
Nicholas Baldwin (PennDOT)Laura Keeley (FTA)
06/01/22 On-going
PennDOT worked with transit agencies throughout 2020 and 2021 to ensure compliance with the PTASP final rule. PennDOT created a template for safety plans and provided technical assistance to agencies as needed. The template was reviewed by the PTASP Technical Assistance Center (TAC) and used as a model for other state DOTs providing guidance to transit agencies. PennDOT continues to work with MPOs/RPOs to encourage target adoption and monitoring as part of the Performance Based Planning and Programming (PBPP) approach.
Action Plan Matrix - 2021 Recommendations
216
DRAFT

Pennsylvania 2019-2022 Statewide Transportation Improvement Program (STIP) and Air Quality Conformity Determination
2021 STIP Finding Recommendation Owner(s)Last
ModifiedCompletion
DateAction(s) Taken
Action Plan Matrix - 2021 Recommendations
Statewide Public Participation Plan (PPP) and Public Involvement for theSTIP/TIPs:FHWA and FTA recommend that PennDOT take steps to better align and utilize the public outreach efforts that are conducted for the TYP with the STIP/TIP development process. The STIP and TYP are complementary in many ways, with the STIP serving as the first four years of the TYP and the State Transportation Commission (STC) taking formal action to adopt both documents at one time.
In addition, FHWA and FTA recommend that PennDOT evaluate and seek to improve public notification, awareness and access to the STC meetings, agendas, and materials under consideration.
FHWA and FTA recommend that PennDOT and Planning Partners evaluate the effectiveness of virtual public involvement (VPI) tools and consider adding VPI techniques to their respective Public Participation Plans.
Dan Keane (PennDOT)Jen Crobak (FHWA)
06/01/22 On-going
The department successfully launched the updated Talk PA Transportation website in the fall of 2020. The website redesign goal was to improve public notification, awareness, and access to the STC/TAC meetings, agendas, TAC Studies, and meeting materials under consideration. STC/TAC meetings, Agendas, "what will be discussed," approved meeting mins, and Teams call information continue to be uploaded on the Website. The department continues to direct the public to the Website by providing weblinks within the Sunshine notices to lead the people to the TAC and STC meeting webpages. The website continues to assist with informing/notifying the public about planning and planning activities.To supplement the TYP outreach efforts and the regional TIPs’ public comment periods, the STC and PennDOT assisted with promoting the regional TIP public comment periods. As Transportation Improvement Programs became available for public comment on planning partners’ websites, the links to each of these draft documents were connected to an interactive map on the TalkPATransportation.com website. PennDOT will host the first public comment period for the STIP from June 15 through June 30, 2022, on the TalkPATransportation.com website to ensure connection between STIP and TYP. A static STIP Process Infographic, “Take a Trip Through the STIP Process,” was developed and served as a visual educational tool for the public. An interactive STIP/TYP Project Map will provide a public friendly way to highlight all the projects outlined in the STIP. After the 15-day STIP Public Comment Period, PennDOT review and documented comments received. PennDOT will submit the draft 12-Year Program, which includes the STIP, to the STC for adoption in August 2022. The adopted 2023 12-Year Program/STIP will be posted on the STC website. To also support the connection between the TYP and STIP/TIPs, the final regional TIPs will also be available for public access during non-program update years. The regional TIPs will be linked from TalkPATransportation.com, creating a central location where all regional TIPs can be easily accessed and viewed by the public. The department has implemented the use of virtual public engagement techniques since 2013. After every outreach campaign, the department hosts a TYP focus group to receive feedback and explore other VPI techniques. The department continues to share our VPI experiences as well as encouraging MPOs and RPOs to share their lessons learned regarding VPI at Statewide meetings. As each MPO and RPO update their own Public Participation Plans, they are including a VPI component (at least 8 recently). Knowing VPI is a Planning Emphasis Area being integrated into most recently updated UPWPS, we anticipate even more updates to Public Participation plans over the next two years.
Air Quality Programs:FHWA and FTA recommend that PennDOT further build on progress from previous efforts by updating the PennDOT Project Review and Classification Guidelines for Regional Air Quality Conformity (March 2014) to document the entire AQ conformity process for TIPs and LRTPs, describe roles and responsibilities, and include new program enhancements.
In addition, FHWA and FTA recommend that MPOs/RPOs coordinate closely with PennDOT as they begin their LRTP update process to map out a development timeline that provides for sufficient time to accommodate the AQ conformity process and interagency coordination.
Jackie Koons-Felion (PennDOT)Jen Crobak (FHWA)
06/01/22 01/27/22
The PennDOT Project Review and Classification Guidelines for Regional Air Quality Conformity was updated and released in June 2021.
A timeline was developed to map out the AQ conformity process as part of the LRTP update process. Training was provided at the PennDOT Air Quality and Congestion Mitigation and Air Quality Work Shop on January 27, 2022.
State Freight Work Group and State Freight Plan:FHWA and FTA recommend that PennDOT continue to expand membership in the State Freight Work Group to include private stakeholders and encourage the Freight Work Group to serve in an advisory role per the guidance in 49 U.S.C. 70201.
In addition, FHWA and FTA recognize efforts are underway to update the State Freight Plan. The FAST Act requires the State Freight Plan to be updated at least once every five years with a 5-year planning horizon per 49 U.S.C. 70202(d)-(e). PennDOT’s State Freight Plan update is due November 17, 2022.
Mike Rimer (PennDOT)Dan Walston (FHWA)
06/01/22 On-going
In December 2021, a FAST Act compliant freight plan was completed and accepted for use and submission to FHWA for formal approval. During a public review period, the IIJA was adopted and put in effect with several additional freight plan element requirements for freight plans. A separate work effort is now underway to address the new elements in advance of the State Freight Plan update due date of November 17, 2022.
The PennDOT Freight Work Group (FWG) has remained in place as originally formed in 2017. The intentions expressed at that time were to see this group of “internal PennDOT” participants continue to grow appropriately. The newest FMP 2045 recommends expansion of the group. Guidance for State Freight Advisory Committees remained optional in the IIJA and guidance in 49 U.S.C. 70201.
A policy meeting with the Deputy Secretary for Planning is set to discuss the composition, approach to expand and steps to shape and/or enlarge the membership and role of the FWG similar to a State Freight Advisory Committee.
217
DRAFT

Pennsylvania 2019-2022 Statewide Transportation Improvement Program (STIP) and Air Quality Conformity Determination
2021 STIP Finding Recommendation Owner(s)Last
ModifiedCompletion
DateAction(s) Taken
Action Plan Matrix - 2021 Recommendations
Keystone Corridor Funding:Per the Memorandum of Understanding (MOU) between PennDOT, FTA, and FHWA for Pennsylvania’s Statewide Procedures for 2021-2024 for STIP and TIP Revisions, the entire amount of federal funds applied to Keystone Corridor Projects shall be programmed on the TIP of the UZA from which the funds originate. There do not appear to be projects using Section 5337 funds programmed on the Harrisburg or Lancaster TIPs despite those UZAs being apportioned Section 5337 formula funds. Keystone related projects using Section 5307 funds do not appear on the Harrisburg and Lancaster TIPs. FTA and FHWA recommend that PennDOT coordinate with the MPOs associated with the three UZAs where the funding originates to program Keystone Corridor projects on their respective TIPs in compliance with the MOU.
Steve Panko (PennDOT)Laura Keeley (FTA)
06/01/22 On-going
Keystone Corridor funding (Section 5307 and 5337 funds) are appropriately added to the respective TIPs according to the current FFY 2021-24 STIP/TIP MOU when projects utilizing these funds are identified.
PennDOT, FTA and FHWA reviewed and clarified Keystone Corridor funding language in the FFY 2023-2026 STIP/TIP MOU. Coordination occurred to ensure language is utilized in the three UZA area FFY 2023-2026 TIP specific MOUs. Coordination will continue for the FFY 2023-2026 STIP/TIP to ensure projects are programmed appropriately on respective TIPs when identified to be funded with Section 5307 and 5337 funds.
218
DRAFT

Wayne County 2023-2026 TIP Environmental Justice Assessment
1
Wayne County 2023-2026 TIP Environmental Justice Assessment Introduction
The public involvement efforts for MPO/RPOs are guided by several federal mandates to ensure nondiscrimination in federally funded activities. These mandates are designed so that planning and public involvement activities are conducted equitably and in consideration of all citizens, regardless of race, nationality, sex, age, ability, language spoken, or economic status. These mandates include:
• Title VI of the Civil Rights Act of 1964 - Title VI of the Civil Rights Act states that "No person in the United States shall, onthe grounds of race, color, or national origin, be excluded from participation in, be denied the benefit of, or be subjected todiscrimination under any program or activity receiving federal financial assistance." MPOs are committed to providing openand inclusive access to the transportation decision-making process for all persons, regardless of race, color, or nationalorigin.
• Executive Order on Environmental Justice (Executive Order 12898 February 11, 1994) - Environmental Justice is the fairtreatment and meaningful involvement of all people regardless of race, color, national origin, or income with respect to thedevelopment, implementation, and enforcement of environmental laws, regulations, and policies. MPOs/RPOs arecommitted to providing opportunities for full and fair participation by minority and low- income communities in thetransportation decision-making process.
• Americans with Disabilities Act (ADA) - The Americans with Disabilities Act of 1990 stipulates involving persons withdisabilities in the development and improvement of services. Sites of public involvement activities as well as theinformation presented must be accessible to persons with disabilities. MPOs/RPOs are committed to providing full access topublic involvement programs and information for persons with disabilities. All public meetings are held in ADA-accessiblelocations. With advance notice, special provisions can be made for hearing-impaired or visually impaired participants.
• Executive Order on Limited English Proficiency - Executive Order 13166, "Improving Access to Services for Persons withLimited English Proficiency," was signed on August 11, 2000. Recipients of federal funding "are required to take reasonablesteps to ensure meaningful access to programs and activities by LEP person." MPOs/RPOs will make special arrangementsfor the provision of interpretative services upon request.
FHWA recently introduced the Environmental Justice Core Elements Methodology to ensure an MPO/RPO can meaningfully assess the benefits and burdens of plans and programs. Wayne County is committed to following the Core Elements approach, which
Appendix 22 Wayne County TIP Materials
219
DRAFT

Wayne County 2023-2026 TIP Environmental Justice Assessment
2
includes efforts to:
• Avoid, minimize, or mitigate disproportionately high and adverse human health or environmental effects, including socialand economic effects, on minority populations and low-income populations.
• Ensure the full and fair participation by all potentially affected communities in the transportation decision-making process.• Prevent the denial of, reduction in, or significant delay in the receipt of benefits by minority populations and low-income
populations.
By integrating the Core Elements into the planning process, state and local agencies are better equipped to carry out the investment strategy and project selection. The EJ process should be comprehensive and continuous with each task informing and cycling back to influence the next step.
Identifying Minority and Low-Income Populations
In development of the 2023-2026 Transportation Improvement Program (TIP), Wayne County conducted an Environmental Justice Benefits and Burdens analysis. A distributive geographic analysis was conducted to identify the locations and concentrations of minority, low-income and other Traditionally Underserved Populations (TUP).
The identification of these populations is essential to establishing effective strategies for engaging them in the transportation planning process. When meaningful opportunities for interaction are established, the transportation planning process can effectively draw upon the perspectives of communities to identify existing transportation needs, localized deficiencies, and the demand for transportation services. Mapping of these populations not only provides a baseline for assessing impacts of the transportation investment program, but also aids in the development of an effective public involvement program.
Minority population is defined as any readily identifiable group of Black, Hispanic, Asian American, American Indian, and Alaskan Native who live in geographic proximity and who would be similarly affected by a proposed FHWA program, policy, or activity. Low-income population is defined as any readily identifiable group of persons at or below the Department of Health and Human Services poverty guidelines who live in a geographic proximity who would be similarly affected by a proposed FHWA program, policy, or activity. As shown in Table 1, based on the 2015-2019 American Community Survey (ACS) data, minority persons in Wayne County make up nearly 4 percent of the total population. The number of persons in poverty is just under 11 percent of the total regional population.
220
DRAFT

Wayne County 2023-2026 TIP Environmental Justice Assessment
3
Table 1: Profile of Low-Income and Minority Populations, 2019
Demographic Indicator Wayne County
Regional Population Regional Percentage Total 47,488 White, Non-Hispanic 45,643 96.11% Minority 1,845 3.89%
Black or African American, non-Hispanic or Latino 336 0.71% American Indian and Alaska Native, non-Hispanic or Latino 90 0.19% Asian alone, non-Hispanic or Latino 301 0.63% Native Hawaiian and Other Pacific Islander, non-Hispanic or Latino 8 0.02% Some other race, non-Hispanic or Latino 107 0.23% Two or more races, non-Hispanic or Latino 1,003 2.11% Hispanic or Latino 1,844 3.88%
Low-Income Households 1,101 10.11%
Low-Income Population 5,353 10.9% Other Potentially Disadvantaged Populations
Limited English Proficiency (LEP) 1,720 3.5%
Persons with a Disability 9,124 19.14%
Female Head of Household with Child 4,062 8.5%
Elderly (65 years or older) 11,838 %
Carless Households 1,102 5.82% Source: 2015-2019 ACS 5-Year Estimates
Table 2 identifies the total population by race and low-Income category. The White, Non-Hispanic category has the highest population in the region and most individuals that are low-Income, however, the category’s overall low-income percentage is 10 percent, which is about the same as the county average of 11 percent. In contrast, the American Indian category has one of the lowest populations in the region and highest percentage of individuals that are low-income. In relation to the region’s total population, this category makes up less than 1 percent.
221
DRAFT

Wayne County 2023-2026 TIP Environmental Justice Assessment
4
Table 2: Population Tabulations by Racial/Ethnic Groups and Low-Income Categories
Wayne County
White Total: 45,643
Low-Income 4,565
% Low-income 10%
Black Total: 336
Low-Income 222
% Low-income 66.1%
American Indian Total: 90
Low-Income 80
% Low-income 88.9%
Asian Total: 301
Low-Income 34
% Low-income 11.3%
Native Hawaiian Total: 8
Low-Income 0
% Low-income 0%
Some Other Race Total: 107
Low-Income 12
% Low-income 11.2%
Two or More Total: 1,003
Low-Income 121
% Low-income 12.1%
Hispanic or Latino origin (of any race) Total: 1,844
Low-Income 319
% Low-income 17.3% Total Population 47,488 Total Low-Income 3,509 Source: 2015-2019 ACS 5-Year Estimates
222
DRAFT

Wayne County 2023-2026 TIP Environmental Justice Assessment
5
Condition Assessment
In order to meaningfully analyze benefits and adverse effects of the transportation program, Wayne County has examined the existing conditions of transportation assets throughout the region and safety performance measures among the minority and low-income populations. These data assessments allow the county to track changes in crashes, poor condition bridges, and poor pavement mileage in the region and identify safety gaps and distribution disparities between minority and low-income populations.
Bridges Tables 3 and 4 provide the number and percentage of bridges by condition and by the concentration of minority and low-income population. Comparing the distribution of total bridges and poor condition bridges between low and high minority and low-income areas helps provide insights on potential equity issues. For areas with higher minority population shares, the percentage of total bridges and poor bridges is 22.7% and 19.9%, respectively. For areas with higher shares of low-income population, the percentage of total bridges and poor bridges is 24.7% and 23.8%, respectively. In both cases the share of poor condition bridges is very near the percentage of total bridges in minority and low-income areas. The data does not indicate any disproportionate impacts to those communities related to bridge asset conditions.
Table 3: Distribution of Poor Condition Bridges by Minority Population Intervals
Ratio of Minority Population Percentage in Census Block Group (bridge location) to Regional Average Minority Percentage
0.0 – 0.5 Very Low
Minority %
0.5 – 1.0 Low
Minority %
1.0 – 2.0 Medium
Minority %
2.0 – 4.0 High
Minority %
> 4.0 Very High
Minority % Bridges 310 190 132 0 15
Share of Bridges 47.9% 29.4% 20.4% 0.0% 2.3%
Poor Condition Bridges 62 39 22 0 3 Percent Poor Condition Bridges 20.0% 20.5% 16.7% 0.0% 20.0% Share of Total Poor Condition Bridges 49.2% 31.0% 17.5% 0.0% 2.4%
Source: 2015-2019 ACS 5-Year Estimates, PennDOT
223
DRAFT
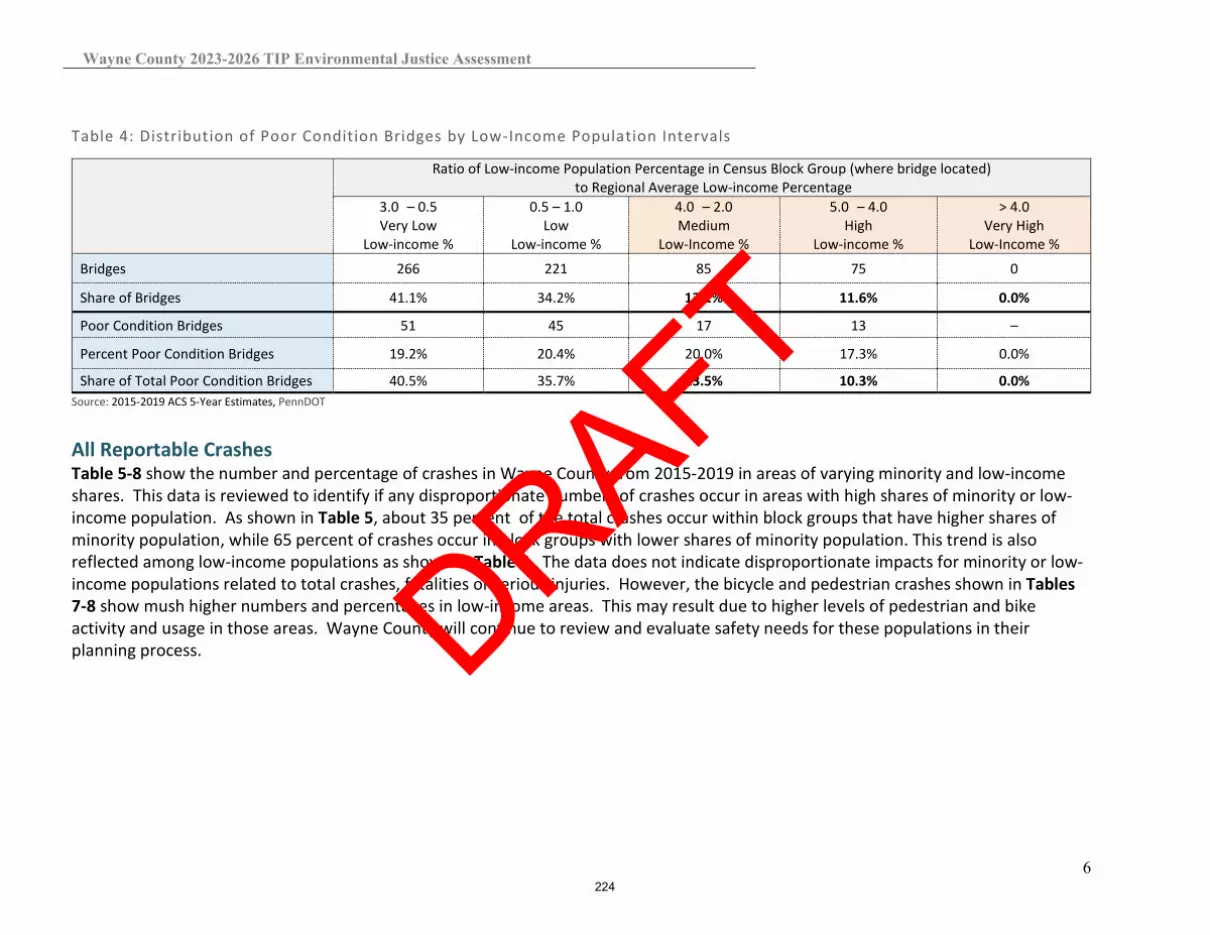
Wayne County 2023-2026 TIP Environmental Justice Assessment
6
Table 4: Distribution of Poor Condition Bridges by Low-Income Population Intervals
Ratio of Low-income Population Percentage in Census Block Group (where bridge located) to Regional Average Low-income Percentage
3.0 – 0.5 Very Low
Low-income %
0.5 – 1.0 Low
Low-income %
4.0 – 2.0 Medium
Low-Income %
5.0 – 4.0 High
Low-income %
> 4.0 Very High
Low-Income %
Bridges 266 221 85 75 0
Share of Bridges 41.1% 34.2% 13.1% 11.6% 0.0%
Poor Condition Bridges 51 45 17 13 –
Percent Poor Condition Bridges 19.2% 20.4% 20.0% 17.3% 0.0%
Share of Total Poor Condition Bridges 40.5% 35.7% 13.5% 10.3% 0.0% Source: 2015-2019 ACS 5-Year Estimates, PennDOT All Reportable Crashes Table 5-8 show the number and percentage of crashes in Wayne County from 2015-2019 in areas of varying minority and low-income shares. This data is reviewed to identify if any disproportionate numbers of crashes occur in areas with high shares of minority or low-income population. As shown in Table 5, about 35 percent of the total crashes occur within block groups that have higher shares of minority population, while 65 percent of crashes occur in block groups with lower shares of minority population. This trend is also reflected among low-income populations as shown in Table 6. The data does not indicate disproportionate impacts for minority or low-income populations related to total crashes, fatalities or serious injuries. However, the bicycle and pedestrian crashes shown in Tables 7-8 show mush higher numbers and percentages in low-income areas. This may result due to higher levels of pedestrian and bike activity and usage in those areas. Wayne County will continue to review and evaluate safety needs for these populations in their planning process.
224
DRAFT

Wayne County 2023-2026 TIP Environmental Justice Assessment
7
Table 5: Distribution of Crashes by Minority Population Intervals
Ratio of Minority Population Percentage in Census Block Group (where crash located) to Regional Average Minority Percentage
0.0 – 0.5 Very Low
Minority %
0.5 – 1.0 Low
Minority %
1.0 – 2.0 Medium
Minority %
2.0 – 4.0 High
Minority %
> 4.0 Very High
Minority % Reportable Crashes (2015-2019) 992 682 732 53 109 Share of Total Reportable Crashes (2015 - 2019) 38.6% 26.6% 28.5% 2.1% 4.2%
Crash Fatalities (2015 - 2019) 15 10 12 1 2 Share of Total Crash Fatalities (2015-2019) 37.5% 25.0% 30.0% 2.5% 5.0%
Crash Suspected Serious Injuries (2015 - 2019) 30 28 13 2 3 Share of Crash Suspected Serious Injuries (2015 - 2019) 39.5% 36.8% 17.1% 2.6% 3.9%
Source: 2015-2019 ACS 5-Year Estimates, PennDOT Table 6: Distribution of Crashes by Low-Income Population Intervals
Ratio of Low-income Population Percentage in Census Block Group (where crash located) to Regional Average Low-income Percentage
0.0 – 0.5 Very Low
Low-income %
0.5 – 1.0 Low
Low-income %
1.0 – 2.0 Medium
Low-Income %
2.0 – 4.0 High
Low-income %
> 4.0 Very High
Low-Income % Reportable Crashes (2015-2019) 515 1164 637 252 0 Share of Total Reportable Crashes (2015 - 2019) 20.1% 45.3% 24.8% 9.8% 0.0%
Crash Fatalities (2015 - 2019) 8 20 5 7 – Share of Total Crash Fatalities (2015-2019) 20.0% 50.0% 12.5% 17.5% 0.0%
Crash Suspected Serious Injuries (2015 - 2019) 21 34 9 12 – Share of Crash Suspected Serious Injuries (2015 - 2019) 27.6% 44.7% 11.8% 15.8% 0.0%
Source: 2015-2019 ACS 5-Year Estimates, PennDOT
225
DRAFT

Wayne County 2023-2026 TIP Environmental Justice Assessment
8
Table 7: Distribution of Bicycle or Pedestrian Crashes by Minority Population Intervals
Ratio of Minority Population Percentage in Census Block Group (where crash located) to Regional Average Minority Percentage
0.0 – 0.5 Very Low
Minority %
0.5 – 1.0 Low
Minority %
1.0 – 2.0 Medium
Minority %
2.0 – 4.0 High
Minority %
> 4.0 Very High
Minority % Bicycle or Pedestrian Crashes (2015 - 2019) 15 7 12 – – Share of Total Bicycle or Pedestrian Crashes (2015 - 2019) 44.1% 20.6% 35.3% 0.0% 0.0%
Source: 2015-2019 ACS 5-Year Estimates, PennDOT
Table 8: Distribution of Bicycle or Pedestrian Crashes by Low-Income Population Intervals
Ratio of Low-income Population Percentage in Census Block Group (where crash located) to Regional Average Low-income Percentage
0.0 – 0.5 Very Low
Low-income %
0.5 – 1.0 Low
Low-income %
1.0 – 2.0 Medium
Low-Income %
2.0 – 4.0 High
Low-income %
> 4.0 Very High
Low-Income % Bicycle or Pedestrian Crashes (2015 - 2019) 2 8 14 11 0 Share of Total Bicycle or Pedestrian Crashes (2015 - 2019) 5.7% 22.9% 40.0% 31.4% 0.0%
Source: 2015-2019 ACS 5-Year Estimates, PennDOT
Pavement Condition Tables 9 and 10 identify the number and percentage of roadways with poor International Roughness Index (IRI) and with poor Overall Pavement Index (OPI) within minority and low-income population block group intervals. Poor pavement condition data in Wayne County may indicate a need for increased roadway resurfacing and reconstruction. The data indicates that poor rated IRI and OPI pavement occurs at nearly equal amounts between areas with and without high shares of low-income or minority population. The data does not indicate any disproportionate impacts to those communities related to pavement conditions.
226
DRAFT

Wayne County 2023-2026 TIP Environmental Justice Assessment
9
Table 9: Distribution of Roadways by Minority Population Intervals
Ratio of Minority Population Percentage in Census Block Group (where road located) to Regional Average Minority Percentage
0.0 – 0.5 Very Low
Minority %
0.5 – 1.0 Low
Minority %
1.0 – 2.0 Medium
Minority %
2.0 – 4.0 High
Minority %
> 4.0 Very High
Minority % Federal Aid Road Segment Miles 69.5008 47.0512 45.571 4.0174 5.3165 Share of Federal Aid Road Segment Miles 40.5% 27.4% 26.6% 2.3% 3.1%
Federal Aid Road Segment Miles with Poor IRI 5.1936 1.6261 6.2847 0 0.4434 Percent of Federal Aid Road Segments with Poor IRI 7.5% 3.5% 13.8% 0.0% 8.3% Share of Total Federal Aid Road Segment Miles with Poor IRI 38.3% 12.0% 46.4% 0.0% 3.3%
Federal Aid Road Segment Miles with Poor OPI 19.3707 13.0909 17.548 2.0694 1.6875 Percent of Federal Aid Road Segments with Poor OPI 27.9% 27.8% 38.5% 51.5% 31.7% Share of Total Federal Aid Road Segment Miles with Poor OPI 36.0% 24.3% 32.6% 3.8% 3.1%
Source: 2015-2019 ACS 5-Year Estimates, PennDOT Table 10: Distribution of Federal Aid Roadways by Low-Income Population Intervals
Ratio of Low-income Population Percentage in Census Block Group (where road located) to Regional Average Low-income Percentage
0.0 – 0.5 Very Low
Low-income %
0.5 – 1.0 Low
Low-income %
1.0 – 2.0 Medium
Low-Income %
2.0 – 4.0 High
Low-income %
> 4.0 Very High
Low-Income % Federal Aid Road Segment Miles 37.6903 78.4469 30.1149 21.8775 0 Share of Federal Aid Road Segment Miles 22.4% 46.7% 17.9% 13.0% 0.0% Federal Aid Road Segment Miles with Poor IRI 1.9501 7.2711 2.4302 1.1934 0 Percent of Federal Aid Road Segments with Poor IRI 5.2% 9.3% 8.1% 5.5% 0.0% Share of Total Federal Aid Road Segment Miles with Poor IRI 15.2% 56.6% 18.9% 9.3% 0.0% Federal Aid Road Segment Miles with Poor OPI 8.9267 23.6515 11.8546 8.1349 0 Percent of Federal Aid Road Segments with Poor OPI 23.7% 30.1% 39.4% 37.2% 0.0% Share of Total Federal Aid Road Segment Miles with Poor OPI 17.0% 45.0% 22.6% 15.5% 0.0%
Source: 2015-2019 ACS 5-Year Estimates, PennDOT
227
DRAFT
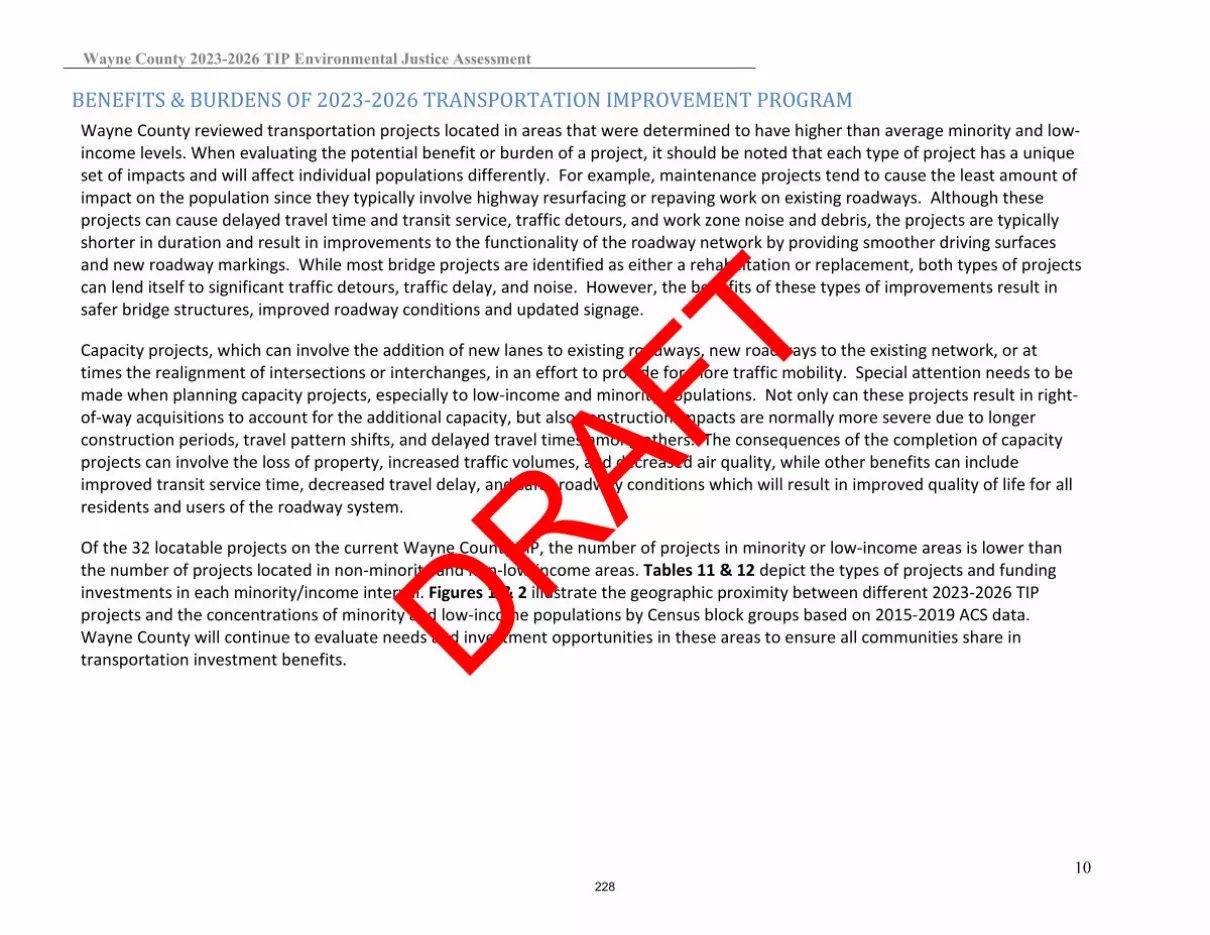
Wayne County 2023-2026 TIP Environmental Justice Assessment
10
BENEFITS & BURDENS OF 2023-2026 TRANSPORTATION IMPROVEMENT PROGRAM Wayne County reviewed transportation projects located in areas that were determined to have higher than average minority and low-income levels. When evaluating the potential benefit or burden of a project, it should be noted that each type of project has a unique set of impacts and will affect individual populations differently. For example, maintenance projects tend to cause the least amount of impact on the population since they typically involve highway resurfacing or repaving work on existing roadways. Although these projects can cause delayed travel time and transit service, traffic detours, and work zone noise and debris, the projects are typically shorter in duration and result in improvements to the functionality of the roadway network by providing smoother driving surfaces and new roadway markings. While most bridge projects are identified as either a rehabilitation or replacement, both types of projects can lend itself to significant traffic detours, traffic delay, and noise. However, the benefits of these types of improvements result in safer bridge structures, improved roadway conditions and updated signage.
Capacity projects, which can involve the addition of new lanes to existing roadways, new roadways to the existing network, or at times the realignment of intersections or interchanges, in an effort to provide for more traffic mobility. Special attention needs to be made when planning capacity projects, especially to low-income and minority populations. Not only can these projects result in right-of-way acquisitions to account for the additional capacity, but also construction impacts are normally more severe due to longer construction periods, travel pattern shifts, and delayed travel times among others. The consequences of the completion of capacity projects can involve the loss of property, increased traffic volumes, and decreased air quality, while other benefits can include improved transit service time, decreased travel delay, and safer roadway conditions which will result in improved quality of life for all residents and users of the roadway system.
Of the 32 locatable projects on the current Wayne County TIP, the number of projects in minority or low-income areas is lower than the number of projects located in non-minority and non-low-income areas. Tables 11 & 12 depict the types of projects and funding investments in each minority/income interval. Figures 1 & 2 illustrate the geographic proximity between different 2023-2026 TIP projects and the concentrations of minority and low-income populations by Census block groups based on 2015-2019 ACS data. Wayne County will continue to evaluate needs and investment opportunities in these areas to ensure all communities share in transportation investment benefits.
228
DRAFT

Wayne County 2023-2026 TIP Environmental Justice Assessment
11
Table 11: Distribution of Locatable Projects by Minority Population Intervals
Ratio of Minority Population Percentage in Census Block Group (project location) to Regional Average Minority Percentage
0.0 – 0.5 Very Low
Minority %
0.5 – 1.0 Low
Minority %
1.0 – 2.0 Medium
Minority %
2.0 – 4.0 High
Minority %
> 4.0 Very High
Minority % Roadway Projects
Amount of Funding $0.00 $0.00 $0.00 $0.00 $0.00 Per Capita Funding $0.00 $0.00 $0.00 $0.00 $0.00 Number of Projects – – – – –
Bridge Projects
Amount of Funding $42,443,559.00 $10,995,490.00 $14,053,000.00 $0.00 $0.00 Per Capita Funding $1,988.45 $813.04 $1,181.72 $0.00 $0.00 Number of Projects 15 8 6 – –
Safety Projects
Amount of Funding $6,647,500.00 $0.00 $1,960,000.00 $0.00 $0.00 Per Capita Funding $311.43 $0.00 $164.82 $0.00 $0.00 Number of Projects 5 – 1 – –
All Projects
Amount of Funding $49,091,059.00 $10,995,490.00 $16,013,000.00 $0.00 $0.00 Per Capita Funding $2,299.89 $813.04 $1,346.54 $0.00 $0.00 Number of Projects 20 8 7 – –
229
DRAFT

Wayne County 2023-2026 TIP Environmental Justice Assessment
12
Table 12: Distribution of Locatable Projects by Low-Income Population Intervals
Ratio of Low-income Population Percentage in Census Block Group (where project located) to Regional Average Low-income Percentage
0.0 – 0.5 Very Low
Low-income %
0.5 – 1.0 Low
Low-income %
1.0 – 2.0 Medium
Low-Income %
2.0 – 4.0 High
Low-income %
> 4.0 Very High
Low-Income % Roadway Projects
Amount of Funding $0.00 $0.00 $0.00 $0.00 $0.00 Per Capita Funding $0.00 $0.00 $0.00 $0.00 $0.00 Number of Projects – – – – –
Bridge Projects
Amount of Funding $25,021,188.96 $31,213,336.20 $9,848,000.00 $2,206,500.00 $0.00 Per Capita Funding $1,885.26 $1,673.55 $883.23 $476.57 $0.00 Number of Projects 10 9 5 2 –
Safety Projects
Amount of Funding $0.00 $1,500,000.00 $1,960,000.00 $0.00 $0.00 Per Capita Funding $0.00 $80.42 $175.78 $0.00 $0.00 Number of Projects – 1 1 – –
All Projects Amount of Funding $25,021,188.96 $32,713,336.20 $11,808,000.00 $2,206,500.00 $0.00 Per Capita Funding $1,885.26 $1,753.97 $1,059.01 $476.57 $0.00 Number of Projects 10 10 6 2 –
230
DRAFT

Wayne County 2023-2026 TIP Environmental Justice Assessment
13
Figure 1: Concentrations of Minority Populations by Census Block Groups & 2023-2026 TIP Project Locations
231
DRAFT

Wayne County 2023-2026 TIP Environmental Justice Assessment
14
Figure 2: Concentrations of Low-Income Populations by Census Block Group & 2023-2026 TIP Project Locations
232
DRAFT

DRAFT

400 North Street, 6th Floor | Harrisburg PA 17120
Phone: 717.787.2862 | Fax: 717.787.5247 www.penndot.gov
DRAFT