Embed Size (px)
Citation preview
J. agric. Engng Res. (2001) 80 (1), 25}35doi:10.1006/jaer.2001.0714, available online at http://www.idealibrary.com onPA*Precision Agriculture
0
Dynamic Weighing for Accurate Fertilizer Application and Monitoring
J. van Bergeijk1; D. Goense2; L.G. van Willigenburg1; L. Speelman
1Wageningen Agricultural University, Department for Agricultural, Environmental and Systems Technology, Bomenweg 4,6703 HD Wageningen, The Netherlands; e-mail of corresponding author: jaap. [email protected]
2Institute for Agricultural and Environmental Engineering, Wageningen, The Netherlands; e-mail: [email protected]
(Received 4 July 2000; accepted in revised form 20 February 2001; published online 24 April 2001)
The mass #ow of fertilizer spreaders must be calibrated for the di!erent types of fertilizers used. To obtainaccurate fertilizer application manual calibration of actual mass #ow must be repeated frequently. Automaticcalibration is possible by measurement of the actual mass #ow, based on dynamic weighing of the spreader. Thispaper describes the design and test of a dynamic weighing system. Under "eld conditions, this system was ableto provide force due to spreader weight readings that have a standard deviation of 20 N, over a measurementrange of 6}20 kN, at a maximum time delay of 1 s.
Time-stamped data logging of the spreader weight and the theoretical application rate combined withposition information allows determination of the realized spatial application of fertilizer. A comparison can bemade between realized and prescribed application rates. This information is necessary for evaluation of fertilizermanagement in a precision agriculture farming system and to accurately target fertilizer application to crop andsoil status.
( 2001 Silsoe Research Institute
1. Introduction
Application of mineral fertilizer in a precision agricul-ture system is focussed on site-speci"c crop requirementsand is based on the estimated crop}soil}weather interac-tions. To address spatial variability of available nutrientsin the soil, three functional requirements for site-speci"cfertilizer spreading can be formulated:
(1) the prescribed application rate must be varied fordi!erent locations in a "eld;
(2) the prescribed application rate must be realizedthrough a correct setpoint mass #ow; and
(3) the obtained mass #ow has to be precisely distrib-uted.
For granular fertilizers, this means that the spreadingtechnique must be able to vary the application rate ata scale corresponding to the variations in crop and soil.Application rate errors due to mass #ow deviations in thespreader have to be minimized and the realized spatialapplication rate must be reported to the management
021-8634/01/090025#11 $35.00/0 25
system to analyse site-speci"c crop response and toadjust future applications within a growing season.
Mass #ow determination of fertilizer spreaders isneeded to calibrate the #ow control device for di!erenttypes of fertilizers with di!erent physical properties(Hofstee and Huisman, 1990). Due to hygroscopic prop-erties of fertilizers even the calibration for a single typeof fertilizer might di!er during spreading. The #ow con-trol device on a spreader is equipped with a sensormeasuring either the aperture of a valve or the rotationalspeed of studded roller feeders, depending on the type ofdevice used. The information based on this sensor iscalled theoretical mass #ow and is determined by thecalibration currently used for the #ow control device.Conventional calibration is carried out by collection ofa small sample of about 25 kg out of the fertilizerspreader during a test run. This sample is weighed andcompared with the theoretically applied amount andyields a new calibration valid for the current fertilizerconditions. To reduce application rate errors, severalmanufacturers mount load cells in the spreaders to
( 2001 Silsoe Research Institute
J. VAN BERGEIJK E¹ A¸ .26
monitor the applied amount of fertilizer. The semi-auto-matic way to calibrate these type of spreaders is to weighthe loaded and unloaded spreaders when stationary ona level surface. The measured load di!erence must beequal to the theoretically spread amount of fertilizerduring the period between two weighing operations. Ifa di!erence occurs, the calibration is adjusted. This calib-ration method is an improvement over the manualmethod because of the larger measurement range on theactual #ow characteristics and because it is less labourand time consuming.
A next step is a continuous measurement of thespreader weight. Contrary to conventional weightmeasurement, where the load has to remain static duringthe measurement, this method is called dynamic weigh-ing. Dynamic weighing of the fertilizer spreader enablesautomatic calibration of the #ow control device duringfertilizer application. In this paper, the design and resultsof a dynamic weighing system are discussed in the con-text of automated calibration of the #ow control device.Furthermore, the addition of a positioning device anda datalogger to create a report of the applied amount offertilizer is discussed.
2. Objectives
The implementation of an automatic calibration algo-rithm for a #ow-control device requires an accurate andreliable weight measurement system. Disturbances due touneven terrain, mechanical vibrations of tractor andspreader, and the operation of the spreader on slopesmust be compensated or suppressed. The "rst objectivetherefore is to design a dynamic weighing system suitablefor operation under "eld conditions in agriculture.
The second objective is the automatic calibration ofthe mass #ow control mechanism of a granular fertilizerspreader. In order to do this, the driving speed ande!ective working width also must be known with su$-cient accuracy. In this research, the working width isspeci"ed by the type of spreader used and driving speed issupplied by an integrated &position}speed}heading' sys-tem on the tractor (van Bergeijk et al., 1998).
The third and last objective is to store both theoreticalapplication rate and weight measurements duringspreading to be able to reconstruct the actual appliedamount of fertilizer.
3. Literature review
Several methods for weight measurement of imple-ments in the three-point hitch already exist. Separatederricks or weighing frames used to weigh silage hand-
ling implements or livestock carriers are available forstatic weighing (Knechtges, 1988). These frames aremounted between the tractor three-point hitch and thestandard implement. Though the design is a versatilesolution, the major drawbacks regarding dynamic weigh-ing are the displacement of the implement away from thetractor and the static weight reading restriction. A morerigid design resulted in a derrick suitable for dynamic usewhich has been released on the market (Lely, 1993).
Integration of dynamic weighing in the tractor, orimplement itself, o!ers a more compact solution. On thetractor, it is possible to measure forces at di!erent posi-tions in the three-point hitch system (Auernhammeret al., 1988, 1990; van den Heuvel & van Meeteren, 1991).They conclude that implement weighing by measurementof forces in the three-point hitch is technically feasiblebut, in practice, disturbed by di!erent hitch geometries.At the implement attachment point side, experimentswith three extended octagonal sensors at the individualthree points of the hitch resulted in measurement errorsof 2% on a force range of 6}20 kN (van Noort, 1995).
Under "eld conditions, in addition to deviations due tovertical accelerations, vibrations due to engine, powertake-o! and implement shaft rotations, and deviationsdue to operation on slope also have to be compensated.Inclination sensors can be used to determine slope angleand are used, for instance, on combine harvesters to levelthe sieves. Vertical accelerations can be measured by anacceleration sensor. When no separate information oninclination or vertical acceleration is needed, both sen-sors can be replaced by a single sensor which measuresa reference weight mounted parallel to the unknownweight (BoK ttinger, 1989). Both disturbances due to accel-erations and slopes can be compensated for, based on theinformation provided by the reference weight sensor.
4. Materials and methods
4.1. Spreader
A standard pneumatic spreader (Amazone Jet 1504)with a working width of 12m is used in the experiments.Three characteristics which make a pneumatic spreadersuitable for precise application of fertilizer are the rela-tively small e!ective working width, the rapidly adjust-able rate and the small application pattern size in thedriving direction. The application rate of the spreader issteered by adjustment of the oil #ow through a hydraulicmotor. The hydraulic motor drives two separate studdedroller feeders for the left and right side of the spreader.The rotational speed of the roller feeders is measured byan inductive switch near one of the axles and enters thedata acquisition system as a pulse frequency. This pulse
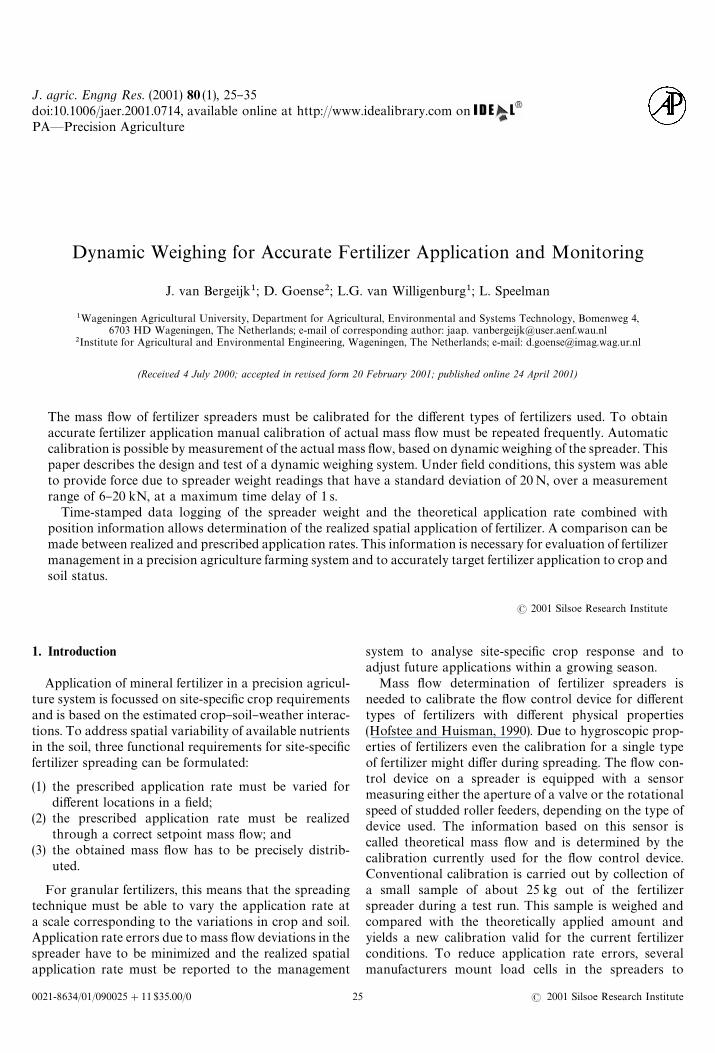
Fig. 1. Construction view of weighing subframe in front ofspreader assembly
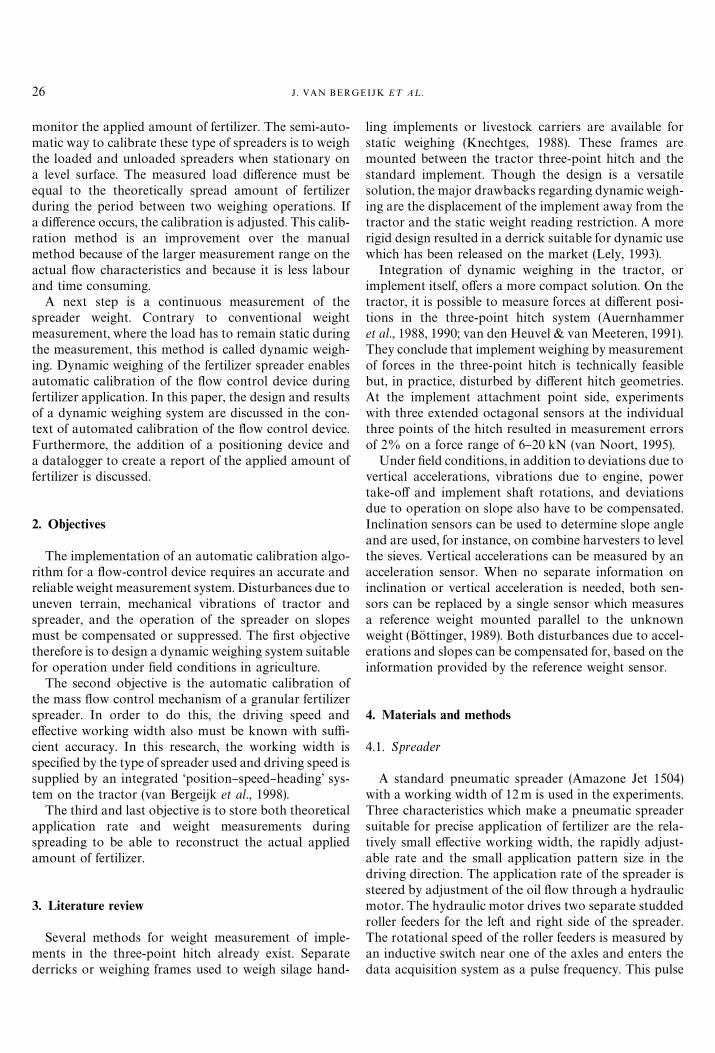
Fig. 2. Schematic view of the load sensor mounting positions
27ACCURATE FERTILIZER APPLICATION
frequency has a linear relation to theoretical mass #ow,i.e. the calibration for this type of #ow control device isa single gain factor. The spreader is divided into foursections of 3 m width each. These sections can be openedor closed individually by an electrically operated coup-ling mechanism between the studded roller feeders andthe hydraulic motor. The force due to the weight of thespreader itself is approximately 6 kN and that due to themaximum additional fertilizer load is 12 kN.
4.2. Sensor mounting
The original hitch studs of the spreader were replacedby three spring blades on a triangular subframe.Figures 1 and 2 illustrate the use of three spring blades,one at the top middle position of the subframe and two atthe lower sides, to construct a reversed parallellogram.The subframe has mounting positions for two straingauge force sensors. The vertical forces of the entirespreader act on the main sensor while the horizontalforces run parallel through the spring blades. The refer-ence sensor measures a known weight. The mountingorientation of the reference sensor is similar to the mainsensor to ensure that both sensors are a!ected by thesame disturbances. Two strain gauge sensors, each withdi!erent dynamic behaviour, were tested as referencesensor. On the "rst reference sensor (referred to as &refer-ence sensor I'), a static force of 1)776N was applied. Onthe second reference sensor (referred to as &reference sen-sor II'), a static force of 38)40N was applied. Table 1 liststhe speci"cations of the sensors used in the experiments.
4.3. Data acquisition
Two di!erent data acquisition systems for the straingauge sensors were examined. The "rst method consistedof a strain gauge ampli"er connected through a low pass"lter to an analogue to digital conversion card in a per-sonal computer system. Though the quality of theindividual data acquisition components was high an al-ternative was needed to minimize the number of noisesources in the weighing system. The second data acquisi-tion method therefore uses a single integrated circuitdirectly connected to the strain gauge sensor. ThisAD7715 integrated circuit combines an ampli"er, a lowpass "lter and a sigma delta analogue to digital conver-sion in a single package. To connect the spreader weightsensor and the reference sensor to the data acquisitionsystem, two AD7715 integrated circuits were used. Thedigitized sensor readings were time stamped and storedon a hard disc together with the studded roller speedsensor readings.
4.4. Experimental procedure
Several characteristics of the strain gauge sensors wereinvestigated. Before mounting the reference sensor on thespreader, resonance frequency, temperature in#uence,linearity and hysteresis were determined. Of the mainforce sensor only the temperature in#uence was mea-sured before mounting. Linearity and hysteresis weretested by applying calibrated loads on the pneumaticspreader while it was "xed in the three-point hitch ofa tractor. Deviations due to spreader operation in hillyterrain, were simulated by an adjustment of the top linkof the three-point hitch.
Next to these static calibration series dynamicmeasurements with various loads in the spreader werecarried out. These experiments consisted of bothmeasurements while driving with a known load on a roadwith tra$c obstacles and of measurements acquired dur-ing fertilizer spreading on a 6 ha "eld. The results of thedynamic measurements were used to implement a "lter
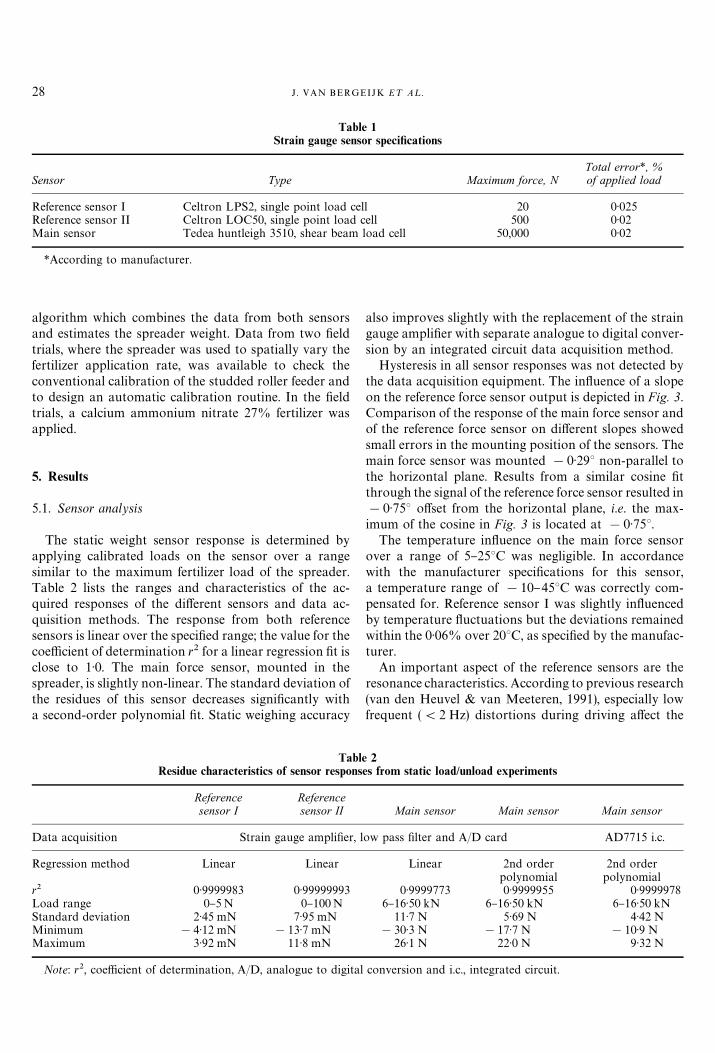
Table 1Strain gauge sensor speci5cations
Sensor Type Maximum force, NTotal error*, %of applied load
Reference sensor I Celtron LPS2, single point load cell 20 0)025Reference sensor II Celtron LOC50, single point load cell 500 0)02Main sensor Tedea huntleigh 3510, shear beam load cell 50,000 0)02
*According to manufacturer.
J. VAN BERGEIJK E¹ A¸ .28
algorithm which combines the data from both sensorsand estimates the spreader weight. Data from two "eldtrials, where the spreader was used to spatially vary thefertilizer application rate, was available to check theconventional calibration of the studded roller feeder andto design an automatic calibration routine. In the "eldtrials, a calcium ammonium nitrate 27% fertilizer wasapplied.
5. Results
5.1. Sensor analysis
The static weight sensor response is determined byapplying calibrated loads on the sensor over a rangesimilar to the maximum fertilizer load of the spreader.Table 2 lists the ranges and characteristics of the ac-quired responses of the di!erent sensors and data ac-quisition methods. The response from both referencesensors is linear over the speci"ed range; the value for thecoe$cient of determination r2 for a linear regression "t isclose to 1)0. The main force sensor, mounted in thespreader, is slightly non-linear. The standard deviation ofthe residues of this sensor decreases signi"cantly witha second-order polynomial "t. Static weighing accuracy
TablResidue characteristics of sensor respons
Reference Referencesensor I sensor II
Data acquisition Strain gauge ampli"er,
Regression method Linear Linear
r2 0)9999983 0)99999993Load range 0}5N 0}100NStandard deviation 2)45 mN 7)95 mNMinimum !4)12 mN !13)7 mNMaximum 3)92 mN 11)8 mN
Note: r2, coe$cient of determination, A/D, analogue to digita
also improves slightly with the replacement of the straingauge ampli"er with separate analogue to digital conver-sion by an integrated circuit data acquisition method.
Hysteresis in all sensor responses was not detected bythe data acquisition equipment. The in#uence of a slopeon the reference force sensor output is depicted in Fig. 3.Comparison of the response of the main force sensor andof the reference force sensor on di!erent slopes showedsmall errors in the mounting position of the sensors. Themain force sensor was mounted !0)293 non-parallel tothe horizontal plane. Results from a similar cosine "tthrough the signal of the reference force sensor resulted in!0)753 o!set from the horizontal plane, i.e. the max-imum of the cosine in Fig. 3 is located at !0)753.
The temperature in#uence on the main force sensorover a range of 5}253C was negligible. In accordancewith the manufacturer speci"cations for this sensor,a temperature range of !10}453C was correctly com-pensated for. Reference sensor I was slightly in#uencedby temperature #uctuations but the deviations remainedwithin the 0)06% over 203C, as speci"ed by the manufac-turer.
An important aspect of the reference sensors are theresonance characteristics. According to previous research(van den Heuvel & van Meeteren, 1991), especially lowfrequent ((2 Hz) distortions during driving a!ect the
e 2es from static load/unload experiments
Main sensor Main sensor Main sensor
low pass "lter and A/D card AD7715 i.c.
Linear 2nd orderpolynomial
2nd orderpolynomial
0)9999773 0)9999955 0)99999786}16)50 kN 6}16)50 kN 6}16)50 kN
11)7 N 5)69 N 4)42 N!30)3 N !17)7 N !10)9 N
26)1 N 22)0 N 9)32 N
l conversion and i.c., integrated circuit.
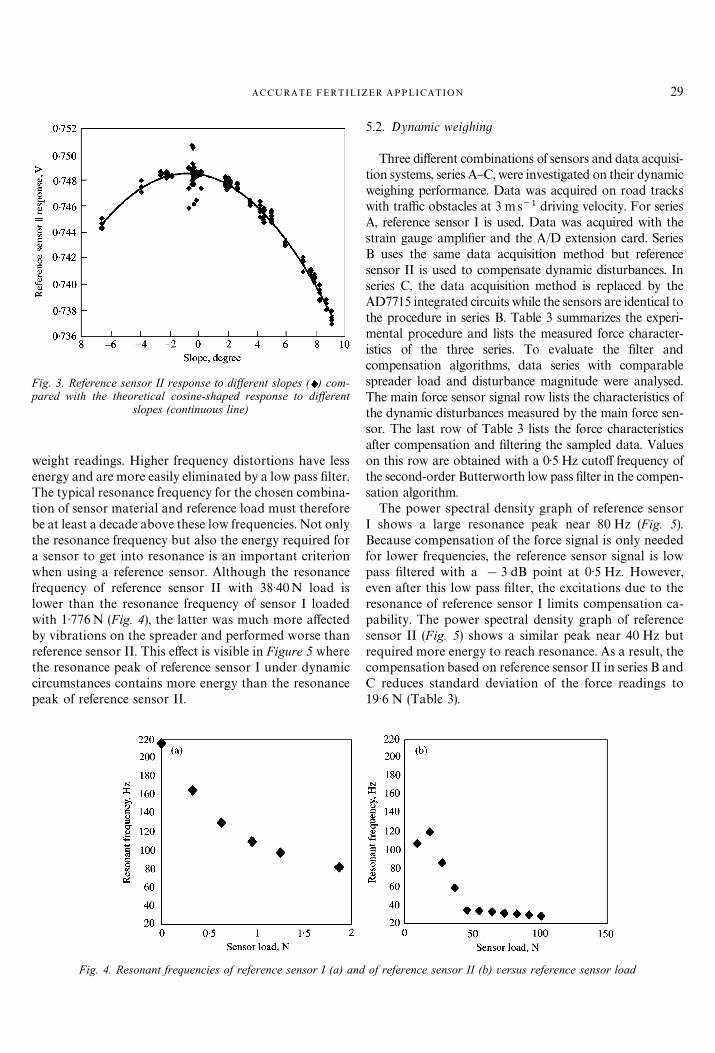
Fig. 3. Reference sensor II response to diwerent slopes ( ) com-pared with the theoretical cosine-shaped response to diwerent
slopes (continuous line)
29ACCURATE FERTILIZER APPLICATION
weight readings. Higher frequency distortions have lessenergy and are more easily eliminated by a low pass "lter.The typical resonance frequency for the chosen combina-tion of sensor material and reference load must thereforebe at least a decade above these low frequencies. Not onlythe resonance frequency but also the energy required fora sensor to get into resonance is an important criterionwhen using a reference sensor. Although the resonancefrequency of reference sensor II with 38)40N load islower than the resonance frequency of sensor I loadedwith 1)776N (Fig. 4), the latter was much more a!ectedby vibrations on the spreader and performed worse thanreference sensor II. This e!ect is visible in Figure 5 wherethe resonance peak of reference sensor I under dynamiccircumstances contains more energy than the resonancepeak of reference sensor II.
Fig. 4. Resonant frequencies of reference sensor I (a) and
5.2. Dynamic weighing
Three di!erent combinations of sensors and data acquisi-tion systems, series A}C, were investigated on their dynamicweighing performance. Data was acquired on road trackswith tra$c obstacles at 3 ms~1 driving velocity. For seriesA, reference sensor I is used. Data was acquired with thestrain gauge ampli"er and the A/D extension card. SeriesB uses the same data acquisition method but referencesensor II is used to compensate dynamic disturbances. Inseries C, the data acquisition method is replaced by theAD7715 integrated circuits while the sensors are identical tothe procedure in series B. Table 3 summarizes the experi-mental procedure and lists the measured force character-istics of the three series. To evaluate the "lter andcompensation algorithms, data series with comparablespreader load and disturbance magnitude were analysed.The main force sensor signal row lists the characteristics ofthe dynamic disturbances measured by the main force sen-sor. The last row of Table 3 lists the force characteristicsafter compensation and "ltering the sampled data. Valueson this row are obtained with a 0)5 Hz cuto! frequency ofthe second-order Butterworth low pass "lter in the compen-sation algorithm.
The power spectral density graph of reference sensorI shows a large resonance peak near 80 Hz (Fig. 5).Because compensation of the force signal is only neededfor lower frequencies, the reference sensor signal is lowpass "ltered with a !3 dB point at 0)5 Hz. However,even after this low pass "lter, the excitations due to theresonance of reference sensor I limits compensation ca-pability. The power spectral density graph of referencesensor II (Fig. 5) shows a similar peak near 40 Hz butrequired more energy to reach resonance. As a result, thecompensation based on reference sensor II in series B andC reduces standard deviation of the force readings to19)6 N (Table 3).
of reference sensor II (b) versus reference sensor load
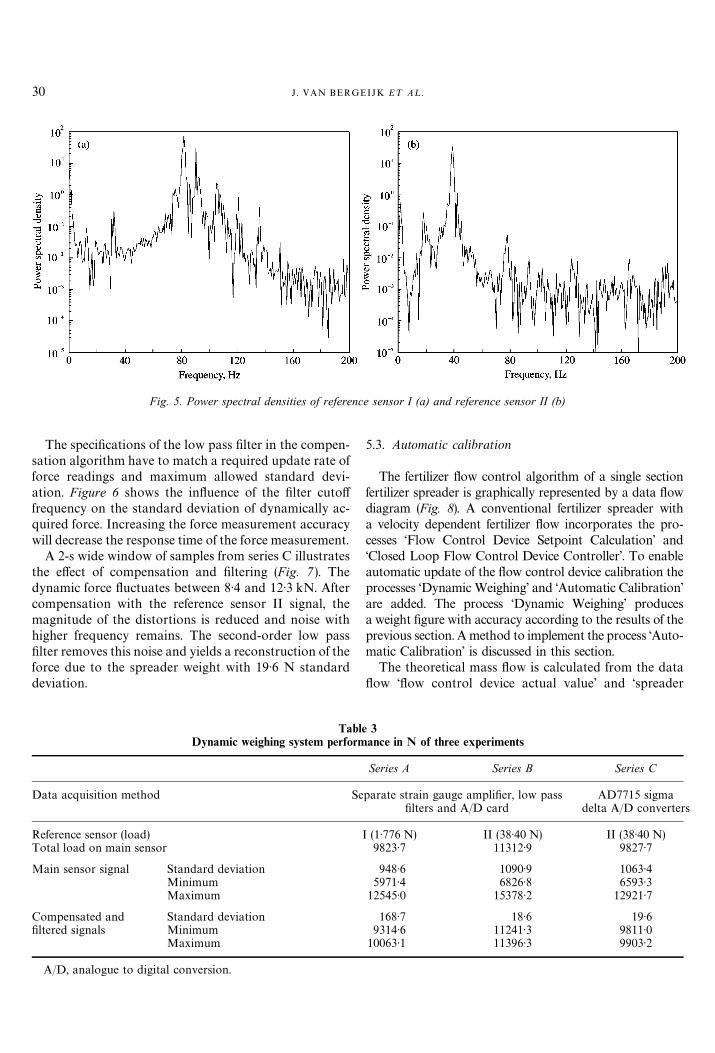
Fig. 5. Power spectral densities of reference sensor I (a) and reference sensor II (b)
J. VAN BERGEIJK E¹ A¸ .30
The speci"cations of the low pass "lter in the compen-sation algorithm have to match a required update rate offorce readings and maximum allowed standard devi-ation. Figure 6 shows the in#uence of the "lter cuto!frequency on the standard deviation of dynamically ac-quired force. Increasing the force measurement accuracywill decrease the response time of the force measurement.
A 2-s wide window of samples from series C illustratesthe e!ect of compensation and "ltering (Fig. 7 ). Thedynamic force #uctuates between 8)4 and 12)3 kN. Aftercompensation with the reference sensor II signal, themagnitude of the distortions is reduced and noise withhigher frequency remains. The second-order low pass"lter removes this noise and yields a reconstruction of theforce due to the spreader weight with 19)6 N standarddeviation.
TablDynamic weighing system perform
Data acquisition method Se
Reference sensor (load)Total load on main sensor
Main sensor signal Standard deviationMinimumMaximum
Compensated and"ltered signals
Standard deviationMinimumMaximum
A/D, analogue to digital conversion.
5.3. Automatic calibration
The fertilizer #ow control algorithm of a single sectionfertilizer spreader is graphically represented by a data #owdiagram (Fig. 8). A conventional fertilizer spreader witha velocity dependent fertilizer #ow incorporates the pro-cesses &Flow Control Device Setpoint Calculation' and&Closed Loop Flow Control Device Controller'. To enableautomatic update of the #ow control device calibration theprocesses &Dynamic Weighing' and &Automatic Calibration'are added. The process &Dynamic Weighing' producesa weight "gure with accuracy according to the results of theprevious section. A method to implement the process &Auto-matic Calibration' is discussed in this section.
The theoretical mass #ow is calculated from the data#ow &#ow control device actual value' and &spreader
e 3ance in N of three experiments
Series A Series B Series C
parate strain gauge ampli"er, low pass"lters and A/D card
AD7715 sigmadelta A/D converters
I (1)776 N) II (38)40 N) II (38)40 N)9823)7 11312)9 9827)7
948)65971)4
12545)0
1090)96826)8
15378)2
1063)46593)3
12921)7
168)79314)6
10063)1
18)611241)311396)3
19)69811)09903)2
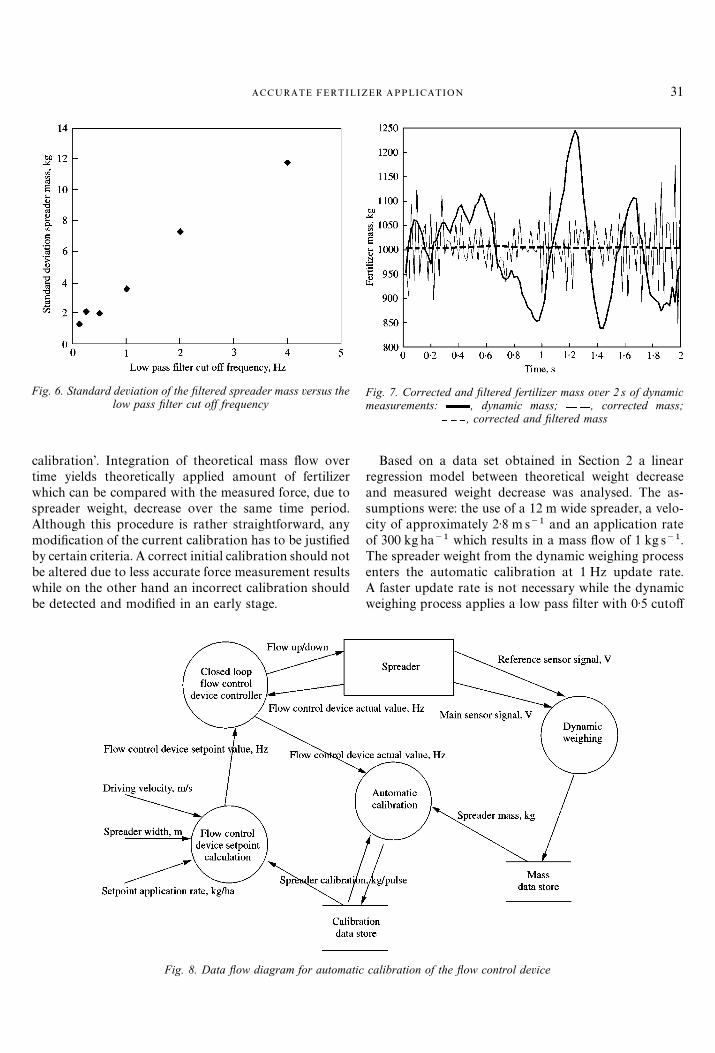
Fig. 6. Standard deviation of the xltered spreader mass versus thelow pass xlter cut ow frequency
Fig. 7. Corrected and xltered fertilizer mass over 2 s of dynamicmeasurements: , dynamic mass; , corrected mass;
, corrected and xltered mass
31ACCURATE FERTILIZER APPLICATION
calibration'. Integration of theoretical mass #ow overtime yields theoretically applied amount of fertilizerwhich can be compared with the measured force, due tospreader weight, decrease over the same time period.Although this procedure is rather straightforward, anymodi"cation of the current calibration has to be justi"edby certain criteria. A correct initial calibration should notbe altered due to less accurate force measurement resultswhile on the other hand an incorrect calibration shouldbe detected and modi"ed in an early stage.
Fig. 8. Data yow diagram for automatic
Based on a data set obtained in Section 2 a linearregression model between theoretical weight decreaseand measured weight decrease was analysed. The as-sumptions were: the use of a 12 m wide spreader, a velo-city of approximately 2)8 m s~1 and an application rateof 300 kg ha~1 which results in a mass #ow of 1 kg s~1.The spreader weight from the dynamic weighing processenters the automatic calibration at 1 Hz update rate.A faster update rate is not necessary while the dynamicweighing process applies a low pass "lter with 0)5 cuto!
calibration of the yow control device
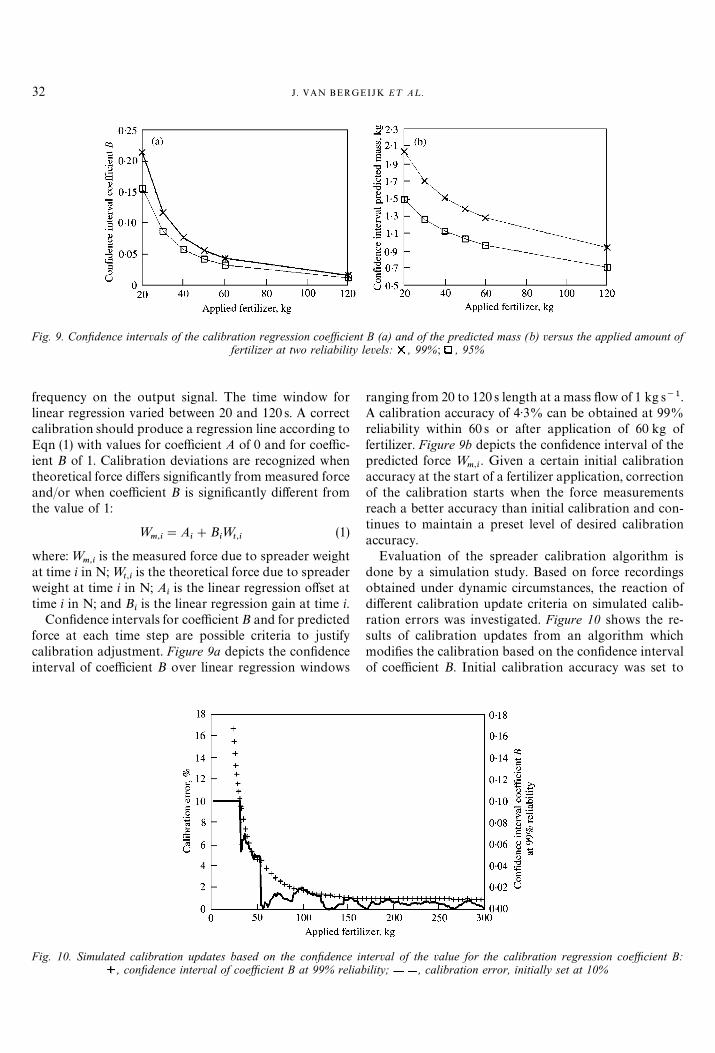
Fig. 9. Conxdence intervals of the calibration regression coezcient B (a) and of the predicted mass (b) versus the applied amount offertilizer at two reliability levels: , 99% ; , 95%
J. VAN BERGEIJK E¹ A¸ .32
frequency on the output signal. The time window forlinear regression varied between 20 and 120 s. A correctcalibration should produce a regression line according toEqn (1) with values for coe$cient A of 0 and for coe$c-ient B of 1. Calibration deviations are recognized whentheoretical force di!ers signi"cantly from measured forceand/or when coe$cient B is signi"cantly di!erent fromthe value of 1:
=m,i
"Ai#B
i=
t,i(1)
where:=m,i
is the measured force due to spreader weightat time i in N;=
t,iis the theoretical force due to spreader
weight at time i in N; Aiis the linear regression o!set at
time i in N; and Biis the linear regression gain at time i.
Con"dence intervals for coe$cient B and for predictedforce at each time step are possible criteria to justifycalibration adjustment. Figure 9a depicts the con"denceinterval of coe$cient B over linear regression windows
Fig. 10. Simulated calibration updates based on the conxdence i, conxdence interval of coezcient B at 99% relia
ranging from 20 to 120 s length at a mass #ow of 1 kg s~1.A calibration accuracy of 4)3% can be obtained at 99%reliability within 60 s or after application of 60 kg offertilizer. Figure 9b depicts the con"dence interval of thepredicted force =
m,i. Given a certain initial calibration
accuracy at the start of a fertilizer application, correctionof the calibration starts when the force measurementsreach a better accuracy than initial calibration and con-tinues to maintain a preset level of desired calibrationaccuracy.
Evaluation of the spreader calibration algorithm isdone by a simulation study. Based on force recordingsobtained under dynamic circumstances, the reaction ofdi!erent calibration update criteria on simulated calib-ration errors was investigated. Figure 10 shows the re-sults of calibration updates from an algorithm whichmodi"es the calibration based on the con"dence intervalof coe$cient B. Initial calibration accuracy was set to
nterval of the value for the calibration regression coezcient B:bility; , calibration error, initially set at 10%
33ACCURATE FERTILIZER APPLICATION
10% and the calibration accuracy goal is 1%. The dataset covers a fertilizer application range from 1000 kgdown to 0 kg at a constant mass #ow of 1 kg s~1.
The con"dence interval for the linear regression coef-"cient B at 99% reliability reaches an accuracy of 10%after application of 30 kg of fertilizer. The calibration,initially set at a 10% error value, is then modi"ed. Atincreased applied fertilizer mass, the calibration accuracyincreases until a 1% accuracy at 99% reliability forcoe$cient B is reached. The calibration error is alreadyclose to 0% after application of 60 kg fertilizer but onlyafter application of approximately 160 kg of fertilizera 1% accuracy at 99% reliability is obtained.
During the application of the "rst 160 kg of fertilizerthe linear regression window enlarges and comprises allweight samples available. The regression window is keptat a size needed to maintain the same accuracy after theaccuracy goal is reached. Although accuracy might im-prove by further enlargement of the regression window,a quick response to calibration changes is also needed.This implies a regression window which is as small asallowed by the accuracy criterion and which depends onthe actual dynamic weighing accuracy.
5.4. ¹ime-stamped data logging
To record the applied amount of fertilizer the followingsystem components were added to the tractor} spreadercombination:
(1) positional information system;(2) map-based information on prescribed fertilizer
application rates;(3) dynamic weighing of the fertilizer amount in the
spreader bin; and
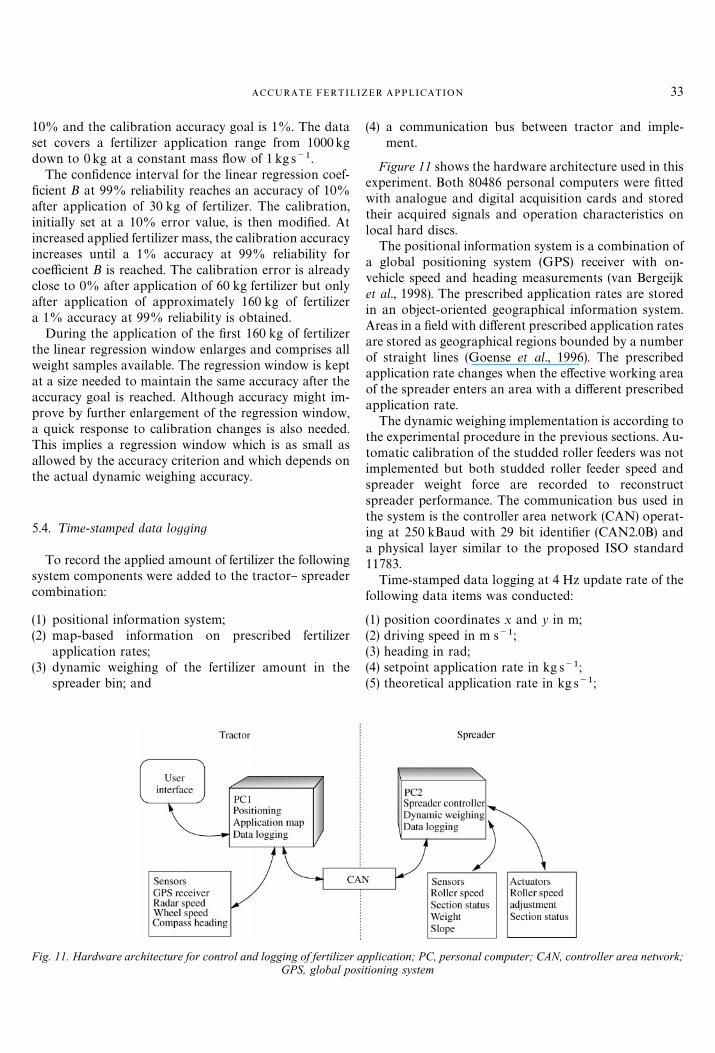
Fig. 11. Hardware architecture for control and logging of fertilizer aGPS, global pos
(4) a communication bus between tractor and imple-ment.
Figure 11 shows the hardware architecture used in thisexperiment. Both 80486 personal computers were "ttedwith analogue and digital acquisition cards and storedtheir acquired signals and operation characteristics onlocal hard discs.
The positional information system is a combination ofa global positioning system (GPS) receiver with on-vehicle speed and heading measurements (van Bergeijket al., 1998). The prescribed application rates are storedin an object-oriented geographical information system.Areas in a "eld with di!erent prescribed application ratesare stored as geographical regions bounded by a numberof straight lines (Goense et al., 1996). The prescribedapplication rate changes when the e!ective working areaof the spreader enters an area with a di!erent prescribedapplication rate.
The dynamic weighing implementation is according tothe experimental procedure in the previous sections. Au-tomatic calibration of the studded roller feeders was notimplemented but both studded roller feeder speed andspreader weight force are recorded to reconstructspreader performance. The communication bus used inthe system is the controller area network (CAN) operat-ing at 250 kBaud with 29 bit identi"er (CAN2.0B) anda physical layer similar to the proposed ISO standard11783.
Time-stamped data logging at 4 Hz update rate of thefollowing data items was conducted:
(1) position coordinates x and y in m;(2) driving speed in m s~1;(3) heading in rad;(4) setpoint application rate in kg s~1;(5) theoretical application rate in kg s~1;
pplication; PC, personal computer; CAN, controller area network;itioning system
J. VAN BERGEIJK E¹ A¸ .34
(6) section status; and(7) spreader mass in kg.
With this information, reconstruction of the appliedamount of fertilizer at a scale equal to the e!ective work-ing width of the implement was carried out.
6. Discussion
The slightly non-linear response of the main forcesensor might be caused by bending of the weighing der-rick or by non-parallel mounted spring plates. In bothsituations, a small portion of the vertical forces is notmeasured by the force sensor. At increased load, a linearmodel for the main force sensor signal shows anincreased error and a reduced sensor response.
A previous version of spreader weight force determina-tion used three extended octagonal ring transducers atthe three hitch joints of the spreader. Advantages of thisapproach were mounting simplicity, the sensors basicallyjust replaced the hitch studs, and the opportunity tomeasure vertical and horizontal forces separately. Pro-cessing of these signals made it possible to reconstruct thegravity point of the spreader, the slope and true verticalforce due to spreader weight. However, individual errorson the sensors propagated through the required signalprocessing and a!ected overall accuracy negatively.Therefore a design based on a single force sensor, com-bined with a construction that eliminates the e!ect ofgravity point changes, was tested and proved to weighmore accurately.
Integration of required data acquisition and signalprocessing into a single integrated circuit and digitalsignal processor is an advantage especially in the direc-tion of practical implementation of the dynamic weighingsystem. Next, with a more compact implementation, ac-curacy slightly improved. One drawback of the use of anintegrated data acquisition method is the required hard-ware and software for the interface, which had to bedesigned speci"cally for our experiment set-up. Anotherdrawback of the use of an AD7715 integrated circuit isless #exibility in sample rate settings and low pass "ltermethods compared to the capabilities of an analoguedata acquisition card mounted in a personal computer.
Based on dynamic weighing, several #ow control de-vice calibration correction methods can be de"ned. Thefertilizer mass #ow is, in practice, not constant over timedue to changing application rates and #uctuations indriving speed. Both measured force and theoretical forceshould therefore not be compared as time series butrelated directly to each other. Even with #uctuations inmass #ow a linear regression between measured forceand theoretical force can be made.
Next to the con"dence interval for the values of coe$c-ient B, other criteria for calibration have to be checked.For predicted force=
m,i[Eqn (1)], a con"dence interval
might indicate signi"cant deviations between measuredforce and theoretical force. A reason for not using thiscriterion is that correction of the calibration entirelyrelies on the value for coe$cient B. Even when thepredicted force di!ers signi"cantly from theoretical force,an inaccurate or less reliable value for coe$cient B maynot be used to alter the calibration. Although the con"-dence intervals for both the coe$cient B and the pre-dicted force are closely related, a criterion based on thecoe$cient B con"dence interval could be used directly tomodify the calibration.
It is not desirable to compensate calibration errorsfrom areas already spread, by spreading more or less onareas that still have to be spread. Therefore, the value ofthe regression coe$cient A [Eqn (1)] cannot be used asa criterion for calibration updates. For example, if due toa calibration error, the theoretical force becomes higherthan the measured force, an update of the calibration willresult in a negative value for coe$cient A which revealsthat too little fertilizer was spread. When the goal of thecalibration update algorithm would be to minimize thevalue for coe$cient A, consequently too much fertilizerwould be spread in the time period that follows.
In a distributed data acquisition system used for timestamped data logging, synchronization of the data mustbe taken care of. While logging of most data is de"ned atthe relatively slow storage rate of 4 Hz the personalcomputer system timer (18)2 Hz) functions as time base.However, clock errors between both computers mightlead to timeshifts between log"les from di!erent com-puters. In order to avoid these errors, a high priorityCAN-message, repeated at 1 Hz, is used to distribute thetimer status of one computer to other data logging devi-ces on the network. In the experiment, the network loadwas low and excessive delays of the timer message duringtransmission on the network were not detected. A postprocessing algorithm calculates the time shift betweenthe two data acquisition platforms. Within a 5 h fertilizerapplication task the timeshift remained less than themeasurable 1/18)2 s.
7. Conclusions
Fertilizer application errors due to mass #ow calib-ration deviations can be reduced by spreader weightmeasurement during fertilizer application. The standarddeviation of static weight force measurement with a con-ventional pneumatic fertilizer spreader, equipped witha reversed parallel weighing derrick, was approxi-mately 8N over 10 kN load range. An integrated data
35ACCURATE FERTILIZER APPLICATION
acquisition method, speci"cally designed for load cellmeasurements, performed slightly better than the use ofa separate strain gauge ampli"er and data acquisitioncard.
A second, reference, load cell with "xed mass wasadded to the weighing derrick to compensate for theoperation on slopes and for the dynamic weight force#uctuations under "eld conditions. Compensation ofspreader weight by the reference sensor response devi-ations due to vertical accelerations worked especiallywell for deviations with a frequency in the range from$0)1 to 20 Hz. The combination of the reference loadcell with the "xed mass had to be chosen such that theresonance frequency is above the deviation frequenciesbeing compensated. The use of a reference load cellreduced standard deviation of dynamic weighing from1063 to 19)6N.
The #ow control device calibration can be monitoredand eventually modi"ed when accurate spreader weightmeasurements are available. Based on the dynamicweighing results, a calibration accuracy goal of 1% canbe maintained under "eld conditions. In a simulationstudy 1% calibration accuracy with 99% reliability wasobtained after application of 160 kg of fertilizer. An initialcalibration error of 5% was corrected after application of60 kg fertilizer, thus minimizing the application error toapproximately 3 kg.
For the reconstruction of actual applied amount offertilizer spreader weight, #ow control device status andpositional information must be logged against a certaintime base. When a separate system for position informa-tion is equipped with own data logging facilities, syn-chronization over an ISO compatible Controller AreaNetwork is su$ciently accurate for a data logging rate of4 Hz.
References
Auernhammer H; Demmel M; Stanzel H (1988). WiegemoK glich-keiten in dem Schlepperdreipunkthydraulik, [Weighing op-portunities in tractor hitch hydraulics]. Landtechnik, 43(10),414}419
Auernhammer H; Stanzel H; Demmel M (1990). WiegemoK glich-keiten im Schlepperheckkraftheber und in Transportfah-rzeugen, [Weighing opportunities in rear tractor hitch and intransport vehicles]. Landtechnik Weihenstephan. Freising,Germany
BoK ttinger S (1989). Durchsatzbestimmung fuK r eine Regelung derMaK hdresser-reinigungsanlage, [Flow measurement for con-trol of the combine harvester sieves], Proceedings of the 11thInternational Congress on Agricultural Engineering, Dublin.In: Land and Water Use (Dodd V A; Grace P M eds),Vol. 3 (Agricultural Mechanisation), pp 1857}1862.Balkema, Rotterdam
Goense D; Hofstee J W; van Bergeijk J (1996). An informationmodel to describe systems for spatially variable "eld opera-tions. Computers and Electronics in Agriculture, 14, 197}214
Hofstee J W; Huisman W (1990). Handling and spreading offertilizers, Part 1: Physical properties of fertilizer in relationto particle motion. Journal of Agricultural EngineeringResearch, 47, 213}234
Knechtges H (1988). BehaK lterwaK gung im Dreipunktanbau, [Im-plement weighing on three point hitch mounting]. Landtech-nik, 44(5), 218}219
Lely (1993). An implement for spreading material. EuropeanPatent Application 0537857A2. Netherlands
van Bergeijk J; Goense D; Keesman K J; Speelman L (1998).Digital "lters to integrate global positioning system and deadreckoning. Journal of Agricultural Engineering Research, 70,135}143
van den Heuvel C L H; van Meeteren C M A (1991). Dynamischegewichtsmeting voor de bewerking kunstmeststrooien, [Dy-namic weighing for fertilizer application]. MSc Thesis, Agri-cultural University,Wageningen
van Noort J (1995). On the improvement of actual applied ratesof fertilizer spreaders. MSc Thesis, Agricultural Univer-sity,Wageningen


