Embed Size (px)
Citation preview

Annual Report and Audited Financial Statements For the period from 14 November 2017 (date of registration) to 31 January 2019
Fidelity UCITS II ICAV
(An Irish collective asset-management vehicle constituted as an umbrella fund with segregated liability between sub-funds)

Fidelity UCITS II ICAV TABLE OF CONTENTS
Page GENERAL INFORMATION 2 INVESTMENT MANAGER’S REPORT 7 SCHEDULES OF INVESTMENTS: Fidelity MSCI Emerging Markets Index Fund 10 Fidelity MSCI Europe Index Fund 30 Fidelity MSCI Japan Index Fund 42 Fidelity MSCI Pacific ex-Japan Index Fund 49 Fidelity MSCI World Index Fund 54 Fidelity S&P 500 Index Fund 88 Fidelity Enhanced Reserve Fund 99 STATEMENT OF FINANCIAL POSITION 105 STATEMENT OF COMPREHENSIVE INCOME 109 STATEMENT OF CHANGES IN NET ASSETS ATTRIBUTABLE TO HOLDERS OF REDEEMABLE PARTICIPATING SHARES 111 STATEMENT OF CASH FLOWS 112 NOTES TO THE FINANCIAL STATEMENTS 114 DIRECTOR’S REPORT 149 REPORT FROM THE DEPOSITARY TO THE SHAREHOLDERS (UNAUDITED) 153 INDEPENDENT AUDITORS’ REPORT 154 DIRECTORY (UNAUDITED) 157 APPENDIX 1 - STATEMENT OF SIGNIFICANT CHANGES IN THE COMPOSITION OF PORTFOLIO (UNAUDITED) 158 APPENDIX 2 – REPORT OF REMUNERATION (UNAUDITED) 166 APPENDIX 3 – TRACKING ERROR (UNAUDITED) 167 APPENDIX 4 – SECURITIES FINANCING TRANSACTIONS (UNAUDITED) 168

Fidelity UCITS II ICAV GENERAL INFORMATION
Fidelity UCITS II ICAV (the “Fund”) was registered in Ireland pursuant to the Irish Collective Asset-management Vehicles Act 2015 (as amended) on 14 November 2017 under registration number C174793 and is authorised by the Central Bank of Ireland (the “Central Bank”) under the European Communities (Undertakings for Collective Investment in Transferable Securities) Regulations 2011 (as amended) (the “UCITS Regulations”). Except where the context otherwise requires, defined terms shall bear the meaning given to them in the Prospectus of the Fund. The Fund is organised in the form of an umbrella fund with segregated liability between sub-funds. The Prospectus provides that the Fund may offer separate sub-funds. Each sub-fund will have a distinct schedule of investments. Currently there are 20 sub-funds under the umbrella. The financial statements are prepared for the below 7* Sub-Funds for which the fiscal year end is 31 January (each, a “Sub-Fund” and, collectively, the “Sub-Funds”): Sub-Fund Launch Date Fidelity MSCI Emerging Markets Index Fund 20 March 2018 Fidelity MSCI Europe Index Fund 20 March 2018 Fidelity MSCI Japan Index Fund 20 March 2018 Fidelity MSCI Pacific ex-Japan Index Fund 20 March 2018 Fidelity MSCI World Index Fund 20 March 2018 Fidelity S&P 500 Index Fund 20 March 2018 Fidelity Enhanced Reserve Fund 26 March 2018 *There are two other Index Tracking Sub-Funds of the Fund in existence, but they have not been launched as at the period end. 31 January 2019 is the first annual reporting cycle of the Fund therefore there are no comparatives in the financial statements. With the prior approval of the Central Bank, the Fund from time to time may create an additional Sub-Fund or Sub-Funds, the investment policies and objectives for which will be outlined in a Relevant Supplement, together with details of the initial offer period, the initial subscription price for each Share and such other relevant information in relation to the additional Sub-Fund or Sub-Funds as the Directors may deem appropriate, or the Central Bank requires, to be included. Each Relevant Supplement will form part of, and should be read in conjunction with, the Prospectus. In addition, the Fund may create additional Classes of Shares within a Sub-Fund to accommodate different terms, including different charges and/or fees and/or brokerage arrangements provided that the Central Bank is notified in advance, and gives prior clearance, of the creation of any such additional Class of Shares. The most recent Prospectus of the Fund is dated 15 March 2019. The most recent Supplements for the Sub-Funds launched as at the period end are dated 15 March 2019. The following Sub-Funds are the launched Index Tracking Sub-Funds: Fidelity MSCI Emerging Markets Index Fund, Fidelity MSCI Europe Index Fund, Fidelity Japan Index Fund, Fidelity MSCI Pacific ex-Japan Index Fund, Fidelity MSCI World Index Fund and Fidelity S&P 500 Index Fund. Fidelity Enhanced Reserve is an Actively Managed Sub-Fund. The benchmark indices for the Index Tracking Sub-Funds launched as at the period end are listed below: Sub-Fund Index Fidelity MSCI Emerging Markets Index Fund MSCI Emerging Markets Index Fidelity MSCI Europe Index Fund MSCI Europe Index Fidelity MSCI Japan Index Fund MSCI Japan Index Fidelity MSCI Pacific ex-Japan Index Fund MSCI Pacific ex-Japan Index Fidelity MSCI World Index Fund MSCI World Index Fidelity S&P 500 Index Fund S&P 500 Index The investment objective of the Index Tracking Sub-Funds is to provide investors with a total return, taking into account both capital and income returns, which reflects, before fees and expenses, the return of the relevant index (each, an “Index”). The investment objective of the Fidelity Enhanced Reserve Fund is to provide an attractive level of risk adjusted total return (income plus capital appreciation) from a portfolio of debt securities issued worldwide.
2

Fidelity UCITS II ICAV GENERAL INFORMATION (CONTINUED)
Fidelity MSCI Emerging Markets Index Fund The MSCI Emerging Markets Index is designed to reflect the performance of large and mid-capitalisation companies across emerging market countries which comply with MSCI's size, liquidity and free float criteria. These criteria are designed to identify those companies whose securities make up 85% of the publically traded market (i.e., the large and mid-capitalisation companies). Full details of the criteria are available on the Index provider’s website at https://www.msci.com/index-methodology. The investment objective of the Sub-Fund is to track the performance of the Index as closely as possible, regardless of whether the Index level rises or falls, while seeking to minimise as far as possible the tracking error between the Sub-Fund’s performance and that of the Index. In order to seek to achieve this investment objective, Geode Capital Management LLC (the “Investment Manager”) will aim to replicate the Index by holding all of the Index securities in a similar proportion to their weighting in the Index. However, where full replication of the Index is not reasonably practical (for example as a result of the number of securities or the illiquidity of certain securities within the Index), the Sub-Fund will use optimisation to select the Index securities in order to build a representative portfolio that provides a return that is comparable to that of the Index. The following are the active Share Classes in the Sub-Fund as at 31 January 2019: Share Class Share Class Launch Date Currency P EUR Acc 20 March 2018 EUR P USD Acc 20 March 2018 USD Fidelity MSCI Europe Index Fund The MSCI Europe Index is designed to reflect the performance of large and mid-capitalisation companies across developed market countries in Europe which comply with MSCI's size, liquidity and free float criteria. These criteria are designed to identify those companies whose securities make up 85% of the publically traded market (i.e., the large and mid-capitalisation companies). Full details of the criteria are available on the Index provider’s website at https://www.msci.com/index-methodology. The investment objective of the Sub-Fund is to track the performance of the Index as closely as possible, regardless of whether the Index level rises or falls, while seeking to minimise as far as possible the tracking error between the Sub-Fund’s performance and that of the Index. In order to seek to achieve this investment objective, the Investment Manager will aim to replicate the Index by holding all of the the index securities in a similar proportion to their weighting in the Index. However, where full replication of the Index is not reasonably practical (for example as a result of the number of securities or the illiquidity of certain securities within the Index), the Sub-Fund will use optimisation to select the Index securities in order to build a representative portfolio that provides a return that is comparable to that of the Index. The following are the active Share Classes in the Sub-Fund as at 31 January 2019: Share Class Share Class Launch Date Currency P EUR Acc 20 March 2018 EUR P USD Acc 20 March 2018 USD P EUR Hedged Acc 20 March 2018 EUR P GBP Hedged Acc 21 June 2018 GBP Fidelity MSCI Japan Index Fund The MSCI Japan Index is designed to reflect the performance of large and mid-capitalisation companies in Japan which comply with MSCI's size, liquidity and free float criteria. These criteria are designed to identify those companies whose securities make up 85% of the publically traded market (i.e., the large and mid-capitalisation companies). Full details of the criteria are available on the Index provider’s website at https://www.msci.com/index-methodology. The investment objective of the Sub-Fund is to track the performance of the Index as closely as possible, regardless of whether the Index level rises or falls, while seeking to minimise as far as possible the tracking error between the Sub-Fund’s performance and that of the Index.
3

Fidelity UCITS II ICAV GENERAL INFORMATION (CONTINUED)
Fidelity MSCI Japan Index Fund (continued) In order to seek to achieve this investment objective, the Investment Manager will aim to replicate the Index by holding all of the Index securities in a similar proportion to their weighting in the Index. However, where full replication of the Index is not reasonably practical (for example as a result of the number of securities or the illiquidity of certain securities within the Index), the Sub-Fund will use optimisation to select the Index securities in order to build a representative portfolio that provides a return that is comparable to that of the Index. The following are the active Share Classes in the Sub-Fund as at 31 January 2019: Share Class Share Class Launch Date Currency P EUR Acc 20 March 2018 EUR P USD Acc 20 March 2018 USD P EUR Hedged Acc 20 March 2018 EUR P GBP Hedged Acc 21 June 2018 GBP
Fidelity MSCI Pacific ex-Japan Index Fund The MSCI Pacific ex-Japan Index is designed to reflect the performance of large and mid-capitalisation companies across developed market countries in the Pacific region excluding Japan which comply with MSCI's size, liquidity and free float criteria. These criteria are designed to identify those companies whose securities make up 85% of the publically traded market (i.e., the large and mid-capitalisation companies). Full details of the criteria are available on the Index provider’s website at https://www.msci.com/index-methodology. The investment objective of the Sub-Fund is to track the performance of the Index as closely as possible, regardless of whether the Index level rises or falls, while seeking to minimise as far as possible the tracking error between the Sub-Fund’s performance and that of the Index. In order to seek to achieve this investment objective, the Investment Manager will aim to replicate the Index by holding all of the Index securities in a similar proportion to their weighting in the Index. However, where full replication of the Index is not reasonably practical (for example as a result of the number of securities or the illiquidity of certain securities within the Index), the Sub-Fund will use optimisation to select the Index securities in order to build a representative portfolio that provides a return that is comparable to that of the Index. The following are the active Share Classes in the Sub-Fund as at 31 January 2019: Share Class Share Class Launch Date Currency P USD Acc 20 March 2018 USD P GBP Hedged Acc 21 June 2018 GBP Fidelity MSCI World Index Fund The MSCI World Index is designed to reflect the performance of large and mid-capitalisation companies across developed market countries which comply with MSCI's size, liquidity and free float criteria. These criteria are designed to identify those companies whose securities make up 85% of the publically traded market (i.e., the large and mid-capitalisation companies). Full details of the criteria are available on the Index provider’s website at https://www.msci.com/index-methodology. The investment objective of the Sub-Fund is to track the performance of the Index as closely as possible, regardless of whether the Index level rises or falls, while seeking to minimise as far as possible the tracking error between the Sub-Fund’s performance and that of the Index. In order to seek to achieve this investment objective, the Investment Manager will aim to replicate the Index by holding all of the Index securities in a similar proportion to their weighting in the Index. However, where full replication of the Index is not reasonably practical (for example as a result of the number of securities or the illiquidity of certain securities within the Index), the Sub-Fund will use optimisation to select the Index securities in order to build a representative portfolio that provides a return that is comparable to that of the Index.
4

Fidelity UCITS II ICAV GENERAL INFORMATION (CONTINUED)
Fidelity MSCI World Index Fund (continued) The following are the active Share Classes in the Sub-Fund as at 31 January 2019: Share Class Share Class Launch Date Currency P EUR Acc 20 March 2018 EUR P USD Acc 20 March 2018 USD P EUR Hedged Acc 20 March 2018 EUR P GBP Hedged Acc 21 June 2018 GBP P CZK Hedged Acc 14 January 2019 CZK
Fidelity S&P 500 Index Fund The S&P 500 Index measures the performance of 500 stocks from top US companies in leading industries of the US economy which comply with S&P’s size, liquidity and free-float criteria. These criteria are designed to identify those companies whose securities make up 85% of the publically traded market (i.e., the large and mid-capitalisation companies). Full details of the criteria are available on the Index provider’s website at http://us.spindices.com/indices/equity/sp-500. The investment objective of the Sub-Fund is to track the performance of the Index as closely as possible, regardless of whether the Index level rises or falls, while seeking to minimise as far as possible the tracking error between the Sub-Fund’s performance and that of the Index. In order to seek to achieve this investment objective, the Investment Manager will aim to replicate the Index by holding all of the Index securities in a similar proportion to their weighting in the Index. However, where full replication of the Index is not reasonably practical (for example as a result of the number of securities or the illiquidity of certain securities within the Index), the Sub-Fund will use optimisation to select the Index securities in order to build a representative portfolio that provides a return that is comparable to that of the Index. The following are the active Share Classes in the Sub-Fund as at 31 January 2019: Share Class Share Class Launch Date Currency P EUR Acc 20 March 2018 EUR P USD Acc 20 March 2018 USD P EUR Hedged Acc 20 March 2018 EUR P GBP Hedged Acc 20 March 2018 GBP Fidelity Enhanced Reserve Fund The investment policy of the Sub-Fund is to invest primarily in a broad range of fixed income securities and money market instruments which are issued by governments of, government agencies or corporate issuers worldwide. The Sub-Fund may invest in such securities issued in both developed and emerging market countries. FIL Investment Management (Hong Kong) Limited (The “Investment Manager”) will not focus on any particular market sector or industry and investments may be in a number of sectors, including the financial services, industrials, and technology sectors. The Investment Manager will approach investment opportunities from a total return perspective, benefiting not only from the debt securities’ regular coupon payments but also from capital appreciation. The Investment Manager will seek to deliver attractive risk adjusted returns by extracting the highest level of return per unit of risk or minimising the risk for each unit of return.
5

Fidelity UCITS II ICAV GENERAL INFORMATION (CONTINUED)
Fidelity Enhanced Reserve Fund (continued) The following are the active Share Classes in the Sub-Fund as at 31 January 2019: Share Class Share Class Launch Date Currency A-ACC USD 26 March 2018 USD A-MDIST(G) USD 26 March 2018 USD A-MDIST(G) SGD Hedged 26 March 2018 SGD I-QDIST(G) USD 26 March 2018 USD A-ACC SDG Hedged 26 March 2018 SGD A-MDIST(G) AUD Hedged 26 March 2018 AUD A-MDIST(G) EUR Hedged 26 March 2018 EUR Y-ACC USD 26 March 2018 USD Y-ACC SGD Hedged 26 March 2018 SGD A-MINCOME(G) GBP Hedged 10 August 2018 GBP Y-MINCOME(G)-USD 16 November 2018 USD
6

Fidelity UCITS II ICAV INVESTMENT MANAGER’S REPORT
Fidelity MSCI Emerging Markets Index Fund
The MSCI Emerging Markets Index (“Index”) declined -11.26% since the Sub-Fund’s inception ending 31 January 2019. The Fidelity MSCI Emerging Markets Index Fund (“Sub-Fund”) return declined twenty three basis points more, down -11.49% (gross of fees). The Sub-Fund is managed on a risk-controlled basis and is constructed to closely replicate its mandated benchmark. Expected sources of performance variance include the impact of security selection from the portfolio optimization employed and withholding tax differences between the Sub-Fund and the Index.
Six of the twenty six countries invested in had positive returns. Brazil (+4.9%) and Qatar (+26.2%) were both positive contributors. In Asia the two countries detracted the most were China and Korea, they fell 15.2% and 14.2% respectively. On a stock level, Reliance Industries in India led the way up 27.2%, followed by China Mobile which rose 18.3%. Detractors, include two large Chinese names, Tencent Holdings (down 25.7%) and Alibaba Group (down 15.3%).
The Sub-Fund seeks to track benchmark returns by owing most of the constituents and matching characteristics of the MSCI Emerging Markets, investing dividend income, and implementing trading strategies for index events with the most cost effective means available. As a result, the Sub-Fund is expected to perform similarly to its benchmark.
Please see table in Appendix 3 – Tracking Error section on page 167.
Fidelity MSCI Europe Index Fund The MSCI Europe Index (“Index”) declined -1.82% since the Sub-Fund’s inception ending 31 January 2019. The Fidelity MSCI Europe Index Fund (“Sub-Fund”) performed better, down -1.75% (gross of fees). The Sub-Fund is managed on a risk-controlled basis and is constructed to closely replicate its mandated benchmark. Expected sources of performance variance include the impact of security selection from the portfolio optimization employed and withholding tax differences between the Sub-Fund and the Index. Four of the sixteen countries invested in had positive returns. Switzerland (+6.4%) and U.K. (+2.6%) were the top two positive contributors. Germany and Italy returns drove some of the underperformance they were down 9.2% and 10.4% respectively. Three Swiss stocks that were positive contributors included Nestle (+19.8%), Roche Holdings (+23.8%), and Novatis (+14.8%). A few of the stock pushing the down side were British American Tobacco falling 28.3% and Bayer Ag which was off 27.0%. The Sub-Fund continues to track the benchmark return by closely replicating the constituents and characteristics of the MSCI Europe Index, investing dividend income and implementing trading strategies for index events with the most cost effective means available. As a result, the Sub-Fund is expected to perform closely to its benchmark. Please see table in Appendix 3 – Tracking Error section on page 167.
Fidelity MSCI Japan Index Fund The MSCI Japan Index (“Index”) declined -7.73% since the Sub-Fund’s inception through the period ending 31 January 2019. The Fidelity MSCI Japan Index Fund (“Sub-Fund”) return declined slightly less, down -7.61% (gross of fees). The Sub-Fund is managed on a risk-controlled basis and is constructed to closely replicate its mandated benchmark. Expected sources of performance variance include the impact of security selection from the portfolio optimization employed and withholding tax differences between the Sub-Fund and the Index. Two of the nineteen countries invested in had positive returns. Mexico (+0.23%) and Qatar (+0.19%) were both slightly positive. The two countries detracting the most China and Korea, they fell 16.9% and 14.0% respectively. On a stock level, Sunny Optical Tech contributed the most up 19.8% followed by Qatar Islamic Bank which gained 36.2%. Chinese holding Tencent Holdings fell 23.5% and Samsung Electronics in Korea was off 10.5%. The Sub-Fund continues to track the benchmark return closely by replicating the constituents and characteristics of the MSCI Japan Index, investing dividend income and implementing trading strategies for index events with the most cost effective means available. As a result, the Sub-Fund is expected to perform closely to its benchmark. Please see table in Appendix 3 – Tracking Error section on page 167.
7

Fidelity UCITS II ICAV INVESTMENT MANAGER’S REPORT (CONTINUED)
Fidelity MSCI Pacific ex-Japan Index Fund The MSCI Pacific ex Japan Index (“Index”) declined -3.16% since the Sub-Fund’s inception ending 31 January 2019. The Fidelity MSCI Pacific ex-Japan Index Fund (“Sub-Fund”) return declined slightly less, down -3.15% (gross of fees). The Sub-Fund is managed on a risk-controlled basis and is constructed to closely replicate its mandated benchmark. Expected sources of performance variance include the impact of security selection from the portfolio optimization employed and withholding tax differences between the Sub-Fund and the Index. Only one of the four countries invested in had positive returns. New Zealand the smallest country gained 6.1% over the period. Australia, Singapore, and Hong Kong all lagged. Australia being the largest country in the index, had the most impactful stocks. The two Australian holdings that led the way were BHP Group (+23.5%) and CLS Ltd. (+12.8%). On the other side Westpac Banking Corp. and National Australian Bank were drivers contributing to the overall decline for the period. Both stocks were down over 16%. The Sub-Fund continues to track the benchmark return by closely replicating the constituents and characteristics of the MSCI Pacific ex-Japan Index, investing dividend income and implementing trading strategies for index events with the most cost effective means available. As a result, the Sub-Fund is expected to perform closely to its benchmark. Please see table in Appendix 3 – Tracking Error section on page 167.
Fidelity MSCI World Index Fund The MSCI World Index (“Index”) declined -2.17% since the Sub-Fund’s inception ending 31 January 2019. The Fidelity MSCI World Index Fund (“Sub-Fund”) return declined slightly more, down -2.15% (gross of fees). The Sub-Fund is managed on a risk-controlled basis and is constructed to closely replicate its mandated benchmark. Expected sources of performance variance include the impact of security selection from the portfolio optimization employed and withholding tax differences between the Sub-Fund and the Index. Four of the twenty three countries invested in had positive returns. Positive contributors included U.S. and Canada. The North American pair rose 0.6% and 0.9% respectively. Driving the index return into negative territory were Japan (-7.6%), Germany (-15.1%) and France (-84%). On a stock level, helping the U.S. outperform, Microsoft, (+13.1%), Merck (+38.3%), and Amazon (+8.3%) all gained for the period. These gains were offset by a handful of detractors. The prices of Nvidia Corp., Abbvie Inc., and British American Tobacco fell over the period. The Sub-Fund seeks to track benchmark returns by owing most of the constituents and matching characteristics of the MSCI World, investing dividend income, and implementing trading strategies for index events with the most cost effective means available. As a result, the Sub-Fund is expected to perform similar to its benchmark. Please see table in Appendix 3 – Tracking Error section on page 167.
Fidelity S&P 500 Index Fund The S&P 500 index (“Index”) gained 0.28% since the Sub-Fund’s inception through the period ending 31 January 2019. The Fidelity S&P 500 Index Fund (“Sub-Fund”) return was slightly lower, up 0.21% (gross of fees). The Sub-Fund is managed on a risk-controlled basis and is constructed to closely replicate its mandated benchmark. Expected sources of performance variance include the impact of trading costs and withholding tax differences between the Sub-Fund and the Index. Six of the eleven sectors invested in had positive returns. Health Care led the way up 8.7% followed by Consumer Discretionary which rose 4.3%. Financials were a drag falling 8.8%. Industrials were off 4.8% over the period. Constituents that drove the index return included Microsoft and Amazon contributed to the positive side. Stock that partially offset on the down side included Nvidia Corp. and Abbvie, they were down 42.3% and 26.5% respectively. The Sub-Fund seeks to track benchmark returns by replicating the constituents and characteristics of the S&P500 Index, investing dividend income, and implementing trading strategies for index events with the most cost effective means available. As a result, the Sub-Fund is expected to perform closely to its benchmark. Please see table in Appendix 3 – Tracking Error section on page 167. Geode Capital Management LLC
8

Fidelity UCITS II ICAV INVESTMENT MANAGER’S REPORT (CONTINUED)
Fidelity Enhanced Reserve Fund Market review: Since inception (March 26, 2018) the Fidelity Enhanced Reserve Fund returned 3% for the period ending 31 January 2019. One week US LIBID (unofficial internal benchmark for the fund) returned 1.63% during the same period. During the period, LIBOR rose as the US Federal Reserve (Fed) raised interest rates three times over the period. On the macroeconomic front, economic data releases pointed to a continued expansion in the economy. However, consumers are becoming less confident and manufacturing surveys are mixed. The US labour market continues to show signs of strength, as evidenced by a solid non-farm payrolls report and jobless claims that remain very low relative to history, although they have begun to drift up off late. Looking at Asia, credit spreads widened during the period amid a weak sentiment as Chinese government’s campaign to tackle debt risks and a trade war with the US started to hurt the former’s economy. China’s economic growth slowed to 6.6% in 2018. However, market inflected in January allowing the Asian credits to end the period on a strong note. This was driven by several positive developments including a more dovish Fed, positive developments in trade talks and introduction of policies aimed at easing credit conditions in China. Performance: The Sub-Fund generated positive returns during the period. Stable coupon income contributed to performance, while credit spread widening and US dollar duration held back gains. Banks and brokers sector supported performance: At a sector level, the allocation to banks and brokers and quasi-sovereigns contributed most to returns; no sector detracted. At a rating level, single A contributed most; no rating bucket detracted. Positioning and outlook: One month into 2019, global and Asian markets face late cycle dynamics coming into play. The Federal Reserve has adopted a much more dovish stance, as shown by Chairman Jerome Powell’s comments, who suggested the Fed will be patient ahead of its next rate move. In China, the two key preconditions for a sustainable recovery in sentiment have gradually materialised -1) easing of credit conditions and 2) cooling of trade tensions. Potential volatility and risks from capacity and liquidity challenges warrant continued focus on shorter duration strategies which offer short-term liquidity. The Sub-Fund offers exposure to US treasuries, money market securities, floating rate notes and other short dated credit. It has moved up in credit quality passively by deploying inflows into investment grade bonds and floating rate notes. High yield stands now at around 10-15% of the Sub-Fund’s assets. Geographical diversification has increased as the Sub-Fund grows in size with the non-APAC share now exceeding 50% of the total portfolio. Please see table in Appendix 3 – Tracking Error section on page 167.
FIL Investment Management (Hong Kong)
9

Fidelity MSCI Emerging Markets Index Fund SCHEDULE OF INVESTMENTS AS AT 31 JANUARY 2019
Number of
Shares Fair Value
USDFund % of
NAV*
Equities 97.24%
Australia 0.01%
MMG 8,000 2,916 0.01%
Brazil 7.87%
Ambev 18,600 89,405 0.42%Atacadao Distribuicao Comercio e Industria 1,500 8,231 0.04%B2W Cia Digital 700 9,608 0.05%B3 - Brasil Bolsa Balcao 8,000 69,112 0.33%Banco Bradesco 3,390 37,466 0.18%Banco Bradesco Preference Shares 13,690 170,092 0.81%Banco do Brasil 3,400 48,403 0.23%Banco Santander Brasil 1,600 21,113 0.10%BB Seguridade Participacoes 2,800 23,874 0.11%BR Malls Participacoes 3,100 12,382 0.06%Braskem 700 10,042 0.05%BRF 2,300 14,863 0.07%CCR 4,600 18,790 0.09%Centrais Eletricas Brasileiras 900 9,240 0.04%Centrais Eletricas Brasileiras Preference Shares 800 8,938 0.04%Cia Brasileira de Distribuicao 600 16,023 0.08%Cia de Saneamento Basico do Estado de Sao Paulo 1,300 15,477 0.07%Cia Energetica de Minas Gerais 3,300 12,547 0.06%Cia Siderurgica Nacional 3,200 8,960 0.04%Cielo 5,100 16,716 0.08%Cosan 600 7,311 0.03%Embraer 2,600 13,804 0.07%Engie Brasil Energia 750 8,616 0.04%Equatorial Energia 700 16,939 0.08%Gerdau 4,300 18,473 0.09%Hypera 1,400 12,241 0.06%IRB Brasil Resseguros 400 9,362 0.04%Itau Unibanco Holding 19,350 205,994 0.99%Itausa - Investimentos Itau 17,430 64,595 0.31%JBS 3,500 14,498 0.07%Klabin 2,800 14,289 0.07%Kroton Educacional 5,500 17,257 0.08%Localiza Rent a Car 2,100 19,197 0.09%Lojas Americanas 3,100 17,930 0.09%Lojas Renner 2,800 34,973 0.17%M. Dias Branco 400 5,228 0.02%Magazine Luiza 300 14,747 0.07%Multiplan Empreendimentos Imobiliarios 1,100 7,860 0.04%Natura Cosmeticos 700 9,114 0.04%Petrobras Distribuidora 1,400 10,242 0.05%Petroleo Brasileiro 11,900 96,532 0.46%Petroleo Brasileiro Preference Shares 15,100 106,033 0.50%Porto Seguro 400 6,158 0.03%Raia Drogasil 900 15,318 0.07%Rumo 4,300 23,195 0.11%Sul America 800 7,050 0.03%Suzano Papel e Celulose 2,161 27,288 0.13%Telefonica Brasil 1,900 25,396 0.12%TIM Participacoes 3,400 11,574 0.05%Ultrapar Participacoes 1,400 21,983 0.10%Vale 12,500 156,130 0.74%WEG 3,250 16,809 0.08%
Total Brazil 1,657,418 7.87%
Chile 1.12%
Aguas Andinas 8,823 5,236 0.02%
10

Fidelity MSCI Emerging Markets Index Fund SCHEDULE OF INVESTMENTS (CONTINUED) AS AT 31 JANUARY 2019
Number of
Shares Fair Value
USDFund % of
NAV*
Equities 97.24% (continued)
Chile 1.12% (continued)
Banco de Chile 107,565 17,133 0.08%Banco de Credito e Inversiones 192 13,739 0.07%Banco Santander Chile 246,562 19,969 0.09%Cencosud 6,017 12,206 0.06%Cia Cervecerias Unidas 600 8,189 0.04%Colbun 27,120 6,186 0.03%Embotelladora Andina 1,144 4,445 0.02%Empresa Nacional de Telecomunicaciones 598 5,784 0.03%Empresas CMPC 5,091 18,472 0.09%Empresas Copec 1,449 19,965 0.09%Enel Americas 115,764 23,749 0.11%Enel Chile 118,022 12,486 0.06%ItauBanca 890,545 8,985 0.04%Latam Airlines Group 1,165 13,982 0.07%SACI Falabella 3,132 25,245 0.13%Sociedad Quimica y Minera de Chile 455 19,470 0.09%
Total Chile 235,241 1.12%
China 26.10%
3SBio 5,000 8,347 0.04%51job 108 7,521 0.04%58.com 406 25,740 0.12%AAC Technologies Holdings 3,000 18,543 0.09%Agile Group Holdings 6,000 7,937 0.04%Agricultural Bank of China 117,000 55,021 0.26%Air China 8,000 7,932 0.04%Alibaba Group Holding 5,135 865,195 4.12%Aluminum Corporation of China 14,000 5,156 0.02%Angang Steel 4,000 2,987 0.01%Anhui Conch Cement 5,000 27,018 0.13%ANTA Sports Products 4,000 20,671 0.10%Anxin Trust 100 60 0.00%Autohome 233 16,865 0.08%AVIC Aircraft 100 207 0.00%AviChina Industry & Technology 8,000 5,312 0.03%BAIC Motor 6,000 3,900 0.02%Baidu 1,109 191,446 0.91%Bank of Beijing 3,000 2,670 0.01%Bank of China 316,000 145,783 0.69%Bank of Communications 36,000 30,510 0.14%Bank of Guiyang 500 824 0.00%Bank of Hangzhou 1,440 1,670 0.01%Bank of Jiangsu 3,100 2,870 0.01%Bank of Nanjing 800 832 0.00%Bank of Ningbo 100 260 0.00%Bank of Shanghai 1,340 2,299 0.01%Baoshan Iron & Steel 300 314 0.00%Baozun 148 5,298 0.03%BBMG 11,000 3,757 0.02%Beijing Capital 3,400 1,683 0.01%Beijing Capital International Airport 6,000 5,605 0.03%BOE Technology Group 600 229 0.00%BYD 2,500 14,672 0.07%BYD Electronic International 2,500 3,071 0.01%CAR 3,000 2,497 0.01%CGN Power 40,000 10,450 0.05%Changjiang Securities 200 159 0.00%China Cinda Asset Management 32,000 8,238 0.04%China CITIC Bank 35,000 22,659 0.11%
11

Fidelity MSCI Emerging Markets Index Fund SCHEDULE OF INVESTMENTS (CONTINUED) AS AT 31 JANUARY 2019
Number of
Shares Fair Value
USDFund % of
NAV*
Equities 97.24% (continued)
China 26.10% (continued)
China Coal Energy 8,000 3,364 0.02%China Communications Construction 17,000 17,007 0.08%China Communications Services 10,000 9,367 0.04%China Conch Venture Holdings 6,000 19,996 0.09%China Construction Bank 378,000 337,693 1.61%China Eastern Airlines 6,000 3,663 0.02%China Everbright Bank 12,000 5,765 0.03%China Evergrande Group 10,000 31,287 0.15%China Film 100 223 0.00%China Fortune Land Development 100 407 0.00%China Galaxy Securities 13,500 6,968 0.03%China Gezhouba Group 100 92 0.00%China Grand Automotive Services 100 64 0.00%China Hongqiao Group 8,500 5,416 0.03%China Huarong Asset Management 39,000 7,903 0.04%China International Capital 4,000 7,963 0.04%China Life Insurance 29,000 71,477 0.34%China Literature 600 2,948 0.01%China Longyuan Power Group 12,000 8,962 0.04%China Medical System Holdings 5,000 5,181 0.02%China Merchants Bank 16,500 71,915 0.34%China Merchants Securities 100 215 0.00%China Merchants Shekou Industrial Zone Holdings 100 287 0.00%China Minsheng Banking 26,800 20,459 0.10%China Molybdenum 15,000 6,060 0.03%China National Building Material 14,000 11,116 0.05%China National Chemical Engineering 100 81 0.00%China National Nuclear Power 1,400 1,125 0.01%China Northern Rare Earth Group High-Tech 800 1,020 0.00%China Oilfield Services 8,000 7,912 0.04%China Oriental Group 4,000 2,697 0.01%China Pacific Insurance Group 10,800 37,781 0.18%China Petroleum & Chemical 100,000 83,728 0.40%China Railway Construction 8,500 11,786 0.06%China Railway Group 16,000 14,926 0.07%China Railway Signal & Communication 4,000 3,166 0.02%China Reinsurance Group 22,000 4,963 0.02%China Resources Pharmaceutical Group 6,000 8,518 0.04%China Shenhua Energy (Class A) 4,000 11,825 0.06%China Shenhua Energy (Class H) 11,500 29,019 0.14%China South Publishing & Media Group 100 196 0.00%China Southern Airlines 8,000 5,679 0.03%China State Construction Engineering 3,740 3,412 0.02%China Telecom 54,000 29,179 0.14%China Tower 156,000 33,400 0.16%China United Network Communications 2,500 1,979 0.01%China Vanke 5,200 20,941 0.10%China Yangtze Power 600 1,470 0.01%China Zhongwang Holdings 6,400 3,205 0.02%Chongqing Rural Commercial Bank 10,000 5,773 0.03%CIFI Holdings Group 12,000 7,876 0.04%CITIC Guoan Information Industry 100 49 0.00%CITIC Securities 9,000 18,283 0.09%CNOOC 70,000 117,042 0.56%COSCO Shipping Energy Transportation 4,000 2,263 0.01%COSCO Shipping Holdings 11,000 4,430 0.02%Country Garden Holdings 29,000 40,950 0.19%Country Garden Services Holdings 5,000 7,698 0.04%CRRC 17,000 17,072 0.08%CSPC Pharmaceutical Group 20,000 34,307 0.16%
12

Fidelity MSCI Emerging Markets Index Fund SCHEDULE OF INVESTMENTS (CONTINUED) AS AT 31 JANUARY 2019
Number of
Shares Fair Value
USDFund % of
NAV*
Equities 97.24% (continued)
China 26.10% (continued)
Ctrip.com International 1,673 55,711 0.26%Dali Foods Group 7,000 4,764 0.02%Daqin Railway 1,300 1,657 0.01%Datang International Power Generation 8,000 2,080 0.01%DHC Software 100 96 0.00%Dongfeng Motor Group 10,000 10,463 0.05%ENN Energy Holdings 3,100 29,591 0.14%Everbright Securities 100 138 0.00%First Capital Securities 100 83 0.00%Focus Media Information Technology 240 195 0.00%Foshan Haitian Flavouring & Food 200 2,156 0.01%Fosun International 10,000 14,911 0.07%Founder Securities 200 182 0.00%Future Land Development Holdings 6,000 5,047 0.02%Fuyao Glass Industry Group 2,000 6,946 0.03%GD Power Development 1,500 537 0.00%GDS Holdings 238 6,759 0.03%Geely Automobile Holdings 19,000 32,108 0.15%Gemdale 100 163 0.00%Genscript Biotech 4,000 6,138 0.03%GF Securities 5,600 7,993 0.04%GoerTek 100 99 0.00%GOME Retail Holdings 44,000 3,813 0.02%Great Wall Motor 11,500 7,797 0.04%Gree Electric Appliances of Zhuhai 100 622 0.00%Greenland Holdings Group 100 96 0.00%Greentown China Holdings 3,500 3,113 0.01%Greentown Service Group 4,000 3,650 0.02%Guangshen Railway 2,100 1,096 0.01%Guangzhou Automobile Group 12,400 13,401 0.06%Guangzhou Haige Communications Group 100 114 0.00%Guangzhou R&F Properties 3,200 6,354 0.03%Guosen Securities 100 125 0.00%Guotai Junan Securities 2,800 5,966 0.03%Guoyuan Securities 100 112 0.00%Haitian International Holdings 3,000 6,882 0.03%Haitong Securities 11,600 13,039 0.06%Hangzhou Hikvision Digital Technology 500 2,238 0.01%Henan Shuanghui Investment & Development 100 373 0.00%Hengan International Group 3,000 23,551 0.11%HengTen Networks Group 84,000 2,730 0.01%Hesteel 4,000 1,831 0.01%Hua Hong Semiconductor 2,000 4,425 0.02%Huaan Securities 100 73 0.00%Huadian Power International 4,000 1,856 0.01%Huaneng Power International 16,000 10,032 0.05%Huaneng Renewables 16,000 4,588 0.02%Huatai Securities 5,800 10,807 0.05%Huaxia Bank 2,300 2,596 0.01%Huayu Automotive Systems 100 301 0.00%Huazhu Group 508 16,129 0.08%Hubei Biocause Pharmaceutical 1,400 1,158 0.01%Hubei Energy Group 2,200 1,217 0.01%Industrial & Commercial Bank of China 276,000 213,154 1.02%Industrial Bank 1,400 3,423 0.02%Industrial Securities 200 146 0.00%Inner Mongolia BaoTou Steel Union 700 153 0.00%Inner Mongolia Yili Industrial Group 100 360 0.00%Inner Mongolia Yitai Coal 4,200 4,868 0.02%JD.com 2,856 70,972 0.34%
13

Fidelity MSCI Emerging Markets Index Fund SCHEDULE OF INVESTMENTS (CONTINUED) AS AT 31 JANUARY 2019
Number of
Shares Fair Value
USDFund % of
NAV*
Equities 97.24% (continued)
China 26.10% (continued)
Jiangsu Expressway 4,000 5,791 0.03%Jiangsu Hengrui Medicine 100 880 0.00%Jiangsu Yanghe Brewery Joint-Stock 100 1,409 0.01%Jiangxi Copper 5,000 6,334 0.03%Jinduicheng Molybdenum 100 91 0.00%Jinke Properties Group 800 682 0.00%Kaisa Group Holdings 8,000 2,559 0.01%Kangmei Pharmaceutical 100 87 0.00%Kingdee International Software Group 10,000 9,584 0.05%Kingsoft 4,000 7,596 0.04%Kweichow Moutai 100 10,281 0.05%KWG Group Holdings 5,000 4,907 0.02%Legend Holdings 1,300 3,388 0.02%Lenovo Group 26,000 18,887 0.09%Logan Property Holdings 6,000 8,121 0.04%Longfor Group Holdings 5,500 16,998 0.08%Luxshare Precision Industry 130 317 0.00%Luye Pharma Group 4,500 3,343 0.02%Maanshan Iron & Steel 8,900 4,790 0.02%Meinian Onehealth Healthcare Holdings 120 273 0.00%Meitu 6,500 2,212 0.01%Metallurgical Corporation of China 10,000 2,740 0.01%Midea Group 100 649 0.00%Momo 557 16,950 0.08%NetEase 313 78,853 0.37%New China Life Insurance 3,100 13,116 0.06%New Hope Liuhe 1,400 1,659 0.01%New Oriental Education & Technology Group 547 42,141 0.20%Noah Holdings 148 6,956 0.03%Offshore Oil Engineering 1,000 781 0.00%O-film Tech 100 149 0.00%Orient Securities 100 119 0.00%People's Insurance Group of China 29,000 11,974 0.06%PetroChina 84,000 54,168 0.26%PICC Property & Casualty 28,000 28,868 0.14%Ping An Bank 800 1,324 0.01%Ping An Insurance Group of China 21,000 203,129 0.97%Poly Developments & Holdings Group 200 384 0.00%Postal Savings Bank of China 10,000 5,607 0.03%Power Construction Corporation of China 1,300 969 0.00%Qingdao Haier 100 239 0.00%RiseSun Real Estate Development 100 137 0.00%Rongsheng Petro Chemical 100 157 0.00%SAIC Motor 700 2,776 0.01%Sanan Optoelectronics 100 146 0.00%Sany Heavy Industry 200 272 0.00%SDIC Power Holdings 100 121 0.00%Semiconductor Manufacturing International 9,500 8,947 0.04%Shaanxi Coal Industry 700 879 0.00%Shandong Weigao Group Medical Polymer 8,000 6,678 0.03%Shanghai Construction Group 600 284 0.00%Shanghai Electric Group 12,000 4,190 0.02%Shanghai Fosun Pharmaceutical Group 2,000 6,079 0.03%Shanghai International Port Group 1,000 801 0.00%Shanghai Lujiazui Finance & Trade Zone Development 4,100 5,576 0.03%Shanghai Oriental Pearl Group 130 191 0.00%Shanghai Pharmaceuticals Holding 3,500 7,449 0.04%Shanghai Pudong Development Bank 1,900 3,039 0.01%Shanghai Tunnel Engineering 200 192 0.00%Shanxi Lu'an Environmental Energy Development 100 103 0.00%
14

Fidelity MSCI Emerging Markets Index Fund SCHEDULE OF INVESTMENTS (CONTINUED) AS AT 31 JANUARY 2019
Number of
Shares Fair Value
USDFund % of
NAV*
Equities 97.24% (continued)
China 26.10% (continued)
Shanxi Securities 100 90 0.00%Shanxi Xishan Coal & Electricity Power 100 81 0.00%Shenergy 3,300 2,484 0.01%Shenwan Hongyuan Group 1,800 1,186 0.01%Shenzhen Energy Group 1,800 1,361 0.01%Shenzhen Overseas Chinese Town 100 95 0.00%Shenzhou International Group Holdings 3,000 35,308 0.17%Shui On Land 14,000 3,461 0.02%Sichuan Chuantou Energy 100 136 0.00%Sihuan Pharmaceutical Holdings Group 15,000 3,154 0.01%Sina 256 15,724 0.07%Sinolink Securities 100 114 0.00%Sino-Ocean Group Holding 13,000 6,362 0.03%Sinopec Engineering Group 5,000 4,907 0.02%Sinopec Shanghai Petrochemical 12,000 5,674 0.03%Sinopharm Group 5,200 23,228 0.11%Sinotrans 8,000 3,660 0.02%Sinotruk Hong Kong 2,500 4,601 0.02%SOHO China 8,000 3,232 0.02%SooChow Securities 100 105 0.00%Southwest Securities 200 115 0.00%Sunac China Holdings 10,000 39,507 0.19%Suning.com 200 310 0.00%Sunny Optical Technology Group 2,900 28,495 0.14%Suzhou Gold Mantis Construction Decoration 100 126 0.00%TAL Education Group 1,365 42,356 0.20%TBEA 100 105 0.00%Tencent Holdings 22,500 992,136 4.72%Tingyi Cayman Islands Holding 8,000 11,133 0.05%Tong Ren Tang Technologies 2,000 2,686 0.01%Tongling Nonferrous Metals Group 6,000 1,771 0.01%Tongwei 100 153 0.00%TravelSky Technology 4,000 10,807 0.05%Tsingtao Brewery 2,000 8,781 0.04%Tunghsu Optoelectronic Technology 100 61 0.00%Uni-President China Holdings 5,000 4,435 0.02%Vipshop Holdings 1,580 12,150 0.06%Want Want China Holdings 19,000 15,327 0.07%Weibo 238 14,437 0.07%Weichai Power 7,000 9,367 0.04%Western Securities 100 115 0.00%Wuliangye Yibin 100 899 0.00%Wuxi Biologics Cayman 2,000 17,192 0.08%XCMG Construction Machinery 200 97 0.00%Xiamen C&D 100 114 0.00%Xinjiang Goldwind Science & Technology 3,600 4,308 0.02%Xinyi Solar Holdings 10,000 4,206 0.02%Yanzhou Coal Mining 8,000 7,300 0.03%Yihai International Holding 2,000 6,092 0.03%Yonghui Superstores 200 240 0.00%Youngor Group 1,600 1,815 0.01%Yum China Holdings 1,509 55,003 0.26%Yuzhou Properties 4,163 2,053 0.01%YY 199 13,817 0.07%Zhaojin Mining Industry 4,000 4,180 0.02%Zhejiang China Commodities City Group 5,000 2,676 0.01%Zhejiang Dahua Technology 100 184 0.00%Zhejiang Expressway 6,000 6,148 0.03%Zhejiang Longsheng Group 100 148 0.00%ZhongAn Online P&C Insurance 700 2,409 0.01%
15

Fidelity MSCI Emerging Markets Index Fund SCHEDULE OF INVESTMENTS (CONTINUED) AS AT 31 JANUARY 2019
Number of
Shares Fair Value
USDFund % of
NAV*
Equities 97.24% (continued)
China 26.10% (continued)
Zhongjin Gold 100 118 0.00%Zhongsheng Group Holdings 2,000 3,584 0.02%Zhuzhou CRRC Times Electric 2,700 14,968 0.07%Zijin Mining Group 24,000 8,931 0.04%Zoomlion Heavy Industry Science & Technology 2,100 1,165 0.01%ZTE 3,200 6,435 0.03%
Total China 5,497,475 26.10%
Colombia 0.40%
Bancolombia 584 6,268 0.03%Bancolombia Preference Shares 2,010 22,233 0.12%Cementos Argos 1,680 4,370 0.02%Ecopetrol 18,888 17,755 0.08%Grupo Argos 1,038 6,202 0.03%Grupo Aval Acciones y Valores 14,101 4,857 0.02%Grupo de Inversiones Suramericana 626 6,949 0.03%Grupo de Inversiones Suramericana Preference Shares 836 8,903 0.04%Interconexion Electrica ESP 1,622 7,269 0.03%
Total Colombia 84,806 0.40%
Czech Republic 0.16%
CEZ 607 15,334 0.07%Komercni banka 297 11,989 0.06%Moneta Money Bank 2,061 7,025 0.03%
Total Czech Republic 34,348 0.16%
Egypt 0.11%
Commercial International Bank Egypt 4,662 22,634 0.11%
Greece 0.21%
Alpha Bank 5,361 5,370 0.03%FF Group 87 479 0.00%Hellenic Telecommunications Organization 949 11,924 0.06%Jumbo 429 7,029 0.03%Motor Oil Hellas Corinth Refineries 235 5,865 0.03%OPAP 878 8,589 0.04%Titan Cement 211 4,760 0.02%
Total Greece 44,016 0.21%
Hong Kong 4.26%
Alibaba Health Information Technology 14,000 12,810 0.06%Alibaba Pictures Group 50,000 8,666 0.04%Beijing Enterprises Holdings 2,000 11,330 0.05%Beijing Enterprises Water Group 22,000 12,701 0.06%Brilliance China Automotive Holdings 12,000 11,286 0.05%China Agri-Industries Holdings 8,000 2,845 0.01%China Ding Yi Feng Holdings 8,000 28,088 0.13%China Everbright 4,000 7,514 0.04%China Everbright International 14,222 14,282 0.07%China First Capital Group 16,000 8,319 0.04%China Gas Holdings 6,800 21,622 0.10%China Jinmao Holdings Group 20,000 10,093 0.05%China Mengniu Dairy 11,000 33,995 0.16%China Merchants Port Holdings 6,000 11,852 0.06%China Mobile 24,000 251,724 1.19%China Overseas Land & Investment 16,000 60,153 0.28%China Power International Development 17,000 4,376 0.02%
16

Fidelity MSCI Emerging Markets Index Fund SCHEDULE OF INVESTMENTS (CONTINUED) AS AT 31 JANUARY 2019
Number of
Shares Fair Value
USDFund % of
NAV*
Equities 97.24% (continued)
Hong Kong 4.26% (continued)
China Resources Beer Holdings 6,000 21,028 0.10%China Resources Cement Holdings 10,000 10,106 0.05%China Resources Gas Group 4,000 15,650 0.07%China Resources Land 12,000 46,644 0.22%China Resources Power Holdings 8,000 16,007 0.08%China State Construction International Holdings 8,000 7,606 0.04%China Taiping Insurance Holdings 6,200 16,988 0.08%China Traditional Chinese Medicine Holdings 8,000 5,200 0.02%China Travel International Investment Hong Kong 12,000 3,456 0.02%China Unicom Hong Kong 24,000 27,375 0.13%CITIC 22,000 33,252 0.16%COSCO Shipping Ports 6,091 6,334 0.03%Far East Horizon 8,000 8,258 0.04%Fullshare Holdings 25,000 5,671 0.03%Guangdong Investment 12,000 22,878 0.11%Haier Electronics Group 5,000 14,369 0.07%Hutchison China MediTech 217 4,926 0.02%Jiayuan International Group 4,026 1,939 0.01%Kingboard Holdings 4,000 13,993 0.07%Kingboard Laminates Holdings 5,500 5,664 0.03%Kunlun Energy 12,000 12,785 0.06%Lee & Man Paper Manufacturing 6,000 5,330 0.03%Nine Dragons Paper Holdings 6,000 6,087 0.03%Shanghai Industrial Holdings 2,000 4,200 0.02%Shenzhen International Holdings 3,500 6,780 0.03%Shenzhen Investment 12,000 4,175 0.02%Shimao Property Holdings 4,500 12,731 0.06%Sino Biopharmaceutical 26,500 22,290 0.11%SSY Group 6,000 5,376 0.03%Sun Art Retail Group 9,500 9,395 0.04%Towngas China 4,000 3,181 0.02%Yuexiu Property 26,000 5,037 0.02%
Total Hong Kong 896,367 4.26%
Hungary 0.31%
MOL Hungarian Oil & Gas 1,409 16,885 0.08%OTP Bank 898 37,055 0.17%Richter Gedeon 546 11,652 0.06%
Total Hungary 65,592 0.31%
India 8.26%
Adani Ports & Special Economic Zone 2,290 10,883 0.05%Ambuja Cements 2,365 6,985 0.03%Ashok Leyland 4,503 5,167 0.02%Asian Paints 1,075 21,267 0.10%Aurobindo Pharma 983 10,853 0.05%Avenue Supermarts 482 9,313 0.04%Axis Bank 7,085 71,806 0.34%Bajaj Auto 337 12,145 0.06%Bajaj Finance 670 24,316 0.12%Bajaj Finserv 142 12,197 0.06%Bharat Forge 816 5,624 0.03%Bharat Petroleum 2,978 14,530 0.07%Bharti Airtel 5,558 23,906 0.11%Bharti Infratel 1,455 6,056 0.03%Bosch 28 7,441 0.04%Britannia Industries 224 10,063 0.05%Cadila Healthcare 893 3,997 0.02%Cipla 1,336 9,696 0.05%
17

Fidelity MSCI Emerging Markets Index Fund SCHEDULE OF INVESTMENTS (CONTINUED) AS AT 31 JANUARY 2019
Number of
Shares Fair Value
USDFund % of
NAV*
Equities 97.24% (continued)
India 8.26% (continued)
Coal India 3,398 10,693 0.05%Container Corporation of India 682 6,271 0.03%Dabur India 1,968 12,383 0.06%Divi's Laboratories 362 7,691 0.04%Dr Reddy's Laboratories 447 17,084 0.08%Eicher Motors 53 14,160 0.07%GAIL India 3,147 14,735 0.07%Glenmark Pharmaceuticals 633 5,808 0.03%Godrej Consumer Products 1,433 14,335 0.07%Grasim Industries 1,277 12,925 0.06%Havells India 963 9,668 0.05%HCL Technologies 2,339 33,085 0.16%Hero MotoCorp 195 7,195 0.03%Hindalco Industries 4,433 13,005 0.06%Hindustan Petroleum 2,354 7,778 0.04%Hindustan Unilever 2,563 63,324 0.30%Housing Development Finance 6,321 170,557 0.80%ICICI Bank 9,188 47,116 0.22%Indiabulls Housing Finance 1,021 9,504 0.05%Indian Oil 6,701 12,899 0.06%Infosys 13,697 144,442 0.69%InterGlobe Aviation 337 5,618 0.03%ITC 13,677 53,510 0.25%JSW Steel 3,188 12,327 0.06%Larsen & Toubro 1,840 33,848 0.16%LIC Housing Finance 1,209 7,656 0.04%Lupin 846 10,411 0.05%Mahindra & Mahindra 2,882 27,586 0.13%Mahindra & Mahindra Financial Services 999 5,699 0.03%Marico 1,755 9,081 0.04%Maruti Suzuki India 418 38,996 0.19%Motherson Sumi Systems 3,658 7,232 0.03%Nestle India 93 15,013 0.07%NTPC 7,529 14,800 0.07%Oil & Natural Gas 5,303 10,495 0.05%Page Industries 20 6,566 0.03%Petronet LNG 2,330 7,443 0.04%Pidilite Industries 477 7,505 0.04%Piramal Enterprises 317 8,990 0.04%Power Grid Corporation of India 6,048 16,038 0.08%REC 2,791 4,874 0.02%Reliance Industries 11,197 192,894 0.91%Shree Cement 33 7,323 0.03%Shriram Transport Finance 575 8,225 0.04%State Bank of India 7,120 29,513 0.14%Sun Pharmaceutical Industries 3,248 19,222 0.09%Tata Consultancy Services 3,528 99,684 0.47%Tata Motors 6,312 15,971 0.08%Tata Power 4,886 4,892 0.02%Tata Steel 1,632 10,953 0.05%Tech Mahindra 1,827 18,766 0.09%Titan 1,242 17,463 0.08%UltraTech Cement 369 18,263 0.09%United Spirits 1,109 8,389 0.04%UPL 1,328 14,658 0.07%Vedanta 5,014 13,956 0.07%Vodafone Idea 7,150 3,031 0.01%Wipro 4,449 23,021 0.11%Yes Bank 6,563 17,902 0.08%
18

Fidelity MSCI Emerging Markets Index Fund SCHEDULE OF INVESTMENTS (CONTINUED) AS AT 31 JANUARY 2019
Number of
Shares Fair Value
USDFund % of
NAV*
Equities 97.24% (continued)
India 8.26% (continued)
Zee Entertainment Enterprises 1,904 10,126 0.05%
Total India 1,738,843 8.26%
Indonesia 2.25%
Adaro Energy 53,900 5,362 0.03%Astra International 79,700 48,199 0.23%Bank Central Asia 39,100 78,844 0.37%Bank Danamon Indonesia 11,200 7,294 0.03%Bank Mandiri Persero 73,900 39,403 0.19%Bank Negara Indonesia Persero 28,800 18,705 0.09%Bank Rakyat Indonesia Persero 219,000 60,344 0.29%Bank Tabungan Negara Persero 16,400 3,216 0.02%Bukit Asam 10,900 3,362 0.02%Bumi Serpong Damai 29,400 2,799 0.01%Charoen Pokphand Indonesia 28,300 14,988 0.07%Gudang Garam 1,800 10,776 0.05%Hanjaya Mandala Sampoerna 37,100 10,169 0.05%Indah Kiat Pulp & Paper 10,500 9,769 0.05%Indocement Tunggal Prakarsa 7,100 9,769 0.05%Indofood CBP Sukses Makmur 8,900 6,863 0.03%Indofood Sukses Makmur 15,700 8,708 0.04%Jasa Marga Persero 8,000 2,817 0.01%Kalbe Farma 82,200 9,413 0.04%Pabrik Kertas Tjiwi Kimia 5,700 5,497 0.03%Pakuwon Jati 63,000 2,931 0.01%Perusahaan Gas Negara Persero 41,900 7,707 0.04%Semen Indonesia Persero 11,500 10,432 0.05%Surya Citra Media 23,000 3,103 0.01%Telekomunikasi Indonesia Persero 199,100 55,573 0.26%Tower Bersama Infrastructure 10,700 3,768 0.02%Unilever Indonesia 6,200 22,186 0.11%United Tractors 6,200 11,415 0.05%
Total Indonesia 473,412 2.25%
Luxembourg 0.04%
Reinet Investments 580 8,770 0.04%
Malaysia 2.22%
AirAsia Group 6,400 4,750 0.02%Alliance Bank Malaysia 4,000 4,141 0.02%AMMB Holdings 6,000 6,592 0.03%Axiata Group 10,000 9,790 0.05%British American Tobacco Malaysia 500 4,678 0.02%CIMB Group Holdings 18,433 25,291 0.12%Dialog Group 13,100 9,595 0.05%DiGi.Com 11,600 13,197 0.06%Fraser & Neave Holdings 500 4,146 0.02%Gamuda 6,500 4,380 0.02%Genting 8,200 13,894 0.07%Genting Malaysia 11,500 9,237 0.04%Genting Plantations 1,500 3,743 0.02%HAP Seng Consolidated 2,500 6,012 0.03%Hartalega Holdings 5,100 6,724 0.03%Hong Leong Bank 2,900 14,613 0.07%Hong Leong Financial Group 900 4,329 0.02%IHH Healthcare 9,700 13,262 0.06%IJM 10,100 4,512 0.02%IOI 6,900 7,833 0.04%
19

Fidelity MSCI Emerging Markets Index Fund SCHEDULE OF INVESTMENTS (CONTINUED) AS AT 31 JANUARY 2019
Number of
Shares Fair Value
USDFund % of
NAV*
Equities 97.24% (continued)
Malaysia 2.22% (continued)
IOI Properties Group 4,200 1,600 0.01%Kuala Lumpur Kepong 2,100 12,653 0.06%Malayan Banking 14,955 34,832 0.17%Malaysia Airports Holdings 3,500 6,870 0.03%Maxis 8,900 12,494 0.06%MISC 3,900 6,456 0.03%Nestle Malaysia 300 10,876 0.05%Petronas Chemicals Group 9,200 18,979 0.09%Petronas Dagangan 800 5,152 0.02%Petronas Gas 2,600 11,477 0.05%PPB Group 2,140 9,509 0.05%Press Metal Aluminium Holdings 4,700 4,946 0.02%Public Bank 11,600 70,177 0.34%QL Resources 2,800 4,621 0.02%RHB Bank 4,000 5,303 0.03%Sime Darby 9,300 5,086 0.02%Sime Darby Plantation 9,100 11,486 0.05%Sime Darby Property 16,300 4,576 0.02%SP Setia Group 6,060 3,802 0.02%Telekom Malaysia 4,300 3,055 0.01%Tenaga Nasional 12,500 39,367 0.19%Top Glove 5,400 6,354 0.03%Westports Holdings 3,800 3,451 0.02%YTL 12,000 3,223 0.02%
Total Malaysia 467,064 2.22%
Mexico 2.67%
Alfa 11,700 14,800 0.07%Alsea 2,000 5,562 0.03%America Movil 132,600 106,690 0.52%Arca Continental 1,900 11,105 0.05%Banco Santander Mexico Institucion de Banca Multiple Grupo Financiero Santand 7,240 10,893 0.05%Cemex 56,100 30,455 0.14%Coca-Cola Femsa 2,300 14,444 0.07%El Puerto de Liverpool 700 4,607 0.02%Fomento Economico Mexicano 7,700 70,399 0.33%Gruma 975 11,937 0.06%Grupo Aeroportuario del Pacifico 1,400 12,628 0.06%Grupo Aeroportuario del Sureste 795 14,453 0.07%Grupo Bimbo 6,400 12,717 0.06%Grupo Carso 2,100 8,273 0.04%Grupo Financiero Banorte 10,200 56,907 0.27%Grupo Financiero Inbursa 9,100 13,247 0.06%Grupo Mexico 14,100 33,931 0.16%Grupo Televisa 9,700 24,372 0.12%Industrias Penoles 535 7,340 0.03%Infraestructura Energetica Nova 2,100 8,287 0.04%Kimberly-Clark de Mexico 5,900 9,897 0.05%Megacable Holdings 1,100 4,970 0.02%Mexichem 4,100 11,006 0.05%Promotora y Operadora de Infraestructura 850 8,716 0.04%Wal-Mart de Mexico 20,600 54,347 0.26%
Total Mexico 561,983 2.67%
Pakistan 0.04%
Habib Bank 2,100 2,262 0.01%Lucky Cement 187 635 0.00%MCB Bank 2,000 3,008 0.01%
20

Fidelity MSCI Emerging Markets Index Fund SCHEDULE OF INVESTMENTS (CONTINUED) AS AT 31 JANUARY 2019
Number of
Shares Fair Value
USDFund % of
NAV*
Equities 97.24% (continued)
Pakistan 0.04% (continued)
Oil & Gas Development 2,800 3,048 0.02%
Total Pakistan 8,953 0.04%
Peru 0.41%
Cia de Minas Buenaventura 717 11,221 0.05%Credicorp 264 64,094 0.31%Southern Copper 340 11,431 0.05%
Total Peru 86,746 0.41%
Philippines 1.07%
Aboitiz Equity Ventures 7,600 9,371 0.04%Aboitiz Power 5,400 3,979 0.02%Alliance Global Group 15,200 3,996 0.02%Ayala 1,020 18,145 0.09%Ayala Land 29,000 24,709 0.12%Bank of the Philippine Islands 3,338 5,829 0.03%BDO Unibank 7,580 19,637 0.09%DMCI Holdings 15,100 3,645 0.02%Globe Telecom 120 4,652 0.02%GT Capital Holdings 363 7,433 0.04%International Container Terminal Services 1,760 3,654 0.02%JG Summit Holdings 10,940 13,573 0.06%Jollibee Foods 1,680 10,188 0.05%Manila Electric 850 5,967 0.03%Megaworld 47,000 4,654 0.02%Metro Pacific Investments 50,400 4,701 0.02%Metropolitan Bank & Trust 6,740 10,865 0.05%PLDT 345 8,541 0.04%Robinsons Land 7,900 3,343 0.02%Security Bank 880 3,023 0.01%SM Investments 900 17,098 0.08%SM Prime Holdings 38,600 28,222 0.13%Universal Robina 3,380 9,606 0.05%
Total Philippines 224,831 1.07%
Poland 1.17%
Alior Bank 350 5,419 0.03%Bank Handlowy w Warszawie 125 2,326 0.01%Bank Millennium 2,318 5,505 0.03%Bank Polska Kasa Opieki 672 20,014 0.10%CCC 110 5,296 0.03%CD Projekt 274 14,019 0.07%Cyfrowy Polsat 990 6,318 0.03%Dino Polska 189 5,105 0.02%Grupa Lotos 364 9,116 0.04%Jastrzebska Spolka Weglowa 199 3,660 0.02%KGHM Polska Miedz 536 13,590 0.06%LPP 5 11,269 0.05%mBank 57 6,892 0.03%Orange Polska 2,526 3,809 0.02%PGE Polska Grupa Energetyczna 3,187 10,178 0.05%Polski Koncern Naftowy ORLEN 1,145 32,281 0.15%Polskie Gornictwo Naftowe i Gazownictwo 6,388 13,125 0.06%Powszechna Kasa Oszczednosci Bank Polski 3,532 37,577 0.18%Powszechny Zaklad Ubezpieczen 2,321 27,912 0.13%Santander Bank Polska 133 13,387 0.06%
Total Poland 246,798 1.17%
21

Fidelity MSCI Emerging Markets Index Fund SCHEDULE OF INVESTMENTS (CONTINUED) AS AT 31 JANUARY 2019
Number of
Shares Fair Value
USDFund % of
NAV*
Equities 97.24% (continued)
Qatar 1.02%
Barwa Real Estate 814 9,105 0.04%Commercial Bank PQSC 762 8,883 0.04%Ezdan Holding Group 3,039 13,045 0.06%Industries Qatar 696 27,448 0.13%Masraf Al Rayan 1,499 16,796 0.08%Ooredoo 326 6,795 0.03%Qatar Electricity & Water 205 10,583 0.05%Qatar Insurance 678 7,260 0.03%Qatar Islamic Bank 446 19,353 0.09%Qatar National Bank 1,775 96,515 0.47%
Total Qatar 215,783 1.02%
Romania 0.06%
NEPI Rockcastle 1,377 13,017 0.06%
Russia 3.79%
Alrosa 9,600 14,450 0.07%Gazprom 41,820 103,990 0.49%Inter RAO 117,000 6,835 0.03%LUKOIL 1,911 153,878 0.72%Magnit 1,431 22,782 0.11%Magnitogorsk Iron & Steel Works 8,500 5,621 0.03%MMC Norilsk Nickel 252 52,325 0.25%Mobile TeleSystems 2,011 17,295 0.08%Moscow Exchange 5,550 7,867 0.04%Novatek 357 65,510 0.31%Novolipetsk Steel 4,590 10,656 0.05%PhosAgro 429 5,843 0.03%Polymetal International 741 8,452 0.04%Polyus 98 8,223 0.04%Rosneft Oil 4,490 28,200 0.13%Sberbank of Russia 42,430 141,198 0.67%Severstal 810 12,352 0.06%Surgutneftegas 34,700 14,497 0.07%Surgutneftegas Preference Shares 30,800 19,083 0.09%Tatneft 5,950 73,322 0.35%Transneft 2 5,330 0.03%VTB Bank 13,860,000 7,995 0.04%X5 Retail Group 471 12,340 0.06%
Total Russia 798,044 3.79%
Singapore 0.03%
BOC Aviation 800 6,760 0.03%
South Africa 5.82%
Absa Group 2,788 38,824 0.18%Anglo American Platinum 196 9,423 0.04%AngloGold Ashanti 1,547 21,798 0.10%Aspen Pharmacare Holdings 1,547 16,937 0.08%Bid 1,296 27,674 0.13%Bidvest Group 1,344 20,520 0.10%Capitec Bank Holdings 159 13,973 0.07%Clicks Group 1,012 15,016 0.07%Discovery 1,376 16,510 0.08%Exxaro Resources 964 11,182 0.05%FirstRand 13,252 69,295 0.33%Foschini Group 867 11,065 0.05%Gold Fields 3,169 12,838 0.06%
22

Fidelity MSCI Emerging Markets Index Fund SCHEDULE OF INVESTMENTS (CONTINUED) AS AT 31 JANUARY 2019
Number of
Shares Fair Value
USDFund % of
NAV*
Equities 97.24% (continued)
South Africa 5.82% (continued)
Investec 1,125 7,381 0.04%Kumba Iron Ore 248 6,329 0.03%Liberty Holdings 520 4,186 0.02%Life Healthcare Group Holdings 5,271 10,772 0.05%MMI Holdings 3,986 5,055 0.02%Motus Holdings 5 34 0.00%Mr Price Group 964 16,200 0.08%MTN Group 6,691 43,882 0.21%Naspers 1,723 394,718 1.88%Nedbank Group 1,542 33,207 0.16%Netcare 4,628 8,632 0.04%Old Mutual 19,054 33,585 0.16%Pick n Pay Stores 1,474 7,714 0.04%PSG Group 587 11,083 0.05%Rand Merchant Investment Holdings 2,735 7,593 0.04%Remgro 2,045 32,523 0.15%RMB Holdings 2,763 17,388 0.08%Sanlam 6,875 43,576 0.21%Sappi 2,089 12,282 0.06%Sasol 2,205 66,536 0.32%Shoprite Holdings 1,808 22,297 0.11%SPAR Group 764 11,480 0.05%Standard Bank Group 5,165 75,898 0.36%Telkom SOC 1,444 7,304 0.03%Tiger Brands 663 13,801 0.07%Truworths International 1,737 10,485 0.05%Vodacom Group 2,351 21,363 0.10%Woolworths Holdings 3,967 15,016 0.07%
Total South Africa 1,225,375 5.82%
South Korea 13.62%
Amorepacific 130 21,206 0.10%Amorepacific Preference Shares 23 2,108 0.01%Amorepacific Group 112 6,895 0.03%BGF Retail 31 5,127 0.02%BNK Financial Group 1,056 6,976 0.03%Celltrion 326 64,166 0.30%Celltrion Healthcare 197 13,173 0.06%Celltrion Pharm 60 3,392 0.02%Cheil Worldwide 294 6,210 0.03%CJ 59 6,390 0.03%CJ Preference Shares 8 264 0.00%CJ CheilJedang 33 10,158 0.05%CJ ENM 42 8,014 0.04%CJ Logistics 29 4,379 0.02%Coway 200 14,991 0.07%Daelim Industrial 109 10,433 0.05%Daewoo Engineering & Construction 656 3,054 0.01%Daewoo Shipbuilding & Marine Engineering 163 5,420 0.03%DB Insurance 193 12,055 0.06%DGB Financial Group 1,049 8,183 0.04%Doosan Bobcat 176 5,252 0.02%E-Mart 84 14,495 0.07%Fila Korea 201 8,599 0.04%GS Engineering & Construction 226 9,557 0.05%GS Holdings 204 9,974 0.05%GS Retail 104 3,370 0.02%Hana Financial Group 1,199 43,050 0.20%Hankook Tire 277 10,406 0.05%
23

Fidelity MSCI Emerging Markets Index Fund SCHEDULE OF INVESTMENTS (CONTINUED) AS AT 31 JANUARY 2019
Number of
Shares Fair Value
USDFund % of
NAV*
Equities 97.24% (continued)
South Korea 13.62% (continued)
Hanmi Pharm 24 9,361 0.04%Hanmi Science 58 3,821 0.02%Hanon Systems 722 8,306 0.04%Hanwha 170 5,371 0.03%Hanwha Chemical 357 7,203 0.03%Hanwha Life Insurance 1,515 5,855 0.03%HDC Holdings 65 1,090 0.01%HDC Hyundai Development-Engineering & Construction 120 5,312 0.03%HLB 126 8,493 0.04%Hotel Shilla 114 7,848 0.04%Hyundai Department Store 58 4,983 0.02%Hyundai Engineering & Construction 305 17,050 0.08%Hyundai Glovis 73 9,317 0.04%Hyundai Heavy Industries 147 18,298 0.09%Hyundai Heavy Industries Holdings 38 12,261 0.06%Hyundai Marine & Fire Insurance 245 8,224 0.04%Hyundai Mobis 268 54,195 0.26%Hyundai Motor 564 65,643 0.31%Hyundai Motor New Preference Shares 114 8,617 0.04%Hyundai Motor Preference Shares 93 6,428 0.03%Hyundai Steel 297 13,667 0.06%Industrial Bank of Korea 1,060 13,576 0.06%Kakao 198 17,671 0.08%Kangwon Land 467 14,270 0.07%KB Financial Group 1,576 68,060 0.32%KCC 21 6,172 0.03%Kia Motors 1,019 33,290 0.16%Korea Aerospace Industries 283 8,673 0.04%Korea Electric Power 987 30,604 0.15%Korea Gas 96 4,668 0.02%Korea Investment Holdings 160 9,246 0.04%Korea Zinc 33 13,065 0.06%Korean Air Lines 211 6,903 0.03%KT 264 3,648 0.02%KT&G 466 41,505 0.20%Kumho Petrochemical 60 4,853 0.02%LG 368 25,699 0.12%LG Chem 173 57,218 0.27%LG Chem Preference Shares 44 8,008 0.04%LG Display 992 16,851 0.08%LG Electronics 411 24,601 0.12%LG Household & Health Care 37 42,066 0.20%LG Household & Health Care Preference Shares 9 6,147 0.03%LG Innotek 61 5,345 0.03%LG Uplus 432 5,863 0.03%Lotte 107 5,030 0.02%Lotte Chemical 65 17,526 0.08%Lotte Shopping 45 7,927 0.04%Medy-Tox 17 7,914 0.04%Mirae Asset Daewoo 1,626 11,092 0.05%NAVER 551 67,349 0.32%NCSoft 68 28,633 0.14%Netmarble 94 9,040 0.04%NH Investment & Securities 499 6,256 0.03%OCI 61 5,866 0.03%Orange Life Insurance 117 3,149 0.01%Orion 85 8,671 0.04%Ottogi 5 3,501 0.02%Pan Ocean 879 3,575 0.02%Pearl Abyss 21 3,648 0.02%
24

Fidelity MSCI Emerging Markets Index Fund SCHEDULE OF INVESTMENTS (CONTINUED) AS AT 31 JANUARY 2019
Number of
Shares Fair Value
USDFund % of
NAV*
Equities 97.24% (continued)
South Korea 13.62% (continued)
POSCO 312 76,833 0.36%POSCO Chemtech 97 5,187 0.02%Posco Daewoo 199 3,577 0.02%S-1 62 5,739 0.03%Samsung Biologics 64 22,951 0.11%Samsung C&T 301 32,463 0.15%Samsung Card 128 3,837 0.02%Samsung Electro-Mechanics 212 20,578 0.10%Samsung Electronics 18,847 781,726 3.71%Samsung Electronics Preference Shares 3,407 114,827 0.55%Samsung Engineering 585 8,807 0.04%Samsung Fire & Marine Insurance 120 29,443 0.14%Samsung Heavy Industries 1,688 13,806 0.07%Samsung Life Insurance 291 23,094 0.11%Samsung SDI 235 47,205 0.22%Samsung SDS 134 26,917 0.13%Samsung Securities 223 6,704 0.03%Shinhan Financial Group 1,698 65,927 0.31%Shinsegae 29 6,894 0.03%SillaJen 227 15,383 0.07%SK Holdings 123 29,129 0.14%SK Hynix 2,277 151,234 0.72%SK Innovation 249 42,184 0.20%SK Telecom 79 18,318 0.09%S-Oil 175 16,436 0.08%ViroMed 50 12,403 0.06%Woori Bank 1,931 25,685 0.12%Yuhan 31 6,631 0.03%
Total South Korea 2,869,737 13.62%
Taiwan 10.36%
Acer 10,000 6,347 0.03%Advantech 2,000 14,876 0.07%Airtac International Group 1,000 11,458 0.05%ASE Technology Holding 13,000 25,389 0.12%Asia Cement 10,000 11,865 0.06%Asustek Computer 3,000 23,046 0.11%AU Optronics 37,000 14,332 0.07%Catcher Technology 3,000 22,606 0.11%Cathay Financial Holding 31,000 43,995 0.21%Chailease Holding 5,060 18,612 0.09%Chang Hwa Commercial Bank 18,520 10,791 0.05%Cheng Shin Rubber Industry 7,000 9,832 0.05%Chicony Electronics 4,010 8,758 0.04%China Airlines 7,000 2,404 0.01%China Development Financial Holding 48,000 15,593 0.07%China Life Insurance 9,360 8,455 0.04%China Steel 47,000 38,935 0.18%Chunghwa Telecom 15,000 52,244 0.25%Compal Electronics 15,000 8,886 0.04%CTBC Financial Holding 71,000 47,839 0.23%Delta Electronics 9,000 44,236 0.21%E.Sun Financial Holding 35,470 24,650 0.12%Eclat Textile 1,000 11,328 0.05%Eva Airways 6,300 3,056 0.01%Evergreen Marine Corporation Taiwan 11,549 4,492 0.02%Far Eastern New Century 15,000 14,501 0.07%Far EasTone Telecommunications 6,000 13,984 0.07%Feng TAY Enterprise 1,000 6,266 0.03%
25

Fidelity MSCI Emerging Markets Index Fund SCHEDULE OF INVESTMENTS (CONTINUED) AS AT 31 JANUARY 2019
Number of
Shares Fair Value
USDFund % of
NAV*
Equities 97.24% (continued)
Taiwan 10.36% (continued)
First Financial Holding 36,250 24,071 0.11%Formosa Chemicals & Fibre 14,000 48,533 0.23%Formosa Petrochemical 5,000 17,496 0.08%Formosa Plastics 18,000 59,762 0.28%Formosa Taffeta 3,000 3,437 0.02%Foxconn Technology 4,000 7,708 0.04%Fubon Financial Holding 25,000 36,253 0.17%Giant Manufacturing 1,000 4,948 0.02%Globalwafers 1,000 9,440 0.04%Highwealth Construction 4,000 6,243 0.03%Hiwin Technologies 1,030 8,114 0.04%Hon Hai Precision Industry 53,200 121,217 0.58%Hotai Motor 1,000 9,537 0.05%Hua Nan Financial Holdings 26,855 16,128 0.08%Innolux 41,000 13,946 0.07%Inventec 8,000 6,159 0.03%Lite-On Technology 10,000 14,729 0.07%MediaTek 7,000 55,368 0.26%Mega Financial Holding 41,000 35,500 0.17%Micro-Star International 3,000 7,236 0.03%Nan Ya Plastics 21,000 52,156 0.25%Nanya Technology 4,000 7,825 0.04%Nien Made Enterprise 1,000 8,463 0.04%Novatek Microelectronics 2,000 10,286 0.05%Pegatron 9,000 15,175 0.07%Phison Electronics 1,000 8,138 0.04%Pou Chen 8,000 9,583 0.05%Powertech Technology 3,000 6,904 0.03%President Chain Store 2,000 20,995 0.10%Quanta Computer 11,000 20,015 0.10%Realtek Semiconductor 2,000 10,644 0.05%Ruentex Development 3,200 4,844 0.02%Ruentex Industries 1,200 3,203 0.02%Shin Kong Financial Holding 35,446 10,026 0.05%SinoPac Financial Holdings 38,540 12,984 0.06%Standard Foods 1,000 1,624 0.01%Synnex Technology International 4,000 4,922 0.02%TaiMed Biologics 1,000 5,485 0.03%Taishin Financial Holding 36,064 15,965 0.08%Taiwan Business Bank 10,400 3,741 0.02%Taiwan Cement 18,000 21,884 0.10%Taiwan Cooperative Financial Holding 31,660 19,065 0.09%Taiwan High Speed Rail 7,000 7,098 0.03%Taiwan Mobile 6,000 21,386 0.10%Taiwan Semiconductor Manufacturing 97,000 697,784 3.31%Tatung 8,000 7,005 0.03%Uni-President Enterprises 18,000 42,127 0.20%United Microelectronics 52,000 19,211 0.09%Vanguard International Semiconductor 3,000 6,504 0.03%Walsin Technology 2,000 11,132 0.05%Win Semiconductors 1,000 4,866 0.02%Winbond Electronics 18,000 8,613 0.04%Wistron 12,205 8,383 0.04%WPG Holdings 5,520 6,998 0.03%Yageo 1,198 12,537 0.06%Yuanta Financial Holding 41,000 22,688 0.11%Zhen Ding Technology Holding 3,000 7,714 0.04%
Total Taiwan 2,182,574 10.36%
26

Fidelity MSCI Emerging Markets Index Fund SCHEDULE OF INVESTMENTS (CONTINUED) AS AT 31 JANUARY 2019
Number of
Shares Fair Value
USDFund % of
NAV*
Equities 97.24% (continued)
Thailand 2.38%
Advanced Info Service 4,100 23,425 0.11%Airports of Thailand 16,500 36,441 0.17%Bangkok Bank 1,100 7,570 0.04%Bangkok Dusit Medical Services 14,600 11,029 0.05%Bangkok Expressway & Metro 27,300 9,088 0.04%Banpu 8,200 4,357 0.02%Berli Jucker 4,700 7,334 0.03%BTS Group Holdings 22,600 7,234 0.03%Bumrungrad Hospital 1,300 7,739 0.04%Central Pattana 5,100 13,018 0.06%Charoen Pokphand Foods 14,400 12,560 0.06%CP ALL 20,100 50,020 0.24%Delta Electronics Thailand 2,500 5,561 0.03%Electricity Generating 500 4,193 0.02%Energy Absolute 5,000 7,602 0.04%Glow Energy 2,000 5,905 0.03%Gulf Energy Development 2,100 5,848 0.03%Home Product Center 15,400 7,690 0.04%Indorama Ventures 6,800 10,447 0.05%IRPC 33,000 6,073 0.03%Kasikornbank 800 5,121 0.02%Kasikornbank Foreign 6,300 40,330 0.19%Krung Thai Bank 12,500 7,922 0.04%Land & Houses 11,800 4,041 0.02%Minor International 8,700 10,791 0.05%Muangthai Capital 2,700 4,105 0.02%PTT 40,800 63,336 0.30%PTT Exploration & Production 5,200 20,472 0.10%PTT Global Chemical 9,000 19,589 0.09%Robinson 2,200 4,788 0.02%Siam Cement 1,500 22,469 0.11%Siam Commercial Bank 7,100 30,225 0.14%Thai Oil 4,200 9,679 0.05%Thai Union Group 8,500 5,088 0.02%TMB Bank 45,900 3,232 0.02%True 40,600 6,628 0.03%
Total Thailand 500,950 2.38%
Turkey 0.67%
Akbank 10,737 14,687 0.06%Anadolu Efes Biracilik Ve Malt Sanayii 964 4,105 0.02%Arcelik 616 2,204 0.01%Aselsan Elektronik Sanayi Ve Ticaret 1,210 6,008 0.03%BIM Birlesik Magazalar 760 13,252 0.06%Eregli Demir ve Celik Fabrikalari 5,780 9,481 0.05%Ford Otomotiv Sanayi 330 3,822 0.02%Haci Omer Sabanci Holding 4,136 7,487 0.04%KOC Holding 2,797 9,349 0.04%Petkim Petrokimya Holding 3,095 3,450 0.02%TAV Havalimanlari Holding 1,022 5,505 0.03%Tupras Turkiye Petrol Rafinerileri 499 13,401 0.06%Turk Hava Yollari 2,167 6,456 0.03%Turkcell Iletisim Hizmetleri 3,829 10,734 0.05%Turkiye Garanti Bankasi 8,049 14,089 0.06%Turkiye Halk Bankasi 1,605 2,357 0.01%Turkiye Is Bankasi 8,694 9,541 0.05%Turkiye Sise ve Cam Fabrikalari 3,265 4,283 0.02%Ulker Biskuvi Sanayi 400 1,422 0.01%
Total Turkey 141,633 0.67%
27

Fidelity MSCI Emerging Markets Index Fund SCHEDULE OF INVESTMENTS (CONTINUED) AS AT 31 JANUARY 2019
Number of
Shares Fair Value
USDFund % of
NAV*
Equities 97.24% (continued)
United Arab Emirates 0.70%
Abu Dhabi Commercial Bank 7,956 20,253 0.10%Aldar Properties 14,478 6,267 0.03%DAMAC Properties Dubai 6,382 2,276 0.01%DP World 610 10,858 0.05%Dubai Islamic Bank 7,124 9,892 0.05%Emaar Development 2,775 3,022 0.01%Emaar Malls 6,965 2,977 0.01%Emaar Properties 13,020 15,278 0.07%Emirates Telecommunications Group 7,130 33,039 0.16%First Abu Dhabi Bank 10,751 43,145 0.21%
Total United Arab Emirates 147,007 0.70%
United Kingdom 0.07%
Mondi 574 14,193 0.07%
United States 0.04%
Nexteer Automotive Group 5,000 7,519 0.04%
Total Equities 20,480,805 97.24%
Transferable Securities 0.40%
Mexico 0.09%
Fibra Uno Administracion REIT 14,100 19,444 0.09%
South Africa 0.31%
Fortress REIT (Class A) 3,890 5,672 0.03%Fortress REIT (Class B) 5,206 6,085 0.03%Growthpoint Properties REIT 12,304 24,079 0.11%Hyprop Investments REIT 1,181 8,010 0.04%Redefine Properties REIT 21,096 16,772 0.08%Resilient REIT 1,030 5,015 0.02%
Total South Africa 65,633 0.31%
Total Transferable Securities 85,077 0.40%
Warrants 0.00%
Thailand 0.00%
BTS Group Holdings (expires 29/11/2019) 1,744 35 0.00%
Total Warrants 35 0.00%
Financial Assets at Fair Value Through Profit or Loss 20,565,917 97.64%
28

Fidelity MSCI Emerging Markets Index Fund SCHEDULE OF INVESTMENTS (CONTINUED) AS AT 31 JANUARY 2019
Financial Derivative Instruments 0.18%
Futures Contracts 0.18%
BrokerNumber of Contracts
Notional Amount
UnrealisedGain/(Loss)
USDFund % of
NAV*MSCI Emerging Markets 15 March 2019 Morgan Stanley 9 441,758 37,313 0.18%
Net Futures Contracts 37,313 0.18%
Total Financial Derivative Instruments 37,313 0.18% Other Assets and Liabilities 460,494 2.18%Net Assets Attributable to Holders of Redeemable Participating Shares 21,063,724 100.00%
Analysis of Assets USDFund % of
Assets(a) Transferable securities admitted to an official stock exchange listing 20,565,917 97.30%(b) Financial derivative instruments 37,313 0.18%(c) Other assets 533,601 2.52%Total Assets 21,136,831 100.00%
*The percentage of net assets disclosed above is subject to rounding.
29
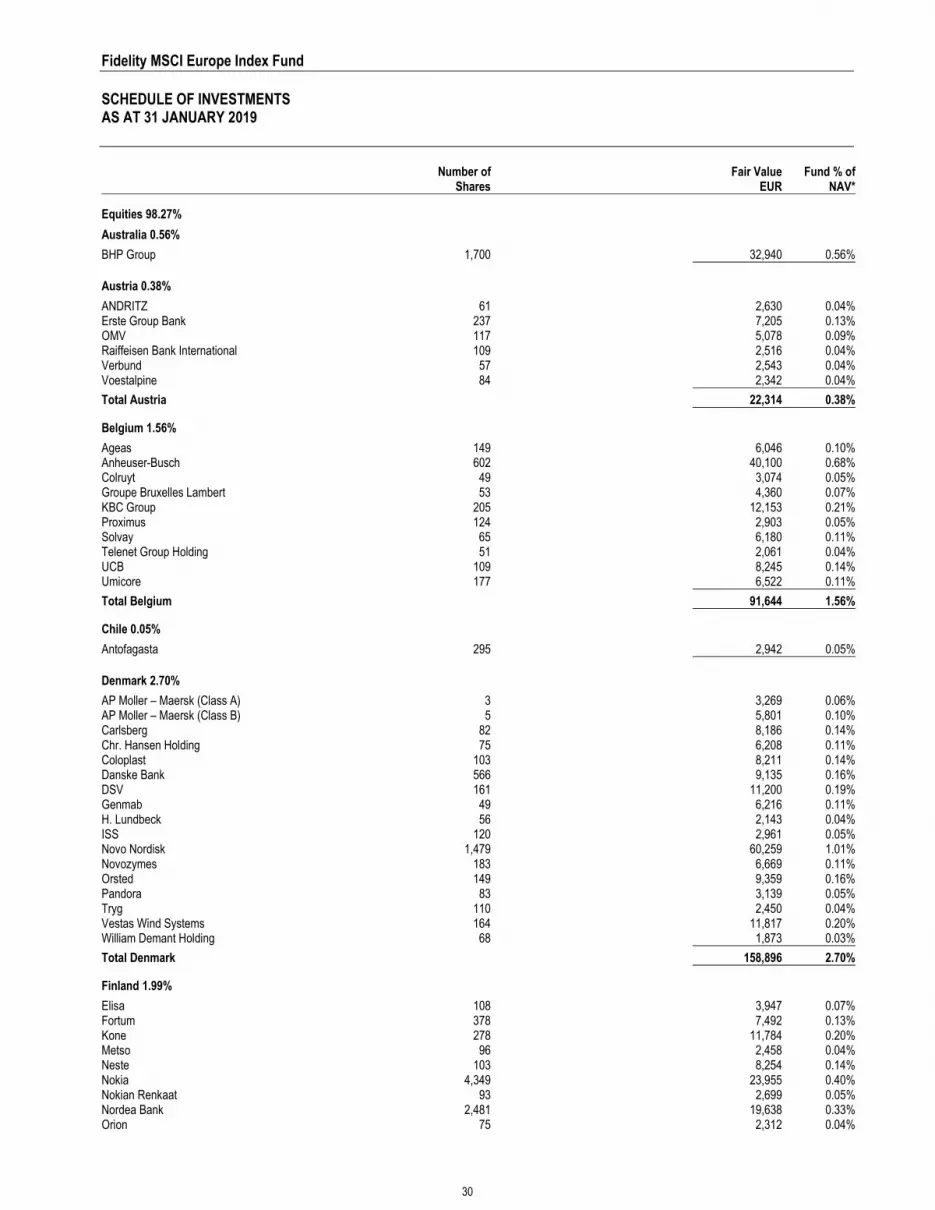
Fidelity MSCI Europe Index Fund SCHEDULE OF INVESTMENTS AS AT 31 JANUARY 2019
Number of
Shares Fair Value
EURFund % of
NAV*
Equities 98.27%
Australia 0.56%
BHP Group 1,700 32,940 0.56%
Austria 0.38%
ANDRITZ 61 2,630 0.04%Erste Group Bank 237 7,205 0.13%OMV 117 5,078 0.09%Raiffeisen Bank International 109 2,516 0.04%Verbund 57 2,543 0.04%Voestalpine 84 2,342 0.04%
Total Austria 22,314 0.38%
Belgium 1.56%
Ageas 149 6,046 0.10%Anheuser-Busch 602 40,100 0.68%Colruyt 49 3,074 0.05%Groupe Bruxelles Lambert 53 4,360 0.07%KBC Group 205 12,153 0.21%Proximus 124 2,903 0.05%Solvay 65 6,180 0.11%Telenet Group Holding 51 2,061 0.04%UCB 109 8,245 0.14%Umicore 177 6,522 0.11%
Total Belgium 91,644 1.56%
Chile 0.05%
Antofagasta 295 2,942 0.05%
Denmark 2.70%
AP Moller – Maersk (Class A) 3 3,269 0.06%AP Moller – Maersk (Class B) 5 5,801 0.10%Carlsberg 82 8,186 0.14%Chr. Hansen Holding 75 6,208 0.11%Coloplast 103 8,211 0.14%Danske Bank 566 9,135 0.16%DSV 161 11,200 0.19%Genmab 49 6,216 0.11%H. Lundbeck 56 2,143 0.04%ISS 120 2,961 0.05%Novo Nordisk 1,479 60,259 1.01%Novozymes 183 6,669 0.11%Orsted 149 9,359 0.16%Pandora 83 3,139 0.05%Tryg 110 2,450 0.04%Vestas Wind Systems 164 11,817 0.20%William Demant Holding 68 1,873 0.03%
Total Denmark 158,896 2.70%
Finland 1.99%
Elisa 108 3,947 0.07%Fortum 378 7,492 0.13%Kone 278 11,784 0.20%Metso 96 2,458 0.04%Neste 103 8,254 0.14%Nokia 4,349 23,955 0.40%Nokian Renkaat 93 2,699 0.05%Nordea Bank 2,481 19,638 0.33%Orion 75 2,312 0.04%
30

Fidelity MSCI Europe Index Fund SCHEDULE OF INVESTMENTS (CONTINUED) AS AT 31 JANUARY 2019
Number of
Shares Fair Value
EURFund % of
NAV*
Equities 98.27% (continued)
Finland 1.99% (continued)
Sampo 350 13,990 0.24%Stora Enso 413 4,830 0.08%UPM-Kymmene 417 10,533 0.18%Wartsila 355 5,050 0.09%
Total Finland 116,942 1.99%
France 16.30%
Accor 142 5,400 0.09%Aeroports de Paris 21 3,511 0.06%Air Liquide 340 36,022 0.61%Airbus 464 46,501 0.79%Alstom 131 4,609 0.08%Amundi 50 2,510 0.04%Arkema 53 4,395 0.07%Atos 82 6,537 0.11%AXA 1,540 31,177 0.53%BioMerieux 37 2,283 0.04%BNP Paribas 894 36,622 0.62%Bollore 707 2,547 0.04%Bouygues 173 5,349 0.09%Bureau Veritas 274 5,316 0.09%Capgemini 133 12,832 0.22%Carrefour 503 8,694 0.15%Casino Guichard Perrachon 57 2,452 0.04%Cie de Saint-Gobain 388 11,687 0.20%Cie Generale des Etablissements Michelin 139 13,183 0.22%CNP Assurances 139 2,758 0.05%Credit Agricole 976 9,720 0.17%Danone 477 30,290 0.51%Dassault Aviation 2 2,602 0.04%Dassault Systemes 109 11,941 0.20%Edenred 183 6,486 0.11%Eiffage 60 4,915 0.08%Electricite de France 462 6,667 0.11%Engie 1,438 20,110 0.34%EssilorLuxottica 226 25,007 0.43%Eurazeo 39 2,531 0.04%Eutelsat Communications 117 2,165 0.04%Faurecia 56 2,137 0.04%Getlink 415 5,304 0.09%Hermes International 29 15,208 0.26%Iliad 18 1,802 0.03%Imerys 19 874 0.01%Ingenico Group 39 1,857 0.03%Ipsen 29 3,190 0.05%JCDecaux 39 1,009 0.02%Kering 59 25,813 0.44%Legrand 218 11,284 0.19%L'Oreal 200 42,019 0.71%LVMH 221 61,824 1.06%Natixis 668 2,987 0.05%Orange 1,532 20,789 0.35%Pernod Ricard 172 24,940 0.42%Peugeot 445 9,786 0.17%Publicis Groupe 173 9,221 0.16%Remy Cointreau 22 2,233 0.04%Renault 160 9,896 0.17%Rexel 239 2,380 0.04%Safran 259 29,656 0.50%
31

Fidelity MSCI Europe Index Fund SCHEDULE OF INVESTMENTS (CONTINUED) AS AT 31 JANUARY 2019
Number of
Shares Fair Value
EURFund % of
NAV*
Equities 98.27% (continued)
France 16.30% (continued)
Sanofi 884 67,024 1.15%Sartorius Stedim Biotech 22 2,119 0.04%Schneider Electric 438 27,191 0.46%SCOR 127 4,663 0.08%SEB 19 2,546 0.04%Societe BIC 27 2,364 0.04%Societe Generale 599 16,257 0.28%Sodexo 77 7,007 0.12%Suez 274 3,065 0.05%Teleperformance 45 6,764 0.11%Thales 85 8,216 0.14%Total 1,888 90,585 1.55%Ubisoft Entertainment 70 5,425 0.09%Valeo 208 5,672 0.10%Veolia Environnement 411 7,571 0.13%Vinci 402 30,906 0.53%Vivendi 817 18,170 0.31%Wendel 23 2,450 0.04%
Total France 959,023 16.30%
Germany 13.74%
1&1 Drillisch 48 1,741 0.03%Adidas 147 30,532 0.52%Allianz 339 62,687 1.07%Axel Springer 41 2,189 0.04%BASF 728 46,461 0.79%Bayer 737 48,788 0.83%Bayerische Motoren Werke 251 18,438 0.31%Bayerische Motoren Werke Preference Shares 47 3,029 0.05%Beiersdorf 75 6,548 0.11%Brenntag 134 5,528 0.09%Commerzbank 759 4,752 0.08%Continental 90 12,389 0.21%Covestro 145 6,986 0.12%Daimler 736 38,022 0.65%Delivery Hero 89 2,866 0.05%Deutsche Bank 1,626 12,595 0.21%Deutsche Boerse 153 17,786 0.30%Deutsche Lufthansa 209 4,611 0.08%Deutsche Post 785 20,222 0.34%Deutsche Telekom 2,665 37,816 0.64%Deutsche Wohnen 284 12,380 0.21%E.ON 1,836 17,772 0.30%Evonik Industries 117 2,792 0.05%Fraport Frankfurt Airport Services Worldwide 38 2,620 0.04%Fresenius Medical Care 180 11,585 0.20%Fresenius 325 14,723 0.25%FUCHS PETROLUB 56 2,292 0.04%GEA Group 115 2,762 0.05%Hannover Rueck 47 5,917 0.10%HeidelbergCement 127 7,666 0.13%Henkel 85 6,804 0.12%Henkel Preference Shares 143 12,138 0.21%HOCHTIEF 18 2,349 0.04%HUGO BOSS 47 2,944 0.05%Infineon Technologies 919 17,842 0.30%Innogy 125 5,175 0.09%KION Group 54 2,723 0.05%LANXESS 63 3,025 0.05%
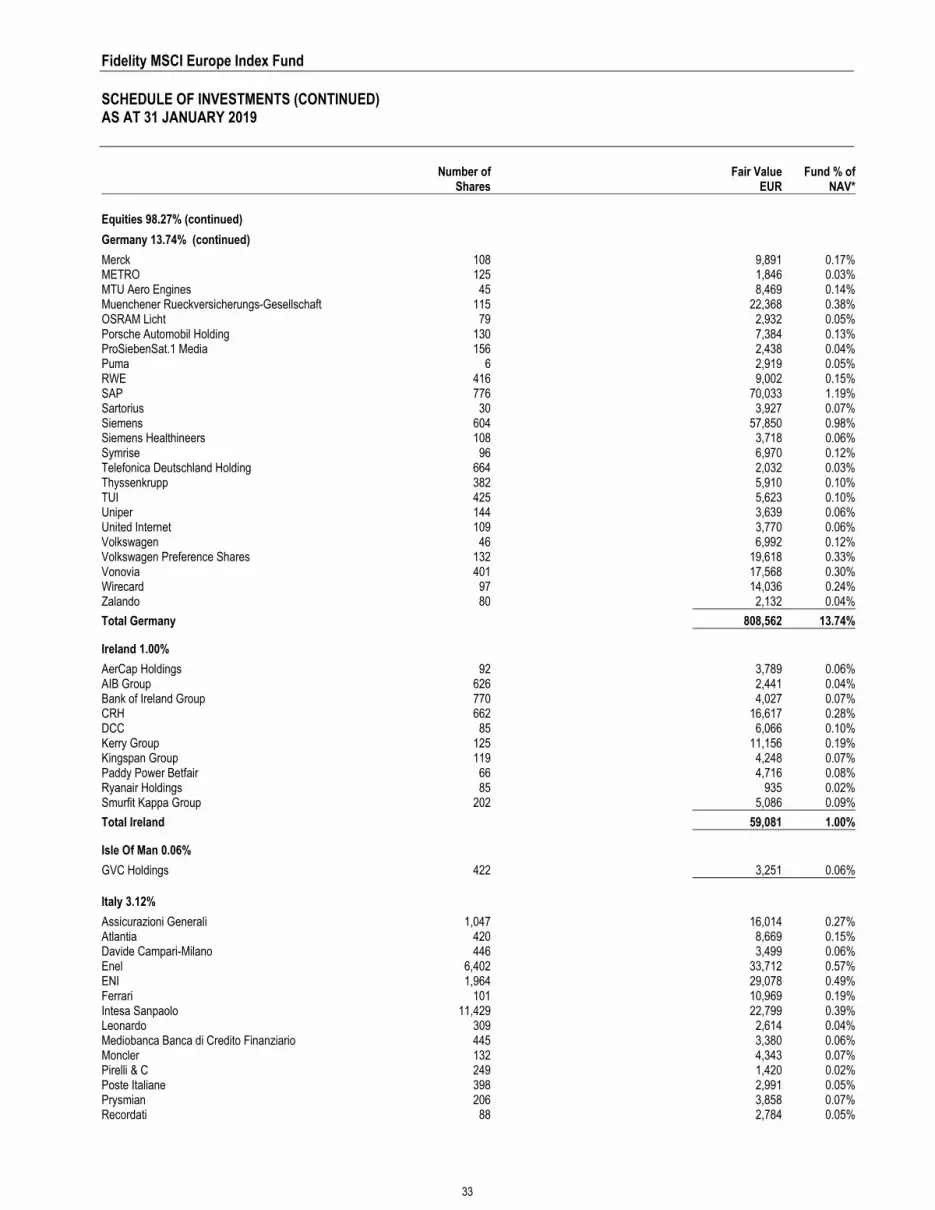
32
Fidelity MSCI Europe Index Fund SCHEDULE OF INVESTMENTS (CONTINUED) AS AT 31 JANUARY 2019
Number of
Shares Fair Value
EURFund % of
NAV*
Equities 98.27% (continued)
Germany 13.74% (continued)
Merck 108 9,891 0.17%METRO 125 1,846 0.03%MTU Aero Engines 45 8,469 0.14%Muenchener Rueckversicherungs-Gesellschaft 115 22,368 0.38%OSRAM Licht 79 2,932 0.05%Porsche Automobil Holding 130 7,384 0.13%ProSiebenSat.1 Media 156 2,438 0.04%Puma 6 2,919 0.05%RWE 416 9,002 0.15%SAP 776 70,033 1.19%Sartorius 30 3,927 0.07%Siemens 604 57,850 0.98%Siemens Healthineers 108 3,718 0.06%Symrise 96 6,970 0.12%Telefonica Deutschland Holding 664 2,032 0.03%Thyssenkrupp 382 5,910 0.10%TUI 425 5,623 0.10%Uniper 144 3,639 0.06%United Internet 109 3,770 0.06%Volkswagen 46 6,992 0.12%Volkswagen Preference Shares 132 19,618 0.33%Vonovia 401 17,568 0.30%Wirecard 97 14,036 0.24%Zalando 80 2,132 0.04%
Total Germany 808,562 13.74%
Ireland 1.00%
AerCap Holdings 92 3,789 0.06%AIB Group 626 2,441 0.04%Bank of Ireland Group 770 4,027 0.07%CRH 662 16,617 0.28%DCC 85 6,066 0.10%Kerry Group 125 11,156 0.19%Kingspan Group 119 4,248 0.07%Paddy Power Betfair 66 4,716 0.08%Ryanair Holdings 85 935 0.02%Smurfit Kappa Group 202 5,086 0.09%
Total Ireland 59,081 1.00%
Isle Of Man 0.06%
GVC Holdings 422 3,251 0.06%
Italy 3.12%
Assicurazioni Generali 1,047 16,014 0.27%Atlantia 420 8,669 0.15%Davide Campari-Milano 446 3,499 0.06%Enel 6,402 33,712 0.57%ENI 1,964 29,078 0.49%Ferrari 101 10,969 0.19%Intesa Sanpaolo 11,429 22,799 0.39%Leonardo 309 2,614 0.04%Mediobanca Banca di Credito Finanziario 445 3,380 0.06%Moncler 132 4,343 0.07%Pirelli & C 249 1,420 0.02%Poste Italiane 398 2,991 0.05%Prysmian 206 3,858 0.07%Recordati 88 2,784 0.05%
33

Fidelity MSCI Europe Index Fund SCHEDULE OF INVESTMENTS (CONTINUED) AS AT 31 JANUARY 2019
Number of
Shares Fair Value
EURFund % of
NAV*
Equities 98.27% (continued)
Italy 3.12% (continued)
Snam 1,950 8,132 0.14%Telecom Italia 8,941 4,345 0.07%Telecom Italia (Non CVA) 4,874 2,082 0.04%Terna Rete Elettrica Nazionale 1,153 6,194 0.11%UniCredit 1,656 16,706 0.28%
Total Italy 183,589 3.12%
Luxembourg 0.57%
ArcelorMittal 562 11,351 0.19%Aroundtown 589 4,547 0.08%Eurofins Scientific 9 3,164 0.05%Millicom International Cellular 50 2,726 0.05%RTL Group 41 1,958 0.03%SES 320 5,702 0.10%Tenaris 386 4,232 0.07%
Total Luxembourg 33,680 0.57%
Mexico 0.04%
Fresnillo 220 2,535 0.04%
Netherlands 7.57%
ABN AMRO Group 356 7,732 0.13%Aegon 1,401 6,279 0.11%Akzo Nobel 183 13,791 0.23%ASML Holding 324 49,643 0.84%EXOR 91 5,078 0.09%Heineken 204 15,990 0.27%Heineken Holding 104 7,883 0.13%ING Groep 3,014 31,080 0.53%Koninklijke Ahold Delhaize 990 22,790 0.39%Koninklijke DSM 152 12,400 0.21%Koninklijke KPN 2,579 6,930 0.12%Koninklijke Philips 740 25,426 0.43%Koninklijke Vopak 60 2,665 0.05%NN Group 245 9,045 0.15%NXP Semiconductors 283 21,465 0.36%QIAGEN 179 5,764 0.10%Randstad 107 4,506 0.08%Royal Dutch Shell (A Shares) 3,828 103,656 1.77%Royal Dutch Shell (B Shares) 2,972 80,698 1.37%Wolters Kluwer 231 12,566 0.21%
Total Netherlands 445,387 7.57%
Norway 1.19%
Aker BP 90 2,615 0.04%DNB 802 12,392 0.21%Equinor 959 19,129 0.33%Gjensidige Forsikring 173 2,601 0.04%Mowi 325 6,241 0.11%Norsk Hydro 1,123 4,522 0.08%Orkla 699 4,910 0.08%Schibsted 87 2,408 0.04%Telenor 605 9,977 0.17%Yara International 150 5,402 0.09%
Total Norway 70,197 1.19%
34

Fidelity MSCI Europe Index Fund SCHEDULE OF INVESTMENTS (CONTINUED) AS AT 31 JANUARY 2019
Number of
Shares Fair Value
EURFund % of
NAV*
Equities 98.27% (continued)
Portugal 0.25%
Energias de Portugal 2,195 7,002 0.12%Galp Energia 391 5,335 0.09%Jeronimo Martins 205 2,536 0.04%
Total Portugal 14,873 0.25%
South Africa 0.05% Investec 507 2,843 0.05%Old Mutual 1 2 0.00%
Total South Africa 2,845 0.05%
Spain 4.81%
ACS Actividades de Construccion y Servicios 209 7,545 0.13%ACS Actividades de Construccion y Servicios – Right Issue 209 100 0.00%Aena SME 56 8,445 0.14%Amadeus IT Group 352 22,345 0.38%Banco Bilbao Vizcaya Argentaria 5,150 26,626 0.45%Banco de Sabadell 4,382 4,379 0.07%Banco Santander 12,913 53,356 0.92%Bankia 937 2,380 0.04%Bankinter 632 4,303 0.07%CaixaBank 3,053 10,069 0.17%Enagas 212 5,391 0.09%Endesa 247 5,390 0.09%Ferrovial 377 7,378 0.13%Grifols 235 5,346 0.09%Iberdrola 103 742 0.01%Iberdrola Interim 4,860 34,991 0.60%Industria de Diseno Textil 864 21,038 0.36%Mapfre 981 2,382 0.04%Naturgy Energy Group 275 6,696 0.11%Red Electrica 339 6,814 0.12%Repsol 1,141 17,492 0.30%Siemens Gamesa Renewable Energy 206 2,550 0.04%Telefonica 3,614 27,087 0.46%
Total Spain 282,845 4.81%
Sweden 3.94%
Alfa Laval 251 4,952 0.08%Assa Abloy 822 13,322 0.23%Atlas Copco (A Shares) 548 12,431 0.21%Atlas Copco (B Shares) 297 6,182 0.11%Boliden 219 4,763 0.08%Electrolux 171 3,520 0.06%Epiroc (A Shares) 392 3,274 0.06%Epiroc (B Shares) 394 3,071 0.05%Essity 504 12,147 0.21%Hennes & Mauritz 733 9,927 0.17%Hexagon 203 8,635 0.15%Husqvarna 359 2,386 0.04%ICA Gruppen 74 2,267 0.04%Industrivarden 200 3,586 0.06%Investor 366 14,000 0.24%Kinnevik 197 4,186 0.07%L. E. Lundbergforetagen 40 1,075 0.02%Lundin Petroleum 135 3,765 0.06%Sandvik 918 12,760 0.22%Securitas 227 3,176 0.05%Skandinaviska Enskilda Banken 1,351 12,337 0.21%Skanska 305 4,646 0.08%
35

Fidelity MSCI Europe Index Fund SCHEDULE OF INVESTMENTS (CONTINUED) AS AT 31 JANUARY 2019
Number of
Shares Fair Value
EURFund % of
NAV*
Equities 98.27% (continued)
Sweden 3.94% (continued)
SKF 331 4,842 0.08%Svenska Handelsbanken 1,256 11,881 0.20%Swedbank 759 14,995 0.25%Swedish Match 134 5,224 0.09%Tele2 380 4,133 0.07%Telefonaktiebolaget LM Ericsson 2,536 19,632 0.34%Telia 2,236 8,482 0.14%Volvo 1,272 15,936 0.27%
Total Sweden 231,533 3.94%
Switzerland 14.80%
ABB 1,502 25,009 0.43%Adecco Group 130 5,679 0.10%Baloise Holding 40 5,401 0.09%Barry Callebaut 2 2,969 0.05%Chocoladefabriken Lindt & Spruengli 1 5,556 0.09%Cie Financiere Richemont 426 25,604 0.44%Clariant 120 2,079 0.04%Coca-Cola HBC 167 4,897 0.08%Credit Suisse Group 2,073 21,879 0.37%Dufry 31 2,704 0.05%EMS-Chemie Holding 8 3,486 0.06%Ferguson 188 10,979 0.19%Geberit 30 10,228 0.17%Givaudan 8 16,922 0.29%Glencore 9,179 32,563 0.55%Julius Baer Group 181 6,331 0.11%Kuehne + Nagel International 45 5,313 0.09%LafargeHolcim 393 16,098 0.27%Lonza Group 62 14,264 0.24%Nestle 2,489 188,995 3.21%Novartis 1,770 134,493 2.29%Pargesa Holding 37 2,547 0.04%Partners Group Holding 13 7,794 0.13%Roche Holding 573 132,858 2.26%Schindler Holding 38 7,043 0.12%Schindler Holding Registered 20 3,682 0.06%SGS 4 8,415 0.14%Sika 105 12,083 0.21%Sonova Holding 48 7,851 0.13%STMicroelectronics 570 7,903 0.13%Straumann Holding 8 5,063 0.09%Swatch Group 18 4,510 0.08%Swatch Group Registered 85 4,129 0.07%Swiss Life Holding 26 9,348 0.16%Swiss Prime Site 62 4,583 0.08%Swiss Re 244 20,401 0.35%Swisscom 22 9,199 0.16%Temenos 54 6,352 0.11%UBS Group 3,151 35,568 0.60%Vifor Pharma 32 3,550 0.06%Zurich Insurance Group 132 36,143 0.61%
Total Switzerland 870,471 14.80%
United Arab Emirates 0.04%
NMC Health 87 2,569 0.04%
36
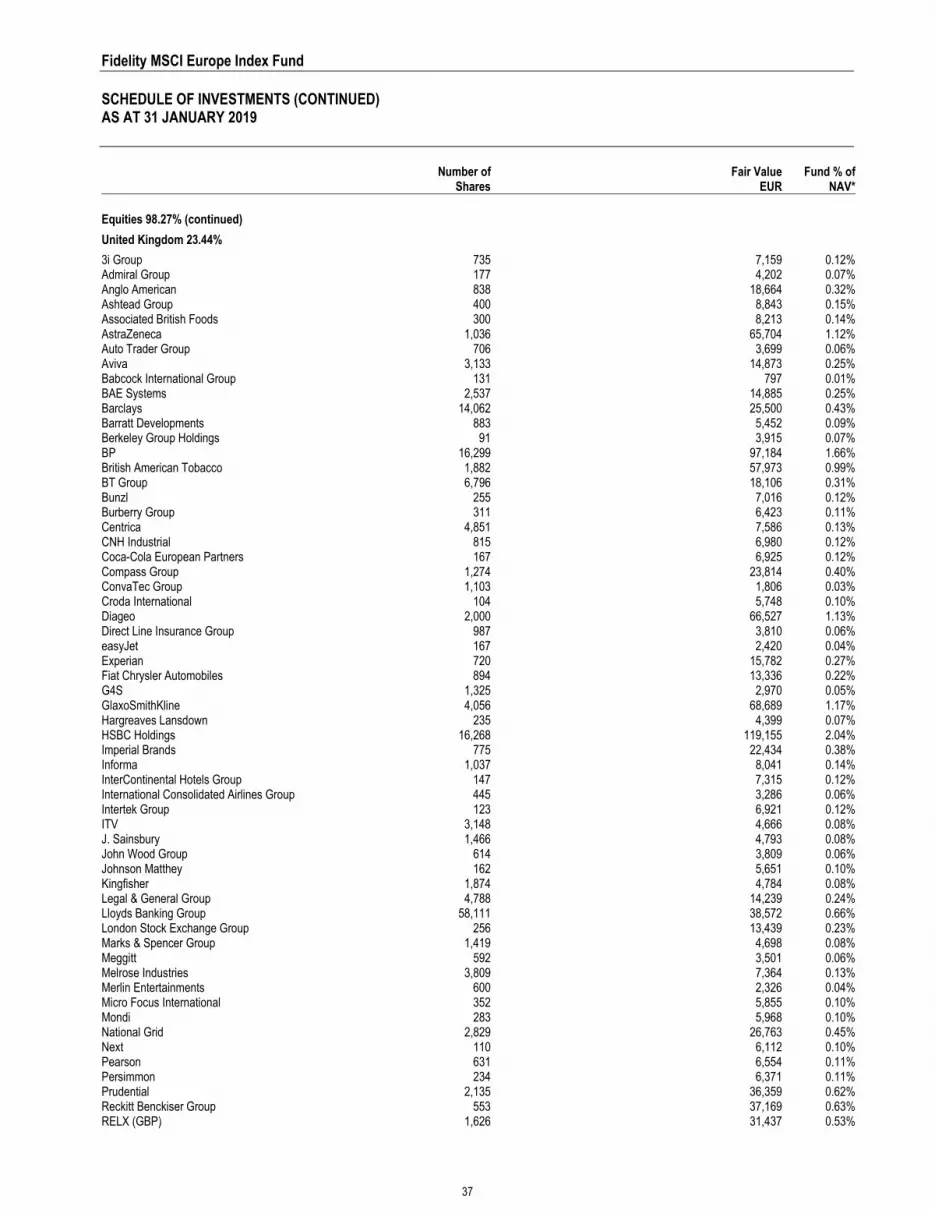
Fidelity MSCI Europe Index Fund SCHEDULE OF INVESTMENTS (CONTINUED) AS AT 31 JANUARY 2019
Number of
Shares Fair Value
EURFund % of
NAV*
Equities 98.27% (continued)
United Kingdom 23.44%
3i Group 735 7,159 0.12%Admiral Group 177 4,202 0.07%Anglo American 838 18,664 0.32%Ashtead Group 400 8,843 0.15%Associated British Foods 300 8,213 0.14%AstraZeneca 1,036 65,704 1.12%Auto Trader Group 706 3,699 0.06%Aviva 3,133 14,873 0.25%Babcock International Group 131 797 0.01%BAE Systems 2,537 14,885 0.25%Barclays 14,062 25,500 0.43%Barratt Developments 883 5,452 0.09%Berkeley Group Holdings 91 3,915 0.07%BP 16,299 97,184 1.66%British American Tobacco 1,882 57,973 0.99%BT Group 6,796 18,106 0.31%Bunzl 255 7,016 0.12%Burberry Group 311 6,423 0.11%Centrica 4,851 7,586 0.13%CNH Industrial 815 6,980 0.12%Coca-Cola European Partners 167 6,925 0.12%Compass Group 1,274 23,814 0.40%ConvaTec Group 1,103 1,806 0.03%Croda International 104 5,748 0.10%Diageo 2,000 66,527 1.13%Direct Line Insurance Group 987 3,810 0.06%easyJet 167 2,420 0.04%Experian 720 15,782 0.27%Fiat Chrysler Automobiles 894 13,336 0.22%G4S 1,325 2,970 0.05%GlaxoSmithKline 4,056 68,689 1.17%Hargreaves Lansdown 235 4,399 0.07%HSBC Holdings 16,268 119,155 2.04%Imperial Brands 775 22,434 0.38%Informa 1,037 8,041 0.14%InterContinental Hotels Group 147 7,315 0.12%International Consolidated Airlines Group 445 3,286 0.06%Intertek Group 123 6,921 0.12%ITV 3,148 4,666 0.08%J. Sainsbury 1,466 4,793 0.08%John Wood Group 614 3,809 0.06%Johnson Matthey 162 5,651 0.10%Kingfisher 1,874 4,784 0.08%Legal & General Group 4,788 14,239 0.24%Lloyds Banking Group 58,111 38,572 0.66%London Stock Exchange Group 256 13,439 0.23%Marks & Spencer Group 1,419 4,698 0.08%Meggitt 592 3,501 0.06%Melrose Industries 3,809 7,364 0.13%Merlin Entertainments 600 2,326 0.04%Micro Focus International 352 5,855 0.10%Mondi 283 5,968 0.10%National Grid 2,829 26,763 0.45%Next 110 6,112 0.10%Pearson 631 6,554 0.11%Persimmon 234 6,371 0.11%Prudential 2,135 36,359 0.62%Reckitt Benckiser Group 553 37,169 0.63%RELX (GBP) 1,626 31,437 0.53%
37

Fidelity MSCI Europe Index Fund SCHEDULE OF INVESTMENTS (CONTINUED) AS AT 31 JANUARY 2019
Number of
Shares Fair Value
EURFund % of
NAV*
Equities 98.27% (continued)
United Kingdom 23.44% (continued)
Rio Tinto 954 45,798 0.78%Rolls-Royce Holdings 1,391 14,103 0.24%Royal Bank of Scotland Group 4,031 11,132 0.19%Royal Mail 640 1,967 0.03%RSA Insurance Group 864 5,079 0.09%Sage Group 852 6,114 0.10%Schroders 112 3,352 0.06%Severn Trent 213 4,880 0.08%Smith & Nephew 737 12,124 0.21%Smiths Group 321 5,316 0.09%SSE 862 11,562 0.20%St. James's Place 446 4,796 0.08%Standard Chartered 2,348 16,525 0.28%Standard Life Aberdeen 2,021 5,830 0.10%Taylor Wimpey 2,843 5,383 0.09%Tesco 7,883 20,162 0.34%Unilever 920 42,024 0.71%Unilever (CVA) 1,226 57,187 0.97%United Utilities Group 586 5,581 0.09%Vodafone Group 22,112 35,129 0.60%Weir Group 228 3,934 0.07%Whitbread 154 8,628 0.15%WM Morrison Supermarkets 1,939 5,207 0.09%WPP 1,009 10,061 0.17%
Total United Kingdom 1,378,856 23.44%
United States 0.11%
Carnival 135 6,667 0.11%
Total Equities 5,781,642 98.27%
Transferable Securities 0.90%
France 0.55%
Covivio REIT 42 3,751 0.06%Gecina REIT 35 4,487 0.08%ICADE REIT 31 2,282 0.04%Klepierre REIT 167 5,003 0.09%Unibail-Rodamco-Westfield 106 16,659 0.28%
Total France 32,182 0.55%
United Kingdom 0.35%
British Land REIT 882 5,798 0.10%Hammerson REIT 579 2,469 0.04%Land Securities Group REIT 645 6,397 0.11%Segro REIT 810 6,008 0.10%
Total United Kingdom 20,672 0.35%
Total Transferable Securities 52,854 0.90%
Financial Assets at Fair Value Through Profit or Loss 5,834,496 99.17%
38

Fidelity MSCI Europe Index Fund SCHEDULE OF INVESTMENTS (CONTINUED) AS AT 31 JANUARY 2019
Financial Derivative Instruments (0.03%) Open Forward Foreign Exchange Contracts held for Portfolio Hedging Purposes (0.04%)
Currency Buy Amount Currency (Sell) Amount Counterparty Settlement Date
Unrealised Gain/(Loss)
EURFund % of
NAV*EUR 213,010 CHF (241,159) Brown Brothers Harriman 18/02/2019 1,137 0.02%EUR 66,155 SEK (679,121) Brown Brothers Harriman 18/02/2019 741 0.01%EUR 8,406 USD (9,598) Brown Brothers Harriman 19/02/2019 52 0.00%EUR 7,944 CHF (8,994) Brown Brothers Harriman 18/02/2019 42 0.00%EUR 2,433 SEK (24,974) Brown Brothers Harriman 18/02/2019 27 0.00%GBP 4,969 EUR (5,671) Brown Brothers Harriman 18/02/2019 23 0.00%EUR 1,614 SEK (16,538) Brown Brothers Harriman 18/02/2019 21 0.00%EUR 6,617 GBP (5,759) Brown Brothers Harriman 18/02/2019 17 0.00%EUR 3,872 GBP (3,367) Brown Brothers Harriman 18/02/2019 15 0.00%EUR 2,504 CHF (2,836) Brown Brothers Harriman 18/02/2019 13 0.00%EUR 2,726 CHF (3,088) Brown Brothers Harriman 18/02/2019 13 0.00%EUR 42,808 DKK (319,512) Brown Brothers Harriman 18/02/2019 11 0.00%EUR 1,986 CHF (2,251) Brown Brothers Harriman 18/02/2019 9 0.00%EUR 1,587 GBP (1,380) Brown Brothers Harriman 18/02/2019 5 0.00%EUR 356 USD (404) Brown Brothers Harriman 19/02/2019 4 0.00%EUR 813 CHF (923) Brown Brothers Harriman 18/02/2019 3 0.00%EUR 3,412 CHF (3,880) Brown Brothers Harriman 18/02/2019 3 0.00%EUR 620 SEK (6,423) Brown Brothers Harriman 18/02/2019 2 0.00%EUR 311 USD (355) Brown Brothers Harriman 19/02/2019 2 0.00%NOK 2,222 EUR (228) Brown Brothers Harriman 18/02/2019 2 0.00%NOK 2,371 EUR (244) Brown Brothers Harriman 18/02/2019 2 0.00%EUR 137 CHF (155) Brown Brothers Harriman 18/02/2019 1 0.00%EUR 1,061 SEK (11,002) Brown Brothers Harriman 18/02/2019 1 0.00%EUR 283 SEK (2,926) Brown Brothers Harriman 18/02/2019 1 0.00%EUR 45 SEK (461) Brown Brothers Harriman 18/02/2019 1 0.00%EUR 139 USD (159) Brown Brothers Harriman 19/02/2019 1 0.00%NOK 2,484 EUR (256) Brown Brothers Harriman 18/02/2019 1 0.00%EUR 111 USD (126) Brown Brothers Harriman 19/02/2019 1 0.00%EUR 380 CHF (433) Brown Brothers Harriman 18/02/2019 0 0.00%EUR 117 CHF (133) Brown Brothers Harriman 18/02/2019 0 0.00%EUR 1,585 DKK (11,830) Brown Brothers Harriman 18/02/2019 0 0.00%EUR 88 DKK (655) Brown Brothers Harriman 18/02/2019 0 0.00%EUR 74 DKK (552) Brown Brothers Harriman 18/02/2019 0 0.00%EUR 173 DKK (1,290) Brown Brothers Harriman 18/02/2019 0 0.00%EUR 390 DKK (2,910) Brown Brothers Harriman 18/02/2019 0 0.00%EUR 673 DKK (5,023) Brown Brothers Harriman 18/02/2019 0 0.00%EUR 25 DKK (185) Brown Brothers Harriman 18/02/2019 0 0.00%DKK 131 EUR (18) Brown Brothers Harriman 18/02/2019 0 0.00%DKK 141 EUR (19) Brown Brothers Harriman 18/02/2019 0 0.00%EUR 29 DKK (218) Brown Brothers Harriman 18/02/2019 0 0.00%EUR 30 NOK (288) Brown Brothers Harriman 18/02/2019 0 0.00%EUR 795 GBP (694) Brown Brothers Harriman 18/02/2019 0 0.00%EUR 7 NOK (73) Brown Brothers Harriman 18/02/2019 0 0.00%EUR 14 USD (16) Brown Brothers Harriman 19/02/2019 0 0.00%EUR 31 SEK (322) Brown Brothers Harriman 18/02/2019 0 0.00%EUR 29 SEK (299) Brown Brothers Harriman 18/02/2019 0 0.00%EUR 111 SEK (1,149) Brown Brothers Harriman 18/02/2019 0 0.00%EUR 8 NOK (78) Brown Brothers Harriman 18/02/2019 0 0.00%EUR 131 SEK (1,359) Brown Brothers Harriman 18/02/2019 0 0.00%EUR 81 USD (92) Brown Brothers Harriman 19/02/2019 0 0.00%EUR 19 USD (22) Brown Brothers Harriman 19/02/2019 0 0.00%EUR 4 USD (5) Brown Brothers Harriman 19/02/2019 0 0.00%EUR 65 NOK (630) Brown Brothers Harriman 18/02/2019 0 0.00%NOK 90 EUR (9) Brown Brothers Harriman 18/02/2019 0 0.00%EUR 30 NOK (285) Brown Brothers Harriman 18/02/2019 0 0.00%USD 10 EUR (9) Brown Brothers Harriman 19/02/2019 0 0.00%EUR 39 USD (44) Brown Brothers Harriman 19/02/2019 0 0.00%EUR 670 DKK (5,001) Brown Brothers Harriman 18/02/2019 0 0.00%DKK 3,890 EUR (521) Brown Brothers Harriman 18/02/2019 0 0.00%DKK 4,886 EUR (654) Brown Brothers Harriman 18/02/2019 0 0.00%EUR 97 USD (112) Brown Brothers Harriman 19/02/2019 0 0.00%
39

Fidelity MSCI Europe Index Fund SCHEDULE OF INVESTMENTS (CONTINUED) AS AT 31 JANUARY 2019
Financial Derivative Instruments (0.03%) (continued) Open Forward Foreign Exchange Contracts held for Portfolio Hedging Purposes (0.04%) (continued)
Currency Buy Amount Currency (Sell) Amount Counterparty Settlement Date
Unrealised Gain/(Loss)
EURFund % of
NAV*EUR 161 GBP (141) Brown Brothers Harriman 18/02/2019 (1) (0.00%)GBP 169 EUR (195) Brown Brothers Harriman 18/02/2019 (1) (0.00%)EUR 169 NOK (1,647) Brown Brothers Harriman 18/02/2019 (1) (0.00%)EUR 428 CHF (488) Brown Brothers Harriman 18/02/2019 (1) (0.00%)USD 387 EUR (338) Brown Brothers Harriman 19/02/2019 (1) (0.00%)EUR 289 NOK (2,810) Brown Brothers Harriman 18/02/2019 (2) (0.00%)EUR 301 NOK (2,929) Brown Brothers Harriman 18/02/2019 (2) (0.00%)USD 207 EUR (182) Brown Brothers Harriman 19/02/2019 (2) (0.00%)EUR 212 GBP (188) Brown Brothers Harriman 18/02/2019 (3) (0.00%)EUR 1,219 GBP (1,068) Brown Brothers Harriman 18/02/2019 (5) (0.00%)EUR 691 NOK (6,731) Brown Brothers Harriman 18/02/2019 (5) (0.00%)SEK 8,304 EUR (810) Brown Brothers Harriman 18/02/2019 (10) (0.00%)EUR 4,304 GBP (3,771) Brown Brothers Harriman 18/02/2019 (17) (0.00%)CHF 2,608 EUR (2,312) Brown Brothers Harriman 18/02/2019 (21) (0.00%)GBP 4,239 EUR (4,892) Brown Brothers Harriman 18/02/2019 (35) (0.00%)EUR 6,599 GBP (5,849) Brown Brothers Harriman 18/02/2019 (103) (0.00%)EUR 15,489 GBP (13,633) Brown Brothers Harriman 18/02/2019 (133) (0.00%)EUR 18,561 NOK (180,829) Brown Brothers Harriman 18/02/2019 (138) (0.00%)EUR 417,439 GBP (367,421) Brown Brothers Harriman 18/02/2019 (3,589) (0.07%) Unrealised Gain on Open Forward Foreign Exchange Contracts held for Portfolio Hedging Purposes 2,151 0.03%Unrealised Loss on Open Forward Foreign Exchange Contracts held for Portfolio Hedging Purposes (4,070) (0.07%) Net Open Forward Foreign Exchange Contracts held for Portfolio Hedging Purposes (1,919) (0.04%)
Open Forward Foreign Exchange Contracts held for Class Hedging Purposes 0.01%
Currency Buy Amount Currency (Sell) Amount Counterparty Settlement Date
Unrealised Gain/(Loss)
EURFund % of
NAV*GBP 49,512 EUR (56,257) Brown Brothers Harriman 18/02/2019 479 0.01%GBP 1,009 EUR (1,138) Brown Brothers Harriman 18/02/2019 18 0.00%GBP 1,207 EUR (1,369) Brown Brothers Harriman 18/02/2019 14 0.00%GBP 1,014 EUR (1,157) Brown Brothers Harriman 18/02/2019 5 0.00%EUR 589 GBP (513) Brown Brothers Harriman 18/02/2019 1 0.00%EUR 0 GBP 0 Brown Brothers Harriman 18/02/2019 0 0.00%GBP 18 EUR (20) Brown Brothers Harriman 18/02/2019 0 0.00%GBP 4 EUR (5) Brown Brothers Harriman 18/02/2019 0 0.00%GBP 1 EUR (1) Brown Brothers Harriman 18/02/2019 0 0.00%GBP 5,543 EUR (6,401) Brown Brothers Harriman 18/02/2019 (49) (0.00%)GBP 14,304 EUR (16,445) Brown Brothers Harriman 18/02/2019 (55) (0.00%)GBP 24,482 EUR (28,180) Brown Brothers Harriman 18/02/2019 (126) (0.00%) Unrealised Gain on Open Forward Foreign Exchange Contracts held for Class Hedging Purposes 517 0.01%Unrealised Loss on Open Forward Foreign Exchange Contracts held for Class Hedging Purposes (230) (0.00%) Net Open Forward Foreign Exchange Contracts held for Class Hedging Purposes 287 0.01%
Futures Contracts 0.00%
Broker Number ofContracts
Notional Amount
UnrealisedGain/(Loss)
EURFund % of
NAV*Euro STOXX 50 15 March 2019 Morgan Stanley 1 31,450 70 0.00%Net Futures Contracts 70 0.00%
Total Financial Derivative Instruments (1,562) (0.03%) Other Assets and Liabilities 50,593 0.86%Net Assets Attributable to Holders of Redeemable Participating Units 5,883,527 100.00%
40

Fidelity MSCI Europe Index Fund SCHEDULE OF INVESTMENTS (CONTINUED) AS AT 31 JANUARY 2019
Analysis of Assets EURFund % of
Assets(a) Transferable securities admitted to an official stock exchange listing 5,834,496 96.59%(b) Financial derivative instruments (1,562) (0.03%)(c) Other assets 207,719 3.44%Total Assets 6,040,653 100.00% *The percentage of net assets disclosed above is subject to rounding.
41

Fidelity MSCI Japan Index Fund SCHEDULE OF INVESTMENTS AS AT 31 JANUARY 2019
Number of
Shares Fair Value
USDFund % of
NAV*
Equities 97.78%
Japan 97.78%
ABC-Mart 200 11,467 0.07%Acom 1,600 5,601 0.04%Aeon 2,900 58,850 0.38%AEON Financial Service 500 9,680 0.06%Aeon Mall 500 8,297 0.05%AGC 900 30,474 0.20%Air Water 600 9,995 0.06%Aisin Seiki 800 31,535 0.20%Ajinomoto 2,200 38,024 0.24%Alfresa Holdings 900 24,785 0.16%Alps Alpine 1,000 21,014 0.14%Amada Holdings 1,600 16,054 0.10%ANA Holdings 500 18,414 0.12%Aozora Bank 600 18,469 0.12%Asahi Group Holdings 1,700 70,996 0.46%Asahi Intecc 500 21,685 0.14%Asahi Kasei 5,900 64,622 0.42%Asics 700 10,098 0.07%Astellas Pharma 8,800 130,144 0.84%Bandai Namco Holdings 900 39,654 0.26%Bank of Kyoto 300 12,749 0.08%Benesse Holdings 300 7,831 0.05%Bridgestone 2,900 111,598 0.72%Brother Industries 1,000 16,834 0.11%Calbee 400 12,827 0.08%Canon 4,700 134,483 0.87%Casio Computer 800 10,637 0.07%Central Japan Railway 700 151,089 0.97%Chiba Bank 2,900 17,640 0.11%Chubu Electric Power 2,800 44,240 0.29%Chugai Pharmaceutical 1,000 58,991 0.38%Chugoku Electric Power 1,300 17,763 0.11%Coca-Cola Bottlers Japan Holdings 600 18,497 0.12%Concordia Financial Group 5,100 20,994 0.14%Credit Saison 700 9,198 0.06%CyberAgent 500 16,080 0.10%Dai Nippon Printing 1,200 27,742 0.18%Daicel 1,100 11,523 0.07%Daifuku 500 24,993 0.16%Dai-ichi Life Holdings 5,100 82,454 0.53%Daiichi Sankyo 2,700 93,457 0.60%Daikin Industries 1,200 129,725 0.84%Daito Trust Construction 300 41,749 0.27%Daiwa House Industry 2,700 87,503 0.56%Daiwa Securities Group 7,600 37,836 0.24%DeNA 500 8,821 0.06%Denso 2,100 96,249 0.62%Dentsu 1,000 47,413 0.31%Disco 100 14,775 0.10%Don Quijote Holdings 600 34,898 0.22%East Japan Railway 1,400 129,670 0.84%Eisai 1,200 92,831 0.60%Electric Power Development 700 17,476 0.11%FamilyMart UNY Holdings 300 35,064 0.23%FANUC 900 151,833 0.98%Fast Retailing 300 137,361 0.88%Fuji Electric 600 18,469 0.12%FUJIFILM Holdings 1,800 77,157 0.50%Fujitsu 900 60,237 0.39%Fukuoka Financial Group 700 15,443 0.10%
42

Fidelity MSCI Japan Index Fund SCHEDULE OF INVESTMENTS (CONTINUED) AS AT 31 JANUARY 2019
Number of
Shares Fair Value
USDFund % of
NAV*
Equities 97.78% (continued)
Japan 97.78% (continued)
Hakuhodo DY Holdings 1,100 16,880 0.11%Hamamatsu Photonics KK 700 25,021 0.16%Hankyu Hanshin Holdings 1,100 39,217 0.25%Hikari Tsushin 100 15,970 0.10%Hino Motors 1,000 10,025 0.06%Hirose Electric 110 11,785 0.08%Hisamitsu Pharmaceutical 300 15,299 0.10%Hitachi 4,500 141,124 0.91%Hitachi Chemical 400 6,572 0.04%Hitachi Construction Machinery 500 12,625 0.08%Hitachi High-Technologies 300 10,806 0.07%Hitachi Metals 1,000 11,201 0.07%Honda Motor 7,600 226,890 1.46%Hoshizaki 300 21,281 0.14%Hoya 1,800 104,166 0.67%Hulic 1,500 13,824 0.09%Idemitsu Kosan 600 21,143 0.14%IHI 700 22,094 0.14%Iida Group Holdings 600 10,922 0.07%Inpex 4,800 46,112 0.30%Isetan Mitsukoshi Holdings 1,600 16,437 0.11%Isuzu Motors 2,600 38,607 0.25%ITOCHU 6,600 120,775 0.78%J Front Retailing 1,000 11,449 0.07%Japan Airlines 500 18,212 0.12%Japan Airport Terminal 200 7,645 0.05%Japan Exchange Group 2,400 42,143 0.27%Japan Post Bank 1,900 22,120 0.14%Japan Post Holdings 7,400 90,911 0.59%Japan Tobacco 5,200 131,398 0.85%JFE Holdings 2,300 40,461 0.26%JGC 900 13,728 0.09%JSR 900 14,522 0.09%JTEKT 900 11,652 0.08%JXTG Holdings 15,300 83,424 0.54%Kajima 2,100 29,832 0.19%Kakaku.com 600 10,497 0.07%Kamigumi 500 11,063 0.07%Kaneka 200 7,810 0.05%Kansai Electric Power 3,300 50,153 0.32%Kansai Paint 800 14,040 0.09%Kao 2,300 162,139 1.04%Kawasaki Heavy Industries 700 17,592 0.11%KDDI 8,300 207,672 1.34%Keihan Holdings 500 20,606 0.13%Keikyu 1,000 17,008 0.11%Keio 500 28,715 0.19%Keisei Electric Railway 600 19,020 0.12%Keyence 500 256,639 1.65%Kikkoman 700 37,113 0.24%Kintetsu Group Holdings 800 34,880 0.22%Kirin Holdings 3,900 92,814 0.60%Kobayashi Pharmaceutical 200 12,680 0.08%Kobe Steel 1,400 11,192 0.07%Koito Manufacturing 500 30,001 0.19%Komatsu 4,300 109,110 0.70%Konami Holdings 400 18,414 0.12%Konica Minolta 2,100 21,091 0.14%Kose 100 14,693 0.09%Kubota 4,600 72,447 0.47%
43

Fidelity MSCI Japan Index Fund SCHEDULE OF INVESTMENTS (CONTINUED) AS AT 31 JANUARY 2019
Number of
Shares Fair Value
USDFund % of
NAV*
Equities 97.78% (continued)
Japan 97.78% (continued)
Kuraray 1,500 23,031 0.15%Kurita Water Industries 400 10,144 0.07%Kyocera 1,500 84,269 0.54%Kyowa Hakko Kirin 1,200 22,935 0.15%Kyushu Electric Power 1,800 22,262 0.14%Kyushu Railway 800 27,272 0.18%Lawson 200 12,331 0.08%LINE 300 10,434 0.07%Lion 1,000 20,794 0.13%LIXIL Group 1,300 19,065 0.12%M3 2,000 28,760 0.19%Makita 1,000 35,376 0.23%Marubeni 7,300 56,787 0.37%Marui Group 900 18,243 0.12%Maruichi Steel Tube 300 9,621 0.06%Mazda Motor 2,700 29,746 0.19%McDonald's Holdings Japan 300 13,273 0.09%Mebuki Financial Group 4,000 11,210 0.07%Medipal Holdings 800 18,451 0.12%MEIJI Holdings 600 46,366 0.30%MINEBEA MITSUMI 1,800 29,473 0.19%MISUMI Group 1,300 29,624 0.19%Mitsubishi 6,300 184,143 1.19%Mitsubishi Chemical Holdings 6,000 51,444 0.33%Mitsubishi Electric 8,600 107,905 0.70%Mitsubishi Estate 5,500 97,259 0.63%Mitsubishi Gas Chemical 700 11,031 0.07%Mitsubishi Heavy Industries 1,400 54,068 0.35%Mitsubishi Materials 500 14,288 0.09%Mitsubishi Motors 2,900 17,933 0.12%Mitsubishi Tanabe Pharma 1,200 18,756 0.12%Mitsubishi UFJ Financial Group 55,000 294,938 1.90%Mitsubishi UFJ Lease & Finance 1,800 9,196 0.06%Mitsui 7,800 127,038 0.82%Mitsui Chemicals 900 22,527 0.15%Mitsui Fudosan 4,200 101,768 0.66%Mitsui OSK Lines 500 12,460 0.08%Mizuho Financial Group 113,100 186,439 1.20%MonotaRO 600 12,752 0.08%MS&AD Insurance Group Holdings 2,200 65,375 0.42%Murata Manufacturing 800 113,351 0.73%Nabtesco 500 13,172 0.08%Nagoya Railroad 900 23,817 0.15%NEC 1,200 40,246 0.26%Nexon 2,100 32,070 0.21%NGK Insulators 1,100 16,880 0.11%NGK Spark Plug 700 15,038 0.10%NH Foods 400 15,804 0.10%Nidec 1,000 119,728 0.77%Nikon 1,500 25,691 0.17%Nintendo 500 155,426 1.00%Nippon Electric Glass 400 11,100 0.07%Nippon Express 400 25,287 0.16%Nippon Paint Holdings 700 23,413 0.15%Nippon Steel & Sumitomo Metal 3,800 70,183 0.45%Nippon Telegraph & Telephone 3,200 137,344 0.88%Nippon Yusen KK 700 11,693 0.08%Nissan Chemical 600 31,866 0.21%Nissan Motor 10,900 92,825 0.60%Nisshin Seifun Group 1,000 20,132 0.13%
44

Fidelity MSCI Japan Index Fund SCHEDULE OF INVESTMENTS (CONTINUED) AS AT 31 JANUARY 2019
Number of
Shares Fair Value
USDFund % of
NAV*
Equities 97.78% (continued)
Japan 97.78% (continued)
Nissin Foods Holdings 300 19,048 0.12%Nitori Holdings 400 52,044 0.34%Nitto Denko 800 45,135 0.29%Nomura Holdings 16,200 65,779 0.42%Nomura Real Estate Holdings 600 11,649 0.08%Nomura Research Institute 500 20,399 0.13%NSK 1,500 14,596 0.09%NTT Data 2,900 34,535 0.22%NTT DOCOMO 6,200 148,434 0.96%Obayashi 3,100 29,425 0.19%Obic 300 28,338 0.18%Odakyu Electric Railway 1,400 31,453 0.20%Oji Holdings 4,000 23,119 0.15%Olympus 1,400 57,503 0.37%Omron 900 36,801 0.24%Ono Pharmaceutical 1,800 39,207 0.25%Oracle Japan 200 14,555 0.09%Oriental Land 900 92,043 0.59%ORIX 6,200 93,430 0.60%Osaka Gas 1,800 35,510 0.23%Otsuka 500 16,126 0.10%Otsuka Holdings 1,800 73,651 0.47%Panasonic 10,400 101,487 0.65%Park24 500 11,913 0.08%Persol Holdings 800 14,209 0.09%Pigeon 500 19,480 0.13%Pola Orbis Holdings 400 11,927 0.08%Rakuten 4,000 30,102 0.19%Recruit Holdings 5,200 139,162 0.90%Renesas Electronics 3,900 22,397 0.14%Resona Holdings 9,900 50,023 0.32%Ricoh 3,100 32,985 0.21%Rinnai 200 13,232 0.09%Rohm 400 28,080 0.18%Ryohin Keikaku 100 23,615 0.15%Sankyo 200 7,737 0.05%Santen Pharmaceutical 1,700 23,415 0.15%SBI Holdings 1,100 23,429 0.15%Secom 1,000 83,626 0.54%Sega Sammy Holdings 800 11,247 0.07%Seibu Holdings 1,000 17,339 0.11%Seiko Epson 1,300 20,641 0.13%Sekisui Chemical 1,800 27,985 0.18%Sekisui House 3,000 44,822 0.29%Seven & i Holdings 3,500 152,407 0.98%Seven Bank 2,400 7,145 0.05%SG Holdings 400 10,721 0.07%Sharp 1,000 10,595 0.07%Shimadzu 1,000 22,926 0.15%Shimamura 100 8,647 0.06%Shimano 300 41,955 0.27%Shimizu 2,500 21,249 0.14%Shin-Etsu Chemical 1,700 143,335 0.92%Shinsei Bank 700 9,468 0.06%Shionogi 1,300 79,866 0.51%Shiseido 1,800 107,094 0.69%Shizuoka Bank 2,000 16,760 0.11%Showa Denko KK 600 20,068 0.13%Showa Shell Sekiyu KK 800 11,908 0.08%SMC 300 98,493 0.63%
45

Fidelity MSCI Japan Index Fund SCHEDULE OF INVESTMENTS (CONTINUED) AS AT 31 JANUARY 2019
Number of
Shares Fair Value
USDFund % of
NAV*
Equities 97.78% (continued)
Japan 97.78% (continued)
Softbank 7,800 96,255 0.62%SoftBank Group 3,900 305,536 1.97%Sohgo Security Services 300 13,066 0.08%Sompo Holdings 1,600 60,072 0.39%Sony 5,900 296,383 1.91%Sony Financial Holdings 800 15,165 0.10%Stanley Electric 600 17,394 0.11%Subaru 2,900 68,003 0.44%SUMCO 1,100 15,222 0.10%Sumitomo 5,300 81,889 0.53%Sumitomo Chemical 7,100 36,925 0.24%Sumitomo Dainippon Pharma 700 16,376 0.11%Sumitomo Electric Industries 3,600 51,157 0.33%Sumitomo Heavy Industries 500 16,884 0.11%Sumitomo Metal Mining 1,100 31,697 0.20%Sumitomo Mitsui Financial Group 6,200 230,442 1.48%Sumitomo Mitsui Trust Holdings 1,600 60,674 0.39%Sumitomo Realty & Development 1,700 64,873 0.42%Sumitomo Rubber Industries 700 9,706 0.06%Sundrug 300 9,579 0.06%Suntory Beverage & Food 700 30,970 0.20%Suzuken 300 15,713 0.10%Suzuki Motor 1,600 83,418 0.54%Sysmex 800 44,451 0.29%T&D Holdings 2,600 32,169 0.21%Taiheiyo Cement 600 20,509 0.13%Taisei 1,000 46,954 0.30%Taisho Pharmaceutical Holdings 200 20,233 0.13%Taiyo Nippon Sanso 600 9,483 0.06%Takashimaya 700 9,494 0.06%Takeda Pharmaceutical 6,900 278,271 1.79%TDK 600 47,248 0.30%Teijin 800 13,805 0.09%Terumo 1,400 79,860 0.51%THK 500 11,840 0.08%Tobu Railway 900 25,388 0.16%Toho 500 18,216 0.12%Toho Gas 300 12,832 0.08%Tohoku Electric Power 2,000 27,051 0.17%Tokio Marine Holdings 3,100 151,311 0.97%Tokyo Century 200 9,336 0.06%Tokyo Electric Power 6,800 41,801 0.27%Tokyo Electron 700 100,565 0.65%Tokyo Gas 1,800 47,278 0.30%Tokyu 2,300 39,309 0.25%Tokyu Fudosan Holdings 2,900 15,775 0.10%Toppan Printing 1,200 19,638 0.13%Toray Industries 6,600 48,934 0.32%Toshiba 3,100 97,845 0.63%Tosoh 1,200 17,014 0.11%TOTO 700 27,111 0.17%Toyo Seikan Group Holdings 700 15,733 0.10%Toyo Suisan Kaisha 400 14,353 0.09%Toyoda Gosei 300 6,536 0.04%Toyota Industries 700 34,540 0.22%Toyota Motor 10,700 656,277 4.22%Toyota Tsusho 1,000 31,793 0.20%Trend Micro 600 31,866 0.21%Tsuruha Holdings 200 18,451 0.12%Unicharm 1,900 58,556 0.38%
46

Fidelity MSCI Japan Index Fund SCHEDULE OF INVESTMENTS (CONTINUED) AS AT 31 JANUARY 2019
Number of
Shares Fair Value
USDFund % of
NAV*
Equities 97.78% (continued)
Japan 97.78% (continued)
USS 1,100 19,245 0.12%Welcia Holdings 200 7,571 0.05%West Japan Railway 800 58,359 0.38%Yahoo Japan 13,300 35,807 0.23%Yakult Honsha 600 39,860 0.26%Yamada Denki 2,700 13,298 0.09%Yamaguchi Financial Group 1,000 10,172 0.07%Yamaha 600 26,243 0.17%Yamaha Motor 1,300 27,785 0.18%Yamato Holdings 1,400 37,261 0.24%Yamazaki Baking 600 11,743 0.08%Yaskawa Electric 1,100 30,929 0.20%Yokogawa Electric 1,100 20,437 0.13%Yokohama Rubber 500 10,585 0.07%ZOZO 1,000 20,151 0.13%
Total Japan 15,176,444 97.78%
Total Equities 15,176,444 97.78%
Transferable Securities 1.22%
Japan 1.22%
Daiwa House REIT Investment 9 21,187 0.14%Japan Prime Realty Investment 4 16,301 0.11%Japan Real Estate Investment 6 35,174 0.23%Japan Retail Fund Investment 13 26,638 0.17%Nippon Building Fund 6 38,812 0.24%Nomura Real Estate Master Fund 19 27,218 0.18%United Urban Investment 15 23,941 0.15%
Total Japan 189,271 1.22%
Total Transferable Securities 189,271 1.22%
Financial Assets at Fair Value Through Profit or Loss 15,365,715 99.00%
Financial Derivative Instruments 0.01%
Open Forward Foreign Exchange Contracts held for Class Hedging Purposes 0.02%
Currency Buy Amount Currency (Sell) Amount Counterparty Settlement Date
Unrealised Gain/(Loss)
USD Fund % of NAV*EUR 919,643 JPY (114,583,970) Brown Brothers Harriman 18/02/2019 2,416 0.02%GBP 6,666 JPY (943,770) Brown Brothers Harriman 18/02/2019 94 0.00%EUR 13,966 JPY (1,741,699) Brown Brothers Harriman 18/02/2019 22 0.00%GBP 139 JPY (19,648) Brown Brothers Harriman 18/02/2019 3 0.00%GBP 80 JPY (11,274) Brown Brothers Harriman 18/02/2019 1 0.00%JPY 11,278 GBP (79) Brown Brothers Harriman 18/02/2019 0 0.00%GBP 82 JPY (11,827) Brown Brothers Harriman 18/02/2019 (1) (0.00%)JPY 70,987 EUR (569) Brown Brothers Harriman 18/02/2019 (1) (0.00%) Unrealised Gain on Open Forward Foreign Exchange Contracts held for Class Hedging Purposes 2,536 0.02%Unrealised Loss on Open Forward Foreign Exchange Contracts held for Class Hedging Purposes (2) (0.00%) Net Open Forward Foreign Exchange Contracts held for Class Hedging Purposes 2,534 0.02%
47

Fidelity MSCI Japan Index Fund SCHEDULE OF INVESTMENTS (CONTINUED) AS AT 31 JANUARY 2019
Financial Derivative Instruments 0.01% (continued) Futures Contracts (0.01%)
BrokerNumber of Contracts
Notional Amount
UnrealisedGain/(Loss)
USD Fund % of NAV*Nikkei 225 07 March 2019 Morgan Stanley 1 97,721 (2,044) (0.01%)Net Futures Contracts (2,044) (0.01%)
Total Financial Derivative Instruments 490 0.01% Other Assets and Liabilities 154,996 0.99%Net Assets Attributable to Holders of Redeemable Participating Units 15,521,201 100.00%
Analysis of Assets USDFund % of
Assets(a) Transferable securities admitted to an official stock exchange listing 15,365,715 88.12%(b) Financial derivative instruments 490 0.00%(c) Other assets 2,072,080 11.88%Total Assets 17,438,285 100.00%
*The percentage of net assets disclosed above is subject to rounding.
48

Fidelity MSCI Pacific ex-Japan Index Fund SCHEDULE OF INVESTMENTS AS AT 31 JANUARY 2019
Number of
Shares Fair Value
USDFund % of
NAV*
Equities 92.09%
Australia 48.59%
AGL Energy 2,562 40,014 0.60%Alumina 9,786 17,339 0.26%Amcor 4,532 45,107 0.67%AMP 11,634 19,171 0.29%APA Group 4,631 30,998 0.46%Aristocrat Leisure 2,242 40,264 0.60%ASX 753 34,980 0.52%Aurizon Holdings 7,814 25,069 0.37%AusNet Services 6,706 8,068 0.12%Australia & New Zealand Banking Group 11,291 206,068 3.09%Bank of Queensland 1,453 10,775 0.16%Bendigo & Adelaide Bank 1,928 15,155 0.23%BHP Billiton 11,572 293,886 4.40%BlueScope Steel 2,054 18,646 0.28%Boral 4,411 15,921 0.24%Brambles 6,235 48,372 0.72%Caltex Australia 1,037 20,294 0.30%Challenger 2,065 10,901 0.16%CIMIC Group 367 11,991 0.18%Coca-Cola Amatil 1,898 11,625 0.17%Cochlear 225 31,732 0.47%Coles Group 4,440 40,500 0.61%Commonwealth Bank of Australia 6,921 352,796 5.28%Computershare 1,791 23,206 0.35%Crown Resorts 1,410 12,286 0.18%CSL 1,779 252,583 3.78%Domino's Pizza Enterprises 229 7,597 0.11%Flight Centre Travel Group 207 6,495 0.10%Fortescue Metals Group 6,182 25,468 0.38%Harvey Norman Holdings 2,173 5,340 0.08%Incitec Pivot 6,092 14,703 0.22%Insurance Australia Group 8,965 46,346 0.69%LendLease Group 2,292 20,439 0.31%Macquarie Group 1,268 107,693 1.61%Medibank 10,981 20,978 0.31%National Australia Bank 10,752 187,058 2.81%Newcrest Mining 3,010 53,661 0.80%Oil Search 5,371 30,586 0.46%Orica 1,417 17,719 0.26%Origin Energy 6,904 36,044 0.54%QBE Insurance Group 5,238 40,981 0.61%Ramsay Health Care 560 23,160 0.35%REA Group 196 10,821 0.16%Santos 6,952 32,797 0.49%SEEK 1,246 15,436 0.23%Sonic Healthcare 1,698 28,501 0.43%South32 20,031 51,558 0.77%Suncorp Group 5,090 48,174 0.72%Sydney Airport 4,261 20,381 0.30%Tabcorp Holdings 7,493 25,405 0.38%Telstra 15,637 35,459 0.53%TPG Telecom 1,505 7,671 0.11%Transurban Group 10,277 91,196 1.36%Treasury Wine Estates 2,840 31,994 0.48%Washington H Soul Pattinson 401 7,693 0.11%Wesfarmers 4,449 104,489 1.56%Westpac Banking 13,506 241,766 3.62%Woodside Petroleum 3,682 92,140 1.38%
49
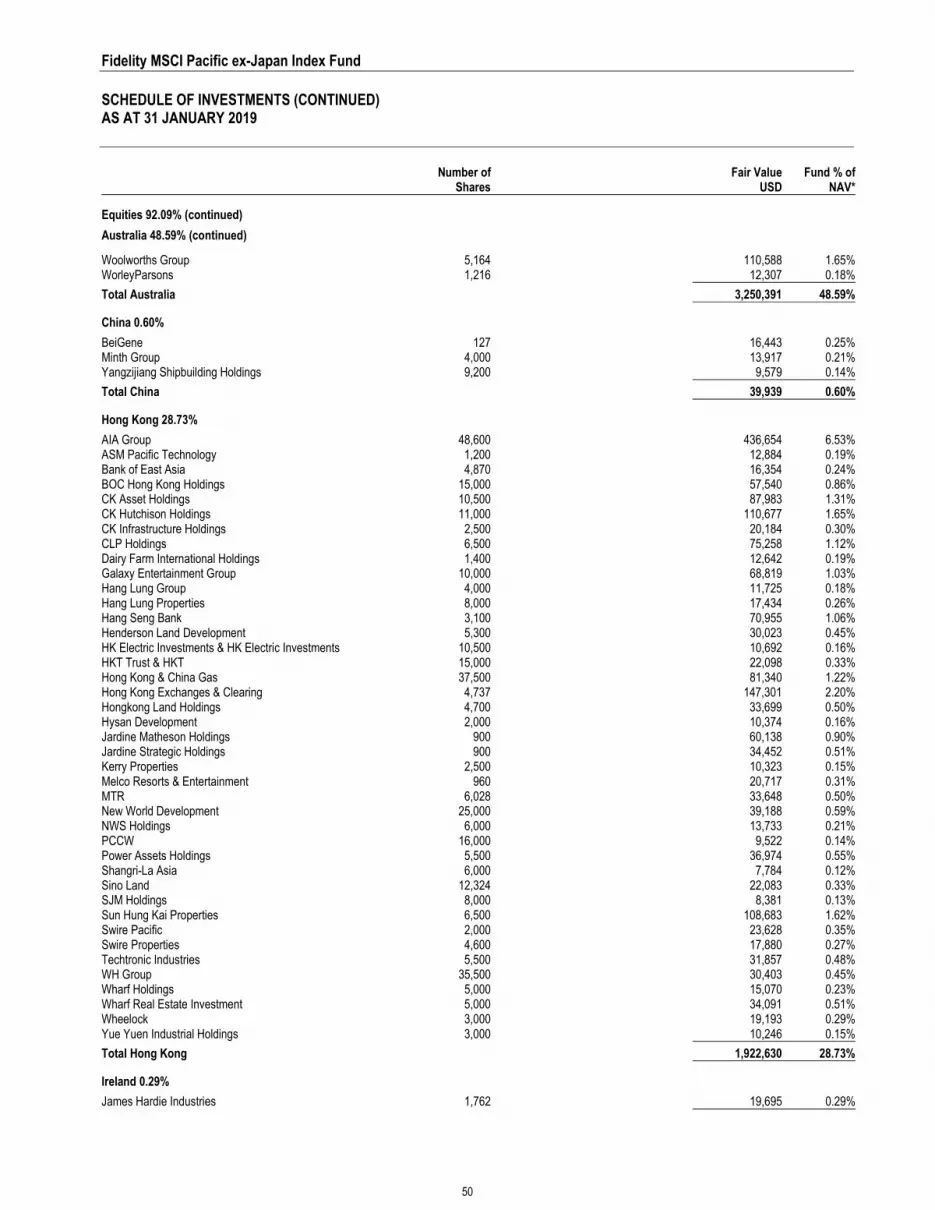
Fidelity MSCI Pacific ex-Japan Index Fund SCHEDULE OF INVESTMENTS (CONTINUED) AS AT 31 JANUARY 2019
Number of
Shares Fair Value
USDFund % of
NAV*
Equities 92.09% (continued)
Australia 48.59% (continued)
Woolworths Group 5,164 110,588 1.65%WorleyParsons 1,216 12,307 0.18%
Total Australia 3,250,391 48.59%
China 0.60%
BeiGene 127 16,443 0.25%Minth Group 4,000 13,917 0.21%Yangzijiang Shipbuilding Holdings 9,200 9,579 0.14%
Total China 39,939 0.60%
Hong Kong 28.73%
AIA Group 48,600 436,654 6.53%ASM Pacific Technology 1,200 12,884 0.19%Bank of East Asia 4,870 16,354 0.24%BOC Hong Kong Holdings 15,000 57,540 0.86%CK Asset Holdings 10,500 87,983 1.31%CK Hutchison Holdings 11,000 110,677 1.65%CK Infrastructure Holdings 2,500 20,184 0.30%CLP Holdings 6,500 75,258 1.12%Dairy Farm International Holdings 1,400 12,642 0.19%Galaxy Entertainment Group 10,000 68,819 1.03%Hang Lung Group 4,000 11,725 0.18%Hang Lung Properties 8,000 17,434 0.26%Hang Seng Bank 3,100 70,955 1.06%Henderson Land Development 5,300 30,023 0.45%HK Electric Investments & HK Electric Investments 10,500 10,692 0.16%HKT Trust & HKT 15,000 22,098 0.33%Hong Kong & China Gas 37,500 81,340 1.22%Hong Kong Exchanges & Clearing 4,737 147,301 2.20%Hongkong Land Holdings 4,700 33,699 0.50%Hysan Development 2,000 10,374 0.16%Jardine Matheson Holdings 900 60,138 0.90%Jardine Strategic Holdings 900 34,452 0.51%Kerry Properties 2,500 10,323 0.15%Melco Resorts & Entertainment 960 20,717 0.31%MTR 6,028 33,648 0.50%New World Development 25,000 39,188 0.59%NWS Holdings 6,000 13,733 0.21%PCCW 16,000 9,522 0.14%Power Assets Holdings 5,500 36,974 0.55%Shangri-La Asia 6,000 7,784 0.12%Sino Land 12,324 22,083 0.33%SJM Holdings 8,000 8,381 0.13%Sun Hung Kai Properties 6,500 108,683 1.62%Swire Pacific 2,000 23,628 0.35%Swire Properties 4,600 17,880 0.27%Techtronic Industries 5,500 31,857 0.48%WH Group 35,500 30,403 0.45%Wharf Holdings 5,000 15,070 0.23%Wharf Real Estate Investment 5,000 34,091 0.51%Wheelock 3,000 19,193 0.29%Yue Yuen Industrial Holdings 3,000 10,246 0.15%
Total Hong Kong 1,922,630 28.73%
Ireland 0.29%
James Hardie Industries 1,762 19,695 0.29%
50

Fidelity MSCI Pacific ex-Japan Index Fund SCHEDULE OF INVESTMENTS (CONTINUED) AS AT 31 JANUARY 2019
Number of
Shares Fair Value
USDFund % of
NAV*
Equities 92.09% (continued)
Macau 1.00%
MGM China Holdings 3,600 6,919 0.10%Sands China 9,600 45,634 0.68%Wynn Macau 6,000 14,559 0.22%
Total Macau 67,112 1.00%
New Zealand 1.81%
a2 Milk 2,907 25,507 0.38%Auckland International Airport 3,923 19,999 0.30%Fisher & Paykel Healthcare 2,294 19,984 0.30%Fletcher Building 3,288 11,403 0.17%Meridian Energy 4,904 11,973 0.18%Ryman Healthcare 1,528 11,107 0.17%Spark New Zealand 7,418 20,863 0.31%
Total New Zealand 120,836 1.81%
Singapore 9.69%
CapitaLand 10,400 25,755 0.38%City Developments 1,600 10,935 0.16%ComfortDelGro 8,400 14,555 0.22%DBS Group Holdings 7,200 128,081 1.92%Genting Singapore 24,800 20,288 0.30%Golden Agri-Resources 24,900 4,722 0.07%Jardine Cycle & Carriage 400 11,236 0.17%Keppel 5,900 26,765 0.40%Oversea-Chinese Banking 12,700 108,710 1.62%SATS 2,600 9,359 0.14%Sembcorp Industries 3,800 7,319 0.11%Singapore Airlines 2,100 15,071 0.23%Singapore Exchange 3,300 18,750 0.28%Singapore Press Holdings 6,100 11,387 0.17%Singapore Technologies Engineering 6,400 17,706 0.26%Singapore Telecommunications 33,000 74,116 1.11%United Overseas Bank 5,400 101,161 1.51%UOL Group 2,000 9,876 0.15%Venture 1,100 13,302 0.20%Wilmar International 7,900 19,564 0.29%
Total Singapore 648,658 9.69%
United Kingdom 1.38%
Rio Tinto 1,455 92,352 1.38%
Total Equities 6,161,613 92.09%
Transferable Securities 6.18%
Australia 3.81%
Dexus REIT 3,965 33,190 0.50%Goodman Group REIT 6,438 54,735 0.82%GPT Group REIT 7,057 29,845 0.45%Mirvac Group REIT 14,606 25,560 0.38%Scentre Group REIT 20,869 60,410 0.90%Stockland REIT 9,560 26,349 0.39%Vicinity Centres REIT 12,959 24,662 0.37%
Total Australia 254,751 3.81%
Hong Kong 1.39%
Link REIT 8,500 93,160 1.39%
51

Fidelity MSCI Pacific ex-Japan Index Fund SCHEDULE OF INVESTMENTS (CONTINUED) AS AT 31 JANUARY 2019
Number of
Shares Fair Value
USDFund % of
NAV*
Transferable Securities 6.18% (continued)
Singapore 0.98%
Ascendas REIT 10,900 22,211 0.32%CapitaLand Commercial Trust REIT 10,300 14,401 0.22%CapitaLand Mall Trust REIT 9,700 17,313 0.26%Suntec REIT 8,300 11,913 0.18%
Total Singapore 65,838 0.98%
Total Transferable Securities 413,749 6.18%
Financial Assets at Fair Value Through Profit or Loss 6,575,362 98.27%
Financial Derivative Instruments 0.08%
Open Forward Foreign Exchange Contracts held for Portfolio Hedging Purposes (0.00%)
Currency Buy Amount Currency (Sell) Amount Counterparty Settlement Date
Unrealised Gain/(Loss)
USDFund % of
NAV*USD 2,601 HKD (20,378) Brown Brothers Harriman 19/02/2019 2 0.00%USD 74 HKD (580) Brown Brothers Harriman 19/02/2019 0 0.00%USD 51 HKD (401) Brown Brothers Harriman 19/02/2019 0 0.00%NZD 6 USD (4) Brown Brothers Harriman 19/02/2019 0 0.00%NZD 3 USD (2) Brown Brothers Harriman 19/02/2019 0 0.00%USD 8 NZD (12) Brown Brothers Harriman 19/02/2019 0 0.00%USD 4 NZD (7) Brown Brothers Harriman 19/02/2019 0 0.00%USD 11 SGD (15) Brown Brothers Harriman 19/02/2019 0 0.00%USD 11 SGD (15) Brown Brothers Harriman 19/02/2019 0 0.00%USD 136 AUD (191) Brown Brothers Harriman 19/02/2019 (3) (0.00%)USD 169 NZD (250) Brown Brothers Harriman 19/02/2019 (4) (0.00%)USD 1,010 SGD (1,370) Brown Brothers Harriman 19/02/2019 (9) (0.00%)USD 5,050 AUD (7,023) Brown Brothers Harriman 19/02/2019 (72) (0.00%) Unrealised Gain on Open Forward Foreign Exchange Contracts held for Portfolio Hedging Purposes 2 0.00%Unrealised Loss on Open Forward Foreign Exchange Contracts held for Portfolio Hedging Purposes (88) (0.00%) Net Open Forward Foreign Exchange Contracts held for Portfolio Hedging Purposes (86) (0.00%)
Open Forward Foreign Exchange Contracts held for Class Hedging Purposes 0.00%
Currency Buy Amount Currency (Sell) Amount Counterparty Settlement Date
Unrealised Gain/(Loss)
USDFund % of
NAV*GBP 6,996 USD (9,075) Brown Brothers Harriman 19/02/2019 134 0.00%GBP 182 USD (235) Brown Brothers Harriman 19/02/2019 4 0.00%GBP 99 USD (130) Brown Brothers Harriman 19/02/2019 0 0.00%Net Open Forward Foreign Exchange Contracts held for Class Hedging Purposes 138 0.00%
Futures Contracts 0.08%
BrokerNumber of Contracts
Notional Amount
Unrealised Gain/(Loss)
USD
Fund % of NAV*
SPI 200 19 March 2019 Morgan Stanley 1 100,568 5,232 0.08%Net Futures Contracts 5,232 0.08%
Total Financial Derivative Instruments 5,284 0.08% Other Assets and Liabilities 110,328 1.65% Net Assets Attributable to Holders of Redeemable Participating Shares 6,690,973 100.00%
52

Fidelity MSCI Pacific ex-Japan Index Fund SCHEDULE OF INVESTMENTS (CONTINUED) AS AT 31 JANUARY 2019
Analysis of Assets USDFund % of
Assets(a) Transferable securities admitted to an official stock exchange listing 6,575,362 98.25%(b) Financial derivative instruments 5,284 0.08%(c) Other assets 111,584 1.67%Total Assets 6,692,230 100.00%
*The percentage of net assets disclosed above is subject to rounding.
53

Fidelity MSCI World Index Fund SCHEDULE OF INVESTMENTS AS AT 31 JANUARY 2019
Number of
Shares Fair Value
USDFund % of
NAV*
Equities 96.20%
Argentina 0.04%
MercadoLibre 53 19,292 0.04%
Australia 2.26%
AGL Energy 898 14,025 0.03%Alumina 2,548 4,515 0.01%Amcor 1,592 15,845 0.03%AMP 2,695 4,441 0.01%APA Group 1,563 10,462 0.02%Aristocrat Leisure 770 13,828 0.03%ASX 206 9,570 0.02%Aurizon Holdings 2,432 7,802 0.02%AusNet Services 1,354 1,629 0.00%Australia & New Zealand Banking Group 3,552 64,826 0.15%Bank of Queensland 292 2,165 0.00%Bendigo & Adelaide Bank 350 2,751 0.01%BHP Group 3,639 92,417 0.20%BHP Group (London Listed) 2,546 56,607 0.12%BlueScope Steel 569 5,165 0.01%Boral 1,223 4,414 0.01%Brambles 1,933 14,997 0.03%Caltex Australia 282 5,519 0.01%Challenger 915 4,830 0.01%CIMIC Group 56 1,830 0.00%Coca-Cola Amatil 363 2,223 0.00%Cochlear 79 11,142 0.02%Coles Group 1,498 13,664 0.03%Commonwealth Bank of Australia 2,169 110,566 0.24%Computershare 487 6,310 0.01%Crown Resorts 242 2,109 0.00%CSL 556 78,941 0.17%Domino's Pizza Enterprises 41 1,360 0.00%Flight Centre Travel Group 38 1,192 0.00%Fortescue Metals Group 2,219 9,142 0.02%Harvey Norman Holdings 407 1,000 0.00%Incitec Pivot 1,880 4,537 0.01%Insurance Australia Group 2,931 15,152 0.03%LendLease Group 613 5,466 0.01%Macquarie Group 418 35,501 0.07%Medibank 3,048 5,823 0.01%National Australia Bank 3,390 58,978 0.12%Newcrest Mining 999 17,810 0.04%Oil Search 1,954 11,127 0.02%Orica 619 7,741 0.02%Origin Energy 2,342 12,227 0.03%QBE Insurance Group 1,819 14,231 0.03%Ramsay Health Care 153 6,328 0.01%REA Group 30 1,656 0.00%Santos 2,486 11,728 0.02%SEEK 491 6,083 0.01%Sonic Healthcare 451 7,570 0.02%South32 6,782 17,456 0.04%Suncorp Group 1,795 16,989 0.04%Sydney Airport 1,671 7,993 0.02%Tabcorp Holdings 2,015 6,832 0.01%Telstra 5,170 11,724 0.02%TPG Telecom 172 877 0.00%Transurban Group 3,102 27,526 0.06%Treasury Wine Estates 980 11,040 0.02%Washington H Soul Pattinson 50 959 0.00%
54

Fidelity MSCI World Index Fund SCHEDULE OF INVESTMENTS (CONTINUED) AS AT 31 JANUARY 2019
Number of
Shares Fair Value
USDFund % of
NAV*
Equities 96.20% (continued)
Australia 2.26% (continued)
Wesfarmers 1,498 35,182 0.07%Westpac Banking 4,243 75,952 0.17%Woodside Petroleum 1,226 30,680 0.06%Woolworths Group 1,713 36,684 0.08%WorleyParsons 256 2,591 0.01%
Total Australia 1,079,730 2.26%
Austria 0.09%
ANDRITZ 122 6,036 0.01%Erste Group Bank 389 13,569 0.03%OMV 158 7,868 0.02%Raiffeisen Bank International 162 4,290 0.01%Verbund 103 5,274 0.01%Voestalpine 136 4,351 0.01%
Total Austria 41,388 0.09%
Belgium 0.33%
Ageas 251 11,687 0.02%Anheuser-Busch InBev 928 70,929 0.15%Colruyt 69 4,967 0.01%Groupe Bruxelles Lambert 88 8,306 0.02%KBC Group 322 21,903 0.05%Proximus SADP 171 4,593 0.01%Solvay 81 8,837 0.02%Telenet Group Holding 36 1,670 0.00%UCB 166 14,408 0.03%Umicore 281 11,882 0.02%
Total Belgium 159,182 0.33%
Bermuda 0.06%
Arch Capital Group 517 15,174 0.03%Everest Re Group 51 11,172 0.02%RenaissanceRe Holdings 43 5,935 0.01%
Total Bermuda 32,281 0.06%
Canada 3.46%
Agnico Eagle Mines 303 13,185 0.03%Alimentation Couche-Tard 556 30,220 0.06%AltaGas 354 3,625 0.01%ARC Resources 540 3,906 0.01%Atco 54 1,708 0.00%Aurora Cannabis 495 3,505 0.01%Australis Capital 10 9 0.00%Bank of Montreal 765 56,025 0.12%Bank of Nova Scotia 1,493 85,035 0.18%Barrick Gold (New York Listed) 1,041 13,943 0.03%Barrick Gold (Toronto Listed) 1,552 20,787 0.04%BCE 165 7,178 0.01%BlackBerry 791 6,372 0.01%Bombardier 2,137 3,238 0.01%Brookfield Asset Management 1,023 44,042 0.09%CAE 329 6,994 0.01%Cameco 513 6,219 0.01%Canadian Imperial Bank of Commerce 527 44,707 0.09%Canadian National Railway 879 73,389 0.15%Canadian Natural Resources 1,546 41,519 0.09%Canadian Pacific Railway 169 34,656 0.07%Canadian Tire 81 9,218 0.02%
55

Fidelity MSCI World Index Fund SCHEDULE OF INVESTMENTS (CONTINUED) AS AT 31 JANUARY 2019
Number of
Shares Fair Value
USDFund % of
NAV*
Equities 96.20% (continued)
Canada 3.46% (continued)
Canadian Utilities 88 2,263 0.00%Canopy Growth 255 12,508 0.03%CCL Industries 171 7,213 0.02%Cenovus Energy 1,345 10,508 0.02%CGI Group 322 21,299 0.04%CI Financial 408 5,496 0.01%Constellation Software 26 19,414 0.04%Dollarama 398 10,719 0.02%Emera 107 3,748 0.01%Empire 132 2,969 0.01%Enbridge 2,469 90,259 0.19%Encana 1,309 8,990 0.02%Fairfax Financial Holdings 36 17,038 0.04%Finning International 249 4,721 0.01%First Capital Realty 128 2,000 0.00%First Quantum Minerals 897 10,389 0.02%Fortis 486 17,341 0.04%Franco-Nevada 243 18,860 0.04%George Weston 115 8,357 0.02%Gildan Activewear 271 9,176 0.02%Goldcorp 1,125 12,592 0.03%Great-West Lifeco 334 7,172 0.01%Husky Energy 365 4,333 0.01%Hydro One 486 7,620 0.02%iA Financial 173 6,430 0.01%IGM Financial 93 2,392 0.00%Imperial Oil 368 10,446 0.02%Intact Financial 185 14,630 0.03%Inter Pipeline 451 7,253 0.02%Keyera 249 5,294 0.01%Kinross Gold 1,694 5,663 0.01%Loblaw 250 12,113 0.03%Lululemon Athletica 119 17,589 0.04%Lundin Mining 438 2,001 0.00%Magna International 415 21,974 0.05%Manulife Financial 2,423 38,947 0.08%Methanex 90 4,907 0.01%Metro 328 11,931 0.02%National Bank of Canada 372 17,505 0.04%Nutrien 745 38,614 0.08%Onex 103 5,826 0.01%Open Text 355 12,626 0.03%Pembina Pipeline 651 23,209 0.05%Power Financial 312 6,405 0.01%Power of Canada 437 8,691 0.02%PrairieSky Royalty 301 4,350 0.01%Restaurant Brands International 308 19,315 0.04%Rogers Communications 424 22,948 0.05%Royal Bank of Canada 1,744 132,823 0.27%Saputo 254 7,450 0.02%Seven Generations Energy 399 3,099 0.01%Shaw Communications 652 13,246 0.03%Shopify 107 18,020 0.04%SNC-Lavalin Group 181 5,040 0.01%Stars Group 244 4,420 0.01%Sun Life Financial 723 26,095 0.05%Suncor Energy 1,979 63,862 0.13%Teck Resources 661 16,106 0.03%TELUS 215 7,534 0.02%Thomson Reuters 257 13,446 0.03%
56

Fidelity MSCI World Index Fund SCHEDULE OF INVESTMENTS (CONTINUED) AS AT 31 JANUARY 2019
Number of
Shares Fair Value
USDFund % of
NAV*
Equities 96.20% (continued)
Canada 3.46% (continued)
Toronto-Dominion Bank 2,219 125,034 0.26%Tourmaline Oil 354 4,830 0.01%TransCanada 1,101 46,847 0.10%Turquoise Hill Resources 511 856 0.00%Vermilion Energy 209 5,124 0.01%West Fraser Timber 76 4,529 0.01%Wheaton Precious Metals 480 10,117 0.02%WSP Global 114 5,854 0.01%
Total Canada 1,659,856 3.46%
Chile 0.01%
Antofagasta 555 6,350 0.01%
China 0.01%
BeiGene 45 5,827 0.01%Yangzijiang Shipbuilding Holdings 800 833 0.00%
Total China 6,660 0.01%
Denmark 0.59%
AP Moller - Maersk (Class A) 6 7,501 0.02%AP Moller - Maersk (Class B) 7 9,318 0.02%Carlsberg 142 16,267 0.03%Chr Hansen Holding 127 12,062 0.03%Coloplast 152 13,904 0.03%Danske Bank 911 16,871 0.04%DSV 238 18,998 0.04%Genmab 79 11,500 0.02%H Lundbeck 100 4,391 0.01%ISS 230 6,513 0.01%Novo Nordisk 2,210 103,318 0.22%Novozymes 287 12,002 0.03%Orsted 220 15,857 0.03%Pandora 143 6,206 0.01%Tryg 117 2,990 0.01%Vestas Wind Systems 245 20,257 0.04%William Demant Holding 69 2,180 0.00%
Total Denmark 280,135 0.59%
Finland 0.43%
Elisa 147 6,165 0.01%Fortum 529 12,031 0.03%Kone 431 20,964 0.04%Metso 68 1,997 0.00%Neste 161 14,805 0.03%Nokia 7,043 44,512 0.10%Nokian Renkaat 103 3,430 0.01%Nordea Bank 3,787 34,395 0.07%Orion 145 5,130 0.01%Sampo 529 24,262 0.05%Stora Enso 717 9,622 0.02%UPM-Kymmene 682 19,767 0.04%Wartsila 597 9,745 0.02%
Total Finland 206,825 0.43%
France 3.55%
Accor 194 8,466 0.02%Aeroports de Paris 30 5,756 0.01%
57

Fidelity MSCI World Index Fund SCHEDULE OF INVESTMENTS (CONTINUED) AS AT 31 JANUARY 2019
Number of
Shares Fair Value
USDFund % of
NAV*
Equities 96.20% (continued)
France 3.55% (continued)
Air Liquide 519 63,096 0.13%Airbus 712 81,878 0.18%Alstom 156 6,297 0.01%Amundi 65 3,744 0.01%Arkema 77 7,326 0.02%Atos 120 10,977 0.02%AXA 2,367 54,986 0.11%BioMerieux 24 1,699 0.00%BNP Paribas 1,368 64,303 0.13%Bollore 1,311 5,419 0.01%Bouygues 293 10,395 0.02%Bureau Veritas 290 6,456 0.01%Capgemini 204 22,584 0.05%Carrefour 768 15,232 0.03%Casino Guichard Perrachon 36 1,777 0.00%Cie de Saint-Gobain 652 22,534 0.05%Cie Generale des Etablissements Michelin 219 23,832 0.05%CNP Assurances 262 5,965 0.01%Credit Agricole 1,379 15,758 0.03%Danone 742 54,064 0.11%Dassault Aviation 2 2,986 0.01%Dassault Systemes 154 19,358 0.04%Edenred 309 12,566 0.03%Eiffage 119 11,186 0.02%Electricite de France 753 12,468 0.03%Engie 2,319 37,213 0.08%EssilorLuxottica 350 44,438 0.09%Eurazeo 97 7,224 0.02%Eutelsat Communications 233 4,946 0.01%Faurecia 108 4,729 0.01%Getlink 543 7,963 0.02%Hermes International 40 24,069 0.05%Iliad 36 4,135 0.01%Imerys 28 1,478 0.00%Ingenico Group 86 4,698 0.01%Ipsen 40 5,049 0.01%JCDecaux 52 1,544 0.00%Kering 95 47,691 0.10%Legrand 347 20,609 0.04%L'Oreal 314 75,699 0.16%LVMH Moet Hennessy Louis Vuitton 339 108,818 0.24%Natixis 990 5,080 0.01%Orange 2,399 37,355 0.08%Pernod Ricard 254 42,261 0.09%Peugeot 704 17,764 0.04%Publicis Groupe 273 16,696 0.03%Remy Cointreau 17 1,980 0.00%Renault 246 17,459 0.04%Rexel 209 2,389 0.00%Safran 406 53,342 0.11%Sanofi 1,380 120,059 0.26%Sartorius Stedim Biotech 38 4,199 0.01%Schneider Electric 693 49,365 0.10%SCOR 211 8,890 0.02%SEB 33 5,074 0.01%Societe BIC 17 1,708 0.00%Societe Generale 978 30,457 0.06%Sodexo 118 12,321 0.03%Suez 381 4,890 0.01%Teleperformance 79 13,624 0.03%
58

Fidelity MSCI World Index Fund SCHEDULE OF INVESTMENTS (CONTINUED) AS AT 31 JANUARY 2019
Number of
Shares Fair Value
USDFund % of
NAV*
Equities 96.20% (continued)
France 3.55% (continued)
Thales 138 15,306 0.03%Total 2,931 161,364 0.35%Ubisoft Entertainment 80 7,114 0.01%Valeo 311 9,731 0.02%Veolia Environnement 734 15,514 0.03%Vinci 610 53,812 0.11%Vivendi 1,331 33,966 0.07%Wendel 52 6,355 0.01%
Total France 1,699,486 3.55%
Germany 2.97%
1&1 Drillisch 34 1,415 0.00%Adidas 228 54,338 0.11%Allianz 521 110,550 0.23%Axel Springer 48 2,941 0.01%BASF 1,109 81,212 0.17%Bayer 1,141 86,672 0.18%Bayerische Motoren Werke 418 35,234 0.07%Bayerische Motoren Werke Preference Shares 63 4,659 0.01%Beiersdorf 136 13,623 0.03%Brenntag 173 8,188 0.02%Commerzbank 1,322 9,497 0.02%Continental 140 22,113 0.05%Covestro 250 13,821 0.03%Daimler 1,084 64,257 0.13%Delivery Hero 62 2,291 0.00%Deutsche Bank 2,505 22,265 0.05%Deutsche Boerse 242 32,281 0.07%Deutsche Lufthansa 252 6,379 0.01%Deutsche Post 1,250 36,948 0.08%Deutsche Telekom 3,993 65,015 0.14%Deutsche Wohnen 427 21,357 0.04%E.ON 2,799 31,089 0.06%Evonik Industries 189 5,174 0.01%Fraport Frankfurt Airport Services Worldwide 63 4,984 0.01%Fresenius 525 27,289 0.06%Fresenius Medical Care 274 20,235 0.04%FUCHS PETROLUB Preference Shares 49 2,301 0.00%GEA Group 185 5,099 0.01%Hannover Rueck 78 11,268 0.02%HeidelbergCement 204 14,129 0.03%Henkel 161 14,788 0.03%Henkel Preference Shares 197 19,187 0.04%HOCHTIEF 15 2,246 0.00%HUGO BOSS 87 6,253 0.01%Infineon Technologies 1,443 32,147 0.07%Innogy 138 6,556 0.01%KION Group 95 5,496 0.01%LANXESS 97 5,345 0.01%Merck 166 17,444 0.04%METRO 161 2,728 0.01%MTU Aero Engines 62 13,389 0.03%Muenchener Rueckversicherungs 177 39,503 0.08%OSRAM Licht 143 6,089 0.01%Porsche Automobil Holding Preference Shares 198 12,905 0.03%ProSiebenSat.1 Media 238 4,268 0.01%Puma 11 6,141 0.01%RWE 658 16,339 0.03%
59

Fidelity MSCI World Index Fund SCHEDULE OF INVESTMENTS (CONTINUED) AS AT 31 JANUARY 2019
Number of
Shares Fair Value
USDFund % of
NAV*
Equities 96.20% (continued)
Germany 2.97% (continued)
SAP 1,189 123,131 0.27%Sartorius Preference Shares 51 7,660 0.02%Siemens 921 101,220 0.21%Siemens Healthineers 198 7,821 0.02%Symrise 161 13,412 0.03%Telefonica Deutschland Holding 974 3,420 0.01%Thyssenkrupp 595 10,562 0.02%TUI 591 8,972 0.02%Uniper 219 6,350 0.01%United Internet 131 5,199 0.01%Volkswagen 103 17,964 0.04%Volkswagen Preference Shares 156 26,603 0.06%Vonovia 621 31,218 0.07%Wirecard 147 24,407 0.05%Zalando 166 5,076 0.01%
Total Germany 1,420,463 2.97%
Hong Kong 1.22%
AIA Group 14,800 132,973 0.29%ASM Pacific Technology 200 2,147 0.00%Bank of East Asia 2,214 7,435 0.02%BOC Hong Kong Holdings 4,500 17,262 0.04%CK Asset Holdings 3,000 25,138 0.05%CK Hutchison Holdings 3,500 35,215 0.08%CK Infrastructure Holdings 1,000 8,073 0.02%CLP Holdings 2,000 23,156 0.05%Dairy Farm International Holdings 170 1,535 0.00%Galaxy Entertainment Group 3,000 20,646 0.04%Hang Lung Group 1,000 2,931 0.01%Hang Lung Properties 3,000 6,538 0.01%Hang Seng Bank 1,000 22,889 0.05%Henderson Land Development 2,100 11,896 0.02%HK Electric Investments & HK Electric Investments 2,000 2,037 0.00%HKT Trust & HKT 4,000 5,893 0.01%Hong Kong & China Gas 11,400 24,727 0.05%Hong Kong Exchanges & Clearing 1,503 46,737 0.11%Hongkong Land Holdings 1,200 8,604 0.02%Hysan Development 1,000 5,187 0.01%Jardine Matheson Holdings 282 18,843 0.04%Jardine Strategic Holdings 289 11,063 0.02%Kerry Properties 500 2,065 0.00%Melco Resorts & Entertainment 322 6,949 0.01%MTR 2,006 11,197 0.02%New World Development 7,000 10,973 0.02%NWS Holdings 1,000 2,289 0.00%PCCW 3,000 1,785 0.00%Power Assets Holdings 2,000 13,445 0.03%Shangri-La Asia 2,000 2,595 0.01%Sino Land 4,064 7,282 0.02%SJM Holdings 1,000 1,048 0.00%Sun Hung Kai Properties 2,000 33,441 0.08%Swire Pacific 500 5,907 0.01%Swire Properties 1,600 6,219 0.01%Techtronic Industries 1,500 8,688 0.02%WH Group 11,500 9,849 0.02%Wharf Holdings 1,000 3,014 0.01%Wharf Real Estate Investment 1,000 6,818 0.01%Wheelock 1,000 6,398 0.01%
60

Fidelity MSCI World Index Fund SCHEDULE OF INVESTMENTS (CONTINUED) AS AT 31 JANUARY 2019
Number of
Shares Fair Value
USDFund % of
NAV*
Equities 96.20% (continued)
Hong Kong 1.22% (continued)
Yue Yuen Industrial Holdings 500 1,708 0.00%
Total Hong Kong 582,595 1.22%
Ireland 0.92%
Accenture 775 119,001 0.25%AerCap Holdings 146 6,900 0.01%AIB Group 1,089 4,873 0.01%Alkermes 186 6,114 0.01%Allegion 126 10,818 0.02%Aptiv 334 26,429 0.06%Bank of Ireland Group 1,390 8,342 0.02%CRH 1,056 30,414 0.06%DCC 128 10,482 0.02%James Hardie Industries 463 5,175 0.01%Jazz Pharmaceuticals 77 9,694 0.02%Kerry Group 197 20,175 0.04%Kingspan Group 193 7,906 0.02%Medtronic 1,647 145,579 0.30%Paddy Power Betfair 106 8,690 0.02%Perrigo 166 7,711 0.02%Ryanair Holdings 193 2,436 0.01%Smurfit Kappa Group 294 8,494 0.02%
Total Ireland 439,233 0.92%
Isle of Man 0.01%
GVC Holdings 544 4,809 0.01%
Israel 0.19%
Azrieli Group 16 852 0.00%Bank Hapoalim 1,568 10,612 0.02%Bank Leumi Le-Israel 2,099 13,859 0.03%Bezeq The Israeli Telecommunication 1,436 1,151 0.00%Check Point Software Technologies 161 18,019 0.04%Elbit Systems 15 1,855 0.00%Israel Chemicals 1,121 6,495 0.01%Mizrahi Tefahot Bank 100 1,858 0.00%Nice 68 7,488 0.02%Teva Pharmaceutical Industries 1,221 24,237 0.06%Wix.com 48 5,249 0.01%
Total Israel 91,675 0.19%
Italy 0.67%
Assicurazioni Generali 1,487 26,097 0.05%Atlantia 639 15,134 0.03%Davide Campari-Milano 813 7,318 0.02%Enel 9,849 59,513 0.13%Eni 3,037 51,597 0.12%Ferrari 160 19,938 0.04%Intesa Sanpaolo 18,829 43,098 0.09%Leonardo 606 5,881 0.01%Mediobanca Banca di Credito Finanziario 659 5,744 0.01%Moncler 177 6,682 0.01%Pirelli & C 285 1,865 0.00%Poste Italiane 353 3,044 0.01%Prysmian 257 5,523 0.01%Recordati 89 3,231 0.01%Snam 2,964 14,182 0.03%Telecom Italia 11,947 6,662 0.01%
61

Fidelity MSCI World Index Fund SCHEDULE OF INVESTMENTS (CONTINUED) AS AT 31 JANUARY 2019
Number of
Shares Fair Value
USDFund % of
NAV*
Equities 96.20% (continued)
Italy 0.67% (continued)
Telecom Italia (Non CVA) 12,528 6,140 0.01%Terna Rete Elettrica Nazionale 1,559 9,610 0.02%UniCredit 2,572 29,772 0.06%
Total Italy 321,031 0.67%
Japan 8.28%
Acom 200 700 0.00%Aeon 800 16,234 0.03%AEON Financial Service 100 1,936 0.00%Aeon Mall 100 1,659 0.00%AGC 200 6,772 0.01%Air Water 100 1,666 0.00%Aisin Seiki 200 7,884 0.02%Ajinomoto 500 8,642 0.02%Alfresa Holdings 200 5,508 0.01%Alps Alpine 200 4,203 0.01%Amada Holdings 400 4,014 0.01%ANA Holdings 200 7,366 0.02%Aozora Bank 100 3,078 0.01%Asahi Group Holdings 500 20,881 0.04%Asahi Intecc 100 4,337 0.01%Asahi Kasei 1,700 18,620 0.04%Asics 100 1,443 0.00%Astellas Pharma 2,400 35,494 0.07%Bandai Namco Holdings 200 8,812 0.02%Bank of Kyoto 100 4,250 0.01%Benesse Holdings 100 2,610 0.01%Bridgestone 800 30,786 0.06%Brother Industries 300 5,050 0.01%Calbee 100 3,207 0.01%Canon 1,300 37,197 0.08%Casio Computer 100 1,330 0.00%Central Japan Railway 200 43,168 0.09%Chiba Bank 900 5,475 0.01%Chubu Electric Power 800 12,640 0.03%Chugai Pharmaceutical 300 17,697 0.04%Chugoku Electric Power 200 2,733 0.01%Coca-Cola Bottlers Japan Holdings 100 3,083 0.01%Concordia Financial Group 1,100 4,528 0.01%Credit Saison 100 1,314 0.00%CyberAgent 100 3,216 0.01%Dai Nippon Printing 300 6,936 0.01%Daicel 400 4,190 0.01%Daifuku 100 4,999 0.01%Dai-ichi Life Holdings 1,400 22,634 0.05%Daiichi Sankyo 700 24,230 0.05%Daikin Industries 300 32,431 0.07%Daito Trust Construction 100 13,916 0.03%Daiwa House Industry 700 22,686 0.05%Daiwa Securities Group 2,200 10,952 0.02%DeNA 100 1,764 0.00%Denso 600 27,500 0.06%Dentsu 300 14,224 0.03%Don Quijote Holdings 100 5,816 0.01%East Japan Railway 400 37,049 0.08%Eisai 300 23,208 0.05%Electric Power Development 100 2,497 0.01%FamilyMart UNY Holdings 100 11,688 0.02%FANUC 200 33,741 0.07%
62

Fidelity MSCI World Index Fund SCHEDULE OF INVESTMENTS (CONTINUED) AS AT 31 JANUARY 2019
Number of
Shares Fair Value
USDFund % of
NAV*
Equities 96.20% (continued)
Japan 8.28% (continued)
Fast Retailing 100 45,787 0.10%Fuji Electric 200 6,156 0.01%FUJIFILM Holdings 500 21,433 0.04%Fujitsu 200 13,386 0.03%Fukuoka Financial Group 200 4,412 0.01%Hakuhodo DY Holdings 400 6,138 0.01%Hamamatsu Photonics 200 7,149 0.01%Hankyu Hanshin Holdings 300 10,696 0.02%Hino Motors 500 5,012 0.01%Hisamitsu Pharmaceutical 100 5,100 0.01%Hitachi 1,200 37,633 0.08%Hitachi Chemical 100 1,643 0.00%Hitachi Construction Machinery 100 2,525 0.01%Hitachi High-Technologies 100 3,602 0.01%Hitachi Metals 100 1,120 0.00%Honda Motor 2,000 59,707 0.12%Hoshizaki 100 7,094 0.01%Hoya 500 28,935 0.06%Hulic 500 4,608 0.01%Idemitsu Kosan 200 7,048 0.01%IHI 200 6,313 0.01%Iida Group Holdings 100 1,820 0.00%Inpex 1,400 13,449 0.03%Isetan Mitsukoshi Holdings 500 5,136 0.01%Isuzu Motors 700 10,394 0.02%ITOCHU 1,800 32,939 0.07%J Front Retailing 300 3,435 0.01%Japan Airlines 100 3,642 0.01%Japan Airport Terminal 100 3,822 0.01%Japan Exchange Group 700 12,292 0.03%Japan Post Bank 400 4,657 0.01%Japan Post Holdings 2,000 24,570 0.05%Japan Tobacco 1,400 35,376 0.07%JFE Holdings 700 12,314 0.03%JGC 200 3,051 0.01%JSR 100 1,614 0.00%JTEKT 100 1,295 0.00%JXTG Holdings 4,200 22,901 0.05%Kajima 500 7,103 0.01%Kakaku.com 100 1,750 0.00%Kamigumi 100 2,213 0.00%Kaneka 100 3,905 0.01%Kansai Electric Power 900 13,678 0.03%Kansai Paint 300 5,265 0.01%Kao 600 42,297 0.09%Kawasaki Heavy Industries 100 2,513 0.01%KDDI 2,200 55,044 0.12%Keihan Holdings 100 4,121 0.01%Keikyu 300 5,102 0.01%Keio 100 5,743 0.01%Keisei Electric Railway 100 3,170 0.01%Keyence 100 51,327 0.11%Kikkoman 200 10,604 0.02%Kintetsu Group Holdings 200 8,720 0.02%Kirin Holdings 1,100 26,178 0.05%Kobayashi Pharmaceutical 100 6,340 0.01%Kobe Steel 200 1,599 0.00%Koito Manufacturing 100 6,000 0.01%Komatsu 1,200 30,449 0.06%Konami Holdings 100 4,604 0.01%
63

Fidelity MSCI World Index Fund SCHEDULE OF INVESTMENTS (CONTINUED) AS AT 31 JANUARY 2019
Number of
Shares Fair Value
USDFund % of
NAV*
Equities 96.20% (continued)
Japan 8.28% (continued)
Konica Minolta 700 7,030 0.01%Kubota 1,300 20,474 0.04%Kuraray 500 7,677 0.02%Kurita Water Industries 100 2,536 0.01%Kyocera 400 22,472 0.05%Kyowa Hakko Kirin 300 5,734 0.01%Kyushu Electric Power 400 4,947 0.01%Kyushu Railway 200 6,818 0.01%Lawson 100 6,166 0.01%LINE 100 3,478 0.01%Lion 200 4,159 0.01%LIXIL Group 200 2,933 0.01%M3 500 7,190 0.02%Makita 300 10,613 0.02%Marubeni 2,100 16,336 0.03%Marui Group 300 6,081 0.01%Maruichi Steel Tube 100 3,207 0.01%Mazda Motor 600 6,610 0.01%McDonald's Holdings Japan 100 4,424 0.01%Mebuki Financial Group 500 1,401 0.00%Medipal Holdings 200 4,613 0.01%MEIJI Holdings 100 7,728 0.02%Minebea Mitsumi 400 6,550 0.01%MISUMI Group 400 9,115 0.02%Mitsubishi 1,700 49,689 0.10%Mitsubishi Chemical Holdings 1,700 14,576 0.03%Mitsubishi Electric 2,400 30,113 0.06%Mitsubishi Estate 1,500 26,525 0.06%Mitsubishi Gas Chemical 100 1,576 0.00%Mitsubishi Heavy Industries 400 15,448 0.03%Mitsubishi Materials 100 2,858 0.01%Mitsubishi Motors 1,000 6,184 0.01%Mitsubishi Tanabe Pharma 200 3,126 0.01%Mitsubishi UFJ Financial Group 14,800 79,364 0.18%Mitsubishi UFJ Lease & Finance 200 1,022 0.00%Mitsui 2,200 35,831 0.07%Mitsui Chemicals 300 7,509 0.02%Mitsui Fudosan 1,100 26,654 0.06%Mitsui OSK Lines 100 2,492 0.01%Mizuho Financial Group 30,200 49,783 0.10%MonotaRO 200 4,251 0.01%MS&AD Insurance Group Holdings 600 17,830 0.04%Murata Manufacturing 200 28,338 0.06%Nabtesco 100 2,634 0.01%Nagoya Railroad 300 7,939 0.02%NEC 300 10,062 0.02%Nexon 600 9,163 0.02%NGK Insulators 500 7,673 0.02%NGK Spark Plug 100 2,148 0.00%NH Foods 100 3,951 0.01%Nidec 300 35,918 0.08%Nikon 300 5,138 0.01%Nintendo 100 31,085 0.06%Nippon Electric Glass 100 2,775 0.01%Nippon Express 100 6,322 0.01%Nippon Paint Holdings 200 6,689 0.01%Nippon Steel & Sumitomo Metal 1,100 20,316 0.04%Nippon Telegraph & Telephone 900 38,628 0.08%Nippon Yusen 100 1,671 0.00%Nissan Chemical 200 10,622 0.02%
64

Fidelity MSCI World Index Fund SCHEDULE OF INVESTMENTS (CONTINUED) AS AT 31 JANUARY 2019
Number of
Shares Fair Value
USDFund % of
NAV*
Equities 96.20% (continued)
Japan 8.28% (continued)
Nissan Motor 2,900 24,697 0.05%Nisshin Seifun Group 300 6,040 0.01%Nissin Foods Holdings 100 6,349 0.01%Nitori Holdings 100 13,011 0.03%Nitto Denko 200 11,284 0.02%Nomura Holdings 4,500 18,272 0.04%Nomura Real Estate Holdings 100 1,942 0.00%Nomura Research Institute 100 4,080 0.01%NSK 700 6,812 0.01%NTT Data 800 9,527 0.02%NTT DOCOMO 1,700 40,700 0.09%Obayashi 700 6,644 0.01%Obic 100 9,446 0.02%Odakyu Electric Railway 400 8,986 0.02%Oji Holdings 1,000 5,780 0.01%Olympus 400 16,429 0.03%Omron 200 8,178 0.02%Ono Pharmaceutical 500 10,891 0.02%Oriental Land 200 20,454 0.04%ORIX 1,700 25,618 0.05%Osaka Gas 400 7,891 0.02%Otsuka 100 3,225 0.01%Otsuka Holdings 500 20,459 0.04%Panasonic 2,900 28,299 0.06%Park24 100 2,383 0.00%Persol Holdings 300 5,328 0.01%Pigeon 100 3,896 0.01%Pola Orbis Holdings 100 2,982 0.01%Rakuten 1,100 8,278 0.02%Recruit Holdings 1,400 37,467 0.08%Renesas Electronics 800 4,594 0.01%Resona Holdings 2,800 14,148 0.03%Ricoh 700 7,448 0.02%Rohm 100 7,020 0.01%Sankyo 100 3,868 0.01%Santen Pharmaceutical 400 5,510 0.01%SBI Holdings 200 4,260 0.01%Secom 300 25,088 0.05%Sega Sammy Holdings 100 1,406 0.00%Seibu Holdings 200 3,468 0.01%Seiko Epson 400 6,351 0.01%Sekisui Chemical 400 6,219 0.01%Sekisui House 900 13,447 0.03%Seven & i Holdings 900 39,190 0.08%Seven Bank 300 893 0.00%SG Holdings 100 2,680 0.01%Sharp 300 3,178 0.01%Shimadzu 200 4,585 0.01%Shimano 100 13,985 0.03%Shimizu 600 5,100 0.01%Shin-Etsu Chemical 400 33,726 0.07%Shinsei Bank 100 1,353 0.00%Shionogi 300 18,431 0.04%Shiseido 500 29,748 0.06%Shizuoka Bank 300 2,514 0.01%Showa Denko 200 6,689 0.01%Showa Shell Sekiyu 200 2,977 0.01%SMC 100 32,831 0.07%Softbank 2,100 25,915 0.05%SoftBank Group 1,000 78,341 0.17%
65

Fidelity MSCI World Index Fund SCHEDULE OF INVESTMENTS (CONTINUED) AS AT 31 JANUARY 2019
Number of
Shares Fair Value
USDFund % of
NAV*
Equities 96.20% (continued)
Japan 8.28% (continued)
Sohgo Security Services 100 4,355 0.01%Sompo Holdings 400 15,018 0.03%Sony 1,600 80,374 0.18%Sony Financial Holdings 200 3,791 0.01%Stanley Electric 100 2,899 0.01%Subaru 800 18,760 0.04%SUMCO 200 2,768 0.01%Sumitomo 1,500 23,176 0.05%Sumitomo Chemical 1,600 8,321 0.02%Sumitomo Dainippon Pharma 200 4,679 0.01%Sumitomo Electric Industries 1,000 14,210 0.03%Sumitomo Heavy Industries 100 3,377 0.01%Sumitomo Metal Mining 300 8,645 0.02%Sumitomo Mitsui Financial Group 1,700 63,185 0.13%Sumitomo Mitsui Trust Holdings 400 15,169 0.03%Sumitomo Realty & Development 500 19,080 0.04%Sumitomo Rubber Industries 100 1,387 0.00%Sundrug 100 3,193 0.01%Suntory Beverage & Food 200 8,849 0.02%Suruga Bank 100 428 0.00%Suzuken 100 5,238 0.01%Suzuki Motor 400 20,855 0.04%Sysmex 200 11,113 0.02%T&D Holdings 600 7,424 0.02%Taiheiyo Cement 100 3,418 0.01%Taisei 300 14,086 0.03%Taiyo Nippon Sanso 100 1,580 0.00%Takashimaya 200 2,712 0.01%Takeda Pharmaceutical 1,855 74,809 0.16%TDK 200 15,749 0.03%Teijin 100 1,726 0.00%Terumo 400 22,817 0.05%THK 100 2,368 0.00%Tobu Railway 200 5,642 0.01%Toho 100 3,643 0.01%Toho Gas 100 4,277 0.01%Tohoku Electric Power 600 8,115 0.02%Tokio Marine Holdings 800 39,048 0.08%Tokyo Century 100 4,668 0.01%Tokyo Electric Power 1,800 11,065 0.02%Tokyo Electron 200 28,733 0.06%Tokyo Gas 500 13,133 0.03%Tokyu 700 11,964 0.03%Tokyu Fudosan Holdings 1,000 5,440 0.01%Toppan Printing 400 6,546 0.01%Toray Industries 1,900 14,087 0.03%Toshiba 800 25,250 0.05%Tosoh 200 2,836 0.01%TOTO 200 7,746 0.02%Toyo Seikan Group Holdings 100 2,248 0.00%Toyo Suisan Kaisha 100 3,588 0.01%Toyoda Gosei 100 2,179 0.00%Toyota Industries 200 9,869 0.02%Toyota Motor 2,800 171,735 0.37%Toyota Tsusho 200 6,359 0.01%Trend Micro 100 5,311 0.01%Unicharm 500 15,409 0.03%USS 300 5,249 0.01%Welcia Holdings 100 3,786 0.01%West Japan Railway 200 14,590 0.03%
66

Fidelity MSCI World Index Fund SCHEDULE OF INVESTMENTS (CONTINUED) AS AT 31 JANUARY 2019
Number of
Shares Fair Value
USDFund % of
NAV*
Equities 96.20% (continued)
Japan 8.28% (continued)
Yahoo Japan 3,700 9,961 0.02%Yakult Honsha 100 6,643 0.01%Yamada Denki 400 1,970 0.00%Yamaguchi Financial Group 100 1,017 0.00%Yamaha 200 8,748 0.02%Yamaha Motor 400 8,549 0.02%Yamato Holdings 400 10,646 0.02%Yamazaki Baking 100 1,957 0.00%Yaskawa Electric 300 8,435 0.02%Yokogawa Electric 200 3,716 0.01%Yokohama Rubber 100 2,117 0.00%ZOZO 200 4,030 0.01%
Total Japan 3,964,293 8.28%
Luxembourg 0.12%
ArcelorMittal 885 20,507 0.05%Aroundtown 843 7,468 0.02%Eurofins Scientific 12 4,841 0.01%Millicom International Cellular 83 5,193 0.01%RTL Group 31 1,699 0.00%SES 461 9,426 0.02%Tenaris 476 5,989 0.01%
Total Luxembourg 55,123 0.12%
Macau 0.05%
MGM China Holdings 400 769 0.00%Sands China 3,200 15,211 0.04%Wynn Macau 2,400 5,824 0.01%
Total Macau 21,804 0.05%
Mexico 0.00%
Fresnillo 145 1,917 0.00%
Netherlands 1.63%
ABN AMRO Group 540 13,458 0.03%Aegon 2,344 12,055 0.03%Akzo Nobel 285 24,644 0.05%ASML Holding 498 87,555 0.17%EXOR 117 7,491 0.02%Heineken 296 26,621 0.06%Heineken Holding 153 13,307 0.03%ING Groep 4,717 55,814 0.12%Koninklijke Ahold Delhaize 1,557 41,127 0.09%Koninklijke DSM 236 22,092 0.05%Koninklijke KPN 4,442 13,696 0.03%Koninklijke Philips 1,199 47,272 0.10%Koninklijke Vopak 51 2,599 0.01%NN Group 393 16,649 0.03%NXP Semiconductors 432 37,597 0.08%QIAGEN 294 10,863 0.02%Randstad 161 7,779 0.02%Royal Dutch Shell (A Shares) 6,039 187,638 0.38%Royal Dutch Shell (B Shares) 4,139 128,956 0.26%Wolters Kluwer 361 22,534 0.05%
Total Netherlands 779,747 1.63%
67

Fidelity MSCI World Index Fund SCHEDULE OF INVESTMENTS (CONTINUED) AS AT 31 JANUARY 2019
Number of
Shares Fair Value
USDFund % of
NAV*
Equities 96.20% (continued)
New Zealand 0.08%
a2 Milk 1,025 8,994 0.03%Auckland International Airport 1,298 6,617 0.01%Fisher & Paykel Healthcare 677 5,898 0.01%Fletcher Building 586 2,032 0.00%Meridian Energy 934 2,280 0.00%Ryman Healthcare 297 2,159 0.00%Spark New Zealand 2,914 8,196 0.03%
Total New Zealand 36,176 0.08%
Norway 0.24%
Aker BP 76 2,533 0.01%DNB 1,306 23,156 0.05%Equinor 1,513 34,629 0.07%Gjensidige Forsikring 107 1,846 0.00%Mowi 552 12,163 0.03%Norsk Hydro 1,371 6,335 0.01%Orkla 854 6,884 0.01%Schibsted 57 1,810 0.00%Telenor 1,023 19,358 0.04%Yara International 187 7,728 0.02%
Total Norway 116,442 0.24%
Portugal 0.06%
Energias de Portugal 3,527 12,911 0.03%Galp Energia 685 10,725 0.02%Jeronimo Martins 219 3,108 0.01%
Total Portugal 26,744 0.06%
Singapore 0.42%
CapitaLand 3,500 8,668 0.02%City Developments 200 1,367 0.00%ComfortDelGro 3,600 6,238 0.01%DBS Group Holdings 2,300 40,914 0.09%Genting Singapore 9,000 7,363 0.02%Golden Agri-Resources 3,000 569 0.00%Jardine Cycle & Carriage 100 2,809 0.01%Keppel 1,700 7,712 0.02%Oversea-Chinese Banking 4,100 35,095 0.07%SATS 500 1,800 0.00%Sembcorp Industries 800 1,541 0.00%Singapore Airlines 1,000 7,177 0.01%Singapore Exchange 600 3,409 0.01%Singapore Press Holdings 1,200 2,240 0.00%Singapore Technologies Engineering 1,200 3,320 0.01%Singapore Telecommunications 10,800 24,256 0.05%United Overseas Bank 1,800 33,720 0.07%UOL Group 300 1,481 0.00%Venture 200 2,418 0.01%Wilmar International 3,200 7,925 0.02%
Total Singapore 200,022 0.42%
South Africa 0.01%
Investec 964 6,204 0.01%Old Mutual 2 3 0.00%
Total South Africa 6,207 0.01%
68

Fidelity MSCI World Index Fund SCHEDULE OF INVESTMENTS (CONTINUED) AS AT 31 JANUARY 2019
Number of
Shares Fair Value
USDFund % of
NAV*
Equities 96.20% (continued)
Spain 1.04%
ACS Actividades de Construccion y Servicios 348 14,415 0.03%ACS Actividades de Construccion y Servicios - Rights Issue 348 191 0.00%Aena SME 88 15,227 0.03%Amadeus IT Group 555 40,426 0.08%Banco Bilbao Vizcaya Argentaria 8,414 49,915 0.10%Banco de Sabadell 5,864 6,725 0.01%Banco Santander 19,733 93,558 0.21%Bankia 867 2,527 0.01%Bankinter 735 5,742 0.01%CaixaBank 4,777 18,078 0.04%Enagas 249 7,266 0.02%Endesa 329 8,237 0.02%Ferrovial 669 15,023 0.03%Grifols 392 10,233 0.02%Iberdrola 7,542 62,309 0.14%Iberdrola (Interim) 191 1,578 0.00%Industria de Diseno Textil 1,375 38,418 0.08%Mapfre 692 1,928 0.00%Naturgy Energy Group 408 11,400 0.02%Red Electrica 467 10,771 0.02%Repsol 1,664 29,270 0.06%Siemens Gamesa Renewable Energy 269 3,821 0.01%Telefonica 5,678 48,832 0.10%
Total Spain 495,890 1.04%
Sweden 0.85%
Alfa Laval 297 6,723 0.01%Assa Abloy 1,201 22,335 0.05%Atlas Copco (A Shares) 522 13,588 0.03%Atlas Copco (B Shares) 839 20,040 0.04%Autoliv 112 8,943 0.02%Boliden 298 7,437 0.02%Electrolux 357 8,433 0.02%Epiroc (Class A) 1,196 11,461 0.02%Epiroc (Class B) 191 1,708 0.00%Essity 792 21,903 0.05%Hennes & Mauritz 1,134 17,623 0.04%Hexagon 342 16,693 0.03%Husqvarna 233 1,777 0.00%ICA Gruppen 58 2,039 0.00%Industrivarden 119 2,448 0.01%Investor 586 25,721 0.06%Kinnevik 245 5,974 0.01%L E Lundbergforetagen 63 1,943 0.00%Lundin Petroleum 194 6,208 0.01%Sandvik 1,381 22,026 0.05%Securitas 420 6,743 0.01%Skandinaviska Enskilda Banken 1,990 20,852 0.04%Skanska 363 6,345 0.01%SKF 420 7,049 0.01%Svenska Handelsbanken 1,846 20,037 0.04%Swedbank 1,123 25,458 0.05%Swedish Match 235 10,512 0.02%Tele2 700 8,735 0.02%Telefonaktiebolaget LM Ericsson 3,835 34,063 0.08%Telia 3,359 14,621 0.03%Veoneer 3 89 0.00%Volvo 1,988 28,577 0.07%
Total Sweden 408,104 0.85%
69

Fidelity MSCI World Index Fund SCHEDULE OF INVESTMENTS (CONTINUED) AS AT 31 JANUARY 2019
Number of
Shares Fair Value
USDFund % of
NAV*
Equities 96.20% (continued)
Switzerland 3.41%
ABB 2,313 44,192 0.09%Adecco Group 173 8,672 0.02%Baloise Holding 60 9,295 0.02%Barry Callebaut 2 3,407 0.01%Chocoladefabriken Lindt & Spruengli 3 19,126 0.04%Chubb 564 75,040 0.16%Cie Financiere Richemont 660 45,517 0.10%Clariant 327 6,500 0.01%Coca-Cola HBC 205 6,898 0.01%Credit Suisse Group 3,253 39,396 0.08%Dufry 21 2,101 0.00%EMS-Chemie Holding 10 5,000 0.01%Ferguson 296 19,835 0.04%Garmin 151 10,446 0.02%Geberit 48 18,777 0.04%Givaudan 11 26,699 0.06%Glencore 13,865 56,440 0.12%Julius Baer Group 303 12,162 0.03%Kuehne + Nagel International 73 9,889 0.02%LafargeHolcim 628 29,517 0.06%Lonza Group 94 24,815 0.05%Nestle 3,737 325,598 0.67%Novartis 2,650 231,049 0.47%Pargesa Holding 31 2,448 0.01%Partners Group Holding 23 15,823 0.03%Roche Holding 859 228,539 0.47%Schindler Holding 57 12,123 0.03%Schindler Holding (Registered) 26 5,493 0.01%SGS 7 16,899 0.04%Sika 153 20,203 0.04%Sonova Holding 71 13,325 0.03%STMicroelectronics 912 14,509 0.03%Straumann Holding 11 7,989 0.02%Swatch Group 27 7,762 0.02%Swatch Group (Registered) 134 7,469 0.02%Swiss Life Holding 43 17,740 0.04%Swiss Prime Site 77 6,531 0.01%Swiss Re 379 36,360 0.08%Swisscom 35 16,793 0.04%TE Connectivity 456 36,913 0.08%Temenos 78 10,527 0.02%UBS Group 4,628 59,943 0.13%Vifor Pharma 48 6,111 0.01%Zurich Insurance Group 179 56,239 0.12%
Total Switzerland 1,630,110 3.41%
United Arab Emirates 0.01%
NMC Health 155 5,252 0.01%
United Kingdom 5.58%
3i Group 1,250 13,970 0.03%Admiral Group 271 7,383 0.02%Anglo American 1,271 32,482 0.07%Aon 299 46,713 0.10%Ashtead Group 623 15,805 0.03%Associated British Foods 475 14,921 0.03%AstraZeneca 1,547 112,576 0.24%Auto Trader Group 1,393 8,374 0.02%Aviva 5,004 27,258 0.06%
70

Fidelity MSCI World Index Fund SCHEDULE OF INVESTMENTS (CONTINUED) AS AT 31 JANUARY 2019
Number of
Shares Fair Value
USDFund % of
NAV*
Equities 96.20% (continued)
United Kingdom 5.58% (continued)
Babcock International Group 166 1,159 0.00%BAE Systems 3,819 25,711 0.05%Barclays 21,473 44,681 0.09%Barratt Developments 1,037 7,347 0.02%Berkeley Group Holdings 131 6,467 0.01%BP 24,382 166,813 0.34%British American Tobacco 2,806 99,181 0.21%BT Group 10,625 32,482 0.07%Bunzl 430 13,575 0.03%Burberry Group 534 12,655 0.03%Capri Holdings 191 8,114 0.02%Centrica 7,299 13,096 0.03%CNH Industrial 1,370 13,463 0.03%Coca-Cola European Partners 271 12,894 0.03%Compass Group 1,981 42,489 0.09%ConvaTec Group 918 1,724 0.00%Croda International 175 11,098 0.02%Diageo 2,958 112,900 0.24%Direct Line Insurance Group 1,905 8,437 0.02%easyJet 112 1,862 0.00%Experian 1,139 28,647 0.06%Fiat Chrysler Automobiles 1,381 23,639 0.05%G4S 2,073 5,333 0.01%GlaxoSmithKline 6,053 117,621 0.24%Hargreaves Lansdown 371 7,970 0.02%HSBC Holdings 24,262 203,909 0.42%IHS Markit 485 25,181 0.05%Imperial Brands 1,201 39,891 0.08%Informa 1,634 14,539 0.03%InterContinental Hotels Group 228 13,018 0.03%International Consolidated Airlines Group 774 6,558 0.01%Intertek Group 206 13,300 0.03%ITV 4,830 8,215 0.02%J Sainsbury 1,684 6,318 0.01%John Wood Group 687 4,891 0.01%Johnson Matthey 254 10,167 0.02%Kingfisher 2,817 8,252 0.02%Legal & General Group 7,061 24,094 0.05%Liberty Global (Class A) 133 3,245 0.01%Liberty Global (Class C) 772 18,188 0.04%Linde 672 109,543 0.23%Lloyds Banking Group 86,394 65,802 0.14%London Stock Exchange Group 371 22,347 0.05%Marks & Spencer Group 1,719 6,531 0.01%Meggitt 1,060 7,192 0.02%Melrose Industries 6,192 13,737 0.03%Merlin Entertainments 484 2,153 0.00%Micro Focus International 556 10,612 0.02%Mondi 470 11,373 0.02%National Grid 4,087 44,365 0.09%Next 178 11,349 0.02%Pearson 985 11,739 0.02%Pentair 183 7,538 0.02%Persimmon 413 12,903 0.03%Prudential 3,146 61,476 0.13%Reckitt Benckiser Group 815 62,857 0.13%RELX 2,352 52,179 0.11%Rio Tinto 461 29,261 0.06%Rio Tinto (London Listed) 1,428 78,661 0.16%Rolls-Royce Holdings 2,118 24,640 0.05%
71

Fidelity MSCI World Index Fund SCHEDULE OF INVESTMENTS (CONTINUED) AS AT 31 JANUARY 2019
Number of
Shares Fair Value
USDFund % of
NAV*
Equities 96.20% (continued)
United Kingdom 5.58% (continued)
Royal Bank of Scotland Group 6,086 19,286 0.04%Royal Mail 1,258 4,437 0.01%RSA Insurance Group 1,375 9,275 0.02%Sage Group 1,402 11,545 0.02%Schroders 117 4,019 0.01%Severn Trent 326 8,570 0.02%Smith & Nephew 1,114 21,029 0.04%Smiths Group 522 9,919 0.02%SSE 1,294 19,916 0.04%St James's Place 539 6,651 0.01%Standard Chartered 3,547 28,644 0.06%Standard Life Aberdeen 3,092 10,236 0.02%Taylor Wimpey 3,482 7,565 0.02%TechnipFMC 553 12,697 0.03%Tesco 12,292 36,074 0.08%Unilever 1,378 72,227 0.15%Unilever (Dutch Certificates) 1,893 101,319 0.21%United Utilities Group 907 9,912 0.02%Vodafone Group 32,505 59,255 0.12%Weir Group 247 4,890 0.01%Whitbread 241 15,493 0.03%Willis Towers Watson 162 26,372 0.06%Wm Morrison Supermarkets 3,038 9,361 0.02%WPP 1,510 17,277 0.04%
Total United Kingdom 2,670,833 5.58%
United States 57.61%
3M 713 142,814 0.30%Abbott Laboratories 2,136 155,885 0.33%AbbVie 1,851 148,617 0.31%Abiomed 53 18,607 0.04%Activision Blizzard 907 42,847 0.09%Acuity Brands 57 6,892 0.01%Adobe 595 147,453 0.31%Advance Auto Parts 95 15,124 0.03%Advanced Micro Devices 1,159 28,291 0.06%AES 833 13,653 0.03%Affiliated Managers Group 72 7,556 0.02%Aflac 927 44,218 0.09%Agilent Technologies 400 30,420 0.06%Air Products & Chemicals 260 42,741 0.09%Akamai Technologies 220 14,322 0.03%Albemarle 120 9,688 0.02%Alexion Pharmaceuticals 280 34,429 0.07%Align Technology 96 23,899 0.05%Alleghany 19 12,000 0.03%Allergan 414 59,608 0.12%Alliance Data Systems 68 12,076 0.03%Alliant Energy 298 13,252 0.03%Allstate 431 37,872 0.08%Ally Financial 561 14,620 0.03%Alnylam Pharmaceuticals 108 9,021 0.02%Alphabet (Class A) 355 399,690 0.84%Alphabet (Class C) 396 442,082 0.92%Altria Group 2,301 113,554 0.24%Amazon.com 508 873,114 1.83%AMERCO 12 4,352 0.01%Ameren 309 21,426 0.04%American Airlines Group 125 4,471 0.01%
72

Fidelity MSCI World Index Fund SCHEDULE OF INVESTMENTS (CONTINUED) AS AT 31 JANUARY 2019
Number of
Shares Fair Value
USDFund % of
NAV*
Equities 96.20% (continued)
United States 57.61% (continued)
American Electric Power 592 46,839 0.10%American Express 885 90,890 0.19%American Financial Group 99 9,444 0.02%American International Group 1,080 46,688 0.10%American Water Works 223 21,334 0.04%Ameriprise Financial 181 22,915 0.05%AmerisourceBergen 205 17,091 0.04%AMETEK 290 21,141 0.04%Amgen 789 147,630 0.31%Amphenol 393 34,553 0.07%Anadarko Petroleum 642 30,386 0.06%Analog Devices 463 45,772 0.10%ANSYS 107 17,585 0.04%Antero Resources 142 1,429 0.00%Anthem 304 92,112 0.19%AO Smith 193 9,237 0.02%Apache 447 14,671 0.03%Apple 5,919 985,157 2.07%Applied Materials 1,234 48,225 0.10%Aramark 316 10,412 0.02%Archer-Daniels-Midland 692 31,071 0.06%Arconic 583 10,972 0.02%Arista Networks 69 14,820 0.03%Arrow Electronics 98 7,443 0.02%Arthur J Gallagher 232 17,333 0.04%Assurant 53 5,109 0.01%AT&T 8,888 267,173 0.56%Athene Holding 200 8,580 0.02%Atmos Energy 137 13,375 0.03%Autodesk 273 40,186 0.08%Automatic Data Processing 519 72,577 0.15%AutoZone 33 27,962 0.06%Avery Dennison 115 12,012 0.03%AXA Equitable Holdings 317 5,877 0.01%Axalta Coating Systems 241 6,174 0.01%Baker Hughes 645 15,203 0.03%Ball 408 21,330 0.04%Bank of America 11,610 330,536 0.69%Bank of New York Mellon 1,214 63,516 0.13%Bausch Health 405 9,948 0.02%Baxter International 636 46,104 0.10%BB&T 961 46,897 0.10%Becton Dickinson 323 80,576 0.17%Berkshire Hathaway 1,590 326,809 0.68%Best Buy 332 19,668 0.04%Biogen 244 81,442 0.17%BioMarin Pharmaceutical 225 22,088 0.05%BlackRock 145 60,187 0.13%Boeing 668 257,594 0.54%Booking Holdings 58 106,303 0.22%BorgWarner 270 11,043 0.02%Boston Scientific 1,729 65,961 0.14%Brighthouse Financial 144 5,377 0.01%Bristol-Myers Squibb 1,991 98,296 0.21%Broadcom 527 141,368 0.30%Broadridge Financial Solutions 152 15,326 0.03%Brown-Forman 338 15,971 0.03%Bunge 180 9,913 0.02%Burlington Stores 85 14,595 0.03%Cabot Oil & Gas 556 13,872 0.03%
73

Fidelity MSCI World Index Fund SCHEDULE OF INVESTMENTS (CONTINUED) AS AT 31 JANUARY 2019
Number of
Shares Fair Value
USDFund % of
NAV*
Equities 96.20% (continued)
United States 57.61% (continued)
Cadence Design Systems 367 17,627 0.04%Campbell Soup 200 7,086 0.01%Capital One Financial 573 46,178 0.10%Cardinal Health 394 19,688 0.04%CarMax 224 13,167 0.03%Carnival 223 12,637 0.03%Carnival 533 30,690 0.06%Caterpillar 723 96,275 0.20%Cboe Global Markets 146 13,617 0.03%CBRE Group 411 18,803 0.04%CBS 428 21,169 0.04%CDK Global 161 7,875 0.02%CDW 198 16,487 0.03%Celanese 170 16,279 0.03%Celgene 859 75,987 0.16%Centene 258 33,687 0.07%CenterPoint Energy 622 19,232 0.04%CenturyLink 1,222 18,721 0.04%Cerner 373 20,481 0.04%CF Industries Holdings 303 13,226 0.03%CH Robinson Worldwide 175 15,185 0.03%Charles Schwab 1,479 69,173 0.14%Charter Communications 195 64,555 0.13%Chemours 185 6,614 0.01%Cheniere Energy 265 17,397 0.04%Chevron 2,344 268,740 0.56%Chipotle Mexican Grill 32 16,948 0.04%Church & Dwight 306 19,771 0.04%Cigna 461 92,112 0.19%Cimarex Energy 123 9,267 0.02%Cincinnati Financial 192 15,575 0.03%Cintas 98 18,376 0.04%Cisco Systems 5,760 272,390 0.57%CIT Group 131 6,051 0.01%Citigroup 3,062 197,377 0.41%Citizens Financial Group 597 20,250 0.04%Citrix Systems 167 17,124 0.04%Clorox 161 23,889 0.05%CME Group 435 79,292 0.17%CMS Energy 361 18,823 0.04%Coca-Cola 4,919 236,751 0.49%Cognex 203 9,237 0.02%Cognizant Technology Solutions 722 50,309 0.11%Colgate-Palmolive 998 64,551 0.13%Comcast 5,578 203,987 0.43%Comerica 215 16,929 0.04%CommScope Holding 254 5,311 0.01%Conagra Brands 630 13,633 0.03%Concho Resources 251 30,080 0.06%ConocoPhillips 1,411 95,511 0.20%Consolidated Edison 393 30,516 0.06%Constellation Brands 211 36,642 0.08%Continental Resources 96 4,432 0.01%Cooper 62 17,283 0.04%Copart 271 13,721 0.03%Corning 997 33,160 0.07%CoStar Group 41 16,020 0.03%Costco Wholesale 535 114,827 0.24%Coty 497 3,857 0.01%Crown Holdings 143 7,293 0.02%
74

Fidelity MSCI World Index Fund SCHEDULE OF INVESTMENTS (CONTINUED) AS AT 31 JANUARY 2019
Number of
Shares Fair Value
USDFund % of
NAV*
Equities 96.20% (continued)
United States 57.61% (continued)
CSX 964 63,335 0.13%Cummins 170 25,009 0.05%CVS Health 1,573 103,110 0.22%Danaher 762 84,521 0.18%Darden Restaurants 159 16,684 0.03%DaVita 172 9,654 0.02%Deere 369 60,516 0.13%Dell Technologies 204 9,912 0.02%Delta Air Lines 218 10,776 0.02%Dentsply Sirona 284 11,914 0.02%Devon Energy 648 17,269 0.04%DexCom 110 15,513 0.03%Diamondback Energy 196 20,212 0.04%Discover Financial Services 436 29,426 0.06%Discovery (Class A) 296 8,400 0.02%Discovery (Class B) 281 7,489 0.02%DISH Network 294 9,017 0.02%Dollar General 328 37,861 0.08%Dollar Tree 296 28,662 0.06%Dominion Energy 899 63,146 0.13%Domino's Pizza 53 15,038 0.03%Dover 188 16,512 0.03%DowDuPont 2,814 151,421 0.32%DR Horton 455 17,495 0.04%DTE Energy 229 26,965 0.06%Duke Energy 833 73,121 0.15%DXC Technology 353 22,634 0.05%E*TRADE Financial 328 15,304 0.03%East West Bancorp 191 9,611 0.02%Eastman Chemical 181 14,592 0.03%Eaton 537 40,946 0.09%Eaton Vance 133 5,123 0.01%eBay 1,186 39,909 0.08%Ecolab 310 49,033 0.10%Edison International 408 23,244 0.05%Edwards Lifesciences 262 44,650 0.09%Electronic Arts 381 35,143 0.07%Eli Lilly 1,182 141,675 0.30%Emerson Electric 781 51,132 0.11%Entergy 226 20,157 0.04%EOG Resources 703 69,738 0.15%Equifax 156 16,695 0.03%Equitrans Midstream 5 104 0.00%Estee Lauder 281 38,334 0.08%Evergy 340 19,489 0.04%Eversource Energy 395 27,417 0.06%Exelon 1,158 55,306 0.12%Expedia Group 157 18,722 0.04%Expeditors International of Washington 219 15,177 0.03%Exxon Mobil 5,182 379,736 0.79%F5 Networks 81 13,037 0.03%Facebook 2,970 495,068 1.03%Fastenal 361 21,826 0.05%FedEx 301 53,449 0.11%Fidelity National Financial 350 12,656 0.03%Fidelity National Information Services 404 42,230 0.09%Fifth Third Bancorp 834 22,368 0.05%First Data 684 16,861 0.04%First Republic Bank 203 19,616 0.04%FirstEnergy 605 23,716 0.05%
75

Fidelity MSCI World Index Fund SCHEDULE OF INVESTMENTS (CONTINUED) AS AT 31 JANUARY 2019
Number of
Shares Fair Value
USDFund % of
NAV*
Equities 96.20% (continued)
United States 57.61% (continued)
Fiserv 504 41,797 0.09%FleetCor Technologies 110 22,199 0.05%Flex 528 5,079 0.01%FLIR Systems 168 8,212 0.02%Flowserve 132 5,813 0.01%Fluor 138 5,047 0.01%FMC 172 13,726 0.03%Ford Motor 4,638 40,814 0.09%Fortinet 180 13,783 0.03%Fortive 379 28,421 0.06%Fortune Brands Home & Security 156 7,067 0.01%Franklin Resources 399 11,814 0.02%Freeport-McMoRan 1,756 20,440 0.04%Gap 229 5,826 0.01%Gartner 115 15,627 0.03%General Dynamics 305 52,207 0.11%General Electric 10,629 107,991 0.23%General Mills 746 33,152 0.07%General Motors 1,539 60,052 0.13%Genuine Parts 186 18,567 0.04%Gilead Sciences 1,581 110,686 0.23%Global Payments 171 19,200 0.04%GoDaddy 217 14,893 0.03%Goldman Sachs Group 436 86,332 0.18%Goodyear Tire & Rubber 257 5,446 0.01%GrubHub 114 9,166 0.02%H&R Block 179 4,223 0.01%Halliburton 1,116 34,998 0.07%Hanesbrands 394 5,906 0.01%Harley-Davidson 212 7,814 0.02%Harris 147 22,517 0.05%Hartford Financial Services Group 447 20,973 0.04%Hasbro 153 13,856 0.03%HCA Healthcare 345 48,103 0.10%HD Supply Holdings 189 7,927 0.02%Helmerich & Payne 144 8,063 0.02%Henry Schein 193 14,996 0.03%Hershey 176 18,674 0.04%Hess 339 18,306 0.04%Hewlett Packard Enterprise 1,859 28,982 0.06%Hilton Worldwide Holdings 290 21,599 0.05%HollyFrontier 220 12,395 0.03%Hologic 349 15,496 0.03%Home Depot 1,403 257,493 0.54%Honeywell International 893 128,262 0.27%Hormel Foods 357 15,108 0.03%HP 1,970 43,399 0.09%Humana 172 53,146 0.11%Huntington Bancshares 1,382 18,298 0.04%Huntington Ingalls Industries 55 11,355 0.02%IAC/InterActiveCorp 92 19,438 0.04%IDEX 98 13,510 0.03%IDEXX Laboratories 92 19,576 0.04%Illinois Tool Works 378 51,903 0.11%Illumina 178 49,803 0.10%Incyte 228 18,375 0.04%Ingersoll-Rand 307 30,712 0.06%Ingredion 78 7,722 0.02%Intel 5,642 265,851 0.56%Intercontinental Exchange 693 53,195 0.11%
76

Fidelity MSCI World Index Fund SCHEDULE OF INVESTMENTS (CONTINUED) AS AT 31 JANUARY 2019
Number of
Shares Fair Value
USDFund % of
NAV*
Equities 96.20% (continued)
United States 57.61% (continued)
International Business Machines 1,114 149,744 0.31%International Flavors & Fragrances 108 15,312 0.03%International Paper 492 23,336 0.05%Interpublic Group 520 11,830 0.02%Intuit 277 59,782 0.12%Intuitive Surgical 138 72,262 0.15%Invesco 528 9,620 0.02%IPG Photonics 42 5,586 0.01%IQVIA Holdings 201 25,931 0.05%Jack Henry & Associates 101 13,489 0.03%Jacobs Engineering Group 170 11,016 0.02%JB Hunt Transport Services 111 11,881 0.02%Jefferies Financial Group 325 6,763 0.01%JM Smucker 149 15,627 0.03%Johnson & Johnson 3,288 437,566 0.91%Johnson Controls International 1,162 39,241 0.08%Jones Lang LaSalle 48 6,884 0.01%JPMorgan Chase 4,108 425,177 0.89%Juniper Networks 439 11,388 0.02%Kansas City Southern 127 13,430 0.03%Kellogg 325 19,178 0.04%KeyCorp 1,117 18,397 0.04%Keysight Technologies 246 18,209 0.04%Kimberly-Clark 435 48,450 0.10%Kinder Morgan 2,477 44,834 0.09%KLA-Tencor 201 21,421 0.04%Knight-Swift Transportation Holdings 188 5,969 0.01%Kohl's 214 14,700 0.03%Kraft Heinz 731 35,132 0.07%Kroger 998 28,273 0.06%L Brands 266 7,405 0.02%L3 Technologies 94 18,507 0.04%Laboratory of America Holdings 129 17,976 0.04%Lam Research 198 33,577 0.07%Lamb Weston Holdings 183 13,231 0.03%Las Vegas Sands 495 28,888 0.06%Lear 83 12,776 0.03%Leggett & Platt 119 4,874 0.01%Leidos Holdings 194 11,252 0.02%Lennar 373 17,688 0.04%Lennox International 38 8,713 0.02%Liberty Broadband 139 11,818 0.02%Liberty Media-Liberty Formula One 215 6,745 0.01%Liberty Media-Liberty SiriusXM (Class A) 184 7,320 0.02%Liberty Media-Liberty SiriusXM (Class C) 153 6,114 0.01%Lincoln National 275 16,085 0.03%Live Nation Entertainment 188 10,060 0.02%LKQ 420 11,012 0.02%Lockheed Martin 312 90,383 0.19%Loews 337 16,142 0.03%Lowe's 992 95,391 0.20%LyondellBasell Industries 414 36,006 0.08%M&T Bank 169 27,807 0.06%Macy's 392 10,310 0.02%ManpowerGroup 87 6,876 0.01%Marathon Oil 987 15,585 0.03%Marathon Petroleum 834 55,261 0.12%Markel 18 18,963 0.04%Marriott International 370 42,376 0.09%Marsh & McLennan 611 53,884 0.11%
77

Fidelity MSCI World Index Fund SCHEDULE OF INVESTMENTS (CONTINUED) AS AT 31 JANUARY 2019
Number of
Shares Fair Value
USDFund % of
NAV*
Equities 96.20% (continued)
United States 57.61% (continued)
Martin Marietta Materials 81 14,311 0.03%Marvell Technology Group 816 15,120 0.03%Masco 398 12,899 0.03%Mastercard 1,132 238,999 0.50%Mattel 363 4,298 0.01%Maxim Integrated Products 360 19,537 0.04%McCormick 148 18,299 0.04%McDonald's 946 169,126 0.35%McKesson 251 32,191 0.07%Merck 3,249 241,823 0.51%MetLife 1,022 46,675 0.10%Mettler-Toledo International 32 20,421 0.04%MGM Resorts International 647 19,048 0.04%Microchip Technology 295 23,709 0.05%Micron Technology 1,450 55,419 0.12%Microsoft 8,917 931,201 1.96%Middleby 72 8,469 0.02%Mohawk Industries 81 10,432 0.02%Molson Coors Brewing 240 15,986 0.03%Mondelez International 1,764 81,603 0.17%Monster Beverage 524 29,994 0.06%Moody's 216 34,238 0.07%Morgan Stanley 1,571 66,453 0.14%Mosaic 478 15,430 0.03%Motorola Solutions 203 23,733 0.05%MSCI 112 19,070 0.04%Mylan 652 19,527 0.04%Nasdaq 130 11,445 0.02%National Oilwell Varco 502 14,799 0.03%Nektar Therapeutics 227 9,611 0.02%NetApp 299 19,067 0.04%Netflix 532 180,614 0.38%Newell Brands 598 12,684 0.03%Newmont Mining 673 22,956 0.05%News 504 6,466 0.01%NextEra Energy 572 102,377 0.21%Nielsen Holdings 467 11,993 0.03%Nike 1,561 127,815 0.27%NiSource 438 11,949 0.02%Noble Energy 564 12,600 0.03%Nordstrom 124 5,755 0.01%Norfolk Southern 332 55,690 0.12%Northern Trust 266 23,530 0.05%Northrop Grumman 201 55,386 0.12%Norwegian Cruise Line Holdings 297 15,275 0.03%NRG Energy 380 15,546 0.03%Nucor 373 22,843 0.05%NVIDIA 707 101,631 0.21%NVR 4 10,640 0.02%Occidental Petroleum 925 61,772 0.13%OGE Energy 252 10,319 0.02%Old Dominion Freight Line 78 10,603 0.02%Omnicom Group 281 21,884 0.05%ON Semiconductor 547 10,962 0.02%ONEOK 514 33,004 0.07%Oracle 3,637 182,687 0.38%O'Reilly Automotive 100 34,466 0.07%Owensrning 114 5,972 0.01%PACCAR 390 25,553 0.05%Packaging of America 123 11,601 0.02%
78

Fidelity MSCI World Index Fund SCHEDULE OF INVESTMENTS (CONTINUED) AS AT 31 JANUARY 2019
Number of
Shares Fair Value
USDFund % of
NAV*
Equities 96.20% (continued)
United States 57.61% (continued)
Palo Alto Networks 116 24,919 0.05%Parker-Hannifin 168 27,688 0.06%Parsley Energy 251 4,664 0.01%Paychex 399 28,249 0.06%PayPal Holdings 1,375 122,045 0.26%People's United Financial 445 7,289 0.02%PepsiCo 1,724 194,243 0.41%Pfizer 7,173 304,494 0.64%Philip Morris International 1,857 142,469 0.30%Phillips 66 532 50,758 0.11%Pinnacle West Capital 143 12,601 0.03%Pioneer Natural Resources 213 30,314 0.06%Plains GP Holdings 106 2,421 0.01%PNC Financial Services Group 560 68,695 0.14%Polaris Industries 63 5,284 0.01%PPG Industries 303 31,948 0.07%PPL 877 27,468 0.06%Principal Financial Group 359 17,975 0.04%Procter & Gamble 3,048 294,041 0.61%Progressive 680 45,757 0.10%Prudential Financial 500 46,070 0.10%PTC 141 11,955 0.02%Public Service Enterprise Group 633 34,530 0.07%PulteGroup 348 9,678 0.02%PVH 99 10,802 0.02%Qorvo 168 10,980 0.02%Qualcomm 1,710 84,679 0.18%Quest Diagnostics 180 15,723 0.03%Qurate Retail 558 12,137 0.03%Ralph Lauren 55 6,388 0.01%Raymond James Financial 149 11,995 0.03%Raytheon 344 56,677 0.12%Red Hat 221 39,303 0.08%Regeneron Pharmaceuticals 96 41,210 0.09%Regions Financial 1,379 20,919 0.04%Reinsurance Group of America 81 11,700 0.02%Republic Services 278 21,325 0.04%Resideo Technologies 10 219 0.00%ResMed 181 17,226 0.04%Robert Half International 155 9,987 0.02%Rockwell Automation 155 26,276 0.05%Rollins 193 7,187 0.02%Roper Technologies 129 36,541 0.08%Ross Stores 471 43,389 0.09%Royal Caribbean Cruises 193 23,170 0.05%S&P Global 302 57,878 0.12%Sabre 301 6,917 0.01%Salesforce.com 871 132,366 0.28%Schlumberger 1,667 73,698 0.15%Seagate Technology 356 15,764 0.03%Sealed Air 210 8,295 0.02%Seattle Genetics 141 10,777 0.02%SEI Investments 182 8,652 0.02%Sempra Energy 342 40,007 0.08%Sensata Technologies Holding 217 10,308 0.02%ServiceNow 222 48,844 0.10%Sherwin-Williams 100 42,152 0.09%Signature Bank 59 7,511 0.02%Sirius XM Holdings 1,992 11,613 0.02%Skyworks Solutions 235 17,164 0.04%
79

Fidelity MSCI World Index Fund SCHEDULE OF INVESTMENTS (CONTINUED) AS AT 31 JANUARY 2019
Number of
Shares Fair Value
USDFund % of
NAV*
Equities 96.20% (continued)
United States 57.61% (continued)
Snap-on 76 12,615 0.03%Southern 1,228 59,681 0.12%Southwest Airlines 179 10,160 0.02%Spirit AeroSystems Holdings 137 11,426 0.02%Splunk 173 21,597 0.05%Sprint 815 5,086 0.01%Square 378 26,970 0.06%SS&C Technologies Holdings 274 14,108 0.03%Stanley Black & Decker 165 20,863 0.04%Starbucks 1,638 111,613 0.23%State Street 476 33,748 0.07%Steel Dynamics 270 9,879 0.02%Stryker 407 72,271 0.15%SunTrust Banks 574 34,107 0.07%SVB Financial Group 70 16,337 0.03%Symantec 779 16,375 0.03%Synchrony Financial 888 26,676 0.06%Synopsys 189 17,643 0.04%Sysco 617 39,395 0.08%T Rowe Price Group 304 28,412 0.06%Take-Two Interactive Software 133 14,038 0.03%Tapestry 388 15,019 0.03%Targa Resources 305 13,118 0.03%Target 623 45,479 0.10%TD Ameritrade Holding 353 19,750 0.04%Teleflex 58 15,863 0.03%Tesla 156 47,895 0.10%Texas Instruments 1,180 118,802 0.25%Textron 315 16,767 0.04%Thermo Fisher Scientific 487 119,641 0.25%Tiffany 147 13,043 0.03%TJX 1,546 76,883 0.16%T-Mobile US 421 29,310 0.06%Torchmark 137 11,475 0.02%Total System Services 206 18,460 0.04%Tractor Supply 161 13,749 0.03%TransDigm Group 59 23,069 0.05%TransUnion 195 11,860 0.02%Travelers 319 40,047 0.08%Trimble 334 12,578 0.03%TripAdvisor 135 7,746 0.02%Twenty-First Century Fox (Class A) 1,017 50,148 0.10%Twenty-First Century Fox (Class B) 770 37,776 0.08%Twitter 853 28,627 0.06%Tyson Foods 372 23,034 0.05%UGI 213 12,147 0.03%Ulta Beauty 71 20,726 0.04%Under Armour (Class A) 230 4,770 0.01%Under Armour (Class C) 245 4,640 0.01%Union Pacific 899 143,004 0.30%United Continental Holdings 85 7,418 0.02%United Parcel Service 839 88,431 0.18%United Rentals 105 13,152 0.03%United Technologies 996 117,598 0.25%United Therapeutics 50 5,767 0.01%UnitedHealth Group 1,176 317,755 0.66%Universal Health Services 109 14,446 0.03%Unum Group 282 9,802 0.02%US Bancorp 1,876 95,976 0.20%Vail Resorts 51 9,601 0.02%
80

Fidelity MSCI World Index Fund SCHEDULE OF INVESTMENTS (CONTINUED) AS AT 31 JANUARY 2019
Number of
Shares Fair Value
USDFund % of
NAV*
Equities 96.20% (continued)
United States 57.61% (continued)
Valero Energy 534 46,896 0.10%Varian Medical Systems 116 15,315 0.03%Veeva Systems 150 16,359 0.03%VeriSign 137 23,190 0.05%Verisk Analytics 193 22,660 0.05%Verizon Communications 5,059 278,549 0.58%Vertex Pharmaceuticals 310 59,182 0.12%VF 422 35,520 0.07%Viacom 467 13,739 0.03%Visa 2,165 292,297 0.61%Vistra Energy 427 10,722 0.02%VMware 93 14,050 0.03%Voya Financial 108 5,014 0.01%Vulcan Materials 157 15,959 0.03%WABCO Holdings 58 6,625 0.01%Wabtec 110 7,608 0.02%Walgreens Boots Alliance 1,022 73,850 0.15%Walmart 1,805 172,973 0.36%Walt Disney 1,806 201,405 0.42%Waste Connections 335 27,993 0.06%Waste Management 502 48,026 0.10%Waters 97 22,428 0.05%Wayfair 74 8,100 0.02%WEC Energy Group 398 29,066 0.06%WellCare Health Plans 63 17,418 0.04%Wells Fargo 5,594 273,603 0.57%Western Digital 367 16,511 0.03%Western Union 568 10,366 0.02%Westlake Chemical 23 1,700 0.00%Westrock 328 13,353 0.03%Whirlpool 84 11,173 0.02%Williams 1,513 40,745 0.09%Workday 183 33,220 0.07%Worldpay 378 31,555 0.07%WR Berkley 122 9,381 0.02%WW Grainger 61 18,019 0.04%Wynn Resorts 124 15,253 0.03%Xcel Energy 635 33,249 0.07%Xerox 241 6,799 0.01%Xilinx 316 35,373 0.07%XPO Logistics 164 9,968 0.02%Xylem 228 16,247 0.03%Yum! Brands 397 37,310 0.08%Zayo Group Holdings 254 6,972 0.01%Zillow Group 160 5,614 0.01%Zimmer Biomet Holdings 257 28,157 0.06%Zions Bancorp 245 11,660 0.02%Zoetis 603 51,954 0.11%
Total United States 27,571,361 57.61%
Total Equities 46,041,016 96.20%
Transferable Securities 2.49%
Australia 0.16%
Dexus REIT 1,049 8,781 0.02%Goodman Group REIT 2,169 18,441 0.04%GPT Group REIT 1,882 7,959 0.02%Mirvac Group REIT 3,881 6,792 0.01%Scentre Group REIT 7,086 20,513 0.05%
81
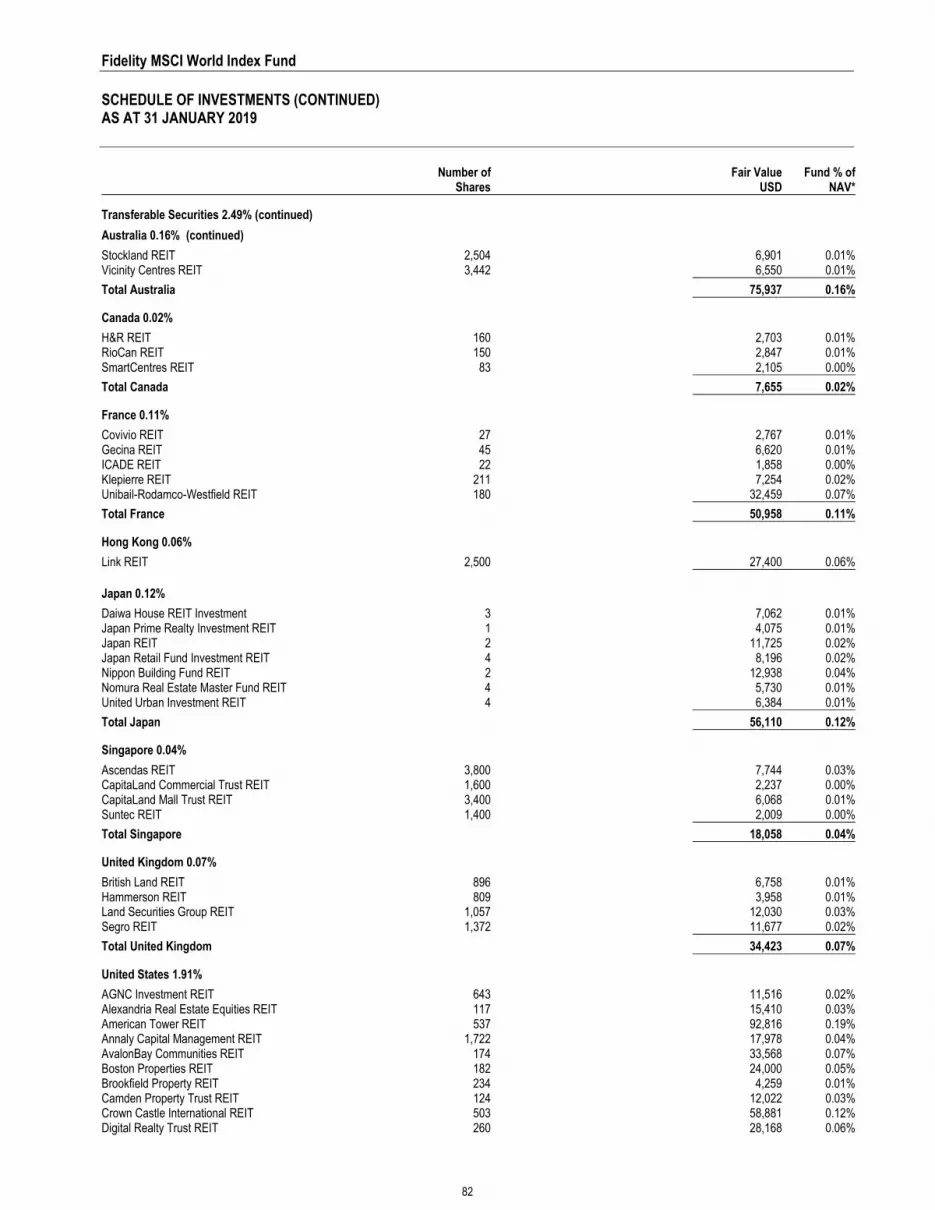
Fidelity MSCI World Index Fund SCHEDULE OF INVESTMENTS (CONTINUED) AS AT 31 JANUARY 2019
Number of
Shares Fair Value
USDFund % of
NAV*
Transferable Securities 2.49% (continued)
Australia 0.16% (continued)
Stockland REIT 2,504 6,901 0.01%Vicinity Centres REIT 3,442 6,550 0.01%
Total Australia 75,937 0.16%
Canada 0.02%
H&R REIT 160 2,703 0.01%RioCan REIT 150 2,847 0.01%SmartCentres REIT 83 2,105 0.00%
Total Canada 7,655 0.02%
France 0.11%
Covivio REIT 27 2,767 0.01%Gecina REIT 45 6,620 0.01%ICADE REIT 22 1,858 0.00%Klepierre REIT 211 7,254 0.02%Unibail-Rodamco-Westfield REIT 180 32,459 0.07%
Total France 50,958 0.11%
Hong Kong 0.06%
Link REIT 2,500 27,400 0.06%
Japan 0.12%
Daiwa House REIT Investment 3 7,062 0.01%Japan Prime Realty Investment REIT 1 4,075 0.01%Japan REIT 2 11,725 0.02%Japan Retail Fund Investment REIT 4 8,196 0.02%Nippon Building Fund REIT 2 12,938 0.04%Nomura Real Estate Master Fund REIT 4 5,730 0.01%United Urban Investment REIT 4 6,384 0.01%
Total Japan 56,110 0.12%
Singapore 0.04%
Ascendas REIT 3,800 7,744 0.03%CapitaLand Commercial Trust REIT 1,600 2,237 0.00%CapitaLand Mall Trust REIT 3,400 6,068 0.01%Suntec REIT 1,400 2,009 0.00%
Total Singapore 18,058 0.04%
United Kingdom 0.07%
British Land REIT 896 6,758 0.01%Hammerson REIT 809 3,958 0.01%Land Securities Group REIT 1,057 12,030 0.03%Segro REIT 1,372 11,677 0.02%
Total United Kingdom 34,423 0.07%
United States 1.91%
AGNC Investment REIT 643 11,516 0.02%Alexandria Real Estate Equities REIT 117 15,410 0.03%American Tower REIT 537 92,816 0.19%Annaly Capital Management REIT 1,722 17,978 0.04%AvalonBay Communities REIT 174 33,568 0.07%Boston Properties REIT 182 24,000 0.05%Brookfield Property REIT 234 4,259 0.01%Camden Property Trust REIT 124 12,022 0.03%Crown Castle International REIT 503 58,881 0.12%Digital Realty Trust REIT 260 28,168 0.06%
82

Fidelity MSCI World Index Fund SCHEDULE OF INVESTMENTS (CONTINUED) AS AT 31 JANUARY 2019
Number of
Shares Fair Value
USDFund % of
NAV*
Transferable Securities 2.49% (continued)
United States 1.91% (continued)
Duke Realty REIT 469 13,714 0.03%Equinix REIT 100 39,400 0.08%Equity Residential REIT 463 33,595 0.07%Essex Property Trust REIT 78 21,154 0.04%Extra Space Storage REIT 162 15,975 0.03%Federal Realty Investment Trust REIT 100 13,257 0.03%HCP REIT 593 18,703 0.04%Host Hotels & Resorts REIT 834 15,062 0.03%Invitation Homes REIT 323 7,264 0.02%Iron Mountain REIT 354 13,169 0.03%Kimco Realty REIT 436 7,416 0.02%Liberty Property Trust REIT 165 7,778 0.02%Macerich REIT 116 5,355 0.01%Mid-America Apartment Communities REIT 150 15,192 0.03%National Retail Properties REIT 207 10,911 0.02%Prologis REIT 764 52,838 0.11%Public Storage REIT 190 40,379 0.08%Realty Income REIT 363 24,934 0.05%Regency Centers REIT 201 13,065 0.03%SBA Communications REIT 146 26,649 0.06%Simon Property Group REIT 374 68,114 0.14%SL Green Realty REIT 115 10,629 0.02%UDR REIT 349 15,269 0.03%Ventas REIT 447 28,827 0.06%VEREIT REIT 1,320 10,666 0.02%Vornado Realty Trust REIT 230 16,079 0.03%Welltower REIT 465 36,033 0.08%Weyerhaeuser REIT 931 24,429 0.05%WP Carey REIT 208 15,577 0.03%
Total United States 920,051 1.91%
Total Transferable Securities 1,190,592 2.49%
Warrants 0.00%
Canada 0.00%
Australis Capital (expires 31/12/2019) 10 7 0.00%
Total Warrants 7 0.00%
Financial Assets at Fair Value Through Profit or Loss 47,231,615 98.69%
Financial Derivative Instruments 0.04%
Open Forward Foreign Exchange Contracts held for Portfolio Hedging Purposes (0.00%)
Currency Buy Amount Currency (Sell) Amount Counterparty Settlement Date
Unrealised Gain/(Loss)
USDFund % of
NAV*USD 398 SEK (3,582) Brown Brothers Harriman 19/02/2019 2 0.00%AUD 5 USD (3) Brown Brothers Harriman 19/02/2019 0 0.00%USD 14 AUD (20) Brown Brothers Harriman 19/02/2019 0 0.00%USD 3 AUD (4) Brown Brothers Harriman 19/02/2019 0 0.00%USD 3 AUD (4) Brown Brothers Harriman 19/02/2019 0 0.00%USD 15 AUD (20) Brown Brothers Harriman 19/02/2019 0 0.00%USD 5 AUD (7) Brown Brothers Harriman 19/02/2019 0 0.00%CAD 6 USD (4) Brown Brothers Harriman 19/02/2019 0 0.00%USD 5 CAD (7) Brown Brothers Harriman 19/02/2019 0 0.00%USD 32 CAD (42) Brown Brothers Harriman 19/02/2019 0 0.00%USD 15 CAD (20) Brown Brothers Harriman 19/02/2019 0 0.00%USD 24 CAD (32) Brown Brothers Harriman 19/02/2019 0 0.00%USD 5 CAD (6) Brown Brothers Harriman 19/02/2019 0 0.00%
83

Fidelity MSCI World Index Fund SCHEDULE OF INVESTMENTS (CONTINUED) AS AT 31 JANUARY 2019
Financial Derivative Instruments 0.04% (continued) Open Forward Foreign Exchange Contracts held for Portfolio Hedging Purposes (0.00%) (continued)
Currency Buy Amount Currency (Sell) Amount Counterparty Settlement Date
Unrealised Gain/(Loss)
USDFund % of
NAV*USD 3 CAD (4) Brown Brothers Harriman 19/02/2019 0 0.00%USD 4 CAD (5) Brown Brothers Harriman 19/02/2019 0 0.00%USD 5 CAD (7) Brown Brothers Harriman 19/02/2019 0 0.00%USD 5 CAD (7) Brown Brothers Harriman 19/02/2019 0 0.00%USD 5 CAD (7) Brown Brothers Harriman 19/02/2019 0 0.00%USD 313 CHF (311) Brown Brothers Harriman 19/02/2019 0 0.00%USD 270 CHF (268) Brown Brothers Harriman 19/02/2019 0 0.00%CHF 19 USD (20) Brown Brothers Harriman 19/02/2019 0 0.00%USD 5 CHF (5) Brown Brothers Harriman 19/02/2019 0 0.00%USD 28 CHF (28) Brown Brothers Harriman 19/02/2019 0 0.00%CHF 3 USD (3) Brown Brothers Harriman 19/02/2019 0 0.00%CHF 4 USD (4) Brown Brothers Harriman 19/02/2019 0 0.00%USD 28 CHF (28) Brown Brothers Harriman 19/02/2019 0 0.00%USD 4 CHF (4) Brown Brothers Harriman 19/02/2019 0 0.00%USD 5 CHF (5) Brown Brothers Harriman 19/02/2019 0 0.00%USD 5 CHF (5) Brown Brothers Harriman 19/02/2019 0 0.00%DKK 7 USD (1) Brown Brothers Harriman 19/02/2019 0 0.00%DKK 5 USD (1) Brown Brothers Harriman 19/02/2019 0 0.00%USD 1 DKK (4) Brown Brothers Harriman 19/02/2019 0 0.00%USD 1 DKK (8) Brown Brothers Harriman 19/02/2019 0 0.00%USD 54 DKK (355) Brown Brothers Harriman 19/02/2019 0 0.00%USD 1 DKK (4) Brown Brothers Harriman 19/02/2019 0 0.00%DKK 4 USD (1) Brown Brothers Harriman 19/02/2019 0 0.00%DKK 23 USD (4) Brown Brothers Harriman 19/02/2019 0 0.00%USD 5 DKK (31) Brown Brothers Harriman 19/02/2019 0 0.00%USD 1 DKK (6) Brown Brothers Harriman 19/02/2019 0 0.00%DKK 4 USD (1) Brown Brothers Harriman 19/02/2019 0 0.00%USD 63 DKK (411) Brown Brothers Harriman 19/02/2019 0 0.00%USD 3 DKK (19) Brown Brothers Harriman 19/02/2019 0 0.00%USD 1 DKK (6) Brown Brothers Harriman 19/02/2019 0 0.00%EUR 10 USD (11) Brown Brothers Harriman 19/02/2019 0 0.00%USD 12 EUR (11) Brown Brothers Harriman 19/02/2019 0 0.00%USD 17 EUR (15) Brown Brothers Harriman 19/02/2019 0 0.00%USD 16 EUR (14) Brown Brothers Harriman 19/02/2019 0 0.00%USD 18 EUR (16) Brown Brothers Harriman 19/02/2019 0 0.00%USD 50 EUR (44) Brown Brothers Harriman 19/02/2019 0 0.00%USD 18 EUR (16) Brown Brothers Harriman 19/02/2019 0 0.00%USD 11 GBP (8) Brown Brothers Harriman 19/02/2019 0 0.00%GBP 6 USD (8) Brown Brothers Harriman 19/02/2019 0 0.00%USD 15 GBP (12) Brown Brothers Harriman 19/02/2019 0 0.00%GBP 34 USD (44) Brown Brothers Harriman 19/02/2019 0 0.00%GBP 6 USD (8) Brown Brothers Harriman 19/02/2019 0 0.00%USD 12 GBP (9) Brown Brothers Harriman 19/02/2019 0 0.00%USD 8 GBP (6) Brown Brothers Harriman 19/02/2019 0 0.00%USD 60 GBP (46) Brown Brothers Harriman 19/02/2019 0 0.00%GBP 5 USD (7) Brown Brothers Harriman 19/02/2019 0 0.00%USD 34 GBP (26) Brown Brothers Harriman 19/02/2019 0 0.00%GBP 25 USD (34) Brown Brothers Harriman 19/02/2019 0 0.00%USD 13 GBP (10) Brown Brothers Harriman 19/02/2019 0 0.00%USD 2 HKD (15) Brown Brothers Harriman 19/02/2019 0 0.00%USD 8 HKD (60) Brown Brothers Harriman 19/02/2019 0 0.00%USD 532 HKD (4,171) Brown Brothers Harriman 19/02/2019 0 0.00%USD 9 HKD (69) Brown Brothers Harriman 19/02/2019 0 0.00%USD 1 HKD (12) Brown Brothers Harriman 19/02/2019 0 0.00%USD 1 HKD (9) Brown Brothers Harriman 19/02/2019 0 0.00%USD 1 HKD (11) Brown Brothers Harriman 19/02/2019 0 0.00%USD 129 HKD (1,014) Brown Brothers Harriman 19/02/2019 0 0.00%USD 3 HKD (20) Brown Brothers Harriman 19/02/2019 0 0.00%USD 112 HKD (876) Brown Brothers Harriman 19/02/2019 0 0.00%USD 10 ILS (36) Brown Brothers Harriman 19/02/2019 0 0.00%USD 0 ILS 0 Brown Brothers Harriman 19/02/2019 0 0.00%
84

Fidelity MSCI World Index Fund SCHEDULE OF INVESTMENTS (CONTINUED) AS AT 31 JANUARY 2019
Financial Derivative Instruments 0.04% (continued) Open Forward Foreign Exchange Contracts held for Portfolio Hedging Purposes (0.00%) (continued)
Currency Buy Amount Currency (Sell) Amount Counterparty Settlement Date
Unrealised Gain/(Loss)
USDFund % of
NAV*USD 1 ILS (2) Brown Brothers Harriman 19/02/2019 0 0.00%USD 0 ILS (1) Brown Brothers Harriman 19/02/2019 0 0.00%USD 0 ILS 0 Brown Brothers Harriman 19/02/2019 0 0.00%USD 1 ILS (2) Brown Brothers Harriman 19/02/2019 0 0.00%USD 8 ILS (31) Brown Brothers Harriman 19/02/2019 0 0.00%USD 0 ILS (1) Brown Brothers Harriman 19/02/2019 0 0.00%USD 1 ILS (2) Brown Brothers Harriman 19/02/2019 0 0.00%USD 0 ILS 0 Brown Brothers Harriman 19/02/2019 0 0.00%USD 10 JPY (1,078) Brown Brothers Harriman 19/02/2019 0 0.00%USD 41 JPY (4,483) Brown Brothers Harriman 19/02/2019 0 0.00%USD 21 JPY (2,309) Brown Brothers Harriman 19/02/2019 0 0.00%JPY 1,438 USD (13) Brown Brothers Harriman 19/02/2019 0 0.00%USD 45 JPY (4,860) Brown Brothers Harriman 19/02/2019 0 0.00%JPY 4,052 USD (37) Brown Brothers Harriman 19/02/2019 0 0.00%USD 12 JPY (1,283) Brown Brothers Harriman 19/02/2019 0 0.00%NOK 14 USD (2) Brown Brothers Harriman 19/02/2019 0 0.00%NOK 3 USD 0 Brown Brothers Harriman 19/02/2019 0 0.00%USD 2 NOK (16) Brown Brothers Harriman 19/02/2019 0 0.00%USD 1 NOK (12) Brown Brothers Harriman 19/02/2019 0 0.00%NOK 16 USD (2) Brown Brothers Harriman 19/02/2019 0 0.00%USD 23 NOK (195) Brown Brothers Harriman 19/02/2019 0 0.00%NOK 3 USD 0 Brown Brothers Harriman 19/02/2019 0 0.00%NOK 3 USD 0 Brown Brothers Harriman 19/02/2019 0 0.00%USD 0 NOK (3) Brown Brothers Harriman 19/02/2019 0 0.00%USD 0 NOK (3) Brown Brothers Harriman 19/02/2019 0 0.00%NOK 3 USD 0 Brown Brothers Harriman 19/02/2019 0 0.00%USD 0 NOK (3) Brown Brothers Harriman 19/02/2019 0 0.00%NOK 2 USD 0 Brown Brothers Harriman 19/02/2019 0 0.00%USD 26 NOK (225) Brown Brothers Harriman 19/02/2019 0 0.00%NZD 1 USD (1) Brown Brothers Harriman 19/02/2019 0 0.00%USD 7 NZD (11) Brown Brothers Harriman 19/02/2019 0 0.00%USD 1 NZD (1) Brown Brothers Harriman 19/02/2019 0 0.00%USD 0 NZD 0 Brown Brothers Harriman 19/02/2019 0 0.00%USD 0 NZD 0 Brown Brothers Harriman 19/02/2019 0 0.00%NZD 0 USD 0 Brown Brothers Harriman 19/02/2019 0 0.00%NZD 0 USD 0 Brown Brothers Harriman 19/02/2019 0 0.00%NZD 0 USD 0 Brown Brothers Harriman 19/02/2019 0 0.00%USD 0 NZD 0 Brown Brothers Harriman 19/02/2019 0 0.00%NZD 0 USD 0 Brown Brothers Harriman 19/02/2019 0 0.00%NZD 0 USD 0 Brown Brothers Harriman 19/02/2019 0 0.00%USD 9 NZD (13) Brown Brothers Harriman 19/02/2019 0 0.00%USD 7 SEK (66) Brown Brothers Harriman 19/02/2019 0 0.00%USD 6 SEK (51) Brown Brothers Harriman 19/02/2019 0 0.00%SEK 52 USD (6) Brown Brothers Harriman 19/02/2019 0 0.00%USD 1 SEK (8) Brown Brothers Harriman 19/02/2019 0 0.00%USD 97 SEK (876) Brown Brothers Harriman 19/02/2019 0 0.00%USD 1 SEK (11) Brown Brothers Harriman 19/02/2019 0 0.00%SEK 10 USD (1) Brown Brothers Harriman 19/02/2019 0 0.00%USD 84 SEK (752) Brown Brothers Harriman 19/02/2019 0 0.00%USD 5 SEK (47) Brown Brothers Harriman 19/02/2019 0 0.00%USD 1 SEK (10) Brown Brothers Harriman 19/02/2019 0 0.00%USD 1 SEK (13) Brown Brothers Harriman 19/02/2019 0 0.00%USD 2 SEK (19) Brown Brothers Harriman 19/02/2019 0 0.00%USD 6 SEK (54) Brown Brothers Harriman 19/02/2019 0 0.00%USD 2 SEK (14) Brown Brothers Harriman 19/02/2019 0 0.00%SGD 4 USD (3) Brown Brothers Harriman 19/02/2019 0 0.00%USD 43 SGD (59) Brown Brothers Harriman 19/02/2019 0 0.00%USD 1 SGD (1) Brown Brothers Harriman 19/02/2019 0 0.00%USD 50 SGD (68) Brown Brothers Harriman 19/02/2019 0 0.00%USD 1 SGD (1) Brown Brothers Harriman 19/02/2019 0 0.00%USD 1 SGD (1) Brown Brothers Harriman 19/02/2019 0 0.00%
85

Fidelity MSCI World Index Fund SCHEDULE OF INVESTMENTS (CONTINUED) AS AT 31 JANUARY 2019
Financial Derivative Instruments 0.04% (continued) Open Forward Foreign Exchange Contracts held for Portfolio Hedging Purposes (0.00%) (continued)
Currency Buy Amount Currency (Sell) Amount Counterparty Settlement Date
Unrealised Gain/(Loss)
USDFund % of
NAV*USD 2 SGD (3) Brown Brothers Harriman 19/02/2019 0 0.00%USD 2 SGD (3) Brown Brothers Harriman 19/02/2019 0 0.00%SGD 1 USD (1) Brown Brothers Harriman 19/02/2019 0 0.00%USD 19,119 HKD (150,000) Brown Brothers Harriman 08/02/2019 (1) (0.00%)USD 109 NOK (928) Brown Brothers Harriman 19/02/2019 (1) (0.00%)USD 35 NZD (52) Brown Brothers Harriman 19/02/2019 (1) (0.00%)USD 1,288 CHF (1,277) Brown Brothers Harriman 19/02/2019 (1) (0.00%)USD 40 ILS (148) Brown Brothers Harriman 19/02/2019 (1) (0.00%)USD 78 EUR (68) Brown Brothers Harriman 19/02/2019 (1) (0.00%)USD 207 SGD (280) Brown Brothers Harriman 19/02/2019 (2) (0.00%)USD 258 DKK (1,690) Brown Brothers Harriman 19/02/2019 (2) (0.00%)USD 71 GBP (55) Brown Brothers Harriman 19/02/2019 (2) (0.00%)USD 777 JPY (84,761) Brown Brothers Harriman 19/02/2019 (3) (0.00%)USD 219 AUD (304) Brown Brothers Harriman 19/02/2019 (3) (0.00%)USD 310 CAD (411) Brown Brothers Harriman 19/02/2019 (3) (0.00%)USD 360 CAD (478) Brown Brothers Harriman 19/02/2019 (4) (0.00%)USD 252 AUD (351) Brown Brothers Harriman 19/02/2019 (4) (0.00%)USD 895 JPY (97,650) Brown Brothers Harriman 19/02/2019 (4) (0.00%)USD 970 EUR (849) Brown Brothers Harriman 19/02/2019 (6) (0.00%)USD 1,119 EUR (980) Brown Brothers Harriman 19/02/2019 (7) (0.00%)USD 523 GBP (403) Brown Brothers Harriman 19/02/2019 (8) (0.00%)USD 605 GBP (467) Brown Brothers Harriman 19/02/2019 (9) (0.00%)USD 1,478 CAD (1,959) Brown Brothers Harriman 19/02/2019 (14) (0.00%)USD 1,032 AUD (1,435) Brown Brothers Harriman 19/02/2019 (15) (0.00%)USD 3,699 JPY (403,656) Brown Brothers Harriman 19/02/2019 (15) (0.00%)USD 4,617 EUR (4,044) Brown Brothers Harriman 19/02/2019 (29) (0.00%)USD 2,490 GBP (1,919) Brown Brothers Harriman 19/02/2019 (38) (0.00%) Unrealised Gain on Open Forward Foreign Exchange Contracts held for Portfolio Hedging Purposes 2 0.00%Unrealised Loss on Open Forward Foreign Exchange Contracts held for Portfolio Hedging Purposes (174) (0.00%) Net Open Forward Foreign Exchange Contracts held for Portfolio Hedging Purposes (172) (0.00%)
Open Forward Foreign Exchange Contracts held for Class Hedging Purposes 0.00%
Currency Buy Amount Currency (Sell) Amount Counterparty Settlement Date
Unrealised Gain/(Loss)
USDFund % of
NAV*EUR 37,385 USD (42,684) Brown Brothers Harriman 19/02/2019 265 0.00%GBP 6,881 USD (8,927) Brown Brothers Harriman 19/02/2019 131 0.00%EUR 501 USD (572) Brown Brothers Harriman 19/02/2019 4 0.00%GBP 182 USD (235) Brown Brothers Harriman 19/02/2019 4 0.00%EUR 384 USD (439) Brown Brothers Harriman 19/02/2019 3 0.00%EUR 420 USD (480) Brown Brothers Harriman 19/02/2019 3 0.00%GBP 93 USD (119) Brown Brothers Harriman 19/02/2019 3 0.00%EUR 300 USD (343) Brown Brothers Harriman 19/02/2019 2 0.00%GBP 78 USD (101) Brown Brothers Harriman 19/02/2019 2 0.00%EUR 105 USD (120) Brown Brothers Harriman 19/02/2019 1 0.00%USD 39 CZK (866) Brown Brothers Harriman 19/02/2019 0 0.00%CZK 2,385 USD (106) Brown Brothers Harriman 19/02/2019 0 0.00%CZK 3,099 USD (138) Brown Brothers Harriman 19/02/2019 0 0.00%CZK 3,152 USD (141) Brown Brothers Harriman 19/02/2019 0 0.00%GBP 72 USD (95) Brown Brothers Harriman 19/02/2019 0 0.00%USD 115 CZK (2,586) Brown Brothers Harriman 19/02/2019 (1) (0.00%)USD 99 GBP (76) Brown Brothers Harriman 19/02/2019 (1) (0.00%)USD 474 EUR (416) Brown Brothers Harriman 19/02/2019 (4) (0.00%)CZK 231,525 USD (10,331) Brown Brothers Harriman 19/02/2019 (12) (0.00%) Unrealised Gain on Open Forward Foreign Exchange Contracts held for Class Hedging Purposes 418 0.00%Unrealised Loss on Open Forward Foreign Exchange Contracts held for Class Hedging Purposes (18) (0.00%) Net Open Forward Foreign Exchange Contracts held for Class Hedging Purposes 400 0.00%
86

Fidelity MSCI World Index Fund SCHEDULE OF INVESTMENTS (CONTINUED) AS AT 31 JANUARY 2019
Financial Derivative Instruments 0.04% (continued) Futures Contracts 0.04%
BrokerNumber of Contracts
Notional Amount
UnrealisedGain/(Loss)
EURFund % of
NAV*MSCI Eafe 15 March 2019 Morgan Stanley 4 357,470 8,150 0.02%S&P 500 E-mini 15 March 2019 Morgan Stanley 2 258,150 12,300 0.02%Net Futures Contracts 20,450 0.04%
Total Financial Derivative Instruments 20,678 0.04% Other Assets and Liabilities 607,687 1.27%
Net Assets Attributable to Holders of Redeemable Participating Shares 47,859,980 100.00%
Analysis of Assets USD
Fund % of Assets
(a) Transferable securities admitted to an official stock exchange listing 46,999,711 95.77%(b) Transferable securities dealt in on another regulated market 231,904 0.47%(c) Financial derivative instruments 20,678 0.04%(d) Other assets 1,825,651 3.72%Total Assets 49,077,944 100.00%
*The percentage of net assets disclosed above is subject to rounding.
87
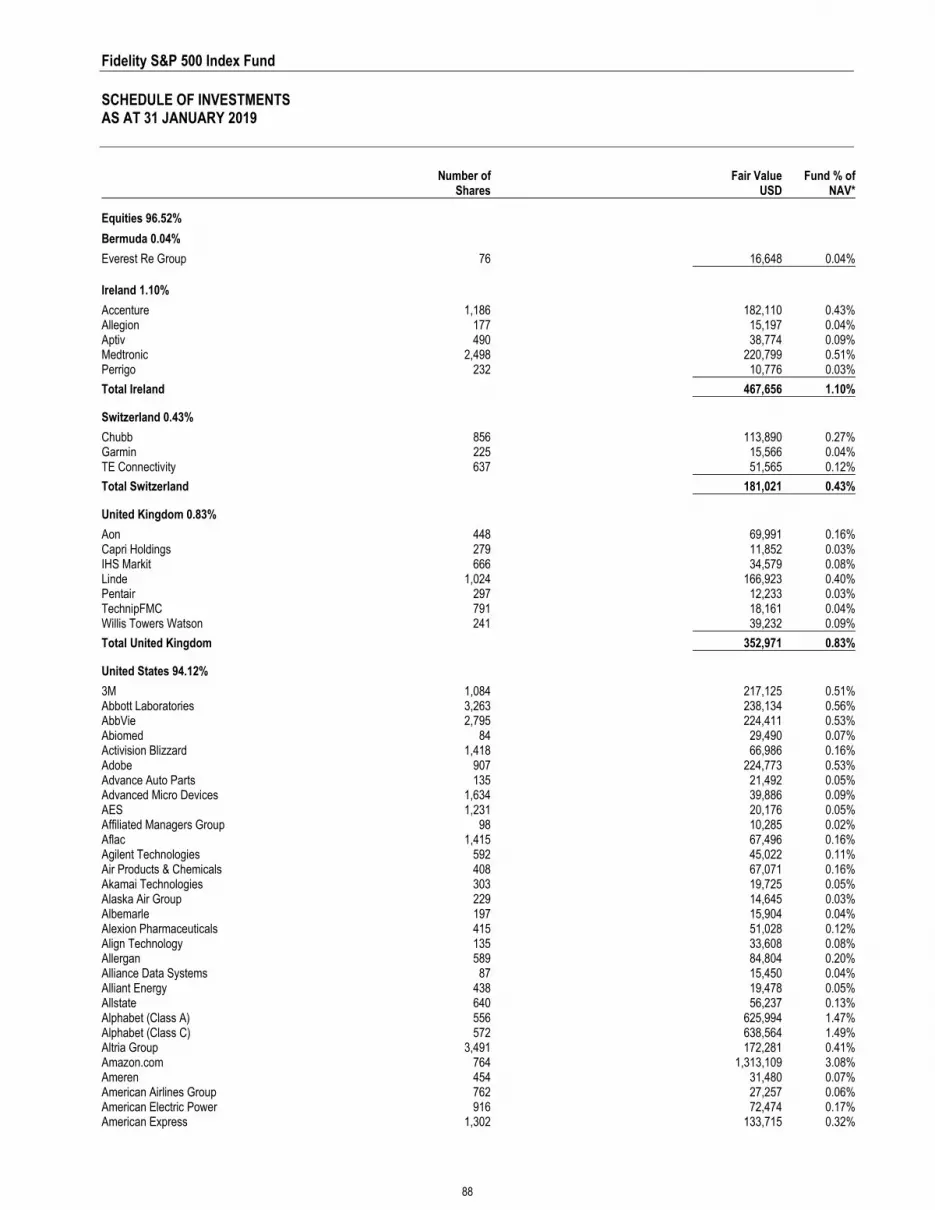
Fidelity S&P 500 Index Fund SCHEDULE OF INVESTMENTS AS AT 31 JANUARY 2019
Number of
Shares Fair Value
USDFund % of
NAV*
Equities 96.52%
Bermuda 0.04%
Everest Re Group 76 16,648 0.04%
Ireland 1.10%
Accenture 1,186 182,110 0.43%Allegion 177 15,197 0.04%Aptiv 490 38,774 0.09%Medtronic 2,498 220,799 0.51%Perrigo 232 10,776 0.03%
Total Ireland 467,656 1.10%
Switzerland 0.43%
Chubb 856 113,890 0.27%Garmin 225 15,566 0.04%TE Connectivity 637 51,565 0.12%
Total Switzerland 181,021 0.43%
United Kingdom 0.83%
Aon 448 69,991 0.16%Capri Holdings 279 11,852 0.03%IHS Markit 666 34,579 0.08%Linde 1,024 166,923 0.40%Pentair 297 12,233 0.03%TechnipFMC 791 18,161 0.04%Willis Towers Watson 241 39,232 0.09%
Total United Kingdom 352,971 0.83%
United States 94.12%
3M 1,084 217,125 0.51%Abbott Laboratories 3,263 238,134 0.56%AbbVie 2,795 224,411 0.53%Abiomed 84 29,490 0.07%Activision Blizzard 1,418 66,986 0.16%Adobe 907 224,773 0.53%Advance Auto Parts 135 21,492 0.05%Advanced Micro Devices 1,634 39,886 0.09%AES 1,231 20,176 0.05%Affiliated Managers Group 98 10,285 0.02%Aflac 1,415 67,496 0.16%Agilent Technologies 592 45,022 0.11%Air Products & Chemicals 408 67,071 0.16%Akamai Technologies 303 19,725 0.05%Alaska Air Group 229 14,645 0.03%Albemarle 197 15,904 0.04%Alexion Pharmaceuticals 415 51,028 0.12%Align Technology 135 33,608 0.08%Allergan 589 84,804 0.20%Alliance Data Systems 87 15,450 0.04%Alliant Energy 438 19,478 0.05%Allstate 640 56,237 0.13%Alphabet (Class A) 556 625,994 1.47%Alphabet (Class C) 572 638,564 1.49%Altria Group 3,491 172,281 0.41%Amazon.com 764 1,313,109 3.08%Ameren 454 31,480 0.07%American Airlines Group 762 27,257 0.06%American Electric Power 916 72,474 0.17%American Express 1,302 133,715 0.32%
88

Fidelity S&P 500 Index Fund SCHEDULE OF INVESTMENTS (CONTINUED) AS AT 31 JANUARY 2019
Number of
Shares Fair Value
USDFund % of
NAV*
Equities 96.52% (continued)
United States 94.12% (continued)
American International Group 1,644 71,070 0.17%American Water Works 336 32,145 0.08%Ameriprise Financial 259 32,789 0.08%AmerisourceBergen 291 24,261 0.06%AMETEK 431 31,420 0.07%Amgen 1,184 221,538 0.52%Amphenol 560 49,235 0.12%Anadarko Petroleum 937 44,348 0.10%Analog Devices 688 68,016 0.16%ANSYS 155 25,474 0.06%Anthem 481 145,743 0.34%AO Smith 267 12,779 0.03%Apache 705 23,138 0.05%Apple 8,382 1,395,099 3.28%Applied Materials 1,826 71,360 0.17%Archer-Daniels-Midland 1,042 46,786 0.11%Arconic 799 15,037 0.04%Arista Networks 97 20,834 0.05%Arthur J Gallagher 341 25,476 0.06%Assurant 97 9,350 0.02%AT&T 13,534 406,832 0.96%Autodesk 407 59,910 0.14%Automatic Data Processing 813 113,690 0.27%AutoZone 47 39,825 0.09%Avery Dennison 161 16,816 0.04%Baker Hughes 954 22,486 0.05%Ball 630 32,936 0.08%Bank of America 16,975 483,278 1.13%Bank of New York Mellon 1,690 88,421 0.21%Baxter International 920 66,691 0.16%BB&T 1,432 69,882 0.16%Becton Dickinson 500 124,730 0.29%Berkshire Hathaway 3,617 743,437 1.74%Best Buy 435 25,769 0.06%Biogen 376 125,501 0.30%BlackRock 226 93,808 0.22%Boeing 982 378,679 0.89%Booking Holdings 86 157,622 0.37%BorgWarner 387 15,828 0.04%Boston Scientific 2,571 98,084 0.23%Brighthouse Financial 220 8,215 0.02%Bristol-Myers Squibb 3,033 149,739 0.35%Broadcom 769 206,284 0.49%Broadridge Financial Solutions 217 21,880 0.05%Brown-Forman 309 14,600 0.03%Cabot Oil & Gas 801 19,985 0.05%Cadence Design Systems 524 25,168 0.06%Campbell Soup 358 12,684 0.03%Capital One Financial 880 70,919 0.17%Cardinal Health 554 27,683 0.07%CarMax 324 19,045 0.04%Carnival 744 42,840 0.10%Caterpillar 1,098 146,210 0.34%Cboe Global Markets 208 19,400 0.05%CBRE Group 589 26,947 0.06%CBS 626 30,962 0.07%Celanese 249 23,844 0.06%Celgene 1,299 114,910 0.27%Centene 382 49,878 0.12%CenterPoint Energy 931 28,787 0.07%
89

Fidelity S&P 500 Index Fund SCHEDULE OF INVESTMENTS (CONTINUED) AS AT 31 JANUARY 2019
Number of
Shares Fair Value
USDFund % of
NAV*
Equities 96.52% (continued)
United States 94.12% (continued)
CenturyLink 1,767 27,070 0.06%Cerner 612 33,605 0.08%CF Industries Holdings 429 18,726 0.04%CH Robinson Worldwide 255 22,126 0.05%Charles Schwab 2,233 104,437 0.25%Charter Communications 328 108,584 0.26%Chevron 3,554 407,466 0.96%Chipotle Mexican Grill 46 24,362 0.06%Church & Dwight 458 29,591 0.07%Cigna 708 141,465 0.33%Cimarex Energy 178 13,411 0.03%Cincinnati Financial 281 22,795 0.05%Cintas 161 30,189 0.07%Cisco Systems 8,364 395,534 0.93%Citigroup 4,544 292,906 0.69%Citizens Financial Group 869 29,476 0.07%Citrix Systems 238 24,405 0.06%Clorox 237 35,166 0.08%CME Group 665 121,216 0.29%CMS Energy 526 27,426 0.06%Coca-Cola 7,126 342,974 0.81%Cognizant Technology Solutions 1,076 74,976 0.18%Colgate-Palmolive 1,612 104,264 0.25%Comcast 8,444 308,797 0.73%Comerica 300 23,622 0.06%Conagra Brands 902 19,519 0.05%Concho Resources 372 44,580 0.11%ConocoPhillips 2,139 144,789 0.34%Consolidated Edison 579 44,959 0.11%Constellation Brands 309 53,661 0.13%Cooper 91 25,367 0.06%Copart 383 19,391 0.05%Corning 1,487 49,458 0.12%Costco Wholesale 815 174,923 0.41%Coty 837 6,495 0.02%CSX 1,491 97,959 0.23%Cummins 277 40,749 0.10%CVS Health 2,403 157,517 0.37%Danaher 1,146 127,114 0.30%Darden Restaurants 231 24,239 0.06%DaVita 234 13,134 0.03%Deere 598 98,072 0.23%Delta Air Lines 1,159 57,289 0.14%Dentsply Sirona 414 17,367 0.04%Devon Energy 870 23,186 0.05%Diamondback Energy 287 29,595 0.07%Discover Financial Services 624 42,114 0.10%Discovery (Class A) 281 7,975 0.02%Discovery (Class C) 680 18,122 0.04%DISH Network 426 13,065 0.03%Dollar General 488 56,330 0.13%Dollar Tree 442 42,799 0.10%Dominion Energy 1,420 99,741 0.24%Dover 272 23,890 0.06%DowDuPont 4,269 229,715 0.54%DR Horton 636 24,454 0.06%DTE Energy 338 39,800 0.09%Duke Energy 1,325 116,309 0.27%DXC Technology 520 33,342 0.08%E*TRADE Financial 472 22,024 0.05%
90

Fidelity S&P 500 Index Fund SCHEDULE OF INVESTMENTS (CONTINUED) AS AT 31 JANUARY 2019
Number of
Shares Fair Value
USDFund % of
NAV*
Equities 96.52% (continued)
United States 94.12% (continued)
Eastman Chemical 260 20,961 0.05%Eaton 805 61,381 0.14%eBay 1,682 56,599 0.13%Ecolab 475 75,131 0.18%Edison International 605 34,467 0.08%Edwards Lifesciences 388 66,123 0.16%Electronic Arts 561 51,747 0.12%Eli Lilly 1,752 209,995 0.49%Emerson Electric 1,163 76,142 0.18%Entergy 337 30,057 0.07%EOG Resources 1,078 106,938 0.25%Equifax 224 23,972 0.06%Estee Lauder 409 55,796 0.13%Evergy 490 28,087 0.07%Eversource Energy 589 40,882 0.10%Exelon 1,797 85,825 0.20%Expedia Group 220 26,235 0.06%Expeditors International of Washington 321 22,245 0.05%Exxon Mobil 7,873 576,933 1.35%F5 Networks 113 18,187 0.04%Facebook 4,467 744,603 1.74%Fastenal 533 32,225 0.08%FedEx 452 80,262 0.19%Fidelity National Information Services 608 63,554 0.15%Fifth Third Bancorp 1,218 32,667 0.08%First Republic Bank 304 29,376 0.07%FirstEnergy 903 35,398 0.08%Fiserv 740 61,368 0.14%FleetCor Technologies 165 33,299 0.08%FLIR Systems 257 12,562 0.03%Flowserve 243 10,702 0.03%Fluor 261 9,545 0.02%FMC 250 19,950 0.05%Foot Locker 213 11,905 0.03%Ford Motor 7,260 63,888 0.15%Fortinet 269 20,597 0.05%Fortive 546 40,945 0.10%Fortune Brands Home & Security 263 11,914 0.03%Franklin Resources 553 16,374 0.04%Freeport-McMoRan 2,692 31,335 0.07%Gap 397 10,100 0.02%Gartner 169 22,965 0.05%General Dynamics 517 88,495 0.21%General Electric 16,162 164,206 0.39%General Mills 1,108 49,240 0.12%General Motors 2,439 95,170 0.22%Genuine Parts 273 27,251 0.06%Gilead Sciences 2,404 168,304 0.40%Global Payments 294 33,010 0.08%Goldman Sachs Group 643 127,320 0.30%Goodyear Tire & Rubber 433 9,175 0.02%H&R Block 382 9,011 0.02%Halliburton 1,628 51,054 0.12%Hanesbrands 670 10,043 0.02%Harley-Davidson 303 11,169 0.03%Harris 219 33,546 0.08%Hartford Financial Services Group 667 31,296 0.07%Hasbro 216 19,561 0.05%HCA Healthcare 499 69,576 0.16%Helmerich & Payne 203 11,366 0.03%
91
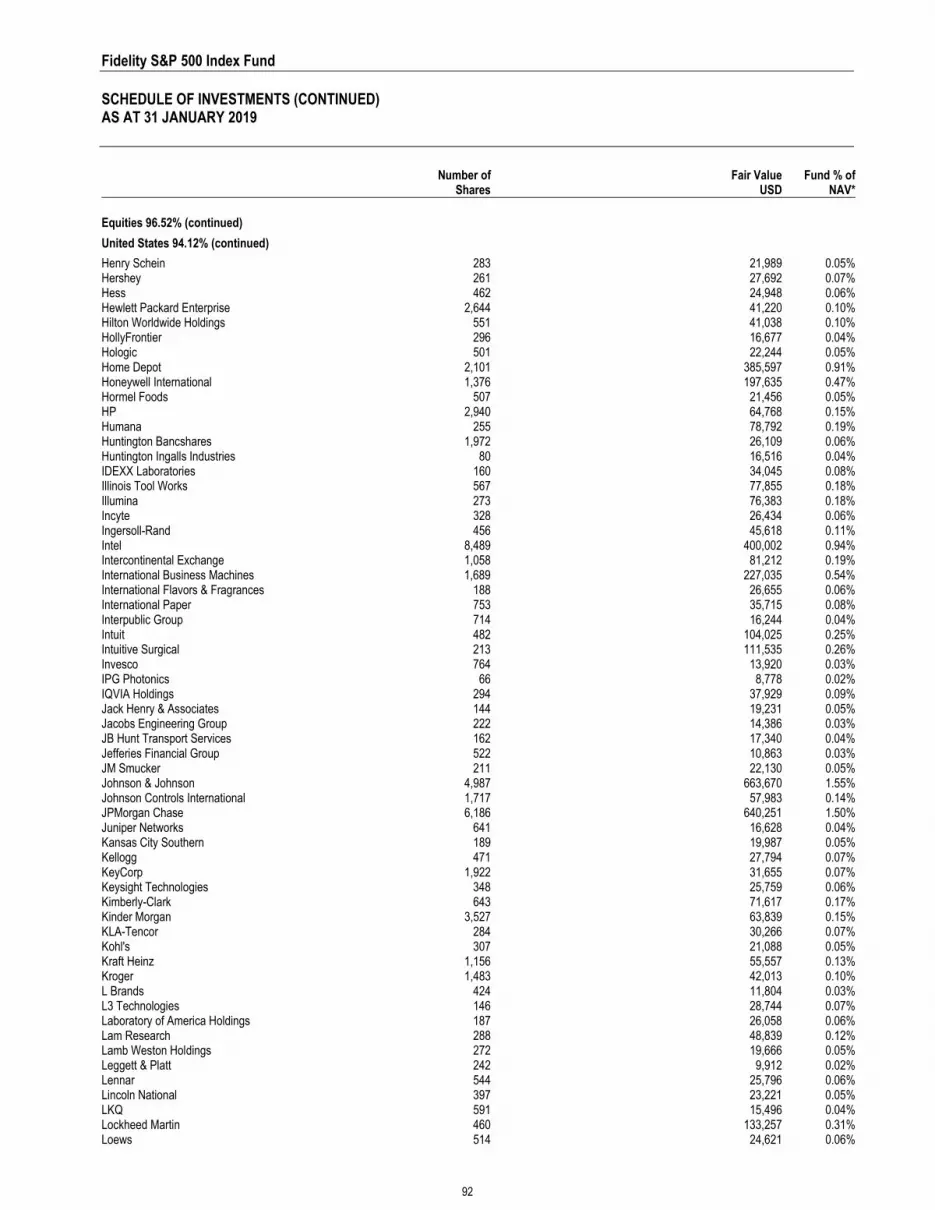
Fidelity S&P 500 Index Fund SCHEDULE OF INVESTMENTS (CONTINUED) AS AT 31 JANUARY 2019
Number of
Shares Fair Value
USDFund % of
NAV*
Equities 96.52% (continued)
United States 94.12% (continued)
Henry Schein 283 21,989 0.05%Hershey 261 27,692 0.07%Hess 462 24,948 0.06%Hewlett Packard Enterprise 2,644 41,220 0.10%Hilton Worldwide Holdings 551 41,038 0.10%HollyFrontier 296 16,677 0.04%Hologic 501 22,244 0.05%Home Depot 2,101 385,597 0.91%Honeywell International 1,376 197,635 0.47%Hormel Foods 507 21,456 0.05%HP 2,940 64,768 0.15%Humana 255 78,792 0.19%Huntington Bancshares 1,972 26,109 0.06%Huntington Ingalls Industries 80 16,516 0.04%IDEXX Laboratories 160 34,045 0.08%Illinois Tool Works 567 77,855 0.18%Illumina 273 76,383 0.18%Incyte 328 26,434 0.06%Ingersoll-Rand 456 45,618 0.11%Intel 8,489 400,002 0.94%Intercontinental Exchange 1,058 81,212 0.19%International Business Machines 1,689 227,035 0.54%International Flavors & Fragrances 188 26,655 0.06%International Paper 753 35,715 0.08%Interpublic Group 714 16,244 0.04%Intuit 482 104,025 0.25%Intuitive Surgical 213 111,535 0.26%Invesco 764 13,920 0.03%IPG Photonics 66 8,778 0.02%IQVIA Holdings 294 37,929 0.09%Jack Henry & Associates 144 19,231 0.05%Jacobs Engineering Group 222 14,386 0.03%JB Hunt Transport Services 162 17,340 0.04%Jefferies Financial Group 522 10,863 0.03%JM Smucker 211 22,130 0.05%Johnson & Johnson 4,987 663,670 1.55%Johnson Controls International 1,717 57,983 0.14%JPMorgan Chase 6,186 640,251 1.50%Juniper Networks 641 16,628 0.04%Kansas City Southern 189 19,987 0.05%Kellogg 471 27,794 0.07%KeyCorp 1,922 31,655 0.07%Keysight Technologies 348 25,759 0.06%Kimberly-Clark 643 71,617 0.17%Kinder Morgan 3,527 63,839 0.15%KLA-Tencor 284 30,266 0.07%Kohl's 307 21,088 0.05%Kraft Heinz 1,156 55,557 0.13%Kroger 1,483 42,013 0.10%L Brands 424 11,804 0.03%L3 Technologies 146 28,744 0.07%Laboratory of America Holdings 187 26,058 0.06%Lam Research 288 48,839 0.12%Lamb Weston Holdings 272 19,666 0.05%Leggett & Platt 242 9,912 0.02%Lennar 544 25,796 0.06%Lincoln National 397 23,221 0.05%LKQ 591 15,496 0.04%Lockheed Martin 460 133,257 0.31%Loews 514 24,621 0.06%
92

Fidelity S&P 500 Index Fund SCHEDULE OF INVESTMENTS (CONTINUED) AS AT 31 JANUARY 2019
Number of
Shares Fair Value
USDFund % of
NAV*
Equities 96.52% (continued)
United States 94.12% (continued)
Lowe's 1,492 143,471 0.34%LyondellBasell Industries 585 50,877 0.12%M&T Bank 261 42,945 0.10%Macy's 571 15,017 0.04%Marathon Oil 1,545 24,396 0.06%Marathon Petroleum 1,284 85,078 0.20%Marriott International 526 60,243 0.14%Marsh & McLennan 936 82,546 0.19%Martin Marietta Materials 117 20,672 0.05%Masco 568 18,409 0.04%Mastercard 1,690 356,810 0.84%Mattel 641 7,589 0.02%Maxim Integrated Products 515 27,949 0.07%McCormick 226 27,943 0.07%McDonald's 1,434 256,371 0.60%McKesson 363 46,555 0.11%Merck 4,838 360,092 0.85%MetLife 1,834 83,759 0.20%Mettler-Toledo International 47 29,994 0.07%MGM Resorts International 931 27,409 0.06%Microchip Technology 439 35,282 0.08%Micron Technology 2,081 79,536 0.19%Microsoft 14,370 1,500,658 3.53%Mohawk Industries 117 15,068 0.04%Molson Coors Brewing 348 23,180 0.05%Mondelez International 2,709 125,318 0.30%Monster Beverage 740 42,358 0.10%Moody's 310 49,138 0.12%Morgan Stanley 2,429 102,747 0.24%Mosaic 659 21,273 0.05%Motorola Solutions 304 35,541 0.08%MSCI 164 27,924 0.07%Mylan 958 28,692 0.07%Nasdaq 213 18,753 0.04%National Oilwell Varco 712 20,990 0.05%Nektar Therapeutics 322 13,633 0.03%NetApp 468 29,844 0.07%Netflix 811 275,335 0.65%Newell Brands 798 16,926 0.04%Newfield Exploration 372 6,800 0.02%Newmont Mining 990 33,769 0.08%News (Class A) 724 9,289 0.02%News (Class B) 222 2,870 0.01%NextEra Energy 890 159,292 0.38%Nielsen Holdings 660 16,949 0.04%Nike 2,369 193,974 0.46%NiSource 675 18,414 0.04%Noble Energy 892 19,927 0.05%Nordstrom 211 9,793 0.02%Norfolk Southern 506 84,876 0.20%Northern Trust 411 36,357 0.09%Northrop Grumman 323 89,003 0.21%Norwegian Cruise Line Holdings 409 21,035 0.05%NRG Energy 539 22,050 0.05%Nucor 583 35,703 0.08%NVIDIA 1,134 163,013 0.38%Occidental Petroleum 1,403 93,692 0.22%Omnicom Group 416 32,398 0.08%ONEOK 764 49,056 0.12%Oracle 4,735 237,839 0.56%
93

Fidelity S&P 500 Index Fund SCHEDULE OF INVESTMENTS (CONTINUED) AS AT 31 JANUARY 2019
Number of
Shares Fair Value
USDFund % of
NAV*
Equities 96.52% (continued)
United States 94.12% (continued)
O'Reilly Automotive 149 51,354 0.12%PACCAR 649 42,522 0.10%Packaging of America 176 16,600 0.04%Parker-Hannifin 246 40,543 0.10%Paychex 594 42,055 0.10%PayPal Holdings 2,192 194,562 0.46%People's United Financial 701 11,482 0.03%PepsiCo 2,626 295,871 0.70%PerkinElmer 207 18,734 0.04%Pfizer 10,752 456,422 1.07%Philip Morris International 2,892 221,874 0.52%Phillips 66 788 75,183 0.18%Pinnacle West Capital 208 18,329 0.04%Pioneer Natural Resources 317 45,115 0.11%PNC Financial Services Group 860 105,496 0.25%PPG Industries 446 47,026 0.11%PPL 1,338 41,906 0.10%Principal Financial Group 489 24,484 0.06%Procter & Gamble 4,633 446,946 1.05%Progressive 1,083 72,875 0.17%Prudential Financial 767 70,671 0.17%Public Service Enterprise Group 939 51,222 0.12%PulteGroup 480 13,349 0.03%PVH 141 15,385 0.04%Qorvo 232 15,164 0.04%Qualcomm 2,252 111,519 0.26%Quanta Services 271 9,577 0.02%Quest Diagnostics 253 22,100 0.05%Ralph Lauren 101 11,730 0.03%Raymond James Financial 240 19,320 0.05%Raytheon 529 87,158 0.21%Red Hat 328 58,332 0.14%Regeneron Pharmaceuticals 144 61,815 0.15%Regions Financial 1,921 29,142 0.07%Republic Services 404 30,991 0.07%ResMed 265 25,220 0.06%Robert Half International 226 14,561 0.03%Rockwell Automation 224 37,972 0.09%Rollins 274 10,204 0.02%Roper Technologies 192 54,386 0.13%Ross Stores 694 63,931 0.15%Royal Caribbean Cruises 318 38,176 0.09%S&P Global 466 89,309 0.21%Salesforce.com 1,424 216,405 0.51%Schlumberger 2,581 114,106 0.27%Seagate Technology 484 21,432 0.05%Sealed Air 292 11,534 0.03%Sempra Energy 511 59,777 0.14%Sherwin-Williams 153 64,493 0.15%Skyworks Solutions 330 24,103 0.06%Snap-on 103 17,097 0.04%Southern 1,912 92,923 0.22%Southwest Airlines 940 53,354 0.13%Stanley Black & Decker 281 35,530 0.08%Starbucks 2,305 157,063 0.37%State Street 705 49,985 0.12%Stryker 577 102,458 0.24%SunTrust Banks 835 49,616 0.12%SVB Financial Group 99 23,105 0.05%Symantec 1,187 24,951 0.06%
94

Fidelity S&P 500 Index Fund SCHEDULE OF INVESTMENTS (CONTINUED) AS AT 31 JANUARY 2019
Number of
Shares Fair Value
USDFund % of
NAV*
Equities 96.52% (continued)
United States 94.12% (continued)
Synchrony Financial 1,229 36,919 0.09%Synopsys 277 25,858 0.06%Sysco 889 56,763 0.13%T Rowe Price Group 447 41,777 0.10%Take-Two Interactive Software 212 22,377 0.05%Tapestry 538 20,826 0.05%Target 970 70,810 0.17%Teleflex 87 23,795 0.06%Texas Instruments 1,785 179,714 0.42%Textron 451 24,007 0.06%Thermo Fisher Scientific 748 183,761 0.43%Tiffany 202 17,923 0.04%TJX 2,299 114,329 0.27%Torchmark 191 15,998 0.04%Total System Services 312 27,958 0.07%Tractor Supply 227 19,386 0.05%TransDigm Group 90 35,190 0.08%Travelers 492 61,766 0.15%TripAdvisor 190 10,902 0.03%Twenty-First Century Fox (Class A) 1,964 96,845 0.23%Twenty-First Century Fox (Class B) 905 44,399 0.10%Twitter 1,344 45,105 0.11%Tyson Foods 548 33,932 0.08%Ulta Beauty 105 30,652 0.07%Under Armour (Class A) 360 7,466 0.02%Under Armour (Class C) 345 6,534 0.02%Union Pacific 1,371 218,085 0.51%United Continental Holdings 425 37,090 0.09%United Parcel Service 1,292 136,177 0.32%United Rentals 151 18,914 0.04%United Technologies 1,508 178,050 0.42%UnitedHealth Group 1,789 483,388 1.13%Universal Health Services 158 20,940 0.05%Unum Group 406 14,113 0.03%US Bancorp 2,823 144,425 0.34%Valero Energy 788 69,202 0.16%Varian Medical Systems 169 22,313 0.05%VeriSign 198 33,515 0.08%Verisk Analytics 306 35,927 0.08%Verizon Communications 7,683 423,026 1.00%Vertex Pharmaceuticals 475 90,682 0.21%VF 605 50,923 0.12%Viacom 657 19,329 0.05%Visa 3,268 441,213 1.04%Vulcan Materials 245 24,904 0.06%Walgreens Boots Alliance 1,494 107,956 0.25%Walmart 2,647 253,662 0.60%Walt Disney 2,769 308,799 0.73%Waste Management 729 69,743 0.16%Waters 141 32,602 0.08%WEC Energy Group 586 42,796 0.10%WellCare Health Plans 93 25,713 0.06%Wells Fargo 7,881 385,460 0.91%Western Digital 538 24,205 0.06%Western Union 823 15,020 0.04%Westrock 471 19,174 0.05%Whirlpool 119 15,828 0.04%Williams 2,249 60,566 0.14%WW Grainger 85 25,108 0.06%Wynn Resorts 182 22,388 0.05%
95

Fidelity S&P 500 Index Fund SCHEDULE OF INVESTMENTS (CONTINUED) AS AT 31 JANUARY 2019
Number of
Shares Fair Value
USDFund % of
NAV*
Equities 96.52% (continued)
United States 94.12% (continued)
Xcel Energy 955 50,004 0.12%Xerox 385 10,861 0.03%Xilinx 470 52,612 0.12%Xylem 334 23,801 0.06%Yum! Brands 580 54,508 0.13%Zimmer Biomet Holdings 379 41,523 0.10%Zions Bancorp. 357 16,990 0.04%Zoetis 893 76,941 0.18%
Total United States 39,941,835 94.12%
Total Equities 40,960,131 96.52%
Transferable Securities 2.96%
United States 2.96%
Alexandria Real Estate Equities 200 26,342 0.06%American Tower 820 141,730 0.33%Apartment Investment & Management 289 14,311 0.03%AvalonBay Communities 257 49,580 0.12%Boston Properties 287 37,847 0.09%Crown Castle International 771 90,253 0.21%Digital Realty Trust 383 41,494 0.10%Duke Realty 666 19,474 0.05%Equinix 150 59,100 0.14%Equity Residential 685 49,704 0.12%Essex Property Trust 123 33,358 0.08%Extra Space Storage 235 23,173 0.05%Federal Realty Investment Trust 137 18,162 0.04%HCP 887 27,976 0.07%Host Hotels & Resorts 1,379 24,905 0.06%Iron Mountain 532 19,790 0.05%Kimco Realty 783 13,319 0.03%Macerich 197 9,094 0.02%Mid-America Apartment Communities 212 21,471 0.05%Prologis 1,170 80,917 0.19%Public Storage 279 59,293 0.14%Realty Income 548 37,642 0.09%Regency Centers 315 20,475 0.05%SBA Communications 211 38,514 0.09%Simon Property Group 575 104,719 0.25%SL Green Realty 158 14,604 0.03%UDR 512 22,400 0.05%Ventas 662 42,692 0.10%Vornado Realty Trust 322 22,511 0.05%Welltower 698 54,088 0.13%Weyerhaeuser 1,392 36,526 0.09%
Total United States 1,255,464 2.96%
Total Transferable Securities 1,255,464 2.96%
Financial Assets at Fair Value Through Profit or Loss 42,215,595 99.48%
96

Fidelity S&P 500 Index Fund SCHEDULE OF INVESTMENTS (CONTINUED) AS AT 31 JANUARY 2019
Financial Derivative Instruments 0.19%
Open Forward Foreign Exchange Contracts held for Class Hedging Purposes 0.18%
Currency Buy Amount Currency (Sell) Amount Counterparty Settlement Date
UnrealisedGain/(Loss)
USDFund % of
NAV*GBP 9,297,228 USD (12,060,578) Brown Brothers Harriman 19/02/2019 178,333 0.41%EUR 3,742,677 USD (4,273,093) Brown Brothers Harriman 19/02/2019 26,605 0.06%GBP 172,639 USD (223,761) Brown Brothers Harriman 19/02/2019 3,502 0.01%GBP 140,438 USD (182,002) Brown Brothers Harriman 19/02/2019 2,872 0.01%GBP 64,766 USD (83,294) Brown Brothers Harriman 19/02/2019 1,964 0.00%EUR 50,685 USD (57,779) Brown Brothers Harriman 19/02/2019 450 0.00%EUR 63,977 USD (73,110) Brown Brothers Harriman 19/02/2019 389 0.00%EUR 45,442 USD (51,899) Brown Brothers Harriman 19/02/2019 306 0.00%GBP 56,272 USD (73,897) Brown Brothers Harriman 19/02/2019 179 0.00%USD 370,499 GBP (281,339) Brown Brothers Harriman 19/02/2019 143 0.00%GBP 4,158 USD (5,396) Brown Brothers Harriman 19/02/2019 78 0.00%EUR 8,763 USD (10,037) Brown Brothers Harriman 19/02/2019 30 0.00%EUR 569 USD (650) Brown Brothers Harriman 19/02/2019 3 0.00%USD 48,328 GBP (36,711) Brown Brothers Harriman 19/02/2019 2 0.00%EUR 555 USD (637) Brown Brothers Harriman 19/02/2019 0 0.00%USD 124 GBP (94) Brown Brothers Harriman 19/02/2019 0 0.00%USD 404 GBP (307) Brown Brothers Harriman 19/02/2019 0 0.00%GBP 98 USD (130) Brown Brothers Harriman 19/02/2019 0 0.00%GBP 602 USD (793) Brown Brothers Harriman 19/02/2019 (1) (0.00%)GBP 2,219 USD (2,923) Brown Brothers Harriman 19/02/2019 (1) (0.00%)USD 149 GBP (114) Brown Brothers Harriman 19/02/2019 (1) (0.00%)USD 169 GBP (129) Brown Brothers Harriman 19/02/2019 (1) (0.00%)USD 422 GBP (323) Brown Brothers Harriman 19/02/2019 (3) (0.00%)EUR 66,699 USD (76,631) Brown Brothers Harriman 19/02/2019 (5) (0.00%)USD 69,287 GBP (52,656) Brown Brothers Harriman 19/02/2019 (29) (0.00%)EUR 37,802 USD (43,495) Brown Brothers Harriman 19/02/2019 (66) (0.00%)USD 32,065 EUR (27,982) Brown Brothers Harriman 19/02/2019 (81) (0.00%)GBP 47,968 USD (63,241) Brown Brothers Harriman 19/02/2019 (96) (0.00%)USD 47,514 GBP (36,202) Brown Brothers Harriman 19/02/2019 (143) (0.00%)USD 8,035 GBP (6,217) Brown Brothers Harriman 19/02/2019 (149) (0.00%)USD 27,776 GBP (21,232) Brown Brothers Harriman 19/02/2019 (175) (0.00%)USD 46,793 EUR (40,961) Brown Brothers Harriman 19/02/2019 (264) (0.00%)USD 66,197 GBP (50,616) Brown Brothers Harriman 19/02/2019 (435) (0.00%)USD 62,612 EUR (54,987) Brown Brothers Harriman 19/02/2019 (558) (0.00%)USD 43,295 GBP (33,492) Brown Brothers Harriman 19/02/2019 (794) (0.00%)USD 79,935 GBP (61,513) Brown Brothers Harriman 19/02/2019 (1,042) (0.00%)USD 152,422 GBP (116,722) Brown Brothers Harriman 19/02/2019 (1,232) (0.00%)USD 1,246,565 EUR (1,088,268) Brown Brothers Harriman 19/02/2019 (3,669) (0.01%)USD 416,276 GBP (320,805) Brown Brothers Harriman 19/02/2019 (6,033) (0.01%)USD 626,936 GBP (485,092) Brown Brothers Harriman 19/02/2019 (11,641) (0.03%)USD 6,010,836 GBP (4,649,813) Brown Brothers Harriman 19/02/2019 (110,199) (0.26%) Unrealised Gain on Open Forward Foreign Exchange Contracts held for Class Hedging Purposes 214,856 0.49%Unrealised Loss on Open Forward Foreign Exchange Contracts held for Class Hedging Purposes (136,618) (0.31%) Net Open Forward Foreign Exchange Contracts held for Class Hedging Purposes 78,238 0.18%
Futures Contracts 0.01%
BrokerNumber ofContracts
Notional Amount
UnrealisedGain/(Loss)
USDFund % of
NAV* S&P 500 E-mini 15 March 2019 Morgan Stanley 1 130,988 4,238 0.01% Net Futures Contracts 4,238 0.01%
Total Financial Derivative Instruments 82,476 0.20% Other Assets and Liabilities 136,887 0.32% Net Assets Attributable to Holders of Redeemable Participating Units 42,434,959 100.00%
97

Fidelity S&P 500 Index Fund SCHEDULE OF INVESTMENTS (CONTINUED) AS AT 31 JANUARY 2019
Analysis of Assets USDFund % of
Assets(a) Transferable securities admitted to an official stock exchange listing 42,215,595 94.92%(b) Financial derivative instruments 82,476 0.19%(c) Other assets 2,176,454 4.89%Total Assets 44,474,525 100.00% *The percentage of net assets disclosed above is subject to rounding.
98

Fidelity Enhanced Reserve Fund SCHEDULE OF INVESTMENTS AS AT 31 JANUARY 2019
Principal Currency Principal Maturity Date Coupon Fair Value
USDFund % of
NAV*
Asset-Backed Securities 0.28%
Jersey, Channel Islands 0.28%
West China Cement USD 320,000 11/09/2019 6.50% 321,463 0.28%
Total Asset-Backed Securities 321,463 0.28%
Certificates of Deposits 4.33%
Australia 1.73%
Cooperative Rabobank USD 1,000,000 02/05/2019 0.00% 993,295 0.86%Sumitomo Bank USD 1,000,000 01/02/2019 0.00% 999,931 0.87%
Total Australia 1,993,226 1.73%
China 1.73%
Agricultural Bank of China USD 1,000,000 01/03/2019 0.00% 998,420 0.87%China Construction Bank USD 1,000,000 16/04/2019 0.00% 994,810 0.86%
Total China 1,993,230 1.73%
United Kingdom 0.87%
Lloyds Bank USD 1,000,000 15/04/2019 2.75% 1,000,406 0.87%
Total Certificates of Deposits 4,986,862 4.33%
Commercial Papers 2.58%
France 0.86%
La Banque Postale USD 1,000,000 04/04/2019 0.00% 995,432 0.86%
Germany 1.72%
DekaBank Deutsche Girozentrale USD 2,000,000 02/05/2019 0.00% 1,986,432 1.72%
Total Commercial Papers 2,981,864 2.58%
Corporate Bonds 68.59%
Australia 2.61%
Australia & New Zealand Banking Group USD 750,000 23/11/2021 2.55% 738,743 0.64%Commonwealth Bank of Australia USD 200,000 15/10/2019 5.00% 203,059 0.18%Commonwealth Bank of Australia CNH 3,000,000 01/03/2020 5.01% 454,751 0.39%Commonwealth Bank of Australia USD 400,000 20/10/2026 3.38% 391,768 0.34%Macquarie Group USD 200,000 14/01/2020 6.00% 205,575 0.18%Woolworths Group USD 1,000,000 12/04/2021 4.55% 1,014,039 0.88%
Total Australia 3,007,935 2.61%
Bermuda 1.22%
China Oil & Gas Group USD 1,400,000 07/05/2020 5.00% 1,403,500 1.22%
British Virgin Islands 10.31%
Bluestar Finance Holdings USD 700,000 30/09/2019 3.13% 697,689 0.61%Bluestar Finance Holdings USD 500,000 11/06/2020 4.38% 503,615 0.44%Chalco Hong Kong Investment USD 200,000 07/11/2021 4.25% 196,921 0.17%China Merchants Finance USD 1,000,000 03/08/2020 3.50% 995,720 0.86%CLP Power Hong Kong Financing USD 1,000,000 19/03/2020 4.75% 1,016,685 0.88%Cssc Capital One USD 1,000,000 27/09/2021 4.13% 1,007,500 0.87%Double Rosy USD 250,000 18/11/2019 3.63% 250,085 0.22%Eastern Creation II Investment Holdings HKD 7,000,000 18/12/2021 3.85% 900,349 0.78%Fita International USD 1,000,000 10/02/2020 7.00% 1,033,421 0.90%Fortune Star USD 500,000 05/12/2020 5.38% 492,378 0.43%Fortune Star USD 900,000 31/01/2021 6.87% 904,799 0.78%Huarong Finance 2017 USD 200,000 27/04/2020 4.41% 200,444 0.17%Huarong Finance 2017 USD 400,000 27/04/2022 4.61% 400,044 0.35%
99

Fidelity Enhanced Reserve Fund SCHEDULE OF INVESTMENTS (CONTINUED) AS AT 31 JANUARY 2019
Principal Currency Principal Maturity Date Coupon Fair Value
USDFund % of
NAV*
Corporate Bonds 68.59% (continued)
British Virgin Islands 10.31% (continued)
RKI Overseas Finance 2016 A USD 400,000 09/08/2019 5.00% 398,106 0.35%RKPF Overseas 2019 B USD 200,000 18/04/2021 7.75% 203,900 0.18%Sino-Ocean Land Treasure IV USD 400,000 31/07/2021 5.04% 399,651 0.35%Studio City USD 500,000 30/11/2019 5.88% 508,125 0.44%Studio City Finance USD 379,000 01/12/2020 8.50% 379,948 0.33%Tewoo Group Finance No 2 USD 200,000 16/12/2019 4.50% 195,041 0.17%Tewoo Group No 4 USD 1,000,000 01/12/2020 3.15% 986,350 0.86%Trade Horizon Global USD 200,000 02/08/2021 5.31% 195,120 0.17%
Total British Virgin Islands 11,865,891 10.31%
Canada 0.34%
Harvest Operations USD 400,000 21/09/2022 3.00% 394,619 0.34%
Cayman Islands 8.49%
ADCB Finance Cayman USD 500,000 10/03/2020 2.63% 494,863 0.43%Agile Group Holdings USD 200,000 23/11/2020 9.50% 211,433 0.18%Alibaba Group Holding USD 200,000 28/11/2019 2.50% 199,576 0.17%CCBL Cayman 1 USD 200,000 31/05/2019 2.38% 199,255 0.17%CDBL Funding 1 USD 1,000,000 15/11/2021 3.87% 999,191 0.87%CDBL Funding 2 HKD 8,000,000 23/01/2021 3.20% 1,021,574 0.89%CDBL Funding 2 USD 200,000 18/07/2021 3.93% 199,941 0.17%China Aoyuan Group USD 200,000 11/01/2020 6.35% 200,505 0.17%China Aoyuan Group USD 200,000 07/09/2021 7.95% 204,173 0.18%China Aoyuan Group USD 225,000 23/01/2022 8.50% 229,467 0.20%China SCE Group Holdings USD 200,000 02/07/2020 10.00% 207,639 0.18%CIFI Holdings Group USD 400,000 02/05/2020 6.38% 403,546 0.35%CSCEC Finance Cayman I USD 500,000 19/11/2020 2.95% 495,107 0.43%ENN Energy Holdings USD 400,000 23/10/2019 3.25% 398,878 0.35%Future Land Development Holdings USD 200,000 16/02/2020 5.00% 198,351 0.17%Greentown China Holdings USD 200,000 11/08/2020 5.88% 200,798 0.17%Health & Happiness H&H International Holdings USD 358,000 21/06/2021 7.25% 361,934 0.31%JD.com USD 1,000,000 29/04/2021 3.13% 976,568 0.85%Lenovo Perpetual Securities USD 200,000 16/09/2167 5.38% 181,110 0.16%Longfor Group Holdings USD 200,000 13/07/2022 3.88% 195,160 0.17%QNB Finance USD 500,000 31/05/2021 4.06% 504,261 0.44%Redco Group USD 200,000 27/02/2019 6.38% 199,400 0.17%Redco Group USD 200,000 29/08/2020 11.00% 192,088 0.17%Soar Wise USD 500,000 06/11/2021 4.63% 504,179 0.44%Sun Hung Kai Properties Capital Market USD 400,000 25/02/2024 3.38% 400,004 0.35%Times China Holdings USD 200,000 27/11/2020 10.95% 211,940 0.18%Times China Holdings USD 200,000 17/01/2021 6.25% 197,854 0.17%
Total Cayman Islands 9,788,795 8.49%
China 4.98%
Agricultural Bank of China USD 500,000 07/11/2021 3.33% 499,624 0.43%Bank of China CNH 5,000,000 20/04/2020 4.88% 757,337 0.66%Bank of China USD 1,000,000 20/11/2021 3.39% 996,804 0.86%Chong Qing Grain Group CNH 7,000,000 14/07/2019 4.02% 1,045,337 0.91%Industrial & Commercial Bank of China USD 1,000,000 25/10/2021 3.52% 999,514 0.87%Industrial & Commercial Bank of China USD 200,000 14/12/2022 3.65% 199,886 0.17%Loncin Holding CNY 7,000,000 05/12/2019 4.50% 1,050,513 0.91%Tianjin Infrastructure Construction & Investment Group USD 200,000 15/06/2019 2.75% 198,764 0.17%
Total China 5,747,779 4.98%
Colombia 0.45%
Bancolombia USD 500,000 03/06/2021 5.95% 524,000 0.45%
100
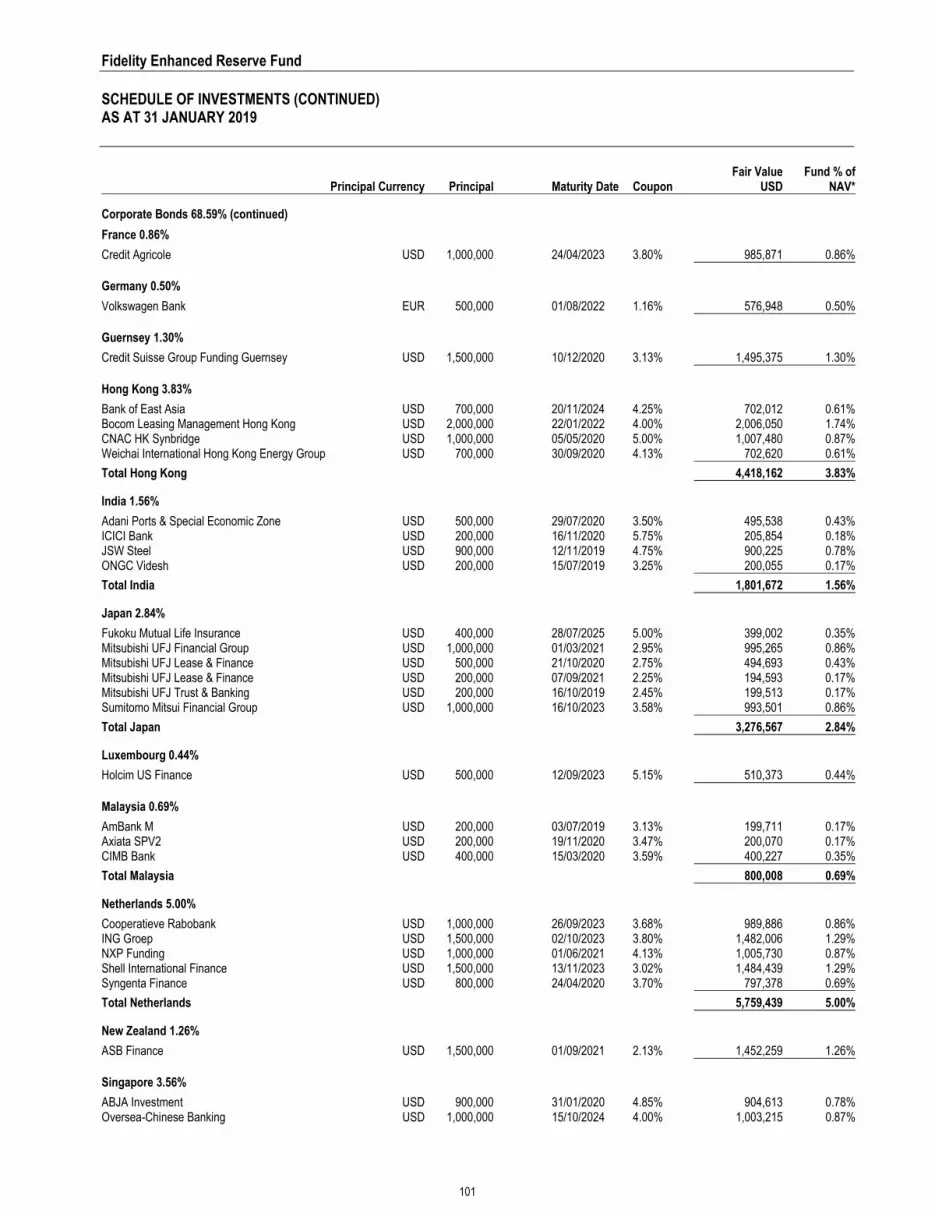
Fidelity Enhanced Reserve Fund SCHEDULE OF INVESTMENTS (CONTINUED) AS AT 31 JANUARY 2019
Principal Currency Principal Maturity Date Coupon Fair Value
USDFund % of
NAV*
Corporate Bonds 68.59% (continued)
France 0.86%
Credit Agricole USD 1,000,000 24/04/2023 3.80% 985,871 0.86%
Germany 0.50%
Volkswagen Bank EUR 500,000 01/08/2022 1.16% 576,948 0.50%
Guernsey 1.30%
Credit Suisse Group Funding Guernsey USD 1,500,000 10/12/2020 3.13% 1,495,375 1.30%
Hong Kong 3.83%
Bank of East Asia USD 700,000 20/11/2024 4.25% 702,012 0.61%Bocom Leasing Management Hong Kong USD 2,000,000 22/01/2022 4.00% 2,006,050 1.74%CNAC HK Synbridge USD 1,000,000 05/05/2020 5.00% 1,007,480 0.87%Weichai International Hong Kong Energy Group USD 700,000 30/09/2020 4.13% 702,620 0.61%
Total Hong Kong 4,418,162 3.83%
India 1.56%
Adani Ports & Special Economic Zone USD 500,000 29/07/2020 3.50% 495,538 0.43%ICICI Bank USD 200,000 16/11/2020 5.75% 205,854 0.18%JSW Steel USD 900,000 12/11/2019 4.75% 900,225 0.78%ONGC Videsh USD 200,000 15/07/2019 3.25% 200,055 0.17%
Total India 1,801,672 1.56%
Japan 2.84%
Fukoku Mutual Life Insurance USD 400,000 28/07/2025 5.00% 399,002 0.35%Mitsubishi UFJ Financial Group USD 1,000,000 01/03/2021 2.95% 995,265 0.86%Mitsubishi UFJ Lease & Finance USD 500,000 21/10/2020 2.75% 494,693 0.43%Mitsubishi UFJ Lease & Finance USD 200,000 07/09/2021 2.25% 194,593 0.17%Mitsubishi UFJ Trust & Banking USD 200,000 16/10/2019 2.45% 199,513 0.17%Sumitomo Mitsui Financial Group USD 1,000,000 16/10/2023 3.58% 993,501 0.86%
Total Japan 3,276,567 2.84%
Luxembourg 0.44%
Holcim US Finance USD 500,000 12/09/2023 5.15% 510,373 0.44%
Malaysia 0.69%
AmBank M USD 200,000 03/07/2019 3.13% 199,711 0.17%Axiata SPV2 USD 200,000 19/11/2020 3.47% 200,070 0.17%CIMB Bank USD 400,000 15/03/2020 3.59% 400,227 0.35%
Total Malaysia 800,008 0.69%
Netherlands 5.00%
Cooperatieve Rabobank USD 1,000,000 26/09/2023 3.68% 989,886 0.86%ING Groep USD 1,500,000 02/10/2023 3.80% 1,482,006 1.29%NXP Funding USD 1,000,000 01/06/2021 4.13% 1,005,730 0.87%Shell International Finance USD 1,500,000 13/11/2023 3.02% 1,484,439 1.29%Syngenta Finance USD 800,000 24/04/2020 3.70% 797,378 0.69%
Total Netherlands 5,759,439 5.00%
New Zealand 1.26%
ASB Finance USD 1,500,000 01/09/2021 2.13% 1,452,259 1.26%
Singapore 3.56%
ABJA Investment USD 900,000 31/01/2020 4.85% 904,613 0.78%Oversea-Chinese Banking USD 1,000,000 15/10/2024 4.00% 1,003,215 0.87%
101

Fidelity Enhanced Reserve Fund SCHEDULE OF INVESTMENTS (CONTINUED) AS AT 31 JANUARY 2019
Principal Currency Principal Maturity Date Coupon Fair Value
USDFund % of
NAV*
Corporate Bonds 68.59% (continued)
Singapore 3.56% (continued)
United Overseas Bank USD 500,000 18/03/2020 2.50% 497,440 0.43%United Overseas Bank USD 1,000,000 23/04/2021 3.20% 1,001,846 0.87%United Overseas Bank USD 700,000 23/04/2021 3.25% 699,254 0.61%
Total Singapore 4,106,368 3.56%
South Korea 3.49%
Hyundai Capital Services USD 400,000 16/03/2021 2.88% 393,681 0.34%Kookmin Bank USD 1,000,000 23/10/2021 3.63% 1,008,398 0.87%Korea Midland Power USD 1,425,000 22/01/2022 3.38% 1,428,141 1.24%Shinhan Bank USD 500,000 15/04/2020 2.25% 493,729 0.43%Shinhan Bank USD 700,000 07/12/2026 3.88% 695,006 0.61%
Total South Korea 4,018,955 3.49%
Thailand 0.18%
Krung Thai Bank USD 200,000 26/12/2024 5.20% 201,756 0.18%
United Arab Emirates 2.15%
DP World USD 500,000 18/05/2020 3.25% 499,175 0.43%Emirates NBD USD 500,000 19/11/2019 3.25% 498,854 0.43%First Abu Dhabi Bank USD 1,500,000 11/02/2020 2.25% 1,482,277 1.29%
Total United Arab Emirates 2,480,306 2.15%
United Kingdom 2.57%
HSBC Holdings USD 2,000,000 18/05/2024 3.64% 1,985,186 1.72%Royal Bank of Scotland Group USD 1,000,000 15/05/2023 4.09% 981,295 0.85%
Total United Kingdom 2,966,481 2.57%
United States 9.96%
Aetna USD 500,000 15/06/2023 2.80% 486,103 0.42%Bank of America USD 500,000 19/04/2021 2.63% 496,586 0.43%Becton Dickinson USD 500,000 06/06/2022 2.89% 490,937 0.43%Broadcom USD 500,000 15/01/2023 2.65% 473,526 0.41%Campbell Soup USD 500,000 15/03/2023 3.65% 494,593 0.43%Cigna USD 500,000 17/09/2021 3.40% 501,955 0.44%Citibank USD 625,000 23/01/2024 3.65% 632,567 0.55%CVS Health USD 500,000 09/03/2021 3.35% 501,606 0.43%Dell International USD 1,000,000 15/06/2021 4.42% 1,014,998 0.88%DISH DBS USD 400,000 01/06/2021 6.75% 405,996 0.35%DPL USD 1,000,000 15/10/2021 7.25% 1,063,751 0.93%General Electric USD 1,000,000 16/09/2020 4.38% 1,007,490 0.87%General Motors Financial USD 500,000 06/11/2021 3.69% 489,389 0.42%General Motors Financial USD 500,000 06/11/2021 4.20% 502,710 0.44%Hyundai Capital America USD 400,000 12/03/2021 3.45% 398,148 0.35%Hyundai Capital America USD 1,000,000 01/02/2022 3.95% 1,004,115 0.87%McKesson USD 1,000,000 30/11/2020 3.65% 1,006,524 0.87%Nestle Holdings USD 500,000 24/09/2021 3.10% 504,815 0.44%
Total United States 11,475,809 9.96%
Total Corporate Bonds 79,058,868 68.59%
Government Bonds 15.84%
China 0.87%
China Development Bank USD 1,000,000 12/12/2021 3.41% 1,000,513 0.87%
102

Fidelity Enhanced Reserve Fund SCHEDULE OF INVESTMENTS (CONTINUED) AS AT 31 JANUARY 2019
Principal Currency Principal Maturity Date Coupon Fair Value
USDFund % of
NAV*
Government Bonds 15.84% (continued)
South Korea 1.82%
Export-Import Bank of Korea USD 400,000 01/06/2023 3.51% 399,585 0.35%Export-Import Bank of Korea USD 1,000,000 27/11/2021 3.50% 1,009,204 0.87%Korea Development Bank USD 200,000 12/03/2021 3.33% 200,034 0.17%Korea Housing Finance USD 500,000 31/10/2022 3.00% 492,682 0.43%
Total South Korea 2,101,505 1.82%
Sri Lanka 0.17%
Sri Lanka Government International Bond USD 200,000 04/10/2020 6.25% 201,407 0.17%
Thailand 0.87%
Export Import Bank of Thailand USD 1,000,000 20/11/2023 3.54% 1,001,597 0.87%
United States 12.11%
U.S. Treasury Note USD 4,000,000 28/02/2019 1.38% 3,997,031 3.47%U.S. Treasury Note USD 3,000,000 31/03/2019 1.25% 2,993,672 2.60%U.S. Treasury Note USD 2,000,000 31/05/2019 1.50% 1,993,477 1.73%U.S. Treasury Note USD 5,000,000 15/07/2019 0.75% 4,960,742 4.31%
Total United States 13,944,922 12.11%
Total Government Bonds 18,249,944 15.84%
Transferable Securities 2.69%
Ireland 2.69%
Fidelity Institutional Liquidity Fund - The United States Dollar Fund 175 3,105,014 2.69%
Total Transferable Securities 3,105,014 2.69%
Financial Assets at Fair Value Through Profit or Loss 108,704,015 94.31%
Financial Derivative Instruments 0.28%
Open Forward Foreign Exchange Contracts held for Portfolio Hedging Purposes (0.06%)
Currency Buy Amount Currency (Sell) Amount Counterparty Settlement Date
Unrealised Gain/(Loss)
USDFund % of
NAV*USD 900,371 HKD (7,000,000) HSBC Bank 11/12/2019 1,056 0.00%USD 148,761 CNY (1,000,000) HSBC Bank 31/01/2020 395 0.00%USD 1,038,314 CNY (7,000,000) HSBC Bank 31/01/2020 (248) (0.00%)USD 1,026,943 HKD (8,000,000) HSBC Bank 16/01/2020 (1,373) (0.00%)USD 575,510 EUR (500,000) HSBC Bank 02/05/2019 (3,219) (0.00%)USD 1,015,788 CNH (7,000,000) Brown Brothers Harriman 16/07/2019 (27,027) (0.02%)USD 1,021,715 CNH (7,100,000) HSBC Bank 05/12/2019 (35,058) (0.04%) Unrealised Gain on Open Forward Foreign Exchange Contracts held for Portfolio Hedging Purposes 1,451 0.00%Unrealised Loss on Open Forward Foreign Exchange Contracts held for Portfolio Hedging Purposes (66,925) (0.06%) Net Open Forward Foreign Exchange Contracts held for Portfolio Hedging Purposes (65,474) (0.06%)
Open Forward Foreign Exchange Contracts held for Class Hedging Purposes 0.34%
Currency Buy Amount Currency (Sell) Amount Counterparty Settlement Date
Unrealised Gain/(Loss)
USDFund % of
NAV*SGD 52,005,279 USD (38,375,182) Brown Brothers Harriman 19/02/2019 283,180 0.26%SGD 5,967,733 USD (4,403,646) Brown Brothers Harriman 19/02/2019 32,495 0.04%GBP 936,501 USD (1,212,884) Brown Brothers Harriman 19/02/2019 17,588 0.02%EUR 2,092,661 USD (2,391,026) Brown Brothers Harriman 19/02/2019 15,814 0.01%SGD 1,447,000 USD (1,063,669) Brown Brothers Harriman 19/02/2019 11,965 0.01%
103

Fidelity Enhanced Reserve Fund SCHEDULE OF INVESTMENTS (CONTINUED) AS AT 31 JANUARY 2019
Financial Derivative Instruments 0.28% (continued) Open Forward Foreign Exchange Contracts held for Class Hedging Purposes 0.34% (continued)
Currency Buy Amount Currency (Sell) Amount Counterparty Settlement Date
Unrealised Gain/(Loss)
USDFund % of
NAV*SGD 1,051,200 USD (775,742) Brown Brothers Harriman 19/02/2019 5,673 0.00%EUR 300,000 USD (341,027) Brown Brothers Harriman 19/02/2019 4,013 0.00%SGD 1,407,931 USD (1,042,675) Brown Brothers Harriman 19/02/2019 3,917 0.00%SGD 465,500 USD (342,315) Brown Brothers Harriman 19/02/2019 3,717 0.00%SGD 446,492 USD (328,586) Brown Brothers Harriman 19/02/2019 3,316 0.00%SGD 563,500 USD (415,708) Brown Brothers Harriman 19/02/2019 3,173 0.00%SGD 294,250 USD (216,516) Brown Brothers Harriman 19/02/2019 2,216 0.00%SGD 385,395 USD (284,362) Brown Brothers Harriman 19/02/2019 2,123 0.00%SGD 564,480 USD (417,664) Brown Brothers Harriman 19/02/2019 1,944 0.00%AUD 172,380 USD (124,033) Brown Brothers Harriman 19/02/2019 1,443 0.00%SGD 172,865 USD (127,559) Brown Brothers Harriman 19/02/2019 941 0.00%SGD 111,720 USD (82,156) Brown Brothers Harriman 19/02/2019 892 0.00%SGD 186,763 USD (137,995) Brown Brothers Harriman 19/02/2019 837 0.00%EUR 104,475 USD (119,439) Brown Brothers Harriman 19/02/2019 721 0.00%EUR 29,700 USD (33,826) Brown Brothers Harriman 19/02/2019 333 0.00%GBP 6,058 USD (7,832) Brown Brothers Harriman 19/02/2019 127 0.00%GBP 2,463 USD (3,174) Brown Brothers Harriman 19/02/2019 61 0.00%SGD 9,900 USD (7,315) Brown Brothers Harriman 19/02/2019 44 0.00%SGD 3,990 USD (2,936) Brown Brothers Harriman 19/02/2019 30 0.00%SGD 180 USD (133) Brown Brothers Harriman 19/02/2019 1 0.00%SGD 48 USD (35) Brown Brothers Harriman 19/02/2019 0 0.00%USD 163 SGD (220) Brown Brothers Harriman 19/02/2019 (1) (0.00%)USD 78 AUD (108) Brown Brothers Harriman 19/02/2019 (1) (0.00%)USD 226 SGD (306) Brown Brothers Harriman 19/02/2019 (2) (0.00%)SGD 49,250 USD (36,615) Brown Brothers Harriman 19/02/2019 (5) (0.00%)USD 7,794 SGD (10,569) Brown Brothers Harriman 19/02/2019 (62) (0.00%)USD 14,185 EUR (12,439) Brown Brothers Harriman 19/02/2019 (121) (0.00%)SGD 1,334,272 USD (991,975) Brown Brothers Harriman 19/02/2019 (138) (0.00%)GBP 60,395 USD (79,539) Brown Brothers Harriman 19/02/2019 (186) (0.00%)USD 67,677 SGD (91,771) Brown Brothers Harriman 19/02/2019 (542) (0.00%)USD 491,274 SGD (663,371) Brown Brothers Harriman 19/02/2019 (1,846) (0.00%) Unrealised Gain on Open Forward Foreign Exchange Contracts held for Class Hedging Purposes 396,564 0.34%Unrealised Loss on Open Forward Foreign Exchange Contracts held for Class Hedging Purposes (2,904) (0.00%) Net Open Forward Foreign Exchange Contracts held for Class Hedging Purposes 393,660 0.34%
Total Financial Derivative Instruments 328,186 0.28% Other Assets and Liabilities 6,234,766 5.41%Net Assets Attributable to Holders of Redeemable Participating Units 115,266,967 100.00%
Analysis of Assets USDFund % of
Assets(a) Transferable securities admitted to an official stock exchange listing 4,974,862 4.02%(b) Transferable securities dealt in on another regulated market 103,729,153 83.74%(c) Financial derivative instruments 328,186 0.26%(d) Other assets 14,835,867 11.98%Total Assets 123,868,068 100.00%
*The percentage of net assets disclosed above is subject to rounding.
104

Fidelity UCITS II ICAV STATEMENT OF FINANCIAL POSITION AS AT 31 JANUARY 2019
Fidelity MSCI Emerging Markets
Index Fund* Fidelity MSCI Europe
Index Fund* Fidelity MSCI Japan
Index Fund* Fidelity MSCI Pacific
ex-Japan Index Fund*
31 January 2019 31 January 2019 31 January 2019 31 January 2019 Note USD EUR USD USD Current Assets Financial Assets at Fair Value Through Profit or Loss 2b, 11f 20,565,917 5,834,496 15,365,715 6,575,362 Financial Derivative Instruments 2d, 2e 37,313 2,738 2,536 5,372 Cash and Cash Equivalents 2c, 3 453,504 101,090 86,626 104,851 Margin Cash Due from Broker – 2,910 7,863 – Investments Sold awaiting settlement – 100 1,952,296 – Capital Shares Sold awaiting settlement 36,677 91,271 – – Dividends Receivable 43,420 8,048 23,249 6,645 Total Assets 21,136,831 6,040,653 17,438,285 6,692,230 Current Liabilities Financial Derivative Instruments 2d, 2e – 4,300 2,046 88 Margin Cash Due to Broker 9,273 – – 494 Investments Purchased awaiting settlement 23,330 87,456 – – Capital Shares Redeemed awaiting settlement 64 64,757 1,913,598 – Management Fees Payable 7 3,394 613 1,440 675 Capital Gain Tax Payable 33,331 – – – Other Payables 3,715 – – – Liabilities (Excluding Net Assets Attributable to Holders of Redeemable Participating Shares) 73,107 157,126 1,917,084 1,257 Net Assets Attributable to Holders of Redeemable Participating Shares (for financial reporting purposes) 21,063,724 5,883,527 15,521,201 6,690,973 Represented by: Net Assets Attributable to Holders of Redeemable Participating Shares (for Shareholder dealing purposes) 21,063,724 5,883,527 15,521,201 6,690,973 Dilution adjustment – – – – Net Assets Attributable to Holders of Redeemable Participating Shares (for financial reporting purposes) 21,063,724 5,883,527 15,521,201 6,690,973
* The Sub-Fund launched on 20 March 2018.
105

Fidelity UCITS II ICAV STATEMENT OF FINANCIAL POSITION (CONTINUED) AS AT 31 JANUARY 2019
Fidelity MSCI World
Index Fund* Fidelity S&P 500
Index Fund*
Fidelity Enhanced
Reserve Fund†
31 January 2019 31 January 2019 31 January 2019 Note USD USD USD Current Assets Financial Assets at Fair Value Through Profit or Loss 2b, 11f 47,231,615 42,215,595 108,704,015 Financial Derivative Instruments 2d, 2e 20,870 219,094 398,015 Cash and Cash Equivalents 2c, 3 746,266 102,008 12,948,708 Margin Cash Due from Broker 22,872 3,362 – Investments Sold awaiting settlement 934,448 – 4,387 Capital Shares Sold awaiting settlement 72,129 1,891,857 1,037,438 Dividends Receivable 49,744 42,609 – Interest Receivable from Financial Assets Through Fair Value and Profit and Loss – – 775,505 Total Assets 49,077,944 44,474,525 123,868,068 Current Liabilities Financial Derivative Instruments 2d, 2e 192 136,618 69,829 Investments Purchased awaiting settlement 332 1,821,459 8,479,581 Capital Shares Redeemed awaiting settlement 1,212,194 77,050 2,330 Management Fees Payable 7 5,246 4,439 49,361 Liabilities (Excluding Net Assets Attributable to Holders of Redeemable Participating Shares) 1,217,964 2,039,566 8,601,101 Net Assets Attributable to Holders of Redeemable Participating Shares (for financial reporting purposes) 47,859,980 42,434,959 115,266,967 Represented by: Net Assets Attributable to Holders of Redeemable Participating Shares (for Shareholder dealing purposes) 47,850,166 42,434,959 115,391,338 Dilution adjustment (9,814) – 124,371 Net Assets Attributable to Holders of Redeemable Participating Shares (for financial reporting purposes) 47,859,980 42,434,959 115,266,967
* The Sub-Fund launched on 20 March 2018. † The Sub-Fund launched on 26 March 2018.
106

Fidelity UCITS II ICAV STATEMENT OF FINANCIAL POSITION (CONTINUED) AS AT 31 JANUARY 2019
Fidelity MSCI Emerging Markets Index Fund Class P EUR Acc Class P USD Acc Net Asset Value EUR USD As at 31 January 2019 5,221,513 15,072,230 Net Asset Value per Share EUR USD As at 31 January 2019 4.72 4.42 Shares In Issue As at 31 January 2019 1,105,458 3,412,706
Fidelity MSCI Europe Index Fund
Class P EUR Acc Class P USD Acc Class P EUR Hedged
Acc Class P GBP Hedged
Acc Net Asset Value EUR USD EUR GBP As at 31 January 2019 4,184,189 9,161 1,580,629 96,585 Net Asset Value per Share EUR USD EUR GBP As at 31 January 2019 4.91 4.59 4.87 4.92 Shares In Issue As at 31 January 2019 852,541 1,996 324,381 19,647
Fidelity MSCI Japan Index Fund
Class P EUR Acc Class P USD Acc Class P EUR Hedged
Acc Class P GBP Hedged
Acc Net Asset Value EUR USD EUR GBP As at 31 January 2019 540,180 13,814,044 939,702 6,893 Net Asset Value per Share EUR USD EUR GBP As at 31 January 2019 4.94 4.62 4.68 4.59 Shares In Issue As at 31 January 2019 109,427 2,992,763 200,882 1,503
Fidelity MSCI Pacific ex-Japan Index Fund Class P USD Acc Class P GBP Hedged Acc Net Asset Value USD GBP As at 31 January 2019 6,681,414 7,267 Net Asset Value per Share USD GBP As at 31 January 2019 4.84 4.87 Shares In Issue As at 31 January 2019 1,381,309 1,493
Fidelity MSCI World Index Fund Class P EUR Acc Class P USD Acc Class P EUR Hedged Acc Class P GBP Hedged Acc Net Asset Value EUR USD EUR GBP As at 31 January 2019 5,330,457 41,668,505 39,163 7,315 Net Asset Value per Share EUR USD EUR GBP As at 31 January 2019 5.22 4.88 4.87 4.83 Shares In Issue As at 31 January 2019 1,020,904 8,534,932 8,035 1,516 Class P CZK Hedged Acc Net Asset Value CZK As at 31 January 2019 239,481 Net Asset Value per Share CZK As at 31 January 2019 103.06 Shares In Issue As at 31 January 2019 2,324
107

Fidelity UCITS II ICAV STATEMENT OF FINANCIAL POSITION (CONTINUED) AS AT 31 JANUARY 2019
Fidelity Enhanced Reserve Fund
Class A-Acc USD Class A-MDIST (G) USD Class A-MDIST (G) SGD
Hedged Net Asset Value USD USD SGD As at 31 January 2019 32,634,692 22,985,854 60,344,427 Net Asset Value per Share USD USD SGD As at 31 January 2019 10.25 10.07 9.99 Shares In Issue As at 31 January 2019 3,182,798 2,282,525 6,042,421
Class I-QDIST(G) USDClass A-ACC SGD
Hedged Class A-MDIST(G) AUD
Hedged Net Asset Value USD SGD AUD As at 31 January 2019 6,339 5,533,999 172,869 Net Asset Value per Share USD SGD AUD As at 31 January 2019 10.13 10.17 10.03 Shares In Issue As at 31 January 2019 626 544,143 17,236
Class A-MDIST(G) EUR
Hedged Class Y-ACC USD Class Y-ACC SGD
Hedged Net Asset Value EUR USD SGD As at 31 January 2019 2,529,026 6,316,270 173,980 Net Asset Value per Share EUR USD SGD As at 31 January 2019 9.83 10.27 10.19 Shares In Issue As at 31 January 2019 257,214 614,960 17,080
Signed on behalf of the Board of Directors by: Date: 24 May 2019
Fidelity S&P 500 Index Fund
Class P EUR Acc Class P USD Acc Class P EUR Hedged
Acc Class P GBP Hedged
AccNet Asset Value EUR USD EUR GBPAs at 31 January 2019 2,498,781 31,494,006 2,832,070 3,667,237Net Asset Value per Share EUR USD EUR GBPAs at 31 January 2019 5.38 5.03 4.89 4.938Shares In Issue As at 31 January 2019 464,878 6,266,107 579,431 743,870
Class A-MINCOME(G)
GBP Hedged Class Y-MINCOME(G)-
USD Net Asset Value GBP USD As at 31 January 2019 1,008,485 5,048 Net Asset Value per Share GBP USD As at 31 January 2019 9.97 10.10 Shares In Issue As at 31 January 2019 101,161 500
Date: 24 May 2019
108

Fidelity UCITS II ICAV STATEMENT OF COMPREHENSIVE INCOME FOR THE PERIOD FROM 14 NOVEMBER 2017 (DATE OF REGISTRATION) TO 31 JANUARY 2019
Fidelity MSCI Emerging Markets
Index Fund* Fidelity MSCI Europe
Index Fund* Fidelity MSCI Japan
Index Fund* Fidelity MSCI Pacific
ex-Japan Index Fund*
31 January 2019 31 January 2019 31 January 2019 31 January 2019 Note USD EUR USD USD Operating Income Interest on Cash 3,236 – 452 729 Dividend Income 2j 408,203 151,591 348,662 185,180 Other Income 195 507 – 122 Net Gain/(Loss) in Financial Assets at fair Value through Profit or Loss 13 (1,768,969) (276,133) (1,578,811) (323,121) Total Operating Income/(Loss) (1,357,335) (124,035) (1,229,697) (137,090) Operating Expenses Management Fees 7 28,102 5,275 14,242 6,035 Transaction Costs 2k, 10 28,544 13,470 5,278 4,350 Capital Gain Tax Expenses 33,331 – – – Other Expenses 281 723 – 16 Total Operating Expenses 90,258 19,468 19,520 10,401 Finance Costs Overdraft Expense 354 135 499 57 Distribution Paid 2o – – – – Income Equalisation 2p – – – – Total Finance Costs 354 135 499 57 Net Investment Income/(Loss) for the financial period (1,447,947) (143,638) (1,249,716) (147,548) Foreign Withholding Tax 2m (55,133) (15,435) (52,292) (3,841) Net Investment Income/(Loss) for the financial period after tax (1,503,080) (159,073) (1,302,008) (151,389)
Net Increase/(Decrease) in Net Assets Attributable to Holders of Redeemable Participating Shares from Operations (1,503,080) (159,073) (1,302,008) (151,389)
* The Sub-Fund launched on 20 March 2018.
109

Fidelity UCITS II ICAV STATEMENT OF COMPREHENSIVE INCOME (CONTINUED) FOR THE PERIOD FROM 14 NOVEMBER 2017 (DATE OF REGISTRATION) TO 31 JANUARY 2019
Fidelity MSCI World
Index Fund* Fidelity S&P 500
Index Fund* Fidelity Enhanced
Reserve Fund†
31 January 2019 31 January 2019 31 January 2019 Note USD USD USD Operating Income Interest from Financial Assets Through Fair Value and Profit and Loss 2i – – 1,007,009 Interest on Cash 4,758 2,943 61,835 Dividend Income 2j 598,421 498,090 – Other Income – 33 – Net Gain/(Loss) in Financial Assets at fair Value through Profit or Loss 13 (2,015,667) (3,616,254) 807,890 Total Operating Income/(Loss) (1,412,488) (3,115,188) 1,876,734 Operating Expenses Management Fees 7 31,995 26,115 178,493 Transaction Costs 2k, 10 34,413 3,490 – Capital Gain Tax Expenses – – – Other Expenses 921 – – Total Operating Expenses 67,329 29,605 178,493 Finance Costs Overdraft Expense 761 61 2 Distribution Paid 2o – – 499,427 Income Equalisation 2p – – (254,007) Total Finance Costs 761 61 245,422 Net Investment Income/(Loss) for the financial period (1,480,578) (3,144,854) 1,452,819 Foreign Withholding Tax 2m (136,571) (183,709) – Net Investment Income/(Loss) for the financial period after tax (1,617,149) (3,328,563) 1,452,819
Net Increase/(Decrease) in Net Assets Attributable to Holders of Redeemable Participating Shares from Operations (1,617,149) (3,328,563) 1,452,819
* The Sub-Fund launched on 20 March 2018. † The Sub-Fund launched on 26 March 2018.
110

Fidelity UCITS II ICAV STATEMENT OF CHANGES IN NET ASSETS ATTRIBUTABLE TO HOLDERS OF REDEEMABLE PARTICIPATING SHARES FOR THE PERIOD FROM 14 NOVEMBER 2017 (DATE OF REGISTRATION) TO 31 JANUARY 2019
Fidelity MSCIEmerging Markets
Index Fund*Fidelity MSCI Europe
Index Fund*Fidelity MSCI Japan
Index Fund*Fidelity MSCI Pacific
ex-Japan Index Fund*
31 January 2019 31 January 2019 31 January 2019 31 January 2019 USD EUR USD USDIncrease/(Decrease) in Net Assets Net Increase/(Decrease) in Net Assets Attributable to
Holders of Redeemable Participating Shares from Operations (1,503,080) (159,073) (1,302,008) (151,389)
Capital Transactions Subscriptions 22,688,391 6,248,769 18,893,084 6,872,2731
Reinvestments – – – – Redemptions (121,587) (206,169) (2,069,875) (29,911)1
Total Capital Transactions 22,566,804 6,042,600 16,823,209 6,842,362 Total Increase/(Decrease) for the Period 21,063,724 5,883,527 15,521,201 6,690,973Net Assets Attributable to Holders of Redeemable Participating Shares Beginning of Period – – – –End of Period 21,063,724 5,883,527 15,521,201 6,690,973
Fidelity MSCI World
Index Fund*Fidelity S&P 500
Index Fund*Fidelity Enhanced
Reserve Fund†
31 January 2019 31 January 2019 31 January 2019 USD USD USDIncrease/(Decrease) in Net Assets Net Increase/(Decrease) in Net Assets Attributable to
Holders of Redeemable Participating Shares from Operations (1,617,149) (3,328,563) 1,452,819
Capital Transactions Subscriptions 64,885,4022 99,448,890 149,070,7843
Reinvestments – – 55,162 Redemptions (15,408,273)2 (53,685,368) (35,311,798)3
Total Capital Transactions 49,477,129 45,763,522 113,814,148 Total Increase/(Decrease) for the Period 47,859,980 42,434,959 115,266,967Net Assets Attributable to Holders of Redeemable Participating Shares Beginning of Period – – –End of Period 47,859,980 42,434,959 115,266,967
* The Sub-Fund launched on 20 March 2018. † The Sub-Fund launched on 26 March 2018. 1) Includes the exchange of 1,493 Shares of Class P USD Acc for 2,000 Shares of Class P GBP Hedged Acc valued USD9,898. 2) Includes the exchange of 4,200 Shares of Class P USD Acc for 1,510 Shares of Class P GBP Hedged Acc and 2,324 Shares of
Class P CZK Hedged Acc valued USD10,048 and USD10,398, respectively. 3) Includes the exchange of 68,691 Shares of Class A-Acc SDG Hedged for 69,952 Shares of Class A-MDIST(G) SDG Hedged valued
USD516,669.
111
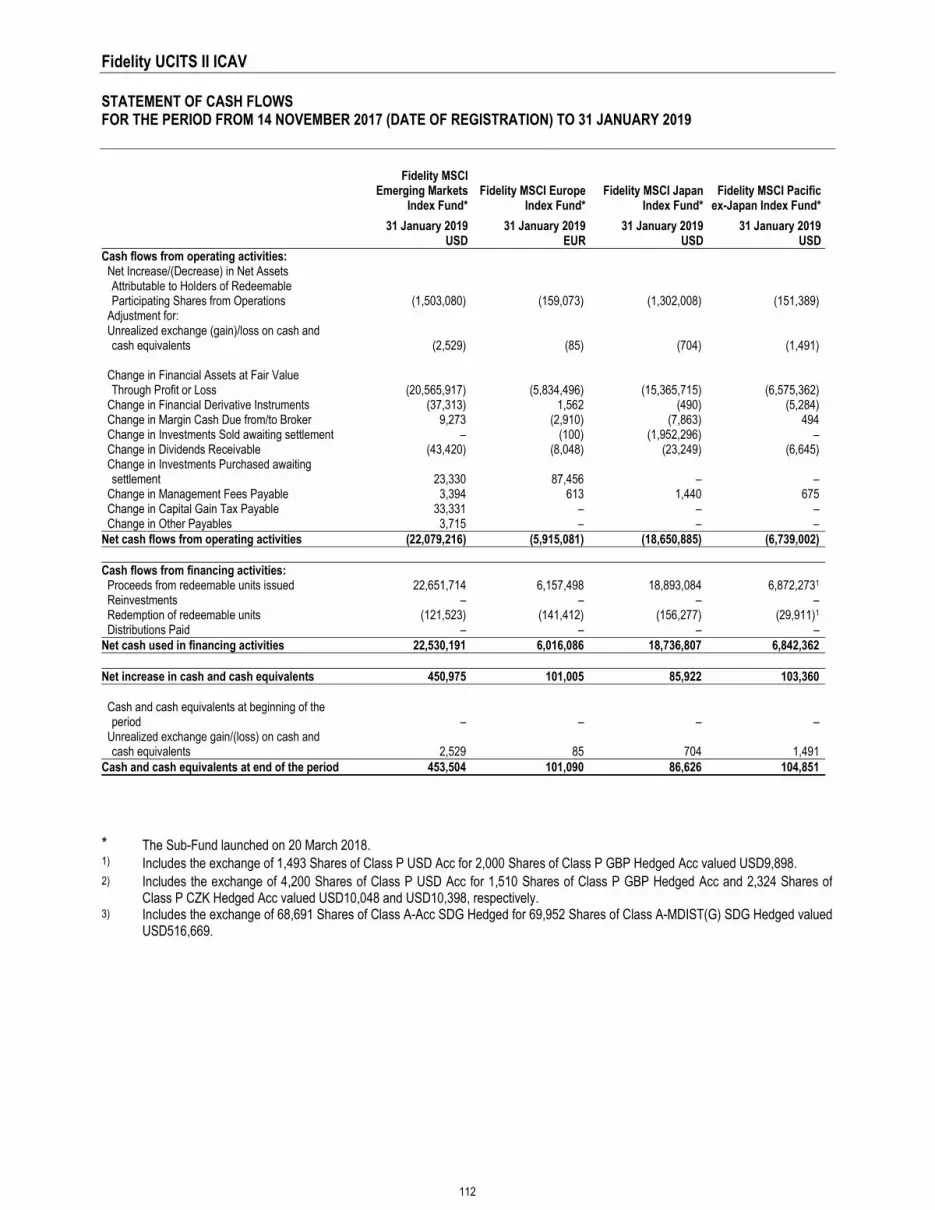
Fidelity UCITS II ICAV STATEMENT OF CASH FLOWS FOR THE PERIOD FROM 14 NOVEMBER 2017 (DATE OF REGISTRATION) TO 31 JANUARY 2019
Fidelity MSCI Emerging Markets
Index Fund* Fidelity MSCI Europe
Index Fund* Fidelity MSCI Japan
Index Fund* Fidelity MSCI Pacific
ex-Japan Index Fund*
31 January 2019 31 January 2019 31 January 2019 31 January 2019 USD EUR USD USD Cash flows from operating activities: Net Increase/(Decrease) in Net Assets
Attributable to Holders of Redeemable Participating Shares from Operations (1,503,080) (159,073) (1,302,008) (151,389)
Adjustment for: Unrealized exchange (gain)/loss on cash and
cash equivalents (2,529) (85) (704) (1,491) Change in Financial Assets at Fair Value
Through Profit or Loss (20,565,917) (5,834,496) (15,365,715) (6,575,362) Change in Financial Derivative Instruments (37,313) 1,562 (490) (5,284) Change in Margin Cash Due from/to Broker 9,273 (2,910) (7,863) 494 Change in Investments Sold awaiting settlement – (100) (1,952,296) – Change in Dividends Receivable (43,420) (8,048) (23,249) (6,645) Change in Investments Purchased awaiting
settlement 23,330 87,456 – – Change in Management Fees Payable 3,394 613 1,440 675 Change in Capital Gain Tax Payable 33,331 – – – Change in Other Payables 3,715 – – – Net cash flows from operating activities (22,079,216) (5,915,081) (18,650,885) (6,739,002) Cash flows from financing activities: Proceeds from redeemable units issued 22,651,714 6,157,498 18,893,084 6,872,2731
Reinvestments – – – – Redemption of redeemable units (121,523) (141,412) (156,277) (29,911)1
Distributions Paid – – – – Net cash used in financing activities 22,530,191 6,016,086 18,736,807 6,842,362 Net increase in cash and cash equivalents 450,975 101,005 85,922 103,360 Cash and cash equivalents at beginning of the
period – – – – Unrealized exchange gain/(loss) on cash and
cash equivalents 2,529 85 704 1,491 Cash and cash equivalents at end of the period 453,504 101,090 86,626 104,851
* The Sub-Fund launched on 20 March 2018. 1) Includes the exchange of 1,493 Shares of Class P USD Acc for 2,000 Shares of Class P GBP Hedged Acc valued USD9,898. 2) Includes the exchange of 4,200 Shares of Class P USD Acc for 1,510 Shares of Class P GBP Hedged Acc and 2,324 Shares of
Class P CZK Hedged Acc valued USD10,048 and USD10,398, respectively. 3) Includes the exchange of 68,691 Shares of Class A-Acc SDG Hedged for 69,952 Shares of Class A-MDIST(G) SDG Hedged valued
USD516,669.
112

Fidelity UCITS II ICAV STATEMENT OF CASH FLOWS (CONTINUED) FOR THE PERIOD FROM 14 NOVEMBER 2017 (DATE OF REGISTRATION) TO 31 JANUARY 2019
Fidelity MSCI World
Index Fund* Fidelity S&P 500 Index
Fund* Fidelity Enhanced
Reserve Fund†
31 January 2019 31 January 2019 31 January 2019 USD USD USD Cash flows from operating activities: Net Increase/(Decrease) in Net Assets
Attributable to Holders of Redeemable Participating Shares from Operations (1,617,149) (3,328,563) 1,452,819
Adjustment for: Unrealized exchange (gain)/loss on cash and
cash equivalents (1,731) 1,319 (9,312) Distributions Paid – – 499,427 Change in Financial Assets at Fair Value
Through Profit or Loss (47,231,615) (42,215,595) (108,704,015) Change in Financial Derivative Instruments (20,678) (82,476) (328,186) Change in Margin Cash Due from/to Broker (22,872) (3,362) – Change in Investments Sold awaiting settlement (934,448) – (4,387) Change in Dividends Receivable (49,744) (42,609) – Change in Interest Receivable from Financial
Assets Through Fair Value and Profit and Loss – – (775,505) Change in Investments Purchased awaiting
settlement 332 1,821,459 8,479,581 Change in Management Fees Payable 5,246 4,439 49,361 Net cash flows from operating activities (49,872,659) (43,845,388) (99,340,217) Cash flows from financing activities: Proceeds from redeemable units issued 64,813,2732 97,557,033 148,033,3463
Reinvestments – – 55,162 Redemption of redeemable units (14,196,079)2 (53,608,318) (35,309,468)3
Distributions Paid – – (499,427)
Net cash used in financing activities 50,617,194 43,948,715 112,279,613 Net increase in cash and cash equivalents 744,535 103,327 12,939,396 Cash and cash equivalents at beginning of the
period – – – Unrealized exchange gain/(loss) on cash and
cash equivalents 1,731 (1,319) 9,312 Cash and cash equivalents at end of the period 746,266 102,008 12,948,708
* The Sub-Fund launched on 20 March 2018. † The Sub-Fund launched on 26 March 2018. 1) Includes the exchange of 1,493 Shares of Class P USD Acc for 2,000 Shares of Class P GBP Hedged Acc valued USD9,898. 2) Includes the exchange of 4,200 Shares of Class P USD Acc for 1,510 Shares of Class P GBP Hedged Acc and 2,324 Shares of
Class P CZK Hedged Acc valued USD10,048 and USD10,398, respectively. 3) Includes the exchange of 68,691 Shares of Class A-Acc SDG Hedged for 69,952 Shares of Class A-MDIST(G) SDG Hedged valued
USD516,669.
113

Fidelity UCITS II ICAV NOTES TO THE FINANCIAL STATEMENTS FOR THE PERIOD FROM 14 NOVEMBER 2017 (DATE OF REGISTRATION) TO 31 JANUARY 2019
1. Organisation Fidelity UCITS II ICAV (the “Fund”) was registered in Ireland pursuant to the Irish Collective Asset-management Vehicles Act 2015 (as amended) on 14 November 2017 under registration number C174793 and is authorised by the Central Bank of Ireland (the “Central Bank”) under the European Communities (Undertakings for Collective Investment in Transferable Securities) Regulations 2011 (as amended) (the “UCITS Regulations”). The Fund is organised in the form of an umbrella fund with segregated liability between Sub-Funds. The Prospectus provides that the Fund may offer separate Sub-Funds. Each Sub-Fund will have a distinct schedule of investments. The portfolio of assets maintained for each Sub- Fund will be invested in accordance with the investment objectives and policies applicable to such Sub-Fund. For more information please refer to the General Information section. 2. Significant Accounting Policies The significant accounting policies and estimation techniques adopted by each Sub-Fund are as follows: a) Basis of Preparation of Financial Statements The financial statements are prepared in accordance with International Financial Reporting Standards as adopted by European Union (“IFRS”) and certain requirements of the UCITS Regulations and the Central Bank’s (Supervision and Enforcement) Act 2013 (section 48(1)) UCITS Regulations 2015 (as amended) (the “Central Bank UCITS Regulations”) that apply to financial reports. The financial statements have been prepared on the going concern basis and under the historical cost convention, as modified by the revaluation of financial assets and financial liabilities held at fair value through profit or loss. The preparation of financial statements in conformity with IFRS requires the use of certain critical accounting estimates. It also requires the Directors to exercise its judgement in the process of applying each Sub-Fund’s accounting policies. The areas involving a higher degree of judgement or complexity, or areas where assumptions and estimates are significant to each Sub-Fund’s financial statements are disclosed in the following notes. New standards and interpretations On 7 June 2017, the International Accounting Standards Board (“IASB” or the “Board”) issued IFRIC Interpretation 23 — Uncertainty over Income Tax Treatments (the “Interpretation”). The Interpretation clarifies application of recognition and measurement requirements in IAS 12 Income Taxes when there is uncertainty over income tax treatments. The Interpretation is effective for annual reporting periods beginning on or after 1 January 2019, but certain transition reliefs are available. Based on the Sub-Fund’s assessment, this new standard is not expected to have a significant impact on the financial statements of the Sub-Funds or performance. IFRS 16, “Leases”, effective for annual reporting periods beginning on or after 1 January 2019, is to report information that (a) faithfully represents lease transactions and (b) provides a basis for users of financial statements to assess the amount, timing and uncertainty of cash flows arising from leases. To meet that objective, a lessee should recognise assets and liabilities arising from a lease. IFRS 16 introduces a single lessee accounting model and requires a lessee to recognise assets and liabilities for all leases with a term of more than 12 months, unless the underlying asset is of low value. A lessee is required to recognise a right-of-use asset representing its right to use the underlying leased asset and a lease liability representing its obligation to make lease payments. The adoption of this standard is not expected to have a material impact on the financial statements of the Sub-Funds. In addition to the above, a number of new standards, amendments to standards and interpretations have not been applied in preparing these financial statements. The Fund expects no material impact from the adoption of the amendments on its financial position or performance. The Fund is authorised by the Central Bank as a UCITS pursuant to the UCITS Regulations. The period ended 31 January 2019 is the first reporting cycle, and therefore there are no comparatives in the financial statements.
114

Fidelity UCITS II ICAV NOTES TO THE FINANCIAL STATEMENTS FOR THE PERIOD FROM 14 NOVEMBER 2017 (DATE OF REGISTRATION) TO 31 JANUARY 2019 (CONTINUED)
2. Significant Accounting Policies (continued) b) Financial Instruments at Fair Value through Profit or Loss Classification The Sub-Funds classify their financial assets and liabilities at fair value through profit or loss. The category of financial assets and liabilities at fair value through profit or loss is sub-divided into financial assets and liabilities held for trading and those designated at fair value through profit or loss upon initial recognition. Financial assets are classified as held for trading if they are acquired for the purpose of selling in the near term. This category includes equity securities, investments in managed funds, debt instruments, warrants and derivative instruments. These assets are acquired principally for the purpose of generating a profit from short-term fluctuation in price. Derivatives of financial assets are also classified as held for trading. Recognition/Derecognition The Sub-Funds recognise a financial asset or a financial liability when, and only when, it becomes a party to the contractual provisions of the instrument. Purchases and sales of financial assets at fair value through profit or loss are recognised on trade date – the date on which the Sub-Funds commit to purchase or sell the financial instrument. A financial asset (or, where applicable, part of a financial asset or a part of a group of similar financial assets) is derecognised where the rights to receive cash flows from the asset have expired, or the Sub-Fund has transferred its rights to receive cash flow from the asset, or has assumed an obligation to pay the received cash flows in full without material delay to a third party under a pass-through arrangement and either the Sub-Funds have transferred substantially all of the risks and rewards of the asset or Sub-Funds have neither transferred nor retained substantially all the risk and rewards of the asset, but has transferred control of the asset. When the Sub-Funds have transferred their right to receive cash flows from an asset (or has entered into a pass-though arrangement), and have neither transferred nor retained substantially all of the risk and rewards of the asset nor transferred control of the asset, the asset is recognised to the extent of the Sub-Funds’ continuing involvement in the asset. In that case, the Sub-Funds also recognise an associated liability. The transferred asset and the associated liability are measured on a basis that reflects the rights and obligations that the Sub-Funds have retained. The Sub-Funds derecognise a financial liability when the obligation under the liability is discharged, cancelled or expired. Realised fair value gains and losses on disposals of financial instruments are calculated using the average cost method. Realised gains and losses are presented under Net Gain/(Loss) in Financial Assets at fair Value through Profit or Loss and Financial Derivative Instruments at the Statement of Comprehensive Income. Measurement On initial recognition financial assets and financial liabilities at fair value through profit or loss are recorded in the Statement of Financial Position at fair value. Subsequent to initial recognition, all financial assets and financial liabilities at fair value through profit or loss are measured at fair value. Gains and losses arising from changes in the fair value of the ‘financial assets or financial liabilities at fair value through profit or loss’ category are presented in the Statement of Comprehensive Income in the period in which they arise. Determination of fair value For both Index Tracking and Actively Managed Sub-Funds each asset which is quoted, listed or traded on or under the rules of any Recognised Market shall be valued at either the (a) closing bid price, (b) last bid price, (c) last traded price, (d) closing mid-market price, (e) latest mid-market price or (f) the official closing price on the relevant Recognised Market at the close of business on such Recognised Market on each Valuation Day, and the relevant valuation method shall be disclosed in the Relevant Supplement. Prices will be obtained for this purpose by the Administrator from independent sources, such as recognized pricing services or brokers specialising in the relevant markets. If the investment is normally quoted, listed or traded on or under the rules of more than one Recognised Market, the relevant Recognised Market shall be either (a) that which is the main market for the investment or (b) the market which the Manager determines provides the fairest criteria in a value for the security, as the Manager may determine. If prices for an investment quoted, listed or traded on the relevant Recognised Market are not available at the relevant time, or are unrepresentative in the opinion of the Manager, such investment shall be valued at such value as shall be estimated with care and in good faith as the probable realisation value of the investment by a competent professional person, firm or corporation appointed for such purpose by the Manager and approved for the purpose by the Depositary. If the investment is quoted, listed or traded on a Recognised Market but acquired or traded at a premium or discount outside of or off the Recognised Market, the investment shall be valued taking into account the level of premium or discount as of the date of valuation of the instrument.
115

Fidelity UCITS II ICAV NOTES TO THE FINANCIAL STATEMENTS FOR THE PERIOD FROM 14 NOVEMBER 2017 (DATE OF REGISTRATION) TO 31 JANUARY 2019 (CONTINUED)
2. Significant Accounting Policies (continued) b) Financial Instruments at Fair Value through Profit or Loss (continued) Determination of fair value (continued) Neither the Directors or their delegates nor the Depositary shall be under any liability if a price reasonably believed by them to be the (a) closing bid price, (b) last bid price, (c) last traded price, (d) closing mid-market price, (e) latest mid-market price or (f) the official closing price for the time being, may be found not to be such. The value of any investment which is not normally quoted, listed or traded on or under the rules of a Recognised Market, will be valued at its probable realisation value estimated with care and in good faith by the Manager in consultation with the Administrator or by a competent person, firm or corporation appointed by the Manager and approved for such purpose by the Depositary. Cash in hand or on deposit shall be valued at face value together with accrued interest where applicable, unless in the opinion of the Manager (in consultation with the Administrator and the Depositary) any adjustment should be made to reflect the fair value thereof. Derivative instruments (including exchange traded futures, index futures and other financial futures contracts) which are traded on a Recognised Market shall be valued at the settlement price as determined by the relevant Recognised Market at the Valuation Point on such Recognised Market, provided that where it is not the practice of the relevant Recognised Market to quote a settlement price, or if a settlement price is not available for any reason, such instruments shall be valued at their probable realisation value estimated with care and in good faith by the Manager or a competent person appointed by it and approved for the purpose by the Depositary. OTC derivatives will be valued at the probable realisation value estimated with care and in good faith by the Manager in consultation with the Administrator or by a competent person, firm or corporation appointed by the Manager and approved for such purpose by the Depositary. Forward foreign exchange contracts may be valued by reference to freely available market quotations or, if such quotations are not available, in accordance with the provisions in respect of OTC Derivatives. Certificates of deposit shall be valued by reference to the latest available sale price for certificates of deposit of like maturity, amount and credit risk on each Valuation Day or, if such price is not available, at the latest bid price or, if such price is not available or is unrepresentative of the value of such certificate of deposit in the opinion of the Manager, at probable realisation value estimated with care and in good faith by a competent person appointed by the Manager and approved for the purpose by the Depositary. Treasury bills and bills of exchange shall be valued with reference to prices ruling in the relevant markets for such instruments of like maturity, amount and credit risk at close of business on such markets on the relevant Valuation Day. Units or shares in collective investment schemes shall be valued on the basis of the latest available unaudited net asset value per unit or share as published by the collective investment scheme. If units or shares in such collective investment schemes are quoted, listed or traded on or under the rules of any Recognised Market then such units or shares will be valued in accordance with the rules set out above for the valuation of assets which are quoted, listed or traded on or under the rules of any Recognised Market. If such prices are unavailable, the units or shares will be valued at their probable realisation value estimated with care and in good faith by the Manager in consultation with the Administrator or by a competent person, firm or corporation appointed for such purpose by the Manager and approved for the purpose by the Depositary. c) Cash and Cash Equivalents Cash and cash equivalents include cash in hand, deposits held on call with banks, other short-term highly liquid investments with original maturities of three months or less and bank overdrafts. All cash at bank balances are held with Brown Brothers Harriman, or with third party institutions approved by the Manager on overnight deposit or directly with a sub-custodian. All deposits held on call with banks are returned to the Depositary the following day.
116

Fidelity UCITS II ICAV NOTES TO THE FINANCIAL STATEMENTS FOR THE PERIOD FROM 14 NOVEMBER 2017 (DATE OF REGISTRATION) TO 31 JANUARY 2019 (CONTINUED)
2. Significant Accounting Policies (continued) d) Futures Contracts A futures contract is a legal agreement, to buy or sell a particular commodity or financial instrument at a predetermined price at a specified time in the future. Initial margin deposits are made upon entering into open futures contracts and are generally made in cash or cash equivalents. Subsequent payments (variation margin) to and from the clearing broker are made on a daily basis based on changes in the market value of futures contracts. Initial margin and variation margin is presented under Margin Cash Due from Broker or Margin Cash Due to Broker on the Statement of Financial Position. The fair value of open futures contracts is based upon their quoted daily settlement prices. Changes in the value of open futures contracts are recognised as unrealised gains or losses on futures contracts until the contracts are terminated, at which time realised gains and losses are recognised. e) Forward Foreign Exchange Contracts Forward foreign exchange contracts are agreements between two parties to exchange two designated currencies at a specific time in the future. The fair value of open forward foreign exchange contracts is calculated as the difference between the contracted rate and the current forward rate that would close out the contract on the valuation date. Changes in the value of forward foreign exchange contracts are recognised as unrealised gains or losses on forward foreign exchange contracts until the contracts are terminated, at which time realized gains and losses are recognised. A Sub-Fund may use forward foreign exchange contracts for the purposes of hedging the currency exposure of the underlying securities into the relevant base currency or on behalf of a specific class in order to hedge some or all of the foreign exchange risk for such class. For each relevant Sub-Fund, gains or losses on open foreign currency exchange spot contracts are included in Cash and Cash Equivalents in the Statement of Financial Position. Unrealised gains and losses on open forward foreign currency exchange contracts are included in Financial Derivative instruments under assets or liabilities, as appropriate, on the Statement of Financial Position and are shown on the Schedule of Investments of each relevant Sub-Fund. Realised gains and losses and change in unrealised gains and losses on forward foreign currency contracts are included in Net Gain/(Loss) in Financial Assets at Fair Value through Profit or Loss and Financial Derivative Instruments on the Statement of Comprehensive Income. f) Warrants Warrants grant the right to acquire an underlying security from the issuer (as opposed to an option where a third party grants a right to acquire an underlying security as described above) at a fixed price. The fair value of warrants is based upon their quoted daily prices. Changes in the value of warrants and realised gains and losses on warrants are recognised as Net Gain/(Loss) in Financial Assets at fair Value through Profit or Loss and Financial Derivative Instruments on the Statement of Comprehensive Income. A Sub-Fund may hold warrants on securities as a substitute for taking a position in the underlying security and/or to gain an exposure within the limits laid down by the Central Bank.
117

Fidelity UCITS II ICAV NOTES TO THE FINANCIAL STATEMENTS FOR THE PERIOD FROM 14 NOVEMBER 2017 (DATE OF REGISTRATION) TO 31 JANUARY 2019 (CONTINUED)
2. Significant Accounting Policies (continued) g) Foreign Exchange Translation Functional and Presentation Currency Items included in the Sub-Funds’ financial statements are measured using the currency in which Shareholder transactions take place (the “functional currency”). The functional currency and presentation currency of each Sub-Fund is as follows: Sub-Fund Functional currency Presentation currency Fidelity MSCI Emerging Markets Index Fund USD USD Fidelity MSCI Europe Index Fund EUR EUR Fidelity MSCI Japan Index Fund USD USD Fidelity MSCI Pacific ex-Japan Index Fund USD USD Fidelity MSCI World Index Fund USD USD Fidelity S&P 500 Index Fund USD USD Fidelity Enhanced Reserve Fund USD USD Transactions and Balances Assets and liabilities denominated in currencies other than the functional currency are translated into the functional currency at the exchange rates ruling at the Statement of Financial Position date. Transactions in currencies other than the functional currency are translated into the functional currency at the exchange rates ruling at the dates of the transactions. Gains and losses on foreign exchange transactions are recognised in the Statement of Comprehensive Income in determining the result for the period. Proceeds from subscriptions and amounts paid for redemptions in currencies other than the functional currency are translated into the functional currency at the exchange rates prevailing at the dates of the transactions. h) Investments Purchased and Sold Investments purchased and sold represent receivables for securities sold and payables for securities purchased that have been contracted for but not yet settled or delivered on the statement of financial position date respectively. The due from brokers balance is held for collection. These amounts are recognised initially at fair value and subsequently measured at amortised cost. At each reporting date, the Sub-Funds shall measure the loss allowance on amounts due from broker at an amount equal to the lifetime expected credit losses if the credit risk has increased significantly since initial recognition. If, at the reporting date, the credit risk has not increased significantly since initial recognition, the Sub-Funds shall measure the loss allowance at an amount equal to 12-month expected credit losses. Significant financial difficulties of the broker, probability that the broker will enter bankruptcy or financial reorganisation, and default in payments are all considered indicators that a loss allowance may be required if the credit risk increases to the point that it is considered to be credit impaired. During the period ended 31 January 2019 no such impairments have occurred. i) Interest from Financial Assets Through Fair Value and Profit and Loss Interest from financial assets through fair value and profit and loss is recognised on the effective yield interest method and credited to the Statement of Comprehensive Income. j) Dividend Income Dividends are credited to the Statement of Comprehensive Income on the dates on which the relevant securities are listed as “ex-dividend”. Income is shown gross of any non-recoverable withholding taxes and net of any tax credits. Withholding tax is disclosed in the Statement of Comprehensive Income. k) Transaction Costs Transaction costs are costs incurred to acquire financial assets or liabilities at fair value through profit or loss. They include fees and commissions paid to agents, advisers, brokers and dealers. Transaction costs are expensed as incurred in the Statement of Comprehensive Income. l) Expenses Expenses are recognised in the Statement of Comprehensive Income on an accrual basis.
118

Fidelity UCITS II ICAV NOTES TO THE FINANCIAL STATEMENTS FOR THE PERIOD FROM 14 NOVEMBER 2017 (DATE OF REGISTRATION) TO 31 JANUARY 2019 (CONTINUED)
2. Significant Accounting Policies (continued) m) Foreign Withholding Taxes Dividends, interest and capital gains (if any) received on investments made by each Sub-Fund may be subject to withholding taxes imposed by the country from which the investment income/gains are received and such taxes may not be recoverable by the Sub-Funds or their Shareholders. Dividend and interest revenue is shown gross of any non-recoverable withholding taxes, which are disclosed separately in the Statement of Comprehensive Income, and net of any tax credits. n) Redeemable Participating Shares Redeemable participating Shares provide the Shareholders with the right to redeem their shares for cash equal to their proportionate share of the Net Asset Value of the Sub-Funds and, accordingly, are classified as financial liabilities. The liability to Shareholders is presented in the Statement of Financial Position as “Net Assets Attributable to Holders of Redeemable Participating Shares” and is based on the residual assets of each Sub-Fund after deducting all other liabilities. o) Distribution Policy
The Prospectus empowers the Directors to declare dividends in respect of Shares in any Distributing Class out of net income (including dividend income, securities lending income and interest revenue, less expenses) in respect of investments of each Sub-Fund (collectively, “Net Income”) for the Index-Tracking Sub-Funds and out of either, Net Income and capital or Net Income for the Fidelity Enhanced Reserve Fund. The Directors may in their sole discretion, determine that the Fund shall, on behalf of one or more Sub-Funds, apply an equalisation methodology in respect to any Distributing Class Shares. An equalisation account will be maintained for each Sub-Fund so that the amount distributed will be the same for all Shares of each Distributing Class notwithstanding different dates of issue. A sum equal to that part of the subscription issued price of an Distributing Class Share which reflects income (if any) accrued but undistributed up to the date of issue will be deemed to be an equalisation payment and treated as repaid to Shareholders in the relevant Sub-Fund with the first dividend to which the Shareholder was entitled in the same relevant period as that in which the Shares are issued. The redemption price of each Distributing Class Share will also include an equalisation payment in respect of the accrued income of the relevant Sub-Fund up to the Dealing Day on which the relevant Distributing Class Shares are redeemed. Index-Tracking Sub-Funds
In respect of Distributing Classes, and subject to Net Income being available for distribution, it is the current intention of the Directors, subject to any de minimis threshold, to declare dividends out of Net Income attributable to each of the Distributing Classes. Under normal circumstances, the Directors intend that dividends shall be declared on a quarterly basis in or around February, May, August and November of each year and paid on the last Thursday of that relevant month, or any such other Business Day that the Directors deem appropriate. However, Shareholders should note that the Directors may, in their discretion, decide not to make such payment in respect of a Distributing Class.
Fidelity Enhanced Reserve Fund
In respect of Distributing Classes, it is the current intention of the Directors, subject to any de minimis threshold, to declare dividends out of gross income attributable to each of the Distributing Classes. Distributions out of gross income are made up of Net Income and capital. Under normal circumstances, the Directors intend that: (a) in respect of monthly Distributing Classes, dividends shall be declared on the first Business Day of each month and paid on the fifth Business Day of each month, or any such other Business Day that the Directors deem appropriate; and (b) in respect of quarterly Distributing Classes, dividends shall be declared on the first Business Day of and paid on the fifth Business Day of February, May, August and November, or any such other Business Day that the Directors deem appropriate. However, Shareholders should note that the Directors may, in their discretion, decide not to make such payment in respect of a Distributing Class.
119

Fidelity UCITS II ICAV NOTES TO THE FINANCIAL STATEMENTS FOR THE PERIOD FROM 14 NOVEMBER 2017 (DATE OF REGISTRATION) TO 31 JANUARY 2019 (CONTINUED)
2. Significant Accounting Policies (continued) o) Distribution Policy (continued) Dividends for the financial period ended 31 January 2019 are disclosed in the table below:
Distributions are recognised in the Statement of Comprehensive Income as Finance Costs.
Sub-Fund
Ex-Dividend Date
Amount Paid (USD)
Dividend per Share (USD)
Fidelity Enhanced Reserve Fund
Class A-MDIST(G) USD 2 July 2018 5,156 0.0258 1 August 2018 5,156 0.0258 3 September 2018 15,376 0.0258 1 October 2018 18,667 0.0258 1 November 2018 29,042 0.0258 3 December 2018 41,233 0.0258 2 January 2019 42,490 0.0258 Class A-MDIST(G) SGD Hedged 2 July 2018 6,201 0.0189 1 August 2018 6,228 0.019 3 September 2018 6,183 0.0188 1 October 2018 18,062 0.0188 1 November 2018 54,794 0.0187 3 December 2018 77,610 0.0189 2 January 2019 85,757 0.0189 I-QDIST(G) USD 1 August 2018 30,932 0.0774 1 November 2018 30,159 0.0774 Class A-MDIST(G) AUD Hedged 2 July 2018 491 0.019 1 August 2018 495 0.0192 3 September 2018 481 0.0186 1 October 2018 481 0.0186 1 November 2018 478 0.0184 3 December 2018 492 0.019 2 January 2019 312 0.018 Class A-MDIST(G) EUR Hedged 2 July 2018 485 0.0299 1 August 2018 487 0.03 3 September 2018 484 0.0298 1 October 2018 1,839 0.0293 1 November 2018 1,864 0.0293 3 December 2018 4,930 0.0291 2 January 2019 6,255 0.0293 A-MINCOME(G) GBP Hedged 1 October 2018 347 0.0336 1 November 2018 343 0.0333 3 December 2018 3,006 0.0328 2 January 2019 3,098 0.0326 Y-MINCOME(G) USD 2 January 2019 13 0.0258
120

Fidelity UCITS II ICAV NOTES TO THE FINANCIAL STATEMENTS FOR THE PERIOD FROM 14 NOVEMBER 2017 (DATE OF REGISTRATION) TO 31 JANUARY 2019 (CONTINUED)
2. Significant Accounting Policies (continued) p) Income Equalisation In respect of the distributing classes, each Sub-Fund operates equalisation arrangements and makes equalisation payments in respect of each share of such Distributing Classes to reflect the pro rata payment of distributions based on the period of time the share has been owned by a shareholder. Income Equalisation is recognised in the Statement of Comprehensive Income as Finance Costs. q) Dilution Adjustment Large transactions in or out of a Sub-Fund can create “dilution” of the Sub-Fund’s assets because the price at which an investor buys or sells Shares in the Sub-Fund may not entirely reflect the dealing and other costs that arise when the Investment Manager has to trade in underlying investments to accommodate large cash inflows or outflows. In order to counter this and enhance the protection of existing Shareholders, there may be an adjustment to a Sub-Fund’s Net Asset Value as part of the regular valuation process to counter the impact of dealing and other costs on occasions when these are deemed to be significant. On any Dealing Day, the Net Asset Value of a Sub-Fund may be adjusted upwards or downwards as applicable to reflect the costs that may be deemed to be incurred in liquidating or purchasing investments to satisfy net daily transactions of that Sub-Fund. The Directors reserve the right to make such an adjustment taking into account factors such as the estimated dilution costs (such as underlying dealing spreads, commissions and other trading expenses) and the size of the relevant Sub-Fund. In deciding whether to make such an adjustment the Directors will have regard to the interests of existing, continuing and potential Shareholders in the Sub-Fund. The adjustment will be upwards when the net aggregate transactions result in an increase of the number of Shares and will be downwards when the net aggregate transactions result in a decrease of the number of Shares. The adjusted Net Asset Value will be applicable to all transactions on that day. Because the determination of whether to adjust the Net Asset Value is based on the net transaction activity of the Dealing Day, Shareholders transacting in the opposite direction of the Sub-Fund’s net transaction activity may benefit at the expense of the other Shareholders in the Sub-Fund. In addition, the Sub-Fund’s Net Asset Value and short-term performance may experience greater volatility as a result of this adjustment methodology. Dilution adjustment is recognised in the Statement of Financial Position. 3. Cash and Cash Equivalents Cash and Cash Equivalents amount for the Sub-Funds for the financial period end 31 January 2019 is disclosed in the table below:
Sub-Fund Counterparty 31 January 2019 Fidelity MSCI Emerging Markets Index Fund USD Brown Brothers Harriman 107,400 Sumitomo Bank 346,104 Total 453,504 Fidelity MSCI Europe Index Fund EUR Brown Brothers Harriman 3,492 HSBC Bank 97,598 Total 101,090 Fidelity MSCI Japan Index Fund USD Australia & New Zealand Banking Group 27,370 Brown Brothers Harriman (14) Mitsubishi UFJ Financial Group 59,270 Total 86,626 Fidelity MSCI Pacific ex-Japan Index Fund USD Australia & New Zealand Banking Group 85,462 Brown Brothers Harriman 19,389 Total 104,851 Fidelity MSCI World Index Fund USD Australia & New Zealand Banking Group 635,291 Banco Santander 32,786 Brown Brothers Harriman 42,205 HSBC Bank 35,984 Total 746,266
121

Fidelity UCITS II ICAV NOTES TO THE FINANCIAL STATEMENTS FOR THE PERIOD FROM 14 NOVEMBER 2017 (DATE OF REGISTRATION) TO 31 JANUARY 2019 (CONTINUED)
3. Cash and Cash Equivalents (continued)
In line with the Central Bank Guidance paper entitled Umbrella Funds – Cash Accounts Holding Subscription, Redemption and Dividend Monies published in March 2016, one or more Umbrella Cash Accounts at umbrella level in the name of the Fund (each, an "Umbrella Cash Account") are being operated by the Administrator in accordance with the requirements of the Central Bank. Such Umbrella Cash Accounts are designed to hold unprocessed subscription monies received from investors, redemption monies payable to investors and/or other amounts due to investors. As at 31 January 2019, the amount held in these cash accounts was USD1,152,561 on Fidelity Enhanced Reserve Fund. Any balances held on these cash accounts at the financial period end are reflected on the Statement of Financial Position. All cash and cash equivalents balances at the period end are held with Brown Brothers Harriman or with approved counterparties on overnight deposit or directly with a sub-custodian. All deposits held on call with banks are returned to the Depositary the following business day. 4. Margin and Collateral Margin cash due from and due to broker for the Sub-Funds for the financial period ended 31 January 2019 are disclosed in the table below:
There were no cash collateral due from and due to broker for the Sub-Funds for the financial period ended 31 January 2019.
Sub-Fund Counterparty 31 January 2019 Fidelity S&P 500 Index Fund USD Brown Brothers Harriman 1,381 Sumitomo Bank 100,627 Total 102,008 Fidelity Enhanced Reserve Fund USD Australia & New Zealand Banking Group 11,318,869 Brown Brothers Harriman 1,186,081 Citibank 443,758 Total 12,948,708
Sub-Fund / Counterparty Margin Cash Due from Broker Margin Cash Due to Broker Fidelity MSCI Emerging Markets Index Fund USD USD Morgan Stanley - 9,273 Total - 9,273 Fidelity MSCI Europe Index Fund EUR EUR Morgan Stanley 2,910 - Total 2,910 - Fidelity MSCI Japan Index Fund USD USD Morgan Stanley 7,863 - Total 7,863 - Fidelity MSCI Pacific ex-Japan Index Fund USD USD Morgan Stanley - 494 Total - 494 Fidelity MSCI World Index Fund USD USD Morgan Stanley 22,872 - Total 22,872 - Fidelity S&P 500 Index Fund USD USD Morgan Stanley 3,362 - Total 3,362 -
122

Fidelity UCITS II ICAV NOTES TO THE FINANCIAL STATEMENTS FOR THE PERIOD FROM 14 NOVEMBER 2017 (DATE OF REGISTRATION) TO 31 JANUARY 2019 (CONTINUED)
5. Share Capital The Fund may issue up to 500,000,000,002 Shares of no par value. The maximum issued Share capital of the Fund shall be 500,000,000,002 Shares of no par value and the minimum issued Share capital of the Fund shall be €2 represented by two Subscriber Shares of no par value issued for €1 each. The issued share capital of the Fund shall not be less than the currency equivalent of €2 represented by two shares of no par value. The Subscriber Shares entitle the holders to attend and vote at any general meetings of the Fund but do not entitle the holders to participate in the profits or assets of the Fund except for a return of capital on a winding-up. The Shares entitle the holders to attend and vote at general meetings of the Fund and (other than the Subscriber Shares) to participate equally in the profits and assets of the Sub-Fund to which the Shares relate, subject to any differences between fees, charges and expenses applicable to different Classes. The movement in the number of redeemable participating Shares for each Sub-Fund for the financial period ended 31 January 2019 is as follows: Fidelity MSCI Emerging Markets Index Fund
Share Class P EUR Acc P USD AccBeginning Balance - -Shares Issued During Period 1,129,411 3,412,708Shares Redeemed During Period (23,953) (2)Balance at End of Period 1,105,458 3,412,706
Fidelity MSCI Europe Index Fund
Share Class P EUR Acc P USD Acc P EUR Hedged Acc P GBP Hedged AccBeginning Balance - - - -Shares Issued During Period 860,432 1,996 357,762 19,659Shares Redeemed During Period (7,891) - (33,381) (12)Balance at End of Period 852,541 1,996 324,381 19,647
Fidelity MSCI Japan Index Fund
Share Class P EUR Acc P USD Acc P EUR Hedged Acc P GBP Hedged AccBeginning Balance - - - -Shares Issued During Period 470,302 2,994,783 207,067 1,503Shares Redeemed During Period (360,875) (2,020) (6,185) -Balance at End of Period 109,427 2,992,763 200,882 1,503
Fidelity MSCI Pacific ex-Japan Index Fund
Share Class P USD Acc P GBP Hedged AccBeginning Balance - -Shares Issued During Period 1,387,747 1,493Shares Redeemed During Period (6,438) -Balance at End of Period 1,381,309 1,493
Fidelity MSCI World Index Fund
Share Class P EUR Acc P USD Acc P EUR Hedged Acc P GBP Hedged AccBeginning Balance - - - -Shares Issued During Period 3,663,190 8,540,439 8,035 1,516Shares Redeemed During Period (2,642,286) (5,507) - -Balance at End of Period 1,020,904 8,534,932 8,035 1,516
123

Fidelity UCITS II ICAV NOTES TO THE FINANCIAL STATEMENTS FOR THE PERIOD FROM 14 NOVEMBER 2017 (DATE OF REGISTRATION) TO 31 JANUARY 2019 (CONTINUED)
5. Share Capital (continued) Share Class P CZK Hedged AccBeginning Balance -Shares Issued During Period 2,324Shares Redeemed During Period -Balance at End of Period 2,324 Fidelity S&P 500 Index Fund Share Class P EUR Acc P USD Acc P EUR Hedged Acc P GBP Hedged AccBeginning Balance - - - -Shares Issued During Period 1,100,011 7,634,728 821,125 7,607,602Shares Redeemed During Period (635,133) (1,368,621) (241,694) (6,863,732)Balance at End of Period 464,878 6,266,107 579,431 743,870 Fidelity Enhanced Reserve Fund
Share Class A-ACC USDA-MDIST(G)
USDA-MDIST(G) SGD
HedgedI-QDIST(G)
USDBeginning Balance - - - -Shares Issued During Period 5,615,417 2,531,709 6,453,507 399,639Shares Redeemed During Period (2,432,619) (249,184) (411,087) (399,013)Balance at End of Period 3,182,798 2,282,525 6,042,420 626
Share Class A-ACC SGD
HedgedA-MDIST(G) AUD
HedgedA-MDIST(G) EUR
Hedged Y-ACC USDBeginning Balance - - - -Shares Issued During Period 630,427 25,851 264,380 634,442Shares Redeemed During Period (86,284) (8,615) (7,166) (19,482)Balance at End of Period 544,143 17,236 257,214 614,960
Share Class Y-ACC SGD
HedgedA-MINCOME(G)
Hedged GBPY-MINCOME(G)
USDBeginning Balance - - -Shares Issued During Period 26,288 101,161 500Shares Redeemed During Period (9,208) - -Balance at End of Period 17,080 101,161 500
6. Taxation Each Sub-Fund is an investment undertaking as defined in Section 739B of the Taxes Consolidation Act, 1997. The Sub-Funds will not be liable to Irish tax in respect of their income and gains, other than on the occurrence of a chargeable event with respect to Irish resident shareholders. The Fund will be obliged to account for Irish income tax to the Irish Revenue Commissioners if Shares are held by non-exempt Irish resident Shareholders. In accordance with the reporting fund regime introduced by the United Kingdom HM Revenue and Customs, each Share Class will be viewed as a separate “offshore fund” for UK tax purposes. The reporting regime permits an offshore fund to seek advance approval from HM Revenue and Customs to be treated as a reporting fund. Once an offshore fund has been granted “reporting fund” status it will maintain that status for so long as it continues to satisfy the conditions to be a “reporting fund”, which include making reports to HM Revenue and Customs and investors for each period of account, without a requirement to apply for further certification by HM Revenue and Customs. Each Share Class in the Sub-Funds is treated as a “reporting fund”. This has been approved by HM Revenue and Customs. Generally a chargeable event arises on any distribution, redemption, repurchase, cancellation, transfer of Shares by an Irish resident Shareholder or on the ending of a “Relevant Period”.
124

Fidelity UCITS II ICAV NOTES TO THE FINANCIAL STATEMENTS FOR THE PERIOD FROM 14 NOVEMBER 2017 (DATE OF REGISTRATION) TO 31 JANUARY 2019 (CONTINUED)
6. Taxation (continued) A “Relevant Period” for these purposes is an eight year period beginning with the acquisition of the Shares by the Irish resident Shareholder and each subsequent period of eight years beginning immediately after the preceding Relevant Period. A gain on a chargeable event does not arise in respect of:
(i) a Shareholder who is not Irish resident and not ordinarily resident in Ireland at the time of the chargeable event provided the necessary signed statutory declarations are held by the Sub-Fund; or
(ii) certain exempted Irish resident investors who have provided the Sub-Fund with the necessary signed statutory declaration. Capital gains, dividends, and interest received by the Sub-Funds may be subject to withholding taxes imposed by the country of origin and such taxes may not be recoverable by the Sub-Funds or their Shareholders. 7. Fees All of the fees and expenses payable in respect of each Sub-Fund are paid as one single fee. This is referred to as the total expense ratio or “TER”. The Manager is responsible for arranging the payment from the TER of all operational expenses of the Sub-Funds, including Directors’, Auditors’, Legal Advisors’, Administrator’s, Depositary’s and other service providers’ fees and expenses and Class hedging costs. The Manager is entitled to an annual fee in respect of the services that it provides to the Sub-Funds. However, this fee will only be paid in circumstances where there is a residual amount left from the TER after the other operational expenses have been paid. Save where another party has agreed to reimburse the Sub-Funds, the TER includes but is not limited to fees and expenses of the Investment Manager, Depositary, Administrator, Secretary and any sub-investment advisor. Subject to applicable law and regulation, the Manager, the Investment Manager, any Sub-Investment Manager, the Administrator, the Depositary, the General Distributor or any Sub-Distributor may pay part or all of its fees to any person that invests in or provides services to the Fund or in respect of the Sub-Funds. The TER does not include extraordinary costs, transaction costs and related expenses, including but not limited to, transaction charges, stamp duty or other taxes on the investments of the Sub-Funds, including duties and charges for portfolio re-balancing, withholding taxes, commissions and brokerage fees incurred with respect to the Sub-Funds’ investments, interest on borrowings and bank charges incurred in negotiating, effecting or varying the terms of such borrowings, any commissions charged by intermediaries in relation to an investment in the Sub-Funds and such extraordinary or exceptional costs and expenses (if any) as may arise from time to time, such as material litigation in relation to the Sub-Funds or the Fund, which will be paid separately out of the assets of the relevant Sub-Fund. The TER is calculated and accrued daily from the Net Asset Value of the Sub-Funds and payable at least quarterly in arrears. The TER of each Sub-Fund is as listed in the Relevant Supplement. If the Sub-Funds’ expenses exceed the TER outlined above in relation to operating the Sub-Funds, the Manager will cover any shortfall from its own assets. The table below outlines the TER figures applicable to each Sub-Fund:
Sub-Fund
TER (% of Net Asset
Value) Fidelity MSCI Emerging Markets Index Fund
Class P EUR Acc 0.20 Class P USD Acc 0.20
Fidelity MSCI Europe Index Fund Class P EUR Hedged Acc 0.20 Class P GBP Hedged Acc 0.20 Class P EUR Acc 0.10 Class P USD Acc 0.10
Fidelity MSCI Japan Index Fund Class P EUR Hedged Acc 0.20 Class P GBP Hedged Acc 0.20 Class P EUR Acc 0.10 Class P USD Acc 0.10
125

Fidelity UCITS II ICAV NOTES TO THE FINANCIAL STATEMENTS FOR THE PERIOD FROM 14 NOVEMBER 2017 (DATE OF REGISTRATION) TO 31 JANUARY 2019 (CONTINUED)
7. Fees (continued)
Fidelity S&P 500 Index Fund Class P EUR Hedged Acc 0.15 Class P GBP Hedged Acc 0.15 Class P EUR Acc 0.06 Class P USD Acc 0.06
Fidelity Enhanced Reserve Fund Class A-ACC USD 0.60 Class A-MDIST(G) USD 0.60 Class A-MDIST(G) SGD Hedged 0.63 Class I-QDIST(G) USD 0.30 Class A-ACC SGD Hedged 0.63 Class A-MDIST(G) AUD Hedged 0.63 Class A-MDIST(G) EUR Hedged 0.63 Class Y-ACC USD 0.40 Class Y-ACC SGD Hedged 0.43 Class A-MINCOME(G) GBP Hedged 0.63 Class Y-MINCOME(G)-USD 0.40
Directors’ Fees The aggregate emoluments of the Directors paid by the Manager out of the TER on behalf of the Fund (including expenses) was EUR30,000 which were paid to David Dillon (resigned 23 May 2018) and Denise Kinsella as independent Directors. Auditors’ Remuneration The statutory audit fee (including out-of-pocket expenses incurred by the auditors in connection with their work) paid by the Manager on behalf of the Fund for the period amounted to EUR63,450. There were no other fees paid to the auditors other than the statutory audit fee. 8. Net Asset Value per Redeemable Participating Share The Net Asset Value per redeemable participating share is calculated by dividing the total net assets (as calculated for shareholder dealing purposes) of each Sub-Fund by the number of redeemable participating Shares of that Class in issue.
Sub-Fund
TER (% of Net Asset
Value) Fidelity MSCI Pacific ex-Japan Index Fund
Class P GBP Hedged Acc 0.23 Class P USD Acc 0.13
Fidelity MSCI World Index Fund Class P CZK Hedged Acc 0.22 Class P EUR Hedged Acc 0.22 Class P GBP Hedged Acc 0.22 Class P EUR Acc 0.12 Class P USD Acc 0.12
126

Fidelity UCITS II ICAV NOTES TO THE FINANCIAL STATEMENTS FOR THE PERIOD FROM 14 NOVEMBER 2017 (DATE OF REGISTRATION) TO 31 JANUARY 2019 (CONTINUED)
9. Related Parties Related Party Disclosures In the opinion of the Directors, the list of related parties under IAS 24 “Related Party Transactions”’ is as follows: FIL Limited – the ultimate holding company and fellow subsidiary undertakings namely: (i) FIL Fund Management (Ireland) Limited (ii) FIL Distributors (iii) FIL Investment Management (Hong Kong) (iv) FIL Fondsbank GmbH The Directors of the Fund and their dependents. The Managers and the Investment Manager of Fidelity Enhanced Reserve Fund are related parties to the Fund and receive the fees, as outlined on the Note 7. The amounts payable as at 31 January 2019 are disclosed in the Statement of Financial Position. The following related parties held Shares in the Sub-Funds as at 31 January 2019: Sub-Fund Related Party Shares Held Fidelity MSCI Emerging Markets Index Fund
Class P EUR Acc FIL Fondsbank GmbH FIL Limited
53,356 1,628
Class P USD Acc FIL Fondsbank GmbH FIL Limited
61 2,993,830
Fidelity MSCI Europe Index Fund Class P EUR Hedged Acc FIL Fondsbank GmbH
FIL Limited 2,197 1,626
Class P GBP Hedged Acc FIL Limited 1,424 Class P EUR Acc FIL Fondsbank GmbH
FIL Limited 34,340
808,346 Class P USD Acc FIL Limited 1,996
Fidelity MSCI Japan Index Fund Class P EUR Hedged Acc FIL Fondsbank GmbH
FIL Limited 292
1,629 Class P GBP Hedged Acc FIL Limited 1,503 Class P EUR Acc FIL Fondsbank GmbH
FIL Limited 2,998 1,629
Class P USD Acc FIL Limited 2,992,763 Fidelity MSCI Pacific ex-Japan Index Fund
Class P GBP Hedged Acc FIL Limited 1,493 Class P USD Acc FIL Fondsbank GmbH
FIL Limited 2,815
997,385 Fidelity MSCI World Index Fund
Class CZK Hedged Acc FIL Limited 2,324 Class P EUR Hedged Acc FIL Fondsbank GmbH
FIL Limited 5,106 1,629
Class P GBP Hedged Acc FIL Limited 1,516 Class P EUR Acc FIL Fondsbank GmbH
FIL Limited 206,535
1,629 Class P USD Acc FIL Fondsbank GmbH
FIL Limited 447
3,044,884
127

Fidelity UCITS II ICAV NOTES TO THE FINANCIAL STATEMENTS FOR THE PERIOD FROM 14 NOVEMBER 2017 (DATE OF REGISTRATION) TO 31 JANUARY 2019 (CONTINUED)
9. Related Parties (continued)
10. Transaction Costs Transaction costs are incremental costs that are directly attributable to the acquisition, issue or disposal of the of the financial asset or liability. In order to achieve its investment objective, each Sub-Fund incurs transaction costs in relation to trading activity on its portfolio. These costs may include broker commissions, settlement fees, stamp duties, and financial transaction taxes. For some financial instruments, such as debt securities, repurchase agreements, and forward foreign exchange contracts, transaction costs are embedded in the price of the instruments and are not separately identifiable. Identifiable transaction costs incurred during the period ended 31 January 2019 are recognised as an expense for financial reporting purposes in the Statement of Comprehensive Income. 11. Financial Risk Management Each Sub-Fund may be exposed to market price risk, interest rate risk, credit risk, liquidity risk or currency risk arising from the financial instruments it holds. The Sub-Funds’ overall risk management programme focuses on the unpredictability of financial markets and seeks to minimise potential adverse effects on financial performance. The policies documented below are standard operational practices and are reviewed regularly by the Investment Manager. In certain market conditions, the Investment Manager may apply additional risk procedures to minimise potential adverse effects on the Sub-Funds’ financial performance. The Directors and the Investment Manager perform the financial risk management procedures on behalf of the Fund. a) Global Exposure Under the UCITS Regulations, the Manager employs a risk management process which enables it to accurately monitor and manage the global exposure of the Sub-Funds to financial derivative instruments (“FDI”) (which are a subset of the financial instruments in which the Sub-Funds invest). The Sub-Funds’ global exposure and leverage is calculated using the commitment approach and the Sub-Funds’ global exposure will not exceed 100% of Net Asset Value. The commitment approach converts the Sub-Funds’ FDI positions into the equivalent positions in the underlying assets and seeks to ensure that the FDI risk is monitored in terms of any future “commitments” to which it is (or may be) obligated.
Sub-Fund Related Party Shares Held Fidelity S&P 500 Index Fund
Class P EUR Hedged Acc FIL Fondsbank GmbH FIL Limited
2,582 1,630
Class P GBP Hedged Acc FIL Limited 1,427 Class P EUR Acc FIL Fondsbank GmbH
FIL Limited 87,391 1,630
Class P USD Acc FIL Fondsbank GmbH 18,342 Fidelity Enhanced Reserve Fund
Class A-ACC USD FIL Limited 614 Class A-MDIST(G) USD FIL Limited 430 Class A-MDIST(G) SGD Hedged FIL Limited 12,635 Class I-QDIST(G) USD FIL Limited 626 Class A-ACC SGD Hedged FIL Limited 13,555 Class A-MDIST(G) AUD Hedged FIL Limited 17,236 Class A-MDIST(G) EUR Hedged FIL Limited 9,055 Class Y-ACC USD FIL Limited 500 Class Y-ACC SGD Hedged FIL Limited 17,080 Class A-MINCOME(G) GBP Hedged FIL Limited 7,768 Class Y-MINCOME(G)-USD FIL Limited 500
128

Fidelity UCITS II ICAV NOTES TO THE FINANCIAL STATEMENTS FOR THE PERIOD FROM 14 NOVEMBER 2017 (DATE OF REGISTRATION) TO 31 JANUARY 2019 (CONTINUED)
11. Financial Risk Management (continued) b) Market Risk This risk comprises of three main types of risk: market price risk, currency risk and interest rate risk. i) Market Price Risk For Sub-Funds which invest in equities, the value of those equities may fluctuate, sometimes dramatically, in response to the activities and results of individual companies or because of general market and economic conditions or other events. Currency exchange rate movements will also cause changes in value when the currency of the investment is other than the Base Currency of the Sub-Fund holding that investment. The Sub-Funds policy is to manage market price risk through diversification and selection of securities and other financial instruments within specified limits set by the Board of Directors. The following sensitivity analysis assumes a change in the market price of investments while holding all other variables constant. In practice this is unlikely to occur, and changes in some of the variables may be correlated. In addition, as the sensitivity analysis uses historical data as a basis for determining future events, it does not encompass all possible scenarios, particularly those that are of an extreme nature. The Investment Manager deems the percentage used applicable for the Sub-Funds’ analysis. i) Market Price Risk (continued)
Sub-Fund % change
31 January 2019Effect on NAV
31 January 2019Fidelity MSCI Emerging Markets Index Fund (USD) 5% 1,030,162Fidelity MSCI Europe Index Fund (EUR) 5% 291,728Fidelity MSCI Japan Index Fund (USD) 5% 768,184Fidelity MSCI Pacific ex-Japan Index Fund (USD) 5% 329,030Fidelity MSCI World Index Fund (USD) 5% 2,362,603Fidelity S&P 500 Index Fund (USD) 5% 2,110,992Fidelity Enhanced Reserve Fund (USD) 5% 5,435,201
ii) Currency Risk The Sub-Funds’ total return and Statement of Financial Position can be significantly affected by foreign exchange rate movements if the Sub-Funds’ assets and income are denominated in currencies other than the Base Currency of the Sub-Funds and this means that currency movements may significantly affect the Sub-Funds’ Net Asset Value per Share. The three principal areas of foreign currency risk are where movements in exchange rates affect the value of investments, short term timing differences or income received.
129

Fidelity UCITS II ICAV NOTES TO THE FINANCIAL STATEMENTS FOR THE PERIOD FROM 14 NOVEMBER 2017 (DATE OF REGISTRATION) TO 31 JANUARY 2019 (CONTINUED)
11. Financial Risk Management (continued) b) Market Risk (continued) ii) Currency Risk (continued) The tables below set out the Sub-Funds’ total exposure to foreign currency at the period ended 31 January 2019, including sensitivity analysis. Fidelity MSCI Emerging Markets Index Fund
Monetary
AssetsNon-Monetary
AssetsMonetaryLiabilities
Non-Monetary Liabilities Total
Currency Exposure5% Sensitivity
Currency USD USD USD USD USDAED 14,136 136,149 - - 150,285 707BRL 27,208 1,657,418 (5,848) - 1,678,778 1360CLP 539 235,241 - - 235,780 27CNH - 107,907 - - 107,907 -CNY 600 - - - 600 30COP 613 84,806 - - 85,419 31CZK 2,898 34,348 - - 37,246 145EUR 13,494 44,016 (152) - 57,358 675HKD 249 4,727,736 - - 4,727,985 12HUF 466 65,592 - - 66,058 23IDR 2,792 473,412 - - 476,204 140INR 9,557 1,738,843 (2,607) - 1,745,793 478KRW 38,182 2,866,090 (2,772) - 2,901,500 1909MXN 2,487 581,427 (4,064) - 579,850 124MYR 3,283 467,064 - - 470,347 164PHP 364 224,831 - - 225,195 18PKR 2,303 8,953 - - 11,256 115PLN 9,507 24,6798 - - 256,305 475QAR 3,726 215,783 - - 219,509 186RUB - 686,615 - - 686,615 -THB 2,973 500,985 - - 503,958 149TRY 11,494 141,633 (3,941) - 149,186 575TWD 620 2,182,573 - - 2,183,193 31ZAR 2,769 1,326,988 (3,946) - 1,325,811 138 Fidelity MSCI Europe Index Fund
Monetary
AssetsNon-Monetary
AssetsMonetaryLiabilities
Non-Monetary Liabilities Total
Currency Exposure5% Sensitivity
Currency USD USD USD USD USDCHF 784 815,349 (10,602) (22) 805,509 39DKK 42 158,908 (1,069) - 157,881 2GBP 5,686 1,610,105 (24,281) (3,887) 1,587,623 284NOK 103 70,202 (2,054) (149) 68,102 5SEK 53 254,691 (3,160) (10) 251,574 3USD 346 32,239 (1,147) (3) 31,435 17
130

Fidelity UCITS II ICAV NOTES TO THE FINANCIAL STATEMENTS FOR THE PERIOD FROM 14 NOVEMBER 2017 (DATE OF REGISTRATION) TO 31 JANUARY 2019 (CONTINUED)
11. Financial Risk Management (continued) b) Market Risk (continued) ii) Currency Risk (continued) Fidelity MSCI Japan Index Fund
Monetary
AssetsNon-Monetary
AssetsMonetaryLiabilities
Non-Monetary Liabilities Total
Currency Exposure5% Sensitivity
Currency USD USD USD USD USDJPY 2,019,288 15,365,715 - (2,046) 17,382,957 100,964 Fidelity MSCI Pacific ex-Japan Index Fund
Monetary
AssetsNon-Monetary
AssetsMonetaryLiabilities
Non-Monetary Liabilities Total
Currency Exposure5% Sensitivity
Currency USD USD USD USD USDAUD 78,039 3,622,421 - (75) 3,700,385 3,902GBP 324 - - - 324 16HKD 1,999 1,935,171 - - 1,937,170 100SDG 8,954 724,074 - (9) 733,019 448NZD 7,203 120,836 - (4) 128,035 360 Fidelity MSCI World Index Fund
Monetary
AssetsNon-Monetary
AssetsMonetaryLiabilities
Non-Monetary Liabilities Total
Currency Exposure5% Sensitivity
Currency USD USD USD USD USDAUD 36,538 1,133,495 - (22) 1,170,011 1,827CAD 54,987 1,659,877 - (22) 1,714,842 2,749CHF 37,965 1,410,028 - (2) 1,447,991 1,898CZK - 1 - - 1 -DKK 6,413 280,136 - (2) 286,547 321EUR 144,513 5,104,906 - (43) 5,249,376 7,226GBP 97,497 2,773,532 - (57) 2,870,972 4,875HKD 26,203 584,805 - (1) 611,007 1,310ILS 2,250 44,170 - (1) 46,419 113JPY 128,095 4,020,404 - (22) 4,148,477 6,405NOK 3,576 116,442 - (2) 120,016 179NZD 3,527 36,176 - (1) 39,702 176SEK 16,255 438,662 - - 454,917 813SGD 9,308 218,913 - (3) 228,218 465 Fidelity S&P 500 Index Fund
Monetary
AssetsNon-Monetary
AssetsMonetaryLiabilities
Non-Monetary Liabilities Total
Currency Exposure5% Sensitivity
Currency USD USD USD USD USDEUR - - (15) - (15) -GBP 766 - - - 766 38
131

Fidelity UCITS II ICAV NOTES TO THE FINANCIAL STATEMENTS FOR THE PERIOD FROM 14 NOVEMBER 2017 (DATE OF REGISTRATION) TO 31 JANUARY 2019 (CONTINUED)
11. Financial Risk Management (continued) b) Market Risk (continued) ii) Currency Risk (continued) Fidelity Enhanced Reserve Fund
Monetary
AssetsNon-Monetary
AssetsMonetaryLiabilities
Non-Monetary Liabilities Total
Currency Exposure5% Sensitivity
Currency USD USD USD USD USDCNH 2,297,484 - (1,243,583) (62,085) 991,816 114,874CNY 1,073,641 395 - (248) 1,073,788 53,682EUR 576,948 - - (3,219) 573,729 28,847GBP - 17,776 - (186) 17,590 -HKD 1,927,278 1,056 - (1,373) 1,926,961 96,364
iii) Interest Rate Risk Interest rate risk arises from the effects of fluctuations in the prevailing levels of market interest rates on the fair value of financial assets and future cash flows. The majority of the Index Tracking Sub-Funds’ financial assets and liabilities are non-interest bearing as at 31 January 2019. As a result, the Index Tracking Sub Funds are not subject to significant amounts of risk due to fluctuations in the prevailing levels of market interest rates. The interest rate risk profile of financial assets and financial liabilities of the Fidelity Enhanced Reserve Fund by the maturity date was as follows: As at 31 January 2019
Up to 1 year 1 - 5 years Over 5 years Non Interest
Bearing Total Assets Cash and Cash Equivalents 11,762,903 - - 1,185,805 12,948,708 Financial assets at Fair Value Through
Profit or Loss 31,087,990 68,551,951 5,959,060 3,105,014 108,704,015 Financial Derivative Instruments - - - 398,015 398,015 Receivable for investments sold - - - 4,387 4,387 Other assets - - - 1,812,943 1,812,943 Total Assets 42,850,893 68,551,951 5,959,060 6,506,164 123,868,068 Liabilities Financial Derivative Instruments - - - 69,829 69,829 Payable for investments purchased - - - 8,479,581 8,479,581 Other liabilities - - - 51,691 51,691 Total Liabilities excluding net assets
attributable to Unitholders - - - 8,601,101 8,601,101
132

Fidelity UCITS II ICAV NOTES TO THE FINANCIAL STATEMENTS FOR THE PERIOD FROM 14 NOVEMBER 2017 (DATE OF REGISTRATION) TO 31 JANUARY 2019 (CONTINUED)
11. Financial Risk Management (continued) c) Credit Risk Each Sub-Fund may be exposed to credit risk, which is the risk that a counterparty will be unable to pay amounts in full when they fall due. Impairment provisions are provided for losses that have been incurred by the Statement of Financial Position date, if any. The main concentration to which each Sub-Fund is exposed arises from each Sub-Fund’s investments in derivative instruments. Each Sub-Fund is also exposed to counterparty credit risk on the cash and cash equivalents, amounts due from brokers and other receivable balances. The Index Tracking Sub-Funds invest in equity securities and have limited or no credit risk on their investments. The Fidelity Enhanced Reserve Fund invests in debt securities and this Sub-Fund may be exposed to losses resulting from default of issuers or borrowers of debt which this Sub-Fund holds. As at 31 January 2019, the institutions where the Sub-Funds’ cash was held and their respective short term credit ratings, as rated by Fitch, are listed below: Institution Short Term Credit Indicator Australia & New Zealand Banking Group F1+ Banco Santander F1 Brown Brothers Harriman F1 Citibank F1+ HSBC Bank F1+ Mitsubishi UFJ Financial Group F1 Sumitomo Bank F1 All cash at bank balances at the period end are held with Brown Brothers Harriman on segregated accounts or swept to overnight time deposits held on pooled accounts in eligible institutions. The Fidelity Enhanced Reserve Fund has the following exposure to issuer credit risk: Security ratings, if any, are obtained from S&P/Moody’s/Fitch Investor Service. As at 31 January 2019
Rating % of Investments AAA 10.04 AA 11.00 A 29.77 BBB 25.21 BB 5.24 B 13.11 Not Rated 5.63 Total 100.00
133

Fidelity UCITS II ICAV NOTES TO THE FINANCIAL STATEMENTS FOR THE PERIOD FROM 14 NOVEMBER 2017 (DATE OF REGISTRATION) TO 31 JANUARY 2019 (CONTINUED)
11. Financial Risk Management (continued) d) Liquidity Risk In normal market conditions the assets of each Sub-Fund comprise mainly realisable investments which can be readily sold. Each Sub-Fund’s main liability is the redemption of any Shares that investors wish to sell. In general, the investments, including cash, of each Sub-Fund are managed so that it can meet its liabilities. Investments held may need to be sold if insufficient cash is available to finance such redemptions. If the size of the disposals are sufficiently large, or the market is illiquid, then there is a risk that either the investments might not be sold or the price at which they are sold may adversely affect the Net Asset Value of the Sub-Funds. The Investment Manager employs an appropriate liquidity risk management process, which takes into account efficient portfolio management transactions employed by the Sub-Funds, in order to ensure that the Sub-Funds are able to comply with their stated redemption obligations. However, it is possible that in the type of circumstances described above, the Sub-Funds may not be able to realise sufficient assets to meet all redemption requests that they receive or the Sub-Funds may determine that the circumstances are such that meeting some or all of such requests is not in the best interests of the Shareholders. The tables below analyse the Sub-Funds’ financial liabilities into relevant maturity groupings based on the remaining period at the Statement of Financial Position date to the contractual maturity date. The amounts in the table below are the contractual undiscounted cash flows. Detailed analyses of the Sub-Funds’ assets are not shown as they are considered liquid based on the fact that they could be converted to cash in less than one month at close to their carrying value. Fidelity MSCI Emerging Markets Index Fund
As at 31 January 2019
Less than orequal to 1 month
USD
More than 1 month
USDTotalUSD
Futures Margin Cash Due to Broker 9,273 – 9,273Payable for shares redeemed 64 – 64Capital Gain Tax Payable 33,331 – 33,331Investments Purchased 23,330 – 23,330Other payables 3,715 – 3,715Management Fees Payable 3,394 – 3,394Redeemable Participating Shares 21,063,724 – 21,063,724Total Financial Liabilities 21,136,831 – 21,136,831
Fidelity MSCI Europe Index Fund
As at 31 January 2019
Less than orequal to 1 month
EUR
More than 1 month
EURTotalEUR
Financial Derivative Instruments 4,300 – 4,300Payable for shares redeemed 64,757 – 64,757Investments Purchased 87,456 – 87,456Management Fees Payable 613 – 613Redeemable Participating Shares 5,883,527 – 5,883,527Total Financial Liabilities 6,040,653 – 6,040,653
134

Fidelity UCITS II ICAV NOTES TO THE FINANCIAL STATEMENTS FOR THE PERIOD FROM 14 NOVEMBER 2017 (DATE OF REGISTRATION) TO 31 JANUARY 2019 (CONTINUED)
11. Financial Risk Management (continued) d) Liquidity Risk (continued) Fidelity MSCI Japan Index Fund
As at 31 January 2019
Less than orequal to 1 month
USD
More than 1 month
USDTotalUSD
Financial Derivative Instruments – 2,046 2,046Payable for shares redeemed 1,913,598 – 1,913,598Management Fees Payable 1,440 – 1,440Redeemable Participating Shares 15,521,201 – 15,521,201Total Financial Liabilities 17,436,239 2,046 17,438,285
Fidelity MSCI Pacific ex-Japan Index Fund
As at 31 January 2019
Less than orequal to 1 month
USD
More than 1 month
USDTotalUSD
Financial Derivative Instruments 88 – 88Futures Margin Cash Due to Broker 494 – 494Management Fees Payable 675 – 675Redeemable Participating Shares 6,690,973 – 6,690,973Total Financial Liabilities 6,692,230 – 6,692,230
Fidelity MSCI World Index Fund
As at 31 January 2019
Less than orequal to 1 month
USD
More than 1 month
USDTotalUSD
Financial Derivative Instruments 192 – 192Payable for shares redeemed 1,212,194 – 1,212,194Investments Purchased 332 – 332Management Fees Payable 5,246 – 5,246Redeemable Participating Shares 47,859,980 – 47,859,980Total Financial Liabilities 49,077,944 – 49,077,944
Fidelity S&P 500 Index Fund
As at 31 January 2019
Less than orequal to 1 month
USD
More than 1 month
USDTotalUSD
Financial Derivative Instruments 136,618 – 136,618Payable for shares redeemed 77,050 – 77,050Investments Purchased 1,821,459 – 1,821,459Management Fees Payable 4,439 – 4,439Redeemable Participating Shares 42,434,959 – 42,434,959Total Financial Liabilities 44,474,525 – 44,474,525
135

Fidelity UCITS II ICAV NOTES TO THE FINANCIAL STATEMENTS FOR THE PERIOD FROM 14 NOVEMBER 2017 (DATE OF REGISTRATION) TO 31 JANUARY 2019 (CONTINUED)
11. Financial Risk Management (continued) d) Liquidity Risk (continued) Fidelity Enhanced Reserve Fund
As at 31 January 2019
Less than orequal to 1 month
USD
More than 1 month
USDTotalUSD
Financial Derivative Instruments – 69,829 69,829Payable for shares redeemed 2,330 – 2,330Investments Purchased 8,479,581 – 8,479,581Management Fees Payable 49,361 – 49,361Redeemable Participating Shares 115,266,967 – 115,266,967Total Financial Liabilities 123,798,239 69,829 123,868,068
e) Capital Risk Management The capital of each Sub-Fund is represented by the Net Assets Attributable to Holders of Redeemable Shares. The amount of Net Assets Attributable to Holders of redeemable Shares is subject to subscriptions and redemptions at the discretion of the Shareholders as well as changes resulting from the Sub-Fund’s performance. The Investment Manager’s objective when managing capital is to safeguard each Sub-Fund’s ability to continue as a going concern in order to provide returns for Shareholders, provide benefits to other stakeholders and maintain a strong capital base to support the development of the investment activities of the Sub-Fund. In order to maintain the capital structure, the Investment Manager’s policy is to perform the following: • monitor liquidity relative to the assets under management and the dealing cycle; • make appropriate adjustments to distributions the Sub-Funds pay to redeeming Shareholders; and • redeem and issue new Shares in accordance with the Prospectus which permits the restriction of redemptions in certain circumstances and require certain minimum holdings and subscriptions. f) Fair Value Estimation Each Sub-Fund has classified fair value measurements using a fair value hierarchy that reflects the significance of the inputs used in making the measurements. The fair value hierarchy has the following levels: (i) Level 1: Investments whose values are based on quoted market prices in active markets and are therefore classified within level 1 include equities listed on an active stock exchange, U.S. government treasury bills and certain non-U.S. sovereign obligations. Quoted prices for these instruments are not adjusted. (ii) Level 2: Financial instruments that trade in markets that are not considered to be active but are valued based on quoted market prices, dealer quotations or alternative pricing sources supported by observable inputs are classified within level 2. These include investment-grade corporate bonds and certain non-U.S. sovereign obligations and over the counter derivatives. As level 2 investments include positions that are not traded in active markets and/or are subject to transfer restrictions, valuations may be adjusted to reflect illiquidity and/or non-transferability, which are generally based on available market information. (iii) Level 3: Investments classified within level 3 have significant unobservable inputs, as they trade infrequently. Level 3 instruments include certain corporate debt securities. As observable prices are not available for these securities, the Sub-Funds have used valuation techniques to derive the fair value. The level in the fair value hierarchy within which the fair value measurement is categorised in its entirety is determined on the basis of the lowest level input that is significant to the fair value measurement in its entirety. For this purpose, the significance of an input is assessed against the fair value measurement in its entirety. If a fair value measurement uses observable inputs that require significant adjustment based on unobservable inputs, that measurement is a level 3 measurement. Assessing the significance of a particular input to the fair value measurement in its entirety requires judgement, considering factors specific to the financial asset or liability.
136

Fidelity UCITS II ICAV NOTES TO THE FINANCIAL STATEMENTS FOR THE PERIOD FROM 14 NOVEMBER 2017 (DATE OF REGISTRATION) TO 31 JANUARY 2019 (CONTINUED)
11. Financial Risk Management (continued) f) Fair Value Estimation (continued) The determination of what constitutes ‘observable’ requires significant judgment by the Directors. The Directors have delegated this task to the Administrator. The Administrator considers observable data to be that market data that is readily available, regularly distributed or updated, reliable and verifiable, not proprietary, and provided by independent sources that are actively involved in the relevant market. As at 31 January 2019, cash and cash equivalents are classified as Level 1. All other assets and liabilities not measured at fair value but for which fair value is disclosed are classified as Level 2. There were no investments classified at Level 3 at the period ended 31 January 2019. The following tables analyse within the fair value hierarchy of the Sub-Funds’ financial assets and liabilities measured at fair value at 31 January 2019: Fidelity MSCI Emerging Markets Index Fund
31 January 2019 Level 1 Level 2 Level 3 Total USD USD USD USDFinancial Assets at Fair Value Through Profit or Loss
Equities 20,480,805 – – 20,480,805Warrants – 35 – 35Futures 37,313 – – 37,313Transferable Securities 85,077 – – 85,077Total Assets 20,603,195 35 – 20,603,230
Fidelity MSCI Europe Index Fund
31 January 2019 Level 1 Level 2 Level 3 Total EUR EUR EUR EURFinancial Assets at Fair Value Through Profit or Loss
Equities 5,781,642 – – 5,781,642Open Forward Currency Exchange Contracts – 2,668 – 2,668Futures 70 – – 70Transferable Securities 52,854 – – 52,854Total Assets 5,834,566 2,668 – 5,837,234
Financial Liabilities at Fair Value Through Profit or Loss
Open Forward Currency Exchange Contracts – 4,300 – 4,300Total Liabilities – 4,300 – 4,300
137

Fidelity UCITS II ICAV NOTES TO THE FINANCIAL STATEMENTS FOR THE PERIOD FROM 14 NOVEMBER 2017 (DATE OF REGISTRATION) TO 31 JANUARY 2019 (CONTINUED)
11. Financial Risk Management (continued) f) Fair Value Estimation (continued) Fidelity MSCI Japan Index Fund
31 January 2019 Level 1 Level 2 Level 3 Total USD USD USD USDFinancial Assets at Fair Value Through Profit or Loss
Equities 15,176,444 – – 15,176,444Open Forward Currency Exchange Contracts – 2,536 – 2,536Transferable Securities 189,271 – – 189,271Total Assets 15,365,715 2,536 – 15,368,251
Financial Liabilities at Fair Value Through Profit or Loss
Open Forward Currency Exchange Contracts – 2 – 2Futures 2,044 – – 2,044Total Liabilities 2,044 2 – 2,046
Fidelity MSCI Pacific ex-Japan Index Fund
31 January 2019 Level 1 Level 2 Level 3 Total USD USD USD USDFinancial Assets at Fair Value Through Profit or Loss
Equities 6,161,613 – – 6,161,613Open Forward Currency Exchange Contracts – 140 – 140Futures 5,232 – – 5,232Transferable Securities 413,749 – – 413,749Total Assets 6,580,594 140 – 6,580,734
Financial Liabilities at Fair Value Through Profit or Loss
Open Forward Currency Exchange Contracts – 88 – 88Total Liabilities – 88 – 88
Fidelity MSCI World Index Fund
31 January 2019 Level 1 Level 2 Level 3 Total USD USD USD USDFinancial Assets at Fair Value Through Profit or Loss
Equities 46,041,016 – – 46,041,016Warrants – 7 – 7Open Forward Currency Exchange Contracts – 420 – 420Futures 20,450 – – 20,450Transferable Securities 1,190,592 – – 1,190,592Total Assets 47,252,058 427 – 47,252,485
Financial Liabilities at Fair Value Through Profit or Loss
Open Forward Currency Exchange Contracts – 192 – 192Total Liabilities – 192 – 192
138

Fidelity UCITS II ICAV NOTES TO THE FINANCIAL STATEMENTS FOR THE PERIOD FROM 14 NOVEMBER 2017 (DATE OF REGISTRATION) TO 31 JANUARY 2019 (CONTINUED)
11. Financial Risk Management (continued) f) Fair Value Estimation (continued) Fidelity S&P 500 Index Fund
31 January 2019 Level 1 Level 2 Level 3 Total USD USD USD USDFinancial Assets at Fair Value Through Profit or Loss
Equities 40,960,131 – – 40,960,131Open Forward Currency Exchange Contracts – 214,856 – 214,856Futures 4,238 – – 4,238Transferable Securities 1,255,464 – – 1,255,464Total Assets 42,219,833 214,856 – 42,434,689
Financial Liabilities at Fair Value Through Profit or Loss
Open Forward Currency Exchange Contracts – 136,618 – 136,618Total Liabilities – 136,618 – 136,618
Fidelity Enhanced Reserve Fund
31 January 2019 Level 1 Level 2 Level 3 Total USD USD USD USDFinancial Assets at Fair Value Through Profit or Loss
Asset-Backed Securities – 321,463 – 321,463Certificates of Deposits – 4,986,862 – 4,986,862Commercial Papers – 2,981,864 – 2,981,864Corporate Bonds – 79,058,868 – 79,058,868Open Forward Currency Exchange Contracts – 398,015 – 398,015Government Bonds 13,944,922 4,305,022 – 18,249,944Transferable Securities – 3,105,014 – 3,105,014Total Assets 13,944,922 95,157,108 – 109,102,030
Financial Liabilities at Fair Value Through Profit or Loss
Open Forward Currency Exchange Contracts – 69,829 – 69,829Total Liabilities – 69,829 – 69,829
g) Cybersecurity Risk The Fund and its service providers (including the Investment Manager) are susceptible to cyber-attacks and technological malfunctions that may have effects that are similar to those of a cyber-attack. Cyber-attacks include, among others, stealing or corrupting data maintained online or digitally, preventing legitimate users from accessing information or services on a website, releasing confidential information without authorisation, and causing operational disruption. Successful cyber-attacks against, or security breakdowns of, the Fund, the Investment Manager, or the Depositary, or other service provider may adversely affect the Sub-Funds or their Shareholders. For instance, cyber-attacks may interfere with the processing of Shareholder transactions, affect the Fund’s ability to calculate its Net Asset Value, cause the release or misappropriation of private Shareholder information or confidential Sub-Fund information, impede trading, cause reputational damage, and subject the Fund to regulatory fines, penalties or financial losses, reimbursement or other compensation costs, and additional compliance costs. The Manager and the Investment Manager have established business continuity plans and systems designed to prevent cyber-attacks. Such plans and systems are subject to inherent limitations. Similar types of cyber security risks also are present for issuers of securities in which the Sub-Funds invest, which could result in material adverse consequences for such issuers, and may cause the Sub-Funds’ investments in such securities to lose value.
139

Fidelity UCITS II ICAV NOTES TO THE FINANCIAL STATEMENTS FOR THE PERIOD FROM 14 NOVEMBER 2017 (DATE OF REGISTRATION) TO 31 JANUARY 2019 (CONTINUED)
11. Financial Risk Management (continued) h) Offsetting The Sub-Funds are required to disclose the impact of offsetting assets and liabilities represented in the statement of financial position to enable users of the financial statements to evaluate the effect or potential effect of netting arrangements on its financial position for recognized assets and liabilities. These recognized assets and liabilities are derivative instruments that are either subject to an enforceable master netting arrangement or similar agreement or meet the following right of set-off criteria: the amounts owed by a Sub-Fund to another party are determinable, the Sub-Fund has the right to set-off the amounts owed with the amounts owed by the other party, the Sub-Fund intends to set-off on a net basis, and the Sub-Funds right of set-off is enforceable at law. For financial reporting purposes, the Sub-Funds do not offset derivative assets and derivative liabilities in the statement of financial position.
Fidelity MSCI Europe Index Fund
31 January 2019
Counterparty
DerivativeAssets
EUR
DerivativeLiabilities
EUR
Net DerivativeAssets (Liabilities)
EUR
Collateral(Received) Pledged
EURNet Amount
EURBrown Brothers Harriman 2,668 (4,300) (1,632) - (1,632)Total 2,668 (4,300) (1,632) - (1,632)
Fidelity MSCI Japan Index Fund
31 January 2019
Counterparty
DerivativeAssets
USD
DerivativeLiabilities
USD
Net DerivativeAssets (Liabilities)
USD
Collateral(Received) Pledged
USDNet Amount
USDBrown Brothers Harriman 2,536 (2) 2,534 - 2,534Total 2,536 (2) 2,534 - 2,534
Fidelity MSCI Pacific ex-Japan Index Fund
31 January 2019
Counterparty
DerivativeAssets
USD
DerivativeLiabilities
USD
Net DerivativeAssets (Liabilities)
USD
Collateral(Received) Pledged
USDNet Amount
USDBrown Brothers Harriman 140 (88) 52 - 52Total 140 (88) 52 - 52
Fidelity MSCI World Index Fund
31 January 2019
Counterparty
DerivativeAssets
USD
DerivativeLiabilities
USD
Net DerivativeAssets (Liabilities)
USD
Collateral(Received) Pledged
USDNet Amount
USDBrown Brothers Harriman 420 (192) 228 - 228Total 420 (192) 228 - 228
Fidelity S&P 500 Index Fund
31 January 2019
Counterparty
DerivativeAssets
USD
DerivativeLiabilities
USD
Net DerivativeAssets (Liabilities)
USD
Collateral(Received) Pledged
USDNet Amount
USDBrown Brothers Harriman 214,856 (136,618) 78,238 - 78,238Total 214,856 (136,618) 78,238 - 78,238
140

Fidelity UCITS II ICAV NOTES TO THE FINANCIAL STATEMENTS FOR THE PERIOD FROM 14 NOVEMBER 2017 (DATE OF REGISTRATION) TO 31 JANUARY 2019 (CONTINUED)
11. Financial Risk Management (continued) h) Offsetting (continued)
Fidelity Enhanced Reserve Fund
31 January 2019
Counterparty
DerivativeAssets
USD
DerivativeLiabilities
USD
Net DerivativeAssets (Liabilities)
USD
Collateral(Received) Pledged
USDNet Amount
USDBrown Brothers Harriman 396,564 (29,931) 366,633 - 366,633HSBC Bank 1,451 (39,898) (38,447) - (38,447)Total 398,015 (69,829) 328,186 - 328,186
12. Exchange Rates The following exchange rates have been used to translate assets and liabilities in currencies other than functional currency of the Sub-Funds: 31 January 2019 FX to USD FX to EURAustralian Dollar 1.3715 -Brazilian Real 3.6428 -British Pound 0.7616 0.8722Canadian Dollar 1.3133 -Chilean Peso 653.1800 -Chinese Yuan (CNH) 6.7128 -Chinese Renminbi (CNY) 6.7055 -Colombian Peso 3,106.2900 -Czech Koruna 22.4446 -Danish Krone 6.5069 7.4663Euro 0.8714 1Hong Kong Dollar 7.8461 -Hungarian Forint 275.5415 -Indian Rupee 71.1200 -Indonesian Rupiah 13,972.5000 -Israeli New Shekel 3.6333 -Japanese Yen 108.8300 -Malaysian Ringgit 4.0960 -Mexican Peso 19.0283 -New Zealand Dollar 1.4418 -Norwegian Krone 8.4235 9.6655Pakistani Rupee 138.2000 -Philippine Peso 52.1100 -Polish Zloty 3.7137 -Qatari Riyal 3.6413 -Russian Ruble 65.4788 -Soudanese Pound 1.3456 -South African Rand 13.2700 -South Korean Won 1,112.6500 -Swedish Krona 9.0473 10.3812Swiss Franc 0.9921 1.1384Taiwanese New Dollar 30.7215 -Thai Baht 31.2425 -
141

Fidelity UCITS II ICAV NOTES TO THE FINANCIAL STATEMENTS FOR THE PERIOD FROM 14 NOVEMBER 2017 (DATE OF REGISTRATION) TO 31 JANUARY 2019 (CONTINUED)
12. Exchange Rates (continued) 31 January 2019 FX to USD FX to EURTurkish Lira 5.1759 -Emirati Dirham 3.6730 -United States Dollar 1 1.1474 13. Net Gain/(Loss) on Financial Assets and Liabilities at Fair Value through Profit or Loss and Financial Derivative Instruments Net Gain/(Loss) on Financial Assets and Liabilities at Fair Value through Profit or Loss and Financial Derivative Instruments for the financial period ended 31 January 2019 is disclosed in the table below:
31 January 2019 Fidelity MSCI Emerging Markets
Index Fund USD
Fidelity MSCI Europe Index Fund
EUR
Fidelity MSCI Japan Index Fund
USD
Fidelity MSCI Pacific ex-Japan Index Fund
USD Realised and Unrealised Gains/(Losses) on Investments Net Realised (Loss)/Gain on Investments (74,145) 24,413 (147,469) (3,091) Net Realised Loss on Forward Foreign Currency Contracts – (9,865) (39,796) (148) Net Realised Loss on Futures (23,015) (9,190) (13,919) (11,964) Net Realised Currency Loss (44,759) (971) (71,436) (6,017) (141,919) 4,387 (272,620) (21,220) Movement in Unrealised Loss on Investments (1,205,677) (305,281) (1,058,735) (157,701) Movement in Unrealised (Loss)/Gain on Forward Foreign Currency Contracts – (1,632) 2,534 52 Movement in Unrealised Currency Gain/(Loss) on Futures 37,312 70 (2,044) 5,231 Movement in Unrealised Currency (Loss)/Gain (458,685) 26,323 (247,946) (149,483) (1,627,050) (280,520) (1,306,191) (301,901) Net Loss on Financial Assets and Liabilities at Fair Value through Profit or Loss (1,768,969) (276,133) (1,578,811) (323,121)
142

Fidelity UCITS II ICAV NOTES TO THE FINANCIAL STATEMENTS FOR THE PERIOD FROM 14 NOVEMBER 2017 (DATE OF REGISTRATION) TO 31 JANUARY 2019 (CONTINUED)
13. Net Gain/(Loss) on Financial Assets and Liabilities at Fair Value through Profit or Loss and Financial Derivative Instruments (continued)
31 January 2019 Fidelity MSCI World Index Fund
USD
Fidelity S&P 500 Index Fund
USD
Fidelity Enhanced Reserve Fund
USD Realised and Unrealised Gains/(Losses) on Investments Net Realised (Loss)/Gain on Investments (625,826) (2,141,201) 1,865 Net Realised (Loss)/Gain on Forward Foreign Currency Contracts (1,641) (1,459,297) 247,150 Net Realised Loss on Futures (41,527) (64,783) – Net Realised Currency (Loss)/Gain (23,949) 2,633 18,108 (692,943) (3,662,648) 267,123 Movement in Unrealised (Loss)/Gain on Investments (1,286,526) (34,762) 145,047 Movement in Unrealised Gain on Forward Foreign Currency Contracts 228 78,238 328,186 Movement in Unrealised Currency Gain on Futures 20,450 4,237 – Movement in Unrealised Currency (Loss)/Gain (56,877) (1,319) 67,534 (1,322,725) 46,394 540,767 Net (Loss)/Gain on Financial Assets and Liabilities at Fair Value through Profit or Loss (2,015,668) (3,616,254) 807,890
In arriving at the results for the financial period all amounts relate to continuing operations. 14. Soft Commission Agreements There were no soft commission arrangements entered into during the period ended 31 January 2019. 15. Cross-trades The Manager and/or the Investment Manager may enter into trades for the account of a Sub-Fund with: (i) the accounts of other clients managed by the Manager, the Investment Manager or its affiliates; or (ii) their house accounts (i.e., accounts owned by the Manager, the Investment Manager or any of its connected persons over which it can exercise control and influence) (“cross-trades”). Such cross-trades will only be undertaken in accordance with the relevant requirements promulgated by the relevant authorities. For the financial period ended 31 January 2019, the Fidelity Enhanced Reserve Fund entered into the following cross trades: Trade Date Security Name Currency Execution Amount 31/01/2019 Sun Hung Kai Properties Capital Market USD 200,010 27/08/2018 West China Cement USD 202,175
143

Fidelity UCITS II ICAV NOTES TO THE FINANCIAL STATEMENTS FOR THE PERIOD FROM 14 NOVEMBER 2017 (DATE OF REGISTRATION) TO 31 JANUARY 2019 (CONTINUED)
16. Efficient Portfolio Management The Sub-Funds may employ investment techniques and instruments for efficient portfolio management purposes only, subject to the conditions and within the limits from time to time laid down by the Central Bank. Any such technique or instrument must be one which (alone or in combination with one or more other techniques or instruments) is believed by the Investment Manager to be economically appropriate to the efficient portfolio management of the Sub-Fund, i.e. the use of a technique or instrument may only be undertaken for the purposes of one or more of the following: (a) a reduction in risk, (b) a reduction in costs, (c) the generation of additional capital or income for the Sub-Fund with an appropriate level of risk, taking into account the risk profile of the Sub-Fund and the general provisions of the UCITS Regulations. During the financial period ended 31 January 2019, the below Sub-Funds used futures contracts for the purposes of cash equitisation. The exposure, counterparties, and any revenues and costs from using these techniques are all detailed below. Fidelity MSCI Emerging Market Index Fund Exposure obtained through the efficient portfolio management techniques employed were as follows:
Counterparty Type Net Exposure
USD Morgan Stanley Futures Contract 37,313
Revenues and costs arising from the efficient portfolio management techniques employed were as follows:
Futures Contracts Revenues
USD Costs
USD Futures Commission Expense – 186
Net Realised Loss on Futures Contracts (23,016) –
Fidelity MSCI Europe Index Fund Exposure obtained through the efficient portfolio management techniques employed were as follows:
Counterparty Type Net Exposure
EUR Morgan Stanley Futures Contract 70
Revenues and costs arising from the efficient portfolio management techniques employed were as follows:
Futures Contracts Revenues
EUR Costs
EUR Futures Commission Expense – 86
Net Realised Loss on Futures Contracts (9,190) –
144

Fidelity UCITS II ICAV NOTES TO THE FINANCIAL STATEMENTS FOR THE PERIOD FROM 14 NOVEMBER 2017 (DATE OF REGISTRATION) TO 31 JANUARY 2019 (CONTINUED)
16. Efficient Portfolio Management (continued) Fidelity MSCI Japan Index Fund Exposure obtained through the efficient portfolio management techniques employed were as follows:
Counterparty Type Net Exposure
USD Morgan Stanley Futures Contract (2,044)
Revenues and costs arising from the efficient portfolio management techniques employed were as follows:
Futures Contracts Revenues
USD Costs
USD Futures Commission Expense – 142
Net Realised Loss on Futures Contracts (13,919) –
Fidelity MSCI Pacific ex-Japan Index Fund Exposure obtained through the efficient portfolio management techniques employed were as follows:
Counterparty Type Net Exposure
USD Morgan Stanley Futures Contract 5,232
Revenues and costs arising from the efficient portfolio management techniques employed were as follows:
Futures Contracts Revenues
USD Costs
USD Futures Commission Expense – 28
Net Realised Loss on Futures Contracts (11,964) –
Fidelity MSCI World Index Fund Exposure obtained through the efficient portfolio management techniques employed were as follows:
Counterparty Type Net Exposure
USD Morgan Stanley Futures Contract 20,450
Revenues and costs arising from the efficient portfolio management techniques employed were as follows:
Futures Contracts Revenues
USD Costs
USD Futures Commission Expense – 171
Net Realised Loss on Futures Contracts (41,527) –
145

Fidelity UCITS II ICAV NOTES TO THE FINANCIAL STATEMENTS FOR THE PERIOD FROM 14 NOVEMBER 2017 (DATE OF REGISTRATION) TO 31 JANUARY 2019 (CONTINUED)
16. Efficient Portfolio Management (continued) Fidelity S&P 500 Index Fund Exposure obtained through the efficient portfolio management techniques employed were as follows:
Counterparty Type Net Exposure
USD Morgan Stanley Futures Contract 4,238
Revenues and costs arising from the efficient portfolio management techniques employed were as follows:
Futures Contracts Revenues
USD Costs
USD Futures Commission Expense – 131
Net Realised Loss on Futures Contracts (60,783) –
17. Significant Events during the Period a) Class Launches
Fidelity MSCI Emerging Markets Index Fund
Class P EUR Acc., Class P USD Acc. were launched on 20 March 2018.
Fidelity MSCI Europe Index Fund
Class P EUR Acc., Class P USD Acc., Class P EUR Hedged Acc. were launched on 20 March 2018.
Class P GBP Hedged Acc. was launched on 21 June 2018.
Fidelity MSCI Japan Index Fund
Class P EUR Acc., Class P USD Acc., Class P EUR Hedged Acc. were launched on 20 March 2018.
Class P GBP Hedged Acc. was launched on 21 June 2018.
Fidelity MSCI Pacific ex-Japan Index Fund Class P USD Acc. was launched on 20 March 2018.
Class P GBP Hedged Acc. was launched on 21 June 2018.
Fidelity MSCI World Index Fund
Class P EUR Acc., Class P USD Acc., Class P EUR Hedged Acc. were launched on 20 March 2018.
Class P GBP Hedged Acc. was launched on 21 June 2018.
Class P CZK Hedged Acc. was launched on 14 January 2019.
Fidelity S&P 500 Index Fund
Class P EUR Acc., Class P USD Acc., Class P EUR Hedged Acc., Class P GBP Hedged Acc. were launched on 20 March 2018.
146

Fidelity UCITS II ICAV NOTES TO THE FINANCIAL STATEMENTS FOR THE PERIOD FROM 14 NOVEMBER 2017 (DATE OF REGISTRATION) TO 31 JANUARY 2019 (CONTINUED)
17. Significant Events during the Period (continued) a) Class Launches (continued)
Fidelity Enhanced Reserve Fund Class A-ACC USD, Class A-MDIST(G) USD, Class A-MIDST(G) Hedged SGD, Class I-QDIST(G) USD, Class A-MIDST(G) Hedged AUD, Class A-MIDST(G) Hedged EUR, Class A-ACC-SGD Hedged, Class Y-ACC USD, Class Y-ACC-SGD Hedged were launched on 26 March 2018.
Class A-MINCOME(G)-GBP Hedged was launched on 10 August 2018.
Class Y-MINCOME(G) USD was launched on 16 November 2018.
b) Prospectus Updates
Revised Relevant Supplements for the Index Tracking Sub-Funds reflecting changes to disclosure regarding German tax reporting disclosure and the applicable settlement deadline were noted by the Central Bank on 17 January 2018. A revised Relevant Supplement for Fidelity MSCI Pacific ex-Japan Index Fund reflecting the change of the name of the Sub-Fund from “Fidelity MSCI Asia Pacific ex-Japan Index Fund” to “Fidelity MSCI Pacific ex-Japan Index Fund” was noted by the Central Bank of 19 February 2018. Fidelity Enhanced Reserve Fund was approved by the Central Bank as a Sub-Fund of the Fund and a Relevant Supplement for this Sub-Fund was noted by the Central Bank on 15 March 2018. Revised Relevant Supplements for the Index Tracking Sub-Funds of the Fund reflecting the change of the definition of “Business Day” for each Index Sub-Fund and the change of the settlement deadline for Fidelity MSCI Japan Index Fund. A revised Relevant Supplement for Fidelity Enhanced Reserve Fund reflecting the creation of a new “A-MINCOME(G)-GBP Hedged” Share Class and changes in the naming formulation of the existing Share Classes of the Sub-Fund, were noted by the Central Bank on 1 August 2018. The Prospectus for the Fund was updated on 9 November 2018 to reflect various changes, including the inclusion of investment restrictions applicable to Sub-Funds registered in Korea, changes to the disclosure relating to German tax reporting and changes in the composition of the boards of ICAV II and FFMIL. The Relevant Supplements for the Index Tracking Sub-Funds were updated on 9 November 2018 to reflect decreases in the maximum TERs payable in respect of ‘I’ Share Classes and the creation of three new ‘foundation’-type Class SE Share Classes of each of four of the Index Tracking Sub-Funds, namely Fidelity MSCI World Index Fund, Fidelity MSCI Pacific ex-Japan Index Fund, Fidelity MSCI Emerging Markets Index Fund and Fidelity S&P 500 Index Fund, denominated in USD, EUR and GBP to incentivise investment in those Sub-Funds. The Class SE Share Classes are available at a reduced TER until 30 November 2021, when they will be automatically converted into equivalent Class P Share Classes subject to a higher TER. The Relevant Supplement for Fidelity Enhanced Reserve Fund was updated on 9 November 2018 to reflect the creation of a new ‘Y-MINCOME(G)-US’ Share Class. The most recent Supplements and Prospectus are dated 15 March 2019. c) Directors Updates Ms Denise Kinsella was appointed as a Director of the Fund, effective 4 January 2018. Mr David Greco was appointed as a Director of the Fund, effective 4 January 2018. Mr Nick King was appointed as a Director of the Fund, effective 4 January 2018. Ms Catherine Fitzsimons was appointed as a Director of the Fund, effective 22 February 2018. Ms Eímhín Ní Mhuircheartaigh was appointed as a Director of the Fund, effective 26 February 2018.
147

Fidelity UCITS II ICAV NOTES TO THE FINANCIAL STATEMENTS FOR THE PERIOD FROM 14 NOVEMBER 2017 (DATE OF REGISTRATION) TO 31 JANUARY 2019 (CONTINUED)
17. Significant Events during the Period (continued) c) Directors Updates (continued) Mr David Dillon resigned as a Director of the Fund, effective 23 May 2018. Mr Paul Burd resigned as a Director of the Fund, effective 3 August 2018. Ms Denise Kinsella was appointed as a Chairperson, effective 20 August 2018. There were no contingent liabilities during the period ended 31 January 2019. 18. Events since the Period End Following the United Kingdom vote to leave the European Union (“EU”) on 23 June 2016, commonly referred to as “BREXIT”, the Fund and the wider Fidelity International Group have been considering the implications of BREXIT. While at the time of finalisation of these financial statements, the ultimate outcome is still uncertain, the Board of Directors has considered the key risks and possible impacts, including the impact of a “hard” or negative BREXIT outcome. Specific BREXIT related management actions have included availing of the UK regulator FCA Temporary Permission Regime (“TPR”) in March 2019. The Prospectus for the Fund was updated on 15 March 2019 to reflect, among other things, amendments to German tax reporting disclosure and minor updates to fees and expenses disclosure. The Relevant Supplements for the Index Tracking Sub-Funds and Fidelity Enhanced Reserve Fund were updated on 15 march 2019 to reflect the date of the revised Prospectus and updated offer status of Share Classes of the Relevant Sub-Funds. There were no other significant events since the financial period end that require disclosure in these financial statements. 19. Approval of Financial Statements The report for the period from 14 November 2017 (date of registration) to 31 January 2019 and financial statements were approved by the Board of Directors of the Fund on 24 May 2019.
148

Fidelity UCITS II ICAV DIRECTORS’ REPORT
The Directors present, herewith their annual report and audited financial statements for Fidelity UCITS II ICAV (the “Fund”) for the period from 14 November 2017 (date of registration) to 31 January 2019. Statement of Directors’ Responsibilities The Directors are responsible for preparing the annual report and the financial statements in accordance with applicable law and regulations. The Irish Collective Asset-management Vehicles Act 2015 (the “ICAV Act”) as amended requires the Directors to prepare financial statements for each financial period which give a true and fair view of the Fund’s assets, liabilities and financial position as at the end of the financial period and the profit or loss of the Fund for the financial period. The Directors have elected to prepare the financial statements in accordance with applicable Irish law and International Financial Reporting Standards, as adopted by the European Union (“IFRS”). In preparing these financial statements, the Directors are required to: - select suitable accounting policies and then apply them consistently; - make judgements and estimates that are reasonable and prudent;
- state whether the financial statements have been prepared in accordance with applicable accounting standards and identify the standards in question, subject to any material departures from those standards being disclosed and explained in the notes to the financial statements; and - prepare the financial statements on the going concern basis unless it is inappropriate to presume that the Fund will continue in business. The Directors are responsible for keeping adequate accounting records which disclose with reasonable accuracy, at any time, the assets and liabilities and financial position of the Fund and enable them to ensure that the financial statements are prepared in accordance with IFRS and comply with the ICAV Act 2015 and the European Communities (Undertakings for Collective Investment in Transferable Securities) Regulations, 2011 (as amended) (“UCITS Regulations”). They are also responsible for safeguarding the assets of the Fund and hence for taking reasonable steps for the prevention and detection of fraud and other irregularities. The Directors are responsible for the maintenance and integrity of the corporate and financial information included on the Fund’s website. Legislation in Ireland governing the preparation and dissemination of financial statements may differ from legislation in other jurisdictions. The Directors are required to entrust the assets of the Fund to a Depositary for safe-keeping. In carrying out this duty, the Fund has appointed Brown Brothers Harriman Trustee Services (Ireland) Limited as Depositary (the “Depositary”). The Financial Statements are available from website at the following link: https://www.fidelityinternational.com/legal-documents/fund-documents/icav-ii/annual-reports/default.page? Accounting Records The Fund is obliged to keep or cause to be kept adequate accounting records as outlined in Section 110 of the ICAV Act. To achieve this, the Directors have appointed a service organisation Brown Brothers Harriman Fund Administration Services (Ireland) Limited (the “Administrator”). The Fund’s accounting records are retained at the Administrator’s registered office at 30 Herbert Street, Dublin 2, Ireland. Principal Activities and Review of Business The Fund was registered in Ireland on 14 November 2017 as an Irish collective asset-management vehicle with variable capital and having segregated liability between its Sub-Funds and is structured as an umbrella collective asset-management vehicle in that the share capital of the Fund may be divided into different Share Classes with one or more Share Classes representing a separate Sub-Fund of the Fund. Each Sub-Fund may have more than one Share Class. The assets of each Sub-Fund are invested in accordance with the investment objectives applicable to such Sub-Fund.
149

Fidelity UCITS II ICAV DIRECTORS’ REPORT (CONTINUED)
Principal Activities and Review of Business (continued) As at 31January 2019, the Fund comprised 19 Sub-Funds under the umbrella. The financial statements are prepared for the below 7 Sub-Funds for which the fiscal year end is 31 January: Sub-Fund Launch Date Fidelity MSCI Emerging Markets Index Fund 20 March 2018 Fidelity MSCI Europe Index Fund 20 March 2018 Fidelity MSCI Japan Index Fund 20 March 2018 Fidelity MSCI Pacific ex-Japan Index Fund 20 March 2018 Fidelity MSCI World Index Fund 20 March 2018 Fidelity S&P 500 Index Fund 20 March 2018 Fidelity Enhanced Reserve Fund 26 March 2018 The investment objectives of the Sub-Funds trading during the period ended 31 January 2019 are stated in the General Information. Results for the Period and Assets, Liabilities and Financial Position at 31 January 2019 Details of the assets, liabilities and financial position of the Sub-Funds and results for the period ended 31 January 2019 are set out in the Statement of Financial Position, Statement of Comprehensive Income and Statement of Changes in Net Assets Attributable to Holders of Redeemable Participating Shares. Directors The names of the persons who were Directors at any time during the financial period are listed below: Mr. David Dillon (Ireland) (Chairperson, resigned on 23 May 2018) Ms. Denise Kinsella (Ireland) (appointed on 4 January 2018, Chairperson from 20 August 2018) Mr. Paul Burd (UK) (resigned on 3 August 2018) Mr. David Greco (USA) (appointed on 4 January 2018) Mr. Nick King (UK) (appointed on 4 January 2018) Ms. Catherine Fitzsimons (Ireland) (appointed on 22 February 2018) Ms. Eímhín Ní Mhuircheartaigh (Ireland) (appointed on 26 February 2018) Directors’ Interests None of the Directors, the Secretary, or their families holds or held any beneficial interests in the Sub-Fund at 31 January 2019 or during the financial period. Transactions Involving Directors There are no contracts or arrangements of any significance in relation to the business of the Fund in which the Directors had any interest, as defined in the ICAV Act, at any time during the financial period ended 31 January 2019 other than those disclosed in Note 7 ‘Fees’ of these financial statements. Connected Person Transactions Connected Persons The Manager, the Depositary, the Investment Manager and each of their respective affiliates are considered to be connected persons of the Fund for the purposes of the Central Bank UCITS Regulations.
150

Fidelity UCITS II ICAV DIRECTORS’ REPORT (CONTINUED)
Connected Person Transactions (continued) Connected Persons (continued) The following table details the types of transaction entered into with counterparties that are connected persons: Type of Transaction Counterparty Administration Brown Brothers Harriman Fund Administration Services (Ireland) Limited Depositary, FX and Hedging Services Brown Brothers Harriman Trustee Services (Ireland) Limited Distributor FIL Distributors Manager FIL Fund Management (Ireland) Limited Investment Manager FIL Investments Management (Hong Kong) Limited Dealing with Connected Persons Regulation 41 of the Central Bank UCITS Regulations “Restriction on transactions with connected persons” states that “a responsible person shall ensure that any transaction between a UCITS and connected person is: (i) conducted at arm’s length; and (ii) in the best interest of the unit-holders of the UCITS”. In accordance with Regulation 78(4) of the Central Bank UCITS Regulations, the Directors are satisfied that: (i) there are in place arrangements, evidenced by written procedures, to ensure that the obligations that are prescribed by Regulation 41(1) are applied to all transactions with a connected person; and (ii) all transactions with connected persons that were entered into during the period to which the report relates complied with the obligations that are prescribed by Regulation 41(1). Risk Management Objectives and Policies
The principal risks and uncertainties faced by the Fund are outlined in Note 11 ‘Financial Risk Management’.
Dividends and Retention
The dividend distributions declared and paid during the period are disclosed in the Statement of Comprehensive Income.
Future Developments
The Sub-Funds will continue to pursue their investment objectives as set out in the Prospectus and outlined in these financial statements.
Independent Auditors
The Fund has appointed PricewaterhouseCoopers, Chartered Accountants & Registered Auditors, as its Independent Auditor.
151
Fidelity UCITS II ICAV DIRECTORS’ REPORT (CONTINUED)
Corporate Governance
Irish Funds Corporate Governance Code
The Board of Directors has assessed the measures included in the voluntary Corporate Governance Code as published by Irish Funds in December 2011 (the "IF Code"). The Board has adopted all corporate governance practices and procedures in the IF Code. This IF Code is available from the Irish Funds’ website at the following link: https://files.irishfunds.ie/1432820468-corporate-governance-code-for-collective-investment-schemes-and-management-companies.pdf Signed on behalf of the Board of Directors by: Date: 24 May 2019
Date: 24 May 2019
152

Fidelity UCITS II ICAV REPORT FROM THE DEPOSITARY TO THE SHAREHOLDERS (UNAUDITED)
We have enquired into the conduct of the Fidelity UCITS II ICAV (the “Fund”) for the period ended 31 January 2019 in our capacity as Depositary to the Fund. This report including the opinion has been prepared for and solely for the Shareholders in the Fund, in accordance with Part 5 of the European Communities (Undertakings for Collective Investment in Transferable Securities) Regulations 2011, as amended, (“The UCITS Regulations”), and for no other purpose. We do not, in giving this opinion, accept or assume responsibility for any other purpose or to any other person to whom this report is shown. Responsibilities of the Depositary Our duties and responsibilities are outlined in Part 5 of the UCITS Regulations. One of those duties is to enquire into the conduct of the Fund in each annual accounting period and report thereon to the shareholders. Our report shall state whether, in our opinion, the Fund has been managed in that period in accordance with the provisions of the Fund’s Instrument of Incorporation of the Fund and the UCITS Regulations. It is the overall responsibility of the Fund to comply with these provisions. If the Fund has not so complied, we as Depositary must state why this is the case and outline the steps which we have taken to rectify the situation. Basis of Depositary Opinion The Depositary conducts such reviews as it, in its reasonable opinion, considers necessary in order to comply with its duties as outlined in Part 5 of the UCITS Regulations and to ensure that, in all material respects, the Fund has been managed (i) in accordance with the limitations imposed on its investment and borrowing powers by the provisions of the Instrument of Incorporation of the Fund and the appropriate regulations and (ii) or otherwise in accordance with the Fund constitutional documentation and the appropriate regulations. Opinion In our opinion, the Fund has been managed during the period, in all material respects:
(i) in accordance with the limitations imposed on the investment and borrowing powers of the Fund by the Instrument of Incorporation of the Fund, the UCITS Regulations and the Central Bank UCITS Regulations, and
(ii) or otherwise in accordance with the provisions of the Instrument of Incorporation of the Fund, the UCITS Regulations and the Central Bank UCITS Regulations.
Brown Brothers Harriman Trustee Services (Ireland) Limited, 30 Herbert Street, Dublin 2, D02 W329, Ireland 24 May 2019
153

Fidelity UCITS II ICAV INDEPENDENT AUDITORS’ REPORT
Report on the audit of the financial statements
Opinion
In our opinion, the financial statements of the 7 Sub-Funds, as listed on page 2 of the financial statements (the “Sub-Funds”), of Fidelity UCITS II ICAV:
give a true and fair view of each of the Sub-Fund’s assets, liabilities and financial position as at 31 January 2019 and of each of their results and cash flows for the for the period from 14 November 2017 to 31 January 2019 (the “period”);
have been properly prepared in accordance with International Financial Reporting Standards (“IFRSs”) as adopted by the European Union; and
have been properly prepared in accordance with the requirements of the Irish Collective Asset-management Vehicles Act 2015 and the European Communities (Undertakings for Collective Investment in Transferable Securities) Regulations 2011 (as amended).
We have audited the financial statements, included within the Annual Report and Audited Financial Statements, which comprise:
the Statement of Financial Position of each of the Sub-Funds as at 31 January 2019; the Statement of Comprehensive Income of each of the Sub-Funds for the period then ended; the Statement of Cash Flows of each of the Sub-Funds for the period then ended; the Statement of Changes in Net Assets Attributable to Holders of Redeemable Participating Shares of each of the
Sub-Funds for the period then ended; the Schedules of Investments for each of the Sub-Funds as at 31 January 2019; and the notes to the financial statements for each of the Sub-Funds, which include a description of the significant
accounting policies.
Basis for opinion
We conducted our audit in accordance with International Standards on Auditing (Ireland) (“ISAs (Ireland)”) and applicable law.
Our responsibilities under ISAs (Ireland) are further described in the Auditors’ responsibilities for the audit of the financial statements section of our report. We believe that the audit evidence we have obtained is sufficient and appropriate to provide a basis for our opinion.
Independence
We remained independent of the ICAV in accordance with the ethical requirements that are relevant to our audit of the financial statements in Ireland, which includes IAASA’s Ethical Standard, and we have fulfilled our other ethical responsibilities in accordance with these requirements.
Conclusions relating to going concern
We have nothing to report in respect of the following matters in relation to which ISAs (Ireland) require us to report to you where:
the directors’ use of the going concern basis of accounting in the preparation of the financial statements is not appropriate; or
the directors have not disclosed in the financial statements any identified material uncertainties that may cast significant doubt about the Sub-Funds’ ability to continue to adopt the going concern basis of accounting for a period of at least twelve months from the date when the financial statements are authorised for issue.
154

Fidelity UCITS II ICAV INDEPENDENT AUDITORS’ REPORT (CONTINUED)
However, because not all future events or conditions can be predicted, this statement is not a guarantee as to the Sub-Funds’ ability to continue as going concerns.
Reporting on other information
The other information comprises all of the information in the Annual Report and Audited Financial Statements other than the financial statements and our auditors’ report thereon. The directors are responsible for the other information. Our opinion on the financial statements does not cover the other information and, accordingly, we do not express an audit opinion or, except to the extent otherwise explicitly stated in this report, any form of assurance thereon. In connection with our audit of the financial statements, our responsibility is to read the other information and, in doing so, consider whether the other information is materially inconsistent with the financial statements or our knowledge obtained in the audit, or otherwise appears to be materially misstated. If we identify an apparent material inconsistency or material misstatement, we are required to perform procedures to conclude whether there is a material misstatement of the financial statements or a material misstatement of the other information. If, based on the work we have performed, we conclude that there is a material misstatement of this other information, we are required to report that fact. We have nothing to report based on these responsibilities.
Based on the responsibilities described above and our work undertaken in the course of the audit, the Irish Collective Asset-management Vehicles Act 2015 requires us to also report the opinion as described below:
In our opinion, based on the work undertaken in the course of the audit, the information given in the Directors’ Report for the period ended 31 January 2019 is consistent with the financial statements.
Responsibilities for the financial statements and the audit
Responsibilities of the directors for the financial statements
As explained more fully in the Statement of Directors' Responsibilities set out on page 149, the directors are responsible for the preparation of the financial statements in accordance with the applicable framework and for being satisfied that they give a true and fair view.
The directors are also responsible for such internal control as they determine is necessary to enable the preparation of financial statements that are free from material misstatement, whether due to fraud or error.
In preparing the financial statements, the directors are responsible for assessing the Sub-Funds’ ability to continue as going concerns, disclosing as applicable, matters related to going concern and using the going concern basis of accounting unless the directors either intend to liquidate the Sub-Fund or to cease operations, or have no realistic alternative but to do so.
Auditors’ responsibilities for the audit of the financial statements
Our objectives are to obtain reasonable assurance about whether the financial statements as a whole are free from material misstatement, whether due to fraud or error, and to issue an auditors’ report that includes our opinion. Reasonable assurance is a high level of assurance, but is not a guarantee that an audit conducted in accordance with ISAs (Ireland) will always detect a material misstatement when it exists. Misstatements can arise from fraud or error and are considered material if, individually or in the aggregate, they could reasonably be expected to influence the economic decisions of users taken on the basis of these financial statements.
A further description of our responsibilities for the audit of the financial statements is located on the IAASA website at:
https://www.iaasa.ie/getmedia/b2389013-1cf6-458b-9b8f-a98202dc9c3a/Description_of_auditors_responsibilities_for_audit.pdf.
This description forms part of our auditors’ report.
Use of this report
This report, including the opinions, has been prepared for and only for the shareholders of each of the Sub-Funds as a body in accordance with section 120 of the Irish Collective Asset-management Vehicles Act 2015 and for no other purpose. We do not, in giving these opinions, accept or assume responsibility for any other purpose or to any other person to whom this report is shown or into whose hands it may come save where expressly agreed by our prior consent in writing.
155

Fidelity UCITS II ICAV INDEPENDENT AUDITORS’ REPORT (CONTINUED)
Other required reporting
Irish Collective Asset-management Vehicles Act 2015 exception reporting
Directors’ remuneration
Under the Irish Collective Asset-management Vehicles Act 2015 we are required to report to you if, in our opinion, the disclosures of directors’ remuneration specified by section 117 of that Act have not been made. We have no exceptions to report arising from this responsibility.
PricewaterhouseCoopers Chartered Accountants and Statutory Audit Firm Dublin 24 May 2019
156

Fidelity UCITS II ICAV DIRECTORY (UNAUDITED)
Directors: Mr. David Dillon (Ireland) (Chairperson, resigned on 23 May 2018) Ms. Denise Kinsella (Ireland) (appointed on 4 January 2018, Chairperson from 20 August 2018) Mr. Paul Burd (UK) (resigned on 3 August 2018) Mr. David Greco (USA) (appointed on 4 January 2018) Mr. Nick King (UK) (appointed on 4 January 2018) Ms. Catherine Fitzsimons (Ireland) (appointed on 22 February 2018) Ms. Eímhín Ní Mhuircheartaigh (Ireland) (appointed on 26 February 2018)
Investment Manager (Index Tracking Sub-Funds): Geode Capital Management LLC 100 Summer St., 12th Floor Boston MA02110 United States of America
Administrator: Brown Brothers Harriman Fund Administration Services (Ireland) Limited 30 Herbert Street Dublin 2 DO2 W329 Ireland
Investment Manager (Fidelity Enhanced Reserve Fund): FIL Investment Management (Hong Kong) Limited Level 21 Two Pacific Place 88 Queensway Admiralty Hong Kong
Legal Advisors: Matheson 70 Sir John Rogerson’s Quay Dublin 2 D02 R296 Ireland
Depositary: Brown Brothers Harriman Trustee Services (Ireland) Limited 30 Herbert Street Dublin 2 D02 W329 Ireland
Registered Office: George’s Quay House 43 Townsend Street Dublin 2 D02 VK65 Ireland
Independent Auditors: PricewaterhouseCoopers One Spencer Dock North Wall Quay Dublin 1 D01 X9R7 Ireland
Manager and Secretary: FIL Fund Management (Ireland) Limited George’s Quay House 43 Townsend Street Dublin 2 D02 VK65 Ireland
Distributor: FIL Distributors Pembroke Hall 42 Crow Lane Pembroke HM19 Bermuda
All current Directors are Non-Executive. *Independent Director
157

Fidelity UCITS II ICAV APPENDIX 1 – STATEMENT OF SIGNIFICANT CHANGES IN THE COMPOSITION OF PORTFOLIO (UNAUDITED)
In accordance with the UCITS Regulations, as amended, a statement of changes in the composition of the Schedule of Investments during the reporting period is provided to ensure that Shareholders can identify changes in the investments held by the Sub-Funds. The following statements present the aggregate purchases and sales of transferable securities exceeding one percent of the total value of purchases or sales, respectively, for the period. At a minimum, the largest twenty purchases and twenty sales are presented, if available.
Fidelity MSCI Emerging Markets Index Fund
Top Twenty Purchases for the period ended 31 January 2019
Security Description Nominal Cost USD Tencent Holdings 23,200 1,221,646 Alibaba Group Holding 5,248 957,117 Samsung Electronics 6,815 878,481 Taiwan Semiconductor Manufacturing 98,000 837,016 Naspers 1,766 460,863 China Construction Bank 378,000 372,833 Baidu 1,143 273,741 Industrial & Commercial Bank of China 294,000 240,368 China Mobile 25,000 235,265 Ping An Insurancempany of China 21,500 234,364 Hon Hai Precision Industry 66,000 192,300 Itau Unibanco Holding 13,700 186,917 SK Hynix 2,325 181,829 Housing Development Finance 6,402 171,675 Sberbank of Russia 43,570 171,632 Reliance Industries 11,647 171,390 Vale 12,900 167,990 Bank of China 328,000 166,986 Samsung Electronics 1,409 134,114 Banco Bradesco 13,600 132,888
Top Twenty Sales for the period ended 31 January 2019
Security Description Nominal Proceeds USD Tencent Holdings 700 35,624 Samsung Electronics 512 24,081 Alibaba Group Holding 113 22,375 Airtac International Group 1,000 17,189 Industrial & Commercial Bank of China 18,000 14,916 Sunny Optical Technology Group 700 14,242 Tsingtao Brewery 2,000 12,672 Eclat Textile 1,000 12,216 Delta Electronics 3,000 11,114 TaiMed Biologics 1,000 10,513 Naspers 43 10,274 President Chain Store 1,000 10,246 Generali Interface Solution 2,000 9,736 X5 Retail Group 400 9,443 China Mobile 1,000 8,924 Gazprom 3,590 8,332 Kweichow Moutai 100 8,123 PPB Group 1,600 8,008 Nien Made Enterprise 1,000 7,927 Samsung Electronics 207 7,777
158

Fidelity UCITS II ICAV APPENDIX 1 – STATEMENT OF SIGNIFICANT CHANGES IN THE COMPOSITION OF PORTFOLIO (UNAUDITED) (CONTINUED)
Fidelity MSCI Europe Index Fund
Top Twenty Purchases for the period ended 31 January 2019
Security Description Nominal Cost EUR Nestle 2,526 167,603 HSBC Holdings 16,360 129,175 Novartis 1,770 119,523 Roche Holding 573 110,645 Royal Dutch Shell (A Shares) 3,903 102,444 Total 1,888 90,397 BP 16,108 90,001 British American Tobacco 1,882 81,530 Royal Dutch Shell (B Shares) 2,972 78,854 SAP 776 68,455 Banco Santander 13,299 67,568 Allianz 348 65,402 Siemens 604 64,212 GlaxoSmithKline 4,056 63,412 Bayer 695 62,550 Novo Nordisk 1,520 61,955 Sanofi 899 60,716 AstraZeneca 1,036 60,502 BASF 728 59,143 Diageo 2,031 58,209
Top Twenty Sales for the period ended 31 January 2019
Security Description Nominal Proceeds EUR Shire PLC 687 34,249 Linde AG - Tender 133 29,579 Abertis Infrastructuras 381 6,995 Luxottica Group 125 6,503 Chocoladefabriken Lindt & Spruengli 1 6,028 Randgold Resources 77 5,591 Old Mutual 3,045 5,458 Rio Tinto 78 3,367 Unilever 64 3,082 Anglo American 147 3,012 Groupe Bruxelles Lambert 36 2,986 Bayerische Motoren Werke Preference Shares 41 2,943 Swiss Prime Site 39 2,928 Lloyds Banking Group 4,473 2,919 Schroders 94 2,896 Nestle 37 2,762 Travis Perkins 197 2,411 K+S AG Reg 144 2,264 Altice Europe 281 2,220 Standard Chartered 244 2,099
159

Fidelity UCITS II ICAV APPENDIX 1 – STATEMENT OF SIGNIFICANT CHANGES IN THE COMPOSITION OF PORTFOLIO (UNAUDITED) (CONTINUED)
Fidelity MSCI Japan Index Fund
Top Twenty Purchases for the period ended 31 January 2019
Security Description Nominal Cost USD Toyota Motor 13,500 867,064 Mitsubishi UFJ Financial Group 64,300 413,578 SoftBank Group 4,500 353,535 Keyence 600 350,302 Sony 6,800 331,394 Takeda Pharmaceutical 7,800 326,033 Sumitomo Mitsui Financial Group 7,300 303,039 Honda Motor 8,700 290,297 Nintendo 600 255,968 KDDI 9,300 236,735 Fanuc 1,000 231,748 Mizuho Financial Group 128,100 228,952 Fast Retailing 500 222,338 Mitsubishi 7,900 215,829 Nidec 1,400 202,831 Shin-Etsu Chemical 2,000 200,653 Hitachi 24,500 192,480 NTT Docomo 7,400 190,422 Canon 5,300 186,524 Kao 2,600 181,678
Major Purchases for the period ended 31 January 2019
Security Description Nominal Proceeds USD Toyota Motor 2,800 173,528 Fast Retailing 200 102,877 Murata Manufacturing 400 54,915 Keyence 100 54,047 Mitsubishi UFJ Financial Group 9,300 49,812 Nidec 400 47,634 Mitsubishi 1,600 44,923 SoftBank Group 600 44,656 Sony 900 44,033 Sumitomo Mitsui Financial Group 1,100 40,567 Takeda Pharmaceutical 900 36,566 Honda Motor 1,100 32,649 Nintendo 100 30,605 Oriental Land 300 29,987 Disco 200 28,615 Shimano 200 28,459 NTT Docomo 1,200 28,037 East Japan Railway 300 27,369 Daito Trust Construction 200 26,981 Shin-Etsu Chemical 300 26,645 Nippon Telegraph & Telephone 600 25,567
160

Fidelity UCITS II ICAV APPENDIX 1 – STATEMENT OF SIGNIFICANT CHANGES IN THE COMPOSITION OF PORTFOLIO (UNAUDITED) (CONTINUED)
Fidelity MSCI Pacific ex-Japan Index Fund
Major Purchases for the year ended 31 January 2019
Security Description Nominal Cost USD AIA Group 48,800 425,442 Commonwealth Bank of Australia 6,921 389,534 Westpac Banking 13,506 295,020 BHP Group 12,420 280,521 Australia & New Zealand Banking Group 11,205 233,836 CSL 1,779 232,032 National Australia Bank 10,378 222,755 Hong Kong Exchanges & Clearing 4,700 157,074 DBS Group Holdings 7,200 148,904 Wesfarmers 4,449 141,147 CK Hutchison Holdings 11,000 128,499 Oversea-Chinese Banking 12,700 123,346 United Overseas Bank 5,500 114,899 Woolworths Group 5,164 108,323 Sun Hung Kai Properties 6,500 104,687 Macquarie Group 1,268 103,589 Rio Tinto 1,603 92,993 CK Asset Holdings 10,500 90,161 Transurban Group 10,277 89,222 Woodside Petroleum 3,777 86,350 Singapore Telecommunications 33,000 83,755 Galaxy Entertainment Group 10,000 83,216 Link REIT 8,500 76,330 Hang Seng Bank 3,200 75,758 Hong Kong & China Gas 35,000 72,492 BOC Hong Kong Holdings 15,000 72,271
161

Fidelity UCITS II ICAV APPENDIX 1 – STATEMENT OF SIGNIFICANT CHANGES IN THE COMPOSITION OF PORTFOLIO (UNAUDITED) (CONTINUED)
Fidelity MSCI Pacific ex-Japan Index Fund (continued)
Major Sales for the year ended 31 January 2019
Security Description Nominal Proceeds USD Westfield 5,746 38,378 BHP Group 848 19,705 Healthscope 5,340 8,813 Rio Tinto 148 8,219 Wharf Real Estate Investment 1,000 7,767 Jardine Matheson Holdings 100 6,604 National Australia Bank 277 4,670 Hutchison Port 14,400 4,248 Mercury 1,901 4,186 Kingston Financial Group 12,000 3,981 CK Infrastructure Holdings 500 3,802 Li & Fung 18,000 3,681 Goodman Group 499 3,506 Power Assets Holdings 500 3,461 Sino Land 2,000 3,440 Australia & New Zealand Banking Group 161 3,198 First Pacific 6,000 3,005 Jardine Cycle & Carriage 100 2,576 Starhub 1,700 2,536 Hang Seng Bank 100 2,308 Woodside Petroleum 95 2,273 United Overseas Bank 100 2,115 Fletcher Building 399 1,852 NWS Holdings 1,000 1,835 Kerry Properties 500 1,715 AIA Group 200 1,639
162

Fidelity UCITS II ICAV APPENDIX 1 – STATEMENT OF SIGNIFICANT CHANGES IN THE COMPOSITION OF PORTFOLIO (UNAUDITED) (CONTINUED)
Fidelity MSCI World Index Fund
Top Twenty Purchases for the period ended 31 January 2019
Security Description Nominal Cost USD Apple 7,599 1,474,542 Microsoft 11,167 1,158,426 Amazon.com 648 1,096,086 Facebook 3,708 601,881 JPMorgan Chase 5,119 566,984 Johnson & Johnson 4,067 552,464 Alphabet 495 542,867 Exxon Mobil 6,387 508,454 Alphabet 449 495,503 Bank of America 14,634 429,472 Berkshire Hathaway 1,970 408,526 Visa 2,801 381,334 Wells Fargo 7,012 380,096 UnitedHealth Group 1,477 377,549 Nestle 4,647 377,093 Pfizer 8,979 366,648 Intel 7,126 351,547 Chevron 2,907 348,330 AT&T 10,520 338,699 Verizon Communications 6,299 333,115
Top Twenty Sales for the period ended 31 January 2019
Security Description Nominal Proceeds USD Apple 1,680 264,416 Microsoft 2,250 230,577 Amazon.com 140 228,235 Facebook 738 107,759 Alphabet 99 104,156 JPMorgan Chase 1,011 102,254 Johnson & Johnson 779 100,288 Alphabet 94 100,272 Visa 636 87,411 Exxon Mobil 1,205 86,482 Coca-Cola 1,756 82,727 Bank of America 3,024 80,418 Nestle 910 77,245 Pfizer 1,806 76,610 UnitedHealth Group 301 75,186 Berkshire Hathaway 380 74,694 Intel 1,484 71,677 Verizon Communications 1,240 71,659 Home Depot 393 70,471 Wells Fargo 1,418 69,092
163

Fidelity UCITS II ICAV APPENDIX 1 – STATEMENT OF SIGNIFICANT CHANGES IN THE COMPOSITION OF PORTFOLIO (UNAUDITED) (CONTINUED)
Fidelity S&P 500 Index Fund
Top Twenty Purchases for the period ended 31 January 2019
Security Description Nominal Cost USD Apple 19,298 3,938,206 Microsoft 32,462 3,448,961 Amazon.com 1,726 2,938,791 Berkshire Hathaway 8,188 1,672,682 Facebook 10,092 1,538,864 Johnson & Johnson 11,298 1,517,259 JPMorgan Chase 14,078 1,499,251 Exxon Mobil 17,848 1,401,526 Alphabet (Class C) 1,285 1,394,262 Alphabet (Class A) 1,262 1,380,218 Bank of America 38,783 1,086,967 Pfizer 24,524 1,050,850 UnitedHealth Group 4,051 1,041,185 Visa 7,417 1,020,728 AT&T 30,148 953,560 Verizon Communications 17,368 946,950 Wells Fargo 18,039 937,736 Chevron 8,030 926,624 Intel 19,243 890,900 Home Depot 4,785 884,427
Top Twenty Sales for the period ended 31 January 2019
Security Description Nominal Proceeds USD Microsoft 18,092 1,888,160 Apple 10,916 1,728,186 Amazon.com 962 1,592,509 Berkshire Hathaway 4,571 906,885 Johnson & Johnson 6,311 828,821 Facebook 5,625 814,693 JPMorgan Chase 7,892 801,630 Alphabet (Class C) 713 762,861 Alphabet (Class A) 706 761,891 Exxon Mobil 9,975 725,738 Pfizer 13,772 581,265 Bank of America 21,808 579,601 Visa 4,149 572,227 UnitedHealth Group 2,262 570,694 Verizon Communications 9,685 553,863 Procter & Gamble 5,846 534,008 AT&T 17,007 518,027 Intel 10,754 517,016 Chevron 4,476 507,038 Wells Fargo 10,158 492,440
164

Fidelity UCITS II ICAV APPENDIX 1 – STATEMENT OF SIGNIFICANT CHANGES IN THE COMPOSITION OF PORTFOLIO (UNAUDITED) (CONTINUED)
Fidelity Enhanced Reserve Fund
Top Twenty Purchases for the period ended 31 January 2019
Security Description Nominal Cost USD United States Treasury Note 0.75% 15/07/2019 5,000,000 4,958,828 United States Treasury Note 1.38% 28/02/2019 4,200,000 4,184,734 Fidelity Institutional Liquidity Fund - The United States Dollar Fund 175 3,100,000 United States Treasury Note 1.25% 31/03/2019 3,000,000 2,986,328 HSBC Holdings 3.64% 18/05/2024 2,000,000 1,991,872 United States Treasury Note 1.50% 31/05/2019 2,000,000 1,988,125 Bocom Leasing Management Hong Kong 4.00% 22/01/2022 2,000,000 1,988,060 Standard Chartered 2.53% 25/01/2019 2,000,000 1,987,291 DekaBank Deutsche Girozentrale 0.00% 02/05/2019 2,000,000 1,986,591 United States Treasury Note 1.25% 15/12/2018 1,500,000 1,496,293 Shell International Finance 3.02% 13/11/2023 1,500,000 1,494,022 ING Groep 3.80% 02/10/2023 1,500,000 1,493,210 Credit Suisse Group Funding Guernsey 3.13% 10/12/2020 1,500,000 1,484,940 First Abu Dhabi Bank 2.25% 11/02/2020 1,500,000 1,478,485 ASB Finance 2.13% 01/09/2021 1,500,000 1,435,090 Korea Midland Power 3.38% 22/01/2022 1,425,000 1,422,093 China Oil & Gas Group 5.00% 07/05/2020 1,400,000 1,397,150 DPL 7.25% 15/10/2021 1,000,000 1,066,250 Fita International 7.00% 10/02/2020 1,000,000 1,033,000 Chong Qing Grain Group 4.02% 14/07/2019 7,000,000 1,020,707
Total Sales for the period ended 31 January 2019
Security Description Nominal Proceeds USD United States Treasury Note 2.63% 31/08/2020 1,000,000 994,375 Indonesia Asahan Alumini 5.23% 15/11/2021 625,000 632,875 United States Treasury Note 2.75% 30/09/2020 500,000 499,336 Shimao Property Holdings 6.38% 15/10/2021 200,000 200,500 Baoxin Auto Finance 6.63% 02/04/2019 200,000 199,750 China Aoyuan Group6.35% 11/01/2020 200,000 199,400 United States Treasury Note 1.38% 28/02/2019 200,000 198,852 United States Treasury Note 0.88% 15/07/2018 150,000 149,830
165

Fidelity UCITS II ICAV APPENDIX 2 – REPORT ON REMUNERATION (UNAUDITED)
The Fund is managed by FIL Fund Management (Ireland) Limited (“FFM(I)L”), a wholly owned subsidiary of FIL Limited (“FIL”). FFM(I)L will take reasonable steps to ensure that any decisions are consistent with the overall business strategy, objectives and the Global Remuneration Policy and try to manage any conflicts of interest which may arise. The FIL Group Remuneration Committee has established a Global Remuneration Policy to ensure the requirements of the UCITS Directive are met at a global level for all its UCITS management companies, including FFM(I)L. The Remuneration Committee reviews the remuneration policy at least annually to reflect the relevant local market practices and regulatory requirements applicable from time to time. The Directors of FFM(I)L review its general principles at least annually and oversee its implementation. The Global Remuneration Policy is consistent with and promotes sound and effective risk management and is designed not to encourage risk-taking which is inconsistent with the risk profile of FFM(I)L and the Fund. The Global Remuneration Policy is in line with the business strategy, objectives, values and interests of FFM(I)L and the Fund and includes measures to avoid conflicts of interest. There were no material changes to the Global Remuneration Policy to report during the financial period. The Global Remuneration Policy applies to all employees, with a focus on the staff whose professional activities have a material impact on the risk profile of the relevant management company or fund (the ‘Identified Staff’). The Identified Staff are individuals whose roles can materially affect the risk of the management company or any UCITS fund that it manages. These roles are identified in line with the requirements of the UCITS Directive and guidance issued by the European Securities and Markets Authority. Identified Staff supporting FFM(I)L, include the following individuals: a) Senior Management (Registered Directors); b) Risk Takers (Senior Management Team); and c) Staff Engaged in Control Functions (Risk, Compliance, Audit, HR and Finance). FFM(I)L does not employ staff directly so the total remuneration to be disclosed under this remuneration disclosure for the financial period is NIL. The fees received by independent Directors of FFM(I)L do not have any variable component. The aggregate total remuneration paid to the Identified Staff, considering all existing delegation arrangements and where information has been made available, is as follows: EUR Fixed 12,756 Variable 1,758 Total 14,514 It is to be noted that the remuneration information disclosed from the delegate for its relevant staff pertains to the financial period ended 31 January 2019. For any additional on remuneration policy, a copy of the summary Remuneration Policy is available at https://www.fil.com.
166

Fidelity UCITS II ICAV APPENDIX 3 – TRACKING ERROR (UNAUDITED)
Each of the Index Tracking Sub-Funds employ a “passive” investment strategy designed to replicate the performance of the Index by holding all of the Index securities in a similar proportion to their weighting in the Index. However, where full replication of the Index is not reasonably possible (for example as a result of the number of securities or the illiquidity of certain securities within the Index), the Sub-Funds will use optimisation to select the Index securities in order to build a representative portfolio that provides a return that is comparable to that of the Index. Tracking error measures the volatility of the return difference between each Sub-Fund and the Index. It is calculated as the standard deviation of the delivered excess returns over an annual period. Anticipated tracking error is disclosed for the Sub-Funds in the table below. Realised (ex-post) tracking error may vary from the anticipated tracking error, depending on a range of circumstances. These include transaction costs, securities lending income and withholding tax differences. The anticipated tracking error and ex-post tracking error are not expected to vary significantly under normal circumstances. For the financial period ended 31 January 2019, the anticipated tracking errors and the ex-post tracking errors were as follows: Sub-Fund Anticipated tracking error (bps) Ex-post tracking error (bps) Fidelity MSCI Emerging Markets Index Fund 50 14 Fidelity MSCI Europe Index Fund 20 11 Fidelity MSCI Japan Index Fund 40 2 Fidelity MSCI Pacific ex-Japan Index Fund 40 2 Fidelity MSCI World Index Fund 20 6 Fidelity S&P 500 Index Fund 15 2 The table below compares the realised Sub-Fund’s performance against the performance of the relevant benchmark Index during the period ended 31 January 2019. An explanation for the difference gross of TER is provided: Sub-Fund
Sub-Fund return for the
financial period ended
31/1/2019 %
Benchmark
return for the financial
period ended
31/1/2019 %
Tracking difference
net of TER
%
TER %
Tracking difference
gross of TER
%
Explanation of the tracking difference
Fidelity MSCI Emerging Markets Index Fund
(11.49) (11.26) (0.23) 0.24 0.01 The outperformance of the Sub-Fund was due to the sampling techniques employed.
Fidelity MSCI Europe Index Fund
(1.75) (1.82) 0.07 0.18 0.25 The outperformance of the Sub-Fund was due to the sampling techniques employed.
Fidelity MSCI Japan Index Fund
(7.61) (7.73) 0.12 0.18 0.30 The outperformance of the Sub-Fund was due to the sampling techniques employed.
Fidelity MSCI Pacific ex-Japan Index Fund
(3.15) (3.16) 0.01 0.18 0.19 The outperformance of the Sub-Fund was due to the sampling techniques employed.
Fidelity MSCI World Index Fund
(2.15) (2.17) 0.02 0.18 0.20 The outperformance of the Sub-Fund was due to the sampling techniques employed.
Fidelity S&P 500 Index Fund
0.21 0.28 (0.07) 0.10 0.03 The outperformance of the Sub-Fund was due to the sampling techniques employed.
167

Fidelity UCITS II ICAV APPENDIX 4 – SECURITIES FINANCING TRANSACTIONS (UNAUDITED)
The Securities Financing Transactions (“SFTs”) Regulation (the “Regulation”) came into force on 12 January 2016 and introduced additional disclosure requirements around securities lending, repurchase agreement/reverse repurchase agreements, total return swaps (TRSs) and other lending/borrowing transactions in annual and semi-annual financial statements, published after 13 January 2017. The Regulation came about due to what was perceived as ‘shadow banking’ risk in the securities financing markets and aims to reduce this risk by improving transparency in the securities financing markets in a number of ways: - By imposing conditions on the 'reuse' of collateral, so that clients and counterparties understand the risks involved and give their consent to the reuse, - By requiring managers to make detailed disclosures to their investors of the use they make of SFTs both in their periodic financial statements and pre-contractual documentation; and - By requiring counterparties to report SFTs to a trade repository so as to provide transparency to regulators on the use of SFTs by market participants. As the Sub-Funds did not hold any SFTs as at 31 January 2019, the report for the period from 14 November 2017 (date of registration) to 31 January 2019 and financial statements do not include any additional disclosures.
168

Annual Report and Audited Financial Statements For the period from 14 November 2017 (date of registration) to 31 December 2018
Fidelity UCITS II ICAV
(An Irish collective asset-management vehicle constituted as an umbrella fund with segregated liability between sub-funds)

Fidelity UCITS II ICAV TABLE OF CONTENTS
Page GENERAL INFORMATION 2 INVESTMENT MANAGER’S REPORT 11 SCHEDULES OF INVESTMENTS: Fidelity Europe ex-UK Equity Fund 18 Fidelity Japan Equity Fund 19 Fidelity North America Equity Fund 20 Fidelity UK Equity Fund 21 Fidelity Global Aggregate Bond Fund 22 Fidelity Global Sub-IG Fixed Income Fund 23 Fidelity Asia Pacific ex-Japan Equity Fund 24 Fidelity Alternative Listed Equity Fund 25 Fidelity Global Emerging Markets Equity Fund 26 STATEMENT OF FINANCIAL POSITION 27 STATEMENT OF COMPREHENSIVE INCOME 31 STATEMENT OF CHANGES IN NET ASSETS ATTRIBUTABLE TO HOLDERS OF REDEEMABLE PARTICIPATING SHARES 33 STATEMENT OF CASH FLOWS 35 NOTES TO THE FINANCIAL STATEMENTS 37 DIRECTORS’ REPORT 55 REPORT FROM THE DEPOSITARY TO THE SHAREHOLDERS (UNAUDITED) 59 INDEPENDENT AUDITORS’ REPORT 60 DIRECTORY 62 APPENDIX 1 - STATEMENT OF SIGNIFICANT CHANGES IN THE COMPOSITION OF PORTFOLIO (UNAUDITED) 63 APPENDIX 2 – REPORT OF REMUNERATION (UNAUDITED) 66 APPENDIX 3 – SECURITIES FINANCING TRANSACTIONS (UNAUDITED) 67

Fidelity UCITS II ICAV GENERAL INFORMATION
2
Fidelity UCITS II ICAV (the “Fund”) was registered in Ireland pursuant to the Irish Collective Asset-management Vehicles Act 2015 on 14 November 2017 as amended under registration number C174793 and is authorised by the Central Bank of Ireland (the “Central Bank”) under the European Communities (Undertakings for Collective Investment in Transferable Securities) Regulations 2011 (as amended) (the “UCITS Regulations”). Except where the context otherwise requires, defined terms shall bear the meaning given to them in the Prospectus of the Fund. The Fund is organised in the form of an umbrella fund with segregated liability between sub-funds. The Prospectus provides that the Fund may offer separate sub-funds. Each sub-fund will have a distinct schedule of investments. Currently there are 19 sub-funds under the umbrella. The financial statements are prepared for the below 9 Sub-Funds for which the fiscal year end is 31 December (each, a “Sub-Fund” and, collectively, the “Sub-Funds”): Sub-Fund Launch Date Fidelity Europe ex-UK Equity Fund 13 August 2018 Fidelity Japan Equity Fund 23 August 2018 Fidelity North America Equity Fund 28 August 2018 Fidelity UK Equity Fund 29 August 2018 Fidelity Global Aggregate Bond Fund 30 August 2018 Fidelity Global Sub-IG Fixed Income Fund 30 August 2018 Fidelity Asia Pacific ex-Japan Equity Fund 31 August 2018 Fidelity Alternative Listed Equity Fund 12 September 2018 Fidelity Global Emerging Markets Equity Fund 14 September 2018 *There is one other sub-fund of the umbrella in existence (Fidelity Global Equity Fund), but it has not been launched as at the period end. 31 December 2018 is the first reporting cycle of the Sub-Funds therefore there are no comparatives in the financial statements. With the prior approval of the Central Bank, the Fund from time to time may create an additional Sub-Fund or Sub-Funds, the investment policies and objectives for which will be outlined in a Relevant Supplement, together with details of the initial offer period, the initial subscription price for each Share and such other relevant information in relation to the additional Sub-Fund or Sub-Funds as the Directors may deem appropriate, or the Central Bank requires, to be included. Each Relevant Supplement will form part of, and should be read in conjunction with, the Prospectus. In addition, the Fund may create additional Classes of Shares within a Sub-Fund to accommodate different terms, including different charges and/or fees and/or brokerage arrangements provided that the Central Bank is notified in advance, and gives prior clearance, of the creation of any such additional Class of Shares. The most recent Prospectus of the Fund is dated 9 November 2018. The most recent Supplements for the Sub-Funds launched as at the period end are dated 9 November 2018. Fidelity Europe ex-UK Equity Fund The investment objective of the Sub-Fund is to seek to achieve long-term capital growth. The Fidelity Europe ex-UK Equity Fund is a feeder UCITS and will seek to achieve its objective by investing up to 100% of its net assets in share classes of the Fidelity Europe ex-UK Equity Fund (the “Master Fund”), being a sub-fund of Fidelity Common Contractual Fund II, a common contractual fund constituted as an umbrella fund and authorised in Ireland by the Central Bank pursuant to the UCITS Regulations. FIL Investments International (the “Investment Manager”) is the Investment Manager of the Sub-Fund and the Master Fund. The investment objective of the Sub-Fund is that all or substantially all of the proceeds of issue of each Class of Shares in the Sub-Fund (and in any circumstances at least 85% of the Sub-Fund’s Net Asset Value) will be invested in the Master Fund. A small portion of the Sub-Fund may be retained in cash or invested in liquid instruments primarily listed or traded on the Recognised Markets for liquidity purposes and for the purposes of paying any expenses of the Sub-Fund, but such investments will not exceed 15% of the Net Asset Value of the Sub-Fund. Such instruments will include money market instruments including bank deposits, fixed or floating rate instruments (including commercial paper, notes, bankers acceptances, certificates of deposit, debentures and short-dated government or corporate bonds), cash and cash equivalents (including treasury bills) that are rated as investment grade or below or are unrated. While these liquid instruments will be primarily listed or traded on Recognised Markets, some of these instruments may be traded over-the-counter on electronic trade platforms. For the avoidance of doubt, the liquid instruments in which the Sub-Fund will invest do not include total return swaps, securities lending, repurchase agreements or reverse repurchase agreements.

Fidelity UCITS II ICAV GENERAL INFORMATION (CONTINUED)
3
Fidelity Europe ex-UK Equity Fund (continued) The Sub-Fund is expected to have similar performance to the Master Fund but the Sub-Fund’s performance may differ given that it may invest up to 15% of its Net Asset Value in liquid instruments described above. The Sub-Fund is also expected to have a similar risk profile to the Master Fund, which is not expected to have an above average risk profile or high volatility as a result of its use of financial derivative instruments. The investment objective of the Master Fund is identical to that of the Sub-Fund, namely to seek to achieve long-term capital growth. The Master Fund seeks to achieve its objective by obtaining exposure to a diversified portfolio, at least two thirds of which will be exposed to equities or equity-related securities of companies domiciled or exercising the predominant part of their economic activity in Europe, excluding the United Kingdom (“Europe ex-UK”). The Investment Manager (in the context of its role as investment manager of the Master Fund) has appointed a number of discretionary investment advisers as its delegates and will allocate some or all of the Master Fund’s assets to such advisers. The Investment Manager is responsible for actively selecting each adviser to which assets will be allocated, for determining the amount of the Master Fund’s assets to allocate to each adviser and for managing such portion of the Master Fund’s assets as are not allocated to an adviser. The Master Fund’s investment strategy will pursue a policy of obtaining exposure to equities and equity-related securities of companies domiciled or exercising the majority of their economic activity in Europe ex-UK. Each adviser will select the exposures that it obtains on behalf of the Master Fund based on its experience of investing in Europe ex-UK equities, current market conditions and the investment objective of the Master Fund. The Master Fund’s investment strategy will seek to obtain exposure to equities and equity-related securities that will provide long-term capital growth for the Master Fund and will not actively focus on any specific geographic region within Europe ex-UK, industry sector or market capitalisation. The following is the active Share Class in the Sub-Fund as at 31 December 2018: Share Class Share Class Launch Date Currency G Acc EUR 13 August 2018 EUR Fidelity Japan Equity Fund The investment objective of the Sub-Fund is to seek to achieve long-term capital growth. The Fidelity Japan Equity Fund is a feeder UCITS and will seek to achieve its objective by investing up to 100% of its net assets in share classes of the Fidelity Japan Equity Fund (the “Master Fund”), being a sub-fund of Fidelity Common Contractual Fund II, a common contractual fund constituted as an umbrella fund and authorised in Ireland by the Central Bank pursuant to the UCITS Regulations. FIL Investments International (the “Investment Manager”) is the Investment Manager of the Sub-Fund and the Master Fund. The investment objective of the Sub-Fund is that all or substantially all of the proceeds of issue of each Class of Shares in the Sub-Fund (and in any circumstances at least 85% of the Sub-Fund’s Net Asset Value) will be invested in the Master Fund. A small portion of the Sub-Fund may be retained in cash or invested in liquid instruments primarily listed or traded on the Recognised Markets for liquidity purposes and for the purposes of paying any expenses of the Sub-Fund, but such investments will not exceed 15% of the Net Asset Value of the Sub-Fund. Such instruments will include money market instruments including bank deposits, fixed or floating rate instruments (including commercial paper, notes, bankers acceptances, certificates of deposit, debentures and short-dated government or corporate bonds), cash and cash equivalents (including treasury bills) that are rated as investment grade or below or are unrated. While these liquid instruments will be primarily listed or traded on Recognised Markets, some of these instruments may be traded over-the-counter on electronic trade platforms. For the avoidance of doubt, the liquid instruments in which the Sub-Fund will invest do not include total return swaps, securities lending, repurchase agreements or reverse repurchase agreements. The Sub-Fund is expected to have similar performance to the Master Fund but the Sub-Fund’s performance may differ given that it may invest up to 15% of its Net Asset Value in liquid instruments described above. The Sub-Fund is also expected to have a similar risk profile to the Master Fund, which is not expected to have an above average risk profile or high volatility as a result of its use of financial derivative instruments. The investment objective of the Master Fund is identical to that of the Sub-Fund, namely to seek to achieve long-term capital growth. The Master Fund seeks to achieve its objective by obtaining exposure to a diversified portfolio, at least two thirds of which will be exposed to equities or equity-related securities of companies domiciled or exercising the predominant part of their economic activity in Japan.
Fidelity UCITS II ICAV GENERAL INFORMATION (CONTINUED)
4
Fidelity Japan Equity Fund (continued) The Investment Manager (in the context of its role as investment manager of the Master Fund) has appointed a number of discretionary investment advisers as its delegates and will allocate some or all of the Master Fund’s assets to such advisers. The Investment Manager is responsible for actively selecting each adviser to which assets will be allocated, for determining the amount of the Master Fund’s assets to allocate to each adviser and for managing such portion of the Master Fund’s assets as are not allocated to an adviser. FIL Investments International (the “Investment Manager”) is the Investment Manager of the Sub-Fund and the Master Fund. The Master Fund’s investment strategy will pursue a policy of obtaining exposure to equities and equity-related securities of companies domiciled or exercising the majority of their economic activity in Japan. Each adviser will select the exposures that it obtains on behalf of the Master Fund based on its experience of investing in Japanese equities, current market conditions and the investment objective of the Master Fund. The Master Fund’s investment strategy will seek to obtain exposure to equities and equity-related securities that will provide long-term capital growth for the Master Fund and will not actively focus on any specific geographic region within Japan, industry sector or market capitalisation. The following is the active Share Class in the Sub-Fund as at 31 December 2018: Share Class Share Class Launch Date Currency G Acc EUR 23 August 2018 EUR Fidelity North America Equity Fund The investment objective of the Sub-Fund is to seek to achieve long-term capital growth. The Fidelity North America Equity Fund is a feeder UCITS and will seek to achieve its objective by investing up to 100% of its net assets in share classes of the Fidelity North America Equity Fund (the “Master Fund”), being a sub-fund of Fidelity Common Contractual Fund II, a common contractual fund constituted as an umbrella fund and authorised in Ireland by the Central Bank pursuant to the UCITS Regulations. FIL Investments International (the “Investment Manager”) is the Investment Manager of the Sub-Fund and the Master Fund. The investment objective of the Sub-Fund is that all or substantially all of the proceeds of issue of each Class of Shares in the Sub-Fund (and in any circumstances at least 85% of the Sub-Fund’s Net Asset Value) will be invested in the Master Fund. A small portion of the Sub-Fund may be retained in cash or invested in liquid instruments primarily listed or traded on the Recognised Markets for liquidity purposes and for the purposes of paying any expenses of the Sub-Fund, but such investments will not exceed 15% of the Net Asset Value of the Sub-Fund. Such instruments will include money market instruments including bank deposits, fixed or floating rate instruments (including commercial paper, notes, bankers acceptances, certificates of deposit, debentures and short-dated government or corporate bonds), cash and cash equivalents (including treasury bills) that are rated as investment grade or below or are unrated. While these liquid instruments will be primarily listed or traded on Recognised Markets, some of these instruments may be traded over-the-counter on electronic trade platforms. For the avoidance of doubt, the liquid instruments in which the Sub-Fund will invest do not include total return swaps, securities lending, repurchase agreements or reverse repurchase agreements. The Sub-Fund is expected to have similar performance to the Master Fund but the Sub-Fund’s performance may differ given that it may invest up to 15% of its Net Asset Value in liquid instruments described above. The Sub-Fund is also expected to have a similar risk profile to the Master Fund, which is not expected to have an above average risk profile or high volatility as a result of its use of financial derivative instruments. The investment objective of the Master Fund is identical to that of the Sub-Fund, namely to seek to achieve long-term capital growth. The Master Fund seeks to achieve its objective by obtaining exposure to a diversified portfolio, at least two thirds of which will be exposed to equities or equity-related securities of companies domiciled or exercising the predominant part of their economic activity in the United States, Canada or Mexico (“North America”). The Investment Manager (in the context of its role as investment manager of the Master Fund) has appointed a number of discretionary investment advisers as its delegates and will allocate some or all of the Master Fund’s assets to such advisers. The Investment Manager is responsible for actively selecting each adviser to which assets will be allocated, for determining the amount of the Master Fund’s assets to allocate to each adviser and for managing such portion of the Master Fund’s assets as are not allocated to an adviser.

Fidelity UCITS II ICAV GENERAL INFORMATION (CONTINUED)
5
Fidelity North America Equity Fund (continued) The Master Fund’s investment strategy will pursue a policy of obtaining exposure to equities and equity-related securities of companies domiciled or exercising the majority of their economic activity in North America. Each adviser will select the exposures that it obtains on behalf of the Master Fund based on its experience of investing in North American equities, current market conditions and the investment objective of the Master Fund. The Master Fund’s investment strategy will seek to obtain exposure to equities and equity-related securities that will provide long-term capital growth for the Master Fund and will not actively focus on any specific geographic region within North America, industry sector or market capitalisation. The following is the active Share Class in the Sub-Fund as at 31 December 2018: Share Class Share Class Launch Date Currency G Acc EUR 28 August 2018 EUR Fidelity UK Equity Fund The investment objective of the Sub-Fund is to seek to achieve long-term capital growth. The Fidelity UK Equity Fund is a feeder UCITS and will seek to achieve its objective by investing up to 100% of its net assets in share classes of the Fidelity UK Equity Fund (the “Master Fund”), being a sub-fund of Fidelity Common Contractual Fund II, a common contractual fund constituted as an umbrella fund and authorised in Ireland by the Central Bank pursuant to the UCITS Regulations. The investment manager of the Master Fund is the same as the Investment Manager of the Sub-Fund. FIL Investments International (the “Investment Manager”) is the Investment Manager of the Sub-Fund and the Master Fund. The investment objective of the Sub-Fund is that all or substantially all of the proceeds of issue of each Class of Shares in the Sub-Fund (and in any circumstances at least 85% of the Sub-Fund’s Net Asset Value) will be invested in the Master Fund. A small portion of the Sub-Fund may be retained in cash or invested in liquid instruments primarily listed or traded on the Recognised Markets for liquidity purposes and for the purposes of paying any expenses of the Sub-Fund, but such investments will not exceed 15% of the Net Asset Value of the Sub-Fund. Such instruments will include money market instruments including bank deposits, fixed or floating rate instruments (including commercial paper, notes, bankers acceptances, certificates of deposit, debentures and short-dated government or corporate bonds), cash and cash equivalents (including treasury bills) that are rated as investment grade or below or are unrated. While these liquid instruments will be primarily listed or traded on Recognised Markets, some of these instruments may be traded over-the-counter on electronic trade platforms. For the avoidance of doubt, the liquid instruments in which the Sub-Fund will invest do not include total return swaps, securities lending, repurchase agreements or reverse repurchase agreements. The Sub-Fund is expected to have similar performance to the Master Fund but the Sub-Fund’s performance may differ given that it may invest up to 15% of its Net Asset Value in liquid instruments described above. The Sub-Fund is also expected to have a similar risk profile to the Master Fund, which is not expected to have an above average risk profile or high volatility as a result of its use of financial derivative instruments. The investment objective of the Master Fund is identical to that of the Sub-Fund, namely to seek to achieve long-term capital growth. The Master Fund seeks to achieve its objective by obtaining exposure to a diversified portfolio, at least two thirds of which will be exposed to equities or equity-related securities of companies domiciled or exercising the predominant part of their economic activity in the United Kingdom (the “UK”). The Investment Manager (in the context of its role as investment manager of the Master Fund) has appointed a number of discretionary investment advisers as its delegates and will allocate some or all of the Master Fund’s assets to such advisers. The Investment Manager is responsible for actively selecting each adviser to which assets will be allocated, for determining the amount of the Master Fund’s assets to allocate to each adviser and for managing such portion of the Master Fund’s assets as are not allocated to an adviser. The Master Fund’s investment strategy will pursue a policy of obtaining exposure to equities and equity-related securities of companies domiciled or exercising the majority of their economic activity in the UK. Each adviser will select the exposures that it obtains on behalf of the Master Fund based on its experience of investing in UK equities, current market conditions and the investment objective of the Master Fund. The Master Fund’s investment strategy will seek to obtain exposure to equities and equity-related securities that will provide long-term capital growth for the Master Fund and will not actively focus on any specific geographic region within the UK, industry sector or market capitalisation.

Fidelity UCITS II ICAV GENERAL INFORMATION (CONTINUED)
6
Fidelity UK Equity Fund (continued) The following is the active Share Class in the Sub-Fund as at 31 December 2018: Share Class Share Class Launch Date Currency G Acc EUR 29 August 2018 EUR Fidelity Global Aggregate Bond Fund The investment objective of the Sub-Fund is to seek to achieve long-term capital growth and income. The Fidelity Global Aggregate Bond Fund is a feeder UCITS and will seek to achieve its objective by investing up to 100% of its net assets in share classes of the Fidelity Global Aggregate Bond Fund (the “Master Fund”), being a sub-fund of Fidelity Common Contractual Fund II, a common contractual fund constituted as an umbrella fund and authorised in Ireland by the Central Bank pursuant to the UCITS Regulations. FIL Investments International (the “Investment Manager”) is the Investment Manager of the Sub-Fund and the Master Fund. The investment objective of the Sub-Fund is that all or substantially all of the proceeds of issue of each Class of Shares in the Sub-Fund (and in any circumstances at least 85% of the Sub-Fund’s Net Asset Value) will be invested in the Master Fund. A small portion of the Sub-Fund may be retained in cash or invested in liquid instruments primarily listed or traded on the Recognised Markets for liquidity purposes and for the purposes of paying any expenses of the Sub-Fund, but such investments will not exceed 15% of the Net Asset Value of the Sub-Fund. Such instruments will include money market instruments including bank deposits, fixed or floating rate instruments (including commercial paper, notes, bankers acceptances, certificates of deposit, debentures and short-dated government or corporate bonds), cash and cash equivalents (including treasury bills) that are rated as investment grade or below or are unrated. While these liquid instruments will be primarily listed or traded on Recognised Markets, some of these instruments may be traded over-the-counter on electronic trade platforms. For the avoidance of doubt, the liquid instruments in which the Sub-Fund will invest do not include total return swaps, securities lending, repurchase agreements or reverse repurchase agreements. The Sub-Fund is expected to have similar performance to the Master Fund but the Sub-Fund’s performance may differ given that it may invest up to 15% of its Net Asset Value in liquid instruments described above. The Sub-Fund is also expected to have a similar risk profile to the Master Fund, which is not expected to have an above average risk profile or high volatility as a result of its use of financial derivative instruments. The investment objective of the Master Fund is identical to that of the Sub-Fund, namely to seek to achieve long-term capital growth and income. The Master Fund seeks to achieve its objective by obtaining exposure to a diversified portfolio of fixed income securities, as described further below. The Investment Manager (in the context of its role as investment manager of the Master Fund) has appointed a number of discretionary investment advisers as its delegates and will allocate some or all of the Master Fund’s assets to such advisers. The Investment Manager is responsible for actively selecting each adviser to which assets will be allocated, for determining the amount of the Master Fund’s assets to allocate to each adviser and for managing such portion of the Master Fund’s assets as are not allocated to an adviser. The Master Fund’s investment strategy will pursue a policy of obtaining exposure to investment grade fixed, floating and adjustable rate, government and corporate debt securities issued by issuers located anywhere in the world (including emerging market countries) and each adviser will select the exposures that it obtains on behalf of the Master Fund based on its experience of investing in debt securities, current market conditions and the investment objective of the Master Fund. The Master Fund’s investment strategy will seek to select debt securities that will provide long-term capital growth for the Master Fund and will not actively focus on any specific geographic region, industry sector or issuer capitalisation. The following is the active Share Class in the Sub-Fund as at 31 December 2018: Share Class Share Class Launch Date Currency G Acc EUR 30 August 2018 EUR

Fidelity UCITS II ICAV GENERAL INFORMATION (CONTINUED)
7
Fidelity Global Sub-IG Fixed Income Fund The investment objective of the Sub-Fund is to seek to achieve long-term capital growth and income. The Fidelity Global Sub-IG Fixed Income Fund is a feeder UCITS and will seek to achieve its objective by investing up to 100% of its net assets in share classes of the Fidelity Global Sub-IG Fixed Income Fund (the “Master Fund”), being a sub-fund of Fidelity Common Contractual Fund II, a common contractual fund constituted as an umbrella fund and authorised in Ireland by the Central Bank pursuant to the UCITS Regulations. FIL Investments International (the “Investment Manager”) is the Investment Manager of the Sub-Fund and the Master Fund. The investment objective of the Sub-Fund is that all or substantially all of the proceeds of issue of each Class of Shares in the Sub-Fund (and in any circumstances at least 85% of the Sub-Fund’s Net Asset Value) will be invested in the Master Fund. A small portion of the Sub-Fund may be retained in cash or invested in liquid instruments primarily listed or traded on the Recognised Markets for liquidity purposes and for the purposes of paying any expenses of the Sub-Fund, but such investments will not exceed 15% of the Net Asset Value of the Sub-Fund. Such instruments will include money market instruments including bank deposits, fixed or floating rate instruments (including commercial paper, notes, bankers acceptances, certificates of deposit, debentures and short-dated government or corporate bonds), cash and cash equivalents (including treasury bills) that are rated as investment grade or below or are unrated. While these liquid instruments will be primarily listed or traded on Recognised Markets, some of these instruments may be traded over-the-counter on electronic trade platforms. For the avoidance of doubt, the liquid instruments in which the Sub-Fund will invest do not include total return swaps, securities lending, repurchase agreements or reverse repurchase agreements. The Sub-Fund is expected to have similar performance to the Master Fund but the Sub-Fund’s performance may differ given that it may invest up to 15% of its Net Asset Value in liquid instruments described above. The Sub-Fund is also expected to have a similar risk profile to the Master Fund, which is not expected to have an above average risk profile or high volatility as a result of its use of financial derivative instruments. The investment objective of the Master Fund is identical to that of the Sub-Fund, namely to seek to achieve long-term capital growth and income. The Master Fund seeks to achieve its objective by obtaining exposure to a diversified portfolio of sub-investment grade fixed income securities, as described further below. The Investment Manager (in the context of its role as investment manager of the Master Fund) has appointed a number of discretionary investment advisers as its delegates and will allocate some or all of the Master Fund’s assets to such advisers. The Investment Manager is responsible for actively selecting each adviser to which assets will be allocated, for determining the amount of the Master Fund’s assets to allocate to each adviser and for managing such portion of the Master Fund’s assets as are not allocated to an adviser. The Master Fund’s investment strategy will pursue a policy of obtaining exposure to fixed, floating and adjustable rate, government and corporate debt securities issued by issuers located anywhere in the world (including emerging market countries) and each adviser will select the exposures that it obtains on behalf of the Master Fund based on its experience of investing in sub-investment grade debt securities, current market conditions and the investment objective of the Master Fund. The Master Fund’s investment strategy will seek to select sub-investment grade debt securities that will provide long-term capital growth for the Master Fund and will not actively focus on any specific geographic region, industry sector or issuer capitalisation. The following is the active Share Class in the Sub-Fund as at 31 December 2018: Share Class Share Class Launch Date Currency G Acc EUR 30 August 2018 EUR Fidelity Asia Pacific ex-Japan Equity Fund The investment objective of the Sub-Fund is to seek to achieve long-term capital growth. The Sub-Fund is a feeder UCITS and will seek to achieve its objective by investing up to 100% of its net assets in share classes of the Fidelity Asia Pacific ex-Japan Equity Fund (the “Master Fund”), being a sub-fund of Fidelity Common Contractual Fund II, a common contractual fund constituted as an umbrella fund and authorised in Ireland by the Central Bank pursuant to the UCITS Regulations. FIL Investments International (the “Investment Manager”) is the Investment Manager of the Sub-Fund and the Master Fund.

Fidelity UCITS II ICAV GENERAL INFORMATION (CONTINUED)
8
Fidelity Asia Pacific ex-Japan Equity Fund (continued) The investment policy of the Sub-Fund is that all or substantially all of the proceeds of issue of each Class of Shares in the Sub-Fund (and in any circumstances at least 85% of the Sub-Fund’s Net Asset Value) will be invested in the Master Fund. A small portion of the Sub-Fund may be retained in cash or invested in liquid instruments primarily listed or traded on the Recognised Markets for liquidity purposes and for the purposes of paying any expenses of the Sub-Fund, but such investments will not exceed 15% of the Net Asset Value of the Sub-Fund. Such instruments will include money market instruments including bank deposits, fixed or floating rate instruments (including commercial paper, notes, bankers acceptances, certificates of deposit, debentures and short-dated government or corporate bonds), cash and cash equivalents (including treasury bills) that are rated as investment grade or below or are unrated. While these liquid instruments will be primarily listed or traded on Recognised Markets, some of these instruments may be traded over-the-counter on electronic trade platforms. For the avoidance of doubt, the liquid instruments in which the Sub-Fund will invest do not include total return swaps, securities lending, repurchase agreements or reverse repurchase agreements. The Sub-Fund is expected to have similar performance to the Master Fund but the Sub-Fund’s performance may differ given that it may invest up to 15% of its Net Asset Value in liquid instruments described above. The Sub-Fund is also expected to have a similar risk profile to the Master Fund, which is not expected to have an above average risk profile or high volatility as a result of its use of financial derivative instruments. The investment objective of the Master Fund is identical to that of the Sub-Fund, namely to seek to achieve long-term capital growth. The Master Fund seeks to achieve its objective by obtaining exposure to a diversified portfolio, at least two thirds of which will be exposed to equities or equity-related securities of companies domiciled or exercising the predominant part of their economic activity in the Asia Pacific region, excluding Japan (“Asia Pacific ex-Japan”). The Investment Manager (in the context of its role as investment manager of the Master Fund) has appointed a number of discretionary investment advisers as its delegates and will allocate some or all of the Master Fund’s assets to such advisers. The Investment Manager is responsible for actively selecting each adviser to which assets will be allocated, for determining the amount of the Master Fund’s assets to allocate to each adviser and for managing such portion of the Master Fund’s assets as are not allocated to an adviser. The Master Fund’s investment strategy will pursue a policy of obtaining exposure to equities and equity-related securities of companies domiciled or exercising the majority of their economic activity in Asia Pacific ex-Japan. Each adviser will select the exposures that it obtains on behalf of the Master Fund based on its experience of investing in Asia Pacific ex-Japan equities, current market conditions and the investment objective of the Master Fund. The Master Fund’s investment strategy will seek to obtain exposure to equities and equity-related securities that will provide long-term capital growth for the Master Fund and will not actively focus on any specific geographic region within the Asia Pacific ex-Japan, industry sector or market capitalisation. The following is the active Share Class in the Sub-Fund as at 31 December 2018: Share Class Share Class Launch Date Currency G Acc EUR 31 August 2018 EUR Fidelity Alternative Listed Equity Fund The investment objective of the Sub-Fund is to seek to achieve long-term capital growth. The Fidelity Alternative Listed Equity Fund is a feeder UCITS and will seek to achieve its objective by investing up to 100% of its net assets in share classes of the Fidelity Alternative Listed Equity Fund (the “Master Fund”), being a sub-fund of Fidelity Common Contractual Fund II, a common contractual fund constituted as an umbrella fund and authorised in Ireland by the Central Bank pursuant to the UCITS Regulations. FIL Investments International (the “Investment Manager”) is the Investment Manager of the Sub-Fund and the Master Fund. The investment objective of the Sub-Fund is that all or substantially all of the proceeds of issue of each Class of Shares in the Sub-Fund (and in any circumstances at least 85% of the Sub-Fund’s Net Asset Value) will be invested in the Master Fund. A small portion of the Sub-Fund may be retained in cash or invested in liquid instruments primarily listed or traded on the Recognised Markets for liquidity purposes and for the purposes of paying any expenses of the Sub-Fund, but such investments will not exceed 15% of the Net Asset Value of the Sub-Fund. Such instruments will include money market instruments including bank deposits, fixed or floating rate instruments (including commercial paper, notes, bankers acceptances, certificates of deposit, debentures and short-dated government or corporate bonds), cash and cash equivalents (including treasury bills) that are rated as investment grade or below or are unrated.

Fidelity UCITS II ICAV GENERAL INFORMATION (CONTINUED)
9
Fidelity Alternative Listed Equity Fund (continued) While these liquid instruments will be primarily listed or traded on Recognised Markets, some of these instruments may be traded over-the-counter on electronic trade platforms. For the avoidance of doubt, the liquid instruments in which the Sub-Fund will invest do not include total return swaps, securities lending, repurchase agreements or reverse repurchase agreements. The Sub-Fund is expected to have similar performance to the Master Fund but the Sub-Fund’s performance may differ given that it may invest up to 15% of its Net Asset Value in liquid instruments described above. The Sub-Fund is also expected to have a similar risk profile to the Master Fund, which is not expected to have an above average risk profile or high volatility as a result of its use of financial derivative instruments. The investment objective of the Master Fund is identical to that of the Sub-Fund, namely to seek to achieve long-term capital growth. The Master Fund seeks to achieve its objective by obtaining exposure to a portfolio primarily made up of listed equities or equity-related securities. The Investment Manager (in the context of its role as investment manager of the Master Fund) has appointed a number of discretionary investment advisers as its delegates and will allocate some or all of the Master Fund’s assets to such advisers. The Investment Manager is responsible for actively selecting each adviser to which assets will be allocated, for determining the amount of the Master Fund’s assets to allocate to each adviser and for managing such portion of the Master Fund’s assets as are not allocated to an adviser. The Master Fund’s investment strategy will pursue a policy of obtaining exposure to listed equities and equity-related securities. Each adviser will select the exposures that it obtains on behalf of the Master Fund based on its experience of investing in equities, current market conditions and the investment objective of the Master Fund. The Master Fund’s investment strategy will seek to obtain exposure to equities and equity-related securities that will provide long-term capital growth for the Master Fund. The selection will not actively focus on any specific geographic region, industry sector or market capitalisation. The following is the active Share Class in the Sub-Fund as at 31 December 2018: Share Class Share Class Launch Date Currency G Acc EUR 12 September 2018 EUR Fidelity Global Emerging Markets Equity Fund The investment objective of the Sub-Fund is to seek to achieve long-term capital growth. The Fidelity Global Emerging Markets Equity Fund is a feeder UCITS and will seek to achieve its objective by investing up to 100% of its net assets in share classes of the Fidelity Global Emerging Markets Equity Fund (the “Master Fund”), being a sub-fund of Fidelity Common Contractual Fund II, a common contractual fund constituted as an umbrella fund and authorised in Ireland by the Central Bank pursuant to the UCITS Regulations. FIL Investments International (the “Investment Manager”) is the Investment Manager of the Sub-Fund and the Master Fund. The investment objective of the Sub-Fund is that all or substantially all of the proceeds of issue of each Class of Shares in the Sub-Fund (and in any circumstances at least 85% of the Sub-Fund’s Net Asset Value) will be invested in the Master Fund. A small portion of the Sub-Fund may be retained in cash or invested in liquid instruments primarily listed or traded on the Recognised Markets for liquidity purposes and for the purposes of paying any expenses of the Sub-Fund, but such investments will not exceed 15% of the Net Asset Value of the Sub-Fund. Such instruments will include money market instruments including bank deposits, fixed or floating rate instruments (including commercial paper, notes, bankers acceptances, certificates of deposit, debentures and short-dated government or corporate bonds), cash and cash equivalents (including treasury bills) that are rated as investment grade or below or are unrated.
While these liquid instruments will be primarily listed or traded on Recognised Markets, some of these instruments may be traded over-the-counter on electronic trade platforms. For the avoidance of doubt, the liquid instruments in which the Sub-Fund will invest do not include total return swaps, securities lending, repurchase agreements or reverse repurchase agreements.
The Sub-Fund is expected to have similar performance to the Master Fund but the Sub-Fund’s performance may differ given that it may invest up to 15% of its Net Asset Value in liquid instruments described above. The Sub-Fund is also expected to have a similar risk profile to the Master Fund, which is not expected to have an above average risk profile or high volatility as a result of its use of financial derivative instruments.

Fidelity UCITS II ICAV GENERAL INFORMATION (CONTINUED)
10
Fidelity Global Emerging Markets Equity Fund (continued)
The investment objective of the Master Fund is identical to that of the Sub-Fund, namely to seek to achieve long-term capital growth. The Master Fund seeks to achieve its objective by obtaining exposure to a diversified portfolio, at least two thirds of which will be exposed to equities or equity-related securities of companies domiciled or exercising the predominant part of their economic activity in emerging market countries (i.e. any country other than one which the World Bank defines as a High Income OECD member country). The Investment Manager (in the context of its role as investment manager of the Master Fund) has appointed a number of discretionary investment advisers as its delegates and will allocate some or all of the Master Fund’s assets to such advisers. The Investment Manager is responsible for actively selecting each adviser to which assets will be allocated, for determining the amount of the Master Fund’s assets to allocate to each adviser and for managing such portion of the Master Fund’s assets as are not allocated to an adviser. The Master Fund’s investment strategy will pursue a policy of obtaining exposure to equities and equity-related securities of companies domiciled or exercising the majority of their economic activity in emerging market countries. Each adviser will select the exposures that it obtains on behalf of the Master Fund based on its experience of investing in emerging market equities, current market conditions and the investment objective of the Master Fund. The Master Fund’s investment strategy will seek to obtain exposure to equities and equity-related securities that will provide long-term capital growth for the Master Fund and will not actively focus on any emerging market country, industry sector or market capitalisation. The following is the active Share Class in the Sub-Fund as at 31 December 2018: Share Class Share Class Launch Date Currency G Acc EUR 14 September 2018 EUR

Fidelity UCITS II ICAV INVESTMENT MANAGER’S REPORT
11
Fidelity Europe ex-UK Equity Fund Fidelity Europe ex-UK Equity Fund is a feeder UCITS and will seek to achieve its objective by investing up to 100% of its net assets in unit classes of the Fidelity Europe ex-UK Equity Fund (the “Master Fund”), being a sub-fund of Fidelity Common Contractual Fund II, a common contractual fund constituted as an umbrella fund and authorised in Ireland by the Central Bank pursuant to the UCITS Regulations. The investment manager of the Master Fund is the same as the Investment Manager of the Sub-Fund. Market Commentary: European markets declined over the review period. During the third quarter of 2018, gains from strong corporate earnings and easing trade tensions between the US and Europe were largely offset by concerns around Brexit and Italy’s higher than expected budget deficit. Equities declined the most towards the end of the year, primarily due to ongoing trade worries, continued Brexit-related uncertainty and weak corporate earnings. Concerns over whether the US and China would be able to reach a long-term agreement during the 90-day truce period, and the deferment of the parliamentary vote on Brexit weighed on equities. Portfolio Commentary: The Master Fund returned -12.68% for the period while the MSCI Europe Ex UK Net returned -10.82%. At the sub-fund level, both the sub-investment advisers hampered performance. The exposure to a sub-investment adviser following a growth style of investing detracted significantly from returns, driven by positions in the industrials, health care and consumer discretionary sectors. Elsewhere, a sub-investment adviser following a value style of investing hampered performance. Its underlying holdings in the financials sector detracted from returns, though positions in the communication services sector supported performance. At the sub-fund level, underlying holdings in the industrials and financials sectors detracted from returns. At the country level, the exposure to Germany and France were the key detractors from performance. At the security level, holdings in Fresenius Medical Care AG & Co. and Elis SA held back gains. Meanwhile, positions in Deutsche Telekom AG and Vestas Wind Systems A/S supported returns. Outlook: Slowing global lead indicators and an uncertain geopolitical environment could prompt investors to become cautious. In an increasingly volatile environment, where valuations appear full in most markets, European equities look relatively attractive. European equities have already de-rated significantly in the second half of 2018. Therefore, any slowdown in economic growth is likely to have a limited impact on stocks. There is a need to be selective, however, as the market has areas of very attractively valued companies and others that are still very expensive. Equity markets are set to face some challenges due to ongoing trade concerns between the US and its major trading partners. The deficit situation in Italy and uncertainty around Brexit also remain a cause for concern. These factors, combined with the slowdown in global economic growth, will negatively impact investors’ preference for risk assets. Nonetheless, an uncertain market environment is likely to create buying opportunities for long-term investors Fidelity Japan Equity Fund Fidelity Japan Equity Fund is a feeder UCITS and will seek to achieve its objective by investing up to 100% of its net assets in unit classes of the Fidelity Japan Equity Fund (the “Master Fund”), being a sub-fund of Fidelity Common Contractual Fund II, a common contractual fund constituted as an umbrella fund and authorised in Ireland by the Central Bank pursuant to the UCITS Regulations. The investment manager of the Master Fund is the same as the Investment Manager of the Sub-Fund. Market Commentary: Japanese equities fell over the review period. The yen’s rise against the US dollar towards the end of the period and persistent worries about the ongoing trade frictions between the US and China weighed on markets. The Japanese economy contracted the most in over four years in the third quarter of 2018 as companies slashed spending. However, key indicators related to production, capital expenditure and consumption have started to rebound, and the economy was expected to return to above-trend growth in the fourth quarter. Earnings expectations have moderated in 2018, with Japanese corporate profits expected to grow at a slower pace in 2019 on account of weaker demand, especially from overseas. Portfolio Commentary: The Master Fund returned -13.96% for the period while the Topix JPY (Net Return) returned -12.95%. At the sub-fund level, all the sub-investment advisers generated negative performance. This was largely attributable to the significant exposure to a sub-investment adviser following a market capitalisation agnostic strategy, where performance was driven by positions in the consumer staples and health care sectors. Meanwhile, underlying holdings in the information technology sector marginally supported returns. Elsewhere, the exposure to a sub-investment adviser following a value strategy detracted from performance, driven by positions in the consumer discretionary and financials sectors. At the sub-fund level, all sectors weighed on returns. Underlying holdings in the consumer discretionary, financials and industrials sectors were the key detractors from performance. At the security level, positions in Square Enix Holdings Company Limited and Hogy Medical Company Limited hampered returns. Meanwhile, the allocation to OBIC Business Consultants Company Limited added marginal value.

Fidelity UCITS II ICAV INVESTMENT MANAGER’S REPORT (CONTINUED)
12
Fidelity Japan Equity Fund (continued) Outlook: Global growth has moderated, with a deceleration in trade volumes feeding through to industrial production. In Japan, a combination of extreme weather and natural disasters contributed to the recent weakness. Escalating trade frictions continue to pose downside risks. Amid the increased market volatility, post-earnings price action has been distinctly negative and, in many cases, has discounted a worst-case scenario. Earnings expectations have moderated, but valuations are supportive and a further significant derating appears unlikely. Fidelity North America Equity Fund Fidelity North America Equity Fund is a feeder UCITS and will seek to achieve its objective by investing up to 100% of its net assets in unit classes of the Fidelity North America Equity Fund (the “Master Fund”), being a sub-fund of Fidelity Common Contractual Fund II, a common contractual fund constituted as an umbrella fund and authorised in Ireland by the Central Bank pursuant to the UCITS Regulations. The investment manager of the Master Fund is the same as the Investment Manager of the Sub-Fund. Market Commentary: US equities fell during the period, mainly on account of a sharp decline in the fourth quarter, amid heightened concerns over economic growth, trade frictions and higher interest rates. Data releases pointed to a continued expansion in the economy; however, consumers are becoming less confident and manufacturing surveys are mixed. There was some optimism about a truce in the trade war between the US and China in December, but investors remain sceptical about a firm consensus on trade issues between the countries. The market was further pressured as the US yield curve flattened towards the end of the period. As widely expected, the US Federal Reserve (Fed) raised its benchmark interest rate for the fourth time in 2018. However, the Fed’s tightening stance added to the jitters as it indicated that interest rates will rise two more times next year as economic growth continues. Portfolio Commentary: The Master Fund returned -8.26% for the period while the S&P 500 Net returned -9.04%. At the sub-fund level, all the sub-investment advisers generated negative performance. This was largely attributable to a sub-investment adviser following a large-cap value strategy, where performance was driven by positions in the financials and energy sectors. Meanwhile, the exposure to cash supported returns. Elsewhere, the significant exposure to a sub-investment Fidelity adviser following a value strategy detracted from performance, driven by positions in the financials and information technology sectors. Meanwhile, underlying holdings in the utilities sector marginally supported returns. At the sub-fund level, the underlying holdings in the financials, information technology and energy sectors were the key detractors from performance. At the security level, the holding in Apache Corporation weighed on returns. Meanwhile, positions in Abbott Laboratories and Berkshire Hathaway added some value. Outlook: The US economy is likely to moderate in 2019 as the capital expenditure cycle slows and some of the positive impact of fiscal stimulus fades. However, rising wages, tax refunds and the decline in oil prices should continue to support consumer spending. The Fed has signalled a more cautious stance in raising interest rates and indicated that it may reduce the number of rate hikes in 2019 as growth moderates. Nonetheless, the US market outlook is supported by its above-trend economic growth. It remains a defensive market relative to its global peers. Growing trade tensions between the US and China has been the major focus for investors over the last few months. However, there are hopes of a de-escalation in the dispute amid expectations that the two countries are making progress on trade negotiations. Fidelity UK Equity Fund Fidelity UK Equity Fund is a feeder UCITS and will seek to achieve its objective by investing up to 100% of its net assets in unit classes of the Fidelity UK Equity Fund (the “Master Fund”), being a sub-fund of Fidelity Common Contractual Fund II, a common contractual fund constituted as an umbrella fund and authorised in Ireland by the Central Bank pursuant to the UCITS Regulations. The investment manager of the Master Fund is the same as the Investment Manager of the Sub-Fund.

Fidelity UCITS II ICAV INVESTMENT MANAGER’S REPORT (CONTINUED)
13
Fidelity UK Equity Fund (continued) Market Commentary: The UK stock market fell over the review period, as lingering concerns about a possible slowdown in the global economy, Brexit-related uncertainties and the ongoing trade friction between the US and China led to risk-off sentiment in financial markets. The normalisation of monetary policies by global central banks, particularly the US Federal Reserve, also weighed on sentiment as investors fear that a rise in borrowing costs may lead to an economic slowdown. On the policy front, the Bank of England raised interest rates by a quarter of a percentage point, from 0.5% to 0.75%, the highest level since March 2009. Overall, most sectors ended in negative territory, with industrials, consumer services and consumer goods among the largest decliners, while the health care sector outperformed the broader market. Meanwhile, mid-cap stocks underperformed their large and small-cap peers. Portfolio Commentary: The Master Fund returned -10.85% for the period while the FTSE All Share returned -11.16%. At the sub-fund level, all the sub-investment advisers generated negative returns. This was attributable to a sub-investment Fidelity adviser following a contrarian and value strategy, where performance was driven by positions in the financials and industrials sectors. Meanwhile, holdings in the health care sector marginally supported returns. Elsewhere, the significant exposure to a sub-investment adviser following an income strategy detracted from performance, driven by positions in the financials and industrials sectors. However, the underlying holdings in the health care sector and in cash added some value. At the sub-fund level, the underlying holdings in the financials, consumer staples and industrials sectors were the key detractors from returns. At the security level, holdings in Schroders PLC and Tesco PLC detracted from performance. Meanwhile, the position in Greggs PLC marginally supported returns. Outlook: The economic environment in the UK remains uncertain as it heads towards its exit from the European Union in March 2019. Against this volatile backdrop, investors have preferred US and European stocks in comparison to UK stocks, resulting in a ‘Brexit’ discount. This presents an interesting investment opportunity for the long-term investor. Financial conditions in the UK have tightened slightly, but remain accommodative overall. Despite various challenges, UK equity markets are supported by low interest rates and reasonable stock valuations. Fidelity Global Aggregate Bond Fund Fidelity Global Aggregate Bond Fund is a feeder UCITS and will seek to achieve its objective by investing up to 100% of its net assets in unit classes of the Fidelity Global Aggregate Bond Fund (the “Master Fund”), being a sub-fund of Fidelity Common Contractual Fund II, a common contractual fund constituted as an umbrella fund and authorised in Ireland by the Central Bank pursuant to the UCITS Regulations. The investment manager of the Master Fund is the same as the Investment Manager of the Sub-Fund. Market Commentary: Fixed income markets posted mixed returns over the review period, with global government bonds ending the year on a positive note. US Treasuries rallied on the back of the more accommodative stance by US Federal Reserve (Fed) Chairman Jerome Powell. Yields were near eight-month lows as weak oil prices and concerns over a potentially long US government shutdown weighed on investor sentiment. Japan’s ten-year bond yield fell below zero for the first time since September 2017, in line with US Treasuries. German bunds also posted positive returns as the eurozone economy witnessed a disappointing end to 2018. Business growth slowed to its weakest pace in over two years in December, as a manufacturing-led slowdown showed signs of spreading to the service industry. UK government bonds (Gilts) followed suit; yields fell after prime minister Theresa May delayed the vote on the Brexit deal in the UK parliament. On the policy front, the US Fed raised its benchmark interest rate twice over the period, while the Bank of Japan and Bank of England kept their policy rates unchanged. Meanwhile, credit markets generated negative performance. Spreads widened across major regions amid concerns over a slowdown in global growth, stock market volatility, a broader deterioration in risk sentiment and China-US trade tensions. High yield bonds came under pressure, with notable underperformance among energy issuers, driven by lower oil prices. Portfolio Commentary: The Master Fund returned 0.24% for the period while the Barclays Global Agg Hedged GBP returned 0.92%. At the sub-fund level, a sub-investment adviser that invests primarily in government bonds enhanced gains. Its performance was driven by holdings in AAA rated US government bonds with a maturity period of 7–10 years. Elsewhere, the significant exposure to a sub-investment adviser following a global aggregate strategy detracted from returns, due to holdings in short-term bonds. At the sub-fund level, the underlying holdings in AAA rated US government bonds with a maturity period of 7–10 years contributed notably to returns. However, positions in short-term bonds detracted from performance. Elsewhere, the exposure to cash marginally supported returns.

Fidelity UCITS II ICAV INVESTMENT MANAGER’S REPORT (CONTINUED)
14
Fidelity Global Aggregate Bond Fund (continued) Outlook: The global economy is expected to post weaker growth as some of the world’s largest countries approach the tail-end of their current economic cycles, pushing down global economic activity and, especially, global demand. Moreover, both political and trade tensions between China and the US remain elevated, fuelling economic uncertainty. With markets seeing a sharp turnaround in risk sentiment, we expect the US Federal Reserve to limit the pace of monetary policy tightening. Oil prices also remain a big driver for US Treasuries, as lower prices will ultimately result in a less inflationary environment and government bonds are likely to be well supported. However, some indicators suggest that the US economy is still healthy. The labour market continues to signal rising wage pressures and any improvement in the economy in the short term will drive global sovereign yields higher. In Europe, German bunds are likely to be well supported, as we believe that growth has passed its cyclical peak. According to consensus expectations, the eurozone is likely to grow 1.6% in 2019. Meanwhile, in credit markets, we remain cautious towards risky assets as we see further credit spread widening and outflows from the asset class. Fidelity Global Sub-IG Fixed Income Fund Fidelity Global Sub-IG Fixed Income Fund is a feeder UCITS and will seek to achieve its objective by investing up to 100% of its net assets in unit classes of the Fidelity Global Sub-IG Fixed Income Fund (the “Master Fund”), being a sub-fund of Fidelity Common Contractual Fund II, a common contractual fund constituted as an umbrella fund and authorised in Ireland by the Central Bank pursuant to the UCITS Regulations. The investment manager of the Master Fund is the same as the Investment Manager of the Sub-Fund. Market Commentary: The high yield market remained volatile and credit spreads widened, as markets continued to be dominated by geopolitical events. The global trade war, Brexit concerns and tension between Italy and the European Union (EU) contributed to the risk-off environment. On the macroeconomic front, the eurozone economy witnessed a disappointing end to 2018. Business growth slowed to its weakest pace in over two years in December, as a manufacturing-led slowdown showed signs of spreading to the service industry. The IHS Markit’s Composite Purchasing Managers’ Index (PMI) for the eurozone fell to 51.1 in December, while the services PMI dropped sharply to 51.2 vs. 54.7 in September, a 49-month low. While the ‘yellow vest’ protest in France contributed to a slowdown in business and travel, slow economic growth across the eurozone remains a bigger cause for concern. In core Europe, German private sector activity grew at the slowest pace in four years in December. The composite PMI for Germany dropped to 51.6 from 55.0 in September, below economists’ forecast of 52.4. The manufacturing PMI for Germany dropped to a 33-month low of 51.5 from 53.7 at the end of the third quarter of 2018, compared to expectations of 51.7, while the services PMI decreased to a 27-month low of 51.8. On the inflation front, the eurozone’s annual inflation rate was 1.9% in November 2018, down from 2.1% in September, and below the European Central Bank’s (ECB) target rate of 2.0%. On a positive note, Italy reached an agreement with Brussels over its 2019 budget after it lowered its deficit target to 2.04% of GDP from 2.4%. On the policy front, the European Central Bank (ECB) left its interest rates unchanged and confirmed that the asset purchase programme will end in December 2018, despite signs of a slowdown in the eurozone recovery. Portfolio Commentary: The Master Fund returned -2.66% for the period while the 50% ICE BofA 50% JPM Blend returned -1.17%. At the sub-fund level, both the sub-investment advisers delivered negative returns. This was largely attributable to the significant exposure to a sub-investment adviser that invests primarily in high yield bonds. Its performance was weighed down by holdings in the US. At a sector level, all sectors detracted from returns, with the exposure to the energy sector significantly hampering performance. Elsewhere, the allocation to a sub-investment adviser investing primarily in emerging market bonds weighed on returns. At the sub-fund level, the underlying holdings in the US were the key detractors from performance, while the position in Indonesia added value. In terms of ratings, B rated bonds had a negative impact on performance, while BBB rated bonds marginally supported returns. In terms of maturity, bonds having a maturity of 3–5 years detracted from performance, while long-terms bonds with a maturity of between 10 and 15 years added marginal value. Elsewhere, the allocation to cash enhanced gains. Outlook: Investor appetite for risk assets is likely to remain subdued in 2019, as macroeconomic uncertainty and low liquidity are expected to weigh on investor sentiment and underlying consumer and business confidence. At a regional level, corporate earnings in the US are expected to witness a further deceleration in growth, as the positive effects of the corporate tax reform wear off. In Europe, political events, including Brexit negotiations, the Italian budget and upcoming EU elections remain at the forefront. Consequently, corporates will look to reprioritise capital allocation towards growth assets amid tightening liquidity conditions. However, given minimal refinancing needs in developed high yield markets, default rates are likely to remain low.

Fidelity UCITS II ICAV INVESTMENT MANAGER’S REPORT (CONTINUED)
15
Fidelity Asia Pacific ex-Japan Equity Fund Fidelity Asia Pacific ex-Japan Equity Fund is a feeder UCITS and will seek to achieve its objective by investing up to 100% of its net assets in unit classes of the Fidelity Asia Pacific ex-Japan Equity Fund (the “Master Fund”), being a sub-fund of Fidelity Common Contractual Fund II, a common contractual fund constituted as an umbrella fund and authorised in Ireland by the Central Bank pursuant to the UCITS Regulations. The investment manager of the Master Fund is the same as the Investment Manager of the Sub-Fund. Market Commentary: Equities in the Asia Pacific ex-Japan region declined against a backdrop of concerns over China-US trade issues, moderation in global growth and worries over the pace of interest rate increases in the US. Fears that the currency crisis in Turkey would impact the wider emerging markets complex also weighed on investor sentiment. Chinese equities fell on concerns that the economy may be headed for a downturn. Tightening liquidity to contain excess debt in the financial system also contributed to the weakness. However, expectations that China will intensify stimulus measures to cushion the impact of a China-US trade war helped contain losses. In key developments, US President Donald Trump and Chinese President Xi Jinping agreed to a 90-day truce at the G-20 summit in Argentina and agreed to work together to strike a trade deal. In Taiwan, policymakers acknowledged the slowdown in export activity as well as in capital goods imports in recent months, amid slowing global growth and US-China trade tensions. Additionally, weak guidance from technology heavyweights weighed on technology supply chain companies. South Korean equities weakened amid headwinds from disappointing macroeconomic data, lacklustre earnings and the depreciation of the Korean won against the US dollar. Australian equities declined due to the weak performance of consumer discretionary and information technology (IT) stocks. In Indonesia, a large current account deficit put pressure on the rupiah. On the monetary policy front, the central bank raised its benchmark interest rate for the sixth time in November since May to lower the current account deficit and stabilise the Indonesian rupiah. Concerns over rising inflation and a widening trade deficit hurt Indian equities. Investor confidence further weakened amid worries over credit and liquidity issues in the non-banking financial sector. Meanwhile, sentiment received support towards the latter half of the period, amid favourable macroeconomic data releases, and the appreciation of the Indian rupee against the US dollar. Portfolio Commentary: The Master Fund returned -9.43% for the period while the MSCI AC Asia Pacific ex Japan Index returned -8.66%. At the sub-fund level, all the sub-investment advisers generated negative returns. This was largely attributable to the significant exposure to a sub-investment adviser following a core Asia-Pacific strategy, where performance was driven by positions in the information technology and financials sectors. Encouragingly, underlying holdings in the utilities sector supported returns. Elsewhere, the holding in a sub-investment adviser following a value style of investing detracted from returns. Its allocation to the consumer discretionary and information technology sectors weighed on performance, while its holdings in the utilities and energy sectors enhanced gains. At the sub-fund level, underlying holdings in the IT and consumer discretionary sectors weighed on returns, while holdings in the utilities sector and in cash marginally supported performance. At the country level, the exposure to Cayman Islands and China were the key detractors from performance, while the allocation to the Philippines and Indonesia marginally supported returns. At the security level, holdings in Samsung Electronics Co. Ltd. and Baidu Inc. detracted from performance. Meanwhile, positions in Kunlun Energy Company Limited and Beijing Enterprises Holdings Limited supported returns. Outlook: Despite challenges brought about by China-US trade conflict, growth forecasts for the region remain unchanged, according to the Asian Development Outlook December Update. Robust domestic demand continues to drive growth in the region. China has entered a relatively low-growth phase of economic activity compared to a decade ago. This has positive implications: the economy is likely to be less cyclical, and structurally driven by consumption rather than fixed asset investment. Chinese corporate balance sheets have significantly improved, companies are conscious of capital expenditure and managements are adopting a more mature approach towards efficient capital allocation and reducing leverage. There is rising awareness among corporates towards improving shareholder returns and enhancing dividend pay-out, and a growing acknowledgement of good governance as well as the societal and environmental impact of businesses. India is maintaining growth momentum given positive domestic consumption trends. Higher oil prices and the depreciation of the rupee have put pressure on demand, inflation, the current account and public finances. However, business investment and exports remain strong, as structural reforms, including smoother implementation of the Goods and Services Tax (GST) and bank recapitalisation, are paying off. ASEAN should continue to grow at a healthy pace. Private consumption remains supported by wage gains and strong labour markets. Overall, equities in the Asia Pacific ex Japan region continue to provide attractive opportunities as valuation premiums have retreated from peak levels seen at the start of 2018.

Fidelity UCITS II ICAV INVESTMENT MANAGER’S REPORT (CONTINUED)
16
Fidelity Alternative Listed Equity Fund Fidelity Alternative Listed Equity Fund is a feeder UCITS and will seek to achieve its objective by investing up to 100% of its net assets in unit classes of the Fidelity Alternative Listed Equity Fund (the “Master Fund”), being a sub-fund of Fidelity Common Contractual Fund II, a common contractual fund constituted as an umbrella fund and authorised in Ireland by the Central Bank pursuant to the UCITS Regulations. The investment manager of the Master Fund is the same as the Investment Manager of the Sub-Fund. Market Commentary: Two main indices representing cash-benchmarked assets – AH Global UCITS Index and UCITS Alternative Index Global – declined over the year and the fourth quarter of 2018. Returns for three Absolute Hedge sub-indices were also negative over the quarter. The index for equity long/short strategies fell by 5.4%, with a majority of the decline concentrated in October, when global equity markets experienced steep losses led by technology exposures. Commodities declined over the year, with most of the weakness concentrated in the last quarter of 2018. After rising over most of the year, the energy sector fell in the fourth quarter after the US issued unexpectedly generous sanction waivers to Iran’s biggest oil buyers. This, coupled with rising US oil production, led to concerns about global oversupply at a time when weak economic data raised concerns about demand. Trade-related issues continued to negatively impact industrial metals prices. However, agricultural commodities advanced. Gold prices also rose over the quarter, mitigating full year losses, as investors sought safe haven assets. Global property markets declined over the quarter, but outperformed equities and commodities. In the US, rising mortgage rates and continued growth in home prices caused housing demand to stall. In the eurozone, Spanish real estate stocks fell in line with the overall market, while French property stocks were lower amid political instability in the country. Growing concerns over rising house prices in Germany prompted institutional investors to shift their focus elsewhere. The UK market was weighed down by growing concerns over Brexit and political uncertainty. Within Asia, tightening measures by policymakers led to a cautious sentiment in Hong Kong and Singapore. Growing concerns over the US-China trade war, expectations of rising mortgage rates and the depreciation of the Chinese yuan further impacted the Hong Kong property market. Portfolio Commentary: The Master Fund returned -3.52% for the period while the Sonia + 3 Annualized returned 0.64%. At the sub-fund level, underlying holdings in the financials sector detracted from performance. The allocation to CATCo Reinsurance Opportunities Fund Limited weighed on returns given its exposure to the Californian wildfires. Its shares fell 40% during the month of November. While the performance is clearly very disappointing, it remains an excellent diversifier in the portfolio and we believe the share price fall has been overdone. Consequently, we added to the holding. Moreover, the position in Invesco Morningstar US Energy Infrastructure MLP UCITS ETF generated negative returns. However, the allocation to 3i Infrastructure Plc enhanced gains, as did the holding in Sequoia Economic Infrastructure Income Fund. Outlook: As the world’s major central banks wind down their quantitative easing programmes, the context in which we are investing suggests that long-term correlations between traditional asset classes may not always hold. As such, traditional ‘balanced’ approaches - combining equities and bonds in varying proportions - are unlikely to achieve the diversification that is necessary to deliver a consistent set of outcomes across market cycles. In an environment of changing fundamentals, slowing growth and a maturing economic cycle, we believe the role of alternatives as diversifiers are an important part of the toolkit for multi asset investors. Of course, alternatives are not risk-free, or even necessarily low risk, but they tend to present different characteristics versus traditional assets in a portfolio, providing uncorrelated sources of risk and opportunity.

Fidelity UCITS II ICAV INVESTMENT MANAGER’S REPORT (CONTINUED)
17
Fidelity Global Emerging Markets Equity Fund Fidelity Global Emerging Markets Equity Fund is a feeder UCITS and will seek to achieve its objective by investing up to 100% of its net assets in unit classes of the Fidelity Global Emerging Markets Equity Fund (the “Master Fund”), being a sub-fund of Fidelity Common Contractual Fund II, a common contractual fund constituted as an umbrella fund and authorised in Ireland by the Central Bank pursuant to the UCITS Regulations. The investment manager of the Master Fund is the same as the Investment Manager of the Sub-Fund. Market Commentary: Emerging market equities fell over the review period. Concerns over the US-China trade war and slowing economic growth in China weighed on investors. A strengthening US dollar and the US Federal Reserve’s (Fed) decision to continue to raise interest rates also hurt sentiment. Geopolitics was in focus amid the arrest of the CFO of a large Chinese technology company for possible extradition to the US. Chinese stocks were negatively impacted by news flow around subdued manufacturing activity. However, the downside was limited by China’s support to the private sector, and an apparent thaw in the US-China trade dispute. Elsewhere, the Russian market was weak as oil prices declined. On a positive note, Brazilian equities rose as political uncertainty ended with the victory of Jair Bolsonaro in the final round of Presidential elections. From an economic perspective, concerns about inflation prompted central bank policy action across the emerging world. The Philippines and Indonesia raised policy rates to curb inflation and support falling currencies. Elsewhere, South Africa raised interest rates to control rising prices and support the rand. Russia unexpectedly increased borrowing costs in December, and indicated that it may do so again if inflationary pressures persist. However, China kept its short-term lending rates unchanged, but introduced a new lending facility to spur lending to small businesses. The Reserve Bank of India held interest rates steady in December, as retail inflation decelerated due to a fall in prices of pulses and vegetables. Portfolio Commentary: The Master Fund returned -3.96% for the period while the MSCI EM Index returned -4.91%. At the sub-fund level, all the sub-investment advisers generated negative performance. This was largely attributable to the significant exposure to a sub-investment adviser following a core emerging market strategy, where performance was driven by positions in the information technology (IT), materials and health care sectors. Meanwhile, underlying holdings in the financials and utilities sectors supported performance. At the sub-fund level, underlying holdings in the IT and materials sectors were the key detractors from performance. Elsewhere, underlying holdings in the financials and utilities sectors marginally supported returns, as did the allocation to cash. At the country level, the exposure to Taiwan was a key detractor from performance, while holdings in Brazil supported returns. At the security level, positions in China Petroleum & Chemical Corporation and Catcher Technology Co. Ltd. detracted from performance. On a positive note, holdings in Telefonica Brasil and Petrobras supported returns. Outlook: Emerging markets may be negatively impacted by tighter US monetary policy and the associated strength of the US dollar, as well as the US-China trade war and broader geopolitical tensions. A supportive environment for commodities should benefit export-oriented developing countries. However, economic growth in China is crucial for commodity prices to be sustained. Nonetheless, from a long-term perspective, emerging markets continue to offer numerous opportunities, supported by structural growth drivers such as urbanisation and lifestyle changes. This will drive demand for different goods and services in underpenetrated markets.

Fidelity Europe ex-UK Equity Fund SCHEDULE OF INVESTMENTS AS AT 31 DECEMBER 2018
18
Number of
Shares Fair Value
EURFund % of
NAV*
Transferable Securities 99.99%
Fidelity CCF II Europe ex-UK Equity Fund - Class G Acc EUR 7,671 67,419 99.99%
Total Transferable Securities 67,419 99.99%
Financial Assets at Fair Value Through Profit or Loss 67,419 99.99%
Other Assets and Liabilities 5 0.01%Net Assets Attributable to Holders of Redeemable Participating Shares 67,424 100.00%
Analysis of Assets EURFund % of
Assets(a) Transferable securities other than those admitted to an official stock exchange listing 67,419 99.99%(b) Other assets 9 0.01%Total Assets 67,428 100.00%
*The percentage of net assets disclosed above is subject to rounding.

Fidelity Japan Equity Fund SCHEDULE OF INVESTMENTS AS AT 31 DECEMBER 2018
19
Number of
Shares Fair Value
EURFund % of
NAV*
Transferable Securities 99.96%
Fidelity CCF II Japan Equity Fund - Class G Acc EUR 2,958 25,719 99.96%
Total Transferable Securities 25,719 99.96%
Financial Assets at Fair Value Through Profit or Loss 25,719 99.96%
Other Assets and Liabilities 9 0.04%Net Assets Attributable to Holders of Redeemable Participating Shares 25,728 100.00%
Analysis of Assets EURFund % of
Assets(a) Transferable securities other than those admitted to an official stock exchange listing 25,719 99.96%(b) Other assets 10 0.04%Total Assets 25,729 100.00%
*The percentage of net assets disclosed above is subject to rounding.

Fidelity North America Equity Fund SCHEDULE OF INVESTMENTS AS AT 31 DECEMBER 2018
20
Number of
Shares Fair Value
EURFund % of
NAV*
Transferable Securities 100.00%
Fidelity CCF II North America Equity Fund - Class G Acc EUR 18,210 157,856 100.00%
Total Transferable Securities 157,856 100.00%
Financial Assets at Fair Value Through Profit or Loss 157,856 100.00%
Other Assets and Liabilities 5 0.00%Net Assets Attributable to Holders of Redeemable Participating Shares 157,861 100.00%
Analysis of Assets EURFund % of
Assets(a) Transferable securities other than those admitted to an official stock exchange listing 157,856 100.00%(b) Other assets 9 0.00%Total Assets 157,865 100.00%
*The percentage of net assets disclosed above is subject to rounding.

Fidelity UK Equity Fund SCHEDULE OF INVESTMENTS AS AT 31 DECEMBER 2018
21
Number of
Shares Fair Value
EURFund % of
NAV*
Transferable Securities 99.98%
Fidelity CCF II UK Equity Fund - Class G Acc EUR 4,746 41,711 99.98%
Total Transferable Securities 41,711 99.98%
Financial Assets at Fair Value Through Profit or Loss 41,711 99.98%
Other Assets and Liabilities 8 0.02%Net Assets Attributable to Holders of Redeemable Participating Shares 41,719 100.00%
Analysis of Assets EURFund % of
Assets(a) Transferable securities other than those admitted to an official stock exchange listing 41,711 99.98%(b) Other assets 9 0.02%Total Assets 41,720 100.00%
*The percentage of net assets disclosed above is subject to rounding.

Fidelity Global Aggregate Bond Fund SCHEDULE OF INVESTMENTS AS AT 31 DECEMBER 2018
22
Number of
Shares Fair Value
EURFund % of
NAV*
Transferable Securities 100.00%
Fidelity CCF II Global Aggregate Bond Fund - Class G Acc EUR 49,200 491,809 100.00%
Total Transferable Securities 491,809 100.00%
Financial Assets at Fair Value Through Profit or Loss 491,809 100.00%
Other Assets and Liabilities 5 0.00%Net Assets Attributable to Holders of Redeemable Participating Shares 491,814 100.00%
Analysis of Assets EURFund % of
Assets(a) Transferable securities other than those admitted to an official stock exchange listing 491,809 100.00%(b) Other assets 10 0.00%Total Assets 491,819 100.00%
*The percentage of net assets disclosed above is subject to rounding.

Fidelity Global Sub-IG Fixed Income Fund SCHEDULE OF INVESTMENTS AS AT 31 DECEMBER 2018
23
Number of
Shares Fair Value
EURFund % of
NAV*
Transferable Securities 100.00%
Fidelity CCF II Global Sub-IG Fixed Income Fund - Class G Acc EUR 19,818 191,572 100.00%
Total Transferable Securities 191,572 100.00%
Financial Assets at Fair Value Through Profit or Loss 191,572 100.00%
Other Assets and Liabilities 7 0.00%Net Assets Attributable to Holders of Redeemable Participating Shares 191,579 100.00%
Analysis of Assets EURFund % of
Assets(a) Transferable securities other than those admitted to an official stock exchange listing 191,572 100.00%(b) Other assets 10 0.00%Total Assets 191,582 100.00%
*The percentage of net assets disclosed above is subject to rounding.

Fidelity Asia Pacific ex-Japan Equity Fund SCHEDULE OF INVESTMENTS AS AT 31 DECEMBER 2018
24
Number of
Shares Fair Value
EURFund % of
NAV*
Transferable Securities 99.97%
Fidelity CCF II Asia Pacific ex-Japan Equity Fund - Class G Acc EUR 3,888 34,270 99.97%
Total Transferable Securities 34,270 99.97%
Financial Assets at Fair Value Through Profit or Loss 34,270 99.97%
Other Assets and Liabilities 8 0.03%Net Assets Attributable to Holders of Redeemable Participating Shares 34,278 100.00%
Analysis of Assets EURFund % of
Assets(a) Transferable securities other than those admitted to an official stock exchange listing 34,270 99.97%(b) Other assets 9 0.03%Total Assets 34,279 100.00%
*The percentage of net assets disclosed above is subject to rounding.

Fidelity Alternative Listed Equity Fund SCHEDULE OF INVESTMENTS AS AT 31 DECEMBER 2018
25
Number of
Shares Fair Value
EURFund % of
NAV*
Transferable Securities 99.98%
Fidelity CCF II Alternative Listed Equity Fund - Class G Acc EUR 5,569 53,254 99.98%
Total Transferable Securities 53,254 99.98%
Financial Assets at Fair Value Through Profit or Loss 53,254 99.98%
Other Assets and Liabilities 8 0.02%Net Assets Attributable to Holders of Redeemable Participating Shares 53,262 100.00%
Analysis of Assets EURFund % of
Assets(a) Transferable securities other than those admitted to an official stock exchange listing 53,254 99.98%(b) Other assets 10 0.02%Total Assets 53,264 100.00%
*The percentage of net assets disclosed above is subject to rounding.

Fidelity Global Emerging Markets Equity Fund SCHEDULE OF INVESTMENTS AS AT 31 DECEMBER 2018
26
Number of
Shares Fair Value
EURFund % of
NAV*
Transferable Securities 99.91%
Fidelity CCF II Global Emerging Markets Equity Fund - Class G Acc EUR 1,181 11,137 99.91%
Total Transferable Securities 11,137 99.91%
Financial Assets at Fair Value Through Profit or Loss 11,137 99.91%
Other Assets and Liabilities 10 0.09%Net Assets Attributable to Holders of Redeemable Participating Shares 11,147 100.00%
Analysis of Assets EURFund % of
Assets(a) Transferable securities other than those admitted to an official stock exchange listing 11,137 99.91%(b) Other assets 10 0.09%Total Assets 11,147 100.00%
*The percentage of net assets disclosed above is subject to rounding.

Fidelity UCITS II ICAV STATEMENT OF FINANCIAL POSITION AS AT 31 DECEMBER 2018
The accompanying notes form an integral part of the financial statements.
27
Fidelity Europe ex-
UK Equity Fund1 Fidelity Japan Equity
Fund2
Fidelity North America Equity
Fund3 Fidelity UK Equity
Fund4
31 December 2018 31 December 2018 31 December 2018 31 December 2018 Note EUR EUR EUR EUR Current Assets Financial Assets at Fair Value Through Profit or Loss 2b, 10f 67,419 25,719 157,856 41,711 Cash and Cash Equivalents 2b, 3 9 10 9 9 Total Assets 67,428 25,729 157,865 41,720 Current Liabilities Management Fees Payable 6 4 1 4 1 Liabilities 4 1 4 1 Net Assets Attributable to Holders of Redeemable Participating Shares 67,424 25,728 157,861 41,719
Fidelity Global Aggregate Bond
Fund5
Fidelity Global Sub-IG Fixed Income
Fund5
Fidelity Asia Pacific ex-Japan Equity
Fund6 Fidelity Alternative
Listed Equity Fund7
31 December 2018 31 December 2018 31 December 2018 31 December 2018 Note EUR EUR EUR EUR Current Assets Financial Assets at Fair Value Through Profit or Loss 2b, 10f 491,809 191,572 34,270 53,254 Cash and Cash Equivalents 2b, 3 10 10 9 10 Total Assets 491,819 191,582 34,279 53,264 Current Liabilities Management Fees Payable 6 5 3 1 2 Liabilities 5 3 1 2 Net Assets Attributable to Holders of Redeemable Participating Shares 491,814 191,579 34,278 53,262

Fidelity UCITS II ICAV STATEMENT OF FINANCIAL POSITION (CONTINUED) AS AT 31 DECEMBER 2018
The accompanying notes form an integral part of the financial statements.
28
Fidelity Global Emerging Markets
Equity Fund8
31 December 2018 Note EUR Current Assets Financial Assets at Fair Value Through Profit or Loss 2b, 10f 11,137 Cash and Cash Equivalents 2b, 3 10 Total Assets 11,147 Current Liabilities Management Fees Payable 6 – Liabilities – Net Assets Attributable to Holders of Redeemable Participating Shares 11,147
1 The Sub-Fund launched on 13 August 2018. 2 The Sub-Fund launched on 23 August 2018. 3 The Sub-Fund launched on 28 August 2018. 4 The Sub-Fund launched on 29 August 2018. 5 The Sub-Fund launched on 30 August 2018. 6 The Sub-Fund launched on 31 August 2018. 7 The Sub-Fund launched on 12 September 2018. 8 The Sub-Fund launched on 14 September 2018.

Fidelity UCITS II ICAV STATEMENT OF FINANCIAL POSITION (CONTINUED) AS AT 31 DECEMBER 2018
The accompanying notes form an integral part of the financial statements.
29
Fidelity Europe ex-UK Equity Fund Class G ACC EUR Net Asset Value EUR As at 31 December 2018 67,424 Net Asset Value per Share EUR As at 31 December 2018 8.79 Share In Issue As at 31 December 2018 7,671
Fidelity Japan Equity Fund Class G ACC EUR Net Asset Value EUR As at 31 December 2018 25,728 Net Asset Value per Share EUR As at 31 December 2018 8.70 Shares In Issue As at 31 December 2018 2,958
Fidelity North America Equity Fund Class G ACC EUR Net Asset Value EUR As at 31 December 2018 157,861 Net Asset Value per Share EUR As at 31 December 2018 8.67 Shares In Issue As at 31 December 2018 18,210
Fidelity UK Equity Fund Class G ACC EUR Net Asset Value EUR As at 31 December 2018 41,719 Net Asset Value per Share EUR As at 31 December 2018 8.79 Shares In Issue As at 31 December 2018 4,746 zyc
Fidelity Global Aggregate Bond Fund Class G ACC EUR Net Asset Value EUR As at 31 December 2018 491,814 Net Asset Value per Share EUR As at 31 December 2018 10.00 Shares In Issue As at 31 December 2018 49,200
Fidelity Global Sub-IG Fixed Income Fund Class G ACC EUR Net Asset Value EUR As at 31 December 2018 191,579 Net Asset Value per Share EUR As at 31 December 2018 9.67 Shares In Issue As at 31 December 2018 19,818

Fidelity UCITS II ICAV
STATEMENT OF FINANCIAL POSITION (CONTINUED) AS AT 31 DECEMBER 2018
Fidelity Asia Pacific ex-Japan Equity Fund
Class G ACC EUR Net Asset Value EUR As at 31 December 2018 34,278 Net Asset Value per Share EUR As at 31 December 2018 8.82 Shares In Issue
As at 31 December 2018 3,888
Fidelity Alternative Listed Equity Fund
Class G ACC EUR Net Asset Value EUR As at 31 December 2018 53,262 Net Asset Value per Share EUR As at 31 December 2018 9,56 Shares In Issue
Asat31 December 2018 5,569
Fidelity Global Emerging Markets Equity Fund
Class G ACC EUR Net Asset Value EUR As at 31 December 2018 11,147 Net Asset Value per Share EUR As at 31 December 2018 9,44 Shares In Issue
As at 31 December 2018 1,181
Signed on behalf of the Board of Directors By:
~ I 29 April 2019 29 61-20T9
The accompanying notes form an integral part of the financial statements.
30

Fidelity UCITS II ICAV STATEMENT OF COMPREHENSIVE INCOME FOR THE PERIOD FROM 14 NOVEMBER 2017 (DATE OF REGISTRATION) TO 31 DECEMBER 2018
The accompanying notes form an integral part of the financial statements.
31
E
Fidelity Europe ex-
UK Equity Fund1 Fidelity Japan Equity
Fund2
Fidelity North America Equity
Fund3 Fidelity UK Equity
Fund4
31 December 2018 31 December 2018 31 December 2018 31 December 2018 Note EUR EUR EUR EUR Operating Income Net Gain/(Loss) in Financial Assets at fair Value through Profit or Loss 11 (4,099) (3,323) (12,419) (2,176) Total Operating Income/(Loss) (4,099) (3,323) (12,419) (2,176) Operating Expenses Management Fees 6 4 1 4 1 Total Operating Expenses 4 1 4 1
Total Comprehensive Income/(Loss) (4,103) (3,324) (12,423) (2,177)
Fidelity Global Aggregate Bond
Fund5
Fidelity Global Sub-IG Fixed Income
Fund5
Fidelity Asia Pacific ex-Japan Equity
Fund6 Fidelity Alternative
Listed Equity Fund7
31 December 2018 31 December 2018 31 December 2018 31 December 2018 Note EUR EUR EUR EUR Operating Income Net Gain/(Loss) in Financial Assets at fair Value through Profit or Loss 11 1,618 (951) (1,285) (1,146) Total Operating Income/(Loss) 1,618 (951) (1,285) (1,146) Operating Expenses Management Fees 6 5 3 1 2 Total Operating Expenses 5 3 1 2
Total Comprehensive Income/(Loss) 1,613 (954) (1,286) (1,148)
There are no gains or losses other than those included in the Statement of Comprehensive Income. In arriving at the results for the financial period all amounts relate to continuing operations.

Fidelity UCITS II ICAV STATEMENT OF COMPREHENSIVE INCOME (CONTINUED) FOR THE PERIOD FROM 14 NOVEMBER 2017 (DATE OF REGISTRATION) TO 31 DECEMBER 2018
The accompanying notes form an integral part of the financial statements.
32
Fidelity Global Emerging Markets
Equity Fund8
31 December 2018 Note EUR Operating Income Net Gain/(Loss) in Financial Assets at fair Value through Profit or Loss 11 (407) Total Operating Income/(Loss) (407) Operating Expenses Management Fees 6 – Total Operating Expenses –
Total Comprehensive Income/(Loss) (407)
1 The Sub-Fund launched on 13 August 2018. 2 The Sub-Fund launched on 23 August 2018. 3 The Sub-Fund launched on 28 August 2018. 4 The Sub-Fund launched on 29 August 2018. 5 The Sub-Fund launched on 30 August 2018. 6 The Sub-Fund launched on 31 August 2018. 7 The Sub-Fund launched on 12 September 2018. 8 The Sub-Fund launched on 14 September 2018. There are no gains or losses other than those included in the Statement of Comprehensive Income. In arriving at the results for the financial period all amounts relate to continuing operations.

Fidelity UCITS II ICAV STATEMENT OF CHANGES IN NET ASSETS ATTRIBUTABLE TO HOLDERS OF REDEEMABLE PARTICIPATING SHARES FOR THE PERIOD FROM 14 NOVEMBER 2017 (DATE OF REGISTRATION) TO 31 DECEMBER 2018
The accompanying notes form an integral part of the financial statements.
33
Fidelity Europe ex-UK
Equity Fund1Fidelity Japan Equity
Fund2Fidelity North America
Equity Fund3Fidelity UK Equity
Fund4
31 December 2018 31 December 2018 31 December 2018 31 December 2018 EUR EUR EUR EURIncrease/(Decrease) in Net Assets Total Comprehensive Income/(Loss) (4,103) (3,324) (12,423) (2,177)Capital Transactions Subscriptions 72,351 33,220 178,362 44,349 Redemptions (824) (4,168) (8,078) (453) Total Capital Transactions 71,527 29,052 170,284 43,896 Total Increase/(Decrease) for the Period 67,424 25,728 157,861 41,719Net Assets Attributable to Holders of Redeemable Participating Shares Beginning of Period – – – –End of Period 67,424 25,728 157,861 41,719
Fidelity GlobalAggregate Bond
Fund5Fidelity Global Sub-IG
Fixed Income Fund5
Fidelity Asia Pacific ex-Japan Equity
Fund6Fidelity Alternative
Listed Equity Fund7
31 December 2018 31 December 2018 31 December 2018 31 December 2018 EUR EUR EUR EURIncrease/(Decrease) in Net Assets Total Comprehensive Income/(Loss) 1,613 (954) (1,286) (1,148)Capital Transactions Subscriptions 495,733 196,371 35,773 55,684 Redemptions (5,532) (3,838) (209) (1,274) Total Capital Transactions 490,201 192,533 35,564 54,410 Total Increase/(Decrease) for the Period 491,814 191,579 34,278 53,262Net Assets Attributable to Holders of Redeemable Participating Shares Beginning of Period – – – –End of Period 491,814 191,579 34,278 53,262

Fidelity UCITS II ICAV STATEMENT OF CHANGES IN NET ASSETS ATTRIBUTABLE TO HOLDERS OF REDEEMABLE PARTICIPATING SHARES (CONTINUED) FOR THE PERIOD FROM 14 NOVEMBER 2017 (DATE OF REGISTRATION) TO 31 DECEMBER 2018
The accompanying notes form an integral part of the financial statements.
34
Fidelity Global Emerging Markets
Equity Fund8
31 December 2018 EUR Increase/(Decrease) in Net Assets Total Comprehensive Income/(Loss) (407) Capital Transactions Subscriptions 11,587 Redemptions (33) Total Capital Transactions 11,554 Total Increase/(Decrease) for the Period 11,147 Net Assets Attributable to Holders of Redeemable Participating Shares Beginning of Period – End of Period 11,147
1 The Sub-Fund launched on 13 August 2018. 2 The Sub-Fund launched on 23 August 2018. 3 The Sub-Fund launched on 28 August 2018. 4 The Sub-Fund launched on 29 August 2018. 5 The Sub-Fund launched on 30 August 2018. 6 The Sub-Fund launched on 31 August 2018. 7 The Sub-Fund launched on 12 September 2018. 8 The Sub-Fund launched on 14 September 2018.

Fidelity UCITS II ICAV STATEMENT OF CASH FLOWS FOR THE PERIOD FROM 14 NOVEMBER 2017 (DATE OF REGISTRATION) TO 31 DECEMBER 2018
The accompanying notes form an integral part of the financial statements.
35
Fidelity Europe ex-UK
Equity Fund1 Fidelity Japan Equity
Fund2 Fidelity North America
Equity Fund3 Fidelity UK Equity
Fund4
31 December 2018 31 December 2018 31 December 2018 31 December 2018 EUR EUR EUR EUR Cash flows from operating activities: Total Comprehensive Income/(Loss) (4,103) (3,324) (12,423) (2,177) Adjustment for: Change in Financial Assets at Fair Value
Through Profit or Loss (67,419) (25,719) (157,856) (41,711) Change in Management Fees Payable 4 1 4 1 Net cash flows from operating activities (71,518) (29,042) (170,275) (43,887) Cash flows from financing activities: Proceeds from redeemable shares issued 72,351 33,220 178,362 44,349 Redemption of redeemable shares (824) (4,168) (8,078) (453) Net cash used in financing activities 71,527 29,052 170,284 43,896 Net increase in cash and cash equivalents 9 10 9 9 Cash and cash equivalents at beginning of the
period – – – – Cash and cash equivalents at end of the period 9 10 9 9
Fidelity Global Aggregate Bond
Fund5 Fidelity Global Sub-IG
Fixed Income Fund5
Fidelity Asia Pacific ex-Japan Equity
Fund6 Fidelity Alternative
Listed Equity Fund7
31 December 2018 31 December 2018 31 December 2018 31 December 2018 EUR EUR EUR EUR Cash flows from operating activities: Total Comprehensive Income/(Loss) 1,613 (954) (1,286) (1,148) Adjustment for: Change in Financial Assets at Fair Value
Through Profit or Loss (491,809) (191,572) (34,270) (53,254) Change in Management Fees Payable 5 3 1 2 Net cash flows from operating activities (490,191) (192,523) (35,555) (54,400) Cash flows from financing activities: Proceeds from redeemable shares issued 495,733 196,371 35,773 55,684 Redemption of redeemable shares (5,532) (3,838) (209) (1,274) Net cash used in financing activities 490,201 192,533 35,564 54,410 Net increase in cash and cash equivalents 10 10 9 10 Cash and cash equivalents at beginning of the
period – – – – Cash and cash equivalents at end of the period 10 10 9 10

Fidelity UCITS II ICAV STATEMENT OF CASH FLOWS (CONTINUED) FOR THE PERIOD FROM 14 NOVEMBER 2017 (DATE OF REGISTRATION) TO 31 DECEMBER 2018
The accompanying notes form an integral part of the financial statements.
36
Fidelity Global Emerging Markets
Equity Fund8
31 December 2018 EUR Cash flows from operating activities: Total Comprehensive Income/(Loss) (407) Adjustment for: Change in Financial Assets at Fair Value
Through Profit or Loss (11,137) Change in Management Fees Payable – Net cash flows from operating activities (11,544) Cash flows from financing activities: Proceeds from redeemable shares issued 11,587 Redemption of redeemable shares (33) Net cash used in financing activities 11,554 Net increase in cash and cash equivalents 10 Cash and cash equivalents at beginning of the
period – Cash and cash equivalents at end of the period 10
1 The Sub-Fund launched on 13 August 2018. 2 The Sub-Fund launched on 23 August 2018. 3 The Sub-Fund launched on 28 August 2018. 4 The Sub-Fund launched on 29 August 2018. 5 The Sub-Fund launched on 30 August 2018. 6 The Sub-Fund launched on 31 August 2018. 7 The Sub-Fund launched on 12 September 2018. 8 The Sub-Fund launched on 14 September 2018.

Fidelity UCITS II ICAV NOTES TO THE FINANCIAL STATEMENTS FOR THE PERIOD FROM 14 NOVEMBER 2017 (DATE OF REGISTRATION) TO 31 DECEMBER 2018
37
1. Organisation Fidelity UCITS II ICAV (the “Fund”) was registered in Ireland pursuant to the Irish Collective Asset-management Vehicles Act 2015 on 14 November 2017 as amended under registration number C174793 and is authorised by the Central Bank of Ireland (the “Central Bank”) under the European Communities (Undertakings for Collective Investment in Transferable Securities) Regulations 2011 (as amended) (the “UCITS Regulations”). The Fund is organised in the form of an umbrella fund with segregated liability between sub-funds. The Prospectus provides that the Fund may offer separate sub-funds. Each sub-fund will have a distinct schedule of investments. The portfolio of assets maintained for each Sub-Fund will be invested in accordance with the investment objectives and policies applicable to such Sub-Fund. For more information please refer to the General Information section. 2. Significant Accounting Policies The significant accounting policies and estimation techniques adopted by each Sub-Fund are as follows: a) Basis of Preparation of Financial Statements The financial statements are prepared in accordance with International Financial Reporting Standards as adopted by European Union (“IFRS”) and certain requirements of the European Communities (Undertakings for Collective Investment in Transferable Securities) Regulations, 2011 (as amended) and the Central Bank’s (Supervision and Enforcement) Act 2013 (section 48(1)) UCITS Regulations 2015 (as amended) (the “Central Bank UCITS Regulations”) that apply to Financial Reports. The financial statements have been prepared on the going concern basis and under the historical cost convention, as modified by the revaluation of financial assets and financial liabilities held at fair value through profit or loss. The preparation of financial statements in conformity with IFRS requires the use of certain critical accounting estimates as adopted by the European Union. It also requires the Directors to exercise their judgement in the process of applying each Sub-Fund’s accounting policies. The areas involving a higher degree of judgement or complexity, or areas where assumptions and estimates are significant to each Sub-Fund’s financial statements are disclosed in the following notes. New standards and interpretations On 7 June 2017, the International Accounting Standards Board issued IFRIC Interpretation 23 — Uncertainty over Income Tax Treatments (the “Interpretation”). The Interpretation clarifies application of recognition and measurement requirements in IAS 12 Income Taxes when there is uncertainty over income tax treatments. The Interpretation is effective for annual reporting periods beginning on or after 1 January 2019, but certain transition reliefs are available. Based on the Sub-Fund’s assessment, this new standard is not expected to have a significant impact on the financial statements of the Sub-Funds or performance. In addition to the above, a number of new standards, amendments to standards and interpretations are effective for annual periods beginning after 14 November 2017, and have not been applied in preparing these financial statements. The Fund expects no material impact from the adoption of the amendments on its financial position or performance. The Fund is authorised by the Central Bank as a UCITS pursuant to the UCITS Regulations. The period ended 31 December 2018 is the first reporting cycle, and therefore there are no comparatives in the financial statements. b) Financial assets and financial liabilities at fair value through profit or loss Classification The Sub-Funds classify their financial assets and liabilities at fair value through profit or loss. The category of financial assets and liabilities at fair value through profit or loss is sub-divided into financial assets and liabilities held for trading and those designated at fair value through profit or loss upon initial recognition. Financial assets are classified as held for trading if they are acquired for the purpose of selling in the near term. This category includes equity securities, investments in managed funds, debt instruments, warrants and derivative instruments. These assets are acquired principally for the purpose of generating a profit from short-term fluctuation in price. Derivatives of financial assets are also classified as held for trading. The Fund’s policy is not to apply hedge accounting.
Fidelity UCITS II ICAV NOTES TO THE FINANCIAL STATEMENTS FOR THE PERIOD FROM 14 NOVEMBER 2017 (DATE OF REGISTRATION) TO 31 DECEMBER 2018 (CONTINUED)
38
2. Significant Accounting Policies (continued) b) Financial assets and financial liabilities at fair value through profit or loss (continued) Recognition/Derecognition The Sub-Funds recognise a financial asset or a financial liability when, and only when, it becomes a party to the contractual provisions of the instrument. Purchases and sales of financial assets at fair value through profit or loss are recognised on trade date – the date on which the Sub-Funds commit to purchase or sell the financial instrument. A financial asset (or, where applicable, part of a financial asset or a part of a group of similar financial assets) is derecognised where the rights to receive cash flows from the asset have expired, or the Fund has transferred its rights to receive cash flow from the asset, or has assumed an obligation to pay the received cash flows in full without material delay to a third party under a pass-through arrangement and either the Sub-Funds have transferred substantially all of the risks and rewards of the asset or Sub-Funds have neither transferred nor retained substantially all the risk and rewards of the asset, but has transferred control of the asset. When the Sub-Funds have transferred their right to receive cash flows from an asset (or has entered into a pass-though arrangement), and have neither transferred nor retained substantially all of the risk and rewards of the asset nor transferred control of the asset, the asset is recognised to the extent of the Sub-Funds’ continuing involvement in the asset. In that case, the Sub-Funds also recognise an associated liability. The transferred asset and the associated liability are measured on a basis that reflects the rights and obligations that the Sub-Funds have retained. The Sub-Funds derecognise a financial liability when the obligation under the liability is discharged, cancelled or expired. Realised fair value gains and losses on disposals of financial instruments are calculated using the average cost method. The Sub-Funds derecognise a financial liability when the obligation under the liability is charged, cancelled or expired. Measurement Financial assets and financial liabilities at fair value through profit or loss are recorded in the Statement of Financial Position at fair value. Subsequent to initial recognition, all financial assets and financial liabilities at fair value through profit or loss are measured at fair value. Gains and losses arising from changes in the fair value of the ‘financial assets or financial liabilities at fair value through profit or loss’ category are presented in the Statement of Comprehensive Income in the period in which they arise. Determination of fair value Each asset which is quoted, listed or traded on or under the rules of any Recognised Market shall be valued at either the (a) closing bid price, (b) last bid price, (c) last traded price, (d) closing mid-market price, (e) latest mid-market price or (f) the official closing price on the relevant Recognised Market at the close of business on such Recognised Market on each Valuation Day, and the relevant valuation method shall be disclosed in the Relevant Supplement. Prices will be obtained for this purpose by the Administrator from independent sources, such as recognized pricing services or brokers specialising in the relevant market. The value of any investment which is not normally quoted, listed or traded on or under the rules of a Recognised Market, will be valued at its probable realisation value estimated with care and in good faith by the Manager in consultation with the Administrator or by a competent person, firm or corporation appointed by the Manager and approved for such purpose by the Depositary. Cash in hand or on deposit shall be valued at face value together with accrued interest where applicable, unless in the opinion of the Manager (in consultation with the Administrator and the Depositary) any adjustment should be made to reflect the fair value thereof. Units or shares in collective investment schemes shall be valued on the basis of the latest unaudited available net asset value per unit or share as published by the collective investment scheme. c) Foreign Exchange Translation Functional and Presentation Currency Items included in the Sub-Funds’ financial statements are measured using the currency in which Shareholder transactions take place (the “functional currency”). The functional currency and presentation currency of each Sub-Fund is Euro.

Fidelity UCITS II ICAV NOTES TO THE FINANCIAL STATEMENTS FOR THE PERIOD FROM 14 NOVEMBER 2017 (DATE OF REGISTRATION) TO 31 DECEMBER 2018 (CONTINUED)
39
2. Significant Accounting Policies (continued) c) Foreign Exchange Translation (continued) Transactions and Balances Assets and liabilities denominated in currencies other than the functional currency are translated into the functional currency at the exchange rates ruling at the Statement of Financial Position date. Transactions in currencies other than the functional currency are translated into the functional currency at the exchange rates ruling at the dates of the transactions. Gains and losses on foreign exchange transactions are recognised in the Statement of Comprehensive Income in determining the result for the period. Proceeds from subscriptions and amounts paid for redemptions in currencies other than the functional currency are translated into the functional currency at the exchange rates prevailing at the dates of the transactions. d) Transaction Costs Transaction costs are incremental costs that are directly attributable to the acquisition, issue or disposal of the financial asset or liability. Transaction costs include fees and commissions paid to agents (including employees acting as selling agents), advisers, brokers and dealers, levies by regulatory agencies and securities exchanges, and transfer taxes and duties. Transaction costs do not include debt premiums or discounts, financing costs or internal administrative or holding costs. Transaction costs on purchases and sales of equities are included in net gain/(loss) on investments in the Statement of Comprehensive Income for each Sub-Fund as incurred. There were no transactions costs incurred during the period ended 31 December 2018. e) Expenses Expenses are recognised in the Statement of Comprehensive Income on an accrual basis. f) Redeemable Participating Shares All redeemable participating Shares issued by the Sub-Funds provide the Shareholders with the right to redeem for cash at the value proportionate to the Shareholder’s share in the Sub-Funds’ net assets on the redemption date. In accordance with IAS 32, redeemable participating Shares have been classified as equity. g) Distribution Policy The Sub-Funds have only accumulating classes, for which the Directors have determined to accumulate all net income and therefore do not intend to declare dividends.

Fidelity UCITS II ICAV NOTES TO THE FINANCIAL STATEMENTS FOR THE PERIOD FROM 14 NOVEMBER 2017 (DATE OF REGISTRATION) TO 31 DECEMBER 2018 (CONTINUED)
40
3. Cash at Bank Cash at Bank amount for the Sub-Funds for the financial period end 31 December 2018 is disclosed in the table below:
All cash at bank balances at the period end are held with Brown Brothers Harriman or with approved counterparties on overnight deposit or directly with a sub-custodian. All deposits held on call with banks are returned to the Depositary the following day. 4. Share Capital The Fund may issue up to 500,000,000,002 Shares of no par value. The maximum issued Share capital of the Fund shall be 500,000,000,002 Shares of no par value and the minimum issued Share capital of the Fund shall be €2 represented by two Subscriber Shares of no par value issued for €1 each. The issued share capital of the Fund shall not be less than the currency equivalent of €2 represented by two shares of no par value. As at 31 December 2018, there were no variations of rights between share classes of the Sub-Funds.
Sub-Fund Counterparty 31 December 2018 Fidelity Europe ex-UK Equity Fund EUR Brown Brothers Harriman
9
Fidelity Japan Equity Fund EUR Brown Brothers Harriman
10
Fidelity North America Equity Fund EUR Brown Brothers Harriman
9
Fidelity UK Equity Fund EUR Brown Brothers Harriman
9
Fidelity Global Aggregate Bond Fund EUR Brown Brothers Harriman
10
Fidelity Global Sub-IG Fixed Income Fund EUR Brown Brothers Harriman
10
Fidelity Asia Pacific ex-Japan Equity Fund EUR Brown Brothers Harriman
9
Fidelity Alternative Listed Equity Fund EUR Brown Brothers Harriman
10
Fidelity Global Emerging Markets Equity Fund EUR Brown Brothers Harriman
10

Fidelity UCITS II ICAV NOTES TO THE FINANCIAL STATEMENTS FOR THE PERIOD FROM 14 NOVEMBER 2017 (DATE OF REGISTRATION) TO 31 DECEMBER 2018 (CONTINUED)
41
4. Share Capital (continued) The movement in the number of redeemable participating Shares for each Sub-Fund for the financial period ended 31 December 2018 is as follows: Fidelity Europe ex-UK Equity Fund
Share Unit Class G Acc EURBeginning Balance –Shares Issued During Period 7,758Shares Redeemed During Period (87)Balance at 31 December 2018 7,671
Fidelity Japan Equity Fund
Share Unit Class G Acc EURBeginning Balance –Shares Issued During Period 3,406Shares Redeemed During Period (448)Balance at 31 December 2018 2,958
Fidelity North America Equity Fund
Share Unit Class G Acc EURBeginning Balance –Shares Issued During Period 19,092Shares Redeemed During Period (882)Balance at 31 December 2018 18,210
Fidelity UK Equity Fund
Share Unit Class G Acc EURBeginning Balance –Shares Issued During Period 4,795Shares Redeemed During Period (49)Balance at 31 December 2018 4,746
Fidelity Global Aggregate Bond Fund
Share Unit Class G Acc EURBeginning Balance –Shares Issued During Period 49,757Shares Redeemed During Period (557)Balance at 31 December 2018 49,200

Fidelity UCITS II ICAV NOTES TO THE FINANCIAL STATEMENTS FOR THE PERIOD FROM 14 NOVEMBER 2017 (DATE OF REGISTRATION) TO 31 DECEMBER 2018 (CONTINUED)
42
4. Share Capital (continued) Fidelity Global Sub-IG Fixed Income Fund
Share Unit Class G Acc EURBeginning Balance –Shares Issued During Period 20,211Shares Redeemed During Period (393)Balance at 31 December 2018 19,818
Fidelity Asia Pacific ex-Japan Equity Fund
Share Unit Class G Acc EURBeginning Balance –Shares Issued During Period 3,911Shares Redeemed During Period (23)Balance at 31 December 2018 3,888
Fidelity Alternative Listed Equity Fund
Share Unit Class G Acc EURBeginning Balance –Shares Issued During Period 5,699Shares Redeemed During Period (130)Balance at 31 December 2018 5,569
Fidelity Global Emerging Markets Equity Fund
Share Unit Class G Acc EURBeginning Balance –Shares Issued During Period 1,185Shares Redeemed During Period (4)Balance at 31 December 2018 1,181
5. Taxation Each Sub-Fund is an investment undertaking as defined in Section 739B of the Taxes Consolidation Act, 1997. The Sub-Funds will not be liable to Irish tax in respect of their income and gains, other than on the occurrence of a chargeable event with respect to Irish resident shareholders. In accordance with the reporting fund regime introduced by the United Kingdom HM Revenue and Customs, each Share Class will be viewed as a separate “offshore fund” for UK tax purposes. The reporting regime permits an offshore fund to seek advance approval from HM Revenue and Customs to be treated as a reporting fund. Once an offshore fund has been granted “reporting fund” status it will maintain that status for so long as it continues to satisfy the conditions to be a “reporting fund”, which include making reports to HM Revenue and Customs and investors for each period of account, without a requirement to apply for further certification by HM Revenue and Customs. Each Share Class in the Sub-Funds is treated as a “reporting fund”. This has been approved by HM Revenue and Customs. Generally a chargeable event arises on any distribution, redemption, repurchase, cancellation, transfer of Shares by an Irish resident Shareholder or on the ending of a “Relevant Period”. A “Relevant Period” for these purposes is an eight year period beginning with the acquisition of the Shares by the Irish resident Shareholder and each subsequent period of eight years beginning immediately after the preceding Relevant Period.

Fidelity UCITS II ICAV NOTES TO THE FINANCIAL STATEMENTS FOR THE PERIOD FROM 14 NOVEMBER 2017 (DATE OF REGISTRATION) TO 31 DECEMBER 2018 (CONTINUED)
43
5. Taxation (continued) A gain on a chargeable event does not arise in respect of:
(i) a Shareholder who is not Irish resident and not ordinarily resident in Ireland at the time of the chargeable event provided the necessary signed statutory declarations are held by the Sub-Fund; or
(ii) certain exempted Irish resident investors who have provided the Sub-Fund with the necessary signed statutory declaration. Capital gains, dividends, and interest received by the Sub-Funds may be subject to withholding taxes imposed by the country of origin and such taxes may not be recoverable by the Sub-Funds or their Shareholders. 6. Fees All of the fees and expenses payable in respect of each Sub-Fund are paid as one single fee. This is referred to as the total expense ratio or “TER”. The Manager is responsible for arranging the payment from the TER of all operational expenses of the Sub-Funds, including Directors’, Auditors’, Legal Advisors’, Administrator’s, Depositary’s and other service providers’ fees and expenses and Class hedging costs. The Manager is entitled to an annual fee in respect of the services that it provides to the Sub-Funds. However, this fee will only be paid in circumstances where there is a residual amount left from the TER after the other operational expenses have been paid. Save where another party has agreed to reimburse the Sub-Funds, the TER includes but is not limited to fees and expenses of the Investment Manager, Depositary, Administrator, Secretary and any sub-investment advisor. Subject to applicable law and regulation, the Manager or the Investment Manager may pay part or all of its fees to any person that invests in or provides services to the Fund or in respect of the Sub-Funds. The TER does not include extraordinary costs, transaction costs and related expenses, including but not limited to, transaction charges, stamp duty or other taxes on the investments of the Sub-Funds, including duties and charges for portfolio re-balancing, withholding taxes, commissions and brokerage fees incurred with respect to the Sub-Funds’ investments, interest on borrowings and bank charges incurred in negotiating, effecting or varying the terms of such borrowings, any commissions charged by intermediaries in relation to an investment in the Sub-Funds and such extraordinary or exceptional costs and expenses (if any) as may arise from time to time, such as material litigation in relation to the Sub-Funds or the Fund, which will be paid separately out of the assets of the relevant Sub-Fund. The TER is calculated and accrued daily from the Net Asset Value of the Sub-Funds and payable at least quarterly in arrears. The TER of each Sub-Fund is as listed in the Relevant Supplement. If the Sub-Funds’ expenses exceed the TER outlined above in relation to operating the funds, the Manager will cover any shortfall from its own assets. The table below outlines the ongoing charges figures applicable to each Sub-Fund:
Sub-Fund TER
(% of Net Asset Value) Fidelity Europe ex-UK Equity Fund
Class G Acc EUR 1 Fidelity Japan Equity Fund
Class G Acc EUR 1 Fidelity North America Equity Fund
Class G Acc EUR 1 Fidelity UK Equity Fund
Class G Acc EUR 1 Fidelity Global Aggregate Bond Fund
Class G Acc EUR 0.65 Fidelity Global Sub-IG Fixed Income Fund
Class G Acc EUR 0.80 Fidelity Asia Pacific ex-Japan Equity Fund
Class G Acc EUR 1 Fidelity Alternative Listed Equity Fund
Class G Acc EUR 1 Fidelity Global Emerging Markets Equity Fund
Class G Acc EUR 1

Fidelity UCITS II ICAV NOTES TO THE FINANCIAL STATEMENTS FOR THE PERIOD FROM 14 NOVEMBER 2017 (DATE OF REGISTRATION) TO 31 DECEMBER 2018 (CONTINUED)
44
6. Fees (continued) Directors’ Fees The aggregate emoluments of the Directors paid by the Manager out of the TER on behalf of the Fund (including expenses) was EUR37,500 which were paid to David Dillon (resigned 23 May 2018) and Denise Kinsella as Independent Directors. 7. Net Asset Value per Redeemable Participating Share The Net Asset Value per redeemable participating share is calculated by dividing the total net assets (as calculated for shareholder dealing purposes) of each Sub-Fund by the number of redeemable participating shares of that class in issue. 8. Related Parties Related Party Disclosures In the opinion of the Directors, the list of related parties under IAS 24 “Related Party Transactions”’ is as follows: FIL Limited – the ultimate holding company and fellow subsidiary undertakings namely: (i) FIL Fund Management (Ireland) Limited (ii) FIL Distributors (iii) FIL Fondsbank GmbH The Directors of the Fund and their dependents. The Directors’ fees for the financial period ended 31 December 2018 are disclosed in Note 6. The Investment Manager is a related party to the Fund and receives the fees, as outlined on the Note 6. The amounts payable as at 31 December 2018 are disclosed in the Statement of Financial Position. The Sub-Funds invest in the respective sub-funds of Fidelity Common Contractual Fund II, a related party to the Fund.

Fidelity UCITS II ICAV NOTES TO THE FINANCIAL STATEMENTS FOR THE PERIOD FROM 14 NOVEMBER 2017 (DATE OF REGISTRATION) TO 31 DECEMBER 2018 (CONTINUED)
45
8. Related Parties (continued) The following related parties held Shares in the Sub-Funds as at 31 December 2018: Sub-Fund Related Party Shares Held Fidelity Europe ex-UK Equity Fund
Class G Acc EUR FIL Fondsbank GmbH 7,235 FIL Limited 436
Fidelity Japan Equity Fund Class G Acc EUR FIL Fondsbank GmbH 2,526 FIL Limited 432
Fidelity North America Equity Fund Class G Acc EUR FIL Fondsbank GmbH 17,780 FIL Limited 430
Fidelity UK Equity Fund Class G Acc EUR FIL Fondsbank GmbH 4,316 FIL Limited 430
Fidelity Global Aggregate Bond Fund Class G Acc EUR FIL Fondsbank GmbH 48,770 FIL Limited 430
Fidelity Global Sub-IG Fixed Income Fund Class G Acc EUR FIL Fondsbank GmbH 19,388 FIL Limited 430
Fidelity Asia Pacific ex-Japan Equity Fund Class G Acc EUR FIL Fondsbank GmbH 3,458 FIL Limited 430
Fidelity Alternative Listed Equity Fund Class G Acc EUR FIL Fondsbank GmbH 5,139 FIL Limited 430
Fidelity Global Emerging Markets Equity Fund Class G Acc EUR FIL Fondsbank GmbH 750 FIL Limited 431
9. Transaction Costs Transaction costs are incremental costs that are directly attributable to the acquisition, issue or disposal of the of the financial asset or liability. In order to achieve its investment objective, each Sub-Fund incurs transaction costs in relation to trading activity on its portfolio. These costs may include broker commissions, settlement fees, stamp duties, and financial transaction taxes. For some financial instruments, such as debt securities, repurchase agreements, and forward foreign exchange contracts, transaction costs are embedded in the price of the instruments and are not separately identifiable. There were no transactions costs incurred during the period ended 31 December 2018. 10. Financial Risk Management The Sub-Funds intend to achieve their investment objective by investing all, or substantially all, of their investable assets in the Master Funds which has the same investment objective and policies as the relevant Sub-Fund and also is managed by the Investment Manager. Accordingly, the description herein of the Sub-Funds’ risks refers to those that will be pursued directly by the Master Funds. Each Sub-Fund may be exposed to market price risk, interest rate risk, credit risk, liquidity risk or currency risk arising from the financial instruments it holds. The Sub-Funds’ overall risk management programme focuses on the unpredictability of financial markets and seeks to minimise potential adverse effects on financial performance. The policies documented below are standard operational practices and are reviewed regularly by the Investment Manager. In certain market conditions, the Investment Manager may apply additional risk procedures to minimise potential adverse effects on the Sub-Funds’ financial performance. The Directors and the Investment Manager perform the financial risk management procedures on behalf of the Fund.
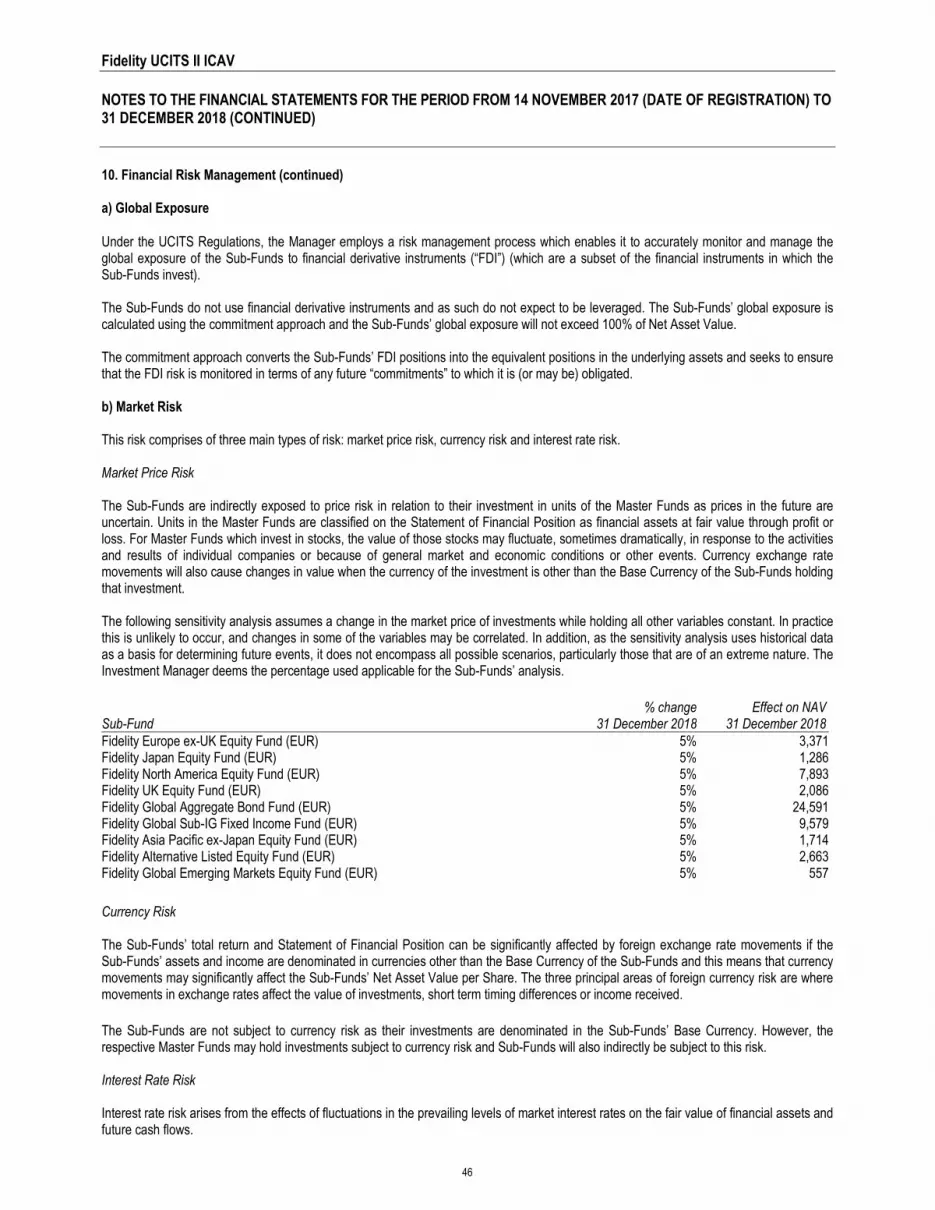
Fidelity UCITS II ICAV NOTES TO THE FINANCIAL STATEMENTS FOR THE PERIOD FROM 14 NOVEMBER 2017 (DATE OF REGISTRATION) TO 31 DECEMBER 2018 (CONTINUED)
46
10. Financial Risk Management (continued) a) Global Exposure
Under the UCITS Regulations, the Manager employs a risk management process which enables it to accurately monitor and manage the global exposure of the Sub-Funds to financial derivative instruments (“FDI”) (which are a subset of the financial instruments in which the Sub-Funds invest).
The Sub-Funds do not use financial derivative instruments and as such do not expect to be leveraged. The Sub-Funds’ global exposure is calculated using the commitment approach and the Sub-Funds’ global exposure will not exceed 100% of Net Asset Value. The commitment approach converts the Sub-Funds’ FDI positions into the equivalent positions in the underlying assets and seeks to ensure that the FDI risk is monitored in terms of any future “commitments” to which it is (or may be) obligated. b) Market Risk This risk comprises of three main types of risk: market price risk, currency risk and interest rate risk. Market Price Risk The Sub-Funds are indirectly exposed to price risk in relation to their investment in units of the Master Funds as prices in the future are uncertain. Units in the Master Funds are classified on the Statement of Financial Position as financial assets at fair value through profit or loss. For Master Funds which invest in stocks, the value of those stocks may fluctuate, sometimes dramatically, in response to the activities and results of individual companies or because of general market and economic conditions or other events. Currency exchange rate movements will also cause changes in value when the currency of the investment is other than the Base Currency of the Sub-Funds holding that investment. The following sensitivity analysis assumes a change in the market price of investments while holding all other variables constant. In practice this is unlikely to occur, and changes in some of the variables may be correlated. In addition, as the sensitivity analysis uses historical data as a basis for determining future events, it does not encompass all possible scenarios, particularly those that are of an extreme nature. The Investment Manager deems the percentage used applicable for the Sub-Funds’ analysis.
Sub-Fund % change
31 December 2018Effect on NAV
31 December 2018 Fidelity Europe ex-UK Equity Fund (EUR) 5% 3,371Fidelity Japan Equity Fund (EUR) 5% 1,286Fidelity North America Equity Fund (EUR) 5% 7,893Fidelity UK Equity Fund (EUR) 5% 2,086Fidelity Global Aggregate Bond Fund (EUR) 5% 24,591Fidelity Global Sub-IG Fixed Income Fund (EUR) 5% 9,579Fidelity Asia Pacific ex-Japan Equity Fund (EUR) 5% 1,714Fidelity Alternative Listed Equity Fund (EUR) 5% 2,663Fidelity Global Emerging Markets Equity Fund (EUR) 5% 557
Currency Risk The Sub-Funds’ total return and Statement of Financial Position can be significantly affected by foreign exchange rate movements if the Sub-Funds’ assets and income are denominated in currencies other than the Base Currency of the Sub-Funds and this means that currency movements may significantly affect the Sub-Funds’ Net Asset Value per Share. The three principal areas of foreign currency risk are where movements in exchange rates affect the value of investments, short term timing differences or income received. The Sub-Funds are not subject to currency risk as their investments are denominated in the Sub-Funds’ Base Currency. However, the respective Master Funds may hold investments subject to currency risk and Sub-Funds will also indirectly be subject to this risk. Interest Rate Risk Interest rate risk arises from the effects of fluctuations in the prevailing levels of market interest rates on the fair value of financial assets and future cash flows.

Fidelity UCITS II ICAV NOTES TO THE FINANCIAL STATEMENTS FOR THE PERIOD FROM 14 NOVEMBER 2017 (DATE OF REGISTRATION) TO 31 DECEMBER 2018 (CONTINUED)
47
10. Financial Risk Management (continued) b) Market Risk (continued) Interest Rate Risk (continued) The Sub-Funds’ financial assets and liabilities are non-interest bearing as at 31 December 2018. As a result, the Sub-Funds are not subject to significant amounts of risk due to fluctuations in the prevailing levels of market interest rates. However, the Master Funds may hold investments subject to interest rate risk and the Sub-Funds will also indirectly be subject to this risk.
c) Credit Risk Credit risk is the risk that a counterparty or an issuer will be unable to pay amounts in full when due. The Sub-Fund will be exposed to credit risk on parties with whom it trades and will also bear the risk of settlement default. The Manager may instruct the Depositary to settle transactions on a delivery free of payment basis where the Manager believes that this form of settlement is appropriate. Shareholders should be aware, however, that this may result in a loss to the Sub-Fund if a transaction fails to settle and the Depositary will not be liable to the Sub-Fund or the shareholders for such a loss. A Sub-Fund is exposed to the credit risk of the counterparties (such as the Depositary) or the brokers and dealers and exchanges through which, it deals, whether it engages in exchange-traded or off-exchange transactions. Counterparty risk is a risk to both parties and should be considered when evaluating a contract. A Sub-Fund may be subject to the possibility of insolvency, bankruptcy or default of a counterparty with which the Sub-Fund trades such instruments, which could result in substantial losses to the Sub-Fund. A Sub-Fund may be subject to risk of loss of its assets held by a broker in the event of the broker's bankruptcy, the bankruptcy of any clearing broker through which the broker executes and clears transactions on behalf of the Sub-Fund, or the bankruptcy of an exchange clearing house. As at 31 December 2018, the institutions where the Sub-Funds’ cash was held and their respective short term credit ratings, as rated by Fitch, are listed below: Institution Short Term Credit Indicator Brown Brothers Harriman F1 All cash at bank balances at the period end are held with Brown Brothers Harriman on segregated accounts or swept to overnight time deposits held on pooled accounts in eligible institutions. The Sub-Funds are not subject to credit risk. However, the Master Funds may hold investments subject to credit risk and the Sub-Funds will also indirectly be subject to this risk. d) Liquidity Risk In normal market conditions the assets of each Sub-Fund comprise mainly realisable investments which can be readily sold. Each Sub-Fund’s main liability is the redemption of any Shares that investors wish to sell. In general, the investments, including cash, of each Sub-Fund are managed so that it can meet its liabilities. Investments held may need to be sold if insufficient cash is available to finance such redemptions. If the size of the disposals are sufficiently large, or the market is illiquid, then there is a risk that either the investments might not be sold or the price at which they are sold may adversely affect the Net Asset Value of the relevant Sub-Fund. The Investment Manager employs an appropriate liquidity risk management process, which takes into account efficient portfolio management transactions employed by the Sub-Funds, in order to ensure that the Sub-Funds are able to comply with their stated redemption obligations. However, it is possible that in the type of circumstances described above, a Sub-Fund may not be able to realise sufficient assets to meet all redemption requests that it receives or the Fund may determine that the circumstances are such that meeting some or all of such requests is not in the best interests of the Shareholders. As at 31 December 2018, all liability amounts are due within three months. There is no liquidity mis-match between the Sub-Funds and the respective Master Funds.

Fidelity UCITS II ICAV NOTES TO THE FINANCIAL STATEMENTS FOR THE PERIOD FROM 14 NOVEMBER 2017 (DATE OF REGISTRATION) TO 31 DECEMBER 2018 (CONTINUED)
48
10. Financial Risk Management (continued) e) Capital Risk Management The capital of each Sub-Fund is represented by the net assets attributable to holders of redeemable Shares. The amount of net assets attributable to holders of redeemable Shares is subject to subscriptions and redemptions at the discretion of the Shareholders as well as changes resulting from the Sub-Funds’ performance. The Investment Manager’s objective when managing capital is to safeguard the Sub-Funds’ ability to continue as a going concern in order to provide returns for Shareholders, provide benefits to other stakeholders and maintain a strong capital base to support the development of the investment activities of the Sub-Funds. In order to maintain the capital structure, the Investment Manager’s policy is to monitor the level of subscriptions and redemptions relative to the assets it expects to be able to liquidate. The Prospectus and Instrument of Incorporation include the ability to restrict redemptions and require certain minimum holdings and subscriptions. f) Fair Value Estimation Each Sub-Fund has classified fair value measurements using a fair value hierarchy that reflects the significance of the inputs used in making the measurements. The fair value hierarchy has the following levels: (i) Level 1: Investments whose values are based on quoted market prices in active markets and are therefore classified within level 1 include active listed equities, U.S. government treasury bills and certain non-U.S. sovereign obligations. Quoted prices for these instruments are not adjusted. (ii) Level 2: Financial instruments that trade in markets that are not considered to be active but are valued based on quoted market prices, dealer quotations or alternative pricing sources supported by observable inputs are classified within level 2. These include investment-grade corporate bonds and certain non-U.S. sovereign obligations, shares of open-end mutual funds and over the counter derivatives. As level 2 investments include positions that are not traded in active markets and/or are subject to transfer restrictions, valuations may be adjusted to reflect illiquidity and/or non-transferability, which are generally based on available market information. (iii) Level 3: Investments classified within level 3 have significant unobservable inputs, as they trade infrequently. Level 3 instruments include certain corporate debt securities. As observable prices are not available for these securities, the Sub-Funds have used valuation techniques to derive the fair value. The level in the fair value hierarchy within which the fair value measurement is categorised in its entirety is determined on the basis of the lowest level input that is significant to the fair value measurement in its entirety. For this purpose, the significance of an input is assessed against the fair value measurement in its entirety. If a fair value measurement uses observable inputs that require significant adjustment based on unobservable inputs, that measurement is a level 3 measurement. Assessing the significance of a particular input to the fair value measurement in its entirety requires judgement, considering factors specific to the financial asset or liability. The puttable value of redeemable participating Shares is calculated based on the net difference between total assets and all other liabilities of the Sub-Funds in accordance with the Prospectus. These Shares are not traded on an active market. A demand feature is attached of those Shares, as they are redeemable at the holder’s option and can be put back to the relevant Sub-Fund at any dealing for cash equal to a proportionate share of the Sub-Fund’s Net Asset Value attributable to the share class. The fair value is based on the amount payable on demand, discounted from the first date that the amount could be required to be paid. The impact of discounting in this instance is not material. As such, level 2 is deemed to be the most appropriate categorisation for net assets attributable to holders of redeemable participating shares. The determination of what constitutes ‘observable’ requires significant judgment by the Directors. The Directors have delegated this task to the Administrator. The Administrator considers observable data to be that market data that is readily available, regularly distributed or updated, reliable and verifiable, not proprietary, and provided by independent sources that are actively involved in the relevant market.

Fidelity UCITS II ICAV NOTES TO THE FINANCIAL STATEMENTS FOR THE PERIOD FROM 14 NOVEMBER 2017 (DATE OF REGISTRATION) TO 31 DECEMBER 2018 (CONTINUED)
49
10. Financial Risk Management (continued) f) Fair Value Estimation (continued) As at 31 December 2018, cash and cash equivalents are classified as Level 1. All other assets and liabilities not measured at fair value but for which fair value is disclosed are classified as Level 2. There were no investments classified at Level 3 at the period ended 31 December 2018. The following tables analyse within the fair value hierarchy of the Sub-Funds’ financial assets and liabilities measured at fair value at 31 December 2018: Fidelity Europe ex-UK Equity Fund
31 December 2018 Level 1 Level 2 Level 3 Total EUR EUR EUR EURFinancial Assets at Fair Value Through Profit or Loss
Transferable Securities - 67,419 - 67,419
Total Assets - 67,419 - 67,419
Fidelity Japan Equity Fund
31 December 2018 Level 1 Level 2 Level 3 Total EUR EUR EUR EURFinancial Assets at Fair Value Through Profit or Loss
Transferable Securities - 25,719 - 25,719
Total Assets - 25,719 - 25,719
Fidelity North America Equity Fund
31 December 2018 Level 1 Level 2 Level 3 Total EUR EUR EUR EURFinancial Assets at Fair Value Through Profit or Loss
Transferable Securities - 157,856 - 157,856
Total Assets - 157,856 - 157,856 Fidelity UK Equity Fund
31 December 2018 Level 1 Level 2 Level 3 Total EUR EUR EUR EURFinancial Assets at Fair Value Through Profit or Loss
Transferable Securities - 41,711 - 41,711
Total Assets - 41,711 - 41,711

Fidelity UCITS II ICAV NOTES TO THE FINANCIAL STATEMENTS FOR THE PERIOD FROM 14 NOVEMBER 2017 (DATE OF REGISTRATION) TO 31 DECEMBER 2018 (CONTINUED)
50
10. Financial Risk Management (continued) f) Fair Value Estimation (continued) Fidelity Global Aggregate Bond Fund
31 December 2018 Level 1 Level 2 Level 3 Total EUR EUR EUR EURFinancial Assets at Fair Value Through Profit or Loss
Transferable Securities - 491,809 - 491,809
Total Assets - 491,809 - 491,809 Fidelity Global Sub-IG Fixed Income Fund
31 December 2018 Level 1 Level 2 Level 3 Total EUR EUR EUR EURFinancial Assets at Fair Value Through Profit or Loss
Transferable Securities - 191,572 - 191,572
Total Assets - 191,572 - 191,572 Fidelity Asia Pacific ex-Japan Equity Fund
31 December 2018 Level 1 Level 2 Level 3 Total EUR EUR EUR EURFinancial Assets at Fair Value Through Profit or Loss
Transferable Securities - 34,270 - 34,270
Total Assets - 34,270 - 34,270 Fidelity Alternative Listed Equity Fund
31 December 2018 Level 1 Level 2 Level 3 Total EUR EUR EUR EURFinancial Assets at Fair Value Through Profit or Loss
Transferable Securities - 53,254 - 53,254
Total Assets - 53,254 - 53,254 Fidelity Global Emerging Markets Equity Fund
31 December 2018 Level 1 Level 2 Level 3 Total EUR EUR EUR EURFinancial Assets at Fair Value Through Profit or Loss
Transferable Securities - 11,137 - 11,137
Total Assets - 11,137 - 11,137
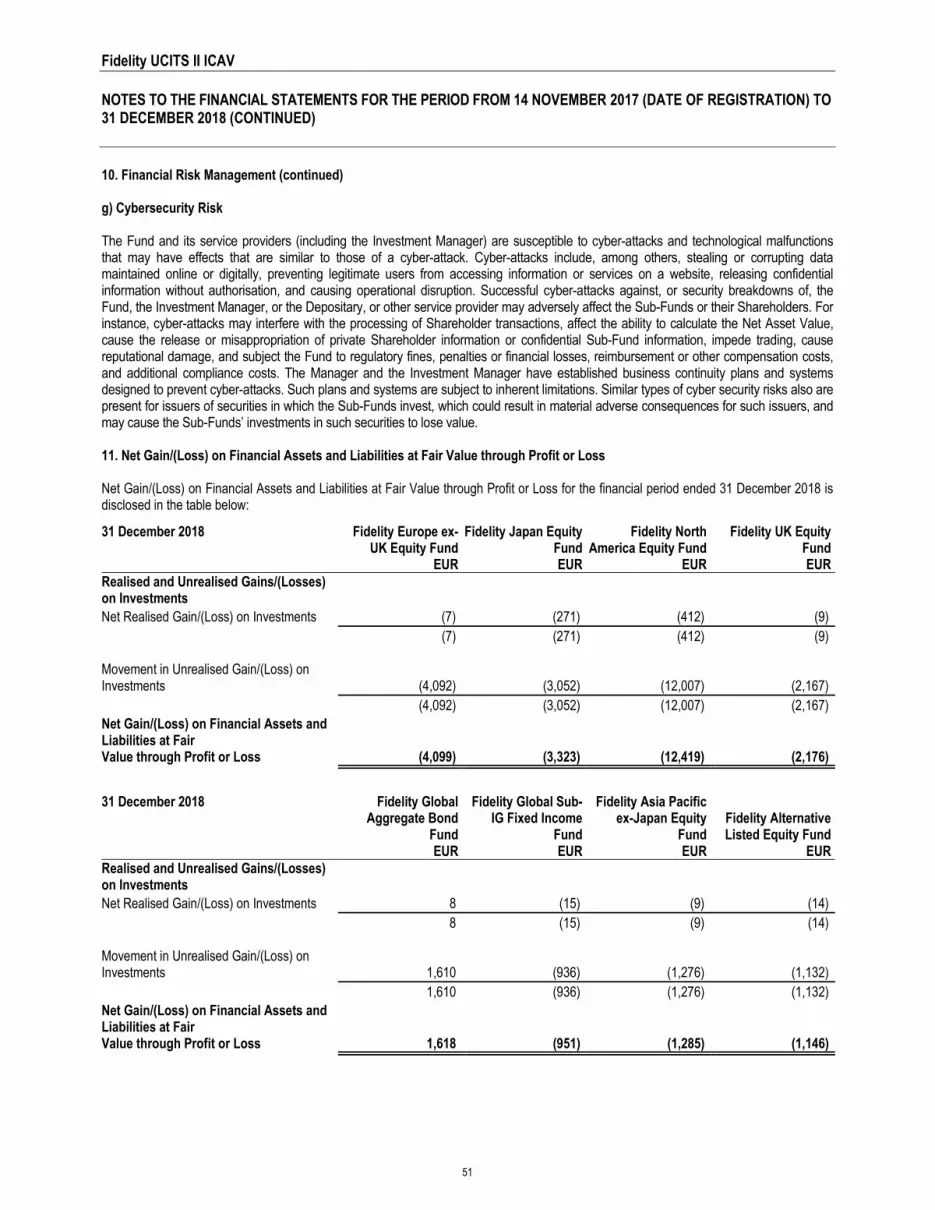
Fidelity UCITS II ICAV NOTES TO THE FINANCIAL STATEMENTS FOR THE PERIOD FROM 14 NOVEMBER 2017 (DATE OF REGISTRATION) TO 31 DECEMBER 2018 (CONTINUED)
51
10. Financial Risk Management (continued) g) Cybersecurity Risk The Fund and its service providers (including the Investment Manager) are susceptible to cyber-attacks and technological malfunctions that may have effects that are similar to those of a cyber-attack. Cyber-attacks include, among others, stealing or corrupting data maintained online or digitally, preventing legitimate users from accessing information or services on a website, releasing confidential information without authorisation, and causing operational disruption. Successful cyber-attacks against, or security breakdowns of, the Fund, the Investment Manager, or the Depositary, or other service provider may adversely affect the Sub-Funds or their Shareholders. For instance, cyber-attacks may interfere with the processing of Shareholder transactions, affect the ability to calculate the Net Asset Value, cause the release or misappropriation of private Shareholder information or confidential Sub-Fund information, impede trading, cause reputational damage, and subject the Fund to regulatory fines, penalties or financial losses, reimbursement or other compensation costs, and additional compliance costs. The Manager and the Investment Manager have established business continuity plans and systems designed to prevent cyber-attacks. Such plans and systems are subject to inherent limitations. Similar types of cyber security risks also are present for issuers of securities in which the Sub-Funds invest, which could result in material adverse consequences for such issuers, and may cause the Sub-Funds’ investments in such securities to lose value. 11. Net Gain/(Loss) on Financial Assets and Liabilities at Fair Value through Profit or Loss Net Gain/(Loss) on Financial Assets and Liabilities at Fair Value through Profit or Loss for the financial period ended 31 December 2018 is disclosed in the table below:
31 December 2018 Fidelity Europe ex-UK Equity Fund
EUR
Fidelity Japan Equity Fund EUR
Fidelity North America Equity Fund
EUR
Fidelity UK Equity Fund EUR
Realised and Unrealised Gains/(Losses) on Investments Net Realised Gain/(Loss) on Investments (7) (271) (412) (9) (7) (271) (412) (9) Movement in Unrealised Gain/(Loss) on Investments (4,092) (3,052) (12,007) (2,167) (4,092) (3,052) (12,007) (2,167) Net Gain/(Loss) on Financial Assets and Liabilities at Fair Value through Profit or Loss (4,099) (3,323) (12,419) (2,176)
31 December 2018 Fidelity Global Aggregate Bond
Fund EUR
Fidelity Global Sub-IG Fixed Income
Fund EUR
Fidelity Asia Pacific ex-Japan Equity
Fund EUR
Fidelity Alternative Listed Equity Fund
EUR Realised and Unrealised Gains/(Losses) on Investments Net Realised Gain/(Loss) on Investments 8 (15) (9) (14) 8 (15) (9) (14) Movement in Unrealised Gain/(Loss) on Investments 1,610 (936) (1,276) (1,132) 1,610 (936) (1,276) (1,132) Net Gain/(Loss) on Financial Assets and Liabilities at Fair Value through Profit or Loss 1,618 (951) (1,285) (1,146)
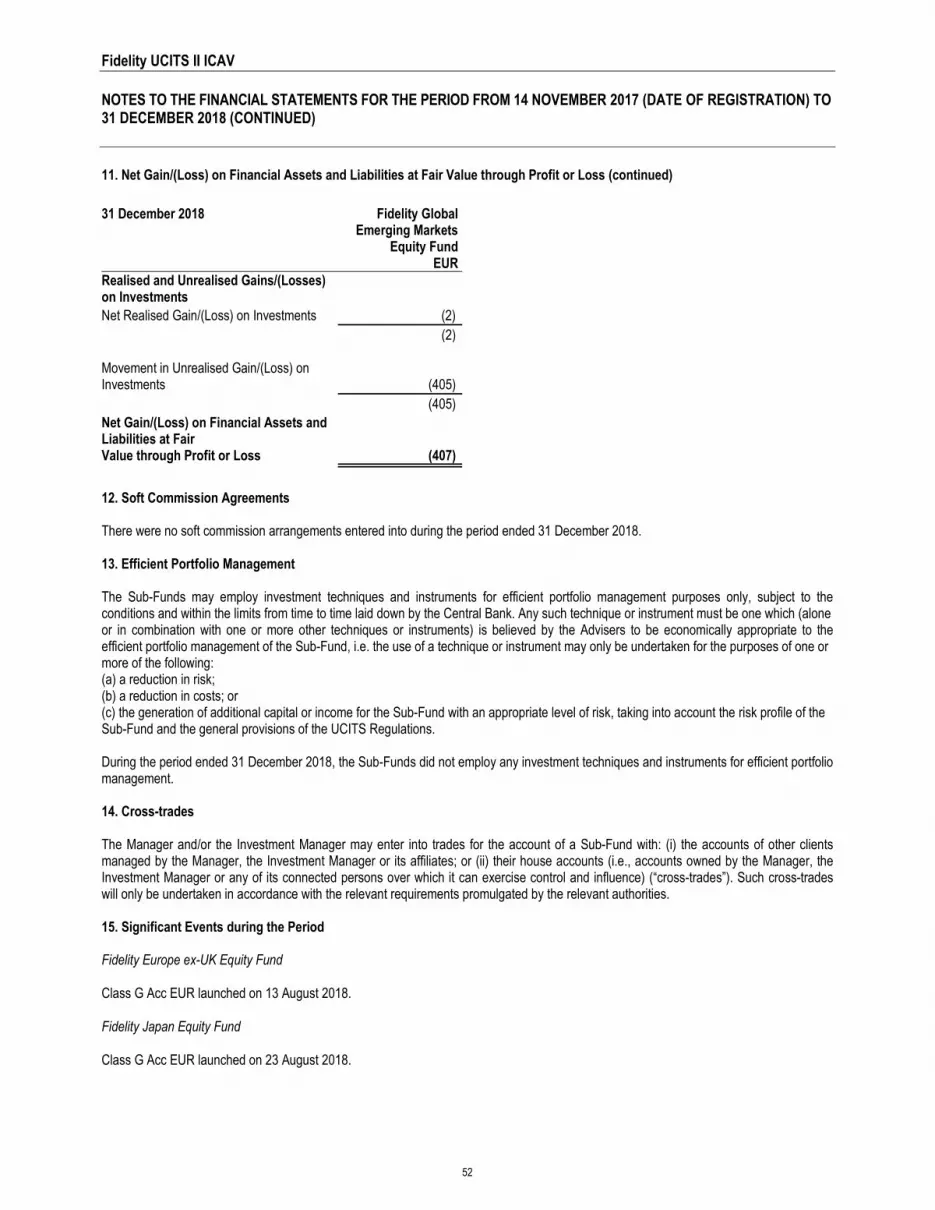
Fidelity UCITS II ICAV NOTES TO THE FINANCIAL STATEMENTS FOR THE PERIOD FROM 14 NOVEMBER 2017 (DATE OF REGISTRATION) TO 31 DECEMBER 2018 (CONTINUED)
52
11. Net Gain/(Loss) on Financial Assets and Liabilities at Fair Value through Profit or Loss (continued)
31 December 2018 Fidelity Global Emerging Markets
Equity Fund EUR
Realised and Unrealised Gains/(Losses) on Investments Net Realised Gain/(Loss) on Investments (2) (2) Movement in Unrealised Gain/(Loss) on Investments (405) (405) Net Gain/(Loss) on Financial Assets and Liabilities at Fair Value through Profit or Loss (407)
12. Soft Commission Agreements There were no soft commission arrangements entered into during the period ended 31 December 2018. 13. Efficient Portfolio Management The Sub-Funds may employ investment techniques and instruments for efficient portfolio management purposes only, subject to the conditions and within the limits from time to time laid down by the Central Bank. Any such technique or instrument must be one which (alone or in combination with one or more other techniques or instruments) is believed by the Advisers to be economically appropriate to the efficient portfolio management of the Sub-Fund, i.e. the use of a technique or instrument may only be undertaken for the purposes of one or more of the following: (a) a reduction in risk; (b) a reduction in costs; or (c) the generation of additional capital or income for the Sub-Fund with an appropriate level of risk, taking into account the risk profile of the Sub-Fund and the general provisions of the UCITS Regulations. During the period ended 31 December 2018, the Sub-Funds did not employ any investment techniques and instruments for efficient portfolio management. 14. Cross-trades The Manager and/or the Investment Manager may enter into trades for the account of a Sub-Fund with: (i) the accounts of other clients managed by the Manager, the Investment Manager or its affiliates; or (ii) their house accounts (i.e., accounts owned by the Manager, the Investment Manager or any of its connected persons over which it can exercise control and influence) (“cross-trades”). Such cross-trades will only be undertaken in accordance with the relevant requirements promulgated by the relevant authorities. 15. Significant Events during the Period Fidelity Europe ex-UK Equity Fund
Class G Acc EUR launched on 13 August 2018.
Fidelity Japan Equity Fund
Class G Acc EUR launched on 23 August 2018.

Fidelity UCITS II ICAV NOTES TO THE FINANCIAL STATEMENTS FOR THE PERIOD FROM 14 NOVEMBER 2017 (DATE OF REGISTRATION) TO 31 DECEMBER 2018 (CONTINUED)
53
15. Significant Events during the Period (continued) Fidelity North America Equity Fund
Class G Acc EUR launched on 28 August 2018.
Fidelity UK Equity Fund Class G Acc EUR launched on 29 August 2018.
Fidelity Global Aggregate Bond Fund
Class G Acc EUR launched on 30 August 2018.
Fidelity Global Sub-IG Fixed Income Fund
Class G Acc EUR launched on 30 August 2018.
Fidelity Asia Pacific ex-Japan Equity Fund Class G Acc EUR launched on 31 August 2018.
Fidelity Alternative Listed Equity Fund
Class G Acc EUR launched on 12 September 2018.
Global Emerging Markets Equity Fund
Class G Acc EUR launched on 14 September 2018.
The appointments and resignations of the following Directors of the Manager:
• Ms Denise Kinsella was appointed as a Director of the Fund, effective 4 January 2018.
• Mr David Greco was appointed as a Director of the Fund, effective 4 January 2018.
• Mr Nick King was appointed as a Director of the Fund, effective 4 January 2018.
• Ms Catherine Fitzsimons was appointed as a Director of the Fund, effective 22 February 2018.
• Ms Eímhín Ní Mhuircheartaigh was appointed as a Director of the Fund, effective 26 February 2018.
• Mr David Dillon resigned as a Director of the Fund, effective 23 May 2018.
• Mr Paul Burd resigned as a Director of the Fund, effective 3 August 2018.
Ms Denise Kinsella was appointed as a Chairperson, effective 20 August 2018.
There were no contingent liabilities during the period ended 31 December 2018.
16. Events since the Period End The most recent supplements and Prospectus are dated 15 March 2019. The prospectus has been updated to reflect, among other things, amendments to German tax reporting disclosure, minor updates to fees and expenses disclosure and the update of the list of sub-funds of the Fund. Revised supplements for the Sub-Funds specify that each Sub-Fund invests at least 85% of its assets in unit classes of the corresponding Master Fund of Fidelity Common Contractual Fund II to address a technical breach of the previous investment objective arising.

Fidelity UCITS II ICAV NOTES TO THE FINANCIAL STATEMENTS FOR THE PERIOD FROM 14 NOVEMBER 2017 (DATE OF REGISTRATION) TO 31 DECEMBER 2018 (CONTINUED)
54
17. Approval of Financial Statements The report for the period from 14 November 2017 (date of registration) to 31 December 2018 and financial statements were approved by the Board of Directors of the Fund on 29 April 2019.

Fidelity UCITS II ICAV
DIRECTORS’ REPORT (UNAUDITED)
55
The Directors present, herewith their annual report and audited financial statements for Fidelity UCITS II ICAV (the “Fund”) for the period from 14 November 2017 (date of registration) to 31 December 2018. Statement of Directors’ Responsibilities The Directors are responsible for preparing the annual report and the financial statements in accordance with applicable law and regulations. The Irish Collective Asset-management Vehicles Act 2015 as amended (the “ICAV Act”) requires the Directors to prepare financial statements for each financial period which give a true and fair view of the Fund’s assets, liabilities and financial position as at the end of the financial period and the profit or loss of the Fund for the financial period. The Directors have elected to prepare the financial statements in accordance with applicable Irish law and International Financial Reporting Standards, as adopted by the European Union (“IFRS”),. In preparing these financial statements, the Directors are required to: - select suitable accounting policies and then apply them consistently; - make judgements and estimates that are reasonable and prudent;
- state whether the financial statements have been prepared in accordance with applicable accounting standards and identify the standards in question, subject to any material departures from those standards being disclosed and explained in the notes to the financial statements; and - prepare the financial statements on the going concern basis unless it is inappropriate to presume that the Fund will continue in business. The Directors are responsible for keeping adequate accounting records which disclose with reasonable accuracy, at any time, the assets and liabilities and financial position of the Fund and enable them to ensure that the financial statements are prepared in accordance with IFRS and comply with the ICAV Act 2015 and the European Communities (Undertakings for Collective Investment in Transferable Securities) Regulations, 2011 (as amended) (“UCITS Regulations”). They are also responsible for safeguarding the assets of the Fund and hence for taking reasonable steps for the prevention and detection of fraud and other irregularities. The Directors are responsible for the maintenance and integrity of the corporate and financial information included on the Fund’s website. Legislation in Ireland governing the preparation and dissemination of financial statements may differ from legislation in other jurisdictions. The Directors are required to entrust the assets of the Fund to a Depositary for safe-keeping. In carrying out this duty, the Fund has appointed Brown Brothers Harriman Trustee Services (Ireland) Limited as Depositary (the “Depositary”). Accounting Records The Fund is obliged to keep or cause to be kept adequate accounting records as outlined in Section 110 of the ICAV Act. To achieve this, the Directors have appointed a service organisation Brown Brothers Harriman Fund Administration Services (Ireland) Limited (the “Administrator”). The Fund’s accounting records are retained at the Administrator’s registered office at 30 Herbert Street, Dublin 2, Ireland.

Fidelity UCITS II ICAV
DIRECTORS’ REPORT (UNAUDITED) (CONTINUED)
56
Principal Activities and Review of Business
The Fund was registered in Ireland on 14 November 2017 as an Irish collective asset-management vehicle with variable capital and having segregated liability between its Sub-Funds and is structured as an umbrella collective asset-management vehicle in that the share capital of the Fund may be divided into different Share Classes with one or more Share Classes representing a separate Sub-Fund of the Fund. Each Sub-Fund may have more than one Share Class. The assets of each Sub-Fund are invested in accordance with the investment objectives applicable to such Sub-Fund. As at 31 December 2018, the Fund comprised 19 Sub-Funds under the umbrella. The financial statements are prepared for the below 9 Sub-Funds for which the fiscal year end is 31 December: Name Launch Date Fidelity Europe ex-UK Equity Fund 13 August 2018 Fidelity Japan Equity Fund 23 August 2018 Fidelity North America Equity Fund 28 August 2018 Fidelity UK Equity Fund 29 August 2018 Fidelity Global Aggregate Bond Fund 30 August 2018 Fidelity Global Sub-IG Fixed Income Fund 30 August 2018 Fidelity Asia Pacific ex-Japan Equity Fund 31 August 2018 Fidelity Alternative Listed Equity Fund 12 September 2018 Fidelity Global Emerging Markets Equity Fund 14 September 2018 The investment objectives of the Sub-Funds trading during the period ended 31 December 2018 are stated in the General Information. Results for the Period and Assets, Liabilities and Financial Position at 31 December 2018 Details of the assets, liabilities and financial position of the Sub-Funds and results for the period ended 31 December 2018 are set out in the Statement of Financial Position, Statement of Other Comprehensive Income and Statement of Changes in Net Assets Attributable to Holders of Redeemable Participating Shares. Directors The names of the persons who were Directors at any time during the financial period are listed below: Mr. David Dillon (Ireland) (Chairperson, resigned on 23 May 2018) Ms. Denise Kinsella (Ireland) (appointed on 4 January 2018, Chairperson from 20 August 2018) Mr. Paul Burd (UK) (resigned on 3 August 2018) Mr. David Greco (USA) (appointed on 4 January 2018) Mr. Nick King (UK) (appointed on 4 January 2018) Ms. Catherine Fitzsimons (Ireland) (appointed on 22 February 2018) Ms. Eímhín Ní Mhuircheartaigh (Ireland) (appointed on 26 February 2018) Directors’ Interests None of the Directors, the Secretary, or their families holds or held any beneficial interests in the Fund at 31 December 2018 or during the financial period. Transactions Involving Directors There are no contracts or arrangements of any significance in relation to the business of the Fund in which the Directors had any interest, as defined in the ICAV Act, at any time during the financial period ended 31 December 2018 other than those disclosed in Note 8 ‘Related Parties’ of these financial statements. Connected Person Transactions Connected Persons The Manager, the Depositary, the Distributor, the Administrator, the Investment Manager and each of their respective affiliates are considered to be connected persons of the Fund for the purposes of the Central Bank UCITS Regulations.

Fidelity UCITS II ICAV
DIRECTORS’ REPORT (UNAUDITED) (CONTINUED)
57
Connected Person Transactions (continued) Connected Persons (continued) The following table details the types of transaction entered into with counterparties that are connected persons: Type of Transaction Counterparty Administration Brown Brothers Harriman Fund Administration Services (Ireland) Limited Depositary, FX and Hedging Services Brown Brothers Harriman Trustee Services (Ireland) Limited Distributor FIL Distributors Manager FIL Fund Management (Ireland) Limited Investment Manager FIL Investments International Dealing with Connected Persons Regulation 41 of the Central Bank UCITS Regulations “Restriction on transactions with connected persons” states that “a responsible person shall ensure that any transaction between a UCITS and connected person is: (i) conducted at arm’s length; and (ii) in the best interest of the unit-holders of the UCITS”. In accordance with Regulation 78(4) of the Central Bank UCITS Regulations, the Directors are satisfied that all connected persons letters from all relevant persons have been received and that: (i) there are in place arrangements, evidenced by written procedures, to ensure that the obligations that are prescribed by Regulation 41(1) are applied to all transactions with a connected person; and (ii) all transactions with connected persons that were entered into during the period to which the report relates complied with the obligations that are prescribed by Regulation 41(1). Risk Management Objectives and Policies
The principal risks and uncertainties faced by the Fund are outlined in Note 10 ‘Financial Risk Management’.
Dividends and Retention
The Sub-Funds have only accumulating classes, for which the Directors have determined to accumulate all net income and therefore do not intend to declare dividends.
Future Developments
The Sub-Funds will continue to pursue their investment objectives as set out in the Prospectus and outlined in these financial statements.
Independent Auditors
The Fund has appointed PricewaterhouseCoopers, Chartered Accountants & Registered Auditors, as its Independent Auditor.

Fidelity UCITS II ICAV
DIRECTORS' REPORT (UNAUDITED) (CONTINUED)
Corporate Governance
Irish Funds Corporate Governance Code
Irish Funds (IF") has published a voluntary corporate governance code for collective investments schemes and management companies (IF Code"). The IF Code reflects existing corporate governance practices imposed on Irish authorised collective investment schemes.
The Board of Directors of the Fund voluntarily adopted the IF Code, as the Fund's corporate governance code with effect from its authorisation as a WITS by the Central Bank on 14 November 2017.
Signed on behalf of the Board of Directors By:
Ø,UCA 29 April 2019 29
~,~- 2019
58

UCITS II ICAV
REPORT FROM THE DEPOSITARY TO THE SHAREHOLDERS (UNAUDITED)
We have enquired into the conduct of the Fidelity UCITS II ICAV (the Fund") for the period ended 31 December 2018 in our capacity as Depositary to the Fund.
This report including the opinion has been prepared for and solely for the Shareholders in the Fund, in accordance with Part 5 of the European Communities (Undertakings for Collective Investment in Transferable Securities) Regulations 2011, as amended, (The UCITS Regulations"), and for no other purpose. We do not, in giving this opinion, accept or assume responsibility for any other purpose or to any other person to whom this report is shown.
Responsibilities of the Depositary
Our duties and responsibilities are outlined in Part 5 of the UCITS Regulations. One of those duties is to enquire into the conduct of the Fund in each annual accounting period and report thereon to the shareholders. Our report shall state whether, in our opinion, the Fund has been managed in that period in accordance with the provisions of the Fund's Instrument of Incorporation of the Fund and the UCITS Regulations. It is the overall responsibility of the Fund to comply with these provisions. If the Fund has not so complied, we as Depositary must state why this is the case and outline the steps which we have taken to rectify the situation.
Basis of Depositary Opinion
The Depositary conducts such reviews as it, in its reasonable opinion, considers necessary in order to comply with its duties as outlined in Part 5 of the UCITS Regulations and to ensure that, in all material respects, the Fund has been managed (i) in accordance with the limitations imposed on its investment and borrowing powers by the provisions of the Instrument of Incorporation of the Fund and the appropriate regulations and (ii) otherwise in accordance with the Fund constitutional documentation and the appropriate regulations.
Opinion In our opinion, the Fund has been managed during the period, in all material respects:
(i)in accordance with the limitations imposed on the investment and borrowing powers of the Fund by the Instrument of Incorporation of the Fund, the UCITS Regulations and the Central Bank UCITS Regulations, and
(ii)otherwise in accordance with the provisions of the Instrument of Incorporation of the Fund, the UCITS Regulations and the Central Bank UCITS Regulations.
Brown Brothers Harriman Trustee Services (Ireland) Limited, 30 Herbert Street, Dublin 2, D02 W329, Ireland
Avb 29 April 2019
59

Fidelity UCITS II ICAV INDEPENDENT AUDITORS’ REPORT
60
Report on the audit of the financial statements
Opinion
In our opinion, Fidelity UCITS II ICAV financial statements:
give a true and fair view of the Sub-Funds’ assets, liabilities and financial position as at 31 December 2018 and of their results and cash flows for the period from 14 November 2017 to 31 December 2018 (the “period”);
have been properly prepared in accordance with International Financial Reporting Standards (“IFRSs”) as adopted by the European Union; and
have been properly prepared in accordance with the requirements of the European Communities (Undertakings for Collective Investment in Transferable Securities) Regulations 2011 (as amended).
We have audited the financial statements, included within the Annual Report and Audited Financial Statements, which comprise:
the Statement of Financial Position as at 31 December 2018; the Statement of Comprehensive Income for the period then ended; the Statement of Cash Flows for the period then ended; the Statement of Changes in Net Assets Attributable to Holders of Redeemable Participating Units for the period
then ended; the Schedules of Investments for each of the Sub-Funds as at 31 December 2018; and the notes to the financial statements for each of the Sub-Funds, which include a description of the significant
accounting policies.
Basis for opinion
We conducted our audit in accordance with International Standards on Auditing (Ireland) (“ISAs (Ireland)”) and applicable law.
Our responsibilities under ISAs (Ireland) are further described in the Auditors’ responsibilities for the audit of the financial statements section of our report. We believe that the audit evidence we have obtained is sufficient and appropriate to provide a basis for our opinion.
Independence
We remained independent of the UCITS II ICAV in accordance with the ethical requirements that are relevant to our audit of the financial statements in Ireland, which includes IAASA’s Ethical Standard, and we have fulfilled our other ethical responsibilities in accordance with these requirements.
Conclusions relating to going concern
We have nothing to report in respect of the following matters in relation to which ISAs (Ireland) require us to report to you where:
the directors’ use of the going concern basis of accounting in the preparation of the financial statements is not appropriate; or
the directors have not disclosed in the financial statements any identified material uncertainties that may cast significant doubt about the Sub-Funds’ ability to continue to adopt the going concern basis of accounting for a period of at least twelve months from the date when the financial statements are authorised for issue.
However, because not all future events or conditions can be predicted, this statement is not a guarantee as to the Sub-Funds’ ability to continue as going concerns.

Reporting on other information
The other information comprises all of the information in the Annual Report and Audited Financial Statements other than the financial statements and our auditors' report thereon. The directors are responsible for the other information. Our opinion on the financial statements does not cover the other information and, accordingly, we do not express an audit opinion or, except to the extent otherwise explicitly stated in this report, any form of assurance thereon. In connection with our audit of the financial statements, our responsibility is to read the other information and, in doing so, consider whether the other information is materially inconsistent with the financial statements or our knowledge obtained in the audit, or otherwise appears to be materially misstated. If we identify an apparent material inconsistency or material misstatement, we are required to perform procedures to conclude whether there is a material misstatement of the financial statements or a material misstatement of the other information. If, based on the work we have performed, we conclude that there is a material misstatement of this other information, we are required to report that fact. We have nothing to report based on these responsibilities.
Based on the responsibilities described above and our work undertaken in the course of the audit, the Irish Collective Asset-management Vehicles Act 2015 requires us to also report the opinion as described below:
In our opinion, based on the work undertaken in the course of the audit, the information given in the Directors' Report for the period ended 31 December 2018 is consistent with the financial statements.
Responsibilities for the financial statements and the audit
Responsibilities of the directors for the financial statements
As explained more fully in the Statement of Directors' Responsibilities set out on page 55, the directors are responsible for the preparation of the financial statements in accordance with the applicable framework and for being satisfied that they give a true and fair view.
The directors are also responsible for such internal control as they determine is necessary to enable the preparation of financial statements that are free from material misstatement, whether due to fraud or error. In preparing the financial statements, the directors are responsible for assessing the Sub-Funds' ability to continue as going concerns, disclosing as applicable, matters related to going concern and using the going concern basis of accounting unless the directors either intend to liquidate the Sub-Fund or to cease operations, or have no realistic alternative but to do SO.
Auditors' responsibilities for the audit ofthefinancial statements
Our objectives are to obtain reasonable assurance about whether the financial statements as a whole are free from material misstatement, whether due to fraud or error, and to issue an auditors' report that includes our opinion. Reasonable assurance is a high level of assurance, but is not a guarantee that an audit conducted in accordance with ISAs (Ireland) will always detect a material misstatement when it exists. Misstatements can arise from fraud or error and are considered material if, individually or in the aggregate, they could reasonably be expected to influence the economic decisions of users taken on the basis of these financial statements.
A further description of our responsibilities for the audit of the financial statements is located on the IAASA website at:
of auditors responsibilities for audit.pdf.
This description forms part of our auditors' report.
Use of this report
This report, including the opinions, has been prepared for and only for the shareholders of each of the Sub-Funds as a body in accordance with section 120 of the Irish Collective Asset-management Vehicles Act 2015 and for no other purpose. We do not, in giving these opinions, accept or assume responsibility for any other purpose or to any other person to whom this report is shown or into whose hands it may come save where expressly agreed by our prior consent in writing.
Other required reporting
Irish Collective Asset-management Vehicles Act 2015 exception reporting
Directors' remuneration
Under the Irish Collective Asset-management Vehicles Act 2015 we are required to report to you if, in our opinion, the disclosures of directors' remuneration specified by section 117 of that Act have not been made. We have no exceptions to report arising from this responsibility.
PricewaterhouseCoopers Chartered Accountants and Statutory Audit Firm Dublin 29 April 2019

Fidelity UCITS II ICAV
DIRECTORY
62
Directors: Mr. David Dillon (Ireland) (Chairperson, resigned on 23 May 2018) Ms. Denise Kinsella (Ireland) (appointed on 4 January 2018, Chairperson from 20 August 2018) Mr. Paul Burd (UK) (resigned on 3 August 2018) Mr. David Greco (USA) (appointed on 4 January 2018) Mr. Nick King (UK) (appointed on 4 January 2018) Ms. Catherine Fitzsimons (Ireland) (appointed on 22 February 2018) Ms. Eímhín Ní Mhuircheartaigh (Ireland) (appointed on 26 February 2018) All current Directors are Non-Executive.
Investment Manager: FIL Investments International Oakhill House 130 Tonbridge Road Hildenborough Tonbridge Kent TN 11 9DZ United Kingdom
Administrator: Brown Brothers Harriman Fund Administration Services (Ireland) Limited 30 Herbert Street Dublin 2 DO2 W329 Ireland
Depositary: Brown Brothers Harriman Trustee Services (Ireland) Limited 30 Herbert Street Dublin 2 D02 W329 Ireland
Legal Advisors: Matheson 70 Sir John Rogerson’s Quay Dublin 2 D02 R296 Ireland
Independent Auditors: PricewaterhouseCoopers One Spencer Dock North Wall Quay Dublin 1 D01 X9R7 Ireland
Registered Office: George’s Quay House 43 Townsend Street Dublin 2 D02 VK65 Ireland
Distributor: FIL Distributors Pembroke Hall 42 Crow Lane Pembroke HM19 Bermuda
Manager and Secretary: FIL Fund Management (Ireland) Limited George’s Quay House 43 Townsend Street Dublin 2 D02 VK65 Ireland

Fidelity UCITS II ICAV
APPENDIX 1 – STATEMENT OF SIGNIFICANT CHANGES IN THE COMPOSITION OF PORTFOLIO (UNAUDITED)
63
In accordance with the UCITS Regulations, as amended, a statement of changes in the composition of the Schedule of Investments during the reporting period is provided to ensure that Shareholders can identify changes in the investments held by the Sub-Funds. The following statements present the aggregate purchases and sales of transferable securities exceeding one percent of the total value of purchases or sales, respectively, for the period. At a minimum, the largest twenty purchases and twenty sales are presented, if available.
Fidelity Europe ex-UK Equity Fund
Total Purchases for the year ended 31 December 2018
Security Description Nominal Cost EUR Fidelity CCF II Europe ex-UK Equity - Class G Acc EUR 7,756 72,351
Total Sales for the year ended 31 December 2018
Security Description Nominal Proceeds EUR Fidelity CCF II Europe ex-UK Equity - Class G Acc EUR 88 834
Fidelity Japan Equity Fund
Total Purchases for the year ended 31 December 2018
Security Description Nominal Cost EUR Fidelity CCF II Japan Equity - Class G Acc EUR 3,406 33,220
Total Sales for the year ended 31 December 2018
Security Description Nominal Proceeds EUR Fidelity CCF II Japan Equity - Class G Acc EUR 449 4,178
Fidelity North America Equity Fund
Total Purchases for the year ended 31 December 2018
Security Description Nominal Cost EUR Fidelity CCF II North America Equity - Class G Acc EUR 19,093 178,362
Total Sales for the year ended 31 December 2018
Security Description Nominal Proceeds EUR Fidelity CCF II North America Equity - Class G Acc EUR 883 8,088
Fidelity UK Equity Fund
Total Purchases for the year ended 31 December 2018
Security Description Nominal Cost EUR Fidelity CCF II UK Equity - Class G Acc EUR 4,795 44,349

Fidelity UCITS II ICAV
APPENDIX 1 – STATEMENT OF SIGNIFICANT CHANGES IN THE COMPOSITION OF PORTFOLIO (UNAUDITED) (CONTINUED)
64
Fidelity UK Equity Fund (continued)
Total Sales for the year ended 31 December 2018
Security Description Nominal Proceeds EUR Fidelity CCF II UK Equity - Class G Acc EUR 50 463
Fidelity Global Aggregate Bond Fund
Total Purchases for the year ended 31 December 2018
Security Description Nominal Cost EUR Fidelity CCF II Global Aggregate Bond - Class G Acc EUR 49,757 495,733
Total Sales for the year ended 31 December 2018
Security Description Nominal Proceeds EUR Fidelity CCF II Global Aggregate Bond - Class G Acc EUR 559 5,542
Fidelity Global Sub-IG Fixed Income Fund
Total Purchases for the year ended 31 December 2018
Security Description Nominal Cost EUR Fidelity CCF II Global Sub-IG Fixed Income - Class G Acc EUR 20,210 196,371
Total Sales for the year ended 31 December 2018
Security Description Nominal Proceeds EUR Fidelity CCF II Global Sub-IG Fixed Income - Class G Acc EUR 394 3,848
Fidelity Asia Pacific ex-Japan Equity Fund
Total Purchases for the year ended 31 December 2018
Security Description Nominal Cost EUR Fidelity CCF II Asia Pacific ex-Japan Equity - Class G Acc EUR 3,911 35,773
Total Sales for the year ended 31 December 2018
Security Description Nominal Proceeds EUR Fidelity CCF II Asia Pacific ex-Japan Equity - Class G Acc EUR 24 218
Fidelity Alternative Listed Equity Fund
Total Purchases for the year ended 31 December 2018
Security Description Nominal Cost EUR Fidelity CCF II Alternative Listed Equity - Class G Acc EUR 5,699 55,684

Fidelity UCITS II ICAV
APPENDIX 1 – STATEMENT OF SIGNIFICANT CHANGES IN THE COMPOSITION OF PORTFOLIO (UNAUDITED) (CONTINUED)
65
Fidelity Alternative Listed Equity Fund (continued)
Total Sales for the year ended 31 December 2018
Security Description Nominal Proceeds EUR Fidelity CCF II Alternative Listed Equity - Class G Acc EUR 132 1,284
Fidelity Global Emerging Markets Equity Fund
Total Purchases for the year ended 31 December 2018
Security Description Nominal Cost EUR Fidelity CCF II Global Emerging Markets Equity - Class G Acc EUR 1,185 11,587
Total Sales for the year ended 31 December 2018
Security Description Nominal Proceeds EUR Fidelity CCF II Global Emerging Markets Equity - Class G Acc EUR 5 43

Fidelity UCITS II ICAV
APPENDIX 2 – REPORT ON REMUNERATION (UNAUDITED)
66
The Fund is managed by FIL Fund Management (Ireland) Limited (‘FFM(I)L’), a wholly owned subsidiary of FIL Limited (‘FIL’). FFM(I)L will take reasonable steps to ensure that any decisions are consistent with the overall business strategy, objectives and the Global Remuneration Policy of the FIL Group (consisting of FIL and its subsidiaries) and try to manage any conflicts of interest which may arise. The FIL Group Remuneration Committee has established a Global Remuneration Policy to ensure the requirements of the UCITS Directive are met at a global level for all its UCITS management companies, including FFM(I)L. The Remuneration Committee reviews the remuneration policy at least annually to reflect the relevant local market practices and regulatory requirements applicable from time to time. The Directors of FFM(I)L review its general principles at least annually and oversee its implementation. The Global Remuneration Policy is consistent with and promotes sound and effective risk management and is designed not to encourage risk-taking which is inconsistent with the risk profile of FFM(I)L and the Fund. The Global Remuneration Policy is in line with the business strategy, objectives, values and interests of FFM(I)L and the Fund and includes measures to avoid conflicts of interest. There were no material changes to the Global Remuneration Policy to report during the financial period. The Global Remuneration Policy applies to all employees, with a focus on the staff whose professional activities have a material impact on the risk profile of the relevant management company or fund (the ‘Identified Staff’). The Identified Staff are individuals whose roles can materially affect the risk of the management company or any UCITS fund that it manages. These roles are identified in line with the requirements of the UCITS Directive and guidance issued by the European Securities and Markets Authority. Identified Staff supporting FFM(I)L, include the following individuals: a) Senior Management (Registered Directors); b) Risk Takers (Senior Management Team); and c) Staff Engaged in Control Functions (Risk, Compliance, Audit, HR and Finance). FFM(I)L does not employ staff directly so the total remuneration to be disclosed under this remuneration disclosure for the financial period is NIL. The fees received by independent Directors of FFM(I)L do not have any variable component. The aggregate total remuneration paid to the Identified Staff, considering all existing delegation arrangements and where information has been made available, is EUR 20.6 million. It should be noted that this remuneration information is that which was disclosed by the delegate, in its annual report for its financial period ended 30 June 2018 and is an aggregate figure disclosed by the Investment Manager for its relevant staff and is not specific to the Fund. For any additional on the Global Remuneration Policy, a summary is available at https://www.fil.com.

Fidelity UCITS II ICAV
APPENDIX 3 – SECURITIES FINANCING TRANSACTIONS (UNAUDITED)
67
The Securities Financing Transactions (“SFTs”) Regulation (the “Regulation”) came into force on 12 January 2016 and introduced additional disclosure requirements around securities lending, repurchase agreement/reverse repurchase agreements, total return swaps (TRSs) and other lending/borrowing transactions in annual and semi-annual financial statements, published after 13 January 2017. The Regulation came about due to what was perceived as ‘shadow banking’ risk in the securities financing markets and aims to reduce this risk by improving transparency in the securities financing markets in a number of ways: - By imposing conditions on the 'reuse' of collateral, so that clients and counterparties understand the risks involved and give their consent to the reuse, - By requiring managers to make detailed disclosures to their investors of the use they make of SFTs both in their periodic financial statements and pre-contractual documentation; and - By requiring counterparties to report SFTs to a trade repository so as to provide transparency to regulators on the use of SFTs by market participants. As the Sub-Funds did not hold any SFTs as at 31 December 2018, the report for the period from 14 November 2017 (date of registration) to 31 December 2018 and financial statements do not include any additional disclosures.


