Embed Size (px)
Citation preview

JOURNAL OF GEOPHYSICAL RESEARCH, VOL. 100, NO. D9, PAGES 18,687-18,706, SEPTEMBER 20, 1995
Field observations in continental stratiform clouds:
Partitioning of cloud particles between droplets and unactivated interstitial aerosols
N. V. Gillani • and S. E. Schwartz Brookhaven National Laboratory, Department of Applied Science, Environmental Chemistry Division, Upton, New York
W. R. Leaitch, J. W. Strapp, and G. A. Isaac Atmospheric Environment Service, Toronto, Ontario, Canada
Abstract. The partitioning of cloud particles between activated droplets and unactivated inter- stitial aerosols is a primary determinant of cloud microphysical, radiative, and chemical properties. In the present study, high-resolution aircraft measurements (1 s, •50 m) of the number concen- trations (Na,,w and Nca) of accumulation-mode particles (AMP, 0.17 to 2.07 !.tm diameter) and cloud droplets (CD, 2 to 35 gm diameter), made during 10 flights in and around continental strati- form clouds near Syracuse, New York, in autumn 1984 have been used to study the local and instantaneous nature of cloud particle partitioning throughout the sampled clouds. The partition- ing is defined as the activated fraction F (-- Ncd/Ntot) of all measured cloud particles (Nto t =- Nam p + Nca). F may be interpreted approximately as the AMP activation efficiency which is often assumed to be unity in all clouds. In the present study, F varied over its full possible range (0 to 1), being low especi•ly in cloud edges. Even in the near-adiabatic parts of cloud interior, its variation ranged from 0.1 to 1 over the 10 days. Statistically, its value in cloud interior exceeded 0.9 in 36% of the data but was below 0.6 in 28%. On 5 of the 10 days, stratocumulus clouds were embedde• in cool, dry, and relatively clean (Nto t < 600 cm-3) northerly air masses. In such cases, cloud droplet concentration increased approximately linearly with increasing total particle loading, and F in cloud interior was near unity and relatively insensitive to changes in the influencing variables. On the other days, especially in stratus clouds embedde• in warm and polluted southerly air masses, F was significantly less than unity, with particles in the smallest size ranges (0.17 to 0.37 grn) activating only fractionally depending on several factors. An important feature of the clouds sampled in this study was the existence of multiple cloud layers and complex vertical thermal structure on most days. Consequently, our analysis of the dependence of F on influencing cloud variables has been based on data grouped into individual cloud layers. Besides the size of the precursor aerosol, we found total particle loading (Ntot) and the local vertical cooling rate (~ temperature lapse rate in individual layers) to influence F the most. In particular, F decreased with increasing particle loading in excess of about 800 cm-3, and increasexl nearly linearly with temperature lapse rate. Evidently, the activation process can become self-limiting in stratiform clouds under polluted conditions, in which case increasing anthropogenic aerosol loading of the atmosphere translates less and less into cloud droplet population. This observation has important implications with respect to cloud radiative forcing, precipitation formation and acidification, and for long range transport of the unactivated aerosols.
1Now at Earth System Science Lab., NASA/UAH Global Hydrology and Climate Center, University of Alabama, Huntsville.
Copyright 1995 by the American Geophysical Union.
Paper number 95JD01170. 0148-0227/95/95JD-01170505.00
Introduction
Clouds play a major role in a number of important atmospheric processes including the water cycle, global energetics, pollutant redistribution and deposition, and atmospheric chemistry. Currently, there is a great deal of interest in the role of clouds in global climate change. At first,
18,687

18,688 GILLANI ET AL.: FIELD OBSERVATIONS 1N CONTINENTAL STRATIFORM CLOUDS
such interest was focused mainly on cloud feedback effects in response to increased cloudiness resulting from global warming caused by anthropogenic emissions of greenhouse gases such as CO 2 [e.g., Cess et al., 1990]. More recently, new concerns have been raised about changes in cloud radiative forcing by the incorporation in clouds of anthropogenic aerosols which modify cloud optical properties [Charlson et al., 1992]. Such aerosol-cloud interactions are believed to lead to global cooling of a magnitude comparable to that of the enhanced greenhouse warming due to anthropogenic emissions of CO 2 [Twomey et al., 1984; WigIcy, 1989; Kaufman et al., 1991; Charlson et al., 1992; Leaitch et al., 1992]. The cooling is most effective in optically thin clouds [Twomey, 1977a] such as the wide-spread midlatitude stratiform clouds.
The interaction of aerosols and clouds is accompanied by a variety of microphysical processes which cause changes in the concentration, size, and chemical composition of cloud droplets. These changes impact not only the shortwave radiative properties of clouds [Twomey, 1977a, b] but also cloud chemical composition [Junge, 1963; Daurn et al., 1987], the potential for precipitation formation [Squires, 1958a, b; Fitzgerald and Spyers-Duran, 1973; Albrecht, 1989], and the scavenging of atmospheric pollutants by precipitation [Slinn, 1974]. Of particular importance is the microphysical process known as aerosol "activation" or droplet "nucleation" in which new cloud droplets form by condensation on preexisting aerosol particles. Not all aerosols exposed to a cloud environment become activated. Those which do become cloud droplets make a far greater contribution to cloud optics and to precipitation formation and chemistry than those which remain unactivated. Consequently, the efficiency of the activation process and the associated partitioning of cloud particles between droplets and unactivated interstitial aerosols are quite important. Water- soluble particles such as sulfate aerosols are the most likely cloud condensation nuclei (CCN). For accumulation-mode particles, activation is, by far, the predominant process of incorporation of aerosols into cloud droplets and contributes the bulk of the solute mass in the droplets. For smaller particles, other processes such as Brownian coagulation may also lead to some aerosol scavenging, but of magnitude significant probably only in terms of change in the number concentration of Aitken nuclei. At high enough liquid water content (LWC _> 0.5 g some cloud droplets may collide and coalesce, thereby leading to a reduction in their number concentration. These various
microphysical cloud processes collectively shape the partitioning of cloud particles. This study is based on in situ field measurements in and around continental stratiform clouds in
northeastern United States, and examines the partitioning of cloud particles between unactivated accumulation-mode particles (.•VlP, -4).2 to 2 Ixm diameter) and cloud droplets (CD, -2 to 35 gun), including its dependence on the major influencing factors.
The process of aerosol activation into cloud droplets in a rising air parcel is well understood in principle based on the well-known K6hler theory [Mason, 1957; Junge and McLaren, 1971; Pruppacher and Klett, 1978; Hiinel, 1987]. It occurs when the air parcel is cooled to a temperature below its dewpoint, causing supersaturation (S = RH- 100, %)and comtensation on the aerosols. The activation of a given particle requires that the local supersaturation exceed a critical value (S c, which depends on particle dry size and composition) for a sufficiently long growth time. In an adiabatic updraft, S attains its maximum value near cloud base where activation is most
likely. Near cloud top and periphery, nonadiabatic conditions generally prevail as a result of entrainment and mixing of surrounding cooler and drier air and may cause S to decrease below S½ and some of the droplets to evaporate. Although the process of aerosol activation is relatively straightforward in principle, the details of the partitioning and of the spatial and spectral distributions of cloud particles in actual clouds are complex and not well understood.
Cloud models of varying degrees of microphysical complexity have been formulated. The most common numerical cloudmodels which are size-resolving and based on K6hler's theory (condensational growth only) are Lagrangian, adiabatic and one-dimensional [e.g., Jerksen and Charlson, 1984; Leaitch et al., 1986; Edwards and Penner, 1988]. Their applicability is limited to steadily ascending air near cloud base. A typical application of such models is to study the sensitivity of activation efficiency (maximum fractional activation) to the principal influencing variables (concentration/size/composition of the precursor aerosols, and dynamic and thermodynamic variables such as updraft speed and temperature). For example, Jensen and Chartson [1984] found mass activation efficiency of typical continental aerosols to be quite sensitive to precloud aerosol loading and to ulxlr• speed. Simple parameterizations of fractional activation have also been developed based on one- dimensional adiabatic Lagrangian models [e.g., Tworacy, 1959; Ghan et al., 1993] and generally highlight the significance of particle loading and updraft speed. The one-dimensional adiabatic approach is useful near cloud base and in updraft cores, but it breaks down near cloud edges and in the upper portions of clouds where entrainment and mixing effects are substantial, and in those parts of clouds where droplet growth processes other than condensation-evaporation (e.g., coalescence) are significant. Additional complexities are introduced by cloud layering, and by lifting and sinking motions [Baker and Latham, 1979; Pruppacher and Klett, 1978]. These complex effects result in three-dimensional spatial inhomogeneities and multimodal droplet size spectra which are uncharacteristic of the simple adiabatic model. The adiabatic assumption is likely to be particularly poor in stratiform clouds. More complex models incorporating varying degrees of sophistication of cloud dynamics and cloud microphysics have been developed [e.g., Chaumerliac et al., 1987; Flossman and Pruppacher, 1988; Molenkamp and Bradley, 1992], but their evaluation based on field measurements has been very limited. These models are considerably more advanced than the cloud modules of regional oxidant and acid deposition models (e.g., RADM [Chang et al., 1990]) which, in ram, are more advanced than the cloud modules of present global climate models. For the development of realistic cloud modules and microphysical parameterizations for use in regional and global models, there is a need to characterize the spatial variability and microstructure of actual clouds, and to examine the dependence of the microslructure on 'influencing variables. This paper attempts to partially address this need.
Previous quantitative field studies of aerosol-cloud interactions are quite sparse. The earliest ones established the importance of the CCN component of atmospheric aerosols in the formation of droplets [Squires, 1958a, b] and attempted to relate droplet and CCN number concentrations quantitat•ely [Twomey, 1959; Tworacy .'and Warner, 1967]. The aircraft measurements of Warner and Tworacy [1967] in clouds downwind of sugar cane fires, and of Fitzgerald and Spyers- Duran [1973] upwind and downwind of a major metropolitan

GILLANI ET AL.: FIELD OBSERVATIONS IN CONTINENTAL STRATIFORM CLOUDS 18,689
area, raised speculation concerning the impact of anthropogenic aerosols in reducing the potential for precipitation formation. In the years which followed, the principal interest in quantitative field studies of aerosol-cloud interactions shifted to the
scavenging of acidic aerosol mass by clouds. The focus of measurements in these studies (from aircraft or at fixed mountain sites) was on gross spatial averages (over tens of kilometers) of species mass concentrations (mostly of surfate and nitrate) based on batch samples collected in cloud water, and in cloud and clear air [Scott and Laulainen, 1979; Sievering et al., 1984; Daum et al., 1984; 1987; Hegg et al., 1984; Hegg and Hobbs, 1986; Leaitch et al., 1986; Pueschel et al., 1986]. In some studies, continuous measurements of aerosol size spectra were used to derive spatially-averaged aerosol volume concentrations [Leaitch et al., 1983; Hegg et al., 1984; Heintzenberg et al., 1989] based on which, aerosol volume scavenging efficiency was inferred. In one study, continuous measurements of light scattering coefficient were used as a surrogate for aerosol mass concentration [ten Brink et al., 1987]. In these studies, inferences of the efficiency of aerosol incorporation were generally based on comparisons of species mass or volume Concentrations (or their surrogates) in cloud water and/or cloud interstitial air with those in putative precloud air. Such inferences can be confounded by incorrect identification of precloud air, non-Lagrangian sampling, extended sampling periods and resultant averaging of spatial inhomogeneities, and inadequately resolved contributions of aqueous-phase chemistry. Not surprisingly, the results of the above studies varied quite widely. Most commonly, however, mass scavenging efficiency was found to be high (>0.8). Based on such findings, the mass scavenging efficiency for suffates in clouds is currently assumed to be unity in all applications of RADM, regardless of cloud type or other influencing conditions [Chang et al., 1990].
The above studies based on spatially-averaged particle mass concentrations could not address the issue of main concern with
respect to radiative transfer, namely, the partitioning of cloud particles in terms of their local number concentrations. Field studies focused on aerosol scavenging based on particle number concentrations are relatively scarce. In the study of Leaitch et al. [1986] for stratiform and cumuliform clouds, the authors took special care to ensure Lagrangian adiabatic interpretation by comparing the instantaneous cloud droplet number concentration at a single location within the adiabatic updraft core near cloud base with the below-cloud aerosol number concentration. They found that activation efficiencies so deemed were generally high when precloud AMP concentrations were less than about 750 cm '3, but dropped off non-linearly at higher particle loading. Raga and Jonas [1993] made a similar observation when comparing droplet concentrations near cloud top with the sub- cloud aerosol concentrations. Daum et al. [1987] presented vertical profries of CD and AMP number concentrations Lhrough a stratus cloud which demonstrated near-total activation of the
AMP in an updraft. Noone et al. [1992] were able to infer size- segregated volume and number scavenging efficiencies of aerosols (using a counterflow virtual impactor) in ground fog under conditions of very high particle loading and extremely low supersaturations. For such highly-polluted fog conditions, they found high activation efficiencies (>0.8) only for particles larger than 0.8 I.tm.
The present study is an investigation of the number concentrations of AMP and CD measured continuously during aircraft flights in nonprecipitating, liquid-water, continental
stratiform clouds in northeastern United States under conditions
characterized by a broad range of particle loading. The measurements have permitted determination of local and instantaneous partitioning of cloud particles into activated droplets and unactivated aerosols in all parts of the sampled clouds. We have studied the variation of fractional activation at
a high level of spatial resolution (-60 m), and also its dependence on properties of the precursor aerosol population and meteorological variables. A preliminary account of this study has been given previoosly [Gillani et al., 1992].
Measurements and Measurement Conditions
The measurements reported here were made near Syracuse, New York during Fall 1984 by the Canadian Institute for Aerospace Research Twin Otter aircraft, which was instrumented for cloud physics and chemistry measurements by the Atmospheric Environment Service of Canada and Brookhaven National Laboratory. The instrumentation and its calibration and measurement capabilities have been fully described previously by Isaac et al. [1983], Leaitch et al [1986], Isaac and Daum [1987], Leaitch and Isaac [1991], and Liu et al. [1992]. Only measurements used in this study are briefly described below.
Continuous measurements (1 s or 50- to 60-m average) were made of particle concentrations, cloud liquid water content (LWC), pressure, temperature, dew point, vertical gust speed, and a number of navigational variables. In addition, batch-mode air and cloudwater samples were also collected, typically over 4- to 30-min intervals, for subsequent chemical analyses. Particle concentrations were measured with particle measuring systems (PMS) probes (all mounted under the same wing of the aircraft) as follows: the active scattering aerosol spectrometer probe, PMS-ASASP-100X, for aerosol particles in 15 size classes ranging between 0.17 and 2.07 gm; the forward scattering spectrometer probe, PMS-FSSP-100, for cloud droplets in 15 size classes ranging between 2 and 35 I•m; PMS-2D -C and -P imaging probes, respectively, for cloud drops (25 to 800 gm) and precipitation drops (200 to 6400 gm). The ASASP is an intrusive sampling device in which the aerosol is sampled from a decelerated airstream at approximately 1 cm a s-l. The probe diffuser nozzle and the block in which the sampling tube is situated has heaters to reduce icing when flying in supercooled cloud. Tests have indicated that this probe effectively dries the aerosol when the heaters are on and often even when they are not [Strapp et al., 1992]. Since the heaters were operated during the flights of this study, the out-of-cloud size distributions presented here represent the dry aerosol. In stratiform clouds, with fairly long continuous exposures of the probe to cloud water, it is believed that the inside of the ASASP diffuser nozzle
may become wet as the heaters are unable to compensate for the continuous accumulation of cloud droplets. In such cases, it is expected that no cloud droplets will evaporate completely, but the interstitial cloud haze particles may still be dried. The FSSP is also a laser light scattering device, but the samplLng is nonintrusive. Corrections for probe dead time and coincidence errors were made as described by Baumgardner et al. [1985]. Here, we refer to the ASASP and FSSP number counts as
concentrations of AMP and CD (Nam• and Ncd), respectively. The particle data were collected at 64 Hz, but the results presented here are based on 1-s averages. LWC was measured
18,690 GILLANI ET AL.: FIELD OBSERVATIONS IN CONTINENTAL STRATIFORM CLOUDS
with a Johnson-Williams probe. A nose-boom vane system provided a measure of vertical gust speed, but not of the longwave mean updraft speed, w.
The Twin Otter flew 24 missions during the project (October 15 - November 15, 1984). Of these, 10 were selected for the present analysis based on two criteria: substantial cloud encounter and minimal, if any, precipitation. A total of more than 24 hours of data were logged on these 10 flights at I s resolution. Of these, about 11% were excluded because of
possible presence of precipitation (based on the 2D-P probe data). Of the remaining data, about 30% were in-cloud, and the remainder were in clear air. A typical flight started with an upward spiral through the sampled cloud and ended with a downward spiral through the cloud. Most of the interim flight consisted of horizontal traverses at one or more constant
altitudes, typically one below the cloud, one or more in the cloud, and sometimes also one above the cloud.
Flight times and summaries of the corresponding cloud and meteorological conditions are given in Table 1. All measurements were made in the daytime between 0900 and 1500 local time. Cloud temperatures were distinctly higher during the first five flights (mostly above 0øC) than during the last five flights (mostly below 0øC). Collectively, the sampled clouds extended from near ground level to a maximum of about 4 km, with thicknesses on individual days varying from less than 400 m to nearly 3 km. The heights, thicknesses and liquid water contents of the clouds sampled during the study were generally characteristic of continental stratiform clouds. The clouds
included in this study were all liquid water clouds. The clouds on 3 days during the warmer spell (October 18 and 26 and November 5) had formed in air masses of southerly origin. On these days, the cloud bases were low (below 400 m); the clouds were the warmest and thermally most stable; and, concentrations of ionic species in cloud water (normalized for liquid water content), as well as aerosol number concentration in the air just
below the clouds were the highest (Nam. t , > 1000 crn-3). On the remaining days, the air masses were of northerly origin, with much lower values of Na,nt, just below cloud base (100 to 550 cm-3), and the clouds were mostly above 1000 m, and relatively colder and more unstable.
Results And Discussion
An important feature of the clouds sampled in this study was the existence of multiple cloud layers and complex vertical thermal structure on most days. Figure 1 shows an example based on the data of an aircraft spiral on November 12. The vertical distribution of liquid water shows the cloud layering, and the temperature profile shows the presence of a sharp inversion around 1000 m, implying decoupling of the cloud layers above and below it. The vertical profile of the unactivated particles (Na,n,o) also shows a complex structure. Because of the complex vertical structure and decoupled cloud layering, it becomes necessary to consider fractional activation as a local variable rather than in relation to conditions below
cloud base.
The vertical structure of temperature and the vertical distribution of cloud LWC for each of the 10 flights are shown in Figure 2. For each day, all the 1-s data of LWC (during upward and downward spirals as well as during the horizontal traverses) are shown plotted as a scatterplot against flight altitude, but the temperature profile shown corresponds to a particular upward or downward spiral only. Altitude is in meters above mean sea level; local terrain elevation above sea level was typically between 150 and 200 m. The high density of LWC data points at discrete elevations corresponds to measurements during the constant-altitude traverses, and the corresponding range of values in each set represents the horizontal variability of LWC in the cloud. Typically, LWC was less than 0.5 g m '3, but occasionally increased to values as high as 1 g m '•. In most flights, the sampled clouds exhibited distinct layers in terms of liquid water distribution and thermal structure. Consequently, some of our analysis has been based on data grouped into individual cloud layers selected for their distinctness based on liquid water distribution as well as thermal structure. Figure 2 identifies 21 such cloud layers (numbered chronologically) for the 10 selected days. The process of delineation of these layers included examination of all temperature profiles (not just the ones shown). The definition of some layers may appear unreasonable based on just the information contained in the
Table 1. Overview of Meteorological and Cloud Conditions
Date Time Air Mass Below-Cloud
(LT) Origin* Namp, t Base? Top,* crn -3 m m
Oct. 18 1030-1300 SW 1400-1500 400 2000 Oct. 26 0930-1200 SSW 1050-1400 200 2000 Oct. 29 1100-1400 ' WNW 100-150 2400 2800 Oct. 31 1130-1400 WNW 500-550 1000 1400 Nov. 5 0900-1130 SW 1200 200 1600 Nov. 6 1130-1500 NW 250-300 1500 2400 Nov. 9 1000-1300 WNW 400-500 1200 3600 Nov. 10 0930-1130 NW <100 1800 4400 Nov. 12 1130-1430 NNE 500 250 3200 Nov. 13 1200-1530 NE 100-150 800 1800
* Based on 850 mbar 4-day back-trajectory arriving over Syracuse at 1800 UTC. * At highest elevation unaffected by cloud; range is generally over flight time. * Above mean sea level; local ground elevation is typically 150-200 m.
Cloud
Temperature• 'C Low High
8 11
5 10 3 6
-1 2
2 7 -14 -8
-8 5 -10 6 -13 0
-10 -5
Cloud Water
pH
3.2-3.4
3.6-4.0 3.8-4.4
3.7-4.1
3.7-4.4
3.9-4.2 4.1-4.5 4.2-4.7 3.4-4.2
4.5-5.5

GILLANI ET AL.: FIELD OBSERVATIONS IN CONTINENTAL STRATIFORM CLOUDS 18,691
ALT (m MSL) 3200
1600
,, 3200
... N.
%'"'..,.,.
%.,,. '..%
...
.,,
TEMP \
%
N. N.
%
...
%...
.,,
TEMP•
I I
0 0
-20
0
0.5 LWC (g.m-3 ) 1.0 0 250 (cm-3 ) -10 TEMP(ø C) 0 -20 -10 TEMP(ø C)
Figure 1. An illustration of the complex vertical structure of stratiform clouds. The plot shows the vertical profiles of temperature and (left) liquid water content (LWC) and (right) concentration of the unactivated interstitial accumulation-mode particles (Namt,) during an aircraft spiral on November 12, 1984. MSL, mean sea level.
500
0
figure, as for example, layer 3 (October 18) with the apparent presence of an inversion in the middle of it. Actually, that inversion had capped the top of the layer during the early part of the flight when the temperature profile shown was obtained; the LWC data above the inversion are from a later time when the
capping inversion and cloud-layer top had moved higher to about 2000 m (based on the temperature and LWC profiles at the later time). Thus the points in the upper part of layer 3 actually represent the same cloud layer a little later and a little higher. Quantitative information about some important variables, aggregated for each cloud layer, is presented in Table 2.
Operational Definition of Aerosol Activation Efficiency, F
The focus in this study is on the partitioning of cloud particles between those which are cloud droplets and those which remain as unactivated interstitial AMP (based on dry size). In order to quantify this partitioning we define the following two quantities based on the continuous data of Ncd and Na,,w:
Total particle concentration
Ntot-- Ncd + Namp ,
Activated fraction
Ncd + Na,n t, Ntot '
F is simply the activated (FSSP) fraction of Sto t (FSSP + ASASP). By definition, it can vary only between 0 and 1. This def'mition of F has several features which make it useful and
robust: F is based entirely on continuously measured local variables and describes the local and instantaneous degree of fractional activation of the AMP; evaluation of fractional activation based on this der'tuition does not require knowledge of conditions at or below cloud base, or at any other putative precloud location; the definition also applies equally well under adiabatic and nonadiabatic conditions.
The data in Figure 3 show two quite different situations with respect to particle partitioning and the meaning of F for two different days of measurement. The top panels (Figures 3a and 3b) show cloud LWC and the bottom panels (Figures 3c and 3d) show the corresponding values of Nam p and Nto t. In the dear air pockets (LWC = 0), Nca and F are zero, and Na,nt, equals Nto t . Within a cloud (LWC > 0), N amt, is less than Nto t . In the October 18 data, the unactivated AMP dominate the total particle count in the cloud (low F), whereas in the data of October 29, the cloud particles are predominantly in the form of activated droplets (high F). On october 18, Nto t was relatively constant horizontally in and out of the cloud; a characteristic feature of stratus clouds [Isaac et al., 1990] which have weak updrafts. By contrast, on October 29, Nto t was sharply higher inside the cloud (by a factor of 2 to 3) than outside, and was mostly due to N cd in the cloud (high F). Two possible explanations may account for the October 29 data: either Nanv below the cloud (= Ntot) was significantly greater than that in the clear air at cloud level, and most of this AMP became activated
when ingested into the cloud, or, Namt, was approximately the same in the clear air below cloud and at cloud level, and the excess Nto t in the cloud was due largely to activation of particles smaller than AMP in the updraft. A closer examination of the data of October 29 indicates that the second of the two
explanations is the more likely one. Na,nt , was about 100 to 200 cm -3 both below the cloud (Table 1) and in the clear air at cloud

18,692 GILLANI ET AL.: FIELD OBSERVATIONS IN CONTINENTAL STRATIFORM CLOUDS
ALT (m MSL) ALT ALT ALT ALT
4000 f • 4000[ • 4000[ •4• 4000 %•\ [I 18OCT•I • [ 1260•841• [1290c 131 OCT84 ISNOV841 .
,.,.:,'","7.:..'•'...,..,.: •. ::..,.. :::• '•:•:•;22• •,,;,,•,,• .......... ::::::::::::::::::::::::::::::::::::::::: ' ,I k I n d plip,ut d, I k • r C,,l."•" ,P•'"'d ,' '. • •lU lii grig n ", q ..... :" ; .... ' ..... qll•l pip • .... : ..... •, ..:. :,:...: ......... .. . . . 5 [ ....... . .... ß • wq. •.:. :,,:• •. ,....• ','•','•:':•'.';•':•':'"';"•;"':•'"" ' h'h'l":'•';'•' I ' '"' ::'"':'" '' ' "
................. ..... ,4 .,•, ...... '•;;N"'" .... . .... "' 1 ?,', r, ' ...... •:• ......
............ :•?•'? .'.•:;•.:.,,:,..4 ':•F..
-•o •mP o o c ••-'•o .... 6 .... •!•6 ' ' ' b .... id-•O ' ' '
4000 r 4000[ r 4000[ .... ..... . '?::::•?:•,;: ;.?'•:.::*:','i8. ......• (..,: .... :.. . .:':1;:,•.7 .,'. . . ,.. '"':;•".." '""' •"":' "' ' "' 16 .... '.: :. 9: ....... ::::' ....... ................ .......
•MP " , '. ',.:;•.,;:.... ...... . . ß ... ;•5'j.:..2.'•::
: ". .... : ';' ' ." :': ' '. .... . . ' .... ' '.•v ':;Tt '• ',:"" ß ....... 15 •,, •,ul •h,,, ;i,;,I,,• ...................... •.•..;;':':: ....... 20
....... . ........ •';::......:... :::;•.::?y.,•.:;.?.•.' ..:. •:. :.'.. •:• ..... .•:
..?': ,•,,';;:1:':,.:,: • • ;,,:•;,•,, ..... .: ..... 17 ,• ...... 200 ,,,,•,,• :'.. i' "'q' ": •l•[v,,," ,v,.. I ,' .............. ' ' '; ............ ' ...... •:•:',:."'""::•"•'•"'"""• [•e?',• '•',4 .... % t" .... • L:•,:,'
.......... •... '• ',:•'. XT 2] ß '%:.'.';., ..
..... [•5•,.,.,,,m•,,•i,.,•, ,.:.• ..:,:. ': ?.'" :.::a•:•, •"Y . ........ • • I • r i•:;•..:.::::.•:.:•:•...:•.:,,,• ß ll.:,:e:• •i4.,.:,•:•7:r
-20 •mP -•0 oc• -'•0 .... 6 .... •0"-•0 0 ..... •0-' ' ' ' ' '26 ' ' '-10 .... 6'-2• ' ' '-•0 .... 0 LWC 0.5 gm-3 1.0 0 0.5 1.0 0 0.5 1.0 0 0.5 1.0 0 0.5 1.0
Figure 2. An overview of the vertical structure of the stratiform clouds for the 10 selected flights of the Syracuse study. Each plot shows all 1-s data of liquid water content (LWC) and a selected vertical profile of temperature corresponding to a particular upward or downward-aircraft spiral. The shaded bars alongside the vertical axes delineate the vertical extents of the 21 cloud layers prevailing during the 10 flights; the layers are numbered from 1 to 21 in a day-by-day chronological order. MSL, mean sea level.
height (Figure 3d), and the values for N•ot of 300 to 600 cm-3 in the cloud (Figure 3d) had to result from activation of sub-AMP CCN. The updraft in the cloud had to have been strong enough to cause high enough supersaturation to make this possible. These scenarios show that values of F significantly less than unity indicate inadequate supersaturation to activate even most of the AMP, whereas high values of F (near unity) indicate high enough supersaturation to activate not only the AMP but also some smaller CCN. In the latter case, Ned and Ntot may include contributions from precloud sub-AMP particles. Such contributions are therefore included in the calculated value of F, as defined here.
Particle Concentration Data
Scatterplots of the vertical concentration profiles for clear-air AMP (upper panels) and cloud droplets (lower panels) are shown in Figure 4 for individual flights. The points represent all 1-s measurements (all spirals and traverses). In some cases, the upward and downward spirals were separated by two hours or longer, during which time the AMP profile changed considerably.' In such cases (e.g., October 29 and 31), the plots
show superposition of multiple profiles. Discrete horizontal lines of high-density points indicate heights at which traverses were made, and show the range of variable values over the traverse lengths. The clear-air profiles show the full vertical range of measurements, whereas the cloud profiles show only the vertical range of the cloud layers. Thus, for example, the data of October 31 clearly show that clouds existed only in a thin layer around 1200 m and at no other measurement locations over the vertical range of 4 kin. The AMP concentrations shown here are for clear air only. Within the vertical range of the cloud layers, they represent AMP concentrations in clear-air pockets and not in cloud interstitial air. Peak concentrations of clear-air
AMP occured mosfiy near ground level, and ranged from less than 200 cm -3 (November 13) to more than 2000 cm-3 (October 18). Above the ground, most commonly, there was either a gradual decreasing trend with height under the more polluted conditions (e.g., October 18 and 26 and November 9 and 10), or a well-mixed layer with rapid drop-off at the top to values approaching zero under relatively cleaner conditions' (e.g., October 31 and November 6). On some days, there were multiple layers of aerosols in the clear air (e.g., October 29 and November 12). Cloud droplet concentrations show no particular tendency of decreasing with height as did the clear-air AMP,

GILLANI ET AL.: FIELD OBSERVATIONS IN CONTINENTAL STRATIFORM CLOUDS 18,693
Table 2. Data for Cloud Interior by Layers
Cloud Data Altitude Range LWC Ntot F Layer Date Points (Mean),* Temperature, 'C Mean (s.d.), Mean (s.d.), Mean (s.d.)
m MSL Low High Mean g m '3 cm -3
1 Oct. 18 234 2 Oct. 18 856 3 Oct. 18 1283 4 Oct. 26 157 5 Oct. 26 1171 6 Oct. 26 1197 7 Oct. 26 74 8 Oct 29 717 9 Oct. 29 135 10 Oct. 31 2360 11 Nov. 5 995 12 Nov. 5 528 13 Nov. 6 1028
14 Nov. 9 2963
15 Nov. 9 (,) 16 Nov. 9 120 17 Nov. 10 1061
18 Nov. 10 (,) 19 Nov. 12 191 20 Nov. 12 424 21 Nov. 13 1135
454-710 (547) 9.5 10.6 9.9 0.33 (0.16) 1127 (59) 0.28 (.08) 721-1268 (1178) 8.9 11.1 10.0 0.35 (0.16) 1022 (163) 0.26 (.11)
1461-1954 (156!) 7.2 9.9 9.2 0.29 (0.13) 889 (115) 0.36 (.12) 295-818 (477) 8.8 9.9 9.1 0.27 (0.14) 830 (334) 0.19 (.11)
1197-1283 (1220) 7.9 11.3 9.8 0.16 (0.08) 384 (66) 0.60 (.21) 1438-1612 (1519) 6.7 10.2 9.0 0.35 (0.16) 317 (81) 0.69 (.17) 1662-1937 (1799) 5.7 9.5 6.6 0.20 (0.07) 166 (36) 0.76 (.16) 2413-2512 (2453) 2.5 5.7 5.2 0.29 (0.18) 353 (92) 0.87 (.12) 2632-2786 (2737) 3.3 5.1 3.8 0.13 (0.05) 287 (111) 0.89 (.11) 1134-1249 (1218) 0.0 2.2 1.2 0.28 (0.09) 798 (151) 0.74 (.14) 476-1112 (847) 5.9 9.0 7.3 0.16 (0.07) 673 (282) 0.57 (.19)
1186-1299 (1221) 5.0 7.4 5.3 0.25 (0.11) 603 (145) 0.70 (.20) 1620-2255 (1782) -13.9 -9.2 -10.3 0.25 (0.11) 579 (60) 0.89 (.09) 1222-2049 (1644) 1.4 4.5 3.7 0.15 (0.07) 356 (140) 0.96 (.05)
3030-3528 0210) -8.2 -4.6 -5.9 0.19 (0.09) 444 (128) 0.76 (.15) 2131-2568 (2420) 0.3 3.3 1.2 0.22 (0.11) 201 (66) 0.88 (.10)
319-953 (697) -3.6 -0.2 -1.9 0.21 (0.10) 437 (289) 0.67 (.20) 2192-3099 (2663) -12.3 -6.3 -9.6 0.27 (0.13) 320 (51) 0.74 (.12) a77-1412 (1082) -8.0 -6.3 -7.6 0.30 (0.08) 392 (64) 0.92 (.04)
All information in this table is based on cloud interior data only (i.e., excluding "edges"). Cloud layers are as identified graphi•y in Figure 2. LWC, liquid water content; s.d., standard deviation.
* The altitude ranges here are narrower than in Figure 2 because the latter included "edge" points also. MSL, mean sea level.
t Less than 10 interior points; statistics not calculated.
broadly implying relatively higher values of F in higher clouds (stratocumulus) than in lower clouds (stratus). In some cases, the clouds were low and exposed to high AMP concentrations, but themselves had substantially lower cloud droplet concentrations (e.g., October 18 and 26); in other cases, the clouds were high and exposed to much lower AMP concentrations, and had significantly higher cloud droplet concentrations (e.g., October 29, November 6 and 9). Maximum droplet concentrations were around 1200 cm-3 (November 5). Table 2 also contains averaged information about particle concentrations for individual cloud layers (layer-mean values of Nto t and the cloud droplet fraction, F). These data generally contim the observations made in this section.
Magnitude and Variation of F
Figure 5 shows three rather different examples of measurements of Ntot and F'at high spatial-temporal resolution (1-s data) during constant-altitude traverses through the clouds of three different days. The traverse of November 9 (Figure 5a) extended over more than 40 km in continuous stratocumuius.
N to t ranged between 300 and 500 cm -3, showing some correlation with LWC, particularly at low LWC, possibly implying the presence of updrafts (where Nto t peaks) and downdrafts (where Ntot dips). F was consistently near unity except where LWC was very low. The traverse of October 18 (nearly 100 lcm, Figure 5b) was through broken stratus. Ntot was high (~800 to 1000 cm -3) and relatively uniform in and out of the cloud. F was much lower than in the November 9 case, varying typically between 0.2 and 0.5 in cloud interior and dropping off markedly at cloud edges. At a later time on that day, the value
of F in cloud interior was as low as 0.1. The traverse of
November 5 (over 40 km, Figure 5c) was through very broken clouds with low LWC. Nto t gradually dropped off from more than 400 to less than 300 cm-3; F varied over nearly the full possible range (0 to 1) in correlation with the variation of LWC. These three examples show that, within a given cloud, F can vary from nearly zero at cloud edge to a maximum value inside, and that it can vary over about an order of magnitude (0.1 to 1.0) in cloud interior from day to day. Clearly, during the course of this study, the variations in F were large.
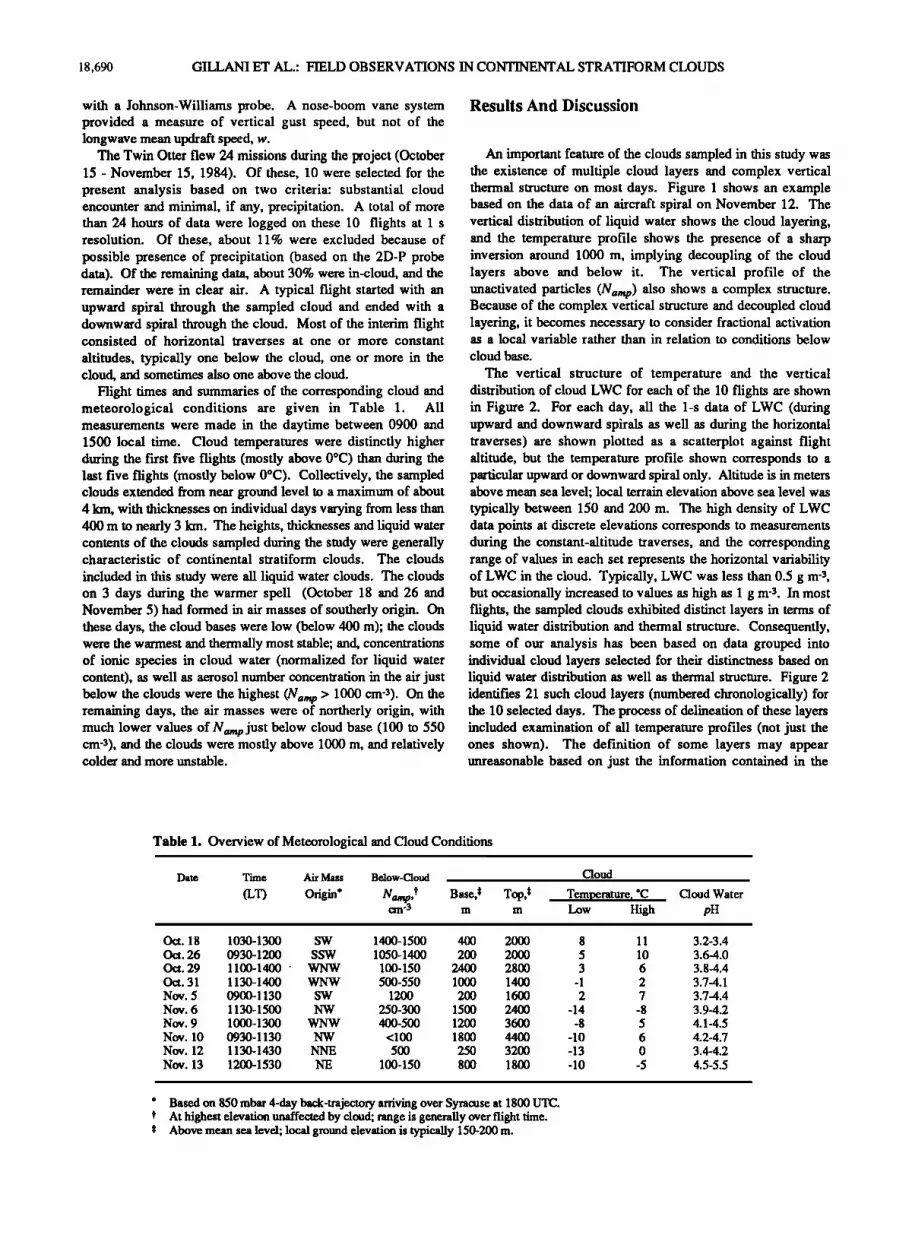
The above examples also show clearly that there is a strong edge effect which may be real (indicating entrainment at cloud edges) or an artifact of data averaging over ~60 m (unresolved inhomogeneities), or a combination of reality and artifact. In order to focus attention on the variations of F in cloud interior, we must first separate the data of cloud interior and cloud edges. To do this, we have defined cloud edge as all data points• corresponding to LWC < 0.03 g m -3 (about 9.6% of the cloud data) as well as all data points which are within 3 s (~180 m) of aircraft sampling from points with LWC < 0.03 g m -3. Clearly, this edge criterion is not perfect, as it takes no cognizance of the proximity of cloud edge in directions other than along the flight path. Edge points defined in this way constitute about 25% of the total in-cloud data. The remaining 75% are henceforth referred to as cloud-interior data. In most of the analyses which follow, attention is focused on cloud-interior data only. Figure 6 permits assessment of the significance of excluding the edge points (as defined) from the data analyses. It shows, for each subrange of F, the fraction of in-cloud data which are in the edges. About 2/3 of the cloud data with F < 0.15 fall in the edges even though.the edges account for only 25% of the total
.

18,694 GILLANI ET AL.: FIELD OBSERVATIONS IN CONTINENTAL STRATIFORM CLOUDS
LWC ( g m -3 ) LWC 1.0 (a) (b) 1.0
1500 rn MSL) ( -• 2500 rn MSL)
0.5 0.5
o , , '-'"-'""' '""-'"'"""'"" , led , ...... .... o 1050 1100 1220 1230 LOCAL TIME
N (cm -3 )
1000-
.. 7 ':?'5'-:: 2.. ::::: 500-
,
.
0 ,
I
i i i i i I i 1050
Ntot
i i i i i i i i i 1100
(d)
,
i" :.!:.." ß ...-..:.:.Nam. p : ::i' ..:.::.:::.:.:. ..... ...• .......... ............. ......... : !::-'.- :- •. .-. .,..y 'i' ,' , , , , i ,
' I ' ' ' ' ' ' ' I 1220 1230 LOCAL TIME
N
1000
5OO
Figure 3. Illustration of two different scenarios of cloud dynamics and particle actNation. The data of each day correspond to a horizontal traverse near cloud base (cloud layer 3 on October 18 and layer 8 on October 29). The upper panels (a and b) show cloud liquid water distribution, and the lower panels (c and d) show the corresponding concentrations of cloud particles (Nto t and Na,nt,). MSL, mean sea level. The traces have been plotted using a software package which plots the actual data points as well as interpolations, as needed, to space the plotting symbols uniformly to yield a more aesthetic product. These interpolations do not change the sense of the data or affect the interpretations given in the text.
in-cloud data. At the other extreme, only about 10% of the data with F > 0.9 reside in the edges. The exclusion of the edge points thus has the twin effects of upwardly biasing the average values of F for the clouds, and of diminishing, though not completely eliminating, the presence of nonadiabatic effects. Table 2 gives mean values of F in individual cloud layers based on cloud-interior data only. It shows such values of F to vary between 0.19 (layer 4) and 0.96 (layer 14).
Figure 7 shows frequency distributions of F as well as Ntot and LWC for sub•anges of those variables based on the data of all 10 days. It includes cloud-interior data only. F exce*xled 0.9 (high activation efficiency) for 36% of all interior data, but was less than 0.6 for 28% of the data. It is clear that the activation
process can be strongly inhibited under certain conditions in continental stratiform clouds, Figure 7 also shows that for about 2/3 of the cloud-interior data of this study, Nto t was under 600 cm'S; it exceeAed 900 cm's only 12% of the time. The most common values were between 300 and 450 cm-3. The most
cxmunon values of LWC were between 0.1 and 0.3 g m-S; values in excess of 0.5 g m-3 occurred less than 5% of the time.
Dependence of F on Influencing Factors
A number of factors have been implicated in previous studies to explain the variation of activation efficiency. Under the conditions of one-dimensional adiabatic models, these have
included principally the precloud aerosol properties (concentration, size and composition) and the updraft speed, w (considered as a surrogate for the cooling rate of the rising air parcel), and to a much lesser degree, cloud base temperature. In real clouds, nonadiabatic effects related to entrainment and mixing, and unsteady lifting and sinking motions can also be quite important. Collectively, these various factors determine excess cloud supersaturation (S-Sc) and the corresponding degree of particle activation. In what follows, we have investigated the dependence of F on the most important influencing factors based on data of the present study.
Dependence of F on clear-air aerosol composition and size. CCN composition (actually, the water-soluble fraction, g, of mass or volume) and size (dry diameter, Do) are important

GILLANI ET AL.: FIELD OBSERVATIONS IN CONTINENTAL STRATIFORM CLOUDS ! 8,695
ALT (m MSL) ALT ALT ALT ALT 4000 4000
2000
"" I •80CT841
400 4000
OCT 841 . 129 OCT 841 13• OCT 841
I ;:: .. :'. ' ' ' :,•.'•. . .'..½:...?', ;.:., , ' .
, :,.'..':,?.,..,. ,..,, ,.,
4000
400 4000
200 ..... : "'!"::-" .....
,' •...•-- :" .:.,.:; ,,:
0 1000 2000 1000
' '"":": :" q;:" l "•' '"• ,,:.,.....: ,,,; ..... • ,.. ....... ..,:..,...::... .,:. ; .• • ß % .....'•..:.
' :'" '( "';" 'I ....... .... ";.,.,,..,,,:...; .,.,, ,,:,•.;. •". ß .,: ';•':::.•. .. .. ß
:::?.,•)•½,,: . :,,.. • , ' .,,.,.,:,,.:,•:..,.......: .... ... ... .....;.,.;.... .. ,, , ..... | .... , :.'::'.":%•,:
1000 2000 1000 2000 1000 2000 1000
AMP Concentration in Clear Air, Nam p (cm -3) 4000 4000
Cloud Droplet
.;: 15 NOV 841
'•...
.?
....
. .-•/•.,•.,,..,..
..... ;.,:,",'?'"""
5o6o .... lO6O' ' '26od
4000
•0(•0 .... 10bO' ' ' •0(•0 .... 10•00 ' ' ' 2'00• .... 10•00 ' ' '260(J Concentration, Ncd (cm -3)
Figure 4. Vertical concentration profiles of clear-air AMP (upper), and of cloud droplets (lower) for individual flights of the Syracuse study. The clear-air data include measurements below and above clouds, as well as in cloud-level clear-air pockets. The data include measurements during spirals as well as during horizontal traverses. MSL, mean sea level.
because of the dependence of S c on them. This dependence was investigated by Junge and McLaren [1971] for representative continental and marine aerosols, based on numerical solutions of the equilibrium equation at the critical condition for activation. They concluded that activation is sensitive to CCN size, but relatively insensitive to composition of the mixed aerosols for 8 > 0.1. Fitzgerald [1973] confirmed these conclusions based on simultaneous measurements of CCN size and activation
spectra for samples of ambient air with 8 estimated to be in the range 0.15 to 0.35, and S in the range 0.35 to 0.75%. More recently, based on extensive year-long measurements of CCN activation spectra for continental aerosols, separated into narrow size bands witbin the accumulation mode, Alofs et al. [1989] derived a semi-empirical expression for S c according to which S c was approximately proportional to (œ D03)-m down to at least S = 0.014%. Figure 8 is a graphical representation of their relationship for particles in the accumulation mode. It confares the earlier observations that the sensitivity of S c to œ is relatively weak for œ > 0.1 (particularly for œ > 0.5). It shows a strong dependence of $c on D o for Do -< 0.5 Ixm and œ > 0.1.
We have attempted to estimate œ for our clear-air aerosol based on the speciated aerosol mass concentration estimates
derived from the chemical analysis of batch-mode filter pack samples collected in the aircraft. Eight such samples were collected entirely in clear air during the 10 flights' four were below cloud, two were at cloud height, and two were above cloud. Chemical analysis of these samples was done for SO42-, NO3', H+, NH4+ and gaseous SO2 and HNO3. Based on these data, a lower-bound estimate of the soluble mass concentration
of the aerosols was estimated as the sum (mz) of the mass concentrations of the four measured major ionic species. Information about the total aerosol mass concentration was not
available from the sample data. Instead, an upper bound of the
total AMP mass concentration (ma,ni0), averaged over the duration of each filter-pack sample, was estimated using an assumed value of 2 g cm-Z for aerosol mean density and the calculated average AMP volume concentration based on the ASASP data. The lowest value of the fraction mz/mamt, (considered to be a lower-bound estimate of œ,n) was 0.78. The
mass fractions of just sulfate in the aerosol (i.e., mso4/mansr) were also at least 0.3. It appears safe therefore to conclude that at least half of the mass of the clear-air aerosol in the present study was water soluble. This result is consistent with previous findings for continental aerosols. Alofs et al. [1989] showed that

18,696 GILLANI ET AL.: FIELD OBSERVATIONS IN CONTINENTAL STRATIFORM CLOUDS
4000 4000 4000
2000
4000
2000
16 NOV 841
1000 2000
AMP
4000 4000
i!••ii'•"' •',• 19 NOV 84 1 ' I10NOV841 !'..' .•
.'.•,•,• .,•:.l;. •..a•ffg....
"'9•'t'" ' / . .,•..• ........... ; i i i i I i i i i i
1000 2000 1000 2000
Concentration in Clear
4000
G i i i i I i i i i 0 1000 •00'0 1000
Cloud
4000
..•.,.::.i'•'? "' ' r•;.
112 NOV a41
..... -.: ,. . . i "a"l' i "-i' "1:' i i i i i 1000 2000
Ai r, Nam p (cm -3) 4000 4000
Droplet
i i i i i i i i
obo' 2606 ' ' ' 000 0d0
Concentration, Ncd (cm -3)
Figure 4. (continued)
NOV 841
1000
.
i i i
2OO0
the most likely value of œv for their continental aerosols was around 0.5. Their analysis assumed the soluble component of the aerosol to be (NHn)•SO n. A review by them of other studies of • at various continental sites revealed values scattered over the range 0.1 to 0.9 h, seven studies, and over the range 0.36 to 0.6 in four of these studies. This suggests that œv = 0.5 is a reasoimable average estimate for continental aerosols, and that (NHn)2SOn is a reasonable surrogate for the soluble component of these aerosols [see also Tworacy, 1980; Leaitch eta/., 1986]. It appears safe to conclude that, on average, the precloud aerosol in our study probably contained a high enough fraction of water soluble mass that S c was probably not particularly sensitive to œ (Figure 8). If so, then variations in œ were unlikely to be a significant cause of the observed large variations of F. For Ev = 0.5 in Figure 8, such continental haze aerosols (D O > 0.17 gm) may be expected to become activated at quite low supersaturations (S _< 0.1%). Evidently, in continental stratiform clouds, variations in the activation of water soluble AMP occur largely in the low-S regime (S _< 0.1%), where F is very sensitive to the factors controlling S.
Examination of clear-air AMP size spectra showed remarkably little variability, both spatially and temporally, over the course of the study. Figure 9a gives statistical information about the size distribution (noxmalized by total Nanv,) based on all clear-air data of the 10 flights (more than 55,000 1-s points). There was an overwhelming concentration of the AMP in the
sizes between 0.17 and 0.37 gm (~97%), and the volume- weighted mean AMP diameter (Dr) generally varied between 0.22 and 0.26 gm (the lower value being typical below clouds and the higher value above clouds). Figure 9b shows examples of specific AMP size spectra in the clear air below cloud base on three days when Na,,• ranged between 95 cm '3 (October. 29) and 1359 cm-3 (October. 18). These examples also show the similarity in the size distributions from day to day, the fact that most particles were in the size range between 0.17 and 0.37 gm on all three days, and that the mean particle diameter, remained conf'med to a narrow range between 0.21 and 0.24 gm. Based on the AMP size statistics (Figure 9a) and an assumed value of œ = 0.5, we were able to constract an expected activation spectnnn for the aerosol of the present study. It is shown in Figure 10. Corresponding to each cutoff size of the a•osol (marked alongside the plotted points), this spectrum consists of the corresponding critical supersaturation for activation (calculated as in Figure 8 and plotted as the abscissa of Figure 10) and the fraction of the AMP above the cutoff size (i.e., the fraction expected to become activated, or F, plotted as the ordinate). Figure 10 shows that complete activation (F = 1) of the AMP is expected for S _> 0.11%. At higher $, the dependence of F on AMP size distribution is expected to be negligible. At lower S, on the other hand, F is expected to depend strongly on S which, in turn, is very sensitive to the precloud aerosol size spectrum (particularly in the size range

GILLANI ET AL.: FIELD OBSERVATIONS IN CONTINENTAL STRATIFORM CLOUDS 18,697
F, LWC (g/m 3) (a) 19 NOV 84] (Altitude ~ 1650 rn MSL) "(" 1.0 ......... "-'"•-:"-- :'"'""' '"'"":::" ....... :':'?';'!":""""" .... ""'":"::'" .... '"'"':'"'"? ..... "' ..... '":'":' ..... '"'"' ..... '" ....
:.-
.
..
:
/, 0 !:• - •.,
-" ,-,,' • •' ', ; :'q ,,,., ,9,4 ',: • .,.•,.-,t' "..
0• ......... 1230 12•0
Ntot - 1000
.)
- 5OO
LWC , 1.0- I ' •'
I 0.5- ..
ß
•.-....
.
0 , , 1050
F, LWC
1.0
0.5
0
• (b) 118 OCT 84 I (Alt ~ 1500 m)
I,.••f,..1• _•, t! Ntøt tot ' f - 1000
i i: . :'- F 500
i i i i i i i i i I 0 1100 1110
(c) 15 NOV 841 (Alt ~ 900 m) .
ß . :!i• i::: :ii::i• :: .. ::•::. !:• • •i.: !. i ::3 '-) • :::'5 "-::&;.:-.': ::.. :. : :-'.':-; ::":.- 9-'..:': -: : --"I •::: •!'.:' :i9':i-.:;.:'-.:::-: !:'E•::, :::: :/!:::;! .•::::'-:::i i.:!:: ::•.i :': ;:. -':• :'" -1[ ß . '.. :.. ' .... : 2 ..... •; •. : :' ; :' '-" '- :?• ' ...... ' '"-': '• ': ] I
::.: ,!:-{: ---::;.-':.::-'.:z•-:-:.,.-'!:-.x. "S':': ::-•: .':i:! ' '" .. ,,•...:,;,,. .... ,:•.:;.......•: .... ::....:.•. ,:..:.. ...... : ß .: , :!?• ::'.': ,!l I: ?.-!!• ii ;-'[t'• •' •.•[*-• y•,•,,[.• • .,, ,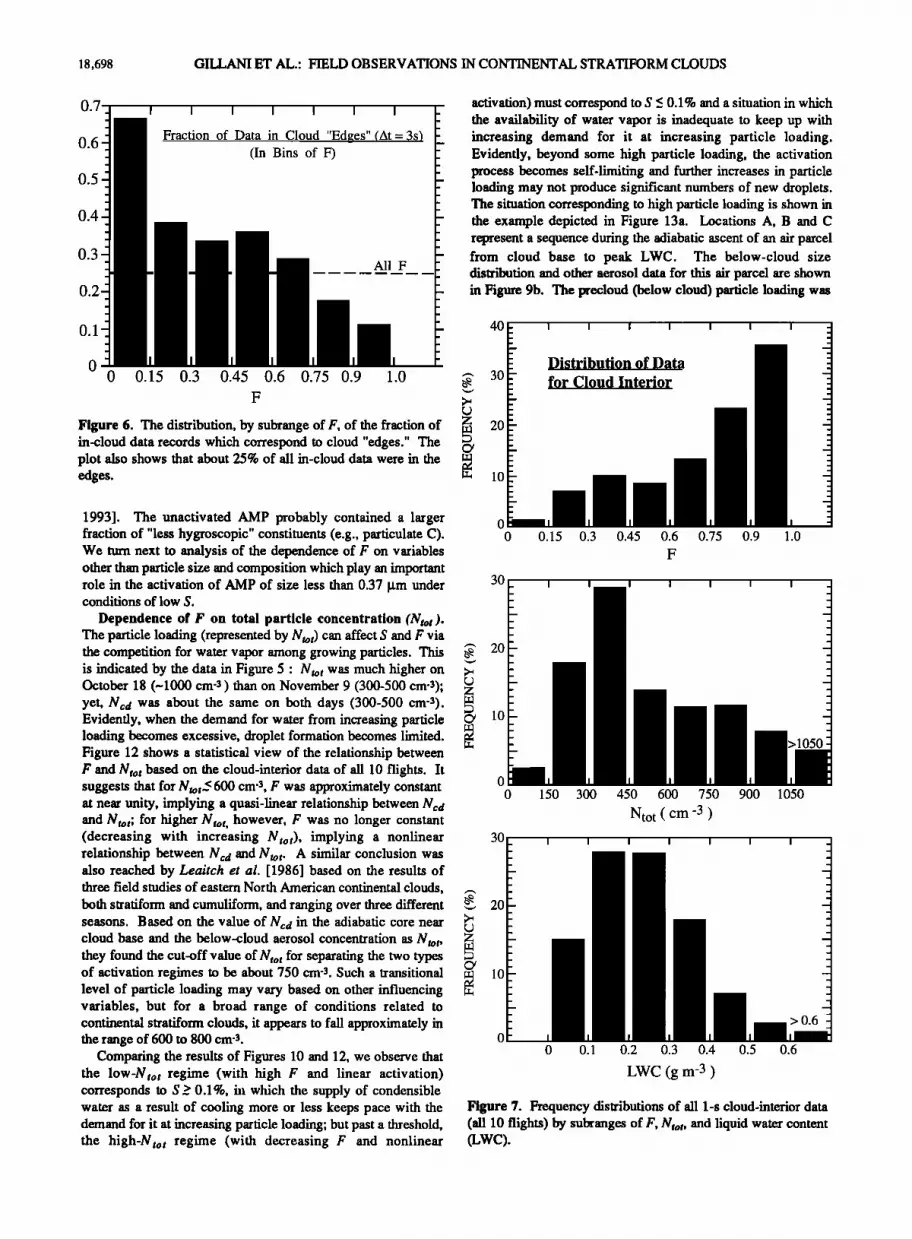
18,698 GILLANI ET AL.: FIELD OBSERVATIONS IN CONTINENTAL STRATIFORM CLOUDS
0.6
0.5
0.4
0.3
0.2
0.1
I I I I I I
Fraction of Data in Cloud "Edges" (At = 3s) (In Bins of F)
All F
activation) must correspond to S _< 0.1% and a situation in which the availability of water vapor is inadequate to keep up with increasing demand for it at increasing particle loading. Evidently, beyond some high particle loading, the activation process becomes self-limiting and further increases in particle loading may not produce significant numbers of new droplets. The situation corresponding to high particle loading is shown in the example depicted in Figure 13a. Locations A, B and C represent a sequence during the adiabatic ascent of an air parcel from cloud base to peak LWC. The below-cloud size distribution and other aerosol data for this air parcel are shown in Figure 9b. The precloud (below cloud) particle loading was
40
0 0.15 0.3 0.45 0.6 0.75 0.9 1.0 •, 30 F
Figure 6. The distribution, by subrange of F, of the fraction of m z 20 in-cloud data records which correspond to cloud "edges." The plot also shows that about 25% of all in-cloud data were in the edges. [a 10
1993]. The unactivated AMP probably contained a larger fraction of "less hygroscopic" constituents (e.g., particulate C). We turn next to analysis of the dependence of F on variables other than particle size and composition which play an important role in the activation of AMP of size less than 0.37 gm under conditions of low S.
Dependence of F on total particle concentration (Nto t ). The particle loading (represented by Ntot) can affect S and F via the competition for water vapor among growing particles. This is indicated by the data in Figure 5 ß Nto t was much higher on October 18 (-1000 cm-3 ) than on November 9 (300-500 cm4); yet, Ncd was about the same on both days (300-500 cm-3). Evidently, when the demand for water from increasing particle loading becomes excessive, droplet formation becomes limited. Figure 12 shows a statistical view of the relationship between F and Nto t based on the cloud-interior data of all 10 flights. It suggests that for Ntot •< 600 cm -z, F was approximately constant at near unity, implying a quasi-linear relationship between Ncd and Ntot; for higher Ntot, however, F was no longer constant (decreasing with increasing N tot) , implying a nonlinear relationship between Ncd and Ntot. A similar conclusion was also reached by Leaitch et al. [1986] based on the results of three field studies of eastern North American continental clouds, both stratiform and cumuliform, and ranging over three different seasons. Based on the value of Nca in the adiabatic core near cloud base and the below-cloud aerosol concentration as Ntot, they found the cut-off value of Nto t for separating the two types of activation regimes to be about 750 cm4. Such a transitional level of particle loading may vary based on other influencing variables, but for a broad range of conditions related to cominental stratiform clouds, it appears to fall approximately in the range of 600 to 800 cm-Z.
Comparing the results of Figures 10 and 12, we observe that the low-Sto t regime (with high F and linear activation) corresponds to S ? 0.1%, hi which the supply of condensible water as a result of cooling more or less keeps pace with the demand for it at increasing particle loading; but past a threshold, the high-N to t regime (with decreasing F and nonlinear
0 0
30
I I I I I I I
Distribution of Data
for Cloud Interior
0.15 0.3 0.45 0.6 0.75 0.9 1.0
F
I i I I I
•. 20
z
cy 10
0 0
30_
20
0
150 300 450 600 750 900 1050
Nto t ( cm-3 ) I I I I I I I
0 0.1 0.2 0.3 0.4 0.5 0.6
LWC (g m-3 )
Figure 7. Frequency distributions of all 1-s cloud-interior data (all 10 flights) by subranges of F, Nto t, and liquid water content (LWC).

GILLANI ET AL.: FIELD OBSERVATIONS IN CONTINENTAL STRATIFORM CLOUDS 18,699
0.25
0.20
ß - 0.15
• O.lO
'• 0.05
0.5
I O•
!
! ! ! ! ! ! !
\ O. 01•--- œ (Soluble Volume Fraction) \ v
% %
%
0.00 , . , ß , ß , . , ß , . , ß , ß , . , 0.1 0.2 0.3 0.4 0.5 0.6 0.7 0.8 0.9 1.0
Aerosol Dry Diameter, D 0 ( g m )
Figure 8. Graphical representation of the empirical dependence of particle critical supersaturation (Sc) on particle dry diameter (Do) and water soluble volume fraction (ev) for accumulation-mode particles, based on the formula of Alofs et al. [1989].
(a) lO -
1 dN
Namp dD
( gm -1)
8 -
6 -
4 -
2 -
0 - l I
I CLEAR-AIR AEROSOLS I
All Ten Days
Size Range (gm) % of Namp 0.17 - 0.20 26.80
0.20 - 0.26 42.64
0.26 - 0.32 18.15
0.32 - 0.37 9.70
0.37 - 0.70 2.07
0.70- 1.02 0.25
1.02 - 2.07 0.39
I I I I 0 0.5 1.0 1.5 2.0
D (gm)
(b)
dN
(cm -3 gm -1)
x 103 10-
8--
6 I
4-
2-
0-
A A B C
18 Oct 29 Oct 9 Nov ALT (m MSL) : 385 2151 1095
Namp (cm -3) ' 1359 95 403 Dv (gm) : 0.234 0.242 0.210
L__ i
i
i
i
.......... --'L_
............. __
I I I -I- I 0 0.2 0.4 0.6 0.8 1.0
D (gm)
Figure 9. Size distributions of clear-air AMP (dry): (a) Normalized (by Na,w,) size distribution (plot) and the frequency distribution by size (inset tabulation) corresponding to the clear-air data of all 10 days; (b) AMP (dry) size distributions below cloud base for three specific days covering a broad range of particle loading conditions. MSL, mean sea level.

18,700 GILLAN] ET AL.: FIELD OBSERVATIONS IN CONTINENTAL STRATIFORM CLOUDS
1.0
0.8
F
0.4
0.2
0.0
(Do = 0.26 gm) //o(0.32)
12) (1) 0.7) (0.37) ......
high (Ntot = 1359 cm-3), and most of the particles were smaller than 0.37 gin. From A to B there was a rapid increase in cloud droplet concentration (Nca) from about 20 cm-3 to about 230 cm -z. Thereafter, however, additional droplet activation was markedly slower (to about 300 cm-Z at C). Evidently, in the presence of the high particle loading, the supersaturation was limited above B, not being adequate to activate the many remaining smaller AMP, but sufficient to permit growth of the droplets already formed, from Dv = 8.96 gm to 13.3 gin. Figure 13b shows the droplet size distributions at A, B, and C. The speclxa at A and B show the unimodal dislxibution characteristic of adiabatic condensational growth; the size spectrum at C is beginning to show transition to a bimodal distribution including the presence of a significant number of large droplets (D > 25
0.02 0.04 0.06 0.08 0.10 0.12 I.tm). The condition at C suggests the likelihood of some droplet
Critical Supersaturation, Sc (%)
Figure 10. Activation spectrum for the clear-air accumulation- mode particles (AMP) of the Syracuse study. Critical super- saturation is based on the expression for S c (œv, Do) of Alofs et al. [1989], with œv = 0.5. In each datum, the value of S c corresponds to Do = diameter shown next to the data point in the plot; F is the expected activated number fraction of the clear-air AMP (based on the statistical size distribution shown in Figure 9a) for sizes cumulatively greater than D 0.
growth by the process of coalescence at high LWC (0.70 g m-a). The size distribution of the unactivated particles at C is depicted in Figure 11 (dis•xibution A) and shows that most of the unactivated particles were smaller than 0.37 Ix_rn.
Figure 14 shows the dependence of F on N tot for the aggregated cloud-interior data of individual cloud layers. Table 2 provides additional information for each of the layers: it gives the number of 1-s data points (interior only) in each layer, the range and mean values of altitude and temperature in the layer, and the mean and standard deviation values for LWC, Nto•, and F. After excluding the edge data, two of the layers (15 and 18)
dN
(cm -3 gm- 1)
x 103
8-
1
4 1
2 i
0 I
CLOUD INTERSTITIAL
AEROSOLS
I I I I
0.5 1.0 1.5 2.0
D (gm)
dN
(cm -3 gm- 1)
250-
200-
150-
100-
50-
0 I
A B C
18 Oct 29 Oct 9 Nov
ALT (m MSL) : 609 2445 1711
Namp (cm -3) : 782 85 11
Dv (gm) : 0.29 0.63 1.08
LWC (g m -3) : 0.70 0.82 0.25 F : 0.29 0.80 0.98
ß . , I I I
0.5 1.0 1.5 2.0
D (gm)
Figure 11. Size distributions of (dried) cloud interstitial AMP at peak liquid water content (LWC) in cloud layers 1 (October 18), 8 (October 29) and 14 (Novem• 9). MSL, mean sea level.

GILLANI ET AL.: FIELD OBSERVATIONS IN CONTINENTAL $TRATIFORM CLOUDS 18,701
1.0
0.8
0.6
0.4'
0.2
0 150 300 450 600 750 900
Nto t ( cm-3 )
> 1050
I
1050
Figure 12. The statistical variation of F with Ntot based on all 1- s cloud-interior data of the 10 flights, segregated into subranges of Nto t. For each subrange of Ntot, the datum shows values of F corresponding to the 5th, 25th, 50th, 75th and 95th percentiles.
were left with less than 10 interior data points each Consequently, those two layers are not included in Figure 14. The median data of the layers in Figure 14 show a general trend of decrease in F with increase in Nto t. This decrease, once again, is largest when Ntot exceeds about 600 cm -3. Particularly conspicuous are the data for layers 1, 2, 3 (October 18) and 4 (the lowest layer of October 26). They have the lowest mean values of F (0.19 to 0.36, Table 2) and the highest mean values of Nto t (_> 800 cm-3). They are also the warmest cloud layers (~100C), and all correspond to southerly air masses. At the other extreme are the data of layers 8, 9, 13, 14, 17, and 21. They have the highest mean values of F (0.87 to 0.96) and relatively low mean values of Ntot (< 600 cm '3) and temperature (-10.3 to 5.2'C), and they all correspond to clouds formed in northerly air masses. Layers 4, 5, 6, and 7 of October 26 are separated vertically by more than 1300 m, and cover the largest daily range of layer-mean values of F (0.19 to 0.76) as well as of Ntot (830 to 166 cm-S). By contrast, layers 1, 2, 3 of October 18 are also separated widely in the vertical (by more than 1000 m), but the corresponding ranges of mean values of F (0.26 to 0.36) and of Ntot (1127 to 889 cm-S) are relatively much smaller. It is clear from this plot that factors other than Nto t must also play an important role in shaping the partitioning of cloud particles, because there is a considerable spread in the values of F corresponding to narrow bands of Ntot. Thus, for example, the two layers in each of the pairs (4,10), (11,13) and (6,14) have like values of Nto t, yet quite different values of F.
Superimposed on the data of Figure 14 are three curves based on one-dimensional adiabatic model calculations. The curves
correspond to different constant values of updraft speed ranging between 5 and 50 cm s -1, and envelope most of the data. The adiabatic model used to •lerive these curves has been described
by Leaitch et al. [1986]. In our model calculations, a bimodal size distribution was used for the precloud aerosol: the Aitken mode (0.01 to 0.1 ]xm radii) and the accumulation mode (0.1 to 1.0 gm radii), each mode being distributed according to gamma functions into 18 size classes. The total particle concentration was assumed to be distributed between the two modes in the
ratio 5:1, respectively. The choice of such spectra was based on measurements of continental aerosols. The soluble mass in both
modes was assumed to be (NH4)2SO4, which accounted for 100% of the total mass in the Aitken mode and 50% in the
accumulation mode. At initialization below cloud base, pressure, temperature and relative humidity were taken as 850 mb, 5øC and 95%, respectively. Sensitivity analyses have shown results to be rather insensitive to temperatures in the range 0 to 20øC. In the model results, F is based on the value of Ncd at a location near cloud base but sufficiently high to be past the location of peak supersaturation, and of Na,nv at initialization just below cloud base. Figure 14 demonstrates that the observed variation of F can be explained well by a combination of variations in Ntot and w (representing the cooling rate in adiabatic ascent). Evidently, these two variables have controlling influence on $ (in the low-$ regime).
Our empirical results pertaining to the relationship between F and Nto t are true at the statistical level (Figure 12) and at the spatial resolution of individual cloud layers (Figure 14). In general, they may not hold for data within a given layer. For a vertically thin layer, Nto t may be more or less constant within the layer; yet, due to other influencing factors, particularly nonadiabatic effects, significant variations in F can and do occur. Even for thicker layers, variations in w, nonadiabatic effects and other factors can combine to obscure or negate the effect of particle loading within a layer.
We have also examined the variation of F with respect to cloud-water sulfate, nitrate, and pH based on chemical analyses of individual batch-mode cloud-water samples. The variation of F with cloudwater sulfate and nitrate is similar to that of F
versus Ntot, implying a close relationship between Ntot and the concentrations of these ions in cloud droplets. Such positive correlation between cloud particle loading and cloud-water concentrations of sulfate and nitrate is consistent with findings of Leaitch et al. [1992] for continental clouds in northeastern North America. The drop-off in F occurs above a combined sulfate + nitrate air-equivalent concentration of about 2 ppb. The variation of F with cloudwater pH shows high F at high pH, and a drop-off in F occuring for pH less than about 4. Thus, the self-limiting behavior of aerosol activation under polluted conditions affects particle partitioning and cloud radiative properties as well as cloud chemical properties.
Dependence of F on temperature lapse rate (-dT/dz). Vertical cooling rate (-w dT/dz) is an important determinant of S. During adiabatic ascent in cumuliform clouds, the lapse rate is often constant and cooling rate is then proportional to w, which is commonly used as a measure of the cooling rate. In the present study, measurements of mean updraft speed were not available, and we have investigated the variation of F with respect to -dT/dz. Figure 15 shows the variation of the median value of F for the cloud-interior data in each layer with the mean temperature lapse rate in the layer. In general, there appears to be a positive quasi-linear relationship between the two variables. A closer examination of the data shows a slight departure from this apparent general behavior. The data of layers 8, 9, 13, 14, 17, and 21 of the five high-F days (October 29, November 6, 9, 10, 13 in northerly air masses) show that, under conditions when supersaturation is high, F is relatively insensitive to variations in the lapse rate (near its high end), just as it was to total particle loading (near its low end). This figure also serves to explain the spread in F values at constant Nto t which •was observed in Figure 14 (there it was explained in terms of w). For example, the increasing spread between the members of the layer pairs

18,702 GILLANI ET AL.: FIELD OBSERVATIONS IN CONTINENTAL STRATIFORM CLOUDS
(a) 1300 -
.
ALT
(m MSL) '
800-
300 , o
o
o
5
. _ _) Temperature ' •.', :.•.• •'. ......... ----
"" "'", -'
i ! i •.5 , x_ , , 500 10
10
18 Oct 1984
I',0 LWC (gin '3) 1000 Ncd ( cm '3 ) 20 Dv (!gin) 15 Tcmp (øC)
(b) 5O
(cm -3 I•n' I)
CLOUD DROPLETS
ß ' c LWC: 0.02 0.23 "0.70 (gm -3) Ntot : 1304 1139 1095 ( cm -3 )
F ß 0.016 0,199 0.286
Dv ß 2.84 8,96 13.3 (I. tm)
'1
!0 35
D (l•m)
Figure 13. (a) The vertical profiles of liquid water content (LWC), Ncd, Dv and temperature in the sampled cloud of October 18. (-1030 LT); A, B, C denote locations along the adiabatic ascent near cloud base. (b) Cloud droplet size distributions at locations A, B, C. MS L, mean sea level.
(6, 14), (11, 13) and (4, 10) in Figure 14 is quite consistent with the corresponding increasing spread of these data in Figure 15. The lapse rate here appears to play the same role as attributed to the updraft speed in Figure 14. The physical significance of this observation is not clear other than that the lapse rate is related to the convective activity in the layer which may be correlated with activation efficiency. The effects on F of increasing particle loading and increasing lapse rate are clearly counteractive.
Dependence of F on liquid water content. Figure 16 illustrates the behavior of F with respect to LWC (here, for a high-F day, October 29, 1984, when the maximum LWC was as high as 0.8 g m-3). For LWC in the range of about 0.1 to 0.5 g m -a, F was generally insensitive to LWC. This is the expected behavior based on adiabatic theory. For LWC close to the lower limit for cloud-interior points (0.03 g m-a), F was significantly lower than its maximum value at LWC > 0.1 g m -3. This may be explained as the behavior in cloud peripheries where S is lower than in the interior, partly due to nonadiabatic effects (near cloud top and sides). In Figure 5c (November 5), the apparent high sensitivity of F to LWC is also probably a result of dominant edge effects. For LWC >_ 0.5 g m -3 (typically in cloud core), there was generally a small decrease in F with increasing LWC. This was probably a result of coalescence of droplets which would result in a decrease in both Ned and F. Figure 17 shows
more direct evidence of coalescence. It is based on the data of a
horizontal traverse at approximately 1200 m through the densest portion of cloud layer 2 of October 18. Corresponding to the time of this measurement, the data of the 2-D particle probes showed evidence of the process of warm rain formation. Figure 17a shows that where LWC exceeded about 0.5 g m -3, there was considerable suppression of the droplet population (Ncd) with an accompanying considerable increase in volume-mean droplet diameter (Dcd) from about 10-12 I•m to about 18 gin. Figure 17b shows the multi-modal droplet size distribution at the location of the peak LWC and significant presence of large drops (> 35 I•m diameter). Thus our data indicate that F is not particularly sensitive to LWC in a direct sense, although at very low and very high values of LWC it is suppressed as a result of edge effects, coalescence and possibly other causes.
Summary and Conclusion
We have carried out a quantitative investigation of the partitioning of cloud particles between activated droplets (2 to 35 I•m) and unactivated accumulation-mode interstitial aerosols (0.17 to 2.07 Ixm) based on high-resolution data of the ASASP and the FSSP in real clouds. The partitioning is def'med as tile activated fraction (F-• N cd/Ntot) of the total particle concentration (Ntot). F is a local and instantaneous descriptor of particle partitioning. The investigation is based on data collected near Syracuse, New York, during 10 aircraft flights in liquid-water continental stratiform clouds embedded in air masses characterized by a broad range of anthropogenic influence. We have presented results of the magnitude and variation of F in these clouds and have carried out a systematic investigation of the dependence of F on several variables implicated previously as being important, and about which ou• measurements included reasonable information. These
influencing variables include the composition and size of the precursor aerosols, the total particle loading, vertical cooling rate in the cloud, and cloud liquid-water content.
In recognition of the predominance of transient and nonadiabatic effects in cloud edges, we have excluded from most of our analyses the d•.ta of cloud edges defined as points with LWC less than 0.03 g m-3, as well as all points within 3 s (~180 m) of sampling from such low LWC points. Such "edge" points comprised about 25% of all the 1-s data records. The focus of data analysis was on the remaining 75% data in cloud-interior.
Most of the clouds studied were found to have complex layered vertical structure in terms of liquid-water distribution and profiles of temperature and particle partitioning. Consequently, our analysis of the dependence of F on influencing cloud variables has been based on data grouped into individual cloud layers. A total of 21 such distinct cloud layers were identified in the data of the 10 flights.
For the composite data set of all 10 days, F was found to vary over its full possible range (0 to 1). Spatially (both horizontally and vertically), it was found to vary over the full range, with the low values being most likely near cloud edges. From day to day, its maximum variation in cloud interior ranged over an order of magnitude (0.1 to 1). Statistically, based on the interior data of all 10 flights, its value exceeded 0.9 for 36% of the data but was less than 0.6 for 28% of the data. Clearly, the assumption of total scavenging of sulfates in regional models such as RADM is

GILLANI ET AL: FIELD OBSERVATIONS IN CONTINENTAL STRATIFORM CLOUDS 18,703
!.0 w
0.8"
0.6-
O. 4 -
0.2 I
41•mm i ...... mmmmmll ......... mmmmmmm .... •!t•
, 0
11
LEGEND
O Median of more than 1000 values] ß Median of 200 to 1000 values [ o Median of less than 200 values [
,
I I
200 400
0.0 I • I 0 600 800 1000
Ntot ( cm '3 ) 1200
Figure 14. The variation of F with Nto t based on the aggregation of all 1-s cloud-interior cl•.ta within each individual cloud layer. Each data point is identified by the cloud layer corresponding to it. Each datum shows the median values as well as the 25th and 75th percentiles of F and Ntot. The median points are grouped by different symbols into three classes (legend at bottom left) corresponding to different ranges of statistical sample sizes (number of 1-s interior data values). The exact sample sizes are given in Table 2. The three broken curves are based on one-dimensional adiabatic model calculations for constant updraft speeds w = 5, 10, 50 ern s-1. Details of the model and model inputs are given in the text of the paper.
not generally justified for continental stratiform clouds. The composition of the clear-air aerosol surrounding the
clouds on all sides (collectively presumed to be the precloud aerosol) was found to contain a high fraction of water soluble mass such that variations in this composition were ruled out as a significant cause of the observed wide variations of F. Given
the focus in this study on the activation of accumulation-mode particles, it was determined that, for the particular aerosol composition of this study, nearly complete activation of the AMP (F -- 1) was likely whenever cloud conditions favored local supersaturation to exceed an inferred value of about 0.1%.
17 • I"
0.8 11 19 7 I11••0 0.6 0.4 1
2
0.2
0.0
-0.2 0.0 0.2 0.4 0.6 0.8 1 0 MEAN TEMPERATURE LAPSE RATE IN LAYER (øC/100m)
Figure 15. The variation of F with temperature lapse rate for individual cloud layers. Each data point is identified by the cloud layer corresponding to it. Each datum shows the median as well as the 25th and 75th percentiles for F based on aggregation of all 1-s cloud-interior data within the corresponding layer, and the mean temperature lapse rate of the layer.
].0-
0.8'
0.6-
0.4-
0.2-
129 OCT 841
I I I I I 0 0.1 0.2 0.3 0.4 0.5
LWC ( g rn -3 )
LWC
>0.5
Figure 16. Illustration of the variations of F and LWC for the data of October 29. The data show the 25th, 50th, and 75th percentile values for F corresponding to the following ranges of liquid water content (LWC): 0.01-0.05; 0.05-0.1; 0.1-0.2; 0.2-0.3; 0.3-0.4; 0.4-0.5; > 0.5 g m -3.

18,704 GILLANI ET AL.: FIELD OBSERVATIONS IN CONTINENTAL STRATIFORM CLOUDS
1000
.
.................. ' ':' '" ' ''' .... : • .'. :....5.'_ •:?'•.';'!'" '--.c.--...c•....v......-.•..-•. c.•.5;
0 i '-• ........... i .............. i' ..............
1233 TIME 1240 1242
(b)
dN
dD
(cm-3 pm-•)
40-
30-
1o
o
/
CLOUD DROPLETS
Time = 1235:58 ALT = 1220
LWC = 0.92 g m -3 Dv = 15.6
Ntot = 1135 cm -3 F = 0.228
i i i I i ! I 0 5 10 15 20 25 30 35
D (pm)
Figure 17. (a) Example of decrease in cloud droplet concentration (and in F) due to coalescence of droplets at high liquid water content (LWC). Observe, in particular, the sharp drop in Ned and the sharp increase in the volume-mean droplet diameter (Dcd) which accompany the sharp rise in LWC at -1235. The data in this plot correspond to a horizontal aircraft traverse at -1200 m in cloud layer 2 of October 18. The traces have been plotted using a software package which plots the actual data points as well as interpolations, as needed, to space the plotting symbols uniformly to yield a more aesthetic product. These interpolations do not change the sense of the data or affect the interpretations given in the text. (b) Multimodal cloud droplet size distribution at -1236.
There was strong evidence that such conditions prevailed predominantly in the interior of the clouds on 5 of the 10 measurement days. On all of these days, the sampled clouds were embedded in relatively clean (Nto t < 600 cm-3), coo1, and dry air masses of northerly origin, and the cloudg ' were stratocumuli with base heights exceeding 800 m and temperatures being under about 5øC. Under such conditions, F was more or less insensitive to both total particle loading (Ntot) and vertical cooling rate (-dT/dz) in the cloud.
Only under conditions when the inferred values of S were less than about 0.1% was there a likelihood of F being significantly less than unity. Under such conditions, F was found to be quite sensitive to particle size, particle loading (Ntot) and vertical cooling rate (as represented by temperature lapse rate). In this low-$ regime, particles with dry diameters between 0.17 and 0.37 Ilrn, which typically comprised more than 97% of the AMP number concentration, were only partially activated depending on S (Figure 10). Particles larger than 0.37 gm were estimated to require S _< 0.03% for activation, a condition which is likely to have prevailed ubiquitously in cloud-interior on all days. The
size distribution of the clear-air aerosol was found to be
impressively uniform both spatially and temporally during the course of the study. The occurrance of the low-S regime was most common in stable stratus with low cloud base (< 400 m mean sea level (MSL)) and temperatures around 10øC, when such clouds were embedded in relatively polluted (Ntot > 800 cm-3), warm and moist air masses of southerly origin. In this regime, S and F in cloud-interior were quite sensitive to Ntot (> 800 cm-3) and inversely related to it. Evidently, in the type of clouds studied, the activation process becomes self-limiting under such polluted conditions, and further increases in particle loading do not cause a proportionate increase in droplet concentration. This observation has major implications with respect to aerosol-cloud interactions and anthropogenic impact on cloud microphysical, radiative and chemical properties. In the low-S regime, S ar• F were also found to be sensitive to the vertical cooling rate. In the absence of measured information about the mean updraft speed in clouds, we found that the mean lapse rate of temperature in the cloud layers served as a good surrogate for the vertical cooling rate. At the spatial resolution

GILLANI ET AL.: FIELD OBSERVATIONS IN CONTINENTAL STRATIFORM CLOUDS 18,705
of the layers, there was a positive and nearly linear relationship between F and the lapse rate such that the latter explained nicely the observed spread in P for constant Ntot. We did not find cloud LWC over the range -0.1 to 0.5 g m -3 to have a significant effect on P. For LWC • 0.1 g m -3, cloud edge effects tended to suppress F; at LWC > 0.5 g m -3, there was evidence that coalescence of droplets was occuring, also tending to suppress F.
This study has demonstrated that real continental stratiform clouds axe complex entities whose microstructure and microphysical properties can deviate very considerably from the assumptions of one-dimensional adiabatic models. It appears possible to relate particle partitioning in the interior of such clouds to measurable influencing variables in a quantitative way, such that the results are consistent with our theoretical
understanding of clouds. Based on more studies of this type covering a broader range of cloud types and environmental conditions, it may be possible to develop useful semiempirical parameterizations of cloud particle partitioning in cloud-interiors which are reasonable descriptions of real clouds, as well as suitable for use in regional and global models which include cloud radiative and chemical effects. Cloud edges comprise a sizable portion of cloud volume and deserve to be studied further, with the objective of developing reasonable model representations of their effects also.
Acknowledgments. This work was performed with partial support under contracts DE-AC02-76CH00016 with the U.S. Department of Energy and RP2023-1 with the Electric Power Research Institute. We also gratefully acknowledge the contributions of the Canadian Institute for Aerospace Research. The bulk of the work for this study was performed by the principal author during a sabbatical visit to Brookhaven National Laboratory (BNL). We wish to express gratitude to P. H. Daum of BNL for many useful discussions and suggestions which have contributed positively to this work, and to J. G. Williams for f'mal preparation and type-setting of this manuscript.
References
Albrecht, B. A., Aerosols, cloud microphysics, and fractional cloudiness, Science, 245, 1227-1230, 1989.
Alofs, D. J., D. E. Hagen, and M. B. Trueblood, Measured spectra of the hygroscopic fraction of atmospheric aerosol particles, J. Appl. Met., 28, 126-136, 1989.
Baker, M. B., and J. Latham, The evolution of droplet spectra and the rate of production of embryonic raindrops in small cumulus clouds, J. Atmos. Sci., 36, 1612-1615, 1979.
Baumgardner, D., J. W. Strapp, and J. E. Dye, Evolution of the forward scattering spectrometer probe, Part II. Corrections for coincidence and dead time errors, J. Atmos. Oceanic Technol., 2, 626-632, 1985.
Cess, R. D. et al., Intercomparison and interpretation of climate feedback processes in 19 atmospheric global climate models, J. Geophys. Res.,95, 16601-16615, 1990.
Chang, J. S. et al., The Regional Acid Deposition Model and Engineering Model, State-of-Science/Technology Report 4, National Acid Precipitation Assessment Program, Washington, DC, Dec. 1990.
Charlson, R. J., S. E. Schwartz, J. M. Hales, R. D. Cess, J. A. Coaldey, Jr., J. E. Hansen, and D. J. Hofmann, Climate
forcing by anthropogenic aerosols, Science, 255, 423-430, 1992.
Chaumerliac, N. E., J.P. Pinty, and E. C. Nickerson, Sulfur scavenging in a mesoscale model with quasi-spectral microphysics: two-dimensional results for continental and marine clouds, J. Geophys. Res., 92, 3114-3126, 1987.
Daum, P. H., T. J. Kelly, J. W. Strapp, W. R. Leaitch, P. Joe, R. S. Schemenauer, G. A. Isaac, K. G. Anlauf, and H. A. Wiebe, Chemistry and physics of a winter stratus cloud layer: A case study, J. Geophys. Res., 92, 8426-8436, 1987.
Daum, P. H., T. J. Kelly, S. E. Schwartz, and L. Newman, Measurements of the chemical composition of stratiform clouds, Atmos. Environ., 18, 2671-2684, 1984.
Edwards, L., and J. E. Penner, Potential nucleation scavenging of smoke particles over large fires: A parametric study, in Aerosols and Climate, edited by P. V. Hobbs and M.P. McCormick, pp. 423-434, Deepak, Hampton, Va., 1988.
Fitzgerald, J. W., and P. A. Spyers-Duran, Changes in cloud nucleus concentration and cloud droplet size distribution associated with pollution from St. Louis, J. Appl. Meteorol., 12, 511-516, 1973.
Fitzgerald, J. W., Dependence of the supersaturation spectrum of CCN on aerosol size distribution and composition, J. Atmos. Sci., 30, 628-634, 1973.
Flossman, A. I., and H. R. Pruppacher, A theoretical study of the wet removal of atmospheric pollutants. HI. The uptake, redistribution and deposition of (NH,•)2SO, • particles by a convective cloud using a two-dimensional cloud dynamic model, J. Atmos. Sci., 45, 1857-1871, 1988.
Ghan, S. J., C. C. Chuang, and J. E. Penner, A parameterization of cloud droplet nucleation. Part I. Single aerosol type, Atrnos. Res., 30, 198-221, 1993.
Gillani, N. V., P. H. Daum, S. E. Schwartz, W. R. Leaitch, J. W. Strapp, and G. A. Isaac, Fractional activation of accumulation-mode particles in warm continental stratiform clouds, in Precipitation Scavenging and Atmospheric-Surface Exchange Processes, vol. 1, edited by S. E. Schwartz and W. G. N. Slinn, pp. 345-358, Hemisphere, Bristol, Pa., 1992.
Hitnel, G., The role of aerosol properties during the condensational growth of cloud: A reinvestigation of numerics and microphysics, Beitr. Phys. Atmosph., 60, 321-339, 1987.
Hegg, D. A., and P. V. Hobbs, Sulfate and nitrate chemistry in cumuliform clouds, Atmos. Environ., 20, 901-909, 1986.
Hegg, D. A., P. V. Hobbs, and L. F. Radke, Measurements of the scavenging of surfate and nitrate in clouds, Atmos. Environ., 18, 1939-1946, 1984.
Heintzenberg, J., J. A. Ogren, K. J. Noone, and L. G•dneus, The size distribution of submicrometer particles within and about stratocumulus cloud droplets on Mt. ,!u'eskutan, Sweden, Atrnos. Res., 24, 89-101, 1989.
Isaac, G. A., and P. H. Daum, A winter study of air, cloud and precipitation chemistry in Ontario, Canada, Atmos. Environ., 21, 1587-1600, 1987.
Isaac, G. A., W. R. Leaitch, and J. W. S trapp, The vertical distribution of aerosols and related compounds in air and cloudwater, Atmos. Environ., 24A, 3033-3046, 1990.
Isaac, G. A., J. W. Strapp, H. A. Wiebe, W. R. Leaitch, J.B. Kerr, K. G. Anlauf, P. W. Summers, and J. I. MacPherson, The role of cloud dynamics in redistributing pollutants and implications for scavenging studies, in Precipitation Scavenging, Dry Deposition and Resuspension,

18,706 GILLAN[ ET AL.: FIELD OBSERVATIONS IN CONTINENTAL STRATIFORM CLOUDS
vol. 1, edited by H. R. Pruppacher, R. G. Semonin, and W. G. N. Slinn, pp. 1-13, Elsevier, New York, 1983.
Jensen, J. B., and R. J. Charlson, On the efficiency of nucleation scavenging, Tellus, 36B, 367-375, 1984.
Junge, C. E., and E. McLaren, Relationship of cloud nuclei spectra to aerosol size distribution and composition, J. Atmos. Sci., 28, 382-390, 1971.
Junge, C. E., Air Chemistry and Radioactivity, Academic, San Diego, Calif., 1963.
Kaufman, Y. J., R. S. Fraser, and R. L. Mahoney, Fossil fuel and biomass burning effect on climate--heating or cooling?, J. Climate, 4, 578-588, 1991.
Leaitch, W. R., and G. A. Isaac, Tropospheric aerosol size distributions from 1982 to 1988 over eastern North America, Atmos. Environ., 25A, 601-619, 1991.
Leaitch, W. R., G. A. Isaac, J. W. Strapp, C. M. Bartic, and H. A. Wiebe, The relationship between cloud droplet number concentrations and anthropogenic pollution: Observations and climatic implications, J. Geophys Res., 97, 2463-2474, 1992.
Leaitch, W. R., J. W. Strapp, G. A. Isaac, and J. G. Hudson, Cloud droplet nucleation and scavenging of aerosol sulphate in polluted almospheres, Tellus, 38B, 328-344, 1986.
Leaitch, W. R., J. W. Strapp, H. A. Wiebe, and G. A. Isaac, Measurements of scavenging and transformation of aerosol inside cumulus, in Precipitation Scavenging, Dry Deposition and Resuspension, vol. 1, edited by H. R. Pruppacher, R. G. Semonin, and W. G. N. Slinn, pp. 53-69, Elsevier, New York, 1983.
Liu, P.S. K., W. R. Leaitch, J. W. Strapp, and M. A. Wasey, Response of particle measuring systems airborne ASASP and PCASP to NaC1 and latex particles, Aerosol Sci. Technol., 16, 83-95, 1992.
Mason, B. J., The Physics of Clouds, Oxford Univ. Press, New York, 1957.
McMurry, P. H., and M. R. Stolzenburg, On the sensitivity of particle size to relative humidity for Los Angeles Aerosols, Atmos. Environ., 23,497-507, 1989.
Molenkamp, C. R., and M. M. Bradley, A numerical model of aerosol scavenging, I; Microphysics parameterization, in Precipitation Scavenging and Atmosphere-Surface Exchange, vol. 1, edited by S. E. Schwartz and W. G. N. Slinn, pp. 575-590, Hemisphere, Bristol, Pa., 1992.
Noone, K., Changes in aerosol size- and phase distributions due to physical and chemical processes in fog, Tellus, 44B, 489-504, 1992.
Pruppacher, H. R., and J. D. Klett, Microphysics of Clouds and Precipitation, D. Reidel, Norwell, Mass., 1980.
Pueschel, R. F., C. C. Van Valin, R. G. Castillo, J. A. Kadlecek, and E. Ganor, Aerosols in polluted versus nonpolluted air masses: Long-range transport and effects on clouds, J. Clim. Appl. Meteorol., 25, 1908-1917, 1986.
Raga, G. B., and P. R. Jonas, On the link between cloud top radiative properties and sub-cloud aerosol concentrations, QJ•. Meteorol. Soc. 119, 1419-1425, 1993.
Scott, B.C., and N. S. Laulainen, On the concentration of sulfate in precipitation, J. Appl. Meteorol., 18, 138-147, 1979.
Sievering, H., C. C. Van Valin, E. W. Barrett, and R. F. Pueschel, Cloud scavenging of aerosol sulfur: Two case studies, Atmos. Environ., 18, 2685-2690, 1984.
Slinn, W. G. N., Rate limiting aspects of in-cloud scavenging, J. Atmos. Sci., 31, 1172-1173, 1974.
Squires, P., The microstructure and colloidal stability of warm clouds: I. The relation between structure and stability, Tellus, 10, 256-261, 1958a.
Squires, P., The microstructure and colloidal stability of warm clouds: II. The causes of the variations in microstructure, Tellus, 10, 262-271, 1958b.
Strapp, J. W., W. R. Leaitch, and P.S. K. Liu, Hydrated and dried aerosol size-dislxibution measurements from the Particle
Measuring Systems FSSP-300 probe and the deiced PCASP- 100X probe, J. Atmos. Oceanic Technol., 9, 548-555, 1992.
ten Brink, H. M., S. E. Schwartz, and P. H. Daum, Efficient scavenging of aerosol surfate by liquid-water clouds, Atmos. Environ., 21, 2035-2052, 1987.
Twomey, S., and J. Warner, Comparison of measurements cloud droplets and cloud nuclei, J. Atmos. $ci., 24, 702-703, 1967.
Twomey, S., Atmospheric Aerosols, Elsevier, New York, 1977. Twomey, S., Cloud nucleation in the atmosphere and the
influence of nucleus concentration levels in atmospheric physics, J. Phys. Chem., 84, 1459-1463, 1980.
Twomey, S., M. Piepgrass, and T. L. Wolfe, An assessment of the impact of pollution on global cloud albedo, Tellus, 36B, 356-366, 1984.
Twomey, S., The nuclei of natural cloud formation. Part II: The supersaturation in natural clouds and the variation of cloud droplet concentration, Pure Appl. Geophys., 43, 243-249, 1959.
Twomey, S., The influence of pollution on the short-wave albedo of clouds, J. Atmos. Sci., 34, 1149-1152, 1977.
Warner, J., and S. Twomey, The production of cloud nuclei by cane fires and the effect on cloud droplet concentration, J. Atmos. Sci., 24, 704-706, 1967.
Wigley, T. M. L., Possible climate change due to SOTderived cloud condensation nuclei, Nature, 339, 365-367, 1989.
Zhang, X. Q., P. H. McMurry, S. V. Hering, and G. S. Casuccio, Mixing characteristics and water content of submicron aerosols measured in Los Angeles and at the Grand Canyon, Atmos. Environ., 27A, 1593-1607, 1993.
N. V. Gillani, S. E. Schwartz, Brookhaven National Laboratory, Department of Appied Science, Environmental Chemistry Division, Upton, NY 11973. (e-mail: [email protected]; steves@ bnl.gov)
W.R. Leaitch, G. A. Isaac, and J. W. Strapp, Atmospheric Environment Service, 4905 Dufferin Street, Downsview, Ontario, M3H5T4, Canada.
(Received April 20, 1994; revised February 22, 1995; accepted March 7, 1995.)


