Embed Size (px)
Citation preview

FINAL REPORT PREPARED BY Changrong Shi
CHIEF INVESTIGATOR(S) Anthea Fernando (Bundaberg Sugar Ltd.), Changrong Shi (QUT), William Doherty (QUT),
RESEARCH ORGANISATIONS Bundaberg Sugar Ltd. and QUT
CO-FUNDER Bundaberg Sugar Ltd. and QUT
DATE 17 April 2020
RESEARCH MISSION 1 Continuous improvement in farming and milling profitability
FINAL REPORT 2020/203 INCREASED SUGAR RECOVERY THROUGH IMPROVED MILL SANITATION AND BIOCIDE APPLICATION

© Copyright 2021 by Sugar Research Australia Limited.
Copyright in this document is owned by Sugar Research Australia Limited (SRA) or by one or more other parties which have provided it to SRA, as indicated in the document. With the exception of any material protected by a trade mark, this document is licensed under a Creative Commons Attribution-NonCommercial 4.0 International licence (as described through this link). Any use of this publication, other than as authorised under this licence or copyright law, is prohibited.
This link takes you to the relevant licence conditions, including the full legal code.
In referencing this document, please use the citation identified in the document.
Disclaimer:
In this disclaimer a reference to “SRA” means Sugar Research Australia Ltd and its directors, officers, employees, contractors and agents.
This document has been prepared in good faith by the organisation or individual named in the document on the basis of information available to them at the date of publication without any independent verification. Although SRA does its best to present information that is correct and accurate, to the full extent permitted by law SRA makes no warranties, guarantees or representations about the suitability, reliability, currency or accuracy of the information in this document, for any purposes.
The information contained in this document (including tests, inspections and recommendations) is produced for general information only. It is not intended as professional advice on any particular matter. No person should act or fail to act on the basis of any information contained in this document without first conducting independent inquiries and obtaining specific and independent professional advice as appropriate.
To the full extent permitted by law, SRA expressly disclaims all and any liability to any persons in respect of anything done by any such person in reliance (whether in whole or in part) on any information contained in this document, including any loss, damage, cost or expense incurred by any such persons as a result of the use of, or reliance on, any information in this document.
The views expressed in this publication are not necessarily those of SRA.
Any copies made of this document or any part of it must incorporate this disclaimer.
Please cite as: Shi, C., Fernando, A., Doherty, W., Stolz, W., Moller, D., (2000) Project title: Increased sugar recovery through improved mill sanitation and biocide 2020203. Sugar Research Australia Limited, Brisbane

Final Report Project 2020/203
sugarresearch.com.au | 1
ABSTRACT Undetermined sucrose loss during the processing of sugarcane to sugar is estimated between 1-2%, being a large financial loss to the industry. Microbial infection of sugarcane juice is from the microorganisms that enter the mill with the cane supply, and those from the floor washing and filtrate. Microbial degradation contributes 93% of the sucrose loss in mixed juice. Effective cleaning and sanitation procedures are needed to reduce microbial degradation in a factory. However, the hygiene practices vary among Australian mills. Biocides are not routinely used in Australian mills, though they are used overseas.
To provide the preferred corrective hygiene actions for sugar mills and to establish the effectiveness of using biocide in Australian mills, this project conducted audits at four mills to understand the habitat of the microorganisms and compared the effectiveness of two biocides to reduce microbial degradation in both laboratory and factory scales.
Results from the factory audits indicate that the floor recovery system stream has the highest microbial loading, and processing last cane and conducting hosing increases the microbial loading in juices. Laboratory biocide tests reveal that biocides could reduce the sucrose degradation rate in juices, and that the biocide P100 is more effective on FMJ, while P200 is more effective on SMJ. Factory trials indicate that using biocides could potentially reduce the polysaccharides and organic acids contents. Two new rapid analytical methods were developed for the analysis of sugars and sugar degradation products in a single run compared to established methods which multiple runs are required.

Final Report Project 2020/203
sugarresearch.com.au | 2
EXECUTIVE SUMMARY Issues and objectives:
Undetermined sucrose loss during the processing of sugarcane to sugar is estimated between 1-2%, being a large financial loss to the industry. There is apparent loss (e.g., analytical errors) and real loss due to physical, microbial, chemical and enzymatic processes. Eggleston (2002) reported that 93% of the sucrose loss in mixed juice is caused by microorganisms.
Microbial infection of sugarcane juice results from the microorganisms that enter the mill with the cane supply, and those from the factory recovery stream and the filtrate. The growth and accumulation of these microorganisms lead not only to sucrose loss, but the formation of increasing proportions of non-sucrose impurities which affect crystallisation rates and sucrose yield.
Effective cleaning and sanitation procedures are needed to reduce microbial degradation in a factory. In Australian sugar mills, the hygiene practices vary from mill to mill. Conducting an audit to identify the habitat of the microorganisms and assess the cleaning practices will provide the preferred corrective actions for sugar mills.
Biocides are used in many overseas sugar factories but are not routinely used in Australian mills. The effectiveness of biocides was assessed in laboratory trials and in two Australian factories.
The objectives of this project were as follows:
⁃ Evaluate hygiene practices used by mills and analyse the extent of microbial infestation in different juice streams.
⁃ Estimate sucrose losses in juices prior to the evaporation stage, before and after biocide treatment.
⁃ Demonstrate the efficacy of biocides to reduce sucrose loss in the milling stage.
⁃ Establish strategies to mitigate microbial degradation in the milling stage.
R&D methodology:
(1) Establish analytical methods for sugar product analysis
⁃ Establish analytical methods for the determination of microbial degradation products i.e., mannitol, oligosaccharides, polysaccharides and organic acids.
(2) Factory hygiene audits
⁃ Conduct hygiene audits at Farleigh, Isis, Millaquin and Inkerman.
⁃ Collect samples of 4 juice streams – first mill juice (FMJ), floor recovery stream (FRS), mixed juice (MJ) and filtrate (FIL) and conduct on-site 24 h degradation to identify the dominant source of contamination. Samples will be collected from 3 different processing periods: (1) last cane, (2) hosing and (3) normal production.
⁃ All samples will be analysed at 0 h and after holding for 24 h to quantify the extent of microbial deterioration.
(3) Assessment of biocide under laboratory conditions. Collect and freeze composites of secondary MJ from Farleigh, Isis, Millaquin and Inkerman. Conduct deterioration experiments, 0 h, 2 h, 8 h, 24 h, 36 h, 48 h. Tests will be conducted without biocide and with P100 and P200.
(4) Factory trials at Millaquin. There will be a 5-week trial with P100 followed by a 5-week trial with P200, No. 1 mill and No. 5 mill juice are the dosing points. The effects of the biocides will be compared. Secondary MJ and ESJ will be collected 4 times a day (with 0.05% sodium azide) and immediately placed on ice before being stored at 4ºC, and will be combined into a composite before storage at -17 °C.
(5) Factory trials at Inkerman. Further compare the effectiveness of the biocides. 2-Week OFF and ON mode will be adopted, No. 1 mill and No. 5 mill juice are the dosing points. In each duration, Secondary MJ and ESJ will be collected for 2-5 days, sampling and storage procedures are similar to Millaquin tests.

Final Report Project 2020/203
sugarresearch.com.au | 3
Project outputs:
⁃ Methodology on two high performance liquid chromatography (HPLC)-based analytical techniques which enables the identification of sucrose, glucose, fructose, 1-kestose and mannitol in a single run.
⁃ HPLC chromatograms showing the separation of sugar degradation products in a single run.
⁃ Knowledge of the microbial habit in Australian sugarcane factories.
⁃ Data on the type and amount of non-sucrose impurities formed as a consequence of microbial degradation of juice streams.
⁃ Knowledge on the impacts of different hygiene practices (e.g., hosing, processing last cane) on the microbial loading in juice.
⁃ Data on the composition of juices with and without the use of biocides.
⁃ Data on microbial degradation products of juice streams over extended time periods.
⁃ Data on the effectiveness of using the biocides P100 and P200 to reduce microbial degradation in juices.
⁃ Data on factory trials with and without biocides.
Outcomes and implications:
⁃ The two HPLC-based analytical methods were developed. This simplifies the metabolites analysis procedures and reduces the labour requirements.
⁃ The impacts of hygiene practices on sugarcane juice microbial loading and the microbial contamination sources in sugar mill provides strategies for mills to avoid measures that have negative impacts on the microbial loading in juices and take corrective hygiene actions to reduce the microbial sucrose loss.
⁃ Biocides are effective in Australian sugarcane juices. However, because of short crush to processing time may not have a significant effect on undetermined sucrose losses as in overseas countries.
⁃ The efficacy of the biocides P100 and P200 on different types of juices have been established. This provides instructions to the Production Manager and Engineers in a sugar factory to decide when and how to use biocide under a particular condition. When there is a long stoppage due an unexpected event in the factory biocides must be used.

Final Report Project 2020/203
sugarresearch.com.au | 4
ABSTRACT ............................................................................................................................................................. 1 EXECUTIVE SUMMARY ........................................................................................................................................ 2 TABLE OF TABLES ................................................................................................................................................ 6 TABLE OF FIGURES .............................................................................................................................................. 7 1. BACKGROUND ........................................................................................................................................ 9 2. PROJECT OBJECTIVES .......................................................................................................................... 9 3. OUTPUTS, OUTCOMES AND IMPLICATIONS ....................................................................................... 9 3.1 Outputs ..................................................................................................................................................... 9 3.2 Outcomes and Implications ..................................................................................................................... 10 4. INDUSTRY COMMUNICATION AND ENGAGEMENT ........................................................................... 10 4.1 Industry engagement during course of project ........................................................................................ 10 4.2 Industry communication messages ......................................................................................................... 10 5. METHODOLOGY .................................................................................................................................... 11 5.1 Establishment of analytical methods ....................................................................................................... 11 5.2 Factory hygiene audits ............................................................................................................................ 11
5.2.1. Conduct hygiene audit at four sugar mills ................................................................................... 11 5.2.2. Investigate the microorganism habitats and the contamination sources ..................................... 11
5.3 Biocide laboratory and factory trials ........................................................................................................ 11 5.3.1 Biocide resources ........................................................................................................................... 11 5.3.2 Assessment of biocide under laboratory conditions ....................................................................... 11 5.3.3 Factory trials at Millaquin sugar mill ............................................................................................... 12 5.3.4 Factory trials at Inkerman sugar mill .............................................................................................. 12
6. RESULTS AND DISCUSSION ................................................................................................................ 13 6.1 Establishment of analytical methods ....................................................................................................... 13
6.1.1 HPIC-PAD method ......................................................................................................................... 13 6.1.2. HPLC-RI method ........................................................................................................................... 14
6.2 Factory hygiene audits ............................................................................................................................ 15 6.2.1. Factory hygiene practices ............................................................................................................. 15 6.2.2. Investigation of the microorganism habitats and the contamination sources ................................ 17
6.3 Biocide laboratory and factory trials ........................................................................................................ 21 6.3.1. Assessment of biocide under laboratory conditions ...................................................................... 21 6.3.2 Factory trials at Millaquin sugar mill ............................................................................................... 26 6.3.3. Factory trials at Inkerman sugar mill ............................................................................................. 28 6.3.4. Economic analysis of the biocide usage ....................................................................................... 30
7. CONCLUSIONS ...................................................................................................................................... 31 7.1 Analytical method .................................................................................................................................... 31 7.2 Factory hygiene audit .............................................................................................................................. 31 7.3 Biocide laboratory tests ........................................................................................................................... 31 7.4 Biocide factory tests ................................................................................................................................ 31 8. RECOMMENDATIONS FOR FURTHER RD&A ..................................................................................... 31 9. PUBLICATIONS ...................................................................................................................................... 32 10. ACKNOWLEDGEMENTS ....................................................................................................................... 32 11. REFERENCES ....................................................................................................................................... 33 12. APPENDIX .............................................................................................................................................. 34 12.1 Appendix 1 METADATA DISCLOSURE ................................................................................................. 34

Final Report Project 2020/203
sugarresearch.com.au | 5
12.2 Appendix 2 PROJECT DATA .................................................................................................................. 35 13. SRA-RMS MANAGER, RESEARCH MISSIONS’ RECOMMENDATION .. Error! Bookmark not defined.
Final Report Project 2020/203
sugarresearch.com.au | 6
TABLE OF TABLES
Table 1 Juice compositions of the FMJ and SMJ adopted in the laboratory degradation tests .............................................................................................................................................................................. 21 Table 2 Concentrations of 1-kestose, glucose and fructose in #1 Mill juice, SMJ and ESJ during P100 followed by P200 testing period at Millaquin Mill ......................................................... 26 Table 3 Total polysaccharides, total organic acids and lactic acid content in SMJ collected during the P100 followed by P200 testing period at Millaquin Mill .................................................. 28 Table 4 Concentrations of the non-sucrose impurities (that might arise from the juice microbial degradation process) in SMJ and ESJ during P100 ON/OFF testing period at Inkerman Mill .............................................................................................................................................................................. 29 Table 5 Metadata disclosure 1 ................................................................................................................... 34
Final Report Project 2020/203
sugarresearch.com.au | 7
TABLE OF FIGURES
Figure 1 Schematic processing diagram and the detailed biocide dosing test parameters at Millaquin Mill ..................................................................................................................................................... 12 Figure 2 Schematic processing diagram and the detailed biocide dosing test parameters at Inkerman Mill .................................................................................................................................................... 13 Figure 3 Chromatograms of fresh and fermented juice using the newly developed high-performance anion exchange chromatography with pulsed ampometric detector. ................... 14 Figure 4 Chromatograms of interval degraded juice samples using the HPLC-RI method ..... 15 Figure 5 Potential microbe accumulation and contamination cases observed within 4 sugar mills ..................................................................................................................................................................... 17 Figure 6 Sucrose content variation between 0 h and 24 h Floor recovery system (FRS) samples collected from (1) Farleigh Mill, (2) Inkerman Mill, (3) Isis Mill and (4) Millaquin Mill .............................................................................................................................................................................. 18 Figure 7 Sucrose concentration variation between 0 h and 24 h Filtrate samples collected from 1) Farleigh Mill, (2) Inkerman Mill, (3) Isis Mill and (4) Millaquin Mill .............................................. 18 Figure 8 Sucrose content variation between 0 h and 24 h #1 Mill juice samples collected from the (1) Farleigh Mill, (2) Millaquin Mill and (3) Isis Mill ........................................................................ 19 Figure 9 Sucrose content variation between 0 h and 24 h First mixed juice samples collected from (1) Farleigh Mill, (2) Inkerman Mill, (3) Millaquin Mill and (4) Isis Mill................................... 20 Figure 10 Total polysaccharides, total organic acids and typical organic acids (lactic acid, formic acid and acetic acid) concentration variation between 0 h and 24 h sample of (a) FMJ, (b) #1 Mill juice, (c) FRS and (d) FIL ......................................................................................................... 21 Figure 11 (a) Sucrose, (b) 1-kestose, (c) glucose, (d) fructose, (e) mannitol, (f) total polysaccharides, (g) total organic acids and (h) total alcohol concentration variation in Inkerman first mixed juice (FMJ) throughout the 48-h laboratory degradation test without the addition of biocide and with P100 and P200 biocide ........................................................................... 23 Figure 12 (a) Sucrose, (b) 1-kestose, (c) glucose, (d) fructose, (e) mannitol, (f) total polysaccharides, (g) total organic acids, and (h) total alcohol concentration variation in Isis secondary mixed juice (SMJ) throughout the 48-h laboratory degradation test with the addition of P100 and P200 biocide and without biocide ..................................................................................... 25 Figure 13 Sucrose, 1-kestose, glucose, fructose concentration in (a) No. 1 Mill juice, (b) SMJ and (c) ESJ collected from P100 and P200 dosing periods, and (d) the concentration of total polysaccharides and total organic acids concentration in SMJ collected from Millaquin Mill P100 and P200 testing periods .................................................................................................................. 27 Figure 14 G/F ration of (a) SMJ and ESJ collected from P100 ON/OFF mode in Inkerman sugar mill and (b) #1 Mill, SMJ and ESJ collected from P100_P200 mode in Millaquin Mill .. 27 Figure 15 Sucrose, 1-kestose, glucose, fructose concentration in (a) SMJ and (b) ESJ collected from Millaquin Mill P100 and P200 testing periods ............................................................ 28 Figure 16 The concentration of total polysaccharides and total organic acids concentration in SMJ collected from Inkerman Mill P100 ON/OFF dosing periods ................................................... 30 Figure 17 (1) 1-kestose, (2) glucose, (3) fructose and (4) mannitol content in 0 h and 24 h degraded Farleigh #1 Mill juice................................................................................................................... 35 Figure 18 (1) 1-kestose, (2) glucose, (3) fructose and (4) mannitol content in 0 h and 24 h degraded ISIS #1 Mill juice .......................................................................................................................... 35 Figure 19 (1) 1-kestose, (2) glucose, (3) fructose and (4) mannitol content in 0 h and 24 h degraded Millaquin #1 Mill juice ................................................................................................................. 36 Figure 20 (1) 1-kestose, (2) glucose, (3) fructose and (4) mannitol content in 0 h and 24 h degraded Farleigh FMJ ................................................................................................................................. 36 Figure 21 (1) 1-kestose, (2) glucose, (3) fructose and (4) mannitol content in 0 h and 24 h degraded Inkerman FMJ .............................................................................................................................. 37

Final Report Project 2020/203
sugarresearch.com.au | 8
Figure 22 (1) 1-kestose, (2) glucose, (3) fructose and (4) mannitol content in 0 h and 24 h degraded Isis FMJ .......................................................................................................................................... 37 Figure 23 (1) 1-kestose, (2) glucose, (3) fructose and (4) mannitol content in 0 h and 24 h degraded Millaquin FMJ ............................................................................................................................... 38 Figure 24 (a) Sucrose, (b) 1-kestose, (c) glucose, (d) fructose, (e) mannitol, (f) total polysaccharides, (g) total organic acids and (h) total alcohol concentration variation in Farleigh first mixed juice (FMJ) throughout the 48-h laboratory degradation test without the addition of biocide and with P100 and P200 biocide ................................................................................................ 39 Figure 25 (a) Sucrose, (b) 1-kestose, (c) glucose, (d) fructose, (e) mannitol, (f) total polysaccharides, (g) total organic acids and (h) total alcohol concentration variation in Millaquin Secondary mixed juice (SMJ) throughout the 48-h laboratory degradation test without the addition of biocide and with P100 and P200 biocide ..................................................... 40

Final Report Project 2020/203
sugarresearch.com.au | 9
1. BACKGROUND
Sucrose loss has long been a common problem for the sugar industry and is estimated to be 1-2% indicating a huge amount of financial loss to the industry. Sucrose loss occurs between harvesting and milling, and during the sugar-manufacturing processes. The three main reaction pathways that result in sucrose loss are microbial, enzymatic, and chemical processes. Results of the effects of these processes on mixed juice (MJ) have indicated that 93% of sucrose deterioration is caused by microbial action, while 5.7% and 1.3% is by enzymatic and chemical processes, respectively, within the first 14 h of the deterioration process (Eggleston 2002).
In addition to sucrose loss, the growth and accumulation of these microorganisms also lead to the formation of increasing proportions of non-sucrose impurities that detrimentally affect the evaporation and crystallisation rates, and molasses exhaustion (sucrose recovery). These impurities include glucose-derived polysaccharides (e.g., dextran), fructose-derived polysaccharides (e.g., levan), mannitol, oligosaccharides (e.g., 1-kestose), organic acids (e.g., lactic acid), and ethanol. Microbial infection of sugarcane juice results from the microorganisms that enter the mill with the cane supply, and those from the factory recovery stream and the filtrate.
Periodic cleaning of filtration systems and the use of hot water to clean screens and drains are methods used to control, but not eliminate, the spread of microbials. In Australian sugar mills, the hygiene practices vary from mill to mill. Another approach to reduce/eliminate the microbial growth in sugarcane juice is to use Food and Drug Administration (FDA) USA, approved biocides, which are used in many oversea sugar factories but not routinely used in Australian sugar mills.
In a previous juice-deterioration studies carried out by Tilbury et al. (1997) indicated that even under Australian harvesting and processing conditions, where the lag time between harvesting and milling (i.e., cut-to-crush) is short, and the maintenance of good hygiene practices through sanitisation of the cane milling train, mixed-juice screen, filters and drains, juice deterioration by micro-organisms still occurs. Apart from this study, little work has been conducted by Australian sugar mills to accurately determine the extent of sucrose loss caused by microorganisms, and the use of biocides approved by the FDA to mitigate sucrose loss. As a consequence of this, the contribution of microbial deterioration to undetermined sucrose loss is unknown.
In this project hygiene audits were undertaken at four mills (Farleigh Mill, Inkerman Mill, Isis Mill and Millaquin Mill) to assess the cleaning practices and juice streams were collected from the four mills and a 24-h onsite degradation test conducted to identify the habitat of microorganisms and screen out the dominate microbial contamination sources within the mills. Two FDA approved biocides (P100 and P200) were assessed under laboratory and factory conditions to identify whether it is beneficial to use biocides in Australian factories. To complement these studies, two rapid analytical methods based on high performance liquid chromatography (HPLC) methods were developed to identify the metabolic products (sugars, 1-kestose and mannitol) in a single run.
2. PROJECT OBJECTIVES
The project objectives were to:
⁃ Evaluate hygiene practices used by mills and analyse the extent of microbial infestation in different juice streams.
⁃ Estimate sucrose losses in juices prior to the evaporation stage, before and after biocide treatment. ⁃ Demonstrate the efficacy of biocides to reduce sucrose loss in the milling stage. ⁃ Establish strategies to mitigate microbial degradation in the milling stage.
3. OUTPUTS, OUTCOMES AND IMPLICATIONS
3.1 Outputs
The outputs from the project are as follows:
⁃ Methodology on two high performance liquid chromatography (HPLC)-based analytical techniques which enables the identification of sucrose, glucose, fructose, 1-kestose and mannitol in a single run.
⁃ HPLC chromatograms showing the separation of sugar degradation products in a single run.
⁃ Knowledge of the microbial habit in Australian sugarcane factories.
⁃ Data on the type and amount of non-sucrose impurities formed as a consequence of microbial degradation of juice streams.

Final Report Project 2020/203
sugarresearch.com.au | 10
⁃ Knowledge on the impacts of different hygiene practices (e.g., hosing, processing last cane) on the microbial loading in juice.
⁃ Data on the composition of juices with and without the use of biocides.
⁃ Data on microbial degradation products of juice streams over extended time periods.
⁃ Data on the effectiveness of using the biocides P100 and P200 to reduce microbial degradation in juices.
⁃ Data on factory trials with and without biocides.
The information from the project is useful to assist mills to decide whether or when to biocides.
3.2 Outcomes and Implications
The main outcomes of this project are as follows:
⁃ The two HPLC-based analytical methods were developed. This simplifies the metabolites analysis procedures and reduces the labour requirements.
⁃ The impacts of hygiene practices on sugarcane juice microbial loading. Microbial contamination sources in sugar mill provides strategies for mills to avoid measures that have negative impacts on the microbial loading in juices and take corrective hygiene actions to reduce the microbial sucrose loss.
⁃ Biocides are effective in Australian sugarcane juices. However, because of short crush to processing time may not have a significant effect on undetermined sucrose losses as in overseas countries.
⁃ The efficacy of the biocides P100 and P200 on different types of juices have been established. This provides instructions to the Production Manager and Engineers in a sugar factory to decide when and how to use biocide under a particular condition. When there is a long stoppage due an unexpected event in the factory biocides must be used.
Overall, this study provides the Mill Production Manager and Engineers a basic understanding of the impacts of sugarcane juice microbial degradation, and the knowledge of the impacts of different practices on sugarcane juice microbial loading, the dominant microbial contaminant sources within the mill, and the effectiveness of two types of biocides. This enables mills take corrective actions to improve the hygiene standard and make decisions on when to apply a biocide in the during the manufacturing processes.
4. INDUSTRY COMMUNICATION AND ENGAGEMENT
4.1 Industry engagement during course of project
The project was initiated by Millaquin Mill and tests were conducted at 4 sugar mills (Farleigh, Inkerman, Isis and Millaquin Mill), as they showed interests in the projects. Factory hygiene audits were undertaken at all the four mills, and mill staff provided extensive assistance during the course of the project. In particular, in the factory trials carried out at Millaquin and Inkerman Mills, mill staff installed pumps and pipes, dosed the juice with biocides, monitored the dosing process, collected samples periodically, stored the samples frozen and transported them to QUT. Mill staff were highly engaged in the whole project implementation processes.
4.2 Industry communication messages
As stated in section 3 the main outcome is to provide the mill production managers and engineers a basic understanding of the impacts of sugarcane juice microbial degradation, and the knowledge of the impacts of different practices on sugarcane juice microbial loading, the dominate microbial contaminate sources within the mill, and the effectiveness of two types of biocide. This enables mills take corrective actions to improve the hygiene standard and make decisions on when and how to apply biocides in the regular manufacturing processes.
To date there has been no communication with any of the SRA Adoption Officers.
Results and application into the industry have also been presented to mill staff in all the cane growing regions in the Research Seminar series conducted in March 2021.
A paper is being prepared for presentation at the 2022 ASSCT Conference.

Final Report Project 2020/203
sugarresearch.com.au | 11
5. METHODOLOGY
5.1 Establishment of analytical methods
There are four (4) methods documented for the analysis of sugars and degradation products. The two (2) methods published by the International Commission for Uniform Methods of Sugar Analysis (ICUMSA) for the analysis of sucrose, glucose, fructose and mannitol, the historical Sugar Research Institute (SRI) method (Papageorgiou et.al., 1997) for the analysis of oligosaccharides, and the method of Eggleston (2002) for the analysis of oligosaccharides in deteriorated cane juice. These methods use high-performance anion exchange chromatography with pulsed ampometric detection (HPIC-PAD) and a CarboPac PA1 column for the separation of the compounds, and to analyse sugar degradation products multiple runs are required.
A modified HPIC-PAD method was developed (using CarboPac PA1 column and pulsed ampometric detector) based on the four established methods with modifications on the concentration of the mobile phases, elution modes (isometric elution OR gradient elution), flow rates and injection volume. This method improved the separation of the sugar degradation products present in sugarcane juice.
A modified HPLC-RI method was developed using Bio-Rad HPX-87P column and Refractive Index detector, and the separation temperature, flow rate and juice preparation method were optimised.
5.2 Factory hygiene audits
5.2.1. Conduct hygiene audit at four sugar mills
Hygiene audits were conducted at four sugar mills (Farleigh, Isis, Millaquin and Inkerman). The hygiene practices at each mill were evaluated, and the hygiene level of each factory were also evaluated based on the overall visual observations including the spill numbers (and possible microbial growth based on whether the spills are slippery), and the drainage appearance.
5.2.2. Investigate the microorganism habitats and the contamination sources
Four juice streams were collected – first mill juice (FMJ), floor recovery stream (FRS), mixed juice (MJ) and filtrate (FIL) to identify the dominant source of contamination. Samples were collected based on the factory processing time frame as follows:
⁃ Last cane processing period, when the last cane from the previous day is being processed, ⁃ Hosing period, depending on the hosing time of the factory, ⁃ Normal production period, when the normal and stable production is in progress.
All samples were analysed at 0 h and after holding for 24 h to quantify the extent of microbial deterioration.
5.3 Biocide laboratory and factory trials
5.3.1 Biocide resources
Two FDA approved biocides (P100 and P200) used in this project were purchased from TD Chemicals Pty Ltd. The chemical composition of P100 is aqueous solution of sodium dimethyldithiocarbamate (C4H6N2S4.2Na) with concentration of 40-42% (w/w), P200 is aqueous solution of disodium ethylene bisdithiocarbamate (C5H10NS3Na) with concentration of ≥ 30% (w/w). The suggested dosing rate of P100 and P200 are 7.5 ppm on cane and 10.0 ppm on cane respectively.
For the storage of P100 and P200, they should be kept in the original sealed package. Avoid temperatures under -10 °C and over 40 °C. The products are sensitive to frost below + 5 °C. Below + 10 °C, parts of the product may crystallise, which may be solved by warming up the product to 35-40 °C. The shelf life of the biocides is 1 year. During storage a small amount of sediment may form.
5.3.2 Assessment of biocide under laboratory conditions
Composites of first mixed juice (FMJ) were collected from Farleigh and Inkerman sugar mill and composite secondary mixed juice (SMJ, including floor washings and filtrate) were collected from Isis and Millaquin sugar mill, the juices were stored in the -20 °C fridge immediately after collection.
The juices were defrosted in the laboratory, and deterioration experiments were conducted at laboratory scale at ambient temperature (~23 °C), interval samples were withdrawn from the system at 0 h, 4 h, 6 h, 16 h, 24 h, 48 h, and were quenched with NaN3 to stop the microbial activity and put in -20 °C instantly for the subsequent analysis. Tests were conducted without biocide and with P100 and P200.
Sugars (sucrose, glucose, fructose), 1-kestose, mannitol, organic acids (oxalic acid, cis-aconitic acid, citric acid, D-gluconic acid, L-malic acid, trans-aconitic acid, succinic acid, glycolic acid, lactic acid, formic acid, acetic acid)

Final Report Project 2020/203
sugarresearch.com.au | 12
and total polysaccharides concentration throughout the degradation process were monitored to reflect the sucrose degradation rate and to identify the effectiveness of the biocides.
5.3.3 Factory trials at Millaquin sugar mill
The effectiveness of P100 and P200 biocide was compared in factory scale at Millaquin sugar mill. The trials were implemented by a 5-week test with dosing P100 biocide followed by a 5-week test dosing with P200 biocide as listed below.
⁃ 1–5-week trial, P100 biocide test ⁃ 5–10-week trial, P200 biocide test
No. 1 and No. 5 mill were set as the biocide dosing points and the dosing rate was based on the suggestion from the supplier (P100 7.5 ppm on cane, and P200 10 ppm on cane). The crushing rate at Millaquin was 320 t/h, so the dosing rate at each dosing point was 2.4 L/h for P100 biocide, and dosing rate at each dosing point was 3.2 L/h for P200 biocide.
The schematic processing diagram and the detailed biocide dosing points and dosing test parameters including dosing point and dosing rate are shown in Figure 1.
No.1 Mill juice (#1 Mill), Secondary mixed juice (SMJ) and Evaporator supply juice (ESJ) were collected for at least 7 days at the end of each testing duration, and each juice sample were collected 4 times a day (with 0.05% NaN3 to stop the microbial activity) and immediately placed on ice before being stored at 4ºC, and were combined into a composite before storage at -17 °C.
Figure 1 Schematic processing diagram and the detailed biocide dosing test parameters at Millaquin Mill
5.3.4 Factory trials at Inkerman sugar mill
To further demonstrate the efficacy of using biocide, another factory trial was conducted at Inkerman sugar mill. P100 biocide weeks ON and OFF mode were applied during the crushing season.
Inkerman sugar mill has a milling train (A side) and a diffuser (B side) in the milling stage (Figure 2). The processing capacity of A and B side is 300 t/h and 270 t/h, respectively. No.1 mill, No. 5 mill of Aside, and No.1 mill and the front end of diffuser of B side were the biocide dosing points. Based on the suggested dosing rate, the pump rate at A side dosing points were 1.125 L/h, and that at the B side dosing points were 1.0125 L/h, the detailed biocide dosing points and dosing test parameters including dosing point and dosing rate are shown in Figure 2.

Final Report Project 2020/203
sugarresearch.com.au | 13
Each test period was set as 2 weeks except for unexpected stoppages, which was trying to accommodate the regular factory periodic cleaning practices (the factory stops for one day every fortnight for the regular evaporators cleaning). The detailed test time frame was as follows:
⁃ 1-2 weeks, P100 biocide test. ⁃ 3 week, P100 biocide test. ⁃ 4-5 weeks, No biocide test. ⁃ 6-7 weeks, P100 biocide test. ⁃ 7-8 weeks, No biocide test. ⁃ 8-9 weeks, P100 biocide test.
In each of the duration, SMJ and ESJ were collected for at least 5 days at the end of the testing period for analysis, except for unexpected stoppages, sampling and storage procedures are similar to Millaquin tests.
Figure 2 Schematic processing diagram and the detailed biocide dosing test parameters at Inkerman Mill
For all juice samples collected (No. 1 Mill juice, SMJ and ESJ) in the two biocide factory trials, analysis on sucrose, glucose, fructose, mannitol and mannitol were performed. In addition to the above analysis, organic acids and total polysaccharides content were analysed for the SMJ collected from the factory trials.
6. RESULTS AND DISCUSSION
6.1 Establishment of analytical methods
Two HPLC-based analytical methods were developed to identify the sucrose, glucose, fructose, 1-kestose, mannitol concentration in a single run.
6.1.1 HPIC-PAD method
This method was developed based on the four methods mentioned in the methodology section with modifications on the concentration of mobile phases, elution modes (isometric elution OR gradient elution), flow rates and injection volume to improve the separation of the complex metabolized products presented in the degraded sugarcane juice. Detailed method parameters are as follows:
⁃ Juice samples (2.5 g) were diluted in 50 mL with lactose added to the solution to act as an internal standard.
⁃ 10 µL of sample was injected into a Dionex CarboPac PA1 column (in series to a guard column) which is able to separate sugars, mannitol and oligosaccharides.
⁃ A flow rate of 0.8 mL/min was used with eluent conditions 100 mM sodium hydroxide isocratic (0-10 minutes).

Final Report Project 2020/203
sugarresearch.com.au | 14
⁃ Gradient of 0-300 mM sodium acetate in 100 mM sodium hydroxide (10-35 minutes) and return to 100 mM sodium hydroxide (35-40 minutes) and isocratic 100 mM sodium hydroxide (40-45 minutes) to re-equilibrate the column.
⁃ Compounds of interest are detected using an electrochemical detector in pulsed ampometric mode.
Typical HPIC chromatograms for fresh and fermented juice are shown in Figure 3.
Figure 3 Chromatograms of fresh and fermented juice using the newly developed high-performance anion exchange chromatography with pulsed ampometric detector.
This method is able to quantify the degradation products within 25 min, however, when the sucrose concentration is too high in the samples, the quantification of sucrose could probably not be accurate enough, further adjustment on juice dilution protocols is required.
6.1.2. HPLC-RI method
A high-performance liquid chromatography (HPLC) method was also developed which can detect the sugars, oligosaccharides, and mannitol presents in the degraded sugarcane juice in a single run.
The detailed method parameters are as follows:
⁃ Juice samples were diluted by 50 times using Milli Q water. ⁃ Bio-Rad HPX-87P column was used for the separation (column temperature 60°C). ⁃ Isometric elution was applied with Milli Q water as mobile phase (45 minutes). ⁃ The flow rate was 0.5 mL/min. ⁃ Compounds were detected using refractive index (RI) detector.
Typical chromatography of the degradation products of interests in sugarcane juice are shown in Figure 4. Degraded sugarcane juice samples from hygiene audit were analysed using HPLC method, the products of interest could be separated very well with this method. However, if the ethanol concentration is high enough in the samples, co-elution of ethanol and fructose could happen.

Final Report Project 2020/203
sugarresearch.com.au | 15
Figure 4 Chromatograms of interval degraded juice samples using the HPLC-RI method
In this project, the HPLC-RI method was selected for all the analysis regarding sucrose, glucose, fructose, 1-kestose and mannitol.
6.2 Factory hygiene audits
6.2.1. Factory hygiene practices
Hygiene audits at Farleigh, Isis, Millaquin and Inkerman sugar mills were completed during the 2020 crushing season by 2-3 days on-site observation and assessment at each mill. The outcomes of the hygiene audit section were obtained based on the observations conducted during the specific time period QUT staff visited the factory.
(1) Farleigh sugar mill
Milling stage:
⁃ All the sumps and spills from the milling stage go to the drain pump and were pumped back to the juice system directly. There is no residence time in the drain, which is a good practice.
⁃ There was a little juice leakage around No.1 mill, and no obvious microbial growth was observed. Minimal spillages were observed around No. 2, No. 3 and No. 4 mills, however the floor was uneven and slippery. The slippery floor is an indication of microbial growth.
Evaporation stage:
⁃ The Evaporation sump consists of evaporation and filtration stage drains. Juice from these drains are directed to a high capacity sink before being pumped back into the process line. There is a big liquid level difference between the pump on and off mode, allowing microbial degradation of residual juice in the sink to continue.
⁃ There was wet bagacillo from the overflow building up around the transfer tank, which could be a potential contamination source.
⁃ There was mud juice leakage underneath the filters; no obvious microbial growth was observed but this could also be a potential microbe contamination source.
Fugal stage:
⁃ The Fugal sumps were directed into a specific sink with a big volume. The large liquid level difference between the pump on and off mode may contribute to microbial degradation of collected juices.
⁃ Spills were observed and found to be slippery, which indicates Leuconostoc might have grown on the floor.
⁃ Unmanned hosing was observed for a while, which could contribute the microbial growth due to the relatively optimal sugar concentration in the washing water.
⁃ Wet sugar belt and holes were observed on the floor around the A&B sugar fugal stage creating stagnant pools of water and sugar, encouraging microbial activity and the formation of deeper holes.
Final Report Project 2020/203
sugarresearch.com.au | 16
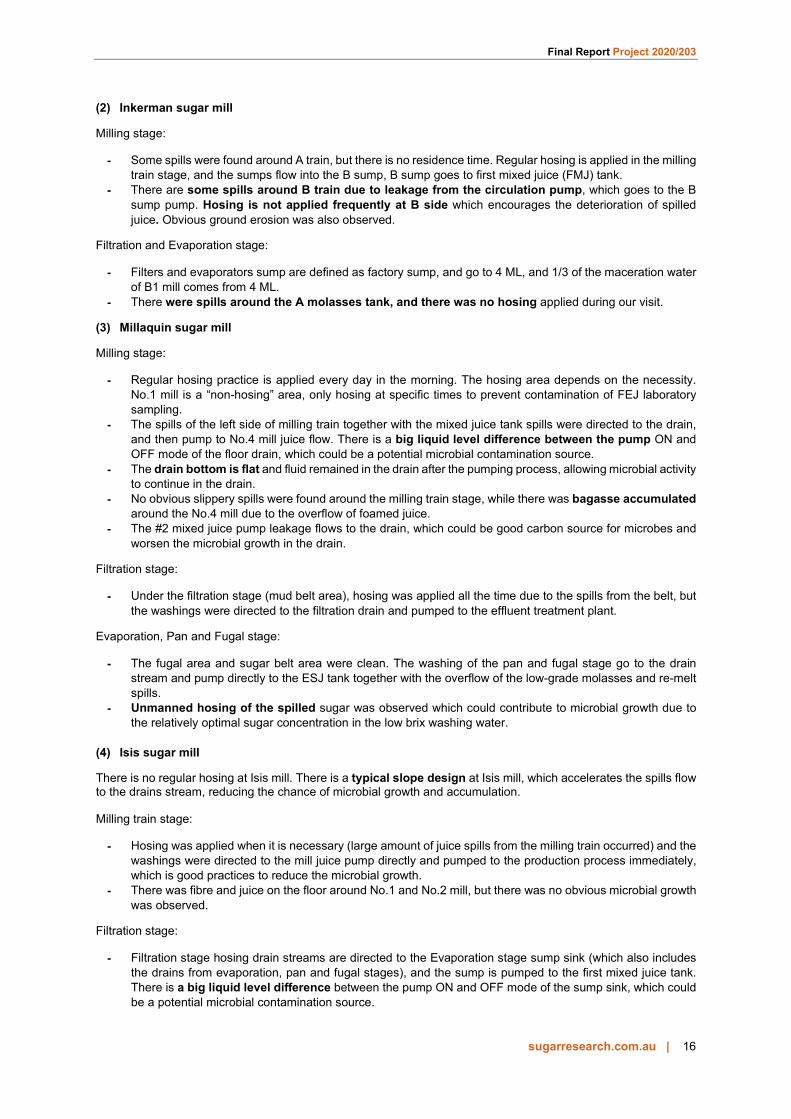
(2) Inkerman sugar mill
Milling stage:
⁃ Some spills were found around A train, but there is no residence time. Regular hosing is applied in the milling train stage, and the sumps flow into the B sump, B sump goes to first mixed juice (FMJ) tank.
⁃ There are some spills around B train due to leakage from the circulation pump, which goes to the B sump pump. Hosing is not applied frequently at B side which encourages the deterioration of spilled juice. Obvious ground erosion was also observed.
Filtration and Evaporation stage:
⁃ Filters and evaporators sump are defined as factory sump, and go to 4 ML, and 1/3 of the maceration water of B1 mill comes from 4 ML.
⁃ There were spills around the A molasses tank, and there was no hosing applied during our visit.
(3) Millaquin sugar mill
Milling stage:
⁃ Regular hosing practice is applied every day in the morning. The hosing area depends on the necessity. No.1 mill is a “non-hosing” area, only hosing at specific times to prevent contamination of FEJ laboratory sampling.
⁃ The spills of the left side of milling train together with the mixed juice tank spills were directed to the drain, and then pump to No.4 mill juice flow. There is a big liquid level difference between the pump ON and OFF mode of the floor drain, which could be a potential microbial contamination source.
⁃ The drain bottom is flat and fluid remained in the drain after the pumping process, allowing microbial activity to continue in the drain.
⁃ No obvious slippery spills were found around the milling train stage, while there was bagasse accumulated around the No.4 mill due to the overflow of foamed juice.
⁃ The #2 mixed juice pump leakage flows to the drain, which could be good carbon source for microbes and worsen the microbial growth in the drain.
Filtration stage:
⁃ Under the filtration stage (mud belt area), hosing was applied all the time due to the spills from the belt, but the washings were directed to the filtration drain and pumped to the effluent treatment plant.
Evaporation, Pan and Fugal stage:
⁃ The fugal area and sugar belt area were clean. The washing of the pan and fugal stage go to the drain stream and pump directly to the ESJ tank together with the overflow of the low-grade molasses and re-melt spills.
⁃ Unmanned hosing of the spilled sugar was observed which could contribute to microbial growth due to the relatively optimal sugar concentration in the low brix washing water.
(4) Isis sugar mill
There is no regular hosing at Isis mill. There is a typical slope design at Isis mill, which accelerates the spills flow to the drains stream, reducing the chance of microbial growth and accumulation.
Milling train stage:
⁃ Hosing was applied when it is necessary (large amount of juice spills from the milling train occurred) and the washings were directed to the mill juice pump directly and pumped to the production process immediately, which is good practices to reduce the microbial growth.
⁃ There was fibre and juice on the floor around No.1 and No.2 mill, but there was no obvious microbial growth was observed.
Filtration stage:
⁃ Filtration stage hosing drain streams are directed to the Evaporation stage sump sink (which also includes the drains from evaporation, pan and fugal stages), and the sump is pumped to the first mixed juice tank. There is a big liquid level difference between the pump ON and OFF mode of the sump sink, which could be a potential microbial contamination source.

Final Report Project 2020/203
sugarresearch.com.au | 17
⁃ There was no significant spill found under the filters.
Pan and Fugal stage:
⁃ Some spills were found underneath the crystallizers. ⁃ No regular hosing was applied. ⁃ Fugal area was clean at ISIS, and dry sugar belt was found at ISIS, which is also a good practice.
Through the 2-3 days observation at the four mills, hygiene practices were found to vary from mill to mill. Most of the mills have regular hosing every day except Isis Mill. This may because Isis has a typical slope ground design, which is able to accelerate the spills flow to the drains. In general, spills were observed in all the four mills at different areas as shown in Figure 5. Some spills were not cleaned immediately, and so microbial growth and accumulation could occur, which will contribute to increased microbe loading in juice. There is a big level difference between pump ON and OFF mode with the drains and the drainage sink, which could be a potential microbe accumulation area.
Figure 5 Potential microbe accumulation and contamination cases observed within 4 sugar mills
If hygiene practices could be improved, taking into account the point raised from the audit, they will contribute to the elimination of microbe numbers in juice and result in a lower sucrose loss arising from microbe activity.
6.2.2. Investigation of the microorganism habitats and the contamination sources
Hygiene audits were conducted at Farleigh, Isis, Millaquin and Inkerman Mills. Composite samples of 4 juice streams – first mill juice (1#Mill), floor washing (FW), FMJ and filtrate (FIL) were collected to identify the dominant source of microbial contamination. Samples were collected based on the factory processing time frame as follows: (a) Last cane period, (b) Hosing period, (c) Normal production period.
An on-site 24-h degradation test was applied to each of the juice collected, and all the samples were analysed at 0 h and 24 h to quantify the extent of microbial deterioration. Sugars (sucrose, glucose, and fructose) contents and mannitol, 1-kestose content were analysed. Different juice streams were found to have different degradation rates.
Figure 6 shows the sucrose concentration of the 0 h and 24 h floor recovery system (FRS) samples collected from the four mills. Overall, in the 24-h degradation process, FRS has the highest degradation rate (up to 98%) in the 24-h period, although on the average it has a lower sucrose content (<10 mg/mL sucrose) than the cane juice streams.

Final Report Project 2020/203
sugarresearch.com.au | 18
Figure 6 Sucrose content variation between 0 h and 24 h Floor recovery system (FRS) samples collected from (1) Farleigh Mill, (2) Inkerman Mill, (3) Isis Mill and (4) Millaquin Mill
Figure 7 shows the sucrose concentration in the 0 h and 24 h FIL samples collected from the four mills. As observed in the four graphs, on the average, FIL has the smallest degradation rate in the 24-h degradation test, ranging from 0.4% to 17.5%, which could be because the FIL originates from high temperature clarification of juice (102-105 °C). Under these conditions, most of the mesophilic microorganisms have been killed, leaving behind the thermophilic microorganisms. As the overall microorganism number is low, the microorganism activity in FIL could be lower than the other juice streams. The highest degradation rate of FIL was found during processing last cane period, indicating the increased thermophilic microorganism number in last cane.
Figure 7 Sucrose concentration variation between 0 h and 24 h Filtrate samples collected from 1) Farleigh Mill, (2)
Inkerman Mill, (3) Isis Mill and (4) Millaquin Mill

Final Report Project 2020/203
sugarresearch.com.au | 19
Figure 8 shows the sucrose concentration in 0 h and 24 h for #1 Mill juice samples from Farleigh, Millaquin and Isis Mills. The sucrose degradation rate of #1 Mill juice varied (depending on the processing period) and from 20% to 60% within 24 h. The highest sucrose degradation rate was found with the processing of last cane. This is confirmed from the result obtained with #1Mill juice of last cane.
Figure 8 Sucrose content variation between 0 h and 24 h #1 Mill juice samples collected from the (1) Farleigh Mill, (2) Millaquin Mill and (3) Isis Mill
Figure 9 shows the sucrose concentrations at 0 h and 24 h for first mixed juice (FMJ). Compared with #1 Mill juice, FMJ combines different streams from the 5 mills and possibly the floor recovery streams from the mill - this varies from mill to mill. As such, FMJ has a higher sucrose degradation rate than #1 Mill juice, the values which varied from different processing period, and is between 20 and 90%. The highest degradation rate of FMJ was found during the hosing period, indicating hosing could significantly increase the microorganism numbers in FMJ, and promote juice degradation. The impacts of hosing overlay that of processing last cane.
The presence of metabolic products such as mannitol, lactic acid and ethanol etc. are indicators that can be used to predict sucrose loss (Jones et al. 1997; Lionnet and & Pillay 1987) and are used as tools to compare the rate and extent of juice deterioration. In addition to sucrose loss, metabolic products including reducing sugars (glucose and fructose), mannitol and 1-kestose all experienced an increasing trend in the degradation process, particularly in #1 Mill juice and FMJ (Appendix 2 Figures 17 to 23), which is in consistent with our previous work (Shi et al., 2020). Mannitol has been reported as a good indicator for the sucrose degradation in sugarcane juice and becomes significant by 24 h. Increased glucose and fructose concentration with time are from the inversion of sucrose, and fructose has a relatively higher concentration than glucose, which could be due to the polymerization of glucosyl moieties from sucrose by glucosyltransferase secreted by the Leuconoctoc, resulting in the liberation of fructose (Eggleston 2002). 1-kestose is a typical oligosaccharide produced in the sugarcane juice degradation process.

Final Report Project 2020/203
sugarresearch.com.au | 20
Figure 9 Sucrose content variation between 0 h and 24 h First mixed juice samples collected from (1) Farleigh Mill, (2)
Inkerman Mill, (3) Millaquin Mill and (4) Isis Mill
Figure 10 (a), (b), (c) and (d) show the total polysaccharides and total organic acids concentration and three typical organic acid concentration in the 0 h and 24 h samples of FMJ, #1 Mill, FRS and FIL, respectively. As observed, in FMJ, #1 Mill juice and FIL, both polysaccharides and organic acids contents increased significantly within 24 h. While the polysaccharides content in FRS are kept relatively constant, organic acids experienced a significant increase probably because of the low sugar content which favours their formation. Among the organic acids detected, lactic acid has the highest increasing trend in the 24-h period with all the four juice streams. Formic acid content decreased slightly in the process in FMJ, #1Mill juice and FIL but increased with FRS. Acetic acid content also experienced increasing trend in the degradation process of all the samples. Lactic acid, acetic acid and mannitol have been reported to be produced as the deterioration products of Leuconostoc microorganisms (Eggleston 2002).
In summary, from the results of the on-site juices degradation tests, it was found that processing factory last cane and conduct hosing practice do increase the microbial loadings. So, less spills could be good to mitigate the need for hosing.

Final Report Project 2020/203
sugarresearch.com.au | 21
Figure 10 Total polysaccharides, total organic acids and typical organic acids (lactic acid, formic acid and acetic acid) concentration variation between 0 h and 24 h sample of (a) FMJ, (b) #1 Mill juice, (c) FRS and (d) FIL
6.3 Biocide laboratory and factory trials
6.3.1. Assessment of biocide under laboratory conditions
Secondary mixed juice (SMJ) was collected from Isis and Millaquin Mill, and first mixed juice (FMJ) was collected from Inkerman and Farleigh Mill, and a 48-h degradation test were carried out with the FMJ and SMJ, the effectiveness of biocide P100 and P200 were compared by the addition of 7.5 ppm P100 and 10 ppm P200 to the juices, a control group without addition of biocide was also set up for comparison. The sucrose degradation rate and the formation of metabolic products procedure were monitored throughout the degradation process.
The juice composition of FMJ and SMJ are listed in Table 1. Mannitol was not detected in both FMJ and SMJ, from which we assume there is no noticeable degradation occurred in the two types of juice collected from the four mills. The FMJ collected form Farleigh contains the drains from evaporation, fugal stages and scrubbers, and FMJ collected from Inkerman contains the drains from the dryer and fugal, the most significant difference between the FMJ and SMJ is the latter is obtained by heating FMJ via primary heaters (76 °C). As the SMJ has been heated, some of the mesophilic microorganisms coming with FMJ could have be killed, and so most of the survived microorganisms in SMJ could be thermophilic microorganisms.
Table 1 Juice compositions of the FMJ and SMJ adopted in the laboratory degradation tests
Items Sucrose
(mg/mL) Glucose
(mg/mL) Fructose
(mg/mL) Mannitol
(mg/mL) 1-Kestose
(mg/mL)
Total
Organic acids
(mg/kg·°Bx)
Total
Polysaccharides
(mg/kg·°Bx)
FMJ 146-192 1.3-3.9 1.3-4.0 0 0.2-2.3 12-15 25-65
SMJ 143-152 0.5-0.8 0.5-0.9 0 0.2-0.35 10-20 44-46
Figure 11 depicts the representative results from the FMJ degradation process of Inkerman Mill, the results of Farleigh mill is listed in Appendix Figure 23. The degradation of sucrose occurred quickly with FMJ within 2 h for all the three groups (control, P100 and P200). There was no significant variation between the three testing groups.

Final Report Project 2020/203
sugarresearch.com.au | 22
In general, with the three testing groups, sucrose concentration experienced a decreasing trend, while glucose, fructose, 1-kestose and mannitol, total organic acids and polysaccharides concentration experienced increasing trend, fructose content was slightly higher than glucose throughout the degradation process. The degradation rate of FMJ ranged from 80.1% to 96.8% in 48 hours (Figure 11 (a)), the high degradation rate could be due to the activities from both mesophilic and thermophilic microorganisms.
The polysaccharides concentration at the end of the degradation process was ~600 mg/kg·°Bx, which is higher than that at the beginning (~60 mg/kg·°Bx) (Figure 11 (f)). Microorganism metabolism also leads to the formation of organic acids. Lactic acid in raw juice has been a determinant for microbial activity and has been cited as a useful indicator for the process (Rein 2018). The total organic acids content at the end of the degradation process was ~30 mg/kg·°Bx, which is almost double of that at the beginning (~10 mg/kg·°Bx, Figure 11 (g)). The alcohols ethanol and methanol were also detected in the degraded juice as well. However, their concentrations fluctuated throughout the process, which could possibly be due to losses associated with the low boiling points of these alcohols. Overall, the total alcohol content experienced an increasing trend for all the tests (Figure 11 (h)).
When we compare the efficacy of the two types of biocides, P100 biocide was more effective than P200 and the control to reduce sucrose degradation rate in FMJ. Sucrose degradation was between 23% and 45% by dosing 7.5 ppm (on cane) of P100 biocide, while that for P200 (10 ppm based on cane) was between 66% and 93%. The results show that P100 is more effective in inhibiting the growth of microorganisms than P200.
The use of P100 not only gave a lower sucrose degradation rate, but also a lower concentration of metabolic products concentrations, especially those of 1-kestose, glucose and fructose as shown in Figure 11 (b), (c), (d). Mannitol and total organic acids contents of P100 group were slightly lower than both the control and P200 group. However, the P200 group gave a slightly lower content of polysaccharides than control and P100, this could possibly because P200 is more effective in inhibiting the polysaccharides secreting microbes.

Final Report Project 2020/203
sugarresearch.com.au | 23
Figure 11 (a) Sucrose, (b) 1-kestose, (c) glucose, (d) fructose, (e) mannitol, (f) total polysaccharides, (g) total organic acids and (h) total alcohol concentration variation in Inkerman first mixed juice (FMJ) throughout the 48-h laboratory
degradation test without the addition of biocide and with P100 and P200 biocide

Final Report Project 2020/203
sugarresearch.com.au | 24
Figure 12 depicts the representative results from ISIS Mill SMJ degradation process. The results of Milliaquin Mill gave similar results as those of ISIS and the results are presented in Appendix Figure 24. Sucrose degradation was observed in SMJ after 6 h, which is slower than that in FMJ. There was no significant difference within the first 6 h between the control and samples and those in which biocides were added.
In general, with the three groups (P100, P200 and control), sucrose concentration decreased, while fructose, 1-kestose and mannitol, total organic acids and polysaccharides concentration experienced increasing trend. Unexpectedly, glucose content decreased in the process, while the proportion of fructose was much higher than glucose. The reduction in the concentration of glucose is likely due it polymerising to polysaccharides. The degradation rate of SMJ was around 32% in 48 h (Figure 12 (a)), which is much lower than that of FMJ. The lower degradation rate of SMJ indicated a lower microorganism activity in SMJ, which further confirmed that the 76 °C heating process significantly reduced the microbial numbers in SMJ. The microorganisms that survived in SMJ could be thermophilic microbes.
The polysaccharides concentration at the end of the degradation process was ~1100 mg/kg·°Bx, which is much higher than that at the beginning (~40 mg/kg·°Bx) (Figure 12 (f)) and is almost double that in FMJ even the degradation rate in SMJ was lower than that in FMJ. The higher concentration of polysaccharides in degraded SMJ indicated that the thermophilic microorganisms survived in SMJ could be the main microbe species that secret polysaccharides.
The total organic acids content at the end of the process was ~30 mg/kg·°Bx, which is almost double of that at the beginning (Figure 12 (g)). Alcohol concentration in the degraded SMJ fluctuated throughout the process. Overall, the total alcohol content experienced an increasing trend as shown in Figure 12 (h).
When SMJ is used as the substrate, P200 biocide gave a better result in reducing sucrose degradation rate. This means P200 biocide could be more effective to inhibit the thermophilic microorganism growth in juice, particularly after 24 h. Sucrose degradation using this biocide was in the range 15.5% to 30.1%.
P200 biocide group not only gave a lower sucrose degradation rate, but also gave lower concentrations of metabolic products concentration, especially that of fructose and polysaccharides content as shown in Figure 12 (d) and (f). The use of P200 was also more effective than P100 or the control in inhibiting the levels of 1-kestose, mannitol and total organic acids in SMJ.
Based on the laboratory tests for the two types of biocides (P100 and P200), as there were no significant changes in the first few hours of the degradation process, so in the real production process, when processing under normal condition where no stoppage occurs, and the quality of the cane is good, the use of biocides may not be necessary. However, if there is a wet weather stop, or there is an unexpected stoppage, it is recommended to use P100 in milling train, and dose it as early as possible in the milling train (e.g., 1# Mill). P200 would be good for use SMJ.

Final Report Project 2020/203
sugarresearch.com.au | 25
Figure 12 (a) Sucrose, (b) 1-kestose, (c) glucose, (d) fructose, (e) mannitol, (f) total polysaccharides, (g) total organic acids, and (h) total alcohol concentration variation in Isis secondary mixed juice (SMJ) throughout the 48-h laboratory
degradation test with the addition of P100 and P200 biocide and without biocide

Final Report Project 2020/203
sugarresearch.com.au | 26
6.3.2 Factory trials at Millaquin sugar mill
The effectiveness of P100 and P200 biocides was compared in factory scale at Millaquin sugar mill. The trials were implemented by a 5-week test with dosing P100 biocide followed by a 5-week test dosing with P200 biocide. #1 Mill juice, SMJ and ESJ were collected for the analysis to identify the differences between each of the test situation. Sugars (sucrose, glucose, fructose), 1-kestose, mannitol were analysed for all the samples. Additionally, the total organic acids and polysaccharides content in SMJ were analysed as well. Mannitol has been reported as a good indicator of sucrose degradation in sugarcane juice. However, from the laboratory studies (see previous section) on juice degradation, mannitol was detected only during long storage time. In this factory trials, mannitol was not detected in all the juices, which means mannitol concentration was very low and out of the detection limit, indicating there is no significant microbial degradation occurred in the juices during the testing periods.
Table 2 and Figure 13 (a), (b) and (c) depicts the sugars (sucrose, glucose, fructose and 1-kestose) results of #1 Mill juice, SMJ and ESJ respectively, the average sucrose concentration in #1 Mill juice, SMJ and ESJ during P100 and P200 testing period were 196.7 and189.3 mg/mL, 145.9 and135.7 mg/mL, and 122.0 and 129.6 mg/mL, respectively. The variation between each sample from a juice type could be different incoming cane juice composition. The continuous changes of the incoming cane quality make it difficult to judge the performance of the biocides based on the variation of sucrose content. However, from Table 2 the average concentrations for 1-kestose, glucose and fructose are generally higher with P100.
Table 2 Concentrations of 1-kestose, glucose and fructose in #1 Mill juice, SMJ and ESJ during P100 followed by P200 testing period at Millaquin Mill
Items 1-kestose (mg/mL)
Glucose (mg/mL)
Fructose (mg/mL)
Biocide P100 P200 P100 P200 P100 P200
#1 Mill juice
1.91 1.31 5.91 5.12 3.19 0.76 2.34 0.90 5.24 3.50 2.38 1.50 1.50 2.87 4.06 9.63 1.90 4.68 0.95 1.19 3.93 4.39 1.27 1.52 1.75 1.41 5.24 3.24 1.63 1.42 2.78 2.58 4.84 5.24 1.35 3.44 3.67 1.31 7.38 4.04 2.67 1.58 1.35 1.41 4.06 4.07 1.37 1.25 4.68 1.02 6.73 4.71 2.15 2.73
Average 2.33 1.56 5.27 4.88 1.99 2.10
SMJ
0.61 0.34 2.70 2.87 0.86 0.50 0.44 0.35 3.78 2.42 0.82 0.42 0.57 0.33 3.18 2.32 0.62 0.53 0.42 0.45 2.97 2.74 0.86 0.55 0.45 0.46 2.47 2.55 0.51 0.53 0.52 0.56 2.53 2.59 0.82 0.50 2.28 0.33 7.29 2.53 3.86 0.50 0.51 0.35 2.99 2.76 0.82 0.57 0.45 0.29 2.46 2.39 0.42 0.52 1.68 0.33 4.83 2.74 1.11 0.49 0.41 0.44 2.10 2.974 0.55 0.82 1.96 0.45 4.49 2.82 1.58 0.85 0.84 0.36 3.12 2.05 0.63 0.67
Average 0.86 0.39 3.45 2.60 1.04 0.57
ESJ
0.31 0.20 2.79 2.72 1.42 0.55 0.18 0.22 1.71 2.64 0.34 0.55 0.21 0.18 2.56 2.18 0.94 0.33 0.33 0.20 2.32 2.43 0.78 0.44 0.29 0.25 2.70 2.76 0.45 0.52 0.16 0.13 2.33 2.10 0.48 0.36 0.39 0.16 2.78 2.67 0.91 0.39 0.15 0.22 2.39 2.49 0.54 0.54 0.20 0.20 1.96 2.51 0.41 0.48 0.22 0.30 2.06 3.05 0.46 0.53 0.23 0.24 2.17 2.63 0.39 0.45
Average 0.24 0.21 2.34 2.56 0.65 0.47
Final Report Project 2020/203
sugarresearch.com.au | 27
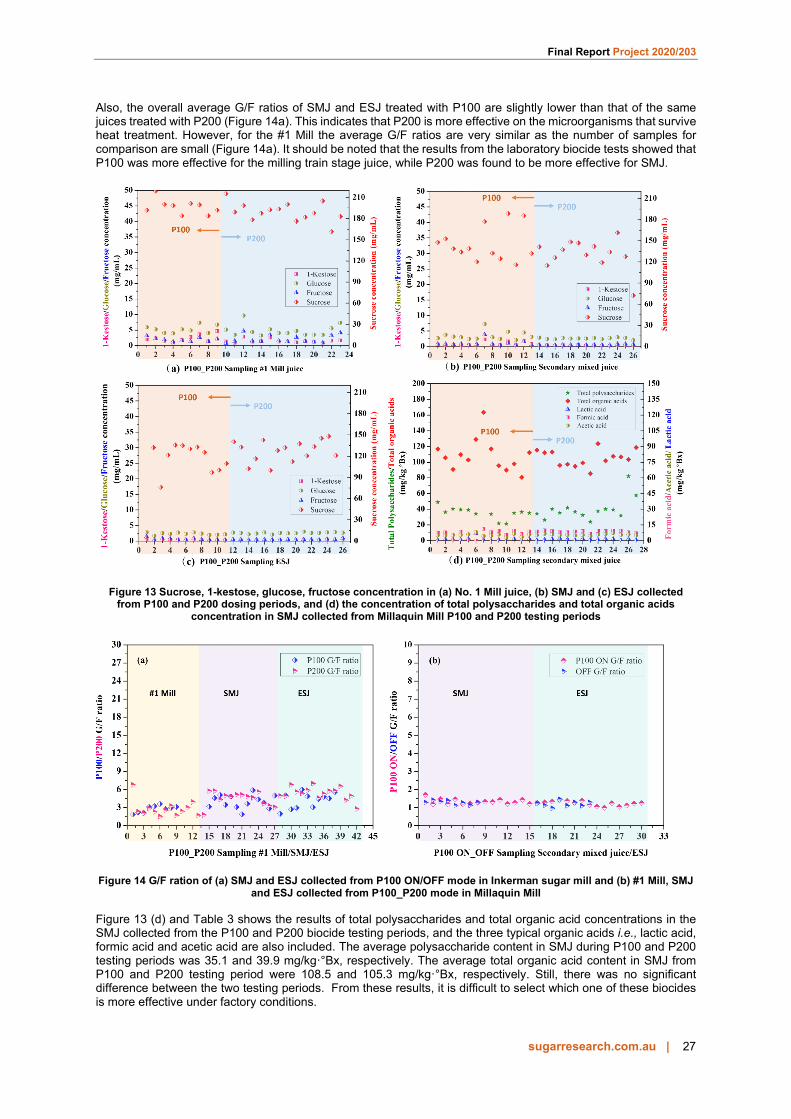
Also, the overall average G/F ratios of SMJ and ESJ treated with P100 are slightly lower than that of the same juices treated with P200 (Figure 14a). This indicates that P200 is more effective on the microorganisms that survive heat treatment. However, for the #1 Mill the average G/F ratios are very similar as the number of samples for comparison are small (Figure 14a). It should be noted that the results from the laboratory biocide tests showed that P100 was more effective for the milling train stage juice, while P200 was found to be more effective for SMJ.
Figure 13 Sucrose, 1-kestose, glucose, fructose concentration in (a) No. 1 Mill juice, (b) SMJ and (c) ESJ collected from P100 and P200 dosing periods, and (d) the concentration of total polysaccharides and total organic acids
concentration in SMJ collected from Millaquin Mill P100 and P200 testing periods
Figure 14 G/F ration of (a) SMJ and ESJ collected from P100 ON/OFF mode in Inkerman sugar mill and (b) #1 Mill, SMJ
and ESJ collected from P100_P200 mode in Millaquin Mill
Figure 13 (d) and Table 3 shows the results of total polysaccharides and total organic acid concentrations in the SMJ collected from the P100 and P200 biocide testing periods, and the three typical organic acids i.e., lactic acid, formic acid and acetic acid are also included. The average polysaccharide content in SMJ during P100 and P200 testing periods was 35.1 and 39.9 mg/kg·°Bx, respectively. The average total organic acid content in SMJ from P100 and P200 testing period were 108.5 and 105.3 mg/kg·°Bx, respectively. Still, there was no significant difference between the two testing periods. From these results, it is difficult to select which one of these biocides is more effective under factory conditions.

Final Report Project 2020/203
sugarresearch.com.au | 28
Table 3 Total polysaccharides, total organic acids and lactic acid content in SMJ collected during the P100 followed by P200 testing period at Millaquin Mill
Items Total Polysaccharides (mg/kg·°Bx)
Total Organic acids (mg/kg·°Bx)
Lactic acid (mg/kg·°Bx)
SMJ
P100 P200 P100 P200 P100 P200
48.87 34.24 116.75 115.41 0.62 0.40 36.16 26.32 105.65 111.99 1.45 0.92 40.22 35.33 90.59 95.90 1.14 2.22 39.48 41.83 109.62 97.41 0.94 1.27 39.14 36.75 102.88 94.61 1.88 0.50 34.14 32.33 128.99 98.99 -- 1.68
-- 23.93 163.49 85.24 0.81 1.08 33.71 37.30 116.87 123.68 0.08 1.08 21.83 40.13 95.38 101.84 0.84 1.58 21.39 39.29 89.83 107.49 0 1.63 35.08 31.96 97.85 106.72 1.67 0.24 36.50 81.96 80.57 103.39 0 1.58 35.11 57.49 112.23 118.75 1.79 0.62
Average 35.14 39.91 108.52 104.72 0.94 1.14
6.3.3. Factory trials at Inkerman sugar mill
The factory trials at Inkerman were to identify whether it is useful to use biocide in the sugar factory, the P100 biocide ON and OFF modes were used. The 2-week ON and OFF modes were implemented and samples of SMJ and ESJ were collected for at least 2-5 days taken the unexpected stoppages into consideration. In the 2020 crushing season, 5 periods with 3 “ON” periods and 2 “OFF” periods were performed.
Sugars (sucrose, glucose, fructose and 1-kestose) and mannitol contents were analysed for all the juice collected. Mannitol was not detected in the juice samples. This means that there was no significant juice degradation occurred during the testing periods. Figures15 (a) and (b) and Table show the results of sugars (sucrose, glucose and fructose) and 1-kestose content in SMJ and ESJ collected during the testing periods, respectively. The first two testing periods were P100 “ON” mode, the sample collecting process was disrupted by an unexpected stoppage, so the sample collection was only last for two days. Similar condition happened with the third “ON” mode. The average sucrose concentration in SMJ of the 6 testing periods of 1st ON, 2nd ON, 1st OFF, 3rd ON, 2nd OFF, 4th ON are 126.3, 133.3, 121.9, 117.9, 132.0, 128.6 mg/mL, respectively (Figure 15 a). Glucose concentrations following similar testing periods are 2.1, 2.0, 2.4, 2.6, 2.7 and 2.9, respectively, fructose concentrations were 1.5, 2.0, 1.78, 1.9, 2.3 and 2.3 mg/mL, respectively, The G/F ratio of the juices collected from the P100 “ON” and “OFF” testing period are shown in Figure 14(b), for both SMJ and ESJ. There are no obvious differences between with and without use of the biocide. Also, the average 1-kestose concentrations were similar between the ON and OFF mode.
Figure 15 Sucrose, 1-kestose, glucose, fructose concentration in (a) SMJ and (b) ESJ collected from Millaquin Mill P100 and P200 testing periods
Table 4 (and Figure 16) presents the results of the non-sucrose impurities. The overall average concentrations of polysaccharides and total organic acids are 35-51 mg/kg·°Bx and 97-116 mg/kg·°Bx respectively. However, total

Final Report Project 2020/203
sugarresearch.com.au | 29
organic acids content experienced a slight decreasing trend in the 1st, 2nd, 3rd and 5th P100 “ON” testing periods, so also a decreasing trend for total polysaccharides in the 2nd 3rd and 5th P100 “ON” testing periods. However, when P100 is not used both total polysaccharides and total organic show an increasing trend. As reported in the laboratory degradation tests, the total organic acid content increased with time during the degradation process, so a higher concentration of total organic acid is related to microbial activities.
From these results it is concluded that P100 reduced microbial degradation of the juice at Inkerman mill.
Table 4 Concentrations of the non-sucrose impurities (that might arise from the juice microbial degradation process) in SMJ and ESJ during P100 ON/OFF testing period at Inkerman Mill
Items
Testing
sequence 1-kestose (mg/mL)
Glucose (mg/mL)
Fructose (mg/mL)
Total polysacchar
ides (mg/kg·°Bx)
Total organic
acids (mg/kg·°Bx)
Lactic acid (mg/kg·°Bx)
SMJ ESJ SMJ ESJ SMJ ESJ SMJ SMJ SMJ
P100 ON
1st P100 ON test
0.39 0.30 2.65 2.88 1.55 2.28 35.66 118.74 5.55 0.22 0.29 1.64 2.15 1.37 1.67 32.90 110.47 2.29 0.04 0.21 2.42 2.53 1.65 1.89 44.58 84.07 1.39 0.23 0.28 1.91 2.71 1.60 1.88 30.86 105.33 1.71 0.30 0.28 2.33 2.69 1.59 1.96 45.84 100.02 2.48 0.28 0.25 1.69 2.04 1.41 1.61 48.46 99.30 2.12
2nd P100 ON test
0.25 0.28 1.86 2.64 1.52 1.90 40.92 112.86 2.40 0.17 0.26 2.13 2.51 1.66 2.20 34.80 82.62 1.65
3rd P100 ON test
0.30 0.30 2.50 2.51 1.88 2.37 87.81 109.84 4.98 0.31 0.27 2.54 2.22 1.92 2.24 70.55 116.53 4.24 0.39 0.41 2.86 2.93 1.99 2.35 62.41 93.53 2.91
4th P100 ON test
0.48 0.34 3.87 2.90 3.19 2.79 28.32 107.96 2.36 0.24 0.35 1.91 2.94 1.50 2.61 48.30 147.06 3.83 0.43 0.29 3.55 2.83 2.48 2.32 42.62 111.15 3.77 0.29 0.35 2.37 2.92 1.97 2.33 38.60 85.03 2.43
Average 0.29 0.30 2.42 2.63 1.82 2.16 41.66 105.63 2.94
P100 OFF
1st P100 OFF test
0.32 0.36 2.48 2.95 1.93 2.40 38.91 89.99 2.78 0.35 0.37 2.40 3.04 1.69 2.70 54.74 117.44 1.97 0.29 0.26 1.97 1.94 1.48 2.02 54.13 133.95 1.37 0.36 0.33 2.71 2.81 1.96 1.93 55.65 118.67 2.32
2nd P100 OFF test
0.48 0.32 2.37 2.54 3.19 2.31 96.97 82.32 4.08 0.24 0.38 2.99 3.01 1.50 2.33 88.66 111.07 4.90 0.43 0.41 3.00 3.23 2.48 2.94 67.75 136.10 3.62 0.29 0.43 2.57 3.29 1.97 2.53 49.12 109.92 2.52
Average 0.35 0.36 2.56 2.85 2.03 2.39 42.99 112.43 2.94

Final Report Project 2020/203
sugarresearch.com.au | 30
Figure 16 The concentration of total polysaccharides and total organic acids concentration in SMJ collected from Inkerman Mill P100 ON/OFF dosing periods
6.3.4. Economic analysis of the biocide usage
From the present work, it was difficult to predict the reduction of sucrose loss by using biocides. More extensive work is required to get a quantifiable value. Our previous work "Assessment of microbial degradation in factory mixed juice and filtrate" did show that microbial activity on Australian juices, and there was sucrose loss in a residence time of 1 h.
If it is established in future work that the sucrose loss could be reduced to ~0.0375 % and 0,07 % for P100 and P200 respectively, and without considering the drop in molasses yield, then the increased sugar yield will cover the cost of the biocides (Table 5). The assumptions used were:
• A factory with a crushing capacity of 500 t/h;
• Sugar price of 400 $/d, and the sugar produced each day is worth $60,000;
• 2020 price of biocide – P100 is ~225 $/d. P200 is 420 $/d

Final Report Project 2020/203
sugarresearch.com.au | 31
Table 5 Economic assessment on the use of biocides
Items P100 P200
Biocide price ($/kg) 2.5 3.5
Biocide dosage rate (ppm on cane) 7.5 10.0
Sugarcane crushing rate (ton/h) 500 500
Biocide dosing rate (L/h) 3.75 5
Biocide cost ($/day) 225 420
Assumed sugar yield (t sugar/t cane) 0.125 0.125
Sugar produced (t/day) 1500 1500
Sugar price ($/t) 400 400
Sugar value ($) 60,0000 60,0000
Biocide cost over sugar value 0.0375% 0.07%
7. CONCLUSIONS
7.1 Analytical method
Two HPLC methods have been developed to analyse sugars (sucrose, glucose, and fructose) and the microbial degradation products of mannitol and 1-kestose in a single run. Multiple runs are required if established methods are used to determine the concentrations of these compounds.
7.2 Factory hygiene audit
Processing factory last cane and hosing do increase the microbial loadings in juice. It is recommended to reduce spills in order minimise the need for hosing. If there is a spill, hosing should be carried out as quickly as possible. The hygiene audits conducted at Inkerman, Millaquin, Fairleigh and Isis mills, have identified the various milling equipment where juice leakages occur and locations to watch for microbial infestations.
7.3 Biocide laboratory tests
P100 biocide is more effective to reduce the sucrose degradation rate arising from mesophilic microorganisms. It could be more effective if applied to the milling train stage. P200 is more effective to reduce the sucrose degradation rate arising from thermophilic microorganisms, and so could be applied to secondary mixed juice.
When processing under normal condition where no stoppage occurs and the quality of the cane is good, the use of biocides may not be necessary. However, if there is a wet weather stop, or there is an unexpected stoppage, it would be good to use P100 in the milling train, and dose it as early as possible in the milling train (e.g., 1# Mill). P200 is preferred for SMJ.
7.4 Biocide factory tests
There was no detectable sucrose loss and no detectable amount of mannitol was obtained in the presence and absence of a biocide. The usage of P100 biocide could be used to reduce the non-sucrose impurities of polysaccharides and organic acids., as these are related to microbial activities.
8. RECOMMENDATIONS FOR FURTHER RD&A
In this project, the preliminary data has indicated benefits in using biocides in Australian sugar mills. Recommendation for the future RD&A are as follows:
(1) Conduct on-site small-scale degradation tests with the fresh juice taken from the processing line at 1 h intervals 24 h with juices from similar rakes.
(2) Undertake extended factory trials with biocides in the “ON” and “OFF” modes in at least two different factories. (3) Test different types of biocides obtained from different suppliers. (4) Estimate undetermined sucrose losses in a factory with and without biocides through extensive factory trials.

Final Report Project 2020/203
sugarresearch.com.au | 32
9. PUBLICATIONS
A paper titled “Increased sucrose recovery through improved mill sanitation and biocide application” is being prepared for presentation at the 2022 ASSCT Conference.
Results and application into the industry have also been presented to mill staff in all the cane growing regions in the Research Seminar series conducted in March 2021.
10. ACKNOWLEDGEMENTS
The authors appreciate the assistance provided by the staff at Millaquin, Inkerman, Isis and Farleigh Mills. MIllaquin mill staff is thanked for their assistance in coordinating the factory trials at Millaquin Mill. Mr David Marino and Mr Charlie Teakle are thanked for their assistance in coordinating the factory trials at Inkerman Mill.
Sugar Research Australia (SRA) is thanked for funding the investigations as part of their Small Milling Research Project scheme.

Final Report Project 2020/203
sugarresearch.com.au | 33
11. REFERENCES
Eggleston G (2002) Deterioration of cane juice—sources and indicators. Food Chemistry 78: 95–103.
ICUMSA Method GS7/8/4-24 (2011) ‘Glucose, Fructose and Sucrose in Cane Juices, Syrups and Molasses and of Sucrose in Beet Molasses by HPIC’
ICUMSA GS8-26 (2013) The Determination of Mannitol – Official and, Glucose, Fructose, Sucrose and Raffinose – Tentative in Beet Brei and Beet Juices by HPAEC-PAD.
Jones B, Joyce J, Shipton W, Rodman D (1997) ATP as an indicator of microbial contamination in crushing juices. Proceedings of Australian Society of Sugar Cane Technologists 19: 396–401.
Lionnet GRE, Pillay JV (1987) Ethanol as an indicator of burn to crush delay. Proceedings of the South African Sugar Technologists' Association 1987: 5–7.
Papageorgiou, J.H. and Edye, L.A. (1997) An investigation of the oligosaccharide impurities at MSCA Mills, August 1997, Confidential Technical Report.
Rein P (2018) Comparison of Sugar Losses in Milling and Diffusion. 2018 ISSCT Factory Workshop.
Shi, C., Rackemann, D., Bakir, H. and Doherty, W., 2020. Assessment of microbial degradation in factory mixed juice and filtrate. Proceedings of the 42nd Australian Society of Sugar Cane Technologists. Vol. 42., pp.307-314.
Tilbury RH, Hollingsworth BS, Graham SD, Pottage P (1977) Mill sanitation: a fresh approach to biocide evaluation. Proceedings of the International Society of Sugar Cane Technologists 16: 2749–2768.

Final Report Project 2020/203
sugarresearch.com.au | 34
12. APPENDIX
12.1 Appendix 1 METADATA DISCLOSURE
Table 5 Metadata disclosure 1
Data All files located in single folder 4421
Stored Location QUT server for CAB (Centre for agriculture and the Bioeconomy). SRI/Projects/4421
Access
Access restricted to SRI staff in CAB
Contact
William Doherty/Changrong Shi

Final Report Project 2020/203
sugarresearch.com.au | 35
12.2 Appendix 2 PROJECT DATA
Figure 17 (1) 1-kestose, (2) glucose, (3) fructose and (4) mannitol content in 0 h and 24 h degraded Farleigh #1 Mill juice
Figure 18 (1) 1-kestose, (2) glucose, (3) fructose and (4) mannitol content in 0 h and 24 h degraded ISIS #1 Mill juice

Final Report Project 2020/203
sugarresearch.com.au | 36
Figure 19 (1) 1-kestose, (2) glucose, (3) fructose and (4) mannitol content in 0 h and 24 h degraded Millaquin #1 Mill juice
Figure 20 (1) 1-kestose, (2) glucose, (3) fructose and (4) mannitol content in 0 h and 24 h degraded Farleigh FMJ

Final Report Project 2020/203
sugarresearch.com.au | 37
Figure 21 (1) 1-kestose, (2) glucose, (3) fructose and (4) mannitol content in 0 h and 24 h degraded Inkerman FMJ
Figure 22 (1) 1-kestose, (2) glucose, (3) fructose and (4) mannitol content in 0 h and 24 h degraded Isis FMJ

Final Report Project 2020/203
sugarresearch.com.au | 38
Figure 23 (1) 1-kestose, (2) glucose, (3) fructose and (4) mannitol content in 0 h and 24 h degraded Millaquin FMJ

Final Report Project 2020/203
sugarresearch.com.au | 39
Figure 24 (a) Sucrose, (b) 1-kestose, (c) glucose, (d) fructose, (e) mannitol, (f) total polysaccharides, (g) total organic acids and (h) total alcohol concentration variation in Farleigh first mixed juice (FMJ) throughout the 48-h laboratory
degradation test without the addition of biocide and with P100 and P200 biocide

Final Report Project 2020/203
sugarresearch.com.au | 40
Figure 25 (a) Sucrose, (b) 1-kestose, (c) glucose, (d) fructose, (e) mannitol, (f) total polysaccharides, (g) total organic acids and (h) total alcohol concentration variation in Millaquin Secondary mixed juice (SMJ) throughout the 48-h laboratory
degradation test without the addition of biocide and with P100 and P200 biocide

Final Report Project 2020/203
sugarresearch.com.au | 41


