Embed Size (px)
Citation preview
FINANCE COMMITTEE AGENDA Monday September 21, 2020
At 6:00 PM
Solon Finance Committee
ROLL CALL APPROVAL OF MINUTES
Regular meeting of August 17, 2020
EXECUTIVE SESSION Adjourn to executive session for discussion of personnel matters related to the compensation of a public employee ITEMS REQUIRING LEGISLATION
1. Authorizing the Finance Director to advertise a bid for audio visual system upgrades for City Council chambers
2. Budget amendments to various operating and capital funds a. Grantwood Golf Course (Fund 550) – additional other expenditures b. General Capital Facility Improvement (Fund 435) – additional other expenditures c. Accumulated Sick Leave & Contingency (Fund 771) – additional personal services
3. Authorizing the payment of amounts due for which the Finance Director has issued Then and Now certificates
PRESENTATION TO COMMITTEE
2021 Budget Development and Capital Plan Preview – Matt Rubino, Director of Finance CORRESPONDENCE
Notification of Release of the City’s 2019 Financial Audit
FINANCE COMMITTEE AGENDA Monday September 21, 2020
At 6:00 PM
Solon Finance Committee
REPORTS TO COMMITTEE
Monthly Financial Summary – August 2020
Income Tax Update – September 2020
ADJOURNMENT
FINANCE COMMITTEE MEETING
August 17, 2020 – 6:00 PM
Present: Councilwoman Meany, Councilman Pelunis, Councilman Zelwin, Director Rubino,
Mayor Kraus, Director Gibbs, Chief Tonelli, Chief Vedder,
Councilman Zelwin presided
APPROVAL OF MINUTES
Motion by Councilwoman Meany, second by Councilman Pelunis to approve the minutes of
July 15, 2020 as submitted.
ROLL CALL: AYE: Meany, Pelunis, Zelwin
NAY: None
Motion Carried
ITEMS REQUIRING LEGISLATION
1. ACCEPTING THE PROPERTY TAX RATES AND AMOUNTS FOR TAX YEAR 2020 AS
DETERMINED BY THE CUYAHOGA COUNTY BUDGET COMMISSION AND AUTHORIZING
NECESSARY TAX LEVIES
Director Rubino explained that this is an annual administrative item. All taxing subdivisions
(cities, schools, counties, etc) have to submit their existing property tax rates to the County
via the County Budget Commission and it is due by mid September. Rates will not change.
Rates will still be 3.30 mils unvoted and .5 mil voted for the service and safety levy. For
2021 some of the 3.30 millage is being proposed to be moved to the General Fund to give it
a one time boost. 2 mills will be allocated to the General Fund, approximately double what
is normally done. This is being proposed because some of the other funds (debt service and
Police and Fire Pension) are currently showing a balance greater than what is necessary for
the next few years. Therefore, the movement of extra funds will be done as a one time only
activity to help cover 2021 expenses. The total unvoted is still 3.30 mils and the voted is
still 0.5 mils for an overall total of 3.80 mils. This is requested under emergency so the
budget resolution can be sent to the Commission in August.
Councilwoman Meany noted that the tax rates have been unchanged since 1996. Director
Rubino confirmed that is correct. He referred to Figure 2 to highlight that the City of Solon
portion of resident property tax is still very small at 3.2% of the whole property tax bill.
Councilwoman Meany motioned to prepare legislation accepting the tax year 2020 property
tax rates as determined by the county budget commission under emergency in order to
meet the imposed deadline for filing the rates with the county budget commission. Second
by Councilman Pelunis.
ROLL CALL: AYE: Meany, Pelunis, Zelwin
NAY: None
Motion Carried
Finance Committee Meeting
August 17, 2020
Page 2
2. AUTHORIZING THE FINANCE DIRECTOR TO REQUEST ADVANCE PAYMENTS FOR TAX
YEAR 2020 FROM THE CUYAHOGA COUNTY OFFICE OF THE FISCAL OFFICER
Director Rubino stated that this allows the County to advance property tax payments to the
City. This would be on the 3.80 mil total. Without the advances the City would only see two
payments a year, a first half distribution and a second half distribution. With legislative
approval the City can request to be part of the Advance Payment Program which provides
an increased number of payments in the first half of the year and getting an advance of the
full collection. A reconciliation is done at the end of the first half of the year. No additional
dollars are received but it helps to speed up the receipt of the funds and positively impacts
the City cash flow. This is an annual approval for the County Fiscal Office to enroll the City
of Solon in the Advanced Payment Program for property taxes.
Councilman Pelunis moved to have legislation prepared for Council to authorize the advance
payments for property tax on first reading and under emergency to ensure timely
submission to the County Budget Commission. Second by Councilwoman Meany.
ROLL CALL: AYE: Meany, Pelunis, Zelwin
NAY: None
Motion Carried
3. ACCEPTING A PROPOSAL FROM MIDWEST EMPLOYERS CASUALTY COMPANY FOR EXCESS
WORKERS’ COMPENSATION INSURANCE FOR PLAN YEARS 2020-2021
Director Rubino confirmed that the City is self insured for workers’ compensation and not
part of the retroactive plan where a city pays a premium based on history of claims. The
City pays its own claims and, just like the health care, there is also a stop loss policy of
Workers’ Compensation Excess Insurance Policy. The previously approved policy was a two
year policy. The City works with Excess Comp Specialists consulting firm to solicit proposals
from the market. They provided four options. Two from Midwest Employee Casualty
Company, which is the incumbent carrier, and two from Safety National Casualty Corp. In
the past the City has chosen a tier option. It is being recommended that the City stay with
Midwest Employee Casualty for the proposed tier option on a two year term. The terms are
the same as the previous policy. The retention per occurrence is $500,000 for any class of
employment, not just Police and Fire. The rate has increased 5% from the previous contract
due to changes in the market and uncertainty with the COVID pandemic. The estimated
annual premium is $107,000. That is based on total salary for the year so if salary levels
decrease then the premium would decrease. It is based on a rate of .282 per payroll. Over
the past five or six years the City has been averaging less than 1.5% growth in the policy
cost. This is a fairly low percentage increase compared to the rate of health care cost
increases.
Director Rubino stated this is requested on first reading, under emergency so the City can
have the policy continue without interruption.
Finance Committee Meeting
August 17, 2020
Page 3
Councilman Zelwin asked if this insurance was used over the past year. Director Rubino
stated the City came close to using it because there were a couple large claims.
Councilman Pelunis asked if the City is prepaying the second year with the first year.
Director Rubino confirmed the City will be paying $107,270 per year each year. Councilman
Pelunis asked if it is better to be locked in for the second year and Director Rubino stated he
prefers to have the certainty of the contract terms especially now when there is volatility in
insurance market options. Director Rubino said he is not happy with the 5% rate increase
but that is unavoidable at this time. It is still the best quote as compared with the other
prices received and there were three additional carriers that chose not to provide a quote,
he stated it may be because they did not feel they could be competitive.
Councilman Pelunis said that there has been a drop in workers’ compensation claims since
many more people are working remotely now or have had reduction in work hours. Would
this be a reason to consider a one year term instead of a two year contract.
Director Rubino said the claims for 2020 are less than 2019 but last year had extenuating
circumstances with a few large claims. More information would need to be gathered over the
next couple years to see if claims do decrease but for now he feels it is best to lock in a rate
for two years. Also, the locked in rate is consistent for the entire employee base.
Councilwoman Meany motioned to prepare legislation approving the two year policy renewal
for excess workers’ compensation insurance with Midwest Employers Casualty Company
under emergency in order to renew prior to the September 1, 2020 expiration date. Second
by Councilman Pelunis.
ROLL CALL: AYE: Meany, Pelunis, Zelwin
NAY: None
Motion Carried
4. AUTHORIZING THE EXTENSION OF A CONTRACT WITH VERIZON WIRELESS THROUGH
NASPO VALUEPOINT FOR WIRELESS SERVICES AND EQUIPMENT FOR VARIOUS CITY
DEPARTMENTS
Director Rubino explained that NASPO is a very large national cooperative that provides a
lot of national contractual services. The City renewed with them last year for the Verizon
services contract and has used them for approximately five years for this service. NASPO
was able to renew the Verizon contract for City services through 2024. He is recommending
that the City renew the contract and exercise the future option through 2024. This is a
citywide wireless services contract for cell phones, wireless devices and other services. The
prepared ordinance sets a not to exceed amount of $55,000 for the entire year. He is
requesting first reading, emergency approval for this which is the same contract, same
terms as currently existing.
Councilman Pelunis moved for passage under suspension for emergency to participate in the
new NASPO contract with the new expiration date. Second by Councilwoman Meany.
Finance Committee Meeting
August 17, 2020
Page 4
ROLL CALL: AYE: Meany, Pelunis, Zelwin
NAY: None
Motion Carried
5. AUTHORIZING A CONTRACT WITH KONICA MINOLTA BUSINESS SOLUTIONS USA, INC.
AND CERTIFYING EQUIVALENCY WITH THE STATE OF OHIO COOPERATIVE PURCHASING
PROGRAM FOR PRINT MANAGEMENT SERVICES FOR VARIOUS CITY DEPARTMENTS
Director Rubino stated this is a citywide contract for print services of the 28 copier/printing
devices. 12 new devices have been purchased since the signing of the last contract three
years ago with Konica Minolta. The City has paid for the 12 new devices so all 28
copier/printer units are now owned by the City. Konica Minolta is honoring the terms of the
State Cooperative contract. The same cost per copy rate will continue. The expected annual
expense is approximately $30,000. Once ERP and some other new systems are in place the
annual cost should decrease. He is requesting first reading under emergency.
Councilwoman Meany asked for confirmation of the $30,000 annual cost. Director Rubino
said there has been a savings due to the $2,100 per month lease payments which are now
complete. Councilwoman Meany asked what the maintenance schedule is for the units the
City now owns. Director Gibbs confirmed there is no automatic maintenance. Maintenance is
on an as needed basis and varies by department. Higher usage departments do require
more maintenance for their equipment. He confirmed all the equipment is currently in good
condition and confirmed that this is the most cost effective way to proceed.
Director Rubino mentioned that one other vendor was considered (Comdoc) but since all the
devices are Konica Minolta it was best to have them do the maintenance on their brand of
equipment.
Councilwoman Meany motioned to prepare legislation approving the proposal of Konica
Minolta Business Solutions USA, Inc. for print management services through a contract by
the State of Ohio and to do this on first reading and under emergency in order to continue
copy services without interruption. Second by Councilman Pelunis.
ROLL CALL: AYE: Meany, Pelunis, Zelwin
NAY: None
Motion Carried
6. AMENDMENTS TO THE GENERAL FUND AND OTHER FUND BUDGETS
A. FUND 100 – INCREASE IN SERVICE OTHER EXPENDITURES
B. FUND 267 – DECREASE IN OTHER EXPENDITURES
C. FUND 421 – INCREASE IN CAPITAL OUTLAY
Finance Committee Meeting
August 17, 2020
Page 5
Director Rubino referred to a memo from the Public Works Commissioner for a significant
repair to a City street sweeper. There is currently enough appropriation to cover the repair
but because the budget is tight for 2020, the recommendation is to increase the budget to
cover the cost of repair for the street sweeper. The cost to rent this equipment is
approximately $10,000 per month as stated in a document prepared by Director Drsek. This
equipment is not scheduled for replacement in the Capital Plan for at least two more years
so it is better to make the repair.
Item B is a compliance related budget amendment. The Home Days Fund is being reduced
by $100,000. Typically there would be revenue received to cover total fund the
appropriation but since the event did not take place the fund cannot have appropriation that
exceeds its revenue, as stated in the statutory budget requirement. The budget needs to be
reduced for 2020 and will then need to be discussed again in 2021.
Item C is a budget clean up item in the Service and Safety Capital Fund. This entailed two
costs. One for the replacement of the Police vehicle which cost slightly more than had
originally been budgeted. The second item is an electrician truck for the Service Department
that had started production in 2018 so this appropriation is to align with the already
approved project that Council has supported. The total amendment to the fund is $95,000.
Councilman Zelwin confirmed his support of repairing the street sweeper vehicle versus the
cost to rent the equipment.
Councilman Pelunis moved to have legislation prepared approving the proposed
amendments to the budget under emergency in order to fund the expenditures that have
occurred in 2020 and to comply with the State budgetary provision. Second by
Councilwoman Meany.
ROLL CALL: AYE: Meany, Pelunis, Zelwin
NAY: None
Motion Carried
PRESENTATION TO COMMITTEE
2020 Q2 BUDGET UPDATE – GENERAL FUND AND CAPITAL
Director Rubino used June year to date numbers in order to develop a projection. General Fund revenue is projected to be approximately 12.7% below the original revenue estimate. This was expected due to the economic slowdown from the pandemic. A plateau has been seen on the revenue loss which is a good indication. Stronger than expected withholding numbers have been seen under these circumstances which is a testament to the resilience of the City’s commercial tax base. There is an approximate $5.7 million revenue loss compared to where the city expectations were when the budget was developed. Operating expenditures as of now are approximately 5.9% less than 2019 due to a slowdown of activity for the city
Finance Committee Meeting
August 17, 2020
Page 6
and Operating Budgets were adjusted quickly to match the slowdown in operations. The projection is to finish approximately 3% under the revised budget in terms of operating expenditures but that will depend on any unexpected expenses due to harsh weather or other issues. The City is still on track to under spend the revised/reduced budget which speaks to the discipline of the department heads and staff. Operating results are indicating a drawdown of General Fund Reserves of $2.5 million. The original thought was this would be closer to $5 million so the revised proposed amount of $2.5 can be covered by the current fund balance. Approximately 47% of revenue loss was covered by budget reductions but with the revised amounts almost 50% will be covered with the budget reduction activities. The ending balance for the General Fund and the Budget Stabilization Fund should end the year at approximately $21.7 million which is 51% of General Fund expenditures which is still well above the 20-25% threshold that is optimal to maintain. Councilwoman Meany stated that the overtime numbers are 41.5% under the prior year which shows that departments are really taking this situation seriously. She recognized the department heads have been doing a tremendous job through all of this. Director Rubino confirmed that except for some facility closures there really has not been a slowdown or noticeable decrease in service levels to residents. Councilman Zelwin requested a look at the decreased costs associated with the slowdown of programing, not just the decrease revenue. Director Rubino stated that charges for services were down 47%, community life programming was down from 2019 approximately 46%. Community Center, Senior Center and Arts Center is still offering some programming but there is a significant decrease in revenue. Expenditures in those three departments are down in total of approximately 25%. There is a decrease in expenditures and slightly lower operating costs. On average, fee revenue covers approximately 60% of community life programming operating costs. That number excludes capital contribution. Therefore the decrease in operating costs are covering the total revenue loss. Councilman Pelunis asked if there should be additional cuts in the next month or two. Director Rubino stated no, he does not feel there is a need for any additional cuts. The withholding tax revenue, the city’s biggest source of revenue, is flat or slightly higher compared to 2019 and is showing continued stability. Withholding accounts for 80% of the total income tax revenue. The other revenue sources, specifically the non tax revenue sources, are down anywhere from the high teens to approximately 40 to 45% depending on what revenue source. It appears the bottom of the revenue loss for
Finance Committee Meeting
August 17, 2020
Page 7
2020 has been identified. Withholding will be monitored closely to be sure that no new trends appear indicating reduced employment. The summary of the second quarter results includes an estimate of where 2020 is predicted to be over the balance of the year. These numbers will also be used as the base starting point for the 2021 budgets. The numbers show that the City is trending under budget for operating expenses. There is still a possibility of additional state or federal aid. Changes in fiscal policy at the federal level, such as the PPP program and the pandemic enhanced unemployment benefits have statistically shown to have helped soften the impact of the recession. Research has shown that these policies have helped slow down the economic decline. Beyond that each city has its own composition of businesses and industry so each city has been affected differently. Solon has faired very well as compared to other local cities. Director Rubino provided a five year forecast and he will be updating it again before the September meeting. It is expected that the City will draw down the cash balance in 2020 and probably again into 2021 but it will be managed and done through a thoughtful and efficient plan. He is estimating somewhat of a recovery towards the end of 2021 and then a slow and weak or moderate type of recovery over the next four years. The cash balance is shown to decline but would run somewhat parallel to the 25% limit policy. This will all be reviewed and refined each year during the budgeting process. The numbers for expected revenue and anticipated expenses starts to even out by 2023 but the forecast still shows a structural imbalance in the General Fund, expenditures exceeding operating revenue for the near future. There may be ways to be more creative with operating budgets and continue to squeeze the operating lines down without reducing service levels. The greater economy will be watched in order to predict an impact on income tax revenue. The National League of Cities put out another report stating that the amount of revenue loss and economic decline with this pandemic was much faster than the last three recessions. Other cities are on the same path. The difference is that Solon has shown it is more resilient on the revenue side. This needs to be viewed as a two year exercise of how to get through 2020 and then how to carry that success into 2021 and keep operating expenses down at the 2019 levels of $39.5 to $40 million Councilman Zelwin stated that it is good to see where the City is now in the five year plan compared to where the City was at in March. It is good to see that the City hasn’t taken as big of a hit as predicted. He stated it will be interesting to see where the withholding number moves as the payroll protection programs expire. Mayor Kraus responded by saying that looking back five months ago the City acted very proactively and made smart decisions to cut some areas including the hiring freeze and the cancellation of most events and deferring many capital programs. He
Finance Committee Meeting
August 17, 2020
Page 8
is very thankful that the decisions were made and each department held to the task. The important factors included not having to make significant staff cuts and at the same time the City maintained high service levels. So now that 2020 was successfully mediated the challenge ahead is looking at 2021. Mayor Kraus stated that the City will need to continue to operate in this same fashion for the next budget cycle. The hiring freeze will remain, the programs will all be reviewed, the capital projects will need to be done on a reduced level and the City will need to continue to operate in this new normal for two years. Hopefully 2022 and 2023 will be on a steady slow increase but this is a two year project. The City needs to go into the 2021 budget with all of those details top of mind. After the first quarter of 2021 a review will be done to see what the status is and adjustments can be made if necessary. Councilwoman Meany stated that with the CARES Act she heard Lakewood received $1.9 million when Solon received $217,000. She asked why the large discrepancy. Director Rubino stated that the formula for the county local government fund distribution was used to develop a prorated distribution of the CARES Act. Communities with greater population would receive larger amounts. Director Rubino stated that the income tax collection update for August covered the July 15 filing date. The City saw a spike but it wasn’t as large as would typically be seen on a normal collection year as far as proportional size as compared to the year to date collection. A comparison of the 2020 filing date July 15 to the traditional April 15, 2019 date was included. For this review the withholding should not be included. Individual net profit shows a decline of approximately $1.4 million or 40% of expected revenue. RITA had sent information stating that this was to be expected. They stated to be expecting either a deferment by way of extension or the use of payment plans that push the revenue into future years. Back in April RITA warned to be prepared for a 10% drop in receipts. Solon did not see that happen and is projecting just under a 6% loss compared to the level expected. Withholding still continues to make up over 76% of the collection. Director Rubino looked at the top 25% net profit filers and it is a mix of good and bad. Some look better than expected and others are down from 2019 or filing extensions. It is very difficult to say how much the slow down is affecting Solon companies but he will continue to monitor.
2021 BUDGET DEVELOPMENT PREVIEW
Director Rubino provided a draft of the key dates for budget development. The timeline is similar to last year. The capital improvement requests have been received.
Finance Committee Meeting
August 17, 2020
Page 9
Some of the non critical general capital projects may need to be deferred. Infrastructure has a dedicated funding source. A preliminary overview of the capital requests and budget will be completed for the September meeting. Each department will begin reviewing the specific department information and the information should be completed in October. Operating costs will need to remain close to 2019 actual operating levels. Some gating systems may be put into place that would allow certain projects to move forward if financial parameters were met. If economic indicators look better than expected then additional projects would move forward. Programming will be of great interest to determine if activities move back closer to the past levels and the timing will be reviewed and will be reflected in the proposed operating budget. It may be best to provide a base budget and a modified forecast with criteria as to how some items may be restored even though they may not be included in the initial proposed budget. Quarterly reviews would then help drive these activities. Capital will see some deferred projects. More detailed parameters will be available in September. Councilwoman Meany stated that this is a tough process but the base budget is a good way to move forward. It is very important to make sure there are no new taxes placed on residents while maintaining the high level of services such as trash collection, street and building maintenance as well as training for police and fire departments. Councilwoman Meany referenced the light that was installed near Nestle and has noticed there is now only a small amount of traffic and if more companies move forward with larger numbers of employees working remotely there needs to be some thought as to the use of facilities within the city. Director Rubino stated that there was a law suit filed last month regarding companies deploying increased work remote strategies. Also, a State Senator did introduce legislation to unwind the law change that may impact the withholding regulations. There is also the question of how remote work policies will impact the larger employers in Solon. One of the largest employers is building a new world headquarters here in town but It is a topic that must remain top of mind. Non tax revenue sources will be reviewed to identify opportunities for revenue enhancement.
DISCUSSION
UPDATE ON THE SOLON ERP PROJECT
Director Rubino and Mayor Kraus have decided to pick up negotiations again with Tyler (the vendor). The project investment summary they provided will be reviewed again to see if there are places to retain the core functionality that the City needs to
Finance Committee Meeting
August 17, 2020
Page 10
make this a successful implementation and scale back some of the areas that can be deferred into a future year. The overall idea is to continue moving forward with ERP, get a contract approved and in place and move forward with the project at a level that will provide a significant amount of business process improvement. The hope is to have a project document and contract for Council to consider in late fall. Councilman Zelwin asked Director Rubino to provide the cost benefit analysis for this project as it requires a large investment during this financially challenged time.
REPORTS TO COMMITTEE
Procurement Updates Pursuant to Ordinance 2020-55
Director Rubino said there are three items highlighted and all were originally on the budget.
Income Tax Update – August 2020
Monthly Financial Summary – July 2020
ADJOURNMENT
Motion by Councilwoman Meany, second by Councilman Pelunis to adjourn the meeting at
7:02 PM
ROLL CALL: AYE: Meany, Pelunis, Zelwin
NAY: None
Motion Carried
__________________________________
K Nelson, Secretary
THE CITY OF SOLON
INFORMATION TECHNOLOGY DEPARTMENT
34200 BAINBRIDGE ROAD
SOLON, OH 44139-2955 PHONE:440.337.1320
To: Finance Committee Subj: Authorization to go out to Bid for Council Chambers broadcast redesign Finance Committee, As budgeted for 2020, I am requesting authorization to go out to bid for an upgrade to the Council Chambers video broadcast system. The system in place now is decades old and has only been upgraded in small pieces throughout the years. There is an extreme excess of equipment and complication in the existing setup that will be streamlined or removed as part of this process. Some of the goals of this project will be to provide better viewing screens for members at the dais, a more reliable video conferencing integration with zoom, and a simplified user interface in the control room that should allow us to go down to one operator per meeting. The City has already invested in the initial design work for the new system that we will use to go out to bid. This standardized design will get us the best pricing comparison between vendors in the event there are multiple bidders. The estimated cost for this project will be $125,000. Funding for the project is from the Cable Franchise Fee Fund (No. 209). I’m requesting authorization for the Director of Finance to advertise a bid for audio visual system upgrades for City Council chambers. Approval is requested on an emergency basis. Jim Gibbs Technology Director City of Solon
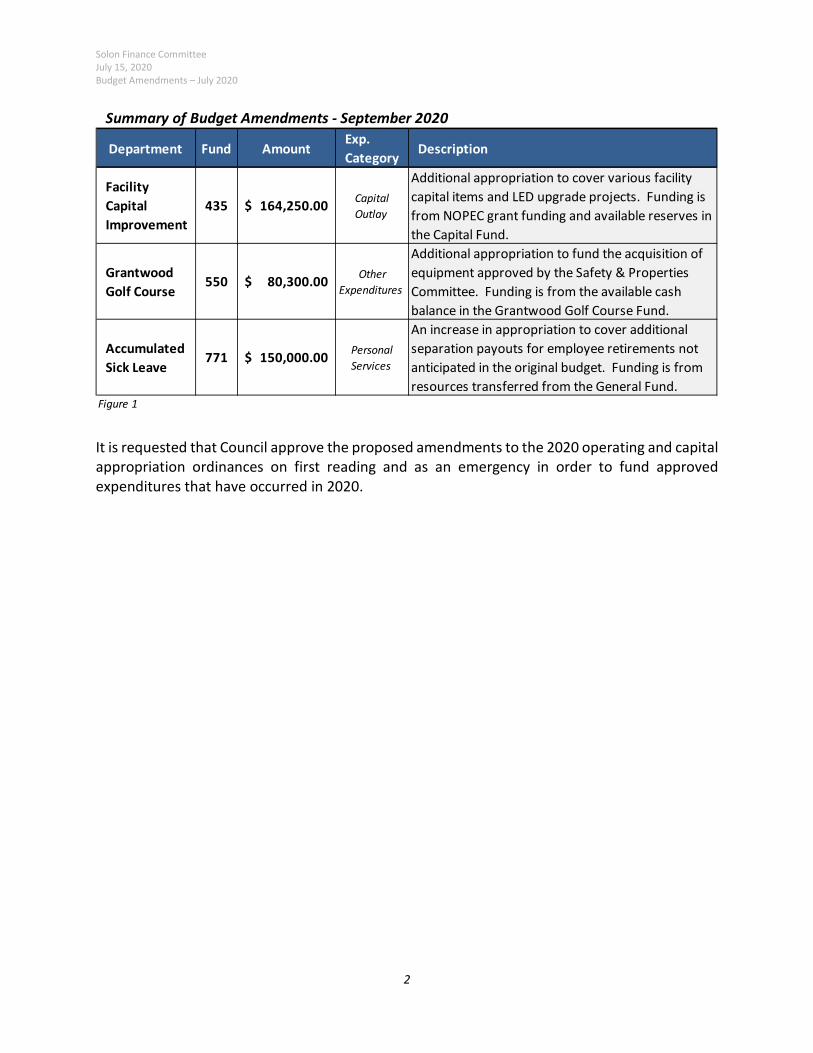
TO: Members of Council Finance Committee FROM: Matt Rubino, Director of Finance CC: Mayor Edward Kraus DATE: September 15, 2020 RE: Budget Amendment Requests – September 2020 As the City implements its yearly operating budget, certain items may require changes or corrections in order to provide adequate appropriations for all approved expenditures. Finance is requesting to amend the annual Operating Appropriations ordinance (2019-197) and to make an amendment to the annual Capital Appropriations ordinance (2019-196) in order to post approved expenditures within the appropriate budgets. An amendment of $164,250 is requested to fund approved facility improvement projects and to appropriate NOPEC Energized Community Grant (NEC) funding for various LED upgrade projects. Council approved the demolition of two City owned properties (2020-133) and a change order for the Bull Home Phase I project (2020-113). A $47,000 portion of the budget amendment is to fund these approved items. The remaining $117,250 of the budget amendment is requested to appropriate NEC grant dollars used to fund various LED upgrade projects at various City facilities. The two major projects that have been approved by Council include the interior lighting upgrades at the Community Center (2020-85) and new LED lighting at the City Hall roundabout (2020-132). An appropriation increase is requested for the Grantwood Golf Course Fund in the amount of $80,300. The budget amendment coincides with the acquisition of greens mowers that was approved by the Safety & Public Properties Committee at the September 9, 2020 meeting. The capital outlay will be funded with revenue received from greens fees and other user charges. An increase in appropriation is requested in the Accumulated Sick Leave & Contingency Fund in the amount of $150,000. The additional appropriation is requested to cover the full amount of separation payouts for employee retirements that have occurred through pay period 19 of this year. The current retirement payouts have exceeded the estimate that was used for the original 2020 budget. Funding for the payouts is from resources transferred from the General Fund. I am not requesting an additional transfer of General Fund resources to the Sick Leave Fund at this time and will reevaluate the need to move additional resources in the fourth quarter. A summary of the requested budget amendments is provided in Figure 1.
THE CITY OF SOLON FINANCE DEPARTMENT
34200 Bainbridge Road Solon, OH 44139-2955
Phone: (440) 349-6300 Fax: (440) 349-6320
Solon Finance Committee July 15, 2020 Budget Amendments – July 2020
2
It is requested that Council approve the proposed amendments to the 2020 operating and capital appropriation ordinances on first reading and as an emergency in order to fund approved expenditures that have occurred in 2020.
Summary of Budget Amendments - September 2020
Department Fund AmountExp. Category Description
Facility Capital Improvement
435 164,250.00$ Capital Outlay
Additional appropriation to cover various facility capital items and LED upgrade projects. Funding is from NOPEC grant funding and available reserves in the Capital Fund.
Grantwood Golf Course
550 80,300.00$ Other Expenditures
Additional appropriation to fund the acquisition of equipment approved by the Safety & Properties Committee. Funding is from the available cash balance in the Grantwood Golf Course Fund.
Accumulated Sick Leave
771 150,000.00$ Personal Services
An increase in appropriation to cover additional separation payouts for employee retirements not anticipated in the original budget. Funding is from resources transferred from the General Fund.
Figure 1
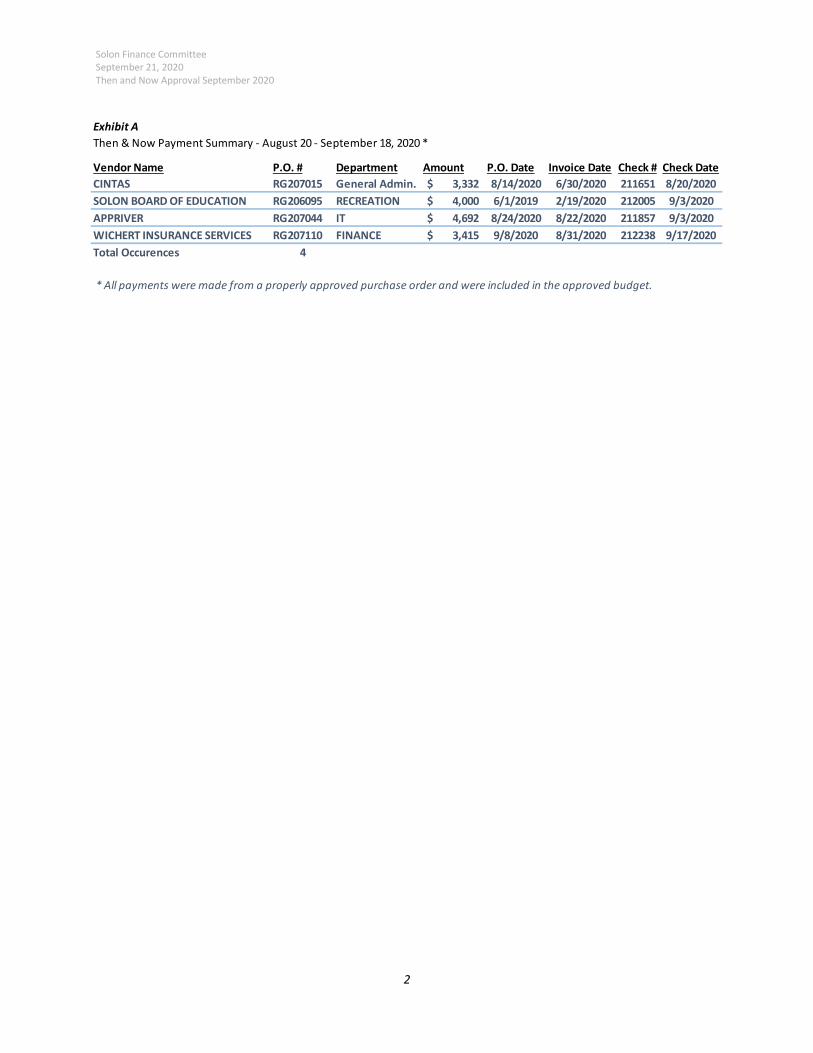
TO: Members of Council Finance Committee FROM: Matt Rubino, Director of Finance CC: Mayor Edward Kraus DATE: September 14, 2020 RE: Approval of Then and Now Certifications – September 2020 Ohio Revised Code Section 5705.41 (D) (1) requires that at the time of entering into a contract or obligation by a government, the fiscal officer must issue a certificate stating that the amount required to be paid under the contract has been lawfully appropriated. The provision is intended to make sure that there will be money to pay any financial obligation of the City. However, there can be several reasons that an order is made for a good or service before a purchase order has been entered into the City’s financial system (CMI). To address these practical considerations Revised Code permits a purchase to be made if the fiscal officer can certify that at the time the obligation was incurred (invoiced) and at the time of the execution of the certificate, sufficient funds were appropriated to pay the obligated amount. This allows the payment of an invoice even if there was no fiscal officer’s certificate at the time the government became obligated to pay for the goods or service. This exception only applies to obligations for $2,999 or less. If the obligation is for $3,000 or more, the legislative body of the government must approve the execution of the Then and Now Certificate and the expenditure. The Auditor of State has communicated set guidelines to maintain a process to identify occurrences and remain compliant with the Revised Code. The Finance Department has identified every purchase where the invoice date preceded the purchase order date. For all purchases of $2,999 or less a Then and Now Certificate has been executed by the Finance Director. An approval will be requested from Council for all Then and Now occurrences at or above $3,000. We have continued working with the departments to reduce the instances of commencing a purchase before creation of a purchase order. All payments were made from a purchase order. It is requested that Finance Committee request that Council adopt legislation approving Then and Now Certificates presented and be authorized on first reading and as an emergency for the transactions listed on Exhibit A and the payments be approved.
THE CITY OF SOLON FINANCE DEPARTMENT
34200 Bainbridge Road Solon, OH 44139-2955
Phone: (440) 349-6300 Fax: (440) 349-6320
Solon Finance Committee September 21, 2020 Then and Now Approval September 2020
2
Exhibit AThen & Now Payment Summary - August 20 - September 18, 2020 *
Vendor Name P.O. # Department Amount P.O. Date Invoice Date Check # Check DateCINTAS RG207015 General Admin. 3,332$ 8/14/2020 6/30/2020 211651 8/20/2020SOLON BOARD OF EDUCATION RG206095 RECREATION 4,000$ 6/1/2019 2/19/2020 212005 9/3/2020APPRIVER RG207044 IT 4,692$ 8/24/2020 8/22/2020 211857 9/3/2020WICHERT INSURANCE SERVICES RG207110 FINANCE 3,415$ 9/8/2020 8/31/2020 212238 9/17/2020Total Occurences 4
* All payments were made from a properly approved purchase order and were included in the approved budget.
TO: Members of Council Finance Committee
FROM: Matt Rubino, Director of Finance
CC: Mayor Edward Kraus
DATE: September 14, 2020
RE: 2021 Budget Development – Preliminary Review
I will be presenting an overview of the preliminary 2021 budget and development process at the September 21st Finance Committee meeting. The overview is intended to brief the Committee on the starting basis of the initial operating budget for 2021. I plan to include information on the following topics in the presentation to the Committee:
o 2020 Budget - Current Status
o 2021 Revenue Assumptions
o 2021 Operating Budget Parameters
o Preliminary Operating Status of General Fund
o Other Operating Funds
o Departmental Review and Requests
o Capital Improvement Plan Request Summary
Copies of the presentation will be provided at the meeting. I will be sure to allot adequate time during the presentation to field questions on the preliminary 2021 budget from the Committee.
THE CITY OF SOLON FINANCE DEPARTMENT
34200 Bainbridge Road Solon, OH 44139-2955
Phone: (440) 349-6300 Fax: (440) 349-6320
TO: Members of Council Finance Committee
FROM: Matt Rubino, Director of Finance
CC: Mayor Edward Kraus
DATE: September 14, 2020
RE: Release of the City’s 2019 Annual Financial Report by the Auditor of State
The Finance Department completed work on the audit of City finances for 2019 at the end of July. At that time the full audit report was submitted by our independent public audit (IPA) firm to the Auditor of State for review and subsequent release.
The 2019 audit report was released by the Auditor on September 7th and was about a month later than normal as a result of submission dates being delayed. The City again had a clean audit with no material findings. The City’s 2019 report qualified for the Auditor of State Award with Distinction for the sixth year in a row. An application was submitted to the Government Finance Officers Association for the Excellence in Financial Reporting award. The evaluation for the certification is still pending.
The 2019 audit is posted on the City website and I will be distributing bound copies of the 2019 report to all Council members later this month. I would encourage you to review the report at your convenience and contact me if you have any questions regarding the 2019 results.
THE CITY OF SOLON FINANCE DEPARTMENT
34200 Bainbridge Road Solon, OH 44139-2955
Phone: (440) 349-6300 Fax: (440) 349-6320
9/8/2020 Ohio Auditor of State - Auditor Faber Announces Qualifiers for Auditor of State Award with Distinction
https://ohioauditor.gov/news/PressReleases/Details/5548 1/3
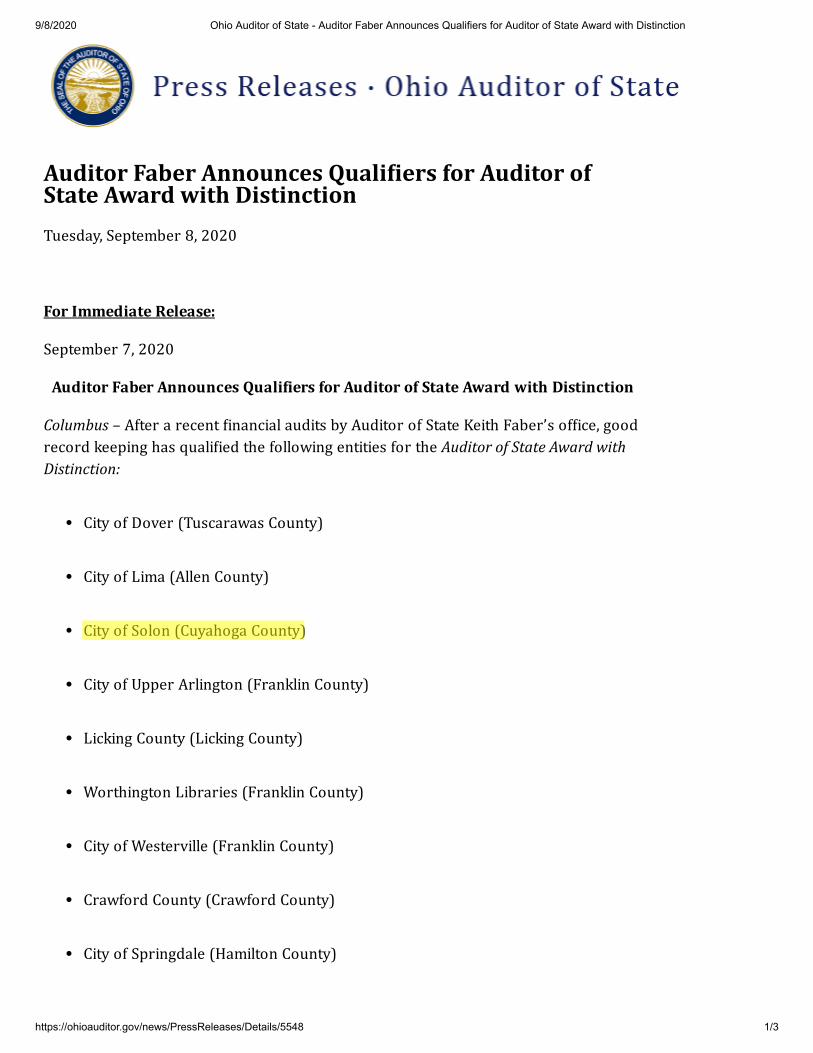
AuditorFaberAnnouncesQuali�iersforAuditorofStateAwardwithDistinctionTuesday,September8,2020
ForImmediateRelease:
September7,2020
AuditorFaberAnnouncesQuali�iersforAuditorofStateAwardwithDistinction
Columbus–Afterarecent�inancialauditsbyAuditorofStateKeithFaber’sof�ice,goodrecordkeepinghasquali�iedthefollowingentitiesfortheAuditorofStateAwardwithDistinction:
CityofDover(TuscarawasCounty)
CityofLima(AllenCounty)
CityofSolon(CuyahogaCounty)
CityofUpperArlington(FranklinCounty)
LickingCounty(LickingCounty)
WorthingtonLibraries(FranklinCounty)
CityofWesterville(FranklinCounty)
CrawfordCounty(CrawfordCounty)
CityofSpringdale(HamiltonCounty)
9/8/2020 Ohio Auditor of State - Auditor Faber Announces Qualifiers for Auditor of State Award with Distinction
https://ohioauditor.gov/news/PressReleases/Details/5548 2/3
CityofMiamisburg(MontgomeryCounty)
CityofSpringboro(WarrenCounty)
MontgomeryCounty(MontgomeryCounty)
RichlandCounty(RichlandCounty)
“ToearntheAwardwithDistinctiontakeshardworkandacommitted�iscalteam,”AuditorFabersaid.“Communitiesshouldbeproudthatstewardsoftaxdollarsputintheextraefforttomaintaincleanrecords.”
TheAuditor’sOf�icepresentstheAuditorofStateAwardwithDistinctiontolocalgovernmentsandschooldistrictsuponthecompletionofa�inancialaudit.Entitiesthatreceivetheawardmeetthefollowingcriteriaofa“clean”auditreport:
Theentitymust�ile�inancialreportswiththeAuditorofState’sof�icebythestatutoryduedate,withoutextension,viatheHinkleSystem,onaGAAPaccountingbasisandprepareaCAFR(ComprehensiveAnnualFinancialReport);Theauditreportdoesnotcontainany�indingsforrecovery,materialcitations,materialweaknesses,signi�icantde�iciencies,UniformGuidance(SingleAudit)�indingsorquestionedcosts;Theentity’smanagementlettercontainsnocommentsrelatedto:
EthicsreferralsQuestionedcostslessthanthethresholdpertheUniformGuidanceLackoftimelyreportsubmissionBankreconciliationissuesFailuretoobtainatimelySingleAuditinaccordancewithUniformGuidanceFindingsforrecoverylessthan$500Publicmeetingsorpublicrecordsissues
Theentityhasnoother�inancialorotherconcerns
Fullcopiesofthesereportsareavailableonline.
###
TheAuditorofState’sof�ice,oneof�iveindependentlyelectedstatewideof�icesinOhioisresponsibleforauditingmorethan6,000stateandlocalgovernmentagencies.UnderthedirectionofAuditorKeithFaber,theof�icealsoprovides�inancialservicestolocalgovernments,investigatesandpreventsfraudinpublicagencies,andpromotestransparencyingovernment.
THE CITY OF SOLON
FINANCE DEPARTMENT
34200 Bainbridge Road Solon, OH 44139-2955
Phone: (440) 349-6300 Fax: (440) 349-6320
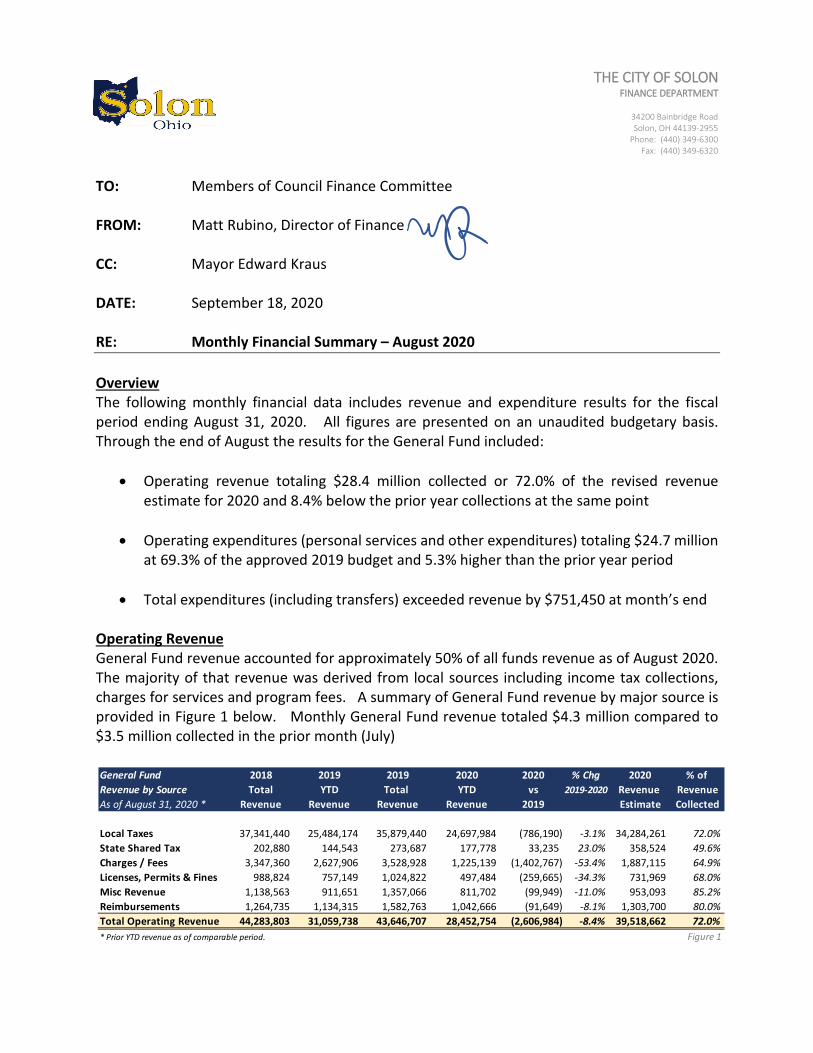
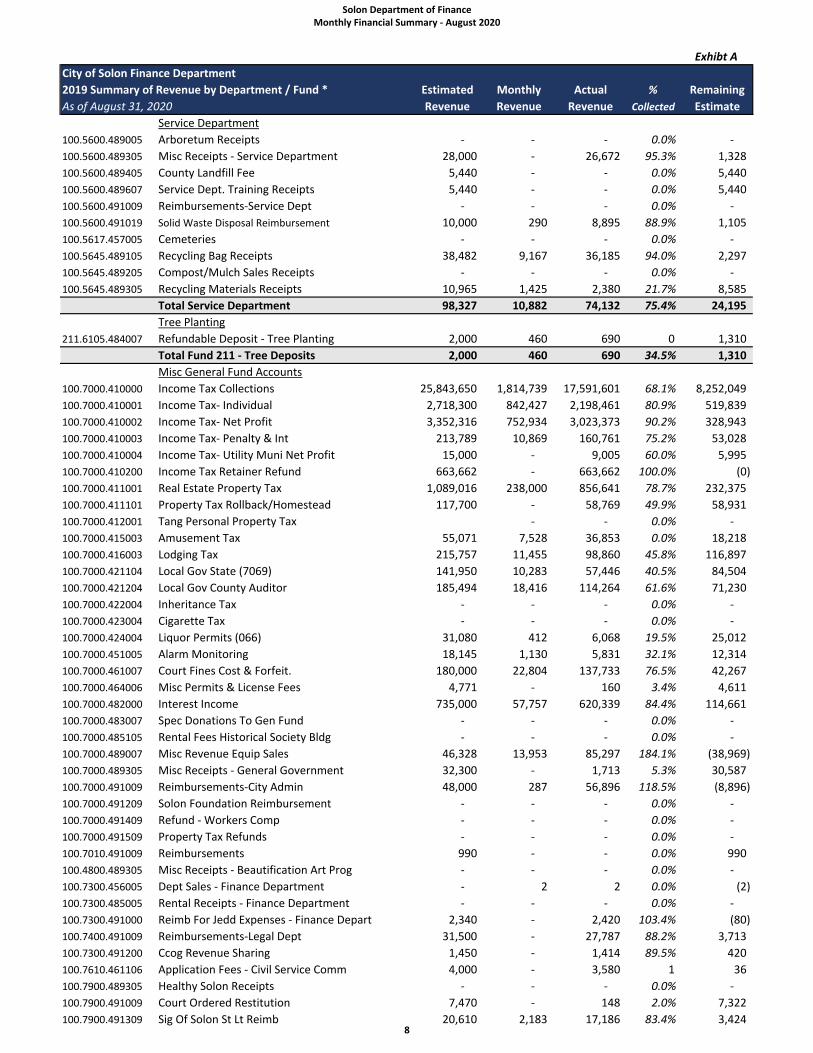
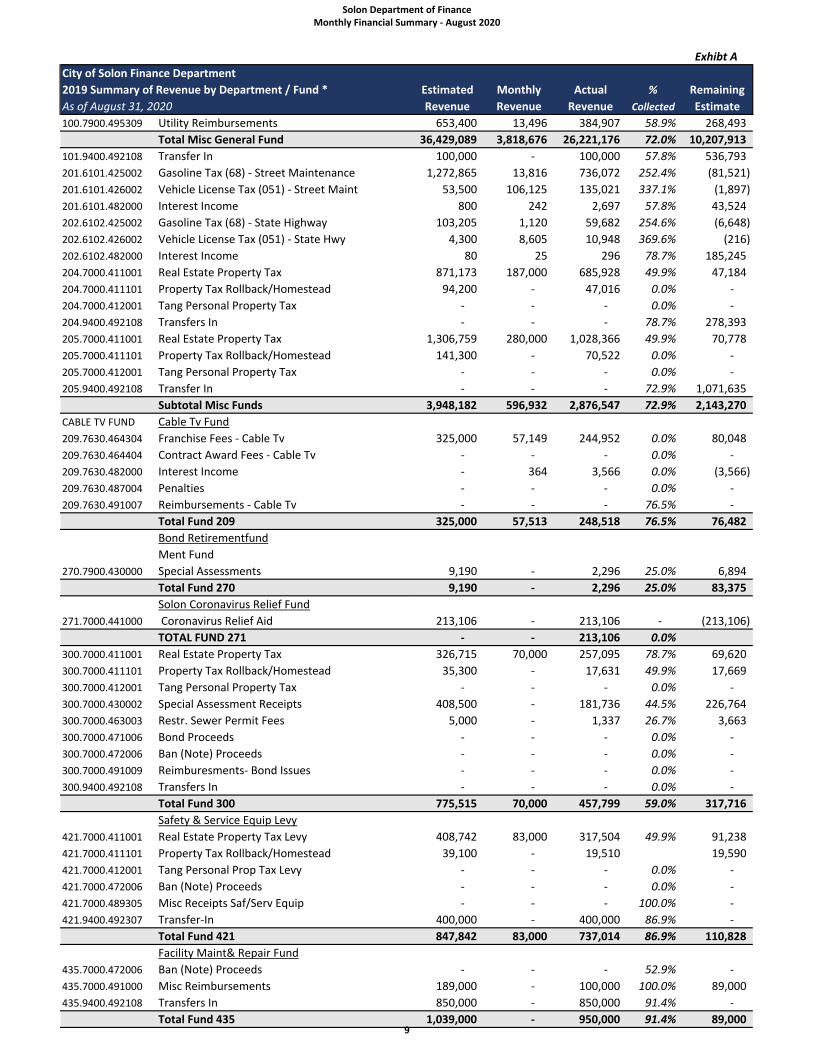
TO: Members of Council Finance Committee FROM: Matt Rubino, Director of Finance CC: Mayor Edward Kraus DATE: September 18, 2020 RE: Monthly Financial Summary – August 2020 Overview The following monthly financial data includes revenue and expenditure results for the fiscal period ending August 31, 2020. All figures are presented on an unaudited budgetary basis. Through the end of August the results for the General Fund included:
• Operating revenue totaling $28.4 million collected or 72.0% of the revised revenue estimate for 2020 and 8.4% below the prior year collections at the same point
• Operating expenditures (personal services and other expenditures) totaling $24.7 million
at 69.3% of the approved 2019 budget and 5.3% higher than the prior year period • Total expenditures (including transfers) exceeded revenue by $751,450 at month’s end
Operating Revenue General Fund revenue accounted for approximately 50% of all funds revenue as of August 2020. The majority of that revenue was derived from local sources including income tax collections, charges for services and program fees. A summary of General Fund revenue by major source is provided in Figure 1 below. Monthly General Fund revenue totaled $4.3 million compared to $3.5 million collected in the prior month (July)
General Fund 2018 2019 2019 2020 2020 % Chg 2020 % of Revenue by Source Total YTD Total YTD vs 2019-2020 Revenue RevenueAs of August 31, 2020 * Revenue Revenue Revenue Revenue 2019 Estimate Collected
Local Taxes 37,341,440 25,484,174 35,879,440 24,697,984 (786,190) -3.1% 34,284,261 72.0%State Shared Tax 202,880 144,543 273,687 177,778 33,235 23.0% 358,524 49.6%Charges / Fees 3,347,360 2,627,906 3,528,928 1,225,139 (1,402,767) -53.4% 1,887,115 64.9%Licenses, Permits & Fines 988,824 757,149 1,024,822 497,484 (259,665) -34.3% 731,969 68.0%Misc Revenue 1,138,563 911,651 1,357,066 811,702 (99,949) -11.0% 953,093 85.2%Reimbursements 1,264,735 1,134,315 1,582,763 1,042,666 (91,649) -8.1% 1,303,700 80.0%Total Operating Revenue 44,283,803 31,059,738 43,646,707 28,452,754 (2,606,984) -8.4% 39,518,662 72.0%* Prior YTD revenue as of comparable period. Figure 1
Solon Finance Committee September 21, 2021 Monthly Financial Summary – August 2020
2
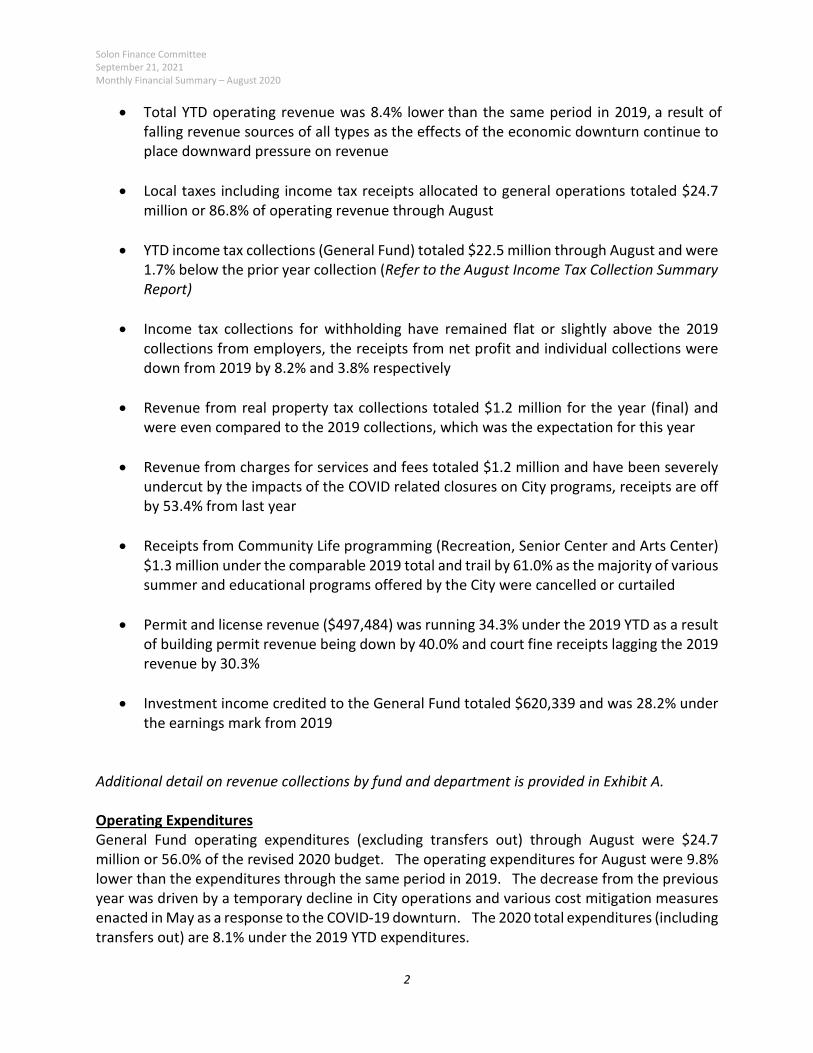
• Total YTD operating revenue was 8.4% lower than the same period in 2019, a result of falling revenue sources of all types as the effects of the economic downturn continue to place downward pressure on revenue
• Local taxes including income tax receipts allocated to general operations totaled $24.7million or 86.8% of operating revenue through August
• YTD income tax collections (General Fund) totaled $22.5 million through August and were1.7% below the prior year collection (Refer to the August Income Tax Collection SummaryReport)
• Income tax collections for withholding have remained flat or slightly above the 2019collections from employers, the receipts from net profit and individual collections weredown from 2019 by 8.2% and 3.8% respectively
• Revenue from real property tax collections totaled $1.2 million for the year (final) andwere even compared to the 2019 collections, which was the expectation for this year
• Revenue from charges for services and fees totaled $1.2 million and have been severelyundercut by the impacts of the COVID related closures on City programs, receipts are offby 53.4% from last year
• Receipts from Community Life programming (Recreation, Senior Center and Arts Center)$1.3 million under the comparable 2019 total and trail by 61.0% as the majority of varioussummer and educational programs offered by the City were cancelled or curtailed
• Permit and license revenue ($497,484) was running 34.3% under the 2019 YTD as a resultof building permit revenue being down by 40.0% and court fine receipts lagging the 2019revenue by 30.3%
• Investment income credited to the General Fund totaled $620,339 and was 28.2% underthe earnings mark from 2019
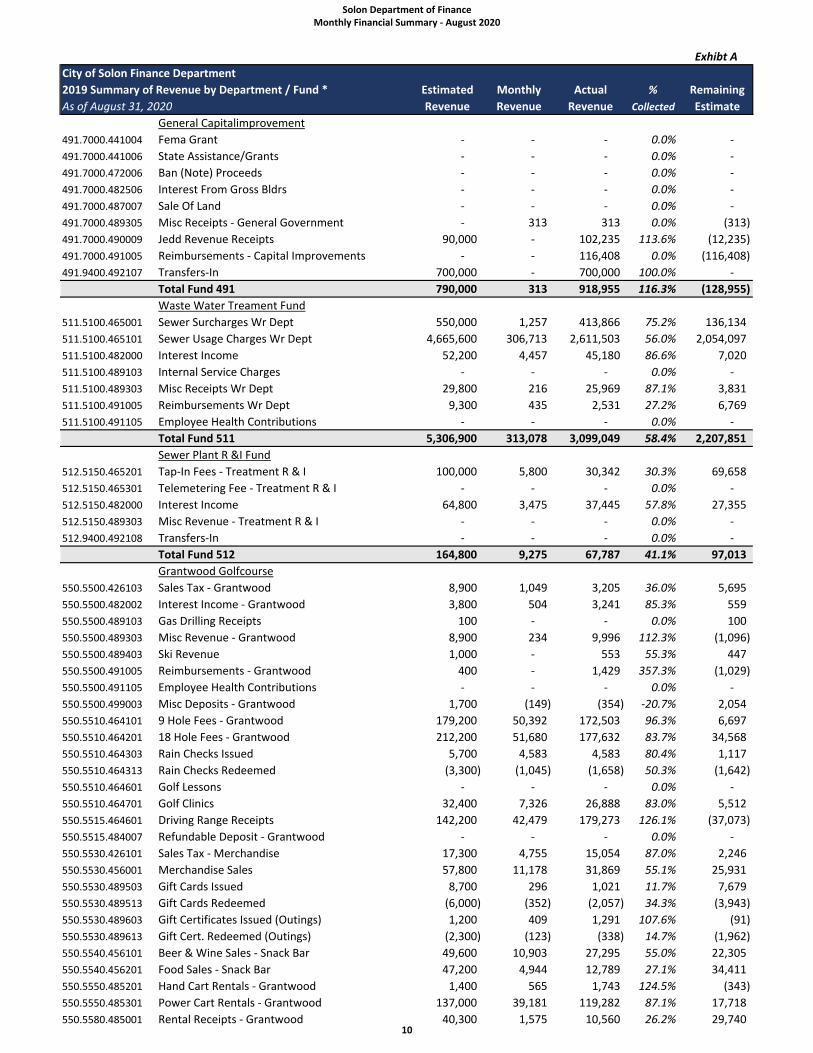
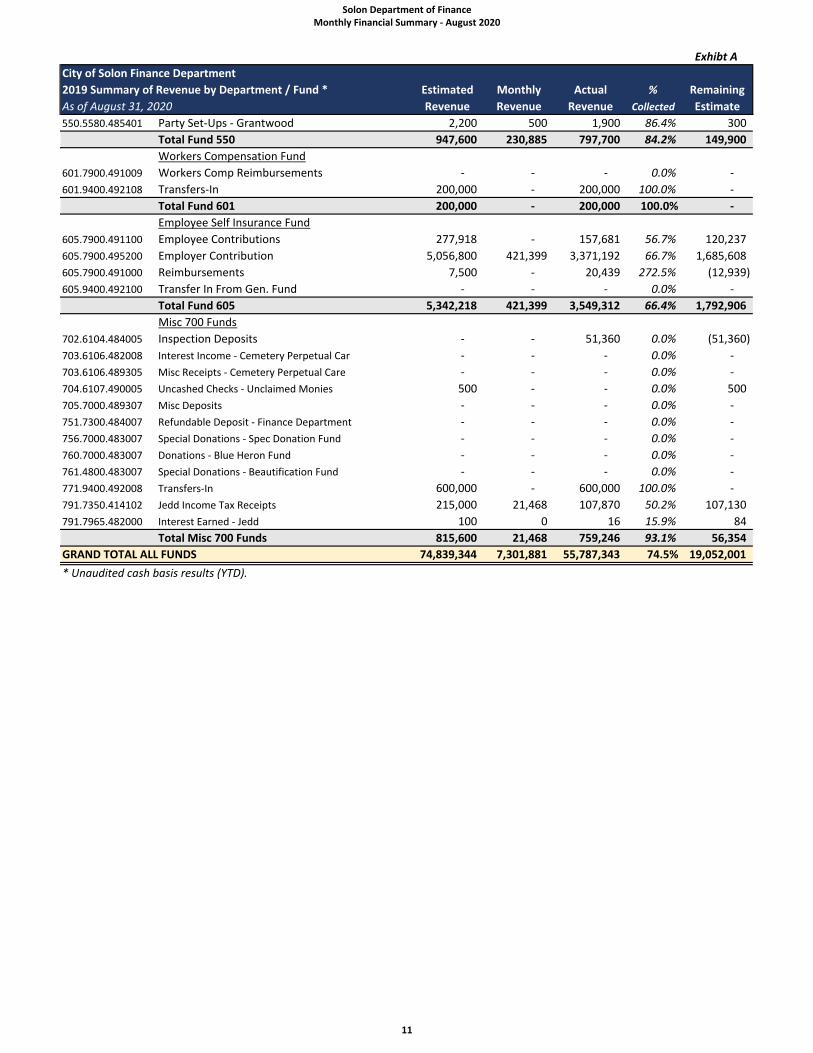
Additional detail on revenue collections by fund and department is provided in Exhibit A.
Operating Expenditures General Fund operating expenditures (excluding transfers out) through August were $24.7 million or 56.0% of the revised 2020 budget. The operating expenditures for August were 9.8% lower than the expenditures through the same period in 2019. The decrease from the previous year was driven by a temporary decline in City operations and various cost mitigation measures enacted in May as a response to the COVID-19 downturn. The 2020 total expenditures (including transfers out) are 8.1% under the 2019 YTD expenditures.
Solon Finance Committee September 21, 2021 Monthly Financial Summary – August 2020
3
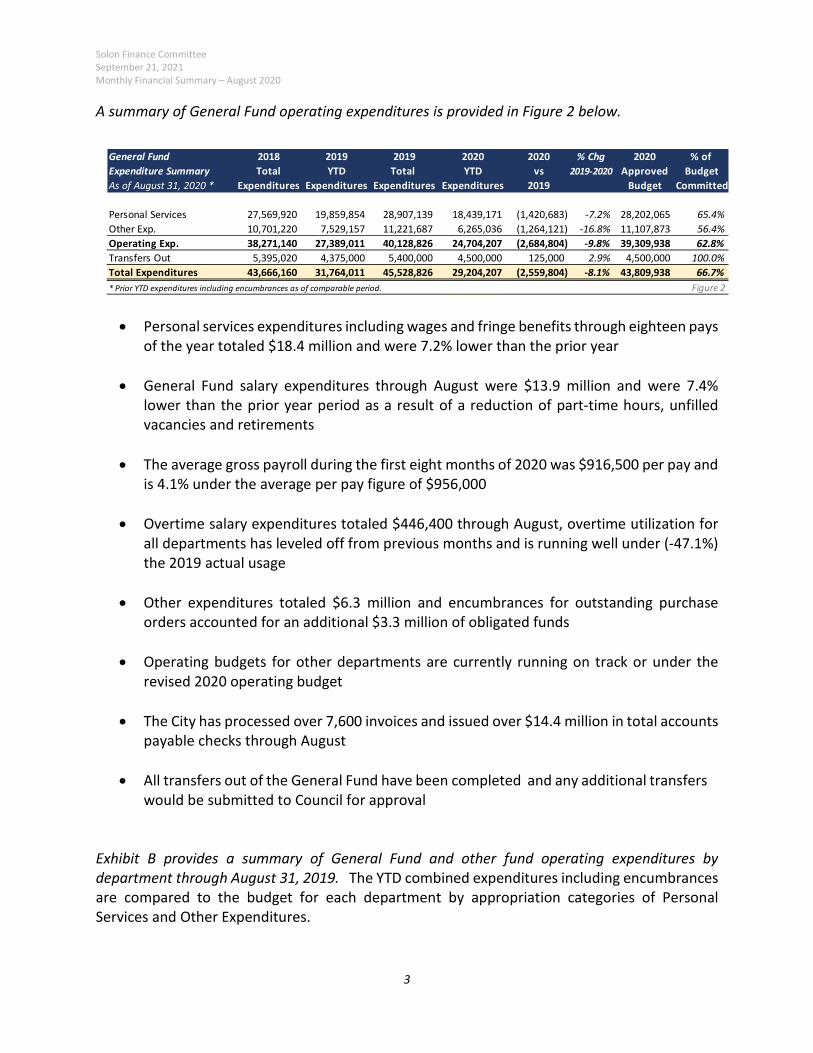
A summary of General Fund operating expenditures is provided in Figure 2 below.
• Personal services expenditures including wages and fringe benefits through eighteen paysof the year totaled $18.4 million and were 7.2% lower than the prior year
• General Fund salary expenditures through August were $13.9 million and were 7.4%lower than the prior year period as a result of a reduction of part-time hours, unfilledvacancies and retirements
• The average gross payroll during the first eight months of 2020 was $916,500 per pay andis 4.1% under the average per pay figure of $956,000
• Overtime salary expenditures totaled $446,400 through August, overtime utilization forall departments has leveled off from previous months and is running well under (-47.1%)the 2019 actual usage
• Other expenditures totaled $6.3 million and encumbrances for outstanding purchaseorders accounted for an additional $3.3 million of obligated funds
• Operating budgets for other departments are currently running on track or under therevised 2020 operating budget
• The City has processed over 7,600 invoices and issued over $14.4 million in total accountspayable checks through August
• All transfers out of the General Fund have been completed and any additional transfers would be submitted to Council for approval
Exhibit B provides a summary of General Fund and other fund operating expenditures by department through August 31, 2019. The YTD combined expenditures including encumbrances are compared to the budget for each department by appropriation categories of Personal Services and Other Expenditures.
General Fund 2018 2019 2019 2020 2020 % Chg 2020 % of Expenditure Summary Total YTD Total YTD vs 2019-2020 Approved BudgetAs of August 31, 2020 * Expenditures Expenditures Expenditures Expenditures 2019 Budget Committed
Personal Services 27,569,920 19,859,854 28,907,139 18,439,171 (1,420,683) -7.2% 28,202,065 65.4%Other Exp. 10,701,220 7,529,157 11,221,687 6,265,036 (1,264,121) -16.8% 11,107,873 56.4%Operating Exp. 38,271,140 27,389,011 40,128,826 24,704,207 (2,684,804) -9.8% 39,309,938 62.8%Transfers Out 5,395,020 4,375,000 5,400,000 4,500,000 125,000 2.9% 4,500,000 100.0%Total Expenditures 43,666,160 31,764,011 45,528,826 29,204,207 (2,559,804) -8.1% 43,809,938 66.7%* Prior YTD expenditures including encumbrances as of comparable period. Figure 2
Solon Finance Committee September 21, 2021 Monthly Financial Summary – August 2020
4
Capital Improvement Fund Budgets Exhibit C provides the YTD actual expenditures for the capital project budgets in the Service & Safety Fund (421), Facility Repair & Maintenance Fund (435) and Capital Equipment Fund (491). The amount of expenditure activity and encumbrances have peaked as of August as most projects have been commenced or completed. Through the first eight months of the year $2.4 million or 88.7% of General Capital Funds have been expended or obligated. A request to appropriate additional funds in the Facility Improvement Fund (No. 435) was included in the September 21st Finance agenda to cover additional approved project capital expenditures (Refer to Item 2 of the agenda). Current Fund Balances Exhibit D includes a month-end summary of revenues, expenditures and ending balances by fund as of August 31, 2020. The YTD unencumbered balance in the General Fund was $13.0 million, a decrease of over $2.5 million (16.1%) since August of 2019. The combined General Fund balance which includes the Budget Stabilization Fund is $20.6 million or 62.2% of combined expenditures. The balance for all funds combined was $44.9 million. The General Fund balance has declined over the past two years as a result of a slip in net profit income tax collections and the depressed revenue levels due to the impact of COVID-19 on the economy. The unencumbered fund balance is currently projected to end the year at around $15 million or 37.5% of expected expenditures. Refer to Exhibit D for the operating results of the General Fund and other City Funds.
Exhibt A
City of Solon Finance Department
2019 Summary of Revenue by Department / Fund * Estimated Monthly Actual % Remaining
As of August 31, 2020 Revenue Revenue Revenue Collected Estimate
POLICE DEPARTMENT
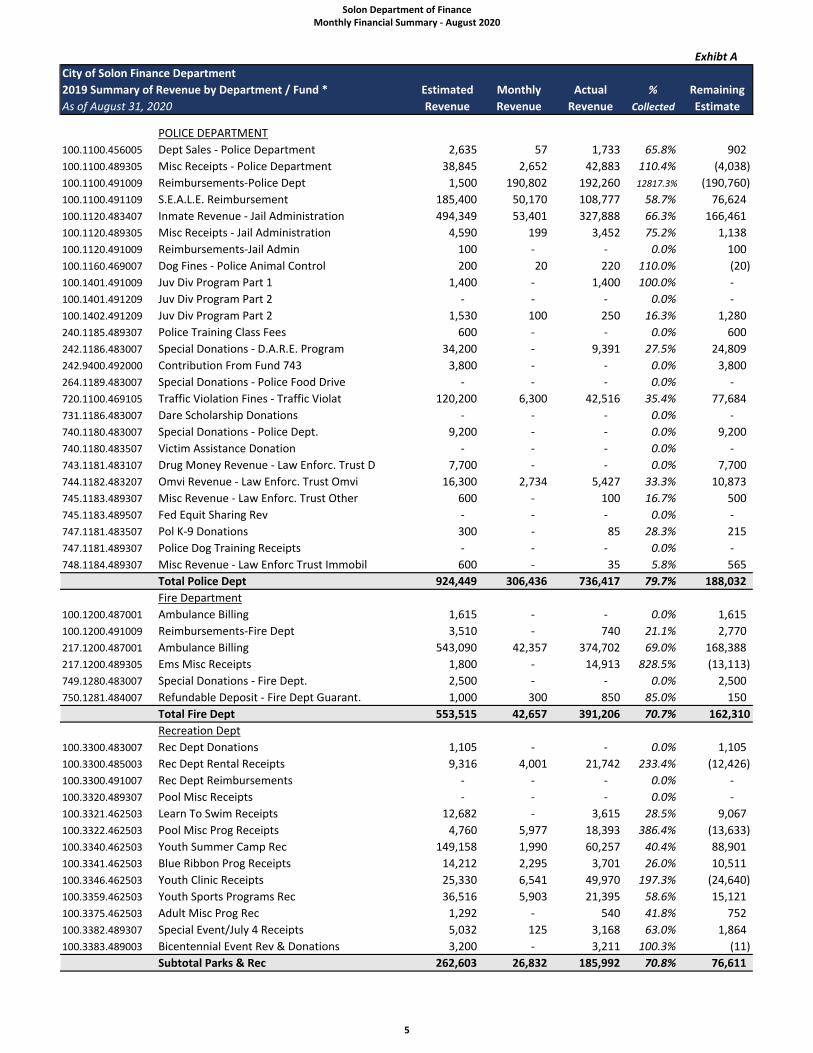
100.1100.456005 Dept Sales ‐ Police Department 2,635 57 1,733 65.8% 902 100.1100.489305 Misc Receipts ‐ Police Department 38,845 2,652 42,883 110.4% (4,038) 100.1100.491009 Reimbursements‐Police Dept 1,500 190,802 192,260 12817.3% (190,760) 100.1100.491109 S.E.A.L.E. Reimbursement 185,400 50,170 108,777 58.7% 76,624 100.1120.483407 Inmate Revenue ‐ Jail Administration 494,349 53,401 327,888 66.3% 166,461 100.1120.489305 Misc Receipts ‐ Jail Administration 4,590 199 3,452 75.2% 1,138 100.1120.491009 Reimbursements‐Jail Admin 100 ‐ ‐ 0.0% 100 100.1160.469007 Dog Fines ‐ Police Animal Control 200 20 220 110.0% (20) 100.1401.491009 Juv Div Program Part 1 1,400 ‐ 1,400 100.0% ‐ 100.1401.491209 Juv Div Program Part 2 ‐ ‐ ‐ 0.0% ‐ 100.1402.491209 Juv Div Program Part 2 1,530 100 250 16.3% 1,280 240.1185.489307 Police Training Class Fees 600 ‐ ‐ 0.0% 600 242.1186.483007 Special Donations ‐ D.A.R.E. Program 34,200 ‐ 9,391 27.5% 24,809 242.9400.492000 Contribution From Fund 743 3,800 ‐ ‐ 0.0% 3,800 264.1189.483007 Special Donations ‐ Police Food Drive ‐ ‐ ‐ 0.0% ‐ 720.1100.469105 Traffic Violation Fines ‐ Traffic Violat 120,200 6,300 42,516 35.4% 77,684 731.1186.483007 Dare Scholarship Donations ‐ ‐ ‐ 0.0% ‐ 740.1180.483007 Special Donations ‐ Police Dept. 9,200 ‐ ‐ 0.0% 9,200 740.1180.483507 Victim Assistance Donation ‐ ‐ ‐ 0.0% ‐ 743.1181.483107 Drug Money Revenue ‐ Law Enforc. Trust D 7,700 ‐ ‐ 0.0% 7,700 744.1182.483207 Omvi Revenue ‐ Law Enforc. Trust Omvi 16,300 2,734 5,427 33.3% 10,873 745.1183.489307 Misc Revenue ‐ Law Enforc. Trust Other 600 ‐ 100 16.7% 500 745.1183.489507 Fed Equit Sharing Rev ‐ ‐ ‐ 0.0% ‐ 747.1181.483507 Pol K‐9 Donations 300 ‐ 85 28.3% 215 747.1181.489307 Police Dog Training Receipts ‐ ‐ ‐ 0.0% ‐ 748.1184.489307 Misc Revenue ‐ Law Enforc Trust Immobil 600 ‐ 35 5.8% 565
Total Police Dept 924,449 306,436 736,417 79.7% 188,032
Fire Department
100.1200.487001 Ambulance Billing 1,615 ‐ ‐ 0.0% 1,615 100.1200.491009 Reimbursements‐Fire Dept 3,510 ‐ 740 21.1% 2,770 217.1200.487001 Ambulance Billing 543,090 42,357 374,702 69.0% 168,388 217.1200.489305 Ems Misc Receipts 1,800 ‐ 14,913 828.5% (13,113) 749.1280.483007 Special Donations ‐ Fire Dept. 2,500 ‐ ‐ 0.0% 2,500 750.1281.484007 Refundable Deposit ‐ Fire Dept Guarant. 1,000 300 850 85.0% 150
Total Fire Dept 553,515 42,657 391,206 70.7% 162,310
Recreation Dept100.3300.483007 Rec Dept Donations 1,105 ‐ ‐ 0.0% 1,105 100.3300.485003 Rec Dept Rental Receipts 9,316 4,001 21,742 233.4% (12,426) 100.3300.491007 Rec Dept Reimbursements ‐ ‐ ‐ 0.0% ‐ 100.3320.489307 Pool Misc Receipts ‐ ‐ ‐ 0.0% ‐ 100.3321.462503 Learn To Swim Receipts 12,682 ‐ 3,615 28.5% 9,067 100.3322.462503 Pool Misc Prog Receipts 4,760 5,977 18,393 386.4% (13,633) 100.3340.462503 Youth Summer Camp Rec 149,158 1,990 60,257 40.4% 88,901 100.3341.462503 Blue Ribbon Prog Receipts 14,212 2,295 3,701 26.0% 10,511 100.3346.462503 Youth Clinic Receipts 25,330 6,541 49,970 197.3% (24,640) 100.3359.462503 Youth Sports Programs Rec 36,516 5,903 21,395 58.6% 15,121 100.3375.462503 Adult Misc Prog Rec 1,292 ‐ 540 41.8% 752 100.3382.489307 Special Event/July 4 Receipts 5,032 125 3,168 63.0% 1,864 100.3383.489003 Bicentennial Event Rev & Donations 3,200 ‐ 3,211 100.3% (11)
Subtotal Parks & Rec 262,603 26,832 185,992 70.8% 76,611
Solon Department of Finance Monthly Financial Summary - August 2020
5
Exhibt A
City of Solon Finance Department
2019 Summary of Revenue by Department / Fund * Estimated Monthly Actual % Remaining
As of August 31, 2020 Revenue Revenue Revenue Collected Estimate
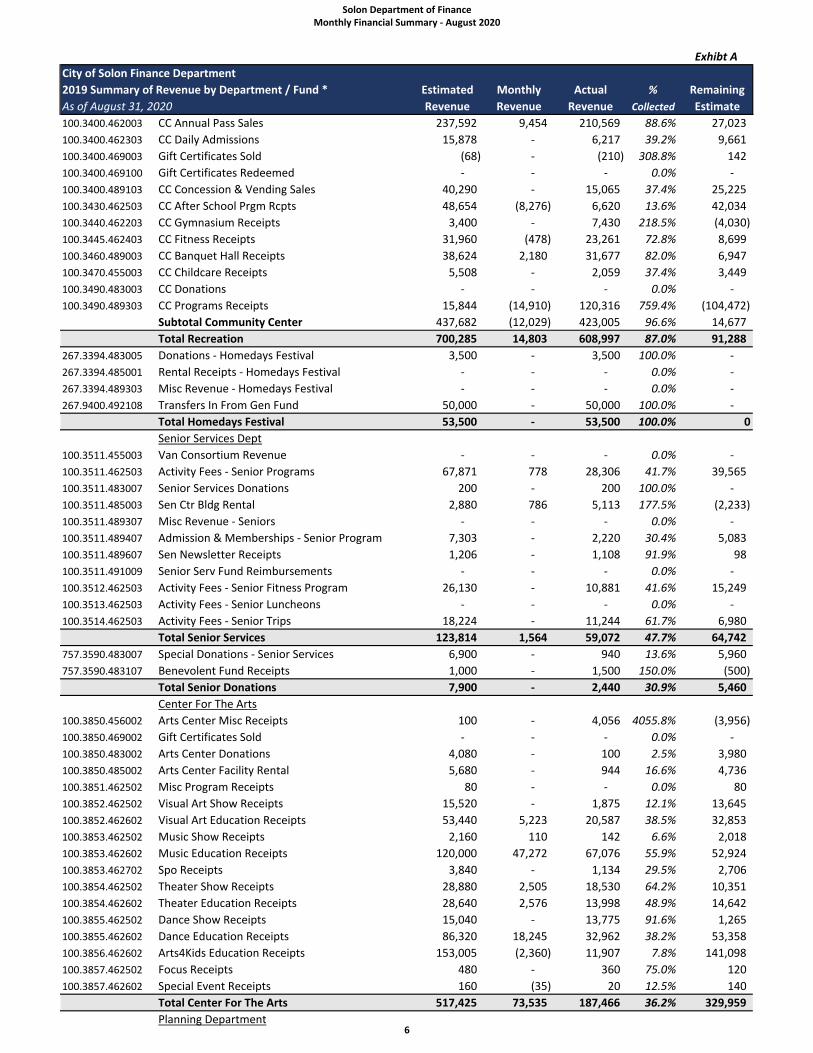
100.3400.462003 CC Annual Pass Sales 237,592 9,454 210,569 88.6% 27,023 100.3400.462303 CC Daily Admissions 15,878 ‐ 6,217 39.2% 9,661 100.3400.469003 Gift Certificates Sold (68) ‐ (210) 308.8% 142 100.3400.469100 Gift Certificates Redeemed ‐ ‐ ‐ 0.0% ‐ 100.3400.489103 CC Concession & Vending Sales 40,290 ‐ 15,065 37.4% 25,225 100.3430.462503 CC After School Prgm Rcpts 48,654 (8,276) 6,620 13.6% 42,034 100.3440.462203 CC Gymnasium Receipts 3,400 ‐ 7,430 218.5% (4,030) 100.3445.462403 CC Fitness Receipts 31,960 (478) 23,261 72.8% 8,699 100.3460.489003 CC Banquet Hall Receipts 38,624 2,180 31,677 82.0% 6,947 100.3470.455003 CC Childcare Receipts 5,508 ‐ 2,059 37.4% 3,449 100.3490.483003 CC Donations ‐ ‐ ‐ 0.0% ‐ 100.3490.489303 CC Programs Receipts 15,844 (14,910) 120,316 759.4% (104,472)
Subtotal Community Center 437,682 (12,029) 423,005 96.6% 14,677 Total Recreation 700,285 14,803 608,997 87.0% 91,288
267.3394.483005 Donations ‐ Homedays Festival 3,500 ‐ 3,500 100.0% ‐ 267.3394.485001 Rental Receipts ‐ Homedays Festival ‐ ‐ ‐ 0.0% ‐ 267.3394.489303 Misc Revenue ‐ Homedays Festival ‐ ‐ ‐ 0.0% ‐ 267.9400.492108 Transfers In From Gen Fund 50,000 ‐ 50,000 100.0% ‐
Total Homedays Festival 53,500 ‐ 53,500 100.0% 0
Senior Services Dept100.3511.455003 Van Consortium Revenue ‐ ‐ ‐ 0.0% ‐ 100.3511.462503 Activity Fees ‐ Senior Programs 67,871 778 28,306 41.7% 39,565 100.3511.483007 Senior Services Donations 200 ‐ 200 100.0% ‐ 100.3511.485003 Sen Ctr Bldg Rental 2,880 786 5,113 177.5% (2,233) 100.3511.489307 Misc Revenue ‐ Seniors ‐ ‐ ‐ 0.0% ‐ 100.3511.489407 Admission & Memberships ‐ Senior Program 7,303 ‐ 2,220 30.4% 5,083 100.3511.489607 Sen Newsletter Receipts 1,206 ‐ 1,108 91.9% 98 100.3511.491009 Senior Serv Fund Reimbursements ‐ ‐ ‐ 0.0% ‐ 100.3512.462503 Activity Fees ‐ Senior Fitness Program 26,130 ‐ 10,881 41.6% 15,249 100.3513.462503 Activity Fees ‐ Senior Luncheons ‐ ‐ ‐ 0.0% ‐ 100.3514.462503 Activity Fees ‐ Senior Trips 18,224 ‐ 11,244 61.7% 6,980
Total Senior Services 123,814 1,564 59,072 47.7% 64,742
757.3590.483007 Special Donations ‐ Senior Services 6,900 ‐ 940 13.6% 5,960 757.3590.483107 Benevolent Fund Receipts 1,000 ‐ 1,500 150.0% (500)
Total Senior Donations 7,900 ‐ 2,440 30.9% 5,460
Center For The Arts100.3850.456002 Arts Center Misc Receipts 100 ‐ 4,056 4055.8% (3,956) 100.3850.469002 Gift Certificates Sold ‐ ‐ ‐ 0.0% ‐ 100.3850.483002 Arts Center Donations 4,080 ‐ 100 2.5% 3,980 100.3850.485002 Arts Center Facility Rental 5,680 ‐ 944 16.6% 4,736 100.3851.462502 Misc Program Receipts 80 ‐ ‐ 0.0% 80 100.3852.462502 Visual Art Show Receipts 15,520 ‐ 1,875 12.1% 13,645 100.3852.462602 Visual Art Education Receipts 53,440 5,223 20,587 38.5% 32,853 100.3853.462502 Music Show Receipts 2,160 110 142 6.6% 2,018 100.3853.462602 Music Education Receipts 120,000 47,272 67,076 55.9% 52,924 100.3853.462702 Spo Receipts 3,840 ‐ 1,134 29.5% 2,706 100.3854.462502 Theater Show Receipts 28,880 2,505 18,530 64.2% 10,351 100.3854.462602 Theater Education Receipts 28,640 2,576 13,998 48.9% 14,642 100.3855.462502 Dance Show Receipts 15,040 ‐ 13,775 91.6% 1,265 100.3855.462602 Dance Education Receipts 86,320 18,245 32,962 38.2% 53,358 100.3856.462602 Arts4Kids Education Receipts 153,005 (2,360) 11,907 7.8% 141,098 100.3857.462502 Focus Receipts 480 ‐ 360 75.0% 120 100.3857.462602 Special Event Receipts 160 (35) 20 12.5% 140
Total Center For The Arts 517,425 73,535 187,466 36.2% 329,959
Planning Department
Solon Department of Finance Monthly Financial Summary - August 2020
6
Exhibt A
City of Solon Finance Department
2019 Summary of Revenue by Department / Fund * Estimated Monthly Actual % Remaining
As of August 31, 2020 Revenue Revenue Revenue Collected Estimate
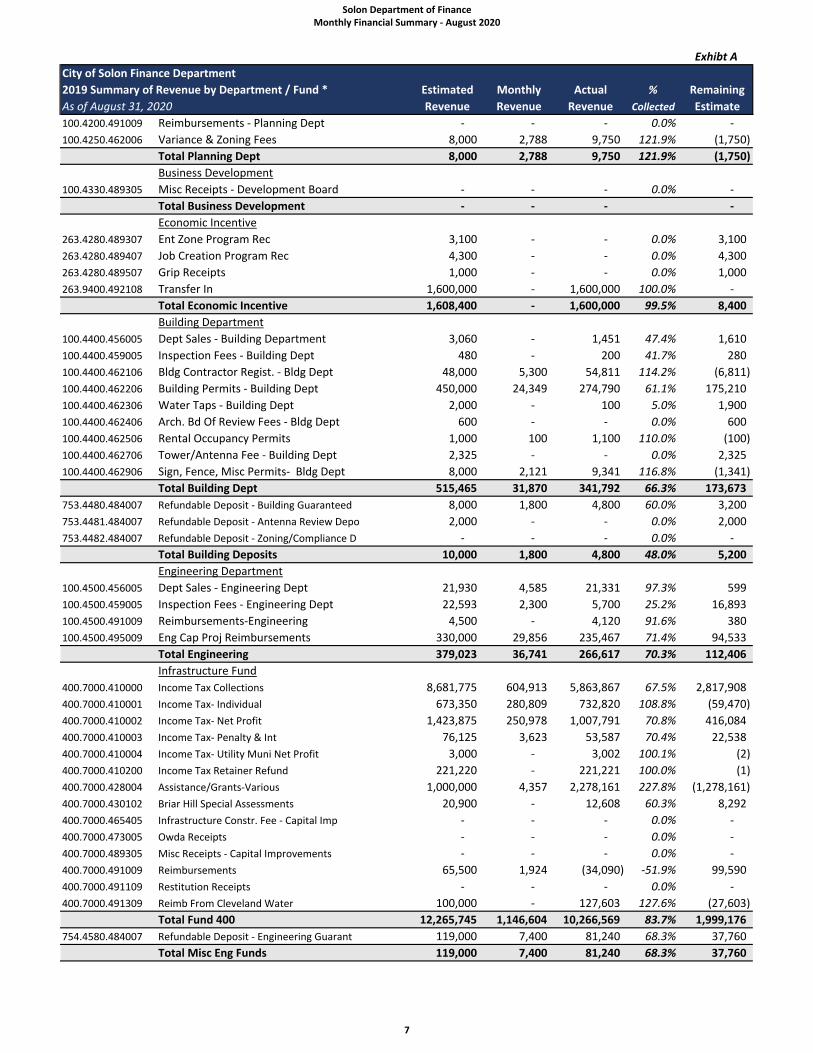
100.4200.491009 Reimbursements ‐ Planning Dept ‐ ‐ ‐ 0.0% ‐ 100.4250.462006 Variance & Zoning Fees 8,000 2,788 9,750 121.9% (1,750)
Total Planning Dept 8,000 2,788 9,750 121.9% (1,750)
Business Development
100.4330.489305 Misc Receipts ‐ Development Board ‐ ‐ ‐ 0.0% ‐ Total Business Development ‐ ‐ ‐ ‐
Economic Incentive263.4280.489307 Ent Zone Program Rec 3,100 ‐ ‐ 0.0% 3,100 263.4280.489407 Job Creation Program Rec 4,300 ‐ ‐ 0.0% 4,300 263.4280.489507 Grip Receipts 1,000 ‐ ‐ 0.0% 1,000 263.9400.492108 Transfer In 1,600,000 ‐ 1,600,000 100.0% ‐
Total Economic Incentive 1,608,400 ‐ 1,600,000 99.5% 8,400
Building Department
100.4400.456005 Dept Sales ‐ Building Department 3,060 ‐ 1,451 47.4% 1,610 100.4400.459005 Inspection Fees ‐ Building Dept 480 ‐ 200 41.7% 280 100.4400.462106 Bldg Contractor Regist. ‐ Bldg Dept 48,000 5,300 54,811 114.2% (6,811) 100.4400.462206 Building Permits ‐ Building Dept 450,000 24,349 274,790 61.1% 175,210 100.4400.462306 Water Taps ‐ Building Dept 2,000 ‐ 100 5.0% 1,900 100.4400.462406 Arch. Bd Of Review Fees ‐ Bldg Dept 600 ‐ ‐ 0.0% 600 100.4400.462506 Rental Occupancy Permits 1,000 100 1,100 110.0% (100) 100.4400.462706 Tower/Antenna Fee ‐ Building Dept 2,325 ‐ ‐ 0.0% 2,325 100.4400.462906 Sign, Fence, Misc Permits‐ Bldg Dept 8,000 2,121 9,341 116.8% (1,341)
Total Building Dept 515,465 31,870 341,792 66.3% 173,673
753.4480.484007 Refundable Deposit ‐ Building Guaranteed 8,000 1,800 4,800 60.0% 3,200 753.4481.484007 Refundable Deposit ‐ Antenna Review Depo 2,000 ‐ ‐ 0.0% 2,000 753.4482.484007 Refundable Deposit ‐ Zoning/Compliance D ‐ ‐ ‐ 0.0% ‐
Total Building Deposits 10,000 1,800 4,800 48.0% 5,200
Engineering Department
100.4500.456005 Dept Sales ‐ Engineering Dept 21,930 4,585 21,331 97.3% 599 100.4500.459005 Inspection Fees ‐ Engineering Dept 22,593 2,300 5,700 25.2% 16,893 100.4500.491009 Reimbursements‐Engineering 4,500 ‐ 4,120 91.6% 380 100.4500.495009 Eng Cap Proj Reimbursements 330,000 29,856 235,467 71.4% 94,533
Total Engineering 379,023 36,741 266,617 70.3% 112,406
Infrastructure Fund400.7000.410000 Income Tax Collections 8,681,775 604,913 5,863,867 67.5% 2,817,908 400.7000.410001 Income Tax‐ Individual 673,350 280,809 732,820 108.8% (59,470) 400.7000.410002 Income Tax‐ Net Profit 1,423,875 250,978 1,007,791 70.8% 416,084 400.7000.410003 Income Tax‐ Penalty & Int 76,125 3,623 53,587 70.4% 22,538 400.7000.410004 Income Tax‐ Utility Muni Net Profit 3,000 ‐ 3,002 100.1% (2) 400.7000.410200 Income Tax Retainer Refund 221,220 ‐ 221,221 100.0% (1) 400.7000.428004 Assistance/Grants‐Various 1,000,000 4,357 2,278,161 227.8% (1,278,161) 400.7000.430102 Briar Hill Special Assessments 20,900 ‐ 12,608 60.3% 8,292 400.7000.465405 Infrastructure Constr. Fee ‐ Capital Imp ‐ ‐ ‐ 0.0% ‐ 400.7000.473005 Owda Receipts ‐ ‐ ‐ 0.0% ‐ 400.7000.489305 Misc Receipts ‐ Capital Improvements ‐ ‐ ‐ 0.0% ‐ 400.7000.491009 Reimbursements 65,500 1,924 (34,090) ‐51.9% 99,590 400.7000.491109 Restitution Receipts ‐ ‐ ‐ 0.0% ‐ 400.7000.491309 Reimb From Cleveland Water 100,000 ‐ 127,603 127.6% (27,603)
Total Fund 400 12,265,745 1,146,604 10,266,569 83.7% 1,999,176
754.4580.484007 Refundable Deposit ‐ Engineering Guarant 119,000 7,400 81,240 68.3% 37,760 Total Misc Eng Funds 119,000 7,400 81,240 68.3% 37,760
Solon Department of Finance Monthly Financial Summary - August 2020
7
Exhibt A
City of Solon Finance Department
2019 Summary of Revenue by Department / Fund * Estimated Monthly Actual % Remaining
As of August 31, 2020 Revenue Revenue Revenue Collected Estimate
Service Department
100.5600.489005 Arboretum Receipts ‐ ‐ ‐ 0.0% ‐ 100.5600.489305 Misc Receipts ‐ Service Department 28,000 ‐ 26,672 95.3% 1,328 100.5600.489405 County Landfill Fee 5,440 ‐ ‐ 0.0% 5,440 100.5600.489607 Service Dept. Training Receipts 5,440 ‐ ‐ 0.0% 5,440 100.5600.491009 Reimbursements‐Service Dept ‐ ‐ ‐ 0.0% ‐ 100.5600.491019 Solid Waste Disposal Reimbursement 10,000 290 8,895 88.9% 1,105 100.5617.457005 Cemeteries ‐ ‐ ‐ 0.0% ‐ 100.5645.489105 Recycling Bag Receipts 38,482 9,167 36,185 94.0% 2,297 100.5645.489205 Compost/Mulch Sales Receipts ‐ ‐ ‐ 0.0% ‐ 100.5645.489305 Recycling Materials Receipts 10,965 1,425 2,380 21.7% 8,585
Total Service Department 98,327 10,882 74,132 75.4% 24,195
Tree Planting211.6105.484007 Refundable Deposit ‐ Tree Planting 2,000 460 690 0 1,310
Total Fund 211 ‐ Tree Deposits 2,000 460 690 34.5% 1,310
Misc General Fund Accounts100.7000.410000 Income Tax Collections 25,843,650 1,814,739 17,591,601 68.1% 8,252,049 100.7000.410001 Income Tax‐ Individual 2,718,300 842,427 2,198,461 80.9% 519,839 100.7000.410002 Income Tax‐ Net Profit 3,352,316 752,934 3,023,373 90.2% 328,943 100.7000.410003 Income Tax‐ Penalty & Int 213,789 10,869 160,761 75.2% 53,028 100.7000.410004 Income Tax‐ Utility Muni Net Profit 15,000 ‐ 9,005 60.0% 5,995 100.7000.410200 Income Tax Retainer Refund 663,662 ‐ 663,662 100.0% (0) 100.7000.411001 Real Estate Property Tax 1,089,016 238,000 856,641 78.7% 232,375 100.7000.411101 Property Tax Rollback/Homestead 117,700 ‐ 58,769 49.9% 58,931 100.7000.412001 Tang Personal Property Tax ‐ ‐ 0.0% ‐ 100.7000.415003 Amusement Tax 55,071 7,528 36,853 0.0% 18,218 100.7000.416003 Lodging Tax 215,757 11,455 98,860 45.8% 116,897 100.7000.421104 Local Gov State (7069) 141,950 10,283 57,446 40.5% 84,504 100.7000.421204 Local Gov County Auditor 185,494 18,416 114,264 61.6% 71,230 100.7000.422004 Inheritance Tax ‐ ‐ ‐ 0.0% ‐ 100.7000.423004 Cigarette Tax ‐ ‐ ‐ 0.0% ‐ 100.7000.424004 Liquor Permits (066) 31,080 412 6,068 19.5% 25,012 100.7000.451005 Alarm Monitoring 18,145 1,130 5,831 32.1% 12,314 100.7000.461007 Court Fines Cost & Forfeit. 180,000 22,804 137,733 76.5% 42,267 100.7000.464006 Misc Permits & License Fees 4,771 ‐ 160 3.4% 4,611 100.7000.482000 Interest Income 735,000 57,757 620,339 84.4% 114,661 100.7000.483007 Spec Donations To Gen Fund ‐ ‐ ‐ 0.0% ‐ 100.7000.485105 Rental Fees Historical Society Bldg ‐ ‐ ‐ 0.0% ‐ 100.7000.489007 Misc Revenue Equip Sales 46,328 13,953 85,297 184.1% (38,969) 100.7000.489305 Misc Receipts ‐ General Government 32,300 ‐ 1,713 5.3% 30,587 100.7000.491009 Reimbursements‐City Admin 48,000 287 56,896 118.5% (8,896) 100.7000.491209 Solon Foundation Reimbursement ‐ ‐ ‐ 0.0% ‐ 100.7000.491409 Refund ‐ Workers Comp ‐ ‐ ‐ 0.0% ‐ 100.7000.491509 Property Tax Refunds ‐ ‐ ‐ 0.0% ‐ 100.7010.491009 Reimbursements 990 ‐ ‐ 0.0% 990 100.4800.489305 Misc Receipts ‐ Beautification Art Prog ‐ ‐ ‐ 0.0% ‐ 100.7300.456005 Dept Sales ‐ Finance Department ‐ 2 2 0.0% (2) 100.7300.485005 Rental Receipts ‐ Finance Department ‐ ‐ ‐ 0.0% ‐ 100.7300.491000 Reimb For Jedd Expenses ‐ Finance Depart 2,340 ‐ 2,420 103.4% (80) 100.7400.491009 Reimbursements‐Legal Dept 31,500 ‐ 27,787 88.2% 3,713 100.7300.491200 Ccog Revenue Sharing 1,450 ‐ 1,414 89.5% 420 100.7610.461106 Application Fees ‐ Civil Service Comm 4,000 ‐ 3,580 1 36 100.7900.489305 Healthy Solon Receipts ‐ ‐ ‐ 0.0% ‐ 100.7900.491009 Court Ordered Restitution 7,470 ‐ 148 2.0% 7,322 100.7900.491309 Sig Of Solon St Lt Reimb 20,610 2,183 17,186 83.4% 3,424
Solon Department of Finance Monthly Financial Summary - August 2020
8
Exhibt A
City of Solon Finance Department
2019 Summary of Revenue by Department / Fund * Estimated Monthly Actual % Remaining
As of August 31, 2020 Revenue Revenue Revenue Collected Estimate
100.7900.495309 Utility Reimbursements 653,400 13,496 384,907 58.9% 268,493 Total Misc General Fund 36,429,089 3,818,676 26,221,176 72.0% 10,207,913
101.9400.492108 Transfer In 100,000 ‐ 100,000 57.8% 536,793 201.6101.425002 Gasoline Tax (68) ‐ Street Maintenance 1,272,865 13,816 736,072 252.4% (81,521) 201.6101.426002 Vehicle License Tax (051) ‐ Street Maint 53,500 106,125 135,021 337.1% (1,897) 201.6101.482000 Interest Income 800 242 2,697 57.8% 43,524 202.6102.425002 Gasoline Tax (68) ‐ State Highway 103,205 1,120 59,682 254.6% (6,648) 202.6102.426002 Vehicle License Tax (051) ‐ State Hwy 4,300 8,605 10,948 369.6% (216) 202.6102.482000 Interest Income 80 25 296 78.7% 185,245 204.7000.411001 Real Estate Property Tax 871,173 187,000 685,928 49.9% 47,184 204.7000.411101 Property Tax Rollback/Homestead 94,200 ‐ 47,016 0.0% ‐ 204.7000.412001 Tang Personal Property Tax ‐ ‐ ‐ 0.0% ‐ 204.9400.492108 Transfers In ‐ ‐ ‐ 78.7% 278,393 205.7000.411001 Real Estate Property Tax 1,306,759 280,000 1,028,366 49.9% 70,778 205.7000.411101 Property Tax Rollback/Homestead 141,300 ‐ 70,522 0.0% ‐ 205.7000.412001 Tang Personal Property Tax ‐ ‐ ‐ 0.0% ‐ 205.9400.492108 Transfer In ‐ ‐ ‐ 72.9% 1,071,635
Subtotal Misc Funds 3,948,182 596,932 2,876,547 72.9% 2,143,270
CABLE TV FUND Cable Tv Fund209.7630.464304 Franchise Fees ‐ Cable Tv 325,000 57,149 244,952 0.0% 80,048 209.7630.464404 Contract Award Fees ‐ Cable Tv ‐ ‐ ‐ 0.0% ‐ 209.7630.482000 Interest Income ‐ 364 3,566 0.0% (3,566) 209.7630.487004 Penalties ‐ ‐ ‐ 0.0% ‐ 209.7630.491007 Reimbursements ‐ Cable Tv ‐ ‐ ‐ 76.5% ‐
Total Fund 209 325,000 57,513 248,518 76.5% 76,482
Bond Retirementfund
Ment Fund270.7900.430000 Special Assessments 9,190 ‐ 2,296 25.0% 6,894
Total Fund 270 9,190 ‐ 2,296 25.0% 83,375
Solon Coronavirus Relief Fund271.7000.441000 Coronavirus Relief Aid 213,106 ‐ 213,106 ‐ (213,106)
TOTAL FUND 271 ‐ ‐ 213,106 0.0%
300.7000.411001 Real Estate Property Tax 326,715 70,000 257,095 78.7% 69,620 300.7000.411101 Property Tax Rollback/Homestead 35,300 ‐ 17,631 49.9% 17,669 300.7000.412001 Tang Personal Property Tax ‐ ‐ ‐ 0.0% ‐ 300.7000.430002 Special Assessment Receipts 408,500 ‐ 181,736 44.5% 226,764 300.7000.463003 Restr. Sewer Permit Fees 5,000 ‐ 1,337 26.7% 3,663 300.7000.471006 Bond Proceeds ‐ ‐ ‐ 0.0% ‐ 300.7000.472006 Ban (Note) Proceeds ‐ ‐ ‐ 0.0% ‐ 300.7000.491009 Reimburesments‐ Bond Issues ‐ ‐ ‐ 0.0% ‐ 300.9400.492108 Transfers In ‐ ‐ ‐ 0.0% ‐
Total Fund 300 775,515 70,000 457,799 59.0% 317,716
Safety & Service Equip Levy421.7000.411001 Real Estate Property Tax Levy 408,742 83,000 317,504 49.9% 91,238 421.7000.411101 Property Tax Rollback/Homestead 39,100 ‐ 19,510 19,590 421.7000.412001 Tang Personal Prop Tax Levy ‐ ‐ ‐ 0.0% ‐ 421.7000.472006 Ban (Note) Proceeds ‐ ‐ ‐ 0.0% ‐ 421.7000.489305 Misc Receipts Saf/Serv Equip ‐ ‐ ‐ 100.0% ‐ 421.9400.492307 Transfer‐In 400,000 ‐ 400,000 86.9% ‐
Total Fund 421 847,842 83,000 737,014 86.9% 110,828
Facility Maint& Repair Fund435.7000.472006 Ban (Note) Proceeds ‐ ‐ ‐ 52.9% ‐ 435.7000.491000 Misc Reimbursements 189,000 ‐ 100,000 100.0% 89,000 435.9400.492108 Transfers In 850,000 ‐ 850,000 91.4% ‐
Total Fund 435 1,039,000 ‐ 950,000 91.4% 89,000
Solon Department of Finance Monthly Financial Summary - August 2020
9
Exhibt A
City of Solon Finance Department
2019 Summary of Revenue by Department / Fund * Estimated Monthly Actual % Remaining
As of August 31, 2020 Revenue Revenue Revenue Collected Estimate
General Capitalimprovement
491.7000.441004 Fema Grant ‐ ‐ ‐ 0.0% ‐ 491.7000.441006 State Assistance/Grants ‐ ‐ ‐ 0.0% ‐ 491.7000.472006 Ban (Note) Proceeds ‐ ‐ ‐ 0.0% ‐ 491.7000.482506 Interest From Gross Bldrs ‐ ‐ ‐ 0.0% ‐ 491.7000.487007 Sale Of Land ‐ ‐ ‐ 0.0% ‐ 491.7000.489305 Misc Receipts ‐ General Government ‐ 313 313 0.0% (313) 491.7000.490009 Jedd Revenue Receipts 90,000 ‐ 102,235 113.6% (12,235) 491.7000.491005 Reimbursements ‐ Capital Improvements ‐ ‐ 116,408 0.0% (116,408) 491.9400.492107 Transfers‐In 700,000 ‐ 700,000 100.0% ‐
Total Fund 491 790,000 313 918,955 116.3% (128,955)
Waste Water Treament Fund511.5100.465001 Sewer Surcharges Wr Dept 550,000 1,257 413,866 75.2% 136,134 511.5100.465101 Sewer Usage Charges Wr Dept 4,665,600 306,713 2,611,503 56.0% 2,054,097 511.5100.482000 Interest Income 52,200 4,457 45,180 86.6% 7,020 511.5100.489103 Internal Service Charges ‐ ‐ ‐ 0.0% ‐ 511.5100.489303 Misc Receipts Wr Dept 29,800 216 25,969 87.1% 3,831 511.5100.491005 Reimbursements Wr Dept 9,300 435 2,531 27.2% 6,769 511.5100.491105 Employee Health Contributions ‐ ‐ ‐ 0.0% ‐
Total Fund 511 5,306,900 313,078 3,099,049 58.4% 2,207,851
Sewer Plant R &I Fund512.5150.465201 Tap‐In Fees ‐ Treatment R & I 100,000 5,800 30,342 30.3% 69,658 512.5150.465301 Telemetering Fee ‐ Treatment R & I ‐ ‐ ‐ 0.0% ‐ 512.5150.482000 Interest Income 64,800 3,475 37,445 57.8% 27,355 512.5150.489303 Misc Revenue ‐ Treatment R & I ‐ ‐ ‐ 0.0% ‐ 512.9400.492108 Transfers‐In ‐ ‐ ‐ 0.0% ‐
Total Fund 512 164,800 9,275 67,787 41.1% 97,013
Grantwood Golfcourse550.5500.426103 Sales Tax ‐ Grantwood 8,900 1,049 3,205 36.0% 5,695 550.5500.482002 Interest Income ‐ Grantwood 3,800 504 3,241 85.3% 559 550.5500.489103 Gas Drilling Receipts 100 ‐ ‐ 0.0% 100 550.5500.489303 Misc Revenue ‐ Grantwood 8,900 234 9,996 112.3% (1,096) 550.5500.489403 Ski Revenue 1,000 ‐ 553 55.3% 447 550.5500.491005 Reimbursements ‐ Grantwood 400 ‐ 1,429 357.3% (1,029) 550.5500.491105 Employee Health Contributions ‐ ‐ ‐ 0.0% ‐ 550.5500.499003 Misc Deposits ‐ Grantwood 1,700 (149) (354) ‐20.7% 2,054 550.5510.464101 9 Hole Fees ‐ Grantwood 179,200 50,392 172,503 96.3% 6,697 550.5510.464201 18 Hole Fees ‐ Grantwood 212,200 51,680 177,632 83.7% 34,568 550.5510.464303 Rain Checks Issued 5,700 4,583 4,583 80.4% 1,117 550.5510.464313 Rain Checks Redeemed (3,300) (1,045) (1,658) 50.3% (1,642) 550.5510.464601 Golf Lessons ‐ ‐ ‐ 0.0% ‐ 550.5510.464701 Golf Clinics 32,400 7,326 26,888 83.0% 5,512 550.5515.464601 Driving Range Receipts 142,200 42,479 179,273 126.1% (37,073) 550.5515.484007 Refundable Deposit ‐ Grantwood ‐ ‐ ‐ 0.0% ‐ 550.5530.426101 Sales Tax ‐ Merchandise 17,300 4,755 15,054 87.0% 2,246 550.5530.456001 Merchandise Sales 57,800 11,178 31,869 55.1% 25,931 550.5530.489503 Gift Cards Issued 8,700 296 1,021 11.7% 7,679 550.5530.489513 Gift Cards Redeemed (6,000) (352) (2,057) 34.3% (3,943) 550.5530.489603 Gift Certificates Issued (Outings) 1,200 409 1,291 107.6% (91) 550.5530.489613 Gift Cert. Redeemed (Outings) (2,300) (123) (338) 14.7% (1,962) 550.5540.456101 Beer & Wine Sales ‐ Snack Bar 49,600 10,903 27,295 55.0% 22,305 550.5540.456201 Food Sales ‐ Snack Bar 47,200 4,944 12,789 27.1% 34,411 550.5550.485201 Hand Cart Rentals ‐ Grantwood 1,400 565 1,743 124.5% (343) 550.5550.485301 Power Cart Rentals ‐ Grantwood 137,000 39,181 119,282 87.1% 17,718 550.5580.485001 Rental Receipts ‐ Grantwood 40,300 1,575 10,560 26.2% 29,740
Solon Department of Finance Monthly Financial Summary - August 2020
10
Exhibt A
City of Solon Finance Department
2019 Summary of Revenue by Department / Fund * Estimated Monthly Actual % Remaining
As of August 31, 2020 Revenue Revenue Revenue Collected Estimate
550.5580.485401 Party Set‐Ups ‐ Grantwood 2,200 500 1,900 86.4% 300 Total Fund 550 947,600 230,885 797,700 84.2% 149,900
Workers Compensation Fund601.7900.491009 Workers Comp Reimbursements ‐ ‐ ‐ 0.0% ‐ 601.9400.492108 Transfers‐In 200,000 ‐ 200,000 100.0% ‐
Total Fund 601 200,000 ‐ 200,000 100.0% ‐
Employee Self Insurance Fund605.7900.491100 Employee Contributions 277,918 ‐ 157,681 56.7% 120,237 605.7900.495200 Employer Contribution 5,056,800 421,399 3,371,192 66.7% 1,685,608 605.7900.491000 Reimbursements 7,500 ‐ 20,439 272.5% (12,939) 605.9400.492100 Transfer In From Gen. Fund ‐ ‐ ‐ 0.0% ‐
Total Fund 605 5,342,218 421,399 3,549,312 66.4% 1,792,906
Misc 700 Funds702.6104.484005 Inspection Deposits ‐ ‐ 51,360 0.0% (51,360) 703.6106.482008 Interest Income ‐ Cemetery Perpetual Car ‐ ‐ ‐ 0.0% ‐ 703.6106.489305 Misc Receipts ‐ Cemetery Perpetual Care ‐ ‐ ‐ 0.0% ‐ 704.6107.490005 Uncashed Checks ‐ Unclaimed Monies 500 ‐ ‐ 0.0% 500 705.7000.489307 Misc Deposits ‐ ‐ ‐ 0.0% ‐ 751.7300.484007 Refundable Deposit ‐ Finance Department ‐ ‐ ‐ 0.0% ‐ 756.7000.483007 Special Donations ‐ Spec Donation Fund ‐ ‐ ‐ 0.0% ‐ 760.7000.483007 Donations ‐ Blue Heron Fund ‐ ‐ ‐ 0.0% ‐ 761.4800.483007 Special Donations ‐ Beautification Fund ‐ ‐ ‐ 0.0% ‐ 771.9400.492008 Transfers‐In 600,000 ‐ 600,000 100.0% ‐ 791.7350.414102 Jedd Income Tax Receipts 215,000 21,468 107,870 50.2% 107,130 791.7965.482000 Interest Earned ‐ Jedd 100 0 16 15.9% 84
Total Misc 700 Funds 815,600 21,468 759,246 93.1% 56,354
74,839,344 7,301,881 55,787,343 74.5% 19,052,001
* Unaudited cash basis results (YTD).
GRAND TOTAL ALL FUNDS
Solon Department of Finance Monthly Financial Summary - August 2020
11
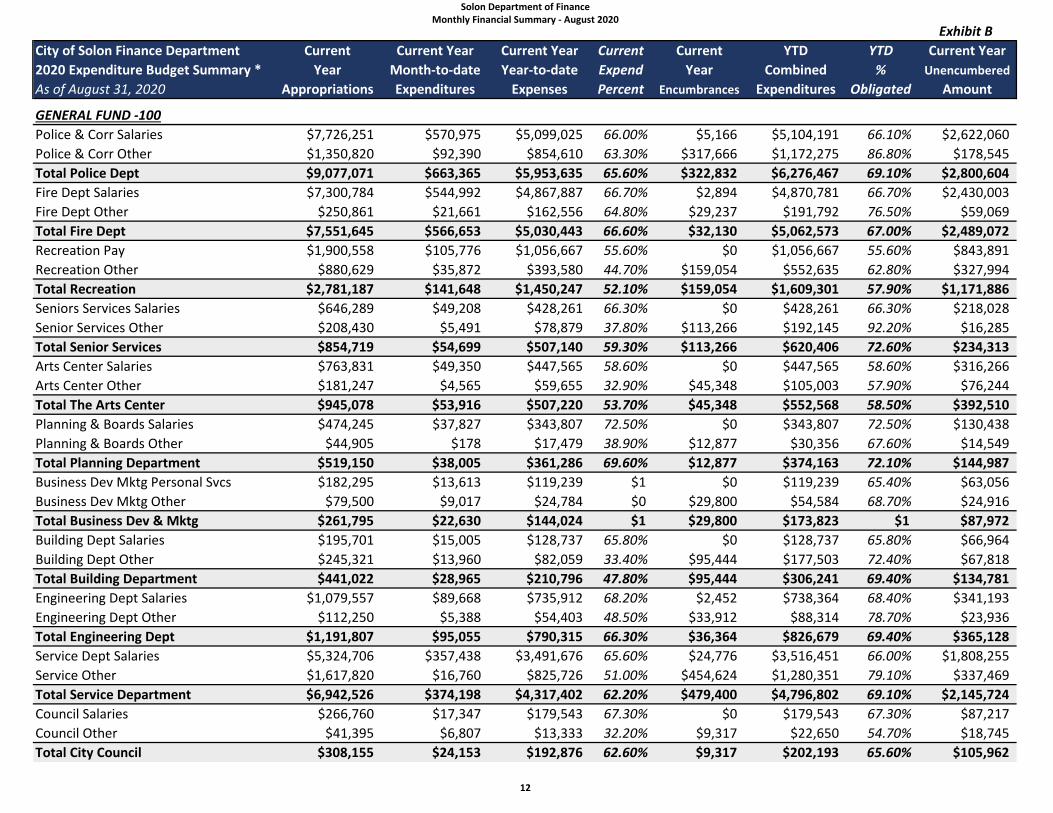
Exhibit BCity of Solon Finance Department Current Current Year Current Year Current Current YTD YTD Current Year2020 Expenditure Budget Summary * Year Month-to-date Year-to-date Expend Year Combined % UnencumberedAs of August 31, 2020 Appropriations Expenditures Expenses Percent Encumbrances Expenditures Obligated Amount
GENERAL FUND -100Police & Corr Salaries $7,726,251 $570,975 $5,099,025 66.00% $5,166 $5,104,191 66.10% $2,622,060Police & Corr Other $1,350,820 $92,390 $854,610 63.30% $317,666 $1,172,275 86.80% $178,545Total Police Dept $9,077,071 $663,365 $5,953,635 65.60% $322,832 $6,276,467 69.10% $2,800,604Fire Dept Salaries $7,300,784 $544,992 $4,867,887 66.70% $2,894 $4,870,781 66.70% $2,430,003Fire Dept Other $250,861 $21,661 $162,556 64.80% $29,237 $191,792 76.50% $59,069Total Fire Dept $7,551,645 $566,653 $5,030,443 66.60% $32,130 $5,062,573 67.00% $2,489,072Recreation Pay $1,900,558 $105,776 $1,056,667 55.60% $0 $1,056,667 55.60% $843,891Recreation Other $880,629 $35,872 $393,580 44.70% $159,054 $552,635 62.80% $327,994Total Recreation $2,781,187 $141,648 $1,450,247 52.10% $159,054 $1,609,301 57.90% $1,171,886Seniors Services Salaries $646,289 $49,208 $428,261 66.30% $0 $428,261 66.30% $218,028Senior Services Other $208,430 $5,491 $78,879 37.80% $113,266 $192,145 92.20% $16,285Total Senior Services $854,719 $54,699 $507,140 59.30% $113,266 $620,406 72.60% $234,313Arts Center Salaries $763,831 $49,350 $447,565 58.60% $0 $447,565 58.60% $316,266Arts Center Other $181,247 $4,565 $59,655 32.90% $45,348 $105,003 57.90% $76,244Total The Arts Center $945,078 $53,916 $507,220 53.70% $45,348 $552,568 58.50% $392,510Planning & Boards Salaries $474,245 $37,827 $343,807 72.50% $0 $343,807 72.50% $130,438Planning & Boards Other $44,905 $178 $17,479 38.90% $12,877 $30,356 67.60% $14,549Total Planning Department $519,150 $38,005 $361,286 69.60% $12,877 $374,163 72.10% $144,987Business Dev Mktg Personal Svcs $182,295 $13,613 $119,239 $1 $0 $119,239 65.40% $63,056Business Dev Mktg Other $79,500 $9,017 $24,784 $0 $29,800 $54,584 68.70% $24,916Total Business Dev & Mktg $261,795 $22,630 $144,024 $1 $29,800 $173,823 $1 $87,972Building Dept Salaries $195,701 $15,005 $128,737 65.80% $0 $128,737 65.80% $66,964Building Dept Other $245,321 $13,960 $82,059 33.40% $95,444 $177,503 72.40% $67,818Total Building Department $441,022 $28,965 $210,796 47.80% $95,444 $306,241 69.40% $134,781Engineering Dept Salaries $1,079,557 $89,668 $735,912 68.20% $2,452 $738,364 68.40% $341,193Engineering Dept Other $112,250 $5,388 $54,403 48.50% $33,912 $88,314 78.70% $23,936Total Engineering Dept $1,191,807 $95,055 $790,315 66.30% $36,364 $826,679 69.40% $365,128Service Dept Salaries $5,324,706 $357,438 $3,491,676 65.60% $24,776 $3,516,451 66.00% $1,808,255Service Other $1,617,820 $16,760 $825,726 51.00% $454,624 $1,280,351 79.10% $337,469Total Service Department $6,942,526 $374,198 $4,317,402 62.20% $479,400 $4,796,802 69.10% $2,145,724Council Salaries $266,760 $17,347 $179,543 67.30% $0 $179,543 67.30% $87,217Council Other $41,395 $6,807 $13,333 32.20% $9,317 $22,650 54.70% $18,745Total City Council $308,155 $24,153 $192,876 62.60% $9,317 $202,193 65.60% $105,962
Solon Department of Finance Monthly Financial Summary - August 2020
12
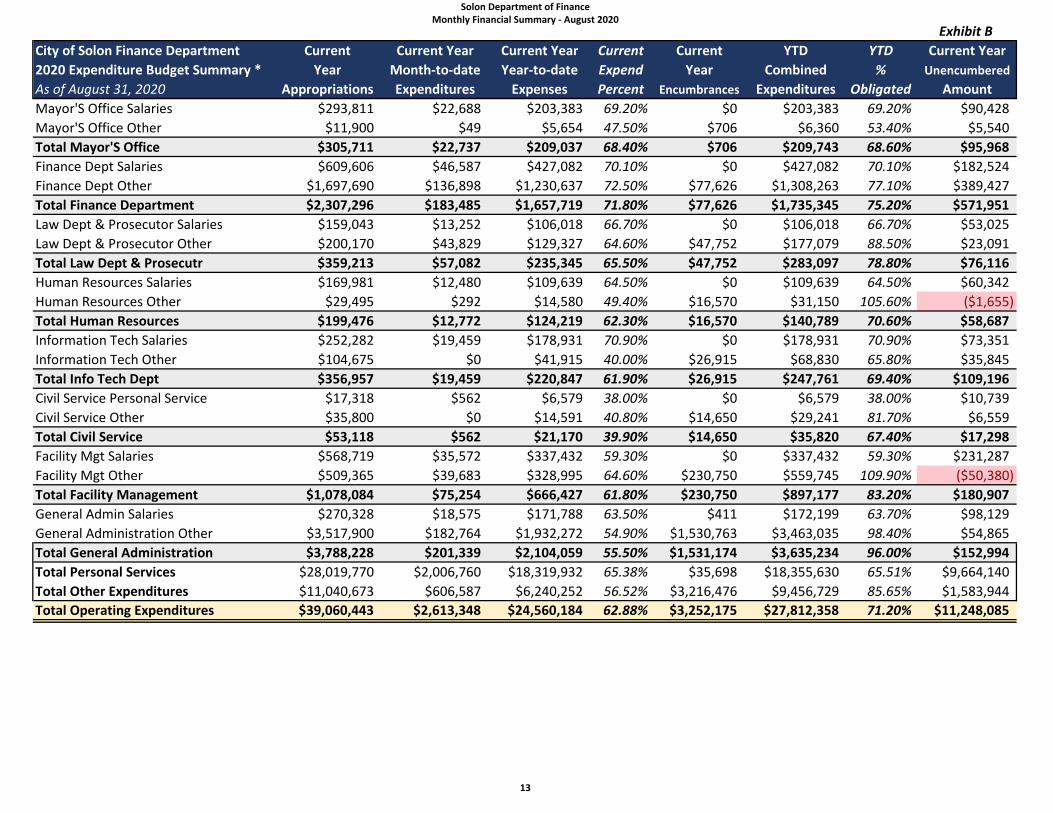
Exhibit BCity of Solon Finance Department Current Current Year Current Year Current Current YTD YTD Current Year2020 Expenditure Budget Summary * Year Month-to-date Year-to-date Expend Year Combined % UnencumberedAs of August 31, 2020 Appropriations Expenditures Expenses Percent Encumbrances Expenditures Obligated AmountMayor'S Office Salaries $293,811 $22,688 $203,383 69.20% $0 $203,383 69.20% $90,428Mayor'S Office Other $11,900 $49 $5,654 47.50% $706 $6,360 53.40% $5,540Total Mayor'S Office $305,711 $22,737 $209,037 68.40% $706 $209,743 68.60% $95,968Finance Dept Salaries $609,606 $46,587 $427,082 70.10% $0 $427,082 70.10% $182,524Finance Dept Other $1,697,690 $136,898 $1,230,637 72.50% $77,626 $1,308,263 77.10% $389,427Total Finance Department $2,307,296 $183,485 $1,657,719 71.80% $77,626 $1,735,345 75.20% $571,951Law Dept & Prosecutor Salaries $159,043 $13,252 $106,018 66.70% $0 $106,018 66.70% $53,025Law Dept & Prosecutor Other $200,170 $43,829 $129,327 64.60% $47,752 $177,079 88.50% $23,091Total Law Dept & Prosecutr $359,213 $57,082 $235,345 65.50% $47,752 $283,097 78.80% $76,116Human Resources Salaries $169,981 $12,480 $109,639 64.50% $0 $109,639 64.50% $60,342Human Resources Other $29,495 $292 $14,580 49.40% $16,570 $31,150 105.60% ($1,655)Total Human Resources $199,476 $12,772 $124,219 62.30% $16,570 $140,789 70.60% $58,687Information Tech Salaries $252,282 $19,459 $178,931 70.90% $0 $178,931 70.90% $73,351Information Tech Other $104,675 $0 $41,915 40.00% $26,915 $68,830 65.80% $35,845Total Info Tech Dept $356,957 $19,459 $220,847 61.90% $26,915 $247,761 69.40% $109,196Civil Service Personal Service $17,318 $562 $6,579 38.00% $0 $6,579 38.00% $10,739Civil Service Other $35,800 $0 $14,591 40.80% $14,650 $29,241 81.70% $6,559Total Civil Service $53,118 $562 $21,170 39.90% $14,650 $35,820 67.40% $17,298Facility Mgt Salaries $568,719 $35,572 $337,432 59.30% $0 $337,432 59.30% $231,287Facility Mgt Other $509,365 $39,683 $328,995 64.60% $230,750 $559,745 109.90% ($50,380)Total Facility Management $1,078,084 $75,254 $666,427 61.80% $230,750 $897,177 83.20% $180,907General Admin Salaries $270,328 $18,575 $171,788 63.50% $411 $172,199 63.70% $98,129General Administration Other $3,517,900 $182,764 $1,932,272 54.90% $1,530,763 $3,463,035 98.40% $54,865Total General Administration $3,788,228 $201,339 $2,104,059 55.50% $1,531,174 $3,635,234 96.00% $152,994Total Personal Services $28,019,770 $2,006,760 $18,319,932 65.38% $35,698 $18,355,630 65.51% $9,664,140Total Other Expenditures $11,040,673 $606,587 $6,240,252 56.52% $3,216,476 $9,456,729 85.65% $1,583,944Total Operating Expenditures $39,060,443 $2,613,348 $24,560,184 62.88% $3,252,175 $27,812,358 71.20% $11,248,085
Solon Department of Finance Monthly Financial Summary - August 2020
13
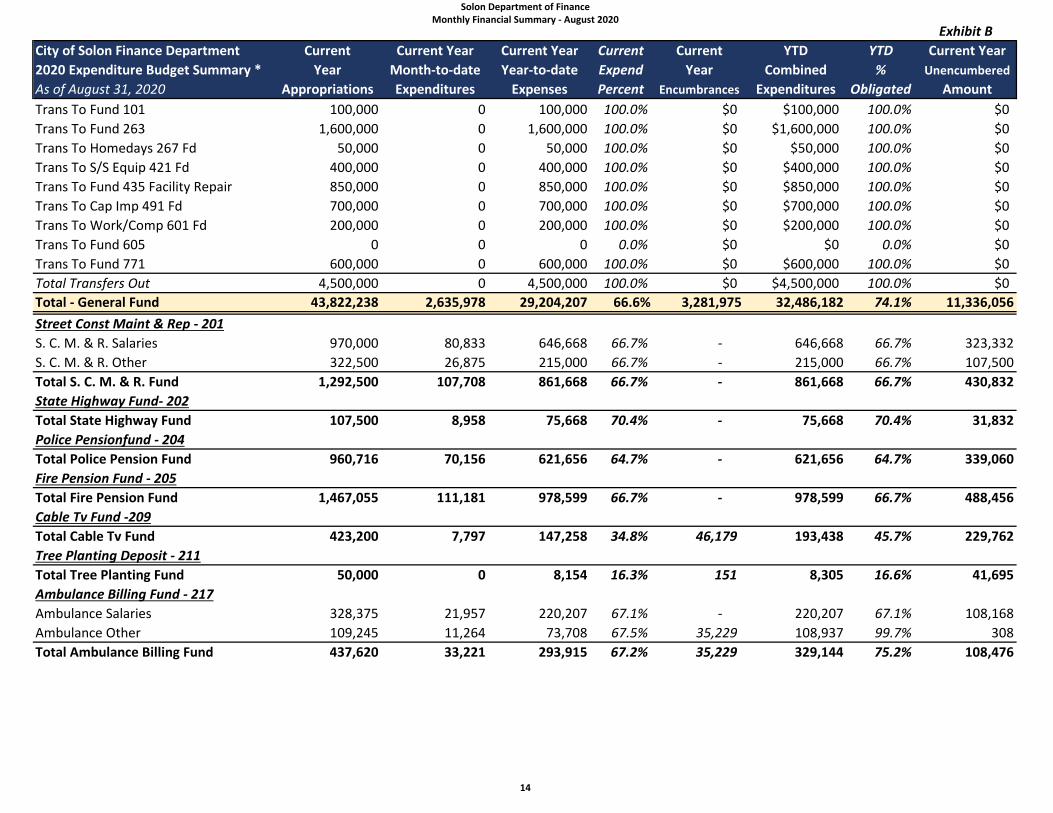
Exhibit BCity of Solon Finance Department Current Current Year Current Year Current Current YTD YTD Current Year2020 Expenditure Budget Summary * Year Month-to-date Year-to-date Expend Year Combined % UnencumberedAs of August 31, 2020 Appropriations Expenditures Expenses Percent Encumbrances Expenditures Obligated AmountTrans To Fund 101 100,000 0 100,000 100.0% $0 $100,000 100.0% $0Trans To Fund 263 1,600,000 0 1,600,000 100.0% $0 $1,600,000 100.0% $0Trans To Homedays 267 Fd 50,000 0 50,000 100.0% $0 $50,000 100.0% $0Trans To S/S Equip 421 Fd 400,000 0 400,000 100.0% $0 $400,000 100.0% $0Trans To Fund 435 Facility Repair 850,000 0 850,000 100.0% $0 $850,000 100.0% $0Trans To Cap Imp 491 Fd 700,000 0 700,000 100.0% $0 $700,000 100.0% $0Trans To Work/Comp 601 Fd 200,000 0 200,000 100.0% $0 $200,000 100.0% $0Trans To Fund 605 0 0 0 0.0% $0 $0 0.0% $0Trans To Fund 771 600,000 0 600,000 100.0% $0 $600,000 100.0% $0Total Transfers Out 4,500,000 0 4,500,000 100.0% $0 $4,500,000 100.0% $0Total - General Fund 43,822,238 2,635,978 29,204,207 66.6% 3,281,975 32,486,182 74.1% 11,336,056Street Const Maint & Rep - 201S. C. M. & R. Salaries 970,000 80,833 646,668 66.7% - 646,668 66.7% 323,332S. C. M. & R. Other 322,500 26,875 215,000 66.7% - 215,000 66.7% 107,500Total S. C. M. & R. Fund 1,292,500 107,708 861,668 66.7% - 861,668 66.7% 430,832State Highway Fund- 202Total State Highway Fund 107,500 8,958 75,668 70.4% - 75,668 70.4% 31,832Police Pensionfund - 204Total Police Pension Fund 960,716 70,156 621,656 64.7% - 621,656 64.7% 339,060Fire Pension Fund - 205Total Fire Pension Fund 1,467,055 111,181 978,599 66.7% - 978,599 66.7% 488,456Cable Tv Fund -209Total Cable Tv Fund 423,200 7,797 147,258 34.8% 46,179 193,438 45.7% 229,762Tree Planting Deposit - 211Total Tree Planting Fund 50,000 0 8,154 16.3% 151 8,305 16.6% 41,695Ambulance Billing Fund - 217Ambulance Salaries 328,375 21,957 220,207 67.1% - 220,207 67.1% 108,168Ambulance Other 109,245 11,264 73,708 67.5% 35,229 108,937 99.7% 308Total Ambulance Billing Fund 437,620 33,221 293,915 67.2% 35,229 329,144 75.2% 108,476
Solon Department of Finance Monthly Financial Summary - August 2020
14
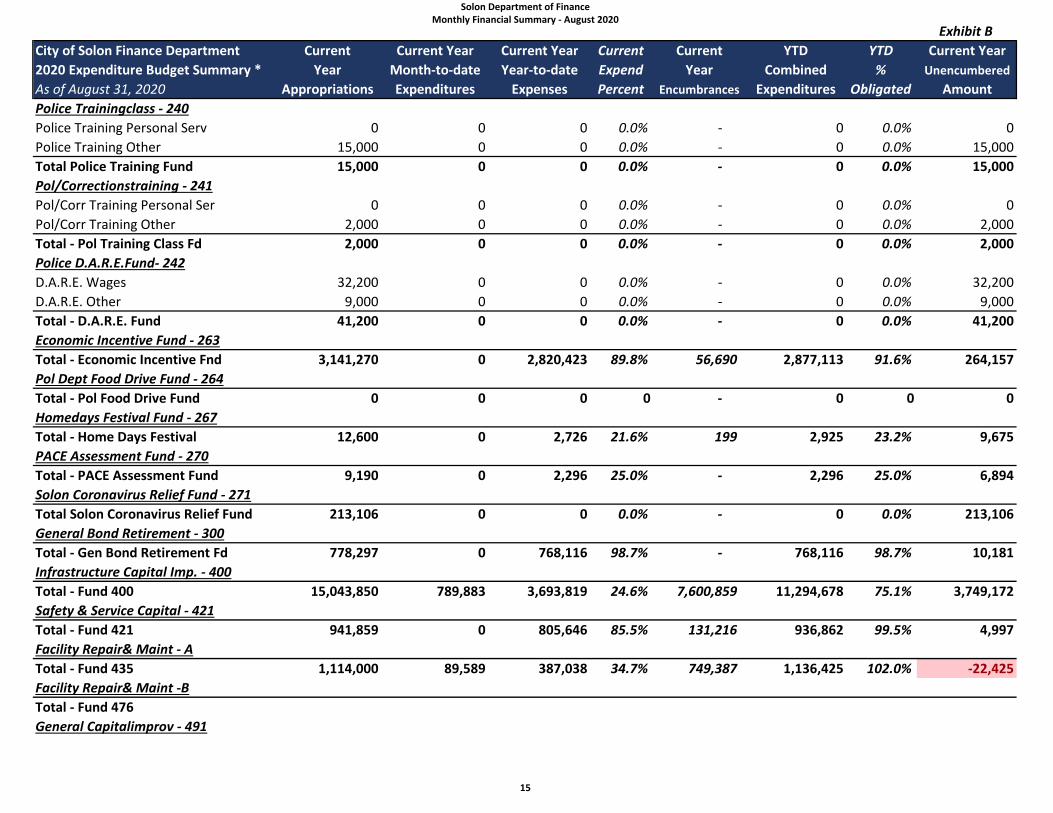
Exhibit BCity of Solon Finance Department Current Current Year Current Year Current Current YTD YTD Current Year2020 Expenditure Budget Summary * Year Month-to-date Year-to-date Expend Year Combined % UnencumberedAs of August 31, 2020 Appropriations Expenditures Expenses Percent Encumbrances Expenditures Obligated AmountPolice Trainingclass - 240Police Training Personal Serv 0 0 0 0.0% - 0 0.0% 0Police Training Other 15,000 0 0 0.0% - 0 0.0% 15,000Total Police Training Fund 15,000 0 0 0.0% - 0 0.0% 15,000Pol/Correctionstraining - 241Pol/Corr Training Personal Ser 0 0 0 0.0% - 0 0.0% 0Pol/Corr Training Other 2,000 0 0 0.0% - 0 0.0% 2,000Total - Pol Training Class Fd 2,000 0 0 0.0% - 0 0.0% 2,000Police D.A.R.E.Fund- 242D.A.R.E. Wages 32,200 0 0 0.0% - 0 0.0% 32,200D.A.R.E. Other 9,000 0 0 0.0% - 0 0.0% 9,000Total - D.A.R.E. Fund 41,200 0 0 0.0% - 0 0.0% 41,200Economic Incentive Fund - 263Total - Economic Incentive Fnd 3,141,270 0 2,820,423 89.8% 56,690 2,877,113 91.6% 264,157Pol Dept Food Drive Fund - 264Total - Pol Food Drive Fund 0 0 0 0 - 0 0 0Homedays Festival Fund - 267Total - Home Days Festival 12,600 0 2,726 21.6% 199 2,925 23.2% 9,675PACE Assessment Fund - 270Total - PACE Assessment Fund 9,190 0 2,296 25.0% - 2,296 25.0% 6,894Solon Coronavirus Relief Fund - 271Total Solon Coronavirus Relief Fund 213,106 0 0 0.0% - 0 0.0% 213,106General Bond Retirement - 300Total - Gen Bond Retirement Fd 778,297 0 768,116 98.7% - 768,116 98.7% 10,181Infrastructure Capital Imp. - 400Total - Fund 400 15,043,850 789,883 3,693,819 24.6% 7,600,859 11,294,678 75.1% 3,749,172Safety & Service Capital - 421Total - Fund 421 941,859 0 805,646 85.5% 131,216 936,862 99.5% 4,997Facility Repair& Maint - ATotal - Fund 435 1,114,000 89,589 387,038 34.7% 749,387 1,136,425 102.0% -22,425Facility Repair& Maint -BTotal - Fund 476General Capitalimprov - 491
Solon Department of Finance Monthly Financial Summary - August 2020
15
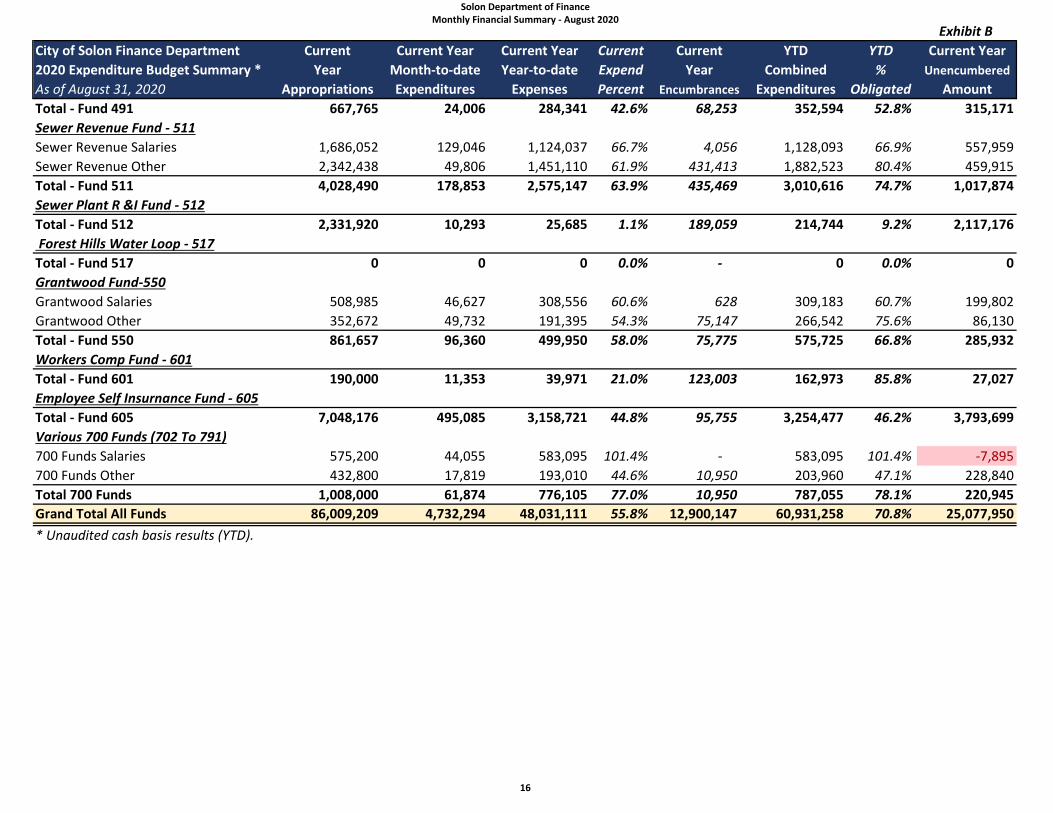
Exhibit BCity of Solon Finance Department Current Current Year Current Year Current Current YTD YTD Current Year2020 Expenditure Budget Summary * Year Month-to-date Year-to-date Expend Year Combined % UnencumberedAs of August 31, 2020 Appropriations Expenditures Expenses Percent Encumbrances Expenditures Obligated AmountTotal - Fund 491 667,765 24,006 284,341 42.6% 68,253 352,594 52.8% 315,171Sewer Revenue Fund - 511Sewer Revenue Salaries 1,686,052 129,046 1,124,037 66.7% 4,056 1,128,093 66.9% 557,959Sewer Revenue Other 2,342,438 49,806 1,451,110 61.9% 431,413 1,882,523 80.4% 459,915Total - Fund 511 4,028,490 178,853 2,575,147 63.9% 435,469 3,010,616 74.7% 1,017,874Sewer Plant R &I Fund - 512Total - Fund 512 2,331,920 10,293 25,685 1.1% 189,059 214,744 9.2% 2,117,176 Forest Hills Water Loop - 517Total - Fund 517 0 0 0 0.0% - 0 0.0% 0Grantwood Fund-550Grantwood Salaries 508,985 46,627 308,556 60.6% 628 309,183 60.7% 199,802Grantwood Other 352,672 49,732 191,395 54.3% 75,147 266,542 75.6% 86,130Total - Fund 550 861,657 96,360 499,950 58.0% 75,775 575,725 66.8% 285,932Workers Comp Fund - 601Total - Fund 601 190,000 11,353 39,971 21.0% 123,003 162,973 85.8% 27,027Employee Self Insurnance Fund - 605Total - Fund 605 7,048,176 495,085 3,158,721 44.8% 95,755 3,254,477 46.2% 3,793,699Various 700 Funds (702 To 791)700 Funds Salaries 575,200 44,055 583,095 101.4% - 583,095 101.4% -7,895700 Funds Other 432,800 17,819 193,010 44.6% 10,950 203,960 47.1% 228,840Total 700 Funds 1,008,000 61,874 776,105 77.0% 10,950 787,055 78.1% 220,945Grand Total All Funds 86,009,209 4,732,294 48,031,111 55.8% 12,900,147 60,931,258 70.8% 25,077,950* Unaudited cash basis results (YTD).
Solon Department of Finance Monthly Financial Summary - August 2020
16
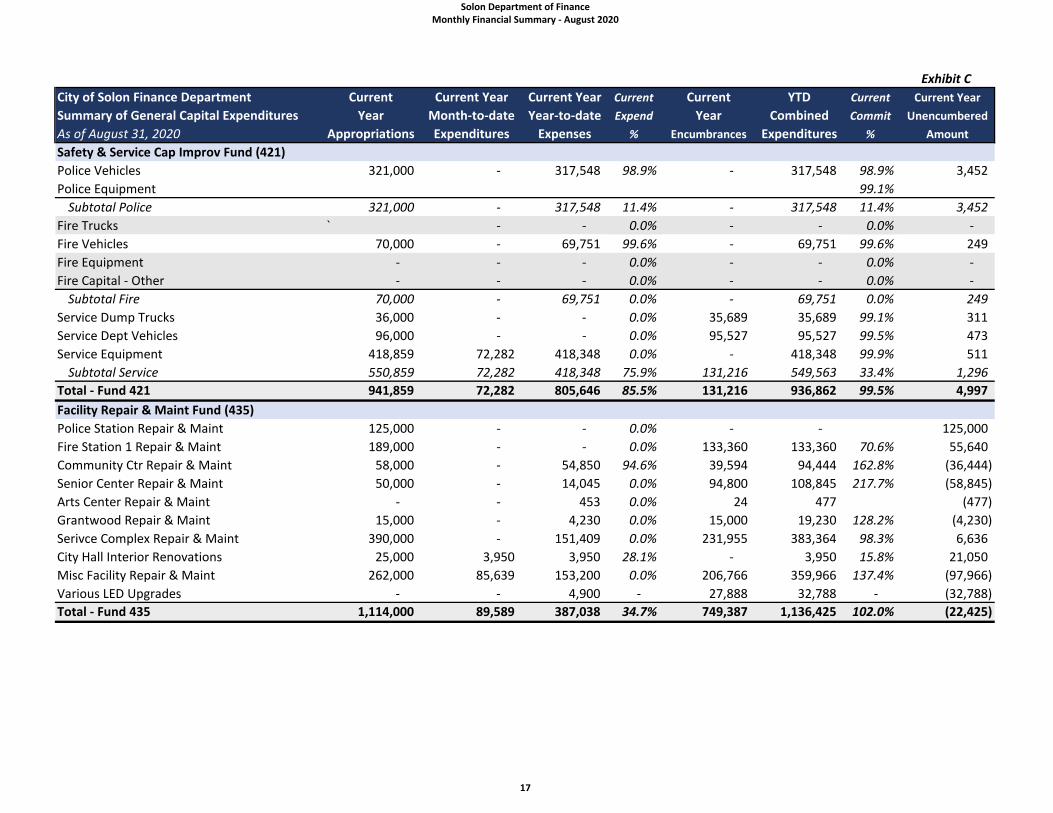
Exhibit CCity of Solon Finance Department Current Current Year Current Year Current Current YTD Current Current YearSummary of General Capital Expenditures Year Month-to-date Year-to-date Expend Year Combined Commit UnencumberedAs of August 31, 2020 Appropriations Expenditures Expenses % Encumbrances Expenditures % AmountSafety & Service Cap Improv Fund (421)Police Vehicles 321,000 - 317,548 98.9% - 317,548 98.9% 3,452 Police Equipment 99.1%
Subtotal Police 321,000 - 317,548 11.4% - 317,548 11.4% 3,452 Fire Trucks ` - - 0.0% - - 0.0% - Fire Vehicles 70,000 - 69,751 99.6% - 69,751 99.6% 249 Fire Equipment - - - 0.0% - - 0.0% - Fire Capital - Other - - - 0.0% - - 0.0% -
Subtotal Fire 70,000 - 69,751 0.0% - 69,751 0.0% 249 Service Dump Trucks 36,000 - - 0.0% 35,689 35,689 99.1% 311 Service Dept Vehicles 96,000 - - 0.0% 95,527 95,527 99.5% 473 Service Equipment 418,859 72,282 418,348 0.0% - 418,348 99.9% 511
Subtotal Service 550,859 72,282 418,348 75.9% 131,216 549,563 33.4% 1,296 Total - Fund 421 941,859 72,282 805,646 85.5% 131,216 936,862 99.5% 4,997 Facility Repair & Maint Fund (435)Police Station Repair & Maint 125,000 - - 0.0% - - 125,000 Fire Station 1 Repair & Maint 189,000 - - 0.0% 133,360 133,360 70.6% 55,640 Community Ctr Repair & Maint 58,000 - 54,850 94.6% 39,594 94,444 162.8% (36,444) Senior Center Repair & Maint 50,000 - 14,045 0.0% 94,800 108,845 217.7% (58,845) Arts Center Repair & Maint - - 453 0.0% 24 477 (477) Grantwood Repair & Maint 15,000 - 4,230 0.0% 15,000 19,230 128.2% (4,230) Serivce Complex Repair & Maint 390,000 - 151,409 0.0% 231,955 383,364 98.3% 6,636 City Hall Interior Renovations 25,000 3,950 3,950 28.1% - 3,950 15.8% 21,050 Misc Facility Repair & Maint 262,000 85,639 153,200 0.0% 206,766 359,966 137.4% (97,966) Various LED Upgrades - - 4,900 - 27,888 32,788 - (32,788) Total - Fund 435 1,114,000 89,589 387,038 34.7% 749,387 1,136,425 102.0% (22,425)
Solon Department of Finance Monthly Financial Summary - August 2020
17
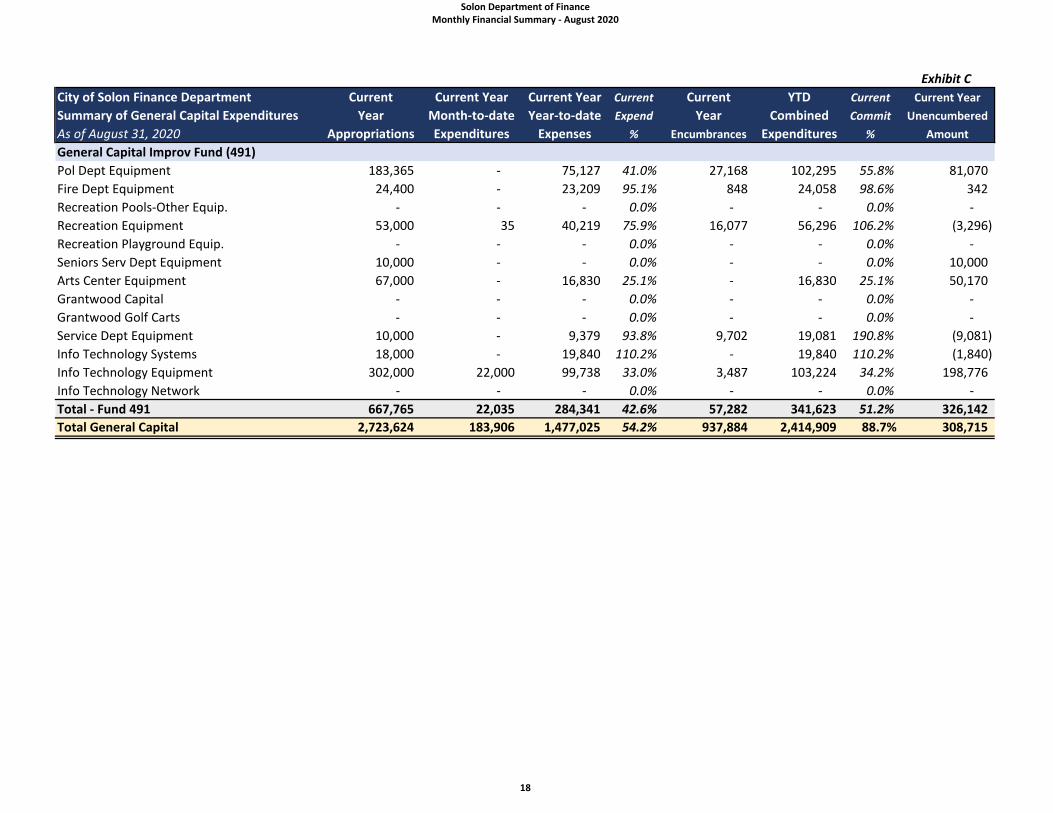
Exhibit CCity of Solon Finance Department Current Current Year Current Year Current Current YTD Current Current YearSummary of General Capital Expenditures Year Month-to-date Year-to-date Expend Year Combined Commit UnencumberedAs of August 31, 2020 Appropriations Expenditures Expenses % Encumbrances Expenditures % AmountGeneral Capital Improv Fund (491)Pol Dept Equipment 183,365 - 75,127 41.0% 27,168 102,295 55.8% 81,070 Fire Dept Equipment 24,400 - 23,209 95.1% 848 24,058 98.6% 342 Recreation Pools-Other Equip. - - - 0.0% - - 0.0% - Recreation Equipment 53,000 35 40,219 75.9% 16,077 56,296 106.2% (3,296) Recreation Playground Equip. - - - 0.0% - - 0.0% - Seniors Serv Dept Equipment 10,000 - - 0.0% - - 0.0% 10,000 Arts Center Equipment 67,000 - 16,830 25.1% - 16,830 25.1% 50,170 Grantwood Capital - - - 0.0% - - 0.0% - Grantwood Golf Carts - - - 0.0% - - 0.0% - Service Dept Equipment 10,000 - 9,379 93.8% 9,702 19,081 190.8% (9,081) Info Technology Systems 18,000 - 19,840 110.2% - 19,840 110.2% (1,840) Info Technology Equipment 302,000 22,000 99,738 33.0% 3,487 103,224 34.2% 198,776 Info Technology Network - - - 0.0% - - 0.0% - Total - Fund 491 667,765 22,035 284,341 42.6% 57,282 341,623 51.2% 326,142 Total General Capital 2,723,624 183,906 1,477,025 54.2% 937,884 2,414,909 88.7% 308,715
Solon Department of Finance Monthly Financial Summary - August 2020
18
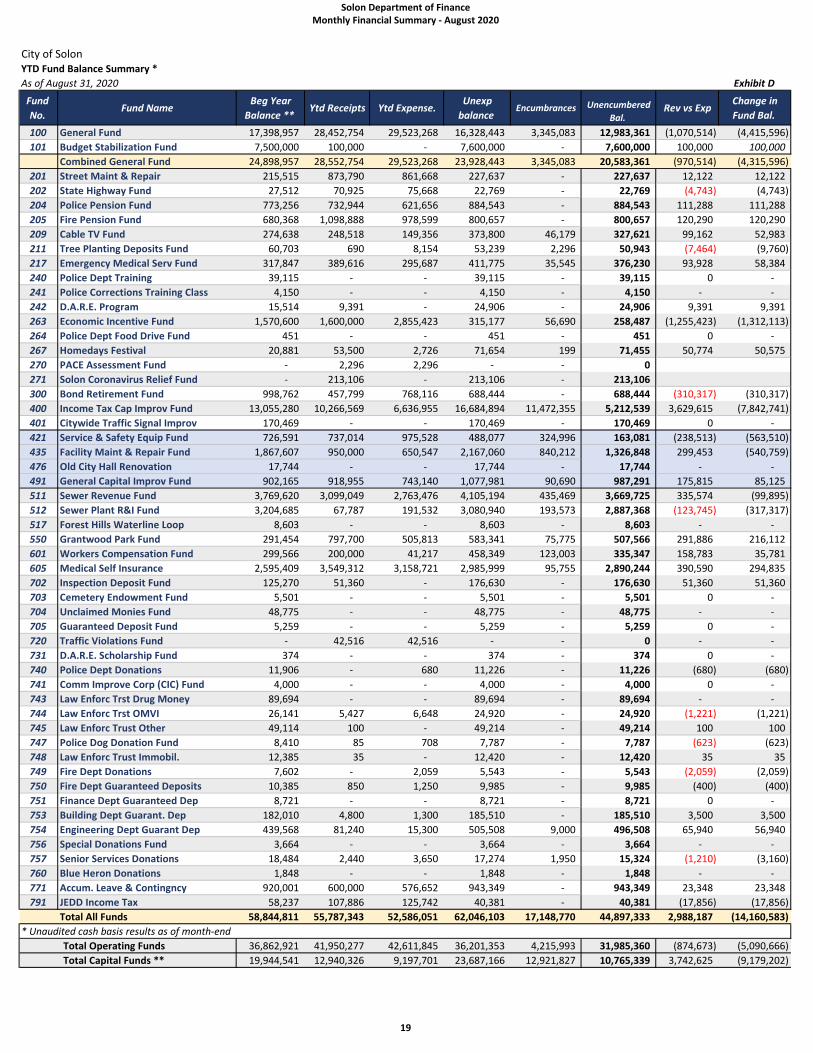
City of SolonYTD Fund Balance Summary *As of August 31, 2020 Exhibit D
Fund No.
Fund Name Beg Year
Balance ** Ytd Receipts Ytd Expense.
Unexp balance
Encumbrances Unencumbered Bal.
Rev vs Exp Change in Fund Bal.
100 General Fund 17,398,957 28,452,754 29,523,268 16,328,443 3,345,083 12,983,361 (1,070,514) (4,415,596) 101 Budget Stabilization Fund 7,500,000 100,000 - 7,600,000 - 7,600,000 100,000 100,000
Combined General Fund 24,898,957 28,552,754 29,523,268 23,928,443 3,345,083 20,583,361 (970,514) (4,315,596) 201 Street Maint & Repair 215,515 873,790 861,668 227,637 - 227,637 12,122 12,122 202 State Highway Fund 27,512 70,925 75,668 22,769 - 22,769 (4,743) (4,743) 204 Police Pension Fund 773,256 732,944 621,656 884,543 - 884,543 111,288 111,288 205 Fire Pension Fund 680,368 1,098,888 978,599 800,657 - 800,657 120,290 120,290 209 Cable TV Fund 274,638 248,518 149,356 373,800 46,179 327,621 99,162 52,983 211 Tree Planting Deposits Fund 60,703 690 8,154 53,239 2,296 50,943 (7,464) (9,760) 217 Emergency Medical Serv Fund 317,847 389,616 295,687 411,775 35,545 376,230 93,928 58,384 240 Police Dept Training 39,115 - - 39,115 - 39,115 0 - 241 Police Corrections Training Class 4,150 - - 4,150 - 4,150 - - 242 D.A.R.E. Program 15,514 9,391 - 24,906 - 24,906 9,391 9,391 263 Economic Incentive Fund 1,570,600 1,600,000 2,855,423 315,177 56,690 258,487 (1,255,423) (1,312,113) 264 Police Dept Food Drive Fund 451 - - 451 - 451 0 - 267 Homedays Festival 20,881 53,500 2,726 71,654 199 71,455 50,774 50,575 270 PACE Assessment Fund - 2,296 2,296 - - 0271 Solon Coronavirus Relief Fund - 213,106 - 213,106 - 213,106300 Bond Retirement Fund 998,762 457,799 768,116 688,444 - 688,444 (310,317) (310,317) 400 Income Tax Cap Improv Fund 13,055,280 10,266,569 6,636,955 16,684,894 11,472,355 5,212,539 3,629,615 (7,842,741) 401 Citywide Traffic Signal Improv 170,469 - - 170,469 - 170,469 0 - 421 Service & Safety Equip Fund 726,591 737,014 975,528 488,077 324,996 163,081 (238,513) (563,510) 435 Facility Maint & Repair Fund 1,867,607 950,000 650,547 2,167,060 840,212 1,326,848 299,453 (540,759) 476 Old City Hall Renovation 17,744 - - 17,744 - 17,744 - - 491 General Capital Improv Fund 902,165 918,955 743,140 1,077,981 90,690 987,291 175,815 85,125 511 Sewer Revenue Fund 3,769,620 3,099,049 2,763,476 4,105,194 435,469 3,669,725 335,574 (99,895) 512 Sewer Plant R&I Fund 3,204,685 67,787 191,532 3,080,940 193,573 2,887,368 (123,745) (317,317) 517 Forest Hills Waterline Loop 8,603 - - 8,603 - 8,603 - - 550 Grantwood Park Fund 291,454 797,700 505,813 583,341 75,775 507,566 291,886 216,112 601 Workers Compensation Fund 299,566 200,000 41,217 458,349 123,003 335,347 158,783 35,781 605 Medical Self Insurance 2,595,409 3,549,312 3,158,721 2,985,999 95,755 2,890,244 390,590 294,835 702 Inspection Deposit Fund 125,270 51,360 - 176,630 - 176,630 51,360 51,360 703 Cemetery Endowment Fund 5,501 - - 5,501 - 5,501 0 - 704 Unclaimed Monies Fund 48,775 - - 48,775 - 48,775 - - 705 Guaranteed Deposit Fund 5,259 - - 5,259 - 5,259 0 - 720 Traffic Violations Fund - 42,516 42,516 - - 0 - - 731 D.A.R.E. Scholarship Fund 374 - - 374 - 374 0 - 740 Police Dept Donations 11,906 - 680 11,226 - 11,226 (680) (680) 741 Comm Improve Corp (CIC) Fund 4,000 - - 4,000 - 4,000 0 - 743 Law Enforc Trst Drug Money 89,694 - - 89,694 - 89,694 - - 744 Law Enforc Trst OMVI 26,141 5,427 6,648 24,920 - 24,920 (1,221) (1,221) 745 Law Enforc Trust Other 49,114 100 - 49,214 - 49,214 100 100 747 Police Dog Donation Fund 8,410 85 708 7,787 - 7,787 (623) (623) 748 Law Enforc Trust Immobil. 12,385 35 - 12,420 - 12,420 35 35 749 Fire Dept Donations 7,602 - 2,059 5,543 - 5,543 (2,059) (2,059) 750 Fire Dept Guaranteed Deposits 10,385 850 1,250 9,985 - 9,985 (400) (400) 751 Finance Dept Guaranteed Dep 8,721 - - 8,721 - 8,721 0 - 753 Building Dept Guarant. Dep 182,010 4,800 1,300 185,510 - 185,510 3,500 3,500 754 Engineering Dept Guarant Dep 439,568 81,240 15,300 505,508 9,000 496,508 65,940 56,940 756 Special Donations Fund 3,664 - - 3,664 - 3,664 - - 757 Senior Services Donations 18,484 2,440 3,650 17,274 1,950 15,324 (1,210) (3,160) 760 Blue Heron Donations 1,848 - - 1,848 - 1,848 - - 771 Accum. Leave & Contingncy 920,001 600,000 576,652 943,349 - 943,349 23,348 23,348 791 JEDD Income Tax 58,237 107,886 125,742 40,381 - 40,381 (17,856) (17,856)
Total All Funds 58,844,811 55,787,343 52,586,051 62,046,103 17,148,770 44,897,333 2,988,187 (14,160,583) * Unaudited cash basis results as of month-end
Total Operating Funds 36,862,921 41,950,277 42,611,845 36,201,353 4,215,993 31,985,360 (874,673) (5,090,666) Total Capital Funds ** 19,944,541 12,940,326 9,197,701 23,687,166 12,921,827 10,765,339 3,742,625 (9,179,202)
Solon Department of Finance Monthly Financial Summary - August 2020
19
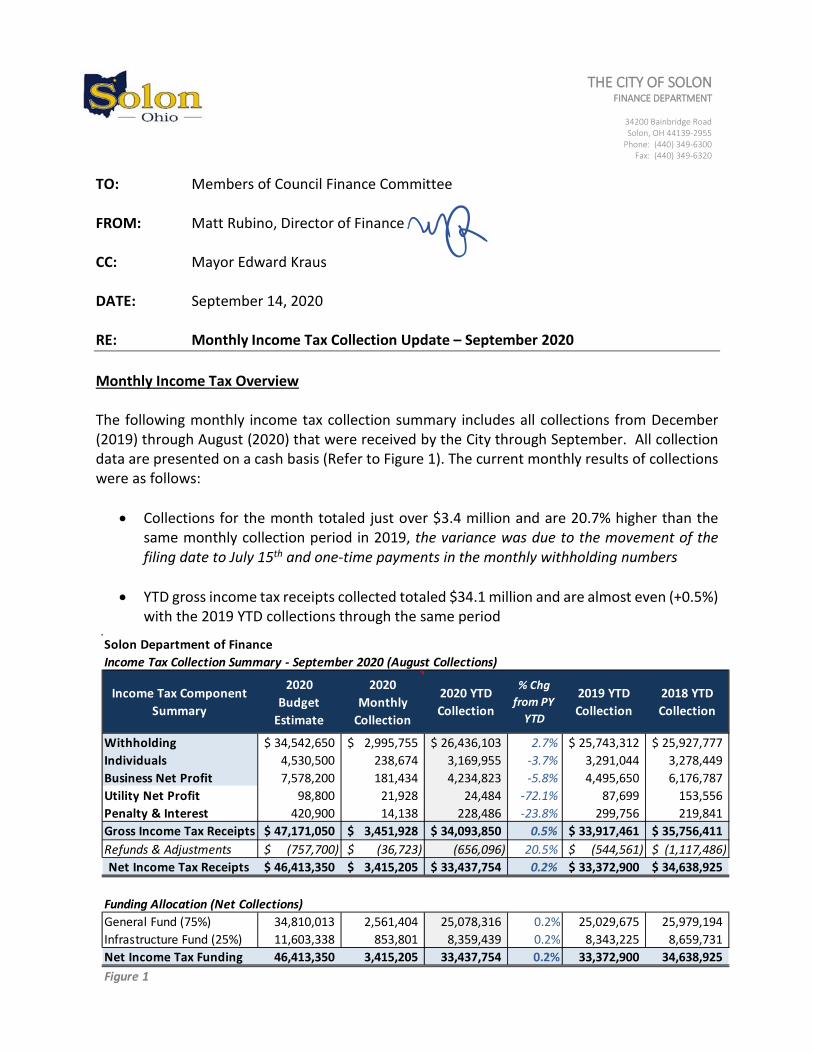
TO: Members of Council Finance Committee FROM: Matt Rubino, Director of Finance CC: Mayor Edward Kraus DATE: September 14, 2020 RE: Monthly Income Tax Collection Update – September 2020 Monthly Income Tax Overview The following monthly income tax collection summary includes all collections from December (2019) through August (2020) that were received by the City through September. All collection data are presented on a cash basis (Refer to Figure 1). The current monthly results of collections were as follows:
• Collections for the month totaled just over $3.4 million and are 20.7% higher than the same monthly collection period in 2019, the variance was due to the movement of the filing date to July 15th and one-time payments in the monthly withholding numbers
• YTD gross income tax receipts collected totaled $34.1 million and are almost even (+0.5%) with the 2019 YTD collections through the same period
THE CITY OF SOLON FINANCE DEPARTMENT
34200 Bainbridge Road Solon, OH 44139-2955
Phone: (440) 349-6300 Fax: (440) 349-6320
Solon Department of FinanceIncome Tax Collection Summary - September 2020 (August Collections)
Income Tax Component Summary
2020 Budget
Estimate
2020 Monthly
Collection
2020 YTD Collection
% Chg from PY
YTD
2019 YTD Collection
2018 YTD Collection
Withholding 34,542,650$ 2,995,755$ 26,436,103$ 2.7% 25,743,312$ 25,927,777$ Individuals 4,530,500 238,674 3,169,955 -3.7% 3,291,044 3,278,449 Business Net Profit 7,578,200 181,434 4,234,823 -5.8% 4,495,650 6,176,787 Utility Net Profit 98,800 21,928 24,484 -72.1% 87,699 153,556 Penalty & Interest 420,900 14,138 228,486 -23.8% 299,756 219,841 Gross Income Tax Receipts 47,171,050$ 3,451,928$ 34,093,850$ 0.5% 33,917,461$ 35,756,411$ Refunds & Adjustments (757,700)$ (36,723)$ (656,096) 20.5% (544,561)$ (1,117,486)$ Net Income Tax Receipts 46,413,350$ 3,415,205$ 33,437,754$ 0.2% 33,372,900$ 34,638,925$
Funding Allocation (Net Collections)General Fund (75%) 34,810,013 2,561,404 25,078,316 0.2% 25,029,675 25,979,194 Infrastructure Fund (25%) 11,603,338 853,801 8,359,439 0.2% 8,343,225 8,659,731 Net Income Tax Funding 46,413,350 3,415,205 33,437,754 0.2% 33,372,900 34,638,925 Figure 1
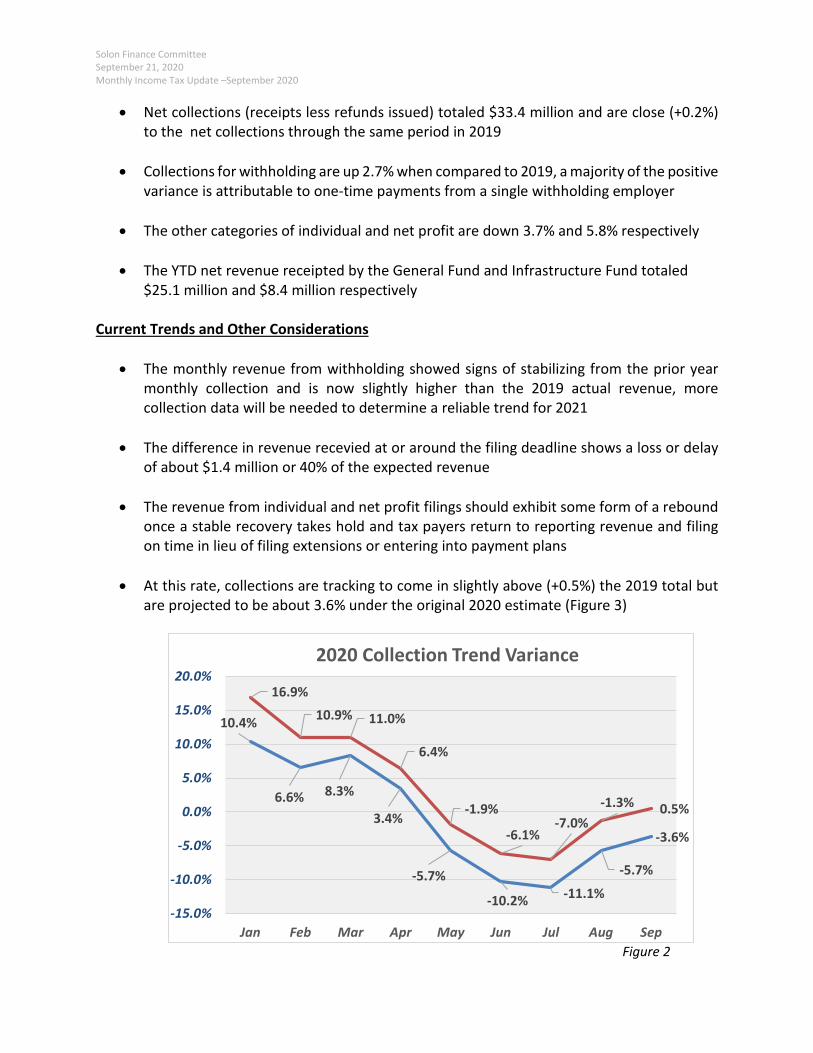
Solon Finance Committee September 21, 2020 Monthly Income Tax Update –September 2020
• Net collections (receipts less refunds issued) totaled $33.4 million and are close (+0.2%) to the net collections through the same period in 2019
• Collections for withholding are up 2.7% when compared to 2019, a majority of the positive
variance is attributable to one-time payments from a single withholding employer
• The other categories of individual and net profit are down 3.7% and 5.8% respectively
• The YTD net revenue receipted by the General Fund and Infrastructure Fund totaled $25.1 million and $8.4 million respectively
Current Trends and Other Considerations
• The monthly revenue from withholding showed signs of stabilizing from the prior year monthly collection and is now slightly higher than the 2019 actual revenue, more collection data will be needed to determine a reliable trend for 2021
• The difference in revenue recevied at or around the filing deadline shows a loss or delay of about $1.4 million or 40% of the expected revenue
• The revenue from individual and net profit filings should exhibit some form of a rebound once a stable recovery takes hold and tax payers return to reporting revenue and filing on time in lieu of filing extensions or entering into payment plans
• At this rate, collections are tracking to come in slightly above (+0.5%) the 2019 total but
are projected to be about 3.6% under the original 2020 estimate (Figure 3)
Figure 2
10.4%
6.6% 8.3%
3.4%
-5.7%
-10.2% -11.1%
-5.7%
-3.6%
16.9%
10.9% 11.0%
6.4%
-1.9%
-6.1%-7.0%
-1.3% 0.5%
-15.0%
-10.0%
-5.0%
0.0%
5.0%
10.0%
15.0%
20.0%
Jan Feb Mar Apr May Jun Jul Aug Sep
2020 Collection Trend Variance
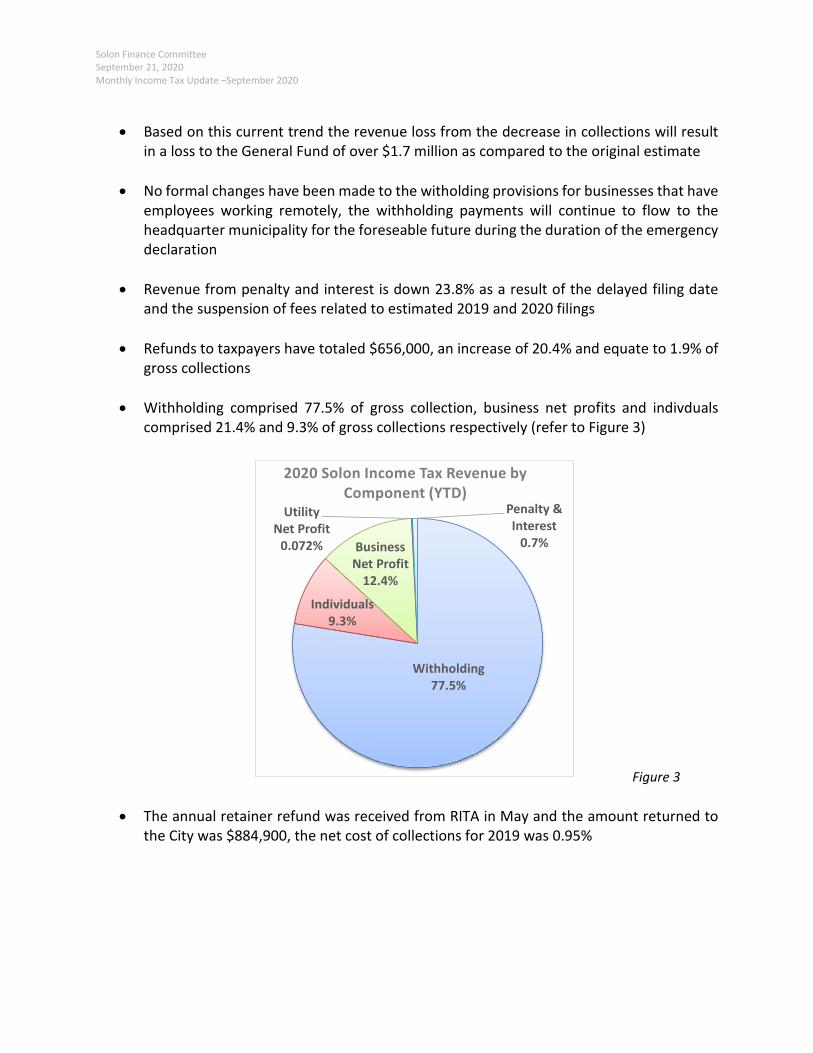
Solon Finance Committee September 21, 2020 Monthly Income Tax Update –September 2020
• Based on this current trend the revenue loss from the decrease in collections will result
in a loss to the General Fund of over $1.7 million as compared to the original estimate
• No formal changes have been made to the witholding provisions for businesses that have employees working remotely, the withholding payments will continue to flow to the headquarter municipality for the foreseable future during the duration of the emergency declaration
• Revenue from penalty and interest is down 23.8% as a result of the delayed filing date and the suspension of fees related to estimated 2019 and 2020 filings
• Refunds to taxpayers have totaled $656,000, an increase of 20.4% and equate to 1.9% of
gross collections • Withholding comprised 77.5% of gross collection, business net profits and indivduals
comprised 21.4% and 9.3% of gross collections respectively (refer to Figure 3)
Figure 3
• The annual retainer refund was received from RITA in May and the amount returned to the City was $884,900, the net cost of collections for 2019 was 0.95%
Withholding77.5%
Individuals9.3%
Business Net Profit
12.4%
Utility Net Profit
0.072%
Penalty & Interest
0.7%
2020 Solon Income Tax Revenue by Component (YTD)
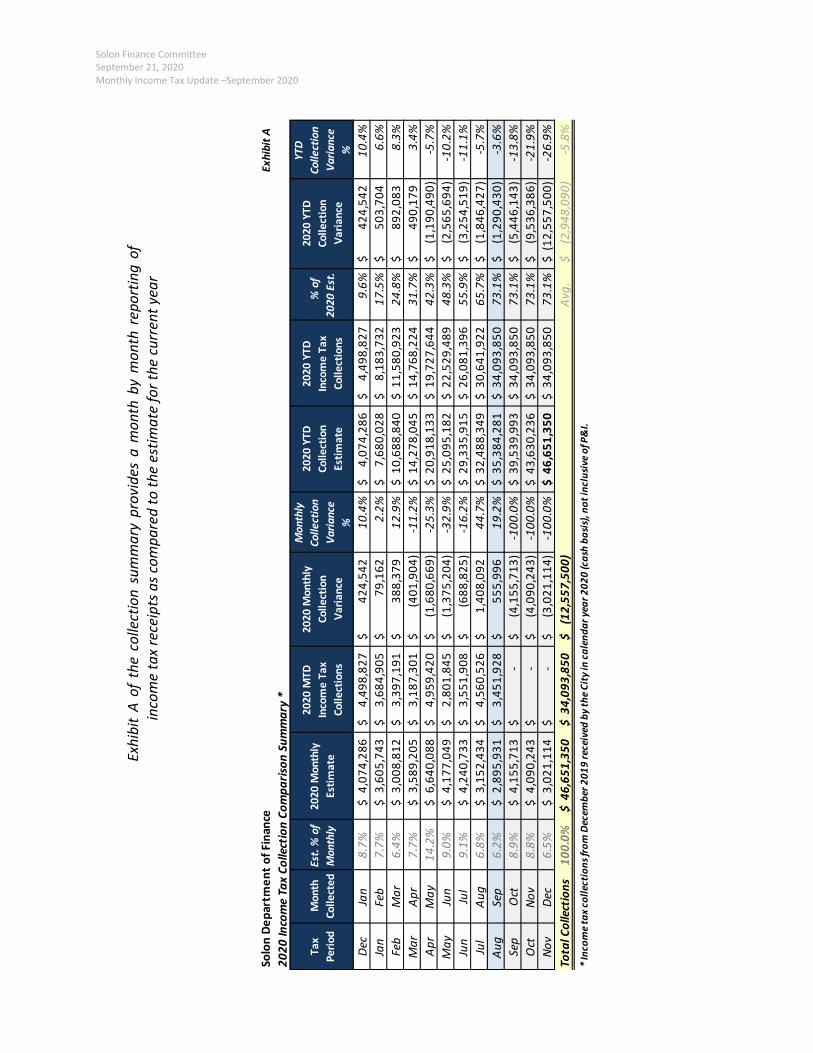
Solon Finance Committee September 21, 2020 Monthly Income Tax Update –September 2020
Exhi
bit
A of
the
col
lect
ion
sum
mar
y pr
ovid
es a
mon
th b
y m
onth
rep
ortin
g of
in
com
e ta
x re
ceip
ts a
s com
pare
d to
the
estim
ate
for t
he c
urre
nt y
ear
Solo
n De
part
men
t of F
inan
ceEx
hibi
t A20
20 In
com
e Ta
x Co
llect
ion
Com
paris
on S
umm
ary
*
Tax
Perio
dM
onth
Co
llect
edEs
t. %
of
Mon
thly
2020
Mon
thly
Es
timat
e
2020
MTD
In
com
e Ta
x Co
llect
ions
2020
Mon
thly
Co
llect
ion
Varia
nce
Mon
thly
Co
llect
ion
Varia
nce
%
2020
YTD
Co
llect
ion
Estim
ate
2020
YTD
In
com
e Ta
x Co
llect
ions
%
of
2020
Est
.
2020
YTD
Co
llect
ion
Varia
nce
YTD
Co
llect
ion
Varia
nce
%De
cJa
n8.
7%4,
074,
286
$ 4,
498,
827
$
42
4,54
2$
10.4
%4,
074,
286
$
4,
498,
827
$
9.
6%42
4,54
2$
10
.4%
Jan
Feb
7.7%
3,60
5,74
3$
3,68
4,90
5$
79,1
62$
2.2%
7,68
0,02
8$
8,18
3,73
2$
17.5
%50
3,70
4$
6.
6%Fe
bM
ar6.
4%3,
008,
812
$ 3,
397,
191
$
38
8,37
9$
12.9
%10
,688
,840
$
11,5
80,9
23$
24
.8%
892,
083
$
8.3%
Mar
Apr
7.7%
3,58
9,20
5$
3,18
7,30
1$
(401
,904
)$
-1
1.2%
14,2
78,0
45$
14
,768
,224
$
31.7
%49
0,17
9$
3.
4%Ap
rM
ay14
.2%
6,64
0,08
8$
4,95
9,42
0$
(1,6
80,6
69)
$
-2
5.3%
20,9
18,1
33$
19
,727
,644
$
42.3
%(1
,190
,490
)$
-5.7
%M
ayJu
n9.
0%4,
177,
049
$ 2,
801,
845
$
(1
,375
,204
)$
-32.
9%25
,095
,182
$
22,5
29,4
89$
48
.3%
(2,5
65,6
94)
$
-1
0.2%
Jun
Jul
9.1%
4,24
0,73
3$
3,55
1,90
8$
(688
,825
)$
-1
6.2%
29,3
35,9
15$
26
,081
,396
$
55.9
%(3
,254
,519
)$
-11.
1%Ju
lAu
g6.
8%3,
152,
434
$ 4,
560,
526
$
1,
408,
092
$
44
.7%
32,4
88,3
49$
30
,641
,922
$
65.7
%(1
,846
,427
)$
-5.7
%Au
gSe
p6.
2%2,
895,
931
$ 3,
451,
928
$
55
5,99
6$
19.2
%35
,384
,281
$
34,0
93,8
50$
73
.1%
(1,2
90,4
30)
$
-3
.6%
Sep
Oct
8.9%
4,15
5,71
3$
-$
(4,1
55,7
13)
$
-1
00.0
%39
,539
,993
$
34,0
93,8
50$
73
.1%
(5,4
46,1
43)
$
-1
3.8%
Oct
Nov
8.8%
4,09
0,24
3$
-$
(4,0
90,2
43)
$
-1
00.0
%43
,630
,236
$
34,0
93,8
50$
73
.1%
(9,5
36,3
86)
$
-2
1.9%
Nov
Dec
6.5%
3,02
1,11
4$
-$
(3,0
21,1
14)
$
-1
00.0
%46
,651
,350
$
34,0
93,8
50$
73
.1%
(12,
557,
500)
$
-26.
9%To
tal C
olle
ctio
ns10
0.0%
46,6
51,3
50$
34
,093
,850
$
(12,
557,
500)
$
Avg.
(2,9
48,0
90)
$
-5.8
%*
Inco
me
tax
colle
ctio
ns fr
om D
ecem
ber 2
019
rece
ived
by
the
City
in c
alen
dar y
ear 2
020
(cas
h ba
sis)
, not
incl
usiv
e of
P&
I.
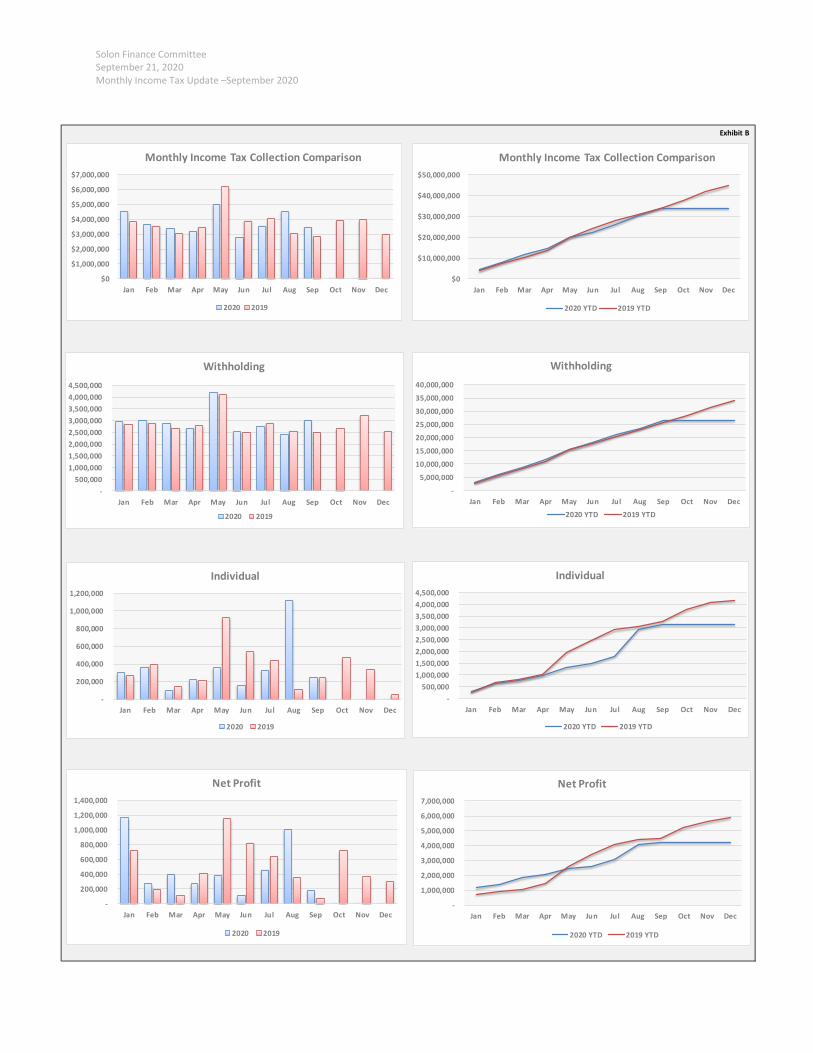
Solon Finance Committee September 21, 2020 Monthly Income Tax Update –September 2020
Exhibit B
- 500,000
1,000,000 1,500,000 2,000,000 2,500,000 3,000,000 3,500,000 4,000,000 4,500,000
Jan Feb Mar Apr May Jun Jul Aug Sep Oct Nov Dec
Withholding
2020 2019
-
200,000
400,000
600,000
800,000
1,000,000
1,200,000
Jan Feb Mar Apr May Jun Jul Aug Sep Oct Nov Dec
Individual
2020 2019
-
200,000
400,000
600,000
800,000
1,000,000
1,200,000
1,400,000
Jan Feb Mar Apr May Jun Jul Aug Sep Oct Nov Dec
Net Profit
2020 2019
-
1,000,000
2,000,000
3,000,000
4,000,000
5,000,000
6,000,000
7,000,000
Jan Feb Mar Apr May Jun Jul Aug Sep Oct Nov Dec
Net Profit
2020 YTD 2019 YTD
- 500,000
1,000,000 1,500,000 2,000,000 2,500,000 3,000,000 3,500,000 4,000,000 4,500,000
Jan Feb Mar Apr May Jun Jul Aug Sep Oct Nov Dec
Individual
2020 YTD 2019 YTD
-
5,000,000
10,000,000
15,000,000
20,000,000
25,000,000
30,000,000
35,000,000
40,000,000
Jan Feb Mar Apr May Jun Jul Aug Sep Oct Nov Dec
Withholding
2020 YTD 2019 YTD
$0
$10,000,000
$20,000,000
$30,000,000
$40,000,000
$50,000,000
Jan Feb Mar Apr May Jun Jul Aug Sep Oct Nov Dec
Monthly Income Tax Collection Comparison
2020 YTD 2019 YTD
$0
$1,000,000
$2,000,000
$3,000,000
$4,000,000
$5,000,000
$6,000,000
$7,000,000
Jan Feb Mar Apr May Jun Jul Aug Sep Oct Nov Dec
Monthly Income Tax Collection Comparison
2020 2019


