Embed Size (px)
Citation preview
Finnsjön study site.Scope of activities and main results
Kaj Ahlbom , Jan-Erik Andersson15, Peter Andersson7,Tomas Ittner', Christer Ljunggren \ Sven Tirén?
! Conterra AB' Geosigma AB' Renco AB
December 1992
FINNSJON STUDY SITE.SCOPE OF ACTIVITIES AND MAIN RESULTS
Kaj Ahlbom1, Jan-Erik Andersson2, Peter Andersson2,Thomas Ittner2, Christer Ljunggren3, Sven Tirén2
1 Conterra AB2 Geosigma AB3 Renco AB
December 1992
This report concerns a study which was conductedfor SKB. The conclusions and viewpoints presentedin the report are those of the author(s) and do notnecessarily coincide with those of the client.
Information on SKB technical reports from1977-1978 (TR 121), 1979 (TR 79-28), 1980 (TR 80-26),1981 (TR 81-17), 1982 (TR 82-28), 1983 (TR 83-77),1984 (TR 85-01), 1985 (TR 85-20), 1986 (TR 86-31),1987 (TR 87-33), 1988 (TR 88-32), 1989 (TR 89-40),1990 (TR 90-46) and 1991 (TR 91-64) is availablethrough SKB.
FINNSJON STUDY SITESCOPE OF ACTIVITIES AND MAIN RESULTS
Kaj Ahlbom*, Jan-Erik Andersson", Peter Andersson"Thomas Ittner", Christer Ljunggren*", Sven Tirén"
December 1992
Keywords: Finnsjön, saline groundwater, subhorizontal fracture zone,hydraulic tests, tracer tests, groundwater sampling, rock stressmeasurements.
Conterra AB'Geo«igma AB"Renco AB'"
ABSTRACT (ENGLISH)
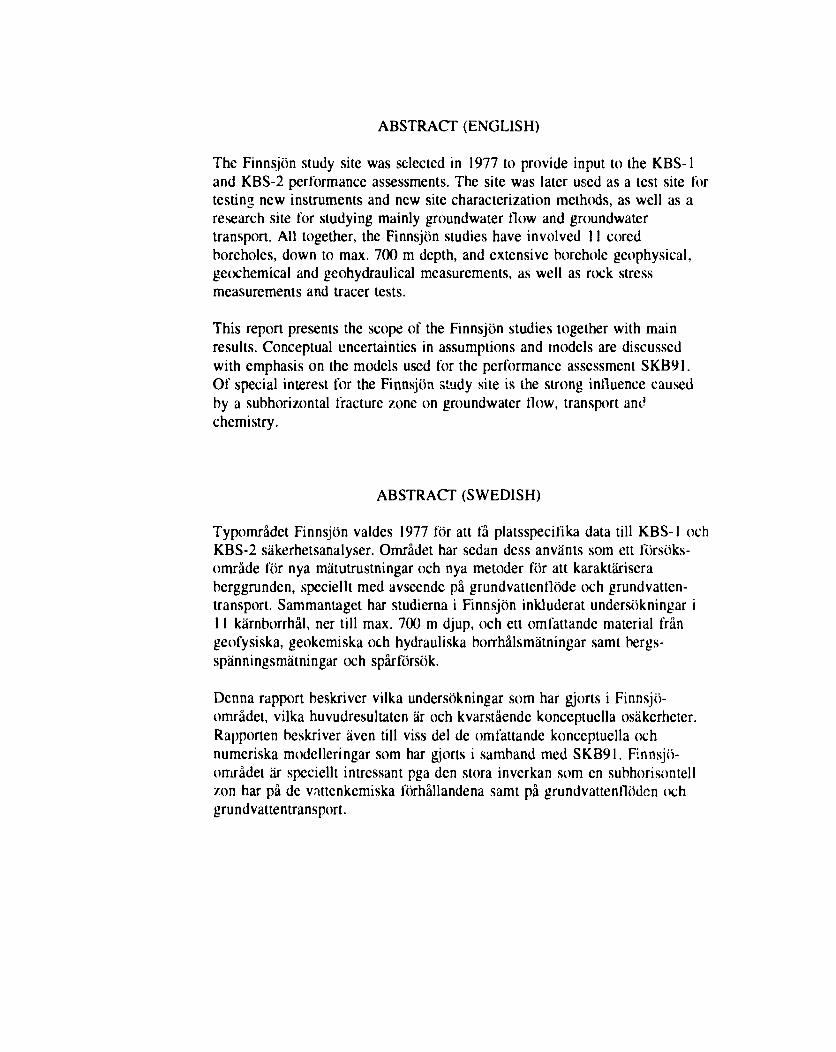
The Finnsjön study site was selected in 1977 to provide input to the KBS-1and KBS-2 performance assessments. The site was later used as a test site fortesting new instruments and new site characterization methods, as well as aresearch site for studying mainly groundwater flow and groundwatertransport. All together, the Finnsjön studies have involved 11 coredboreholes, down to max. 700 m depth, and extensive borehole geophysical,geochemical and geohydraulical measurements, as well as rock stressmeasurements and tracer tests.
This report presents the scope of the Finnsjön studies together with mainresults. Conceptual uncertainties in assumptions and models are discussedwith emphasis on the models used for the performance assessment SKB91.Of special interest for the Finnsjön ätudy site is ihe strong influence causedby a subhorizontal fracture zone on groundwater flow, transport andchemistry.
ABSTRACT (SWEDISH)
Typområdet Finnsjön valdes 1977 för att få platsspecifika data till KBS-1 ochKBS-2 säkerhetsanalyser. Området har sedan dess använts som ett försöks-område för nya mätutrustningar och nya metoder för att karaktäriseraberggrunden, speciellt med avseende på grundvattenflöde och grundvatten-transport. Sammantaget har studierna i Finnsjön inkluderat undersökningar i11 kärnborrhål, ner till max. 700 m djup, och ett omfattande material frängeofysiska, geokemiska och hydrauliska borrhålsmätningar samt bergs-spänningsmätningar och spårförsök.
Denna rapport beskriver vilka undersökningar som har gjorts i Finnsjö-området, vilka huvudresultaten är och kvarstående konceptuella osäkerheter.Rapporten beskriver även till viss del de omfattande konceptuella ochnumeriska modelleringar som har gjorts i samband med SKB91. Finnsjö-området är speciellt intressant pga den stora inverkan som en subhorisontellzon har på de vattenkemiska förhållandena samt på grundvattenflöden ochgrundvattentransport.
PREFACE
During the period from 1977-1986 SKB (Swedish Nuclear Fuel and WasteManagement Co) performed surface and borehole investigations of 14 studysites for the purpose of assessing their suitability for a repository of spentnuclear fuel. The next phase in the SKB site selection programme will be toperform detailed characterization, including characterization from shaftsand/or tunnels, of two or three sites. The detailed investigations will continueover several years to provide all the data needed for a licensing application tobuild a repository. Such an application is foreseen to be given to theauthorities around the year 2003.
It is presently not clear if anyone of the study sites will be selected as a sitefor detailed characterization. Other sites with geological and/or socio-economical characteristics judged more favourable may very well be selected.However, as a part of the background documentation needed for the siteselection studies to come, summary reports will be prepared for most studysites. These reports will include scope of activities, main results, uncertaintiesand need of complementary investigations.
This report concerns the Finnsjön study site. The report has been written bythe following authors; Kaj Ahlbom and Sven Tirén (scope of activities andgeologic model), Jan-Erik Andersson (geohydrological model), Thomas Ittncr(groundwatcr chemistry), Peter Andersson (solute transport) and ChristerLjunggren (rock mechanics).
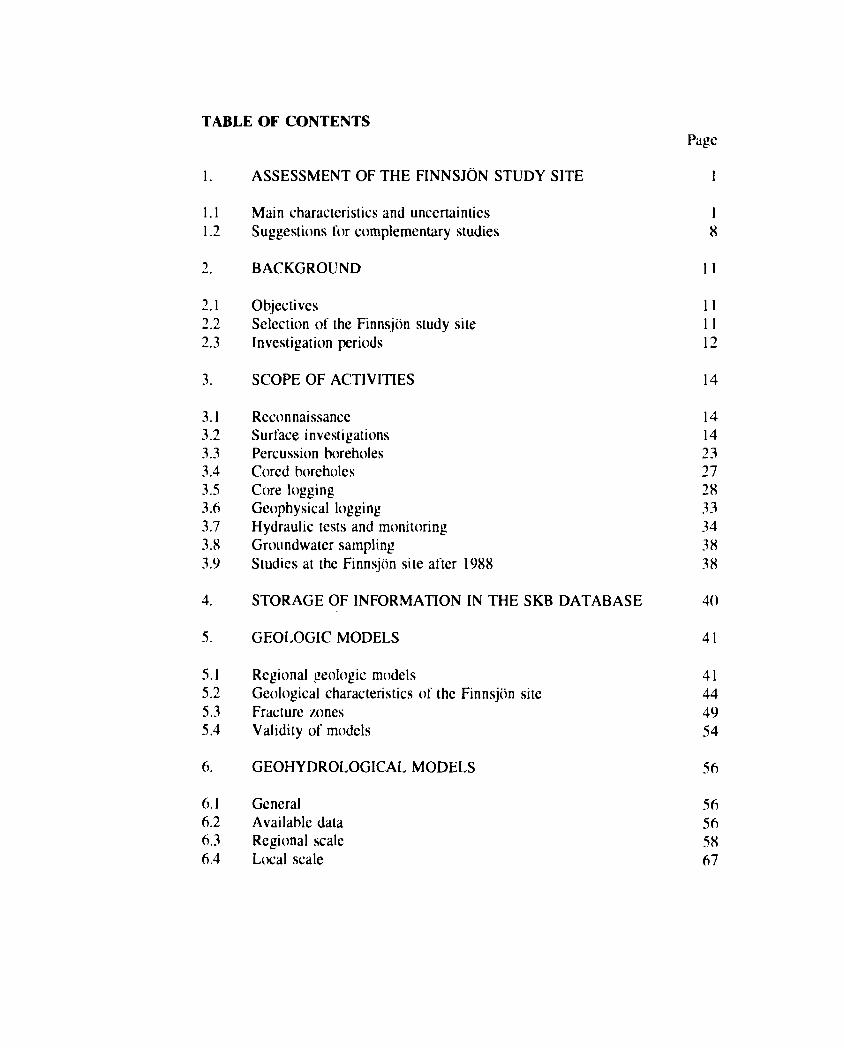
TABLE OF CONTENTS
Page
1. ASSESSMENT OF THE FINNSJÖN STUDY SITE 1
1.1 Main characteristics and uncertainties 1
1.2 Suggestions for complementary studies 8
2. BACKGROUND 11
2.1 Objectives 112.2 Selection of the Finnsjön study site 11
2.3 Investigation periods 12
3. SCOPE OF ACTIVITIES 14
3.1 Reconnaissance 143.2 Surface investigations 143.3 Percussion boreholes 233.4 Cored boreholes 273.5 Core logging 283.6 Geophysical logging 333.7 Hydraulic tests and monitoring 343.8 Groundwater sampling 383.9 Studies at the Finnsjön site after 1988 38
4. STORAGE OF INFORMATION IN THE SKB DATABASE 40
5. GEOLOGIC MODELS 41
5.1 Regional geologic models 415.2 Geological characteristics of the Finnsjön site 445.3 Fracture zones 495.4 Validity of models 546. GEOHYDROLOGICAL MODELS 566.1 General 566.2 Available data 566.3 Regional scale 586.4 Local scale 67
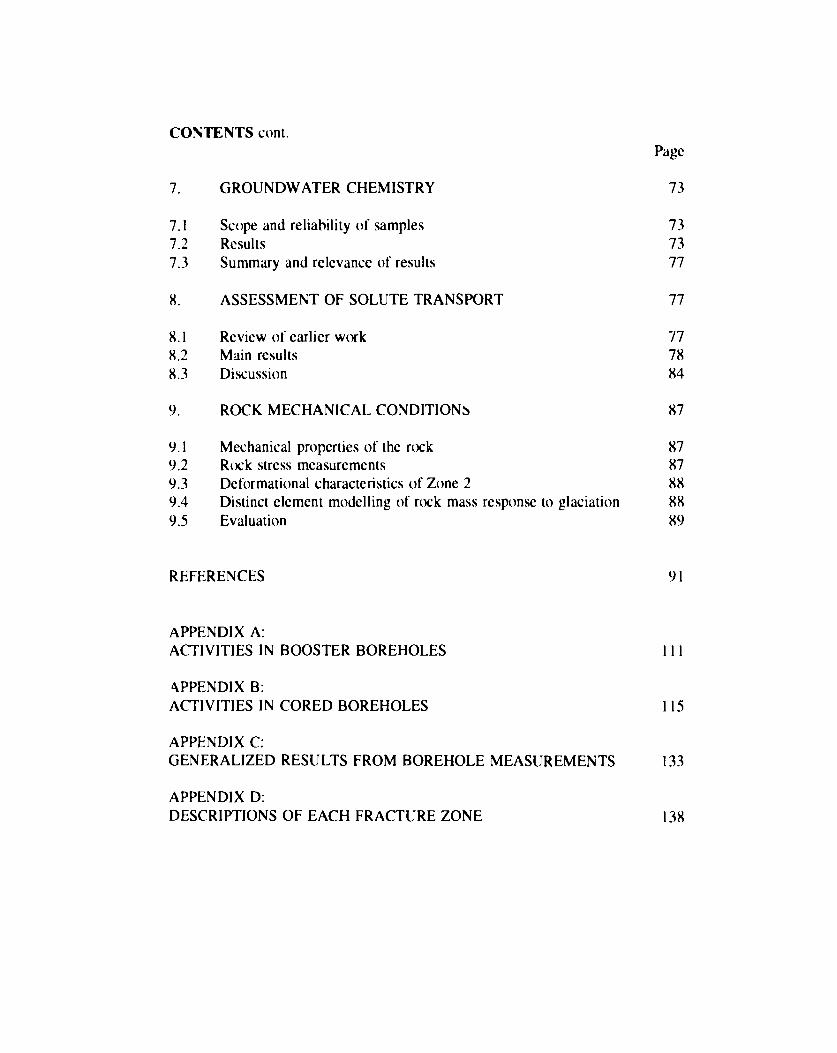
CONTENTS cont.
Page
7. GROUNDWATER CHEMISTRY 73
7.1 Scope and reliability of samples 737.2 Results 73
7.3 Summary and relevance of results 77
8. ASSESSMENT OF SOLUTE TRANSPORT 77
8.1 Review of earlier work 778.2 Main results 78
8.3 Discussion 84
9. ROCK MECHANICAL CONDITIONS 87
9.1 Mechanical properties of the rock 879.2 Rock stress measurements 879.3 Deformational characteristics of Zone 2 889.4 Distinct element modelling of rock mass response to glaciation 889.5 Evaluation 89REFERENCES 91
APPENDIX A:ACTIVITIES IN BOOSTER BOREHOLES 111
APPENDIX B:ACTIVITIES IN CORED BOREHOLES 115
APPENDIX C:GENERALIZED RESULTS FROM BOREHOLE MEASUREMENTS 133
APPENDIX D:DESCRIPTIONS OF EACH FRACTURE ZONE 138
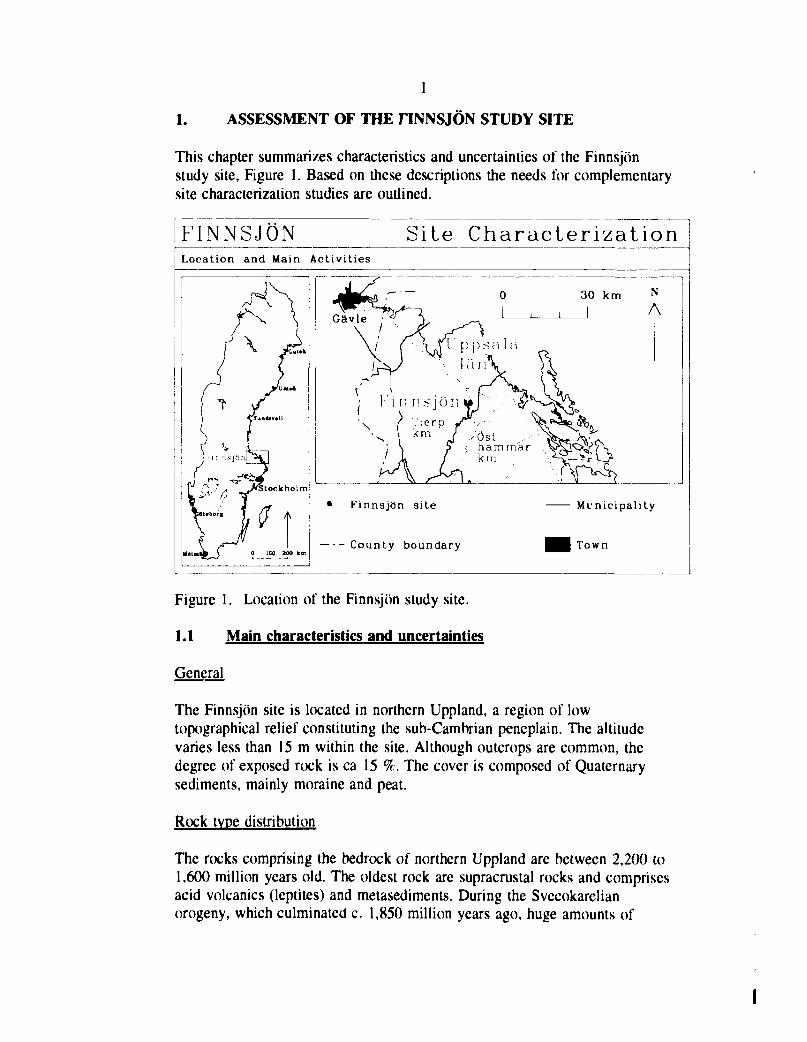
1. ASSESSMENT OF THE FINNSJÖN STUDY SITE
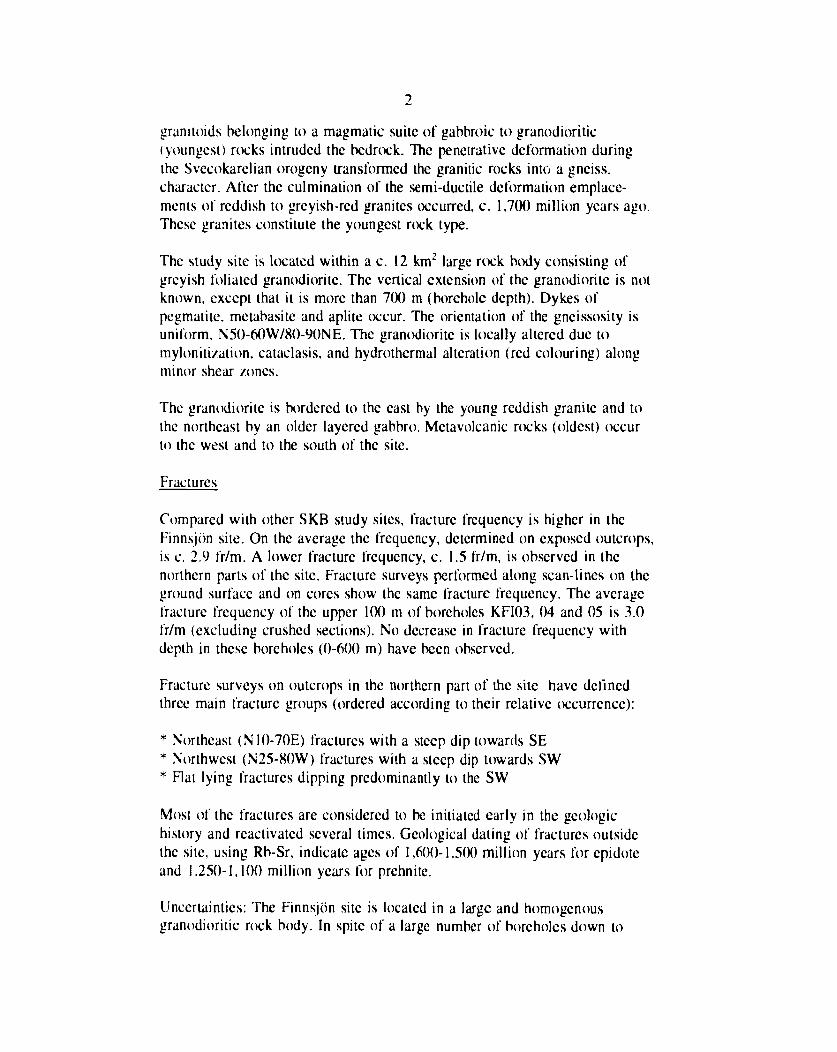
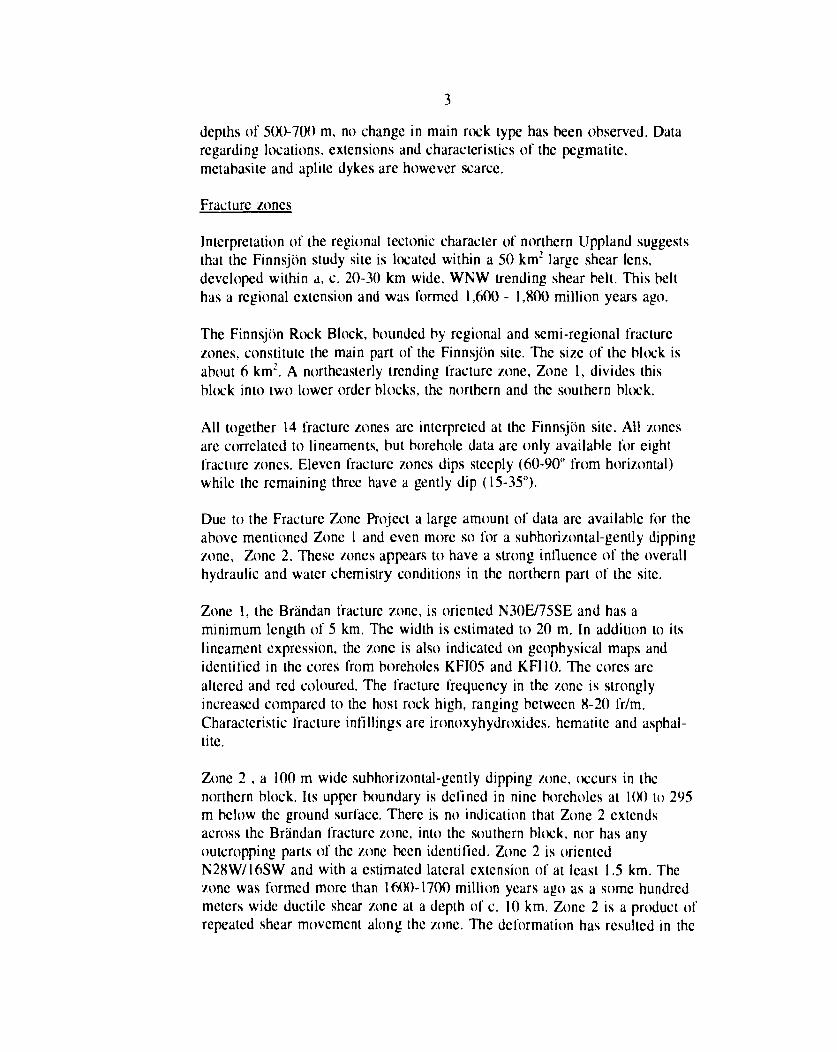
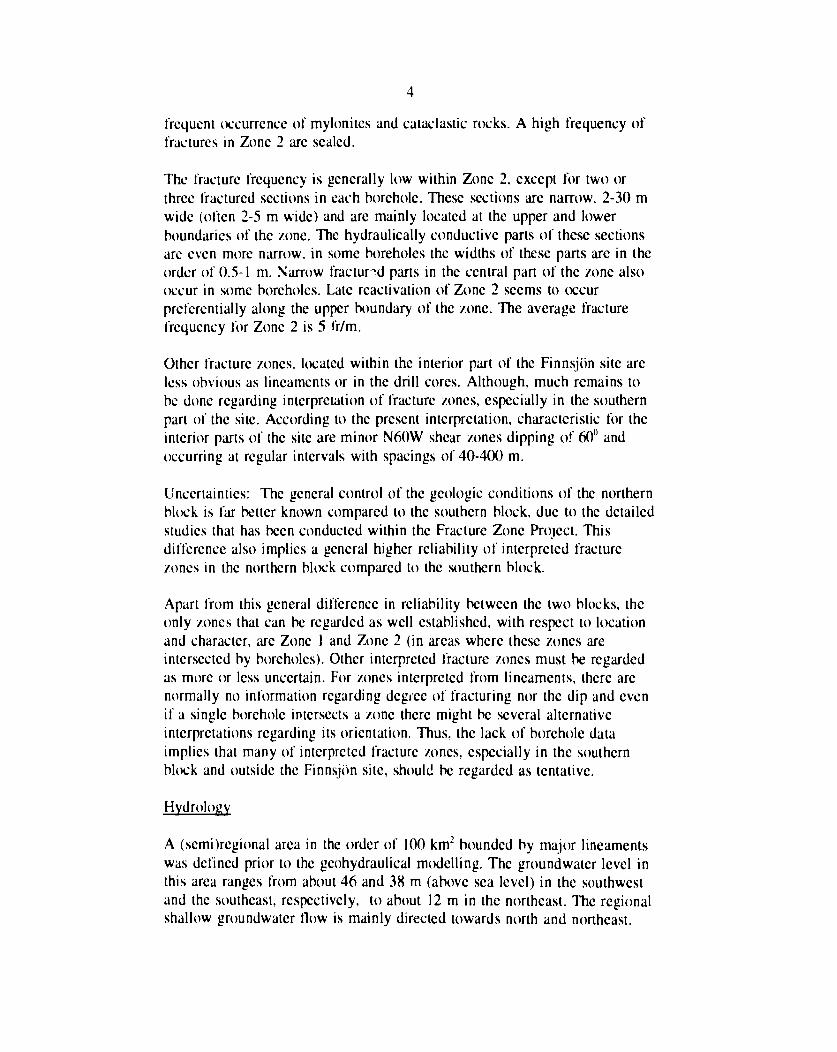
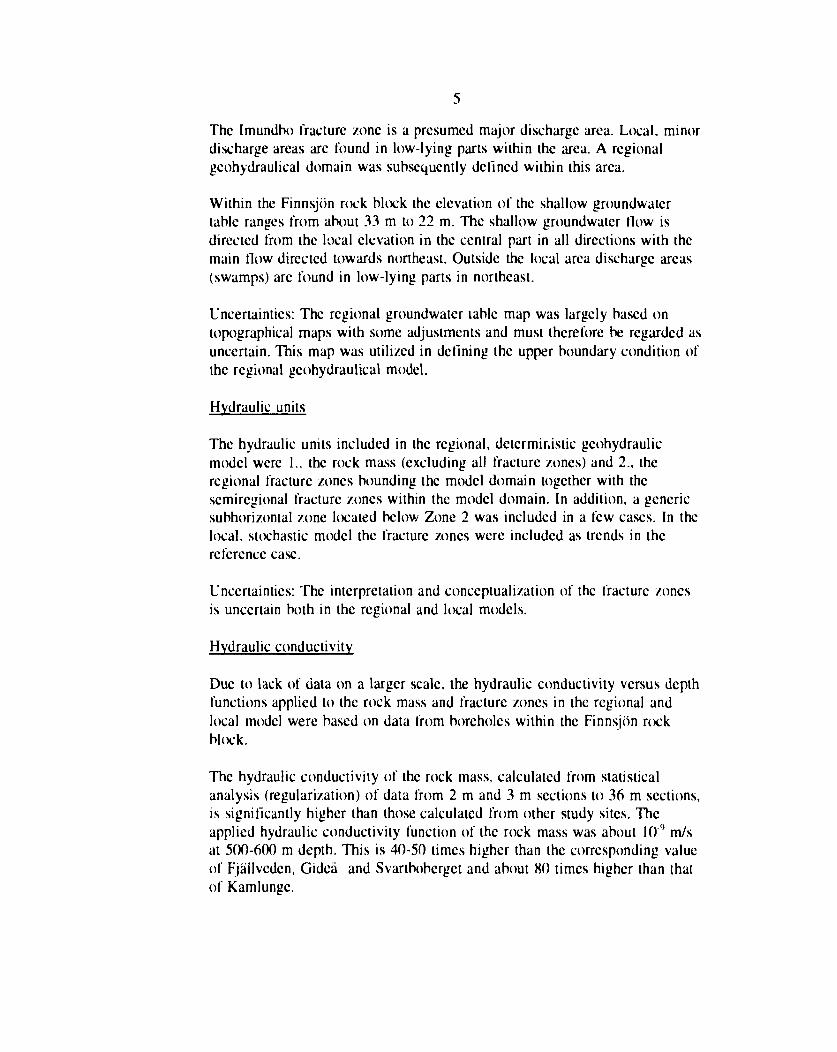
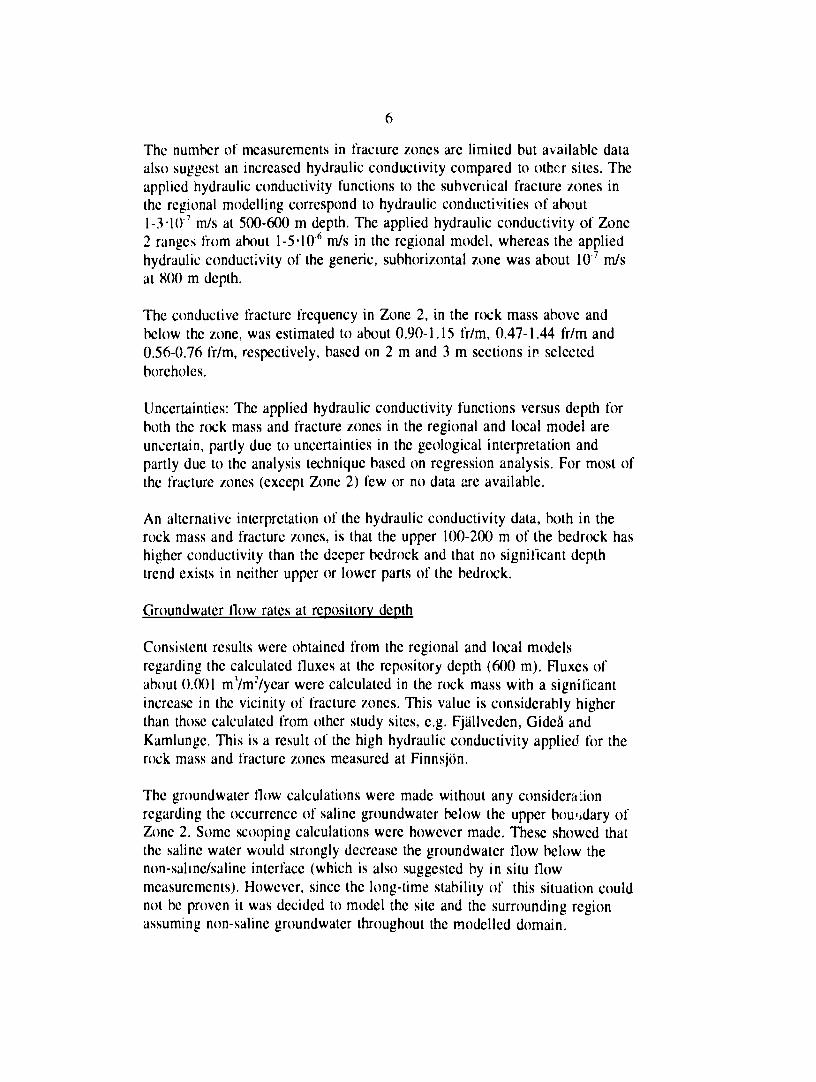
This chapter summarizes characteristics and uncertainties of the Finnsjönstudy site, Figure 1. Based on these descriptions the needs for complementarysite characterization studies are outlined.
iFINNSJÖN Site CharacterizationLocation and Main Activities
Finnsjön site Municipality
— - - County boundary
Figure 1. Location of the Finnsjön study site.
1.1 Main characteristics and uncertainties
General
The Finnsjön site is located in northern Uppland, a region of lowtopographical relief constituting the sub-Cambrian peneplain. The altitudevaries less than 15 m within the site. Although outcrops are common, thedegree of exposed rock is ca 15 %. The cover is composed of Quaternarysediments, mainly moraine and peat.
Rock type distribution
The rocks comprising the bedrock of northern Uppland are between 2,200 to1,600 million years old. The oldest rock are supracrustal rocks and comprisesacid volcanics (leptites) and metasediments. During the Svecokarelianorogeny, which culminated c. 1,850 million years ago, huge amounts of
granitoids belonging to a magmatic suite of gabbroic to granodioritic(youngest) rocks intruded the bedrock. The penetrative deformation duringthe Svecokarelian orogeny transformed the granitic rocks into a gneiss,character. After the culmination of the semi-ductile deformation emplace-ments of reddish to greyish-red granites occurred, c. 1,700 million years ago.These granites constitute the youngest rock type.
The study site is located within a c. 12 km2 large rock body consisting ofgreyish foliated granodiorite. The vertical extension of the granodiorite is notknown, except that it is more than 700 m (borehole depth). Dykes ofpegmatite, metabasite and aplite occur. The orientation of the gneissosity isuniform, N50-60W/80-90NE. The granodiorite is locally altered due tomyloniti/ation, cataclasis, and hydrothermal alteration (red colouring) alongminor shear zones.
The granodiorite is bordered to the east by the young reddish granite and tothe northeast by an older layered gabbro. Metavolcanic rocks (oldest) occurto the west and to the south of the site.
Fractures
Compared with other SKB study sites, fracture frequency is higher in theFinnsjön site. On the average the frequency, determined on exposed outcrops,is c. 2.9 fr/m. A lower fracture frequency, c. 1.5 fr/m, is observed in thenorthern parts of the site. Fracture surveys performed along scan-lines on theground surface and on cores show the same fracture frequency. The averagefracture frequency of the upper 100 m of boreholes KFI03, 04 and 05 is 3.0fr/m (excluding crushed sections). No decrease in fracture frequency withdepth in these boreholes (0-600 m) have been observed.
Fracture surveys on outcrops in the northern part of the site have definedthree main fracture groups (ordered according to their relative occurrence):
* Northeast (N10-70E) fractures with a steep dip towards SE* Northwest (N25-8OW) fractures with a steep dip towards SW* Flat lying fractures dipping predominantly to the SW
Most of the fractures are considered to be initiated early in the geologichistory and reactivated several times. Geological dating of fractures outsidethe site, using Rb-Sr, indicate ages of 1,600-1,500 million years for epidoteand 1.250-1,100 million years for prehnite.
Uncertainties: The Finnsjön site is located in a large and homogenousgranodioritic rock body. In spite of a large number of boreholes down to
3
depths of 500-700 m, no change in main rock type has been observed. Dataregarding locations, extensions and characteristics of the pegmatite,metabasite and aplite dykes are however scarce.
Fracture /ones
Interpretation of the regional tectonic character of northern Uppland suggeststhat the Finnsjön study site is located within a 50 km2 large shear lens,developed within a, c. 20-30 km wide, WNW trending shear belt. This belthas a regional extension and was formed 1,600 - 1,800 million years ago.
The Finnsjön Rock Block, bounded by regional and semi-regional fracture/ones, constitute the main part of the Finnsjön site. The size of the block isabout 6 km2. A northeasterly trending fracture /one, Zone 1, divides thisblock into two lower order blocks, the northern and the southern block.
All together 14 fracture /ones are interpreted at the Finnsjön site. All /onesare correlated to lineaments, but borehole data are only available for eightfracture /ones. Eleven fracture zones dips steeply (60-90° from horizontal)while the remaining three have a gently dip (15-35°).
Due to the Fracture Zone Project a large amount of data are available for theabove mentioned Zone 1 and even more so for a subhorizontal-gently dippingzone, Zone 2. These zones appears to have a strong influence of the overallhydraulic and water chemistry conditions in the northern part of the site.
Zone 1, the Brändan fracture zone, is oriented N3OE/75SE and has aminimum length of 5 km. The width is estimated to 20 m. In addition to itslineament expression, the /one is also indicated on geophysical maps andidentified in the cores from boreholes KFI05 and KFI10. The cores arealtered and red coloured. The fracture frequency in the zone is stronglyincreased compared to the host rock high, ranging between 8-20 fr/m.Characteristic fracture infillings are ironoxyhydroxides, hematite and asphal-tite.
Zone 2 , a 100 m wide subhorizontal-gently dipping /one, (xxurs in thenorthern block. Its upper boundary is defined in nine boreholes at 1(X) to 295m below the ground surface. There is no indication that Zone 2 extendsacross the Brändan fracture /one, into the southern block, nor has anyoutcropping parts of the zone been identified. Zone 2 is orientedN28W/16SW and with a estimated lateral extension of at least 1.5 km. Thezone was formed more than 1600-1700 million years ago as a some hundredmeters wide ductile shear zone at a depth of c. 10 km. Zone 2 is a product ofrepeated shear movement along the zone. The deformation has resulted in the
frequent occurrence of mylonites and cataclastic rocks. A high frequency offractures in Zone 2 are sealed.
The fracture frequency is generally low within Zone 2. except for two orthree fractured sections in each borehole. These sections are narrow, 2-30 mwide (often 2-5 m wide) and are mainly located at the upper and lowerboundaries of the zone. The hydraulically conductive parts of these sectionsare even more narrow, in some boreholes the widths of these parts are in theorder of 0.5-1 m. Narrow fractured parts in the central part of the /.one alsooccur in some boreholes. Late reactivation of Zone 2 seems to occurpreferentially along the upper boundary of the zone. The average fracturefrequency for Zone 2 is 5 fr/m.
Other fracture zones, located within the interior part of the Finnsjön site areless obvious as lineaments or in the drill cores. Although, much remains tobe done regarding interpretation of fracture zones, especially in the southernpart of the site. According to the present interpretation, characteristic for theinterior parts of the site are minor N60W shear zones dipping of 60° andoccurring at regular intervals with spacings of 40-400 m.
Uncertainties: The general control of the geologic conditions of the northernblock is far better known compared to the southern block, due to the detailedstudies that has been conducted within the Fracture Zone Project. Thisdifference also implies a general higher reliability of interpreted fracturezones in the northern block compared to the southern block.
Apart from this general difference in reliability between the two blocks, theonly zones that can be regarded as well established, with respect to locationand character, are Zone 1 and Zone 2 (in areas where these zones areintersected by boreholes). Other interpreted fracture zones must be regardedas more or less uncertain. For zones interpreted from lineaments, there arenormally no information regarding degree of fracturing nor the dip and evenif a single borehole intersects a zone there might be several alternativeinterpretations regarding its orientation. Thus, the lack of borehole dataimplies that many of interpreted fracture zones, especially in the southernblock and outside the Finnsjön site, should be regarded as tentative.
Hydrology
A (semi)regional area in the order of 100 km2 bounded by major lineamentswas defined prior to the geohydraulical modelling. The groundwater level inthis area ranges from about 46 and 38 m (above sea level) in the southwestand the southeast, respectively, to about 12 m in the northeast. The regionalshallow groundwatcr How is mainly directed towards north and northeast.
5
The Imundbo fracture zone is a presumed major discharge area. Local, minordischarge areas are found in low-lying parts within the area. A regionalgeohydraulical domain was subsequently defined within this area.
Within the Finnsjön rock block the elevation of the shallow groundwatcrtable ranges from about 33 m to 22 m. The shallow groundwater flow isdirected from the local elevation in the central part in all directions with themain flow directed towards northeast. Outside the local area discharge areas(swamps) are found in low-lying parts in northeast.
Uncertainties: The regional groundwater table map was largely based ontopographical maps with some adjustments and must therefore be regarded asuncertain. This map was utilized in defining the upper boundary condition ofthe regional geohydraulical model.
Hydraulic units
The hydraulic units included in the regional, deterministic gcohydraulicmodel were 1., the rock mass (excluding all fracture zones) and 2., theregional fracture zones bounding the model domain together with thesemiregional fracture zones within the model domain. In addition, a genericsubhorizontal zone located below Zone 2 was included in a few cases. In thelocal, stochastic model the fracture zones were included as trends in thereference case.
Uncertainties: The interpretation and conceptualization of the fracture zonesis uncertain both in the regional and local models.
Hydraulic conductivity
Due to lack of data on a larger scale, the hydraulic conductivity versus depthfunctions applied to the rock mass and fracture zones in the regional andlocal model were based on data from boreholes within the Finnsjön rockblock.
The hydraulic conductivity of the rock mass, calculated from statisticalanalysis (regularization) of data from 2 m and 3 m sections to 36 m sections,is significantly higher than those calculated from other study sites. Theapplied hydraulic conductivity function of the rock mass was about If)"9 m/sat 500-600 m depth. This is 40-50 times higher than the corresponding valueof Fjäilveden, Gideå and Svartbobcrget and about SO times higher than thatof Kamlunge.
The number of measurements in fracture zones are limited but available dataalso suggest an increased hydraulic conductivity compared to other sites. Theapplied hydraulic conductivity functions to the subveriical fracture zones inthe regional modelling correspond to hydraulic conductivities of about1-3-107 m/s at 500-600 m depth. The applied hydraulic conductivity of Zone2 ranges from about 1-5-106 m/s in the regional model, whereas the appliedhydraulic conductivity of the generic, subhorizontal zone was about 107 m/sat S00 m depth.
The conductive fracture frequency in Zone 2, in the rock mass above andbelow the zone, was estimated to about 0.90-1.15 fr/m, 0.47-1.44 fr/m and0.56-0.76 fr/m, respectively, based on 2 m and 3 m sections in selectedboreholes.
Uncertainties: The applied hydraulic conductivity functions versus depth forboth the rock mass and fracture zones in the regional and local model areuncertain, partly due to uncertainties in the geological interpretation andpartly due to the analysis technique based on regression analysis. For most ofthe fracture zones (except Zone 2) few or no data are available.
An alternative interpretation of the hydraulic conductivity data, both in therock mass and fracture zones, is that the upper 100-200 m of the bedrock hashigher conductivity than the deeper bedrock and that no significant depthtrend exists in neither upper or lower parts of the bedrock.
Groundwater flow rates at repository depth
Consistent results were obtained from the regional and local modelsregarding the calculated fluxes at the repository depth (600 m). Fluxes ofabout 0.001 mVnr/year were calculated in the rock mass with a significantincrease in the vicinity of fracture zones. This value is considerably higherthan those calculated from other study sites, e.g. Fjällveden, Gideå andKamlunge. This is a result of the high hydraulic conductivity applied for therock mass and fracture zones measured at Finnsjön.
The groundwater flow calculations were made without any considerationregarding the occurrence of saline groundwater below the upper boundary ofZone 2. Some scooping calculations were however made. These showed thatthe saline water would strongly decrease the groundwater flow below thenon-salinc/saline interface (which is also suggested by in situ flowmeasurements). However, since the long-time stability of this situation couldnot be proven it was decided to model the site and the surrounding regionassuming non-saline groundwater throughout the modelled domain.
Uncertainties: The above mentioned uncertainties in the conceptual geologicalmodels, the hydraulic properties of the hydraulic units and the assumption ofnon-saline groundwater at depth, implies a corresponding uncertainty in thecalculated groundwater flow rates. Also the applied lateral and upperboundary conditions are uncertain.
Solute transport
There are a number of different solute transport models applied to Finnsjöndata. However, most of the models have been applied to tracer testsperformed in artificial flow regimes, and they have not or can not betransferred to predicting the transport from a repository at 600 m depth.However, within the SKB 91 study, both a deterministic and a stochasticcontinuum model has been used to describe the flow field and travel timesfrom a repository. Travel times are determined to vary between ten and tenthousands of years. The most important factors that affect the travel timesand flow pattern at the site are; the conductivity contrast between fracturezones and rock mass, the location and connectivity of fracture /ones, themagnitude and direction of the local and regional gradient, and the presenceof saline water. Low angle fracture zones, like Zone 2, have been found to beparticularly important for flow and transport at the Finnsjön site.
Uncertainties: The boundary conditions are of great importance for the solutetransport. Only a few variations of the boundary conditions for thedeterministic model has been made and no variations for the stochasticmodel. Also, the existence, location and connectivity of fracture zones arcimportant for the solute transport. These factors have not been varied to anylarge extent in the Finnsjön models. The magnitude and direction of thenatural gradient is also important in a flat topography area like Finnsjön. Thiswas shown by the deterministic modelling but no variations were made in thestochastic modelling. Lastly, to determine the actual fluid velocity throughthe Finnsjön site, knowledge of the flow porosity is important and only a fewdata exist from fracture zones at the site.
Groundwater chemistry
Groundwater sampling for chemical analyses have intermittently been carriedout in 19 boreholes over a period of 12 years. During this time the samplingtechniques and the chemical analyses have developed significantly. Also thenumber of investigated parameters have been increased.
The main types of groundwaters can be distinguished, one old saline and oneyounger non-saline type. Samples taken below Zone 2, represents the deepold groundwater, which is of reducing character and with high chloride
8
content. Non-saline groundwater are found above Zone 2 and in the southernblock down to the maximum borehole depth.
Uncertainties: Only live of the sampled boreholes were considered represen-tative for the depth sampled. With the exception of borehole KFI08, locatedat the eastern boundary of the site, all "representative" boreholes are locatedin the northern block. The groundwater chemistry conditions in the southernblock are therefore uncertain.
Rock mechanics
Stress measurements using hydraulic fracturing technique have been carriedout in borehole KFI06 down to 500 m depth. The results showed normalconditions for Sweden regarding stress magnitudes and stress orientations. Noobvious stress anomalies was associated with Zone 2. Rock mechanicaltests on core samples from three depths in borehole KFI01 also reportsnormal conditions, indicating a "average quality designation" for the intactrock.. A special study of Zone 2 indicate a deformation modulus of no lessthan 25 GPa for the complete /.one.
Taking into account the state of stress and the mechanical properties of therock mass and fracture zones at Finnsjön, there should not be any stabilityproblems in the construction of a repository at 600 m depth.
Distinct element modelling of the rock mass response to glaciation have alsobeen made. This study indicate that reactivation of existing fracture zones arelikely to occur and that any repository should be located at least 100 m fromfracture zones.
1.2 Suggestions for complementary studies
Conceptual pcologic models
The distribution of rock types at the Finnsjön site and its surroundings is wellknown and there is no need for any complementary studies. The oppositeapplies for the distribution of fracture zones. The present model of fracturezones should be regarded as tentative and should be thoroughly tested withtrenches, boreholes and borehole measurements. In particular, this should bemade for fracture zones interpreted from lineament studies only.
Also, existing drill cores could be used to a greater extent to improve thereliability of interpreted zones, including their location, extension andhydraulic properties and depth dependence. It should also be noted thatfurther work on detailed correlation between surface and borehole, or
between boreholes, would probably identify additional fracture zones. Sincethe occurrence of subhorizontal fracture zones is of great importance for theperformance of a repository, the possible existence of additional such zonesshould be investigated.
Conceptual geohvdrological models and data sampling
The regional distribution of saline groundwater should be further studied,possibly by drilling one borehole in the farmland area covered by clay to theeast of the Finnsjön rock block and deepening one borehole in the Finnsjönsouthern block. By determining groundwater flow and chemistry in these andother boreholes, in situ data will be available to calibrate and/or validategroundwater flow models. In parallel, modelling studies should be made onthe rate of exchange of saline water to non-saline water due to the landupliiVsea level changes, as well as the possible influence of regional flow onthe deep groundwater.
Groundwater chemical conditions
As discussed above there is a need to map the extent of the saline ground-water and to quantify the amount of regional groundwater flow at variouslocations and depths. To resolve these questions additional groundwatcrsampling is needed, especially in new boreholes in the southern Finnsjönblock where reliable chemical data is more or less lacking. Chemicalsampling will also be important if new boreholes are drilled outside the site,as discussed above. The new sampling rounds should be designed to meetthree objectives; 1.) to characterize the groundwater chemistry at depth, 2.) toassist in the interpretation of regional hydrology, and 3.) to assist in theinterpretation of local hydrology.
Although the available chemistry data at Finnsjön has been evaluatedthoroughly, at the time of writing the most evaluated test site in Sweden, it ispossible to gain some further hints about hydrological conditions bycomplementary evaluation of existing data. One attempt to compare thegeneral chemistry characteristics of the different sections for all the boreholeswould show to what extent the sampled sections can be categori/ed intodistinct groups, and thereby possibly provide clues that can be used tointerpret the geohydrology. It is possible that such additional analysis wouldhelp in the interpretation of where local or regional flow conditions prevails.
The groundwater flow model within the area could be used to investigate thepossible connection between the Zone 2 and Lake Finnsjön. Natural tracerssuch as organic material could be used to study the potential link between thetwo water systems.
10
Solute transport
To improve knowledge of transport at the Finnsjön site, the following factorswould be most important; 1.) investigation of the deep groundwater system(what boundary conditions would be appropriate for a local site modelpredicting flow and transport?), 2.) investigation of connectivity,transmissivity, and extension of fracture zones close to the repository area aswell as close to regional zones, and 3.) investigation of the lateral extensionof tlic saline water below Zone 2. Once these facts are established, the pointof next greatest importance would be determination of hydraulic conductivitydistribution including possible depth dependence.
Sorption coefficients, including estimates of surface available for sorption,and reaction coefficients, are of next greatest importance to improvingknowledge of nuclide transport in both the conductive fractures and inbedrock blocks. In-situ tests to determine effective sorption coefficients,effective area and importance of matrix diffusion should be carried out.
Of least importance to a safety analysis is knowledge of pure parameters oftransport, the flow porosity and the dispersivity, which only change thetiming of nuclide mass arrival in the biosphere. Uncertainty in theseparameters would likely be overshadowed by uncertainties in the boundaryconditions, structures, conductivity distribution and sorptivity of nuclides.
Rock Mechanics
The rock stresses have only been measured down to 500 m below surface. Itmight be suggested to investigate the stress state from 500 m depth down tothe bottom of borehole KFI06 at 700 rn. Furthermore it is recommended todetermine the thermal properties (conductivity, diffusivity and specific heal).
11
2. BACKGROUND
2.1 Objectives
Geological investigations of study sites in the Swedish programme fordisposal of spent nuclear fuel has until 1990 involved a total of 14 sites. Forsome of these sites, investigations has been limited to surface studies and/oronly one deep borehole. Relatively extensive investigations have been carriedout at eight sites. The investigations in these later sites have involved anextensive programme of surface geophysical surveys and geological mappingand several deep boreholes down to 700-1000 m depth.
Over the years the scope of investigations at the st':dy sites has graduallyextended due to a steady increasing demand of data for performanceassessments. The amount of data available from the later investigated sitesare therefore greater compared to the earlier sites.
2.2 Selection of the Finnsjön study site
The Finnsjön study site was selected in 1977 to provide input to the KBS-1performance assessment. The time-constraint of this assessment made itnecessary to select easy assessable sites, preferable located close to existingpower stations. Such a location was also recommended in an earlier report tothe government (Aka utredningen, 1976).
The first reconnaissance borehole was drilled close to the Forsmark nuclearpower station. However, because of unfavourable rock conditions in thisborehole, the investigation area was moved 15 km eastwards to a large, wellexposed and homogenous rock block, later named the Finnsjön rock block.
The first main period of site investigations at Finnsjön took place between1977 and 1979. The results are summarized in the KBS-1 and KBS-2 reports(SKBF, 1977 and 1978). The investigations were a result of the "StipulationAct" which, among else, demanded the reactor owners to demonstrate howand where an "absolutely safe" final storage of high level waste and/or spentnuclear fuel can be effected. During the early parts of the KBS-1 studiesthree deep cored boreholes were drilled down to 500 m depth and testedhvdraulically.
The government resolution, concerning the application to fuel two nuclearreactors, required that supplementary geological studies should be carried outto ensure thai all provisions of the "Nuclear Power Stipulation Act" werefulfilled.
12
SKB responded to this demand by drilling four additional boreholes at theFinnsjön study site down to depths of about c. 500 m. Hydraulic tests, weremade in all boreholes. For some boreholes also geophysical logging andgroundwater sampling were made. Although it was stated in the KBS-1 and 2reports that the Finnsjön site could be used for a repository, the site wasranked lower than the Sternö site because of "..water-bearing fracture zones...which must be carefully considered in the design of a rock repository".
2.3 Investigation periods
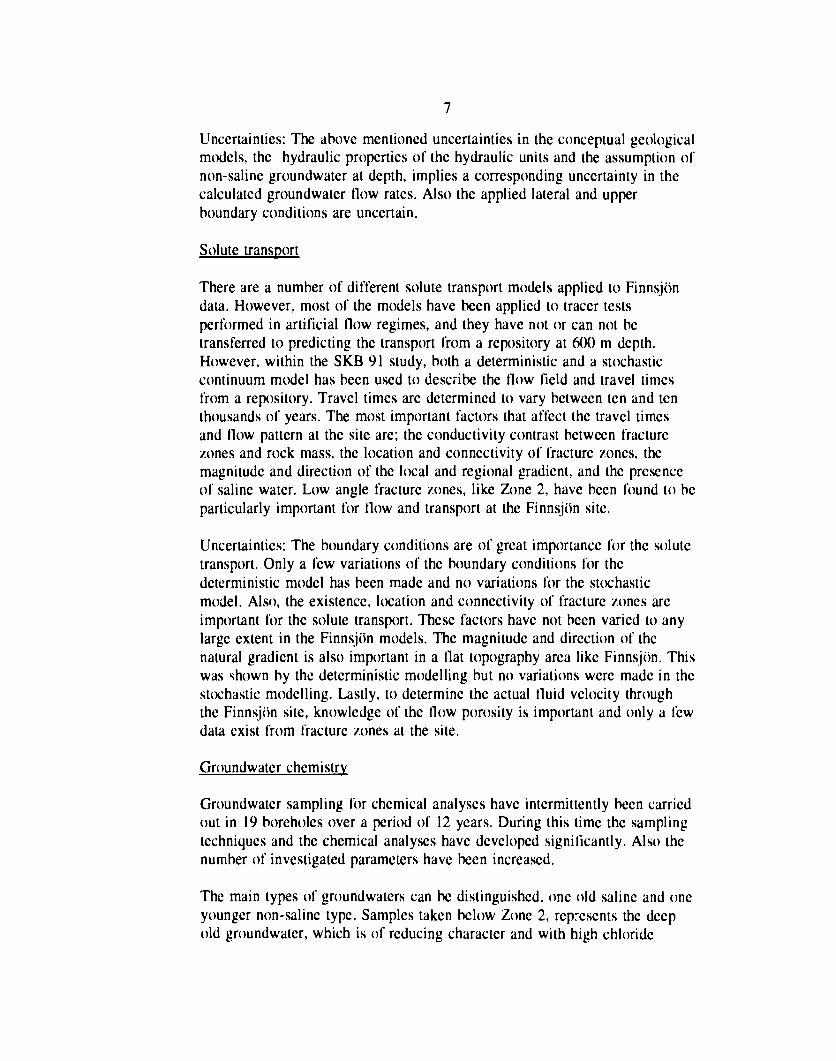
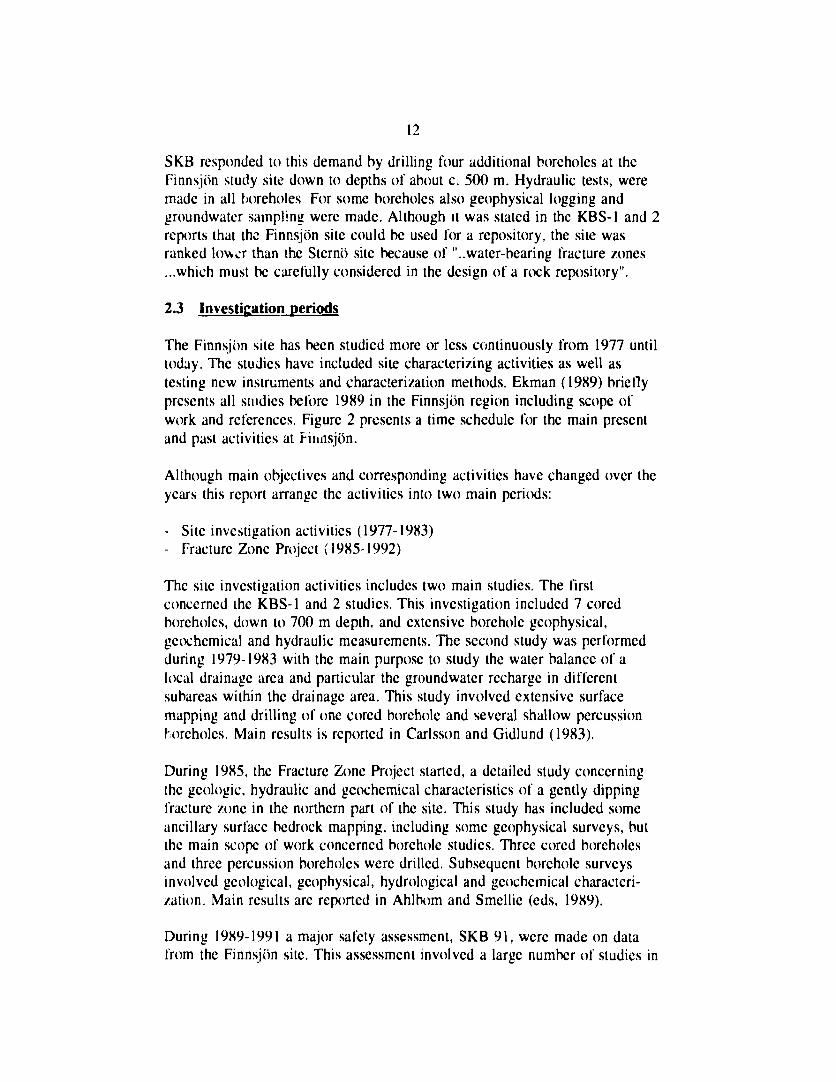
The Finnsjön site has been studied more or less continuously from 1977 untiltoday. The studies have included site characterizing activities as well astesting new instruments and characterization methods. Ekman (1989) brieflypresents all studies before 1989 in the Finnsjön region including scope ofwork and references. Figure 2 presents a time schedule for the main presentand past activities at Finnsjön.
Although main objectives and corresponding activities have changed over theyears this report arrange the activities into two main periods:
- Site investigation activities (1977-1983)- Fracture Zone Project (1985-1992)
The site investigation activities includes two main studies. The firstconcerned the KBS-1 and 2 studies. This investigation included 7 coredboreholes, down to 700 m depth, and extensive borehole geophysical,geochemical and hydraulic measurements. The second study was performedduring 1979-1983 with the main purpose to study the water balance of alocal drainage area and particular the groundwater recharge in differentsubareas within the drainage area. This study involved extensive surfacemapping and drilling of one cored borehole and several shallow percussionhoreholes. Main results is reported in Carlsson and Gidlund (1983).
During 1985, the Fracture Zone Project started, a detailed study concerningthe geologic, hydraulic and geochemical characteristics of a gently dippingfracture zone in the northern part of the site. This study has included someancillary surface bedrock mapping, including some geophysical surveys, butthe main scope of work concerned borehole studies. Three cored boreholesand three percussion boreholes were drilled. Subsequent borehole surveysinvolved geological, geophysical, hydrological and geochemical characteri-zation. Main results are reported in Ahlbom and Smcllic (eds, 1989).
During 1989-1991 a major safety assessment, SKB 91, were made on datafrom the Finnsjön site. This assessment involved a large number of studies in
13
where data were compiled and evaluated. Based on these studies hydraulicmodelling, using both deterministic and stochastic approaches, were made.Main results are presented in the SKB 91 report. All studies were made onexisting data and therefore no additional field activities was made.
The only study presently on-going at Finnsjön concerns a programme formonitoring groundwater nuclide transport from the Chernobyl fallout.
FINNSJON Site CharacterizationLocation and Main Activities
Location of the Finnsjön site Land ownershipCounty bound. Municipality 3 Forest Companies Q Finnsjön site
Main ActivitiesSite selectionSite investigation
Status ReportR8.D projects, Slolu» ReportFracture Zone Project
Zone selectionFracture zone charac-terizationSummary Report
Chernobyl fallout studies
"iTt Tt BO tl M M Report
SKB 197?SKBF/KBS TR B3 56SKBF/KBS TR 83-38
SKB TR B9 19. 91 OB91-24
Figure 2. Location of the Finnsjön study site. Administrative borders andland ownership are shown. Site investigation refers to the KBS-1and KBS-2 studies and the subsequent water balance studies.
14
3. SCOPE OF ACTIVITIES
3.1 Reconnaissance
The Finnsjön study site was selected because of its geological characteristics(large homogenous and well exposed rock block) in combination with itsfavourable location close to a nuclear power plant. However, there is noreport describing the reconnaissance activities involved in the selection of theFinnsjön study site, although it is stated in Scherman et al. (1978) that theselection was based on studies of topographical, economical and geologicalmaps and aerial photos.
3.2 Surface investigations
General
During the site investigations 1977-1983 maps were produced showing theQuaternary deposits, drainage basins, hydrobotanical conditions and rock typedistribution. Satellite and aerial photos were used to interpret fracture zonesboth on a regional and local scale. The hydrological conditions in connectionwith some fracture zones were studied in more detailed using refractionseismic and shallow boreholes in the overburden. During the Fracture ZoneProject some additional detailed mapping were made concerning geologicaland tectonical characteristics.
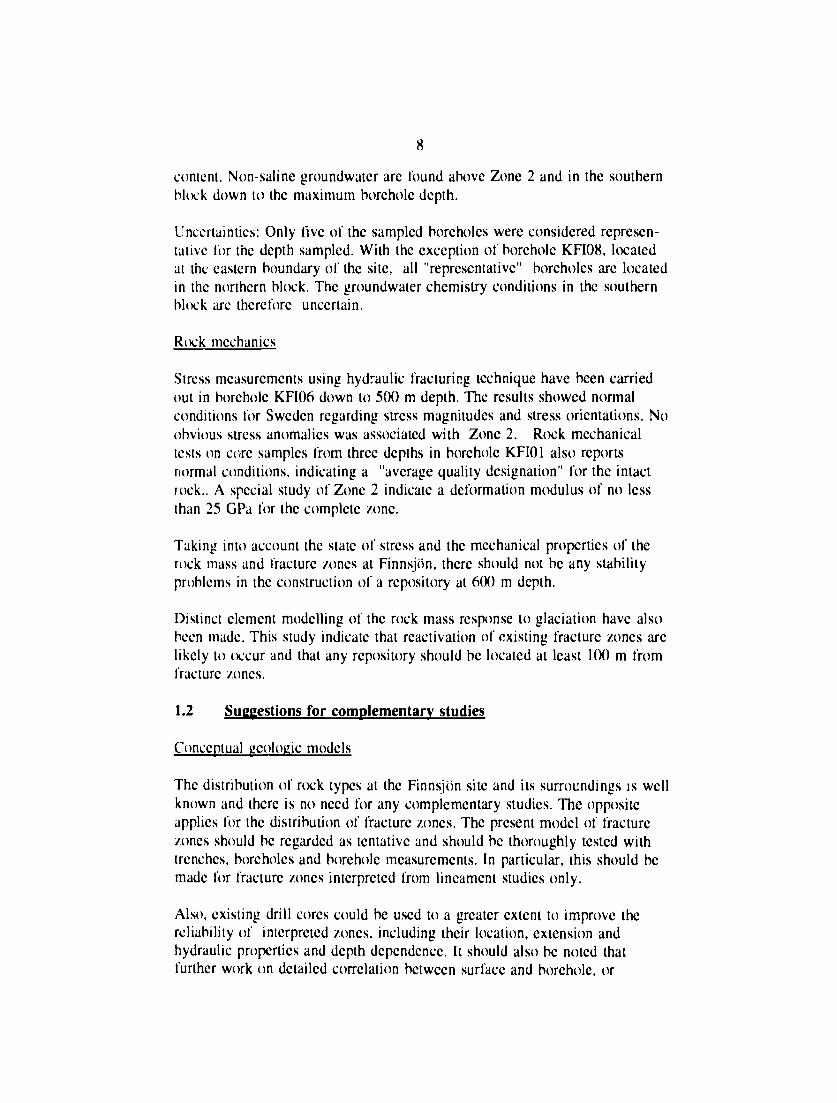
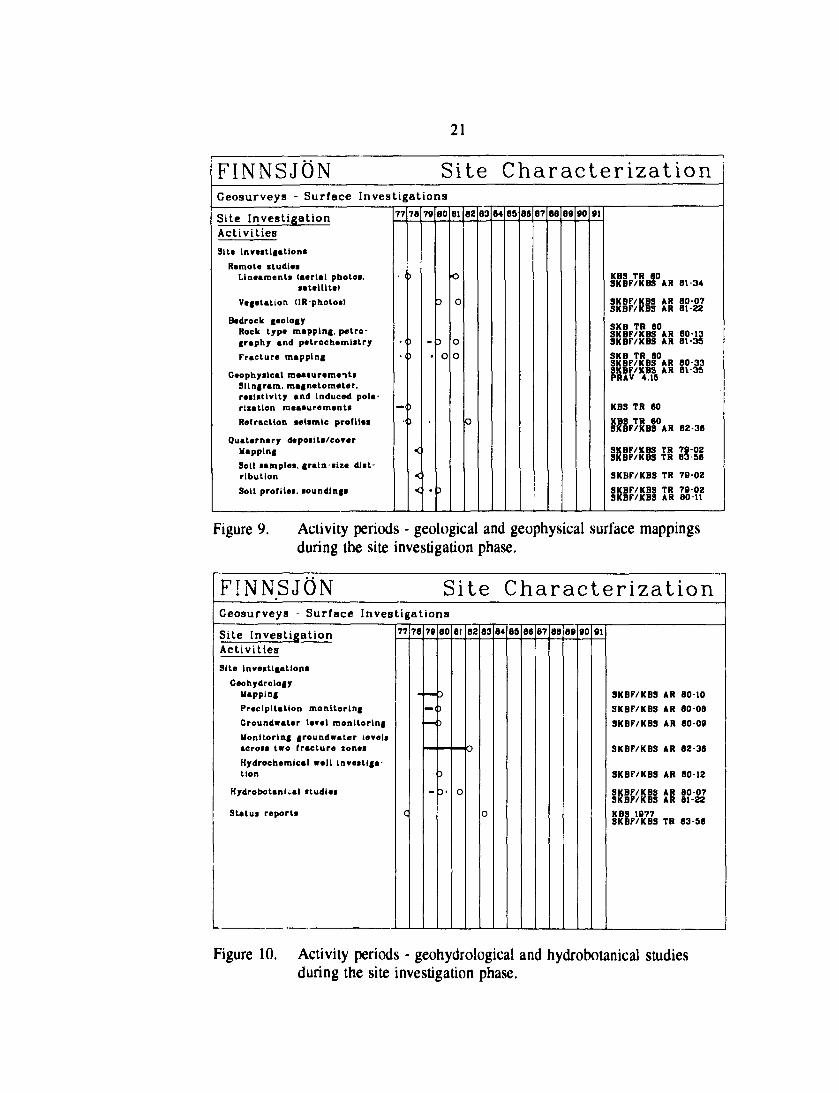
Areas covered by the various mappings and compilations of earlier studies,including references, are presented in Figures 3 to 8. Activity periodsshowing when studies were made are presented in Figures 9 to 12.
Geological mapping
The Finnsjön studies have not involved any mapping of the rock typedistribution in the regional scale. Instead available maps have been used, e.g.Söderholm et al. (1983) in the scale 1:250 000, for the north Uppland region,and Stålhös (1988, 1991) in the scale 1:50 000 for the region surrounding theFinnsjön study site.
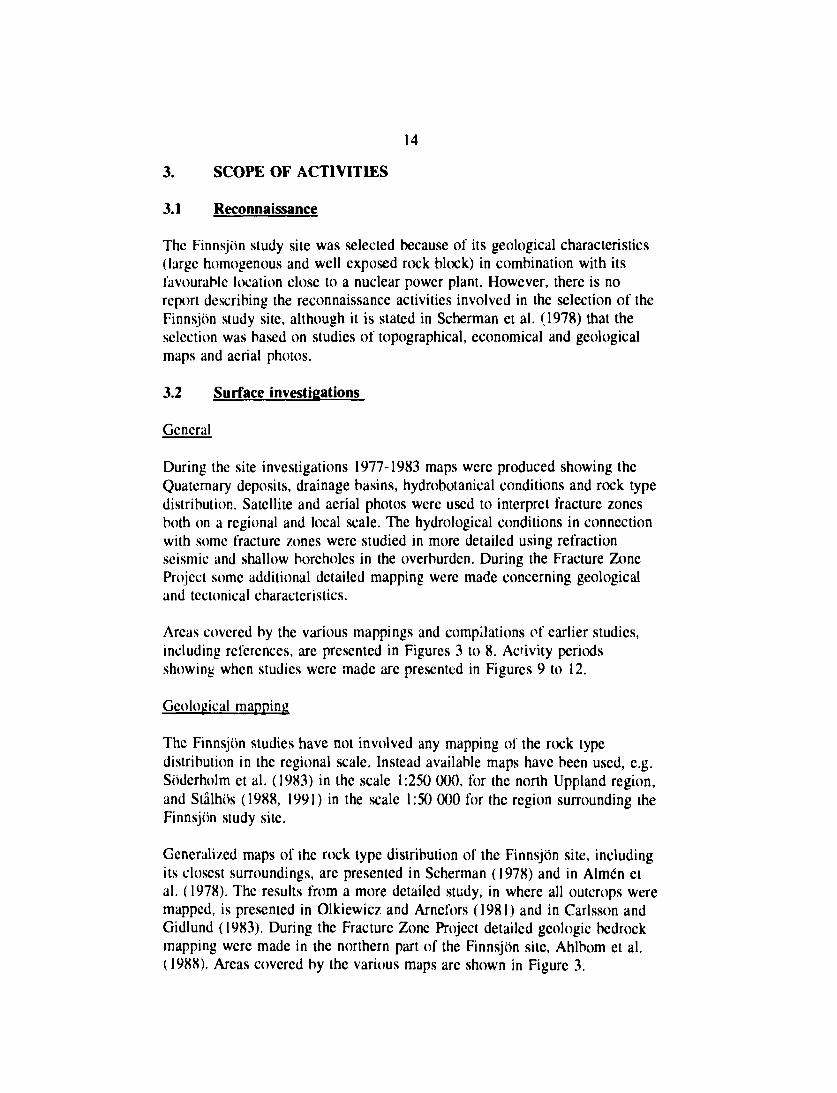
Generalized maps of the rock type distribution of the Finnsjön site, includingits closest surroundings, are presented in Scherman (1978) and in Almén etal. (1978). The results from a more detailed study, in where all outcrops weremapped, is presented in Olkiewicz and Arnefors (1981) and in Carlsson andGidlund (1983). During the Fracture Zone Project detailed geologic bedrockmapping were made in the northern part of the Finnsjön site, Ahlbom et al.(1988). Areas covered by the various maps are shown in Figure 3.
15
Fractures
A scan-line fracture survey was made on 73 outcrops in two orthogonalprofiles (Figure 3). The survey was made as a part of a programme fortesting investigation techniques for site investigations. The results aretherefore preliminary in nature. The results is published in Olkiewicz andArnefors (1981).
As a part of the Fracture Zone Project comprehensive fracture surveys wasmade in the northern part of the site (Tirén 1989). These surveys includedmapping of prominent fractures in a ca 2 km2 large area, as well as a detailedsurvey of all fractures in a 90 m x 5 m area, in where all soil was removed.
Variations in directions of paleostresses have been determined by analysingfracture configurations (Munier and Tirén 1989). Summaries of fracturestudies at Finnsjön are presented in Ahlbom and Tirén (1991) and inAndersson et al. (1991).
FINNSJON Site CharacterizationSite Investigation Lineaments
Finnsjön &
ii
- Surface
KJr [nö]
/' • • / "
• Y
Investigation
A0 12 3 4 !> km
Regional lineament mspt (whole area ahown)(interpreted from LANDSAT colour compositeand topographical mapi)Report! SKBF/KBS AR 81-34, SKBF/KBS TR 83-56Semlreglonal lineament map(interpreted from topographical map)Reports SKBF/KBS TR 83 56
0 Local lineament maps(interpreted from aerial photos)Reports SKBF/KBS AR 61-34
SKB 1077
Figure 3. Left, extent of bedrock and fracture mappings made during the siteinvestigation period. Right, extent of bedrock and fracturemappings made during the Fracture Zone Project.
16
Lineament analyses
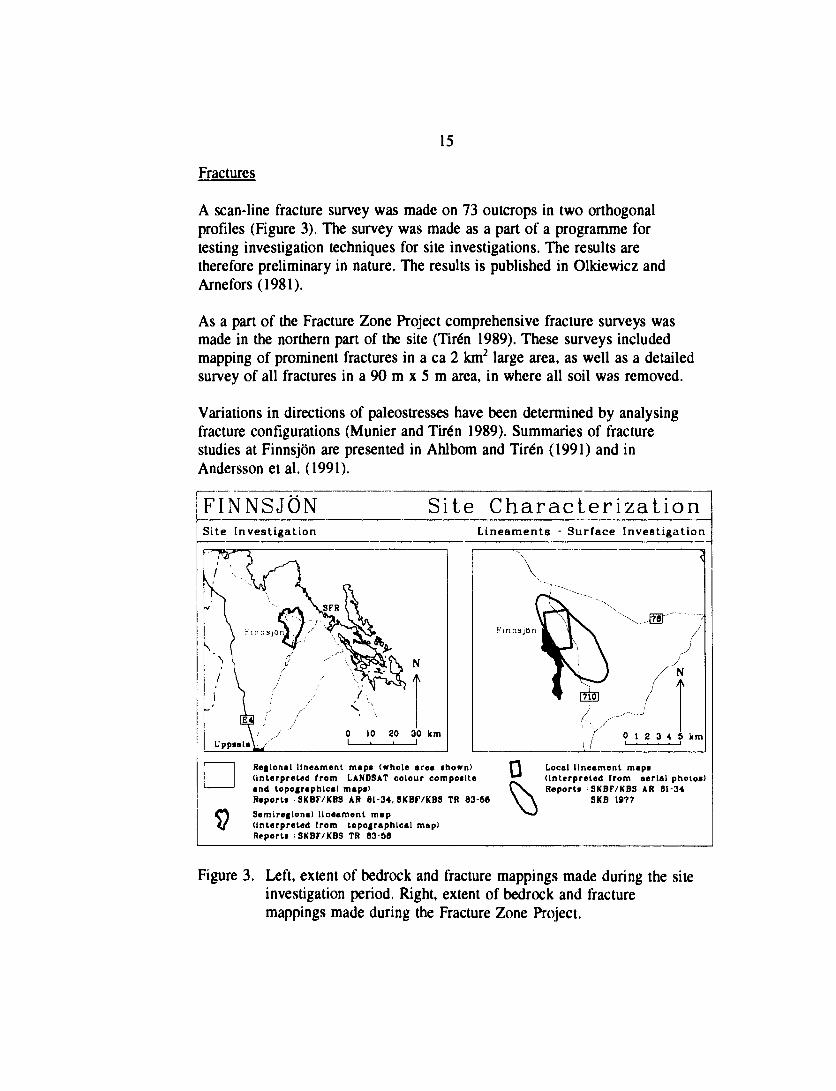
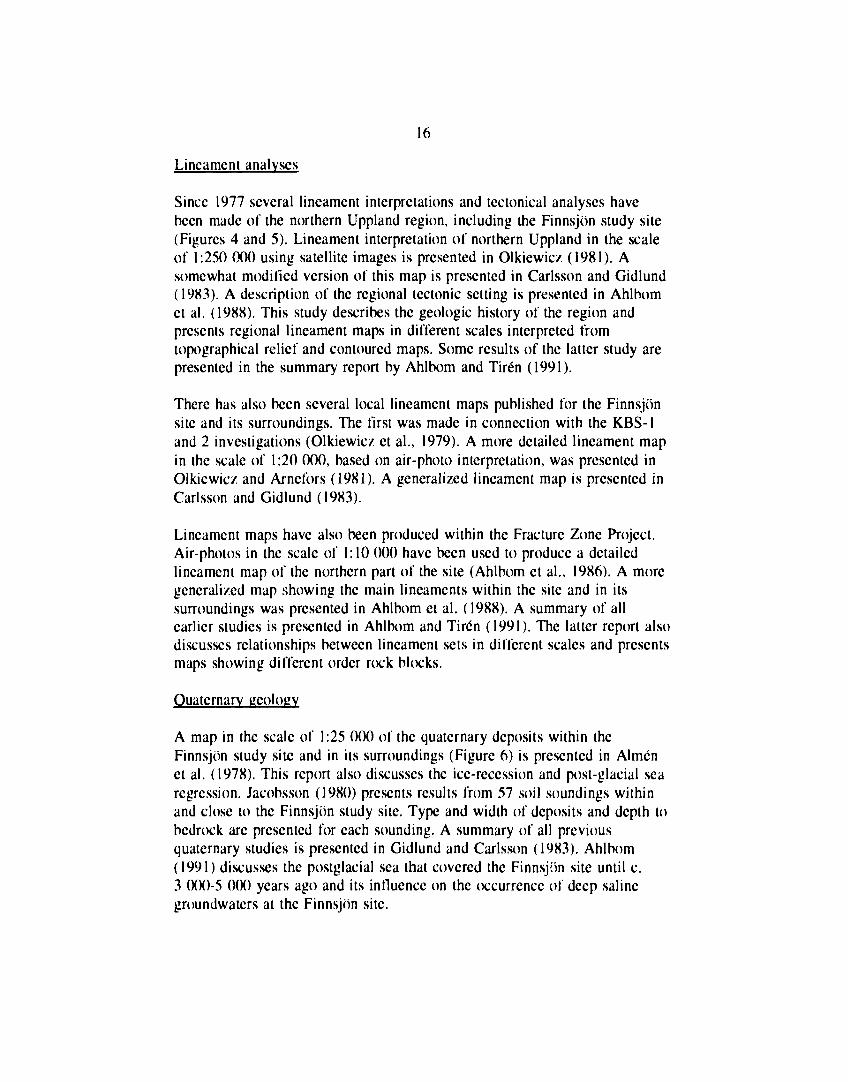
Since 1977 several lineament interpretations and tectonical analyses havebeen made of the northern Uppland region, including the Finnsjön study site(Figures 4 and 5). Lineament interpretation of northern Uppland in the scaleof 1:250 000 using satellite images is presented in Olkiewicz (1981). Asomewhat modified version of this map is presented in Carlsson and Gidlund(1983). A description of the regional tectonic setting is presented in Ahlbomet al. (1988). This study describes the geologic history of the region andpresents regional lineament maps in different scales interpreted fromtopographical relief and contoured maps. Some results of the latter study arepresented in the summary report by Ahlbom and Tirén (1991).
There has also been several local lineament maps published for the Finnsjönsite and its surroundings. The first was made in connection with the KBS-1and 2 investigations (Olkiewicz et al., 1979). A more detailed lineament mapin the scale of 1:20 000, based on air-photo interpretation, was presented inOlkiewicz and Arnefors (1981). A generalized lineament map is presented inCarlsson and Gidlund (1983).
Lineament maps have also been produced within the Fracture Zone Project.Air-photos in the scale of 1:10 000 have been used to produce a detailedlineament map of the northern part of the site (Ahlbom et al., 1986). A moregeneralized map showing the main lineaments within the site and in itssurroundings was presented in Ahlbom et al. (1988). A summary of allearlier studies is presented in Ahlbom and Tirén (1991). The latter report alsodiscusses relationships between lineament sets in different scales and presentsmaps showing different order rock blocks.
Quaternary geology
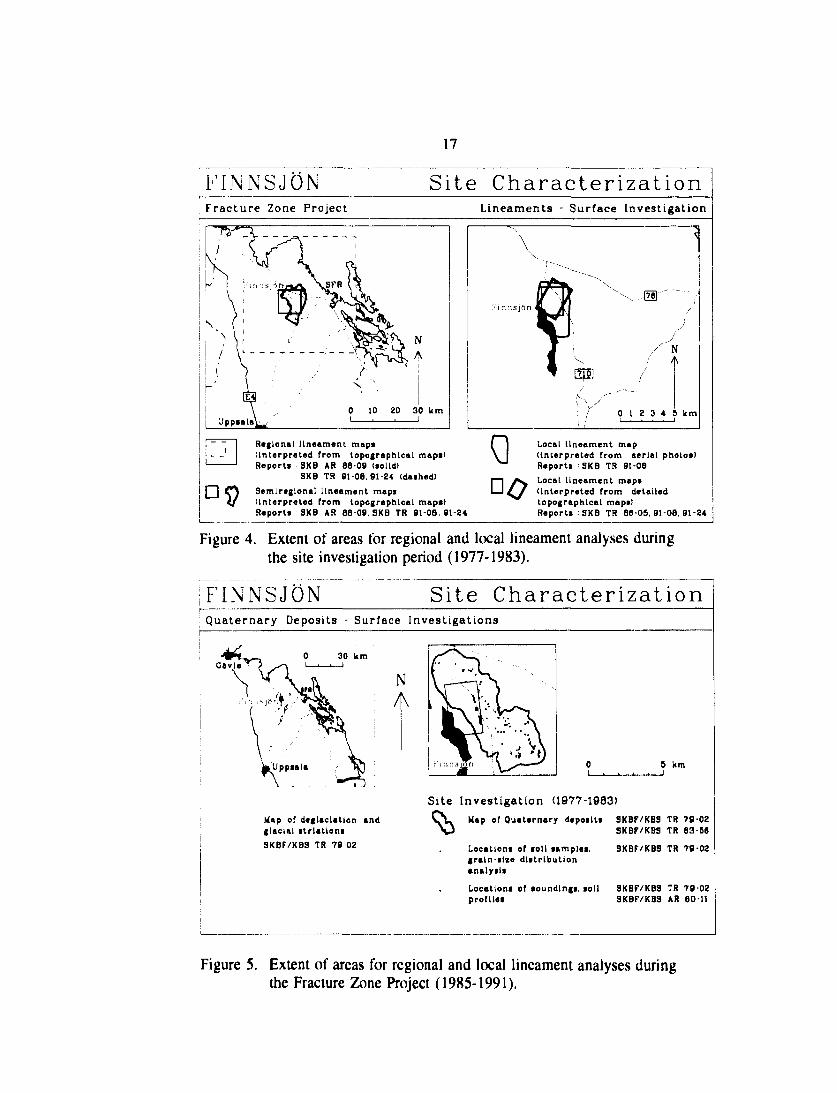
A map in the scale of 1:25 000 of the quaternary deposits within theFinnsjön study site and in its surroundings (Figure 6) is presented in Almcnet al. (1978). This report also discusses the ice-recession and post-glacial searegression. Jacobsson (1980) presents results from 57 soil soundings withinand close to the Finnsjön study site. Type and width of deposits and depth tobedrock are presented for each sounding. A summary of all previousquaternary studies is presented in Gidlund and Carlsson (1983). Ahlbom(1991) discusses the postglacial sea that covered the Finnsjön site until c.3 000-5 000 years ago and its influence on the occurrence of deep salinegroundwatcrs at the Finnsjön site.
17
FINNSJÖN Site CharacterizationFracture Zone Project Lineaments - Surface Investigation
r ' i n r i s j o n I
..-(76]""
0 I 2 3 4 5 km
Regions! lineament maps(Interpreted from topographical maps)Report! SKB AR 66-09 (solid)
SKB TR 91-06,91-24 (dashed)Semiregional lineament maps(Interpreted from topographical map*)Reports SKB AR 86-09. 8KB TR 91-09,91-24
00
Local lineament map(Interpreted from aerial photos)Reports SKB TR 91-08Local lineament maps(interpreted from detailedtopographical maps)Reports SKB TR 88-05.91-08.91-24
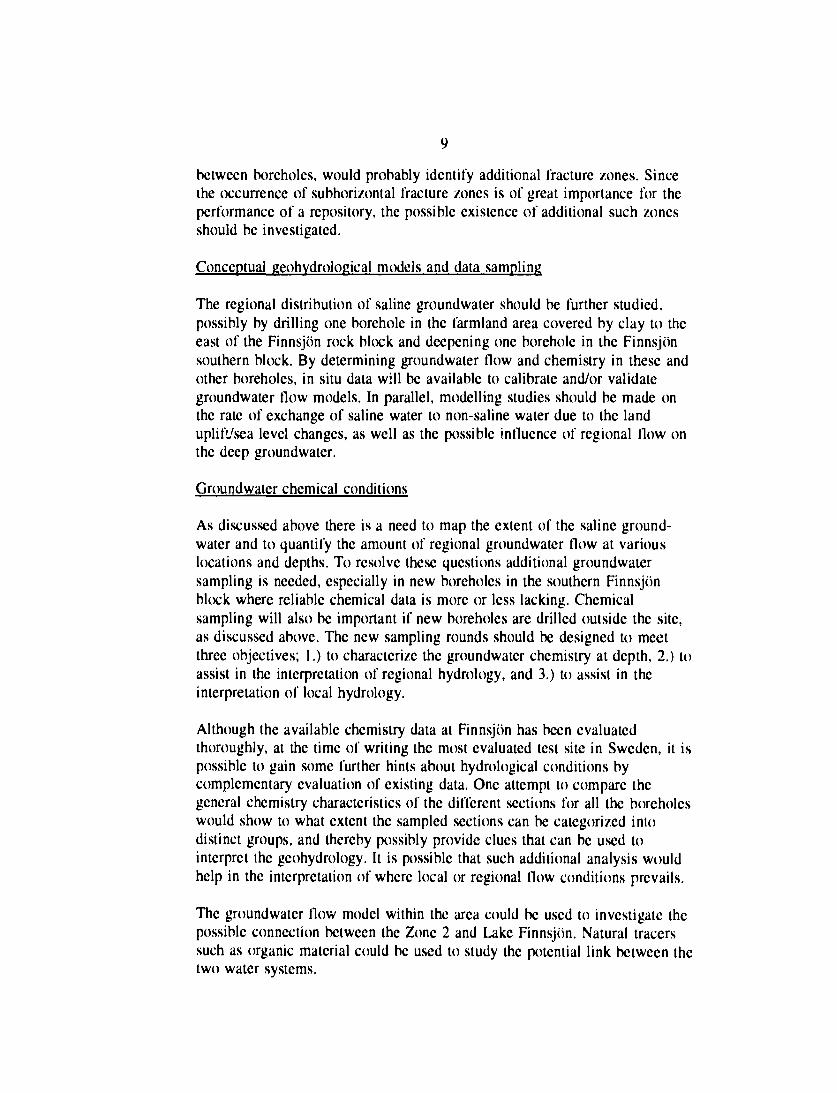
Figure 4. Extent of areas for regional and local lineament analyses duringthe site investigation period (1977-1983).
FINNSJÖN Si te CharacteQuaternary Deposits - Surface Investigations
*&ht~^, o 30 kmGavle • ? -x-\ 1—i—.—1
Wuppsala ' / j Ö
Map of deglaclatlen andglacial strlatloniSKBF/KBS TR 7902
N/ \
:•' i n n
Site
0i
rizat
9I
Investigation (1977-1983)
Hap of Quaternary deposits
Locations of soil samples,grain-size distributionanalysis
Locations of soundings, soilprofiles
SKBF/KBSSKBF/KBS
SKBF/KBS
SKBF/KBSSKBF/KBS
ion
km
TR 78-02TR 83-56
TR 78-02
TR 78-02AR 80-11
Figure 5. Extent of areas for regional and local lineament analyses duringthe Fracture Zone Project (1985-1991).
FINNSJÖN
18
Site CharacterizationBedrock Geology - Surface Investigations
Site Investigation (19771981)
J _
Local bedrockmap
Profiles alongwhich fracturefrequency mea-surements wereperformed(73 outcrops)
SKBF/KBSAR 81-35TR 83-56
SKBF/KBSAR 81-34
(SKB TR 91-24)
N
30 kmI
Fracture Zone Projekt (1984-1989)
•Regional bedrock map
Semi-regional bedrockand fracture zone maps
Map of fracture zonesat the Finnsjön site
Detailed mapped area, bedrockand fracture populationFracture cell map(10 times it's size)
SKB TR 91-08
SKB TR 91-08
SKB TR 91-08
SKB AR 88-09
SKB AR 88-09SKB TR 91-24
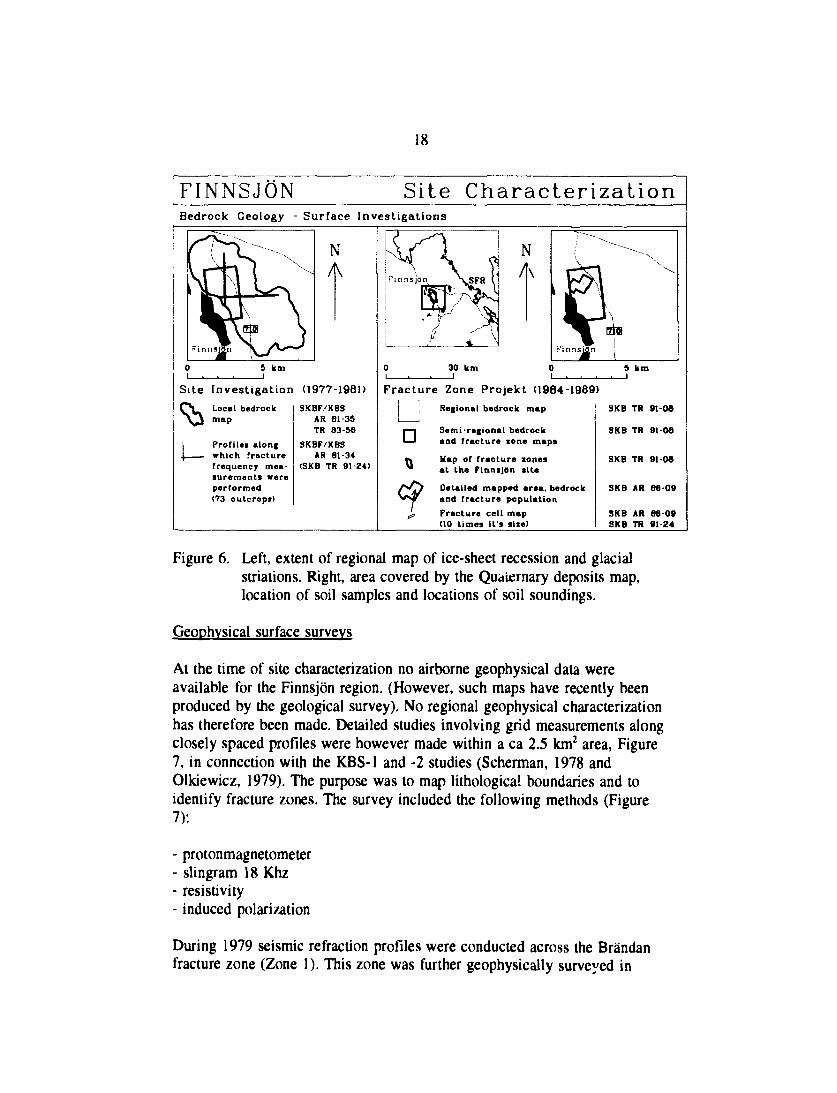
Figure 6. Left, extent of regional map of ice-sheet recession and glacialstriations. Right, area covered by the Quaternary deposits map,location of soil samples and locations of soil soundings.
Geophysical surface surveys
At the time of site characterization no airborne geophysical data wereavailable for the Finnsjön region. (However, such maps have recently beenproduced by the geological survey). No regional geophysical characterizationhas therefore been made. Detailed studies involving grid measurements alongclosely spaced profiles were however made within a ca 2.5 km2 area, Figure7, in connection with the KBS-1 and -2 studies (Scherman, 1978 andOlkiewicz, 1979). The purpose was to map lithological boundaries and toidentify fracture zones. The survey included the following methods (Figure7):
- protonmagnetometer- slingram 18 Khz- resistivity- induced polarization
During 1979 seismic refraction profiles were conducted across the Brändanfracture zone (Zone 1). This zone was further geophysically surveyed in
19
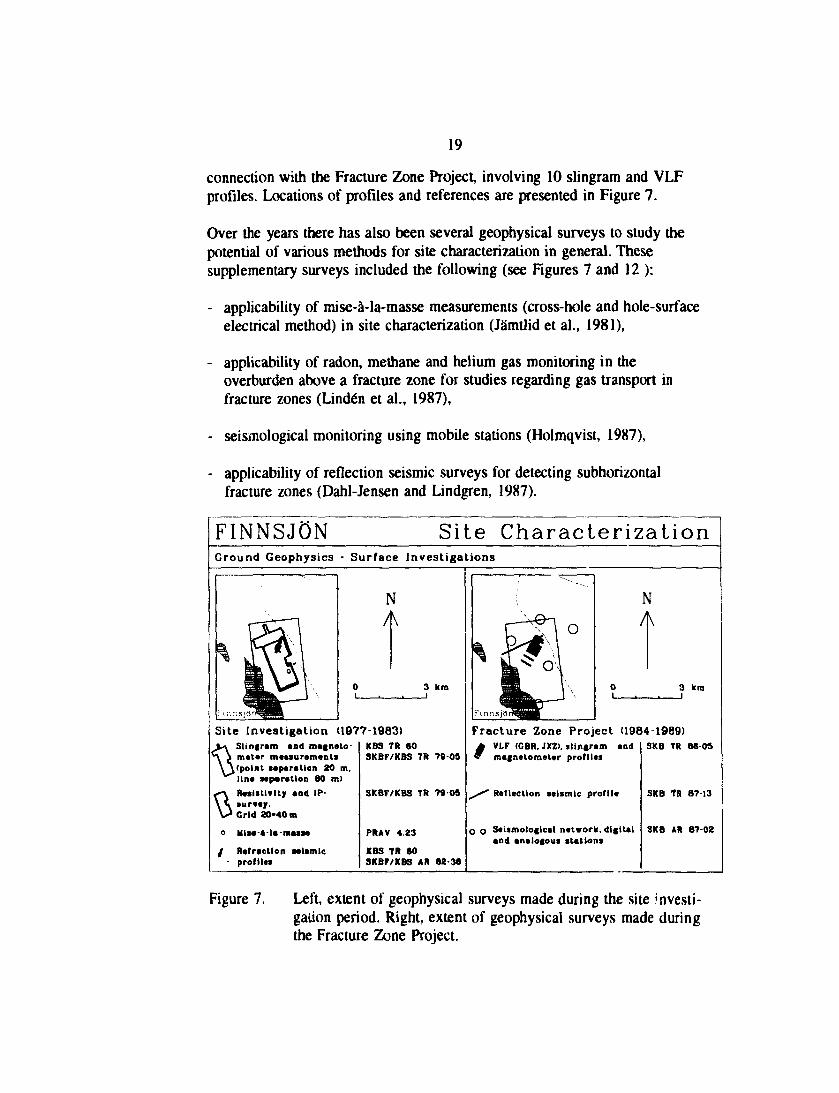
connection with the Fracture Zone Project, involving 10 slingram and VLFprofiles. Locations of profiles and references are presented in Figure 7.
Over the years there has also been several geophysical surveys to study thepotential of various methods for site characterization in general. Thesesupplementary surveys included the following (see Figures 7 and 12 ):
- applicability of mise-å-la-masse measurements (cross-hole and hole-surfaceelectrical method) in site characterization (Jämtlid et al., 1981),
- applicability of radon, methane and helium gas monitoring in theoverburden above a fracture zone for studies regarding gas transport infracture zones (Linden et al., 1987),
- seismological monitoring using mobile stations (Holmqvist, 1987),
- applicability of reflection seismic surveys for detecting subhorizontalfracture zones (Dahl-Jensen and Lindgren, 1987).
FINNSJÖN Site CharacterizationGround Geophysics - Surface Investigations
N
3 km
Site Investigation (1977-1963)V \ Sllngram and magneto-
*\ i meter oteasuremants\ \ ( p o l n t separation 20 m.
Una separation 80 mlResistivity and IP-•urveyGrid 20*40 m
o Mtse-é-la masse
/ Refraction seismic• profiles
KBS TR 60SKBF/KBS TR 78-05
SKBF/KBS TR 79 OS
PRAV 4.23
KBS TR 603KBP/KBS AR 88-36
NA
3 km
Fracture Zone Project (1984 1989)VLF (CBR, JX2), slinfram andmagnetometer profiles
Reflection seismic profile
O o Seismological netrork. digitaland analogous stations
8KB TR 68-05
3KB TR 87 13
8KB AR 67-02
Figure 7. Left, extent of geophysical surveys made during the site investi-gation period. Right, extent of geophysical surveys made duringthe Fracture Zone Project.
20
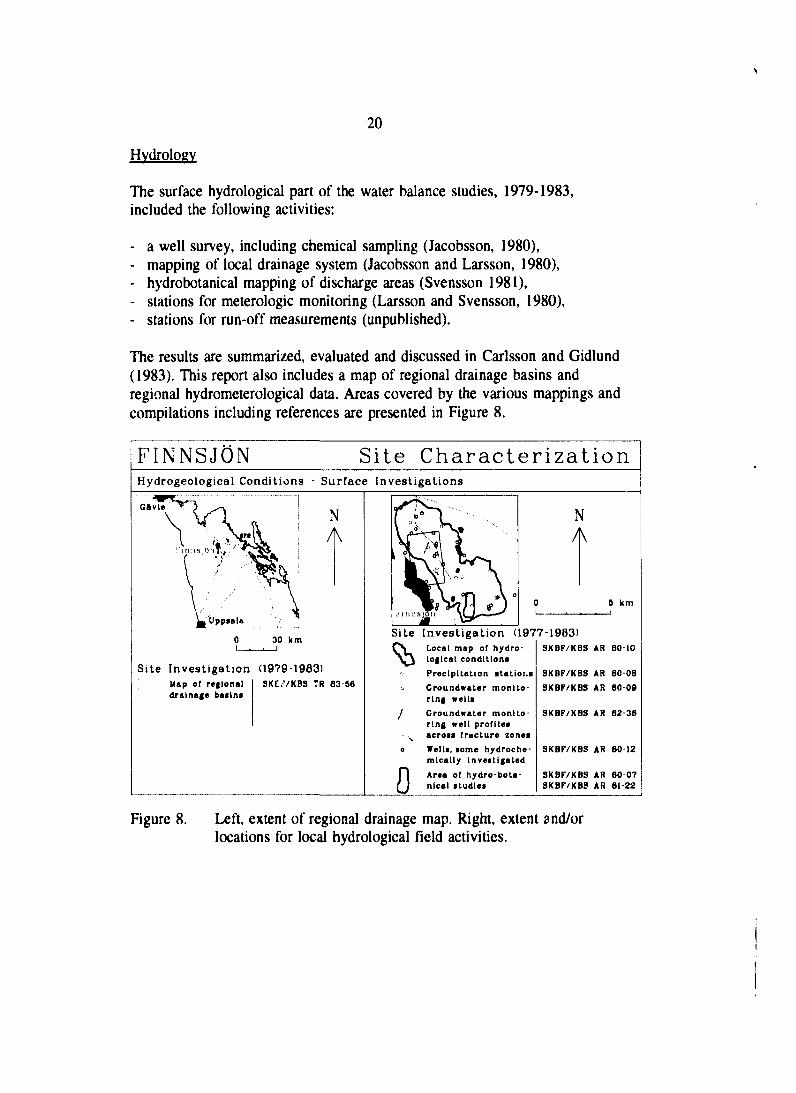
Hydrology
The surface hydrological part of the water balance studies, 1979-1983,included the following activities:
- a well survey, including chemical sampling (Jacobsson, 1980),- mapping of local drainage system (Jacobsson and Larsson, 1980),- hydrobotanical mapping of discharge areas (Svensson 1981),- stations for meterologic monitoring (Larsson and Svensson, 1980),- stations for run-off measurements (unpublished).
The results are summarized, evaluated and discussed in Carlsson and Gidlund(1983). This report also includes a map of regional drainage basins andregional hydrometerological data. Areas covered by the various mappings andcompilations including references are presented in Figure 8.
FINNSJÖN Site CharacterizationHydrogeological Conditions - Surface Investigations
GAvieNA
Site InvestigationMap of regionaldrainage baiini
30 km
(19791983)SKE.-VKBS TR 83 56
NA
5 km
Site Investigation (1977-1983)
0
Local map of hydro-logical condition*Precipitation itatioi.tGroundwater monito-ring wellsGroundwater monito-ring well profile!across fracture zoneiWells, tome hydroche-mlcally investigatedArea of hydro-bota-nical studies
SKBF/KBS AR 80-10
SKBF/KBS AR 80-08SKBF/KBS AR 80-09
SKBF/KBS AR 82-36
SKBF/KBS AR 80-12
SKBF/KBS AR 8007SKBF/KBS AR 81-22
Figure 8. Left, extent of regional drainage map. Right, extent and/orlocations for local hydrological field activities.
21
FINNSJÖN Site ChGeosurveys - Surface Investigations
Site InvestigationActivities
Site InvestigationsRemote studies
Lineaments (aerial photos.satellite)
Vegetation (IR-photos)
Bedrock geologyRock type mapping, petro-graphy and petrochemistryFracture mapping
Geophysical measurementsSlingram, magnetometer.resistivity and Induced pola-rization measurementsRefraction seismic profiles
Quaternary deposits/coverMappingSoil samples, grain-size dist-ributionSoil profiles, soundings
77
—(
78
)
))
)
>
<
<
<
79
-
*
ao
3
O
3
81
O
0
0
0
82
0
83 84 85 86
aracterizat
87 86 89 90 91
KBS TR 80SKBF/KBS AR
SKBF/KBS ARSKBF/KBS AR
SKB TR 60SKBF/KBS ARSKBF/KBS ARSKB TR 80SKBF/KBS ARSKBF/KBS ARPRAV 4.15
KBS TR 60
SHrTBtJ0*»
iBSKSB VnSKBF/KBS TR
SKBF/KBS TRSKBF/KBS AR
ion
81-34
i?:3l80-3381-35
82-36
mi79-02
79-0280-11
Figure 9. Activity periods - geological and geophysical surface mappingsduring the site investigation phase.
FINNSJÖN Site CharacterizationGeosurveys - Surface Investigations
Site InvestigationActivities
Site investigationsCeohydrology
MappingPrecipitation monitoringCroundwater level monitoringMonitoring groundwater levelsaero» two fracture zonesHydrochemical well investiga-tion
Hydrobotanl.al »tudiei
Status reports
77 78 79 80 81 82 83 84 85 86 87 88 89 90 91
SKBF/KBS AR 80-10
SKBF/KBS AR 80-08
SKBF/KBS AR 80-09
SKBF/KBS AR 82-36
SKBF/KBS AR 80-12
SKBF/KBS AR 80-07SKBF/KBS AR 81-22KBS 1977SKBF/KBS TR 83-56
Figure 10. Activity periods - geohydrological and hydrobotanical studiesduring the site investigation phase.
FINNSJÖN
22
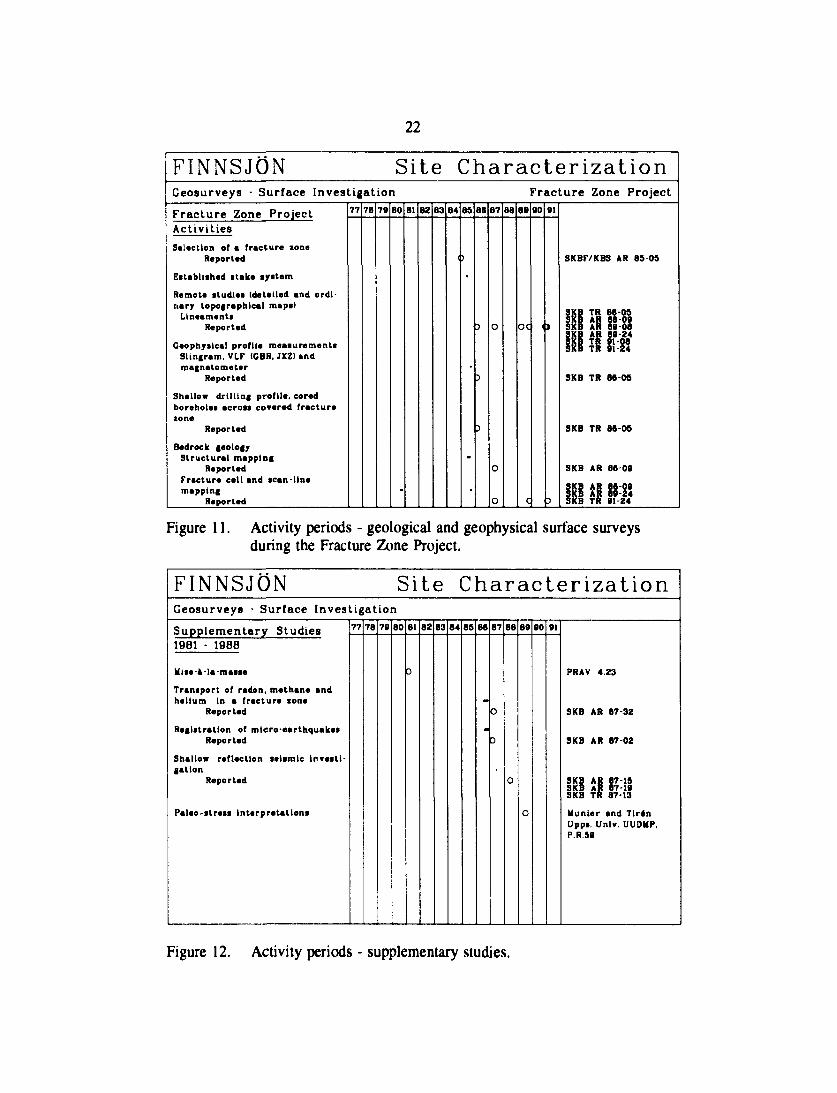
Site CharacterizationCeosurveys - Surface Investigation Fracture Zone ProjectFracture Zone ProjectActivitiesSelection of • fracture zone
Reported
Established stake system
Remote studies (detailed and ordi-nary topographical maps)
LineamentsReported
Geophysical profile measurementsSlingrem. VLF (GBR. JXZ) andmagnetometer
Reported
Shallow drilling profile, coredboreholes across co»ered fracturezone
Reported
Bedrock geologyStructural mapping
ReportedFracture cell and scan-linemapping
Reported
77 78 78 BO 61 62 63 64 85 88 67 88 69 80 81
OC
SKBF/KBS AR 85-05
KB TR
foe4
91-24
SKB TR 86-05
SKB TR 68-05
SKB AR 86-09
SKB AR 86-08SKB AR 89-24SKB TR 91-24
Figure 11. Activity periods - geological and geophysical surface surveysduring the Fracture Zone Project.
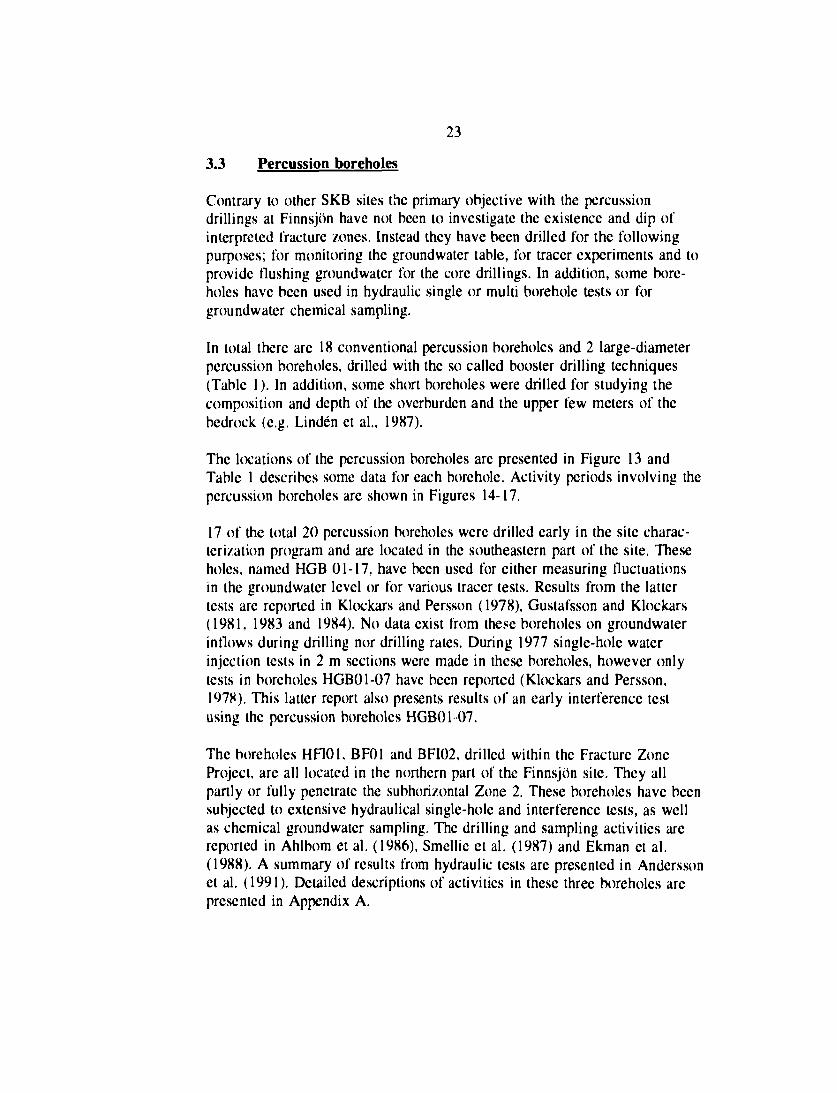
FINNSJÖN Site CharacterizationCeosurveys - Surface InvestigationSupplementary Studies19B1 - 196B
Mise-a-la-masse
Transport of radon, methane andhelium In a fracture xone
Reported
Registration of micro-earthquakesReported
Shallow reflection seismic Investi-gation
Reported
Paleo-stress Interpretations
77 78 79 80 81 82 83 84 85 88 87 88 89 90 91
PRAV 4.23
SKB AR 67-32
SKB AR 87-02
SKB AR 87-15SKB AR 87-19SKB TR 8713
Munter and TlrénUpps. Univ. UUDstP,P.R.59
Figure 12. Activity periods - supplementary studies.
23
3.3 Percussion boreholes
Contrary to other SKB sites the primary objective with the percussiondrillings at Finnsjön have not been to investigate the existence and dip ofinterpreted fracture zones. Instead they have been drilled for the followingpurposes; for monitoring the groundwater table, for tracer experiments and toprovide flushing groundwater for the core drillings. In addition, some bore-holes have been used in hydraulic single or multi borehole tests or forgroundwater chemical sampling.
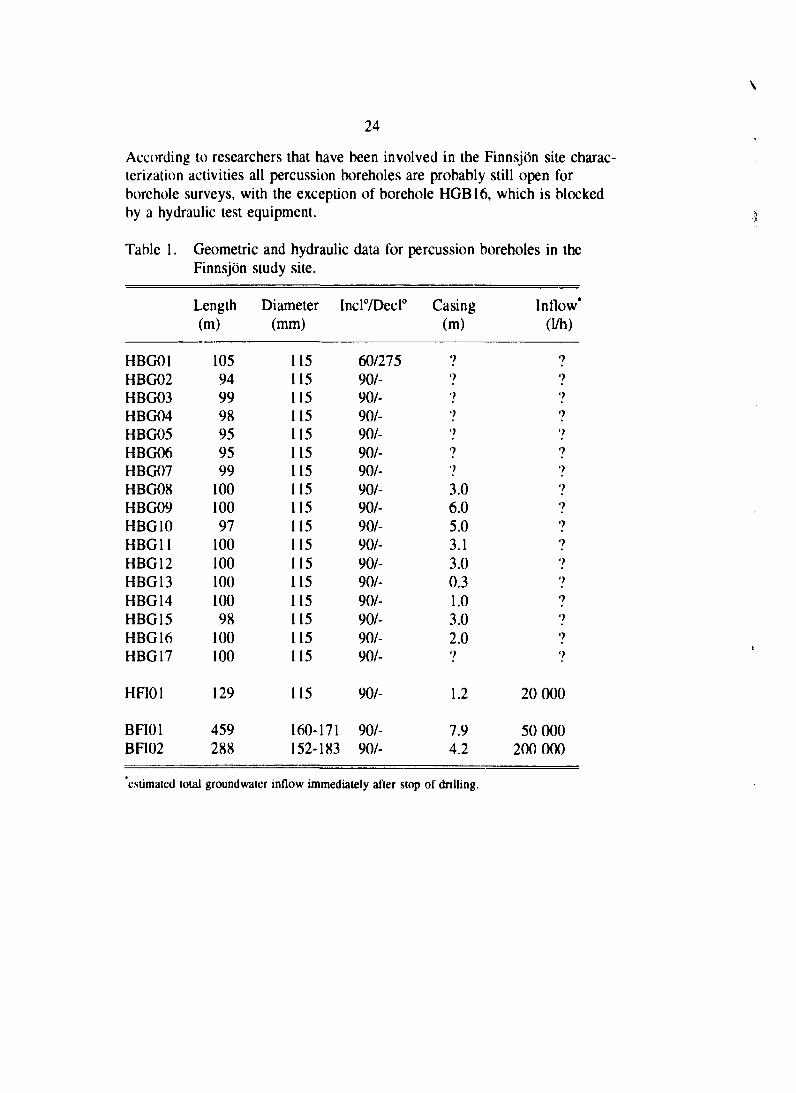
In total there are 18 conventional percussion boreholes and 2 large-diameterpercussion boreholes, drilled with the so called booster drilling techniques(Table 1). In addition, some short boreholes were drilled for studying thecomposition and depth of the overburden and the upper few meters of thebedrock (e.g. Linden et al., 1987).
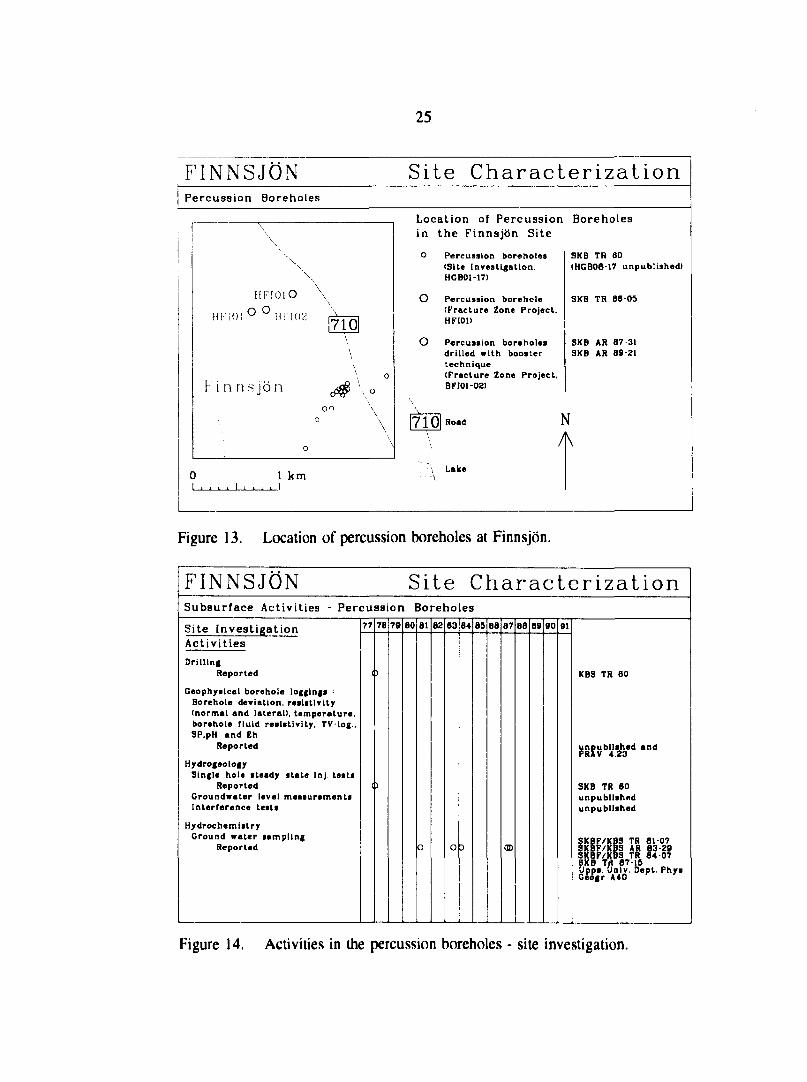
The locations of the percussion boreholes are presented in Figure 13 andTable 1 describes some data for each borehole. Activity periods involving thepercussion boreholes are shown in Figures 14-17.
17 of the total 20 percussion boreholes were drilled early in the site charac-terization program and are located in the southeastern part of the site. Theseholes, named HGB 01-17, have been used for either measuring fluctuationsin the groundwater level or for various tracer tests. Results from the lattertests are reported in Klockars and Persson (1978), Gustafsson and Klockars(1981, 1983 and 1984). No data exist from these boreholes on groundwaterinflows during drilling nor drilling rates. During 1977 single-hole waterinjection tests in 2 m sections were made in these boreholes, however onlytests in boreholes HGB01-07 have been reported (Klockars and Persson,1978). This latter report also presents results of an early interference testusing the percussion boreholes HGB01 07.
The boreholes HFI01, BF01 and BFI02, drilled within the Fracture ZoneProject, are all located in the northern part of the Finnsjön site. They allpartly or fully penetrate the subhorizontal Zone 2. These boreholes have beensubjected to extensive hydraulical single-hole and interference tests, as wellas chemical groundwater sampling. The drilling and sampling activities arereported in Ahlbom et al. (1986), Smellie et al. (1987) and Ekman et al.(1988). A summary of results from hydraulic tests are presented in Anderssonet al. (1991). Detailed descriptions of activities in these three boreholes arcpresented in Appendix A.
24
According to researchers that have been involved in the Finnsjön site charac-terization activities all percussion boreholes are probably still open forborehole surveys, with the exception of borehole HGB16, which is blockedby a hydraulic test equipment.
Table 1. Geometric and hydraulic data for percussion boreholes in theFinnsjön study site.
HBG01HBG02HBG03HBG04HBG05HBG06HBG07HBG08HBG09HBG10HBG11HBG12HBG13HBG14HBG15HBG16HBG17
Length(m)
105949998959599
10010097
10010010010098
100100
Diameter(mm)
115115115115115115115115115115115115115115115115115
InclTDeel0
60/27590/-90/-90/-90/-90/-90/-90/-90/-90/-90/-90/-90/-90/-90/-90/-90/-
Casing(m)
777•)7773.06.05.03.13.00.31.03.02.0•)
Inflow*(1/h)
79
79
777777777777•}
HFI01
BFI01BFI02
129
459288
115 90/-
160-171 90/-152-183 90/-
1.2
7.94.2
20 000
50 000200 000
estimated total groundwater inflow immediately after stop of drilling.
FINNSJÖN
25
Site CharacterizationPercussion Boreholes
Hi
Vi
'10!
n n
\
HFIOl
° m
sjön
o10
\
0
\
co
|7lÖ|
\
°
0
O
\
\
I ,1 km
J
Location of Percussion Boreholesin the Finnsjön Site
O
Percussion boreholes(Site Investigation,HGB01-17)
Percussion borehole(Fracture Zone Project,HFI01)
Percussion boreholesdrilled with boostertechnique(Fracture Zone Project,BFIOl-OZ)
SKB TR 60(HGB08 17 unpublished)
SKB TR 86-05
SKB AR 87 31SKB AR 89-21
N
Lake
Figure 13. Location of percussion boreholes at Finnsjön.
FINNSJON Site CharacterizationSubsurface Activities - Percussion Boreholes
Site InvestigationActivitiesDrilling
Reported
Geophysical borehole loggings -Borehole deviation, reiiitlvity(normal and lateral), temperature,borehole fluid resistivity, TV-log.,SP.pH and Eh
Reported
HydrogeologySingle hole steady state lnj tests
ReportedCroundwater level measurementsInterference tests
HydrochemistryGround water sampling
Reported
77 78 79 80 81 83 84 85 88 87 88 89 90 91
KBS TR 60
unpublished and
SKB TR 80unpublishedunpublished
VKBS TR 81-077KBS AR 83-29VKBS TR 84-07
SKB Tfl 87-15Upps. Univ. Dept. Phys.Ceogr A40
Figure 14. Activities in the percussion boreholes - site investigation.
26
FINNSJÖN Site CharacterizationSubsurface Activities - Percussion Boreholes
Site InvestigationActivitiesGroundvater flow measured bypoint dilution method
Reported
Groundwater transport, nonradio-active tracer!
Reported
Tracer teitt, method study
77|78|79J8O|BtJB2|83 84 85 80 87 88|89|90|»l
<D
SKBF/KBS AR 84-06SKB AR 68-21SKB Tech Note 1987
SKBF/KBS AR 80 34SKBF/KBS TR 81-07SKBF/KBS AR 83-20SKBF/KBS TR 83-36SKBF/KBS AR 84-07
SKN ARBETS PM19904-10
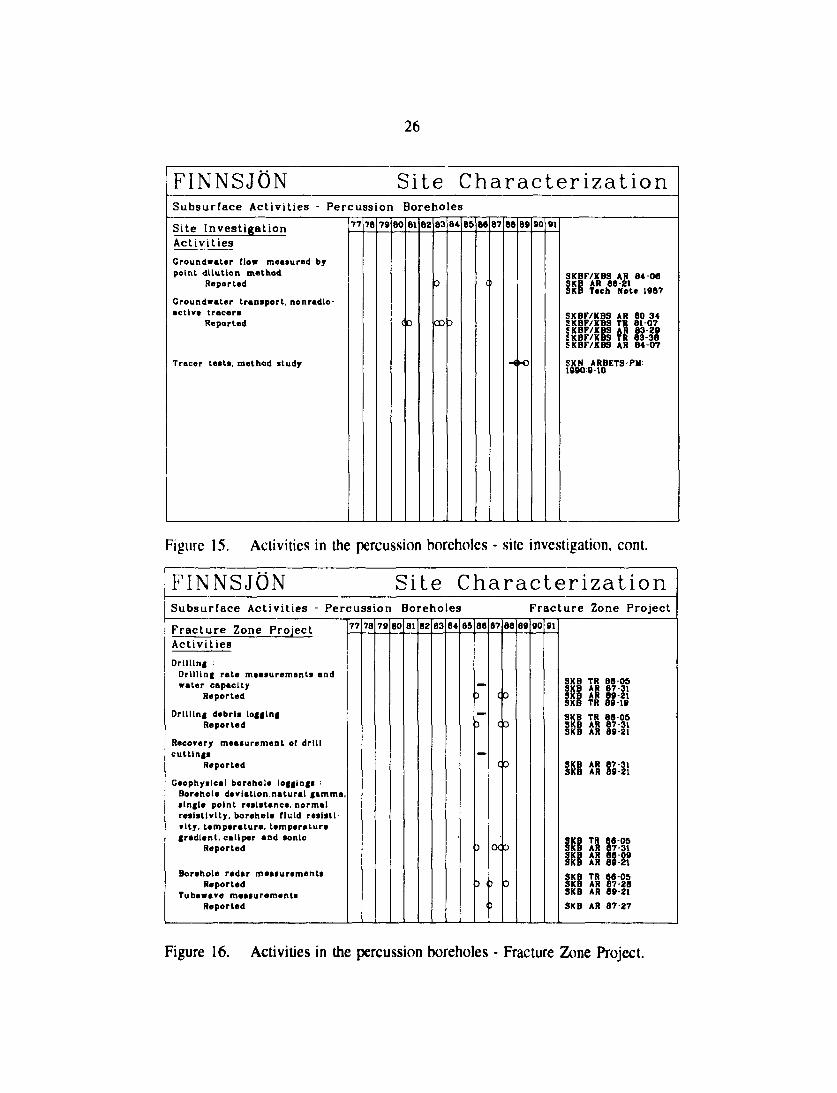
Figure 15. Activities in the percussion boreholes - site investigation, cont.
FINNSJÖN Site CharacterizationSubsurface Activities - Percussion Boreholes Fracture Zone Project
Fracture Zone ProjectActivitiesDrilling •
Drilling rate measurement! andwater capacity
Reported
Drilling debris loggingReported
Recovery measurement of drillcuttings
Reported
Geophysical borehole loggings -Borehole deviation,natural gammasingle point resistance, normalresistivity, borehole fluid resisti-vity, temperature, temperaturegradient, callper and sonic
Reported
Borehole radar measurementsReported
Tubewave measurementsReported
77 78 79 80 81 82 83 84 85 88 87
C 3
C D
88 89 90 91
SKB TR 88-05SKB AR 87-31SKB AR 69-21SKB TR 89-19
SKBSKBSKB
TR 88-05AR 87-31AR 89-21
SKB AR 67-31SKB AR 89-21
-052821
KB TR 86-05KB AR 87 28KB AR 69-21
SKB AR 87-27
Figure 16. Activities in the percussion boreholes - Fracture Zone Project,
FINNSJÖN
27
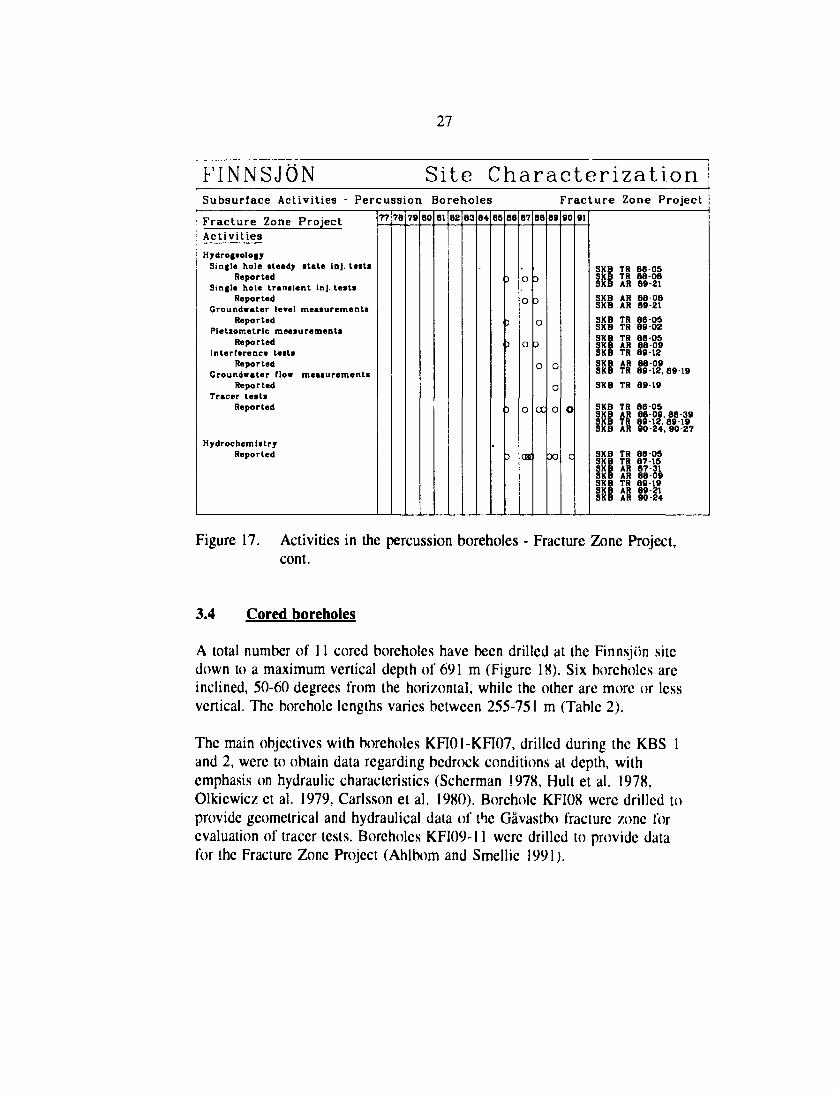
Site CharacterizationSubsurface Activities - Percussion Boreholes Fracture Zone Project
Fracture Zone ProjectActivitiesHjrdrogeology
Single hole steady state Inj. testsReported
Single hole transient Inj. testsReported
Groundwater level measurementsReported
Pietxometric measurementsReported
Interference testsReported
Groundwater (low measurementsReported
Tracer testsReported
HydrochemlstryReported
77 76 79 80 81 83 84 85 88 87188 89 90 91
OC
XI
TR B0-O5TR B8-08AR 89 21
SKB ARSKB AR
9 089-21
8689-
SKB TR 86-05SKB AR 88-09SKB TR 8 9 1 2SKB AR 86-09SKB TR 89-12. 89-19SKB TR 89-19
SKB TR 86-05AR 88-09. 88-38TR 89-12. 8919AR SO-24. 90-27
TRTRAR 87-31AR 88-09
96-05J7-15
SKESKESKESKESKB TR 89-19SKB AR 89-21SKB AR SO 24
Figure 17. Activities in the percussion boreholes - Fracture Zone Project,cont.
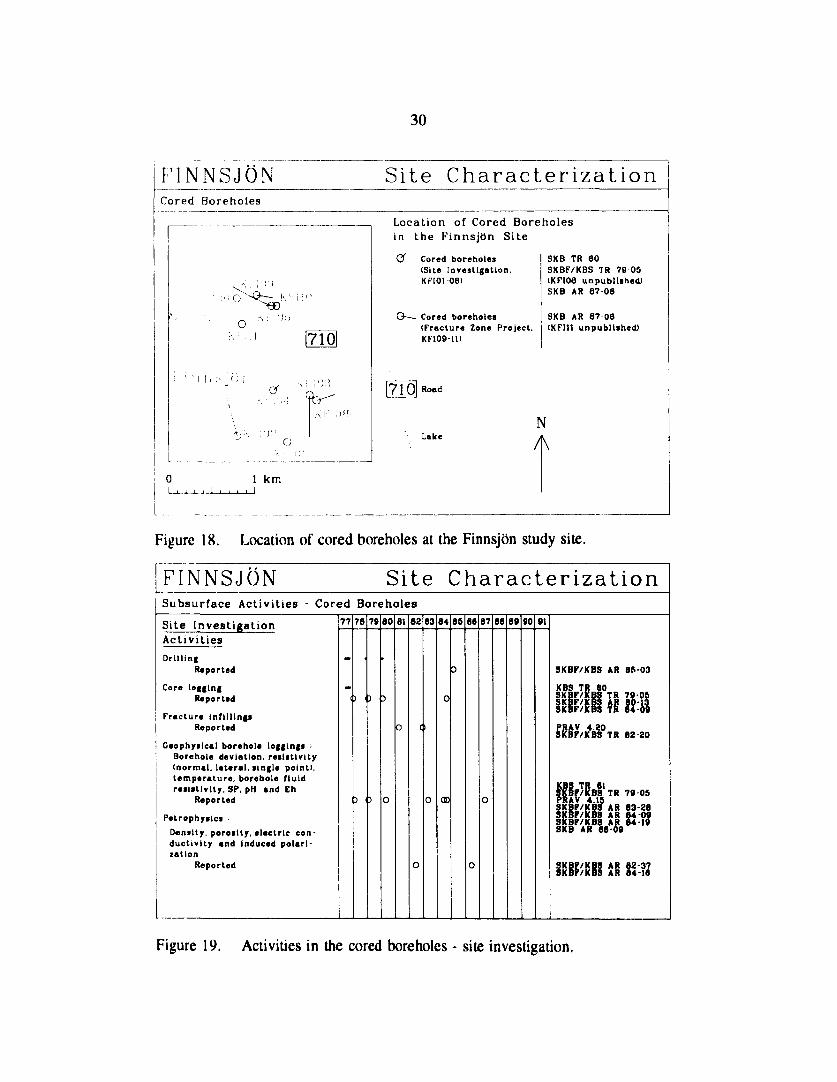
3.4 Cored boreholes
A total number of 11 cored boreholes have been drilled at the Finnsjön sitedown to a maximum vertical depth of 691 m (Figure 18). Six boreholes arcinclined, 50-60 degrees from the horizontal, while the other are more or lessvertical. The borehole lengths varies between 255-751 m (Table 2).
The main objectives with boreholes KFI01-KFI07, drilled during the KBS 1and 2, were to obtain data regarding bedrock conditions at depth, withemphasis on hydraulic characteristics (Scherman 1978, Hult et al. 1978,Olkiewicz et al. 1979, Carlsson et al. 1980). Borehole KFI08 were drilled toprovide geometrical and hydraulical data of the Gåvastbo fracture /.one forevaluation of tracer tests. Boreholes KFI09-11 were drilled to provide datafor the Fracture Zone Project (Ahlbom and Smellie 1991).
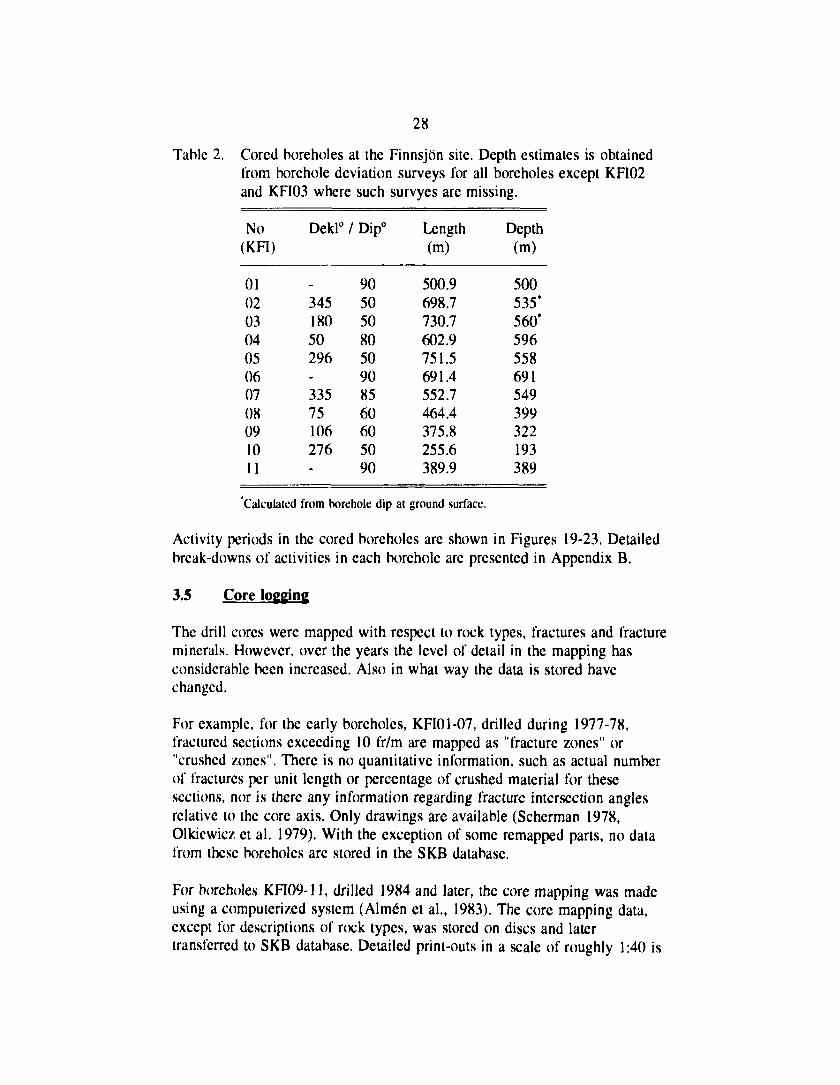
28
Table 2. Cored boreholes at the Finnsjön site. Depth estimates is obtainedfrom borehole deviation surveys for all boreholes except KFI02and KFI03 where such survyes are missing.
No(KFI)
0102030405060708091011
Dekl° i
_
34518050296-33575106276-
'Dip0
9050508050908560605090
Length(m)
500.9698.7730.7602.9751.5691.4552.7464.4375.8255.6389.9
Depth(m)
500535*560*596558691549399322193389
Calculated from borehole dip at ground surface.
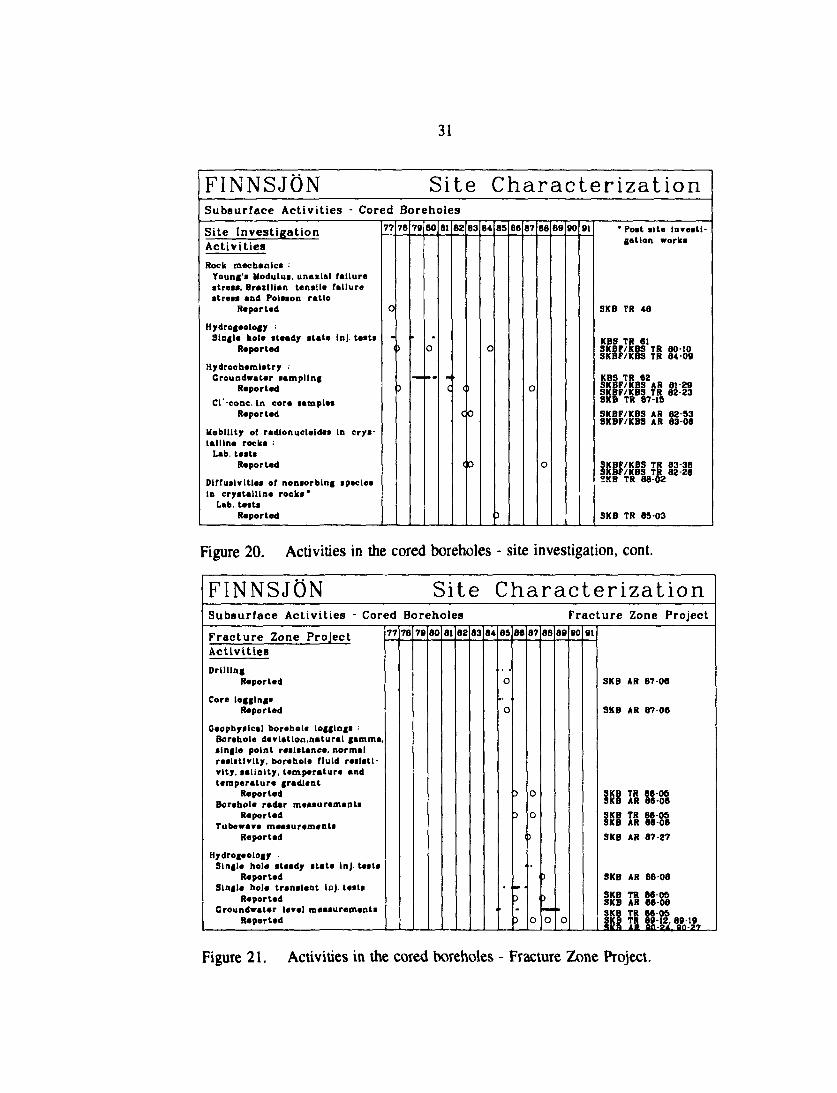
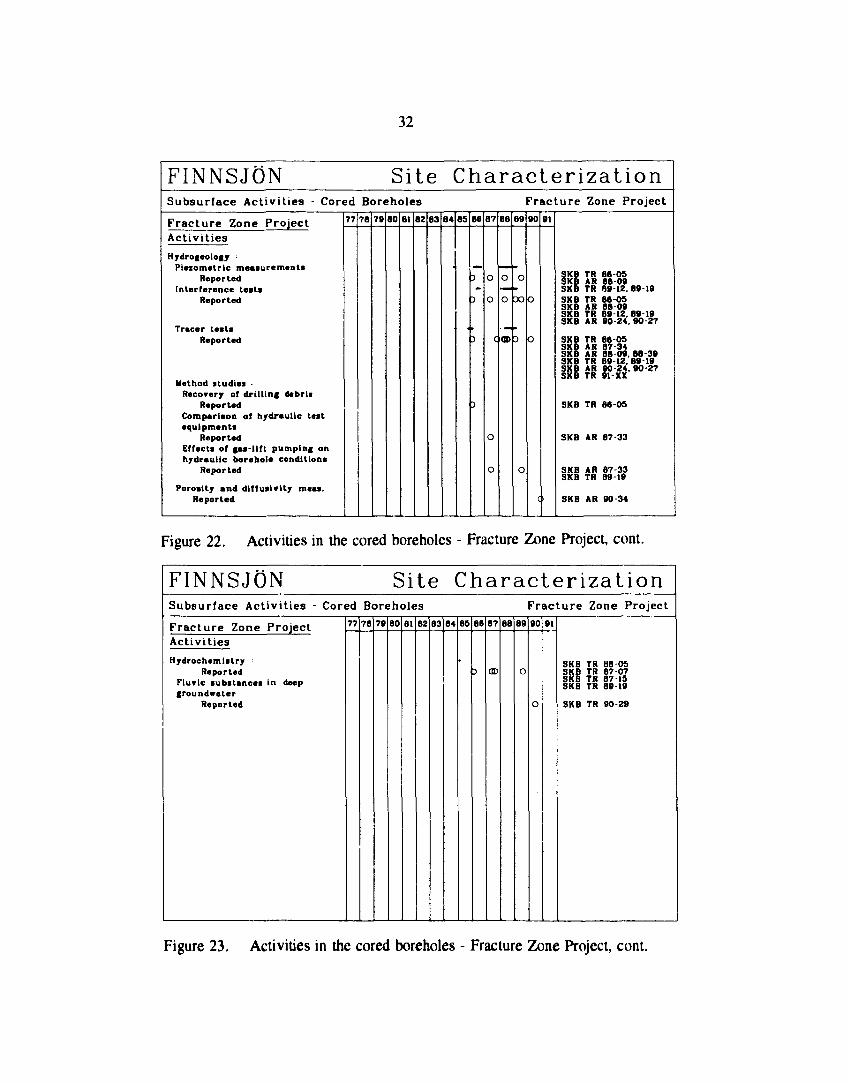
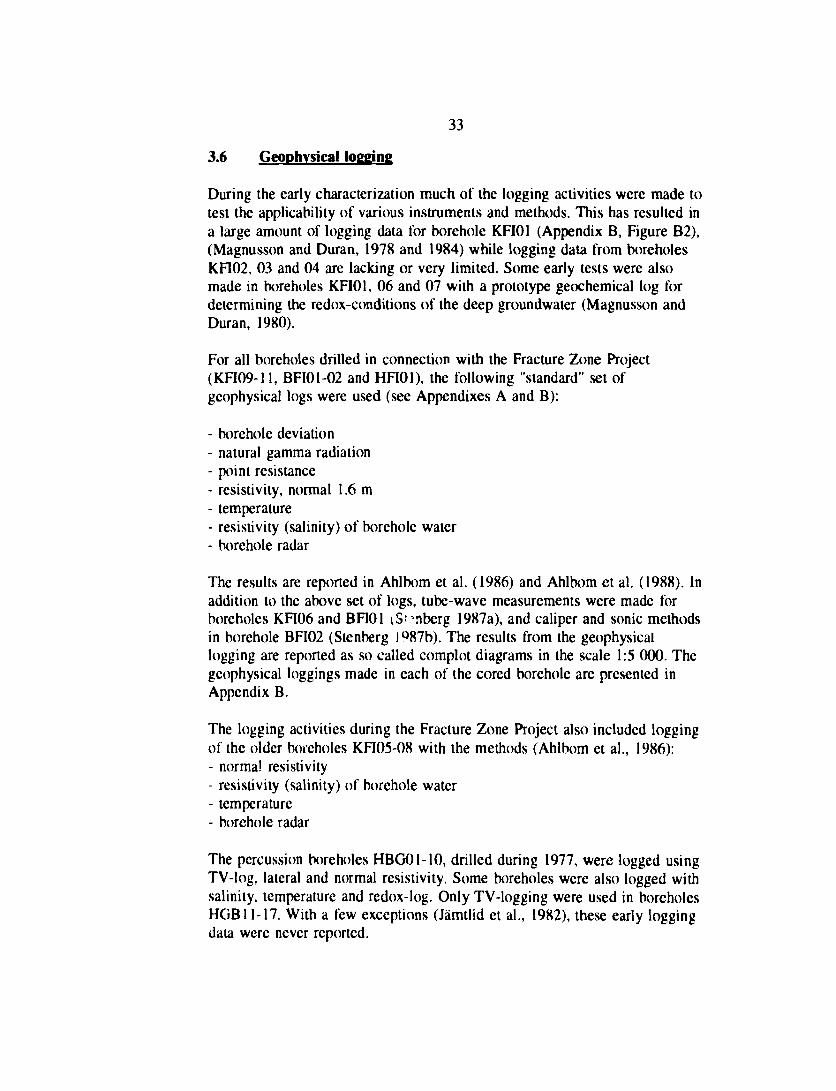
Activity periods in the cored boreholes are shown in Figures 19-23. Detailedbreak-downs of activities in each borehole are presented in Appendix B.
3.5 Core logging
The drill cores were mapped with respect to rock types, fractures and fractureminerals. However, over the years the level of detail in the mapping hasconsiderable been increased. Also in what way the data is stored havechanged.
For example, for the early boreholes, KFI01-07, drilled during 1977-78,fractured sections exceeding 10 fr/m are mapped as "fracture zones" or"crushed zones". There is no quantitative information, such as actual numberof fractures per unit length or percentage of crushed material for thesesections, nor is there any information regarding fracture intersection anglesrelative to the core axis. Only drawings are available (Scherman 1978,Olkiewicz et al. 1979). With the exception of some remapped parts, no datafrom these boreholes are stored in the SKB database.
For boreholes KFI09-11, drilled 1984 and later, the core mapping was madeusing a computerized system (Almén et al., 1983). The core mapping data,except for descriptions of rock types, was stored on discs and latertransferred to SKB database. Detailed print-outs in a scale of roughly 1:40 is
29
available in Ahlbom et al. (1985) for boreholes KFI09 and KFI10. Thisreport also contains some remapped sections of boreholes KFI05 and KFI06.The locations of the remapped sections are shown in Figures B6-B8,Appendix B.
The SKB database of boreholes KFI09-11 and parts of KFI05-07 include dataon:
- rock type- intersection angle between lithological contact and core axis- type of fracture (sealed, fresh or coated)- intersection angle between fracture and core axis- fractured section (more than 10 fr/m)- crushed section- core loss- fracture mineral- short comment
No print-out regarding the core mapping of borehole KFI08, drilled during1980, is available because of early termination of a research project. Also,no print-outs of the core logging of KFI11 and remapped parts of KFI07 areavailable, although data from these boreholes is stored in the SKB database.
Core samples for petrophysical measurements were taken from boreholeKFI05 (6 samples between 261-538 m) and KFI08 (14 samples between 115-322 m). The results are reported in Jämtlid and Tullborg (1982) and Öqvistand Jämtlid (1984). The samples were measured with respect to:
- density- porosity- resistivity- induced polarization
30
FINNSJÖN Site CharacterizationCored Boreholes
o• . : i
0
Location of Cored Boreholesin the Finnsjön Site
Cored boreholes(Site Investigation,KFI01-08)
O— Cored boreholes(Fracture Zone Project,KFI09-UI
\ Road
SKB TR 60SKBF/KBS TR 78 05(KFI08 unpublished)SKB AR 87 06
SKB AR 87 06(KF111 unpublished)
LakeN
1 km
Figure 18. Location of cored boreholes at the Finnsjön study site.
FINNSJÖN Site CharacterizationSubsurface Activities - Cored Boreholes
Site Investigation1 — "
ActivitiesDrilling
Reported
Core loggingReported
Fracture infilling!Reported
Geophysical borehole loggings •Borehole deviation, resistivity(normal, lateral, single point),temperature, borehole fluidresistivity. SP, pH and Eh
Reported
PetrophysicsDensity, porosity, electric con-ductivity and induced polari-zation
Reported
77
(
78
.
> i
)
78
3
80
D
O
81
0
82
(
O
83
0
84
0
0D
85 66
0
87
0
86 89 80 91
SKBF/KBS AR 86-03
KBS TR 60SKBF/KBS TR 79-05SKBF/KBS AR 60-13SKBF/KBS TR 64-09
SKBF/KBS0TR 82-20
S
3
i2v/K4B15 TR 790i
EBF/KBS AR 83-28IBF/KBS AR J*-OJIB AR 68-09
SKBF/KBS AR 82-37QffRP/VRR AR 1 1 111
Figure 19. Activities in the cored boreholes - site investigation.
31
FINNSJÖNSubsurface Activities - Cored
Site InvestigationActivitiesRock mechanics :
Young's Modulus, unaxlal failurestress, Brazilian tensile failurestress and Poisson ratio
Reported
Hydrogeology •Single hole steady state in), tests
Reported
Hydrocheraistry •Croundwater sampling
ReportedCl-conc. in core samples
Reported
Mobility of radionucleidet In crys-talline rocks •
Lab. testsReported
Dlffuslvities of nonsorbing speciesIn crystalline rocks*
Lab. testsReported
77
O
-<
Site CharacterizationBoreholes
78
i
)
70
•
80
-0
• •
81
•a
C
82
(
C
(
83
I
0
D
84
O
85
3
66 87
O
86
O
89 90
1
91 ' Post s i te investi-gation works
SKB TR 48
KBS TR 61SKBF/KBS TR 80-10SKBF/KBS TR 8 4 0 9
KBS TR 62SKBF/KBS AR 81-29SKBF/KBS TR 82-23SKB TR 87-15SKBF/KBS AR 82-53SKBF/KBS AR 8 3 0 6
SKB TR 85-03
Figure 20. Activities in the cored boreholes - site investigation, cont.
FINNSJÖN Site Character izat ionSubsurface Activities - Cored Boreholes Fracture Zone Project
Fracture Zone ProjectActivitiesDrilling
Reported
Core loggingsReported
Geophysical borehole loggings •Borehole deviation,natural gamma,single point resistance, normalresistivity, borehole fluid resisti-vity, salinity, temperature andtemperature gradient
ReportedBorehole radar measurements
ReportedTubewave meesurements
Reported
Hydrogeology •Single hole steady state Inj. tests
ReportedSingle hole transient inj. tests
ReportedCroundwater level measurements
Reported
77 78 70 80 81 82 83 84 85
O
O
•
86
5
D
3
3
87
0
0
)
0
88
O
89
O
90 91
SKB AR 87-08
SKB AR 87-06
Kl
SKB
SKB
SKB8KB
TRAR
AR
AR
AR
TRAR
S3
87-27
88-06
88-OS88-06
Figure 21. Activities in the cored boreholes - Fracture Zone Project.
32
FINNSJÖN SiteSubsurface Activities - Cored Boreholes
Fracture Zone ProjectActivitiesHydrogeology •
Piezometric measurementsReported
Interference testsReported
Tracer testsReported
Method studies •Recovery of drilling debris
ReportedComparison of hydraulic testequipments
ReportedEffects of gas-lift pumping onhydraulic borehole conditions
Reported
Porosity and diffuslvity meas.Reported
77 78 79 80 81 82 83
Charac terizationFracture
84 85 86
•
>
87
O
O
C
o
o
88
»mm
O
o
89
O
XI
3
O
90
0
0
c
91
SKBSKBSKB
IK§SKBSKB
SKB
SKBSKB
IK!
SKB
SKB
SKBSKB
SKB
Zone Project
TRARTRTRARTRAR
TRAR
TRARTR
TR
AR
ARTR
AR
86-0588-0989-12. 89-19
Siot89-12. 89-1990-24. »0-27
86-0587-3488-09. 88-3989-12. 89-1990-24. 90-2791-XX
86-05
87-33
87-3389-19
90-34
Figure 22. Activities in the cored boreholes - Fracture Zone Project, cont.
FINNSJÖN Site CharacterizationSubsurface Activities - Cored Boreholes Fracture Zone Project
Fracture Zone ProjectActivitiesHydrochemistry
ReportedFIUTIC substances in deepgroundwater
Reported
77 78 79 80 81 82 83 84 85 86 87 88
(3D
89 90 91
SKB TR B6-05SKB TR 87-07SKB TR 87-15SKB TR 69-19
SKB TR 90-29
Figure 23. Activities in the cored boreholes - Fracture Zone Project, cont.
33
3.6 Geophysical logging
During the early characterization much of the logging activities were made totest the applicability of various instruments and methods. This has resulted ina large amount of logging data for borehole KFI01 (Appendix B, Figure B2),(Magnusson and Duran, 1978 and 1984) while logging data from boreholesKFI02, 03 and 04 are lacking or very limited. Some early tests were alsomade in boreholes KFI01, 06 and 07 with a prototype geochemical log fordetermining the redox-conditions of the deep groundwater (Magnusson andDuran, 1980).
For all boreholes drilled in connection with the Fracture Zone Project(KFI09-11, BFI01-02 and HFI01), the following "standard" set ofgeophysical logs were used (see Appendixes A and B):
- borehole deviation- natural gamma radiation- point resistance- resistivity, normal 1.6 m- temperature- resistivity (salinity) of borehole water- borehole radar
The results are reported in Ahlbom et al. (1986) and Ahlbom et al. (1988). Inaddition to the above set of logs, tube-wave measurements were made forboreholes KFI06 and BFI01 iSf^nberg 1987a), and caliper and sonic methodsin borehole BFI02 (Stenberg i 987b). The results from the geophysicallogging are reported as so called complot diagrams in the scale 1:5 000. Thegeophysical loggings made in each of the cored borehole are presented inAppendix B.
The logging activities during the Fracture Zone Project also included loggingof the older boreholes KFIO5-O8 with the methods (Ahlbom et al., 1986):- normal resistivity- resistivity (salinity) of borehole water- temperature- borehole radar
The percussion boreholes HBG01-10, drilled during 1977, were logged usingTV-log, lateral and normal resistivity. Some boreholes were also logged withsalinity, temperature and redox-log. Only TV-logging were used in boreholesHGB11-17. With a few exceptions (Jämtlid et al., 1982), these early loggingdata were never reported.
34
3.7 Hydraulic tests and monitoring
Water injection single-hole tests
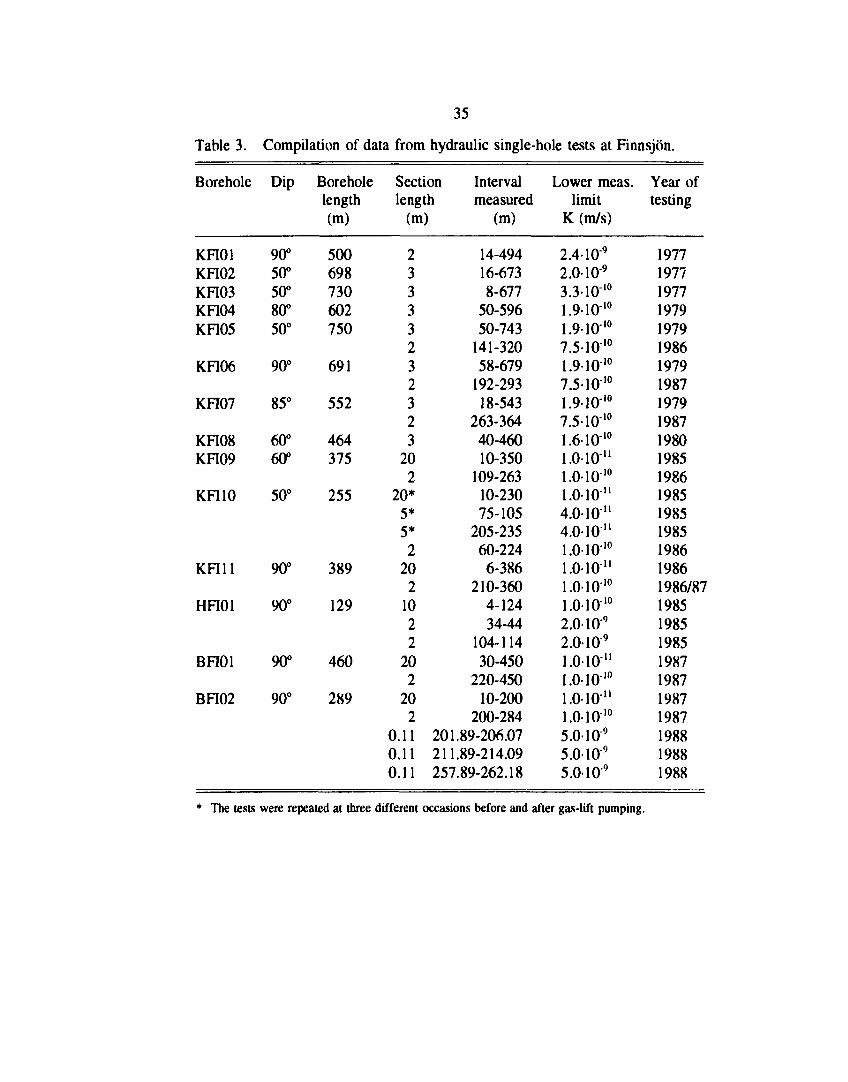
Single-hole watt/ injection tests have been carried out since 1977 at theFinnsjön study site. Information on boreholes tested, actual packer spacing,intervals measured, lower measurement limits and year of testing is compiledin Table 3. The oldest tests (boreholes KFI01-08) were normally performedin 3 m-sections, covering almost the entire boreholes. These tests, whichwere carried out as short-time steady-state tests, are reported by Hult et al.(1978) and Carlsson et al. (1980). In the deepest parts of boreholes KF102and KFI03 no hydraulic tests were performed due to intense fracturing.
The Fracture Zone Project was initiated 1984. In this project the hydraulicsingle-hole tests were generally performed in 2 m-sections covering Zone 2and its immediate surroundings. Tests in 20 m-sections were generally per-formed above Zone 2 and in some cases along the entire boreholes. Single-packer tests were generally carried out in the lower parts of the boreholes.
The 2 m-tests were performed as short steady-state tests whereas the 20 m-tests were transient tests of 2 hours of injection followed by 2 hours ofpressure recovery. Finally, very detailed tests in 0.11 m-sections were carriedout in segments of Zone 2 in borehole BFI02. Results are reported inAhlbom et al. (1986), Ahlbom et al. (1988), Andersson et al. (1988) andEkman et al. (1988). The performance and interpretation of the single-holetests are described in Almén et al. (1986). A comparison of results from old3 m-tests and new 2 m-tests in boreholes KFIO5-O7 is reported in Anderssonet al. (1988). The activity periods for the hydraulic tests are presented inFigure 21. Scope of water injection tests in the different boreholes ispresented in Appendixes A and B.
Interference tests
During drilling of be ehole BFI01 the groundwater head was registered inisolated sections in sc /eral other boreholes. Since water was flushed out ofborehole BFI01 by compressed air at a fairly constant rate, the drillingperiods could be regarded as (preliminary) drawdown tests. Between thedrilling periods the groundwater heads were allowed to recover. These testsare reported in Ahlbom et al. (1988). Subsequently, more sophisticatedhydraulic interference tests were carried out by pumping from different partsof Zone 2 in borehole BFI02 and monitoring the head changes in isolatedmultiple-borehole sections within Zone 2 and in a few boreholes outside thezone. The detailed interference tes's were analysed both qualitatively and(.'.ntitatively by Andersson et al. 1989).
35
Table 3. Compilation of data from hydraulic single-hole tests at Finnsjön.
Borehole
KFI01KFI02KFI03KFI04KFI05
KFI06
KFI07
KFI08KFI09
KFI10
KFI11
HFI01
BFI01
BFI02
Dip
90°50°50°80°50°
90°
85°
60°60°
50°
90°
90°
90°
90°
Boreholelength(m)
500698730602750
691
552
464375
255
389
129
460
289
Sectionlength
(m)
23333232323
202
20*5*5*2
202
1022
202
202
0.11 201.0.11 211.0.11 257.
Intervalmeasured
(m)
14-49416-6738-677
50-59650-743
141-32058-679
192-29318-543
263-36440-46010-350
109-26310-23075-105
205-23560-2246-386
210-3604-12434-44
104-11430-450
220-45010-200
200-28489-206.0789-214.0989-262.18
Lower meas.limit
K(m/s)
2.4109
2.0-109
3.31O"10
1.91010
1.91010
7.5-1010
1.91010
7.51010
1.91010
7.51O10
1.6-10-10
1.010"1.01010
1.010"4 .010"4 .010"1.01010
1.010"1.0-10'°1.01010
2.0-10"9
2.0-109
1.010"1.0-lO"10
1.010"1.01010
5.0-109
5.0-10"9
5.0-109
Year oftesting
1977197719771979197919861979198719791987198019851986198519851985198619861986/871985198519851987198719871987198819881988
The tests were repeated at three different occasions before and after gas-lift pumping.
36
Groundwater head measurements
Groundwater head measurements were made both during undisturbedconditions and during drilling of BFI01 (Ahlbom et al., 1988). Themeasurements were made in 3-5 isolated sections in the cored boreholesKFI05-11 and in three sections of borehole HFI01. The measurements weremade intermittently during most part of 1986. Undisturbed head measure-ments in the borehole sections were obtained before the pumping and afterthe recovery periods of the drilling. To calculate the groundwater potentials,the pressures were corrected for the varying salinity along the boreholes.
Groundwater head estimates were also obtained during the single hole waterinjection tests, before and after the test sequence, in boreholes KFI09-11 andBFIOl. Only head estimates in sections higher than 10"10 m/s were consideredreliable.
Tracer tests
Preliminary tracer tests
Several parameters were determined from preliminary tracer tests in theupper part of Zone 2 by injecting tracers in boreholes KFI06, KFI11 andBFI01 and monitoring the break-through of tracers in the pumping boreholeBFI02 during an interference test (Andersson et al. 1989).
Radially converging tracer test
The objective of the radially converging tracer test was primarily todetermine the transport parameters of Zone 2 and to utilize the experimentalresults for validation and verification of radionuclidc transport. In a radialgeometry of a central pumping borehole (BFI02) and three peripheralinjection boreholes (KFI06, KFI 11 and BFI01), tracers were injected in threepackcd-off intervals in each borehole in totally nine injection points atdistances of c. 150 m from the pumping borehole.
The central borehole was pumped from a packed-off interval enclosing theentire Zone 2. Totally eleven different tracers were injected, eight of themcontinuously for 5-7 weeks and three were injected as pulses.
Tracer breakthrough was registered from all nine injection intervals, with firstarrivals ranging between 24 - 3500 hours. An analytical evaluation oftransport parameters was made including hydraulic conductivity, fractureaperture, flow porosity and dispcrsivity. Possible interconnections betweenhighly conductive intervals were also studied by detailed sampling in the
37
pumping borehole. In addition, a comparison was performed, betweenpredictions of the tracer breakthroughs, based on a numerical model that wascalibrated by the hydraulic interference tests and the experimental results.The radially converging tracer tests are reported by Gustafsson et al. (1990).
Dipole tracer test
A tracer test was also performed in a dipole flow field created in the upperpart of Zone 2 between borehole BFI01 (injection) and BFI02 (withdrawal).The main objective of the test was to verify the results from the radiallyconverging test and to test the applicability of the method in a large scale inhigh conductive rock, using short-lived radioisotopes. Totally 15 tracerinjections were made including 14 radioactive tracers and 5 non-active.Tracer breakthrough was monitored both in the pumping hole BFI02 and intwo observation boreholes, KFI06 and KFI11. The results indicated that thetransport in the upper part of Zone 2 is highly heterogenous. The dipoletracer test is reported by Andersson et al. (1990).
Tracer dilution tests
Tracer dilution tests were performed in boreholes BFI01 and HFI01 todetermine the natural groundwater flow rate in Zone 2, and secondly toestablish the flow rate in the rock and fracture zones adjacent to Zone 2. Thedilution measurements were successful in 10 of the 12 selected boreholesections (Gustafsson and Andersson, 1991).
Other tracer tests
During drilling of borehole KFI11 the flushing water was recovered from theexisting borehole HFI01, located at a distance of about 440 m from KFI11.Both boreholes intersects the upper part of Zone 2.The flushing water waslabelled with a tracer at the surface before it was pumped down in boreholeKFIl 1. A total loss of flushing water occurred when borehole KFI1! penetra-ted the upper boundary of Zone 2 (Gustafsson and Andersson 1991). Bycontinuously monitoring the tracer content of the water pumped up fromborehole HFI01 the first breakthrough of tracer (Uranine) from boreholeKFIl 1 was recorded in borehole HFI01 about one month after penetration ofZone 2.
This test was used to estimate the hydraulic fracture conductivity, firstlybased on the assumption of radial flow in a single fracture between boreholesKFI11 and HFI01 and secondly, assuming linear flow in the fracture betweenthe boreholes. In addition, the flow porosity was estimated assuming a 1 mthick hydraulically active /one. The results are shown in Table 12. The same
38
parameters were latter re-calculated including the effect of the radius ofinfluence (re) and finally, including the combined effects of both radius ofinfluence and enhanced transport velocity in the vicinity of the pumpingborehole.
Early tracer tests were made in a minor fracture zone at the Gåvastbo areabetween boreholes HGB01 and HGB02 (Gustafsson and Klockars, 1981).The equivalent hydraulic fracture conductivity and flow porosity werecalculated. The tests also included studies of sorbing tracers (Cs and Sr)(Gustafsson and Klockars 1984).
3.8 Groundwater sampling
Groundwater sampling has been made in 12 deep boreholes. Sampled depthsvaries between 100-700 m. Results are presented in Laurent (1982), Ahlbomet al. (1986), Smellie and Wikberg (1989) and Andersson et al. (1991). In anearly study geochemical associations between the groundwater and thefracture minerals were discussed by Tullborg and Larson (1982).
Methods for groundwater sampling and chemical analyses have developedconsiderable since the first investigations in 1977. Instruments used in thefirst years was prototypes. The quality of sampling increased considerableduring 1984 when the SKB mobile laboratory vas introduced, which amongother improvements made it possible to measure pH and Eh down-holeduring sampling. Only chemical analyses from the two last sampledboreholes, KFI09 and BFI01, should be regarded as fully representative.
3.9 Studies at the Finnsjön site after 1988
After the main investigation period of the Fracture Zone Project wasterminated in 1988, the Finnsjön site have been used for studyingradionuclide migration in connection with the Chernobyl fallout. The scopeof work and the corresponding references are presented in Figure 24. Apartfrom these studies no field activities have been performed at the Finnsjön sitesince 1988.
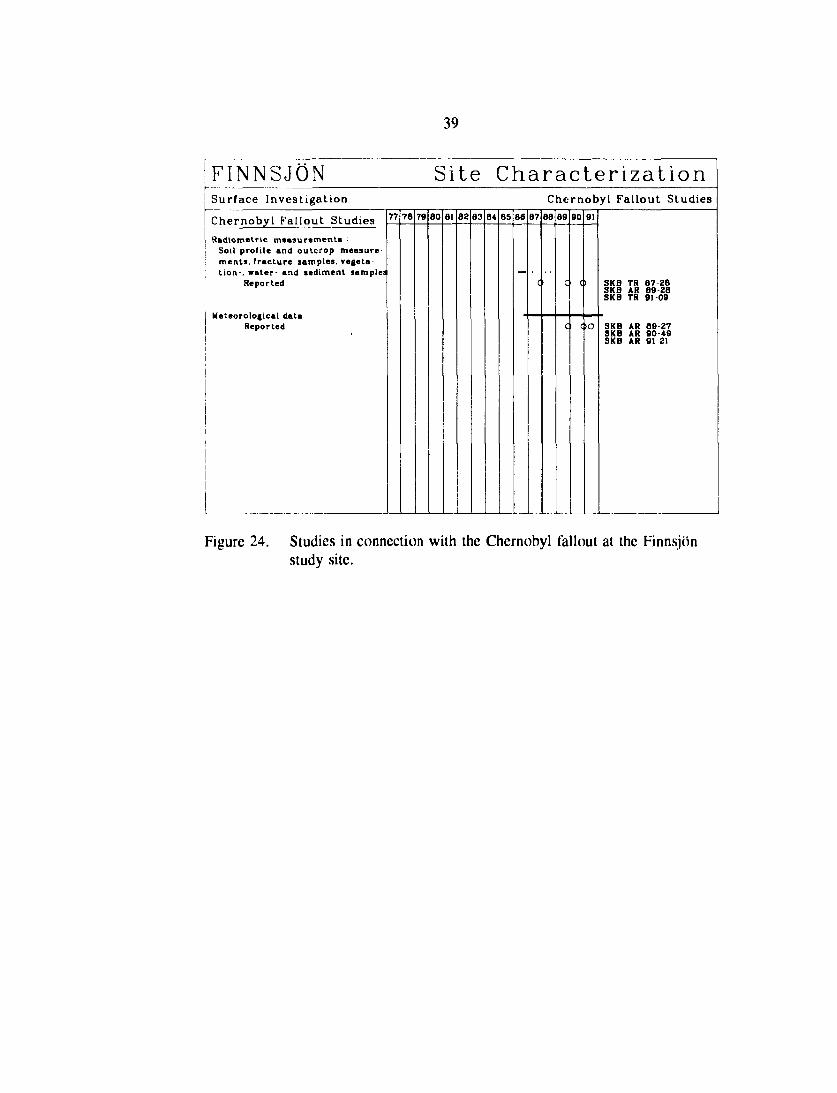
39
FINNSJÖN Site CharacterizationSurface Investigation Chernobyl Fallout Studies
Chernobyl Fallout Studies
Radiomelric measurements •Soil profile and outcrop measurements, fracture samples, vegeta-tion-, water- and sediment samples
Reported
Meteorological dataReported
80 m 82 83 e* 85 8fl 87 ee 89 90 91
SKB TR 87 28SKB AR 89 28SKB TR 9109
ft 88"-SKB AR 8927SKB AR 90-49SKB AR 91-21
Figure 24. Studies in connection with the Chernobyl fallout at the Finnsjönstudy site.
40
4. STORAGE OF INFORMATION IN THE SKB DATABASE
Data from surface surveys
With the exception of the refraction seismic survey, all geophysical surfacemeasurements are stored in the SKB database GEOTAB. "Surface data", suchas geological maps, lineament interpretations, surface fracture surveys, depthof overburden, hydrometerological data and groundwater level maps, are notstored.
Data from borehole surveys/testr
Most data fioir, rht geological and geophysical surveys, hydrological testsand water samDimg in the cored boreholes are stored in GEOTAB. Thisincludes borenoie geometrical data (coordinates, length, dip, deviation etc),core logging ' standard" geophysical logs and single hole hydraulic packertests. Alsi siosrec aie chemical analyses of sampled groundwater from thecored borcno.ti, as v/ell as from the booster borehole BFIOI.
For th'-. r^rcu'jSiori borehoies the database includes geometrical data,geopr • -,'';al iogs, borehole deviation measurements, groundwater levelmot:i-.'.)ur.£ aria some interference tests. A description of stored data fromsurv'..;'.. a, tacit.' oorehole are presented in Appendix A and Appendix B(h)/.<;- 'ni nfcacling GEOTAB;.
:.'w: i'jii'jwiog borehole measurernents/sarnpling/analysis are not stored in the
.Tc-'-iijSit/»'' v,*. »CIOHÄ. Ho Grilling rale:, or data regarding drilling debris arc. . " ; ' - •jrtiifc/rnort, the data base does not contain any information regarding• i,t ,C/,.;..I.UKI!. i»f majoi infiowt and total water capacities.
"-»'.'j .<>&.& fatifeiysfcs. U'u cnemicai analysis of whole rock samples norbt.d;./& :•/< ;.aciurfc minerais i£ stored. This also applies to data concerning'Wb-.riiiOgica. cinfipositions (thin sections).
s measureinenis. No petrophysical nor mechanicals clei.ennined from tests on cort samples are stored. This also
tf^pi.c:.- lo results from the rnise-å-ia-rnasse and tube-wave surveys, as well as'•ht boieiiOiC radar and rock stress measurements.
41
5. GEOLOGIC MODELS
5.1 Regional geologic models
Geology
The rocks comprising the bedrock of northern Uppland are between 2,200 to1,600 million years old. The oldest rock are deposited at the surface of thecrust (supracrustal rocks) and comprises acid volcanics (leptites) andmetasediments with intercalated mineralized beds (eg. Danncmora IronMine). A basement, on which these rocks were deposited, has not beenidentified.
The supracrustal rocks were later deformed and altered during a period ofmountain building, the Svecokarelian orogeny, which culminated c. 1,850million years ago. Huge amounts of granitoids, a magmatic suite of gabbroicto granodioritic (youngest) rocks, were at this time emplaced in thesupracrustal sequence. The culmination of the ductile deformation during theSvecokarelian orogeny occurred just after the intrusion of the granitoids. Thedeformation resulted in a regional foliation and shearing along contacts ofmajor lithological boundaries. The mineralogy of the bedrock indicate thatthis deformation occurred at a temperature of c. 400-600 °C and a pressure ofc. 4-8 kbar (middle amphibolite fades).
The deformation ceased, but before the deformation changed character fromductile to semi-ductile the bedrock was intruded by doloritic Herräng dykes(c. 1,800 million years ago), and the deformation become more linked toregional shear zones, forming regional lens-shaped (anastomosing) patterns.These shear zones have a N-S trend in central Uppland, while they form a c.20-30 km wide, WNW trending belt along the northeastern coastline ofUppland deforming the Herräng dykes.
After the culmination of the semi-ductile deformation, emplacements ofreddish to greyish-red granites occurred, c. 1,700 million years ago. Thesegranites overprinted the semi-ductile shear pattern and brecciated the bedrock.The bedrock was affected by thermal alteration and deformation at thecontacts to the late granites. The deformation was locally intensive.
Younger intrusive rocks, younger than 1,700 million years old, have not beenrecognized at the Finnsjön site nor at its surroundings. However, the recordof younger doleritic and alkaline intrusions just outside this area arenumerous. The region was affected by block faulting during a long period,more than 800 million years. This block faulting declined and erosionresulted in the formation of the sub-Cambrian peneplain for more than 600
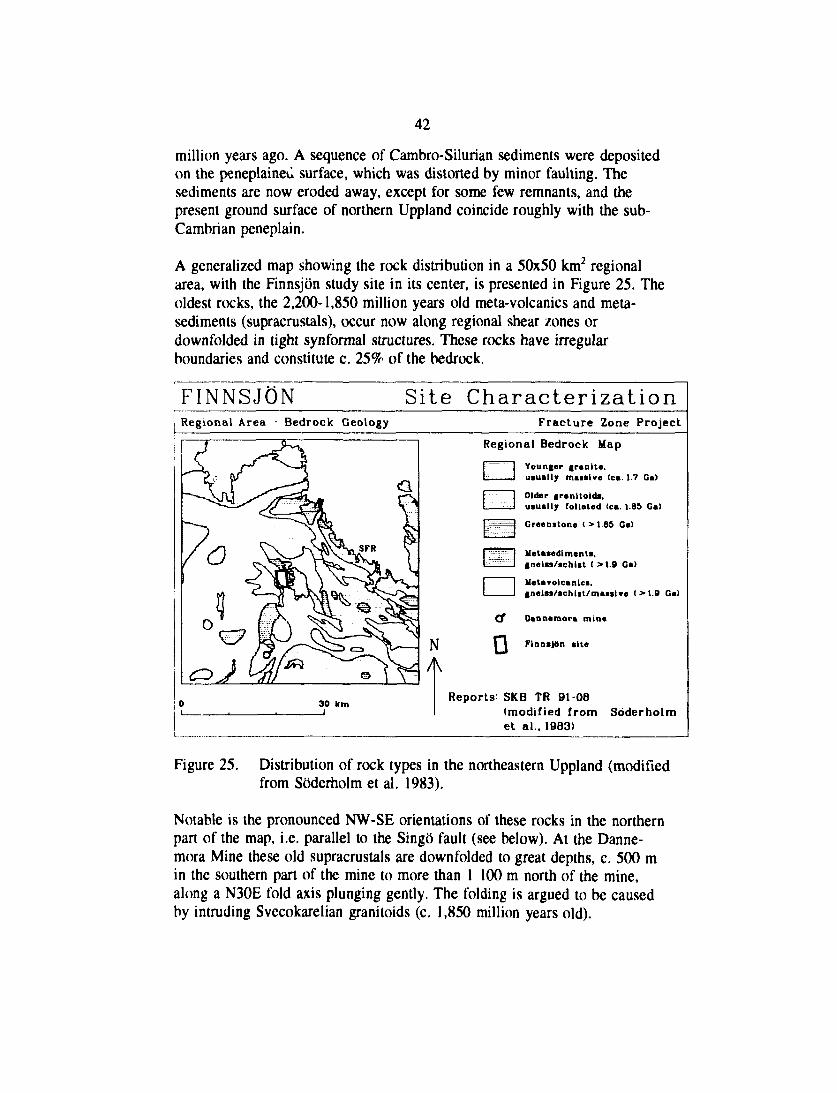
42
million years ago. A sequence of Cambro-Silurian sediments were depositedon the peneplaineu surface, which was distorted by minor faulting. Thesediments are now eroded away, except for some few remnants, and thepresent ground surface of northern Uppland coincide roughly with the sub-Cambrian peneplain.
A generalized map showing the rock distribution in a 50x50 km2 regionalarea, with the Finnsjön study site in its center, is presented in Figure 25. Theoldest rocks, the 2,200-1,850 million years old meta-volcanics and meta-sediments (supracrustals), occur now along regional shear zones ordownfolded in tight synformal structures. These rocks have irregularboundaries and constitute c. 25% of the bedrock.
FINNSJON Site CharacterizationRegional Area - Bedrock Geology Fracture Zone Project
Regional Bedrock Map
cr
o
Younger granite.usually maattve (ca. 1.7 Ga)
Older granitoids,usually foliated (ca. 1 85 Ca)
Greenstone <>1.8S Ca)
Metasedlments,gneiss/schist ( >1.9 Ga)
Metavolcanics.gneiss/schist/masstve (>1.9 Ga)
Dannemora mine
Finnsjön site
i
Reports^ SKB TR 91 08(modified from Söderholmet al.. 1963)
Figure 25. Distribution of rock types in the northeastern Uppland (modifiedfrom Söderholm et al. 1983).
Notable is the pronounced NW-SE orientations of these rocks in the northernpart of the map, i.e. parallel to the Singö fault (see below). At the Danne-mora Mine these old supracrustals are downfolded to great depths, c. 500 min the southern part of the mine to more than 1 100 m north of the mine,along a N30E fold axis plunging gently. The folding is argued to be causedby intruding Svecokarelian granitoids (c. 1,850 million years old).
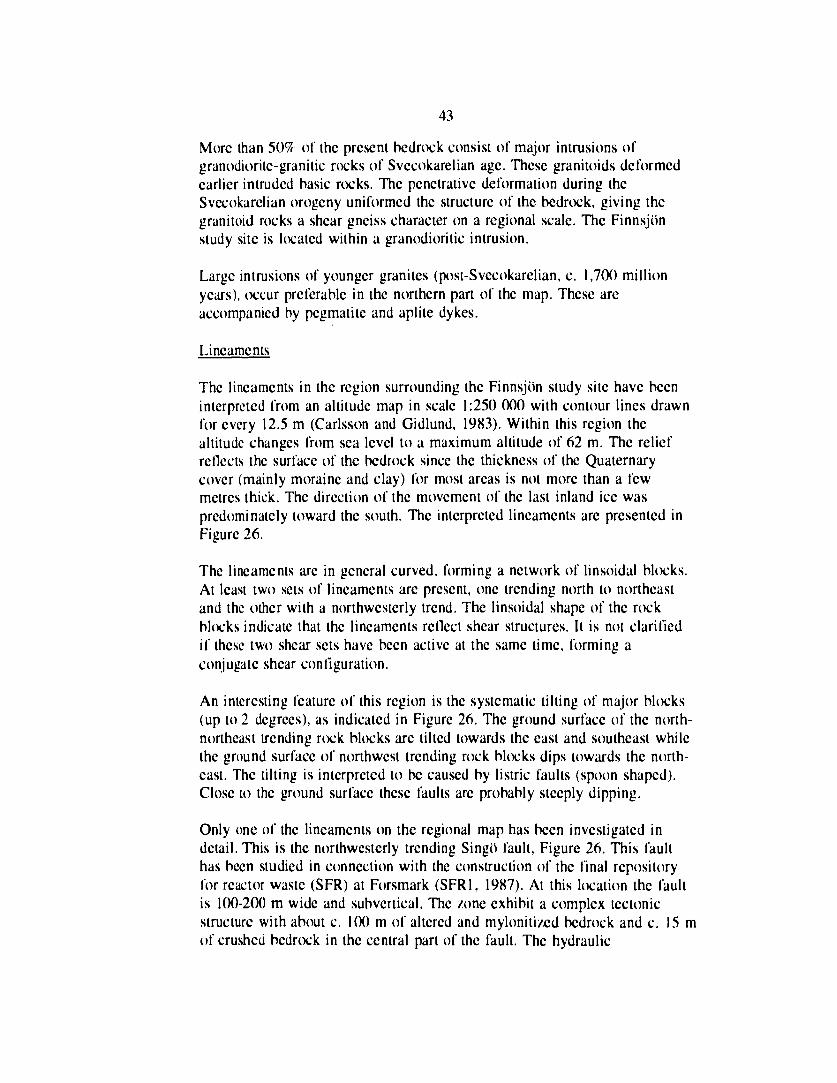
43
More than 509? of the present bedrock consist of major intrusions ofgranodiorite-granitic rocks of Svecokarelian age. These granitoids deformedearlier intruded basic rocks. The penetrative deformation during theSvecokarelian orogeny uniformed the structure of the bedrock, giving thegranitoid rocks a shear gneiss character on a regional scale. The Finnsjönstudy site is located within a granodioritic intrusion.
Large intrusions of younger granites (post-Svecokarelian, c. 1,700 millionyears), occur preferable in the northern part of the map. These areaccompanied by pegmatite and aplite dykes.
Lineaments
The lineaments in the region surrounding the Finnsjön study site have beeninterpreted from an altitude map in scale 1:250 000 with contour lines drawnfor every 12.5 m (Carlsson and Gidlund, 1983). Within this region thealtitude changes from sea level to a maximum altitude of 62 m. The reliefreflects the surface of the bedrock since the thickness of the Quaternarycover (mainly moraine and clay) for most areas is not more than a fewmetres thick. The direction of the movement of the last inland ice waspredominately toward the south. The interpreted lineaments are presented inFigure 26.
The lineaments arc in general curved, forming a network of linsoidal blocks.At least two sets of lineaments are present, one trending north to northeastand the other with a northwesterly trend. The linsoidal shape of the rockblocks indicate that the lineaments reflect shear structures. It is not clarifiedif these two shear sets have been active at the same time, forming aconjugate shear configuration.
An interesting feature of this region is the systematic tilting of major blocks(up to 2 degrees), as indicated in Figure 26. The ground surface of the north-northeast trending rock blocks are tilted towards the east and southeast whilethe ground surface of northwest trending rock blocks dips towards the north-east. The tilting is interpreted to be caused by listric faults (spoon shaped).Close to the ground surface these faults are probably steeply dipping.
Only one of the lineaments on the regional map has been investigated indetail. This is the northwesterly trending Singö fault, Figure 26. This faulthas been studied in connection with the construction of the final repositoryfor reactor waste (SFR) at Forsmark (SFR1, 1987). At this location the faultis 100-200 m wide and subvertical. The /one exhibit a complex tectonicstructure with about c. 100 m of altered and mylonitized bedrock and c. 15 mof crushed bedrock in the central part of the fault. The hydraulic
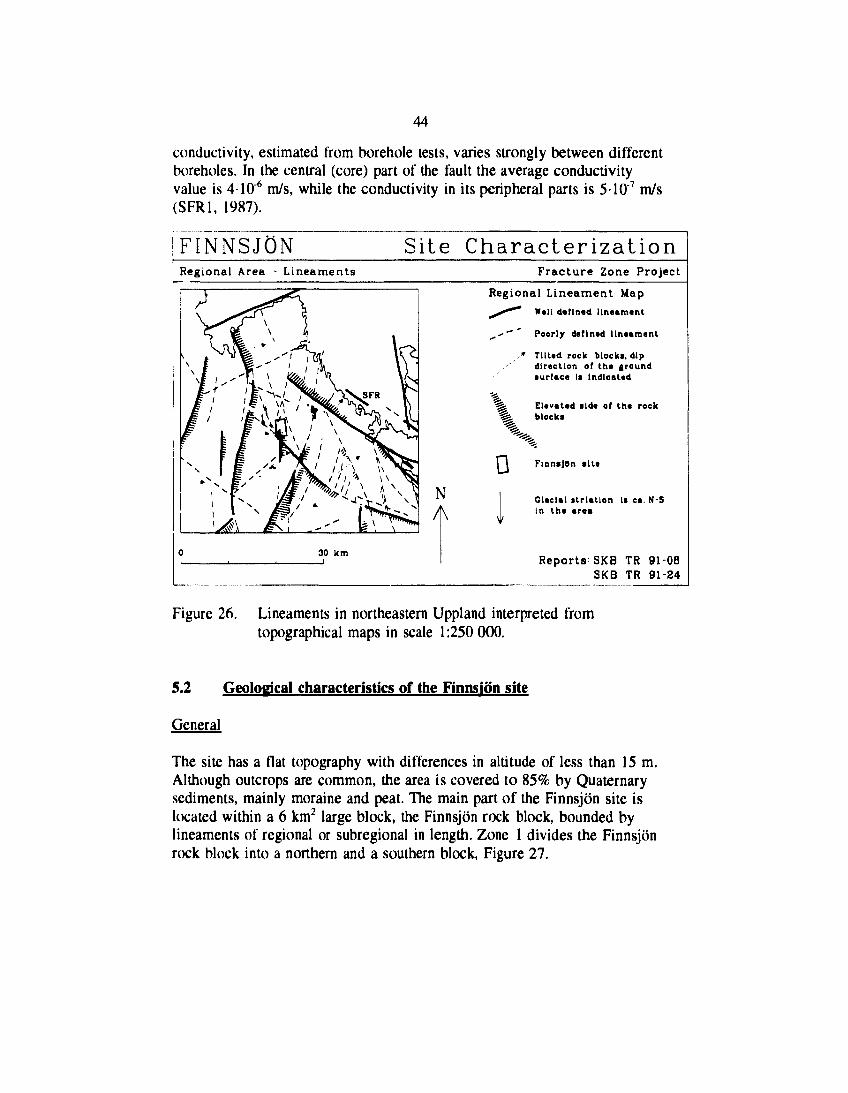
44
conductivity, estimated from borehole tests, varies strongly between differentboreholes. In the central (core) part of the fault the average conductivityvalue is 4-106 m/s, while the conductivity in its peripheral parts is 5-10'7 m/s(SFR1, 1987).
FINNSJON Site Character iza t ionRegional Area - Lineaments Fracture Zone Project
Regional Lineament Map
^^~ Well defined lineament
^,'" Poorly defined llnetment
• Tilted rock blocks, dip' direction of the ground
iurfe.ce Is Indicated
^
0NA
Eleveted tide of the rockblocks
FlnnsJOn site
Gleclel »trlatton is ca. N-Sin the area
Reports'SKB TR 91-08SKB TR 91-24
Figure 26. Lineaments in northeastern Uppland interpreted fromtopographical maps in scale 1:250 000.
5.2 Geological characteristics of the Finnsjön site
General
The site has a flat topography with differences in altitude of less than 15 m.Although outcrops are common, the area is covered to 85% by Quaternarysediments, mainly moraine and peat. The main part of the Finnsjön site islocated within a 6 km2 large block, the Finnsjön rock block, bounded bylineaments of regional or subregional in length. Zone 1 divides the Finnsjönrock block into a northern and a southern block, Figure 27.
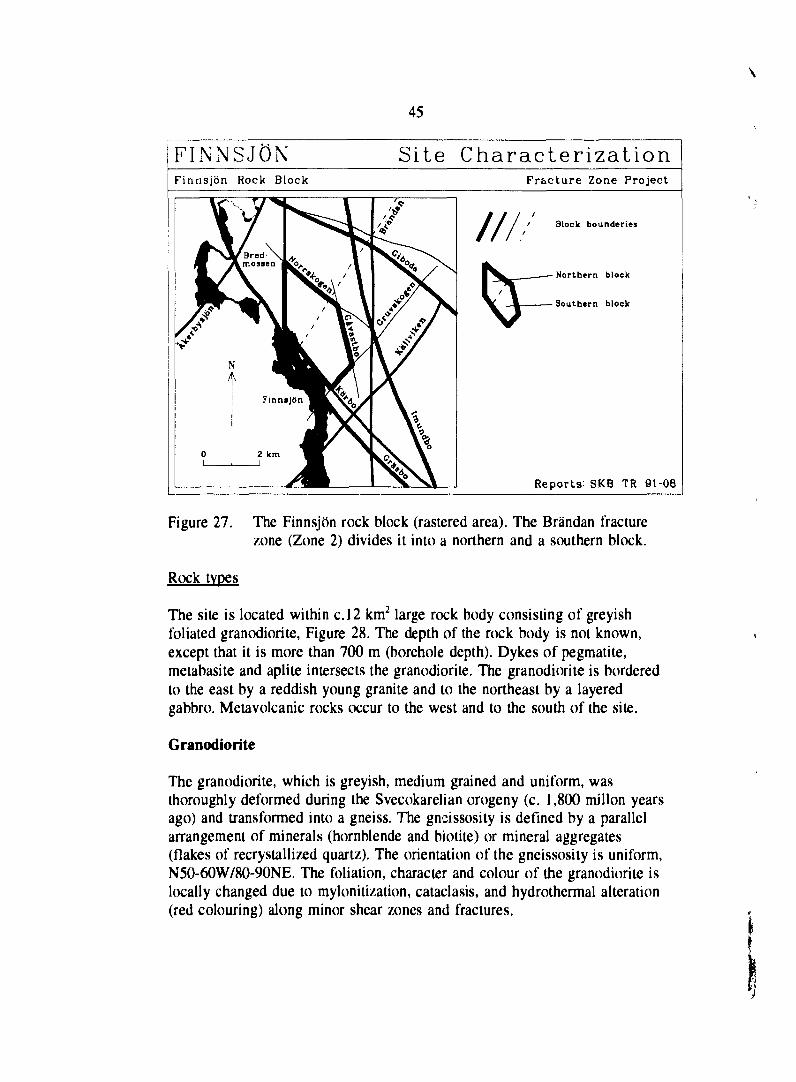
45
FINNSJÖN Site CharacterizationFinnsjön Rock Block Fracture Zone Project
Block bounderies
Northern block
Southern block
Reports: SKB TR 91-08
Figure 27.
Rock types
The Finnsjön rock block (rastered area). The Brändan fracturezone (Zone 2) divides it into a northern and a southern block.
The site is located within c.12 km2 large rock body consisting of greyishfoliated granodiorite, Figure 28. The depth of the rock body is not known,except that it is more than 700 m (borehole depth). Dykes of pegmatite,metabasite and aplite intersects the granodiorite. The granodiorite is borderedto the east by a reddish young granite and to the northeast by a layeredgabbro. Metavolcanic rocks occur to the west and to the south of the site.
Granodiorite
The granodiorite, which is greyish, medium grained and uniform, wasthoroughly deformed during the Svecokarelian orogeny (c. 1,800 millon yearsago) and transformed into a gneiss. The gneissosity is defined by a parallelarrangement of minerals (hornblende and biotite) or mineral aggregates(flakes of recrystallized quartz). The orientation of the gneissosity is uniform,N50-60W/80-90NE. The foliation, character and colour of the granodiorite islocally changed due to mylonitization, cataclasis, and hydrothermal alteration(red colouring) along minor shear zones and fractures.
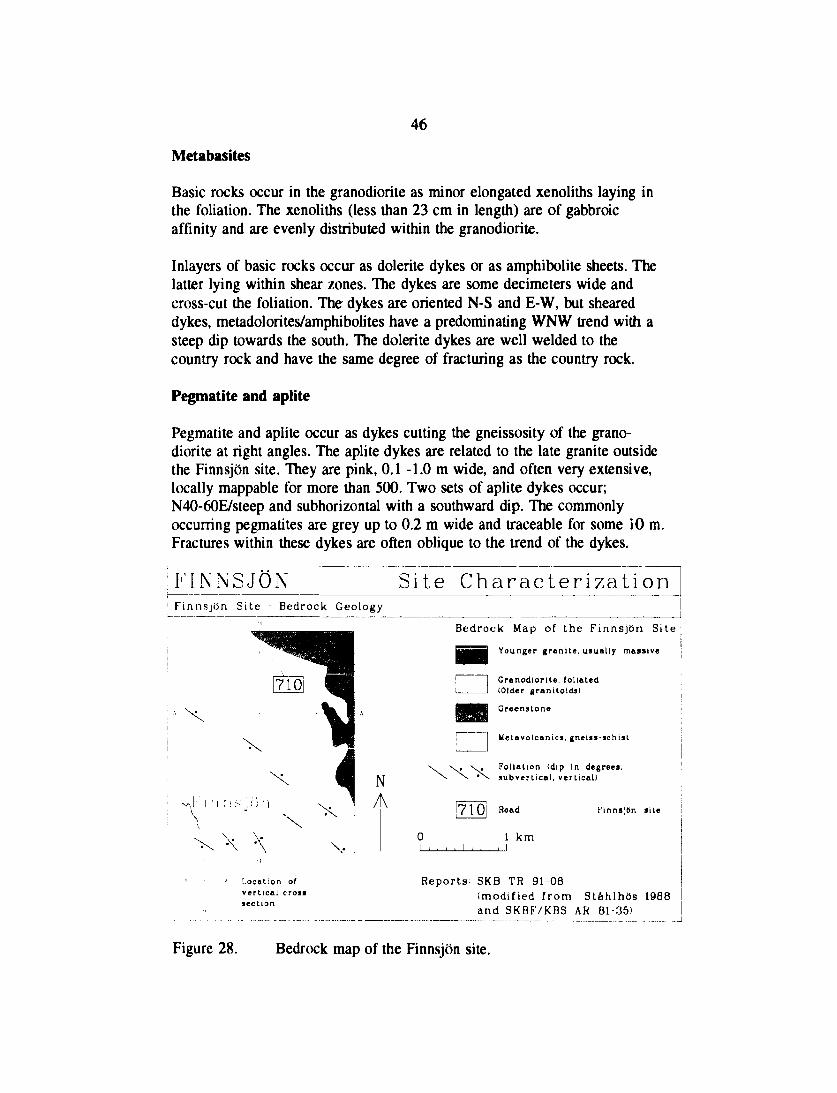
46
Metabasites
Basic rocks occur in the granodiorite as minor elongated xenoliths laying inthe foliation. The xenoliths (less than 23 cm in length) are of gabbroicaffinity and are evenly distributed within the granodiorite.
Inlayers of basic rocks occur as dolerite dykes or as amphibolite sheets. Thelatter lying within shear zones. The dykes are some decimeters wide andcross-cut the foliation. The dykes are oriented N-S and E-W, but sheareddykes, metadolorites/amphibolites have a predominating WNW trend with asteep dip towards the south. The dolerite dykes are well welded to thecountry rock and have the same degree of fracturing as the country rock.
Pegmatite and aplite
Pegmatite and aplite occur as dykes cutting the gneissosity of the grano-diorite at right angles. The aplite dykes are related to the late granite outsidethe Finnsjön site. They are pink, 0.1 -1.0 m wide, and often very extensive,locally mappable for more than 500. Two sets of aplite dykes occur;N40-60E/steep and subhorizontal with a southward dip. The commonlyoccurring pegmatites are grey up to 0.2 m wide and traceable for some 10 m.Fractures within these dykes are often oblique to the trend of the dykes.
FINNSJÖN Site CharacterizationFinnsjön Site - Bedrock Geology
Bedrock Map of the Finnsjön Site
Younger granite, usually massive
Granodiorite. foliated(Older granitoids!
Greenstone
Metavolcanlcs. gneiss-schisL
NA
. , Foliation (dip In degrees,aubvertical, vertical)
[7101 Road
1 km
Finnsjön site
Location ofvertical crosisection
Reports SKB TR 9108(modified from Ståhlhösand SKBFVKBS AR 81-35)
19B8
Figure 28. Bedrock map of the Finnsjön site.
47
Fractures
The fracture frequencies measured on outcrops in the Finnsjön study site donot indicate an uniform fracturing. A fracture survey performed along twoorthogonal profiles (Figure 3) during the early site characterization reflectsthe fracturing in the southern block and in the bedrock surrounding Zone 1, 3and 4. The result of this survey indicates, compared to other SKB study sites,a fracture frequency which is relatively high. On the average the frequency,determined on exposed outcrops, is c. 2.9 fr/m (Olkiewicz, 1981). Forcomparison, the Sternö and Gideå sites display fracture frequencies of c. 0.9and c. 1.2 fr/m, respectively.
The fracture surveys performed along scan-lines on the ground surface andon cores show the same fracture frequency. This suggests a homogeneousconfiguration of fractures. The average fracture frequency in the cores fromthe upper 100 m in the boreholes KFI03, 04 and 05 is 3.0 fr/m (excludingcrushed sections). No decrease in fracture frequency with depth (0-600 m)have been observed in these boreholes. The locations of sections with highfracture frequency in each cored borehole are presented in Appendix C.
Fracture surveys performed along an excavated trench, ca 5 x 90 m large, inthe northern block indicates a lower average fracture frequency, c. 1.5 fr/m.This is also apparent in the cores from boreholes in this block. For example,borehole KFI11 display a fracture frequency of about 1 fr/m in the bedrockabove Zone 2.
Fracture surveys on outcrops in the northern block have defined three mainfracture sets (ordered according to their relative occurrence):
* Northeast (N10-70E) fractures with a steep dip towards SE* Northwest (N25-80W) fractures with a steep dip towards SW* Flat lying fractures dipping predominantly to the SW
This configuration of fractures resembles the fracture configuration atForsmark (SFR1, 1987).
Northeast fractures
Northeast trending fractures are the most frequent occurring fractures. Thefracture walls are altered, reddened by hydrothermal fluids. A commoninfilling in these fractures is iron-rich prehnite, which has, outside this area,been dated to 1,250-1,100 Ma (Wickman et al. 1983). The northeast fracturesoften occur en echelon (stepped configuration). This fracture set is interpreted
48
to have been formed by a regional ENE left lateral shearing with a compres-sion component in NNE.
Northwest fractures
The northwest fracture set is older than the northeast fractures and has beenformed by a ductile-brittle deformation. This is evident by the commonoccurring ductile deformation of the wall rock (flexures and mylonites). Thenorthwest fractures are oriented more or less parallel to the foliation in thegranodiorite. Regarding the frequency of "open fractures" mapped onoutcrops, there is an equal relative occurrence for the two steeply dippingfracture sets, but the northwest fractures are the most extensive.
Flat lying fractures
Flat lying, horizontal to gently dipping, fractures are relatively scarce inoutcrops. Although they are well expressed as planar structures forming themorphology of outcrops. Most dips towards the SW. Some of the southwestdipping fractures show a wall rock alteration similar to the northeast trendingfracture set, indicating that these two fracture sets were connected.
Fracture infillings
The fracture infillings are mostly of hydrothermal origin. According toTullborg and Larson (1982) and Tirén (1989), the sequence of fractureinfilling, from oldest to youngest, is:
* Epidote and calcitc (associated with mylonitic andcatadastic processes).
* Prchnite and calcite/quartz.* Hematite, laumontite, prismatic calcite and quartz.* Chlorite and calcite.* Amorph. Fe3+ oxy-hydroxid precipitates (rust)
Most of the fractures are considered to be initiated early in the geologichistory and reactivated several times. Geological dating using Rb-Sr indicateages of 1,600-1,500 million years for epidote and 1,250-1,100 million yearsfor prehnite (Wickman et al., 1983).
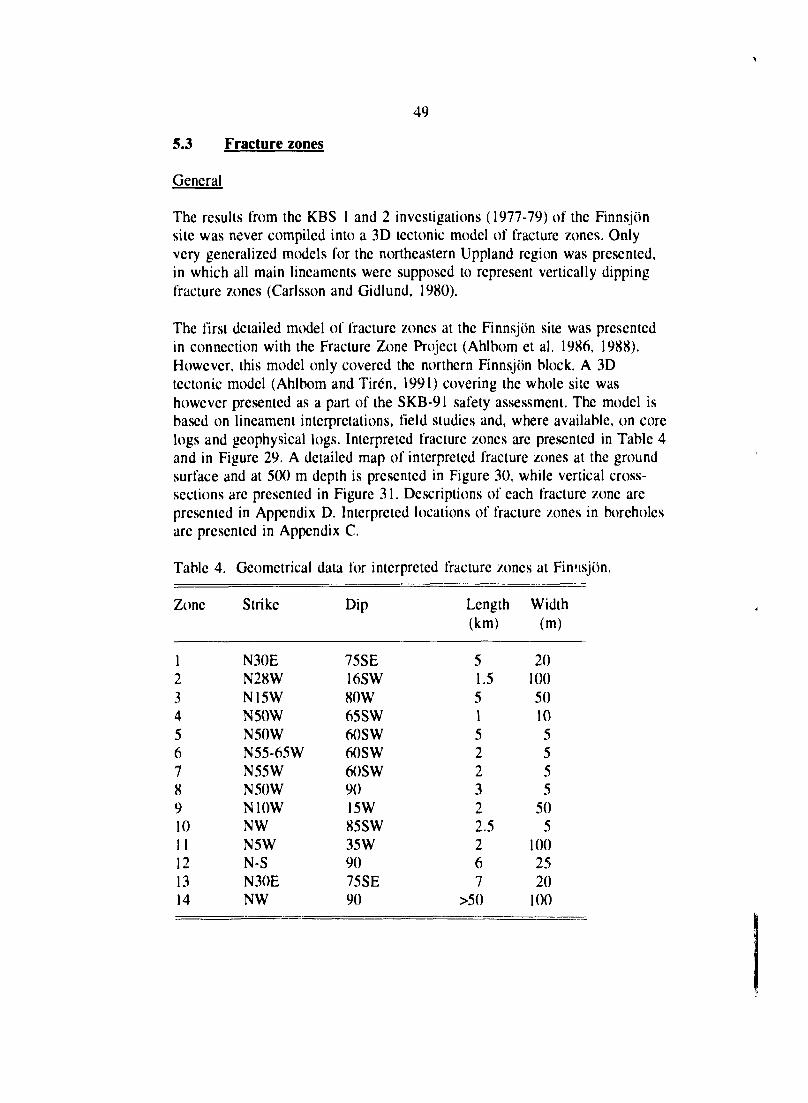
49
5.3 Fracture zones
General
The results from the KBS 1 and 2 investigations (1977-79) of the Finnsjönsite was never compiled into a 3D tectonic model of fracture zones. Onlyvery generalized models for the northeastern Uppland region was presented,in which all main lineaments were supposed to represent vertically dippingfracture zones (Carlsson and Gidlund, 1980).
The first detailed model of fracture zones at the Finnsjön site was presentedin connection with the Fracture Zone Project (Ahlbom et al. 1986, 1988).However, this model only covered the northern Finnsjön block. A 3Dtectonic model (Ahlbom and Tirén, 1991) covering the whole site washowever presented as a part of the SKB-91 safety assessment. The model isbased on lineament interpretations, field studies and, where available, on corelogs and geophysical logs. Interpreted fracture zones are presented in Table 4and in Figure 29. A detailed map of interpreted fracture zones at the groundsurface and at 500 m depth is presented in Figure 30, while vertical cross-sections are presented in Figure 31. Descriptions of each fracture zone arepresented in Appendix D. Interpreted locations of fracture zones in boreholesare presented in Appendix C.
Table 4. Geometrical data for interpreted fracture zones at Finnsjön.
Zone
1234567891011121314
Strike
N30EN28WN15WN50WN50WN55-65WN55WN50WN10WNWN5WN-SN30ENW
Dip
75SE16SW80W65SW60SW60SW60SW9015W85SW35W9075SE90
Length(km)
51.551522322.5267
>5()
Width(m)
2010050105555
505
1002520
100
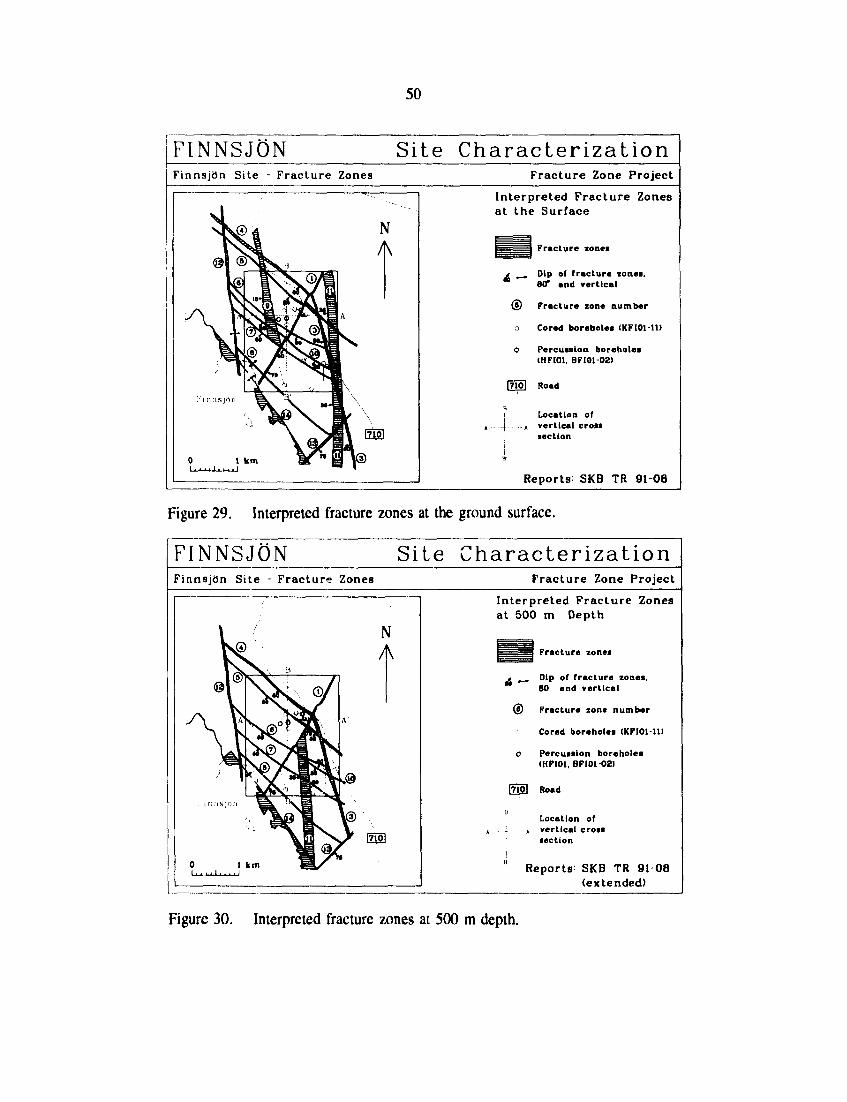
50
FINNSJÖN Site CharacterizationFinnsjön Site - Fracture Zones Fracture Zone Project
01
@
\
in
1
i
km
O o
V
N/
1
Interpreted Fracture Zonesat the Surface
Fracture zones
d _ Dip of fracture lonei.SO* and vertical
Fracture zone number
Cored borehole* (KFI01-11)
PercuaaLon boreholes(HFI01, BFI01-02)
Road
Location ofvertical crosssection
Reports: SKB TR 91-08
Figure 29. Interpreted fracture zones at the ground surface.
FINNSJÖN Site CharacterizationFinnsjön Site - Fracture Zones Fracture Zone Project
• ";ri^°" Ilk ^VB ^
e l •»0 1 km E^X
P/
A1
i\
Vf [710]
Interpreted Fracture Zonesat 500 m Depth
Fracture zones
_ Dip of fracture zones.80 and vertical
Fracture zone number
Cored boreholes (KFI01-1U
Percussion boreholes(KFI01, BFIOl 02)
01 Road
Location of» vertical cross
section
Reports: SKB TR 91 08(extended)
Figure 30. Interpreted fracture zones at 500 m depth.
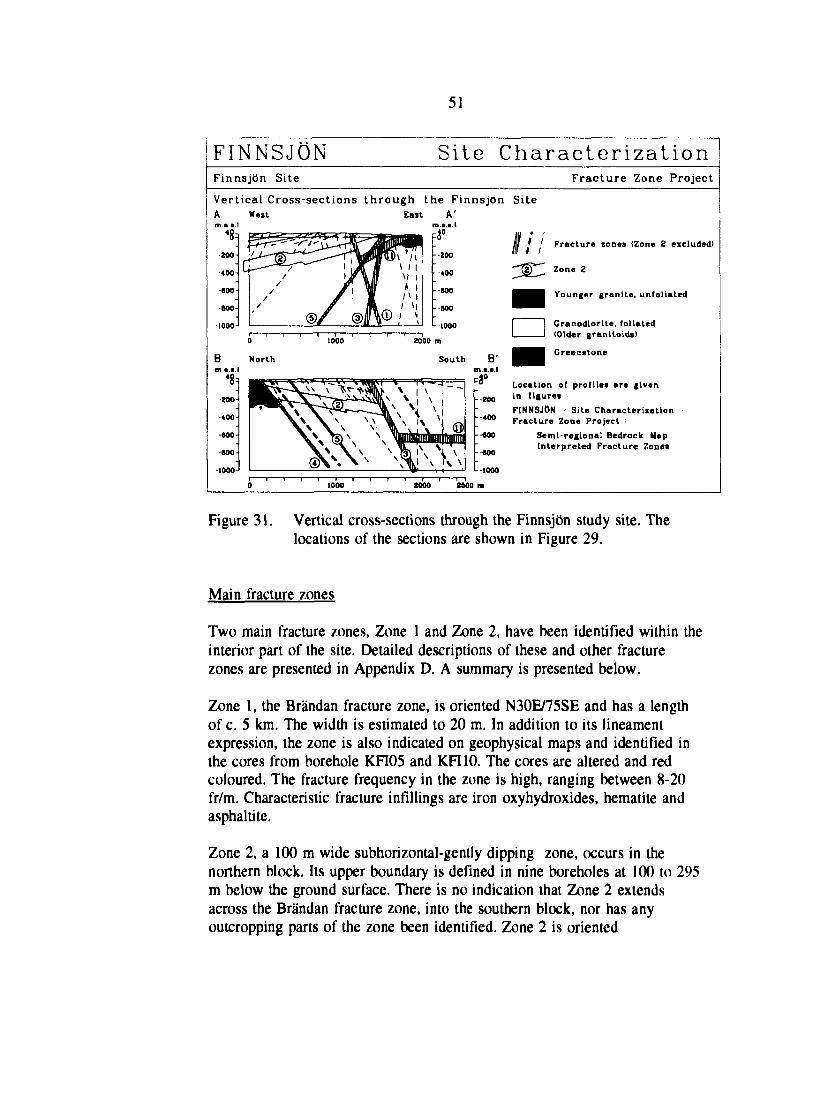
FINNSJÖN
51
Site CharacterizationFinnsjön Site Fracture Zone Project
Vertical Cross-sections through the Finnsjön Site
' ' Fracture zones (Zone 2 excluded)
Zone 2
Younger granite, unfoliated
Cranodiorite, foliated(Older granitoids)
Creenstone
Location of profiles are given200 l n »«"«»
FINNSJON - Site CharacterizationFracture Zone Project
»00 Semi-regional Bedrock HapInterpreted Fracture Zones
1000 2000 2600 m
Figure 31. Vertical cross-sections through the Finnsjön study site. Thelocations of the sections are shown in Figure 29.
Main fracture zones
Two main fracture zones, Zone 1 and Zone 2, have been identified within theinterior part of the site. Detailed descriptions of these and other fracturezones are presented in Appendix D. A summary is presented below.
Zone 1, the Brändan fracture zone, is oriented N30E/75SE and has a lengthof c. 5 km. The width is estimated to 20 m. In addition to its lineamentexpression, the zone is also indicated on geophysical maps and identified inthe cores from borehole KFI05 and KFIIO. The cores are altered and redcoloured. The fracture frequency in the zone is high, ranging between 8-20fr/m. Characteristic fracture inflllings are iron oxyhydroxides, hematite andasphaltite.
Zone 2, a 100 m wide subhorizontal-gently dipping zone, occurs in thenorthern block. Its upper boundary is defined in nine boreholes at 100 to 295m below the ground surface. There is no indication that Zone 2 extendsacross the Brändan fracture zone, into the southern block, nor has anyoutcropping parts of the zone been identified. Zone 2 is oriented
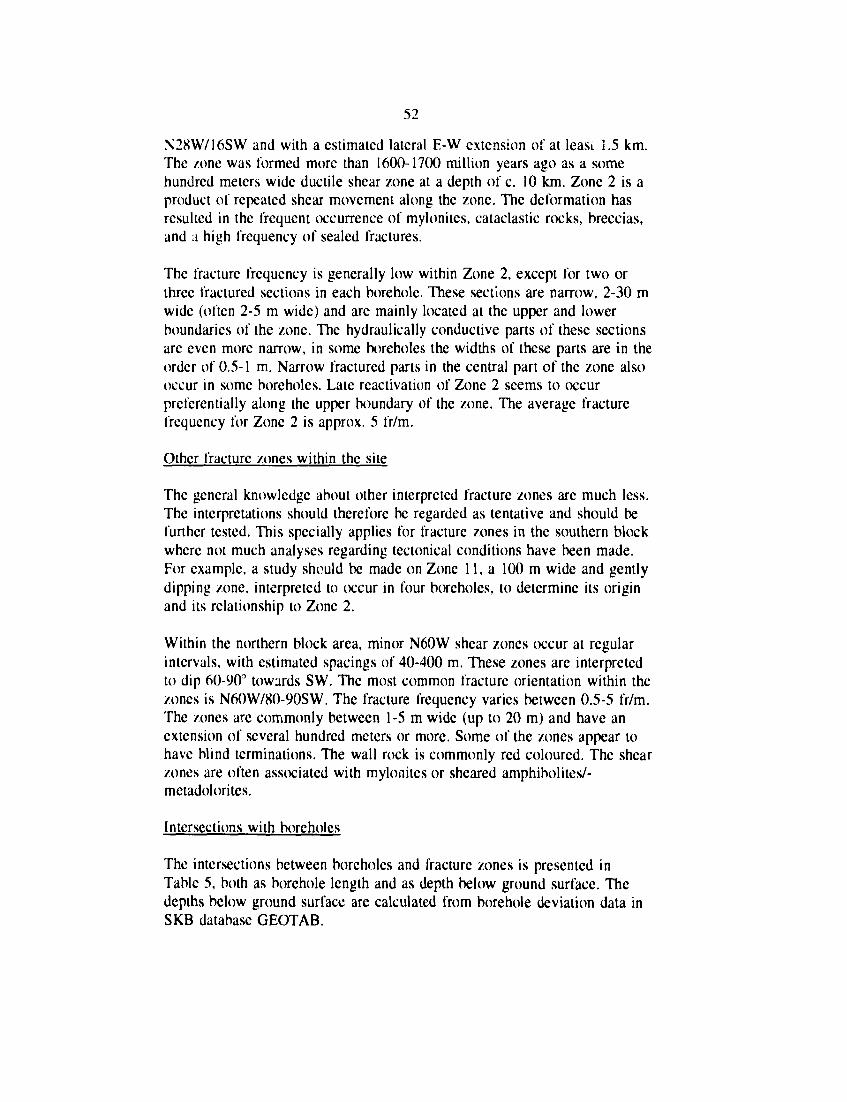
52
N2SW/16SW and with a estimated lateral E-W extension of at leasi 1.5 km.The zone was formed more than 1600-1700 million years ago as a somehundred meters wide ductile shear zone at a depth of c. 10 km. Zone 2 is aproduct of repeated shear movement along the zone. The deformation hasresulted in the frequent occurrence of mylonites, cataclastic rocks, breccias,and a high frequency of sealed fractures.
The fracture frequency is generally low within Zone 2, except for two orthree fractured sections in each borehole. These sections are narrow, 2-30 mwide (often 2-5 m wide) and are mainly located at the upper and lowerboundaries of the zone. The hydraulically conductive parts of these sectionsare even more narrow, in some boreholes the widths of these parts are in theorder of 0.5-1 m. Narrow fractured parts in the central part of the zone alsooccur in some boreholes. Late reactivation of Zone 2 seems to occurpreferentially along the upper boundary of the zone. The average fracturefrequency for Zone 2 is approx. 5 fr/m.
Other fracture zones within the site
The general knowledge about other interpreted fracture zones are much less.The interpretations should therefore be regarded as tentative and should befurther tested. This specially applies for fracture zones in the southern blockwhere not much analyses regarding tectonical conditions have been made.For example, a study should be made on Zone 11, a 100 m wide and gentlydipping zone, interpreted to occur in four boreholes, to determine its originand its relationship to Zone 2.
Within the northern block area, minor N60W shear zones occur at regularintervals, with estimated spacings of 40-400 m. These zones are interpretedto dip 60-90° towards SW. The most common fracture orientation within thezones is N60W/80-90SW. The fracture frequency varies between 0.5-5 fr/m.The zones are commonly between 1-5 m wide (up to 20 m) and have anextension of several hundred meters or more. Some of the zones appear tohave blind terminations. The wall rock is commonly red coloured. The shearzones are often associated with mylonites or sheared amphibolites/-metadolorites.
Intersections with boreholes
The intersections between boreholes and fracture zones is presented inTable 5, both as borehole length and as depth below ground surface. Thedepths below ground surface are calculated from borehole deviation data inSKB database GEOTAB.
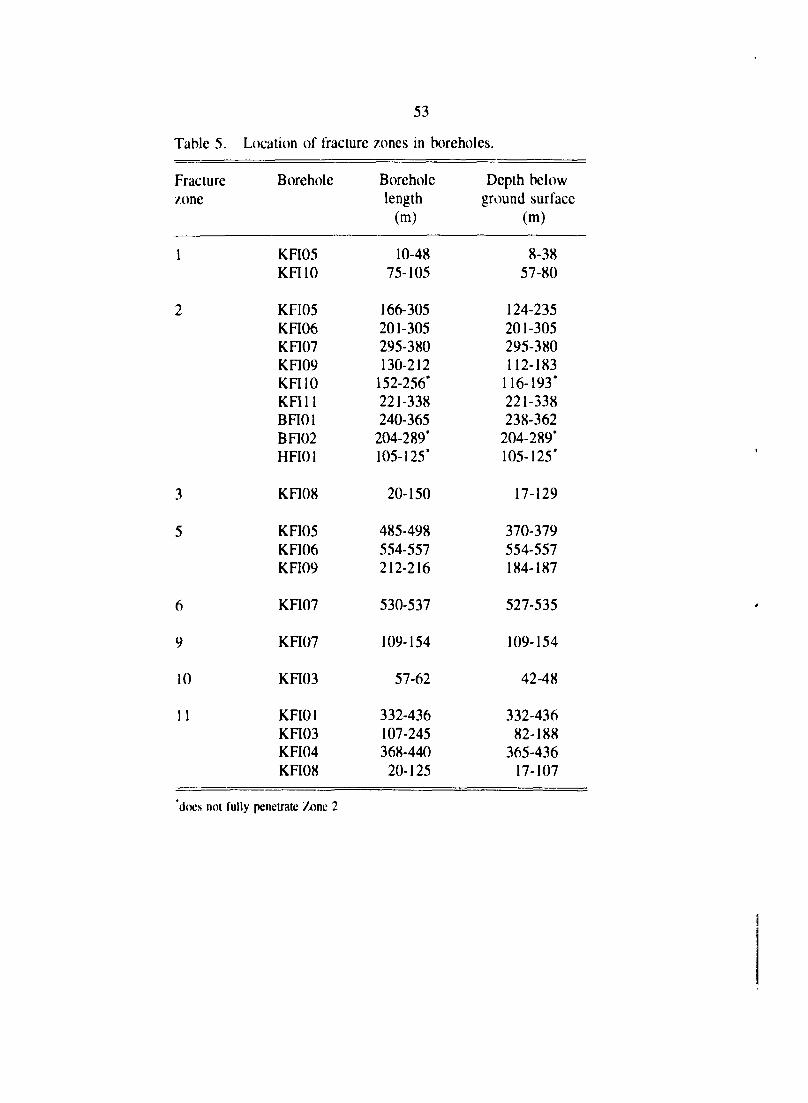
53
Table 5. Location of fracture zones in boreholes.
Fracturezone
1
2
Borehole
KFI05KFI10
KFI05KFI06KF107KFI09KFI10KFI11BFI01BFI02HFI01
Boreholelength
(m)
10-4875-105
166-305201-305295-380130-212
152-256'221-338240-365
204-289'105-125*
Depth belowground surface
(m)
8-3857-80
124-235201-305295-380112-183
116-193*221-338238-362
204-289*105-125*
KFI08 20-150 17-129
5
6
9
10
11
KFI05KFI06KFI09
KFI07
KFI07
KFI03
KFI01KFI03KFI04KFI08
485-498554-557212-216
530-537
109-154
57-62
332-436107-245368-44020-125
370-379554-557184-187
527-535
109-154
42-48
332-43682-188
365-43617-107
'does not fully penetrate Zone 2
54
5.4 Validity of models
Rock type distribution
The homogeneity of the granodioritic bedrock at the Finnsjön study site, incombination with the well exposed bedrock and the large amount of boreholedata, implies a high degree of certainty in the distribution of the main rocktypes for most part of the site. However, this is not the case for theeasternmost part of the site where a high frequency of granitic dykes occursin the deeper parts of the boreholes. This probably implies a closeness atdepth to the large body of younger granite which outcrops outside the site tothe east.
There are also large uncertainties in the occurrence and in the continuationsof amphibolilic, granitic and pegmatitic dykes. In fact, with some exceptionno attempt was made in the geological mapping to study their lateral andvertical continuations.
Interpreted fracture zones
The general control of the geologic conditions of the northern block is farbetter known compared to the southern block (Figure 27), due to the detailedstudies that has been conducted within the Fracture Zone Project (Chapter 1)in the southeastern part of the northern block. This difference also implies ageneral higher reliability of interpreted fracture zones in the northern blockcompared to the southern block.
Apart from this general difference in reliability between the two blocks, theonly zones that can be regarded as well established, with respect to locationand character, are Zone 1 and Zone 2 (in areas where these zones are inter-sected by boreholes). Other interpreted fracture zones must be regarded asmore or less uncertain. For zones interpreted from lineaments, there arenormally no information regarding degree of fracturing nor the dip and evenif a single borehole intersects a zone there might be several alternativeinterpretations regarding its orientation. It is probable that further work ondetailed correlation between surface and borehole data would identifyadditional fracture zones.
Appendix D describes on what grounds each fracture zone has been inter-preted, including an judgment regarding the reliability in the interpretation,mainly based on the nomenclature suggested by Bäckblom (1989). Also inter-sections with interpreted fracture zones and boreholes are presented,including main geologic and tectonic characteristics in the cores.
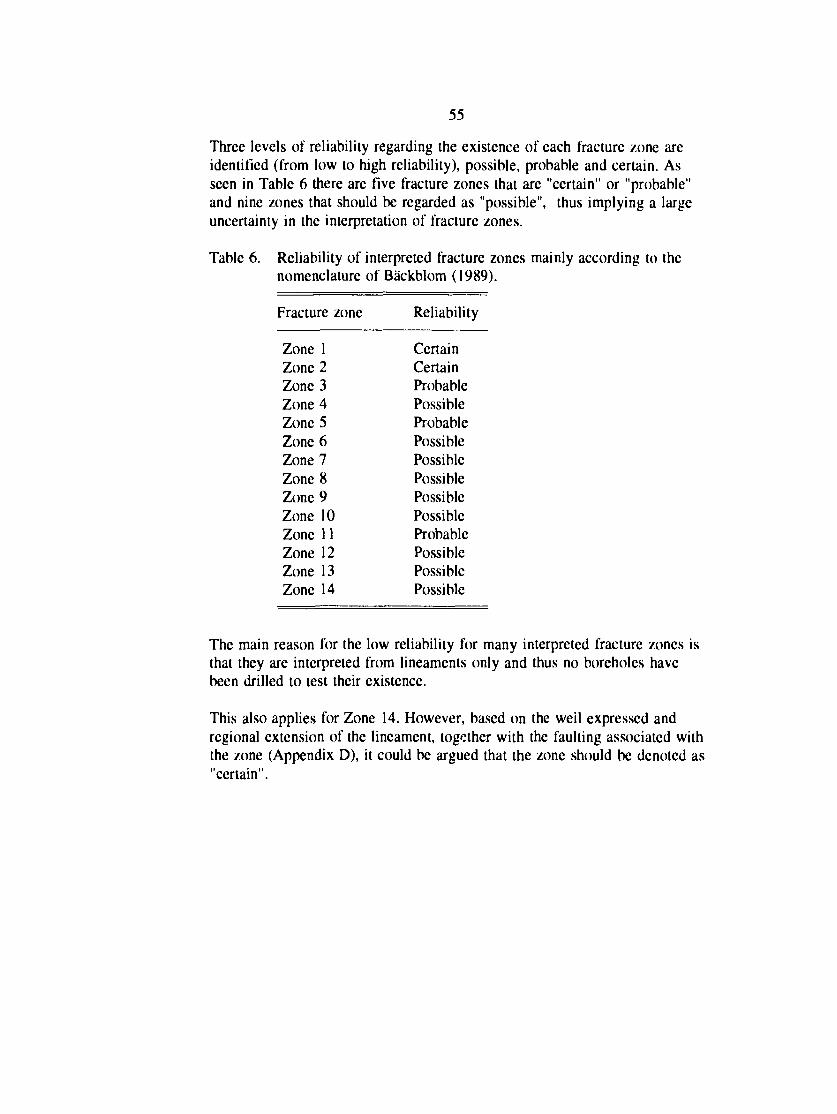
55
Three levels of reliability regarding the existence of each fracture zone areidentified (from low to high reliability), possible, probable and certain. Asseen in Table 6 there are five fracture zones that are "certain" or "probable"and nine zones that should be regarded as "possible", thus implying a largeuncertainty in the interpretation of fracture zones.
Table 6. Reliability of interpreted fracture zones mainly according to thenomenclature of Bäckblom (1989).
Fracture zone
Zone 1Zone 2Zone 3Zone 4Zone 5Zone 6Zone 7Zone 8Zone 9Zone 10Zone 11Zone 12Zone 13Zone 14
Reliability
CertainCertainProbablePossibleProbablePossiblePossiblePossiblePossiblePossibleProbablePossiblePossiblePossible
The main reason for the low reliability for many interpreted fracture zones isthat they are interpreted from lineaments only and thus no boreholes havebeen drilled to test their existence.
This also applies for Zone 14. However, based on the weil expressed andregional extension of the lineament, together with the faulting associated withthe zone (Appendix D), it could be argued that the zone should be denoted as"certain".
56
6. GEOHYDROLOGICAL MODELS
6.1 General
Groundwater tlow modelling of the Finnsjön site and its surroundings hasbeen performed on two different occasions. Preliminary modelling wasperformed by Carlsson et al. (1983) using a more or less generic approach.Since then, the knowledge of the geological and hydrogeological conditionsat Finnsjön has been greatly improved by the Fracture Zone Project (Ahlbomet al., 1988) and the SKB 91 project (SKB, 1992). The latter project involvedcomprehensive modelling efforts, including both deterministic and stochasticcontinuum modelling and discrete fracture modelling (Table 7). Scopingcalculations were also carried out to study the effects of saline groundwaterand the influence of permafrost.
The basic strategy in the SKB 91 project was to perform deterministiccontinuum modelling in the regional area and subsequent stochastic-continuum modelling in the local area. The main results of this modelling aredescribed in this chapter.
The gcohydrological deterministic continuum modelling in the regional areaat Finnsjön within the SKB 91 project was performed using a model codebased on the finite element method (NAMMU) together with a modifiedversion of the program package HYPAC. Subsequently, stochastic continuummodelling was carried out in the local area using the program packageHYDRASTAR. In addition, the code PHOENICS was used to model salinegroundwater flow and FRACMAN/MAFIC for discrete fracture modelling asan alternative description of the groundwater flow pattern in the rock.
6.2 Available data
The geoinformation used in SKB 91 for the hydraulic modelling consist ofconceptual models of fracture zones on different scales, hydrological andhydrometeorological data, contour maps of the groundwater table andhydraulic conductivity data from hydraulic single hole tests. Measurements ofthe natural groundwater flow through isolated sections of two boreholes werealso used for model validation.
All background data for the hydraulic modelling are presented in Anderssonet al. (1989). Subsequently, the geological interpretation of a few of thefracture /.ones was slightly modified by Ahlbom and Tirén (1991) followedby a corresponding updating of the background data report (Andersson et al.,1991). The hydraulic modelling was mainly based on the information in the
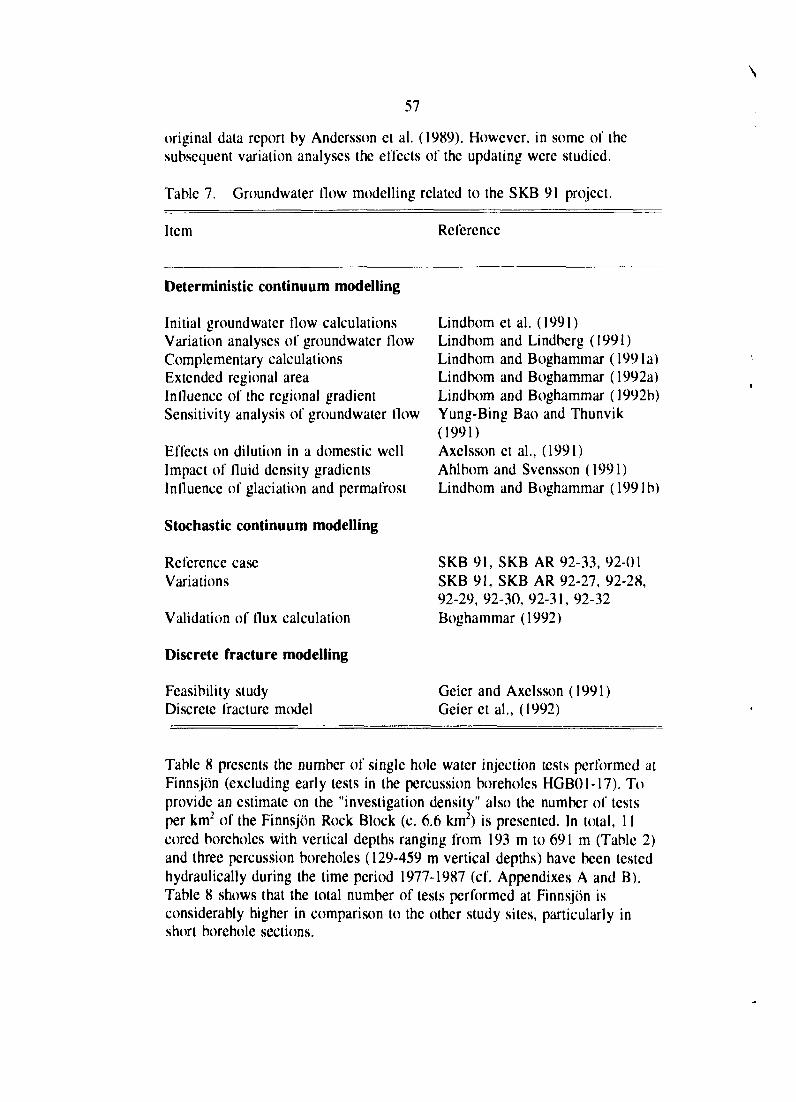
\
57
original data report by Andersson et al. (1989). However, in some of thesubsequent variation analyses the effects of the updating were studied.
Table 7. Groundwater flow modelling related to the SKB 91 project.
Item Reference
Deterministic continuum modelling
Initial groundwater flow calculationsVariation analyses of groundwater flowComplementary calculationsExtended regional areaInfluence of the regional gradientSensitivity analysis of groundwater flow
Effects on dilution in a domestic wellImpact of fluid density gradientsInfluence of glaciation and permafrost
Stochastic continuum modelling
Reference caseVariations
Validation of flux calculation
Discrete fracture modelling
Feasibility studyDiscrete fracture model
Lindbom et al. (1991)Lindbom and Lindberg (1991)Lindbom and Boghammar (1991a)Lindbom and Boghammar (1992a)Lindbom and Boghammar (1992b)Yung-Bing Bao and Thunvik(1991)Axelsson et al., (1991)Ahlbom and Svensson (1991)Lindbom and Boghammar (1991b)
SKB 91, SKB AR 92-33, 92-01SKB 91, SKB AR 92-27, 92-28,92-29,92-30,92-31,92-32Boghammar (1992)
Gcier and Axelsson (1991)Geieret al., (1992)
Table 8 presents the number of single hole water injection tests performed atFinnsjön (excluding early tests in the percussion boreholes HGB01-17). Toprovide an estimate on the "investigation density" also the number of testsper km2 of the Finnsjön Rock Block (c. 6.6 km2) is presented. In total, 11cored boreholes with vertical depths ranging from 193 m to 691 m (Table 2)and three percussion boreholes (129-459 m vertical depths) have been testedhydraulically during the time period 1977-1987 (cf. Appendixes A and B).Table 8 shows that the total number of tests performed at Finnsjön isconsiderably higher in comparison to the other study sites, particularly inshort borehole sections.
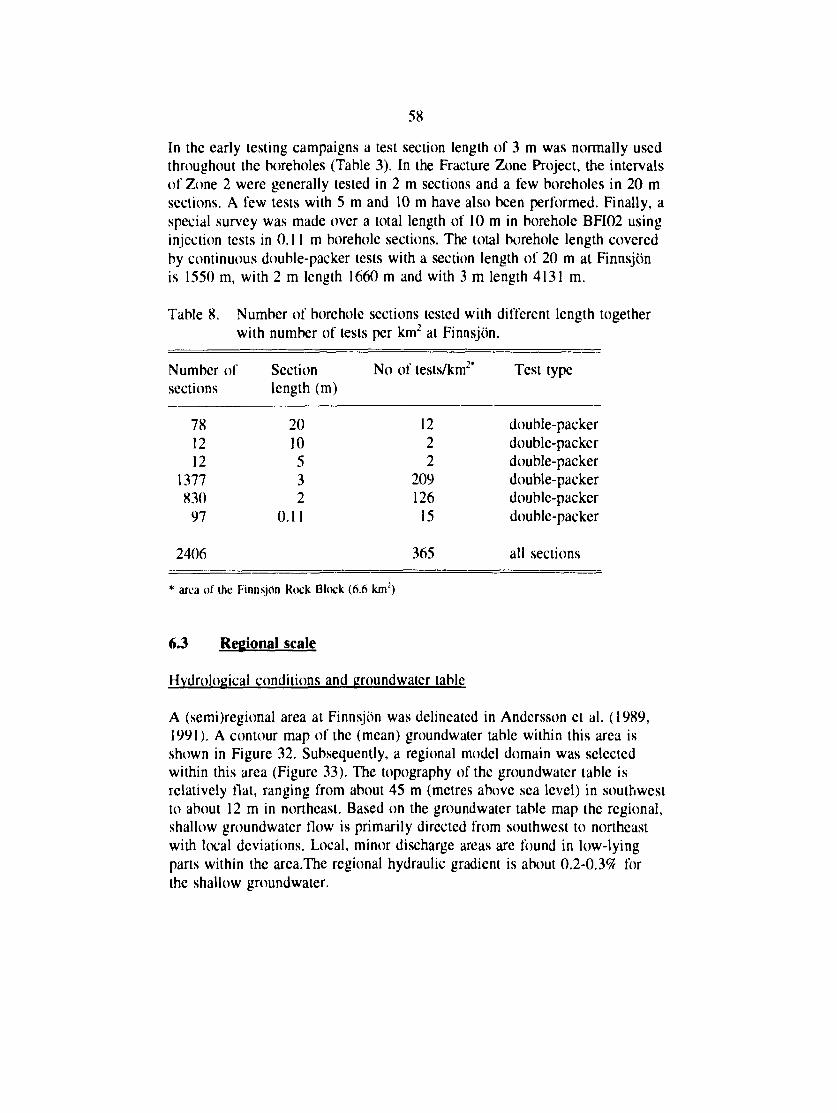
58
In the early testing campaigns a test section length of 3 m was normally usedthroughout the boreholes (Table 3). In the Fracture Zone Project, the intervalsof Zone 2 were generally tested in 2 m sections and a few boreholes in 20 msections. A few tests with 5 m and 10 m have also been performed. Finally, aspecial survey was made over a total length of 10 m in borehole BFI02 usinginjection tests in 0.11 m borehole sections. The total borehole length coveredby continuous double-packer tests with a section length of 20 m at Finnsjönis 1550 m, with 2 m length 1660 m and with 3 m length 4131 m.
Table 8. Number of borehole sections tested with different length togetherwith number of tests per km2 at Finnsjön.
Number ofsections
781212
137783097
2406
Sectionlength (m)
2010532
0.11
No of tests/km2*
1222
20912615
365
Test type
double-packerdouble-packerdouble-packerdouble-packerdouble-packerdouble-packer
all sections
* area of the Finnsjön Rock Block (6.6 km2)
6.3 Regional scale
Hvdrolopical conditions and uroundwater table
A (semi)regional area at Finnsjön was delineated in Andersson et al. (1989,1991). A contour map of the (mean) groundwater table within this area isshown in Figure 32. Subsequently, a regional model domain was selectedwithin this area (Figure 33). The topography of the groundwater table isrelatively flat, ranging from about 45 m (metres above sea level) in southwestto about 12 m in northeast. Based on the groundwater table map the regional,shallow groundwater flow is primarily directed from southwest to northeastwith local deviations. Local, minor discharge areas are found in low-lyingparts within the area.The regional hydraulic gradient is about 0.2-0.3$ forthe shallow groundwater.
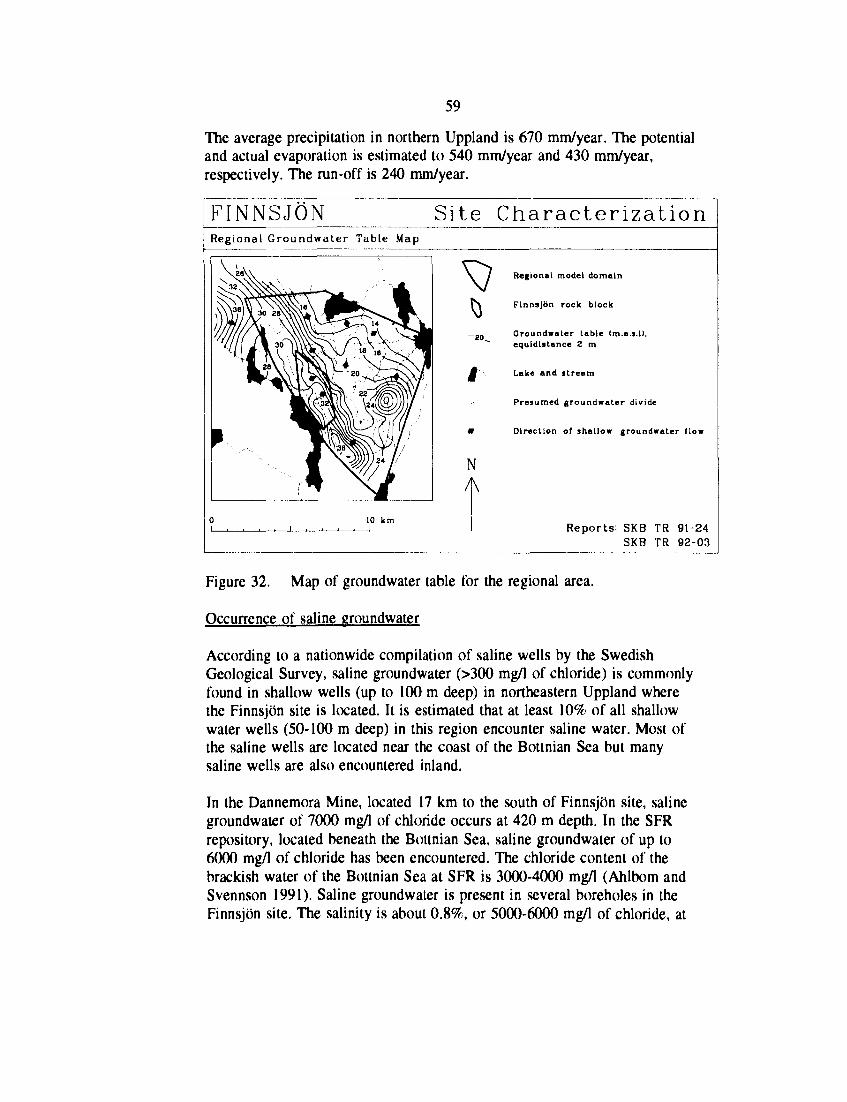
59
The average precipitation in northern Uppland is 670 mm/year. The potentialand actual evaporation is estimated to 540 mm/year and 430 mm/year,respectively. The run-off is 240 mm/year.
FINNSJÖN Site CharacterizationRegional Groundwater Table Map
Regional model domain
Finnsjön rock block
Groundwater table (m.a.s.l),equidistance 2 m
Lake and stream
Presumed groundwater divide
Direction of shallow groundwater flow
NA
10 kmReports: SKB TR 91-24
SKB TR 92-03
Figure 32. Map of groundwater table for the regional area.
Occurrence of saline groundwater
According to a nationwide compilation of saline wells by the SwedishGeological Survey, saline groundwater (>300 mg/1 of chloride) is commonlyfound in shallow wells (up to 100 m deep) in northeastern Uppland wherethe Finnsjön site is located. It is estimated that at least 10% of all shallowwater wells (50-100 m deep) in this region encounter saline water. Most ofthe saline wells are located near the coast of the Bottnian Sea but manysaline wells are also encountered inland.
In the Dannemora Mine, located 17 km to the south of Finnsjön site, salinegroundwater of 7000 mg/1 of chloride occurs at 420 m depth. In the SFRrepository, located beneath the Bottnian Sea, saline groundwater of up to6000 mg/1 of chloride has been encountered. The chloride content of thebrackish water of the Bottnian Sea at SFR is 3000-4000 mg/1 (Ahlbom andSvennson 1991). Saline groundwater is present in several boreholes in theFinnsjön site. The salinity is about 0.8%, or 5000-6000 mg/1 of chloride, at
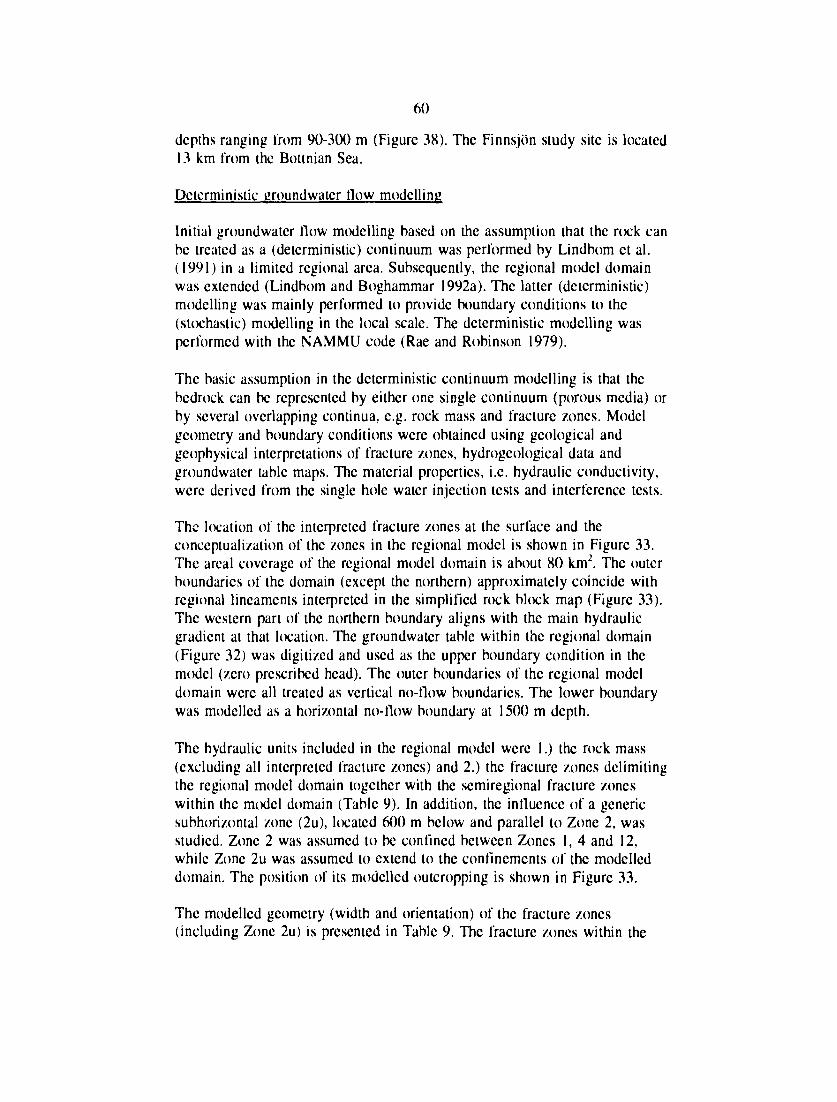
60
depths ranging from 90-300 m (Figure 38). The Finnsjön study site is located13 km from the Bottnian Sea.
Deterministic groundwater flow modelling
Initial groundwater flow modelling based on the assumption that the rock canbe treated as a (deterministic) continuum was performed by Lindbom et al.(1991) in a limited regional area. Subsequently, the regional model domainwas extended (Lindbom and Boghammar 1992a). The latter (deterministic)modelling was mainly performed to provide boundary conditions to the(stochastic) modelling in the local scale. The deterministic modelling wasperformed with the NAMMU code (Rae and Robinson 1979).
The basic assumption in the deterministic continuum modelling is that thebedrock can be represented by either one single continuum (porous media) orby several overlapping continua, e.g. rock mass and fracture zones. Modelgeometry and boundary conditions were obtained using geological andgeophysical interpretations of fracture zones, hydrogeological data andgroundwater table maps. The material properties, i.e. hydraulic conductivity,were derived from the single hole water injection tests and interference tests.
The location of the interpreted fracture zones at the surface and theconceptualization of the zones in the regional model is shown in Figure 33.The areal coverage of the regional model domain is about 80 km2. The outerboundaries of the domain (except the northern) approximately coincide withregional lineaments interpreted in the simplified rock block map (Figure 33).The western part of the northern boundary aligns with the main hydraulicgradient at that location. The groundwater table within the regional domain(Figure 32) was digitized and used as the upper boundary condition in themodel (zero prescribed head). The outer boundaries of the regional modeldomain were all treated as vertical no-flow boundaries. The lower boundarywas modelled as a horizontal no-flow boundary at 1500 m depth.
The hydraulic units included in the regional model were 1.) the rock mass(excluding all interpreted fracture zones) and 2.) the fracture zones delimitingthe regional model domain together with the semiregional fracture zoneswithin the model domain (Table 9). In addition, the influence of a genericsubhorizontal zone (2u), located 600 m below and parallel to Zone 2, wasstudied. Zone 2 was assumed to be confined between Zones 1, 4 and 12,while Zone 2u was assumed to extend to the confinements of the modelleddomain. The position of its modelled outcropping is shown in Figure 33.
The modelled geometry (width and orientation) of the fracture zones(including Zone 2u) is presented in Table 9. The fracture zones within the
\
61
regional domain were implicitly modelled. The finite element mesh consistedof roughly 18 400 eight-noded brick elements with totally about 20 700nodes.
FINNSJON Site CharacterizationInterpreted Fracture Zones and Regional Model Domain
Simplified Rock Block Map
^ ^ Fracture zone
—""" Regional lineament
_ ^ * Outcropping of generic zone 2uat the surface
\ / Regional model domain
P\ Finnsjön rock block
£ Lake
10 km
Reports: SKB TR 91-24SKB TR 9203
Figure 33. Interpreted and modelled fracture zones at the surface in theregional model at Finnsjön.
The hydraulic conductivity versus depth functions assigned to the rock massand fracture zones in the regional model were based on regression analysesof (the logarithms of) upscaled conductivity data from 2 m and 3 m longborehole sections to an averaging length of 36 m. This procedure is describedby Norman (1992). The regression curves were based on a power function ofthe following form:
K = a z ' (z>0) (6.1)
where K is hydraulic conductivity, z is vertical depth below ground surfaceand a and b are constants. Measured data below the lower measurement limitwere assigned the actual value of this limit in the regression analyses (Table3).
The hydraulic conductivities for both the rock mass and the fracture zoneswere assumed to obey Eqn. (6.1) with the same value of the constant 'b' inthis equation (b=2.23) for the rock mass and fracture zones. The values of
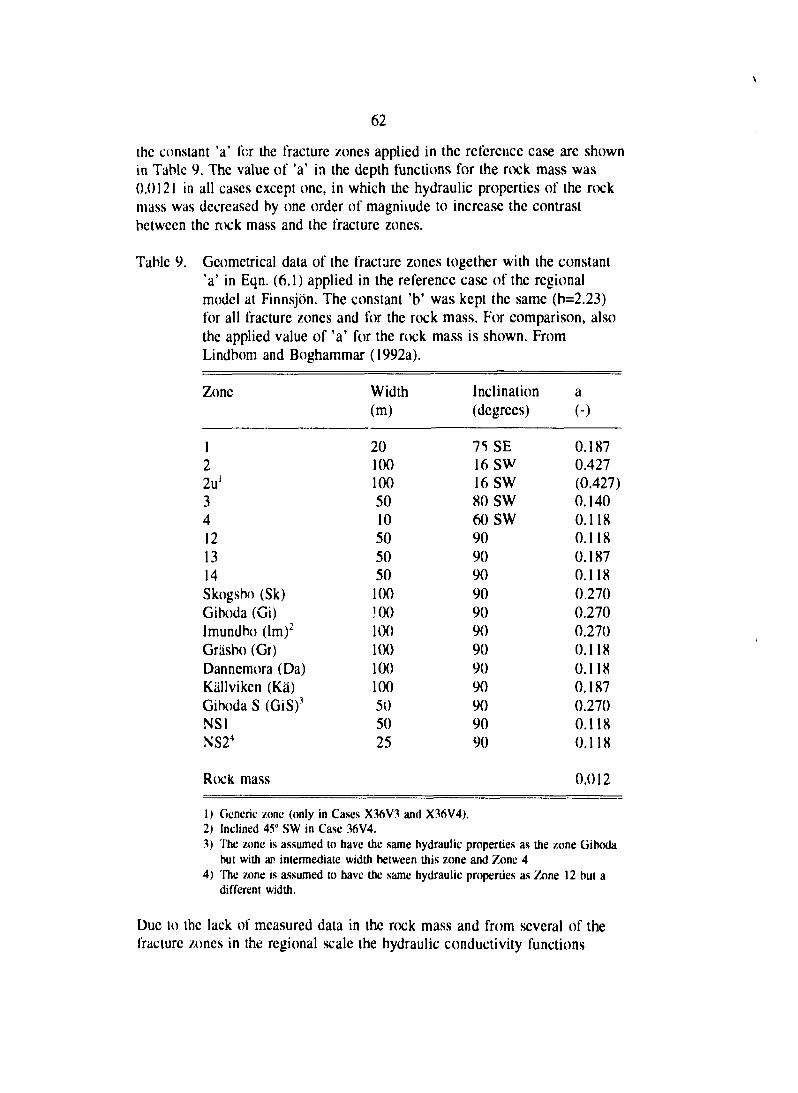
62
the constant 'a' for the fracture zones applied in the reference case are shownin Table 9. The value of 'a' in the depth functions for the rock mass was0.0121 in all cases except one, in which the hydraulic properties of the rockmass was decreased by one order of magnitude to increase the contrastbetween the rock mass and the fracture zones.
Table 9. Geometrical data of the fracture zones together with the constant'a' in Eqn. (6.1) applied in the reference case of the regionalmodel at Finnsjön. The constant 'b' was kept the same (b=2.23)for all fracture zones and for the rock mass. For comparison, alsothe applied value of 'a' for the rock mass is shown. FromLindbom and Boghammar (1992a).
Zone
122u'34121314Skogsbo (Sk)Giboda (Gi)Imundbo (Im)2
Gräsbo (Gr)Dannemora (Da)Källvikcn (Kä)Giboda S (GiS)3
NS1NS24
Width(m)
201001005010505050100!00100100100100505025
Inclination(degrees)
75 SE16 SW16 SW80 SW60 SW909090909090909090909090
a(-)
0.1870.427(0.427)0.1400.1180.1180.1870.1180.2700.2700.2700.1180.1180.1870.2700.1180.118
Rock mass 0.012
1) Generic zone (only in Cases X36V3 and X36V4).2) Inclined 45° SW in Case 36V4.3) The zone is assumed to have the same hydraulic properties as the zone Ciiboda
hut with ar. intermediate width between this zone and Zone 44) The zone is assumed to have the same hydraulic properties as Zone 12 but a
different width.
Due to the lack of measured data in the rock mass and from several of thefracture /ones in the regional scale the hydraulic conductivity functions
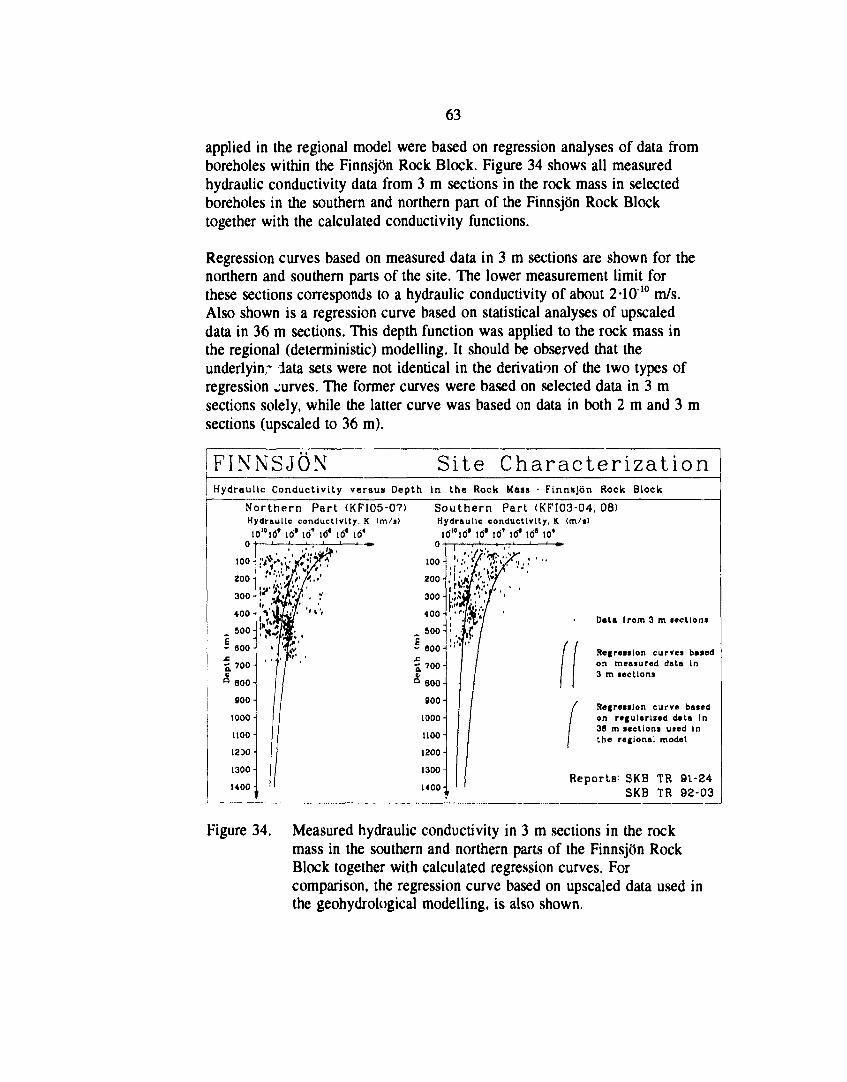
63
applied in the regional model were based on regression analyses of data fromboreholes within the Finnsjön Rock Block. Figure 34 shows all measuredhydraulic conductivity data from 3 m sections in the rock mass in selectedboreholes in the southern and northern part of the Finnsjön Rock Blocktogether with the calculated conductivity functions.
Regression curves based on measured data in 3 m sections are shown for thenorthern and southern parts of the site. The lower measurement limit forthese sections corresponds to a hydraulic conductivity of about 2-1010 m/s.Also shown is a regression curve based on statistical analyses of upscaleddata in 36 m sections. This depth function was applied to the rock mass inthe regional (deterministic) modelling. It should be observed that theunderlyinr iata sets were not identical in the derivation of the two types ofregression curves. The former curves were based on selected data in 3 msections solely, while the latter curve was based on data in both 2 m and 3 msections (upscaled to 36 m).
FINNSJON Site CharacterizationHydraulic Conductivity versus Depth in the Rock Mass - Finnsjön Rock Block
Northern Part (KFI05-0?)Hydraulic conductivity. K (m/a)
id10 its' id" id7 id* id' id4
0-
100-
200-
300-
• 00-
_ 500-
- 800-
£700 -
^ 800-
900-
1000-
1100 -
1230 •
1300-
K00 ;
—_i 1 U- 1 1 1 ^
''it'ir.'r''''*''$$£'• •
'IT '//
ii
Southern Part (KFI03-04. 08)Hydraulic conductivity, K (m/s!io"iä* id' id' id* id" to4
o-
Dota Irom 3 m »ctiona
Regrenlon curves baaedon meanured data in3 m aectiona
Regreiaion curve batedon regularized date in36 m aectiona uaed inthe regional model
Reports SKB TR 91-24SKB TR 92-03
Figure 34. Measured hydraulic conductivity in 3 m sections in the rockmass in the southern and northern parts of the Finnsjön RockBlock together with calculated regression curves. Forcomparison, the regression curve based on upscaled data used inthe geohydrological modelling, is also shown.
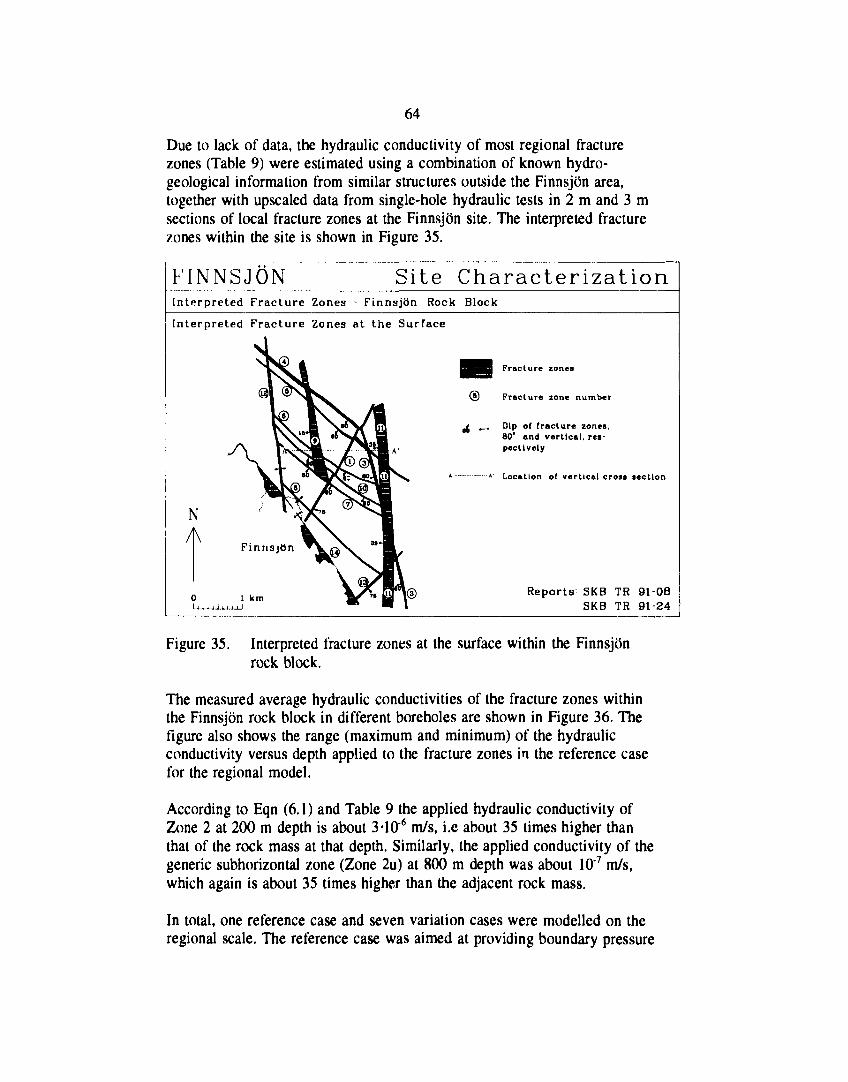
64
Due to lack of data, the hydraulic conductivity of most regional fracturezones (Table 9) were estimated using a combination of known hydro-geological information from similar structures outside the Finnsjön area,together with upscaled data from single-hole hydraulic tests in 2 m and 3 msections of local fracture zones at the Finnsjön site. The interpreted fracturezones within the site is shown in Figure 35.
FINNSJÖN Site CharacterizationInterpreted Fracture Zones - Finnsjön Rock Block
Interpreted Fracture Zones at the Surface
N
• Fracture zones
(S) Fracture zone number
a{ _ Dip of fracture zones.80* and vertical, res-pectively
* — —* Location of vertical cross section
Reports^ SKB TR 9108SKB TR 91-24
Figure 35. Interpreted fracture zones at the surface within the Finnsjönrock block.
The measured average hydraulic conductivities of the fracture zones withinthe Finnsjön rock block in different boreholes are shown in Figure 36. Thefigure also shows the range (maximum and minimum) of the hydraulicconductivity versus depth applied to the fracture zones in the reference casefor the regional model.
According to Eqn (6.1) and Table 9 the applied hydraulic conductivity ofZone 2 at 200 m depth is about 3*10'6 m/s, i.e about 35 times higher thanthat of the rock mass at that depth. Similarly, the applied conductivity of thegeneric subhorizontal zone (Zone 2u) at 800 m depth was about 10'7 m/s,which again is about 35 times higher than the adjacent rock mass.
In total, one reference case and seven variation cases were modelled on theregional scale. The reference case was aimed at providing boundary pressure
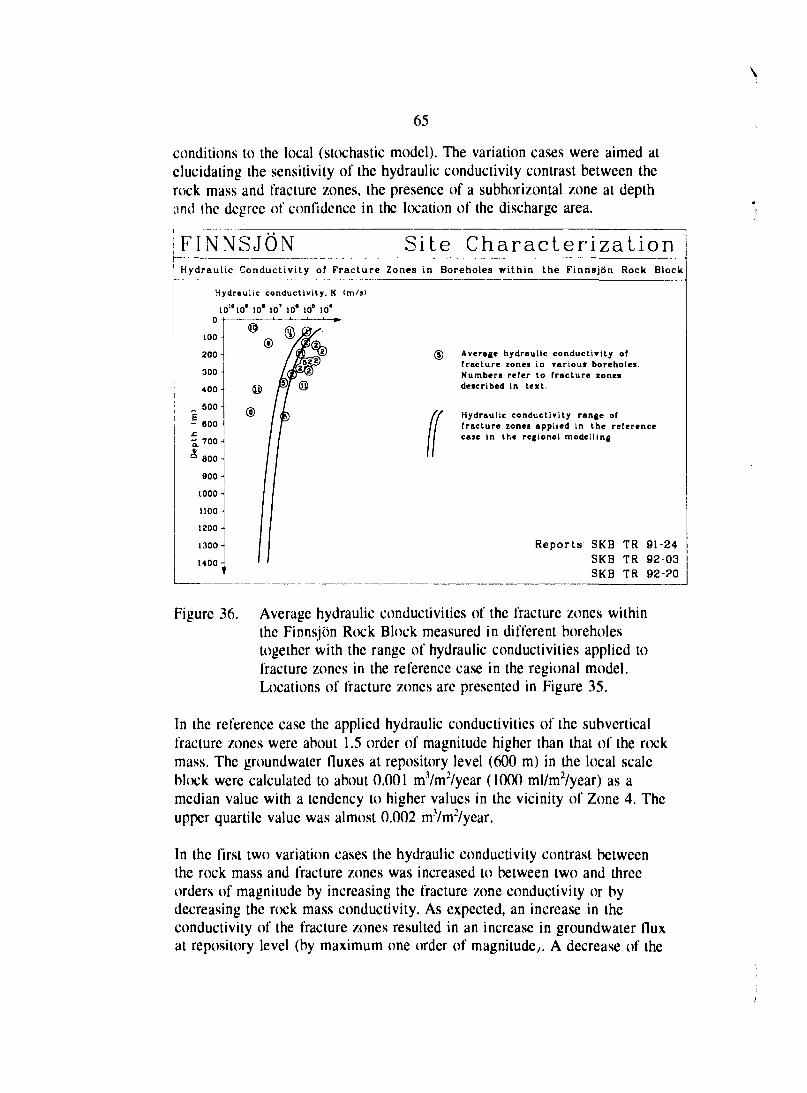
\
65
conditions to the local (stochastic model). The variation cases were aimed atelucidating the sensitivity of the hydraulic conductivity contrast between therock mass and fracture zones, the presence of a subhorizontal zone at depthand the degree of confidence in the location of the discharge area.
FINNSJON Site CharacterizationHydraulic Conductivity of Fracture Zones in Boreholes within the Finnsjön Rock Block
Hydraulic conductivity, K (m/s)
IÖ^IO ' IÖ1 iöT iö* iö* iö*
100-
200
300
400-
500-
- 600-
1.700
° 800
900-
1000-
1100
1200-
1300-
U00-
(S) Average hydraulic conductivity offracture zones in various boreholes.Numbers refer to fracture zonesdescribed in text.
Hydraulic conductivity range offracture zones applied in the referencecase in the regional modelling
Reports SKB TR 91-24SKB TR 92-03SKB TR 92?0
Figure 36. Average hydraulic conductivities of the fracture zones withinthe Finnsjön Rock Block measured in different boreholestogether with the range of hydraulic conductivities applied tofracture zones in the reference case in the regional model.Locations of fracture zones are presented in Figure 35.
In the reference case the applied hydraulic conductivities of the subverticalfracture zones were about 1.5 order of magnitude higher than that of the rockmass. The groundwater fluxes at repository level (600 m) in the local scaleblock were calculated to about 0.001 mVm2/year (1000 ml/m2/year) as amedian value with a tendency to higher values in the vicinity of Zone 4. Theupper quartile value was almost 0.002 mVmVyear.
In the first two variation cases the hydraulic conductivity contrast betweenthe rock mass and fracture zones was increased to between two and threeorders of magnitude by increasing the fracture zone conductivity or bydecreasing the rock mass conductivity. As expected, an increase in theconductivity of the fracture zones resulted in an increase in groundwater fluxat repository level (by maximum one order of magnitude;. A decrease of the
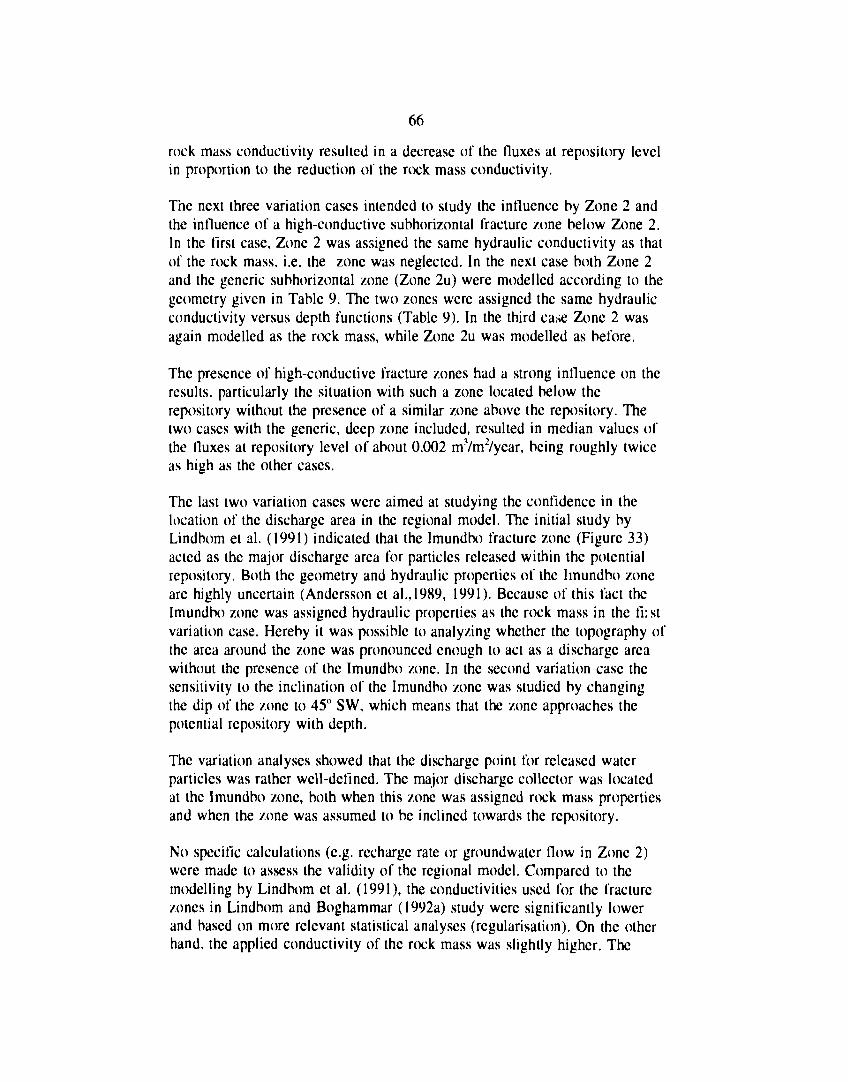
66
rock mass conductivity resulted in a decrease of the fluxes at repository levelin proportion to the reduction of the rock mass conductivity.
The next three variation cases intended to study the influence by Zone 2 andthe influence of a high-conductive subhorizontal fracture zone below Zone 2.In the first case, Zone 2 was assigned the same hydraulic conductivity as thatof the rock mass, i.e. the zone was neglected. In the next case both Zone 2and the generic subhorizontal zone (Zone 2u) were modelled according to thegeometry given in Table 9. The two zones were assigned the same hydraulicconductivity versus depth functions (Table 9). In the third case Zone 2 wasagain modelled as the rock mass, while Zone 2u was modelled as before.
The presence of high-conductive fracture zones had a strong influence on theresults, particularly the situation with such a zone located below therepository without the presence of a similar zone above the repository. Thetwo cases with the generic, deep zone included, resulted in median values ofthe fluxes at repository level of about 0.002 mVm2/year, being roughly twiceas high as the other cases.
The last two variation cases were aimed at studying the confidence in thelocation of the discharge area in the regional model. The initial study byLindbom et al. (1991) indicated that the Imundbo fracture zone (Figure 33)acted as the major discharge area for particles released within the potentialrepository. Both the geometry and hydraulic properties of the Imundbo zoneare highly uncertain (Andersson et al., 1989, 1991). Because of this fact theImundbo zone was assigned hydraulic properties as the rock mass in the firstvariation case. Hereby it was possible to analyzing whether the topography ofthe area around the zone was pronounced enough to act as a discharge areawithout the presence of the Imundbo zone. In the second variation case thesensitivity to the inclination of the Imundbo zone was studied by changingthe dip of the zone to 45" SW, which means that the zone approaches thepotential repository with depth.
The variation analyses showed that the discharge point for released waterparticles was rather well-defined. The major discharge collector was locatedat the Imundbo zone, both when this zone was assigned rock mass propertiesand when the zone was assumed to be inclined towards the repository.
No specific calculations (e.g. recharge rate or groundwater flow in Zone 2)were made to assess the validity of the regional model. Compared to themodelling by Lindbom et al. (1991), the conductivities used for the fracturezones in Lindbom and Boghammar (1992a) study were significantly lowerand based on more relevant statistical analyses (regularisation). On the otherhand, the applied conductivity of the rock mass was slightly higher. The
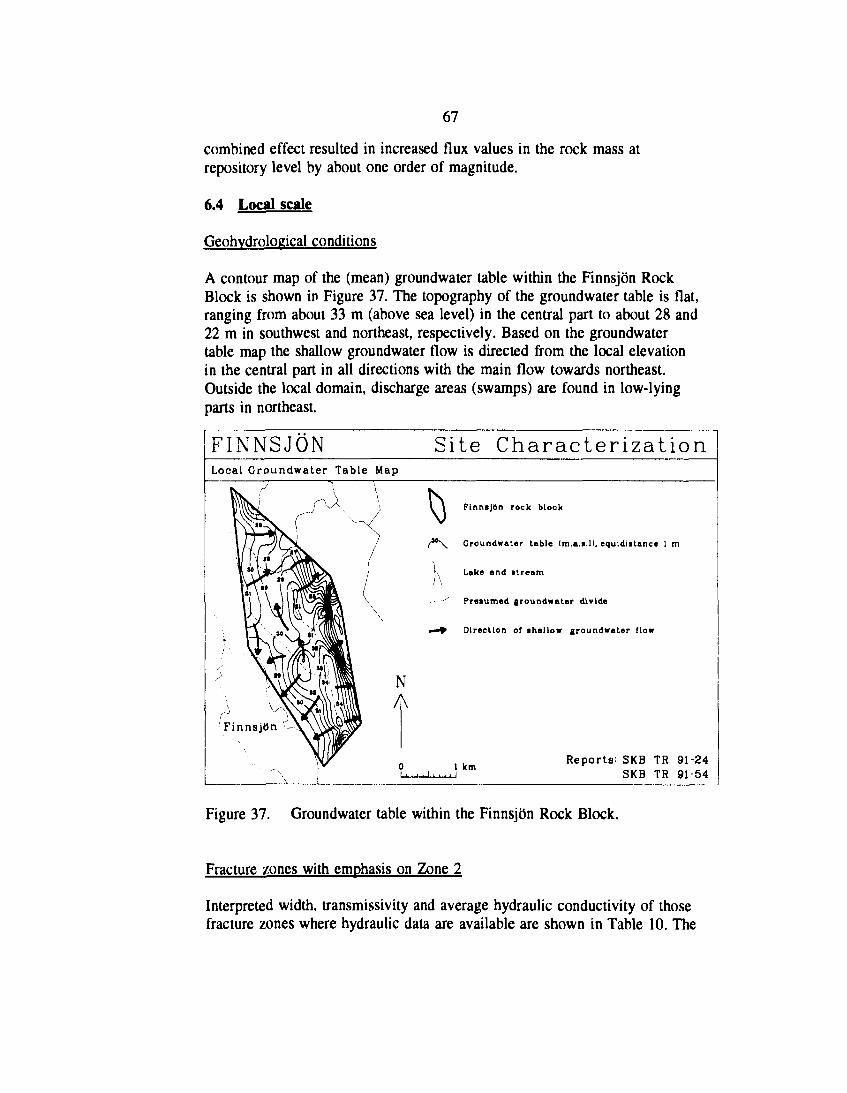
67
combined effect resulted in increased flux values in the rock mass atrepository level by about one order of magnitude.
6.4 Local scale
Geohydrological conditions
A contour map of the (mean) groundwater table within the Finnsjön RockBlock is shown in Figure 37. The topography of the groundwater table is flat,ranging from about 33 m (above sea level) in the central part to about 28 and22 m in southwest and northeast, respectively. Based on the groundwatertable map the shallow groundwater flow is directed from the local elevationin the central part in all directions with the main flow towards northeast.Outside the local domain, discharge areas (swamps) are found in low-lyingparts in northeast.
FINNSJON Site CharacterizationLocal Groundwater Table Map
I A Finnsjön rock block
Groundwater table (m.a.s.l), equidistance 1 m
Lake end stream
Presumed groundwater divide
Direction of shallow groundwater flow
NA
0I . . . . I ,
1 km• I
Reports: SKB TR 91-24SKB TR 91-54
Figure 37. Groundwater table within the Finnsjön Rock Block.
Fracture zones with emphasis on Zone 2
Interpreted width, transmissivity and average hydraulic conductivity of thosefracture zones where hydraulic data are available are shown in Table 10. The
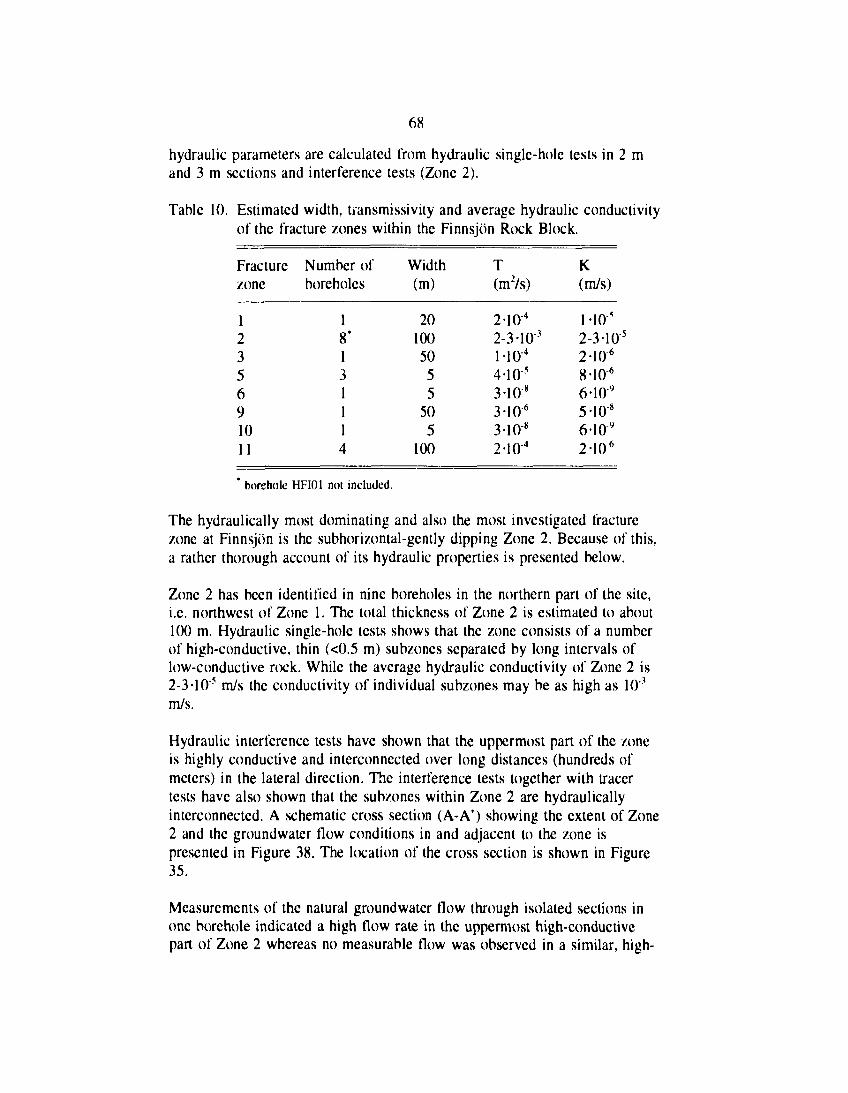
68
hydraulic parameters are calculated from hydraulic single-hole tests in 2 mand 3 m sections and interference tests (Zone 2).
Table 10. Estimated width, transmissivity and average hydraulic conductivityof the fracture zones within the Finnsjön Rock Block.
Fracturezone
1235691011
Number ofboreholes
18*131114
Width(m)
201005055
505
100
T(m2/s)
2-104
2-3 103
M0-4
4-1O5
3-1O8
3-106
3-1O"8
2 104
K(m/s)
1 -10?
2-3-1O5
2-106
8 106
6-109
5-1O"8
6-109
2-106
' borehole HFI01 not included.
The hydraulically most dominating and also the most investigated fracturezone at Finnsjön is the subhorizontal-gently dipping Zone 2. Because of this,a rather thorough account of its hydraulic properties is presented below.
Zone 2 has been identified in nine boreholes in the northern part of the site,i.e. northwest of Zone 1. The total thickness of Zone 2 is estimated to about100 m. Hydraulic single-hole tests shows that the zone consists of a numberof high-conductive, thin (<0.5 m) subzones separated by long intervals oflow-conductive rock. While the average hydraulic conductivity of Zone 2 is2-3-105 m/s the conductivity of individual subzones may be as high as 10"3
m/s.
Hydraulic interference tests have shown that the uppermost part of the zoneis highly conductive and interconnected over long distances (hundreds ofmeters) in the lateral direction. The interference tests together with tracertests have also shown that the subzones within Zone 2 are hydraulicallyinterconnected. A schematic cross section (A-A') showing the extent of Zone2 and the groundwater flow conditions in and adjacent to the zone ispresented in Figure 38. The location of the cross section is shown in Figure35.
Measurements of the natural groundwater flow through isolated sections inone borehole indicated a high flow rate in the uppermost high-conductivepart of Zone 2 whereas no measurable flow was observed in a similar, high-
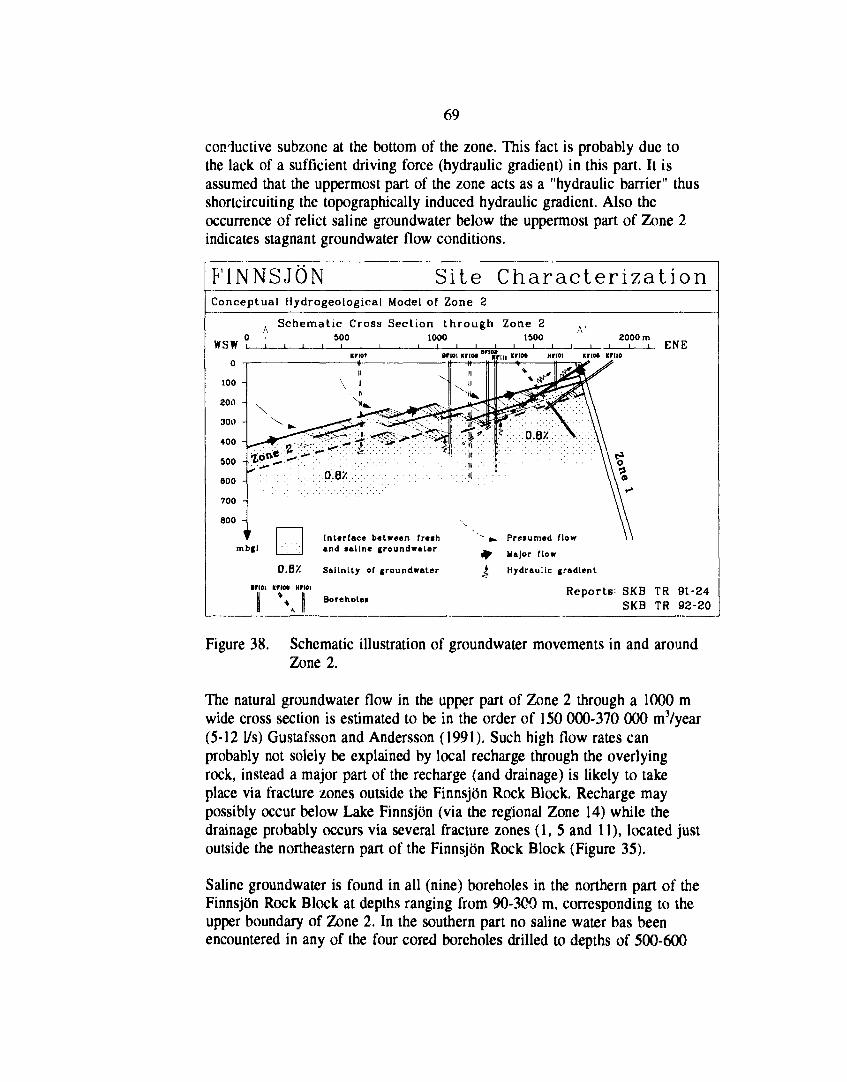
69
coniuctive subzone at the bottom of the zone. This fact is probably due tothe lack of a sufficient driving force (hydraulic gradient) in this part. It isassumed that the uppermost part of the zone acts as a "hydraulic barrier" thusshortcircuiting the topographically induced hydraulic gradient. Also theoccurrence of relict saline groundwater below the uppermost part of Zone 2indicates stagnant groundwater flow conditions.
FINNSJON Site CharacterizationConceptual Hydrogeological Model of Zone 2
Schematic Cross Section through Zone 2
WSW500
-J 11000
-J 1
tsooI
A', "T 0"! ENE
Krior
mbgl
QMV.
•not «riM HMOI
Interface between freihand saline groundwaLer
Salinity of groundwater
Borehole)
" o. Presumed flow
«> Major flow
I Hydraulic gradient
Reports: SKB TR 91-24SKB TR 92-20
Figure 38. Schematic illustration of groundwater movements in and aroundZone 2.
The natural groundwater flow in the upper part of Zone 2 through a 1000 mwide cross section is estimated to be in the order of 150 000-370 000 mVyear(5-12 l/s) Gustafsson and Andersson (1991). Such high flow rates canprobably not solely be explained by local recharge through the overlyingrock, instead a major part of the recharge (and drainage) is likely to takeplace via fracture zones outside the Finnsjön Rock Block. Recharge maypossibly occur below Lake Finnsjön (via the regional Zone 14) while thedrainage probably occurs via several fracture zones (1, 5 and 11), located justoutside the northeastern part of the Finnsjön Rock Block (Figure 35),
Saline groundwater is found in all (nine) boreholes in the northern part of theFinnsjön Rock Block at depths ranging from 90-300 m, corresponding to theupper boundary of Zone 2. In the southern part no saline water has beenencountered in any of the four cored boreholes drilled to depths of 500-600
70
m. Apart from the northern block, saline groundwater has also beenencountered in borehole (KFI08), penetrating the eastern boundary of theFinnsjön Rock Block, and continuing under farmland to the east. Thefarmland is covered by a thick layer of glacial clay (7-8 m thickness).
According to a tentative model presented in Ahlbom and Svensson (1991) thelocation of the saline water interface in the northern block is governed by thepresence of Zone 2, which is assumed to shortcircuite the saline water belowLake Finnsjön (at about 370 m depth) in the west and the presumed salinewater below the farmland in the east (at about 10 m depth). The saline waterinterface will thus follow the dip of Zone 2 which is in accordance with thefield observations (Andersson et al. 1991). According to the same model, thesaline water interface in the southern part of the Finnsjön Rock Block isassumed to be an inverse image of the elevation of the groundwater table(according to a certain depth ratio between fresh and saline water). In thecentral and southern parts the saline interface would according to this ratio belocated at a depth of 700-1000 m, i.e below the boreholes drilled in theseparts.
The conceptual model of the saline water has tentatively been confirmed bynumerical modelling Ahlbom and Svensson (1991). Scooping calculations ina vertical cross section with presence of saline water below Zone 2, have alsobeen performed by Lindbom et al. (1991).
The conductive fracture frequency (CFF) in Zone 2 and the rock mass aboveand below the zone was estimated in Andersson et al. (1988) by a statisticalmethod using hydraulic conductivity data from 2 m and 3 m sections inselected boreholes. The estimated range of average CFF in Zone 2 was 0.90-1.15, whereas the average CFF in the rock mass above and below the zonewas 0.47-1.44 and 0.56-0.76, respectively. It should be pointed out that thesevalues arc based on shorter test sections than the values reported from otherstudy sites, e.g. Fjällveden and Gideå, and thus not directly comparable.
Stochastic qroundwater flow modelling
In the local scale, stochastic groundwater flow modelling was performed inSKB 91 using the code HYDRASTAR. This code carries out Monte Carlosimulation of the steady-state form of the hydrology equation in a rectilinearblock. The rock is assumed to be a stochastic continuum. The modelled blockis shown in Figure 39. The block is about 5 x 3 x 1.5 km in size.
The simulation of groundwater flow with HYDRASTAR is preceeded bygeostatistical analyses of available hydraulic conductivity data from single-hole tests with different packer spacing. Prior to the analyses these data are
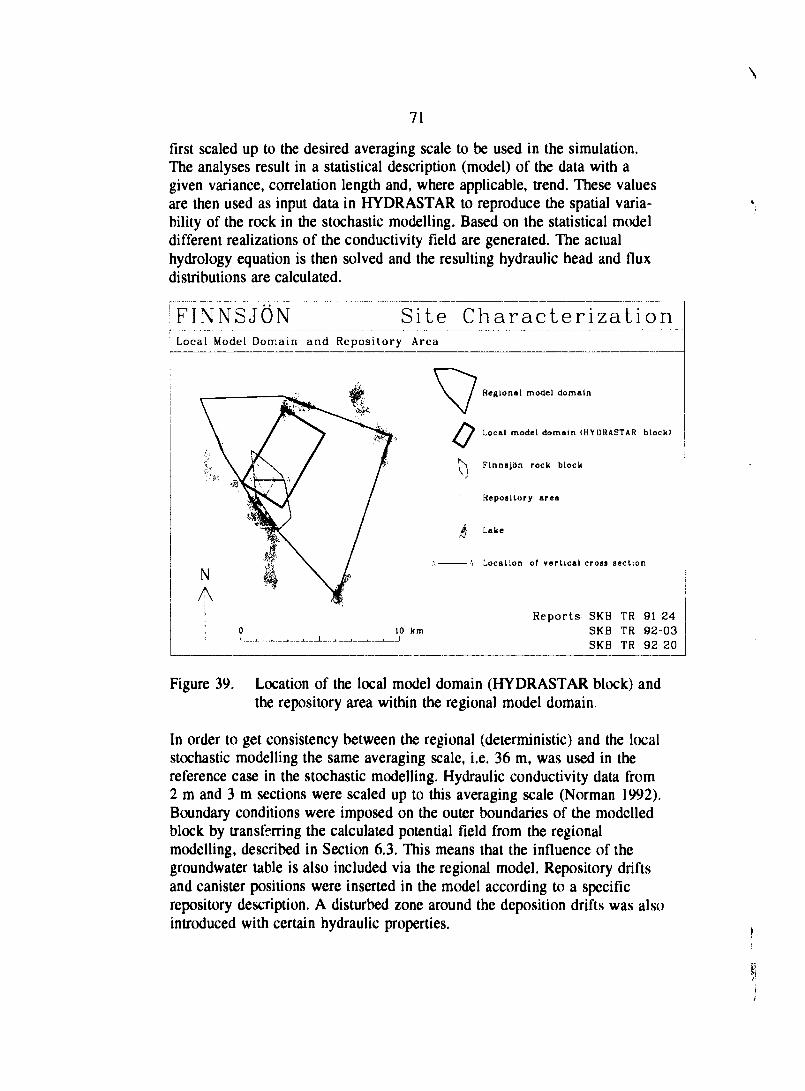
71
first scaled up to the desired averaging scale to be used in the simulation.The analyses result in a statistical description (model) of the data with agiven variance, correlation length and, where applicable, trend. These valuesare then used as input data in HYDRASTAR to reproduce the spatial varia-bility of the rock in the stochastic modelling. Based on the statistical modeldifferent realizations of the conductivity field are generated. The actualhydrology equation is then solved and the resulting hydraulic head and fluxdistributions are calculated.
FINNSJON Site CharacterizationLocal Model Domain and Repository Area
Regional model domain
Local model domain (HYDKASTAR block)
Finnsjön rock block
Repository area
Lake
•A Location of vertical cross section
10 kmReports SKB TR 91 24
SKB TR 92-03SKB TR 92 20
Figure 39. Location of the local model domain (HYDRASTAR block) andthe repository area within the regional model domain.
In order to get consistency between the regional (deterministic) and the localstochastic modelling the same averaging scale, i.e. 36 m, was used in thereference case in the stochastic modelling. Hydraulic conductivity data from2 m and 3 m sections were scaled up to this averaging scale (Norman 1992).Boundary conditions were imposed on the outer boundaries of the modelledblock by transferring the calculated potential field from the regionalmodelling, described in Section 6.3. This means that the influence of thegroundwater table is also included via the regional model. Repository driftsand canister positions were inserted in the model according to a specificrepository description. A disturbed zone around the deposition drifts was alsointroduced with certain hydraulic properties.
72
The SKB 91 reference case in the stochastic modelling was based on astatistical model with trends based on a spherically isotropic variogramfunctions. The trend was according to the regression curves of hydraulicconductivity, based on upscaled data for the rock mass is shown in Figure34. The reference case model was based on the averaging scale of 36 m witha variance of 1.25 and a correlation length of 106 m for the logarithm of thehydraulic conductivity. The extent of the disturbed zone was assumed to be 1m around the deposition drifts with a hydraulic conductivity of 10'6 m/s. Theconductivity of the backfill was assumed to 10"9 m/s.
A number of variation cases were also carried out to assess the sensitivity ofvarying, e.g. the averaging scale or hydraulic properties, on the calculatedgroundwater fluxes at repository level, travel times from the repository,conductivity fields and the groundwater flow pattern, respectively. The modelvariations were carried out with two different-sized model areas, the"reference case" and "smaller block".
For the reference case Monte Carlo simulation with 500 realizations wascarried out for the flow field and of the groundwater travel times fromdifferent positions in the repository. Typical flux values of about 0.001m'/nr/year at the repository level (600 m) were obtained from the stochasticmodelling. This is in agreement with the results from the regional, deter-ministic modelling (Section 6.3). The variations showed that the flow patternand groundwater travel time from the repository were changed to a relativelysmall extent by most of the variations performed. Significant changes aremainly caused by flat-lying, highly conductive zones, which can create bothmore and less favourable conditions than in the reference case. Thecalculated groundwater travel times are presented in Chapter 8.
The validity of the results from the stochastic modelling was assessed bysimulations of the natural groundwater flow in different boreholes atFinnsjön. The modelled flows were compared with results from fieldmeasurements of the natural flow with a point dilution probe presented inAndersson et al. (1991). Comparisons in one borehole (BFI01) showed thatthe extremely high fluxes measured on a metre scale at the upper interface ofZone 2 could not be recreated by the stochastic model. However, there is agood agreement when considering the total flow. The simulated fluxes abovethe zone are also in reasonably good agreement with the measured.
In the lower, high-conductive part of Zone 2 the groundwater is more or lessstagnant. This situation was not reproduced in the stochastic modelling (northe deterministic modelling), probably because the modelling did not takeinto account the presence of a more saline and heavier groundwater at thislevel.
73
7. GROUNDWATER CHEMISTRY
7.1 Scope and reliability of samples
Sampling of groundwater for chemical analyses have been made inter-mittently from 1977 to 1989. AH together, 19 boreholes have been sampled.The results, including sampling methods, are presented by Hultberg et al(1981), Gustafsson and Klockars (1981), Laurent (1982), Ahlbom et al.(1986), Smellie et al. (1987), Smellie and Wikberg (1989) and Andersson etal. (1991). In Ekman (1989) a compilation of investigated parameters of allboreholes at Finnsjön up till 1988 are presented.
The results and reliability of the early groundwater samples are discussed inAllard et al. (1983), Nordstrom and Puigdomenech (1986), Puigdomenechand Nordstrom (1987). By considering various sources of contamination itwas concluded that boreholes KFI05, KFI06, KFI08, KFI09 and BFI01 canbe regarded as relatively free from contamination during groundwatersampling procedures and thus representative for the depth sampled. BoreholesKFI04 and KFI07 show varying degree of contamination. Boreholes KFI01and KFI02 are contaminated by near-surface and/or flushing water duringsampling.
The methodology for sampling analysis of borehole water was developedconsiderable with the introduction of the mobile laboratory in 1984. Thismade it possible to analyze the most sensitive components immediately andto carry out sampling under well-controlled conditions. These improvementsmean that the most reliable analyses of deep groundwater are from the mostrecently sampled boreholes, manly KFI09 and BFI01.
This chapter review some of the most important results with emphasis on thesampling performed by the mobile laboratory. A division is made intogeneral chemistry, redox-sen si tive parameters, uranium chemistry andenvironmental isotopes. Such a division is somewhat arbitrary, and obviouslysome of the parameters overlap. Where not specifically referenced, thecomments made ary. generally based on the extensive data analysis carriedout by Ahlbom et al. (1986), Smellie and Wikberg (1989) and Andersson etal. (1991).
7.2 Results
General chemistry
Groundwater sampling in the two boreholes KFI09 and BFI01 shows thethree main types of groundwaters that are present at the Finnsjön study site,
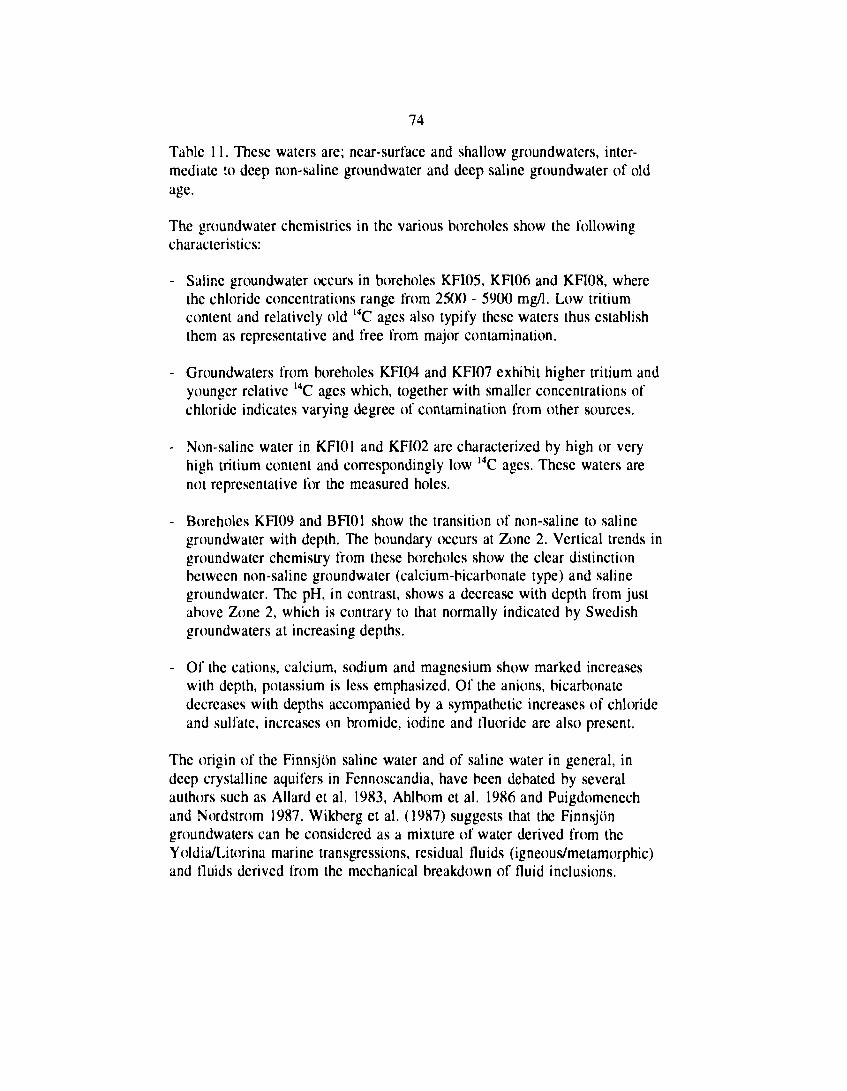
74
Table 11. These waters are; near-surface and shallow groundwaters, inter-mediate to deep non-saline groundwater and deep saline groundwater of oldage.
The groundwater chemistries in the various boreholes show the followingcharacteristics:
- Saline groundwater occurs in boreholes KFI05, KF106 and KF108, wherethe chloride concentrations range from 2500 - 5900 mg/1. Low tritiumcontent and relatively old 14C ages also typify these waters thus establishthem as representative and free from major contamination.
- Groundwaters from boreholes KFI04 and KFI07 exhibit higher tritium andyounger relative 14C ages which, together with smaller concentrations ofchloride indicates varying degree of contamination from other sources.
- Non-saline water in KFI01 and KFI02 are characterized by high or veryhigh tritium content and correspondingly low 14C ages. These waters arenot representative for the measured holes.
- Boreholes KFI09 and BFI01 show the transition of non-saline to salinegroundwater with depth. The boundary occurs at Zone 2. Vertical trends ingroundwater chemistry from these boreholes show the clear distinctionbetween non-saline groundwater (calcium-bicarbonate type) and salinegroundwater. The pH, in contrast, shows a decrease with depth from justabove Zone 2, which is contrary to that normally indicated by Swedishgroundwaters at increasing depths.
- Of the cations, calcium, sodium and magnesium show marked increaseswith depth, potassium is less emphasized. Of the anions, bicarbonatedecreases with depths accompanied by a sympathetic increases of chlorideand sulfate, increases on bromide, iodine and fluoride are also present.
The origin of the Finnsjön saline water and of saline water in general, indeep crystalline aquifers in Fennoscandia, have been debated by severalauthors such as Allard et al. 1983, Ahlbom et al. 1986 and Puigdomenechand Nordstrom 1987. Wikberg et al. (1987) suggests that the Finnsjöngroundwaters can be considered as a mixture of water derived from theYoldia/Litorina marine transgressions, residual fluids (igneous/metamorphic)and fluids derived from the mechanical breakdown of fluid inclusions.
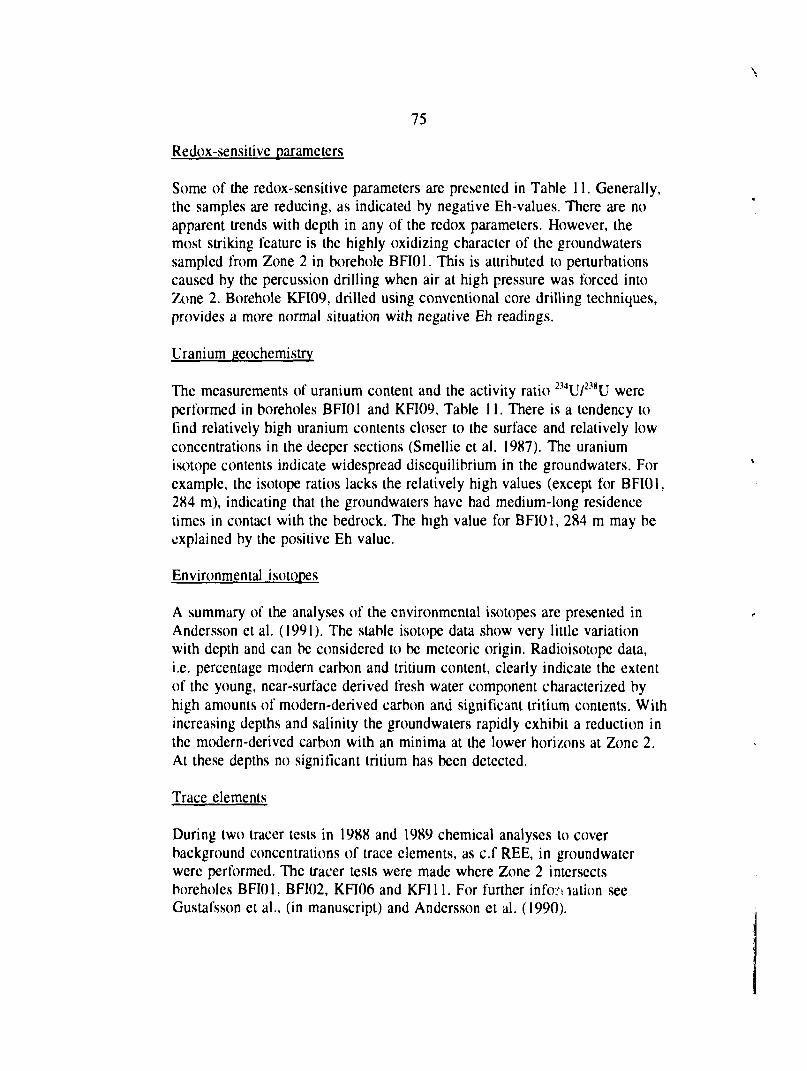
75
Redox-sensitive parameters
Some of the redox-sensitive parameters are presented in Table 11. Generally,the samples are reducing, as indicated by negative Eh-values. There are noapparent trends with depth in any of the redox parameters. However, themost striking feature is the highly oxidizing character of the groundwaterssampled from Zone 2 in borehole BFI01. This is attributed to perturbationscaused by the percussion drilling when air at high pressure was forced intoZone 2. Borehole KFI09, drilled using conventional core drilling techniques,provides a more normal situation with negative Eh readings.
Uranium geochemistry
The measurements of uranium content and the activity ratio 234U/238U wereperformed in boreholes BFI01 and KFI09, Table 11. There is a tendency tofind relatively high uranium contents closer to the surface and relatively lowconcentrations in the deeper sections (Smellie et al. 1987). The uraniumisotope contents indicate widespread disequilibrium in the groundwaters. Forexample, the isotope ratios lacks the relatively high values (except for BFI01,284 m), indicating that the groundwaters have had medium-long residencetimes in contact with the bedrock. The high value for BFI01, 284 m may beexplained by the positive Eh value.
Environmental isotopes
A summary of the analyses of the environmental isotopes are presented inAndersson et al. (1991). The stable isotope data show very little variationwith depth and can be considered to be meteoric origin. Radioisotope data,i.e. percentage modern carbon and tritium content, clearly indicate the extentof the young, near-surface derived fresh water component characterized byhigh amounts of modern-derived carbon and significant tritium contents. Withincreasing depths and salinity the groundwaters rapidly exhibit a reduction inthe modern-derived carbon with an minima at the lower horizons at Zone 2.At these depths no significant tritium has been detected.
Trace elements
During two tracer tests in 1988 and 1989 chemical analyses to coverbackground concentrations of trace elements, as c.f REE, in groundwaterwere performed. The tracer tests were made where Zone 2 intersectsboreholes BFI01, BFI02, KFI06 and KFI11. For further intonation seeGustafsson et al., (in manuscript) and Andersson et al. (1990).
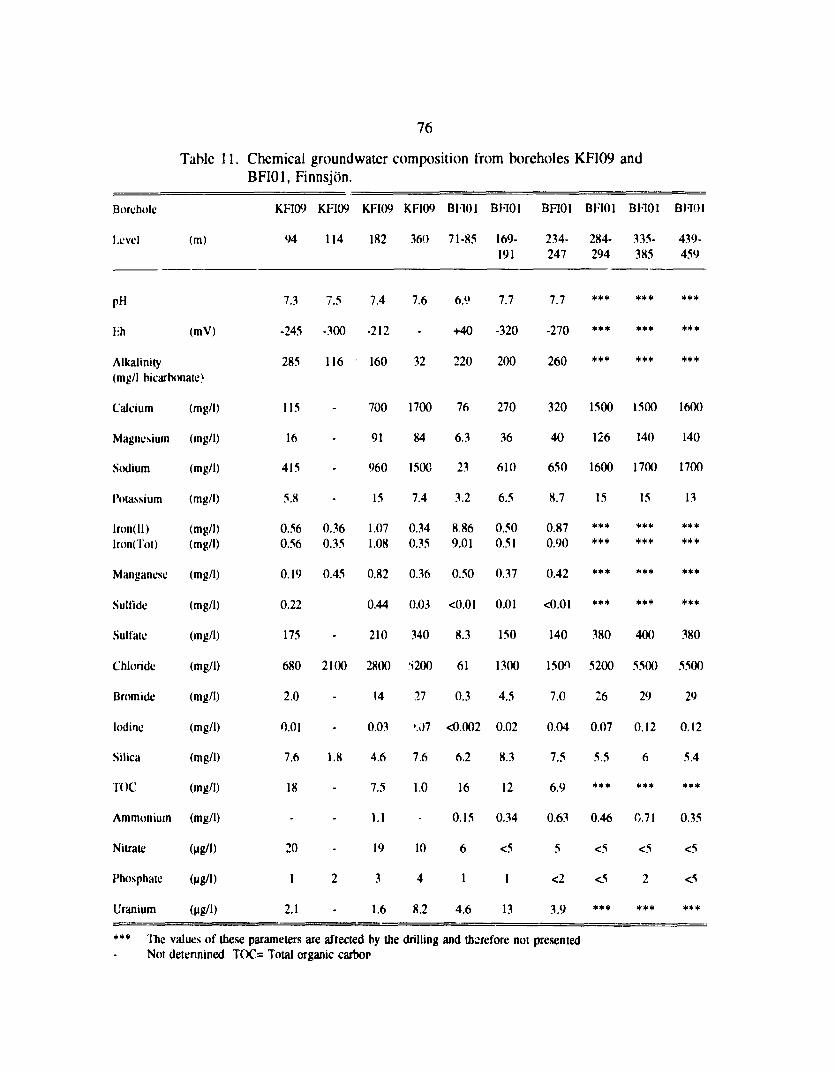
76
Table 11. Chemical groundwater composition from boreholes KFI09 andBFI01, Finnsjön.
Borehole
Level
PH
l-h
(m)
(mV)
Alkalinity(mg/l bicarbonate)
Calcium
Magnesium
Sodium
Potassium
Iron(II)Iron(Tot)
Manganese
Sulfidc
Sulfate
Chloride
Bromide
Iodine
Silica
TOC
Ammonium
Nitrate
Phosphate
Uranium
(mg/l)
(mg/I)
(mg/l)
(mg/l)
(mg/l)(mg/l)
(mg/l)
(mg/l)
(mg/l)
(mg/l)
(mg/l)
(mg/l)
(mg/l)
(mg/l)
(mg/l)
(Mg/l)
(Mg/D
(Mg/l)
KFI09
94
7.3
-245
285
115
16
415
5.8
0.560.56
0.19
0.22
175
680
2.0
0.01
7.6
18
-
20
1
2.1
KFI09
114
7.5
-300
116
-
-
-
-
0.360.35
0.45
-
2100
-
-
1.8
-
-
-
2
-
KFI09
182
7.4
-212
160
700
91
960
15
1.071.08
0.82
0.44
210
2800
14
0.03
4.6
7.5
1.1
19
3
1.6
KFI09
360
7.6
-
32
1700
84
150C
7.4
0.340.35
0.36
0.03
340
S200
27
-.07
7.6
1.0
-
10
4
8.2
BF101
71-85
6.9
+40
220
76
6.3
23
3.2
8869.01
0.50
<0.01
8.3
61
0.3
<0.002
6.2
16
0.15
6
1
4.6
BFI01
169-191
7.7
-320
200
270
36
610
6.5
0.500.51
0.37
0.01
150
1300
4.5
0.02
8.3
12
0.34
<5
1
13
BFI01
234-247
7.7
-270
260
320
40
650
8.7
0.870.90
0.42
<0.01
140
1500
7.0
0.04
7.5
6.9
0.63
5
<2
3.9
BFI01
284-294
* • *
* • •
• • •
1500
126
1600
15
**** * •
* • *
* * *
380
5200
26
0.07
5.5
***
0.46
<5
<5
• • •
BF101
335-385
• * •
***
• • •
1500
140
1700
15
+**
• • •
* * *
•*+
400
5500
29
0.12
6
***
0.71
<5
2
* * •
BFI01
439-459
• • *
***
• • *
1600
140
1700
13
**** • •
• • +
***
380
5500
29
0.12
5.4
* * ¥
0.35
<5
<5
+*+
+*+ The values of these parameters are affected by the drilling and therefore not presentedNot determined TOC= Total organic carbor
77
7.3 Summary and relevance of results
A total of 19 boreholes have been sampled at Finnsjön. In general, theoverall picture from tnese boreholes is fairly simple with Zone 2 as astructural/hydraulic barrier to vertical groundwater movement. Downwardmoving non saline groundwater flow will preferentially spread out alongZone 2 rather than continue to deeper levels. Thus preventing or considerablydelaying the process of mixing and flushing out the older saline water belowthe zone. Similarity, the more sluggish upward moving salt water will dolikewise. Zone 2 will therefore be a horizon along which groundwaters ofconsiderably age differences will come into contact and mix with oneanother.
The groundwater chemistry at the Finnsjön study site is similar to otherstudied areas in Sweden. A special characteristic is the high content ofcarbonate in the non-saline water.
8. ASSESSMENT OF SOLUTE TRANSPORT
8.1 Review of earlier work
Finnsjön is the most investigated and modelled region so far within the SKBprogramme. Several modelling efforts have been made over the years. Thefirst modelling efforts was made by Carlsson et al. (1983) with the purposeto test the program package later used for modelling of the Fjällvcden, Gideäand Kamlunge sites. The modelling did not include any transport calculationsfor the Finnsjön site. A similar finite-clement code was later used in the SKB91-study but then also including transport calculations (Lindbom et al., 1991;Lindbom and Boghammar 1991a, 1992a, 1992b). This model is furtherdescribed below.
Finnsjön has also been used as test location for development of various tracertost methods and therefore a number of tracer tests have been performed nthe area. In the Gåvastbo area a series of converging tracer tests with bothconservative and sorbing tracers were performed by Gustafsson and Klockars(1981, 1984). These tests were modelled using one-dimensional transportmodels in order to determine transport properties of the Finnsjön bedrocksuch as (low porosity, dispersivity and hydraulic fracture conductivity. Thesetests were also incorporated in the INTRACOIN study (SKI, 1986) wherethree different modelling teams used the tracer tests to test their modelconcepts. All three teams used one-dimensional approaches. The processesand phenomena included in the modelling were: advection, dispersion,channeling, matrix diffusion, diffusion into stagnant water, several pathways,
78
surface sorption and sorption in rock matrix. No attempts were made tomodel the groundwater flow at the site.
Studies of the transport processes were also performed as a part of theFracture Zone Project. A series of interference tests and tracer tesls weremade to determine the transport properties of Zone 2. The study involvedsimulations of both flow and transport (Nordqvist and Andersson, 1987;Andersson et al., 1990; Gustafsson et al., 1990) using a 2D finite elementcode, SUTRA (Voss, 1984). The modelling procedure was made in a seriesof steps by using the data from the early phases of the project as calibrationmeasurements and then make predictions for the following phase. After thecalibration and verification of the flow model, the transport for the radiallyconverging tracer test was predicted and the experimental results werecompared to the prediction (Gustafsson et al., 1990). The tracer tests werealso modelled with one-dimensional advection-dispersion models in order todetermine transport properties of Zone 2.
The interference tests and tracer tests within the Fracture Zone Project werealso used as a test case in the INTRAVAL study (NEA/SKI, 1990). Sevendifferent modelling teams have analyzed the radially converging test and thedipolc tracer test using different modelling concepts. The modelling wasmainly concentrated on one of the tracer tests and none of the teams used thewhole sequence of tests including the interference tests. The modellingconcepts are summarized below.
At the Finnsjön site tracer tests have been made at two main locations. TheGävastbo area, located in the eastern part of the site (where the percussionboreholes HGB01-17 cluster in Figure 13) and at Zone 2, located in thenorthern part of the site.
8.2 Main results
Conceptual model of How and transport
The investigations within the Fracture Zone Project have resulted in a largenumber of geological, hydrological, and geochemical data. Based on thesedata a conceptual model of flow and transport has been established for thenorthern part of the site. The most important feature regarding flow andtransport in this part is the subhorizontal-gently dipping Zone 2, set Figure38.
Gustafsson and Andersson (1991) present a conceptual model of flow andtransport within Zone 2 based on measurements of natural head conditions, aseries of tracer tests, and in-situ grcundwater flow measurements.
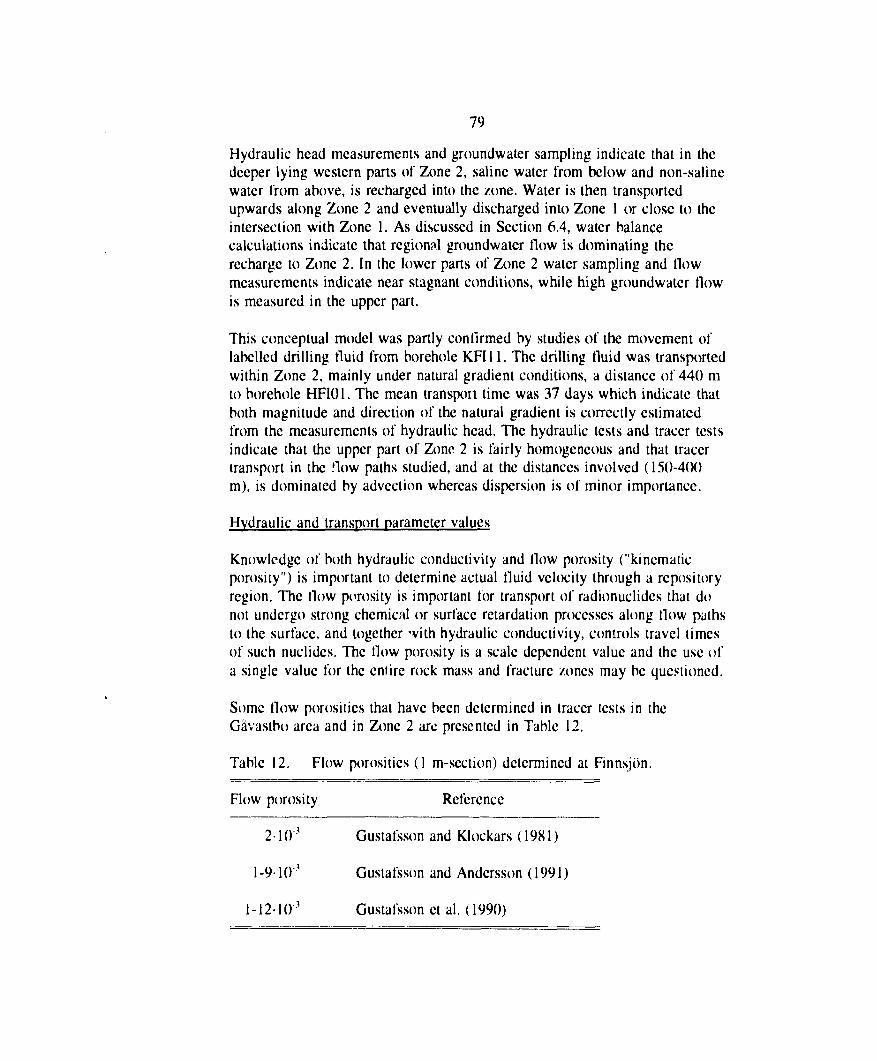
79
Hydraulic head measurements and groundwater sampling indicate that in thedeeper lying western parts of Zone 2, saline water from below and non-salinewater from above, is recharged into the zone. Water is then transportedupwards along Zone 2 and eventually discharged into Zone 1 or close to theintersection with Zone 1. As discussed in Section 6.4, water balancecalculations indicate that regional groundwater flow is dominating therecharge to Zone 2. In the lower parts of Zone 2 water sampling and flowmeasurements indicate near stagnant conditions, while high groundwater Howis measured in the upper part.
This conceptual model was partly confirmed by studies of the movement oflabelled drilling fluid from borehole KFIU . The drilling fluid was transportedwithin Zone 2, mainly under natural gradient conditions, a distance of 440 mto borehole HFI01. The mean transpoit time was 37 days which indicate thatboth magnitude and direction of the natural gradient is correctly estimatedfrom the measurements of hydraulic head. The hydraulic tests and tracer testsindicate that the upper part of Zone 2 is fairly homogeneous and that tracertransport in the flow paths studied, and at the distances involved (150-4(K)m), is dominated by advection whereas dispersion is of minor importance.
Hydraulic and transport parameter values
Knowledge of both hydraulic conductivity and flow porosity ("kinematicporosity") is important to determine actual fluid velocity through a repositoryregion. The flow porosity is important tor transport of radionutiides that donot undergo strong chemical or surface retardation processes along flow pathsto the surface, and together "vith hydraulic conductivity, controls travel timesof such nuclides. The flow porosity is a scale dependent value and the use ofa single value for the entire rock mass and fracture zones may be questioned.
Some flow porosities that have been determined in tracer tests in theGävastbo area and in Zone 2 are presented in Table 12.
Table 12. Flow porosities (1 m-section) determined at Finnsjön.
Flow porosity Reference
2-1 (V3 Gustafsson and Klockars (1981)
1 -9-10' Gustafsson and Andersson (1991)
1-1210* Gustafsson et al. (1990)
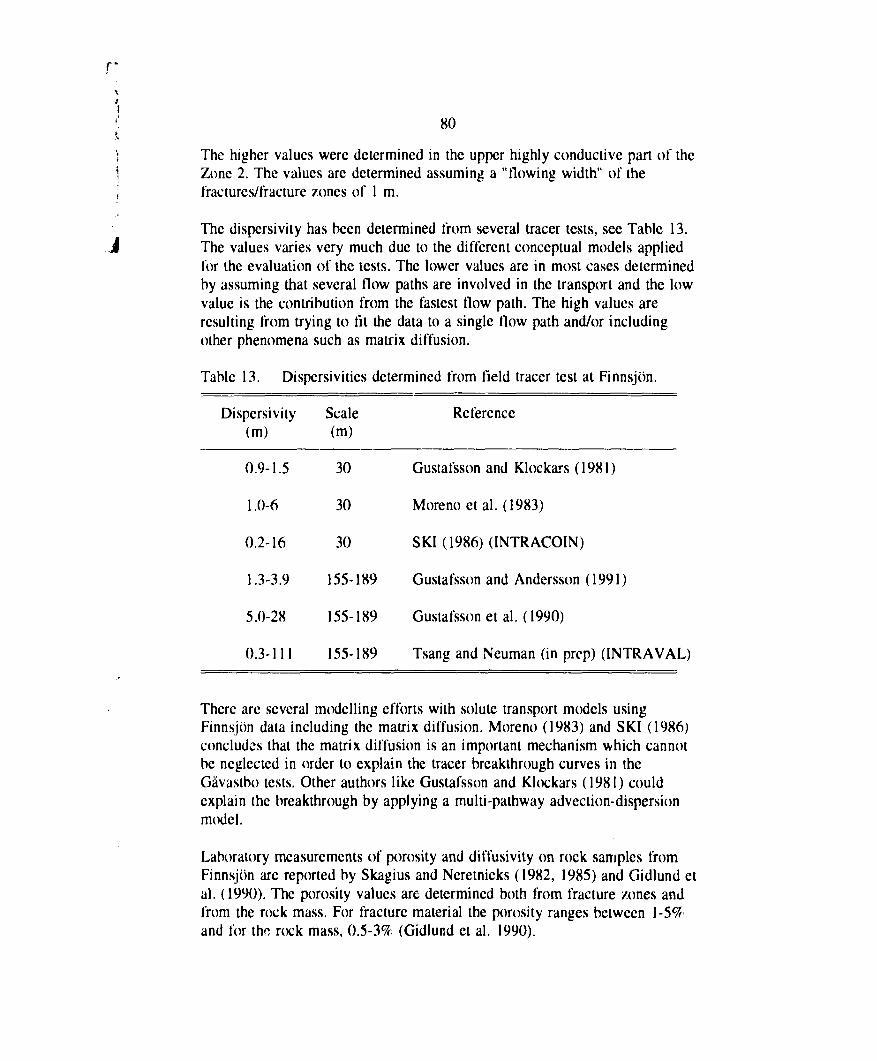
'! 80K
) The higher values were determined in the upper highly conductive part of the\ Zone 2. The values are determined assuming a "flowing width" of the', fractures/fracture zones of 1 m.
The dispersivity has been determined from several tracer tests, see Table 13.i The values varies very much due to the different conceptual models applied
for the evaluation of the tests. The lower values are in most cases determinedby assuming that several flow paths are involved in the transport and the lowvalue is the contribution from the fastest flow path. The high values areresulting from trying to fit the data to a single flow path and/or includingother phenomena such as matrix diffusion.
Table 13. Dispcrsivities determined from field tracer test at Finnsjön.
Dispersivity Scale Reference
(m) (m)
0.9-1.5 30 Gustafsson and Klockars (1981)
1.0-6 30 Moreno et al. (1983)
0.2-16 30 SKI (1986) (INTRACOIN)
1.3-3.9 155-189 Gustafsson and Andersson (1991)
5.0-28 155-189 Gustafsson et al. (1990)
0.3-111 155-189 Tsang and Neuman (in prep) (INTRAVAL)
There are several modelling efforts with solute transport models usingFinnsjön data including the matrix diffusion. Moreno (1983) and SKI (1986)concludes that the matrix diffusion is an important mechanism which cannotbe neglected in order to explain the tracer breakthrough curves in theGävastbo tests. Other authors like Gustafsson and Klockars (1981) couldexplain the breakthrough by applying a multi-pathway advection-dispersionmodel.
Laboratory measurements of porosity and diffusivity on rock samples fromFinnsjön are reported by Skagius and Neretnieks (1982, 1985) and Gidlund etal. (1990). The porosity values are determined both from fracture zones andfrom the rock mass. For fracture material the porosity ranges between 1-5%and for th« rock mass, 0.5-3% (Gidlur.d et al. 1990).
81
The retardation of solutes due to sorption has also been studied at Finnsjön.Gustafsson and Klockars (1984) performed a converging tracer test with thesorbing tracers Strontium and Cesium. The Strontium run was also used inthe INTRACOIN study. Andersson et al., (1990; used a large number ofdifferent tracers in a dipole flow geometry in the upper part of Zone 2.Sorbing tracers like Tc-99, Co-58, Rb-86, Na-24, and Tl-201 were used butonly Na-24 could be detected whereas the others were completely sorbed.Besides the tracer test, some laboratory determinations of distributioncoefficients (Kd) for Strontium and Cesium on Finnsjön granite, or fractureinfillings from Finnsjön, have been made by Skagius et al. (1981),Torstenfeldt et al. (1981), and Landström et al. (1983).
Deterministic groundwater flow modelling
The modelling concepts used for modelling the trace; tests at Finnsjön,briefly described in Section 8.1, are mainly concerned with the determinationof transport properties of either individual fractures or fracture zones butnone of these approaches considers the transport from a hypotheticalrepository to the surface. However, in the SKB-91 study the 3D finiteclement code NAMMU (Rae and Robinson, 1979) was used to model thegroundwater system. Lindbom and Boghammar, (1992a) describes a model ofthe groundwater system in which both a three-dimensional flow field andgroundwater travel times from a repository at 600 m depth are shown.Parameter variations and boundary conditions for eight different cases arepresented, c.f. Chapter 6.
The main objective of performing the deterministic modelling was to use themodel results as boundary conditions for the stochastic continuum modellingperformed a* a part of the SKB 91 study (SKB, 1992), cf below.
Groundwater flux distributions in a horizontal cut at 600 m depth arepresented for eight variations. A median value for the Base Case amountedto about 0.001 m7m2/year, c.f. Chapter 6.
Travel times for particles released at eight different points at 600 m depth aregiven. The travel times ranges between 40-2400 years. The shortest traveltimes arc determined for the case with a fracture zone below the repositoryand without the presence of Zone 2, i.e an entirely generic case. Considerablereduction of travel times was also achieved for the case with an increasedconductivity contrast between rock mass and fracture zones.
The discharge point for all particles was the Imundbo zone, which is aregional lineament with hydraulic properties assumed to be similar to Zone 5.
82
v. One variation assigning rock mass properties to the Imundbo zone (i.e. no1 fracture zone) showed only minor differences regarding flow and transport.
Lindbom and Boghammar (1992b) performed six calculations in order tocheck the model sensitivity of an altered regional gradient by imposing a
J regional gradient along the top surface of the model. The resulting traveltimes showed no substantial difference compared to the Base Case whereasthe flow paths were considerably different for some of the variations. Thereason for this was that the imposed gradient changed the direction of thelocal natural gradient.
Stochastic groundwater flow modelling
For the SKB 91 study, the main part of the modelling work was focused onconditional stochastic simulation of the flow conditions in the Finnsjön block.The computer program HYDRASTAR was used for the stochasticsimulations of the groundwater head and flow field at Finnsjön, c.f. Chapter6. In addition, particle tracking was performed in 500 realizations for thebase case and in 50 realizations for 16 variations of the base case. Traveltimes were calculated using a fixed value for the flow porosity of 0.0001.
The results from the HYDRASTAR simulations are presented as head andconductivity fields in three different vertical cross-sections and one horizontalsection at 600 m depth (repository level). Due to the large number ofrealizations, only a few have been presented in the report. The groundwatertravel times and Darcy fluxes from the different realizations have also beenanalyzed statistically and are presented in histograms.
The distribution of travel times shows that nearly half of the travel times arelonger than 10 000 years and that the other half is centered around 100 years.The statistical analysis of the travel times shows that they are very dependenton the location of the release point within the repository.
The variations made include; altering of repository depth (± 100m), alteringof repository position (closer to major fracture zones), changed repositorylayout, altered conductivity contrast, and exclusion and introduction of zones.Also, combination of the variations have been made so that totally 16different cases have been considered.
In summary, the variations shows that:
a reduction of the rock mass conductivity alters the flow pattern sothat Zones 4 and 5 becomes more important. Travel times are notincreased,
83
the influence of increasing the conductivity of the steeply dippingfracture zones is small,
the exclusion of Zone 2 has very little effect on flow paths and traveltimes due to the fact that the flow is downward-directed from Zone 2,
the introduction of a low angle fracture zone beneath the repositorygives much shorter travel times.
In addition to the particle tracking, transport modelling has been performedboth for the near field and the far field. The near field modelling includes theradionuclide transport through the engineered barriers and will not be treatedin this report. The far field modelling is performed by studying the transportin stream tubes by means of the far field model FARF31 (Norman andKjellbert, 1990). The transport equation is solved for 88 different streamiubesemerging from the repository. The processes included in the model areadvection, dispersion, matrix diffusion, matrix sorption, and chain decay. Themost important input parameters for the model are the travel time (obtainedfrom particle tracking with HYDRASTAR), the Peclet Number (dispersion),the matrix sorption coefficients for the different elements (Kd), and thespecific surface area per unit volume of rock (or water) that is available forsorption and diffusion into the rock matrix.
The input data for the model are based on both field and laboratoryexperiments, not only at the Finnsjön site, but also from Stripa and othersites. The input data are discussed by Elert et al. (1992).
The results of the transport calculations are presented as histograms anddiagrams of maximum doses and doses as a function of time for the long-lived fission products. A few variations of the input data are also presented.The combined results from the near field and far field transport modellingshowed that only the long-lived nuclides carbon-14, iodine-129, cesium-135,radium-226, and protactinium-231 can escape from the near field and that thedoses are more than a factor 1000 lower than the individual dose limitsuggested by the authorities.
Other calculations
As earlier described a number of different transport models have beenapplied to some of the tracer tests performed at Finnsjön. Most of the modelshave been applied in order to determine transport parameters or trying todistinguish between different transport phenomena. However, Andersson etal. (1989) presents simulations of both flow and transport in a horizontalplane of Zone 2 using the SUTRA-code. The model was used to simulate the
84
interference tests and to predict the tracer breakthrough in the radiallyconverging tracer test by Gustafsson et al. (1990). Parameter sensitivityanalysis showed that the model was rather insensitive to changes in thetransmissivity values whereas the choice of boundaries is important. Themodel managed to simulate the more distant pressure responses very well butthe near-field responses could not be fitted so well. This shows theanisotropic nature of the zone but also that the zone may be treated as aporous media in scales exceeding 500 m. The anisotropy or ratherheterogeneity of the zone was also demonstrated by the large scale tracertests (Gustafsson et al., 1990; Andersson et al., 1990). No transportcalculations were made under natural gradient conditions and very fewvariations of boundary conditions.
The transport within Zone 2 has also been studied by several teams in theINTRAVAL study (NEA/SKI, 1990). The approaches are all directed towardsexplaining the pure solute transport using different conceptual models. Theconcepts used include a porous medium model, a channel model, a variablechannel aperture model, and a fracture network model. All of these modelsseem to be able to reproduce the tracer breakthrough during these artificialconditions. However, no attempts have been made to predict the transportunder natural conditions.
A specific feature of the Finnsjön site is the presence of saline water.Ahlbom and Svensson (1991) presents a simple steady-state model whichmay explain the presence of saline water in the northern Finnsjön block andalso the lack of saline water in the southern block. According to the model,the main reason for the presence of saline water is the clay cover to the eastof the Finnsjön Rock Block. However, the model is built upon some non-tested assumptions and rough estimates. There is currently no field dataavailable to validate the model. Ahlbom and Svensson (1991) also presentsanother conceptual model where the presence of saline water can beexplained by thw presence of Zone 2. They also examines the impact ofsaline water on travel times and flow distribution using the PHOENICS code.Travel times were found to be considerably increased due to the presence ofsaline water below Zone 2, from 450 to 13 500 years (average values).
8.3 Discussion
Comparison of field data to modelled results
The transport modelling performed for the SKB 91 study included bothdeterministic and stochastic approaches. However, both approaches are basedon the same conceptual model of the Finnsjön area and there are largeuncertainties regarding connectivity and transmissivity of the fracture zones.
85
Only 8 of the total 14 interpreted fracture zones has been investigated withboreholes and of the 11 regional zones only 2 have been investigated. This isalso one of the reasons for a stochastic modelling approach for Finnsjön.
It is also difficult to compare the modelling results with experimental resultsregarding flow and transport in the Finnsjön Rock Block due to the fact thatmost of the modelling efforts have been made neglecting the presence ofsaline water. However, the calculations including saline water with thePHOENICS code (Ahlbom and Svensson, 1991) shows that the presence ofsaline water changes the flow pattern and travel times drastically. Flowdirection and magnitude are then consistent with the conceptual modelpresented by Gustafsson and Andersson (1991), i.e. a very slow transport ofsaline water upwards to Zone 2. The exclusion of saline water leads to atransport that is governed by the topographical gradient, which means that thearea where Zone 2 is located is a recharge area and water moves downwardsbelow the zone and discharges in the Imundbo zone, which is the case for thedeterministic modelling (Lindbom and Boghammar, 1992a, b) and thestochastic modelling (SKB 91, 1992).
Implications of existing information for solute transport
The modelled groundwater system is the primary basis for this evaluation ofsolute transport. In detail, little is actually known about transport paths ortravel times from a repository at 600 m depth. Under the conditions studied,travel times for conservative solutes arc predicted within large ranges, fromas little as ten to as much as a ten thousands of years. Travel times and pathsare found to be most dependent on the existence of conductive fracturezones, especially low angle fracture zones below the repository, but only afew tests varying structure and connectivity was carried out.
Boundary conditions are equally important to the transport predicted by themodel analysis. It was shown that the use of major fracture zones asboundaries may lead to errors, especially when pressure distributions aretransferred from regional scale to local scale. In fact, it is entirely possibleand even likely that the 600 m depth is within the realm of a deep regionalgroundwater system. The groundwater flow and transport through therepository may have little, if anything, to do with the water-table topographywithin the site area. Flows at depth may be driven by a more regional water-table gradient. The direction and magnitude of the gradient becomes veryimportant in a flat topography aiea like Finnsjön. A reduction of the gradientwith 50% was shown to alter flow paths and travel times considerably.
Considerations towards improving the transport predictions of the Finnsjönsite model must begin with improvements in the conceptual model of the
86
groundwater system. Of particular importance is a clarification of flowregimes in the deeper regions of the site wherein a renository would besituated. Boundary conditions appropriate to the sur.. ial groundwater maynot simply be projected downward to apply to ds xr systems. Such anassumption, even when inappropriate, is decir ' jr the groundwater flowand transport that occurs at depth, and esscn.-iily overrides otherconsiderations such as conductivity distil-..tion. Further, information onconductive structures which control f\ •. and transport that depends onstructures which strike the ground • ^ace is not likely sufficient to describethe connectivity at depth which •«• s depend also on possible but not yetidentified additional low-ang' ..ones that do no outcrop.
87
9. ROCK MECHANICAL CONDITIONS
Compared to other study sites there has been quite an extensive programmeof rock mechanical studies at Finnsjön. These studies includes mechanicaltests on rock samples, borehole stress measurements, response of Zone 2 tovarious loadings and mechanical modelling of bedrock response to glaciation.
9.1 Mechanical properties of the rock
Uniaxial compression tests and brazilian tests have been made on twelve coresamples from borehole KFI01 to determine mechanical properties (Swan,1977). All samples were granodiorite. Samples were taken from 50 m, 200 mand 400 m depth.
Uniaxial compression tests
The uniaxial compression tests gave a uniaxial compressive strength of 240.6± 15.2 MPa, a static Young's modulus of 82.5 ± 3.2 GPa and a staticPoisson's ratio of 0.20 ± 0.02. No difference could be found between thedifferent depths. The reported results of the Young's modulus and Poisson'sratio were evaluated from secants drawn from the origin to intersect theload-deformation curves at points that correspond to 50% of the failure loadof the specimens.
Brazilian disc tests
The brazilian disc tests gave a tensile strength of 13.5 ±+ 1.9 MPa. Theresults did not show any differences with depth.
9.2 Rock stress measurements
Rock stress measurements were conducted in the vertical borehole KFI06(Bjarnasor. and Stephansson, 1988). Successful measurements were conductedat 14 test sections, from 80 m depth down to a maximum depth of 500 m.Due to casing no measurements could be conducted above 56 m depth. Theresults are presented in Figure 40. The location of Fracture Zone 2 isindicated in the figure. The results show moderate rock stresses with noextreme values. At 80 m depth, the minimum horizontal stress is around 4.5MPa and at 500 m depth 14.5 MPa.
The magnitude of the minimum horizontal stress is larger than the theoreticalvertical stress for the entire measurement interval. Hence, the stress situationfor the upper 500 m of the crust represents thrust fault conditions. The
88
minimum horizontal stress increase with depth at a rate slightly less than thatof the theoretical vertical stress. This indicates, based on the assumption oflinear stress increase, that strike-slip conditions will begin to prevail at 700 -800 m depth.
The magnitude of the maximum horizontal stress shows a steady increasewith depth. The maximum horizontal stress is around 6 MPa at 80 m depthand 23 MPa at 500 m depth. However, there is a large scatter in magnitudesbetween 400-500 m depth, as can be seen Figure 40.
The ratio of the maximum to the minimum horizontal stress increases fromapproximately 1.1 at 100 m depth to 1.5 at 500 m depth. Single horizontalfractures were recorded in three test sections. The recorded shut-in pressures,Figure 40, were almost identical to the theoretical vertical stress (rgz).
The results in Figure 40 do not show any evidence for significant stressanomalies as Zone 2 is passed. Due to intense fracturing, data from withinthe zone is restricted to one measuring point. Also this point did not showany significant stress anomaly.
The maximum horizontal stress is oriented N48 W, with a standard deviationof ±10°. This is based on a total of 16 reliable imprints of initiated hydro-fractures. No rotation with depth is observed.
9.3 Deformational characteristics of Zone 2
The dclbrmational characteristics of Zone 2 were estimated as a part of theFracture Zone Project (Lcijon and Ljunggren, 1992). Three methods wereused to estimate the deformation modulus of the zone; (i) RQD, (ii) theQ-systcm and (iii) the JRC and JCS. For all methods, information fromborehole KFI06 were used. For the complete zone (between 200 m - 300 mdepth in the borehole) the analyses indicate a deformation modulus of no lessthan 25 GPa (309? of Young's modulus).
9.4 Distinct element modelling of the rock mass response to glaciation
The rock mass response to glaciation, deglaciation, isostatic movements andwater pressure from an ice lake have been simulated for a cross section ofthe Finnsjön study site (Rosengren & Stephansson, 1990). A total of sixmodels have been simulated. Four of the models use a boundary conditionwith boundary elements at the bottom and sides of the model. Rollerboundaries were applied to two models.
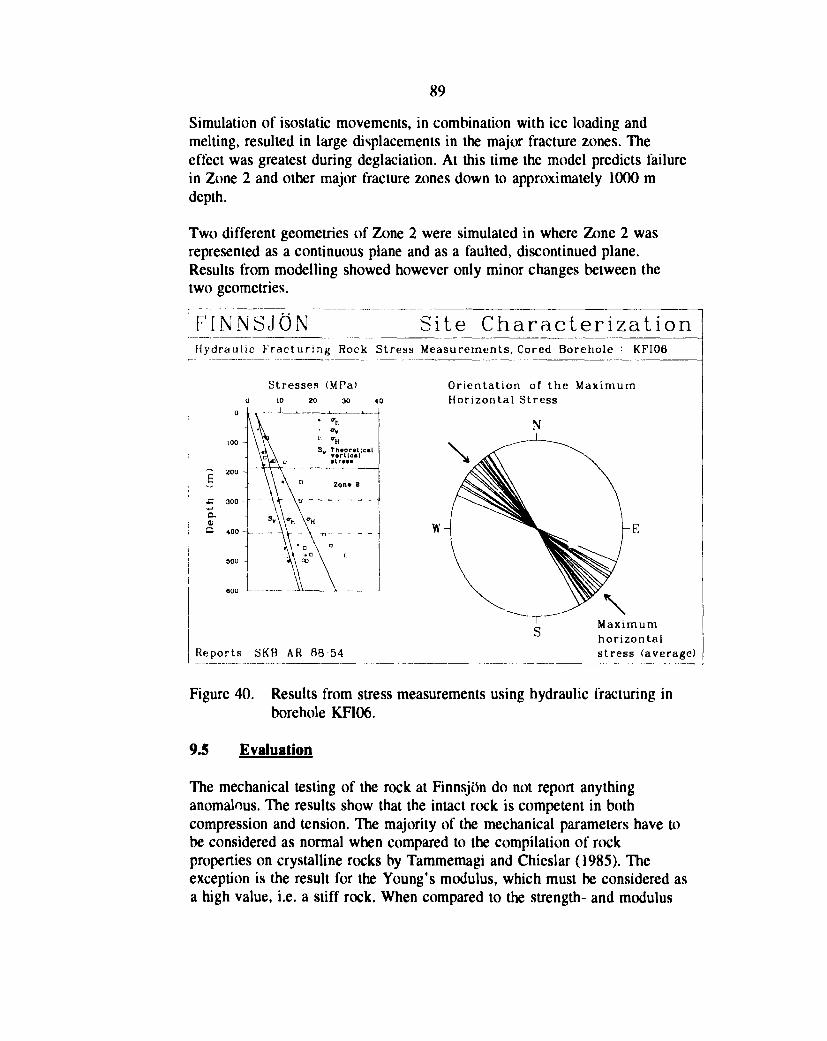
89
Simulation of isostatic movements, in combination with ice loading andmelting, resulted in large displacements in the major fracture zones. Theeffect was greatest during deglaciation. At this time the model predicts failurein Zone 2 and other major fracture zones down to approximately 1000 mdepth.
Two different geometries of Zone 2 were simulated in where Zone 2 wasrepresented as a continuous plane and as a faulted, discontinued plane.Results from modelling showed however only minor changes between thetwo geometries.
FINNSJÖN Site CharacterizationHydraulic Fracturing Rock Stress Measurements, Cored Borehole : KFI06
Stresses (MPa)
exQ
Orientation of the MaximumHorizontal Stress
\
400 -
\
Reports SKB AR B8-54
Maximumhorizontalstress (average)
Figure 40. Results from stress measurements using hydraulic fracturing inborehole KFI06.
9.5 Evaluation
The mechanical testing of the rock at Finnsjön do not report anythinganomalous. The results show that the intact rock is competent in bothcompression and tension. The majority of the mechanical parameters have tobe considered as normal when compared to the compilation of rockproperties on crystalline rocks by Tammemagi and Chieslar (1985). Theexception is the result for the Young's modulus, which must be considered asa high value, i.e. a stiff rock. When compared to the strength- and modulus
90
ratio classification by Deere and Miller (1966) an average quality designationis obtained for the Finnsjön granodiorite.
The rock stresses are moderate and the difference in magnitude between themaximum and minimum horizontal stress is normal for Sweden. The standarddeviation on the orientation is fully acceptable and can be considered asnormal for hydrofracturing measurements. The orientation of the maximumhorizontal stress coincide with the NW-SE trend found in Sweden, (Miiller atal., 1991, Stephansson and Ljunggren, 1988). Between depths 400 m - 500 mthree single horizontal fractures were recorded. The shut-in pressures fromthese are almost identical to the theoretical vertical stress. Thus, at that depth,the assumption of the vertical stress being controlled by the overburdenpressure, is valid.
The rock mechanics study of Zone 2 indicate a deformation modulus of noless than 25 GPa for the complete zone. For the poorest parts of the zone adeformation modulus of 10 GPa is indicated. Despite the high fracturefrequency of the zone, the rock mass deformation modulus is on the order of309? of Young's modulus. Such a value do not in any way contradict theexisting bank of large-scale field data, as obtained from various case studies,(Bieniawski (1978), Heuze (1980)).
The risk of spalling, or rock bursts have been estimated by use of theempirical relationships by Hoek & Brown (1980) and Russenes (1974).Taking into account the stress state at Finnsjön and the uniaxial compressivestrength of the granodiorite no spalling should occur above 400 m depth.Between 400 m - 500 m depth minor spalling may occur. The brittleness ofthe rock has not been considered.
No low quality mechanical parameter has been discovered for the intact rock,and taking into account the stress state, the rock shouldn't create any stabilityproblems in the construction of a repository at 600 m depth.
91
REFERENCES
In the figures and tables of this report most references are only noted by theSKB report series number (e.g. TR 83-45 or AR 83-36). Because of this, thereference list catalogues references both according to their SKB reportnumber and according to the authors.
Technical Reports (TR)
TR 48 Swan G., 1977: The mechanical properties of the rocks at Stripa,Kråkemåla, Finnsjön, and Blekinge.
TR 60 Klockars C-E och Persson O., 1978: Berggrundvatten-förhållanden i Finnsjöområdets nordöstra del.
TR 60 Scherman S., 1978: Förarbeten för platsval, berggrunds-undersökningar.
TR 61 Hult A., Gidlund G. och Thoregren U., 1978: Permeabilitets-bestämningar.
TR 79-02 Almén K-E., Ekman L. och Olkiewicz A., 1978: Försöksområdetvid Finnsjön. Beskrivning till berggrunds- och jordartskartor.
TR 79-05 Olkiewicz A., Scherman S. och Kornfält K-A., 1979:Kompletterande berggrundsundersökningar inom Finnsjö- ochKarlshamnsområdena.
TR 80-10 Carlsson L., Gentzschein B., Gidlund G., Hansson K., SvenssonT. och Thoregren U., 1980: Kompletterande permeabiIi tets-mätningar i Finnsjöområdet.
TR 81-07 Gustafsson E. and Klockars C-E., 1981: Studies on groundwatertransport in fractured crystalline rock under controlled conditionsusing non-radioactive tracers.
TR 82-12 Skagius K. and Neretnieks I., 1982: Diffusion in crystallinerocks of some sorbing and non-sorbing species.
TR 82-20 Tullborg E-L. and Larson S-Å., 1982: Fissure fillings fromFinnsjön and Studsvik, Sweden. Identification, chemistry anddating.
92
TR 82-26 Torstenrelt B., Ittner T., Allard B., Andersson K. and OlofssonU., 1982: Mobilities of radionuclides in fresh and fracturedcrystalline rock.
TR 82-23 Laurent S., 1982. Analysis from Groundwater from DeepBoreholes in Kråkemåla, Sternö och Finnsjön.
TR 83-18 Landström O., Klockars C-E., Persson O., Torstenfeldt B.,Allard B., Tullborg EL. and Larson S-Å., 1983: Migrationexperiments in Studsvik.
TR 83-38 Moreno L., Neretnieks I. and Klockars C-E., 1983: Evaluation ofsome tracer tests in granitic rock at Finnsjön.
TR 83-40 Wikberg P., Grenthc I. and Axelsen K., 1983: Redox conditionsin groundwaters from Svartboberget, Gideå, Fjällveden andKamlunge.
TR 83-45 Carlsson L., Winberg A. and Grundfelt B., 1983: Modelcalculations of the groundwater flow at Finnsjön, Fjällveden,Gideå and Kamlunge.
TR 83-56 Carlsson L. and Gidlund G., 1983: Evaluation of thehydrogeological conditions at Finnsjön.
TR 83-59 Allard B., Larsson S.Å., Tullborg E-L. and Wikberg P., 1983:Chemistry of Deep Groundwaters from Granitic Bedrock.
TR 84-07 Gustafsson E. and Klockars C-E., 1984: Study of strontium andcesium migration in fractured crystalline rock.
TR 84-09 Magnusson K-Å. and Duran O., 1984: Comparative study ofgeological, hydrological and geophysical borehole investigations.
TR 85-03 Skagius K. and Neretnieks I., 1985: Porosities and diffusivitiesof some non-sorbing species in crystalline rocks.
TR 85-11 Smellie J., Larsson N-Å., Wikberg P. and Carlsson L., 1985:Hydrochemical investigations in crystalline bedrock in relationto existing hydraulic conditions: Experience from the SKb test-sites in Sweden.
TR 86-03 Nordstrom D.K. and Puigdomencch I., 1986: Redox Chemistryof Deep Groundwaters in Sweden.
93
TR 86-05 Ahlbom K.. Andersson P., Ekman L., Gustafsson E., Smellic J.and Tullborg E-L., 1986: Preliminary investigations of fracturezones in the Brändan Area, Finnsjön study site.
TR 86-16 Almén K., Andersson O., Fridh B., Johansson BE., SchlstedtM., Gustafsson E., Hansson K.. Olsson O., Nilsson G., AxelsenK. and Wikberg P., 1986: Site investigation. Equipment forgeological, geophysical, hydrogeological and hydrochemica)characterization.
TR 87-07 Wikberg P., Axelsen K. and Fredlund F., 1987: DeepGroundwatcr Chemistry.
TR 87-13 Dahl-Jensen T. and Lindgren J., 1987: Shallow reflectionseismic investigation of fracture zones in the Finnsjö area,method evaluation.
TR 87-15 Puigdomenech I. and Nordstrom K,. 1987: Geochemicalinterpretation of Groundwaters from Finnsjön, Sweden.
TR 88-02 Ittner T., Torstenfeldt B. and Allard B., 1988: Migration of thefission products strontium, technetium, iodine, cesium and theactinides neptunium, plutonium, americium in granitic rock.
TR 89-12 Andersson J-E., Ekman L., Gustafsson E., Nordqvist R. andTirén S., 1989: Hydraulic interference tests and tracer testswithin the Brändan area, Finnsjön study site. The Fracture ZoneProject Phase 3.
TR 89-19 Ahlbom K. and Smellie J.A.T. (eds), 1989: Characterization offracture zone 2, Finnsjön study site.
TR 89-19 Tirén S.A., 1989: Geological setting and deformation history ofa low angle fracture zone at Finnsjön, Sweden. In;Characterization of fracture zone 2, Finnsjön study site. Part 5.Ahlbom K. and Smcllie J.A.T. (Eds).
TR 89-19 Smellie J. and Wikberg P., 1989: Hydrochcmical investigationsat Finnsjön, Sweden. In; Characterization of fracture zone 2,Finnsjön study site. Part 5. Ahlbom K. and Smellie J.A.T. (Eds).
TR 90-01 Norman S, Kjellbert N 1990. FARF31 - A far field radionuclidcmigration code for use with the PROPER package.
94
TR 91-08 Ahlbom K. and Tirén S., 1991: Overview of geologic andhydrogeologic character of the Finnsjön site and itssurroundings.
TR 91-09 Ittner T., 1991: Long term sampling and measuring program.Joint report for 1987,1988 and 1989. Within the project: Falloutstudies in the Gideå and Finnsjö areas after the Chernobylaccident in 1986.
TR 91-12 Lindbom B., Boghammar A., Lindberg H. and Bjelkås J., 1991:Numerical groundwater flow calculations at the Finnsjön site.
TR 91-13 Geier J.E. and Axelsson C-L., 1991: Discrete fracture modellingof the Finnsjön rock mass. Phase 1: Feasibility study.
TR 91-24 Andersson J-E., Nordqvist R., Nyberg G., Smellie J. and TirénS., 1991: Hydrogeological Conditions in the Finnsjö Area.Compilation of Data and Conceptual model.
TR 91-42 Yung-Bing Bao. and Thunvik R., 1991: Sensitivity analysis ofthe groundwater flow at the Finnsjön study site.
TR 91-54 Axelsson C-L., Byström J., Eriksson Å., Holmen J. and Hait-jema H.M., 1991: Hydraulic evaluation of the groundwater con-ditions at Finnsjön. The effects on dilution in a domestic well.
TR 91-57 Ahlbom K. and Svensson U., 1991: The groundwater circulationin the Finnsjön area - the impact of density gradients.
TR 91-58 Lindbom B. and Boghammar A., 1991b: Exploratorycalculations concerning the influence of glaciation andpermafrost on the groundwater flow system and an initial studyof permafrost influence at the Finnsjön site - an SKB 91 study.
TR 92-03 Lindbom B. and Boghammar A., 1992a: Numerical groundwaterflow calculations at the Finnsjön site - extended regional area.
TR 92-07 Geier J.E., Axelsson C-L., Hässler L. and Benabderrahmane A.,1992: Discrete fracture modelling of the Finnsjön rock mass:Phase 2.
TR 92-08 Norman S., 1992: Statistical inference and comparison ofstochastic models for the hydraulic conductivity at the Finnsjönsite.
95
TR 92-09 Elert M., Neretnieks I., Kjellbert N. and Ström A., 1992:Description of the transport mechanisms and pathways in the farfield of a KBS-3 type repository.
TR 92-11 Lindbom B. and Boghammar A., 1992b: Numerical groundwaterflow calculations at the Finnsjön site - the influence of theregional gradient.
TR 92-20 SKB 91, 1992: Final disposal of spent nuclear fuel. Importanceof the bedrock for safety.
Progress Reports (AR - arbetsrapporter)
AR 80-08 Larsson N-Å. och Svensson T., 1980: Nederbördsdata frånFinnsjöns undersökningsområde.
AR 80-10 Jacobsson J-Å. och Larsson N-Å., 1980: Hydrologiskytkartering av Finnsjöns undersökningsområde.
AR 80-13 Olkiewicz A. och Arn^fors J., 1980: Berggrundsbeskriving avFinnsjöns undersökningsområde.
AR 81-22 Svensson T., 1981: Hydrobotanisk kartering av Finnsjönsundersökningsområde - jämförelse mellan flygbildstolkad ochmarkkarterad vegetation.
AR 81-34 Olkiewicz A., 1981: Lineament, sprickzoner och sprickor inomnorra Uppland med speciell betoning på undersökningsområdetvid Finnsjön.
AR 81-35 Olkiewicz A. och Arnefors J., 1981: Berggrundsbeskriving avundersökningsområdet vid Finnsjön i norra Uppland.
AR 82-37 Jämtlid A. och Tullborg E-L., 1982: Motståndsmätning påborrkärneprover från Finnsjön.
AR 84-14 Stenberg L. and Olsson O., 1984: The tube wave method foridentifying permeable fracture zones intersecting a borehole.
AR 84-16 Öqvist U. and Jämtlid A., 1984: Geofysiska parametermätningarpå borrkärneprov från Finnsjön, Sternö och Stripa.
AR 84-19 Duran O., 1984: Borehole "in situ" measurements of Eh, pH,pS2 and temperature.
96
AR 85-03 Persson KL., 1985: Borrhålsdata från Svartboberget, Gideå,Fjällveden, Finnsjön, Taavinunannen, Kråkemåla, Karlshamn,Finnsjön, Forsmark och Ävrö.
AR 86-16 Tirén S.A., 1986: Fractures and fracture zones.
AR 86-21 Gustavsson E., 1986: Determination of groundwater flow using apoint dilution technique.
AR 87-02 Holmqvist C, 1987: Undersökning av mikrojordbävningar vidFinnsjön, Uppland.
AR 87-06 Ahlbom K., Melkersson K. and Stråhle A., 1985: Fracture ZoneProject: Core logging and technical data for borehole Fi 5, Fi 6,Fi 9 and Fi 10.
AR 87-27 Stenberg ., 1987a: Detailed investigations of fracture zones inthe Brändan area, Finnsjön study site. Investigations with thetubewave method in boreholes Fi 6 and BFi 1.
AR 87-31 Smellie J., Gustafsson E. and Wikberg P., 1987: Groundwatersampling during and subsequent to air-flush roiary drilling:Hydrochemical investigations at depth in fractured crystallinerock.
AR 87-32 Linden A., Mellander H.. Åkerblom G. och Jönsson G., 1978:Koncentrationer av radon, metan och helium över en sprickzon iFinnsjönområdet.
AR 88-08 Andersson J-E., Ekman L. and Winberg A., 1988: Detailedinvestigations of fracture zones in the Brändan area, Finnsjönstudy site. Single-hole water injection tests in detailed sections.
AR 88-09 Ahlbom K., Andersson P., Ekman L. and Tirén S., 1988:Characterization of fracture zones in the Brändan area, Finnsjönstudy site, central Sweden.
AR 88-11 Nordqvist R. and Andersson J-E., 1988: Transient Howsimulations in a fracture zone in the Brändan area, Finnsjön.
AR 88-54 Bjarnason, B. and Stephansson O., 1988: Hydraulic fracturingstress measurements in borehole Fi-6 Finnsjön study site, centralSweden.
97
AR 89-08 Ahlbom K. and Tirén S., 1989: Overview of geologic andhydrogeologic character of the Finnsjön site and itssurroundings.
AR 89-09 Ekman L., 1989: Sammanställning av geovetenskapliga under-sökningar utförda inom Finnsjöområdet under tiden 1977-1988.
AR 89-21 Ekman L., Andersson J-E., Andersson P., Carlsten S., ErikssonC-O., Gustafsson E., Hansson K. and Stenberg L., 1988:Documentation of borehole BFI02 within the Brändan area,Finnsjön study site.
AR 89-24 Andersson J-E., Nordqvist R., Nyberg G., Smellie J.A.T. andTirén S., 1989: Hydrogeological conditions in the Finnsjön area- Compilation of data and conceptual model.
AR 90-02 Sehlstedt S., 1990: Status of geophysical tables in the SKBdatabase Geotab.
AR 90-24 Andersson P., Eriksson C-E., Gustafsson E., and Ittner T., 1990:Dipole tracer experiment in a low-angle fracture zone at theFinnsjön site, central Sweden. Experimental design andpreliminary results.
AR 90-27 Gustafsson E., Andersson P., Eriksson C-O., and Nordqvist R.,1990: Radially converging tracer experiment in a low anglefracture zone at the Finnsjön site, central Sweden. The FractureZone Project Phase 3.
AR 90-34 Gidlund J., Moreno M, and Neretnieks I., 1990: Porosity anddiffusivity measurements of samples from Finnsjön.
AR 91-19 Lindbom B. and Lindberg H., 1991: Variation analyses of thegroundwater flow calculations at the Finnsjön site.
AR 91-34 Lindbom B. and Boghammar A., 1991a: Numerical groundwaterflow calculations at the Finnsjön site - complementarycalculations.
AR 92-01 Jansson S., 1992: SKB 91 - Statistical analysis ofHYDRASTAR results. (A reference case with 500 realizations).
AR 92-09 Boghammar A., 1992: Memo regarding validation of fluxcalculation with HYDRASTAR - an SKB 91 study.
98
AR 92-27 SKB 91 Geohydrologiska beräkningar Variationsfall: Tätareberäkningsnät (Mindre block 24).
AR 92-28 SKB 91 Geohydrologiska beräkningarVariationsfall:Beräkningsskala 24 m (Skala 24).
AR 92-29 SKB 91 Geohydrologiska beräkningar Variationsfall: Statistiskmodell utan trend (Ingen trend).
AR 92-30 SKB 91 Geohydrologiska beräkningar Variationsfall:Beräkningsskala 48 m (Skala 48 m).
AR 92-31 SKB 91 Geohydrologiska beräkningar Variationsfall: Minskatmodellområde för HYDRASTAR-simulering.
AR 92-32 SKB 91 Geohydrologiska beräkningar Variationsfall: Statistiskanisotropi (Anisotrop).
AR 92-33 SKB 91 Geohydrologiska beräkningar Variationsfall:Referensfallet.
References by the authors
The references presented below are all referred to in the present report. Theuse of Finnsjön as a test site for almost 15 years have resulted in someadditional progress reports not referred to here. A complete list of allactivities/reports (in swed:sh) between the years 1977-1988 is presented inEkman (1989). Between 1989-1992 several compilation and evaluationstudies were made to provide data for the SKB 91 performance assessment.Most of these studies are referred to in the SKB 91 report (1992).
Ahlbom K., Andersson P., Ekman L, Gustafsson E., Smellie J. and TullborgE-L., 1986: Preliminary Investigations of Fracture Zones in theBrändan Area, Finnsjön Study Site. SKB Technical Report TR 86-05.
Ahlbom K., Andersson P., Ekman L. and Tirén S., 1988: Characterization offracture zones in the Brändan area, Finnsjön study site, centralSweden. SKB Progress report AR 88-09.
Ahlbom K., Melkersson K. and Stråhle A., 1985: Fracture Zone Project: Corelogging and technical data for borehole Fi 5, Fi 6, Fi 9 and Fi 10.SKB Progress Report AR 87-06.
99
Ahlbom K. and Tirén S., 1989: Overview of geologic and hydrogeologiccharacter of the Finnsjön site and its surroundings. SKB ProgressReport AR 89-08.
Ahlbom K. and Tirén S., 1991: Overview of geologic and hydrogeologiccharacter of the Finnsjön site and its surroundings. SKB Technicalreport TR 91-08.
Ahlbom K. and Smellie J.A.T. (eds), 1989: Characterization of fracture zone2, Finnsjön study site. SKB Technical Report TR 89-19.
Ahlbom K. and Smellie J.A.T. (eds), 1991: Characterization of fracture zone2, Finnsjön study site. J. of Hydrology, Special issue, Vol 126, Nos.1-2.
Ahlbom K. and Svensson U., 1991: The groundwater circulation in the Finnsjön area - the impact of density gradients. SKB Technical report TR91-57.
Aka-utredningen, 1976: Använt kärnbränsle och radioaktivt avfall.Betänkande av Aka-utredningen. SOU 1976:30.31 och 41.
Allard B., Larsson S.Å., Tullborg E-L. and Wikberg P., 1983: Chemistry ofDeep Groundwaters from Granitic Bedrock. SKBF/KBS Technicalreport TR 83-59.
Almén K-E., Ekman L. och Olkiewicz A., 1978: Försöksområdet vidFinnsjön. Beskrivning till berggrunds- och jordartskartor. SKBF/KBSTeknisk rapport 79-02.
Almén K., Andersson O., Fridh B., Johansson B-E., Sehlstedt M., GustafssonE., Hansson K., Olsson O., Nilsson G., Axelsen K. and Wikberg P.,1986: Site Investigation. Equipment for Geological, Geophysical,Hydrogeological and Hydrochemical Characterization. SKB Technicalreport TR 86-16.
Andersson J-E., Ekman L., Gustafsson E., Nordqvist R. and Tirén S., 1989:Hydraulic interference tests and tracer tests within the Brändan area,Finnsjön study site. The Fracture Zone Project Phase 3. SKBTechnical Report 89-12.
100
Andersson J-E.. Ekman L. and Winberg A.. 1988: Detailed investigations offracture zones in the Brandan area, Finnsjön study site. Single-holewater injection tests in detailed sections. SKB Progress Report AR 88-08.
Andersson J-E., Nordqvist R., Nyberg G., Smellie J.A.T. and Tirén S., 1989:Hydrogeological conditions in the Finnsjön area - Compilation of dataand conceptual model. SKB Progress report AR 89-24.
Andersson J-E., Nordqvist R., Nyberg G., Smellie J. and Tirén S., 1991:Hydrogeological Conditions in the Finnsjö Area. Compilation of Dataand Conceptual model. SKB Technical report TR 91-24.
Andersson P., Eriksson C-O., Gustafsson E. and Ittner T.T 1990: Dipole tracerexperiment in a low-angle fracture zone at the Finnsjön site, centralSweden, Experimental design and preliminary results. SKB ProgressReport AR 90-24.
Axelsson C-L., Byström J., Eriksson A., Holmen J. and Haitjcma H.M.,1991: Hydraulic evaluation of the groundwater conditions at Finnsjön.The effects on dilution in a domestic well. SKB Technical report TR91-54.
Bieniawski Z.T., 1978: Determining the rock mass deformability: Experiencefrom case histories. Int. J. Rock Mech. Min. Sci. & Geomech. Abstr.,Vol. 15, pp. 237-247.
Bjarnason B. and Stephansson O., 1988: Hydraulic fracturing stressmeasurements in borehole Fi-6 Finnsjön study site, central Sweden.SKB Progress report AR 88-54.
Boghammar A., 1992: Memo regarding validation of flux calculation withHYDRASTAR - an SKB 91 study. SKB Progress report AR 92-09.
Bäckblom G., 1989: Guide-lines for use of nomenclature on fractures,fracture /ones and other topics. SKB Tekniskt PM Nr 25-89-007.
Carlsson L, Gentzschein B., Gidlund G., Hansson K., Svennson T. ochThoregren U., 1980: Kompletterande permeabilitetsmätningar iFinnsjöområdet. SKBF/KBS Teknisk rapport TR 80-10.
Carlsson L. and Gidlund G., 1983: Evaluation of the hydrogeologicalconditions at Finnsjön. SKBF/KBS Technical report TR 83-56.
101
Carlsson L., Winberg A. and Grundfelt B., 1983: Model calculations of thegroundwater flow at Finnsjön, Fjällveden, Gideå and Kamlunge.SKBF/KBS Technical Report TR 83-45.
Deere D.U. and Miller R.P., 1966: Engineering classification and indexproperties for intact rock. Report No. AFWL-TR-65-116, Air ForceWeapons Laboratory, Kirtland Air Force Base, New Mexico.
Dahl-Jensen T. and Lindgren J., 1987: Shallow reflection seismicinvestigation of fracture zones in the Finnsjö area, method evaluation.SKB Technical report 87-13.
Duran O., 1984: Borehole "in situ" measurements of Eh, pH, pS2' andtemperature. SKBF/KBS Progress Report AR 84-19.
Ekman L., Andersson J-E., Andersson P., Carlsten S., Eriksson C-O.,Gustafsson E., Hansson K. and Stenberg L., 1988: Documentation ofborehole BFI02 within the Brändan area, Finnsjön study site. SKBProgress report AR 89-21.
Ekman L., 1989: Sammanställning av geovetenskapliga undersökningarutförda inom Finnsjöområdet under tiden 1977-1988. SKBArbetsrapport AR 89-09.
Elert M, Neretnieks I, Kjellbert N, Ström A 1992. Description of thetransport mechanisms and pathways in the far field of a KBS-3 typerepository. SKB Technical Report 92-09.
Eronen M., 1988: A scrutiny of the late Quaternary history of the Baltic Sea.Geological Survey of Finland. Special Paper 6, 11-18.
Geier J.E. and Axelsson C-L., 1991: Discrete fracture modelling of the Finnsjön rock mass. Phase 1: Feasibility study. SKB Technical report TR91-13.
Geier J.E., Axelsson C-L., Hässler L. and Benabderrahmane A., 1992:Discrete fracture modelling of the Finnsjön rock mass. Calculations atthe Finnsjön site - the influence of the regional gradient. SKBTechnical report TR 92-07.
Gidlund J., Moreno M., and Neretnieks I., 1990: Porosity and diffusivitymeasurements of samples from Finnsjön. SKB Progress Report 90-34.
102
Gustavsson E., 1986: Determination of groundwater flow using a pointdilution technique. SKB Progress Report AR 86-21.
Gustafsson E., and Klockars C-E., 1981: Studies on groundwater transport infractured crystalline rock under controlled conditions using non-radioactive tracers. SKB Technical Report 81-07.
Gustafsson E. and Klockars C-E., 1984: Study of strontium and cesiummigration in fractured crystalline rock. SKBF/KBS Technical Report84-07.
Gustafsson E., Andersson P., Eriksson C-O. and Nordqvist R., 1990: Radiallyconverging tracer experiment in a low angle fracture zone at theFinnsjön site, central Sweden. The Fracture Zone Project Phase 3.SKB Progress Report 90-27.
Gustafsson E. and Andersson P., 1991: Groundwater flow conditions in alow-angle fracture zone at Finnsjön, Sweden. J. of Hydrology, 126.
Gustafsson E., Andersson P., Eriksson C-O. and Nordqvist R.,(in prep.):Radially converging tracer experiment in a low-angle fracture zone atthe Finnsjön site, central Sweden. The Fracture Zone Project - Phase3. To be published as a SKB Technical report.
Heuze F.E., 1980: Scale effects in the determination of rock mass strengthand deformability. Rock Mechanics 12, pp. 167-192.
Hoek E. and Brown E.T., 1980: Underground Excavations in Rock.Instituteof Mining and Metallurgy, London.
Holmqvist C, 1987: Undersökning av mikrojordbävningar vid Finnsjön,Uppland. SKB Arbetsrapport AR 87-02.
Hult A., Gidlund G. och Thoregren U., 1978: Permeabilitetsbestämningar.SKBF/KBS Teknisk rapport TR 61.
Hultbcrg B., Larsson S-Å. and Tullborg E-L., 1981: Groundwater inCrystalline Rock - Chemical Composition and Isotopic Conditions inGroundwater From Finnsjön, Kråkemåla och Sternö. (In Swedish).SKBF/KBS Progress report AR 81-29.
103
Ittner T., Torstenfeldt B. and Allard B., 1988: Migration of the fissionproducts strontium, technetium, iodine, cesium and the actinidesneptunium, plutonium, americium in granitic rock. SKB Technicalreport 88-02.
Ittner T., 1991: Long term sampling and measuring program. Joint report for1987,1988 and 1989. Within the project: Fallout studies in the Gideåand Finnsjö areas after the Chernobyl accident in 1986. SKBTechnical report TR 91-09.
Jackobsson J-Å., 1980: Resultat av kompletterande jordartssonderingar iFinnsjöns undersökningsområde 1979. SGU arbetsrapport.
Jacobsson J-Å. och Larsson N-Å., 1980: Hydrologisk ytkartering avFinnsjöns undersökningsområde. SKBF/KBS Arbetsrapport 80-10.
Jansson S., 1992: SKB 91 - Statistical analysis of HYDRASTAR results. (Areference case with 500 realizations). SKB Progress report AR 92-01.
Jämtlid A., Magnusson K-Å. och Olsson O., 1982: Elektiskamellanhålsmätningar i Finnsjön. PRAV 4.23.
Jämtlid A. och Tullborg E-L., 1982: Motståndsmätning på borrkärneproverfrån Finnsjön. SKBF-KBS Arbetsrapport 82-37.
KBS-3: 1983. Final disposal of Spent Nuclear Fuel. Swedish Nuclear Fueland Waste Management Co. Stockholm.
Kloc kars C-E och Persson O., 1978: Berggrund vattenförhållanden iFinnsjöområdets nordöstra del. SKBF/KBS Teknisk rapport 60.
Laurent S., 1982: Analysis from Groundwater from Deep Boreholes inKråkemåla, Sternö och Finnsjön. SKBF/KBS Technical report TR 82-23.
Landström O., Klockars C-E., Persson O., Torstenfeldt B., Allard B.,Tullborg E-L. and Larson S-Å., 1983: Migration experiments inStudsvik. SKBF/KBS Technical Report 83-18.
Larsson N-Å. och Svensson T., 1980: Nederbördsdata från Finnsjönsundersökningsområde. SKBF/KBS Arbetsrapport 80-08.
104
Leijon B. and Ljunggren C, 1992: Rock mechanics study of fracture zone 2at the Finnsjön site. To be published in the SKB Technical Reportseries.
Lindbom B., Boghammar A., Lindberg H. and Bjelkås J., 1991: Numericalgroundwater flow calculations at the Finnsjön site. SKB Technicalreport TR 91-12.
Lindbom B. and Boghammar A., 1991a: Numerical groundwater flowcalculations at the Finnsjön site - complementary calculations. SKBProgress report AR 91-34.
Lindbom B. and Boghammar A., 1991b: Exploratory calculations concerningthe influence of glaciation and permafrost on the groundwater flowsystem and an initial study of permafrost influence at the Finnsjön site- an SKB 91 study. SKB Technical report TR 91-58.
Lindbom B. and Boghrmmar A., 1992a: Numerical groundwater flowcalculations at the Finnsjön site - extended regional area. SKBTechnical report TR 92-03.
Lindbom B. and Boghammar A., 1992b: Numerical groundwater flowcalculations at the Finnsjön site - the influence of the regionalgradient. SKB Technical report TR 92-11.
Lindbom B. and Lindberg H., 1991: Variation analyses of the groundwaterflow calculations at the Finnsjön site. SKB Progress report AR 91-19.
Linden A., Mellander H., Åkerblom G. och Jönsson G., 1978:Koncentrationer av radon, metan och helium över en sprickzon iFinnsjönområdet. SKB Arbetsrapport 87-32.
Ljunggren C. and Leijon B., 1991: A rock mechanics study of fracture zone2 at the Finnsjön study site. To be printed as a SKB Technical report.
Lundqvist T., 1979: The Precambrian of Sweden. Sveriges GeologiskaUndersökning, Serie C 768.
Lundqvist T., 1991: De prekambriska bildningarna (urberget). I LindströmM., Lundqvist J. and Lundqvist T., 1991: Sveriges geologi från urtidtill nutid. Studentlitteratur, Lund.
105
Magnusson K-Å. and Duran O., 1984: Comparative study of geological,hydrological and geophysical borehole investigations. SKB Technicalreport 84-09.
Moreno L., Neretnieks I. and Klockars C-E., 1983: Evaluation of some tracertests in granitic rock at Finnsjön. SKBF/KBS Technical Report 83-38.
Miiller B., Fuchs K., Mastin L., Gregersen S., Pavoni N., Stephansson O.,Ljunggren C. and Zoback M.L., 1991: Regional patterns of stress inEurope. J. Geophys. Res. (in press)
Munier R. and Tirén S.A., 1989: Geometry and kinetics of deformation zonesin the Finnsjön area, central Sweden: a deformation system controlledby five sets of shear zones. Thesis, Uppsala University, UUDMP. Res.Rep. 59.
NEA/SKI, 1990: The International INTRAVAL Project. Background andresults.
Nordqvist R. and Andersson J-E., 1988: Transient flow simulations in afracture zone in the Brändan area, Finnsjön. SKB Progress Report 88-11.
Nordstrom D.K. and Puigdomenech I., 1986: Redox Chemistry of DeepGroundwaters in Sweden. SKB Technical report TR 86-03.
Norman S. and Kjellbert N., 1990: FARF31 A far-field radionuclide migration code for use with the PROPER package. SKB Technical Report90-01.
Norman S., 1992: Statistical inference and comparison of stochastic modelsfor the hydraulic conductivity at the Finnsjön site. SKB TechnicalReport TR 92-08. Swedish Nuclear Fuel and Waste Management Co.,Stockholm.
Olkiewicz A., Scherman S. och Kornfält K-A., 1979: Kompletterandeberggrundsundersökningar inom Finnsjö- och Karlshamnsområdena.SKBF/KBS Teknisk rapport TR 79-05.
Olkiewicz A. och Arnefors J., 1980: Berggrundsbeskriving av Finnsjönsundersökningsområde. SKBF/KBS Arbetsrapport AR 80-13.
106
Olkiewicz A. och Arnefors J., 1981: Berggrundsbeskriving av undersökningsområdet vid Finnsjön i norra Uppland. SKBF/KBS Arbetsrapport AR81-35.
Olkiewicz A., 1981: Lineament, sprickzoner och sprickor inom norraUppland med speciell betoning på undersökningsområdet vid Finnsjön.SKBF/KBS Arbetsrapport AR 81-34.
Persson K-L., 1985: Borrhålsdata från Svartboberget, Gideå, Fjällveden,Kamlunge, Taavinunannen, Kråkemåla, Karlshamn, Finnsjön,Forsmark och Ävrö. SKBF/KBS Arbetsrapport AR 85-03.
Puigdomenech I. and Nordstrom K., 1987: Geochemical interpretation ofGroundwaters from Finnsjön, Sweden. SKB Technical report TR 87-15.
Rae J., and Robinson P.C., 1979: NAMMU: Finite-Element program forcoupled heat and groundwater flow problems. Report AERE R-9610.U.K. Atomic Energy Research Establishment, Harwell Laboratory.
Rosengren L. and Stephansson O., 1990: Distinct element modelling of therock mass response to glaciation at Finnsjön, Central Sweden. SKBTechnical report TR 90-40.
Russenes B., 1974: Bergslagsanalyse for tunneler i dalsider. NTH, Geol. Inst.,Trondheim.
Scherman S., 1978: Förarbeten för platsval, berggrundsundersökningar.SKBF/KBS Teknisk rapport 60.
Sehlstedt S., 1990: Status of geophysical tables in the SKB database Geotab.SKB Progress Report AR 90-02.
SFR1 1987: Slutförvar för reaktoravfall, slutlig säkerhetsrapport SFR1. SKB.
Skagius K., Svedberg G. and Neretnieks I., 1981: A study of strontium andcesium sorption on granite. Report PRAV 4.26.
Skagius K. and Neretnieks I., 1982: Diffusion in crystalline rocks of somesorbing and non-sorbing species. SKBF/KBS Technical Report 82-12.
Skagius K. and Neretnieks I., 1985: Porosities and diffusivities of some non-sorbing species in crystalline rocks. SKB Technical Report 85-03.
107
Skagius K., 1986: Diffusion of dissolved species in the matrix of someSwedish crystalline rocks. PhD Dissertation, Royal Institute ofTechnology, Stockholm.
SKB 91, 1992: Final disposal of spent nuclear fuel. Importance of thebedrock for safety. SKB Technical Report TR 92-20. Swedish NuclearFuel and Waste Management Co., Stockholm.
SKB 91 Geohydrologiska beräkningar Variationsfall: Tätare beräkningsnät(Mindre block 24). SKB AR 92-27.
SKB 91 Geohydrologiska beräkningarVariationsfall: Beräkningsskala 24 m(Skala 24). SKB AR 92-28.
SKB 91 Geohydrologiska beräkningar Variationsfall: Statistisk modell utantrend (Ingen trend).SKB AR 92-29.
SKB 91 Geohydrologiska beräkningar Variationsfall: Beräkningsskala 48 m(Skala 48 m). SKB AR 92-30.
SKB 91 Geohydrologiska beräkningar Variationsfall: Minskat modellområdeför HYDRASTAR-simulering.SKB AR 92-31
SKB 91 Geohydrologiska beräkningar Variationsfall: Statistisk anisotropi(Anisotrop). SKB AR 92-32.
SKB 91 Geohydrologiska beräkningar Variationsfall: Referensfallet.SKB AR 92-33.
SKBF, 1977: Handling of Spent Nuclear Fuel and Final Storage of VitrifiedHigh Level Reprocessing Waste (KBS-1). SKB Stockholm.
SKBF, 1978: Handling and Final Storage of Spent Nuclear Fuel (KBS-2).SKBF/KBS Stockholm.
SKI 1986: INTRACOIN. Final Report Levels 2 and 3. Model validation anduncertainty analysis. SKI 86:2.
Smellie J., Larsson N-Å., Wikberg P. and Carlsson L., 1985: Hydrochemicalinvestigations in crystalline bedrock in relation to existing hydraulicconditions: Experience from the SKB test-sites in Sweden. SKBTechnical report TR 85-11.
108
Smellie J., Gustafsson E. and Wikberg P., 1987: Groundwater samplingduring and subsequent to air-flush rotary drilling: Hydrochemicalinvestigations at depth in fractured crystalline rock. SKB Progressreport AR 87-31.
Smellie J. and Wikberg P., 1989: Hydrochemical investigations at Finnsjön,Sweden. In; Characterization of fracture zone 2, Finnsjön study site.Part 5. Ahlbom K. and Smellie J.A.T. (Eds) SKB Technical report TR89-19.
Stenberg ., 1987a: Detailed investigations of fracture zones in the Brändanarea, Finnsjön study site. Investigations with the tubewave method inboreholes Fi 6 and BFi 1. SKB Progress report 87-27.
Stenberg L., 1987b: Geophysical logging performed in borehole BFi 2 withinthe Brändan area, Finnsjön study site. SGAB IRAP 87072.
Stenberg L. and Olsson O., 1984: The tube wave method for identifyingpermeable fracture zones intersecting a borehole. SKB Progress reportAR 84-14.
Stephansson O. and Ljunggren C, 1988: Swedish stress data for the WorldStress Map Project and geological implications of the data in FRSDB.In Proc. Workshop on Nordic Rock Stress Data, Trondheim, SINTEFReport.
Stålhös G., 1988: Berggrundskartan 121 Östhammar NV. SGU Ser Af nr 166.
Stålhös G., 1991: Beskrivning till berggrundskartorna Östhammar NV, NO,SV, SO med sammanfattande översikt av basiska gångar, metamorfosoch tektonik i östra Mellansverige. SGU Serie Af nr 161,166,169 och172.
Sundberg J., 1988: Thermal properties of soils and rocks. Publ. A57, Dep. ofgeology, CTH/GU Göteborg.
Svensson T., 1981: Hydrobotanisk kartering av Finnsjöns undersökningsområde - jämförelse mellan flygbildstolkad och markkarteradvegetation. SKB/KBS Arbetsrapport 81-22.
Swan G., 1977: The mechanical properties of the rocks at Stripa, Kråkemåla,Finnsjön, and Blekinge. SKBF/KBS Technical report TR 48.
109
Söderholm H., Miillern C-F. and Engqvist P., 1983: Beskrivning och hilagortill hydrogeologiska kartan över Uppsala län. SGU Serie Ah, Nr 5.
Tammemagi H.Y. and Chieslar J.D., 1985: Interim rock mass properties andconditions for analyses of a repository in crystalline rock. TechnicalReport BMI/OCRD-18, Office of Crystalline Repository Development,Battelle Memorial Institute, Columbus, OH.
Tirén S.A., 1986: Fractures and fracture zones. SKB Progress report AR86-16.
Tirén S.A., 1989: Geological setting and deformation history of a low anglefracture zone at Finnsjön, Sweden. SKB Technical Report TR 89-19
Tirén S.A., Ahlbom K. and Stråhle A., 1985: Investigations of fracture zonesin the Brändan area, northern Uppland, Sweden: Geological andhydrogeological characterization. Proc. on the Int. Symp. onFundamentals of Rock Joints. Björkliden, CENTEC publ.
Torstenfeldt B., Andersson K. and Allard B., 1981: Sorption of Sr and Cs onrocks and minerals. Part 1: Sorption in groundwater. Report PRAV4.29.
Torstenfelt B., Ittner T., Allard B., Andersson K. and Olofsson U., 1982:Mobilities of radionuclides in fresh and fractured crystalline rock.SKBF/KBS Technical Report TR 82-26.
Tullborg E-L. and Larson S-Å., 1982: Fissure fillings from Finnsjön andStudsvik, Sweden. Identification, chemistry and dating. SKBF/KBSTechnical Report TR 82-20.
Tsang C-F. and Neuman S., (editors), 1992: The International INTRAVALProject Phase 1 Case 5 - Studies of Tracer Experiments in a FractureZone at the Finnsjön Research Area. NEA/SKI 1992.
Welin E., Kähr A-M. and Lundegårdh P.H., 1980: Rb-Sr isotope systematicsat amphibolite facies conditions, Uppsala region, eastern Sweden.Precambrian Research, Vol.13.
Voss C, 1984: A finite-element simulation model for saturated-unsaturatedfluid-density-dependent groundwater flow with energy transport orchemically reactive single species solute transport. U.S. GeologicalSurvey, Water Resources Investigations Report 84-4369.
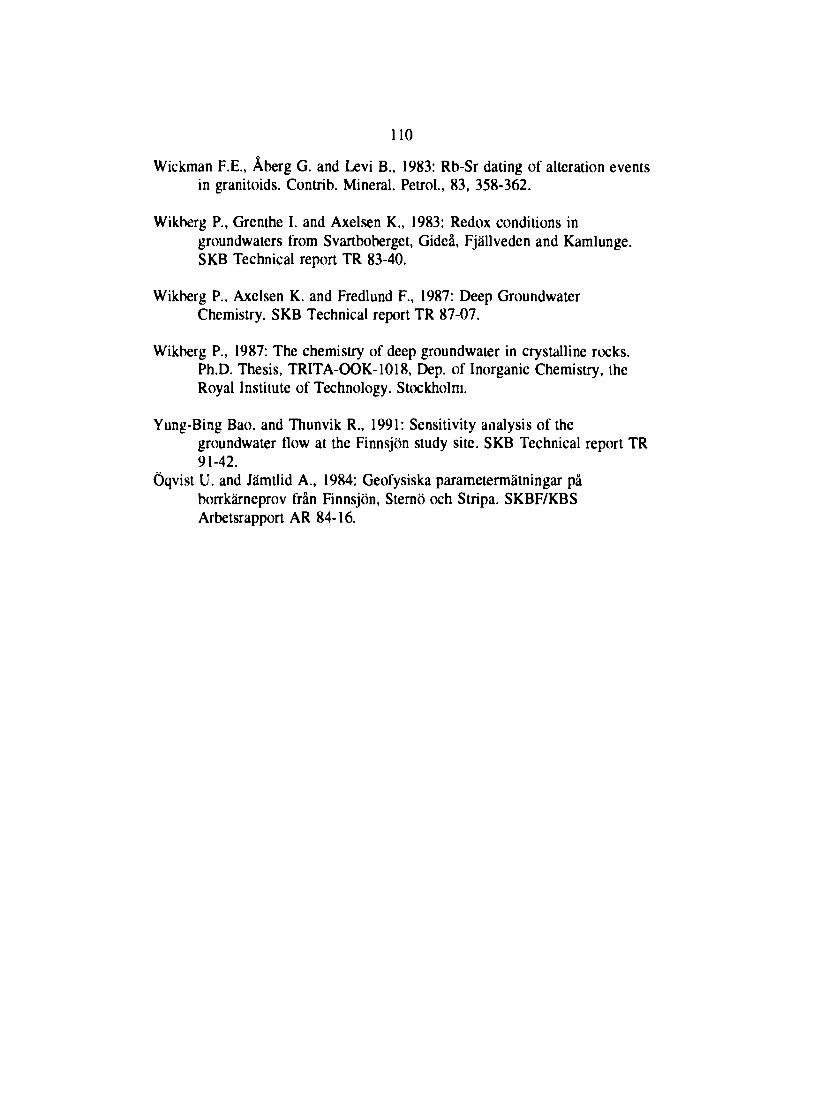
110
Wickman F.E., Åberg G. and Levi B., 1983: Rb-Sr dating of alteration eventsin granitoids. Contrib. Mineral. Petrol., 83, 358-362.
Wikberg P., Grenthe I. and Axelsen K., 1983: Redox conditions ingroundwaters from Svartboberget, Gideå, Fjällveden and Kamlunge.SKB Technical report TR 83-40.
Wikberg P., Axelsen K. and Fredlund F., 1987: Deep GroundwaterChemistry. SKB Technical report TR 87-07.
Wikberg P., 1987: The chemistry of deep groundwater in crystalline rocks.Ph.D. Thesis, TRITA-OOK-1018, Dep. of Inorganic Chemistry, theRoyal Institute of Technology. Stockholm.
Yung-Bing Bao. and Thunvik R., 1991: Sensitivity analysis of thegroundwater flow at the Finnsjön study site. SKB Technical report TR91-42.
Öqvist U. and Jämtlid A., 1984: Geofysiska parametermätningar påborrkärneprov från Finnsjön, Sternö och Stripa. SKBF/KBSArbetsrapport AR 84-16.
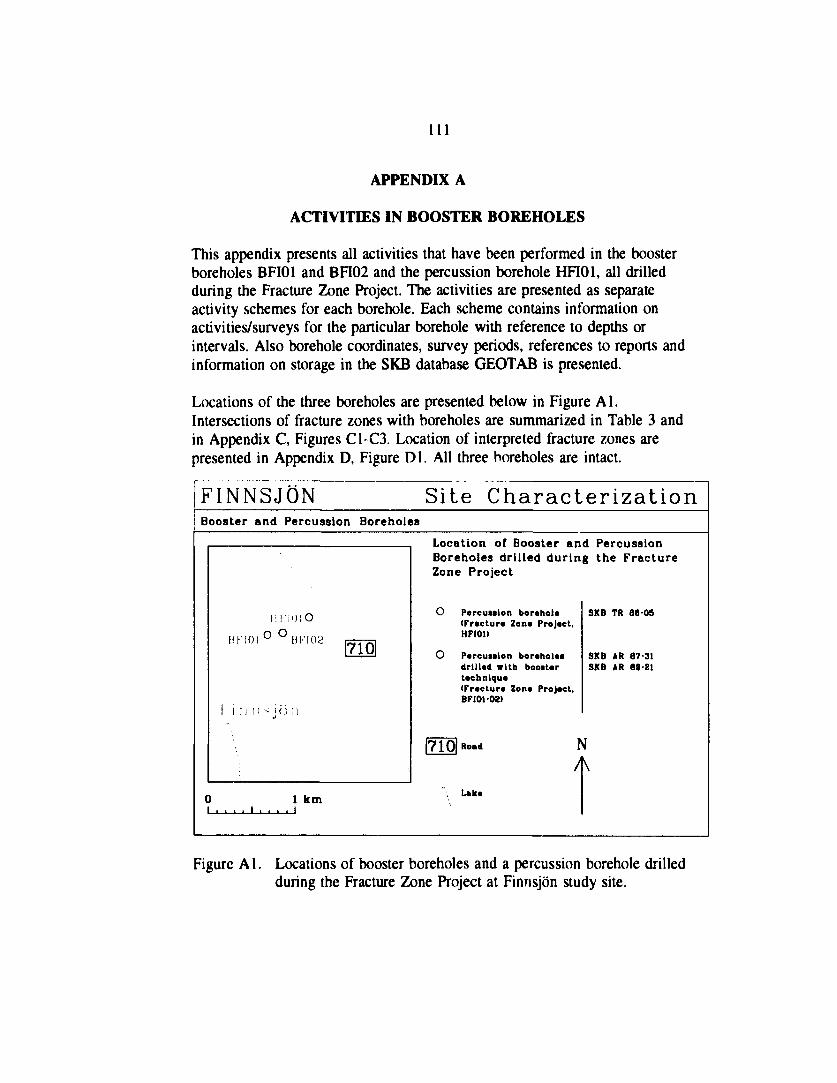
Ill
APPENDIX A
ACTIVITIES IN BOOSTER BOREHOLES
This appendix presents all activities that have been performed in the boosterboreholes BFI01 and BFI02 and the percussion borehole HFI01, all drilledduring the Fracture Zone Project. The activities are presented as separateactivity schemes for each borehole. Each scheme contains information onactivities/surveys for the particular borehole with reference to depths orintervals. Also borehole coordinates, survey periods, references to reports andinformation on storage in the SKB database GEOTAB is presented.
Locations of the three boreholes are presented below in Figure Al.Intersections of fracture zones with boreholes are summarized in Table 3 andin Appendix C, Figures C1-C3. Location of interpreted fracture zones arepresented in Appendix D, Figure Dl. All three boreholes are intact.
FINNSJÖN Site CharacterizationBooster and Percussion Boreholes
Location of Booster and PercussionBoreholes drilled during the FractureZone Project
O Percuadon borehole(Fracture Zon» Project,HFI01)
O Pereunlon boreholeadrillad with booitertechnique(Fracture Zone Project,BFIOl-02)
SKB TR 8805
8KB AR 87-31SKB AR 89 21
1 kmj
Road
Laka
N
Figure A1. Locations of booster boreholes and a percussion borehole drilledduring the Fracture Zone Project at Finnsjön study site.
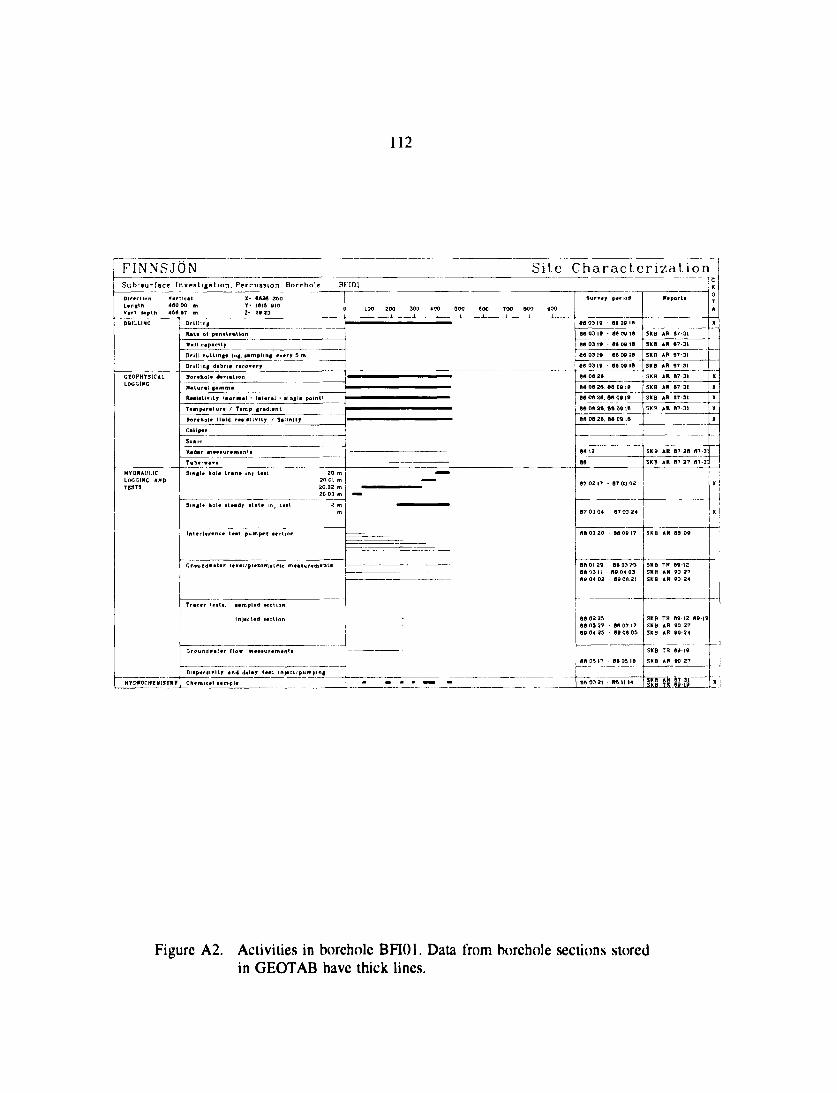
112
FINNSJÖN
LengthVert depth
LOCCINC
Vertical480 00 m450 67 en
LOCC1HC ANDTESTS
HYPMCHH smy
Drilling
R*\« ol ptn«lr»t
Veil capacity
Drill cutting» log
Drilling debrte r»
Natural gamma
Reiiettvlt? tnorm
Borehole fluid ra
Ciliptr
Site Characterization
X- M M 260Y- 1615 BIOZ- 2»J3
on
••mpling tverr 5 m
o..rr
ai - lateral • ilngla polr l '
»iftlvitjr / Salinil*
Son re
Radar measurement*
Dlipertivlt* and
Chemical aemple
20 01 m20 03 m20 03 tn
JacLad i icUon
delaf ta i l ln)«ct/pumpin|
1W3 200 300 400 900 800 700 800 900
_ —
—
.
Sur»er
SB 03 19
06 03 1»
06 03 IB
B6 03 19
86 06 2B
06 00 26.
period
08 09 10
86 00 IB
BB 09 10
SA09 19
86 06 26. ttftQttlO
BB D6 2B. 06 09 18
06 12
06
07 02 |7
87 03 04
00 03 110g 04 02
68 02 250B OS 2709 04 25
Btl m 2)
07 03 OZ
07 03 24
09O4G3- 09 04 21
- 09 04 05
ra n 14
SKB
SKB
5KB
SKB
SKB
SKB
5KH
SKB
SKB5KB
SKB
SKB
SKBSKB
ne
AR
AR
AR
AR
AR
AR
AR
ARAR
Tft
AR
port.
87-31
07-31
07 31
87-31
87 31
87-31
»7-31
00 09
90 2790 24
0912. 09 10
90 24
CT.0TA
X
X
X
X
X
1—
X
X
*
Figure A2. Activities in borehole BFI01. Data from borehole sections storedin GEOTAB have thick lines.
113
FINNSJÖN
DirectionLengthVert depth
DRILLING
LOCCINC
Vertical209 09 en1»M it
Drilling
HYDRAULICLOCCIKC ANDTE5T3
HYDROCHRyiSTRT
Rate ol penat
9elt capacity
Drill cuttings
Drilling debr
Natural gamrr
Realatlvtty 'ft
Temp*rature
Celip«r
Sonic
Radar meeeur
Tub* t o r
Single hole t
ratio
e ree
X-r*Z-
n
» n
o*
ormal -
/ Temp
e m *
ana
Single hole Bleed?
Chemical •ampie.
ta
in}
•(
«<»0 Z«91616 07729 02
ipling e*4
ry
lateral •
gradient
teal
ate inj te
n borehol
Site Characterization
c
tj 6 n»
ingia point'
20 m
*t 0 11 m
nl>
t O.ifetion -
LOO ZOO 300 400 900 000 700 MO 900l i i i i i i i i
-
-
Survey
07 10 13
07 10 13
07 10 13
07 1104
07 11 04.
07 11 04
07 11 04
07 1104
07U04
07 11 29
87 \2 07
00 OZ 1000 DZ 29K0D3 1400 04 1300 07.23
88 DZ 10aa 02 250BO3U88 03 II09 04 02
80 04 1200 07 IS09 04 13
perlo4
07 10 20
07.10 ZB
07 tO Z0
YT 11 00
07 12 03
09 01 2»
- 80 03 0400 03 21
00 OZ Z4- 08 03 tO
8904 0389 00 20
- 09 04 03• 08 07 22- 09 00 13
SKB
SKB
SKB
SKB
SXB
SKB
SXB
SKB
SKB
[SKB
SKB
SKB
SKBSKBSKBSKB
Report»
AR 8 9 2 1
JR
AR
AR
AR
AR
AR
AR
AR
AR
AH
TRTRTRAR
SKB TRSKB TRSKB TftSKB ARSKB AR
SKBSKSSKB
SKB
SKB
ARARAR
89 21
09-21
09 21
89 21
89-21
89-21
0921
89 21
89-21
89 21
89 21
09 1209-1209-1290-27
99-1209-1Z•9-1390-Z790-24
09-1Z. 090-2790-2790-24
AR 88 39
AR 09-21.9
9-19
0 24
C
0TA
X
X
X
X
X
X
Figure A3. Activities in borehole BFI02. Data from borehole sections storedin GEOTAB have thick lines.
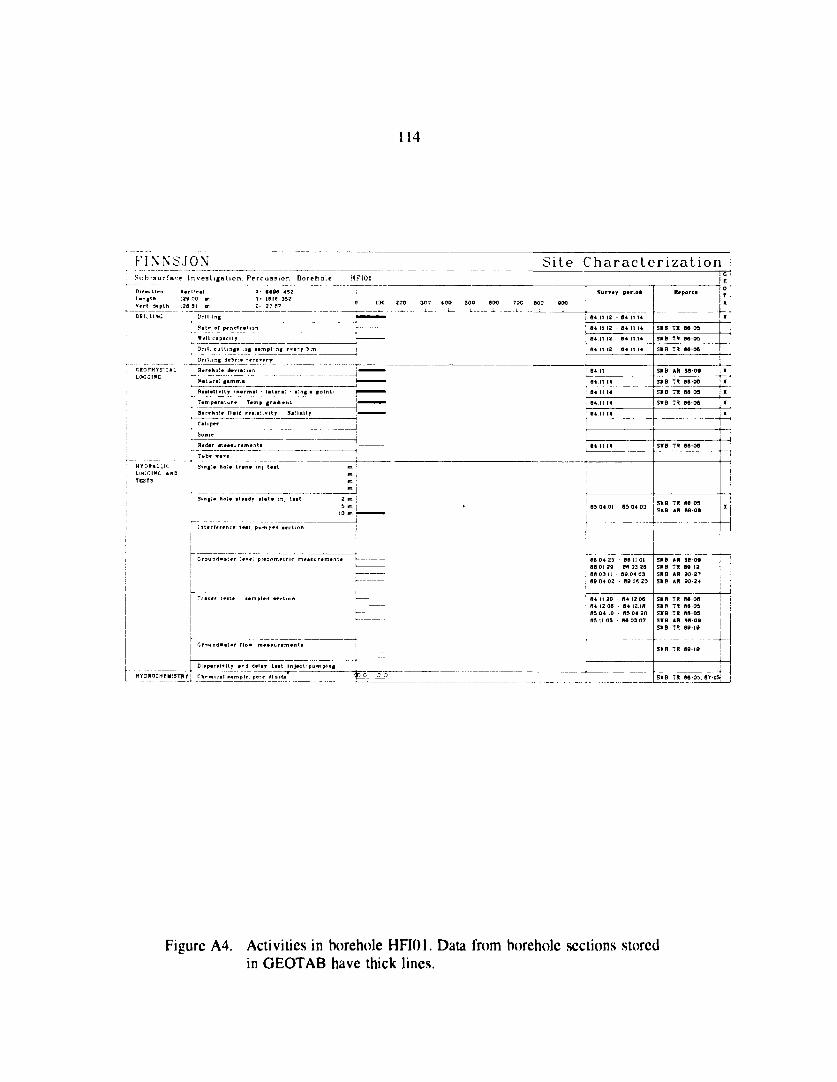
114
FINNSJÖN?M:b surface Investigation. Percussion Borehole HFI01
Direction v»r'. !e«l! L«n«(li 120 00 m! V*rl depth :IO Ot 01
! CRtLLISC
Site Characterization
Figure A4. Activities in borehole HFIOl. Data from borehole sections storedin GEOTAB have thick lines.
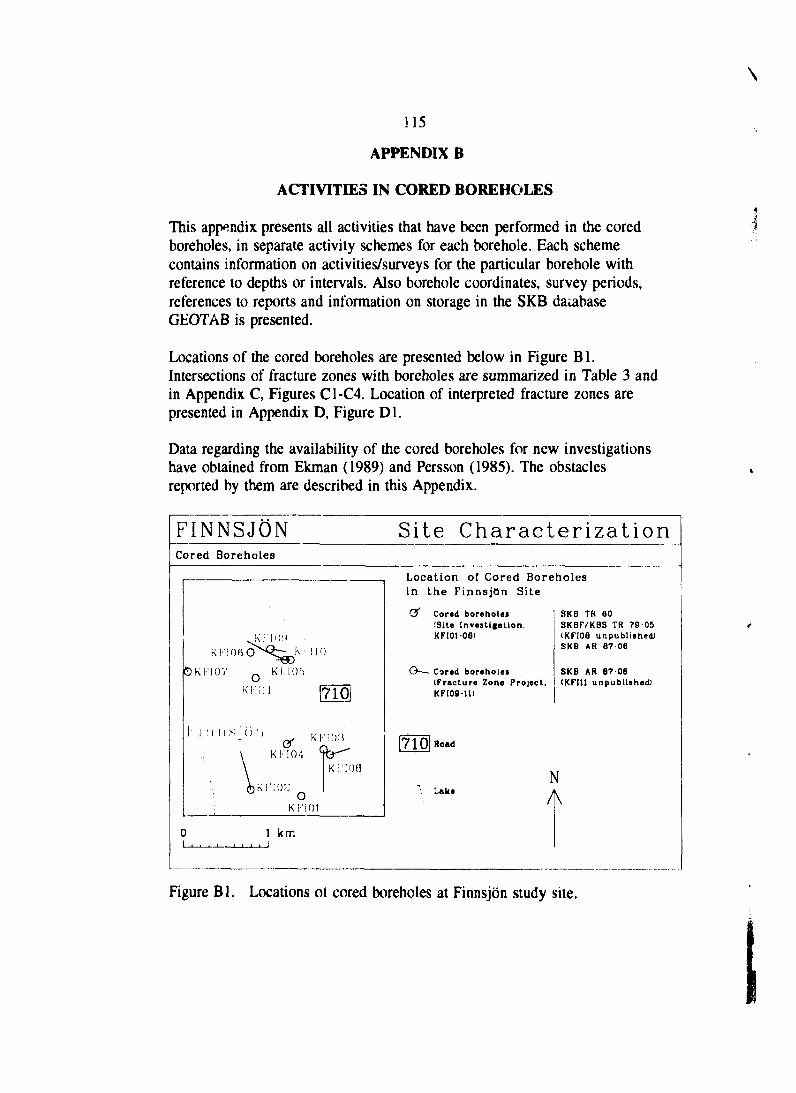
\
115
APPENDIX B
ACTIVITIES IN CORED BOREHOLES
This appendix presents all activities that have been performed in the coredboreholes, in separate activity schemes for each borehole. Each schemecontains information on activities/surveys for the particular borehole withreference to depths or intervals. Also borehole coordinates, survey periods,references to reports and information on storage in the SKB databaseGEOTAB is presented.
Locations of the cored boreholes are presented below in Figure Bl.Intersections of fracture zones with boreholes are summarized in Table 3 andin Appendix C, Figures C1-C4. Location of interpreted fracture zones arepresented in Appendix D, Figure Dl.
Data regarding the availability of the cored boreholes for new investigationshave obtained from Ekman (1989) and Persson (1985). The obstaclesreported by them are described in this Appendix.
FINNSJON Site CharacterizationCored Boreholes
O K I ' 1 0 7 o K KI Of)
K K i l l
K I ' I O ! )
•no
i l l u s i o n
K l ' 1 0 4
KKIOl i
oKr ' IOI
K K I O B
1 km
Location of Cored Boreholesin the Finnsjön Site
Cored boreholesISite Investigation.KFI01-06)
G—. Cored boreholes(Fracture Zone Project,KFI09-1D
SKB TR 60SKBF/KBS TR 7905(KFIOa unpublished)SKB AR 87-06
SKB AR 67 06(KFI11 unpublished)
[7101 Read
LakeN
Figure Bl. Locations ot cored boreholes at Finnsjön study site.
116
Borehole KFI01
This borehole (Figure B2) is drilled vertical to a depth of 501 m below theground. The objective was to obtain data regarding rock types, degree offracturing and hydraulic conductivity in a rock block at the central part of thesite. Borehole coordinates and activities performed are presented in FigureB2. Generalized results concerning rock types, fracturing and hydraulicallyconductive sections are presented in Appendix C, Figure Cl.
Granodiorite is the dominating rock type in the borehole. Some metre-widedykes of pegmatite and aplite are also encountered. The degree of fracturingis low down to 200 m. Below this depth the degree of fracturing increasesalthough there still exists wide sections with low fracture frequencies. Highlyfractured sections occurs between 214-217 m, 336-355 m and 360-361 m. InAhlbom and Tirén (1991) the two latter sections are interpreted to be a partof a c. 100 m wide gentle dipping (35°) fracture zone, Zone 11, occurring inthe borehole between 332-436 m.
The mean fracture frequency of the borehole is 2.3 fr/m. (Assuming 5 cm asa mean fracture spacing in sections only marked in the core logs as fracturedor crushed rock).
Borehole availability: The total length of the borehole was at one timeblocked with a hydraulic test equipment. Part of the borehole was latercleared down to 340 m or possible longer, although there might still be someplastic debris left in the upper part of the borehole.
Borehole KFI02
This borehole (Figure B3) is 699 m in length and ends at a depth of about535 m. It is drilled inclined 50° to the horizontal to study the geologic andhydraulic characteristics of the bedrock and of northwesterly oriented fracturezones, mainly indicated from lineaments.
The dominating rock type is granodiorite which colour changes from grey tored. The latter is commonly found in and close to highly fractured sections.Some metre-wide dykes of metabasite is also noted in the core logs.
The degree of fracturing is highest down to about 110 m. Below this depththe fracturing decreases somewhat until the lowermost part of the boreholewhere a strongly fracture section occurs (677-690 m). It is possible that thissections might represent Zone 1. Mean fracture frequency for the totalborehole length is 3.2 fr/m. Generalized results are presented in Appendix C,Figure C1.
117
Borehole availability: The borehole is blocked with a hydraulic testequipment from 100 m and downwards.
Borehole KFI03
Borehole KFI03 (Figure B4) is 731 in length and drilled inclined 50°,reaching a depth of about 560 m. The borehole is drilled in the eastern partof the site close to, and more or less parallel with Zone 3, the Gävastbofracture zone.
With the exception of one 1.5 m wide metabasitic dyke all cores from thisborehole consists of grey or red granodiorite. The fracture frequency is highover the total length of the borehole. Mean fracture frequency is 5.8 fr/m.The most fractured sections occurs at 150-190, 220-270, 340-360, 590-640,670-730 m. In Ahlbom and Tirén (1986) a gentle dipping and 100 m widefracture zone (Zone 11) is interpreted to occur in the borehole between 107-275 m. Another zone, Zone 10, is interpreted by the same authors tointersect the borehole at 57-62 m.
The strongly fractured sections in the borehole from 340 m and downwardshave not been correlated with any fracture zone at the surface, although themost plausible one appears to be the Gåvastbo fracture zone (Zone 3).Generalized results are presented in Appendix C, Figure C1.
Borehole availability: A hydraulic test equipment blocks the total length ofthe borehole.
Borehole KFI04
This borehole (Figure B5) has a length of 603 m and drilled inclined 80°,reaching a depth of 596 m. The borehole is located in the central part of thesite in a technically affected rock block (in what way is not reported). Theobjective was to study the continuation of this tectonics towards depth and tostudy its influence on the hydraulic conductivity.
The borehole consists mainly of grey or red granodiorite down to 527 mwhere the main rock type is changed to a reddish granite, which continues tothe end of the borehole. Granite also occurs as dykes at 388-391 m and 397-428 m borehole length. The granodiorite is also cut by several pegmatite andmetabasitic dykes.
The cores are, compared to other boreholes in Finnsjön 'datively lowfractured, although several sections with increased fracturing do occur. The
118
most prominent fractured section occurs between 370-440 m. Ahlbom andTirén (1991) interpret this section to represent the gentle dipping Zone 11.Mean fracture frequency of the borehole is 3.6 fr/m. Main results fromborehole investigations are shown in Appendix C, Figure C2.
Borehole availability: During borehole logging 1985 a blockage at 75 mdepth was detected, indicating a borehole collapse at this depth.
Borehole KFI05
This borehole (Figure B6) is inclined, 50°, with a length of 752 m and adepth of 558 m. It is drilled to investigate a topographically andgeophysically mell marked lineament (Zone 1).
The borehole is dominated by grey and red granodiorite. Granite dykes,pegmatite dykes and to some extent metabasic dykes occurs frequentlythroughout the borehole.
The degree of fracturing is high down to c. 240 m depth. Below this depththe fracturing decreases somewhat but several highly fractured sections alsooccurs below this depth. The first interpretation of the borehole resultsindicated that the borehole was more or less parallel to Zone 1, which wouldexplain the long fractured section. During the Fracture Zone Project theborehole results was reinterpretated. The present interpretation is that Zone 1is located in the uppermost 50 m of the borehole (which is cased in thispart). From 166-305 m the borehole penetrate the gently dipping Zone 2.Ahlbom and Tirén (1991) further interprets a 2-6 m wide and 60° dippingfracture /one (Zone 5) to intersect the borehole at 493 m.
The mean fracture frequency for the borehole is 4.7 fr/m. Main results fromborehole investigations are shown in Appendix C, Figure C2.
Borehole availability: No known problems with borehole blockage (theborehole is cased dowi, to 56 m).
Borehole KFI06
This borehole (Figure B7) is located in the northern part of the site and isdrilled vertically to 691 m depth. The objective was to obtain rockcharacteristics in this part of the site.
The borehole is dominated by grey and red granodiorite. Granite dykes,pegmatite dykes and to some extent metabasic dykes occurs frequentlythroughout the borehole. The frequency of pegmatites increases with depth.
119
Borehole KFI06 is, together with other boreholes in the northern part of thesite, relatively low fractured compared to boreholes in the central andsouthern part of the site. Fractured rock occurs mainly between 193-284 m,although other fractured sections occurs both above and below this section.Ahlbom and Tirén (1991) interprets the gently dipping Zone 2 to be locatedbetween 201-305 m in the borehole and Zone 5 at around 555 m depth.
Mean fracture frequency is 3.0 fr/m. Main results from boreholeinvestigations are shown in Appendix C, Figure C2.
Borehole availability: No known problems with borehole blockage.
Borehole KFI07
Borehole KFI07 (Figure B8) is drilled 85° to a borehole length of 553 m,corresponding to a depth of 549 m. It is located in the northwestern part ofthe site with a general objective to investigate rock characteristics in this partof the site.
The borehole is strongly dominated by grey and red granodiorite. The amountof red granodiorite (tectonically affected rock) is less than in other boreholesat Finnsjön. The borehole only cuts one metabasite dyke and a fewpegmatites.
The relatively low amount of fractured rock in this borehole is also seen onthe mean fracture frequency, 1.8 fr/m. The main fractured sections occursbetween 288-388 m and 513-531 m. These sections were interpreted inAhlbom and Tirén (1991) to represent Zone 2 and Zone 6, respectively.Based on surface data they also interpreted another fracture zone. Zone 9, tooccur between 109-154 m in the borehole. However, this is not conclusivelyshown in the core logs nor in the geophysical or hydraulical boreholemeasurements. Main results from borehole investigations are shown inAppendix C, Figure C3.
Borehole availability: No known problems with borehole blockage.
Borehole KFI08
This borehole (Figure B9) is 464 m in length and is drilled inclined 60°,reaching a depth of 399 m. The borehole is located in the eastern boundaryto the Finnsjön Rock Block site with the objective to characterize theGåvastbo fracture zone (Zone 3).
120
The core mapping of this borehole has not been reported. A compilation ofrock type distribution has however been made from available workingdocuments. This compilation is presented in Appendix C, Figure C3, togetherwith other main borehole results.
According to this compilation granodiorite and reddish granite occurs in moreor less equal amount, reflecting the closeness to the main granitic bodyoccurring close to the east.
Due to the absence of a fracture core log no study of mean fracturefrequency has been made for the borehole. However the resistivity logging,presented in Ahlbom et al., 1986, indicate a major fracture zone from moreor less the ground surface and down to 150 m borehole length, which areinterpreted to represent Zone 3. Minor fractured sections also occur 200-215m, 315-335 m and 410-430 m.
Borehole availability: No known problems with borehole blockage.
Borehole KFI09
This borehole (Figure B10) is drilled 60° to the horizontal and has a length of376 m, corresponding to a depth of about 322 m. The objective was toinvestigate the character of Zone 1. However, after the discovery of thegently dipping Zone 2 in the borehole, the main efforts were changed tocharacterize this latter fracture zone.
The borehole is dominated by red and grey granodiorite. In addition,pegmatites occur towards the end of the borehole. The main fractured sectionin the borehole occurs between 134-217 m. This section contains severaltectonized and brecciated sections of granodiorite. It is interpreted torepresent the gently dipping Zone 2 down to 212 m. Between 212-216 m a 5m wide and 60° dipping fracture zone (Zone 5) intersects the borehole. Other,fractured sections occur at 65-67 m, 74-77 m and 245-250 m. Mean fracturefrequency for the whole borehole is 2.8 fr/m. Main results from boreholeinvestigations are shown in Appendix C, Figure C3.
Borehole availability: No known problems with borehole blockage.
Borehole KFI10
This borehole (Figure Bl 1) is 256 m in length and is drilled inclined 50°,reaching a depth of 193 m. The borehole is positioned to penetrate both Zone1 and Zone 2.
121
Pink or red granodiorite dominates in the cores, although there are also somesections with grey granodiorite. Also some small dykes of pegmatite orgranite occur in the upper part of the borehole,
High fracture frequency and tectonization occurs within two intervals, 75-105m and 152-256 m (end of borehole). The upper interval is interpreted torepresent Zone 1 and is characterized by a high fracture frequency and thefracture minerals hematite and asphaltite. The lower interval is interpreted torepresent Zone 2 and is characterized by several minor sections of tectonizedrock including breccias and mylonites.
The position of the borehole in the area where these two zones crosses eachother is reflected in a high mean fracture frequency for the borehole, 4.8fr/m. Main results from borehole investigations are shown in Appendix C,Figure C4.
Borehole availability: No known problems with borehole blockage.
Borehole KFI11
This borehole (Figure B12) is located in the central, northern part of the siteand is drilled vertically 390 m below the ground surface. The objective wasto investigate Zone 2 in a position where no other fracture zone wouldinterfere with the results.Grey granodiorite dominates the bedrock down to 220 m. Below this depthred granodiorite dominates. Pegmatites and metabasic and aplitic dykesconstitute W7< of the total core length.
The fracture frequency down to 220 m is 0.9 fr/m reflecting the low degreeof fracturing in this part. Zone 2 is interpreted to be located between 221-33Xm. In this section a c. 10 cm wide open fracture occurs at 224 m causingvery high hydraulic conductivity. The fracture is at least partly filled withunconsolidated rock debris. The most intensely deformed section occurs at290-305 m. Characteristic fracture minerals for the zone are calcite,laumontite and iron oxy-hydroxides.
The lower boundary of Zone 2 is somewhat uncertain due to repeatedlyoccurring fractured sections at the lowermost part of the borehole. The meanfracture frequency for the whole borehole is 2.0 fr/m. Main results fromborehole investigations are shown in Appendix C, Figure C4.
Borehole availability: No known problems with borehole blockage.
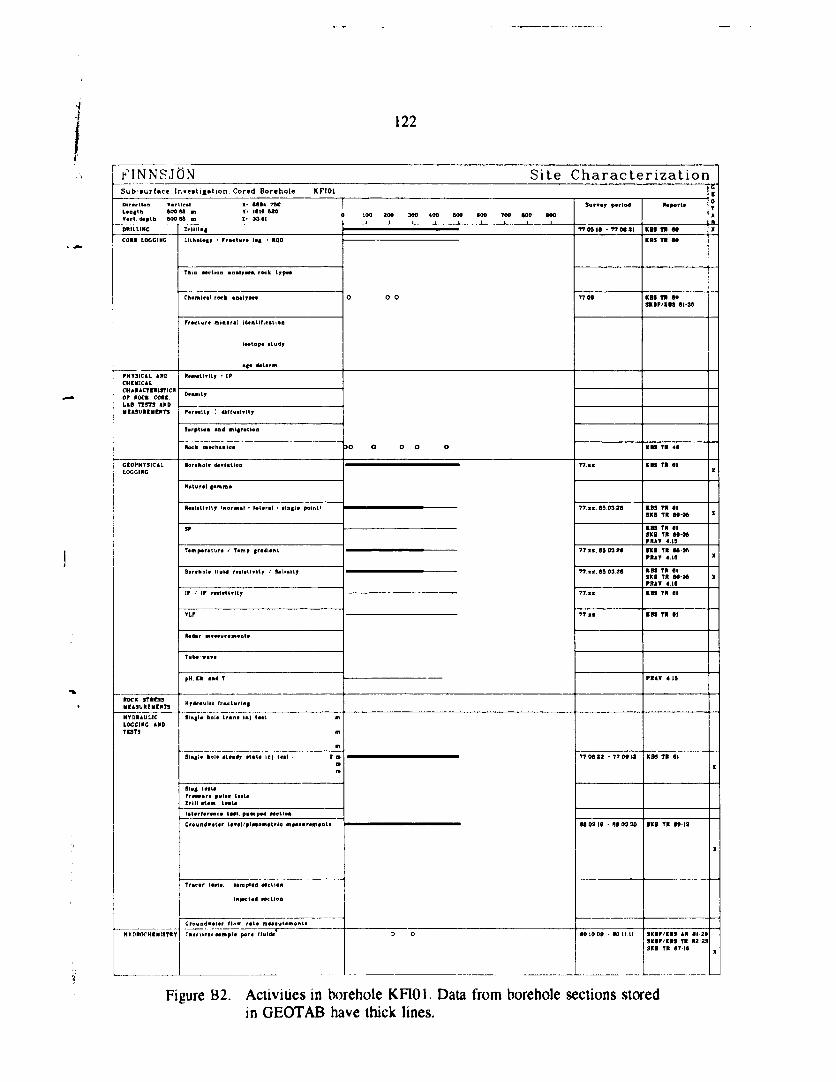
122
FINNSJÖN Site Characterization
Direction Vertical X- Uft« T MLeaftt. 600 M n Y> 1616 5 MVarl depth 000 56 m Z* 33 61
CORE L0CC1NC
PHYSICAL ANDCHEMICALCHARACTERISTICSOP ROCK COM,LAB TESTS ANDMEASUREMENTS
LOGGING
ROCK STRESSMEASUREMENTS
LOCCINC AMDTESTS
HVDROTHEHISTRr
1
LltholAir * FratUrt lo« • ROD
Thio Mctioa ma*ljmt*. rock typea
Cnanhcal rock «t»lr»*t
ieotope atudy
•l« dt t i rn
RaalatlTlty • IP
Paroalty '. aJfrualvlty
Sorptioft *Dd anl|r«tl«n
Rock machaaics
Naturel famra*
RaalatlTllr (normal • lataral • *tn(la point)
SP
Ttmp«r*turc / Tamp f radian t
VLr
Radar Btf*aur«manta
Tuba-wava
pH,Ch and T
Hrdraulle fraclurlni
SI
m
Sln|l* hol« altadr ttata in]. t « t Z tnmm
Slu4 t« i#PrcMtiri p»la« ttataDrill at«m taata
lularfaranea la«l, pumpad Mellan
Cr»uod«*t«r l*v«|/pl«isai*trl« mM«iir*ai«oti
Traear latia, aamplad Motion
Intactcd aacttaa
Ckarti^ai lampia pora (luida
100 200 300 400 BOO 600 TM HO MO
O O O
JO O O O O
o o
ttirimj period
77 0»
T7.«t
77 •>. B8D3 2S
77, i .B5 03 2«
77. l i . 89 03 26
77. > i
77.lt
77 OS 22 • 77 0* 12
HOS 19 - MM30
80 10 09 - 80 II II
KmporlM
m n «o
KB3 T> 80S K B P / t n »1 35
KB9 TR 48
ICBS T» 81
r.83 TB 81SKB TR 88-08
KS9 TR 81SKB TR 8808PRAV 4.19
1KB TR 88DAPR1V 4 15
KBS TR BlSKB TR 88-08PR1V 416
KBS TB 81
KBS TR 81
PRAV 415
KBS TR 81
SKB TR «» IS
SKBF/KBS AR 81-29SKBP/IB3 TR 82-23SKB TR 97-15
Ct0TA
n
X
X
X
X
X
X
X
Figure B2. Activities in borehole KFI01. Data from borehole sections storedin GEOTAB have thick lines.
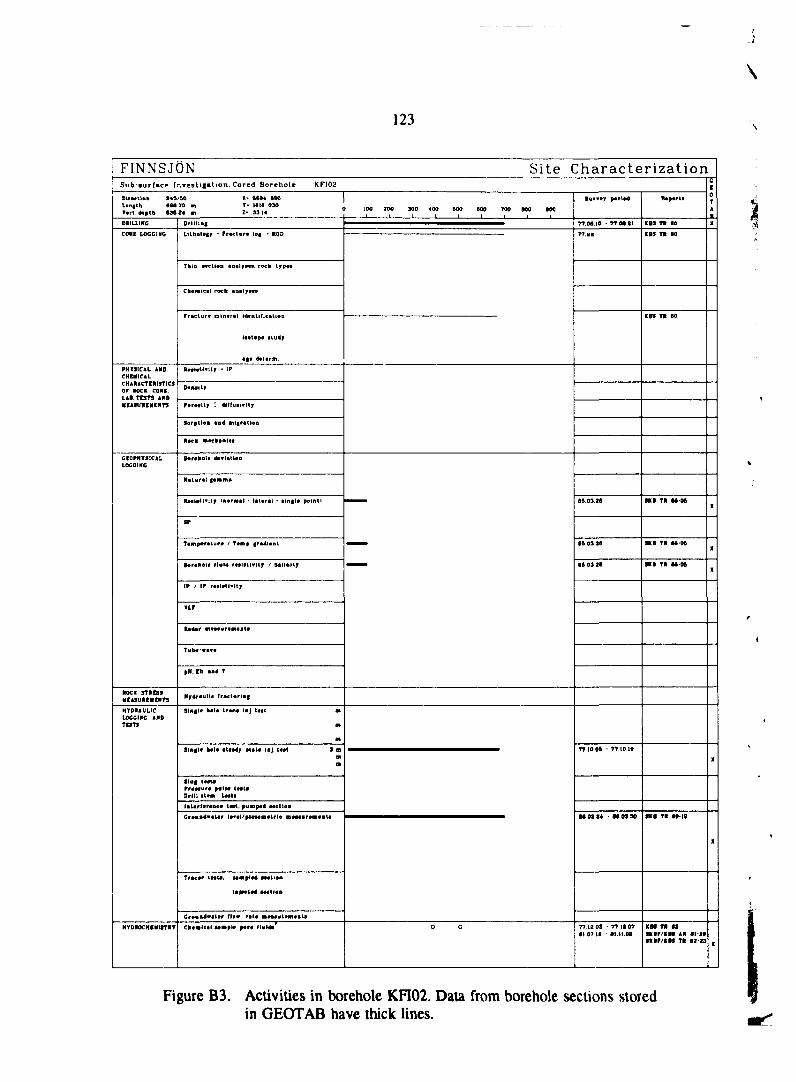
123
\
FINNSJÖN Site CharacterizationSubiurfa.ee Investigation. Cored Borehole KPI02
DiracOoa 84ft
V*rt dtBtb 638
CORI LOCCINC
PHYSICAL AMDCHEMICALCHARACTERISTICSOP ROCK COM,LAB. TESTS AHD
CtOPHTSICALLOCCINC
ROCK STRESS
HYDRAULICLOCCINC ANDTEXTS
HYDROCHIHltTRT
/SO X- U » 4 AMTO m Y* l«lfl 03024 m 1 - 3 3 14
Ltlbologj - Praetvra log • RQD
Thia avctlofl ta*\yw*t, rock t^paa
Cbcnical rock aaalraaa
taotop* atudjr
agt datarm
R«tl*tl*llr • IP
D. M . t ,
S . r , l . « .Bd . . . » t . . .
R««k »ach...«.
B«r«hoi* davlallan
Natural gamma
Raalatlvily (Mormal • lataral • tlngl* point i
SP
Tamparatura / Tamp gradlant
IP / IP raalatlvltr
VLP
Radar «i*aaur*Bi«nt*
Tuba-vava
pH. Eh and T
m
m
Stngl* kola attady alala ioj. Uat 3 mm
Slug t« l#Praacura pnlM taataDrill atam taala
iBlarlarasea taat, pumpad aaellBB
Trace* tMU. MOtplad Mctiatk
lafactad aaatlas
Ck«ajte«l M B B I » p«r« flttldt'
100 ZOO 300 400 600 600 TOO 600 »00
1 1 1 1 1 1 i > 1
0 0
Survey p«rl«4
77.M»
»5 03 2»
0103 26
OS 03 20
7T10 06 - 77.1010
M 02 21 - M 03 30
77 12 0» -77 1107•1 07 1* - 01 11.03
lUfarti
IBS TU 00
IBS Tl 00
mi T« M M
9KB TU B6-06
KB T» M M
1KB T» H I 2
UBS T« 12
IKBr/IBl AH 01-20m r / I K TB. B2-23
X
X
X
X
X
Figure B3. Activities in borehole KFI02. Data from borehole sections storedin GEOTAB have thick lines.
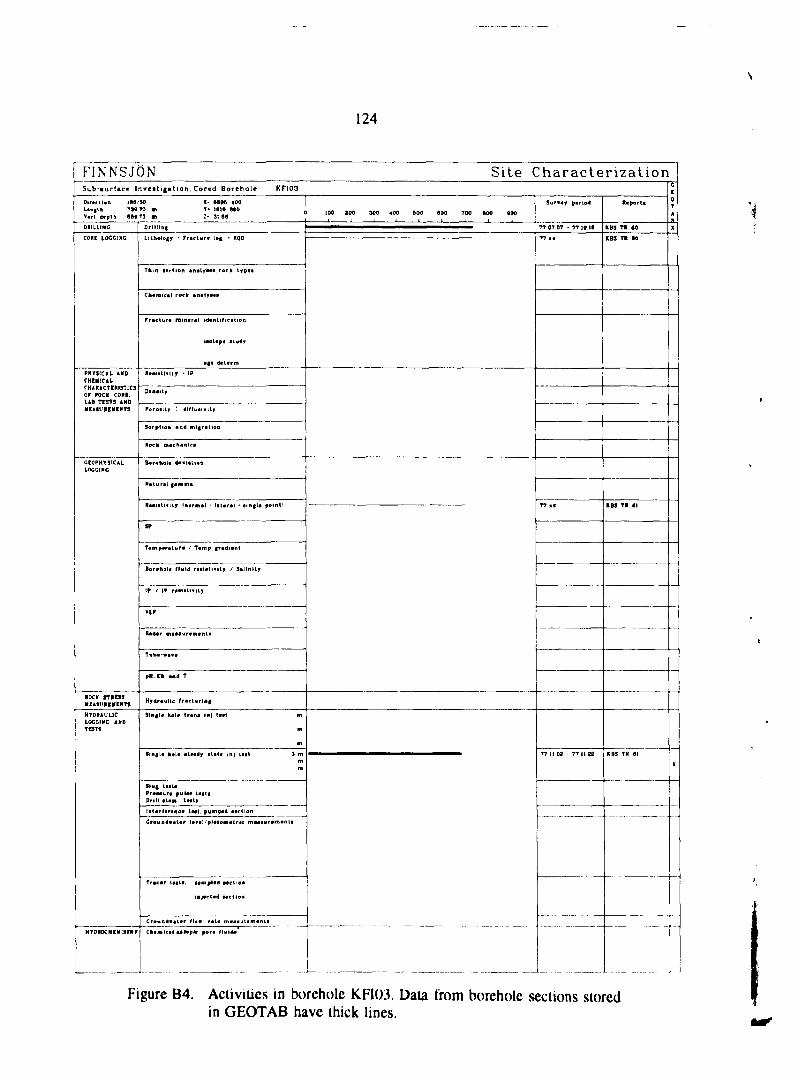
124
FINNSJÖN Site Characterization
Direction 100/Ltn| (h T30v«rt d«pth OS»
DRILLING
PHYSICAL ANDCHtMICAtCHARACTERISTICSOr ROCK CORf.LAB TESTS ANDHE A SUReU CUTS
LOGGING
•OCK STRESS
HYDRAULICLOCCINC ANDTOTS
HVOROCHIUISTIir
50 X- M § 6 400tO vt 1- )B1» MO79 m Z* 3t &a
Drill ing
iaatopa aiudjr
• | t dtUrm
RaatatMtr • IP
Dtnaitjr
poroaity : dtrrutivur
Natural gamma
Raaiatlfitr (normal - lataral • lingla point)
SP
Borahol* Mul4 rtalttivlty / Sailnltf
IP ' IP r*sl*lt*liy
VLr
Rad«r ai*<»urfm«nl«
7ub*-«B*a
pH. Ch and T
Singla hol* trana InJ t«il m
m
m
Singla tool* llaady alaU mj l«il 3 mm
Slug lÉtiaPrniur* pul«* (•«(*Drill i t m tail*
lit*rl«r«n^« tatl. pumpad aaclian
Trscar tait*, tampltd Mction
m>ac[ad faction
Ckamical itmpl* por» Hulda
100 200 300 400 »00 «OO TOO »00 »001 1 1 1 1 1 1 1 1
Survaf par lod
TTOT07 • ?7 10.tl
77 • •
TfKK
11 U 02 7T It 22
Raparla
KBS TR 00
KB5 TR 60
KBS TR 61
KBS TR 61
C0TA
JL
-
X
Figure B4. Activities in borehole KFI03. Data from borehole sections storedin GEOTAB have thick lines.
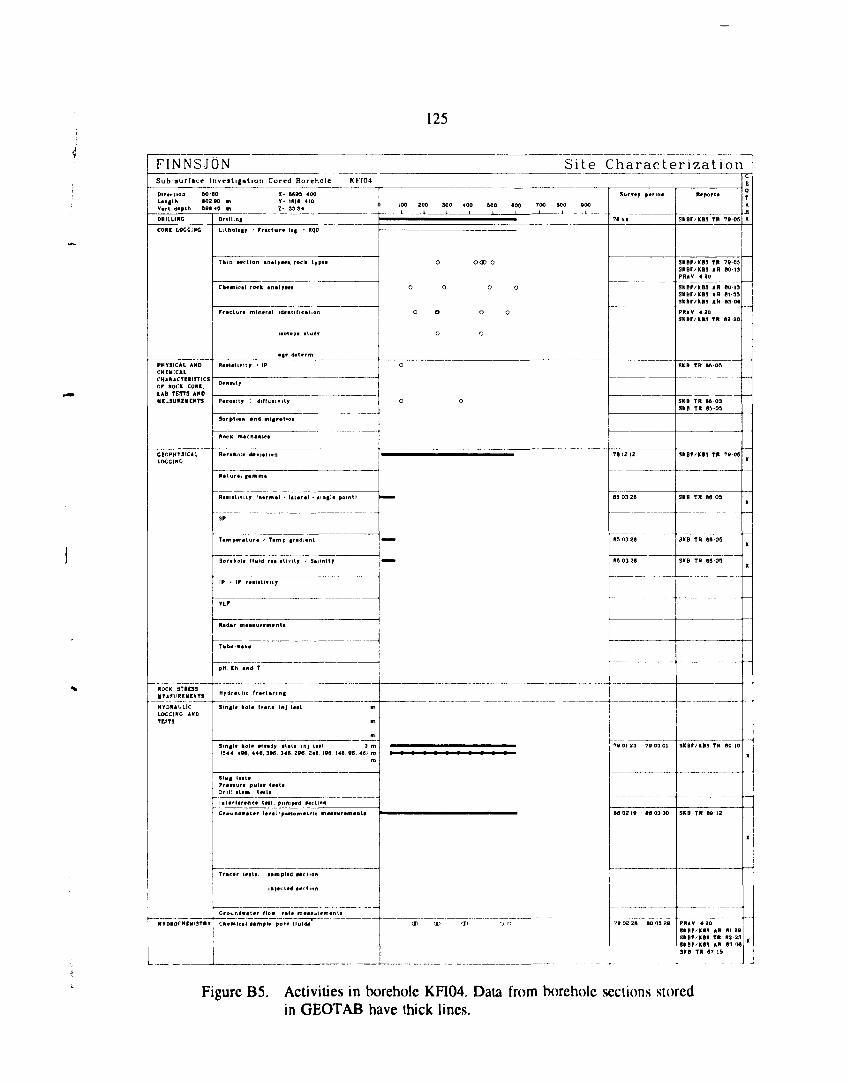
125
FINNSJÖN Site Cha rac t e r i za t i onSub surface Invest igat ion, Cored Borehole KF'IO4
Pirvcllon 60/BOL«n|th 603 00 viV«rl d«pth 086 40 m
X- BSK 400Y ' 1610 410Z' 33 3 4
CORE LOCCIMG
PHYSICAL ANDCHEUICALCHARACTERISTICSOr ROCK CORK.LAB TESTS ANDMEASUREMENTS
ROCK STRESSMÉASUREMCNT3
HVDRAULICLOCCINC ANDTESTS
HVDROCHIM!9T i r
0 tOO 200 300 400 600 600 700 »00 »00
• fracture lo« • ROD
Cb*mic«l rovk
Natural f«mm*
SP
Tampan
• hoi* (laid rtiliUWtr
IP ' IP r«Bl*tl*ltjr
VLf
R*dar tfitaauramv
Singla hol* trana IM) ta i l
Sm|l« hole »itidy •(•(« inj u i i 3 m15*4 4H. 446, 3M. 345. 280. Z4fl IBS I4fl. 06. 46J m
Slu4 latt*PraMur» pulia laatiDrill Htm laila
nlar(«r*ne« tttt pumpatf
Ch#mictl aampla por* Mutd*
8 021» 06 03 30
SKBP/KB3 TR *?9 03
3KBr/KB5 TB 7» 05SKBP/KB3 AR 80 13PRAV 4 20
SKBP/KBS Aft 80 13SKBF/K83 AR 81 35SKBP/KRS AR 63 06
PRAV 4 20SKBF/KBS TR 82 20
SXB TR «1 OS
SKB TR 6ft 03SKB TR 9J-05
SKBf/KBS TR T»-0»
5KB TR 68 OS
5K8 TR 86 OS
SKB TR ASOfl
3KB TR 6 B 1 3
PRAV 4Z0SKBF/KBJ Aft 61 20SKBf/KSS TR 82 23SKBF/RtS AR 63 06SKB TR 67 IS
Figure B5. Activities in borehole KFI04. Data from borehole sections storedin GEOTAB have thick lines.
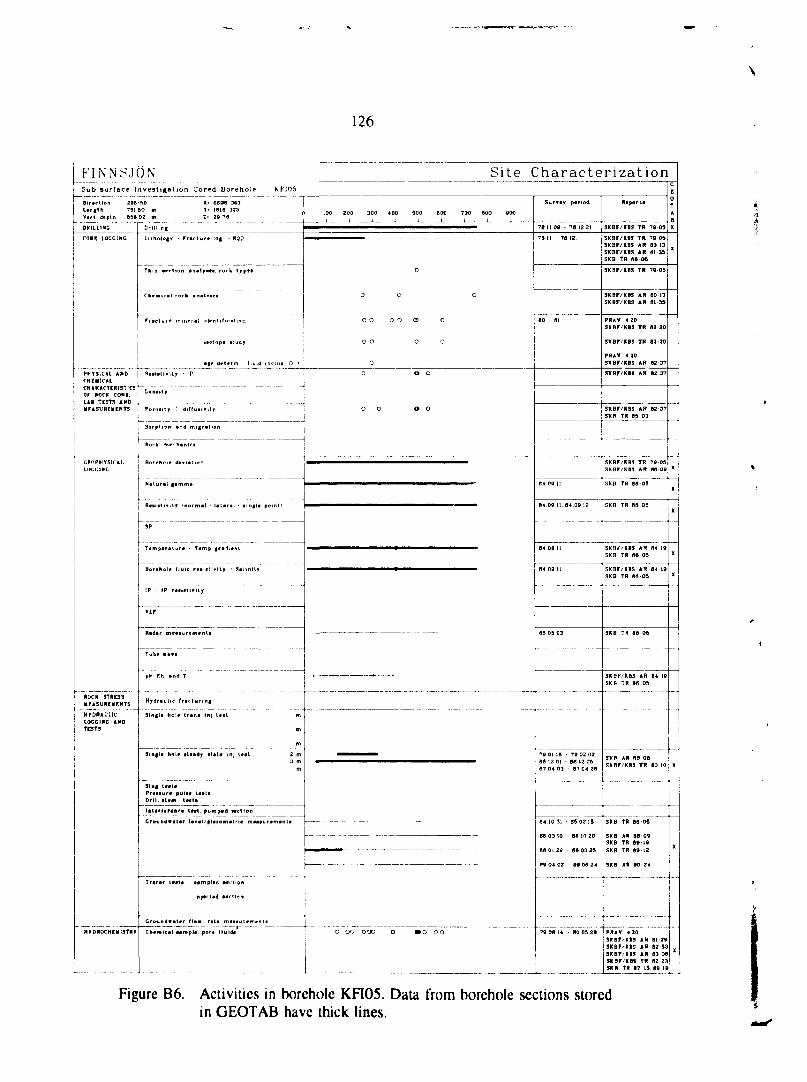
126
Site Cha rac t e r i za t i onFINNSJÖNSub surface InvestiRation. Cored BoreholeDirection 29ft<M)U n f l h ?6l SO mv«rl depth 66» OS m
DRILLING Drllllni
T> 1610 3332- J9 70 0 100 200 300 400 600 600 700 900 800
SKBF/KH5 AR Hl 31SKB TR S 9 O 6
SKBF7KBS AR 60-13SKBF/KBS AR B I 3 &
PRAV 4 2 0SKBF/KBS TR 82 20
PRAV 4 20SKBF/KBS AR 97-3?
PHYSICAL ANDCHEMICALCHAHACTFRI3TIC30» K0CK COt*I.LAB TESTS AND
SKBF/KB5 AR 82-3?SKB TR 85 03
SKB/'KBS AR 04 195KB TR 89 05
HV&RAULICLOCCINC ANDTESTS
Slnjl* fiol* (r«na In) l»»t
SKB AR B8 OB3KBF/KB3 TR 8 0 1 0SS 12 01 M 12 OS
•7 04 03 »7 04
SJ 1*4 taataPra«fura pui*« lDrill i t f m laita
04 10 31 - 65 02 ]&
SS 03 10 - SS 10 20
RA 01 20 BB 03 28
SKB AR BBOBSKB TR 0 0 1 9SKB TR 89 12
Träter i»jt» •smplfrf M
SKBF/KB3 AR 83 MSKBF/KB3 in 02 23SKR TR 87 14 89 19
Figure B6. Activities in borehole KFI05. Data from borehole sections storedin GEOTAB have thick lines.
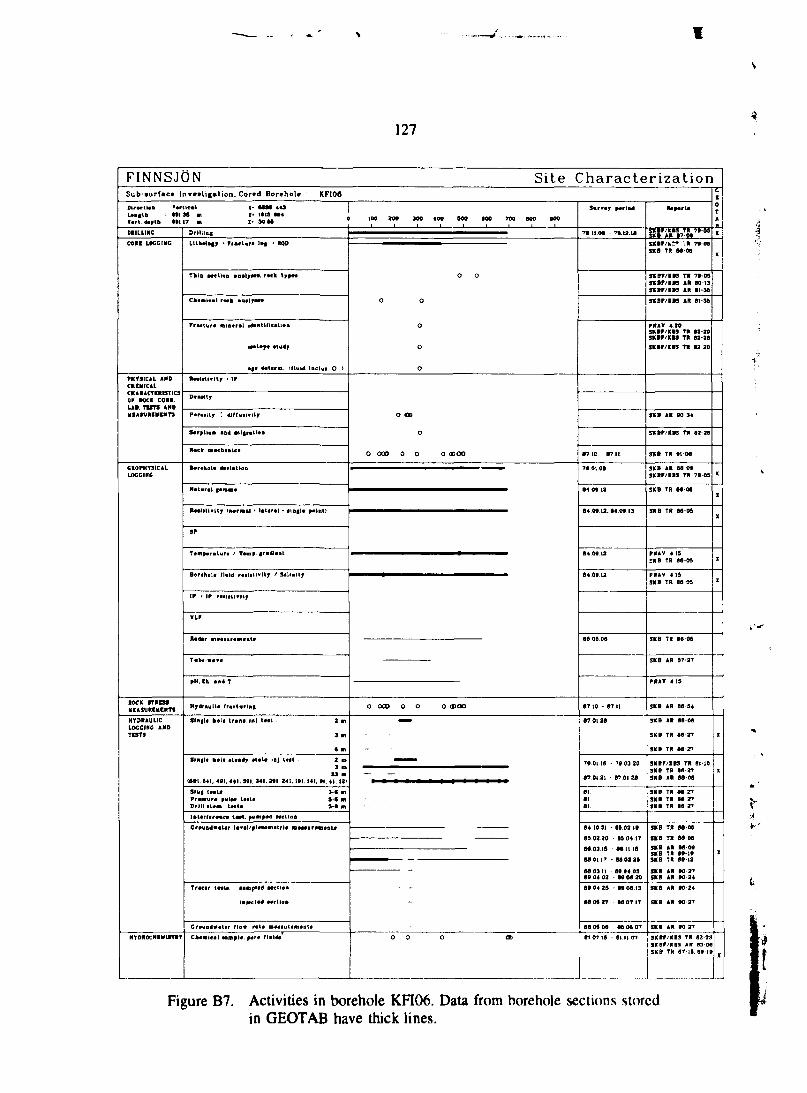
127
FINNSJON Site Characterization
Direction Tartlcai X- S t M 449L*D|lb M l 36 m T- 1018 tS4* * r t oaatb 1*117 m Z* M M
DRILL1RC
COM LOGGING
PHYSICAL A*0CHCHICALCHARACTERISTICSOF ROCK CORK.LAP. TESTS ANDHtASVRKMCIITS
GtOPHYSlCALLOCCINC
HOCK STRESSHCASURCHCRTS
HYDRAULICLOCCINC ANDTESTS
HTDROCHIHOTRT
Drllllag
U U * U t 7 * f ra *Wf« >•• * BQD
This atcliea. analr***. rack l y f ta
Cb*nkcal rock aaalfaaa
(••tap* H\t4f
• | t dalarm ifluld laclua 0 )
RaatatUltr • IP
Parwiity : «iffuat?lty
SarptlaB and ani|ratl*tt
Rock twacaaalCB
B*r«hot« atvtatlaii
Natural gamma
RMl i lU i ty ift«rmal • laUral • atogla point)
SP
Bortholc fluid rcilatlwllr / 3*11 »1 I f
IP / IP raiiftlvllj
VLP
JUdtr anaaiur*an«nl>
Tub4-v«*«
pH. Cb * K « T
Hrdrtulle fracturing
Sln|l* •>«!• trana. In) t««L 2 m
3*)
ft m
3 m33 m
tft»l. 641, 401, 441. 391, M l . » 1 , 241. 1*1, 141, »1, 41. 121
Slug t « * u 3 « atPraaaurc aulM taatf 3-C tnDrill i t * * tMta 1 * «n
laUrr«rane« laat. »u«p*d MCltoa
Traear tMla. Mtaplfd Mct io*
t • |«>C t «*J MCtiOB
Cft«*leal aaoaalc. a«ra flulda
100 200 300 400 BOO 100 TOO SCO 900
0 0
0 0
0
o
0
O <|>
o
0 000 0 O 0 (BOO
O COD 0 O 0 (UOO
-
• -
0 O O CD
Survty parlod
?Rnos - Tsia.is
87 1C - 87 11
Tt-.Ol.Qt
B409 L2
84.0912. B4 09.13
84.09 12
84 09 12
60 00 00
67 10 - 67 11
67 0128
79.01 18 - 79 03 20
67 0121 - BTOI 20
81010t
04 10 31 - 66 0219
090220 - 85.04.IT
86 031& 66 1116
60 0117 - 0» 03 36
86 0311 69 04 0989 04 03 SO 00 20
89 04 25 - 09 00 13
80 06 27 - 86 07 17
80 06 M - U 0 6 0T
Raa«rU
SKBF/XBS TR 79 03SK I AR 67-OS
SKBF/nr» : R Tt-osSKB TK 88-00
SVBF/XBS TR 78-05SKBP/KBS AR 60-13SK BP/K BS AR 61-36
SKBP/KBS AR 0135
PRAV 420SK BP/K S3 TR 02-20SKBP/KBS TR 02 26SKBP/KBS TR 02 20
SKB AR 90-34
SKBP/KBS TR 02-26
SKt TR 9106
SKB AR 00 09SKBP/KIS TU 7909
SKB TR 88-06
SKB TR 66-06
PRAV 415fKB TR 00 05
PRAV 415SKB TR 00-05
SKB TR 86-06
SKB AR 07-27
PRAV 4 15
SKB AR 00-54
SK B AR 00-06
SKB TR 00-27
SKB TR 06 27
SKBP/XB3 TR 01-10SKB TR 06-27SKB AN 88-00
SKB TR 06 27SK8 TR 88 27SK 8 TR 66 27
SKB TR 86-06
SKB TR 88 06
SKB AR 00 09SKB TR 68-19SKB TR 80-12
SKB AR 90 2?SKB AR 90-34
SKB AR 90 24
SKB AR 90-27
SKR AR 90 27
SKB TR 07-16. 89 19
CC0TA
X
X
X
X
X
X
X
X
X
X
X
Figure B7. Activities in borehole KFI06. Data from borehole sections storedin GEOTAB have thick lines.
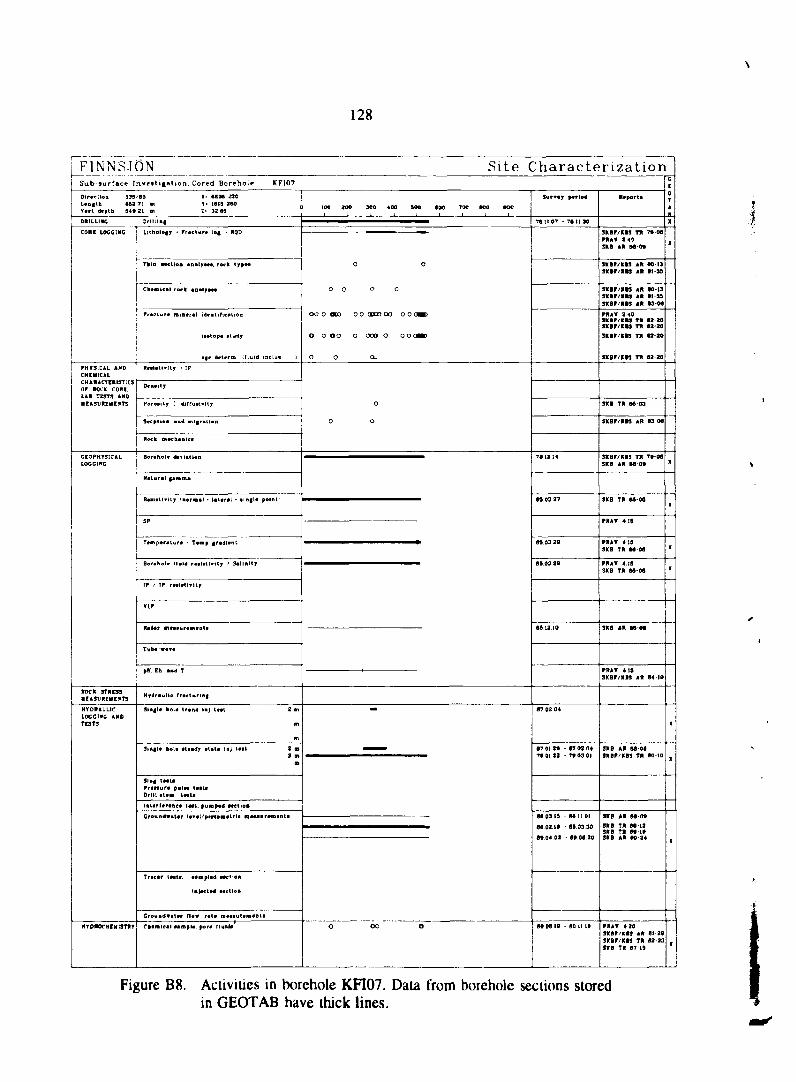
128
FINNSJÖN Site Characterization
Direction 3»/83 X- » M 220 |
EfV s s : ; :si~ • >- « r « . „ . . „ ™ - -DRILLING
CORE LOGGING
PHYSICAL ANDCHEMICALCHARACTERISTICSOF ROCI GOBI.LAB TESTS AND
LOGGING
ROCK STRESSMEASUREMENTS
HYDRAULICLOGGING AMDTESTS
MYDHOCHEMtSTRT
Drilling
lltholegr • Praclurt log • RQD
Tfeia MctioD aa»lya«*. rock typva
Cbvmical rock analrp**
iaotopo »tudjr
• 1 * determ (fluid inclu» 1
R»uti«itr • ip
D«Mitr
Sarpttaa and Bikgr>U*n
Rock Mocttcnics
H*tur*l | i « n t
R«ilatlvtLy (normal • latortl • ttngl* point?
SP
Borahaltr fluid (-••Ittlvtty / S«linltj
vi,r
T i iWvt f t
pH.Eh and T
Slugt* kol* Iran* In) test 2 m
m
3 mm
SlHg t H l fPrtMur* pvlM I M UDrML «l«M l « U
lalarlcrcae* I M I . pu«p«d Metloa
Crouod*Bt«r l»T*I/ft«o»itrlc n N i i r n i i i t i
Tracer t til», nnplad MCIION
I»)*ctt4 Metloit
CliMlcil Moipl*. port riulda
O 0
0 0 O 0
OO O ODD 0 O QOOO OO O O CkaV
O O OO D OCO O OOOVD
0 0 Ou
o
0 O
O OO O
Survty s«rlo4
T«tl 07 - 7» It 30
?a tz K
»9 03 27
83 03 29
85 03 29
•Ö12I0
87 02 04
87 Ot a» «7 03 0479 0112 - 79 03 01
010315 - 00 II 01
eeozi» - fl»os30
a» 04 02 8»0«20
80 OS 10 • 80 111»
••porta
SKBP/EIS TR 7»-0flPRAV 249SKB AR M 09
SKBP/IBS AR «013SVBF/KB3 AR »I-3S
SKBP/KB3 AR SO 13SKIP/IBS AR 81-USKer/RBS AR B3-M
PRAV 2 40SKBP/KB3 TR 11-20SXBr/KBS TR »2-20SKBP/RB3 TR 82 20
SK BP/ms TR ea 20
SKB TR SS 03
SKBP/RBS AR 83 M
SXBP/RB5 TR T» 09SKB AR M 09
SKB TR 84-05
PRAV 4 19
PRAV 4 IS5KB TR 88 06
PRAV 4.15SKB TR 86 05
SKB AR M 0 9
PRAV 4 1»SKBP/KIS AR 84 10
SK8 AR S8-O09KBP/KB9 TR 80 10
9KP AR 68-00
SKB TR »9-12SKB TR 00 I»SKB AR 00 24
PRAV 4 20SKBP/KBS AR 01 20SKBf/KBS TR 82 23SKB TR 67 [5
CE0TAHX
X
X
X
X
X
X
X
X
X
Figure B8. Activities in borehole KFI07. Data from borehole sections storedin GEOTAB have thick lines.
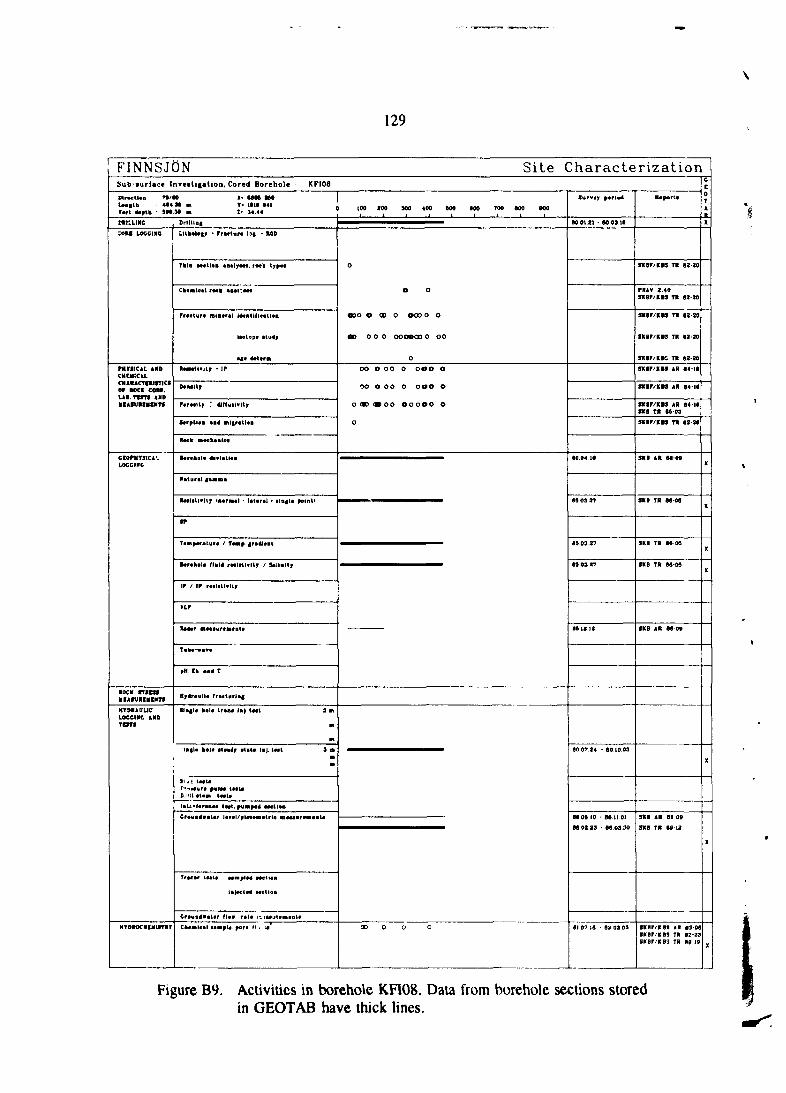
129
FINNSJÖN Site CharacterizationSubsurface IriTeitigation, Cored Borehole KFI06
OlpvctUn T5VUagth 404»•ft «*ttb 90*
COM LOGGING
PHTSICAL åMOCHWtCiLCHARACTIRItTICSOF BOCK CORK.UB.TSSTS AMD•EA5VRCHCRT»
CEOPHTSICA'.UKCIRC
ROCK messMEASUREMENTS
HYDRAULICLOCCtHC fcNftTESTS
HVDBOCHIHtSnir
» I* MBS MtM B T> !• ! • 041U n 2- 34.44
Lttb*l»|r * FncUrt l->$ • RQt>
Thin »action •a»lr**«> r*ck typtt
Ck*iajica,l rock *B«lrM*
frcetur* mtetral ltf*milicati«D
liotop» I U O
•«« tettrn
RMtttlfity • IP
p*r*iup : wrmtvitr
S«rptl«B «n4 nl|r«tt*B
Rack m*eh«Ble«
B«r*kol« 4a«i«t»«»
Natural I I M B I
R4aiill*ltr <K«rM«l • I tUri l • ila*l« •eint*
SP
Ta*i»«r«lur« / limp |radJ«Dl
B*r«kal« flwl4 rMlrtlvltf / Sallallj
VLF
Hater ai««tur*««Bla
1»W-*a*«
pH. th antf T
Kj4r«ullc rr««turlng
llM|la kola Lr*M tfc) t«at 3 n
•n
• i
l«fl« h«la atavdy ilaU IBJ. tail ' 3 »
m
*l i1 taaUr'->*flura M * M I M I CS '11 al«M t«atf
liU'far«Bca laat.punpatf acctlor
Crauntfvatar laval/alM«B«trl« m««aaraa«aU
Tr«c«r iMta, aanplad awctiaii
ia)a«ta4 wt l l ta
Craua^valar fl«v rala t- iMutaravnla
Cft«iBleal låBftl*. pora ri i m
tOO 100 300 400 ftOO 800 TOO BOO MO
O
O O
•JDO O flD O OOOO O
OD o o o ooooao o oo
0
OO O OO 0 OOO O
OO O OO O OOO O
O OD d» OO OOOOO O
o
CD O O O
Survay parled
•0.04. K
06 03 27
65 03 27
BS0327
H 12 13
00 07 24 - BO LO 03
81 Oft 10 - M i t 01
86.02.23 - S6.03.30
61 07 16 62 02 03
Haparta
SK B F/IBS TR 02-20
PRA V 2.40SKBF/KB3 TR 02-20
SKBP/KM TR 02-20
SKBF/KB3 TR 02-20
SKi r /Kt * TR « 2 »
SV8P/XBS AR 04-1*
SKBF/KPS AR 04-IC
SVBP/XK AR 0416SKB TR 68 03
SKBrVXK TR 02-26
SKB AR 66-TO
SKB TR B60S
SKB TR 6606
SK8 TR 86-06
SKB AR 66-0*
SKB AR 6B 00
SKB TR 60t2
SKBr/KBS AR B3-06SKBf/KBS TR 0223SKBF/KB5 TR 00 10
X
X
X
X
X
X
X
Figure B9. Activities in borehole KF108. Data from borehole sections storedin GEOTAB have thick lines.
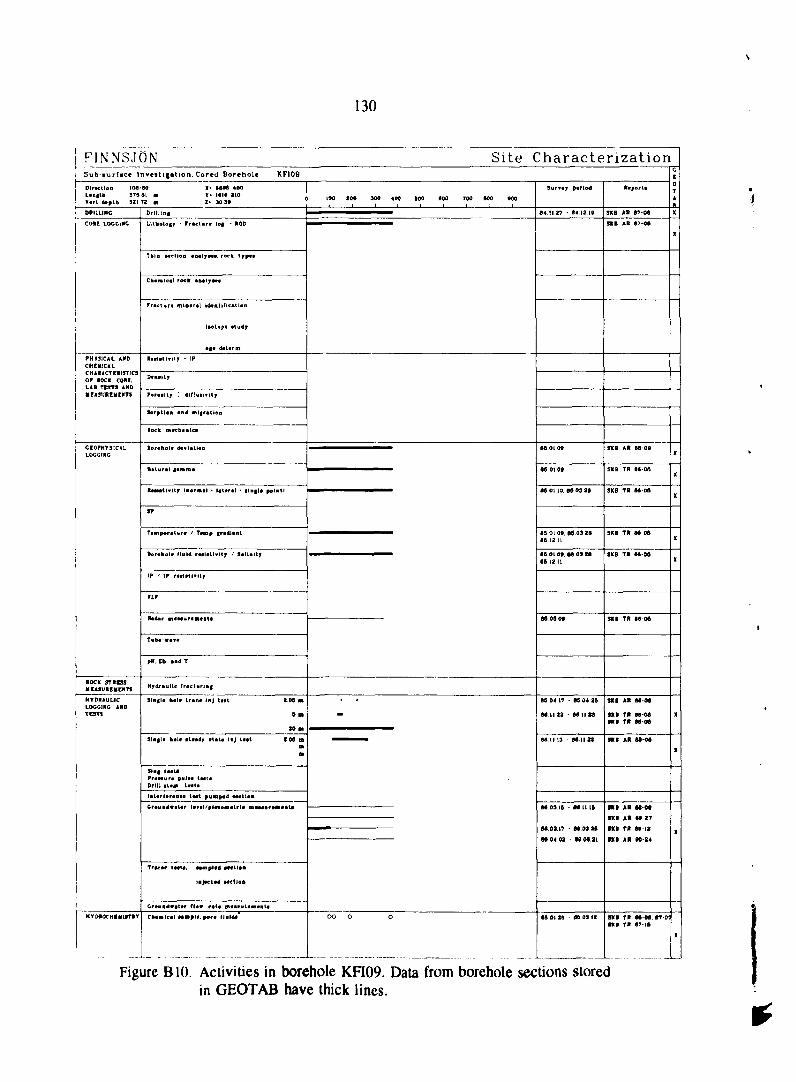
130
FINNSJÖN Site CharacterizationSub-aurface lnveiti jation, Cored Borehole KF109
DlrKtlan 104Lvoilfa S?»V«rl d«ptb M t
COM LOGGING
PHYSICAL ANDCHEMICALCHAR ACT ERISTICSor ROCK co«i.LAB TESTS AND
GEOPHYSICALLOCCIKC
ROCK STRESSMEASUREMENTS
HYDRAULICLOGGING ANDTEST*
HYDROCHEUtSTIT
60 X' M M 4soat m Y> 1610 210TZ m Z* 30 3»
Ulbolof]> • Praelurt lo | • RQD
Chemical r«ck artalyaea
Uolopt aiudjr
• |a Mt irm
Raeiatlvltv * IP
SarptloR end nl|r«tton
Rock m«ch«Blea
Bor«hol* dtwi«tl«a
Hviursl p n n i
RMlatlvltf (itariBal • lét«ril • tlDfl* point*
SP
vir
Radar •iiHurinfDU
Tub« V I M
pH. Cfa and T
Hydraulie fraelurlug
Sln«l« kola Iran* In) U*t 2.0ft m
O n
20 n
StNfl* b«U ttvadr alaU Inj taat 3 « »
StHf tHLtPr«Mun pula* laataDrill i t * * L«ata
laurlaranca ta«t. puaspad taellaB
T fleet laat», wnpltd ptelKn
Cfeaaleal tanal*. a«r* t Inlås
I M 200 300 400 600 6DQ 700 HO ftOO
-
OO 0 O
Survey parlod
8ft 01 09
as oi o«
S8 01 10. » 0 3 26
65 01 09. 09 03 288ft.l2.lt
8ft 01 0». S» 03 288ft 12 11
6ft Oft 0»
89 04 17 - 89 04 2ft
86 1122 - 861123
66 1113 66 II 23
66 03 IB - M 11 IB
64 0217 - 68.03 2ft
N 04 03 - 80 06 31
6ft 01 25 0ft 03 12
Raporta
SKB AR 6706
SKB AR 68-0*
SXB TR 66-00
SKB TR M Oft
SKB TR 68 Oft
SKB TR 86-06
SKB TR 66-00
SKB AR 68 08
SXB TR 66-061KB TR 86-06
SKB AR 66-06
SKB AR 66-0t
SKB AR 6» 27
SKB TR 68 12
8KB All M 24
SKB TR 66-OA. 87-08KB TR 87 1ft
X
X
X
X
X
X
X
X
X
X
Figure BIO. Activities in borehole KFI09. Data from borehole sections storedin GEOTAB have thick lines.
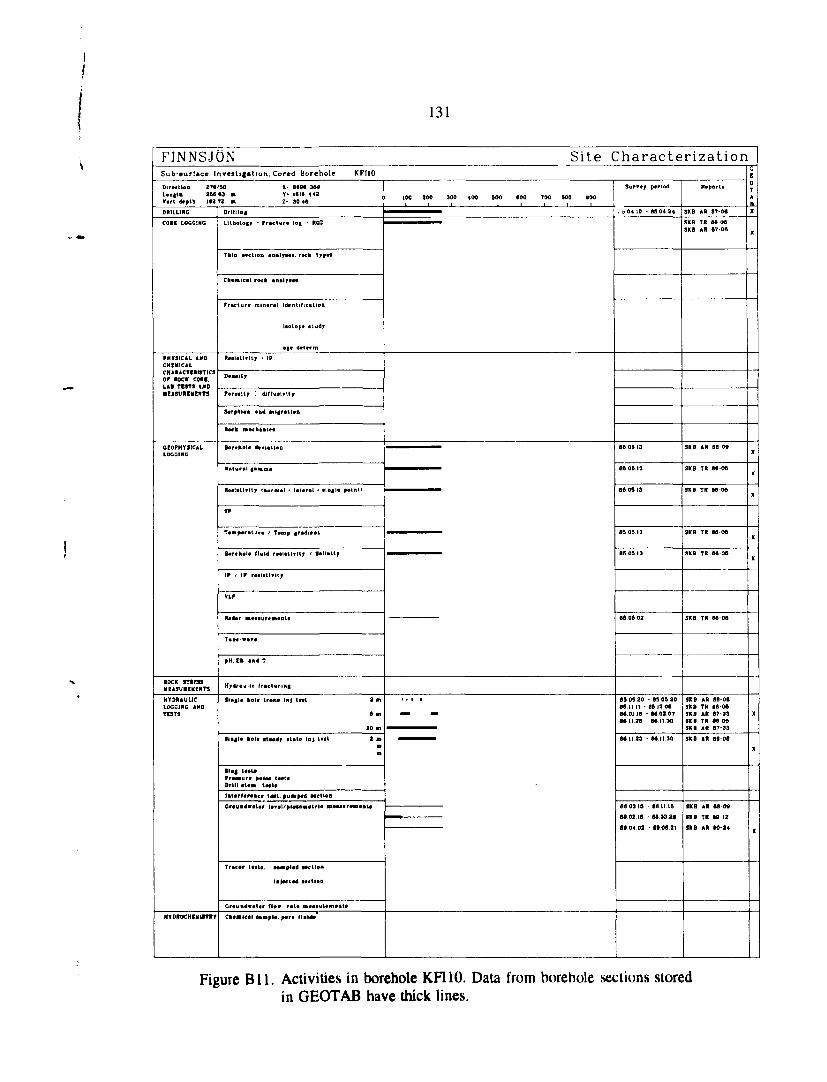
131
FINNSJÖN Site Characterization
Direction 278/90 X- 6 I M 360L»ngth 86863 m Y» 1616 443Vtrt dapth ItZ TZ m Z- 30 46
CORI LOCCINC
PHYSICAL AMDCHEH1CALCHARACTERISTICSor ROCK con.LA> TESTS 1MDMEASUREMENTS
GEOPHYSICALLOCCINC
ROCK STRESSUEASUREKEflTS
HYDRA UUCLOCCtHC AMDTESTS
HrDROCHBKUTRr
Litbalegr • Practura log - ROD
Thin wet ton a nair a*a. roeh typta
Chemical rock t n i l j i H i
liolopc Huåj
• | t 4«ttrm
Raatatlvltf • IP
Daiwtl?
P«rotitr : dJffui i t i t f
S«rpll»aj *n4 n t | r« t l «n
Rock m*cbaBlcfl
Bert holt tftviatloa
Natural ( i i i m i
Raalatlvltr litormal • lalaral • tlnsta p»tnl>
SP
B«r«holo fluid raalatlvltf / Sallaitj
IP / IP raaiitlvltr
VIP
Rad*r m«a«urf«i«Dta
Tub«-wa*«
pH. Ch and T
Hrdraulic ffftctvrlng
SiRjI* hoi* Iran* inj t t i t 2 m
20 m
SiB|l« hole fttadr attic In) tMt 2 n01
B
I I U$ t M UPrtNurt ptilac laata
UtcrfarcDec I M I . *uaap«d Mctloa
CroundwaUr la*a!/pt«wan«tri<9 ntai iramtBU
Tfacar itata. M M pi ad M C H » "
lt>act«4 a«et(oB
Ck#«leal umnla, »«ra Malda'
100 200 300 400 500 600 700 BOQ BOOi 1 1 1 i i i i i
i t * a
S«r*ay p«rtod
88 05 13
66 06 13
06 Oft 13
65 05 13
85 05 13
66 06 02
66 06 20 - 65 05 308611 II - 8513 0688.01 18 - 66 02 OT•8 II Z8 - 86 11.30
66 1123 - 6611 30
66 031ft - 86 II 1ft
M 0 2 I 6 - HQ326
00 04 02 - 0006.21
R«porta
SKB TR 66 MSKB AR 67-06
SKB AR 66 0*
SKB TR 6606
3K8 TR 86 OS
SKB TR 66-05
SKB TR 6806
SKB TR 6606
SXB AR SB 069K8 TR 6606SKB AR 6T-33SKB TR 68-03SKB AR 07-33
SKB AR 66 08
9KB AR 68 00
SKB TR 60-12
SKB AR 00-24
E0TAR
X
X
X
X
X
X
X
X
X
Figure B l l . Activities in borehole KF110. Data from borehole sections storedin GEOTAB have thick lines.
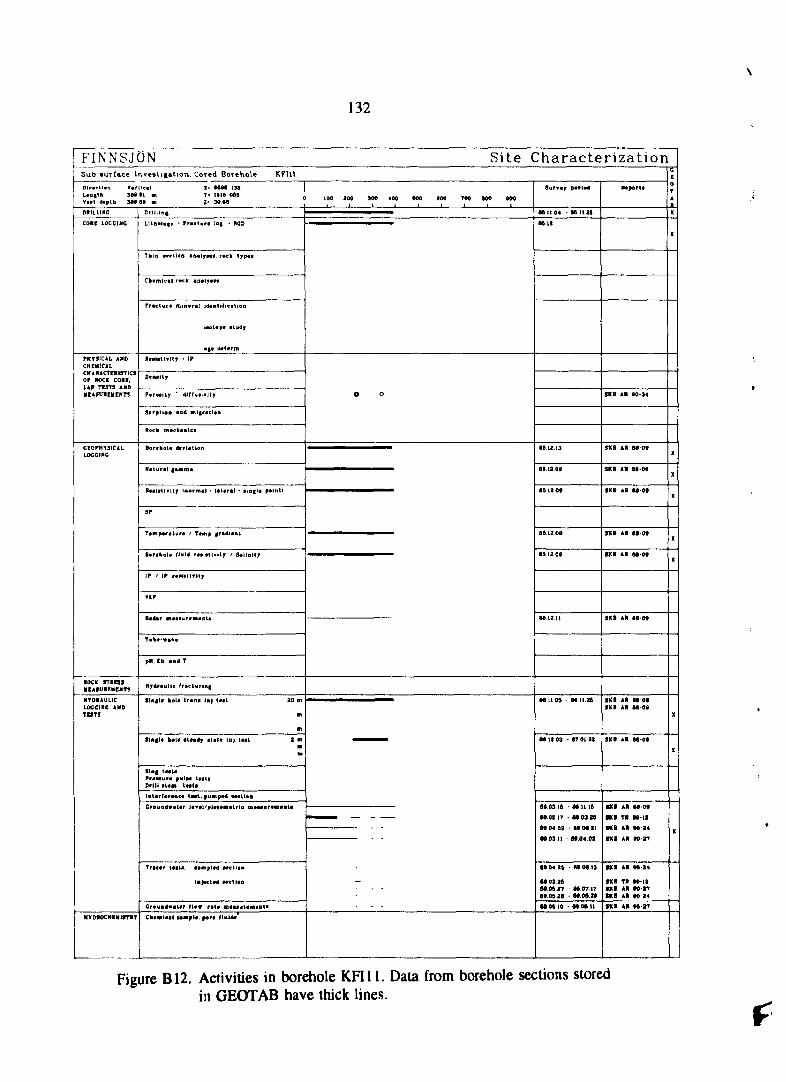
132
FINNSJÖN Site CharacterizationSubiurf&cc Investigation. Cored Borehole KFttt
Dtr*ctl«n Vortical X- M M 139L«n«ih see et * i Y* teie 06BV.r l d*p'.h 38» 89 m Z- 30 66
DtlLLINC
CORE LOCCINC
PHYSICAL AXDCHEMICALCHARACTERISTICSOP ROCK CORK,LAP. TESTS AMD
LOCCINC
ROCK STRESSMEASUREMENTS
HYDRAULICLOCCINC ANDTerrs
HYDROCHlKIfTRT
DMIltot
Lit hoi o*? • fracture lag • RQD
Tain Kction ar>al)>at*. rock typ#i
iaolop* iludr
•g* d«t«rtn
ftaalitlttir • IP
D«iwllr
Rock macbaalea
Natur»! { M i n t
Raalaimty (normal • lateral • tingle point)
SP
Temperature / Temp gradient
Bonhale fluid rMl«tt*ilr / Ssllnltf
IP / IP rcilttivttr
VLP
R*4«r *i*Mur*Di«nt«
pH. tb Md T
Kfd/iullc frtteturiM|
Single kel« Iran* In) taat 20 m
m
m
siptgit b«i* ft«*dr i i in IDJ i«fi 2 mm
II Hf IMUPr«Mur* pulM ttitiOrlll I U M t«ftt
Ial«r(«r«ee« Ittl, punpid MCIIOB
CrouadvaUr l«v«l/»l«4»a«lrlo rncuirvncoti
Tr«c«r (fill, ••itipitd Mellon
lapMt«d f«ell«B
Ch**leal MBpK. f*T» Hulda
LOO ZOO 300 400 600 BOO TOO 600 »00i i i i i i i i i
O 0
-
Survey period
BS.tl 04 - M.II.2S
8912
astzi3
M ISO»
8M2 09
8ft 12 00
89 12 01
89 1211
88110» - 19 I I 29
88 12 03 - IT 01 22
880915 - M i l It
88 02 17 - N 0 3 29
M 04 02 - I I 0 8 21
M 0 3 I I • 88 04 03
e« 04 2» - W O».I3
SI 03 3888.09.27 - 88.07.17810928 - H »
UM 10 - MM 11
••port*
SKI AR K-34
SKI A» 98 Ot
SKI A» ee-Of
SKI All B8-0«
SKB Al 99 0»
SKI Al 9808
SKB AH SB'O»
SKB A« 88-08SKB AR M-0B
SKB A> 8808
SKI AH HOB
SKB TU IB-It
SKI AR 80-24
SKB AR B0-27
8KB AR BO-24
SKB T» M-I2SKI AR 80-37• K l Al 80-24
SKI AR 80-37
[0TAn
X
X
X
X
X
X
X
X
X
Figure B12. Activities in borehole KFI11. Data from borehole sections storedin GEOTAB have thick lines.
\
133
APPENDIX C
GENERALIZED RESULTS FROM BOREHOLE MEASUREMENTS f
Generalized results from core mapping and borehole measurements/tests inthe cored boreholes KFI01-KFI11 are presented in Figures C1-C4. For eachborehole the following information is presented; rock types, location offractured sections (including interpreted fracture zones) and locations ofsections with increased hydraulic conductivity. For comparison, alsointersections with interpreted fracture zones are shown in the figures. Thegeneralizations have been made in the following way:
Rock types
Main rock types are shown, i.e. rocks with a width/extension along the coregreater than 1 m. Amphibolitic and doleritic bodies or dykes are collectivelytermed greenstone.
Fracturing
Increased fracturing is noted where the fracture frequency exceeds 10 fr/mover a 10 m section of the core.
Increased hydraulic conductivity
Increased hydraulic conductivity is noted for borehole sections where theconductivity is more than 10 times higher than the average hydraulicconductivity for the rock mass at the depth in question (sec Figure 19 inChapter 6). Highly increased hydraulic conductivity is noted where theconductivity in the borehole section is more than 100 times higher.
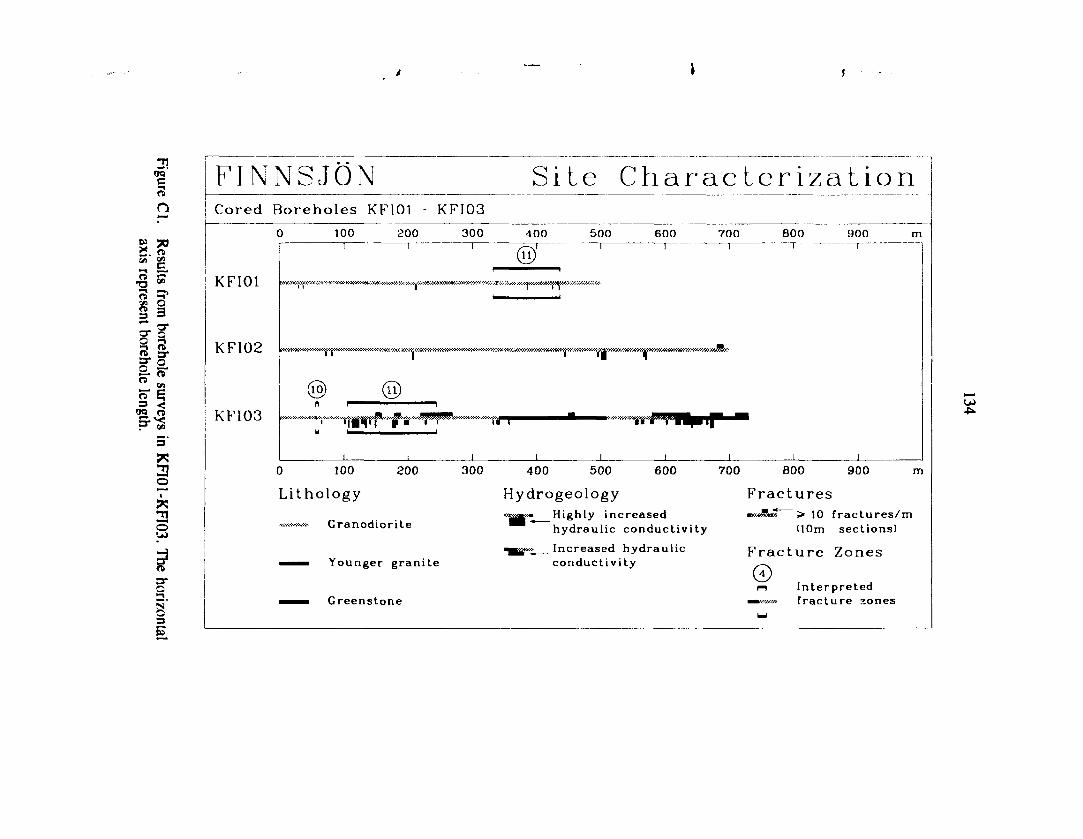
ts
repi
nsen
a-
nhoi
nS"3
OQ
S-
TOC
3Cl.
73nc_
iJ3 *Oft.en
en
3"
ao
1
303.1
aro
IFINNSJÖN Site CharacterizationQ I Cored Boreholes KFI01 - KFI03
100—I—
200 300—I—
400 5001—
600—I—
700 B00 900
KFI01
KFI02
KFI03
mvKvT^X^X-X'XW^^
0 100 300
Lithology
Granodiorite
Younger granite
Greenstone
300 400 500 600 700
Hydrogeology
Highly increasedhydraulic conductivity
'^__Increased hydraulicconductivity
BOO
Fractures
900 m
> 10 fractures/m(10m sections)
Fracture Zones
i-i Interpreted
fracture zones
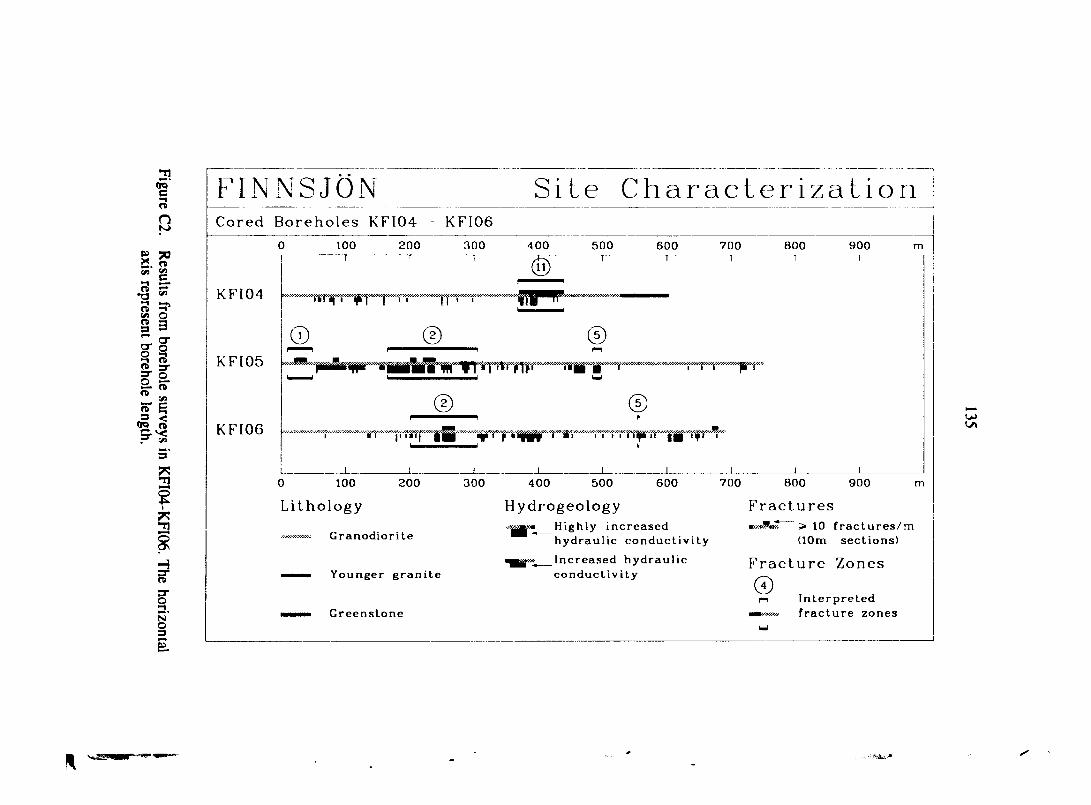
09
— •
n•aasen
§•jhole
nsW35-
aoc
OJO
70»9C^f~
v-?
UIO
O"
nole
<6v ;
FINNSJÖN Site CharacterizationCored Boreholes KFI04 KFI06
I1I
o 100 200 300 4 0 0 5 0 0 600 700 800 9 0 0
KF104
®•*N>»t»>»^*W£*«wwccäo*>*5«cwK«
1\. f I 0 O K««HHw.™«Nffl^»M«««»J»«0g«ÖK«S^^B^
KF106
0 100 200 300 400 500 600 700
Lithology
Granodiori te
Younger granite
Greenstone
HydrogeologyHighly increasedhydraulic conductivity
Increased hydraulicconductivity
800
Fractures
9 0 0
> 10 fractures/m(10m sections)
Fracture Zones
©(—i Interpreted
fracture zones
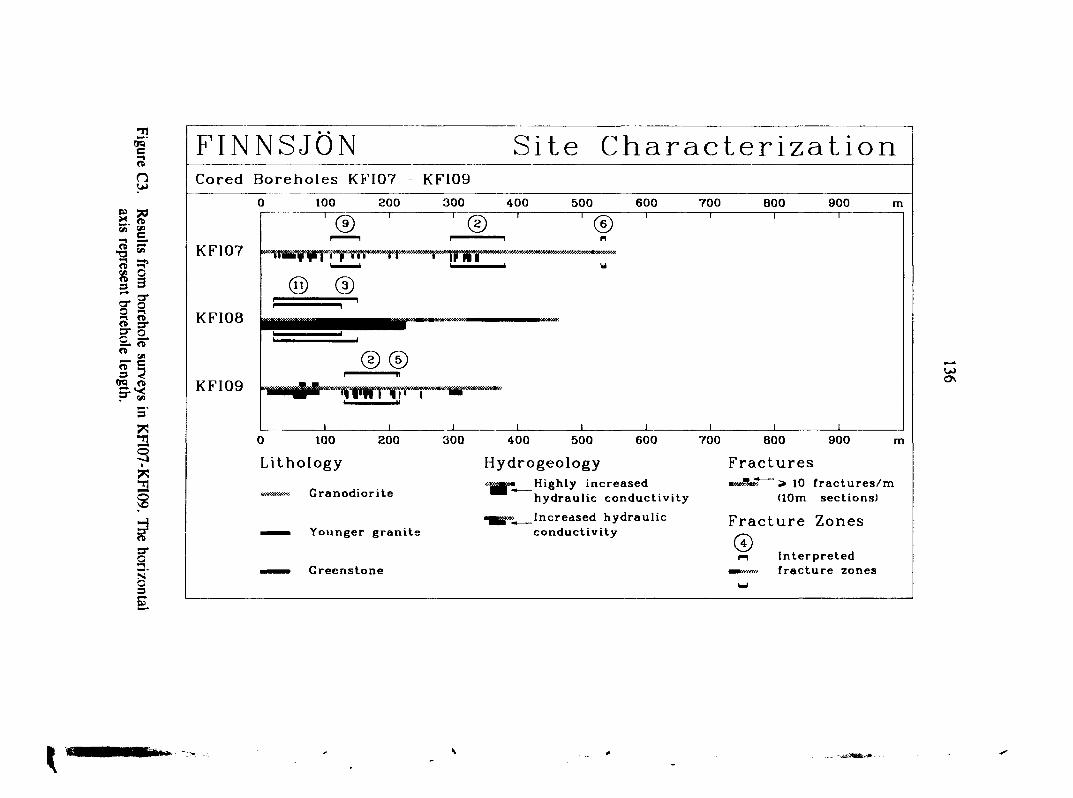
o
i§a*
3* O
OQ
FINNSJÖN Site CharacterizationCored Boreholes KFI07 - KFI09
KFI07
KFI08
KFI09
0 100 200
Lithology
Cranodiorite
Younger granite
Greenstone
300 400 500 600
HydrogeologyHighly increasedhydraulic conductivity
»j, Increased hydraul icconductivity
700 800 900
Fracturesm
~ > 10 fractures/m(10m sections)
Fracture Zones
n Interpretedfracture zones
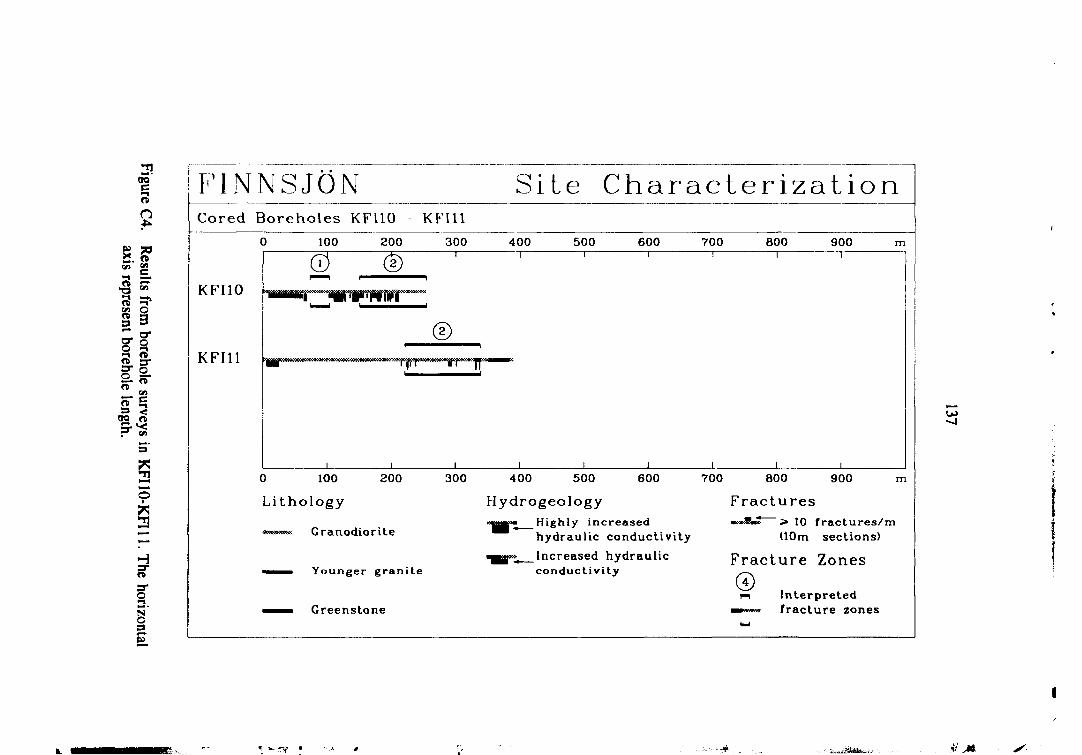
XOB*
:sen
or
o
3gth.
C5n
U1O
J
bor
ETO,fB
•«*eys
5'
|o
FINNSJÖN Site CharacterizationCored Boreholes KFHO - KFI11
i
o 100 200 300 400 500 600 700 800 900
KFI10
KFI11
0 100 200Lithology
Granodiorite
Younger granite
Greenstone
300 400 500 600Hydrogeology
Highly increasedhydraulic conductivityIncreased hydraulicconductivity
700 800
Fractures
900
> 10 fractures/m(10m sections)
Fracture Zones
i-i Interpretedfracture zones
ii M,
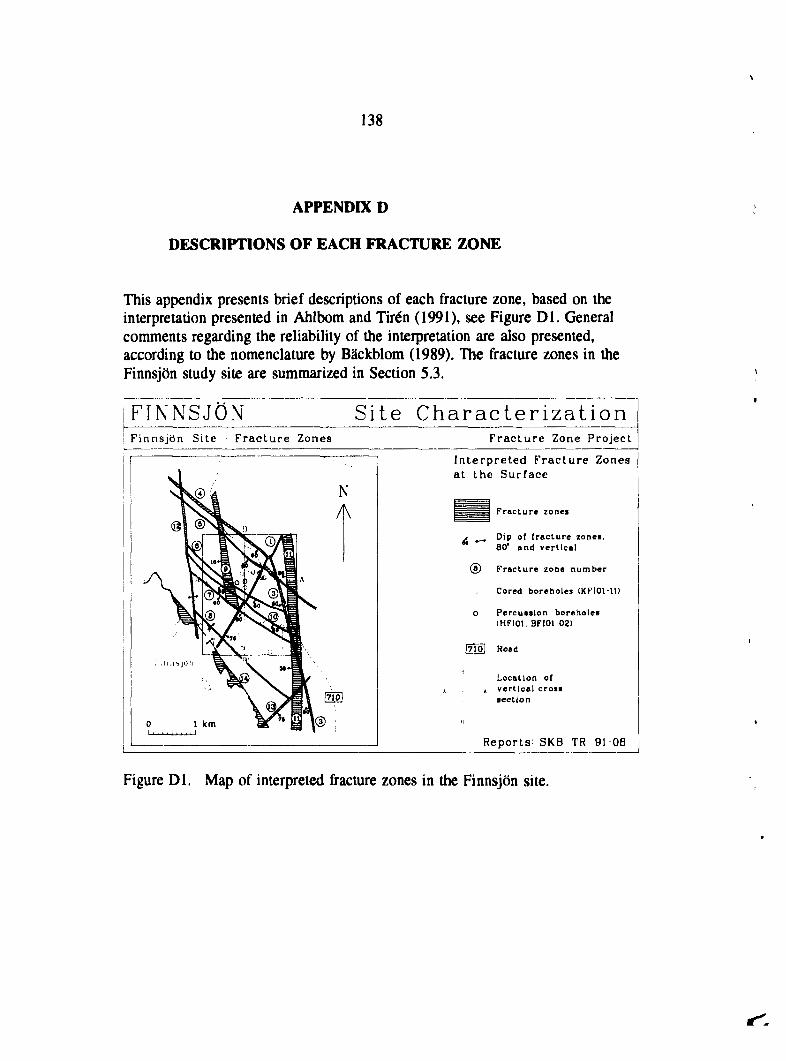
138
APPENDIX D
DESCRIPTIONS OF EACH FRACTURE ZONE
This appendix presents brief descriptions of each fracture zone, based on theinterpretation presented in Ahlbom and Tirén (1991), see Figure Dl. Generalcomments regarding the reliability of the interpretation are also presented,according to the nomenclature by Bäckblom (1989). The fracture zones in theFinnsjön study site are summarized in Section 5.3.
FINNSJÖN Site CharacterizationFinnsjön Site - Fracture Zones Fracture Zone Project
Interpreted Fracture Zonesat the Surface
®
Fracture zone»
Dip of fracture zones,SO' and vertical
Fracture zone number
Cored boreholes lKFIOl-11)
o Percussion boreholes(HF101, BF101-02)
(710] Road
Location ofvertical crosssection
Repor ts : SKB TR 9 1 0 8
Figure Dl. Map of interpreted fracture zones in the Finnsjön site.
139
ZONE 1 (Brändan fracture zone)
The most prominent lineament transecting the Finnsjön Rock Block is causedby Zone 1. The zone is oriented N30E/75SE and with a length of c. 5 km.The width is estimated to 20 m. In addition to its lineament expression, the/.one is also indicated on geophysical maps and identified in the cores fromborehole KFI05 and KFI10.
The surface expression of Zone 1 is an open, about 5-50 m wide, peatcovered gully. Fracture surveys in the eastern part of the Finnsjön siteindicate that Zone 1 constitute a border between rock blocks of differenttectonic character. The rock block south of Zone 1 is characterized bynortheast trending fractures with pink coatings of laumontite and hematite.Fractures of this type is rare in the northern rock block. The different tectoniccharacter between the blocks indicate that faulting has occurred on Zone 1.The degree of fracturing in the surrounding outcrops does not increasesignificantly when approaching the zone.
The difference in tectonic character is also indicated by a ground resistivitysurvey (Ahlbom et al., 1986) in which Zone 1 constitute a boundary betweena fractured part of the southern rock block (in the area where boreholesKFI05 and KFI10 are located) and a low-fractured northern rock block.
Two cored boreholes, KFI05 and KFI10, intersects the Brändan zone. Thecores from the Brändan zone are altered and red coloured. The fracturefrequency in the zone is high, ranging between 8-20 fr/m, with the highestvalues along the western side of the zone. Characteristic fracture infillings arehematite and asphaltite.
Water injection tests in Zone 1 have been carried out in borehole KFI10.This borehole penetrates, within a close distance, both the Brändan zone andthe upper part of Zone 2. This is reflected in a high hydraulic conductivityfor all 20 m sections for the total length of the borehole (256 m). However,an increase of the conductivity is measured at the intersection with Zone 1.Here, the conductivity values ranges between MO"6 m/s and 5105 m/s atvertical depths between 57 and 76 m. The hydraulic conductivity of thecountry rock is 5-10 times lower.
Reliability: The strong surface expression of the zone, both as a lineamentand as a geophysical anomaly, together with the identification of the zone intwo boreholes implies a reliability level of "certain", according to theBäckblom nomenclature.
140
ZONE 2 (the subhorizontal - gently dipping fracture zone)
Zone 2 has been thoroughly investigated during the fracture Zone Project(Ahlbom & Smellie, eds., 1989). A great amount of data is thereforeavailable and is summarized below. Zone 2 is oriented N28W/16SW, c. 100m wide and with a estimated length of c. 1.5 km. Zone 2 has not been foundto outcrop within the Finnsjön Rock Block.
Zone 2, is defined in eight boreholes located within an area of c. 500 m x500 m in the eastern part of the northern block (north of Zone 1).In the eastern part of the northern block the upper boundary of Zone 2 isalmost planar, oriented in N28W/16W, and located in boreholes between 100to 240 m below the ground surface. The location of the lower boundary isless distinct. In general, Zone 2 is interpreted to have a width of about 100m. In the western part of the northern block the upper boundary of Zone 2 isinterpreted to occur in borehole KFI07 at a depth of 295 m. Since this issomewhat shallower than expected, Zone 2 can not be planar between theeastern and western parts of the northern block (cf. Figure 38). There is noindication in the boreholes in the southern block that Zone 2 extends acrossZone 1, into the southern block.
Although Zone 2 is expressed as an c. 100 m wide more or less altered zone,the fracture frequency is generally low within Zone 2, except for two or threefractured sections in each borehole. These sections are narrow, 2-30 m wide(often 2-5 m wide) and are mainly located at the upper and lower boundariesof the zone. The hydraulically conductive parts of these sections are evenmore narrow, in some boreholes the widths of these parts are in the order of0.5-1 m. Narrow fractured parts in the central part of the zone also occur insome boreholes. The average fracture frequency for Zone 2 is 5 fr/m.
The water injection tests show for most boreholes a general decrease inhydraulic conductivity towards depth for the bedrock above Zone 2. Thisdecrease is interrupted by the zone, where the hydraulic conductivityincreases by one to four orders of magnitude to values between 106 - 10"5
m/s (measured in 20 m sections). Using much smaller packer intervals, 2.0 mand 0.11 m respectively, the latter only in borehole BFI02, indicate that themost conductive parts of Zone 2 merely consist of a few very narrowsub/ones with a width of only about 0.5 m. The uppermost of thesesubzones, which coincides with the upper boundary of Zone 2, is highlywater conductive (10'4 m/s). This subzone can be correlated between allboreholes in the northern block.
Towards the bottom of Zone 2 there are several "narrow subzones" with veryhigh hydraulic conductivity (more than 104 m/s measured in 20 m packed-off
\
141
sections). These conductive subzones are separated by bedrock with lowhydraulic conductivity. Below the zone the conductivity is in general low(1010-10" m/s) with several minor sections with high hydraulic conductivity(107-106 m/s). Given the narrow widths of the subzones, the hydraulicproperties of Zone 2 should preferably be expressed in terms oftransmissivity rather than average hydraulic conductivity of longer testsections. The transmissivity of each subzone has been estimated to 1-4-103
nr/s.
Reliability: The observation of Zone 2 in a large number of boreholes impliesa "certain" reliability level for the zone.
ZONE 3 (the Gåvastbo fracture zone)
The N15W/80W trending Zone 3 delimits the Finnsjön Rock Block to theeast. The zone is at least 5 km long and c. 50 m wide. Zone 3 is penetratedby one cored borehole, KFI08.
Zone 3 is morphologically expressed as a depression floored by moraine,then clay and on top a thin layer of peat. Soundings indicate a depth of thesedimentary cover in the order of 5 m.
The core mapping of KFI08 has not been reported. However, a brief look athe worksheets from the core logs show the following characteristics for theGåvastbo fracture zone. Zone 3 is highly fractured with mylonized andbrecciated sections. Common fracture minerals are epidote and chlorite. Theamount of aplite and pegmatite dykes increases towards the end of borehole,indicating that the contact between the granodiorite and the young granite,east of Gåvastbo fracture zone, is close.
The core mapping, geophysical logging and radar measurements suggest thatthis fracture zone is subvertical, dipping 80-85 degrees towards the west.However, as discussed under Zone 11 (see below) the dip can also be moregently c. 30-40° to the west.
The geophysical logs indicate a strongly fractured bedrock down c. 120 mborehole length corresponding to a width of the zone of about 60 m.However, since it is possible that this fractured section also includes Zone 11(see below), the width estimate is uncertain.
Water injection tests in 3 m sections have been performed in borehole KFI08from 43 m to the end of the borehole (458 m). The results have not beenevaluated and reported but available data suggest values of hydraulic conduc-tivity between 10"6 m/s to 107 m/s down to 225 m borehole length, corre-
142
sponding to c. 200 m depth. Below this depth the hydraulic conductivity iscommonly between 109 m/s to 10"10 m/s.
Reliability: Zone 3 is strongly expressed topographically as a wide andextensive lineament. Borehole KFI08 confirms the existence of a fracturezone. There are however uncertainties regarding its dip. The presentinterpretation should therefore be regarded as "probable".
ZONE 4
This northwesterly trending fracture zone is located outside the FinnsjönRock Block to the northeast. Zone 4 is defined by a c. 1 km long N50Wtrending lineament indicated on topographical maps and aerial-photos. Noborehole information exist regarding this zone. However, as this zone issituated close to and is related to Zone 5 and has the same orientation, thesame dip as Zone 5 (60 degrees towards SW) is suggested. Assumed widthof Zone 4 is 10 m. Reliability: "possible".
ZONE 5
This zone (Norrskogen lineament, Figure 27) is traceable for c. 5 km and hasa northwesterly orientation (N50W). Zone 5 delimits the Finnsjön RockBlock to the northeast. It is well expressed as a lineament on both aerial-photos and on topographical maps. A dip of 60 degrees towards thesouthwest is suggested for this zone. If so, the Zone 5 coincides withweathered and fractured sections in the boreholes KFI05, KFI06 and KFI09at 493 m, 555 m and 214 m, respectively (borehole length). Thisinterpretation will result in a width of the zone of, at least, 2-6 m. Thehydraulic conductivity of Zone 5 decreases with depth from 2-1O'5 m/s to910 8 m/s, at depths of 185 m to 555 m.
Reliability: The combination of a lineament and three fractured sections inthree boreholes all lying in the same plane is a strong argument for theexistence of the interpreted zone. However, the frequent occurrence offractured sections in boreholes and the lack of a comparison of corecharacteristics between the sections makes "probable" a relevant reliabilitylevel for Zone 5.
ZONE 6
This smoothly curved northwesterly (N55-65W) trending fracture zone, c. 2km long, is only poorly expressed on aerial-photos and on topographicalmaps. However, ground geophysical measurements indicates that thesoutheastern part of the zone constitutes a boundary between a fractured rock,
\
143
to the north, and low fractured rock to the south of the zone. As this zonehas the same trend as Zone 5, a dip of 60° towards SW is suggested. Withthe assumed dip Zon<* 6 will intersect borehole KFI07 at c. 500 m. At thisdepth the core of KFI07 is strongly fractured, thus supporting the suggesteddip. Estimated width is 5 m. Reliability: "possible".
ZONE 7
Zone 7 trends N55W and is traceable for more than 2 km. It is wellexpressed on aerial-photos and topographical maps. No borehole informationexist regarding this lineament. In accordance with earlier presented northwesttrending fracture zones, a dip of 60 degrees towards SW is suggested forZone 7. Assumed width is 5 m. Reliability: "possible".
ZONE 8
Zone 8 trends N50W and is more than 3 km long. It is apparent as a distinctlineament in the southwestern part of the Finnsjön Rock Block. No boreholeinformation is available. A vertical dip is assumed for this zone due to thecloseness and probable affiliation to the vertical, wide and extensive Zone 14(see below). A width of 5 m is assumed for Zone 8. Reliability: "possible".
ZONE 9
Zone 9 represent a 200-300 m wide N10W trending lineament of lowtopographical relief in a c. 2 km long stripe of peat and moraine. Noconclusive data exist regarding the dip, width and character of Zone 9.
There are two alternative interpretations regarding the orientation of Zone 9.In Ahlbom et al. (1986), two steeply dipping fracture zones of lower orderwas interpreted to be located at the east and west margin of Zone 9. InAndersson et al. (1989), Zone 9 is interpreted as a gently inclined zone,dipping 15 degrees, which comprises gently dipping fractures, less than 5fractures/m. The interpretation was based on fracture studies on outcrops andin borehole KFI07. The latter interpretation, with a gently dipping fracture/one, is in this report regarded as the most probable. In this case Zone 9 willintersect borehole KFI07 at c. 100-150 m. Since no significant increase inhydraulic conductivity have been measured in this section, Zone 9 hasprobably no or only limited influence on the groundwater flow conditions.Reliability: "possible".
144
ZONE 10
Zone 10 have northwesterly trend. It is traceable for more than 2.5 km andpoor to well expressed in the detailed topographical map. It is observed inthe field, north of its intersection with Zone 1, as increased fracturefrequency in the surrounding outcrops to a 10 wide gully. Zone 10 is curvedin the southern block. Field observations and indications in borehole KFI03(57-62 m) indicate a vertical to steep westerly dip (85°). Estimated width is5 m. Reliability: "possible".
ZONE 11
The existence of a N5W, gently and westerly dipping (35°) fracture zone inthe southern block is indicated by geological and geophysical data fromboreholes KFI01, KFI03 and KFI08. Combining data from these boreholeswith core mapping of KFI04, it is possible to define a c. 100 m wide fracturezone. The available information does not allow an accurate determination ofstrike and dip, but generally the zone is interpreted to strike north-south anddip 30-40° west.
The existence of a gently dipping fracture zone in boreholes KFI01 andKFI04 is supported by gentle-subhorizontal dipping fractures in the drillcores (similar as for Zone 2) and borehole geophysical characteristics similaras those registered across Zone 2. Borehole KFI08 intersects Zone 11 at thesame location as Zone 3. This could possibly imply that the earlierinterpretation of a subvertical Zone 3 could be wrong and instead Zone 3 isthe same as Zone 11, or that both alternatives exist. The limited dataavailable does not allow any further elaboration on this possibility.
Reliability: In spite of the location of Zone 11 in four boreholes, theexistence of this zone is uncertain due to the frequent occurrence of fracturedborehole sections. Thus the 'lability level of Zone 11 is "probable".
ZONE 12
There are no borehole data available for this c. 6 km long and north-southtrending fracture zone, delimiting the Finnsjön Rock Block to the west.However, due to the similarities in strike and morphology, Zone 12 is givena vertical dip. Assumed width is 25 m. Reliability: "possible".
\
145
ZONE 13
There are no borehole data available for this c. 7 km long and northeast(N30E) trending fracture zone, delimiting the Finnsjön Rock Block to thesouth. As a first attempt this zone are given the same characteristics as Zone1 (a dip of 75° to SE and a width of 20 m). Reliability: "possible".
ZONE 14
Ground surface and borehole data are lacking for the wide and regionallyextensive (>50 km, c.f. Figures 26 and 27) northwest trending zone delimit-ing the Finnsjön Rock Block in the southwestern part. Changes in rock typescan be observed while crossing the zone, implying that faulting haveoccurred. As this zone have the same strike as the Singö fault, and are inter-preted to be related genetically, data from this fault are used as a firstassumption. In this case, a width of 100 m and a vertical dip should bedenoted for this zone. Using values from the Singö fault, an hydraulicconductivity of about 10'7 m/s to 10'6 m/s is expected for the upper 100 m ofthe zone. Reliability: according to Bäckblom classification "possible".However, it could as well be argued that Zone 14 is "certain". This isbecause of the well expressed and regional extension of the lineament,together with the faulting associated with the zone.
List of SKB reportsAnnual Reports
1977-78TR121KBS Technical Reports 1-120SummariesStockholm, May 1979
1979TR 79-28The KBS Annual Report 1979KBS Technical Reports 79-01 - 79-27SummariesStockholm, March 1980
1980TR 80-26The KBS Annual Report 1980KBS Technical Reports 80-01 - 80-25SummariesStockholm, March 1981
1981TR 81-17The KBS Annual Report 1981KBS Technical Reports 81-01 -81-16SummariesStockholm, April 1982
1982TR 82-28The KBS Annual Report 1982KBS Technical Reports 82-01 - 82-27SummariesStockholm, July 1983
1983TR 83-77The KBS Annual Report 1983KBS Technical Reports 83-01 - 83-76SummariesStockholm, June 1984
1984TR 85-01Annual Research and DevelopmentReport 1984Including Summaries of Technical Reports Issuedduring 1984. (Technical Reports 84-01 - 84-19)Stockholm, June 1985
1985TR 85-20Annual Research and DevelopmentReport 1985Including Summaries of Technical Reports Issuedduring 1985. (Technical Reports 85-01 - 85-19)Stockholm, May 1986
\
1986TR 86-31SKB Annual Report 1986Including Summaries of Technical Reports Issuedduring 1986Stockholm, May 1987
1987TR 87-33SKB Annual Report 1987Including Summaries of Technical Reports Issuedduring 1987Stockholm, May 1988
1988TR 88-32SKB Annual Report 1988Including Summaries of Technical Reports Issuedduring 1988Stockholm, May 1989
1989TR 89-40SKB Annual Report 1989Including Summaries of Technical Reports Issuedduring 1989Stockholm, May 1990
1990TR 90-46SKB Annual Report 1990Including Summaries of Technical Reports Issuedduring 1990Stockholm, May 1991
1991TR 91-64SKB Annual Report 1991Including Summaries of Technical Reports Issuedduring 1991Stockholm, April 1992
Technical ReportsList of SKB Technical Reports 1992
TR 92-01GEOTAB. OverviewEbbe Eriksson1, Bertil Johansson2,Margareta Gerlach3, Stefan Magnusson2,Ann-Chatrin Nilsson4, Stefan Sehlstedt3,Tomas Stark1
1SGAB, ?ERGODATA AB,3MRM Konsult AB4KTHJanuary 1992
TR 92-02Sternö study site. Scope of activities andmain resultsKaj Ahlbom', Jan-Erik Andersson2, Rune Nordqvist2,Christer Ljunggren3, Sven Tirén2, Clifford Voss4
'Conterra AB, 2Geosigma AB, 3Renco AB,"U.S. Geological SurveyJanuary 1992
TR 92-03Numerical groundwater flow calculationsat the Finnsjön study site - extendedregional areaBjörn Lindbom, Anders BoghammarKemakta Consultants Co, StockholmMarch 1992
TR 92-04Low temperature creep of copper intendedfor nuclear waste containersP J Henderson, J O Österberg, B IvarssonSwedish Institute for Metals Research, StockholmMarch 1992
TR 92-05Boyancy flow in fractured rock with a saltgradient in the groundwater - An inititalstudyJohan ClaessonDepartment of Building Physics, Lund University,SwedenFebruary 1992
TR 9206Characterization of nearf ield rock - A basisfor comparison of repository conceptsRoland Pusch, Harald HökmarkClay Technology AB and Lund University ofTechnologyDecember 1991
TR 92-07Discrete fracture modelling of the Finnsjönrock mass: Phase 2J E Geier, C-L Axelsson, L Hässler,A BenabderrahmaneGolden Geosystem AB, Uppsala, SwedenApril 1992
TR 92-08Statistical inference and comparison ofstochastic models for the hydraulicconductivity at the Finnsjön siteSven NormanStarprog ABApril 1992
TR 92-09Description of the transport mechanismsand pathways in the far field of a KBS-3type repositoryMark Elert', Ivars Neretnieks2, Nils Kjellbert3,Anders Ström3
'Kemakta Konsult AB2Royal Institute of Technology3Swedish Nuclear Fuel and Waste Management CoApril 1992
TR 92-10Description of groundwater chemical datain the SKB database GEOTAB prior to1990Sif Laurent', Stefan Magnusson2,Ann-Chatrin Nilsson3
WL, Stockholm2Ergodata AB, Göteborg3Dept. of Inorg. Chemistry, KTH, StockholmApril 1992
TR 92-11Numerical groundwter flow calculations atthe Finnsjön study site - the influence ofthe regional gradientBjörn Lindbom, Anders BoghammarKemakta Consultants Co., Stockholm, SwedenApril 1992
TR92-12HYDRASTAR - a code for stochasticsimulation of groundwater flowSven NormanAbraxas KonsultMay 1992
TR 92-13Radionuclide solubilities to be used inSKB 91Jordi Bruno1, Patrik Sellin2
1MBT, Barcelona Spain2SKB, Stockholm, SwedenJune 1992
TR 92-14Numerical calculations onheterogeneity of groundwater flowSven FollinDepartment of Land and Water Resources,Royal Institute of TechnologyJune 1992
TR 92-15Kamlunge study site.Scope of activities and main resultsKaj Ahlbom', Jan-Erik Andersson2,Peter Andersson2, Thomas Ittner2,
Christer Ljunggren3, Sven Tirén2
'Conterra AB2Geosigma AB3Renco ABMay 1992
TR92 16Equipment for deployment of canisterswith spent nuclear fuel and bentonitebuffer in horisontal holesVesa Henttonen, Miko SuikkiJP-Engineering Oy. Raisio, FinlandJune 1992
TR 92-17The implication of fractal dimension inhydrogeology and rock mechanics.Version 1.1W Dershowitz', K Redus', P Wallmann1,P LaPointe', C-L Axelsson2
'Golder Associates Inc., Seattle, Washington, USA2Golder Associates Geosystem AB, Uppsala,SwedenFebruary 1992
TR 92-18Stochastic continuum simulation ofmass arrival using a synthetic data set.The effect of hard and soft conditioningKung Chen Shan', Wen Xian Huan1, VladimirCvetkovic', Anders Winberg2
1 Royal Institute of Technology, Stockholm2 Conterra AB, GothenburgJune 1992
TR 92-19Partitioning and transmutation.A review of the current state of the artMats Skälberg, Jan-Olov LiljenzinDepartment of Nuclear Chemistry,Chalmers University of TechnologyOctober 1992
TR 92-20SKB91Final disposal of spent nuclear fuel.Importance of the bedrock for safety.SKBMay 1992
TR 92 21The Protogine Zone.Geology and mobility during the last1.5 GaPer-Gur oar Andréasson, Agnes RodheSeptember 1992
TR 92 22Klipperås study site.Scope of activities and main resultsKaj Ahlbom1, Jan-Erik Andersson2,Peter Andersson2, Tomas Ittner2,Christer Ljunggren3, Sven Tirén2
'Conterra AB2Geosigma AB3Renco ABSeptember 1992
TR 92 23Bedrock stability in SoutheasternSweden. Evidence from fracturing inthe Ordovician limestones of NorthernÖlandAlan Geoffrey Milnes', David G Gee2
'Geological and Environmental Assessments(GEA), Zurich, Switzerland2Geologiska Institutionen, Lund, SwedenSeptember 1992
TR 92 24Plan 92Costs for management of theradioactive waste from nuclear powerproductionSwedish Nuclear Fuel and Waste Management CoJune 1992
TR 92 25Gabbro as a host rock for a nuclearwaste repositoryKaj Ahlbom1, Bengt Leijon', Magnus Liedholnf,John Smellie''Conterra AB2VBB VIAKSeptember 1992
TR 92 26Copper canisters for nuclear high levelwaste disposal. Corrosion aspectsLars Werme, Patrik Sellin, Nils KjellbertSwedish Nuclear Fuel and Waste ManagementCo, Stockholm, SwedenOctober 1992
TR 92 27Thermo-mechanical FE-analysis of butt-welding of a Cu-Fe canister for spentnuclear fuelB L Josefson', L Karlsson2, L E Lindgren2,M Jonsson2
'Chalmers University of Technology, Göteborg,Sweden'Division of Computer Aided Design, LuleåUniversity of Technology, Luleå, SwedenOctober 1992
TR 92 28A rock mechanics study of FractureZone 2 at the Finnsjön siteBengt Leijon', Christer Ljunggren2
'Conterra AB2Renco ABJanuary 1992
TR 92 29Release calculations in a repository ofthe very long tunnel typeL Romero, L Moreno, I NeretnieksDepartment of Chemical Engineering,Royal Institute of Technology, Stockholm, SwedenNovember 1992
TR 92 30Interaction between rock, bentonitebuffer and canister. FEM calculationsof some mechanical effects on thecanister in different disposal conceptsLennart BörgessonClay Technology AB, Lund SwedenJuly 1992
TR 92 31The Äspö Hard Rock Laboratory:Final evaluation of the hydro-geochemical pre-investigations inrelation to existing geologic andhydraulic conditionsJohn Smellie1, Marcus Laaksoharju2
'Conterra AB, Uppsala, Sweden2GeoPoint AB, Stockholm, SwedenNovember 1992
TR 92 32Äspö Hard Rock Laboratory:Evaluation of the combined longtermpumping and tracer test (LPT2)in borehole KAS06Ingvar Rhen1 (ed), Urban Svensson2 (ed.),Jan-Erik Andersson3, Peter Andersson3,Carl-Olof Eriksson3, Erik Gustafsson3,Thomas Ittner3, Rune Nordqvist3
'VBB VIAK AB2Computer-aided Fluid Engineering3Geosigma ABNovember 1992


