Embed Size (px)
Citation preview

First Order Augmentation to TensorVoting for Boundary Inference and
Multiscale Analysis in 3DWai-Shun Tong, Student Member, IEEE Computer Society,
Chi-Keung Tang, Member, IEEE Computer Society,
Philippos Mordohai, Student Member, IEEE, and Gerard Medioni, Fellow, IEEE
Abstract—Most computer vision applications require the reliable detection of boundaries. In the presence of outliers, missing data,
orientation discontinuities, and occlusion, this problem is particularly challenging. We propose to address it by complementing the
tensor voting framework, which was limited to second order properties, with first order representation and voting. First order voting
fields and a mechanism to vote for 3D surface and volume boundaries and curve endpoints in 3D are defined. Boundary inference is
also useful for a second difficult problem in grouping, namely, automatic scale selection. We propose an algorithm that automatically
infers the smallest scale that can preserve the finest details. Our algorithm then proceeds with progressively larger scales to ensure
continuity where it has not been achieved. Therefore, the proposed approach does not oversmooth features or delay the handling of
boundaries and discontinuities until model misfit occurs. The interaction of smooth features, boundaries, and outliers is accommodated
by the unified representation, making possible the perceptual organization of data in curves, surfaces, volumes, and their boundaries
simultaneously. We present results on a variety of data sets to show the efficacy of the improved formalism.
Index Terms—Tensor voting, first order voting, boundary inference, discontinuities, multiscale analysis, 3D perceptual organization.
�
1 INTRODUCTION
WE address two complex issues that often arise inperceptual organization problems; boundary infer-
ence and multiple-scale processing. The augmentation to theoriginal tensor voting framework [1] proposed here enablesus to simultaneously detect and extract curves, surfaces, andvolumes along with their terminations in 3D, even undersevere noise corruption. Since our method is model-free, thetreatment of arbitrary curves, surfaces, and volumes is notharder or more computationally expensive than that of lines,planes, and rectangular regions. Furthermore, we present ascheme for multiscale analysis of the data that is founded onour novel boundary detection technique. This paper com-pletes the compact description of the topic, which appears in[2], by providing full details for all cases of boundaryinference and more illustrative examples, as well as a moredetailed analysis of the multiple scale scheme.
The fundamental problem we address in this line ofresearch is the development of a methodology for theperceptual organization of tokens. The tokens represent theposition of elements such as points, curvels (curve elements),or surfels (surface elements) and can also convey otherinformation, such as curve or surface orientation. Tokengeneration is application specific and is not described in
detail here. Tokens can be generated by processes that detectthe presence of certain features, such as edges, corners, pixelcorrespondences, surface patches, intensity within certainthresholds, etc. Perceptual organization is achieved byenforcing constraints, as suggested by Gestalt psychology[3]. The inferreddescriptions are in termsof junctions, curves,surfaces, volumes, and their boundaries. These structures arerepresentedbygrouped tokens that bear local estimates of thestructure’s orientation.
1.1 Boundary Inference
The first contribution of this paper deals with the funda-mental smoothness versus discontinuities dilemma thatoccurs in most nontrivial perceptual organization scenarios.Many perceptual organization approaches operate either asgrouping or as segmentation processes. We believe that bothgrouping and segmentation must be performed in order totackle challenging problems. In both cases, boundaries play acritical part. Our strictly second order formalism [1] can beviewed as an excitatory process that facilitates grouping ofthe input data and is able to extrapolate and extract densesalient structures. The integration of boundary inference, viafirst order voting, provides amechanism to inhibit thegrowthof the extracted structures. The addition of polarity vectors(first order tensors) to the representation complements thepreviously published second order representation that wasinsufficient for encoding first order properties, such asboundaries of perceptual structures. The new representationexploits the essential property of boundaries to have all theirneighbors, at least locally, on the same side of a half-space.Asdescribed in the remainder of the paper, the voting scheme isidentical to that of the second order case and the first order
594 IEEE TRANSACTIONS ON PATTERN ANALYSIS AND MACHINE INTELLIGENCE, VOL. 26, NO. 5, MAY 2004
. W.-S. Tong and C.-K. Tang are with the Department of Computer Science,Hong Kong University of Science & Technology, Clear Water Bay, HongKong. E-mail: {cstws, cktang}@cs.ust.hk.
. P. Mordohai and G. Medioni are with the Institute for Robotics andIntelligent Systems, University of Southern California, Los Angeles, CA90083-0273. E-mail: {mordohai, medioni}@iris.usc.edu.
Manuscript received 16 Dec. 2002; revised 24 July 2003; accepted 13Oct. 2003.Recommended for acceptance by E.R. Hancock.For information on obtaining reprints of this article, please send e-mail to:[email protected], and reference IEEECS Log Number 117965.
0162-8828/04/$20.00 � 2004 IEEE Published by the IEEE Computer Society

vector voting fields can be easily derived from the secondorder fundamental tensor voting field.
Open surfaces in 3D often occur in stereo and othercomputer visionproblems. For instance, inFig. 1, thedetectedmotion layers of the “flower garden” sequence (as computedby an algorithm such as [4]) are surfaces whose disconti-nuities convey important information. Our original frame-work fails to explicitly detect them, as illustrated in a simple2D example in Fig. 2. Consider points A and A0, which aresmooth inliers of the contours. The second order tensorsassociated with these points are identical in terms of bothsaliencyandorientation. Theproblemappearswhencompar-ing pointsB andCwithB0 andC0. The latter are inliers of theclosed contour,while the formerare the endpoints of theopencontour. The second order tensor at B has identical orienta-tion as the one atB0. Even though there is a difference in curvesaliency since B receives less support from its neighborhoodthanB0, the inferred description is very similar for two pointswhicharequalitativelyverydifferent. Thisoccursbecause thesecond order representation is inadequate to capture the keyproperty of endpoints: that all their neighbors in the contourare on the same side. The first order augmentation to theframework addresses this shortcoming by being sensitive tothe direction from which votes are received.
The second order part of the representation encodes thepreferred type of structure or structures of a token, theorientation of these structures and discontinuities in
orientation. These can be viewed as second order disconti-nuities since the structure remains continuous but itsorientation changes abruptly. For example, a contour iscontinuous at a corner, but its orientation is not. On the otherhand, the first order part of the representation captures thedirections from which votes are cast to a token or, in otherwords, the distribution of the token’s neighbors in space.This information can be used to detect the terminations ofstructures, such as the boundaries of the surfaces of Figs. 1cand 1d.
1.2 Multiscale Analysis
A second issue that often arises is the selection of the properglobal scale for a data set, in case of single-scale methods, orthe selection of the manner in which multiscale analysisshould be performed. This usually occurs when dealingwithdata sets with varying density of data from region to region.The conflict is between the preservation of details, on onehand, and robustness to noise and completion of missingdata, on the other. Consider Fig. 3a, where one can observeeither anumberof curve segments consistingofpoints inveryclose proximity or that these segments constitute a largercontour. Since human perception of this figure is not unique,but is a function of scale, an artificial perceptual groupingmechanism should also be able to derive the alternativegroupings as the scale varies.At a small scale, the input canbegrouped into the smaller segments and their endpoints canbedetected as in Fig. 3b. Then, the gaps can be bridged using alarger scale, while leaving the already grouped pointsuntouched (Fig. 3c). Alternatively, if the details and gaps ofthe contour are assumed to be due to noise, a large scale thatguarantees smoothness and good continuation should beapplied to the data set (Fig. 3d).
Motivated by these observations and scale-space theory[5], we present a multiscale implementation of our frame-work. We propose a data-driven, adaptive scheme whereprocessing is performed at multiple scales according to local
TONG ET AL.: FIRST ORDER AUGMENTATION TO TENSOR VOTING FOR BOUNDARY INFERENCE AND MULTISCALE ANALYSIS IN 3D 595
Fig. 1. Flower Garden. A sample frame and velocity field (x-component) are shown. (c) and (d) show the extracted discontinuity curves, together withthe computed depth map.
Fig. 2. (a) Open contour. (b) Closed contour. Open contours haveendpoints where orientation still varies smoothly.

criteria. Our aim is to capture details where they exist andbridge gaps due to missing data without oversmoothing therest of the input. We begin processing at a small scale andproceed with larger scales only in regions where disconti-nuities are detected. This hierarchical bottom-up scheme isconsistent with preattentive human perception ([6], [7], [8],[9]) and offers many advantages over both symbolic andsignal processing techniques ([10]). Once organization at afine scale has been completed, we do not have to revisit theseparts of the data set, thus avoiding unnecessary computa-tions. In addition, since no convolutions with isotropicsmoothing kernels are involved, features do not shift as scaleincreases. Accurate boundary detection is critical for thesuccess of such a schemesince their presence is an indicator ofpotentially missing data and gaps that need to be bridged.
1.3 Organization of the Paper
This paper is organized as follows: In Section 2, we reviewrelated work. In Section 3, we present an overview of thesecond order tensor voting framework and introduce the firstorder representation, votingmechanism, andvoting fields. InSection 4, the extraction of curve, surface, and regionboundaries is described in detail and, in Section 5, themultiscale analysis of complex data sets is presented.Section 6 contains results on complex real three-dimensionaldata sets of various modalities. Finally, we discuss thecontributions of this paper along with possible directions forfuture work in Section 7.
2 RELATED WORK
Surface and curve inference from 3D data has been an activeresearch area. Important issues include noise robustness,detection of orientation and depth discontinuities, andanalysis at multiple scales. Since some of these issues havenot been addressed in 3D, 2D research is also included here.
For surfaces represented in terms of energy functions,Terzopoulous andMetaxas [11] propose the deformable surfacemodel. An initial shape is iteratively deformed until thesurface parameters thatmaximize the fit are obtained. In [12],Sethian proposed a level set approach under which surfacescan be inferred as the zero-level iso-surface of a multivariateimplicit function. The technique allows for topologicalchanges, thus it can reconstruct surfaces of any genus as wellas nonmanifolds. Osher et al. [13] andOsher and Fedkiw [14]proposed efficient ways of handling implicit surfaces as levelsets of a function. A combination of points and elementarysurfaces and curves can be provided as input to their
technique which can handle local changes as well as globaldeformations and topological changes. The output howeveris limited to surfaces only. Lorigo et al. [44] extended the levelset approaches in computer vision to codimension-twomanifolds. Previously, level sets were limited to codimen-sion-one manifolds, i.e., surfaces in 3D, while this general-ization allows the inference of curves which are lowerdimensional manifolds. All the implicit surface-based ap-proaches are iterative and require careful selection of theimplicit function and initialization. Furthermore, only onemanifold type can be extracted at a time.
We now turn our attention to perceptual organizationtechniques that aim at grouping the primitives contained inthe data set into perceptual structures. These primitives serveas tokens in a symbolic framework that aims at inferringmeaningful groupings according to the Gestalt principles.More relevant to the work presented in this paper aremethods that infer regions and their boundaries in 2D since,as pointed out in [15], there are not many perceptualorganization methods that operate in 3D. Shashua andUllman [16] first addressed the issue of structural saliencyand how prominent curves are formed from tokens that arenot salient in isolation. They define a locally connectednetwork that assigns a saliency value to every image locationaccording to the length and smoothness of curvature ofcurves going through that location. In [17], Parent andZuckerinfer trace points and their curvature based on spatialintegration of local information. An important aspect of thismethod is its robustness to noise. This work was extended tosurface inference in three dimensions by Sander and Zucker[18]. Sarkar andBoyer [19] employ avoting scheme todetect ahierarchy of tokens. Unlike our voting scheme, voting inparameter space has to be performed separately for each typeof feature, thus making the computational complexityprohibitive for generalization to 3D.
An important class of perceptual organization methodsare inspired by human perception and research in psycho-physiology and neuroscience. Grossberg and Mingolla and[20] and Grossberg and Todorovic [21] developed theBoundary Contour System and the Feature Contour System thatcan group fragmented and even illusory contours to formclosed boundaries and regions by feature cooperation in aneural network. The cues they use are intensity edges andcorners in images. Parallel and orthogonal groupingmechan-isms allow the completion of regular and illusory contours.Heitger and von der Heydt [22], in a classic paper on neuralcontour processing, showed how elementary edges can begrouped into contours, including illusory ones, via convolu-tion with a set of orientation selective kernels, whoseresponses decay with distance and difference in orientation.Both these approaches use terminations of image structures(edges and corners) as cues for contour formation, but do notexplicitly detect the terminations of the contours beinginferred. Williams and Jacobs [23] introduced the stochasticcompletion fields for contour grouping. Their theory isprobabilistic and models the contour from a source to a sinkas the motion of a particle performing a random walk.Particles decay after every step, thus minimizing the like-lihood of completions that are not supported by the data orbetween distant points. Li [6] presented a contour integrationmodel based on excitatory and inhibitory cells and a top-down feedback loop. What is more relevant to our researchthat focuses on the preattentive bottom-up process of
596 IEEE TRANSACTIONS ON PATTERN ANALYSIS AND MACHINE INTELLIGENCE, VOL. 26, NO. 5, MAY 2004
Fig. 3. Curve extraction at different scales. (a) Input data, (b) grouping ata small scale (endpoints in gray), (c) gaps are bridged, and (d) groupingat a large scale.

perceptual grouping is that connection strength decreaseswith distance and that zero or low curvature alternatives arepreferred to high curvature ones. The model for contourextraction of Yen and Finkel [24] is based on psychophysicalandphysiological evidence that hasmany similarities to ours.It employs a voting mechanismwhere votes, whose strengthfalls off as a Gaussian function of distance, are cast along apreferred orientation that is the tangent of the osculatingcircle. Review of perceptual grouping techniques based oncooperation and inhibition fields can be found in [25], [26]. Itshould be noted here that all these methods, unlike ours,require oriented inputs.
Based on scale-space representations for 1D signals [27],Mokhtarian [28] and Mokhtarian and Mackworth [29]proposed a scale-space representation for planar and three-dimensional curves. Special treatment for curvature singula-rities, evenat straight lines, isnecessaryand the curves tend toshift toward the center of curvature as they are convolvedwith Gaussian kernels of increasing scale. Lowe [30]proposed a technique to compensate for this unwantedshrinking of the curves. Perona and Malik [31] usedanisotropic diffusion instead of convolution to address thisproblem. Local differential properties are used to discourageinterregion diffusion and facilitate intraregion diffusion.Lindeberg [5], [32] presented a framework for multiscaleimage analysis and automatic selection of scale. The appro-priate scale at which each feature should be represented isfound by selecting normalized measures of feature strengthin the three-dimensional scale-space (x, y,�). Theproblems ofshrinkage and curvature singularities do not affect ourapproach that is symbolic, according to the computer visionparadigm proposed by Marr [33]. Along these lines, Saund[10], [34] has developed a framework that is symbolic, asopposed to the signal/image-based representation of pre-vious multiscale methodologies. The major advantagesgained by the symbolic representation are that features donot shift with scale, curvature discontinuities, and opencurves do not pose additional difficulties and that featuresthat exist in coarse scales donot affect adjacent features in finescales andviceversa.Dolan andRiseman [35] alsoproposedahierarchical fine-to-coarse scheme for the representation ofcurvilinear structure. Curve fragments are grouped by linkfilters according to proximity, angular compatibility, andcontinuation to form multilevel descriptions of the input.
Our method relates to the previous work in the followingways: The inputs can be oriented, unoriented, or a combina-tion of both, while many of the techniques mentioned aboverequire oriented inputs to proceed. Our representation issymbolic (in the sense defined in [10]) and, in addition to theadvantages this brings,we are able to extract open and closedsurfaces, curves, and junctions in 3D simultaneously. To ourknowledge, the tensor voting framework is the onlymethodology that can represent and infer all possible typesof structures in any dimension in the same space. Our votingfunction has many similarities with other voting-basedmethods, such as the decay with distance and curvature[22], [24], [6], and the use of constant curvature paths [17],[34], [19], [24] that result in an eight-shaped voting field (in2D) [22], [24]. The major difference is that, in our case, thevotes cast are tensors and not scalars, therefore, they are a lotricher in information.We applymultiple scale processing in afine-to-coarse fashion, in accord with the majority of themultiscale techniques [33], [27], [36], [10], [35], [5]. Finally, as
in thework of Lindeberg [5], [32], we detect each feature in asfine a scale as possible and then leave it unchanged as thescale becomes coarser.
3 THE AUGMENTED TENSOR VOTING FRAMEWORK
In this section, we briefly review the original second ordertensor voting framework [1] and show how it is augmentedby first order representation and voting that enable us todetect discontinuities or structure terminations in the data.We begin by describing the representation, then illustratethe voting mechanism and introduce the concept of votingfields and how they are derived from the 2D second orderfundamental stick field. Finally, we briefly review the waydense structures such as surfaces and curves can beextracted from the sparse data. Pseudocode of the algo-rithms is available in [38] and the Appendix.
3.1 Representation by Polarity Vectors and SecondOrder Tensors
As mentioned in Section 1, we are interested in theperceptual organization of generic tokens. Each tokenrepresents the potential presence of a perceptual structureat its position. The representation of a token consists of asymmetric second order tensor that encodes saliency and avector that encodes polarity. The representation is com-pleted by the signs and directions of the principalcurvatures that can be estimated as in [40]. Interestedreaders should refer to that paper for details since curvatureestimation will not be described here. The tensor essentiallyindicates the saliency of each type of perceptual structure(surface, curve, or region in 3D) the token belongs to and itspreferred normal and tangent orientations. The polarityvector, on the other hand, encodes the likelihood of thetoken being on the boundary of a perceptual structure.
In 3D, there are three possible types of inputs: unoriented,elementary curves, and elementary surfaces. Unorientedinputs are the most general case, have no preference oforientation, and the type of structure they may belong to canonlybe inferredbasedon the configurationof their neighbors.Their representation should be isotropic with respect toorientation.Wechoose to represent oriented tokenswith theirnormals instead of their tangents. Therefore, an elementarysurface patch is encodedwith a tensor that is alignedwith thepatch’s normal. A curve element, on the other hand, has a setof normals that spana 2D subspace in 3D. The curve’s tangentis orthogonal to this subspace. Curvels are represented by atensor that is orthogonal to its tangent, therefore belonging tothe normal subspace. These tensors are presented in thefollowing paragraphs. The first order representation for allcases is initialized to zero, since no a priori information isavailable.
A 3D, symmetric, nonnegative definite, second ordertensor can be viewed as a 3� 3 matrix or, equivalently, a3D ellipsoid. Intuitively, its shape indicates the type ofstructure represented and its size the saliency of thisinformation. The tensor can be decomposed as in thefollowing equation:
T ¼ �1ee1eeT1 þ �2ee2ee
T2 þ �3ee3ee
T3
¼ ð�1 � �2Þee1eeT1 þ ð�2 � �3Þðee1eeT1 þ ee2eeT2 Þ
þ �3ðee1eeT1 þ ee2eeT2 þ ee3ee
T3 Þ;
ð1Þ
TONG ET AL.: FIRST ORDER AUGMENTATION TO TENSOR VOTING FOR BOUNDARY INFERENCE AND MULTISCALE ANALYSIS IN 3D 597

where �i are the eigenvalues in decreasing order and eei arethe corresponding eigenvectors (see also Fig. 4). Note that theeigenvalues are nonnegative since the tensor is nonnegativedefinite. For instance, when �1 ¼ 1; �2 ¼ �3 ¼ 0, only the firstterm in (1) remains, which corresponds to a degenerateelongated ellipsoid, termed hereafter the stick tensor, thatrepresents an elementary surface token with ee1 as its surfacenormal. When �1 ¼ �2 ¼ 1; �3 ¼ 0, only the second termremains, which corresponds to a degenerate disk-shapedellipsoid, termed hereafter the plate tensor, that represents acurve (or a surface intersection) with ee3 as its tangent or, inother words, with ee1 and ee2 as the two normals that span thesubspace of orientations that is orthogonal to the curve.Finally, when all eigenvalues are equal, only the third termremains, which corresponds to a sphere, termed the balltensor, that corresponds to an unoriented token which can bea volume inlier or a junction. The size of the tensor indicatesthe certainty of the information represented by the tensor. Ageneric tensor can be decomposed as in (1) and each type ofsaliency can be evaluated. The size of the stick component(�1 � �2) indicates surface saliency, the size of the platecomponent (�2 � �3) indicates curve saliency, and that of theball component (�3) junction or volume saliency. Theinterpretation of the inferred saliencies is described inSection 3.4.
The tensors can be initialized as ballswith nopreference oforientation or, if prior knowledge is available, with somepreferred orientation. But, in general, after voting, a generictensor comprising all three components will be the repre-sentation for each token. The benefit of having this repre-sentation is that the likelihood of the token belonging to eachtype of structure can be encoded simultaneously and carriedthroughout the processing stages without having to makepremature hard decisions or maintain separate maps forevery token type.
The advantages of using the above representation come atthe cost of being insensitive to the direction from which theinformation is propagated to each token. As shown inSection 3.2, the second order votes are also symmetric,nonnegative definite, second order tensors. It leads to equalvote contributions at locations ~uu and �~uu from a voter. Thesecond order representation is adequate for representingtokens that belong to smooth structures or are located at
orientation discontinuities; it fails, though, at structurediscontinuities suchas surfaceboundariesor curveendpointssince the surface boundaries, for instance, have a preferrednormalthat isagoodcontinuationof the interiorof thesurface.What discriminates between the interior points of the surfaceand points on its boundaries is the fact that the former aresurrounded by neighbors of the same surface,while the latterare not. The polarity vector is used to collect precisely thisinformation since it is sensitive not only to the orientation ofthe vote, but also to the direction fromwhich it is coming. Itsmagnitude is an indicationof the likelihoodof the tokenbeingon a boundary. A token on the boundary of a perceptualstructure has a large polarity vector directed toward themajority of its neighboring tokens. On the other hand, a tokenin the interior of a surface or a curve has a locally nonmaximalpolarity vector associated with it.
3.2 Tensor Voting
The core of our framework is the way information ispropagated from token to token. The question we want toanswer is: Assuming that a token at O with normal ~NN and atoken at P belong to the same smooth perceptual structure,what information should the token at O cast at P? We firstanswer the question for the 2D case of a voterwith a pure sticktensorand showhowall other cases canbederived from it.Weclaim that, in the absence of other information, the arc of theosculating circle at O that goes through P is the most likelysmooth path since it maintains constant curvature. Theosculating circle is the circle that shares the same normal asa curve at the given point. In case of straight continuationfrom O to P , the osculating circle degenerates to a straightline. It has enough degrees of freedom to connect twolocations given only one orientation, that of the voter. Sincevoting is a pairwise operation, nothing suggests the use ofsmooth connections with varying curvature. Similar use ofprimitive circular arcs can also be found in [17], [34], [19].
As shown in Fig. 5, the second order vote is also a sticktensor and has a normal lying along the radius of theosculating circle atP , whichhasC as its center. The first ordervote is a vector along the tangent of the same circle atP .Whatremains to be defined is the magnitude of these votes. Sincenothing suggests the opposite, the first and second ordervotes should have the same magnitude and this should be a
598 IEEE TRANSACTIONS ON PATTERN ANALYSIS AND MACHINE INTELLIGENCE, VOL. 26, NO. 5, MAY 2004
Fig. 4. Second order generic tensor and its decomposition into the stick, plate, and ball components in 3D.

function of proximity and smooth continuation. The saliencydecay functionwe have selected has the following form:
DF ðs; �; �Þ ¼ e�s2þc�2
�2
� �; ð2Þ
where s is the arc lengthOP , � is the curvature, c is a constantwhich controls the decay with high curvature1 and � is thescale of analysis, which determines the effective neighbor-hood size.2 Note that � is the only free parameter in thesystem. For a more detailed analysis on the selection of thesmoothest paths and the saliency decay function, see [1].
In summary, the secondorder vote is a secondorder tensorthat indicates the preferred orientation at the receiveraccording to the voter, while the first order vote is a firstorder tensor (a vector) that points toward the voter along thesmooth path connecting the voter and receiver. Pseudocodefor the voting functions is available in the Appendix. Whatshould be noted is that both first and second order votes aregenerated by the secondorder part of the representation. Thisis because polarity vectors can only be initialized as zerovectors and because the second order tensor defines the typeof structure and the way it should vote. The followingequationsdefine the secondand first order votes cast byaunitstick tensor as functions of the parameters already defined.
S2ðd; �Þ ¼ DF ðs; �; �Þ �sinð2�Þcosð2�Þ
� �½�sinð2�Þcosð2�Þ�: ð3Þ
S1ðd; �Þ ¼ DF ðs; �; �Þ �cosð2�Þ�sinð2�Þ
� �: ð4Þ
Asimple example to illustrate polarity is depicted in Fig. 6.The input consists ofa setof coplanarunoriented tokens.Theyare encoded as ball tensors and cast first and second ordervotes to their neighbors. Figs. 6b and 6c show the maximumsurface saliency and polarity at every ðx; yÞ position. Cuts ofthese 2D maps can be seen in Figs. 6d and 6e. The surfacesaliency map indicates that there are salient surfaces formedby the tokens, but, since saliency is an excitatory process and
its value drops gradually, detectingwhere the surface ends isnot an easy task. However, when the surface saliency map iscomplemented by the polarity map, the surface boundariescan be detected as surface inliers that are also maxima ofpolarity along the direction of the polarity vectors.
3.3 Voting Fields
In this section, we will show how all the necessary votes can
be cast in the same way as described in the previous sectionfor the 2D stick tensor case and how all first and second orderfields in any dimension can be derived. Finally, wewill show
how the votes cast by an arbitrary tensor can be computedgiven the voting fields.
The second order stick voting fieldS2ðP Þ is a second ordertensor field. At every position, it contains a tensor that is the
vote cast there by a unitary stick tensor located at the originand alignedwith the y axis. The shape of the field in 2D can beseen in Fig. 7a, which is generated by considering all P in the
2Dspace (Fig. 5). Depicted at everyposition is the eigenvectorcorresponding to the maximum eigenvalue of the secondorder tensor contained there. Its size is proportional to the
magnitude of the vote. To compute a vote cast by an arbitrarystick tensor, we need to align the field with the orientation ofthe voter, andmultiply the saliency of the vote that coincides
with thereceiverby thesaliencyof thearbitrarystick tensor,asin Fig. 7c. The same alignment holds for the first order case,where the voting fields are vector fields. Since the locationsO
and P and the unitary stick tensor define a plane in 3D, thegeneration of stick votes is identical in 2D, 3D, and ND. Thestick voting fields in higher dimensions, therefore, can be
derived by a simple rotation of the 2D stick field with respectto theaxisalignedwiththestick tensor.Specifically,note thatacut of the 3D stick voting field that contains the origin is
identical toFig.5asince thevotingstick tensorandthereceiverdefine a plane in 3D where the voting takes place.
At the other end of the spectrum is the ball voting fieldB2ðP Þ, a cut of which can be seen in Fig. 7b. The ball tensorhas no preference of orientation, but still it can castmeaningful information to other locations. The presence oftwo proximate unoriented tokens, the voter and the receiver,indicates a potential perceptual structure. In the 3D case, thiscan either be a curve segment or a pencil of planesintersecting on that segment. Even though the voters areunoriented, surfaces can be inferred since the accumulationof votes from point to point with one degree of freedom interms of surface orientation, from neighbors in the samesurface, results in a high certainty for the correct surfacenormal and eliminates the degree of freedom. The case forcurves is similar. The ball voting fields allow us to inferpreferred orientations from unoriented tokens, thus mini-mizing initialization requirements.
To show the derivation of the ball voting fields from thestick voting fields, we can visualize the vote at P from aunitary ball tensor at the origin O as the integration of thevotes of stick tensors that span the space of all possibleorientations. In 3D, this can be simulated by a rotating sticktensor that spans the unit sphere. The 3D ball fields can bederived from the stick fields SiðP Þ, as follows: The firstorder ball field is derived from the first order stick field andthe second order ball field from the second order stick field.
TONG ET AL.: FIRST ORDER AUGMENTATION TO TENSOR VOTING FOR BOUNDARY INFERENCE AND MULTISCALE ANALYSIS IN 3D 599
Fig. 5. Second and first order votes cast by a stick tensor located at the
origin.
1. In fact, c is a function of �. Typical values of c range from 35.7 to110.363 for � ranging from 10 to 30. In our experiments, the results are notsensitive to the choice of c.
2. Since we use a Gaussian decay function for DF ð�Þ, the effective
neighborhood size is about 3�. The derivation is as follows: let k be the
effective neighborhood size. Then, we can set e�k2
�2 ¼ �, a small number,
which is the lower bound of significant magnitude. We can then derive the
effective neighborhood size k given �.

BiðP Þ ¼Z �
0
Z �
0
R�1���SiðR���P ÞR�T���d�d�j�¼0
i ¼ 1; 2; the order of the field;
ð5Þ
where R��� is the rotation matrix to align Si with ee1, the
eigenvector corresponding to the maximum eigenvalue (the
stick component) of the rotating tensor at P , and �; �; � are
rotation angles about the x; y; z axis, respectively.In practice, the integration is approximated by a summa-
tion which, in the second order case, is performed as tensor
addition,while, in the first order case, it is performed as plain
vector addition. Normalization has to be performed in ordertomake the energy emitted by a unitary ball equal to that of aunitary stick. As a result of the integration, the second orderball field does not contain purely stick or purely ball tensors,but arbitrary second order symmetric tensors. The first orderball field holds a vector at each position as a result of vectoraddition. Both fields are radially symmetric, as expected,since the voter has no preferred orientation.
To complete the description of the voting fields for the3D case,weneed to describe the plate voting fieldsPiðP Þ. Sincethe plate tensor encodes uncertainty of orientation aroundoneaxis, it canbederivedby integrating thevotesof a rotatingstick tensor that spans the unit circle, in otherwords, the platetensor. The formal derivation is analogous to that of the ballvoting fields and can be written as follows:
PiðP Þ ¼Z �
0
R�1���SiðR���P ÞR�T���d�j�¼�¼0
i ¼ 1; 2; the order of the field;
ð6Þ
where �; �; �, and R��� have the same meaning as in theprevious equation.
We have derived six voting fields for the 3D case, namely,the first and secondorder stick, plate, andball fields. They arefunctions of the position of the receiver relative to the voterand a single parameter, the scale of the saliency decayfunction. After these fields have been precomputed at thedesiredresolution, computing thevotescastbyany3Dsecondorder tensor is reduced to a few look-upoperations and linearinterpolation.These fieldsareadequate forvotegenerationbyanysecond-ordernonnegativedefinite tensor.AsdescribedinSection 3.1, any 3D tensor can be decomposed into the stick,plate, and ball components, according to its eigensystem.Then, the corresponding fields can be aligned with eachcomponent. Votes are retrieved by simple look-up operations
600 IEEE TRANSACTIONS ON PATTERN ANALYSIS AND MACHINE INTELLIGENCE, VOL. 26, NO. 5, MAY 2004
Fig. 6. (a) Input. (b) Surface saliency magnitude. (c) Polarity magnitude. (d) Cut of surface saliency. (e) Cut of polarity. Surface saliency and polarityfor (a) a set of unoriented coplanar tokens. (b) Detection of the plane’s boundaries using surface saliency alone is not clear. (c) Incorporating polarityinformation makes boundary detection straightforward. (d) and (e) are cuts of the surface saliency and polarity maps.
Fig. 7. (a) Two-dimensional stick voting field. (b) Two-dimensional ballvoting field. (c)A casts a stick vote toB, using the 2Dstick voting field.Dueto symmetry, theorthographic projectionof a sliceof the3Dball voting fieldviewed along the direction parallel to the ee3 component of the tensor at thecenter of the field looks the sameas (b). The fields are definedeverywherewhere the empty areas denote very small and negligible tensor votes.

and their magnitude is multiplied by the correspondingsaliency. Recall from (1) that the saliency of the stickcomponent is �1 � �2, of the plate component �2 � �3, and ofthe ball component �3.
3.4 Vote Collection and Interpretation
Votes are cast from token to token, as described in theprevious section, and they are accumulated by tensoraddition in the case of the second order votes, which are,in general, arbitrary second order tensors, and by vectoraddition in the case of the first order votes, which arevectors. Voting takes place in a finite neighborhood withinwhich the magnitude of the votes cast remains significant.
Analysis of the second order votes can be performed oncethe eigensystemof the accumulated secondorder 3� 3 tensorhas been computed. Then, the tensor can be decomposed intothe stick, plate, and ball components:
T ¼ð�1 � �2Þee1eeT1 þ ð�2 � �3Þðee1eeT1 þ ee2eeT2 Þ
þ �3ðee1eeT1 þ ee2eeT2 þ ee3ee
T3 Þ;
ð7Þ
where ee1eeT1 is a stick tensor, ee1ee
T1 þ ee2ee
T2 is a plate tensor, ee1ee
T1 þ
ee2eeT2 þ ee3ee
T3 is a ball tensor. The following cases have to be
considered: If �1 � �2; �3, this indicates a dominant stick
component, thusapreference foranormalorientationand the
token most likely belongs on a surface. In case of a token that
belongs on a curve, or surface intersection, the uncertainty in
normal orientation spans a plane perpendicular to the
tangent. Hence, the inferred tensor is plate-like, that is,
�1 � �2 � �3. If the token has no preference of orientation,
�1 � �2 � �3 and the dominant component is the ball. Tokens
that belong to volumes have high �3 values. Junctions can be
discriminated fromvolume inliers since they aredistinct local
maxima of �3. That is, their �3 values are considerably larger
than those of their neighbors. An outlier receives only
inconsistent votes, so all eigenvalues are small.Vote collection for the first order case is performed by
vector addition. The accumulated result is a vector whosedirection points to a weighted center of mass from whichvotes are cast and whose magnitude encodes polarity. Since
the first order votes areweighted by the saliency of the votersand attenuate with distance and curvature, their vector sumpoints to the direction from which the most salient contribu-tions were received. A relatively low polarity indicates atoken that is in the interior of a curve, surface, or region,therefore surrounded by neighbors whose votes cancel outeach other. On the other hand, a high polarity indicates atoken that is on or close to a boundary, thus receiving votesfrom only one side with respect to the boundary, at leastlocally. The interpretation of polarity vectors for boundaryinference is done in conjunction with second order tensorsand is described in Table 1. A detailed analysis for each casecan be found in Section 4.
3.5 Dense Structure Extraction
Nowthat themost likely typeof feature at each tokenhasbeenestimated, we want to compute the dense structures(connected curves and surfaces in 3D) that can be inferredfrom the tokens. This can be achieved by casting votes to alllocations,whether they contain a token or not, using the samevoting fields and voting mechanism. Then, each site containsa 2-tuple ðs; vvÞ, indicating feature saliency and direction.Given this dense information, a modified marching algo-rithm [38] is used to extract surfaces and curves whichcorrespond to the loci of zero crossings in s along vvs. Junctionsare isolated and, therefore, are extracted as maxima ofjunction saliency. Extraction stops at boundaries, thus over-coming the inherent limitation of the Marching Cubesalgorithm [39] that only extracts closed surfaces. Interestedreaders are referred to [1] or [38] for more details.
4 BOUNDARY INFERENCE
In this section, we describe how the theory developed in theprevious section can be used to infer boundaries of3D perceptual structures. We begin with surface boundarydetection (surface end-curves) and then turn our attention tocurve endpoint detection and region boundary inference(volume boundary). The optimality of these extractedstructures is explained by ourmodifiedmarching algorithms
TONG ET AL.: FIRST ORDER AUGMENTATION TO TENSOR VOTING FOR BOUNDARY INFERENCE AND MULTISCALE ANALYSIS IN 3D 601
TABLE 1Summary of First and Second Order Tensor Structure for Each Feature Type in 3D
[38] formaximal surface and curve extraction, which extractsmaxima along the detected polarity direction.
4.1 Surface Boundary Inference
We are interested in extracting surface end-curves that, insome applications, may indicate depth discontinuities orocclusion boundaries. In the case of surfaces, both interiorpoints and points on boundaries are characterized by adominant stick component. Our objective is to associateeach input point Q with a 2-tuple ðs; vvÞS , where s denotessurface boundary saliency and vv is a unit vector whichindicates the normal direction to the underlying boundarycurve. The curves depicted in Fig. 1 are points with larges values. When all ðs; vvÞS are available, we extract the curvescorresponding to maxima in s along the polarity vectordirection, using a modified curve marching process [38].
Assumewe are given an open smooth surface patch in 3D,encoded as a sparse set of tokens, possibly containedwithin alarger data set. The tokens are initially encoded as ball tensorssince their preference of orientation is unknown. After a passof second order voting, the tokens that lie on the surface, bothin the interior and on the boundaries, have accumulatedsecond order tensors with dominant stick componentsconsistent with the normal of the surface at each location.
With orientednormal vectors, tokens propagate first ordervotes to their neighbors. As seen in Section 3.2, these voteswill be along the tangent of the circular arc connecting thevoter and the receiver. Therefore, the resultingpolarity vectorat the receiver after vote accumulation lies on a planeperpendicular to the estimated local surface normal. In caseof a token in the interior of the region, the first order votescome from all directions and cancel each other out. On theotherhand, close to the surfaceboundaries, a largevector sumis accumulated, pointing toward the average direction(weighted by vote saliencies) from which the votes came.This polarity direction is locally orthogonal to the boundaryby definition. If the detected polarity vector is not exactlyorthogonal to the estimated surface normal that is anindication of interference by noise, we use its projection onthe plane orthogonal to the normal. The tensor is robustagainst this kind of interference since it contributes to the ballcomponent and does not affect the estimated normal.
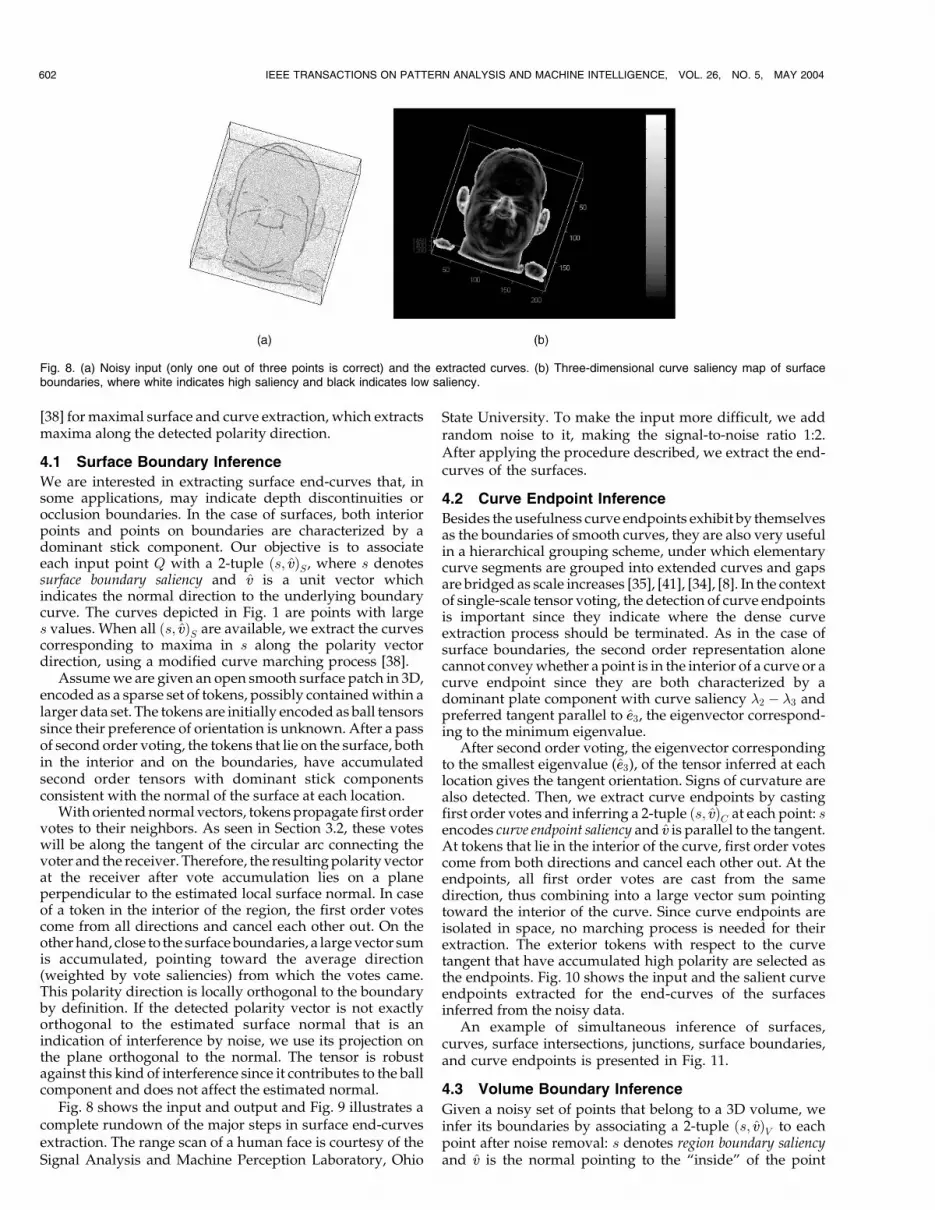
Fig. 8 shows the input and output and Fig. 9 illustrates acomplete rundown of the major steps in surface end-curvesextraction. The range scan of a human face is courtesy of theSignal Analysis and Machine Perception Laboratory, Ohio
State University. To make the input more difficult, we addrandom noise to it, making the signal-to-noise ratio 1:2.After applying the procedure described, we extract the end-curves of the surfaces.
4.2 Curve Endpoint Inference
Besides the usefulness curve endpoints exhibit by themselvesas the boundaries of smooth curves, they are also very usefulin a hierarchical grouping scheme, under which elementarycurve segments are grouped into extended curves and gapsare bridged as scale increases [35], [41], [34], [8]. In the contextof single-scale tensor voting, the detection of curve endpointsis important since they indicate where the dense curveextraction process should be terminated. As in the case ofsurface boundaries, the second order representation alonecannot conveywhether a point is in the interior of a curve or acurve endpoint since they are both characterized by adominant plate component with curve saliency �2 � �3 andpreferred tangent parallel to ee3, the eigenvector correspond-ing to the minimum eigenvalue.
After second order voting, the eigenvector correspondingto the smallest eigenvalue (ee3), of the tensor inferred at eachlocation gives the tangent orientation. Signs of curvature arealso detected. Then, we extract curve endpoints by castingfirst order votes and inferring a 2-tuple ðs; vvÞC at each point: sencodes curve endpoint saliency and vv is parallel to the tangent.At tokens that lie in the interior of the curve, first order votescome from both directions and cancel each other out. At theendpoints, all first order votes are cast from the samedirection, thus combining into a large vector sum pointingtoward the interior of the curve. Since curve endpoints areisolated in space, no marching process is needed for theirextraction. The exterior tokens with respect to the curvetangent that have accumulated high polarity are selected asthe endpoints. Fig. 10 shows the input and the salient curveendpoints extracted for the end-curves of the surfacesinferred from the noisy data.
An example of simultaneous inference of surfaces,curves, surface intersections, junctions, surface boundaries,and curve endpoints is presented in Fig. 11.
4.3 Volume Boundary Inference
Given a noisy set of points that belong to a 3D volume, weinfer its boundaries by associating a 2-tuple ðs; vvÞV to eachpoint after noise removal: s denotes region boundary saliencyand vv is the normal pointing to the “inside” of the point
602 IEEE TRANSACTIONS ON PATTERN ANALYSIS AND MACHINE INTELLIGENCE, VOL. 26, NO. 5, MAY 2004
Fig. 8. (a) Noisy input (only one out of three points is correct) and the extracted curves. (b) Three-dimensional curve saliency map of surfaceboundaries, where white indicates high saliency and black indicates low saliency.

cluster. Note that, in this case, the normal refers to the vectorinferred by first order voting since the characteristic secondorder tensor of a region is a ball that has no orientationpreference.
In terms of second order tensors, regions are characterizedby adominant ball component since they collect secondordervotes from all directions in 3D. The same holds for tokensclose to the region boundaries since second order votes are afunction of orientation but not direction. Once second orderinformation is available at each token, first order votes are
cast. The bounding surface of a 3D region can be extracted bythemodified surfacemarching algorithm [38] as themaximalisosurface of s along vv.
Fig. 12 shows input and results on surface boundaryextraction. The input is a set of approximately 600,000 un-oriented tokens uniformly distributed inside a peanut-likeshape. A number of random points, ranging from 600,000 to2.4million, drawn fromauniformdistribution is added to thedata set. Fig. 12a shows the noise free input, while Fig. 12bshows the input with 600,000 random points added. Inputs
TONG ET AL.: FIRST ORDER AUGMENTATION TO TENSOR VOTING FOR BOUNDARY INFERENCE AND MULTISCALE ANALYSIS IN 3D 603
Fig. 10. Two results: (a) Face and (b) frog on curve endpoint inference. The noisy data set is obtained by adding two random points for every truedata point. The result of surface boundary inference of the objects of interest are marked in white and points with high curve endpoint saliency arecoded in in dark gray. (The face scan data is courtesy of the Signal Analysis and Machine Perception Laboratory, Ohio State University.)
Fig. 9. Complete rundown of the major steps in end-curve detection. (a) A magnified portion of the point data in Fig. 8 (after noise rejection by tensorvoting). (b) The result after the first pass. Surface saliency is indicated by the length of each normal. (c) Sign of curvature is used to orient normalvector. (d) Polarities obtained by first order voting.

with more random points are too noisy to be displayed.Second and first order voting is performed using the samescale in all cases and the bounding surfaces of the peanut areextracted based on their highpolarity. Table 2 reports the truepositive rates for the extracted boundaries. Tokens labeledvolume boundaries are considered correct if they are within1 percent of the peanut’s size from the actual boundary asdefined by the equations used to generate the input. Theprocessing time for thedata setwith 3million total pointswas43 minutes on a Pentium 4 PC at 2.8GHz.
5 MULTISCALE ANALYSIS
In this section, we present an algorithm that uses first andsecond order voting to adjust the scale of analysis, a naturalapplication of the first order augmented framework. Ourapproach operates in a fine-to-coarse fashion, much likemost other multiple scale methods in computer vision [33],[27], [36], [10], [35], [5]. This allows the preservation of finedetails where they exist, while it delays the enforcement ofglobal smoothness as long as possible. Tokens that havealready been processed at a fine scale are left untouched atsubsequent larger scales that are only applied to regionswith discontinuities. Accurate boundary detection, there-fore, is a critical module in such a scheme.
A technique for automatic scale selection based on theexistence of discontinuities at the previous scale will beillustrated in the running example of this section that comesfrom the field of medical imaging. In medical imageanalysis, we usually assume the absence of junctions. Eventhough the surfaces of organs and tissues can sometimes bevery convoluted, they should still be smooth. Takingadvantage of this domain-specific knowledge, voting isfirst performed with a small scale and we can determinewhether it is sufficient for each region based on thepresence or absence of junctions.
We first use a 2D synthetic image to illustrate a completerundown of ourmultiscale algorithm. By thresholding imageintensity,weproducean initial setof tokens shown inFig. 13a.The desired feature is a ribbon-like structure. However,intensity thresholding is inaccurate and misses some data inthe middle. We begin by detecting region boundaries in 2D.Weobtain estimates of polaritydirections that indicate region
boundary saliency by second and first order tensor voting
(Fig. 13b). Then, using the detected region boundaries asinputs, these estimates are refined intomore accurate normaldirections of the bounding curves. Tokenswith high junction
saliency indicate highly convoluted features or errors result-ing frommissing data (both cases are characterized by a set of
inconsistent normals violating the continuity constraint). Afixed size neighborhood (e.g., 3� 3� 3, independent of thescale �) with high junction saliency is removed around each
detected junction (Fig. 13c). Then, we perform 2D endpointdetection on the remaining region boundaries, (Fig. 13d).These will serve as interfaces where gaps will be bridged as
the scale is increased. Scale is further increased until thedetected endpoints are connected smoothly or we reach thelargest permissible scale (Fig. 13e). Finally, the same march-
ing curve process [38] is applied to produce a densecontinuous curve (Fig. 13f).
5.1 Multiscale Algorithm
The algorithm for 3D presented below is a generalization ofthe 2D case. Scales �1 and �n are the smallest and largest
permissible scales, respectively. The sensitivity of thisselection is very low and any reasonable range of scalesshould produce very similar results. b denotes a token and
neighborhoodðbÞ is a fixed size neighborhood around it.
SURFACEEXTRACT(�1; �n)1. Threshold intensity (Fig. 13a)2. Vote for the bounding surfaces of 3D regions
using �1 (Fig. 13b)3. For each neighborhoodðbÞ do
� �1
repeatVote for bounding surface normals
using � (Fig. 13c)Vote for signs of curvatures using � [40]if (maxðneighborhoodðbÞ:JunctionSaliencyÞÞ > j)
(Fig. 13c)Remove tokens around b’s neighborhood
Vote for surface end-curves using � (Fig. 13d)if (maxðneighborhoodðbÞ:SurfaceBoundarySaliencyÞÞ
> e)� �þ k
Vote for bounding surfaces of regions(Figs. 13e and 13f)
until (neighborhoodðbÞ:SurfaceBoundarySaliency < e)or (� > �n)
The other parameters are: j is the maximum acceptablejunction saliency, below which a token is not classified as ajunction; e is the minimum volume boundary saliency,above which a token is classified as a boundary; k is the stepby which scale is incremented at each iteration.
In Step 3 above, we want to find the smallest � 2 ½�1; �n�such that continuity is satisfied at the smallest possible scaleand, at the same time, the finest details are preserved. At eachiteration, smoothness andcontinuity are examinedby the twoconditional statements in the algorithm. Smoothness isensured if no junctions can be detected and continuity isensured if no structural boundaries exist. We have exactlyfour cases (recall the saliency definitions in Table 1):
604 IEEE TRANSACTIONS ON PATTERN ANALYSIS AND MACHINE INTELLIGENCE, VOL. 26, NO. 5, MAY 2004
Fig. 11. Results on simultaneous inference of multiple types ofstructures. (a) Unoriented data set that consists of two intersectingplanes, two intersecting curves, and random outliers. (b) Output aftervoting. Outliers have been rejected due to very low saliency. Surfaceinliers are marked in gray, curves and boundaries in black. Curveendpoints and junctions have been enlarged.

1. High junction saliency and high end-curve saliency. Sinceno junction exists and a token with high end-curvesaliency also has high surface saliency, this scenarioindicates the presence of highly convoluted surface,where many surface normals exist in the neighbor-hood. This scenario is very possible for the brain dataor complicated tissue we test in the next section. Ascontinuity and smoothness constraints are violated atthe current scale �, we increase � by k to enforce moresmoothness in a larger scale in the next scale iteration.
2. High junction saliency and low end-curve saliency. Thisscenario indicates a salient junction, where end-curve (and, thus, surface) saliency is low. A salientpoint junction should be absent from real medicaldata. Therefore, the reason why the smoothnessconstraint is violated at the current scale � is verypossibly due to missing or noisy data. Therefore, we
remove a small, fixed size neighborhood at thispoint, which should automatically result in highend-curve saliency at the current scale due to thebreaking of continuity. The resulting gap can bebridged as the scale is increased in the next scaleiteration.
3. Low junction saliency and high end-curve saliency. With-out any salient junction, a salient end-curve indicatesthe presence of erroneous data because, supposedly,only smooth and continuous organ/tissue structureexists. In this case, we increase the scale so that thefragmented data can be connected smoothly in thenext scale iterations.
4. Low junction saliency and low end-curve saliency. Thecurrent scale of analysis is acceptable for maintain-ing both smoothness and continuity. Therefore, therepeat loop stops if this condition is true.
TONG ET AL.: FIRST ORDER AUGMENTATION TO TENSOR VOTING FOR BOUNDARY INFERENCE AND MULTISCALE ANALYSIS IN 3D 605
Fig. 12. (a) Results on volume boundary inference. The unoriented inliers form a peanut. Noise-free input. Large numbers of random points areadded to the data set. (b) Input with 600,000 random. (c) Boundaries with 1.2 million outliers. (d) Boundaries with 2.4 million outliers.
Fig. 13. Illustration of our multiscale technique (a) initial set of tokens, (b) polarities; a junction is labeled, (c) removal of tokens around the detected
junction, (d) endpoint detection, (e) missing tokens are inferred during the multiscale analysis, and (f) final curve extraction result.
TABLE 2Correct Detection Rates for the Boundaries of the “Peanut” of Fig. 12

Atypical value of k is 1 in a 150� 150� 150quantized gridfor medical data. Experiments in [1] show that the step size kis not critical since tensor voting has low sensitivity over areasonable range in [�1; �n]. If k is too large, oversmoothingmay occur. The step size has a marginal effect on theperformance of the system.
6 EXPERIMENTAL RESULTS
We apply the augmented framework on medical images, asthe data objects exhibit smooth structure and would benefitthe most from our method that enforces/facilitates smooth-ness. Since CT and MRI scans are 2D images, we prepare the3Ddata by applying intensity segmentation on the images bythresholding and stacking the thresholded points to producea 3D point set. First order region inference as well as theaugmented surface extractionmethodare thenapplied on the3D data. As we shall see, with minimal knowledge, ourmethodcan refine andextract accurate results.Running timesaremeasured on aPentium III at 600MHz,with 384MBRAM.
Fig. 14 shows the reconstruction result of theTHORAXdataset. This is a set of real CT scans (courtesy of the University ofWashington Health Science Center). Only 12 interleavedslices, whose z-coordinates range unevenly from 110 to 180,are used. To make the example more challenging, we add a
total of 12,000 noisy points to the volume (signal: noise = 1:2).After intensity thresholding, we initialize the tokens as balltensors and perform 2D first order voting on the 12 slices toinfer the region boundaries.3 The segmentation results onthree sample slices are shown in Fig. 14a. Next, we stacktogether the resulting thorax boundaries into a 3D volume ofdimensions 170� 114� 70 (Fig. 14b). The complete surface isthen extracted by the augmented version of 3D tensor voting,which consists of 3D second order voting to refine the normalof the sparse boundary points, inference of sign of curvature,followed by surface extraction. Two views of the segmentedsurface are shown in Fig. 14c. We do not use any assumptionother than the smoothness and continuity requirementsmentioned in the second paragraph of Section 5 in ourreconstruction. Processing times are shown in Table 3.
The MCGILL BRAIN, from the Brainweb [42], is used toevaluate our algorithm. The dimensions of the MRI data setare 181� 217� 181, with resolution set at 1mm3. We areinterested in three types of tissues: the cerebrospinal fluid orCSF, the graymatter orGM, and thewhitematter orWM.Weperform initial intensity segmentationon theMRI images and
606 IEEE TRANSACTIONS ON PATTERN ANALYSIS AND MACHINE INTELLIGENCE, VOL. 26, NO. 5, MAY 2004
Fig. 14. Results on the 12 slices of the CT scan of the Thorax data set. (a) Three slices of the CT scan showing the inferred boundaries of the thorax
(the bright curves), (b) 3D boundary points before surface extraction, and (c) result of the surface extraction using our method.
3. In most situations, region boundary inferences are performed in the3D volume except here when the input consists of widely separated andinterleaved slices, region inferences will be more stable in 2D. Surfaceextraction is, however, always performed in 3D.

stack them up into three 3D tissue point sets. This is a very
challenging data set since all surfaces are very convoluted.
Without any a priori assumption or initialization, we can still
robustly separate two closely spaced surfaces that define the
boundaries of the CSF ribbon (or CSF ), the gray matter
ribbon (or GM), and white matter (or WM) (Figs. 15a, 15b,
TONG ET AL.: FIRST ORDER AUGMENTATION TO TENSOR VOTING FOR BOUNDARY INFERENCE AND MULTISCALE ANALYSIS IN 3D 607
TABLE 3Processing Times for the THORAX Data Set
Fig. 15. Results on the MCGILL BRAIN data set. The sagittal, transversal, coronal views of the extracted (a) CSF, (b) gray matter, and (c) white matterboundaries are shown. The inner cortical surface and the outer cortical surface are shown together in (d). In (e) and (f), three views of the inner andouter cortical surface mesh are shown.

and 15c) by using 3D first order voting for region boundary
detection for the respective tissue volume. To further
delineate the two bounding surfaces of the gray matter, we
perform two additional operations, based on the knowledge
that CSF encloses GM which, in turn, encloses WM. Thus,
CSF \GM gives the outer cortical surface, whereas GM \WM produces the inner cortical surface. Fig. 15d shows the
resulting intersections for both the inner and the outer
surface. Finally, Figs. 15e and 15f show the result of the innerandouter cortical surface using the augmented tensor voting,
which consists of 3D secondorder voting to refine thenormal,
inference of sign of curvature, followed by surface extraction.While only the continuity and smoothness constraints are
usedwhenwe apply our first order augmented tensor voting
framework, there exist other specialized methods in themedical image computing literature that make use of prior
knowledge. The use of prior models to extract brain surfaces
is however out of the scope of this paper. Table 4 summarizesthe processing times for the MCGILL BRAIN data set.
608 IEEE TRANSACTIONS ON PATTERN ANALYSIS AND MACHINE INTELLIGENCE, VOL. 26, NO. 5, MAY 2004
TABLE 4Processing Times for the MCGILL BRAIN Data Set
Fig. 16. Algorithm 1.

We perform a simple error analysis on the resulting graymatter surfaces obtained above (Fig. 15), for which groundtruth is available. Qualitatively, the results are verysatisfactory. Our quantitative comparison is as follows:The true bounding surfaces of gray matter are first derivedfrom the set of pixels known to be gray matter (groundtruth) by manual expert tracing. We count the number ofpixels classified as cortex surfaces, and check against thetrue boundary pixels. Let TP% be the true positivepercentage that indicates our correct classification. LetFP% and FN% be the false positive and negativepercentage, respectively. We obtained the following results:TP ¼ 89:76%, FP ¼ 4:36%, FN ¼ 5:10%. We have approxi-mately 90 percent correctness, which is comparable to theresults reported in [43] for the same example. Their focus isthe correctness of tissue volume labeling and a TP% of 92 isreported. On the other hand, our interest is the correctnessof tissue surface labeling, which could be a more sensitivemetric and, hence, we have a slightly lower TP%. Weindicate the cortical bounding surface tokens in our figures.
7 DISCUSSION AND CONCLUSION
In this paper, we have presented a first order augmentationto the tensor voting framework that fits naturally within thetheory described in [1]. It was illustrated in 3D, but itprovides a boundary detection mechanism for manifolds ofdimension 1 to N in any N-dimensional space. We haveshown how the first order vector fields can be derived fromthe fundamental 2D first order stick field, in the same way asthe second order tensor fields. Our new representationmaintains all the critical properties of the strictly secondorder one, including reasonable computational complexity,and, at the same time, provides a richer description for
perceptual structures in any dimension. In the same waythat the second order tensor simultaneously encodes thesaliency of the token as an elementary surface patch, anelementary curve segment, a junction, or noise, thusallowing the decisions to be made at a later stage, thepolarity vector encodes the saliency of the token as aboundary of a perceptual structure without labeling thetoken as a boundary before the local neighborhood isconsidered. The voting fields allow tokens with differenttensor structures to interact with each other and provide themeans for junctions, curves, surfaces, volumes, and theirboundaries to emerge from the same space. We claim thatthis is an important contribution and that results should besuperior with unified processing as opposed to treating eachtype of structure separately.
Putting the capability to detect discontinuities to use, wehave also opened the door to multiscale data analysis usingtensor voting. The results we have obtained are encouragingand they justify both the fine-to-coarse manner in which weprocess the data, as well as the automatic scale selectiontechniqueweuse.Theseallowus to locally resolve the conflictbetween detail preservation, on one hand, and smoothnessand continuity, on the other. Scale adaptation based on localcriteria bypasses the need for computing the entire scale-spaceof large three-dimensional data sets and the subsequentneed for searching for the proper output in scale-space. Amajor axis of our future work will be along furtherexperiments on multiscale data analysis. There is a plethoraof issues that areworthyof investigation, such as the selectionof the range of scales as a function of the level of noise, thechoice of the local criteria used for scale adaptation, and thedevelopment of multiresolution representations for the data.
TONG ET AL.: FIRST ORDER AUGMENTATION TO TENSOR VOTING FOR BOUNDARY INFERENCE AND MULTISCALE ANALYSIS IN 3D 609
Fig. 17. Algorithm 2.

APPENDIX
ALGORITHMS FOR 3D TENSOR VOTING
We detail the general second order tensor voting algorithm[37] in this section. The voter uses GENTENSORVOTE to casta tensor vote to the vote receiver (votee). Votes generated byGENNORMALVOTE are accumulated using COMBINE. A3� 3 outTensor is the output. The votee thus receives a setof outTensor from voters within its neighborhood. Theresulting tensor matrices can be summed up by ADDTEN-
SOR, which performs ordinary 3� 3 matrix addition. Thefinal matrix after accumulation describes an ellipsoid in 3D.For first order voting, ADDVECTOR is used for voteaccumulation, which is plain vector addition. See Figs. 16,17, 18, and 19.
ACKNOWLEDGMENTS
This research is supported by the Hong Kong Research
Grant Council (Project No. HKUST 6193/02E), the National
Science Foundation (Project No. 9811883), and the Inte-
grated Media Systems Center, and National Science
Foundation Engineering Research Center, Cooperative
Agreement No. EEC-9529152.
REFERENCES
[1] G. Medioni, M.S. Lee, and C.K. Tang, A Computational Frameworkfor Segmentation and Grouping. Elsevier, 2000.
[2] W.S. Tong, C.K. Tang, and G. Medioni, “First Order Tensor Votingand Application to 3-D Scale Analysis,” Proc. Computer Vision andPattern Recognition, vol. I, pp. 175-182, 2001.
[3] M. Wertheimer, “Laws of Organization in Perceptual Forms,”Psycologische Forschung, translation by W. Ellis, A source book ofGestalt psychology (1938), vol. 4, pp. 301-350, 1923.
[4] M. Nicolescu and G. Medioni, “Layered 4D Representation andVoting for Grouping from Motion,” IEEE Trans. Pattern Analysisand Machine Intelligence, vol. 25, no. 4, pp. 492-501, Apr. 2003.
[5] T. Lindeberg, “Scale-Space: A Framework for Handling ImageStructures at Multiple Scales,” CERN School of Computing, pp. 695-702, 1996.
[6] Z. Li, “A Neural Model of Contour Integration in the PrimaryVisual Cortex,” Neural Computation, vol. 10, pp. 903-940, 1998.
[7] C.M. Gray, “The Temporal Correlation Hypothesis of VisualFeature Integration: Still Alive and Well,” Neuron, vol. 24, pp. 31-47, 1999.
[8] E. Mingolla, W.D. Ross, and S. Grossberg, “A Neural Network forEnhancing Boundaries and Surfaces in Synthetic Aperture RadarImages,” Neural Networks, vol. 12, pp. 499-511, 1999.
[9] R. Raizada and S. Grossberg, “Context-Sensitive Bindings by theLaminar Circuits of v1 and v2: A Unified Model of PerceptualGrouping, Attention, and Orientation Contrast,” Visual Cognition,vol. 8, nos. 3-5, pp. 431-466, June 2001.
[10] E. Saund, “Symbolic Construction of a 2D Scale-Space Image,”IEEE Trans. Pattern Analysis and Machine Intelligence, vol. 12, no. 8,pp. 817-830, Aug. 1990.
[11] D. Terzopoulos and D. Metaxas, “Dynamic 3D Models with Localand Global Deformations: Deformable Superquadrics,” IEEETrans. Pattern Analysis and Machine Intelligence, vol. 13, no. 7,pp. 703-714, July 1991.
[12] J.A. Sethian, Level Set Methods: Evolving Interfaces in Geometry, FluidMechanics, Computer Vision and Materials Science. Cambridge Univ.Press, 1996.
[13] S. Osher, H.K. Zhao, and R. Fedkiw, “Fast Surface ReconstructionUsing the Level Set Method,” UCLA Computational and AppliedMath. Reports, pp. 32-40, 2001.
[14] S. Osher and R.P. Fedkiw, The Level Set Method and DynamicImplicit Surfaces. Springer Verlag, 2002.
[15] K.L. Boyer and S. Sarkar, “Perceptual Organization in ComputerVision: Status, Challenges, and Potential,” Computer Vision andImage Understanding, vol. 76, no. 1, pp. 1-6, Oct. 1999.
[16] A. Shashua and S. Ullman, “Structural Saliency: The Detection ofGlobally Salient Structures Using a Locally Connected Network,”Proc. Int’l Conf. Computer Vision, pp. 321-327, 1988.
[17] P. Parent and S.W. Zucker, “Trace Inference, Curvature Consis-tency, and Curve Detection,” IEEE Trans. Pattern Analysis andMachine Intelligence, vol. 11, no. 8, pp. 823-839, Aug. 1989.
[18] P.T. Sander and S.W. Zucker, “Inferring Surface Trace andDifferential Structure from3D Images,” IEEETrans. PatternAnalysisand Machine Intelligence, vol. 12, no. 9, pp. 833-854, Sept. 1990.
[19] S. Sarkar and K.L. Boyer, “A Computational Structure forPreattentive Perceptual Organization: Graphical Enumerationand Voting Methods,” IEEE Trans. Systems, Man, and Cybernetics,vol. 24, no. 2, pp. 246-267, Feb. 1994.
[20] S. Grossberg and E. Mingolla, “Neural Dynamics of FormPerception: Boundary Completion,” Psychological Rev., pp. 173-211, 1985.
[21] S. Grossberg and D. Todorovic, “Neural Dynamics of 1-D and 2-DBrightness Perception: A Unified Model of Classical and RecentPhenomena,”Perception andPsychophysics,vol. 43, pp. 723-742, 1988.
[22] F. Heitger and R. von der Heydt, “A Computational Model ofNeural Contour Processing: Figure-Ground Segregation andIllusoryContours,”Proc. Int’l Conf. Computer Vision,pp. 32-40, 1993.
[23] L.R. Williams and D.W. Jacobs, “Stochastic Completion Fields: ANeural Model of Illusory Contour Shape and Salience,” NeuralComputation, vol. 9, no. 4, pp. 837-858, 1997.
[24] S.C. Yen and L.H. Finkel, “Extraction of Perceptually SalientContours by Striate Cortical Networks,” Vision Research, vol. 38,no. 5, pp. 719-741, 1998.
610 IEEE TRANSACTIONS ON PATTERN ANALYSIS AND MACHINE INTELLIGENCE, VOL. 26, NO. 5, MAY 2004
Fig. 19. Algorithm 4.
Fig. 18. Algorithm 3.

[25] L.R. Williams and K.K. Thornber, “A Comparison of Measures forDetecting Natural Shapes in Cluttered Backgrounds,” Int’lJ. Computer Vision, vol. 34, no. 2/3, pp. 1-16, Aug. 1999.
[26] H. Neummann and E. Mingolla, “Computational Neural Modelsof Spatial Integration in Perceptual Grouping,” From Fragments toObjects: Grouping and Segmentation in Vision, T.F. Shipley andP.J. Kellman, eds., pp. 353-400, 2001.
[27] A.P. Witkin, “Scale-Space Filtering,” Proc. Fourth Int’l Joint Conf.Artificial Intelligence, pp. 1019-1022, 1983.
[28] F. Mokhtarian, “Multi-Scale Description of Space Curves andThree-Dimensional Objects,” Proc. IEEE Conf. Computer Vision andPattern Recognition, pp. 298-303, 1988.
[29] F. Mokhtarian and A.K. Mackworth, “A Theory of Multiscale,Curvature-Based Shape Representation for Planar Curves,” IEEETrans. Pattern Analysis and Machine Intelligence, vol. 14, no. 8,pp. 789-805, Aug. 1992.
[30] D.G. Lowe, “Organization of Smooth Image Curves at MultipleScales,” Int’l J. Computer Vision, vol. 3, no. 2, pp. 119-130, June1989.
[31] P. Perona and J. Malik, “Scale Space and Edge Detection UsingAnisotropic Diffusion,” IEEE Trans. Pattern Analysis and MachineIntelligence, vol. 12, no. 7, pp. 629-639, July 1990.
[32] T. Lindeberg, “Principles for Automatic Scale Selection,” Handbookon Computer Vision and Applications, vol. 2, pp. 239-274, 1999.
[33] D. Marr, Vision. Freeman Press 1982.[34] E. Saund, “Labeling of Curvilinear Structure Across Scales by
Token Grouping,” Proc. Conf. Computer Vision and PatternRecognition, pp. 257-263, 1992.
[35] J. Dolan and E.M. Riseman, “Computing Curvilinear Structure byToken-Based Grouping,” Proc. Conf. Computer Vision and PatternRecognition, pp. 264-270, 1992.
[36] F. Mokhtarian and A.K. Mackworth, “Scale Based Description andRecognition of Planar Curves and Two-Dimensional Shapes,”IEEE Trans. Pattern Analysis and Machine Intelligence, vol. 8, no. 1,pp. 34-43, Jan. 1986.
[37] C.K. Tang, G. Medioni, and M.S. Lee, “N-Dimensional TensorVoting and Application to Epipolar Geometry Estimation,” IEEETrans. Pattern Analysis and Machine Intelligence, vol. 23, no. 8,pp. 829-844, Aug. 2001.
[38] C.K. Tang and G. Medioni, “Inference of Integrated Surface,Curve, and Junction Descriptions from Sparse 3D Data,” IEEETrans. Pattern Analysis and Machine Intelligence, vol. 20, no. 11,pp. 1206-1223, Nov. 1998.
[39] W.E. Lorensen and H.E. Cline, “Marching Cubes: A HighResolution 3D Surface Reconstruction Algorithm,” ComputerGraphics, vol. 21, no. 4, pp. 163-169, 1987.
[40] C.K. Tang and G. Medioni, “Curvature-Augmented Tensor Votingfor Shape Inference from Noisy 3D Data,” IEEE Trans. PatternAnalysis and Machine Intelligence, vol. 24, no. 6, pp. 858-864, June2002.
[41] R. Mohan and R. Nevatia, “Perceptual Organization for SceneSegmentation and Description,” IEEE Trans. Pattern Analysis andMachine Intelligence, vol. 14, no. 6, pp. 616-635, June 1992.
[42] “Brainweb,” McConnel Brain Imaging Center at the MontrealNeurological Inst. http://www.bic.mni.mcgill.ca/, 2004.
[43] X. Zeng, L.H. Staib, R.T. Schultz, and J.S. Duncan, “Segmentationand Measurement of the Cortex from 3-D MR Images,” Proc. Int’lConf. Medical Image Computing and Computer-Assisted Intervention,pp. 519-530, 1998.
[44] L.M. Lorigo, O.D. Faugeras, W.E.L. Grimson, R. Keriven, R.Kikinis, A. Nabavi, and C.F. Westin, “Codimension-Two GeodesicActive Contours for the Segmentation of Tubular Structures,”pp. 444-451, Proc. Computer Vision and Pattern Recognition, 2000.
Wai-Shun Tong received the BEng and MPhildegrees from the Hong Kong University ofScience of Technology in computer science.He was a visiting student at the University ofSouthern California (USC), Los Angeles, in2001. In 2002, he was awarded the MicrosoftFellowship Asia. He is currently a visiting studentat the Visual Computing Group of MicrosoftResearch Asia. His research interests includelow to mid-level vision such as segmentation,
correspondence, shape analysis, and vision and graphics topics. He is astudent member of the IEEE Computer Society.
Chi-Keung Tang received the MS and PhDdegrees in computer science from the Universityof Southern California (USC), Los Angeles, in1999 and 2000, respectively. He has been withthe Computer Science Department at the HongKong University of Science and Technologysince 2000, where he is currently an assistantprofessor. He is also an adjunct researcher atthe Visual Computing Group of Microsoft Re-search, Asia, working on various exciting re-
search topics in computer vision and graphics. His research interestsinclude low- to mid-level vision such as segmentation, correspondence,shape analysis, and vision and graphics topics such as image-basedrendering and medical image analysis. He is a member of the IEEEComputer Society.
Philippos Mordohai received the Diploma inelectrical and computer engineering from theAristotle University of Thessaloniki, Greece, in1998 and the MS degree in electrical engineer-ing from the University of Southern California(USC), Los Angeles, in 2000. He is pursuing thePhD degree in electrical engineering at USC. Heis a graduate research assistant at the ComputerVision Laboratory of the Institute of Robotics andIntelligent Systems and the Integrated MediaSystems Center at USC. His research interests
in computer vision include perceptual organization and 3D reconstruc-tion from two or multiple images. He is a student member of the IEEEand the IEEE Computer Society.
Gerard Medioni received the Diplome d’Ingen-ieur Civil from the Ecole Nationale Superieuredes Telecommunications, Paris, France, in 1977and the MS and PhD degrees in computerscience from the University of Southern Califor-nia, Los Angeles, in 1980 and 1983, respec-tively. He has been with USC since 1983, wherehe is currently a professor of computer scienceand electrical engineering, codirector of theComputer Vision Laboratory, and chairman of
the Computer Science Department. He was a visiting scientist at INRIASophia Antipolis in 1993 and chief technical officer of Geometrix, Inc.during his sabbatical leave in 2000. His research interests cover a broadspectrum of the computer vision field and he has studied techniques foredge detection, perceptual grouping, shape description, stereo analysis,range image understanding, image to map correspondence, objectrecognition, and image sequence analysis. He has published more than100 papers in conference proceedings and journals. Dr. Medioni is afellow of the IEEE and a fellow of the IAPR. He has served on theprogram committees of many major vision conferences and wasprogram chairman of the 1991 IEEE Computer Vision and PatternRecognition Conference in Maui, program cochairman of the 1995 IEEESymposium on Computer Vision held in Coral Gables, Florida, generalcochair of the 1997 IEEE Computer Vision and Pattern RecognitionConference in Puerto Rico, program cochair of the 1998 InternationalConference on Pattern Recognition held in Brisbane, Australia, andgeneral cochairman of the 2001 IEEE Computer Vision and PatternRecognition Conference in Kauai. Professor Medioni is an associateeditor of Pattern Recognition and Image Analysis and one of the NorthAmerican editors for Image and Vision Computing.
TONG ET AL.: FIRST ORDER AUGMENTATION TO TENSOR VOTING FOR BOUNDARY INFERENCE AND MULTISCALE ANALYSIS IN 3D 611


