Embed Size (px)
Citation preview
Fiscal Space for Achieving the Millennium Development Goals and Implementing the TenthPlan in BhutanAuthor(s): M GOVINDA RAO and ANURADHA SETHSource: Economic and Political Weekly, Vol. 44, No. 35 (AUGUST 29-SEPTEMBER 4, 2009), pp.51-59Published by: Economic and Political WeeklyStable URL: http://www.jstor.org/stable/25663493 .
Accessed: 18/09/2014 12:40
Your use of the JSTOR archive indicates your acceptance of the Terms & Conditions of Use, available at .http://www.jstor.org/page/info/about/policies/terms.jsp
.JSTOR is a not-for-profit service that helps scholars, researchers, and students discover, use, and build upon a wide range ofcontent in a trusted digital archive. We use information technology and tools to increase productivity and facilitate new formsof scholarship. For more information about JSTOR, please contact [email protected].
.
Economic and Political Weekly is collaborating with JSTOR to digitize, preserve and extend access toEconomic and Political Weekly.
http://www.jstor.org
This content downloaded from 165.65.120.145 on Thu, 18 Sep 2014 12:40:55 PMAll use subject to JSTOR Terms and Conditions
[SPECIAL ARTICLE ??? ^^^^^^^^^^^^^^^^
Fiscal Space for Achieving the Millennium
Development Goals and Implementing the Tenth Plan in Bhutan
M GOVINDA RAO, ANURADHA SETH __
The paper addresses the issue of financing the achievement of the Millennium Development Goals in a sustainable manner in a small, low income and
landlocked country, the example being Bhutan. The
analysis shows that although mdg financing is nested
within the plan outlay, significant efforts will be needed to ensure adequate resources for financing the plan and
smoothening the wide year-to-year fluctuations in
revenues and expenditure flows. The paper explores the availability of additional fiscal space using the fiscal diamond framework to identify policy and institutional reforms needed for raising revenues from
tax and non-tax sources, improving productivity from public spending through reprioritisation,
accessing external grants and borrowing from
domestic and foreign sources.
M Govinda Rao {[email protected]) is with the National Institute of Public Finance and Policy, New Delhi. Anuradha Seth
([email protected]) is with the Regional Centre for Asia and the Pacific, United Nations Development Programme.
Bhutan, a small Himalayan kingdom with just over
6,40,000 people has been making rapid strides in eco nomic progress and human development. The country has
recorded impressive growth rates to average over 7% per annum
during the last two decades and during the Ninth Plan period (2002-07), the growth rate was over 9%. This has transformed
the economy from being one of the least developed, to one with a
per capita income of $1,200. There has been a steady improve ment in human development indicators as well. From being a low
human development country with a human development Index
(hdi) value of 0.550 in 1998, the country progressed to a medium
country with a value of 0.600 in 2006. Among the south Asian
countries, only India and Sri Lanka have marginally higher values of hdi.
1 Introduction
In this small, landlocked country with limited market penetra tion, economic growth has mainly been based on the exploitation
of natural resources, more particularly, generation and export of
hydropower. The narrow basis of growth has been capital inten
sive and has led to uneven distribution. However, the govern
ment has used the resources generated through these activities to
spend on social infrastructure to make impressive progress in
human development. The government is fully committed to
achieving the Millennium Development Goals (mdgs) by main
streaming it into the Tenth Plan (2008-13).
Mainstreaming the mdg with the Plan requires making a
detailed cost estimate for achieving the mdgs, alignment of Plan
outlays with mdg needs and working out strategies to raise the
required resources. The government undertook a detailed costing exercise to quantify the resource requirements for achieving seven
of the eight mdgs, namely, reducing poverty and hunger, securing universal primary education, promoting gender equality and women's empowerment, reducing child mortality, improving maternal health, combating the spread of communicable diseases and ensuring environmental sustainability (rgob 2007a).
This study attempts to quantify the fiscal space needed to achieve the mdgs and identify the measures to finance the mdgs in a sustainable manner. Section 2 briefly outlines the analytical framework employed to determine the potential for expanding the fiscal space. Section 3 summarises the overall financing re
quirements for achieving mdgs and compares it with the Plan out
lay. Section 4 explores the role of domestic revenue mobilisation.
Economic & Political weekly DDES august 29, 2009 vol xliv no 35 51
This content downloaded from 165.65.120.145 on Thu, 18 Sep 2014 12:40:55 PMAll use subject to JSTOR Terms and Conditions
SPECIAL ARTICLE ^ , ? _r-=
Section 5 analyses expenditure trends, its consistency with mdg
cost estimates, and explores the scope for improving efficiency and expenditure reprioritisation. Section 6 considers the role of
official development assistance (oda) and Section 7 examines the
scope for borrowings (both external and domestic). Section 8 deals with the possibility of enhancing fiscal space through private sources (foreign direct investment (fdi), households).
Section 9 presents concluding remarks.
2 Mobilising Resources: Analytical Framework
It is very well recognised that inclusive growth requires building capabilities of the poor and disadvantaged sections to empower them to participate in the market in a productive manner. As
argued by Amartya Sen (1999:86), "poverty must be seen as the
deprivation of basic capabilities rather than merely as lowness of incomes". Capabilities provide freedoms - freedom from hunger
and poverty, freedom to work, freedom from increased choice of
avocations. Bhutan has been transforming itself into a demo
cratic society and ensuring these freedoms will make this trans
formation even more meaningful.
Bhutan has tried to align the national planning process with
the mdgs. Analysis shows that the country has made impressive
strides in human development and it is well on track to achieve most of the mdgs (rgob and undp 2005). Even as the growth of Bhutan's economy is narrowly based (dependant mainly on the
generation and export of hydroelectricity), the government has
to broaden the developmental base by spending on education,
healthcare and agriculture and rural development to disseminate
the benefits to the population as a whole. Nevertheless, achieving
the mdgs depends on the ability of the government to release
resources for investment in sectors as reflected in the Bhutan
Millennium Development Goals: Needs Assessment and Costing
Report (2006-2015) (rgob 20073:103).
The financing strategy for achieving the mdgs entails a com
prehensive mapping of potential sources of finance from both
public and private sources - though, public spending constitutes
a predominant part of spending on sectors impacting on mdgs.
The fiscal space diamond is a diagnostic tool that assesses the
major sources of "public finance" available to countries (Seth
2007; Chambas et al 2006; World Bank 2007). The four sides of the diamond represent different mechanisms by which fiscal
space can be enhanced. These are (i) enhancing domestic reve
nues from tax and non-tax sources; (ii) increasing official devel
opment assistance including grants, concessional loans and debt
relief; (iii) reprioritising expenditures, including enhancing their
allocative and technical efficiency, and (iv) financing public
expenditures by borrowing from domestic and international
sources.
3 Financing Requirements for MDGs and Investments in
the Tenth Plan
Bhutan's MDGs Needs Assessment Report (2007) estimated that
between 2006 and 2015, the country will need to invest approxi
mately Ngultrums (Nu) 113.110 billion ($ 2.5 billion) in 2005
prices to implement interventions identified for achieving
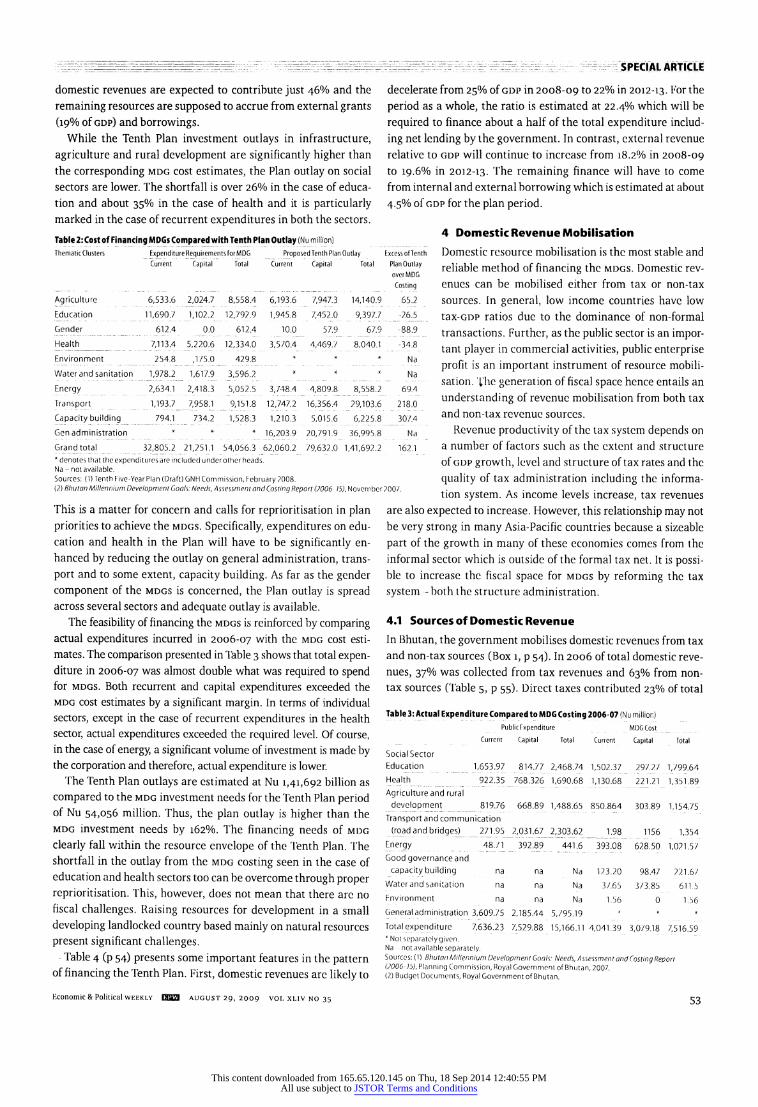
the mdgs (Table 1). These estimates represent on average
Nu 17,815 ($394) per capita annually or Nu 178,146 ($3,937) per capita for the next 10 years from 2006 to 2015. According to the
Report, investment needs are the highest for the social sectors.
The investment requirements for the education sector constitute
almost a quarter of total investment needs and for health, it is
21.9%. Investment needs for infrastructure (transport and
energy) are estimated at 26.5% followed by agriculture and rural
development (16.6%). Collectively, these four sectors account for
89.4% of total mdg investment needs. The analysis also shows
that almost 60% of the total investment will be required for recurrent expenditures and capital investment requirements
will be 40%.
Table 1: Total Resource Needs Estimates for Interventions to Achieve M DGs (2006 15, Nu million)
MDG ThematicClusters Total Capital Recurrent Per Cent of Total
1 Agriculture 18,748.03 4,507.59 14,240.44 16.58
2 Education _ 27,600.33 2,807.26 24,793.07 24.40
3 Gender 1,343.98 1,343.98 1.19
4,5,6 Health 24,794.42 9,910.41 14,884.01 21.92
7 Environment 458.17 183.23 274.94 0.41
8 Waterand sanitation 7,366.27 4,017.78 3,348.49 6.51
Cross-cutting Energy 10,820.04 5,332.75 5,48/.29 9.57 sectors Transport 19,162.69 16,641.82 2,520.87 16.94
Capacity 2,816.25 1,260.76 1,555.49 2.49
Grand total 113,110.19 46,005.58 67,104.60 100
Percentage 100 40% 60% Source: RGoB?00/a.
According to Bhutan's Tenth Five-Year Plan, of the total esti
mated development outlay of Nu 141.692 billion (rgob 2008b), Nu 62.06 billion or 43.8% has been allocated for current expendi
tures and spending on capital investments constitute the remain
ing (56.2 %). The sector-wise break up shows that over 26% of the
allocation is for general administration and another 26% for in
frastructure sectors such as energy and transport. The allocation
to social sectors is about 22%.
A comparison of the two estimates presented in Table 2 (p 53)
indicates that in general, the Tenth Plan outlay is almost 162%
higher than the investment requirements for mdg for the compa
rable period. Of course, plan outlay includes expenditures on
sectors and programmes which are not a part of the mdg costing.
Nevertheless, even if only investments in social and economic
sectors are considered, the proposed plan investments are higher
by 93%. This is true of both current and capital components - the
former by 39% and the latter by 177%. Thus, the overall plan outlay can more than adequately cover the requirements to
achieve the mdgs.
As the mdg financing requirements are nested within the
Tenth Plan investment, the mdg financing issues are subsumed
under broader issues surrounding the financing of the Tenth Plan
itself. The pattern of financing the Tenth Plan, however, shows
that the domestic resources can finance just about 46.3% of the
total requirements of Nu 65.6 billion, external assistance grants
of around Nu 56 billion to help meet its capital expenditures in
the Tenth Plan (ibid: 63). The pattern of plan financing shown in
Table 3 (p 53) shows that total plan outlay during the Tenth Plan is estimated at over 28% of gross domestic product (gdp) and
52 august 29, 2009 vol xliv no 35 GEES Economic & Political weekly
This content downloaded from 165.65.120.145 on Thu, 18 Sep 2014 12:40:55 PMAll use subject to JSTOR Terms and Conditions
:^^^eeee?ee^^ ARTICLE
domestic revenues are expected to contribute just 46% and the
remaining resources are supposed to accrue from external grants
(19% of gdp) and borrowings. While the Tenth Plan investment outlays in infrastructure,
agriculture and rural development are significantly higher than the corresponding mdg cost estimates, the Plan outlay on social
sectors are lower. The shortfall is over 26% in the case of educa
tion and about 35% in the case of health and it is particularly marked in the case of recurrent expenditures in both the sectors.
Table 2: Cost of Financing MDGs Compared with Tenth Plan Outlay (Nu million) Thematic Clusters Expenditure Requirements for MDG Proposed Tenth Plan Outlay Excess of Tenth
Current Capital Total Current Capital Total Plan Outlay over MDG Costing
Agriculture 6,533.6 2,024.7 8,558.4 6,193.6 7,947.3 14,140.9 65.2
Education 11,690.7 1,102.2 12,792.9 1,945.8 7,452.0 9,397.7 -2.6.5
Gender _ 612.4 0.0 612.4 10.0 57.9 67.9 -88.9
Health_ 7,113.4 5,220.6 12,334.0 3,5/0.4 4,469.7 8,040.1 -34.8
Environment 254.8 ,175.0 429.8 M * Na
Water and sanitation 1,978.2 1,617.9 3,596.2 * * * Na
Energy 2,634.1 2,418.3 5,052.5 3,748.4 4,809.8 8,558.2 69.4
Transport 1,193.7 7,958.1 9,151.8 12,747.2 16,356.4 29,103.6 218.0
Capacity building 794.1 734.2 1,528.3 1,210.3 5,015.6 6,225.8 307.4
Gen administration * * * 16,203.9 20,791.9 36,995.8 Na
Grandtotal 32,805.2 21,251.1 54,056.3 62,060.2 79,632.0 1,41,692.2 162.1 * denotes that the expenditures are included under other heads. Na - not available. Sources: (1) Tenth Five Year Plan (Draft) GNH Commission, February 2008. (2) Bhutan Millennium Development Goals: Needs, Assessment and Costing Report (P006-15), November 2007.
This is a matter for concern and calls for reprioritisation in plan priorities to achieve the mdgs. Specifically, expenditures on edu
cation and health in the Plan will have to be significantly en hanced by reducing the outlay on general administration, trans
port and to some extent, capacity building. As far as the gender
component of the mdgs is concerned, the Plan outlay is spread across several sectors and adequate outlay is available.
The feasibility of financing the mdgs is reinforced by comparing actual expenditures incurred in 2006-07 with the mdg cost esti
mates. The comparison presented in Table 3 shows that total expen
diture in 2006-07 was almost double what was required to spend for mdgs. Both recurrent and capital expenditures exceeded the
mdg cost estimates by a significant margin. In terms of individual
sectors, except in the case of recurrent expenditures in the health
sector, actual expenditures exceeded the required level. Of course,
in the case of energy, a significant volume of investment is made by the corporation and therefore, actual expenditure is lower.
The Tenth Plan outlays are estimated at Nu 1,41,692 billion as
compared to the mdg investment needs for the Tenth Plan period of Nu 54,056 million. Thus, the plan outlay is higher than the mdg investment needs by 162%. The financing needs of mdg
clearly fall within the resource envelope of the Tenth Plan. The shortfall in the outlay from the mdg costing seen in the case of education and health sectors too can be overcome through proper
reprioritisation. This, however, does not mean that there are no
fiscal challenges. Raising resources for development in a small
developing landlocked country based mainly on natural resources
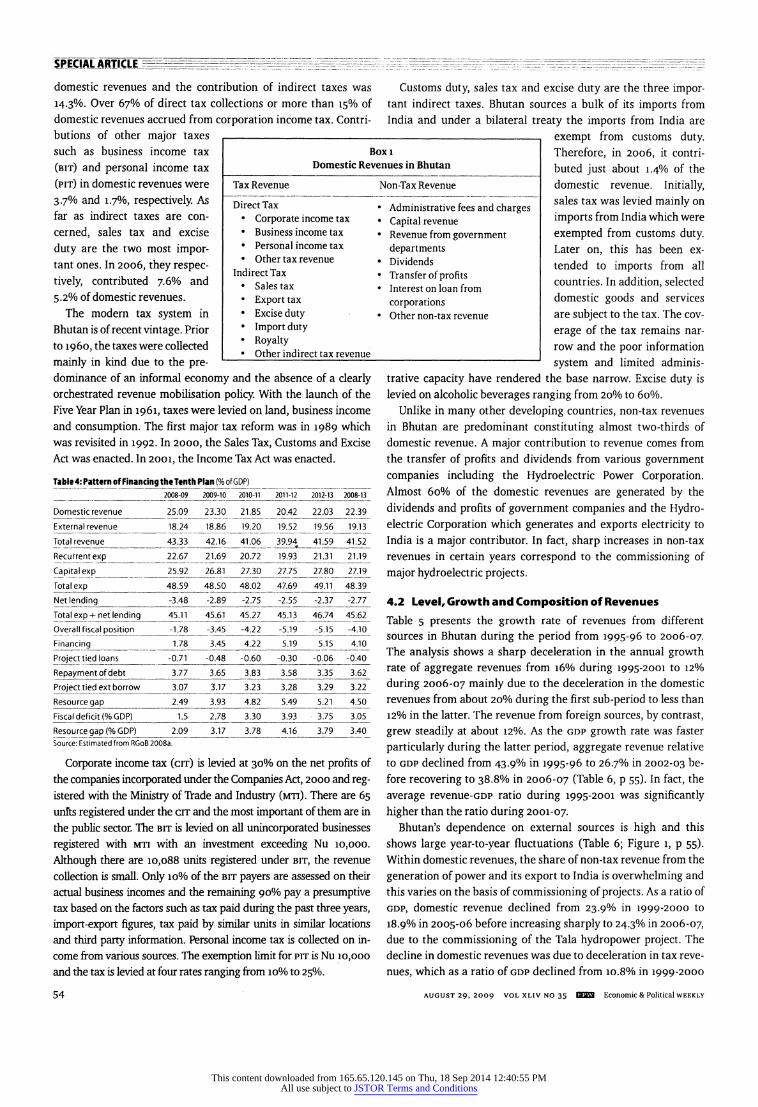
present significant challenges. Table 4 (p 54) presents some important features in the pattern
of financing the Tenth Plan. First, domestic revenues are likely to
decelerate from 25% of gdp in 2008-09 to 22% in 2012-13. For the
period as a whole, the ratio is estimated at 22.4% which will be
required to finance about a half of the total expenditure includ
ing net lending by the government. In contrast, external revenue
relative to gdp will continue to increase from 18.2% in 2008-09
to 19.6% in 2012-13. The remaining finance will have to come
from internal and external borrowing which is estimated at about
4.5% of gdp for the plan period.
4 Domestic Revenue Mobilisation
Domestic resource mobilisation is the most stable and
reliable method of financing the mdgs. Domestic rev
enues can be mobilised either from tax or non-tax
sources. In general, low income countries have low
tax-gdp ratios due to the dominance of non-formal
transactions. Further, as the public sector is an impor tant player in commercial activities, public enterprise
profit is an important instrument of resource mobili
sation, t he generation of fiscal space hence entails an
understanding of revenue mobilisation from both tax
and non-tax revenue sources.
Revenue productivity of the tax system depends on
a number of factors such as the extent and structure
of gdp growth, level and structure of tax rates and the
quality of tax administration including the informa
tion system. As income levels increase, tax revenues
are also expected to increase. However, this relationship may not
be very strong in many Asia-Pacific countries because a sizeable
part of the growth in many of these economies comes from the
informal sector which is outside of the formal tax net. It is possi ble to increase the fiscal space for mdgs by reforming the tax
system - both the structure administration.
4.1 Sources of Domestic Revenue
In Bhutan, the government mobilises domestic revenues from tax
and non-tax sources (Box i, p 54). In 2006 of total domestic reve
nues, 37% was collected from tax revenues and 63% from non
tax sources (Table 5, p 55). Direct taxes contributed 23% of total
Table 3: Actual Expenditure Compared to MDG Costing 2006-07 (Nu million) Public Fxpenditure MDG Cost _
Current Capital Total Current Capital Total
Social Sector Education 1,653.97 814.77 2,468.74 1,502.37 297.27 1,799.64 Health 922.35 768.326 1,690.68 1,130.68 221.21 1,351.89
Agriculture and rural
development 819.76 668.89 1,488.65 850.864 303.89 1,154.75 Transport and communication
(road and bridges) 271.95 2,031.67 2,303.62 _ 1.98 1156 1,354
Energy 48.71 392.89 441.6 393.08 628.50 1,021.5/ Good governance and
capacity building na na Na 123.20 98.47 221.67 Water and sanitation na na Na 3/.65 3/3.85 611 5 Environment na na Na 1.56 0 1.56 General administration 3,609.75 2,185.44 5,795.19 Total expenditure 7,636.23 7,529.88 15,166.11 4,041.39 3,0/9.18 7,516.59 * Not separately given. Na not available separately. Sources: (1) Bhutan Millennium Development Goals: Needs, Assessment and Costing Report (?006 IS), Planning Commission, Royal Government of Bhutan, 2007. (2) Budget Documents, Royal Government of Bhutan.
Economic & Political weekly GQQ3 august 29, 2009 vol xliv no 35 53
This content downloaded from 165.65.120.145 on Thu, 18 Sep 2014 12:40:55 PMAll use subject to JSTOR Terms and Conditions
SPECIAL ARTICLE =^==^ee^~e^e=t=e^:z_ =-,~ ,_--r =r_ ^- : '^-ryy
domestic revenues and the contribution of indirect taxes was
14.3%- Over 67% of direct tax collections or more than 15% of domestic revenues accrued from corporation income tax. Contri
butions of other major taxes such as business income tax
(bit) and personal income tax
(pit) in domestic revenues were
3.7% and 1.7%, respectively. As
far as indirect taxes are con
cerned, sales tax and excise
duty are the two most impor tant ones. In 2006, they respec
tively, contributed 7.6% and
5.2% of domestic revenues.
The modern tax system in Bhutan is of recent vintage. Prior
to i960, the taxes were collected
mainly in kind due to the pre dominance of an informal economy and the absence of a clearly
orchestrated revenue mobilisation policy. With the launch of the Five Year Plan in 1961, taxes were levied on land, business income
and consumption. The first major tax reform was in 1989 which was revisited in 1992. In 2000, the Sales Tax, Customs and Excise
Act was enacted. In 2001, the Income Tax Act was enacted.
Table 4: Pattern of Financing the Tenth Plan (% of GDP)_ _
_2008-09 2009-10 2010-11 2011-12 2012-13 2008-13
Domestic revenue__2l-99_ 2330 21.85_20.42 22.03 22.39
External revenue_ 18.24 18.86_19.20 19.52_19.56 19.13
Total revenue_ 43.33 42.16 41.06 39.94 41.59 41.52
Recurrent exp_22.67_21.69 20.72_19.93 21.31 21.19
Capital exp_ 25.92 26.81_27.30_ 27.75 27.80 _2719_ Total exp_ 48.59 48.50 48.02 47.69 49.11 48.39
Netjending^_-3.48 -2.89 -2.75 -2.55 -2.37 -2.77
Total exp + net lending 45.11 45.61 45.27 45.13 46.74 45.62
Overall fiscal position_-178_-3.45 -4.22 -5.19 -5.15_-4.10 Financi ng_178_3.45 4.22_5J 9_5j 5_ __4/10_ Project tied loans_ -071 -0.48 -0.60 -0.30_-O06_-0.40 Repayment of debt_3.77 3.65 3.83 3.58 3.35 3.62
Project tied ext borrow 3.07 3.17 3.23 3.28 3.29 3.22
Resource gap_2.49 3.93 4.82 5.49 5.21 4.50
Fiscal deficit (%GDP)_1.5 2.78 3.30 3.93 375 3.05
Resource gap (% GDP)_2.09 3.17 378 4.16 3.79 3.40 Source: Estimated from RGoB 2008a.
Corporate income tax (cit) is levied at 30% on the net profits of the companies incorporated under the Companies Act, 2000 and reg
istered with the Ministry of Trade and Industry (mti). There are 65 units registered under the cit and the most important of them are in
the public sector. The bit is levied on all unincorporated businesses
registered with mti with an investment exceeding Nu 10,000.
Although there are 10,088 units registered under bit, the revenue
collection is small. Only 10% of the bit payers are assessed on their
actual business incomes and the remaining 90% pay a presumptive tax based on the factors such as tax paid during the past three years,
import-export figures, tax paid by similar units in similar locations and third party information. Personal income tax is collected on in
come from various sources. The exemption limit for pit is Nu 10,000
and the tax is levied at four rates ranging from 10% to 25%.
Boxi
Domestic Revenues in Bhutan
Tax Revenue Non-Tax Revenue
Direct Tax Administrative fees and charges Corporate income tax
Capital revenue Business income tax . Revenue from government Personal income tax
departments Other tax revenue Dividends
Indirect Tax . Transfer of profits Sales tax Interest on loan from
Export tax corporations
Excise duty . Other non-tax revenue
Import duty
Royalty Other indirect tax
revenue_
Customs duty, sales tax and excise duty are the three impor tant indirect taxes. Bhutan sources a bulk of its imports from
India and under a bilateral treaty the imports from India are
exempt from customs duty.
Therefore, in 2006, it contri
buted just about 1.4% of the domestic revenue. Initially, sales tax was levied mainly on
imports from India which were
exempted from customs duty. Later on, this has been ex
tended to imports from all countries. In addition, selected
domestic goods and services
are subject to the tax. The cov
erage of the tax remains nar
row and the poor information
system and limited adminis
trative capacity have rendered the base narrow. Excise duty is
levied on alcoholic beverages ranging from 20% to 60%. Unlike in many other developing countries, non-tax revenues
in Bhutan are predominant constituting almost two-thirds of
domestic revenue. A major contribution to revenue comes from
the transfer of profits and dividends from various government companies including the Hydroelectric Power Corporation.
Almost 60% of the domestic revenues are generated by the dividends and profits of government companies and the Hydro electric Corporation which generates and exports electricity to India is a major contributor. In fact, sharp increases in non-tax
revenues in certain years correspond to the commissioning of
major hydroelectric projects.
4.2 Level, Growth and Composition of Revenues
Table 5 presents the growth rate of revenues from different
sources in Bhutan during the period from 1995-96 to 2006-07.
The analysis shows a sharp deceleration in the annual growth rate of aggregate revenues from 16% during 1995-2001 to 12%
during 2006-07 mainly due to the deceleration in the domestic revenues from about 20% during the first sub-period to less than 12% in the latter. The revenue from foreign sources, by contrast,
grew steadily at about 12%. As the gdp growth rate was faster
particularly during the latter period, aggregate revenue relative
to gdp declined from 43.9% in 1995-96 to 26.7% in 2002-03 be
fore recovering to 38.8% in 2006-07 (Table 6, p 55). In fact, the
average revenue-gdp ratio during 1995-2001 was significantly
higher than the ratio during 2001-07.
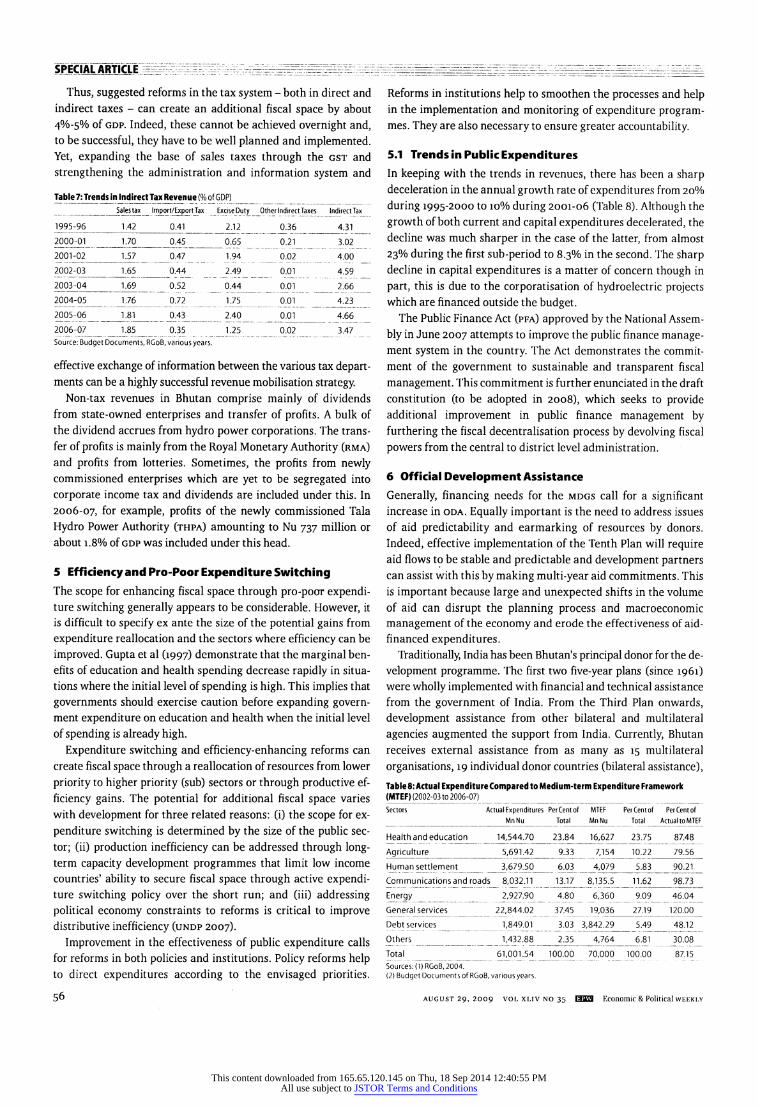
Bhutan's dependence on external sources is high and this
shows large year-to-year fluctuations (Table 6; Figure 1, p 55). Within domestic revenues, the share of non-tax revenue from the
generation of power and its export to India is overwhelming and
this varies on the basis of commissioning of projects. As a ratio of
gdp, domestic revenue declined from 23.9% in 1999-2000 to
18.9% in 2005-06 before increasing sharply to 24.3% in 2006-07,
due to the commissioning of the Tala hydropower project. The decline in domestic revenues was due to deceleration in tax reve
nues, which as a ratio of gdp declined from 10.8% in 1999-2000
54 august 29, 2009 vol xliv no 35 GDBB Economic & Political weekly
This content downloaded from 165.65.120.145 on Thu, 18 Sep 2014 12:40:55 PMAll use subject to JSTOR Terms and Conditions
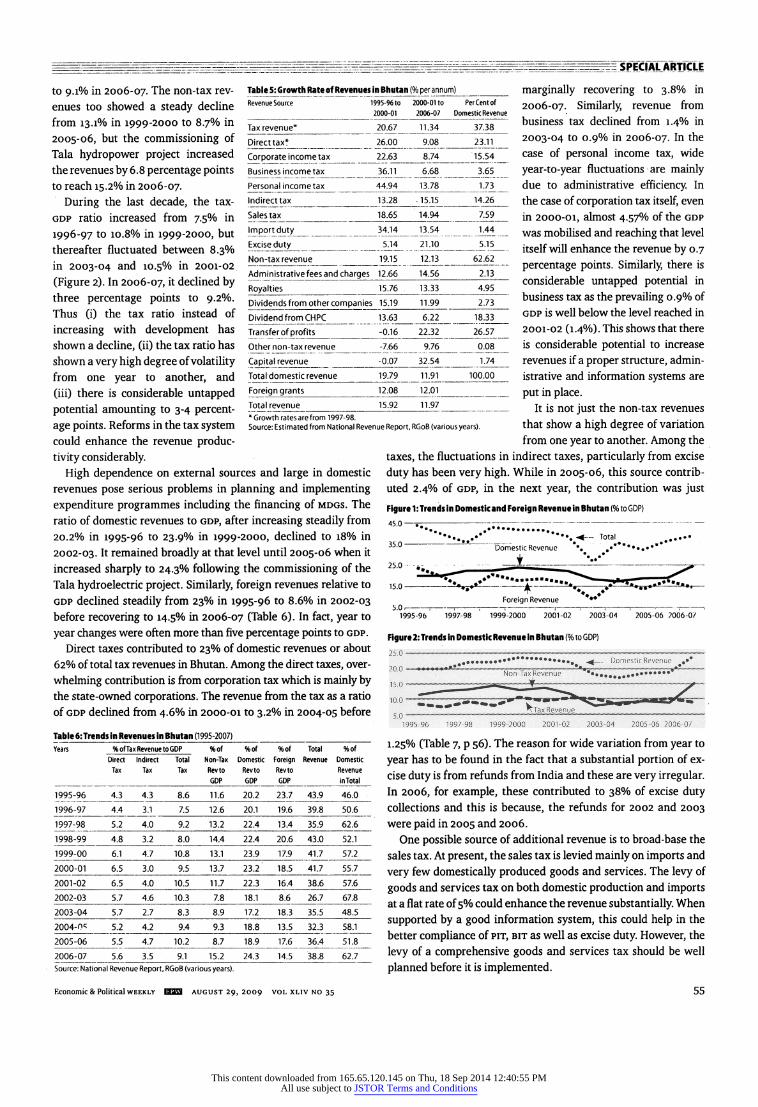
to 9.1% in 2006-07. The non-tax rev
enues too showed a steady decline
from 13.1% in 1999-2000 to 8.7% in
2005-06, but the commissioning of
Tala hydropower project increased the revenues by 6.8 percentage points to reach 15.2% in 2006-07.
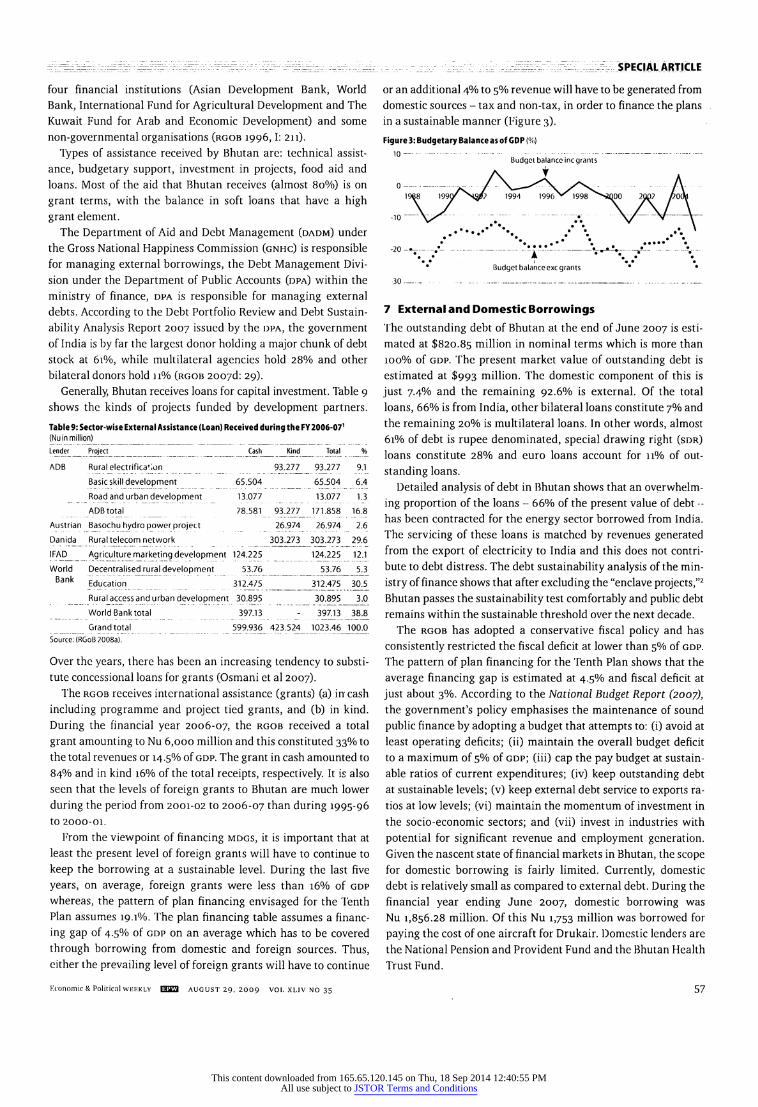
During the last decade, the tax
gdp ratio increased from 7.5% in
1996-97 to 10.8% in 1999-2000, but
thereafter fluctuated between 8.3%
in 2003-04 and 10.5% in 2001-02
(Figure 2). In 2006-07, it declined by three percentage points to 9.2%.
Thus (i) the tax ratio instead of
increasing with development has
shown a decline, (ii) the tax ratio has shown a very high degree of volatility from one year to another, and
(iii) there is considerable untapped potential amounting to 3-4 percent
age points. Reforms in the tax system
Table ̂Growth Rate of Revenues in Bhutan (% per annurrO_ Revenue Source 1995-96 to 2000-01 to Per Cent of
2000-01 2006-07 Domestic Revenue
Tax revenue*_2CK67_
11.34 37.38_
Diremax*_26j?_?__ 9.08_23/M_ Corporate income tax_22.63_8.74_J5i54_ Business incometax_36lL_ 6.68_?-55.._
PersonaJ incometax_44.94 13.78_173_ Indirect tax_13.28_-15.15_14.26 Sales tax_18.65 14.94_759_
[m portduty_34_14_13.54_1.44 _
Exciseduty_5_14_ 21.JI0_5.15_ Non-tax revenue_119.15 12.13_ 62.62
Administrative fees and charges 12.66 14.56_2J3_
Royalties_15.76 13.33_4.95 Dividends from other companies 15.19 11.99_273 Dividend fromCHPC_ 13.63_6.22_18.33_ Transfer of profits_-0.16
22.32 26.57 __
Other non-tax revenue_-7.66_ _ 976^_0.08_ Capital revenue_-0.07_32.54_174 Total domestic revenue_19.79_11.91_1J?_0_?_0_? Foreign grants_12.08 12.01_ TotaI revenue_15.92 11.97_ * Growth rates are from 1997-98. Source: Estimated from National Revenue Report, RGoB (various years).
could enhance the revenue produc
tivity considerably. High dependence on external sources and large in domestic
revenues pose serious problems in planning and implementing
expenditure programmes including the financing of mdgs. The ratio of domestic revenues to gdp, after increasing steadily from
20.2% in 1995-96 to 23.9% in 1999-2000, declined to 18% in
2002-03. It remained broadly at that level until 2005-06 when it
increased sharply to 24.3% following the commissioning of the Tala hydroelectric project. Similarly, foreign revenues relative to gdp declined steadily from 23% in 1995-96 to 8.6% in 2002-03 before recovering to 14.5% in 2006-07 (Table 6). In fact, year to
year changes were often more than five percentage points to gdp.
Direct taxes contributed to 23% of domestic revenues or about
62% of total tax revenues in Bhutan. Among the direct taxes, over
whelming contribution is from corporation tax which is mainly by the state-owned corporations. The revenue from the tax as a ratio
of gdp declined from 4.6% in 2000-01 to 3.2% in 2004-05 before
Table 6: Trends in Revenues in Bhutan (1995-2007)_ Years % of Tax Revenue to GDP %of %of %of Total %of
Direct Indirect Total Non-Tax Domestic Foreign Revenue Domestic Tax Tax Tax Revto Revto Revto Revenue
_GDP GDP_ GDP_in Total
1995- 96_4.3 4.3 8.6 11.6 20.2 23.7 43.9 46.0
1996- 97_44_3.1 7.5 12.6 20.1 19.6 39.8 50.6 _ 1997- 98_ 5.2 4.0 9.2 13.2 22.4 13.4 35.9 62.6_ 1998- 99 4.8 3.2 8.0 14.4 22.4 20.6 43.0 52.1
1999- 00 6.1 4.7 10.8 13.1 23.9 17.9 41.7 57.2
2000- 01 6.5 3.0 9.5 137_23.2 18.5 41.7 557_ 2001- 02 6.5 4.0 10.5 11.7 22.3 16.4 38.6 57.6
2002- 03 5.7 4.6 10.3 7.8 18.1 8.6 26.7 67.8
2003- 04 5.7 27 8.3 8.9 17.2 18.3 35.5 48.5
2004- 0^ _5.2 4.2 9.4 9.3 18.8 _13.5 32.3 58.1
2005- 06 5.5 4.7 10.2 8.7 18.9 _17^6_36.4_51.8 _ 2006- 07 56 3.5 9.1 15.2 24.3 14.5 38.8 62.7 Source: National Revenue Report, RGoB (various years).
marginally recovering to 3.8% in
2006-07. Similarly, revenue from
business tax declined from 1.4% in
2003-04 to 0.9% in 2006-07. In the
case of personal income tax, wide
year-to-year fluctuations are mainly
due to administrative efficiency. In the case of corporation tax itself, even
in 2000-01, almost 4.57% of the gdp
was mobilised and reaching that level itself will enhance the revenue by 0.7
percentage points. Similarly, there is considerable untapped potential in business tax as the prevailing 0.9% of gdp is well below the level reached in 2001-02 (1.4%). This shows that there
is considerable potential to increase
revenues if a proper structure, admin
istrative and information systems are
put in place.
It is not just the non-tax revenues
that show a high degree of variation from one year to another. Among the
taxes, the fluctuations in indirect taxes, particularly from excise
duty has been very high. While in 2005-06, this source contrib uted 2.4% of gdp, in the next year, the contribution was just
Figure 1: Trends in Domestic and Foreign Revenue in Bhutan (% to GDP)
35,0 "Domestic Revenue \
25.0 .^ ?1-??-^
15.0-\- *U-^^W'^"" Foreign Revenue
* * 5.0 .-;-,-;-r-r-r-1-i-;
1995-96 1997-98 1999-2000 2001-02 2003-04 2005-06 7006-07
Figure 2: Trends in Domestic Revenue in Bhutan (% to GDP)
25.0-? _Domestic Revenue
20.0 .?' " l. . *mwi. Non-Tax Revenue
10.0LL"^-l' '""^mm^ L'''a,?..'l?Ai ^Tax Revenue _
50 1995-96 1997-98 1999-2000 2001-02 2003-04 2005-06 2006-07
1.25% (Table 7, p 56). The reason for wide variation from year to
year has to be found in the fact that a substantial portion of ex
cise duty is from refunds from India and these are very irregular. In 2006, for example, these contributed to 38% of excise duty collections and this is because, the refunds for 2002 and 2003 were paid in 2005 and 2006.
One possible source of additional revenue is to broad-base the sales tax. At present, the sales tax is levied mainly on imports and
very few domestically produced goods and services. The levy of
goods and services tax on both domestic production and imports at a flat rate of 5% could enhance the revenue substantially. When
supported by a good information system, this could help in the better compliance of pit, bit as well as excise duty. However, the
levy of a comprehensive goods and services tax should be well
planned before it is implemented.
Economic & Political weekly EXES august 29, 2009 vol xliv no 35 55
This content downloaded from 165.65.120.145 on Thu, 18 Sep 2014 12:40:55 PMAll use subject to JSTOR Terms and Conditions
SPECIAL ARTICLE =.~ - - ^ _?- j^ff^^-^
Thus, suggested reforms in the tax system - both in direct and
indirect taxes - can create an additional fiscal space by about
4%-5% of gdp. Indeed, these cannot be achieved overnight and, to be successful, they have to be well planned and implemented. Yet, expanding the base of sales taxes through the gst and
strengthening the administration and information system and
Table 7: Trends in Indirect Tax Revenue (% of GDP) _ Sales tax Import/Export Tax Excise Duty Other Indirect Taxes Indirect Tax
1995-96_JL42_0.41_2/12 _ 036 4.31
2000- 01_ 1.70 0.45 _0.65 __ 0.21_ 3.02
2001- 02 1.57 _0.47_1.94_ 0.02 4.00
2002- 03__1.65 _ 0.44 2.49 0.01 4.59
2003- 04_1^69_0.52 _0.44_0.01_2.66 2004-
05_176_0.72_175__0.01 _ 4.23
2005- 06_1.81_0.43 2.40 0.01 4.66
2006- 07_1_85_ 0.35 1.25 0.02 3.47 Source: Budget Documents, RGoB, various years.
effective exchange of information between the various tax depart ments can be a highly successful revenue mobilisation strategy.
Non-tax revenues in Bhutan comprise mainly of dividends
from state-owned enterprises and transfer of profits. A bulk of
the dividend accrues from hydro power corporations. The trans
fer of profits is mainly from the Royal Monetary Authority (rma) and profits from lotteries. Sometimes, the profits from newly commissioned enterprises which are yet to be segregated into
corporate income tax and dividends are included under this. In
2006-07, for example, profits of the newly commissioned Tala
Hydro Power Authority (thpa) amounting to Nu 737 million or about 1.8% of gdp was included under this head.
5 Efficiency and Pro-Poor Expenditure Switching The scope for enhancing fiscal space through pro-poor expendi ture switching generally appears to be considerable. However, it is difficult to specify ex ante the size of the potential gains from
expenditure reallocation and the sectors where efficiency can be
improved. Gupta et al (1997) demonstrate that the marginal ben
efits of education and health spending decrease rapidly in situa
tions where the initial level of spending is high. This implies that
governments should exercise caution before expanding govern
ment expenditure on education and health when the initial level
of spending is already high. Expenditure switching and efficiency-enhancing reforms can
create fiscal space through a reallocation of resources from lower
priority to higher priority (sub) sectors or through productive ef
ficiency gains. The potential for additional fiscal space varies with development for three related reasons: (i) the scope for ex
penditure switching is determined by the size of the public sec
tor; (ii) production inefficiency can be addressed through long term capacity development programmes that limit low income countries' ability to secure fiscal space through active expendi ture switching policy over the short run; and (iii) addressing political economy constraints to reforms is critical to improve distributive inefficiency (undp 2007).
Improvement in the effectiveness of public expenditure calls for reforms in both policies and institutions. Policy reforms help to direct expenditures according to the envisaged priorities.
Reforms in institutions help to smoothen the processes and help in the implementation and monitoring of expenditure program
mes. They are also necessary to ensure greater accountability.
5.1 Trends in Public Expenditures In keeping with the trends in revenues, there has been a sharp deceleration in the annual growth rate of expenditures from 20%
during 1995-2000 to 10% during 2001-06 (Table 8). Although the
growth of both current and capital expenditures decelerated, the decline was much sharper in the case of the latter, from almost
23% during the first sub-period to 8.3% in the second. The sharp decline in capital expenditures is a matter of concern though in
part, this is due to the corporatisation of hydroelectric projects which are financed outside the budget.
The Public Finance Act (pfa) approved by the National Assem
bly in June 2007 attempts to improve the public finance manage ment system in the country. The Act demonstrates the commit
ment of the government to sustainable and transparent fiscal
management. This commitment is further enunciated in the draft
constitution (to be adopted in 2008), which seeks to provide additional improvement in public finance management by furthering the fiscal decentralisation process by devolving fiscal
powers from the central to district level administration.
6 Official Development Assistance
Generally, financing needs for the mdgs call for a significant increase in oda. Equally important is the need to address issues
of aid predictability and earmarking of resources by donors.
Indeed, effective implementation of the Tenth Plan will require aid flows to be stable and predictable and development partners can assist with this by making multi-year aid commitments. This is important because large and unexpected shifts in the volume of aid can disrupt the planning process and macroeconomic
management of the economy and erode the effectiveness of aid
financed expenditures.
Traditionally, India has been Bhutan's principal donor for the de
velopment programme. The first two five-year plans (since 1961) were wholly implemented with financial and technical assistance
from the government of India. From the Third Plan onwards,
development assistance from other bilateral and multilateral
agencies augmented the support from India. Currently, Bhutan
receives external assistance from as many as 15 multilateral
organisations, 19 individual donor countries (bilateral assistance),
Table 8: Actual Expenditure Compared to Medium-term Expenditure Framework (MTEF) (2002-03 to 2006-07)_
Sectors Actual Expenditures Per Cent of MTEF Per Cent of Per Cent of Mn Nu Total Mn Nu Total Actual to MTEF
Health and education^_ 14,54470 23.84 16,627 2375 87.48
Agriculture_5,691.42 9.33 7,154^^10.22_7_9_.5_6_ Human settlement_3,679.50 6.03 4,079 5.83 90.21
Commu^cations^ndjroads_ 8,032.11 13.17 8,135.5_11.62 98.73
Energy j?'927-90___ _6'360_^9_46.04_ General services_ 22,844.02_37.45_ 19,036_27.19_J_20.00_ Debt services_ _ 1,849.01 _3.03 3,842.29_5.49 _ 48.12
Others 1,432.88 _2.35_4,764 _ 6.81 J0.08_
Total_6L001_.54 100.00 7_0,000_ 100.00 87.15 Sources: (DRGoB, 2004. (2) Budget Documents of RGoB, various years.
56 august 29, 2009 vol xliv no 35 HSB3 Economic & Political weekly
This content downloaded from 165.65.120.145 on Thu, 18 Sep 2014 12:40:55 PMAll use subject to JSTOR Terms and Conditions
^_ ^ _ ^ SPECIAL ARTICLE
four financial institutions (Asian Development Bank, World
Bank, International Fund for Agricultural Development and The
Kuwait Fund for Arab and Economic Development) and some
non-governmental organisations (rgob 1996,1: 211).
Types of assistance received by Bhutan are: technical assist
ance, budgetary support, investment in projects, food aid and
loans. Most of the aid that Bhutan receives (almost 80%) is on
grant terms, with the balance in soft loans that have a high
grant element.
The Department of Aid and Debt Management (dadm) under the Gross National Happiness Commission (gnhc) is responsible
for managing external borrowings, the Debt Management Divi
sion under the Department of Public Accounts (dpa) within the
ministry of finance, dpa is responsible for managing external
debts. According to the Debt Portfolio Review and Debt Sustain
ability Analysis Report 2007 issued by the dpa, the government
of India is by far the largest donor holding a major chunk of debt stock at 61%, while multilateral agencies hold 28% and other
bilateral donors hold n% (rgob 2007d: 29).
Generally, Bhutan receives loans for capital investment. Table 9
shows the kinds of projects funded by development partners. Table 9: Sector-wise External Assistance (Loan) Received during the FY 2006-071 (Nu in million)
Lender^_ Project_ _Cash_Kind_ Tota[ _%
ADB Rural electrification 93-27Z__ 93i277 91
Basic skill development 65.504 65.504 6.4
Road and urban development 13.077 13.077 1.3
ADB total _ 78.581 93.277_ 171.858 16.8
Austrian Basochu hydro power project 26.974 26.974 2.6
Danida Rural telecom network 3_?^273_ 303.273 29.6
I FAD Agriculture marketing development 124.225 124.225 12.1
World Decentralised rural development 53.76 53.76 5.3 Bank Education 312A75_312.475 30.5
Rural access and urban development 30.895 30.895 3.0
World Bank total 397.13 - 397/13 38^8 _ Grand total __ 599.936 423.524 1023.46 100.0
Source: (RGoB 2008a).
Over the years, there has been an increasing tendency to substi
tute concessional loans for grants (Osmani et al 2007).
The rgob receives international assistance (grants) (a) in cash
including programme and project tied grants, and (b) in kind.
During the financial year 2006-07, the rgob received a total
grant amounting to Nu 6,000 million and this constituted 33% to
the total revenues or 14.5% of gdp. The grant in cash amounted to
84% and in kind 16% of the total receipts, respectively. It is also seen that the levels of foreign grants to Bhutan are much lower
during the period from 2001-02 to 2006-07 than during 1995-96
to 2000-01.
From the viewpoint of financing mdgs, it is important that at
least the present level of foreign grants will have to continue to
keep the borrowing at a sustainable level. During the last five
years, on average, foreign grants were less than 16% of gdp
whereas, the pattern of plan financing envisaged for the Tenth
Plan assumes 19.1%. The plan financing table assumes a financ
ing gap of 4.5% of gdp on an average which has to be covered
through borrowing from domestic and foreign sources. Thus, either the prevailing level of foreign grants will have to continue
or an additional 4% to 5% revenue will have to be generated from
domestic sources - tax and non-tax, in order to finance the plans in a sustainable manner (Figure 3).
Figure 3: Budgetary Balance as of GDP (%)
Budget balance inc grants
1968 199^N^?
1994 1996 S///|998ns>s?X)0 2QD7 /ooV
.* *. -20 - v -.-v^-.-v-._.v. m 1
Budget balanceexc grants
7 External and Domestic Borrowings
The outstanding debt of Bhutan at the end of June 2007 is esti mated at $820.85 million in nominal terms which is more than
100% of gdp. The present market value of outstanding debt is
estimated at $993 million. The domestic component of this is
just 7.4% and the remaining 92.6% is external. Of the total
loans, 66% is from India, other bilateral loans constitute 7% and the remaining 20% is multilateral loans. In other words, almost
61% of debt is rupee denominated, special drawing right (sdr) loans constitute 28% and euro loans account for 11% of out
standing loans.
Detailed analysis of debt in Bhutan shows that an overwhelm
ing proportion of the loans - 66% of the present value of debt -
has been contracted for the energy sector borrowed from India.
The servicing of these loans is matched by revenues generated
from the export of electricity to India and this does not contri bute to debt distress. The debt sustainability analysis of the min
istry of finance shows that after excluding the "enclave projects,"2
Bhutan passes the sustainability test comfortably and public debt remains within the sustainable threshold over the next decade.
The rgob has adopted a conservative fiscal policy and has
consistently restricted the fiscal deficit at lower than 5% of gdp.
The pattern of plan financing for the Tenth Plan shows that the
average financing gap is estimated at 4.5% and fiscal deficit at
just about 3%. According to the National Budget Report (2007), the government's policy emphasises the maintenance of sound
public finance by adopting a budget that attempts to: (i) avoid at least operating deficits; (ii) maintain the overall budget deficit to a maximum of 5% of gdp; (iii) cap the pay budget at sustain able ratios of current expenditures; (iv) keep outstanding debt at sustainable levels; (v) keep external debt service to exports ra
tios at low levels; (vi) maintain the momentum of investment in the socio-economic sectors; and (vii) invest in industries with
potential for significant revenue and employment generation.
Given the nascent state of financial markets in Bhutan, the scope
for domestic borrowing is fairly limited. Currently, domestic
debt is relatively small as compared to external debt. During the
financial year ending June 2007, domestic borrowing was
Nu 1,856.28 million. Of this Nu 1,753 million was borrowed for
paying the cost of one aircraft for Drukair. Domestic lenders are
the National Pension and Provident Fund and the Bhutan Health Trust Fund.
Kconomic & Political wkkkly EQ33 august 29, 2009 vol xliv no 35 57
This content downloaded from 165.65.120.145 on Thu, 18 Sep 2014 12:40:55 PMAll use subject to JSTOR Terms and Conditions
SPECIAL ARTICLE-== -?^eeeeeee^^
8 Mobilising Finance from Non-Public Sources
So far, the discussion on enhancing fiscal space has focused on
identifying sources of public finance. However, the role of the pri vate sector can be important in financing development and
should be leveraged since contributions from the private sector can lower the investment burden of the public sector.
8.1 Foreign Direct Investment and Other Private Flows
Private capital flows include commercial flows (portfolio invest
ment, bank lending and fdi) and non-commercial flows like
migrant workers' remittances. The foreign investment is looked
upon as providing a beneficial boost to private sector develop ment and* industrialisation, through easier access to capital, tech
nology and markets. It is also expected to contribute to the Gross National Happiness, through creation of additional economic
benefits, in ways, which are consistent with the kingdom's goal of
preserving its environmental and cultural ethos. The broad
objectives of encouraging foreign direct investment in the coun
try are to: (i) support private sector development; (ii) generate employment; (iii) facilitate skill development; (iv) promote capi tal inflow; (v) foster transfer of technology; (vi) expand market access and international trade; (vii) enhance convertible foreign exchange earnings; and (viii) broaden potential comparative advantages. These will be administered by imposing on foreign investors a minimum investment size, so that there is no
foreign competition for cottage and small enterprises; integrat
ing sector policies and priorities and adopting comprehensive fdi rules and regulations. These rules and regulations are appli
cable in the manufacturing and service sectors including financial sectors.
In the manufacturing sector, the minimum size of investment
(total project cost) is $1 million, ofwhich the foreign investor can hold up to 70% of the equity. The minimum size of investment
(total project cost) for activities in the services sector is $500,000,
ofwhich foreign investor can hold up to 70% of the equity. All foreign exchange transactions must be routed through the
normal banking channels. There will be no restrictions on local
borrowing by foreign investors in Bhutan. The legislations such as the Sales Tax, Customs and Excise Act of the Kingdom of
Bhutan, 2000 and Income Tax Act of the Kingdom of Bhutan,
2001 and amendments thereto shall apply to fdi.
At present, the government is revising its policy on fdi and
private capital flows. This is being done in the context of formu
lating a revised trade and industry policy. According to the gov ernment, financing for the Tenth Plan will not be affected in any
meaningful way on account of private capital inflows or signifi cant increases in fdi in the medium term.
8.2 Household Financing It was noted earlier that some types of user fees paid by house
holds go directly to the government budget. However, there are some categories of user fees (water charges, electricity charges)
that are not routed through the government budget -
yet, these
charges serve to finance some of the mdgs. It is these latter
charges that are to be considered in the discussion on household
financing for the mdgs.
- Estimating the contribution of households for financing the
mdgs requires that cost-recovery programmes be designed in
ways that do not impose user fees for poor households. In other
words, the design of cost-recovery programmes should be based
on the following two principles: (i) User fees do not contribute to the cost of primary school
education, adult literacy programmes, improving gender equal
ity, basic healthcare, nutritional interventions, and transport
infrastructure.
(ii) Richer households bear some of the cost for agricultural interventions (especially in food security, agro-processing and
live-stock), secondary school education, energy provision, and
water supply and sanitation.
In Bhutan, health and education services are publicly financed and free for most households. No policy changes are envisaged that will alter this in the medium term.
9 Policy Recommendations and Conclusion
The rgob has adopted the mdgs as a development strategy and has attempted to align the five-year plans to this effect. It has made considerable progress in economic conditions and in empowering
people through human development and is well on track to achiev
ing most of the mdgs. The outlay for the Tenth Plan is significantly higher than the required expenditures for mdg as assessed in the
costing estimates. Thus, financing needs of mdgs are nested in the
Tenth Plan outlay and therefore, finding the fiscal space for mdgs is essentially an exercise in plan financing.
The pattern of financing the Tenth Plan shows that there is a resource gap of about 4.5% of gdp. Realising the revenue targets
indicated in the Plan financing table and keeping the uncovered resource gap at a sustainable level are important challenges faced
in mdg financing in the medium term.
It must, however, be noted that the Plan outlay is not merely concerned with mdg financing and includes several additional
sectors. However, the fact that the outlay exceeds the mdg costing
by over 160% essentially implies considerable reprioritisation.
Reprioritisation is necessary also because the plan outlay on edu
cation and health sectors fall considerably short of mdg costing
estimates. The shortfall is over 26% in the case of education and about 35% in the case of health. Furthermore, the shortfall is par
ticularly marked in the case of recurrent expenditures under both education and health sectors. Therefore, achievement of mdgs
would call for reprioritisation in plan priorities towards educa tion and health sectors by compressing outlay on general admin istration and to some extent transport.
One of the major shortcomings of the financing system in Bhutan is the high degree of volatility in the revenues. High de
pendence on external revenues and irregular excise refunds from
government of India are the major reasons for large year to year
variations. However, in the medium term, continued sourcing of
external revenue will be necessary to finance the mdg needs.
External donors will have to continue to support the Royal
Government of Bhutan through grants and concessional assist
ance at the prevailing level.
Additional resource mobilisation from the tax revenues will
require significant reforms on both the structure and administration
58 august 29, 2009 vol xliv no 35 13359 Economic & Political weekly
This content downloaded from 165.65.120.145 on Thu, 18 Sep 2014 12:40:55 PMAll use subject to JSTOR Terms and Conditions
- - ^ r _ I - ~ SPECIAL ARTICLE
of the tax system. In the case of pit, improvement in revenue col
lection will have to be achieved both by reforming the structure and by streamlining administration. Indeed the prevailing exemp
tion limit for the tax is extremely low (Nu 10,000). There is a case
for increasing that limit to Nu 100,000. This, while leaving out a
large number of assessees, will not reduce tax collection much and
reduce administrative burden. The way to enhance revenue pro
ductivity is by streamlining administration including instituting the information system.
The base of the sales tax is narrow and broadening it could
enhance revenue productivity and ring in greater stability to rev
enues. At present, the tax is levied on imports and a few domestic
goods and services. The coverage of commodities on domestic
production is extremely narrow and value added at subsequent
stages is not included in the tax base. Reform of sales tax system
should proceed by levying a general goods and services tax at a
uniform rate of 5% on all goods and services, domestically
produced as well as imported, with exemptions on unprocessed
food articles. In addition, sumptuary/carbon items can be
subjected to a separate extra tax.
The exemption limit for the payment of goods and services tax can be kept at turnover level of Nu 500,000 and dealers up to a
turnover Nu 2.5 million could pay a simplified tax at 1% of their turnovers and can be asked to keep simplified accounts without tax credit and with provision to voluntarily opt for regular value
added tax (vat) dealership. It is also important to institute com
puterised information system and exchanging the information
system with other tax departments could significantly increase
revenues by improving tax compliance. The information col
lected from goods and services tax (gst) should also be usefully employed to administer the bit.
The attempts by the rgob to introduce two-year rolling budget and Medium Term Expenditure Framework (mtef) have helped to enhance efficiency, but much remains to be done to operation
alise the mtef in different sectors. A comparison of the mtef
expenditures with actual expenditures for the period from
2002-03 to 2006-07 shows that there was a significant shortfall
in actual expenditures from mtef in respect of both aggregate
expenditures as well as in some important social and economic
sectors. Nevertheless, the attempt has helped to plan and imple
ment expenditure programmes in different sectors, avoid season
ality and make the spending pattern smoother.
Although on the basis of aggregate volume of debt, Bhutan may be considered to be a debt stressed country, a detailed debt sus
tainability analysis shows that after excluding the enclave
projects, Bhutan passes the sustainability test comfortably and
public debt ratios remain within the threshold throughout the next decade. The rgob has been careful in adopting a conserva
tive fiscal policy and has consistently restricted the fiscal deficit at lower than 5% of gdp. The pattern of plan financing for the Tenth Plan also shows that the average financing gap is 4.5%.
There is considerable scope for augmenting resources for
financing mdg related expenditures by creating an enabling environment for private investments -
particularly foreign
investment in a strategic manner. It may also be necessary to aug
ment resources by charging fees on the households for consum
ing some of the public services -- particularly those that benefit
relatively better off sections of society and those which are of non-merit good nature.
Although the mdg financing needs are covered within the Tenth Plan outlay, and mdg financing pattern is well within the realm of feasibility, reforms are necessary in policies and institu
tions both to mobilise larger volume of resources and to improve
efficiency in public service delivery. Reforms in the tax system as indicated in this report could help to enhance domestic revenues
significantly. Much remains to be done to improve expenditure
management and control systems. Further, there is considerable
scope for the participation of private sector in supplementing the
government efforts to provide public service with significant impact on mdgs.
NOTES _ 1 The direct disbursement from Goi for the Tala
hydropower project (THPP), which is a turnkey project, is excluded from this statement. How ever, it is included in the statement of outstanding loans where actual outstanding debt of the government is ascertained.
2 Enclave projects arc those projects that are expected to become self-financing once brought on-stream such as the energy sector loans financed by government of India.
REFERENCES
ADB (2007): "Kingdom of Bhutan: Strengthening Public Financial Management", Asian Development Bank: 20.
Chambas, Gerared et al (2006): "Assessing Fiscal Space in Developing Countries", Concept paper commissioned by UNDP, CERDI.
Gupta, Sanjeev, K Honjo and M Verhoeven (1997): "The Efficiency of Government Expenditure: Ex periences from Africa", IMF Working Paper 153.
Osmani, S R, B B Bajracharya et al (2.007): The Macro economics of Poverty Reduction: Case Study for Bhutan, UNDP, Thimpu.
RGoB (1996): Eighth Five-Year Plan (1997-2002), Plan ning Commission, Thimphu (Thailand: Keen Pub lishing Co), I: 211.
- (2004): "Poverty Reduction Strategy Paper: A
Cover Note to the Ninth Plan Main Document", D o Planning, MoF: 57.
RGoB (2006): Annual Audit Report 2006, R A Author ity, RAA.
- (2007a): Bhutan Millennium Development Goals:
Needs Assessment and Cost ing Report (2006 -2015) : GNH Commission, GNHC.
- (2007b): National Budget: Financial Year 2007-08, MoF, Thimpu.
- (2007c): Public Finance Act of Bhutan, Dept of Public Accounts, MoF, Thimpu.
- (2007d): Public Debt of Bhutan for the Year Ended June 200/: Debt Portfolio Review and Debt Sus tainability Analysis, Debt Management Division, Department of Public Accounts, MOF.
- (2008a): Annual Financial Statements of the Royal
Government of Bhutan for the Financial Year ended 30 June 2007, D 0 B a Accounts, MOF.
- (2008b): Tenth Five-Year Plan (2008-2013), Draft,
Vol 1, Main Document, GNH Commssion, Bhutan. RGoB and UNDP (2005): MDG Progress Report for
Bhutan (Thimpu: Ministry of Planning). Sen, Amartya (1999): Development as Freedom (New
York: Alfred A Knopf). Seth, Anuradha (2007): "National Financing Strate
gies for Achieving the Millennium Development Goals", Discussion Paper, Regional Centre for Asia & Pacific (Colombo: UNDP).
World Bank (2007): Fiscal Policy for Growth and Devel opment: Further Analysis and Lessons from Coun try Case Studies, Report of the Development Com
mittee (Washington DC: World Bank).
For the Attention of Subscribers and Subscription Agencies Outside India
It has come to our notice that a large number of subscriptions to the /W from outside the country together with the subscription payments sent to supposed subscription agents in India have not been forwarded to us. We wish to point out to subscribers and subscription agencies outside India that all foreign subscriptions, together
with the appropriate remittances, must be forwarded to us and not to unauthorised third parties in India. We take no responsibility whatsoever in respect of subscriptions not registered with us.
Manager
Economic & Political weekly BSCS august 29, 2009 vol xliv no 35 59
This content downloaded from 165.65.120.145 on Thu, 18 Sep 2014 12:40:55 PMAll use subject to JSTOR Terms and Conditions