Embed Size (px)
Citation preview

364
Wilson Bulletin 117(4):364–374, 2005
FLIGHT SPEEDS OF NORTHERN PINTAILS DURING MIGRATIONDETERMINED USING SATELLITE TELEMETRY
MICHAEL R. MILLER,1,5 JOHN Y. TAKEKAWA,2 JOSEPH P. FLESKES,1
DENNIS L. ORTHMEYER,1,4 MICHAEL L. CASAZZA,1 DAVID A. HAUKOS,3
AND WILLIAM M. PERRY1
ABSTRACT.—Speed (km/hr) during flight is one of several factors determining the rate of migration (km/day) and flight range of birds. We attached 26-g, back-mounted satellite-received radio tags (platform transmittingterminals; PTTs) to adult female Northern Pintails (Anas acuta) during (1) midwinter 2000–2003 in the northernCentral Valley of California, (2) fall and winter 2002–2003 in the Playa Lakes Region and Gulf Coast of Texas,and (3) early fall 2002–2003 in south-central New Mexico. We tracked tagged birds after release and, in severalinstances, obtained multiple locations during single migratory flights (flight paths). We used data from 17 PTT-tagged hens along 21 migratory flight paths to estimate groundspeeds during spring (n 5 19 flights) and fall (n5 2 flights). Pintails migrated at an average groundspeed of 77 6 4 (SE) km/hr (range for individual flight paths5 40–122 km/hr), which was within the range of estimates reported in the literature for migratory and localflights of waterfowl (42–116 km/hr); further, groundspeed averaged 53 6 6 km/hr in headwinds and 82 6 4km/hr in tailwinds. At a typical, but hypothetical, flight altitude of 1,460 m (850 millibars standard pressure),17 of the 21 flight paths occurred in tailwinds with an average airspeed of 55 6 4 km/hr, and 4 occurred inheadwinds with an average airspeed of 71 6 4 km/hr. These adjustments in airspeed and groundspeed in responseto wind suggest that pintails migrated at airspeeds that on average maximized range and conserved energy, andfell within the range of expectations based on aerodynamic and energetic theory. Received 19 November 2004,accepted 6 September 2005.
The overall rate at which birds travel duringmigration, often referred to as migration speed(measured in km/day), includes the time re-quired to accumulate fat reserves and rest pri-or to migration and at stopovers, and the ac-tual time spent in flight during which fat iscatabolized (Alerstam and Lindstrom 1990).Flight speed (km/hr) is expressed as ground-speed (velocity with respect to ground) or air-speed (velocity with respect to air); the ratioof groundspeed to airspeed directly measuresthe effects of wind on the energetic costs ofmigration (Alerstam 1978, Richardson 1990).This ratio is proportional to migration speed(Alerstam 2003), and can predict the strength
1 U.S. Geological Survey, Western Ecological Re-search Center, Dixon Field Station, 6924 Tremont Rd.,Dixon, CA 95620, USA.
2 U.S. Geological Survey, Western Ecological Re-search Center, San Francisco Bay Estuary Field Sta-tion, 505 Azuar Dr., Vallejo, CA 94592, USA.
3 U.S. Fish and Wildlife Service, Dept. of Range,Wildlife, and Fisheries Management, Texas TechUniv., Lubbock, TX 79409, USA.
4 Current address: California Waterfowl Association,4630 Northgate Blvd., Ste. 150, Sacramento, CA95834, USA.
5 Corresponding author; e-mail:[email protected]
of migration (the number of birds aloft; Rich-ardson 1990). For many birds, migrationspeed may be controlled largely by the timerequired to acquire fat reserves at stopovers(Alerstam 2003). However, Liechti and Bru-derer (1998) concluded that for birds makinglong nonstop flights, selection of favorabletailwinds to boost groundspeed and save en-ergy (fat) is more important than timing de-parture based on the rate of fat accumulation.Birds in headwinds, for example, may lowerflight altitude until wind velocity declines,thereby increasing groundspeed and conserv-ing energy (Kerlinger and Moore 1989).
Birds migrate at groundspeeds that reflect,among other things, airspeed in the presenceor absence of tailwinds or headwinds (Rich-ardson 1990, Alerstam 2003) and aerodynam-ic characteristics of the species (Pennycuick1975, Rayner 1990). Aeronautical flight me-chanics and bioenergetics theory suggest thatbirds should fly at one of two characteristicairspeeds during migration. The first minimiz-es energy cost per unit of time to remain air-borne as long as possible (minimum powerspeed; Vmp), and the second minimizes the en-ergy cost per unit of distance flown to maxi-mize distance over the ground with a certainfuel load (maximum range speed; Vmr) (Tucker

365Miller et al. • PINTAIL FLIGHT SPEED
and Schmidt-Koenig 1971, Alerstam and Hed-enstrom 1998). A third conceptual speed,which is not as well defined (Bruderer andBoldt 2001), minimizes total duration of themigration by maximizing overall speed (min-imum time speed; Vmt); however, in practice itis rarely separable from Vmr (Alerstam andHedenstrom 1998, Hedenstrom and Alerstam1998). In general, waterfowl are well designedfor relatively rapid long-distance migration(Rayner 1988), and the moderately sizedNorthern Pintail (Anas acuta), in particular,features an aerodynamic design (streamlinedshape, long narrow wings) that supports effi-cient long-distance flight (Pennycuick 1975,Bellrose 1980, Bruderer and Boldt 2001).However, it is not known whether pintails mi-grate with flight speeds that adhere to theo-retical models.
Investigators have used satellite telemetryto estimate the groundspeeds of migratingswans (Cygnus spp.; Pennycuick et al.1996a, Ely et al. 1997) and Brant (Brantabernicla; Green et al. 2002), but we foundno such information for ducks. A recent pro-ject to track migration of adult female pin-tails outfitted with satellite-receiving radiotags (platform transmitting terminals; PTTs)in California, Texas, and New Mexico win-tering regions (Miller et al. 2001, 2005) pro-vided an opportunity to directly estimategroundspeed. By using archived speeds anddirections of winds at a typical waterfowlmigration altitude, we then determined theirpotential airspeed and compared it with the-oretical values of Vmp and Vmr (Bruderer andBoldt 2001).
METHODS
We captured pintails at the following timesand locations: (1) December–January 2000–2003 in California at Sacramento Valley na-tional wildlife refuges (NWR) and state wild-life areas (central location: 398 249 N, 1218589 W); (2) November–January 2001–2002 inthe Playa Lakes Region of Texas at BuffaloLake NWR (348 549 N, 1028 79 W) and on pri-vate lands (338 469 N, 1018 519 W), and alongthe Texas Gulf Coast on a unit of AransasNWR (288 339 N, 968 339 W) and on privatelands (278 209 N, 978 489 W); and (3) Octo-ber–November 2001–2002 in New Mexico atBosque del Apache NWR (338 489 N, 1068
519 W). These areas are located in importantpintail wintering or fall staging regions (Bell-rose 1980).
We tagged only adult female pintails be-cause of their critical role in population dy-namics (Flint et al. 1998). We sorted all hensby sex and age (Carney 1992), attached fed-eral leg bands, and obtained body mass (65g). We used Model 100 PTTs from MicrowaveTelemetry, Inc. (Columbia, Maryland), andannually attached 25–55 on females in Cali-fornia, 20 in Texas, and 6–9 in New Mexico.The units, with harness and protective neo-prene pad, weighed about 26 g, which was2.7–3.2% of average body mass at capture inCalifornia (900–950 g), Texas (820–920 g),and New Mexico (935–975 g), well undercommonly used guidelines (Caccamise andHedin 1985). We attached each PTT dorsallybetween the wings by fashioning a harness of0.38-cm-wide (sold as 3/16 in) Teflon ribbon(Bally Ribbon, Bally, Pennsylvania). Thecompleted harness included fore and aft bodyloops connected with a 1-cm-length of ribbonover the keel, similar to designs used by Ma-lecki et al. (2001). Ours, however, consistedof a single length of ribbon without metalclips, buckles, shrink-tubing, or sewed areas,and we hardened knots with cyanoacrylateglue. We released tagged hens at trap sites 5–19 hr after capture—either during eveningpintail flights or at night.
To encompass spring migration, we pro-grammed PTTs to last 6–8 months by using arepeating duty cycle consisting of a 5- to 6-hrtransmission period followed by a 72-hr rest-ing period; some PTTs lasted long enough toprovide data during fall migration. We usedthe Argos location and data collection system(Argos, Inc. 1996), including multi-satelliteservice with standard and auxiliary locationprocessing, to monitor the locations of PTT-tagged pintails. Argos estimates PTT locationsfrom the Doppler shift in transmission fre-quency received by satellites as they approachand then move away from the PTT. Argoschecks the plausibility of locations via (1)minimum residual error, (2) transmission fre-quency continuity, (3) shortest distance cov-ered since previous location, and (4) plausi-bility of velocity between locations. The num-ber of positive checks (NOPC; 0–4) is includ-ed with each location received via daily

366 THE WILSON BULLETIN • Vol. 117, No. 4, December 2005
e-mails. The PTTs also provided sensor datato index the unit’s temperature, remainingvoltage, and motion. We used these, especiallythe latter, to determine whether birds werealive and to verify that they were flying.
Argos classifies each PTT location based onestimated accuracy and the number of trans-missions (messages) received from each PTTduring a satellite overpass. The classes of lo-cation quality (LC 3, LC 2, LC 1, LC 0) arebased on $4 messages received by the satel-lite via standard data processing; respectiveaccuracies are ,150, 150–350, 350–1,000,and .1,000 m. Accuracy is expressed as theprobability that 67% of the locations will fallwithin stated limits; therefore, high-quality lo-cations might be inaccurate, while lower-qual-ity locations might be very accurate (Hatch etal. 2000). Argos does not estimate accuracyof LC A (3 messages received), LC B (twomessages received), or LC Z (latitude/longi-tude often provided if $1 message received),which are received via auxiliary processing;however, field tests have shown that LC A canbe as accurate as LC 0 or LC 1 (Britten et al.1999, Hays et al. 2001), and LC B can be asaccurate or better than LC 0 (Hatch et al.2000, Hays et al. 2001). Therefore, the accu-racy of individual points along a flight pathlikely varies, even among those of the sameLC (Hatch et al. 2000). If a PTT-tagged birdis stationary (not flying), several criteria arenormally used to choose one best locationfrom among the many normally provided byArgos (Ely et al. 1997, Butler et al. 1998, Pe-tersen et al. 1999, Hatch et al. 2000). Becauseof continuous forward travel, however, Argoscannot provide alternate points at each loca-tion for pintails in migratory flight. Therefore,we initially plotted all locations of birds inflight and subsequently examined each ofthem in detail to determine flight paths.
We analyzed and displayed location datausing ArcInfo and ArcView Geographic In-formation System software (EnvironmentalSystems Research Institute, Redlands, Cali-fornia). For each female, we plotted individualflight paths using all PTT locations acquiredwhile the bird was flying. Each flight pathconsisted of segments formed by successivepairs of adjacent location points (e.g., a pathformed by five points would have four flight-path segments). We used only locations re-
corded during pintail migratory flights—iden-tified from multiple locations of birds headinggenerally northerly or southerly during a sin-gle transmission period—concurrently withPTT motion sensor data that suggested vig-orous activity. Additionally, we used only lo-cations .200 km from the location recordedon the previous or subsequent (or both) loca-tion-days; these criteria precluded inadver-tently including stationary pintails or thosemaking only local flights.
We selected only those points that best de-fined the flight path, and deleted those thatdeviated from the general line of flight, re-versed direction, occurred in clusters (indicat-ing a stationary bird), occurred too close to-gether in space and time, or representedmovement too fast or too slow betweenpoints—especially if LC was A or worse(Hatch et al. 2000 used LC 0). For example,we considered a given point to be an obviousoutlier from the general line of flight if theperpendicular distance from the flight line wasgreater than the average error distance fromtrue position as determined for the least ac-curate LCs in recent field tests of PTTs (i.e.,7.5 km for LC 0 and LC A, and 23–35 kmfor LC B [Blouin et al. 1999, Britten et al.1999]; 20 km for LC A and LC B [Hatch etal. 2000]; 1–10 km for LC 0 and LC A, and7 km for LC B [Hays et al. 2001]). We alsoconsidered points to be outliers if the time be-tween location points along the path was ,10min and the distances between them ,20 km,unless this was typical along the flight pathand produced similar intervening ground-speeds among segments. We rejected one oftwo points that created sharp-angled directionchanges (usually .458) and reversals. Addi-tionally, we questioned the accuracy of indi-vidual locations if the groundspeed along pathsegments seemed biologically impossible. Wedefined this as (1) .160 km/hr, the speed ofa Red-breasted Merganser (Mergus serrator)flying with a 32 km/hr tailwind, while beingchased by a small aircraft (Thompson 1961),or (2) ,20 km/hr when point separation was,20 km, unless intervening groundspeedsmatched those between other more widelyseparated points along the path. These criteriaare somewhat arbitrary, but provided a con-sistent method for selecting and rejecting lo-cations—similar to procedures used by Hatch
367Miller et al. • PINTAIL FLIGHT SPEED
et al. (2000), in which they discarded loca-tions ‘‘conspicuously outside’’ clusters ofpoints (stationary birds) because they violatedtheir redundancy rule.
We estimated apparent groundspeeds alongeach outlier-corrected flight path by summingthe total time (hr) and distance (km) of eachflight-path segment, and then dividing totaldistance over the flight path by total time fromthe first to the last accepted location point. Weused multiple flight paths from individualtagged hens, if available, and estimatedgroundspeed as mean 6 SE for all flights. Forcomparison, we also estimated groundspeedfor all flights using all recorded locations (out-liers retained) to recognize our uncertaintywith the deletions and determine how our cri-teria may have affected final groundspeed es-timates.
We wanted to determine reliable airspeedsfor PTT-tagged pintails, but wind speeds in-crease and their directions change markedlywith increasing altitude (Kerlinger and Moore1989, Ahrens 2000); in addition, we did notknow at what altitudes our tagged ducks mi-grated (our PTTs did not have altitude sen-sors). We had no means to predict when orwhere measurable flight paths would occur,and as a result, we could not a priori deployradar and weather balloons to obtain ground-speed, wind speed, wind direction, and flightaltitude simultaneously, as done when birdspass predictable locations (Bruderer and Boldt2001). Therefore, to assess the effect of head-winds or tailwinds along the 21 pintail flightpaths, we assumed migration altitudes of sealevel and 1,460 m above sea level (1,000 and850 millibars [mb] at standard pressure; Ah-rens 2000), which is within the typical rangeused by migrating waterfowl (Kerlinger andMoore 1989, Berthold 1996), and for whicharchived weather data were readily available.The higher altitude was used by Dau (1992),Shamoun-Baranes et al. (2003), and Gill et al.(2005) to examine migration of Brant, WhiteStorks (Ciconia ciconia), and Bar-tailed God-wits (Limosa lapponica), respectively. We ob-tained wind speed and direction on the datesof pintail flights using North American Con-stant Pressure weather charts (850 mb) for00:00 UTC and 12:00 UTC, published by theNational Center for Environmental Prediction(NCEP; National Climatic Data Center 2005).
We assumed that the weather charts repre-sented conditions at the location of flying pin-tails, and we used wind speeds and directionsnearest to each pintail flight path (Shamoun-Baranes et al. 2003). Because exact flight al-titudes remained unknown, we did not add un-justified precision to the generally imperfectdata to account for the angle at which tail-winds or headwinds may have intercepted pin-tail flight paths (Gill et al. 2005). Instead, weassumed that tailwinds and headwinds essen-tially paralleled flight paths, and ignored com-pensation and drift (Wege and Raveling 1984,Alerstam and Hedenstrom 1998). We calcu-lated airspeeds either as (1) groundspeed 2tailwind or (2) groundspeed 1 headwind. Tocharacterize migration conditions at the sur-face, we obtained archived sky conditions andsurface wind speed and direction at the timeof flights from weather stations nearest theflight paths (Weather Underground 2005).
RESULTS
During 2001, 2002, and 2003, we obtained21 flight paths of 17 PTT-tagged pintails forwhich we estimated groundspeeds (Fig. 1). Ofthis total, 19 flights from 16 pintails occurredduring spring, and 2 flights from 2 birds oc-curred during fall (1 hen provided 1 springand 1 fall flight; Table 1). These data included14 pintails tagged in California, 2 in Texas,and 1 in New Mexico. We used all originalArgos locations from 10 pintail flight paths(uncorrected), but deleted $1 location fromeach of 11 others (outlier-corrected), becausethey did not meet our established criteria. Out-lier correction resulted in increases in ground-speed of 4–21 km/hr for five flight paths, de-creases in speed of 1–69 km/hr for five flightpaths, and no change for one flight path. Out-lier correction reduced our total number of lo-cations from 108 to 77. Correction for outliersdid not markedly increase the proportion ofhigh-quality locations forming flight pathscompared with that in the uncorrected dataset. For example, the proportion of LC 1 andLC 2 locations increased to 17% from 12% ofall locations, and those of LC A, B, and Zdeclined to 25% from 32% (no change in pro-portion of LC 0).
When we used the 11 outlier-correctedflights and the 10 uncorrected flights, ground-speeds of pintails along all 21 flight paths

368 THE WILSON BULLETIN • Vol. 117, No. 4, December 2005
FIG. 1. Migration flight paths and path segments of adult female Northern Pintails PTT-tagged in California,Texas, and New Mexico, used to estimate groundspeed and airspeed (km/hr), 2001–2003. Circled uppercaseletters are bird identifiers from Tables 1, 2. Thick black lines show the measured flight paths divided intosegments by open circles representing pintail locations. Thin gray lines show migration routes prior and sub-sequent to the measured path.
ranged from 40 to 122 km/hr (Table 1) andaveraged 77 6 4 km/hr (CV 5 5.6, 90% CI5 69–84). Two-thirds of the speeds (14 of 21flight paths) occurred over a narrower rangeof 61–80 km/hr. Without omitting outliers,
groundspeeds ranged from 45 to 111 km/hrand averaged 78 6 4 km/hr (CV 5 4.9, CI 572–84), indistinguishable from the outlier-cor-rected value. Groundspeed averaged 75 6 4km/hr (CV 5 4.6, CI 5 70–81) for the 10

369Miller et al. • PINTAIL FLIGHT SPEED
TABLE 1. Outlier-corrected groundspeeds of adult female Northern Pintails, including start and end times,distance flown, and time in flight, along flight paths determined via satellite telemetry, 2001–2003. All timesare Pacific Standard Time, except as noted. Bird identifiers (uppercase letters) correspond to those in Figure 1.
YearStartdate Bird Location of flight (n1, n2)a
Start-endtimes
Distanceflown(km)
Time inflight(hr)
Groundspeed
(km/hr)
2001 21 Mar A West-central Idaho (4, 4) 04:15–08:42e 288.7 4.45 652001 25 Apr B West of Washington/British Columbia
(8, 6)03:55–09:23 393.3 5.45 72
2001 27 Apr C Northeastern Alberta (10, 5) 04:29–07:58e 267.4 3.49 772001 27 Apr D Western Alberta (4, 4) 19:31–00:38e 511.4 5.12 1002001 3 May E West of Washington/Oregon (4, 4) 02:30–06:23 309.2 3.90 792002 23 Feb F Northern California (8, 3) 17:05–20:06 212.6 3.13 682002 20 Mar G Southern Idaho (4, 3) 01:09–03:42e 294.4 2.55 1162002 21 Mar Hb Eastern Oregon to western Idaho
(3, 3)19:55–23:57e 257.8 4.03 64
2002 13 Apr I North Dakota (10, 5) 15:54–19:52f 180.1 2.28 792002 19 Apr J British Columbia coast (7, 4) 02:20–07:13 216.3 4.89 442002 21 Apr Kc West of Washington/British Columbia
(8, 5)11:51–15:46 157.6 3.91 40
2002 24 Apr Ld Western Oregon/ocean (3, 3) 23:17–01:25 292.7 3.79 772002 25 Apr M Eastern Texas (3, 3) 20:41–22:20f 218.3 3.06 712002 8 May Nb Central Alberta (3, 3) 21:08–22:49e 206.1 3.36 622002 9 May O Central Oregon (2, 2) 21:35–23:14 127.4 1.66 772002 14 May Pb Southeastern Yukon (9, 5) 09:08–10:48 366.4 3.01 1222002 26 May Qc West-central British Columbia (4, 3) 22:47–02:15 277.3 3.46 802002 10 Oct Rd Western Oregon/ocean (3, 2) 21:38–23:16 99.8 1.64 612002 12 Nov S Southern New Mexico to Mexico
(6, 5)18:49–22:17e 428.1 4.51 95
2003 19 Mar T Northeastern Oregon (2, 2) 01:07–02:46 135.3 1.66 822003 31 Mar U Eastern Oregon (3, 3) 19:28–22:39 243.1 3.19 76
a n1 5 total number of separate location points recorded during flight and used to estimate groundspeed without correcting for outliers; n2 5 numberof accepted location points used to estimate outlier-corrected groundspeed.
b,c,d Superscripts of the same letter indicate multiple flights for the same pintail.e Mountain Standard Time.f Central Standard Time.
uncorrected flights, 78 6 8 km/hr (CV 5 10.1,CI 5 65–90) for the 11 outlier-correctedflights, and 80 6 7 km/hr (CV 5 8.4, CI 569–91) for the 11 flights when not correctedfor outliers. Most (19 of 21) flights occurredpartially or entirely at night (Table 1), and twopaths transited land and sea (Fig. 1).
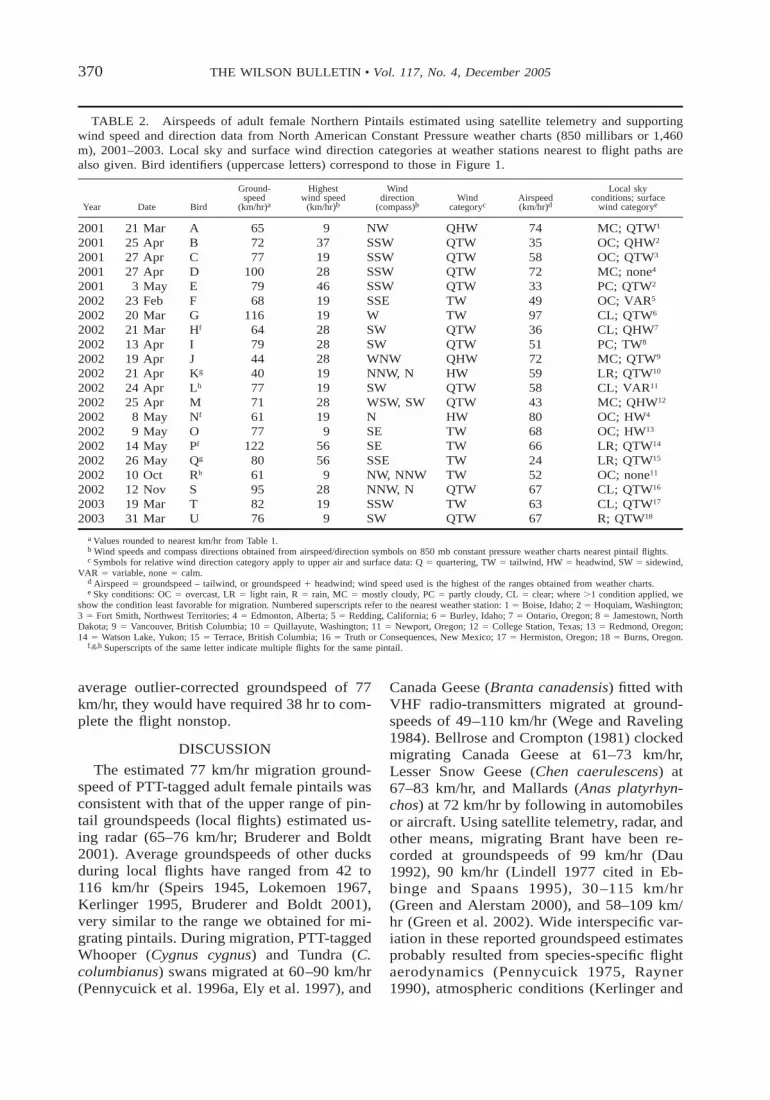
Based on wind speeds and directions at1,400 m (850 mb), 17 of the 21 flights (81%)occurred in tailwinds and four in headwinds(Table 2). Groundspeeds averaged 82 6 4km/hr (CV 5 8.2, CI 5 75–89) in tailwindsand 53 6 6 km/hr (CV 5 11.8, CI 5 43–63)in headwinds. Three of the four flights thatoccurred in headwinds at 850 mb (birds A, J,and K; Table 2) would have had tailwindsnear the ground surface of 6–13, 7–11, and13–15 km/hr, respectively (weather station
data), and the fourth flight (bird N) wouldhave had headwinds of 6–9 km/hr. Corre-sponding airspeeds of pintails at 850 mbranged from 24 to 97 km/hr in tailwinds andfrom 59 to 80 km/hr in headwinds (Table 2),with means of 55 6 4 km/hr (CV 5 7.9, CI5 48–62) in tailwinds and 71 6 4 km/hr (CV5 6.2, CI 5 64–78) in headwinds. The ratiosof groundspeed to airspeed averaged 0.73 60.6 in headwind (CV 5 8.2, CI 5 0.63–0.83)and 1.61 6 0.14 in tailwind (CV 5 8.5, CI5 1.39–1.83).
The longest distance flown by a pintail forwhich we estimated groundspeed (bird B),was 2,926 km—from Goose Lake in southernOregon (428 159 N, 1208 239 W) to the KenaiPeninsula in Alaska (598 129 N, 1518 469 W;Table 1). Assuming that pintails flew at the
370 THE WILSON BULLETIN • Vol. 117, No. 4, December 2005
TABLE 2. Airspeeds of adult female Northern Pintails estimated using satellite telemetry and supportingwind speed and direction data from North American Constant Pressure weather charts (850 millibars or 1,460m), 2001–2003. Local sky and surface wind direction categories at weather stations nearest to flight paths arealso given. Bird identifiers (uppercase letters) correspond to those in Figure 1.
Year Date Bird
Ground-speed
(km/hr)a
Highestwind speed
(km/hr)b
Winddirection
(compass)bWind
categorycAirspeed(km/hr)d
Local skyconditions; surface
wind categorye
2001 21 Mar A 65 9 NW QHW 74 MC; QTW1
2001 25 Apr B 72 37 SSW QTW 35 OC; QHW2
2001 27 Apr C 77 19 SSW QTW 58 OC; QTW3
2001 27 Apr D 100 28 SSW QTW 72 MC; none4
2001 3 May E 79 46 SSW QTW 33 PC; QTW2
2002 23 Feb F 68 19 SSE TW 49 OC; VAR5
2002 20 Mar G 116 19 W TW 97 CL; QTW6
2002 21 Mar Hf 64 28 SW QTW 36 CL; QHW7
2002 13 Apr I 79 28 SW QTW 51 PC; TW8
2002 19 Apr J 44 28 WNW QHW 72 MC; QTW9
2002 21 Apr Kg 40 19 NNW, N HW 59 LR; QTW10
2002 24 Apr Lh 77 19 SW QTW 58 CL; VAR11
2002 25 Apr M 71 28 WSW, SW QTW 43 MC; QHW12
2002 8 May Nf 61 19 N HW 80 OC; HW4
2002 9 May O 77 9 SE TW 68 OC; HW13
2002 14 May Pf 122 56 SE TW 66 LR; QTW14
2002 26 May Qg 80 56 SSE TW 24 LR; QTW15
2002 10 Oct Rh 61 9 NW, NNW TW 52 OC; none11
2002 12 Nov S 95 28 NNW, N QTW 67 CL; QTW16
2003 19 Mar T 82 19 SSW TW 63 CL; QTW17
2003 31 Mar U 76 9 SW QTW 67 R; QTW18
a Values rounded to nearest km/hr from Table 1.b Wind speeds and compass directions obtained from airspeed/direction symbols on 850 mb constant pressure weather charts nearest pintail flights.c Symbols for relative wind direction category apply to upper air and surface data: Q 5 quartering, TW 5 tailwind, HW 5 headwind, SW 5 sidewind,
VAR 5 variable, none 5 calm.d Airspeed 5 groundspeed – tailwind, or groundspeed 1 headwind; wind speed used is the highest of the ranges obtained from weather charts.e Sky conditions: OC 5 overcast, LR 5 light rain, R 5 rain, MC 5 mostly cloudy, PC 5 partly cloudy, CL 5 clear; where .1 condition applied, we
show the condition least favorable for migration. Numbered superscripts refer to the nearest weather station: 1 5 Boise, Idaho; 2 5 Hoquiam, Washington;3 5 Fort Smith, Northwest Territories; 4 5 Edmonton, Alberta; 5 5 Redding, California; 6 5 Burley, Idaho; 7 5 Ontario, Oregon; 8 5 Jamestown, NorthDakota; 9 5 Vancouver, British Columbia; 10 5 Quillayute, Washington; 11 5 Newport, Oregon; 12 5 College Station, Texas; 13 5 Redmond, Oregon;14 5 Watson Lake, Yukon; 15 5 Terrace, British Columbia; 16 5 Truth or Consequences, New Mexico; 17 5 Hermiston, Oregon; 18 5 Burns, Oregon.
f,g,h Superscripts of the same letter indicate multiple flights for the same pintail.
average outlier-corrected groundspeed of 77km/hr, they would have required 38 hr to com-plete the flight nonstop.
DISCUSSION
The estimated 77 km/hr migration ground-speed of PTT-tagged adult female pintails wasconsistent with that of the upper range of pin-tail groundspeeds (local flights) estimated us-ing radar (65–76 km/hr; Bruderer and Boldt2001). Average groundspeeds of other ducksduring local flights have ranged from 42 to116 km/hr (Speirs 1945, Lokemoen 1967,Kerlinger 1995, Bruderer and Boldt 2001),very similar to the range we obtained for mi-grating pintails. During migration, PTT-taggedWhooper (Cygnus cygnus) and Tundra (C.columbianus) swans migrated at 60–90 km/hr(Pennycuick et al. 1996a, Ely et al. 1997), and
Canada Geese (Branta canadensis) fitted withVHF radio-transmitters migrated at ground-speeds of 49–110 km/hr (Wege and Raveling1984). Bellrose and Crompton (1981) clockedmigrating Canada Geese at 61–73 km/hr,Lesser Snow Geese (Chen caerulescens) at67–83 km/hr, and Mallards (Anas platyrhyn-chos) at 72 km/hr by following in automobilesor aircraft. Using satellite telemetry, radar, andother means, migrating Brant have been re-corded at groundspeeds of 99 km/hr (Dau1992), 90 km/hr (Lindell 1977 cited in Eb-binge and Spaans 1995), 30–115 km/hr(Green and Alerstam 2000), and 58–109 km/hr (Green et al. 2002). Wide interspecific var-iation in these reported groundspeed estimatesprobably resulted from species-specific flightaerodynamics (Pennycuick 1975, Rayner1990), atmospheric conditions (Kerlinger and

371Miller et al. • PINTAIL FLIGHT SPEED
Moore 1989), and errors associated with thevarious methods (Bruderer and Boldt 2001).The relatively wide range of pintail ground-speeds in our study undoubtedly reflected pri-marily wind conditions, and perhaps angle offlight (ascending, descending, horizontal;Green and Alerstam 2000); however, the closeagreement between outlier-corrected and un-corrected data suggests that measurement er-ror was minimal. We recommend that inves-tigators report groundspeeds and groundspeedto airspeed ratios because of their implicationin analysis of flight range and cost.
Birds use tailwinds to minimize the ener-getic cost of migration by increasing ground-speed and range, reducing airspeed to main-tain groundspeed, or both (Richardson 1990,Alerstam and Hedenstrom 1998), and this hasbeen verified for migrating waterfowl (Blok-poel 1974, Bellrose and Crompton 1981,Wege and Raveling 1984, Dau 1992, Green etal. 2002). Most pintails (had they migrated atour specified altitude of 1,460 m) would havebenefited from tailwinds, as exemplified bytheir average higher groundspeed and lowerairspeed in tailwinds. Birds are known to alterflight altitudes and move to those with favor-able winds (Gauthreaux 1991). If three of thefour pintails in our study that we assumedwere flying into headwinds aloft had insteadbeen flying near the ground surface, theywould have had tailwinds. Also, the threeflights occurred partially or completely duringthe day (Table 1), when low-altitude migrationflights are typical (Richardson 1990). How-ever, we cannot be sure of the migration alti-tude, and sky conditions observed from theground varied from mostly cloudy to light rainand overcast (Table 2), weather types that tendto discourage migration (Richardson 1990).
Birds generally adjust airspeed when winddirection changes; waterfowl increase air-speed to compensate for headwinds and re-duce airspeed as tailwinds increase (Tuckerand Schmidt-Koenig 1971, Bellrose andCrompton 1981, Wege and Raveling 1984,Pennycuick et al. 1996a), but the adjustmentsare not necessarily proportionate (Bellrose andCrompton 1981). Our pintails clearly did nothave a strategy to maintain airspeeds inchanging wind conditions (Table 2), althoughBlokpoel (1974) concluded that migratingLesser Snow Geese did. Our estimates of av-
erage pintail airspeed support the hypothesisthat their airspeed was faster, and groundspeedslower, in headwinds compared with tail-winds. The ratios of groundspeed to airspeedfor tagged pintails show that compared withstill air (ratio 5 1.0), pintails decreased theirgroundspeeds about 27% in headwinds and in-creased groundspeeds by about 61% in tail-winds, suggesting that migration occurred atVmr. Demonstrating such compensation duringlocal flights, Tucker and Schmidt-Koenig(1971) reported a pintail airspeed of 56 6 1km/hr with tailwinds and 66 6 1 km/hragainst headwinds, similar to our results (55and 71 km/hr, respectively). Because Tuckerand Schmidt-Koenig (1971) did not report re-spective groundspeeds or wind directions, weestimated groundspeeds from their study byusing their reported average wind speeds of18 and 31 km/hr and applying them as tail-winds and headwinds. This produced potentialrespective groundspeeds of 74 and 87 km/hrin tailwinds and 48 and 35 km/hr in head-winds, similar to our findings.
Using the theoretical flight models of Pen-nycuick (1989) and Rayner (1990), Brudererand Boldt (2001) calculated Vmr and Vmp forpintails as 64 and 40 km/hr, respectively. Theaverage airspeed of our pintails in tailwinds(55 km/hr) was above Vmp and below Vmr, andtheir average airspeed in headwinds (71 km/hr) was greater than both Vmp and Vmr. In fourinstances, our pintails flew more slowly thanVmp in tailwinds (24–36 km/hr), and on nineflight paths in variable wind directions, theyflew faster than Vmr (66–97 km/hr); on eightpaths, pintails flew at speeds between the the-oretical speeds (43–63 km/hr; Table 2). Ourdata support Welham’s (1994) findings thatpintail-sized birds tend to migrate at Vmr, butare not bound by theoretical flight models(Pennycuick 1998); more data are needed tocompare field results with their predictions.The four excessively slow speeds in tailwinds(,Vmp) may reflect errors resulting from over-estimation of wind speed (Tucker andSchmidt-Koenig 1971), resulting from poten-tial differences between winds at the actual(unknown) and selected (850 mb) flight alti-tudes. Pintails probably do not fly at the the-oretical minimum power speed in any event,a phenomenon demonstrated for a CommonTeal (Anas crecca crecca) and other birds that

372 THE WILSON BULLETIN • Vol. 117, No. 4, December 2005
refused to fly in wind tunnels at Vmp (Penny-cuick et al. 1996b). To address this problemin future field studies, wind speeds and direc-tions will need to be obtained very near flightaltitudes because wind data gleaned from con-stant pressure charts are only as relevant asthe selected flight altitude. Investigators coulduse PTTs with onboard altitude sensors, butthese sensors are not yet available for thesmall PTTs required for use on pintail-sizedbirds. Larger PTTs with GPS technology areavailable, which would be suitable for geeseand swans; these can track position, altitude,heading, and speed with high accuracy (630m; Microwave Telemetry, Inc. 2005).
Most waterfowl are known to migrate atnight as well as during daylight hours (Bell-rose 1980, Kerlinger and Moore 1989). There-fore, it is not surprising that nearly all of ourmeasured flights of tagged pintails occurredpartially or entirely at night. For long-distancemigrations, typically beginning after sunset(Kerlinger and Moore 1989), travel may ex-tend into daylight hours because there is notenough time to make the transit during night-time hours (Berthold 1996), or wind condi-tions might favor continuing into daytimehours (Liechti and Schaller 1999 cited in Jenniand Schaub 2003); five of our recorded flightsoverlapped day and night (birds A, B, C, E,and J; Table 1). Migration in the cooler, am-bient nighttime air at moderate to high alti-tudes theoretically provides bioenergetic ben-efits of heat dissipation and water conserva-tion through evaporative cooling (Berthold1996, Kvist et al. 1998). This could be criticalfor waterfowl during long, nonstop migrationswhen diurnal and surface temperatures arehigh (e.g., early fall, late spring). Nocturnalatmospheric conditions provide distinct ad-vantages to migrating birds, including coolertemperatures and more humidity, denser air,weaker and more laminar horizontal winds,and little or no vertical air motion comparedwith daytime conditions (Kerlinger and Moore1989, Ahrens 2000); these conditions maxi-mize flight speed while reducing energy cost.Additionally, night migration would enablecelestial navigation (Bellrose 1980).
Our data suggest that researchers need notdelete any but the most obvious outliers toestimate groundspeeds when using the methodof total distance divided by total time with
relatively large sample sizes. Average ground-speed estimated using all data did not differfrom that using outlier-corrected data, eventhough the former included very high and un-realistic speeds on six flight-path segments(175, 381, 484, 611, 829, and 999 km/hr).These did not affect the average because theyoccurred over very short time periods betweenthe first and last location points (32 sec to 7.2min), and because we did not estimategroundspeed by averaging speeds of eachflight-path segment. Investigators could in-crease the frequency of high-quality locations(LC . 0) by increasing PTT power, or, forlarge species, adopt new PTT models that in-corporate global positioning systems (GPS;Microwave Telemetry, Inc. 2005). This wouldimprove estimation of groundspeeds and air-speeds and their precision along individualflight-path segments.
Back-mounted PTTs may have reduced ourestimates of pintail groundspeed; however, re-sults from previous studies that addressed thisissue have been inconclusive. For example,Butler et al. (1998) estimated a potential 5%increase in the energetic costs of flight of Bar-nacle Geese (Branta leucopsis) outfitted with33-g PTTs. Because geese are able to reposi-tion PTTs under their body feathers whilepreening (Butler et al. 1998), wind resistancedue to PTTs may be reduced (Obrecht et al.1988). Harnessed transmitters increased theenergy cost of rapid flight in homing pigeons(Rock Pigeon, Columba livia; Gessaman andNagy 1988), perhaps due to the vertically flat-tened posterior ends of the test transmitters(Obrecht et al. 1988). In wind tunnel experi-ments that tested the aerodynamic character-istics of three transmitter sizes attached to fro-zen Lesser Snow Geese and Mallards, stream-lined transmitters created the least drag, andthe smallest test transmitters (slightly largerthan our 20-g unit [excluding harness]) cre-ated drag too small to be measured (Obrechtet al. 1988); the sloped anterior and posteriorends of our pintail PTTs mimicked the stream-lined shape of these units. Pennycuick et al.(1996b) recently reduced their estimate ofbody-drag coefficients for flying birds from0.4 to 0.08, suggesting that drag may not beas important as once thought. Based on thisnew information and our typical meangroundspeeds and airspeeds of PTT-tagged
373Miller et al. • PINTAIL FLIGHT SPEED
pintails, we conclude that the variation ingroundspeed caused by wind direction andspeed likely overwhelmed wind resistance andmass effects of PTTs. Nonetheless, we en-courage researchers to develop reliable, im-plantable PTTs for moderately sized water-fowl because of potential aerodynamic bene-fits and reduced energetic costs of flight.
ACKNOWLEDGMENTS
We thank A. A. Marnell, II, and the Tuscany Re-search Institute for providing all operational fundingto support the California work through annual grantsto Ducks Unlimited, Inc., Memphis, Tennessee, andsupporting grants to the California Waterfowl Associ-ation, Sacramento, California. D. P. Connelly, F. A.Reid, and G. L. Stewart secured the funding, and B.D. J. Batt, M. Petrie, and G. S. Yarris managed donatedfunds. B. D. J. Batt, M. Petrie, D. P. Connelly, F. A.Reid, G. S. Yarris, M. G. Anderson, K. L. Guyn, andD. C. Duncan contributed to project development andother planning. The U.S. Fish and Wildlife Service(Region 2), Texas Parks and Wildlife, and the PlayaLakes Joint Venture provided funding for the Texasand New Mexico work. P. Howey provided technicalassistance. P. Blake, D. Campbell, N. M. Carpenter, S.Cordes, C. Dennis, J. G. Mensik, and J. A. Moon lo-cated pintail capture sites. We thank the many fieldtechnicians who trapped ducks and assisted with PTTattachment, especially C. Lee, B. Ballard, S. Cordts, J.A. Laughlin, and D. L. Loughman. J. K. Daugherty,S. Burnett, C. J. Gregory, and L. L. Williams managedall satellite data. We thank S. E. Schwarzbach, B. D.J. Batt, B. M. Ballard, R. R. Cox, and three anonymousreferees for thorough reviews of the manuscript.
LITERATURE CITED
AHRENS, C. D. 2000. Meteorology today: an introduc-tion to weather, climate, and the environment.Brooks/Cole, Pacific Grove, California.
ALERSTAM, T. 1978. Analysis and a theory of visiblebird migration. Oikos 30:273–349.
ALERSTAM, T. 2003. Bird migration speed. Pages 253–267 in Avian migration (P. Berthold, E. Gwinner,and E. Sonnenschein, Eds.). Springer-Verlag, Ber-lin, Germany.
ALERSTAM, T. AND A. HEDENSTROM. 1998. The devel-opment of bird migration theory. Journal of AvianBiology 29:343–369.
ALERSTAM, T. AND A. LINDSTROM. 1990. Optimal birdmigration: the relative importance of time, energy,and safety. Pages 331–351 in Bird migration (E.Gwinner, Ed.). Springer-Verlag, Berlin, Germany.
ARGOS, INC. 1996. User’s manual. Landover, Maryland.http://www.argosinc.com (accessed 10 April 2005).
BELLROSE, F. C. 1980. Ducks, geese, and swans ofNorth America. Stackpole Books, Harrisburg,Pennsylvania.
BELLROSE, F. C. AND R. C. CROMPTON. 1981. Migration
speeds of three waterfowl species. Wilson Bulletin93:121–124.
BERTHOLD, P. 1996. Control of bird migration. Chap-man and Hall, London, United Kingdom.
BLOKPOEL, H. 1974. Migration of Lesser Snow andBlue Geese, part 1. Report Series, no. 28, Cana-dian Wildlife Service, Ottawa, Ontario, Canada.
BLOUIN, F., J. F. GIROUX, J. FERRON, G. GAUTHIER, AND
G. J. DOUCET. 1999. The use of satellite telemetryto track Greater Snow Geese. Journal of Field Or-nithology 70:187–199.
BRITTEN, M. W., P. L. KENNEDY, AND S. AMBROSE.1999. Performance and accuracy evaluations ofsmall satellite transmitters. Journal of WildlifeManagement 63:1349–1358.
BRUDERER, B. AND A. BOLDT. 2001. Flight character-istics of birds: I. Radar measurements of speeds.Ibis 143:178–204.
BUTLER, P. J., A. J. WOAKES, AND C. M. BISHOP. 1998.Behaviour and physiology of Svalbard BarnacleGeese Branta leucopsis during their autumn mi-gration. Journal of Avian Biology 29:536–545.
CACCAMISE, D. F. AND R. S. HEDIN. 1985. An aerody-namic basis for selecting transmitter loads inbirds. Wilson Bulletin 97:306–318.
CARNEY, S. M. 1992. Species, age, and sex identifi-cation of ducks using wing plumage. U.S. Fishand Wildlife Service, Washington, D.C.
DAU, C. P. 1992. The fall migration of Pacific FlywayBrent Branta bernicla in relation to climatic con-ditions. Wildfowl 43:80–95.
EBBINGE, B. S. AND B. SPAANS. 1995. The importanceof body reserves accumulated in spring staging ar-eas in the temperate zone for breeding in dark-bel-lied Brent Geese (Branta bernicla bernicla) in thehigh Arctic. Journal of Avian Biology 26:105–113.
ELY, C. R., D. C. DOUGLAS, A. C. FOWLER, C. A. BAB-COCK, D. V. DERKSEN, AND J. Y. TAKEKAWA. 1997.Migration behavior of Tundra Swans from the Yu-kon-Kuskokwim Delta, Alaska. Wilson Bulletin109:679–692.
FLINT, P. L., J. B. GRAND, AND R. F. ROCKWELL. 1998.A model of Northern Pintail productivity and pop-ulation growth rate. Journal of Wildlife Manage-ment 62:1110–1118.
GAUTHREAUX, S. A. 1991. The flight behavior of mi-grating birds in changing wind fields: radar andvisual analyses. American Zoologist 31:187–204.
GESSAMAN, J. A. AND K. A. NAGY. 1988. Transmitterloads affect the flight speed and metabolism ofhoming pigeons. Condor 90:662–668.
GILL, R. E., JR., T. PIERSMA, G. HUFFORD, R. SER-VRANCKX, AND A. RIEGEN. 2005. Crossing the ul-timate ecological barrier: evidence for an 11 000-km-long nonstop flight from Alaska to New Zea-land and eastern Australia by Bar-tailed Godwits.Condor 107:1–20.
GREEN, M. AND T. ALERSTAM. 2000. Flight speeds andclimb rates of Brent Geese: mass-dependent dif-ferences between spring and autumn migration.Journal of Avian Biology 31:215–225.

374 THE WILSON BULLETIN • Vol. 117, No. 4, December 2005
GREEN, M., T. ALERSTAM, P. CLAUSEN, R. DRENT, AND
B. S. EBBINGE. 2002. Dark-bellied Brent GeeseBranta bernicla bernicla, as recorded by satellitetelemetry, do not minimize flight distance duringspring migration. Ibis 144:106–121.
HATCH, S. A., P. M. MEYERS, D. M. MULCAHY, AND D.C. DOUGLAS. 2000. Performance of implantablesatellite transmitters in diving seabirds. Waterbirds23:84–94.
HAYS, G. C., A. AKESSON, B. J. GODLEY, P. LUSHCI,AND P. SANTIDRIAN. 2001. The implications of lo-cation accuracy for the interpretation of satellite-tracking data. Animal Behaviour 61:1035–1040.
HEDENSTROM, A. AND T. ALERSTAM. 1998. How fastcan birds migrate? Journal of Avian Biology 29:424–432.
JENNI, L. AND M. SCHAUB. 2003. Behavioural and phys-iological reactions to environmental variation inbird migration: a review. Pages 155–171 in Avianmigration (P. Berthold, E. Gwinner, and E. Sonnen-schein, Eds.). Springer-Verlag, Berlin, Germany.
KERLINGER, P. 1995. How birds migrate. StackpoleBooks, Mechanicsburg, Pennsylvania.
KERLINGER, P. AND F. R. MOORE. 1989. Atmosphericstructure and avian migration. Current Ornitholo-gy 6:109–142.
KVIST, A., M. KLAASSEN, AND A. LINDSTROM. 1998.Energy expenditure in relation to flight speed:what is the power of mass loss rate estimates?Journal of Avian Biology 29:485–498.
LIECHTI, F. AND B. BRUDERER. 1998. The relevance ofwind for optimal migration theory. Journal of Avi-an Biology 29:561–568.
LIECHTI, R. AND E. SCHALLER. 1999. The use of low-level jets by migrating birds. Naturwissenschaften86:549–551.
LINDELL, L. 1977. Migratory Brent Geese Branta ber-nicla in south Sweden on 25 September 1976. An-ser 16:146–147.
LOKEMOEN, J. T. 1967. Flight speed of the Wood Duck.Wilson Bulletin 79:238–239.
MALECKI, R. A., B. D. J. BATT, AND S. E. SHEAFFER.2001. Spatial and temporal distribution of Atlanticpopulation Canada geese. Journal of WildlifeManagement 65:242–247.
MICROWAVE TELEMETRY, INC. 2005. Product and servic-es catalogue. Columbia, Maryland. http://www.microwavetelemetry.com (accessed 10 April 2005).
MILLER, M. R., J. P. FLESKES, J. Y. TAKEKAWA, D. L.ORTHMEYER, M. L. CASAZZA, AND W. M. PERRY.2001. Satellite tracking of Northern Pintail springmigration from California, USA: the route to Chu-kotka, Russia. Casarca 7:229–233.
MILLER, M. R., J. P. FLESKES, J. Y. TAKEKAWA, D. C.ORTHMEYER, M. L. CASAZZA, AND W. M. PERRY.2005. Spring migration of Northern Pintails fromCalifornia’s Central Valley wintering area trackedwith satellite telemetry: routes, timing, and destina-tions. Canadian Journal of Zoology 83:1314–1332.
NATIONAL CLIMATIC DATA CENTER. 2005. Upper-airdata: data and products, NCEP charts. Asheville,
North Carolina. http://www.ncdc.noaa.gov/oa/up-perair.html (accessed 10 April 2005).
OBRECHT, H. H., C. J. PENNYCUICK, AND M. R. FULLER.1988. Wind tunnel experiments to assess the effectof back-mounted radio-transmitters on bird bodydrag. Journal of Experimental Biology 135:265–273.
PENNYCUICK, C. J. 1975. Mechanics of flight. AvianBiology 5:1–75.
PENNYCUICK, C. J. 1989. Bird flight performance: apractical calculation manual. Oxford UniversityPress, Oxford, United Kingdom.
PENNYCUICK, C. J. 1998. Towards an optimal strategyfor bird flight research. Journal of Avian Biology29:449–457.
PENNYCUICK, C. J., O. EINARSON, T. A. M. BRADBURY,AND M. OWENS. 1996a. Migrating Whooper SwansCygnus cygnus: satellite tracks and flight perfor-mance calculations. Journal of Avian Biology 27:118–134.
PENNYCUICK, C. J., M. KLAASSEN, A. KVIST, AND A.LINDSTROM. 1996b. Wingbeat frequency and thebody drag anomaly: wind tunnel observations ona Thrush Nightingale (Luscinia luscinia) and aTeal (Anas crecca). Journal of Experimental Bi-ology 199:2757–2765.
PETERSEN, M. R., W. W. LARNED, AND D. C. DOUGLAS.1999. At-sea distribution of Spectacled Eiders: a120-year mystery resolved. Auk 116:1009–1020.
RAYNER, J. M. V. 1988. Form and function in avianflight. Current Ornithology 5:1–77.
RAYNER, J. M. V. 1990. The mechanics of flight andbird migration performance. Pages 283–299 inBird migration (E. Gwinner, Ed.). Springer-Verlag,Berlin, Germany.
RICHARDSON, W. J. 1990. Timing of bird migration inrelation to weather: updated review. Pages 78–101in Bird migration (E. Gwinner, Ed.). Springer-Ver-lag, Berlin, Germany.
SHAMOUN-BARANES, J., A. BAHARAD, P. ALPERT, P.BERTHOLD, Y. YOM-TAV, Y. DVIR, AND Y. LESHAM.2003. The effect of wind, season and latitude onthe migration speed of White Storks Ciconia ci-conia, along the eastern migration route. Journalof Avian Biology 34:97–104.
SPEIRS, J. M. 1945. Flight speed of the Old-squaw. Auk62:135–136.
THOMPSON, M. C. 1961. The flight speed of a Red-breasted Merganser. Condor 63:265.
TUCKER, V. A. AND K. SCHMIDT-KOENIG. 1971. Flightspeeds of birds in relation to energetics and winddirections. Auk 88:97–107.
WEATHER UNDERGROUND. 2005. Weather station histo-ries. Ann Arbor, Michigan. http://www.weatherunderground.com (accessed 10 April 2005).
WEGE, M. L. AND D. G. RAVELING. 1984. Flight speedand directional responses to wind by migratingCanada Geese. Auk 101:342–348.
WELHAM, C. V. J. 1994. Flight speeds of migratingbirds: a test of maximum range speed predictionsfrom three aerodynamic equations. BehavioralEcology 5:1–8.


