Embed Size (px)
Citation preview
Skeletal Muscle Performance DeterminedbyModulationofNumberofMyosinMotorsRather Than Motor Force or Stroke SizeGabriella Piazzesi,1,2 Massimo Reconditi,1 Marco Linari,1 Leonardo Lucii,1 Pasquale Bianco,1,2
Elisabetta Brunello,1,2 Valerie Decostre,1 Alex Stewart,3 David B. Gore,4 Thomas C. Irving,4 Malcolm Irving,5,*and Vincenzo Lombardi1,2
1Laboratorio di Fisiologia, Dipartimento di Biologia Animale e Genetica, Universita degli Studi di Firenze, Via G. Sansone 1,
50019 Sesto Fiorentino, Italy2CRS SOFT-INFM-CNR, Universita di Roma ‘‘La Sapienza’’, 00185 Roma, Italy3Dexela Ltd., Spitfire Studios, 63 Collier Street, London N1 9BE, UK4BioCAT, Advanced Photon Source, 9700 South Cass Avenue, Argonne, IL 60439 , USA5Randall Division of Cell and Molecular Biophysics, King’s College London, London SE1 1UL, UK
*Correspondence: [email protected]
DOI 10.1016/j.cell.2007.09.045
SUMMARY
Skeletal muscle can bear a high load at constantlength, or shorten rapidly when the load is low.This force-velocity relationship is the primarydeterminant of muscle performance in vivo.Here we exploited the quasi-crystalline orderof myosin II motors in muscle filaments to deter-mine the molecular basis of this relationship byX-ray interference and mechanical measure-ments on intact single cells. We found that,during muscle shortening at a wide range ofvelocities, individual myosin motors maintaina force of about 6 pN while pulling an actin fila-ment through a 6 nm stroke, then quickly detachwhen the motor reaches a critical conformation.Thus we show that the force-velocity relation-ship is primarily a result of a reduction in thenumber of motors attached to actin in each fila-ment in proportion to the filament load. Theseresults explain muscle performance and effi-ciency in terms of the molecular mechanism ofthe myosin motor.
INTRODUCTION
The myosin II motors that drive muscle contraction are
organized into ordered superstructures in which a large en-
sembleof motorsacts asa functionalunit. The a-helical tails
of the myosin II molecules are packed into the backbone of
myosin filaments, with groups of motors emerging at regu-
lar 14.5 nm intervals (Huxley and Brown, 1967; Figure 1A).
Relative sliding of actin and myosin filaments during muscle
contraction is driven by the motor ensemble, mechanically
coupled by their connections to the filament backbone and
784 Cell 131, 784–795, November 16, 2007 ª2007 Elsevier Inc.
structurally constrained by the locally ordered lattice of
parallel filaments (Hanson and Huxley, 1953; Huxley,
1969). This structure is repeated regularly along the muscle
cell, with an array of myosin filaments at the midpoint of
each muscle sarcomere. Each myosin molecule contains
two identical motors composed of a catalytic domain that
attaches to actin in a well-defined orientation and a light-
chain domain that connects the catalytic domain to the
myosin tail and filament (Figure 1B; Rayment et al., 1993a).
Crystallographic studies suggest that the working stroke
of the motor is produced by bending between these two
domains, so that tilting of the light-chain domain drives rel-
ative sliding between the myosin and actin filaments (Ray-
ment et al., 1993b; Holmes, 1997; Dominguez et al., 1998).
The quasi-crystalline structure and organization of the
myosin filaments allow the motor mechanism to be char-
acterized with remarkably high structural and temporal
resolution in an intact muscle cell by a combination of
mechanical and X-ray techniques (Huxley and Simmons,
1971; Piazzesi et al., 2002a, 2002b; Reconditi et al.,
2004). Previously, these techniques relied on fast pertur-
bations of muscle cell length or force to synchronize the
action of the motor ensemble. The physiological perfor-
mance of muscle, however, depends on asynchronous
action of the motors on a slower timescale. Here we
applied the combined mechanical and X-ray approach
to determine the molecular basis of the primary determi-
nant of muscle performance in vivo: the relationship
between shortening velocity and load. The results do not
support the conventional explanation of this relationship
(Huxley, 1957; Cooke, 1997), in which the lower force
exerted by shortening muscle is primarily a result of a lower
force per motor. We propose a quantitative explanation of
muscle performance and efficiency in terms of the unitary
action of an individual myosin motor which integrates
previous mechanistic insights from mechanical and struc-
tural studies at both the cellular and molecular levels.
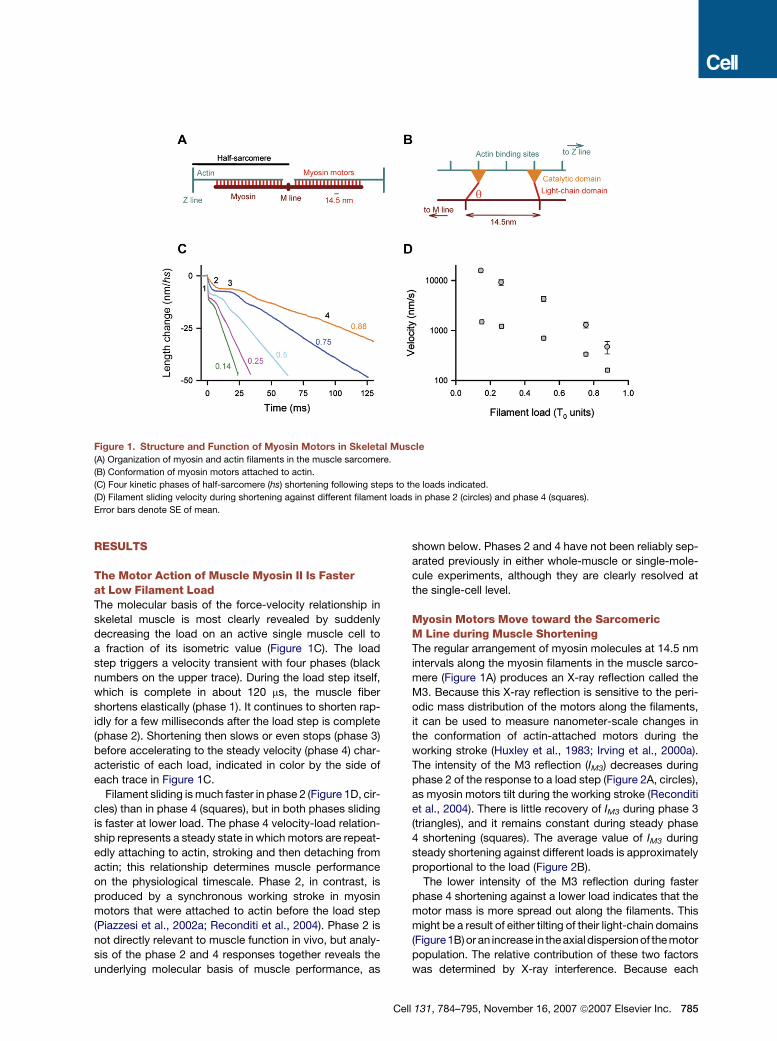
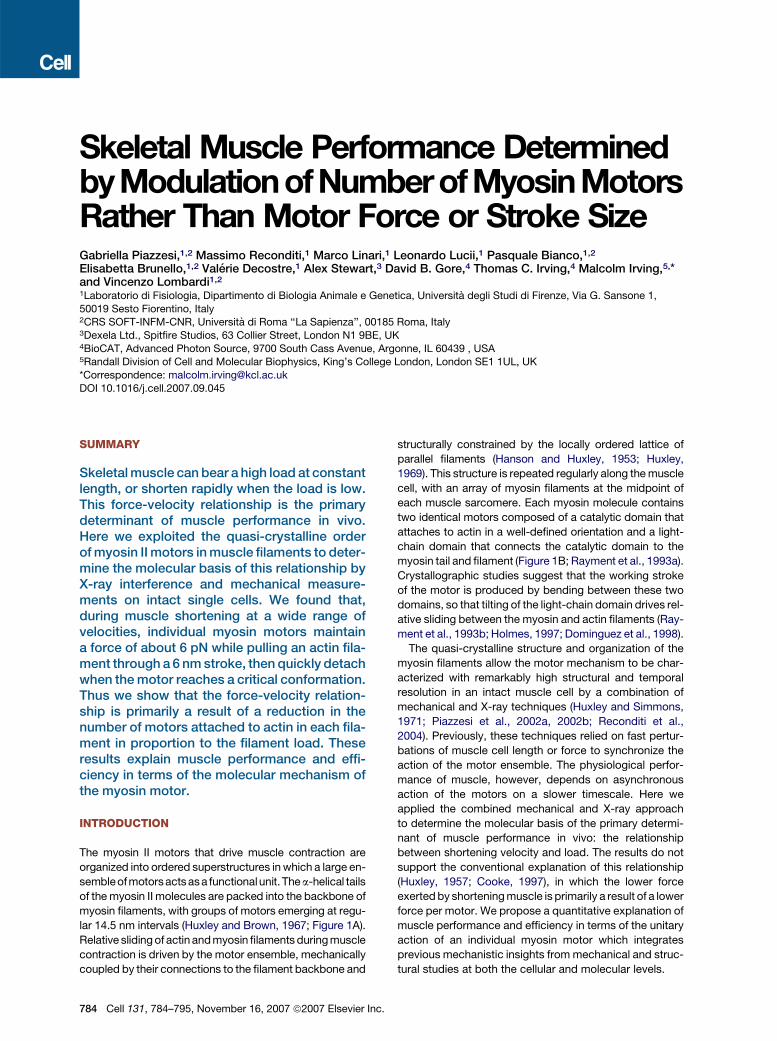
Figure 1. Structure and Function of Myosin Motors in Skeletal Muscle
(A) Organization of myosin and actin filaments in the muscle sarcomere.
(B) Conformation of myosin motors attached to actin.
(C) Four kinetic phases of half-sarcomere (hs) shortening following steps to the loads indicated.
(D) Filament sliding velocity during shortening against different filament loads in phase 2 (circles) and phase 4 (squares).
Error bars denote SE of mean.
RESULTS
The Motor Action of Muscle Myosin II Is Fasterat Low Filament LoadThe molecular basis of the force-velocity relationship in
skeletal muscle is most clearly revealed by suddenly
decreasing the load on an active single muscle cell to
a fraction of its isometric value (Figure 1C). The load
step triggers a velocity transient with four phases (black
numbers on the upper trace). During the load step itself,
which is complete in about 120 ms, the muscle fiber
shortens elastically (phase 1). It continues to shorten rap-
idly for a few milliseconds after the load step is complete
(phase 2). Shortening then slows or even stops (phase 3)
before accelerating to the steady velocity (phase 4) char-
acteristic of each load, indicated in color by the side of
each trace in Figure 1C.
Filament sliding is much faster in phase 2 (Figure 1D, cir-
cles) than in phase 4 (squares), but in both phases sliding
is faster at lower load. The phase 4 velocity-load relation-
ship represents a steady state in which motors are repeat-
edly attaching to actin, stroking and then detaching from
actin; this relationship determines muscle performance
on the physiological timescale. Phase 2, in contrast, is
produced by a synchronous working stroke in myosin
motors that were attached to actin before the load step
(Piazzesi et al., 2002a; Reconditi et al., 2004). Phase 2 is
not directly relevant to muscle function in vivo, but analy-
sis of the phase 2 and 4 responses together reveals the
underlying molecular basis of muscle performance, as
C
shown below. Phases 2 and 4 have not been reliably sep-
arated previously in either whole-muscle or single-mole-
cule experiments, although they are clearly resolved at
the single-cell level.
Myosin Motors Move toward the SarcomericM Line during Muscle ShorteningThe regular arrangement of myosin molecules at 14.5 nm
intervals along the myosin filaments in the muscle sarco-
mere (Figure 1A) produces an X-ray reflection called the
M3. Because this X-ray reflection is sensitive to the peri-
odic mass distribution of the motors along the filaments,
it can be used to measure nanometer-scale changes in
the conformation of actin-attached motors during the
working stroke (Huxley et al., 1983; Irving et al., 2000a).
The intensity of the M3 reflection (IM3) decreases during
phase 2 of the response to a load step (Figure 2A, circles),
as myosin motors tilt during the working stroke (Reconditi
et al., 2004). There is little recovery of IM3 during phase 3
(triangles), and it remains constant during steady phase
4 shortening (squares). The average value of IM3 during
steady shortening against different loads is approximately
proportional to the load (Figure 2B).
The lower intensity of the M3 reflection during faster
phase 4 shortening against a lower load indicates that the
motor mass is more spread out along the filaments. This
might be a result of either tilting of their light-chain domains
(Figure 1B)or an increase in theaxialdispersion of the motor
population. The relative contribution of these two factors
was determined by X-ray interference. Because each
ell 131, 784–795, November 16, 2007 ª2007 Elsevier Inc. 785
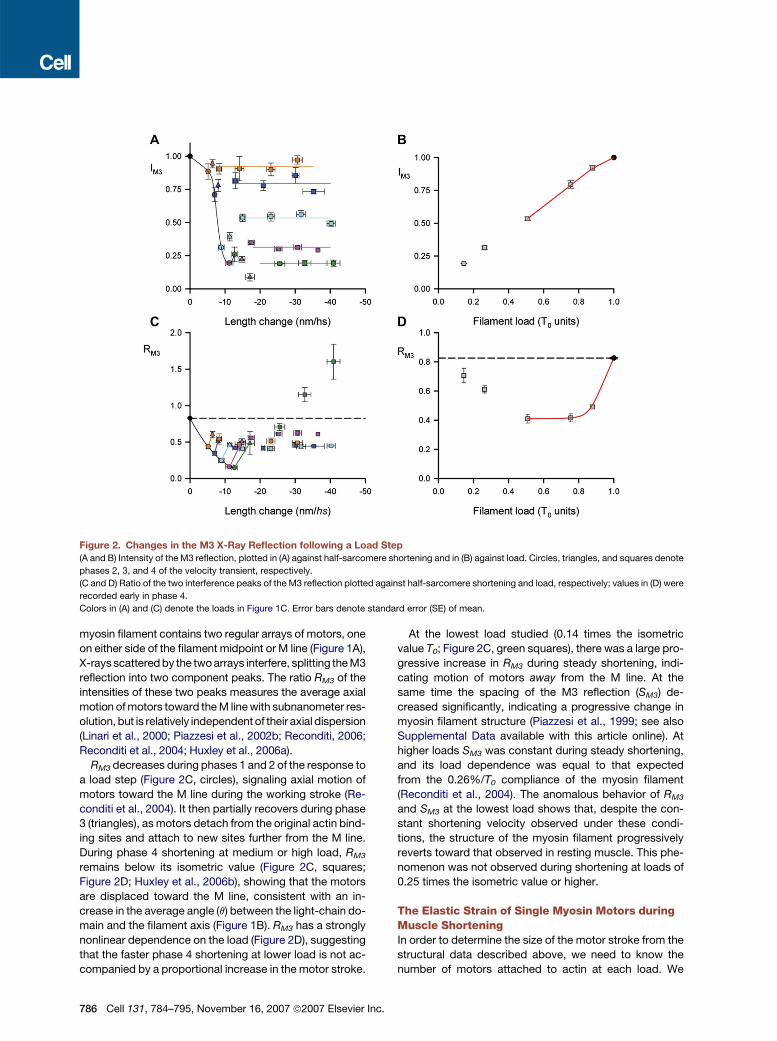
Figure 2. Changes in the M3 X-Ray Reflection following a Load Step
(A and B) Intensity of the M3 reflection, plotted in (A) against half-sarcomere shortening and in (B) against load. Circles, triangles, and squares denote
phases 2, 3, and 4 of the velocity transient, respectively.
(C and D) Ratio of the two interference peaks of the M3 reflection plotted against half-sarcomere shortening and load, respectively; values in (D) were
recorded early in phase 4.
Colors in (A) and (C) denote the loads in Figure 1C. Error bars denote standard error (SE) of mean.
myosin filament contains two regular arrays of motors, one
on either side of the filament midpoint or M line (Figure 1A),
X-rays scattered by the two arrays interfere, splitting the M3
reflection into two component peaks. The ratio RM3 of the
intensities of these two peaks measures the average axial
motion of motors toward the M line with subnanometer res-
olution, but is relatively independent of their axial dispersion
(Linari et al., 2000; Piazzesi et al., 2002b; Reconditi, 2006;
Reconditi et al., 2004; Huxley et al., 2006a).
RM3 decreases during phases 1 and 2 of the response to
a load step (Figure 2C, circles), signaling axial motion of
motors toward the M line during the working stroke (Re-
conditi et al., 2004). It then partially recovers during phase
3 (triangles), as motors detach from the original actin bind-
ing sites and attach to new sites further from the M line.
During phase 4 shortening at medium or high load, RM3
remains below its isometric value (Figure 2C, squares;
Figure 2D; Huxley et al., 2006b), showing that the motors
are displaced toward the M line, consistent with an in-
crease in the average angle (q) between the light-chain do-
main and the filament axis (Figure 1B). RM3 has a strongly
nonlinear dependence on the load (Figure 2D), suggesting
that the faster phase 4 shortening at lower load is not ac-
companied by a proportional increase in the motor stroke.
786 Cell 131, 784–795, November 16, 2007 ª2007 Elsevier Inc
At the lowest load studied (0.14 times the isometric
value T0; Figure 2C, green squares), there was a large pro-
gressive increase in RM3 during steady shortening, indi-
cating motion of motors away from the M line. At the
same time the spacing of the M3 reflection (SM3) de-
creased significantly, indicating a progressive change in
myosin filament structure (Piazzesi et al., 1999; see also
Supplemental Data available with this article online). At
higher loads SM3 was constant during steady shortening,
and its load dependence was equal to that expected
from the 0.26%/T0 compliance of the myosin filament
(Reconditi et al., 2004). The anomalous behavior of RM3
and SM3 at the lowest load shows that, despite the con-
stant shortening velocity observed under these condi-
tions, the structure of the myosin filament progressively
reverts toward that observed in resting muscle. This phe-
nomenon was not observed during shortening at loads of
0.25 times the isometric value or higher.
The Elastic Strain of Single Myosin Motors duringMuscle ShorteningIn order to determine the size of the motor stroke from the
structural data described above, we need to know the
number of motors attached to actin at each load. We
.
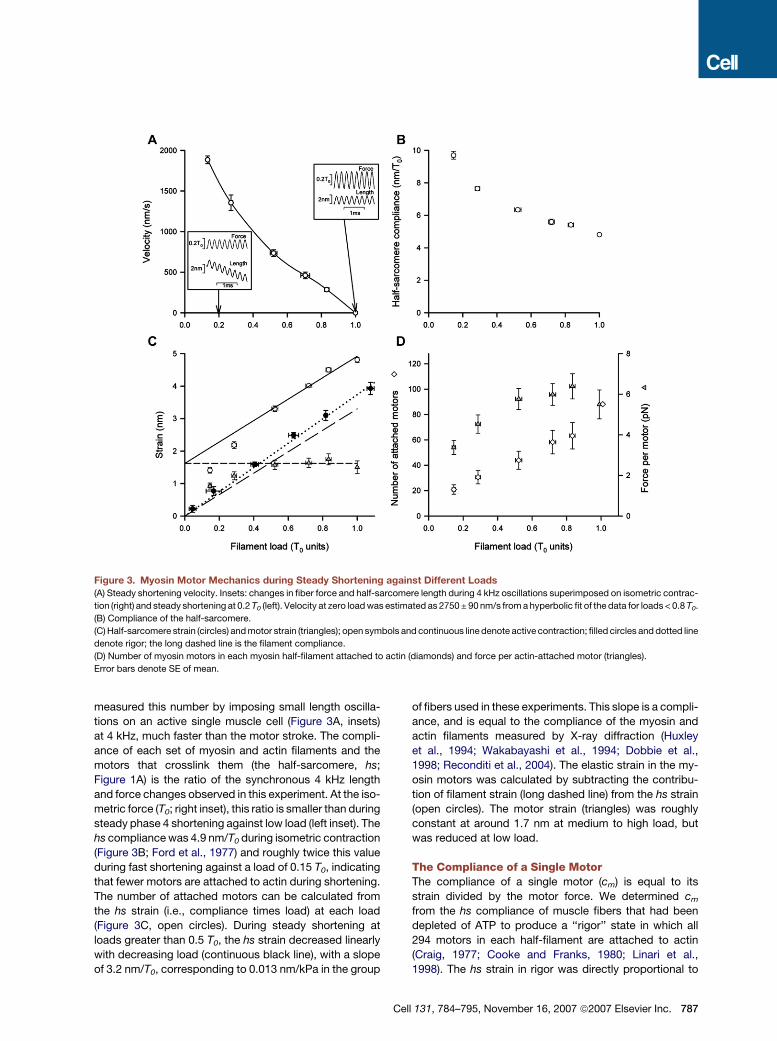
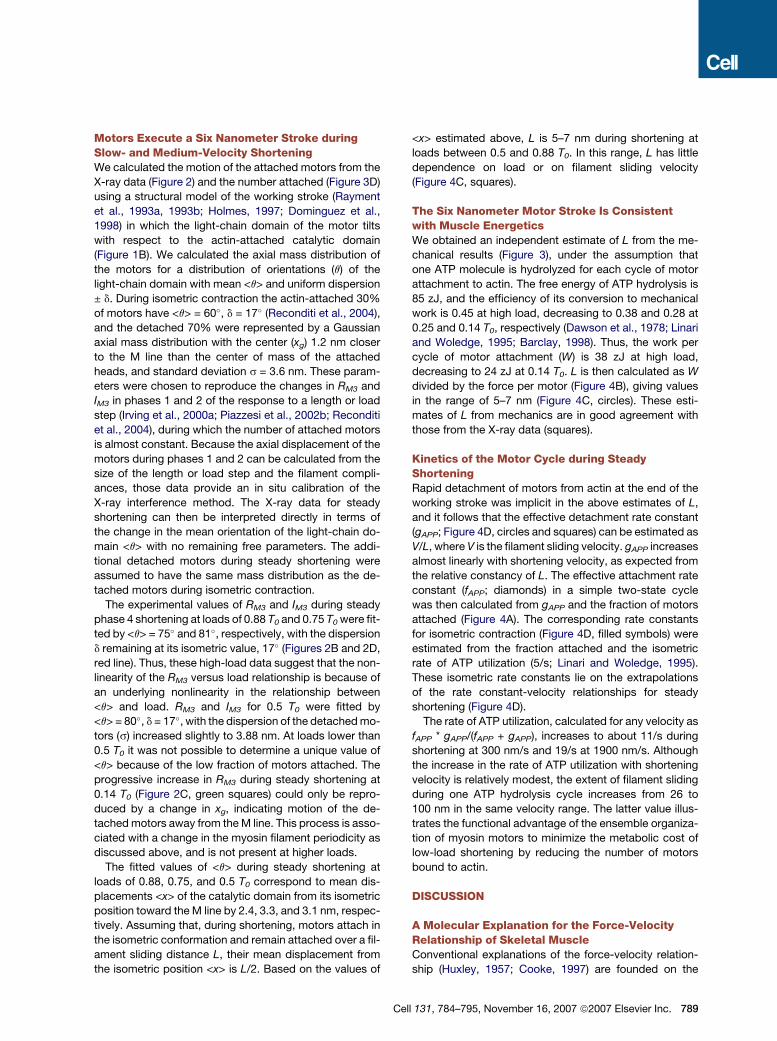
Figure 3. Myosin Motor Mechanics during Steady Shortening against Different Loads
(A) Steady shortening velocity. Insets: changes in fiber force and half-sarcomere length during 4 kHz oscillations superimposed on isometric contrac-
tion (right) and steady shortening at 0.2 T0 (left). Velocity at zero load was estimated as 2750 ± 90 nm/s from a hyperbolic fit of the data for loads < 0.8 T0.
(B) Compliance of the half-sarcomere.
(C) Half-sarcomere strain (circles) and motor strain (triangles); open symbols and continuous line denote active contraction; filled circles and dotted line
denote rigor; the long dashed line is the filament compliance.
(D) Number of myosin motors in each myosin half-filament attached to actin (diamonds) and force per actin-attached motor (triangles).
Error bars denote SE of mean.
measured this number by imposing small length oscilla-
tions on an active single muscle cell (Figure 3A, insets)
at 4 kHz, much faster than the motor stroke. The compli-
ance of each set of myosin and actin filaments and the
motors that crosslink them (the half-sarcomere, hs;
Figure 1A) is the ratio of the synchronous 4 kHz length
and force changes observed in this experiment. At the iso-
metric force (T0; right inset), this ratio is smaller than during
steady phase 4 shortening against low load (left inset). The
hs compliance was 4.9 nm/T0 during isometric contraction
(Figure 3B; Ford et al., 1977) and roughly twice this value
during fast shortening against a load of 0.15 T0, indicating
that fewer motors are attached to actin during shortening.
The number of attached motors can be calculated from
the hs strain (i.e., compliance times load) at each load
(Figure 3C, open circles). During steady shortening at
loads greater than 0.5 T0, the hs strain decreased linearly
with decreasing load (continuous black line), with a slope
of 3.2 nm/T0, corresponding to 0.013 nm/kPa in the group
of fibers used in these experiments. This slope is a compli-
ance, and is equal to the compliance of the myosin and
actin filaments measured by X-ray diffraction (Huxley
et al., 1994; Wakabayashi et al., 1994; Dobbie et al.,
1998; Reconditi et al., 2004). The elastic strain in the my-
osin motors was calculated by subtracting the contribu-
tion of filament strain (long dashed line) from the hs strain
(open circles). The motor strain (triangles) was roughly
constant at around 1.7 nm at medium to high load, but
was reduced at low load.
The Compliance of a Single MotorThe compliance of a single motor (cm) is equal to its
strain divided by the motor force. We determined cm
from the hs compliance of muscle fibers that had been
depleted of ATP to produce a ‘‘rigor’’ state in which all
294 motors in each half-filament are attached to actin
(Craig, 1977; Cooke and Franks, 1980; Linari et al.,
1998). The hs strain in rigor was directly proportional to
Cell 131, 784–795, November 16, 2007 ª2007 Elsevier Inc. 787
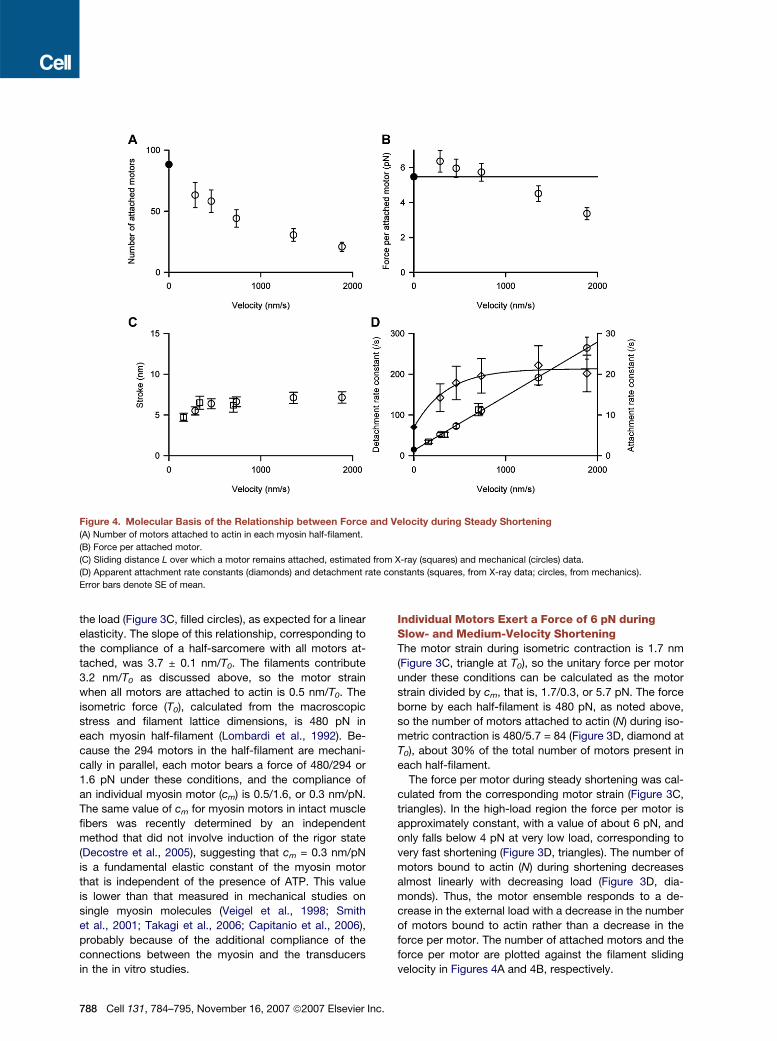
Figure 4. Molecular Basis of the Relationship between Force and Velocity during Steady Shortening
(A) Number of motors attached to actin in each myosin half-filament.
(B) Force per attached motor.
(C) Sliding distance L over which a motor remains attached, estimated from X-ray (squares) and mechanical (circles) data.
(D) Apparent attachment rate constants (diamonds) and detachment rate constants (squares, from X-ray data; circles, from mechanics).
Error bars denote SE of mean.
the load (Figure 3C, filled circles), as expected for a linear
elasticity. The slope of this relationship, corresponding to
the compliance of a half-sarcomere with all motors at-
tached, was 3.7 ± 0.1 nm/T0. The filaments contribute
3.2 nm/T0 as discussed above, so the motor strain
when all motors are attached to actin is 0.5 nm/T0. The
isometric force (T0), calculated from the macroscopic
stress and filament lattice dimensions, is 480 pN in
each myosin half-filament (Lombardi et al., 1992). Be-
cause the 294 motors in the half-filament are mechani-
cally in parallel, each motor bears a force of 480/294 or
1.6 pN under these conditions, and the compliance of
an individual myosin motor (cm) is 0.5/1.6, or 0.3 nm/pN.
The same value of cm for myosin motors in intact muscle
fibers was recently determined by an independent
method that did not involve induction of the rigor state
(Decostre et al., 2005), suggesting that cm = 0.3 nm/pN
is a fundamental elastic constant of the myosin motor
that is independent of the presence of ATP. This value
is lower than that measured in mechanical studies on
single myosin molecules (Veigel et al., 1998; Smith
et al., 2001; Takagi et al., 2006; Capitanio et al., 2006),
probably because of the additional compliance of the
connections between the myosin and the transducers
in the in vitro studies.
788 Cell 131, 784–795, November 16, 2007 ª2007 Elsevier Inc.
Individual Motors Exert a Force of 6 pN duringSlow- and Medium-Velocity ShorteningThe motor strain during isometric contraction is 1.7 nm
(Figure 3C, triangle at T0), so the unitary force per motor
under these conditions can be calculated as the motor
strain divided by cm, that is, 1.7/0.3, or 5.7 pN. The force
borne by each half-filament is 480 pN, as noted above,
so the number of motors attached to actin (N) during iso-
metric contraction is 480/5.7 = 84 (Figure 3D, diamond at
T0), about 30% of the total number of motors present in
each half-filament.
The force per motor during steady shortening was cal-
culated from the corresponding motor strain (Figure 3C,
triangles). In the high-load region the force per motor is
approximately constant, with a value of about 6 pN, and
only falls below 4 pN at very low load, corresponding to
very fast shortening (Figure 3D, triangles). The number of
motors bound to actin (N) during shortening decreases
almost linearly with decreasing load (Figure 3D, dia-
monds). Thus, the motor ensemble responds to a de-
crease in the external load with a decrease in the number
of motors bound to actin rather than a decrease in the
force per motor. The number of attached motors and the
force per motor are plotted against the filament sliding
velocity in Figures 4A and 4B, respectively.
Motors Execute a Six Nanometer Stroke duringSlow- and Medium-Velocity ShorteningWe calculated the motion of the attached motors from the
X-ray data (Figure 2) and the number attached (Figure 3D)
using a structural model of the working stroke (Rayment
et al., 1993a, 1993b; Holmes, 1997; Dominguez et al.,
1998) in which the light-chain domain of the motor tilts
with respect to the actin-attached catalytic domain
(Figure 1B). We calculated the axial mass distribution of
the motors for a distribution of orientations (q) of the
light-chain domain with mean <q> and uniform dispersion
± d. During isometric contraction the actin-attached 30%
of motors have <q> = 60�, d = 17� (Reconditi et al., 2004),
and the detached 70% were represented by a Gaussian
axial mass distribution with the center (xg) 1.2 nm closer
to the M line than the center of mass of the attached
heads, and standard deviation s = 3.6 nm. These param-
eters were chosen to reproduce the changes in RM3 and
IM3 in phases 1 and 2 of the response to a length or load
step (Irving et al., 2000a; Piazzesi et al., 2002b; Reconditi
et al., 2004), during which the number of attached motors
is almost constant. Because the axial displacement of the
motors during phases 1 and 2 can be calculated from the
size of the length or load step and the filament compli-
ances, those data provide an in situ calibration of the
X-ray interference method. The X-ray data for steady
shortening can then be interpreted directly in terms of
the change in the mean orientation of the light-chain do-
main <q> with no remaining free parameters. The addi-
tional detached motors during steady shortening were
assumed to have the same mass distribution as the de-
tached motors during isometric contraction.
The experimental values of RM3 and IM3 during steady
phase 4 shortening at loads of 0.88 T0 and 0.75 T0 were fit-
ted by <q> = 75� and 81�, respectively, with the dispersion
d remaining at its isometric value, 17� (Figures 2B and 2D,
red line). Thus, these high-load data suggest that the non-
linearity of the RM3 versus load relationship is because of
an underlying nonlinearity in the relationship between
<q> and load. RM3 and IM3 for 0.5 T0 were fitted by
<q> = 80�, d = 17�, with the dispersion of the detached mo-
tors (s) increased slightly to 3.88 nm. At loads lower than
0.5 T0 it was not possible to determine a unique value of
<q> because of the low fraction of motors attached. The
progressive increase in RM3 during steady shortening at
0.14 T0 (Figure 2C, green squares) could only be repro-
duced by a change in xg, indicating motion of the de-
tached motors away from the M line. This process is asso-
ciated with a change in the myosin filament periodicity as
discussed above, and is not present at higher loads.
The fitted values of <q> during steady shortening at
loads of 0.88, 0.75, and 0.5 T0 correspond to mean dis-
placements <x> of the catalytic domain from its isometric
position toward the M line by 2.4, 3.3, and 3.1 nm, respec-
tively. Assuming that, during shortening, motors attach in
the isometric conformation and remain attached over a fil-
ament sliding distance L, their mean displacement from
the isometric position <x> is L/2. Based on the values of
C
<x> estimated above, L is 5–7 nm during shortening at
loads between 0.5 and 0.88 T0. In this range, L has little
dependence on load or on filament sliding velocity
(Figure 4C, squares).
The Six Nanometer Motor Stroke Is Consistentwith Muscle EnergeticsWe obtained an independent estimate of L from the me-
chanical results (Figure 3), under the assumption that
one ATP molecule is hydrolyzed for each cycle of motor
attachment to actin. The free energy of ATP hydrolysis is
85 zJ, and the efficiency of its conversion to mechanical
work is 0.45 at high load, decreasing to 0.38 and 0.28 at
0.25 and 0.14 T0, respectively (Dawson et al., 1978; Linari
and Woledge, 1995; Barclay, 1998). Thus, the work per
cycle of motor attachment (W) is 38 zJ at high load,
decreasing to 24 zJ at 0.14 T0. L is then calculated as W
divided by the force per motor (Figure 4B), giving values
in the range of 5–7 nm (Figure 4C, circles). These esti-
mates of L from mechanics are in good agreement with
those from the X-ray data (squares).
Kinetics of the Motor Cycle during SteadyShorteningRapid detachment of motors from actin at the end of the
working stroke was implicit in the above estimates of L,
and it follows that the effective detachment rate constant
(gAPP; Figure 4D, circles and squares) can be estimated as
V/L, where V is the filament sliding velocity. gAPP increases
almost linearly with shortening velocity, as expected from
the relative constancy of L. The effective attachment rate
constant (fAPP; diamonds) in a simple two-state cycle
was then calculated from gAPP and the fraction of motors
attached (Figure 4A). The corresponding rate constants
for isometric contraction (Figure 4D, filled symbols) were
estimated from the fraction attached and the isometric
rate of ATP utilization (5/s; Linari and Woledge, 1995).
These isometric rate constants lie on the extrapolations
of the rate constant-velocity relationships for steady
shortening (Figure 4D).
The rate of ATP utilization, calculated for any velocity as
fAPP * gAPP/(fAPP + gAPP), increases to about 11/s during
shortening at 300 nm/s and 19/s at 1900 nm/s. Although
the increase in the rate of ATP utilization with shortening
velocity is relatively modest, the extent of filament sliding
during one ATP hydrolysis cycle increases from 26 to
100 nm in the same velocity range. The latter value illus-
trates the functional advantage of the ensemble organiza-
tion of myosin motors to minimize the metabolic cost of
low-load shortening by reducing the number of motors
bound to actin.
DISCUSSION
A Molecular Explanation for the Force-VelocityRelationship of Skeletal MuscleConventional explanations of the force-velocity relation-
ship (Huxley, 1957; Cooke, 1997) are founded on the
ell 131, 784–795, November 16, 2007 ª2007 Elsevier Inc. 789
concept that sliding between the myosin and actin fila-
ments in the direction corresponding to muscle shortening
reduces the elastic force in the myosin motors that cross-
link the filaments as external work is performed. The pres-
ent results, in contrast, show that each motor maintains
a force of about 6 pN, equal to the isometric force, during
shortening at low to medium velocities (Figure 4B). More-
over, individual motors have a low compliance, and their
elastic strain under the isometric force of 5.7 pN is only
1.7 nm (Figure 3), corresponding to an elastic energy of
0.5 * 1.7 * 5.7, or about 5 zJ. This is much smaller than
the 38 zJ work output of a myosin motor in a single cycle
of attachment, so the work done by shortening muscle
cannot be explained by the discharge of elastic energy
stored in the motor. The increase in the effective motor at-
tachment rate (fAPP) with shortening velocity (Figure 4D) is
also inconsistent with the original model (Huxley, 1957)
and requires a more complex kinetic scheme, for example
one in which the sequence of motor states in the ATPase
cycle depends on the sliding velocity (Piazzesi and Lom-
bardi, 1995). Saturation of fAPP indicates a rate-limiting
transition at about 20/s between two detached states of
the motor cycle.
We propose an alternative explanation for the force-
velocity relationship which integrates the original concept
of the motor attachment-detachment cycle (Huxley, 1957)
with the subsequent proposal that active force is gener-
ated within the attached motor (Huxley and Simmons,
1971). During slow- and medium-velocity shortening, the
tendency of filament sliding to reduce the motor force is
counteracted by active force generation, so that each
attached motor maintains the force that it is able to de-
velop under isometric conditions. The number of attached
motors decreases approximately in proportion to the ex-
ternal load (Figure 3D), and this can be explained by rapid
detachment of motors at the end of their working stroke
(Figure 4D; see also Lan and Sun, 2005). Because the
stroke size is only weakly dependent on velocity, the
effective detachment rate increases almost linearly with
velocity, so the number attached decreases. This mecha-
nism explains the high efficiency of skeletal muscle over
a wide range of physiological shortening velocities in
a straightforward way: individual attached motors perform
the same 6 pN 3 6 nm stroke throughout this range, and
the number of attached motors is modulated to match
the external load. The sliding velocity at which this match
occurs is set by the attachment rate.
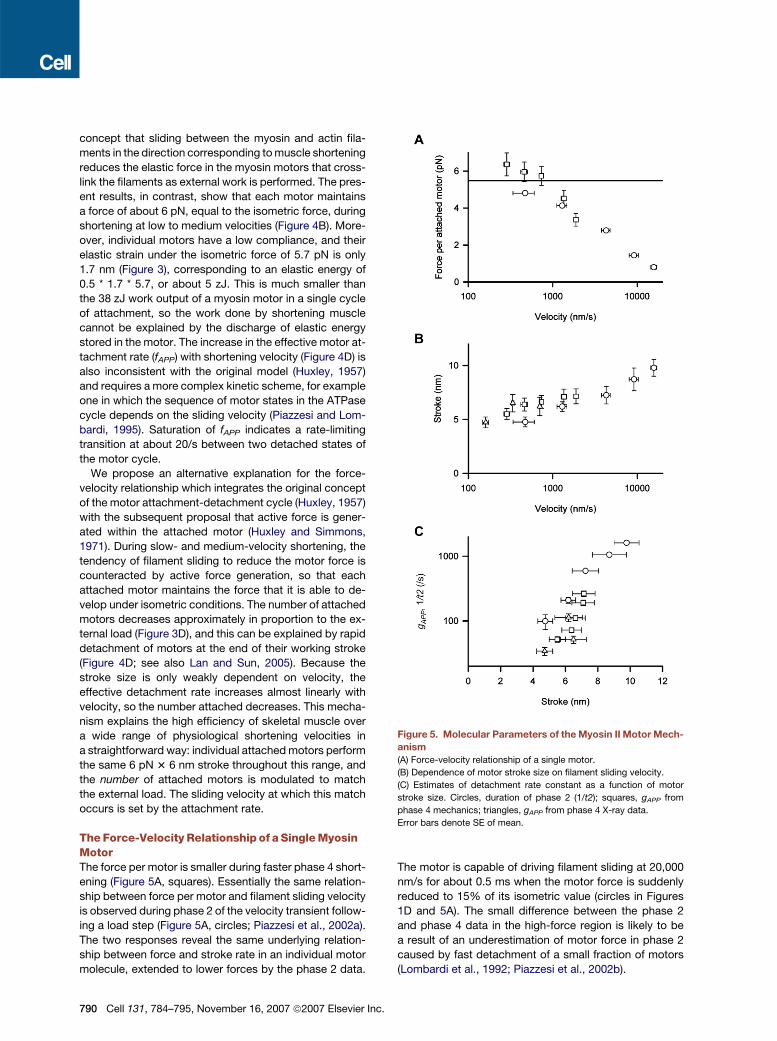
The Force-Velocity Relationship of a Single MyosinMotorThe force per motor is smaller during faster phase 4 short-
ening (Figure 5A, squares). Essentially the same relation-
ship between force per motor and filament sliding velocity
is observed during phase 2 of the velocity transient follow-
ing a load step (Figure 5A, circles; Piazzesi et al., 2002a).
The two responses reveal the same underlying relation-
ship between force and stroke rate in an individual motor
molecule, extended to lower forces by the phase 2 data.
790 Cell 131, 784–795, November 16, 2007 ª2007 Elsevier Inc
The motor is capable of driving filament sliding at 20,000
nm/s for about 0.5 ms when the motor force is suddenly
reduced to 15% of its isometric value (circles in Figures
1D and 5A). The small difference between the phase 2
and phase 4 data in the high-force region is likely to be
a result of an underestimation of motor force in phase 2
caused by fast detachment of a small fraction of motors
(Lombardi et al., 1992; Piazzesi et al., 2002b).
Figure 5. Molecular Parameters of the Myosin II Motor Mech-
anism
(A) Force-velocity relationship of a single motor.
(B) Dependence of motor stroke size on filament sliding velocity.
(C) Estimates of detachment rate constant as a function of motor
stroke size. Circles, duration of phase 2 (1/t2); squares, gAPP from
phase 4 mechanics; triangles, gAPP from phase 4 X-ray data.
Error bars denote SE of mean.
.
The decrease in motor force at filament sliding velocities
greater than about 1000 nm/s (Figure 5A) reflects the finite
speed of the working stroke responsible for force genera-
tion in the actin-attached motor (Huxley and Simmons,
1971; Piazzesi et al., 2002a). The force per motor falls to
about half its isometric value at a filament sliding velocity
of ca 3000 nm/s, which is the velocity during phase 4
shortening against zero load. The intrinsic speed of the
motor stroke is therefore well matched to its physiological
function.
The Size of the Motor Stroke In SituA comparison of the stroke amplitudes in phases 2 and 4
provides further support for this molecular explanation of
the force-velocity relationship. The phase 2 stroke is mea-
sured as the initial transient shortening of the half-sarco-
mere in the first few milliseconds after a sudden force
decrease that synchronizes the motor strokes (Figure 1C;
Piazzesi et al., 2002a), and is about 6 nm at high motor
force (low velocity) and about 10 nm at low motor force
(high velocity) (Figure 5B, circles), in agreement with previ-
ous structural estimates based on RM3 (Reconditi et al.,
2004). The motor stroke during steady phase 4 shortening,
defined as the extent of filament sliding over which the mo-
tor remains attached to actin, and calculated from either
mechanical data (Figure 5B, squares) or RM3 and IM3
(Figure 5B, triangles), ranges from 5 to 7 nm. All these es-
timates of stroke size are in reasonable agreement, over
the whole range of filament sliding velocity in either phase
2 or phase 4, and therefore over the whole range of force
per motor (Figure 5A). The stroke size of the myosin II motor
increases gradually by a factor of about two, from ca 5 to
10 nm, as the filament sliding velocity increases by two
orders of magnitude, from ca 200 nm/s to 20,000 nm/s
(Figure 5B).
Slightly larger estimates of stroke size in the low-veloc-
ity region, 7.5 nm at ca 100 nm/s and 10.0 nm at ca
1000 nm/s, were recently determined from measurements
of RM3 and IM3 during steady shortening in whole muscles
(Huxley et al., 2006b). Phases 2 and 4 cannot be resolved
in that preparation, and there were several other differ-
ences in experimental protocols, temperature, and analy-
sis between the whole-muscle and our single-cell studies.
In particular, Huxley et al. estimated stroke size primarily
from the axial dispersion of the attached motors, whereas
we estimated it from the mean axial displacement. The
small differences in the stroke size estimates from the
two studies are likely to be due to these methodological
differences.
This dependence of the stroke size of skeletal muscle
myosin on sliding velocity (Figure 5B) and consequently
on motor force (Figure 5A) is a fundamental characteristic
of the myosin II motor mechanism. It is also a generic
property of models in which the stroke is a result of a tran-
sition from one actin-attached state to another with lower
free energy that is coupled to increased strain of an elastic
element (Huxley and Simmons, 1971). In this paradigm,
the effective stroke is reduced at high motor force
C
because the energy required to stretch the elastic element
reduces the equilibrium constant of the transition (Piazzesi
et al., 2002a; Decostre et al., 2005). Quantitative analysis
of this mechanism suggests that there must be more
than two actin-attached states (Huxley and Simmons,
1971; Huxley and Tideswell, 1996), and the present results
provide strong support for this requirement. Because the
compliance of a single motor is 0.3 nm/pN, the energy re-
quired to extend the motor compliance in a single 10 nm
stroke is 170 zJ, which is double the free energy available
from ATP hydrolysis. This consideration makes any motor
mechanism based on a single 10 nm stroke extremely un-
likely, and shows that the 10 nm stroke observed at low
load must be composed of a series of substrokes. The
ca 6 nm stroke at high load can then be understood as
a consequence of detachment from actin from an interme-
diate state in the series. A similar conclusion was derived
previously from a theoretical analysis of the phase 4 force-
velocity relationship in terms of the Huxley-Simmons for-
malism (Piazzesi and Lombardi, 1995).
The Rate of Motor Detachment from Actin IsControlled by Motor ConformationThe weak dependence of motor stroke size on filament
sliding velocity as the latter is varied over two orders of
magnitude (Figure 5B) implies that the effective rate con-
stant for detachment of the motor from actin is primarily
determined by the extent of progress of the motor through
its stroke. The effective detachment rate constant (gAPP)
during steady phase 4 shortening is velocity divided by
stroke size (Figure 4D). gAPP determined from either me-
chanical (Figure 5C, squares) or X-ray data (triangles)
has a very steep dependence on stroke size. The corre-
sponding detachment rate during phase 2 shortening can-
not be determined by this approach because phase 2 is
not a steady state, but an upper limit can be estimated
as the reciprocal of the phase 2 duration (Figure 5C;
1/t2, circles), which shows a steep dependence on stroke
size similar to that of gAPP. Again, the phase 2 and 4 data
point to the same underlying molecular mechanism, in
which detachment of the motor from actin depends
strongly on its progress through the stroke, and therefore
on the conformation of the motor. The motor detaches
from actin more quickly during faster shortening against
a low filament load because it reaches the critical confor-
mation for detachment more quickly.
The general concept that the motor detaches from actin
only after performing useful work is closely related to its
high efficiency (Huxley, 1957; Nyitrai and Geeves, 2004).
In principle, the detachment rate might be controlled
directly by the motor conformation (e.g., Lan and Sun,
2005), or by its load or elastic strain (e.g., Veigel et al.,
2003; Takagi et al., 2006), and these two parameters are
coupled in some theoretical formalisms. The present
results show that the detachment rate varies by almost
an order of magnitude during phase 4 shortening at slow
to medium velocity while the force per motor is roughly
constant (Figures 4B and 4D), which is inconsistent with
ell 131, 784–795, November 16, 2007 ª2007 Elsevier Inc. 791
models in which the detachment rate is directly controlled
by motor load or elastic strain. The results described above
(Figure 5C) demonstrate that the detachment rate is spe-
cifically and directly controlled by motor conformation.
Relationship of the In Situ Stroke Sizeto Crystallographic StructuresX-ray crystallographic and electron microscopy studies of
myosin fragments and their actin-bound complexes have
revealed structural details of the motor mechanism in rela-
tion to its ATP hydrolysis cycle (Lymn and Taylor, 1971;
Rayment et al., 1993a, 1993b; Dominguez et al., 1998;
Holmes et al., 2003; Geeves and Holmes, 2005). The major
structural change in the motor is a bend between its cata-
lytic and light-chain domains, and this is associated with
the release of the ATP hydrolysis products ADP and phos-
phate (Pi) from the active site of myosin, between the so-
called pre-power stroke and rigor-like states. Although the
structure of the actin-bound myosin-ADP-Pi complex has
not been determined, it seems likely that in this state the
catalytic domain would bind to actin as in the rigor-like
state and, if so, tilting of the light-chain domain on release
of the hydrolysis products would displace its distal end
along the filament axis by 10–12 nm. This would produce
a stroke size similar to that observed in situ when the
motor load is suddenly reduced to very low values (Huxley
and Simmons, 1971; Piazzesi et al., 2002a; Reconditi
et al., 2004) and described above (Figure 5B). No interme-
diate states that might correspond to substrokes of the
actin-attached motor have been identified by crystallo-
graphic studies of motor fragments in the absence of
actin. However, these substates are likely to be both
dynamic and significantly populated only under strain, in
which case they would be effectively undetectable by cur-
rent in vitro structural techniques.
Relation to In Vitro Mechanical Studiesof the Myosin MotorIn vitro functional studies of single motor proteins have
been particularly successful for motors like kinesin and
myosin V that work as isolated molecules in the cellular
environment. Muscle myosin II, in contrast, is designed
to work within a quasi-crystalline ensemble, making it
more difficult to compare the results of single-molecule
and cell-level studies of myosin II. Moreover, the stroke
rate of this myosin is ca 1000/s, which is too fast to be
resolved or controlled by current single-molecule tech-
niques, although these methods have demonstrated
a load-dependent detachment rate for the much slower
myosin II from smooth muscle (Veigel et al., 2003).
In the present work, we derived the molecular proper-
ties of skeletal muscle myosin II from high-resolution
structural and functional studies of single muscle cells,
under the working hypothesis that there are no unknown
protein factors or phenomena contributing to the cellular
responses. Where direct comparisons can be made, the
in situ results are consistent with the in vitro properties
of isolated muscle myosin II, supporting the working
792 Cell 131, 784–795, November 16, 2007 ª2007 Elsevier Inc
hypothesis. Thus, for example, mechanical studies on sin-
gle molecules of muscle myosin II and its fragments have
generally been interpreted in terms of a single working
stroke of 5–6 nm at low motor load (Molloy et al., 1995;
Tyska et al., 1999; Ruff et al., 2001; Steffen et al., 2001),
and a recent analysis (Sleep et al., 2006) suggests that
those studies may have underestimated the stroke size
by a factor of two, which would make the in vitro mechan-
ical estimates of the low-load stroke size 10–12 nm, in
agreement with both the in vitro structural studies de-
scribed above and the in situ values measured in the pres-
ent work. Neither the high-load stroke nor the isometric
force have been measured for single molecules of myosin
II from skeletal muscle, but the average force at the end of
single interactions under dynamic force feedback with a 1
ms time constant was ca 5 pN (Takagi et al., 2006), similar
to the isometric force measured here. The rate of the my-
osin II stroke has not been measured in vitro.
The detachment rate of myosin II from actin in vitro is
very much slower than the corresponding rate in situ at
low load, about 1500/s (Figures 5A and 5C), because the
ATP concentrations used in vitro are orders of magnitude
smaller than the physiological value, so that motor detach-
ment becomes limited by the rate of ATP binding. How-
ever, a recent in vitro study of fast myosin II from mouse
muscle at 22�C (Capitanio et al., 2006) identified two com-
ponents of the working stroke, the first of which was asso-
ciated with a rate constant of 1200/s that was independent
of ATP concentration, and might limit the rate of motor
detachment at physiological [ATP]. This rate constant is
close to that observed at low motor load in situ, and
may reflect the same biochemical transition in the myosin
II motor, most likely associated with ADP release from its
active site.
The present results show that the fundamental determi-
nant of muscle performance at the cellular level, the force-
velocity relationship, can be understood at the level of the
individual myosin II molecule. The organization of myosin
II motors into ordered cellular ensembles allows physio-
logical modulation of the number of motors attached to
actin as a function of the filament load, which in turn allows
individual motors to work at high force and efficiency
against a wide range of external loads. Several fundamen-
tal properties of the myosin II motor reported here, includ-
ing its isometric force, compliance, stroke dynamics, and
detachment kinetics, can at present be measured only in
situ. The general features of the myosin II motor mecha-
nism described above, including the existence of sub-
strokes and the control of detachment rate by motor con-
formation, are likely to be shared by other motor proteins.
EXPERIMENTAL PROCEDURES
Muscle Fibers and Mechanical Measurements
Single intact fibers were dissected from tibialis anterior muscles of
frogs (Rana temporaria) that had been cooled to 2�C–4�C and killed
by decapitation followed by destruction of the spinal cord. Fibers
were mounted in Ringer’s solution at 4�C and sarcomere length 2.1 mm
between a capacitance force transducer and a loudspeaker-coil motor
.
(Lombardi and Piazzesi, 1990). Sarcomere length in a 1–1.5 mm fiber
segment was measured continuously with a striation follower (Huxley
et al., 1981). Fibers were stimulated every 4 min at 18–25 Hz via elec-
trodes parallel to the fiber axis, for 0.4–2.3 s depending on the proto-
col. Force developed at constant fiber length and was clamped at
the plateau level 240 ms after the first stimulus. Force steps were
imposed 20 ms later. Force feedback parameters were optimized for
each fiber and force-step amplitude. Force steps were complete in
about 120 ms. The duration of phase 2 of the velocity transient following
a force step (t2) was measured from the start of the step to the mini-
mum value of the X-ray intensity ratio RM3 (see Figure 2b of Reconditi
et al., 2004). The extent of filament sliding in this period is L2 but part of
this, sfil.DT, is a result of the elasticity of the myosin and actin filaments,
where sfil is the filament strain during isometric contraction (3.2 nm;
Figure 3) and DT is the decrease in force during the load step as a frac-
tion of the isometric force. The size of the phase 2 stroke was therefore
estimated as (L2� sfil.DT) and the filament sliding velocity in phase 2 as
(L2 � sfil.DT)/t2.
Fiber compliance during steady shortening against different loads
was measured in Florence by imposing 4 kHz length oscillations, �2
nm/half-sarcomere (hs) peak to peak, at the isometric tetanus plateau
and after 40 nm/hs of steady shortening at 0.2�2 mm/hs/s. Elastic and
viscous components of complex compliance were determined by
Fourier analysis of force and sarcomere length sampled at 200 kHz.
Viscous stiffness was less than 1% of elastic stiffness. Fiber cross-
sectional area was 20,000 ± 3,000 mm2 (SD, n = 4 fibers).
To induce the rigor state, intact fibers were transferred to Ringer’s
solution containing 20 mM butanedione monoxime (BDM), cooled to
1�C, and then 1 mM iodoacetic acid, 5.6 mM 2,4-dinitrofluorobenzene,
and 1 mM sodium azide were added. After rigor induction was com-
plete, as determined by stiffness measurements, fibers were returned
to Ringer’s solution with BDM, then to Ringer’s solution. This protocol
maintained sarcomere order, cell-membrane integrity, and strong ten-
don attachments.
X-Ray Data Collection
Fibers were mounted vertically in Ringer’s solution at 4�C between
mica windows carrying the stimulating electrodes, 600 mm apart on ei-
ther side of the fiber, at the BioCAT beamline of the Advanced Photon
Source (Irving et al., 2000b). Fiber cross-sectional area was 20,000 ±
7,000 mm2 (SD, n = 15 fibers) and isometric force (T0) was 240 kPa.
X-ray exposure was controlled by two electromagnetic shutters in tan-
dem, and monitored with 10 ms resolution using a pin diode. The wave-
length was 0.1 nm and the maximum X-ray flux at the fiber was ca
2.1013 photons/s. The beam was attenuated for fiber alignment. Radi-
ation damage was minimized by translating the fiber vertically between
X-ray exposures by ca 100 mm. Data were typically collected from
about 40 activations without effect on fiber function. X-ray diffraction
patterns were collected on a cooled CCD detector (Phillips et al.,
2002) mounted 2.5 m from the fiber. The 7000 vertical pixels were
binned by two and the 4000 horizontal pixels by 32 before readout.
The X-ray beam was focused at the detector with full width half
maximum (FWHM) 50–80 mm vertically and 150 mm horizontally. The
FWHM of the vertical point-spread function was 65 mm.
Experimental Protocols
X-ray data were collected at the end of phase 2 of the load-step re-
sponse, at the end of phase 3, and at different times during phase 4.
For phase 2 and phase 3, data from a series of load release/restretch
cycles of period 50–100 ms were accumulated on the CCD (Reconditi
et al., 2004). X-ray exposure time was 0.25–2 ms for phase 2 and 0.5–5
ms for phase 3, depending on the load. The restretch time was also ad-
justed according to the duration of phase 2 or 3 at the different loads.
During phase 4, data were collected at times corresponding to short-
ening of about 20, 30, and 40 nm/hs, and X-ray exposure was 2.5 ms
for load steps to 0.14 and 0.25 T0, 5 ms for 0.5 and 0.75 T0, and 10 ms
for 0.88 T0. X-ray data were also recorded from tetani with the same
C
protocols but without imposed length steps, and in 5 ms windows at
260 ms in separate isometric tetani. There were no significant differ-
ences between these two isometric patterns.
X-Ray Data Analysis
Diffraction patterns were dark-corrected, and then centered and
aligned using the M3 and equatorial 1,1 reflections. The distribution
of diffracted intensity along the vertical axis of the X-ray pattern, paral-
lel to the muscle fiber axis, was calculated by integrating the 2D data
from 0.017/nm on either side of the axis. Background intensity was
subtracted after straight-line or smooth convex hull fitting. The interfer-
ence components of each reflection were extracted by fitting multiple
Gaussian peaks to the vertical intensity distribution. The total reflection
intensity was calculated as the sum of the component peaks, and the
spacing as the weighted mean of the component peaks, calibrated by
that of the M3 reflection in an isometric tetanus, 14.573 nm (Linari et al.,
2000). X-ray data analysis used the software packages Fit2D (A. Ham-
mersley, European Synchrotron Radiation Facility) and Peakfit (SPSS
Science).
Supplemental Data
Supplemental Data include one figure and can be found with this arti-
cle online at http://www.cell.com/cgi/content/full/131/4/784/DC1/.
ACKNOWLEDGMENTS
This work was supported by Ministero dell’Universita e della Ricerca
(Italy), National Institutes of Health grant R01AR049033.03 (USA), the
Medical Research Council (UK), and the European Union (EU-HPRN-
CT-2000-00091). Use of the Advanced Photon Source was supported
by the U.S. Department of Energy, Basic Energy Sciences, Office of
Science, under contract W-31-109-ENG-38. BioCAT is a National
Institutes of Health-supported research center, grant RR-08630. We
thank A. Aiazzi and M. Dolfi for mechanical and electronics support.
Received: February 19, 2007
Revised: June 8, 2007
Accepted: September 27, 2007
Published: November 15, 2007
REFERENCES
Barclay, C.J. (1998). Estimation of cross-bridge stiffness from maxi-
mum thermodynamic efficiency. J. Muscle Res. Cell Motil. 19, 855–
864.
Capitanio, M., Canepari, M., Cacciafesta, P., Lombardi, V., Cicchi, R.,
Maffei, M., Pavone, F.S., and Bottinelli, R. (2006). Two independent
mechanical events in the interaction cycle of skeletal muscle myosin
with actin. Proc. Natl. Acad. Sci. USA 103, 87–92.
Cooke, R. (1997). Actomyosin interaction in striated muscle. Physiol.
Rev. 77, 671–697.
Cooke, R., and Franks, K. (1980). All myosin heads form bonds with
actin in rigor rabbit skeletal muscle. Biochemistry 19, 2265–2269.
Craig, R. (1977). Structure of A-segments from frog and rabbit skeletal
muscle. J. Mol. Biol. 109, 69–81.
Dawson, M.J., Gadian, D.G., and Wilkie, D.R. (1978). Muscular fatigue
investigated by phosphorus nuclear magnetic resonance. Nature 274,
861–866.
Decostre, V., Bianco, P., Lombardi, V., and Piazzesi, G. (2005). Effect
of temperature on the working stroke of muscle myosin. Proc. Natl.
Acad. Sci. USA 102, 13927–13932.
Dobbie, I., Linari, M., Piazzesi, G., Reconditi, M., Koubassova, N., Fer-
enczi, M.A., Lombardi, V., and Irving, M. (1998). Elastic bending and
active tilting of myosin heads during muscle contraction. Nature 396,
383–387.
ell 131, 784–795, November 16, 2007 ª2007 Elsevier Inc. 793
Dominguez, R., Freyzon, Y., Trybus, K.M., and Cohen, C. (1998). Crys-
tal structure of a vertebrate smooth muscle myosin motor domain and
its complex with the essential light chain: visualization of the pre-power
stroke state. Cell 94, 559–571.
Ford, L.E., Huxley, A.F., and Simmons, R.M. (1977). Tension re-
sponses to sudden length change in stimulated frog muscle fibres
near slack length. J. Physiol. 269, 441–515.
Geeves, M.A., and Holmes, K.C. (2005). The molecular mechanism of
muscle contraction. Adv. Protein Chem. 71, 161–193.
Hanson, J., and Huxley, H.E. (1953). Structural basis of the cross-stri-
ations in muscle. Nature 172, 530–532.
Holmes, K.C. (1997). The swinging lever-arm hypothesis of muscle
contraction. Curr. Biol. 7, R112–R118.
Holmes, K.C., Angert, I., Kull, F.J., Jahn, W., and Schroder, R.R. (2003).
Electron cryomicroscopy shows how strong binding of myosin to actin
releases nucleotide. Nature 425, 423–427.
Huxley, A.F. (1957). Muscle structure and theories of contraction.
Prog. Biophys. Biophys. Chem. 7, 255–318.
Huxley, H.E. (1969). The mechanism of muscle contraction. Science
164, 1356–1366.
Huxley, H.E., and Brown, W. (1967). The low-angle X-ray diagram of
vertebrate striated muscle and its behaviour during contraction and
rigor. J. Mol. Biol. 30, 383–434.
Huxley, A.F., and Simmons, R.M. (1971). Proposed mechanism of
force generation in striated muscle. Nature 233, 533–538.
Huxley, A.F., and Tideswell, S. (1996). Filament compliance and ten-
sion transients in muscle. J. Muscle Res. Cell Motil. 17, 507–511.
Huxley, A.F., Lombardi, V., and Peachey, L.D. (1981). A system for fast
recording of longitudinal displacement of a striated muscle fibre. J.
Physiol. 317, 12P–13P.
Huxley, H.E., Simmons, R.M., Faruqi, A.R., Kress, M., Bordas, J., and
Koch, M.H.J. (1983). Changes in the X-ray reflections from contracting
muscle during rapid mechanical transients and their structural implica-
tions. J. Mol. Biol. 169, 469–506.
Huxley, H.E., Stewart, A., Sosa, H., and Irving, T. (1994). X-ray diffrac-
tion measurements of the extensibility of actin and myosin filaments in
contracting muscle. Biophys. J. 67, 2411–2421.
Huxley, H.E., Reconditi, M., Stewart, A., and Irving, T.C. (2006a). X-ray
interference studies of crossbridge action in muscle contraction: evi-
dence from quick releases. J. Mol. Biol. 363, 743–761.
Huxley, H.E., Reconditi, M., Stewart, A., and Irving, T.C. (2006b). X-ray
interference studies of crossbridge action in muscle contraction: evi-
dence from muscles during steady shortening. J. Mol. Biol. 363,
762–772.
Irving, M., Piazzesi, G., Lucii, L., Sun, Y.-B., Harford, J.J., Dobbie, I.M.,
Ferenczi, M.A., Reconditi, M., and Lombardi, V. (2000a). Conformation
of the myosin motor during force generation in skeletal muscle. Nat.
Struct. Biol. 7, 482–485.
Irving, T.C., Fischetti, R., Rosenbaum, G., and Bunker, G.B. (2000b).
Fibre diffraction using the BioCAT undulator beamline at the Advanced
Photon Source. Nucl. Instrum. Methods Phys. Res. A 448, 250–254.
Lan, G., and Sun, S.X. (2005). Dynamics of myosin-driven skeletal
muscle contraction: 1. Steady-state force generation. Biophys. J. 88,
4107–4117.
Linari, M., and Woledge, R.C. (1995). Comparison of energy output
during ramp and staircase shortening in frog muscle fibres. J. Physiol.
487, 699–710.
Linari, M., Dobbie, I., Reconditi, M., Koubassova, N., Irving, M., Piaz-
zesi, G., and Lombardi, V. (1998). The stiffness of skeletal muscle in
isometric contraction and rigor: the fraction of myosin heads bound
to actin. Biophys. J. 74, 2459–2473.
794 Cell 131, 784–795, November 16, 2007 ª2007 Elsevier Inc
Linari, M., Piazzesi, G., Dobbie, I., Koubassova, N., Reconditi, M., Nar-
ayanan, T., Diat, O., Irving, M., and Lombardi, V. (2000). Interference
fine structure and sarcomere length dependence of the axial X-ray pat-
tern from active single muscle fibers. Proc. Natl. Acad. Sci. USA 97,
7226–7231.
Lombardi, V., and Piazzesi, G. (1990). The contractile response during
steady lengthening of stimulated frog muscle fibres. J. Physiol. 431,
141–171.
Lombardi, V., Piazzesi, G., and Linari, M. (1992). Rapid regeneration of
the actin-myosin power stroke in contracting muscle. Nature 355, 638–
641.
Lymn, R.W., and Taylor, E.W. (1971). Mechanism of adenosine triphos-
phate hydrolysis by actomyosin. Biochemistry 10, 4617–4624.
Molloy, J.E., Burns, J.E., Kendrick-Jones, J., Tregear, R.T., and White,
D.C. (1995). Movement and force produced by a single myosin head.
Nature 378, 209–212.
Nyitrai, M., and Geeves, M. (2004). ADP and strain sensitivity in myosin
motors. Philos. Trans. R. Soc. Lond. B Biol. Sci. 359, 1867–1877.
Phillips, W.C., Stewart, A., Stanton, M., Naday, I., and Ingersoll, C.
(2002). High-sensitivity CCD-based X-ray detector. J. Synchrotron
Radiat. 9, 36–43.
Piazzesi, G., and Lombardi, V. (1995). A cross-bridge model that is able
to explain mechanical and energetic properties of shortening muscle.
Biophys. J. 68, 1966–1979.
Piazzesi, G., Reconditi, M., Dobbie, I., Linari, M., Boesecke, P., Diat,
O., Irving, M., and Lombardi, V. (1999). Changes in conformation of
myosin heads during the development of isometric contraction and
rapid shortening in single frog muscle fibres. J. Physiol. 514, 305–312.
Piazzesi, G., Lucii, L., and Lombardi, V. (2002a). The size and the
speed of the working stroke of muscle myosin and its dependence
on the force. J. Physiol. 545, 145–151.
Piazzesi, G., Reconditi, M., Linari, M., Lucii, L., Sun, Y.-B., Narayanan,
T., Boesecke, P., Lombardi, V., and Irving, M. (2002b). Mechanism of
force generation by myosin heads in skeletal muscle. Nature 415,
659–662.
Rayment, I., Rypniewski, W., Schmidt-Base, K., Smith, R., Tomchick,
D.R., Benning, M.M., Winkelmann, D.A., Wesenberg, G., and Holden,
H.M. (1993a). Three-dimensional structure of myosin subfragment-1:
a molecular motor. Science 261, 50–58.
Rayment, I., Holden, H.M., Whittaker, M., Yohn, C.B., Lorenz, M.,
Holmes, K.C., and Milligan, R.A. (1993b). Structure of the actin-
myosin complex and its implications for muscle contraction.
Science 261, 58–65.
Reconditi, M. (2006). Recent improvements in small angle X-ray dif-
fraction for the study of muscle physiology. Rep. Prog. Phys. 69,
2709–2759.
Reconditi, M., Linari, M., Lucii, L., Stewart, A., Sun, Y.-B., Boesecke,
P., Narayanan, T., Fischetti, R.F., Irving, T., Piazzesi, G., et al. (2004).
The myosin motor in muscle generates a smaller and slower working
stroke at higher load. Nature 428, 578–581.
Ruff, C., Furch, M., Brenner, B., Manstein, D.J., and Meyhofer, E.
(2001). Single-molecule tracking of myosins with genetically engi-
neered amplifier domains. Nat. Struct. Biol. 8, 226–229.
Sleep, J.A., Lewalle, A., and Smith, D. (2006). Reconciling the working
strokes of a single head of skeletal muscle myosin estimated from la-
ser-trap experiments and crystal structures. Proc. Natl. Acad. Sci.
USA 103, 1278–1282.
Smith, D.A., Steffen, W., Simmons, R.M., and Sleep, J.A. (2001). Hid-
den-Markov methods for the analysis of single-molecule actomyosin
displacement data: the variance-Hidden-Markov method. Biophys.
J. 81, 2795–2816.
.
Steffen, W., Smith, D.A., Simmons, R.M., and Sleep, J.A. (2001). Map-
ping the actin filament with myosin. Proc. Natl. Acad. Sci. USA 98,
14949–14954.
Takagi, Y., Homsher, E.E., Goldman, Y.E., and Shuman, H. (2006).
Force generation in single conventional actomyosin complexes under
high dynamic load. Biophys. J. 90, 1295–1307.
Tyska, M.J., Dupuis, D.E., Guilford, W.H., Patlak, J.B., Waller, G.S.,
Trybus, K.M., Warshaw, D.M., and Lowey, S. (1999). Two heads of my-
osin are better than one for generating force and motion. Proc. Natl.
Acad. Sci. USA 96, 4402–4407.
C
Veigel, C., Bartoo, M.L., White, D.C., Sparrow, J.C., and Molloy, J.E.
(1998). The stiffness of rabbit skeletal actomyosin cross-bridges deter-
mined with an optical tweezers transducer. Biophys. J. 75, 1424–1438.
Veigel, C., Molloy, J.E., Schimtz, S., and Kendrick-Jones, J. (2003).
Load-dependent kinetics of force production by smooth muscle myo-
sin measured with optical tweezers. Nat. Cell Biol. 5, 980–986.
Wakabayashi, K., Sugimoto, Y., Tanaka, H., Ueno, Y., Takezawa, Y.,
and Amemiya, Y. (1994). X-ray diffraction evidence for the extensibility
of actin and myosin filaments during muscle contraction. Biophys. J.
67, 2422–2435.
ell 131, 784–795, November 16, 2007 ª2007 Elsevier Inc. 795


