Embed Size (px)
Citation preview

Floating Foundations ofHigher Education PolicyJeroen Huisman, Frans Kaiser and Hans Vossensteyn,University of Twente
Introduction
In many higher education policy documents an important place isreserved for the level of (or rate of) participation. This pre-occupationhas two main causes. The first one is rather straightforward: the morestudents who enrol in higher education, the more – public – resourceshave to be devoted to higher education. High participation rates cantherefore be a burden for the governmental budget (NationalCommittee of Inquiry into Higher Education, 1997). The secondreason for this pre-occupation is based on the expectation that a highlevel of participation will lead to a highly skilled labour force, whichoften is related to the competitive power of national economies. Thisexpectation has become particularly important since the late 1970s(Teichler, 1989).
Since participation has become one of the major topics of nationalhigher education policies, governments have developed many strategieseither to increase or – if necessary – to control participation rates. Themajor steering instruments of governments referred to in literature andpolicy documents concern selection, diversity and financial incentives forstudents (Fulton, 1989; Kaiser and De Weert, 1994). Diversity policiesaim at enlarging the range of choices available for students. As Stadtman(1980) argued, diversity in that respect makes higher education availableto virtually everyone. Admission policies aim at regulating enrolment, interms of the qualifications required, the capacity of institutions andfulfilling the needs of the labour market. As Fulton and Elwood (1989)stated, selection procedures concern the features that determine thefeasibility of widening access. Finally, limiting the financial barrierswhich may prevent people from entering higher education is regarded asan instrument to increase the affordability of higher education. Unequalaccess to the means of financing a college education is still regarded as
Higher Education Quarterly, 0951–5224Volume 54, No. 3, July 2000, pp 217–238
Blackwell Publishers Ltd. 2000, 108 Cowley Road, Oxford OX4 1JF, UKand 350 Main Street, Malden, MA 02148, USA.
a problem generating unequal opportunities to participate in highereducation (Clotfelter et al., 1991).
Governmental policies are not the sole forces impacting participationrates. Other factors, largely unrelated to governmental policies, such asthe incorporation of new scientific fields and increasing consumer bene-fits (e.g. Papadopoulos, 1994), may be of equal importance.Nevertheless, governments actively want to influence participation ratesand are more or less limited to the three major instruments mentionedabove. It is clear from most policies that, irrespective of the systemsconcerned, there is a set of common assumptions underlying these poli-cies. The assumptions express the general beliefs that the rate of partic-ipation can be positively influenced through increasing the level ofinstitutional and programmatic diversity of the system, through increas-ing the affordability of attending higher education (either by reducingthe costs or by increasing the benefits), and through making admissionto higher education less selective.
However, a striking finding is that most of these assumptions havehardly been tested empirically. The question we are interested in is towhat extent empirical proof can be found for them. In other words, dodiversity, affordability and selection have an impact on the highereducation participation rate? In this article we make a first attempt totest these three – commonly accepted – assumptions. In drawing up our‘model’, we start from an international comparative perspective, basedon already existing material. This implies that the analysis will takeplace at the level of countries, the macro level.
We structure the paper as follows. First, we elaborate upon the threeassumptions. Second, we operationalise and measure the main conceptsor variables: rate of participation, diversity, selectivity and affordability.Third, we ‘test’ the tentative policy expectations through a comparativeanalysis of a number of Western European higher education systems.Fourth and finally, we reflect on the strength of the expectations and theimplication of the empirical findings for policy making.
Three Assumptions
First, a high level of diversity is presumed to be a requirement for a highlevel of participation. It is often assumed – by both researchers andpolicy-makers – that the larger the variety of institutions, the morechoices available for those eligible for higher education, and the greaterthe chances that a potential student will select an institution and studyprogramme that fits his or her needs.
218 Higher Education Quarterly
Blackwell Publishers Ltd. 2000
The work of Trow on the transition from elite to mass higher educa-tion has been of particular influence on thinking in Western Europe onthe relation between diversity (both within and between institutions)and the level of participation. Trow (1972) predicted that Europeanhigher education systems would follow the American model of transi-tion to a mass (and highly diversified) higher education system. In fact,he suggested that growth towards massification was dependent ongreater diversity. In more recent publications, he qualified the proposi-tion by suggesting that greater diversity was one of the factors of influ-ence (Trow, 1979).
In policy papers in many countries the expectation that a certain levelof diversity is necessary to cope with the increasing variety of demands ishighlighted many times. In Finland and Austria, this argument was usedto champion the introduction of a new higher education sector. Accordingto the policy-makers, the development of the new sector would increasethe institutional and programmic diversity, and therefore potentially attractlarger proportions of the age cohort and consequently increase the level ofparticipation. It must be added that the new sectors were not introducedsolely to increase participation ratios. Other arguments, such as over-crowded universities, high drop-out rates, demands from the labourmarket, etc., were also used to defend the policy measures.
The second assumption deals with the relationship between partici-pation and the costs of attending higher education for the individualstudent. The literature on the economics of education applies the prin-ciples of demand theory to education. Based on the idea that the quan-tity of a particular good demanded is a function of its relative price (inrelation to its relative pay-off), it is assumed that enrolment rates will benegatively associated with prices charged to students, particularlytuition fees. On the contrary, it can be expected that enrolment rateswill be positively associated with cost reductions, particularly throughoffering student financial support (Leslie and Brinkman, 1987). Manystudies have been conducted to investigate the influence of studentsupport and tuition policies on participation. Heller (1997) provides arather extensive overview of the American studies in this field andcomes to the conclusion that (potential) students to some extent areprice responsive.
In addition, public policy in many countries – e.g. Australia, theNetherlands and the United Kingdom – is concerned with keepinghigher education affordable in times of mass-higher education, inparticular through providing financial arrangements for students frompoor families.
Floating Foundations of HE Policy 219
Blackwell Publishers Ltd. 2000

The third assumption is rather straightforward. It says that the moreselective a system is, the lower the participation ratio will be. The selec-tivity of a higher education system has to do with the proportion of theapplicants that are admitted to higher education or to specific parts ofthe higher education system. Admission systems are applied to highereducation for different kinds of reasons. In these times of growingdemand for higher education and a limited capacity to take up newentrants, the major role of admission systems is to manage the admis-sions process in such a way as to ensure the best possible match betweenstudents and programmes in order to eliminate as far as possiblewastage caused by students leaving their studies (Scott, 1996). In addi-tion, admission systems are used to facilitate the process of metamor-phosis from applicant to student, and let this happen in a cost effectiveand transparent way. Furthermore, admission and selection systems areused for adjusting the intake of students to the needs of the labourmarket. These kind of reasons often show up in discussions and policypapers regarding this issue, e.g. in Belgium (Flanders) and theNetherlands.
Participation
In international debates, two different types of rates of participation areused. These two types, the gross and the net rate of participation, differfundamentally from each other. The gross rate of participation takestotal enrolment in higher education and divides it by a reference group(the population within a certain fixed range of age). The best knowngross rate of participation is published by UNESCO. The referencegroup used is 18–22 or 19–23 years olds. Although the results (see table1) are used frequently in policy documents, there are some critics of thismethod. Because of the fixed reference group, the scores do not takeinto account the differences in age-structure of the student populationbetween countries (especially the differences in the proportion ofmature students). Furthermore, this indicator is sensitive to fluctuationsin demographics like birth waves, especially if they are differently timedin different countries.
The net rate of participation is a way to deal with these problems.Here, enrolment at age X is divided by population of age X. The scoreon this indicator is not one figure but a figure for each age-group.Although such an array of scores gives a more accurate picture of partic-ipation, it is of limited use to policy makers: they are looking for onefigure. In table 2 we present the results of the net rate of participation
220 Higher Education Quarterly
Blackwell Publishers Ltd. 2000

as reported by OECD. Here, the age-groups are clustered in three agebands. This clustering has only a marginal effect on the resulting scores.In an attempt to obtain one figure for the net rate of participation wesummed the scores on the three age bands. These new scores may beused to rank the countries according to their rate of participation inhigher education.
Since the net rate of participation is less sensitive to differences ineducational structure and demographic fluctuations, we use thesescores in the remainder of this article. Before we turn to the level ofdiversity we want to point out a peculiarity of the scores on participa-tion. The differences in the scores between a number of countries arerelatively small. Since we have made some crude modifications to thenet rate of participation, we shall be cautious in ranking the countriesaccording to these scores.
Institutional and Programmatic Diversity
Despite some attempts to define diversity, one of the main shortcom-ings of studies in higher education has been the lack of operationalisa-tion of the concept of diversity (see Huisman, 1995 for an elaboratediscussion). Although institutional diversity has been described in termsof different missions of higher education institutions (e.g. Trow, 1979),or even in terms of structural characteristics, such as governmental(legal) prescriptions defining differences between types of institutions,
Floating Foundations of HE Policy 221
Blackwell Publishers Ltd. 2000
TABLE 1Gross rate of enrolment (in %, age groups 18–22 and 19–23)
Country 1990 1991 1992 1993 1994 1995 1996
Austria 35,2 38,3 40,6 42,5 44,8 46,6 48,0Belgium 40,2 43,0 46,2 49,2 54,4 56,1 57,4Denmark* 36,5 38,7 40,9 44,4 45,0 45,0 46,3Finland* 48,9 52,7 58,7 63,2 66,9 70,3 71,1France 39,6 43,6 46,1 49,6 49,9 51,0 52,2Germany* 33,9 35,0 38,3 40,6 43,0 44,4 45,3Netherlands 39,8 42,2 44,8 48,9 48,0 48,6 50,2Sweden* 32,0 34,6 37,5 39,9 42,5 46,0 48,7United Kingdom 29,1 33,0 38,9 43,4 48,3 49,5 50,4
Source: UNESCO database.*age group 19–23

222H
igher E
du
cation Q
uarterly
B
lackwell P
ublishers Ltd. 2000
TABLE 2Net enrolment in public and private tertiary education (in %, by age group)
1992 1994 1996Age 18–21 22–25 26–29 total 18–21 22–25 26–29 total 18–21 22–25 26–29 Total
Austria 13,1 15,4 9,0 37,5 12,0 13,3 8,0 33,3 16,1 11,6 8,8 36,5Belgium 31,4 9.7 1,7 42,8 37,4 14,7 3,8 55,9 39,6 15,4 4,0 59,0Denmark 9,2 19,9 10,1 39,2 9,1 22,1 10,9 42,1 8,5 23,5 12,1 44,1Finland 15,4 22,5 10,7 48,6 16,6 27,3 12,2 56,1 18,0 29,0 14,0 60,6France 29,0 16,9 4,1 50,0 33,2 17,0 4,6 54,8 36,0 18,6 4,4 59,0Germany 9,7 16,9 10,9 37,5 11,2 17,2 10,3 38,7 10,8 17,2 11,8 39,8Netherlands 20,1 15,9 4,8 40,8 22,1 18,4 6,2 46,7 24,0 19,2 5,4 48,6Sweden 10,6 12,7 6,5 29,8 12,3 15,3 7,2 34,8 13,7 17,9 8,0 39,6United Kingdom 18,0 6,6 2,9 27,5 23,6 8,4 4,4 36,4 26,9 9,4 4,8 41,4
Source: OECD, Education at a Glance, 1993, 1995, 1998.

straightforward operationalisations and empirical measurements are theexception (see Birnbaum, 1983). We, therefore, propose to define rele-vant variables for distinguishing higher education institutions within aspecific higher education system. On the basis of these variables, wedevelop institutional profiles and measure the diversity within thesystems, taking into account the number of institutional profiles and thedispersion of the higher education institutions across the profiles. Inaddition to institutional diversity, we pay attention to a second impor-tant form of variety within higher education systems: programmaticdiversity. With respect to this type of diversity, we focus on the varietyof initial programmes available for secondary school leavers, excludingPh.D. programmes, post-doctoral degrees, etc.
Many classifications use teaching and research-related variables tomake distinctions between institutions. The US Carnegie Classification(Carnegie Foundation, 1994), for instance, uses the level of degreeoffered, the size of the institution, Ph.D. production, research funding,admission restrictions, amount of federal support, number of Master’sdegrees awarded, and the comprehensiveness of the mission. Thisresults in a classification of ten categories of higher education institu-tions: from research universities to associate colleges and specialisedinstitutions. Another example can be found in Australia. The Australiangovernment (Department of Employment, Education and Training,1996) shows the diversity of its higher education system by presentingdata on 68 variables (related to student and staff characteristics,resources, and research features).
To allow for an international comparison, we propose to use thefollowing set of variables to characterise higher education institutions.We stress that we mainly focus on characteristics related to the teachingfunction of higher education; research-related characteristics – nomatter how important – will be ignored. We think this choice is justi-fied, for the relationship between this type of diversity and participationis of central concern.
Size: Institutions may differ considerably in size. The following classesof size (full time student numbers) will be used to categorise institu-tions: 1–100 students, 101–500 students, 501–3000 students,3001–10000 students, and 10001 or more students.
Control: Here we distinguish between institutions under (national)public control, private control (meaning usually religion-based,government-funded institutions), or sub-national control (municipal,regional).
Floating Foundations of HE Policy 223
Blackwell Publishers Ltd. 2000

Disciplines: The (combination of) disciplines offered by the institutionsis an important discriminatory variable. We distinguish agriculture,engineering, economics, education, health, humanities, naturalsciences, and social sciences.
Degrees: From the regulations pertaining to the higher educationsystems, the different – officially recognised – degrees can bededuced.
Programme types: In the system studied, it will be noted whetherprogrammes are organised differently from the full time standard.Alternatives to this standard are part-time programmes, programmesalternating working and learning, and short-cycle higher education.
When for each institution the values of the five variables above areknown, it can be decided how many of the institutions are similar anddissimilar, or in other words, belong to a certain institutional type.Institutions belong to a certain type if and only if they have similarscores on the variables.
To indicate the institutional diversity within the nine higher educa-tion systems analysed, we used two indicators. One indicator is derivedfrom ecology (see e.g. Ludwig and Reynolds, 1988), the field withinbiology focusing on the diversity of life forms. Simpson’s λ gives theprobability that two institutions drawn at random from a population(higher education system) of institutions belong to the same institu-tional type. The indicator can be calculated as follows: λ = 1 – Σpi
2,where pi is the proportional abundance of the ith type of institution.
The second indicator is derived from the work of Birnbaum (1983).He proposed four indicators of diversity of which we take the following:the number of institutional types in a higher education system dividedby the total number of institutions.
Both indicators have values ranging from 0 to 1. The higher the indi-cator, the higher the level of institutional diversity. An example mayexplain the procedure of calculating the indices. Imagine a highereducation system of 25 institutions consisting of 5 institutions of typeA, 8 institutions of type B, 6 institutions of type C, and 6 institutions oftype D. Applying the indicators to the example above, leads to thefollowing results:
λ = 1 – [(5/25)2 + (8/25)2 + (6/25)2 + (6/25)2] = .7424.
Birnbaum’s indicator is: 4/25 = .16.As has been mentioned, in addition to institutional diversity, we focus
on programmatic diversity (P). For this type of variety, we calculate the
224 Higher Education Quarterly
Blackwell Publishers Ltd. 2000

total number of (locations of) programmes, correcting for the size of thehigher education system by dividing this number by the total number ofinstitutions. The number of locations of programmes is the totalnumber offered, irrespective of the fact whether an identical programmeis offered at a number of different institutions. Note that the range ofscores for programmatic diversity is much larger than for the indicatorsof institutional diversity.
Table 3 provides insight into the scores of the countries in oursample on the three indicators (the first two indicators express institu-tional diversity, the third indicator expresses programmatic variety)used. Based on these scores, we classified the countries by giving thema rank score.
Note that the range of scores for Simpson’s is small, due to charac-teristics of the populations of higher education institutions. Small indi-cator differences, however, reflect considerable differences between thesystems: e.g. systems with many ‘unique’ institutions versus morehomogeneous systems. Despite the different ranges and variance of theindicators, they show significant rank correlations. Adding the scores tocreate a total diversity score seems therefore feasible (see last column).According to the analysis, three groups of higher education systems canbe distinguished. The United Kingdom and Flanders have the mostdiverse higher education systems. The Netherlands is in third position.France and Denmark are the least diverse systems. Austria, Finland,Germany and Sweden are in the midst of the spectrum from low to high
Floating Foundations of HE Policy 225
Blackwell Publishers Ltd. 2000
TABLE 3Summary of the indicators per higher education system
Country Simpson’s Birnbaum P Total rankl score
Austria 0,929 (7) 0,600 (5) 17,8 (4) 16 (5)Belgium (Flanders) 0,972 (3) 0,974 (1) 32,3 (2) 6 (2)Denmark 0,904 (9) 0,233 (8) 5,7 (9) 26 (9)Finland 0.952 (5) 0,646 (4) 8,8 (8) 17 (6)France 0,942 (6) 0,104 (9) 9,1 (7) 22 (8)Germany 0,966 (4) 0,393 (7) 18,6 (3) 14 (4)Netherlands 0,973 (2) 0,658 (3) 15,5 (6) 11 (3)Sweden 0,926 (8) 0,527 (6) 16,5 (5) 19 (7)United Kingdom 0,997 (1) 0,725 (2) 69,1 (1) 4 (1)
Source: Huisman, 1997.

diversity. Note that system size is unrelated to diversity: the sheernumber of institutions does not imply a large level of diversity. Forinstance, the largest system in terms of number of institutions in oursample (France), has large numbers of institutions in the SectionsTechnician Supérieur with identical profiles, lowering the total level ofdiversity.
Affordability
The second ‘explanatory’ variable used in this study concerns theaffordability of higher education. One can look at affordability from twoangles: from a governmental or from a student’s perspective. In thisarticle we have chosen the latter position. From the students’ perspec-tive (often also including the parent’s perspective), affordability indi-cates the relationship between the costs of higher education and themeans available to pay for these costs (McPherson and Schapiro, 1991).More precisely, affordability may be defined as the extent to whichstudents are able to meet the costs of following a higher educationprogramme (Vossensteyn, 1997). Thus, the affordability of educationdepends on the costs of higher education and on the support studentsreceive. In order to provide insight into the relative affordability ofhigher education in the countries included, a number of aspects havebeen discerned, which give an indication of the costs related to study-ing and express the financial means available to students to cover thesecosts.
In comparing countries, it would be interesting to calculate the ‘netcosts of education’. However, this would require data about the averagepublic subsidy per recipient, which are very hard to obtain. In addition,such a method cannot reckon with the many differences between thenational systems of support, and the variation among the positions ofindividual students within each country. In order to control for thesecomplexities, we scored the different countries on five indicators ofaffordability that we will discuss in more detail.
First of all, the costs of study. These can be divided into study andliving costs. Study costs refer to tuition fees and expenditure on studymaterials. Foregone earnings are left out of the comparisons, becausethey do not imply direct costs that students have to pay in order tostudy. Living costs can be divided into livelihood, housing (rents), trav-elling expenses and sundries like sport, entertainment, etc. As an esti-mate for the average costs per student, the countries involved in thisstudy are compared on the basis of the average expenditures reported
226 Higher Education Quarterly
Blackwell Publishers Ltd. 2000

by undergraduate students in national surveys on this issue, referring tothe situation in 1994 or 1995/96.
In order to cover the direct costs of higher education, a number oftypes of financial support are available to students, classified in twocategories of support: direct support (grants and loans) and indirectstudent support (child allowances and tax reductions).
Direct support – which is our second indicator – concerns the provi-sion of financial means from the government directly to students. Incomparing the countries on the issue of direct support, it is not the(total) amounts of money allocated to the students which is taken as anindicator, but the percentage of students that receive a grant and/or iseligible for a loan. In addition, we looked at the proportion of thebudget of the students that is covered by grants and loans.
Indirect support – our third indicator – is defined as public financialassistance given to students through their families, primarily providedby means of child allowances and tax benefits. The amounts givenusually depend on the number of children and the income level of fami-lies, and therefore vary from student to student within countries. Whereindirect support is applicable, we took the situation for students fromfamilies with two children and a tax rate 40 per cent as a benchmark.Again, the percentage of beneficiaries of indirect support and theproportion of the students’ budget covered by the indirect means ofsupport are used as the indicators here.
In addition, the financial position of students, and thus affordability,can be influenced by governments through the stipulation of conditionswhich have to be met before financial aid is provided, such as studyprogress requirements. The relative strictness of these type of require-ments is taken as the fourth indicator.
The fifth indicator concerns developments in student supportschemes. These may influence the way students view the affordability ofhigher education. In times of increasing support for students, they mayconsider the affordability of higher education as improving, or vice-versa. Developments in recent years within the countries analysedconcerning the amount of support offered to students, as well as theproportion of students benefiting from it, have been taken as the basisfor a positive or negative score on this indicator.
Finally, the total relative affordability of higher education in theselected countries has been determined by a weighted accumulation ofthe relative scores of the countries on the different indicators discerned.To this end, the countries were given a score on each indicator rangingbetween 1 (low affordability) and 3 (high affordability) at first.
Floating Foundations of HE Policy 227
Blackwell Publishers Ltd. 2000

However, because we do not consider all indicators equally importantfor the affordability of higher education, a straightforward accumulationof the country scores on the five indicators cannot be applied. We there-fore attached different weights to the scores on the individual indicatorsused.
Direct grants are considered to be the most important indicator,because they concern a subsidy lowering the costs of education andenhancing students’ financial independence. This weighting has beenexpressed by multiplying these scores by 2. Because indirect supportmakes students financially dependent on their parents, but also lowersthe costs of education its relative importance for affordability is less thanthat of grants. Therefore, these scores on indirect support have beenmultiplied by 1.5. The weight attached to loans with respect to its influ-ence on affordability is based on the notion that loans enable studentsto meet (part of) the costs of education and make them financially inde-pendent. On the other hand, loans imply a cost to the students oncethey graduate. Therefore, the scores for this indicator have been multi-plied by a factor of 1. Finally, the least weight has been attached to thecosts of education, the study progress requirements and the develop-ments in the systems of student support, although it is acknowledgedthat these have an impact on affordability. The scores on these indica-tors have been multiplied by a factor of 0.5. Adding up the countryscores multiplied by their respective weights provides a total affordabil-ity score for each country. The results are presented in table 4.
This table shows that the higher education systems of Finland andDenmark have the highest affordability. In Austria, Belgium(Flanders) and the UK the relative affordability is the least of thecountries in our sample. The other countries take an intermediateposition. This table also shows that students are slightly ‘better off’ insystems with a major focus on direct support, than in systems thathave an emphasis on indirect support through their families.Nonetheless, the positions of the UK and, to a lesser extent, Swedenshow a small deviation from this pattern. The position of Sweden canbe explained by the strong role given to loans. Concerning the UK, itis worth mentioning that the duration of initial courses is relativelyshort compared to the other countries. This for instance implies thatstudents would have to take out loans for only a limited period oftime. However, the recent introduction of tuition fees to be paid bythe students themselves, and a full substitution of grants with loans,will not have a positive influence on the UK’s relative position withregard to affordability.
228 Higher Education Quarterly
Blackwell Publishers Ltd. 2000

Floatin
g Fou
nd
ations of H
E P
olicy229
B
lackwell P
ublishers Ltd. 2000
TABLE 4Relative affordability of higher education in the selected countries
Costs Grants Indirect support Loans Study Developments Totalprogress relative
requirements affordability
Number Coverage Number Coverage Eligible Coverage
Austria 1.0 2.0 4.0 3.0 3.0 1.0 1.0 1.0 0.5 16.5Belgium (Fl.) 1.0 2.0 4.0 4.5 3.0 1.0 1.0 0.5 1.0 18.0Denmark 1.0 6.0 6.0 1.5 1.5 3.0 2.0 1.0 1.0 23.0Finland 1.5 6.0 6.0 1.5 1.5 3.0 3.0 1.0 1.5 25.0France 1.5 2.0 4.0 4.5 3.0 1.0 2.0 0.5 0.5 19.0Germany 1.0 2.0 4.0 4.5 3.0 1.0 2.0 1.5 0.5 19.5Netherlands 0.5 6.0 4.0 1.5 1.5 3.0 3.0 1.0 0.5 21.0Sweden 0.5 6.0 2.0 1.5 1.5 3.0 3.0 1.0 1.0 19.5United Kingdom 0.5 4.0 4.0 1.5 1.5 3.0 2.0 0.5 1.0 18.0
Source: Vossensteyn, 1999.

Selectivity
We define the concept of selectivity as the entrance procedures and crite-ria used to determine who may enrol in higher education, or in specifichigher education institutions or programmes. Selection at entry tohigher education plays a central role. Other types of selection, like selec-tion during the programmes, are not elaborated upon.
To enable a comparison of the relative selectivity of the higher educa-tion systems in the countries concerned, we demarcated three indicatorswhich give measurable information about the outcomes of the selectionprocesses and thus about the relative selectivity of the systems. Theseindicators are: the range of programmes and institutions covered byselection procedures, the criteria used and their range of application,and the percentage of applicants rejected (unmet demand). Weacknowledge that these indicators do not give any background informa-tion on the way selection is carried out. For those interested, we haveexplored this type of process-related information in another study(Vossensteyn, 1997), also using qualitative indicators such as the majorarguments brought forward for applying selection mechanisms, and theprocedures and role of various stakeholders in deciding on the entrancecapacity and the criteria used for selection.
With regard to the number of programmes and institutions for whichstudents are selected, a large variation can be seen among the systemsanalysed. Austria, Belgium (Flanders) and the Netherlands have openentry systems, which use procedures for only a very limited number ofprogrammes. In Denmark the number of programmes with an officialnumerus clausus is also limited, but selection is applied to the main partof the programmes. In Finland and the UK almost all programmes havean entrance selection. In countries like France and Germany a rapidincrease in the number of students (candidates) has led to a large fric-tion between capacity and demand, which influences the selectivity ofthe systems. Nevertheless, entrance in French public universities isopen to most of the applicants (although they do not always get into theprogramme and institution of their first choice), but entrance into theprivate institutions is very restricted.
The second indicator concerns the selection criteria used, their rela-tive strictness and their range of application. Three major categories ofcriteria are used in the countries analysed. The first category concernsmerits, e.g. relevant knowledge and skills, expressed by qualifications,type of courses, work experience or entrance examinations. Generalqualifying diplomas, average examination results in secondary educa-
230 Higher Education Quarterly
Blackwell Publishers Ltd. 2000
tion and the type of courses followed are used in most cases where selec-tion is applied. Entrance examinations are used for only a limitednumber of programmes in Denmark, Finland and France. Professionalexperience is used in cases where applicants do not have the formalqualifying diplomas. The second group of criteria is formed by personalcharacteristics. This particularly concerns the criterion of age, which isused in Sweden and Finland to promote participation of maturestudents. The final category includes other criteria, such as the lengthof time students wait to be admitted to certain study programmes. Thislatter criterion is particularly used in Germany, where applicants whoare turned down are put on a waiting list which will finally lead toadmission (sometimes after several years). Waiting lists in Denmark andthe UK (‘clearing list’) do not guarantee access.
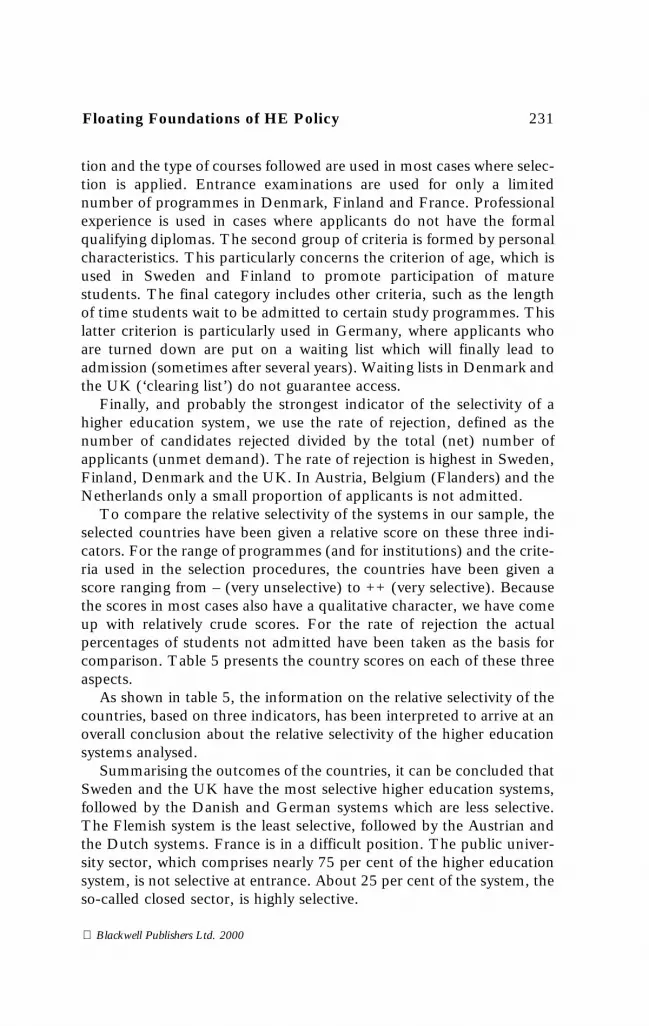
Finally, and probably the strongest indicator of the selectivity of ahigher education system, we use the rate of rejection, defined as thenumber of candidates rejected divided by the total (net) number ofapplicants (unmet demand). The rate of rejection is highest in Sweden,Finland, Denmark and the UK. In Austria, Belgium (Flanders) and theNetherlands only a small proportion of applicants is not admitted.
To compare the relative selectivity of the systems in our sample, theselected countries have been given a relative score on these three indi-cators. For the range of programmes (and for institutions) and the crite-ria used in the selection procedures, the countries have been given ascore ranging from – (very unselective) to ++ (very selective). Becausethe scores in most cases also have a qualitative character, we have comeup with relatively crude scores. For the rate of rejection the actualpercentages of students not admitted have been taken as the basis forcomparison. Table 5 presents the country scores on each of these threeaspects.
As shown in table 5, the information on the relative selectivity of thecountries, based on three indicators, has been interpreted to arrive at anoverall conclusion about the relative selectivity of the higher educationsystems analysed.
Summarising the outcomes of the countries, it can be concluded thatSweden and the UK have the most selective higher education systems,followed by the Danish and German systems which are less selective.The Flemish system is the least selective, followed by the Austrian andthe Dutch systems. France is in a difficult position. The public univer-sity sector, which comprises nearly 75 per cent of the higher educationsystem, is not selective at entrance. About 25 per cent of the system, theso-called closed sector, is highly selective.
Floating Foundations of HE Policy 231
Blackwell Publishers Ltd. 2000

232H
igher E
du
cation Q
uarterly
B
lackwell P
ublishers Ltd. 2000
TABLE 5The relative selectivity of higher education systems
Country Type of HE Range of Criteria and range rate of Total score for theprogrammes of application rejection countries as a whole
Austria Universities – – – ±3%Other + + in total Unselective
Belgium (Flanders) – – – – ±3% UnselectiveDenmark Quotum 1 ++ + 31%
Quotum 2 ++ + in total SelectiveFinland Universities ++ ++ 50%
Other ++ ++ in total Very selectiveFrance Universities – – – 0%
Other ++ ++ 80%–95% UnselectiveGermany With Abitur + –
Wait period ++ + rather low SelectiveWithout Abitur ++ +
Netherlands – – + ±5% UnselectiveSweden ++ ++ 63% Very selectiveUnited Kingdom ++ ++ 26% Very selective
Notes: In case of Denmark, quotum 1 includes students who are admitted on general entrance requirements including specific subjects,levels and secondary education examination grades. In addition, institutions are free to admit a limited number of applicants on the basisof less strict criteria including occupational experience, foreign qualifications, etc. (quotum 2). The Abitur is the highest general secondaryeducation qualification in Germany.Source: Vossen steyn, 1997.

Testing the Assumptions
In this section, the relative diversity, selectivity and affordability arecompared with the rates of participation shown in the countries underconsideration. To this end, the final results of the four separate analy-ses used in this study have been put together in table 6. This provides aclear overview from which we can draw conclusions on whether or notthe assumed relationships formulated in the beginning of this paperhold. More explicitly, is it true that higher education systems with arelatively high rate of participation are characterised by a relatively highprogrammatic diversity, high affordability and relatively low selectivity?
In presenting the country scores on the four variables in table 6, wesorted the countries by rate of participation. For some countries, thescores do not differ significantly from other countries. As a crude checkon validity we used the criterion that the difference between nationalscore and average score (9 countries average) has to be more than a halfof one standard deviation (or less than minus a half of one standarddeviation). No score in table 6 means that the score does not signifi-cantly differ from the nine countries’ average.
The main conclusion that can drawn from this table is that theemerging pattern of relationships between the central concepts is for the
Floating Foundations of HE Policy 233
Blackwell Publishers Ltd. 2000
TABLE 6Ranking of higher education systems on rate of participation (gross,
population), diversity, affordability and selectivity
Country Participation Diversity Affordability Selectivity
Germany lowAustria low low lowBelgium (Flanders) low high low lowUnited Kingdom low high low highNetherlands lowDenmark high low highSweden high highFinland high high highFrance high Low
Source: CHEPS, 1999.Bold: at least 1 standard deviation higher or lower than average score over all nine coun-tries.Italics: at least 0.5 standard deviation higher or lower than average score over all ninecountries.
greater part not in line with the three assumptions formulated in thispaper. There does seem to be a positive relation between levels ofaffordability and levels of participation, implying that the low(er) finan-cial barriers, the high(er) the participation rates. On the other hand,high levels of diversity are not related to high levels of participation. Onthe contrary: the results indicate that the lower level of diversity, thehigher the level of participation. In addition, the table suggests that lowlevels of selectivity are not unambiguously related to high levels ofparticipation. Also, the data suggest that high levels of selectivity arelinked with high levels of participation. In sum, we cannot find supportfor our assumption that a consistently low rate of selectivity in combi-nation with a high rate of affordability and diversity – together –contribute to a high rate of participation. The French case, for instance,shows the highest rate of participation in a situation of relatively poordiversity, low affordability and relative non-selectivity. From the find-ings we draw the conclusion that the assumptions about the relation-ships between the four variables tested in this article are not veryplausible. If this is true, participation strategies in public policy mightoften be based on shaky grounds. Nevertheless, we are aware of the factthat this study was a first attempt to test these assumptions using newand sometimes crude indicators on a limited data set. Therefore, in thenext section we would like to indicate possible explanations for our find-ings.
Summary and Discussion
It is quite common to suppose that a high level of diversity, a high levelof affordability and a low level of selectivity have positive impacts onindividual decisions on whether or not to enrol in higher education andas such on the rate of participation. In operational terms, this meansthat the more variety of programmes and institutions in a system, andthe lower the barriers to enter the system, the more opportunities forstudents and the higher the level of participation will be.
Such expectations – and sometimes taken-for-granted assumptions –about the relationships between diversity, selectivity, and affordabilityon the one hand, and participation on the other, are clearly recognisablein governmental policy documents. This study challenged the underly-ing expectations of such policies. To investigate the relationshipsbetween the central concepts, we have operationalised these for a set ofWestern European countries. Next, we have put the relationships to thetest. The data and methods used in this study provide different results
234 Higher Education Quarterly
Blackwell Publishers Ltd. 2000

from those expected. Except for the relationship between high levels ofparticipation and high levels of affordability, the other assumptionscould not be endorsed by the empirical data.
The findings of our research point in two directions. One conclusioncould be that participation strategies in public policy might often bebased on illusions: the basic assumptions of many governmental policiesmay prove to be untenable. Another conclusion could be that there areshortcomings in our research design, leading to distorted empirical find-ings. Therefore, a critical look at our approach is necessary, acknowl-edging that our study was a first attempt to test these assumptions usinga limited data set. Here we indicate a few aspects that might improveour model and data-collection.
First, we assumed very simple and direct relationships between thegeneral concepts. However, as stated, the concepts are very complexand difficult to measure, which resulted in relatively coarse scores. Forinstance, the concept of participation can be encapsulated by differentindicators, each meaningful but leading to different rank orders ofsystems of higher education. Also, increases in tuition fees areregarded as a decrease of the affordability of education. However, inpractice, tuition increases seem to have little impact on participation,just as grants mainly have an impact on the participation of peoplefrom specific target groups (Heller, 1997). Furthermore, the debateon the pricing effects on higher education participation is complicatedby the conception of education as an investment. As such, the deci-sion to enrol in higher education not only depends on its relativeprice, but also on its expected returns, which may vary between coun-tries, disciplines, study programmes and individuals. Thus differencesin wage structures, labour market positions and innate abilities mayindirectly influence enrolment decisions and participation patterns.Finally, in addition to the criticism of the concepts we chose, it wouldbe wise to look at (additional) explanations for differences in partici-pation, such as economic development and developments in thelabour market. Huijsman et al. (1986), for instance, found from timeseries analysis that by far the most important economic factor causingthe increase in participation was the growth in per capita nationalincome.
Second, we measured all variables at the macro level whereas the rateof participation in fact is an accumulation of individual decisionswhether or not to enrol in higher education. Looking from the individ-ual perspective, it is known that there is a wide range of variables whichinfluence the enrolment decision, such as socio-economic background
Floating Foundations of HE Policy 235
Blackwell Publishers Ltd. 2000

of the students, previous achievements in education and the potentialfuture benefits of higher education (high income and low unemploy-ment expectancies). In our study we limited ourselves to the policyinitiatives used to diminish the restrictions for enrolling in higher educa-tion, such as offering a wide array of study programmes, offering finan-cial facilities to pay for the cost of study and the extent to which thenumber of students admitted to study programmes is limited or not.These limitations to the research design chosen plead for a more holis-tic approach in order to identify multivariate relationships.
Third, the data used have been limited to one moment in time,whereas higher education systems prove to be eminent examples ofsystems with a highly complex and dynamic character. Therefore, itwould probably be wise to complement the comparative across coun-try analysis with a longitudinal research design. Reflection on a recentextensive longitudinal six-country study (Arimoto, 1997) points outthat the modes of diversification differ to a considerable extent.Teichler (1997, p. 225) concludes on the basis of developments in theUSA, Japan, Switzerland, Singapore, China and Germany: ‘. . . thedata made available in the six country studies do not suffice to drawany conclusions about the relationships between massification andstructural diversification . . .’. Factors to take into account in furtherinvestigation in both longitudinal and cross country studies are,amongst others, institutional competition and privatisation in highereducation.
Finally, we did not put any weights to the different concepts influ-encing participation, so we did not develop a rank order between theconcepts based on their relative importance for – and impact on –participation. As a result, there is no distinction between necessary orconditional relationships (e.g. if a system is very selective, than the rela-tive affordability is not so important any longer).
Despite these criticisms something should be said about the assump-tions behind governmental policies with respect to participation. Evenif the model put forward is not (yet) perfect, this applies to an evengreater extent to governmental policies. We maintain that many publicparticipation policies are grounded on too simplistic assumptions and inthat sense based on floating foundations. The empirical findings so farpoint out that none of the expectations or assumptions found in highereducation participation policies are tenable. It follows that policymakers should be aware of the more complex interrelations and inter-actions between the concepts and set aside straightforward linearreasoning.
236 Higher Education Quarterly
Blackwell Publishers Ltd. 2000

References
Arimoto, A. (ed. 1997), Academic reforms in the world: situation and perspective in the massi-fication stage of higher education. Hiroshima University: RIHE.
Birnbaum, R. (1983), Maintaining diversity in higher education. San Francisco: Jossey-Bass.
Carnegie Foundation for the Advancement of Teaching (1994), A classification of institu-tions of higher education. Princeton: CFAT.
Clotfelter, C. T., R. G. Ehrenberg, M. Getz and J. J. Siegfried (1991), Economic challengesin higher education, University of Chicago Press, Chicago.
Department of Education, Employment and Training (1996), Diversity in AustralianHigher Education Institutions. Higher Education Series 26. Canberra: DEET.
Fulton, O. (1989), Access and institutional change, Buckingham: The Society for Researchinto Higher Education and the Open University Press.
Fulton, O. and S. Elwood (1989), Admissions, access and institutional change, in: fulton,O. (ed.), Access and institutional change, Buckingham: The Society for Research intoHigher Education and the Open University Press.
Heller, D. E. (1997), Student price response in higher education, An update to Leslie andBrinkman, Journal of Higher Education, Vol. 68, No. 6, pp. 624–659, Ohio StateUniversity Press.
Huijsman, R., T. Kloek, D. A. Kodde & J. M. M. Ritzen (1986), An empirical analysisof college enrolment in the Netherlands, De Economist, Vol. 34, 181–190.
Huisman, J. (1995), Diversity, differentiation and dependency in higher education.Utrecht: Lemma.
Huisman, J. (1997), Institutional and programmatic diversity, A comparative analysis ofnational higher education systems in nine Western European countries, CHEPS-highereducation monitor, Thematic report II, Ministerie van Onderwijs, Cultuur enWetenschappen, Beleidsgerichte studies Hoger onderwijs en Wetenschappelijk onder-zoek, nr. 50, Zoetermeer.
Kaiser, F. and E. de Weert (1994), Access-policies and mass higher education. In: L. C.J. Goedegebuure and F. A. van Vught (eds.), Comparative policy studies in higher educa-tion. Utrecht: Lemma, pp. 165–193.
Leslie, L. L. and P. T. Brinkman (1987), Student price response in higher education,Journal of Higher Education, Vol. 58, pp. 181–204.
Ludwig, J. A. and J. F. Reynolds (1988), Statistical ecology. A primer on methods andcomputing. New York: Wiley and Sons.
McPherson, M. S. and M. O. Schapiro (1991), Keeping College Affordable, government andeducational opportunity, The Brookings Institution, Washington DC.
National Committee of Inquiry into Higher Education (1997), Higher education in thelearning society, NCIHE, Norwich.
Papadopoulos, G. S. (1994), Education 1960–1990. The OECD perspective. Paris: OECD.Scott, M. W. (1996), Admissions systems, Access to Higher Education in Europe,
Comparative study, Council of Europe, Universities and Colleges Liaison Officer,UCAS, Cheltenham, UK.
Stadtman, V. A. (1980), Academic adaptations. Higher education prepares for the 1980s and1990s. San Francisco: Jossey-Bass.
Teichler, U. (1989), Changing patterns of the higher education system. The experience of threedecades. London: Jessica Kingsley.
Teichler, U. (1997), Reforms as a response to massification of higher education: acomparative view. In: A. Arimoto (ed.), Academic reforms in the world: situation andperspective in the massification stage of higher education. Hiroshima University: RIHE, pp.213–234.
Trow, M. (1972), The expansion and transformation in higher education, InternationalReview of Education, Vol. 18, pp. 61–84.
Floating Foundations of HE Policy 237
Blackwell Publishers Ltd. 2000

Trow, M. (1979), Elite and mass higher education: American models and European realities.Stockholm: National Board of Universities.
Vossensteyn, J. J. (1997), Access: Selection and affordability, A comparative analysis of thebarriers for entrance in higher education in nine West-European countries. Zoetermeer:Ministerie van Onderwijs, Cultuur en Wetenschappen.
Vossensteyn, J. J. (1999), Where in Europe would people like to study? The affordabilityof higher education in nine Western European countries, Higher Education, Vol. 37,pp. 159–176.
238 Higher Education Quarterly
Blackwell Publishers Ltd. 2000


