Embed Size (px)
Citation preview

Rock Foundations Course No: G09-001
Credit: 9 PDH
Gilbert Gedeon, P.E.
Continuing Education and Development, Inc.22 Stonewall CourtWoodcliff Lake, NJ 07677
P: (877) [email protected]

CECW-EG
Engineer Manual1110-1-2908
Department of the ArmyU.S. Army Corps of Engineers
Washington, DC 20314-1000
EM 1110-1-2908
30 November 1994
Engineering and Design
ROCK FOUNDATIONS
Distribution Restriction StatementApproved for public release; distribution is
unlimited.

EM 1110-1-290830 November 1994
US Army Corpsof Engineers
ENGINEERING AND DESIGN
Rock Foundations
ENGINEER MANUAL

DEPARTMENT OF THE ARMY EM 1110-1-2908U.S. Army Corps of Engineers
CECW-EG Washington, DC 20314-1000
ManualNo. 1110-1-2908 30 November 1994
Engineering and DesignROCK FOUNDATIONS
1. Purpose. This manual provides technical criteria and guidance for design of rock foundations for civilworks or similar large military structures.
2. Applicability. This manual applies to HQUSACE elements, major subordinate commands, districts,laboratories, and field operating activities.
3. General. The manual provides a minimum standard to be used for planning a satisfactory rockfoundation design for the usual situation. Unusual or special site, loading, or operating conditions maywarrant sophisticated analytical designs that are beyond the scope of this manual.
FOR THE COMMANDER:
WILLIAM D. BROWNColonel, Corps of EngineersChief of Staff

DEPARTMENT OF THE ARMY EM 1110-1-2908U.S. Army Corps of Engineers
CECW-EG Washington, DC 20314-1000
Manual 30 November 1994No. 1110-1-2908
Engineering and DesignROCK FOUNDATIONS
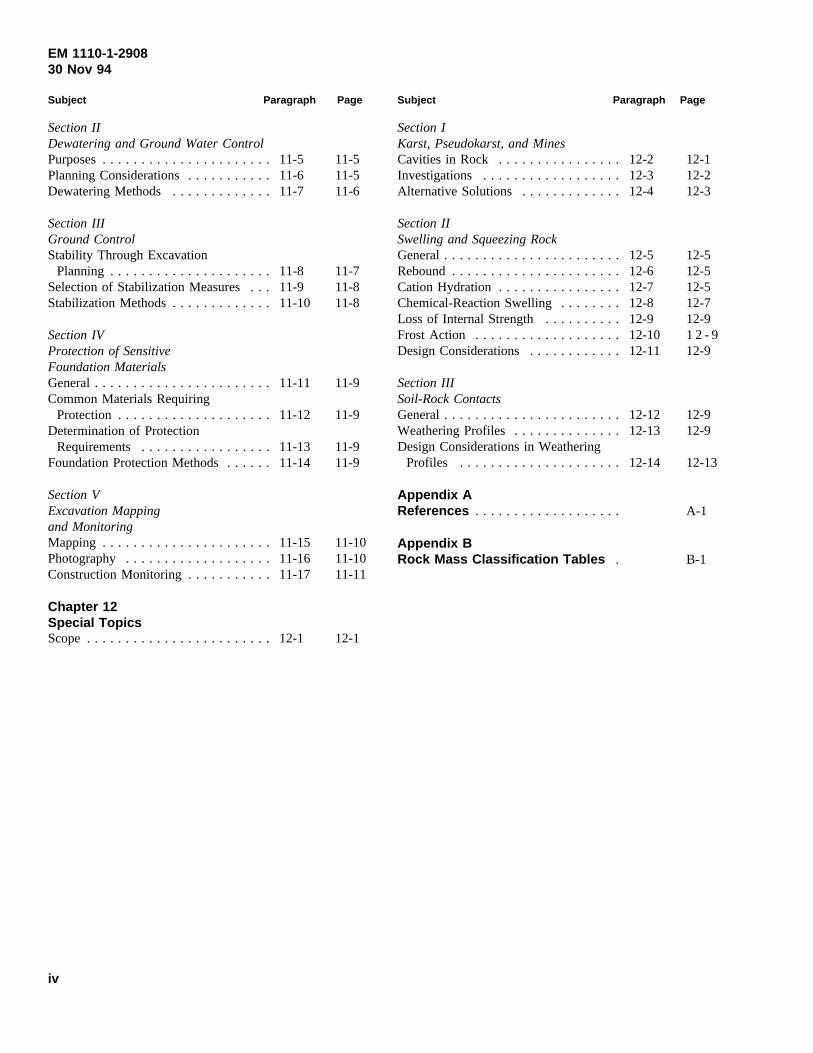
Table of Contents
Subject Paragraph Page
Chapter 1IntroductionPurpose . . . . . . . . . . . . . . . . . . . . . . 1-1 1-1Applicability . . . . . . . . . . . . . . . . . . . 1-2 1-1References . . . . . . . . . . . . . . . . . . . . 1-3 1-1Scope of Manual. . . . . . . . . . . . . . . . 1-4 1-1Coordination . . . . . . . . . . . . . . . . . . . 1-5 1-1
Chapter 2Design ConsiderationsDesign Approach. . . . . . . . . . . . . . . . 2-1 2-1Types of Structures. . . . . . . . . . . . . . 2-2 2-1Design Considerations. . . . . . . . . . . . 2-3 2-1Factor of Safety. . . . . . . . . . . . . . . . . 2-4 2-1
Chapter 3Site InvestigationsScope. . . . . . . . . . . . . . . . . . . . . . . . 3-1 3-1Applicable Manuals. . . . . . . . . . . . . . 3-2 3-1
Section IPreliminary StudiesGeneral. . . . . . . . . . . . . . . . . . . . . . . 3-3 3-1Map Studies . . . . . . . . . . . . . . . . . . . 3-4 3-1Other Sources of Information. . . . . . . 3-5 3-1Field Reconnaissance. . . . . . . . . . . . . 3-6 3-1
Section IIField InvestigationsGeneral. . . . . . . . . . . . . . . . . . . . . . . 3-7 3-2Geologic Mapping. . . . . . . . . . . . . . . 3-8 3-2Geophysical Explorations. . . . . . . . . . 3-9 3-2Borings . . . . . . . . . . . . . . . . . . . . . . .3-10 3-3Exploratory Excavations. . . . . . . . . . . 3-11 3-4In-Situ Testing . . . . . . . . . . . . . . . . . 3-12 3-4
Subject Paragraph Page
Section IIILaboratory TestingGeneral. . . . . . . . . . . . . . . . . . . . . . . 3-13 3-4Selection of Samples and Tests. . . . . . 3-14 3-4Laboratory Tests. . . . . . . . . . . . . . . . 3-15 3-5
Chapter 4Rock Mass CharacterizationScope. . . . . . . . . . . . . . . . . . . . . . . . 4-1 4-1Intact Rock versus Rock Mass. . . . . . . 4-2 4-1
Section IGeologic DescriptionsGeneral. . . . . . . . . . . . . . . . . . . . . . . 4-3 4-1Rock Core Descriptors. . . . . . . . . . . . 4-4 4-1Supplemental Descriptors. . . . . . . . . . 4-5 4-5Index Tests. . . . . . . . . . . . . . . . . . . . 4-6 4-6
Section IIRock Mass ClassificationGeneral. . . . . . . . . . . . . . . . . . . . . . . 4-7 4-6Available Classification Systems. . . . . 4-8 4-6Rock Quality Designation. . . . . . . . . . 4-9 4-7Geomechanics Classification. . . . . . . . 4-10 4-8Q-System . . . . . . . . . . . . . . . . . . . . . 4-11 4-8Value of Classification Systems. . . . . . 4-12 4-9
Section IIIShear StrengthGeneral. . . . . . . . . . . . . . . . . . . . . . . 4-13 4-9Rock Failure Characteristics. . . . . . . . 4-14 4-9Failure Criteria . . . . . . . . . . . . . . . . . 4-15 4-10Shear Strength Tests. . . . . . . . . . . . . . 4-16 4-12Shear Strength Testing Program. . . . . . 4-17 4-12
i

EM 1110-1-290830 Nov 94
Subject Paragraph Page
Selection of Design Shear StrengthParameters. . . . . . . . . . . . . . . . . . . 4-18 4-14
Section IVDeformation and SettlementGeneral. . . . . . . . . . . . . . . . . . . . . . .4-19 4-17Moduli Definitions . . . . . . . . . . . . . . . 4-20 4-18Test Methods for Estimating Modulus . 4-21 4-18Other Methods for Estimating Modulus 4-22 4-20Considerations in Selecting Design
Modulus Values . . . . . . . . . . . . . . . 4-23 4-20Selection of Design Moduli. . . . . . . . . 4-24 4-21
Section VUse of Selected Design ParametersGeneral. . . . . . . . . . . . . . . . . . . . . . .4-25 4-21
Chapter 5Deformation and SettlementScope. . . . . . . . . . . . . . . . . . . . . . . . 5-1 5-1
Section ICategories of Rock Mass DeformationGeneral. . . . . . . . . . . . . . . . . . . . . . . 5-2 5-1Time-Dependent Deformations. . . . . . 5-3 5-1Time-Independent Deformations. . . . . 5-4 5-2
Section IIAnalytical MethodsGeneral. . . . . . . . . . . . . . . . . . . . . . . 5-5 5-2Closed Form Methods. . . . . . . . . . . . 5-6 5-2Numerical Models . . . . . . . . . . . . . . . 5-7 5-5
Section IIIAllowable SettlementGeneral. . . . . . . . . . . . . . . . . . . . . . . 5-8 5-5Mass Concrete Structure. . . . . . . . . . . 5-9 5-5
Section IVTreatment MethodsGeneral. . . . . . . . . . . . . . . . . . . . . . .5-10 5-6Rock Mass Improvement. . . . . . . . . . 5-11 5-7Foundation Design Modifications. . . . . 5-12 5-7
Chapter 6Bearing CapacityScope. . . . . . . . . . . . . . . . . . . . . . . . 6-1 6-1Applicability . . . . . . . . . . . . . . . . . . . 6-2 6-1
Section IFailure ModesGeneral. . . . . . . . . . . . . . . . . . . . . . . 6-3 6-1
Subject Paragraph Page
Intact Rock Mass. . . . . . . . . . . . . . . . 6-4 6-1Jointed Rock Mass. . . . . . . . . . . . . . . 6-5 6-1Layered Rock Mass. . . . . . . . . . . . . . 6-6 6-3Highly Fractured Rock Masses. . . . . . 6-7 6-3Secondary Causes of Failure. . . . . . . . 6-8 6-3
Section IIMethods for Computing Bearing CapacityGeneral. . . . . . . . . . . . . . . . . . . . . . . 6-9 6-3Definitions . . . . . . . . . . . . . . . . . . . . 6-10 6-3Analytical Methods . . . . . . . . . . . . . . 6-11 6-3Bearing Capacity Equations. . . . . . . . 6-12 6-4Eccentric Load on a Horizontal
Foundation . . . . . . . . . . . . . . . . . . . 6-13 6-6Special Design Cases. . . . . . . . . . . . . 6-14 6-7
Section IIIAllowable Bearing Capacity ValueGeneral. . . . . . . . . . . . . . . . . . . . . . . 6-15 6-7Determination . . . . . . . . . . . . . . . . . . 6-16 6-8Structural Limitations. . . . . . . . . . . . . 6-17 6-9
Section IVTreatment MethodsGeneral. . . . . . . . . . . . . . . . . . . . . . . 6-18 6-9Effective Unit Weight . . . . . . . . . . . . 6-19 6-9Foundation Depth . . . . . . . . . . . . . . . 6-20 6-9
Chapter 7Sliding StabilityScope. . . . . . . . . . . . . . . . . . . . . . . . 7-1 7-1
Section IModes of FailureGeneral. . . . . . . . . . . . . . . . . . . . . . . 7-2 7-1Potential Failure Paths. . . . . . . . . . . . 7-3 7-1
Section IIMethods of AnalysisGeneral Approach. . . . . . . . . . . . . . . 7-4 7-1Conditions for Stability. . . . . . . . . . . . 7-5 7-3Assumptions . . . . . . . . . . . . . . . . . . . 7-6 7-3Analytical Techniques for Multi-Wedge
Systems . . . . . . . . . . . . . . . . . . . . . 7-7 7-4Preliminary Procedures. . . . . . . . . . . . 7-8 7-6Analytical Procedures. . . . . . . . . . . . . 7-9 7-6Design Considerations. . . . . . . . . . . . 7-10 7-6Seismic Sliding Stability. . . . . . . . . . . 7-11 7-8Factor of Safety. . . . . . . . . . . . . . . . . 7-12 7-9
ii

EM 1110-1-290830 Nov 94
Subject Paragraph Page
Section IIITreatment MethodsGeneral. . . . . . . . . . . . . . . . . . . . . . .7-13 7-9Increase in Shear Strength. . . . . . . . . . 7-14 7-9Increase in Passive Wedge
Resistance . . . . . . . . . . . . . . . . . . . 7-15 7-9Lateral Restraint . . . . . . . . . . . . . . . . 7-16 7-9
Chapter 8Cut Slope StabilityScope. . . . . . . . . . . . . . . . . . . . . . . . 8-1 8-1
Section IModes of FailureGeneral. . . . . . . . . . . . . . . . . . . . . . . 8-2 8-1Types of Failure Modes. . . . . . . . . . . 8-3 8-1Sliding Failure Modes . . . . . . . . . . . . 8-4 8-1Toppling Failure Mode. . . . . . . . . . . . 8-5 8-3Sloughing Failure Mode. . . . . . . . . . . 8-6 8-3Additional Factors Influencing Slope
Stability . . . . . . . . . . . . . . . . . . . . . 8-7 8-3
Section IIMethods for Assessing StabilityGeneral. . . . . . . . . . . . . . . . . . . . . . . 8-8 8-4Sliding Stability Analyses. . . . . . . . . . 8-9 8-4Toppling Stability Analyses . . . . . . . . 8-10 8-6Localized Sloughing Analyses. . . . . . . 8-11 8-6Physical Modeling Techniques. . . . . . 8-12 8-6Design Considerations. . . . . . . . . . . . 8-13 8-7
Section IIITreatment Methods andPlanning ConsiderationsGeneral. . . . . . . . . . . . . . . . . . . . . . .8-14 8-7Treatment Methods. . . . . . . . . . . . . . 8-15 8-7Planning Considerations. . . . . . . . . . . 8-16 8-8
Chapter 9Anchorage SystemsScope. . . . . . . . . . . . . . . . . . . . . . . . 9-1 9-1
Section IModes of Anchor-Rock InteractionGeneral. . . . . . . . . . . . . . . . . . . . . . . 9-2 9-1Tensioned Anchor Systems. . . . . . . . . 9-3 9-1Untensioned Anchor Systems. . . . . . . 9-4 9-1
Section IIMethods of AnalysisGeneral. . . . . . . . . . . . . . . . . . . . . . . 9-5 9-2
Subject Paragraph Page
Analyses for Tension AnchorSystems . . . . . . . . . . . . . . . . . . . . . 9-6 9-2
Dowels . . . . . . . . . . . . . . . . . . . . . . . 9-7 9-3Design Considerations. . . . . . . . . . . . 9-8 9-3
Chapter 10InstrumentationScope. . . . . . . . . . . . . . . . . . . . . . . .10-1 10-1
Section IPlanning ConsiderationsGeneral. . . . . . . . . . . . . . . . . . . . . . . 10-2 10-1Program Initiation . . . . . . . . . . . . . . . 10-3 10-1Cost Control . . . . . . . . . . . . . . . . . . . 10-4 10-1Types and Number of Instruments. . . . 10-5 10-1
Section IIApplicationsGeneral. . . . . . . . . . . . . . . . . . . . . . . 10-6 10-2Cut Slope Instrumentation. . . . . . . . . . 10-7 10-2Foundation/Structure
Instrumentation. . . . . . . . . . . . . . . . 10-8 10-3
Section IIITypes of Instruments and LimitationsGeneral. . . . . . . . . . . . . . . . . . . . . . . 10-9 10-5Piezometers. . . . . . . . . . . . . . . . . . . . 10-10 10-5Ground Motions/Vibrations. . . . . . . . . 10-11 10-5Limitations . . . . . . . . . . . . . . . . . . . . 10-12 10-7
Section IVData Interpretation and EvaluationReading Frequency. . . . . . . . . . . . . . 10-13 10-7Automatic Data Acquisition
Systems . . . . . . . . . . . . . . . . . . . . . 10-14 10-9Data Presentation. . . . . . . . . . . . . . . . 10-15 10-9Data Evaluation. . . . . . . . . . . . . . . . . 10-16 10-9Data Use . . . . . . . . . . . . . . . . . . . . . 10-17 10-9
Chapter 11Construction ConsiderationsScope. . . . . . . . . . . . . . . . . . . . . . . .11-1 11-1
Section IExcavationInformation Requirements. . . . . . . . . . 11-2 11-1Excavation Methods. . . . . . . . . . . . . . 11-3 11-1Effects of Discontinuities on
Excavation . . . . . . . . . . . . . . . . . . . 11-4 11-5
iii
EM 1110-1-290830 Nov 94
Subject Paragraph Page
Section IIDewatering and Ground Water ControlPurposes. . . . . . . . . . . . . . . . . . . . . . 11-5 11-5Planning Considerations. . . . . . . . . . . 11-6 11-5Dewatering Methods . . . . . . . . . . . . . 11-7 11-6
Section IIIGround ControlStability Through Excavation
Planning . . . . . . . . . . . . . . . . . . . . . 11-8 11-7Selection of Stabilization Measures . . . 11-9 11-8Stabilization Methods. . . . . . . . . . . . . 11-10 11-8
Section IVProtection of SensitiveFoundation MaterialsGeneral. . . . . . . . . . . . . . . . . . . . . . .11-11 11-9Common Materials Requiring
Protection. . . . . . . . . . . . . . . . . . . . 11-12 11-9Determination of Protection
Requirements . . . . . . . . . . . . . . . . . 11-13 11-9Foundation Protection Methods. . . . . . 11-14 11-9
Section VExcavation Mappingand MonitoringMapping . . . . . . . . . . . . . . . . . . . . . . 11-15 11-10Photography . . . . . . . . . . . . . . . . . . . 11-16 11-10Construction Monitoring. . . . . . . . . . . 11-17 11-11
Chapter 12Special TopicsScope. . . . . . . . . . . . . . . . . . . . . . . .12-1 12-1
Subject Paragraph Page
Section IKarst, Pseudokarst, and MinesCavities in Rock . . . . . . . . . . . . . . . . 12-2 12-1Investigations . . . . . . . . . . . . . . . . . . 12-3 12-2Alternative Solutions . . . . . . . . . . . . . 12-4 12-3
Section IISwelling and Squeezing RockGeneral. . . . . . . . . . . . . . . . . . . . . . . 12-5 12-5Rebound. . . . . . . . . . . . . . . . . . . . . . 12-6 12-5Cation Hydration. . . . . . . . . . . . . . . . 12-7 12-5Chemical-Reaction Swelling. . . . . . . . 12-8 12-7Loss of Internal Strength. . . . . . . . . . 12-9 12-9Frost Action . . . . . . . . . . . . . . . . . . . 12-10 1 2 - 9Design Considerations. . . . . . . . . . . . 12-11 12-9
Section IIISoil-Rock ContactsGeneral. . . . . . . . . . . . . . . . . . . . . . . 12-12 12-9Weathering Profiles. . . . . . . . . . . . . . 12-13 12-9Design Considerations in Weathering
Profiles . . . . . . . . . . . . . . . . . . . . . 12-14 12-13
Appendix AReferences . . . . . . . . . . . . . . . . . . . A-1
Appendix BRock Mass Classification Tables . B-1
iv

EM 1110-1-290830 Nov 94
CONVERSION FACTORS, U.S. CUSTOMARY TO SI
UNITS OF MEASUREMENT
U.S. customary units of measurement used in this report can be converted to SI units as follows:
Page No. Multiply By To Obtain
18 cubic feet 0.02831685 cubic metres
66 degrees (angle) 0.01745329 radians
67 feet 0.3048 metres
70 gallons (U.S. liquid) 3.785412 cubic decimetres
71 inches 2.54 centimetres
72 miles (U.S. statute) 0.609347 kilometres
73 pints (U.S. liquid) 0.0004731765 cubic metres
74 pound (force) 4.448222 newtons
pounds (force persquare inch
6894.757 pascals
76 square feet 0.09290304 square metres
v

EM 1110-1-290830 Nov 94
Chapter 1Introduction
1-1. Purpose
This manual provides technical criteria and guidance fordesign of rock foundations for civil works or similar largemilitary structures.
1-2. Applicability
This manual applies to HQUSACE elements, major subor-dinate commands, districts, laboratories, and field oper-ating activities.
1-3. References
References pertaining to this manual are listed in Appen-dix A. References further explain or supplement a subjectcovered in the body of this manual. The references pro-vided are essential publications to the users of this man-ual. Each reference is identified in the text by either thedesignated publication number or by author and date.References to cited material in tables and figures are alsoidentified throughout the manual.
1-4. Scope of Manual
The manual provides a minimum standard to be used forplanning a satisfactory rock foundation design for theusual situation. Chapter 2 provides a discussion on designconsiderations and factor of safety. Chapter 3 providesguidance on site investigation techniques and procedures.Chapter 4 provides guidance on rock mass characteriza-tion and classification schemes. Chapters 5 and 6 provideguidance on related topic areas of foundation deformationand settlement and foundation bearing capacity, respec-tively. Chapters 7 and 8 provide guidance on the sliding
stability assessment of gravity structures and slopes cutinto rock mass, respectively. Chapter 9 provides guidanceon the design of rock anchorage systems. Chapter 10provides guidance on selection of appropriate geotechnicalinstrumentation. Chapters 11 and 12 provide discussionon construction considerations and special topics, respec-tively. Unusual or special site, loading, or operatingconditions may warrant sophisticated analytical designsthat are beyond the scope of this manual.
1-5. Coordination
A fully coordinated team of geotechnical and structuralengineers and engineering geologists should insure thatthe result of the analyses are fully integrated into theoverall design feature being considered. Some of thecritical aspects of the design process which require coor-dination are the following.
a. Details and estimates. Exploration details andpreliminary estimates of geotechnical parameters, subsur-face conditions and design options.
b. Features. Selection of loading conditions, loadingeffects, potential failure mechanisms and other relatedfeatures of the analytical model.
c. Feasibility. Evaluation of the technical and eco-nomic feasibility of alternative structures.
d. Refinement of design. Refinement of the prelimi-nary design configuration and proportions to reflect con-sistently the results of more detailed geotechnical siteexplorations, laboratory testing, and numerical analyses.
e. Unexpected variations. Modifications to featuresduring construction due to unexpected variations in thefoundation conditions.
1-1

EM 1110-1-290830 Nov 94
Chapter 2Design Considerations
2-1. Design Approach
This manual is intended to provide, where possible, aguided approach for the design of rock foundations. Theconcept of guided design provides for a stepped procedurefor solving engineering problems that requires solution bydecision making and judgment. Any design whichinvolves rock masses requires a decision making processin which information must be obtained, considered, andreconciled before decisions and judgments can be madeand supported. As such, the manual provides a steppedprocedure for planning, collecting, and characterizing theinformation required to make intelligent decisions andvalue judgments concerning subsurface conditions, proper-ties, and behavior. A fully coordinated team of geo-technical and structural engineers and engineeringgeologists are required to insure that rock foundationconditions and design are properly integrated into theoverall design of the structure and that the completed finaldesign of the structure is safe, efficient, and economical.Foundation characterization and design work should beguided by appropriate principles of rock mechanics.
2-2. Types of Structures
The types of structures that require analyses as describedherein include concrete gravity dams, concrete retainingwalls, navigation locks, embankment dams, and similarcivil works or military type structures founded on rock.Although directed toward concrete structures, parts of thismanual are applicable to all rock foundations.
2-3. Design Considerations
The design of rock foundations includes two usual analy-ses, bearing capacity and settlement analyses and slidingstability analyses. Bearing capacity and settlement analy-ses involve the ability of the rock foundation to supportthe imposed loads without bearing capacity failure andwithout excessive or intolerable deformations or settle-ments. Sliding stability analyses involve the ability of therock foundation or slope to resist the imposed loads with-out shearing or sliding. Both analyses must be coordi-nated and satisfied in a complete design. Basic data thatshould be obtained during the design stage include strike,dip, thickness, continuity, and composition of all faultsand shears in the foundation; depth of overburden; groundwater condition; depth of weathering throughout the
foundation; joint orientation and continuity; lithology;physical and engineering properties of the rock mass; andloading conditions. Potential failure modes and mecha-nisms must be determined. For foundation sliding stabil-ity, an adequate assessment of the stress conditions andsliding stability of the rock foundation must account forthe basic behavior of the structure, the mechanism oftransmitting loads to the foundation, the reaction of thefoundation to the imposed loads and the effects of thefoundation behavior on the structure. In addition to theabove, the analyses of rock foundations must include anevaluation of the effects of seepage and of grouting per-formed to reduce seepage and the seepage effects. Theseevaluations are particularly important as related to assess-ment of hydraulic structures. Because of the difficulty indetermining bedrock seepage, seepage paths, and theeffectiveness of grouting, conservative assumptions shouldbe used in these evaluations. For a discussion of grout-ing, see EM 1110-2-3504.
2-4. Factor of Safety
The factor of safety is defined in the manual in terms ofthe strength parameters of the rock mass. For analysesinvolving shear or sliding failures, the safety factor isdefined as the factor by which the design shear strengthmust be reduced in order to bring the sliding mass into astate of limiting equilibrium along a given slip plane.This definition pertains to the shear resistance along agiven slip surface. The derivation of limit equilibriumequations used to assess sliding stability involve convert-ing stresses to forces. The equations satisfy force equilib-rium for the limiting case. For analyses involving bearingcapacity failures, the safety factor is defined as the ratioof allowable stress to the actual working stress. Thesafety factors described in the manual represent the mini-mum allowable safety factors to be used in the design ofrock slopes and foundations for applicable structures. Theminimum allowable safety factors described in this man-ual assume that a complete and comprehensivegeotechnical investigation program has been performed.Safety factors greater than the described minimums maybe warranted if uncertainties exist in the subsurface condi-tions or if reliable design parameters cannot be deter-mined. Higher safety factors may also be warranted ifunusual or extreme loading or operating conditions areimposed on the structure or substructure. Any relaxationof the minimum values involving rock foundations will besubject to the approval of CECW-EG and CECW-ED andshould be justified by extensive geotechnical studies ofsuch a nature as to reduce geotechnical uncertainties to aminimum.
2-1

EM 1110-1-290830 Nov 94
Chapter 3Site Investigations
3-1. Scope
This chapter describes general guidance for site investi-gation methods and techniques used to obtain informationin support of final site evaluation, design, construction,and instrumentation phases of a project with respect torock foundations. Once a site (preliminary or final) hasbeen selected, the problem usually consists of adapting allphases of the project to existing terrain and rock massconditions. Because terrain and rock mass conditions areseldom similar between project sites, it is difficult, if notimpractical, to establish standardized methodologies forsite investigations. In this respect, the scope of investiga-tion should be based on an assessment of geologic struc-tural complexity, imposed or existing loads acting on thefoundation, and to some extent the consequence should afailure occur. For example, the extent of the investigationcould vary from a limited effort where the foundationrock is massive and strong to extensive and detailedwhere the rock mass is highly fractured and containsweak shear zones. It must be recognized, however, that,even in the former case, a certain minimum of investiga-tion is necessary to determine that weak zones are notpresent in the foundation. In many cases, the extent ofthe required field site investigation can be judged from anassessment of preliminary site studies.
3-2. Applicable Manuals
Methods and techniques commonly used in site investi-gations are discussed and described in other designmanuals. Two manuals of particular importance areEM 1110-1-1804 and EM 1110-1-1802. It is not theintent of this manual to duplicate material discussed inexisting manuals. However, discussions provided inEM 1110-1-1804 and EM 1110-1-1802 apply to both soiland rock. In this respect, this manual will briefly sum-marize those methods and techniques available for investi-gating project sites with rock foundations.
Section IPreliminary Studies
3-3. General
Prior to implementing a detailed site investigation pro-gram, certain types of preliminary information will havebeen developed. The type and extent of informationdepends on the cost and complexity of the project. The
information is developed from a thorough survey of exist-ing information and field reconnaissance. Information ontopography, geology and potential geologic hazards, sur-face and ground-water hydrology, seismology, and rockmass characteristics are reviewed to determine thefollowing:
Adequacy of available data.
Type and extent of additional data that will beneeded.
The need for initiating critical long-term studies,such as ground water and seismicity studies, thatrequire advance planning and early action.
Possible locations and type of geologic featuresthat might control the design of project features.
3-4. Map Studies
Various types of published maps can provide an excellentsource of geologic information to develop the regionalgeology and geological models of potential or final sites.The types of available maps and their uses are describedby Thompson (1979) and summarized in EM 1110-1-1804. EM 1110-1-1804 also provides sources for obtain-ing published maps.
3-5. Other Sources of Information
Geotechnical information and data pertinent to the projectcan frequently be obtained from a careful search of fed-eral, state, or local governments as well as private indus-try in the vicinity. Consultation with private geotechnicalengineering firms, mining companies, well drilling anddevelopment companies and state and private universitystaff can sometimes provide a wealth of information.EM 1110-1-1804 provides a detailed listing of potentialsources of information.
3-6. Field Reconnaissance
After a complete review of available geotechnical data, ageologic field reconnaissance should be made to gatherinformation that can be obtained without subsurfaceexploration. The primary objective of this initial fieldreconnaissance is to, insofar as possible, confirm, corrector expand geologic and hydrologic information collectedfrom preliminary office studies. If rock outcrops arepresent, the initial field reconnaissance offers an opportu-nity to collect preliminary information on rock mass con-ditions that might influence the design and construction of
3-1

EM 1110-1-290830 Nov 94
project features. Notation should be made of the strikeand dip of major joint sets, joint spacing, joint conditions(i.e. weathering, joint wall roughness, joint tightness, jointinfillings, and shear zones), and joint continuity.EM 1110-1-1804, Murphy (1985), and Chapter 4 of thismanual provide guidance as to special geologic features aswell as hydrologic and cultural features which should alsobe noted.
Section IIField Investigations
3-7. General
This section briefly discusses those considerations nec-essary for completion of a successful field investigationprogram. The majorities of these considerations are dis-cussed in detail in EM 1110-1-1804 and in Chapter 4 ofthis manual. In this respect, the minimum componentsthat should be considered include geologic mapping, geo-physical exploration, borings, exploratory excavations, andinsitu testing. The focus of geologic data to be obtainedwill evolve as site characteristics are ascertained.
3-8. Geologic Mapping
In general, geologic mapping progresses from the prelimi-nary studies phase with collection of existing maps andinformation to detailed site-specific construction mapping.Types of maps progress from areal mapping to site map-ping to construction (foundation specific) mapping.
a. Areal mapping. An areal map should consist ofsufficient area to include the project site(s) as well as thesurrounding area that could influence or could be influ-enced by the project. The area and the degree of detailmapped can vary widely depending on the type and sizeof project and on the geologic conditions. Geologic fea-tures and information of importance to rock foundationsthat are to be mapped include:
(1) Faults, joints, shear zones, stratigraphy.
(2) Ground-water levels, springs, surface water orother evidence of the ground-water regime.
(3) Potential cavities due to karstic formations,mines, and tunnels.
(4) Potential problem rocks subject to dissolving,swelling, shrinking, and/or erosion.
(5) Potential rock slope instability.
(6) Gas, water, and sewer pipe lines as well as otherutilities.
b. Site mapping. Site maps should be large-scaledwith detailed geologic information of specific sites ofinterest within the project area to include proposed struc-ture areas. Detailed description of the geologic featuresof existing rock foundation materials and overburdenmaterials is essential in site mapping and subsequentexplorations. The determination and description of thesubsurface features must involve the coordinated andcooperative efforts of all geotechnical professionalsresponsible for the project design and construction.
c. Construction mapping. During construction, it isessential to map the “as built” geologic foundation condi-tions as accurately as possible. The final mapping isusually accomplished after the foundation has beencleaned up and just prior to the placement of concrete orbackfill. Accurate location of foundation details is neces-sary. Permanent and easily identified planes of referenceshould be used. The system of measurement should tieto, or incorporate, any new or existing structure resting onthe rock foundation. Foundation mapping should alsoinclude a comprehensive photographic record. A founda-tion map and photographic record will be made for theentire rock foundation and will be incorporated into thefoundation report (ER 1110-1-1801). These maps andphotographs have proved to be valuable where there werecontractor claims, where future modifications to the pro-ject became necessary, or where correction of a malfunc-tion or distress of the operational structure requiresdetailed knowledge of foundation conditions.
3-9. Geophysical Explorations
Geophysical techniques consist of making indirectmeasurements on the ground surface, or in boreholes, toobtain generalized subsurface information. Geologicinformation is obtained through analysis or interpretationof these measurements. Boreholes or other subsurfaceexplorations are needed for reference and control whengeophysical methods are used. Geophysical explorationsare of greatest value when performed early in the fieldexploration program in combination with limited subsur-face explorations. The explorations are appropriate for arapid, though approximate, location and correlation ofgeologic features such as stratigraphy, lithology, discon-tinuities, ground water, and for the in-situ measurement ofdynamic elastic moduli and rock densities. The cost ofgeophysical explorations is generally low compared withthe cost of core borings or test pits, and considerablesavings may be realized by judicious use of these
3-2

EM 1110-1-290830 Nov 94
methods. The application, advantages, and limitations ofselected geophysical methods are summarized inEM 1110-1-1804. EM 1110-1-1802 provides detailedguidance on the use and interpretation of surface andsubsurface methods.
3-10. Borings
Borings, in most cases, provide the only viable explora-tory tool that directly reveals geologic evidence of thesubsurface site conditions. In addition to exploring geo-logic stratigraphy and structure, borings are necessary toobtain samples for laboratory engineering property tests.Borings are also frequently made for other uses to includecollection of ground-water data, perform in-situ tests,install instruments, and explore the condition of existingstructures. Boring methods, techniques, and applicationsare described in EM 1110-1-1804 and EM 1110-2-1907.Of the various boring methods, rock core borings are themost useful in rock foundation investigations.
a. Rock core boring. Rock core boring is the processin which diamond or other types of core drill bits are usedto drill exploratory holes and retrieve rock core. If prop-erly performed, rock core can provide an almost continu-ous column of rock that reflects actual rock massconditions. Good rock core retrieval with a minimum ofdisturbance requires the expertise of an experienced drillcrew.
(1) Standard sizes and notations of diamond coredrill bits are summarized in EM 1110-1-1804. Core bitsthat produce 2.0 inch (nominal) diameter core (i.e., NWor NQ bit sizes) are satisfactory for most explorationwork in good rock as well as provide sufficient size sam-ples for most rock index tests such as unconfined com-pression, density, and petrographic analysis. However,the use of larger diameter core bits ranging from 4.0 to6.0 inches (nominal) in diameter are frequently requiredto produce good core in soft, weak and/or fractured strata.The larger diameter cores are also more desirable forsamples from which rock strength test specimens areprepared; particularly strengths of natural discontinuities.
(2) While the majorities of rock core borings aredrilled vertically, inclined borings and in some casesoriented cores are required to adequately define stratifi-cation and jointing. Inclined borings should be used toinvestigate steeply inclined jointing in abutments andvalley sections for dams, along spillway and tunnel align-ments, and in foundations of all structures. In near verti-cal bedding, inclined borings can be used to reduce thetotal number of borings needed to obtain core samples of
all strata. Where precise geological structure is requiredfrom core samples, techniques involving oriented coresare sometimes employed. In these procedures, the core isscribed or engraved with a special drilling tool so that itsorientation is preserved. In this manner, both the dip andstrike of any joint, bedding plane, or other planar surfacecan be ascertained.
(3) The number of borings and the depths to whichbore holes should be advanced are dependent upon thesubsurface geological conditions, the project site areas,types of projects and structural features. Where rockmass conditions are known to be massive and of excellentquality, the number and depth of boring can be minimal.Where the foundation rock is suspected to be highly vari-able and weak, such as karstic limestone or sedimentaryrock containing weak and compressible seams, one ormore boring for each major load bearing foundation ele-ment may be required. In cases where structural loadsmay cause excessive deformation, at least one of theboreholes should be extended to a depth equivalent to anelevation where the structure imposed stress acting withinthe foundation material is no more than 10 percent of themaximum stress applied by the foundation. Techniquesfor estimating structure induced stresses with depth arediscussed in Chapter 5 of this manual.
(4) Core logging and appropriate descriptors describ-ing the rock provide a permanent record of the rock massconditions. Core logging procedures and appropriate rockdescriptors are discussed in EM 1110-1-1804, ER 1110-1-1802, Murphy (1985), and Chapter 4 of this manual.Examples of core logs are provided in Appendix D ofEM 1110-1-1804. A color photographic record of all coresamples should be made in accordance withER 1110-1-1802.
(5) The sidewalls of the borehole from which thecore has been extracted offer a unique picture of thesubsurface where all structural features of the rock forma-tion are still in their original position. This view of therock can be important when portions of rock core havebeen lost during the drilling operation, particularly weakseam fillers, and when the true dip and strike of the struc-tural features are required. Borehole viewing and photog-raphy equipment include borescopes, photographiccameras, TV cameras, sonic imagery loggers, caliperloggers, and alinement survey devices. EP 1110-1-10provides detailed information on TV and photographicsystems, borescope, and televiewer. Sonic imagery andcaliper loggers are discussed in detail in EM 1110-1-1802.General discussions of borehole examination techniquesare also provided in EM 1110-1-1804.
3-3

EM 1110-1-290830 Nov 94
b. Large-diameter borings. Large-diameter borings,2 feet or more in diameter, are not frequently used. How-ever, their use permits direct examination of the sidewallsof the boring or shaft and provides access for obtaininghigh-quality undisturbed samples. These advantages areoften the principal justification for large-diameter borings.Direct inspection of the sidewalls may reveal details, suchas thin weak layers or old shear planes, that may not bedetected by continuous undisturbed sampling. Augers arenormally used in soils and soft rock, and percussion drills,roller bits, or the calyx method are used in hard rock.
3-11. Exploratory Excavations
Test pits, test trenches, and exploratory tunnels provideaccess for larger-scaled observations of rock mass charac-ter, for determining top of rock profile in highly weath-ered rock/soil interfaces, and for some in-situ tests whichcannot be executed in a smaller borehole.
a. Test pits and trenches. In weak or highly frac-tured rock, test pits and trenches can be constructedquickly and economically by surface-type excavationequipment. Final excavation to grade where samples areto be obtained or in-situ tests performed must be donecarefully. Test pits and trenches are generally used onlyabove the ground-water level. Exploratory trench excava-tions are often used in fault evaluation studies. An exten-sion of a bedrock fault into much younger overburdenmaterials exposed by trenching is usually considered proofof recent fault activity.
b. Exploratory tunnels. Exploratory tunnels/aditspermit detailed examination of the composition and geom-etry of rock structures such as joints, fractures, faults,shear zones, and solution channels. They are commonlyused to explore conditions at the locations of large under-ground excavations and the foundations and abutments oflarge dam projects. They are particularly appropriate indefining the extent of marginal strength rock or adverserock structure suspected from surface mapping and boringinformation. For major projects where high-intensityloads will be transmitted to foundations or abutments,tunnels/adits afford the only practical means for testinginplace rock at locations and in directions correspondingto the structure loading. The detailed geology of explor-atory tunnels, regardless of their purpose, should bemapped carefully. The cost of obtaining an accurate andreliable geologic map of a tunnel is usually insignificantcompared with the cost of the tunnel. The geologic infor-mation gained from such mapping provides a very usefuladditional dimension to interpretations of rock structurededuced from other sources. A complete picture of the
site geology can be achieved only when the geologic dataand interpretations from surface mapping, borings, andpilot tunnels are combined and well correlated. Whenexploratory tunnels are strategically located, they canoften be incorporated into the permanent structure.Exploratory tunnels can be used for drainage and postcon-struction observations to determine seepage quantities andto confirm certain design assumptions. On some projects,exploratory tunnels may be used for permanent access orfor utility conduits.
3-12. In-Situ Testing
In-situ tests are often the best means for determining theengineering properties of subsurface materials and, insome cases, may be the only way to obtain meaningfulresults. Table 3-1 lists in-situ tests and their purposes.In-situ rock tests are performed to determine in-situstresses and deformation properties of the jointed rockmass, shear strength of jointed rock mass or criticallyweak seams within the rock mass, residual stresses withinthe rock mass, anchor capacities, and rock mass perme-ability. Large-scaled in-situ tests tend to average out theeffect of complex interactions. In-situ tests in rock arefrequently expensive and should be reserved for projectswith large, concentrated loads. Well-conducted tests maybe useful in reducing overly conservative assumptions.Such tests should be located in the same general area as aproposed structure and test loading should be applied inthe same direction as the proposed structural loading.In-situ tests are discussed in greater detail in EM 1110-1-1804, the Rock Testing Handbook, and in Chapter 5 ofthis manual.
Section IIILaboratory Testing
3-13. General
Laboratory tests are usually performed in addition to andafter field observations and tests. These tests serve todetermine index values for identification and correlation,further refining the geologic model of the site and theyprovide values for engineering properties of the rock usedin the analysis and design of foundations and cut slopes.
3-14. Selection of Samples and Tests
The selection of samples and the number and type of testsare influenced by local subsurface conditions and the sizeand type of structure. Prior to any laboratory testing, rockcores should have been visually classified and logged.
3-4

EM 1110-1-290830 Nov 94
Table 3-1Summary of Purpose and Type of In-Situ Tests for Rock
Purpose of Test Type of Test
Strength Field Vane Shear1
Direct ShearPressuremeter2
Uniaxial Compressive2
Borehole Jacking2
Bearing Capacity Plate Bearing1
Standard Penetration1
Stress Conditions Hydraulic FracturingPressuremeterOvercoringFlat JackUniaxial (Tunnel) Jacking2
Chamber (Gallery) Pressure2
Mass Deformability Geophysical (Refraction)3
Pressuremeter or DilatometerPlate BearingUniaxial (Tunnel) Jacking2
Borehole Jacking2
Chamber (Gallery) Pressure2
Anchor Capacity Anchor/Rockbolt Loading
Rock Mass Permeability Constant HeadRising or Falling HeadWell Slug PumpingPressure Injection
Notes:1. Primarily for clay shales, badly decomposed, or moderately
soft rocks, and rock with soft seams.2. Less frequently used.3. Dynamic deformability.
Selection of samples and the type and number of tests canbest be accomplished after development of the geologicmodel using results of field observations and examinationof rock cores, together with other geotechnical dataobtained from earlier preliminary investigations. Thegeologic model, in the form of profiles and sections, willchange as the level of testing and the number of testsprogresses. Testing requirements are also likely to changeas more data become available and are reviewed for
project needs. The selection of samples and type of testaccording to required use of the test results and geologicalcondition is discussed in Chapter 4 of this manual. Addi-tional guidance can be found in EM 1110-2-1902,TM 5-818-1, EM 1110-2-2909, EM 1110-1-1804,Nicholson (1983), Goodman (1976), and Hoek and Bray(1974).
3-15. Laboratory Tests
Table 3-2 summarizes laboratory tests according to pur-pose and type. The tests listed are the types more com-monly performed for input to rock foundation analysesand design process. Details and procedures for individualtest types are provided in the Rock Testing Handbook.Laboratory rock testing is discussed in Chapter 4 of thismanual and in EM 1110-1-1804.
Table 3-2Summary of Purpose and Type of In-Situ Tests for Rock
Purpose of Test Type of Test
Strength Uniaxial CompressionDirect ShearTriaxial CompressionDirect TensionBrazilian SplitPoint Load1
Deformability Uniaxial CompressionTriaxial CompressSwellCreep
Permeability Gas Permeability
Characterization Water ContentPorosityDensity (Unit Weight)Specific GravityAbsorptionReboundSonic VelocitiesAbrasion Resistance
Notes:1. Point load tests are also frequently performed in the field.
3-5
EM 1110-1-290830 Nov 94
Chapter 4Rock Mass Characterization
4-1. Scope
This chapter provides guidance in the description andengineering classification of intact rock and rock masses,the types, applications and analyses of rock property tests,the evaluation of intact rock and rock mass properties,and the selection of design parameters for project struc-tures founded on rock. Rock mass characterization refersto the compilation of information and data to build a com-plete conceptual model of the rock foundation in whichall geologic features that might control the stability ofproject structures, as well as the physical properties ofthose features, are identified and defined. The compila-tion of information and data is a continual process. Theprocess starts with the preliminary site investigations andis expanded and refined during site exploration, laboratoryand field testing, design analyses, construction and, insome cases, operation of the project structure. The orderof information and data development generally reflects adistrict’s approach to the process but usually evolves fromgeneralized information to the specific details required bythe design process. Furthermore, the level of detailrequired is dependent upon the project structure and therock mass foundation conditions. For these reasons, thischapter is subdivided into five topic areas according totypes of information rather than according to a sequenceof tasks. Topic areas include geologic descriptions, engi-neering classification, shear strength parameters, bearingcapacity parameters, and deformation and settlementparameters. The five topic areas provide required input tothe analytical design processes described in Chapters 5, 6,7, and 8.
4-2. Intact Rock versus Rock Mass
The in-situ rock, or rock mass, is comprised of intactblocks of rock separated by discontinuities such as joints,bedding planes, folds, sheared zones and faults. Theserock blocks may vary from fresh and unaltered rock tobadly decomposed and disintegrated rock. Under appliedstress, the rock mass behavior is generally governed bythe interaction of the intact rock blocks with the disconti-nuities. For purposes of design analyses, behavioralmechanisms may be assumed as discontinuous (e.g. slid-ing stability) or continuous (e.g. deformation andsettlement).
Section IGeologic Descriptions
4-3. General
Geologic descriptions contain some especially importantqualitative and quantitative descriptive elements for intactrock and rock masses. Such descriptors are used primar-ily for geologic classification, correlation of stratigraphicunits, and foundation characterization. A detailed descrip-tion of the foundation rock, its structure, and the conditionof its discontinuities can provide valuable insights intopotential rock mass behavior. Geologic descriptors can,for convenience of discussion, be divided into two groups:descriptors commonly used to describe rock core obtainedduring site exploration core boring and supplementaldescriptors required for a complete description of the rockmass. Descriptive elements are often tailored to specificgeologic conditions of interest. In addition to generalgeologic descriptors, a number of rock index tests arefrequently used to aid in geologic classification andcharacterization.
4-4. Rock Core Descriptors
Rock core descriptors refer to the description of apparentcharacteristics resulting from a visual and physical inspec-tion of rock core. Rock core descriptors are recorded onthe drilling log (ENG Form 1836) either graphically or bywritten description. Descriptions are required for theintact blocks of rock, the rock mass structure (i.e., frac-tures and bedding) as well as the condition and type ofdiscontinuity. Criteria for the majorities of these descrip-tive elements are contained in Table B-2 of EM 1110-1-1804, Table 3-5 of EM 1110-1-1806, and Murphy (1985).Table 4-1 summarizes, consolidates, and, in someinstances, expands descriptor criterion contained in theabove references. Figures D-6 and D-7 of EM 1110-1-1804 provide examples of typical rock core logs. Thefollowing discussions provide a brief summary of theengineering significance associated with the more impor-tant descriptors.
a. Unit designation. Unit designation is usually aninformal name assigned to a rock unit that does not neces-sarily have a relationship to stratigraphic rank (e.g. Miamioolite or Chattanooga shale).
4-1

EM 1110-1-290830 Nov 94
Table 4-1Summary of Rock Descriptors
1. Intact Blocks of Rock
a. Degree of Weathering.
(1) Unweathered: No evidence of any chemical or mechanical alteration.
(2) Slightly weathered: Slight discoloration on surface, slight alteration along discontinuities, less than 10 percent of the rockvolume altered.
(3) Moderately weathered: Discoloring evident, surface pitted and altered with alteration penetrating well below rock surfaces,weathering “halos” evident, 10 to 50 percent of the rock altered.
(4) Highly weathered: Entire mass discolored, alteracation pervading nearly all of the rock with some pockets of slightly weatheredrock noticeable, some minerals leached away.
(5) Decomposed: Rock reduced to a soil with relicit rock texture, generally molded and crumbled by hand.
b. Hardness.
(1) Very soft: Can be deformed by hand.
(2) Soft: Can be scratched with a fingernail.
(3) Moderately hard: Can be scratched easily with a knife.
(4) Hard: Can be scratched with difficulty with a knife.
(5) Very hard: Cannot be scratched with a knife.
c. Texture.
(1) Sedimentary rocks:
Texture Grain Diameter Particle Name Rock Name
* 80 mm cobble conglomerate* 5 - 80 mm gravel
Coarse grained 2 - 5 mmMedium grained 0.4 - 2 mm sand sandstoneFine grained 0.1 - 0.4 mmVery fine grained 0.1 mm clay, silt shale, claystone,
siltstone____________________________________________________________________________
* Use clay-sand texture to describe conglomerate matrix.
(2) Igneous and metamorphic rocks:
Texture Grain Diameter
Coarse grained 5 mmMedium grained 1 - 5 mmFine grained 0.1 - 1 mmAphanite 0.1 mm
(Continued)
4-2

EM 1110-1-290830 Nov 94
Table 4-1. (Continued)
(3) Textural adjectives: Use simple standard textural adjectives such as prophyritic, vesicular, pegmatitic, granular, and grains welldeveloped, but not sophisticated terms such as holohyaline, hypidimorphic granular, crystal loblastic, andcataclastic.
d. Lithology Macro Description of Mineral Components.
Use standard adjectives such as shaly, sandy, silty, and calcareous. Note inclusions, concretions, nodules, etc.
2. Rock Structure
a. Thickness of Bedding.
(1) Massive: 3-ft thick or greater.
(2) Thick bedded: beds from 1- to 3-ft thick.
(3) Medium bedded: beds from 4 in. to 1-ft thick.
(4) Thin bedded: 4-in. thick or less.
b. Degree of Fracturing (Jointing).
(1) Unfractured: fracture spacing - 6 ft or more.
(2) Slightly fractured: fracture spacing - 2 to 6 ft.
(3) Moderately fractured: fracture spacing - 8 in. to 2 ft.
(4) Highly fractured: fracture spacing - 2 in. to 8 in.
(5) Intensely fractured: fracture spacing - 2 in. or less.
c. Dip of Bed or Fracture.
(1) Flat: 0 to 20 degrees.
(2) Dipping: 20 to 45 degrees.
(3) Steeply dipping: 45 to 90 degrees.
3. Discontinuities
a. Joints.
(1) Type: Type of joint if it can be readily determined (i.e., bedding, cleavage, foliation, schistosity, or extension).
(2) Degree of joint wall weathering:
(i) Unweathered: No visible signs are noted of weathering; joint wall rock is fresh, crystal bright.
(ii) Slightly weathered joints: Discontinuities are stained or discolored and may contain a thin coating of altered material.Discoloration may extend into the rock from the discontinuity surfaces to a distance of up to 20 percent of the discontinuityspacing.
(iii) Moderately weathered joints: Slight discoloration extends from discontinuity planes for greater than 20 percent of thediscontinuity spacing. Discontinuities may contain filling of altered material. Partial opening of grain boundaries may beobserved.
(Continued)
4-3
EM 1110-1-290830 Nov 94
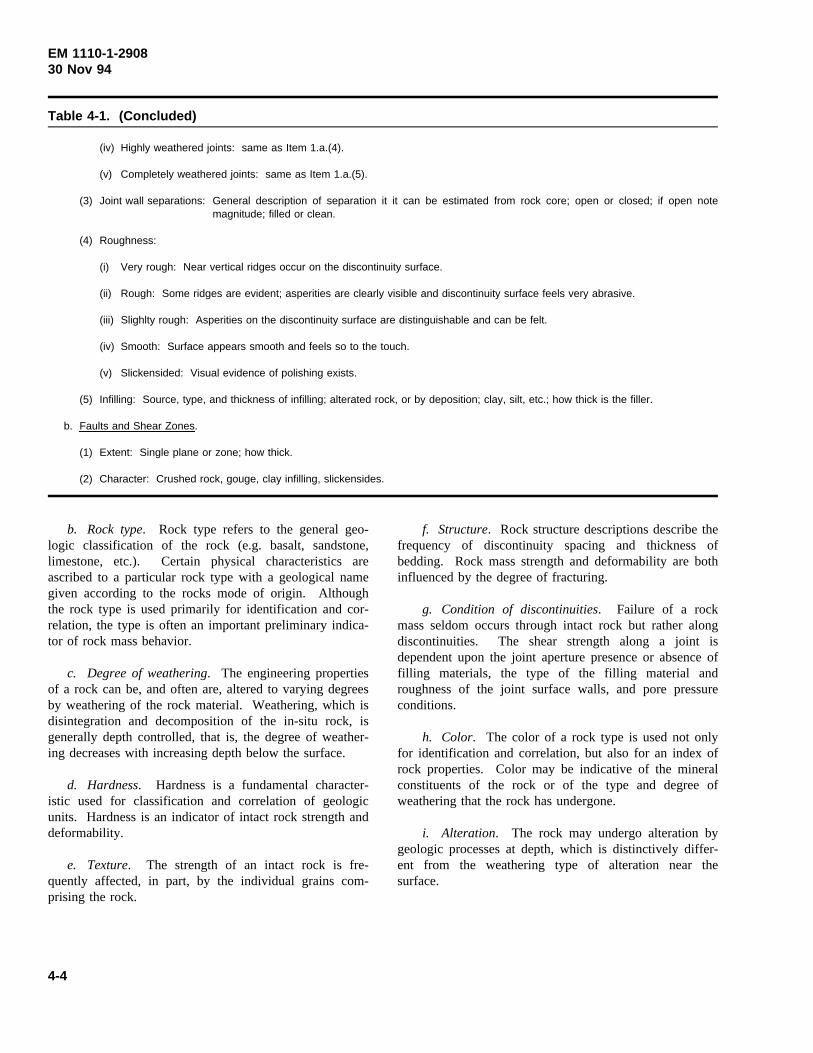
Table 4-1. (Concluded)
(iv) Highly weathered joints: same as Item 1.a.(4).
(v) Completely weathered joints: same as Item 1.a.(5).
(3) Joint wall separations: General description of separation it it can be estimated from rock core; open or closed; if open notemagnitude; filled or clean.
(4) Roughness:
(i) Very rough: Near vertical ridges occur on the discontinuity surface.
(ii) Rough: Some ridges are evident; asperities are clearly visible and discontinuity surface feels very abrasive.
(iii) Slighlty rough: Asperities on the discontinuity surface are distinguishable and can be felt.
(iv) Smooth: Surface appears smooth and feels so to the touch.
(v) Slickensided: Visual evidence of polishing exists.
(5) Infilling: Source, type, and thickness of infilling; alterated rock, or by deposition; clay, silt, etc.; how thick is the filler.
b. Faults and Shear Zones.
(1) Extent: Single plane or zone; how thick.
(2) Character: Crushed rock, gouge, clay infilling, slickensides.
b. Rock type. Rock type refers to the general geo-logic classification of the rock (e.g. basalt, sandstone,limestone, etc.). Certain physical characteristics areascribed to a particular rock type with a geological namegiven according to the rocks mode of origin. Althoughthe rock type is used primarily for identification and cor-relation, the type is often an important preliminary indica-tor of rock mass behavior.
c. Degree of weathering. The engineering propertiesof a rock can be, and often are, altered to varying degreesby weathering of the rock material. Weathering, which isdisintegration and decomposition of the in-situ rock, isgenerally depth controlled, that is, the degree of weather-ing decreases with increasing depth below the surface.
d. Hardness. Hardness is a fundamental character-istic used for classification and correlation of geologicunits. Hardness is an indicator of intact rock strength anddeformability.
e. Texture. The strength of an intact rock is fre-quently affected, in part, by the individual grains com-prising the rock.
f. Structure. Rock structure descriptions describe thefrequency of discontinuity spacing and thickness ofbedding. Rock mass strength and deformability are bothinfluenced by the degree of fracturing.
g. Condition of discontinuities. Failure of a rockmass seldom occurs through intact rock but rather alongdiscontinuities. The shear strength along a joint isdependent upon the joint aperture presence or absence offilling materials, the type of the filling material androughness of the joint surface walls, and pore pressureconditions.
h. Color. The color of a rock type is used not onlyfor identification and correlation, but also for an index ofrock properties. Color may be indicative of the mineralconstituents of the rock or of the type and degree ofweathering that the rock has undergone.
i. Alteration. The rock may undergo alteration bygeologic processes at depth, which is distinctively differ-ent from the weathering type of alteration near thesurface.
4-4

EM 1110-1-290830 Nov 94
4-5. Supplemental Descriptors
Descriptors and descriptor criterion discussed in para-graph 4-4 and summarized in Table 4-1 can be readilyobtained from observation and inspection of rock core.However, certain important additional descriptors cannotbe obtained from core alone. These additional descriptorsinclude orientation of discontinuities, actual thicknesses ofdiscontinuities, first-order roughness of discontinuities,continuity of discontinuities, cavity details, and slakedurability.
a. Orientation of discontinuities. Because discon-tinuities represent directional planes of weakness, theorientation of the discontinuity is an important consider-ation in assessing sliding stability and, to some extent,bearing capacity and deformation/settlement. Retrievedcore, oriented with respect to vertical and magnetic north,provides a means for determining discontinuity orienta-tion. A number of manufacturers market devices for thispurpose. However, most of these techniques abound withpractical difficulties (e.g. see Hoek and Bray 1974). Thesidewalls of the borehole from which conventional corehas been extracted offer a unique picture of the subsurfacewhere all structural features of the rock mass are still intheir original position. In this respect, techniques thatprovide images of the borehole sidewalls such as theborehole camera, the borescope, TV camera or sonicimagery (discussed in Chapter 3, EM 1110-1-1804,EP 1110-1-10, and EM 1110-1-1802) offer an ideal meansof determining the strike and dip angles of discontinuities.The orientation of the discontinuity should be recorded ona borehole photo log. The poles of the planes defined bythe strike and dip angles of the discontinuities should thenbe plotted on an equal area stereonet. Equal area stereo-net pole plots permit a statistical evaluation of discontinu-ity groupings or sets, thus establishing likely bounds ofstrike and dip orientations. A stereographic projectionplot should then be made of the bounding discontinuityplanes for each set of discontinuities to assess thoseplanes which are kinematically free to slide. Goodman(1976), Hoek and Bray (1974), and Priest (1985) offerguidance for stereonet pole plots and stereographic projec-tion techniques.
b. Discontinuity thickness. The drilling and retrievingof a rock core frequently disturb the discontinuity sur-faces. For this reason, aperture measurements of disconti-nuity surfaces obtained from rock core can be misleading.The best source for joint aperture information is fromdirect measurement of borehole surface images (e.g. bore-hole photographs and TV camera recordings). The actualaperture measurement should be recorded on a borehole
photo log. An alternative to recording actual measure-ments is to describe aperture according to the followingdescriptors:
(1) Very tight: separations of less than 0.1 mm.
(2) Tight: separations between 0.1 and 0.5 mm.
(3) Moderately open: separations between 0.5 and2.5 mm.
(4) Open: separations between 2.5 and 10 mm.
(5) Very wide: separations between 10 and 25 mm.
For separations greater than 25 mm the discontinuityshould be described as a major discontinuity.
c. First-order roughness of discontinuities. First-order roughness refers to the overall, or large scale, asper-ities along a discontinuity surface. Figure 4-1 illustratesthe difference between first-order large scale asperitiesand the smaller, second-order asperities commonly associ-ated with roughnesses representative of the rock corescale. The first-order roughness is generally the majorcontributor to shear strength development along a discon-tinuity (see paragraph 4-14b below for further discussion).A description of this large scale roughness can only beevaluated from an inspection of exposed discontinuitytraces or surfaces. An inspection of rock outcrops in thevicinity of the project site offers an inexpensive means ofobtaining this information. Critically oriented joint sets,for which outcrops are not available, may require excava-tion of inspection adits or trenches. Descriptors such asstepped, undulating, or planar should be used to describenoncritical surfaces. For critically oriented discontinuities,the angles of inclination, (referred to as thei angle)between the average dip of the discontinuity and first-order asperities should be measured and recorded
Figure 4-1. Rough discontinuity surface with first-order and second-order asperities (after Patton andDeere 1970)
4-5

EM 1110-1-290830 Nov 94
(Figure 4-1). Hoek and Bray (1974) provide guidance formeasuring first-order asperity angles.
d. Continuity of discontinuities. The continuity of ajoint influences the extent to which the intact rock mate-rial and the discontinuities separately affect the behaviorof the rock mass. In essence, the continuity, or lack ofcontinuity, determines whether the strength that controlsthe stability of a given structure is representative of adiscontinuous rock surface or a combination of discontin-uous surfaces and intact rock. For the case of retainingstructures, such as gravity dams and lockwalls, a disconti-nuity is considered fully continuous if its length is greaterthan the base width in the direction of potential sliding.
e. Cavities. Standard rock coring procedures arecapable of detecting the presence of cavities as well astheir extent along the borehole axis. However, an evalua-tion of the volumetric dimensions requires three-dimensional inspection. Downhole TV cameras, withtheir relatively long focal lengths, provide a means forinspecting cavities. Rock formations particularly suscepti-ble to solutioning (e.g. karstic limestone, gypsum, andanhydrite) may require excavation of inspection trenchesor adits to adequately define the location and extent ofmajor cavities. A description of a cavity should includeits geometric dimensions, the orientation of any elongatedfeatures, and the extent of any infilling as well as the typeof infilling material.
4-6. Index Tests
Intact samples of rock may be selected for index testingto further aid in geological classification and as indicatorsof rock mass behavior. As a matter of routine, certaintests will always be performed on representative coresfrom each major lithological unit and/or weathered class.The number of tests should be sufficient to characterizethe range of properties. Routine tests include water con-tent, unit weight, and unconfined compression tests.Additional tests for durability, tensile strength, specificgravity, absorption, pulse velocity, and ultrasonic elasticconstants and permeability tests as well as a petrographicexamination may be dictated by the nature of the rock orby the project requirements. Types of classification andindex tests which are frequently used for rock are listed inTable 4-2.
Section IIRock Mass Classification
4-7. General
Following an appropriate amount of site investigation therock mass can be divided or classified into zones ormasses of similar expected performance. The similarperformance may be excavatability, strength, deformabil-ity, or any other characteristic of interest, and is deter-mined by use of all of the investigative tools previouslydescribed. A good rock mass classification system will:
Divide a particular rock mass into groups ofsimilar behavior.
Provide a basis for understanding the character-istics of each group.
Facilitate planning and design by yielding quanti-tative data required for the solution of real engi-neering problems.
Provide a common basis for effective communi-cation among all persons concerned with a givenproject.
A meaningful and useful rock mass classification systemmust be clear and concise, using widely accepted termi-nology. Only the most significant properties, based onmeasured parameters that can be derived quickly andinexpensively, should be included. The classificationshould be general enough that it can be used for a tunnel,slope, or foundation. Because each feature of a rock mass(i.e. discontinuities, intact rock, weathering, etc.) has adifferent significance, a ranking of combined factors isnecessary to satisfactorily describe a rock mass. Eachproject may need site-specific zoning or rock mass classi-fication, or it may benefit from use of one of the popularexisting systems.
4-8. Available Classification Systems
Numerous rock mass classification systems have beendeveloped for universal use. However, six have enjoyedgreater use. The six systems include Terzaghi’s RockLoad Height Classification (Terzaghi 1946); Lauffer’s
4-6

EM 1110-1-290830 Nov 94
Table 4-2Laboratory Classification and Index Tests for Rock
Test Test Method Remarks
Unconfined (uniaxial) RTH1 111 Primary index test for strength andcompression deformability of intact rock; required
input to rock mass classificationsystems.
Point load test RTH 325 Indirect method to determine uncon-fined compressive (UC) strength; canbe performed in the field on corepieces unsuitable for UC tests.
Water content RTH 106 Indirect indication of porosity ofintact rock or clay content of sedi-mentary rock.
Unit weight and total RTH 109 Indirect indication of weatheringporosity and soundness.
Splitting strength of rock RTH 113 Indirect method to determine the ten-(Brazilian tensile sile strength of intact rock.strength method)
Durability ASTM2 D- Index of weatherability of rock ex-4644 posed in excavations.
Specific gravity of solids RTH 108 Indirect indication of soundness ofrock intended for use as riprap anddrainage aggregate.
Pulse velocities and RTH 110 Index of compressional wave velocityelastic constants and ultrasonic elastic constants for
correlation with in-situ geophysicaltest results.
Rebound number RTH 105 Index of relative hardness of intactrock cores.
Permeability RTH 114 Intact rock (no joints or majordefects).
Petrographic examination RTH 102 Performed on representative cores ofeach significant lithologic unit.
Specific gravity and RTH 107 Indirect indication of soundness andabsorption deformability
Notes:1. Rock Testing Handbook.2. American Society for Testing and Materials.
Classification (Lauffer 1958); Deere’s Rock QualityDesignation (RQD) (Deere 1964); RSR Concept (Wick-ham, Tiedemann, and Skinner 1972); GeomechanicsSystem (Bieniawski 1973); and the Q-System (Barton,Lien, and Lunde 1974). Most of the above systems wereprimarily developed for the design of underground exca-vations. However, three of the above six classificationsystems have been used extensively in correlation withparameters applicable to the design of rock foundations.These three classification systems are the Rock QualityDesignation, Geomechanics System, and the Q-System.
4-9. Rock Quality Designation
Deere (1964) proposed a quantitative index obtaineddirectly from measurements of rock core pieces. Thisindex, referred to as the Rock Quality Designation (RQD),is defined as the ratio (in percent) of the total length ofsound core pieces 4 in. (10.16 cm) in length or longer tothe length of the core run. The RQD value, then, is ameasure of the degree of fracturing, and, since the ratiocounts only sound pieces of intact rock, weathering isaccounted for indirectly. Deere (1964) proposed the
4-7

EM 1110-1-290830 Nov 94
following relationship between the RQD index and theengineering quality of the rock mass. The determinationof RQD during core recovery is simple and straight-forward. The RQD index is internationally recognized
RQD, percent Rock Quality
< 25 Very poor25 < 50 Poor50 < 75 Fair75 < 90 Good90 < 100 Excellent
as an indicator of rock mass conditions and is a necessaryinput parameter for the Geomechanic System andQ-System. Since core logs should reflect to the maxi-mum extent possible the rock mass conditions encoun-tered, RQD should be determined in the field andrecorded on the core logs. Deere and Deere (1989) pro-vides the latest guidance for determining RQD.
4-10. Geomechanics Classification
a. General. The Geomechanics Classification, orRock Mass Rating (RMR) system, proposed byBieniawski (1973), was initially developed for tunnels. Inrecent years, it has been applied to the preliminary designof rock slopes and foundations as well as for estimatingthe in-situ modulus of deformation and rock massstrength. The RMR uses six parameters that are readilydetermined in the field:
• Uniaxial compressive strength of the intact rock.
• Rock Quality Designation (RQD).
• Spacing of discontinuities.
• Condition of discontinuities.
• Ground water conditions.
• Orientation of discontinuities.
All but the intact rock strength are normally determined inthe standard geological investigations and are entered onan input data sheet (see Table B-1, Appendix B). Theuniaxial compressive strength of rock is determined inaccordance with standard laboratory procedures but can bereadily estimated on site from the point-load strengthindex (see Table 4-2).
b. Basic RMR determination. The input data sheet(Table B-1, Appendix B) summarizes, for each core hole,all six input parameters. The first five parameters (i.e.strength, RQD, joint spacing, joint conditions, and groundwater) are used to determine the basic RMR. Importanceratings are assigned to each of the five parameters inaccordance with Part A of Table B-2, Appendix B. Inassigning the rating for each core hole, the average condi-tions rather than the worst are considered. The impor-tance ratings given for joint spacings apply to rock masseshaving three sets of joints. Consequently, a conservativeassessment is obtained when only two sets of discontinu-ities are present. The basic rock mass rating is obtainedby adding up the five parameters listed in Part A ofTable B-2, Appendix B.
c. Adjustment for discontinuity orientation. Adjust-ment of the basic RMR value is required to include theeffect of the strike and dip of discontinuities. The adjust-ment factor (a negative number) and hence the final RMRvalue, will vary depending upon the engineering applica-tion and the orientation of the structure with respect to theorientation of the discontinuities. The adjusted values,summarized in Part B of Table B-2, Appendix B, aredivided into five groups according to orientations whichrange from very favorable to very unfavorable. Thedetermination of the degree of favorability is made byreference to Table B-3 for assessment of discontinuityorientation in relation to dams (Part A), and tunnels(Part B).
d. Rock mass class. After the adjustment is made inaccordance with Part B, Table B-2, Appendix B, the rockmass ratings are placed in one of five rock mass classesin Part C, Table B-2, Appendix B. Finally, the ratings aregrouped in Part D of Table B-2, Appendix B. This sec-tion gives the practical meaning of each rock class, and aqualitative description is provided for each of the fiverock mass classes. These descriptions range from “verygood rock” for class I (RMR range from 81 to 100) to“very poor rock” for class V (RMR ranges < 20). Thisclassification also provides a range of cohesion values andfriction angles for the rock mass.
4-11. Q-System
The Q-system, proposed by Barton, Lien, and Lunde(1974) was developed specifically for the design of tunnelsupport systems. As in the case of the GeomechanicsSystem, the Q-system has been expanded to provide pre-liminary estimates. Likewise, the Q-system incorporates
4-8

EM 1110-1-290830 Nov 94
the following six parameters and the equation for obtain-ing rock mass qualityQ:
• Rock Quality Designation (RQD).
• Number of discontinuity sets.
• Roughness of the most unfavorable discontinuity.
• Degree of alteration or filling along the weakestdiscontinuity.
• Water inflow.
• Stress condition.
(4-1)Q (RQD/Jn) × (Jr /Ja) × (Jw/SRF)
where
RQD = Rock Quality Designation
Jn = joint set number
Jr = joint roughness number
Ja = joint alteration number
Jw = joint water reduction number
SRF = stress reduction number
Table B-4, Appendix B, provides the necessary guidancefor assigning values to the six parameters. Depending onthe six assigned parameter values reflecting the rock massquality, Q can vary between 0.001 to 1000. Rock qualityis divided into nine classes ranging from exceptionallypoor (Q ranging from 0.001 to 0.01) to exceptionallygood (Q ranging from 400 to 1000).
4-12. Value of Classification Systems
There is perhaps no engineering discipline that relies moreheavily on engineering judgment than rock mechanics.This judgment factor is, in part, due to the difficulty intesting specimens of sufficient scale to be representativeof rock mass behavior and, in part, due to the naturalvariability of rock masses. In this respect, the real valueof a rock mass classification systems is appropriatelysummarized by Bieniawski (1979). “...no matter whichclassification system is used, the very process of rockmass classification enables the designer to gain a better
understanding of the influence of the various geologicparameters in the overall rock mass behavior and, hence,gain a better appreciation of all the factors involved in theengineering problem. This leads to better engineeringjudgment. Consequently, it does not really matter thatthere is no general agreement on which rock classificationsystem is best; it is better to try two or more systems and,through a parametric study, obtain a better “feel” for therock mass. Rock mass classification systems do notreplace site investigations, material descriptions, and geo-logic work-up. They are an adjunct to these items andthe universal schemes, in particular, have special value inrelating the rock mass in question to engineering param-eters based on empirical knowledge.”
Section IIIShear Strength
4-13. General
The shear strength that can be developed to resist slidingin a rock foundation or a rock slope is generally con-trolled by natural planes of discontinuity rather than theintact rock strength. The possible exception to this rulemay include structures founded on, or slopes excavated in,weak rock or where a potential failure surface is definedby planes of discontinuities interrupted by segments ofintact rock blocks. Regardless of the mode of potentialfailure, the selection of shear strength parameters for usein the design process invariably involves the testing ofappropriate rock specimens. Selection of the type of testbest suited for intact or discontinuous rock, as well asselection of design shear strength parameters, requires anappreciation of rock failure characteristics. Discussionson rock failure characteristics are contained in TR GL-83-13 (Nicholson 1983a) and Goodman (1980).
4-14. Rock Failure Characteristics
Failure of a foundation or slope can occur through theintact rock, along discontinuities or through filling mate-rial contained between discontinuities. Each mode offailure is defined by its own failure characteristics.
a. Intact rock. At stress levels associated with lowhead gravity dams, retaining walls and slopes, virtually allrocks behave in a brittle manner at failure. Brittle failureis marked by a rapid increase in applied stress, with smallstrains, until a peak stress is obtained. Further increasesin strain cause a rapid decrease in stress until the residualstress value is reached. While the residual stress value isgenerally unique for a given rock type and minor princi-pal stress, the peak stress is dependent upon the size of
4-9

EM 1110-1-290830 Nov 94
the specimen and the rate that the stress is applied. Fail-ure envelopes developed from plots of shear stress versusnormal stress are typically curvilinear.
b. Discontinuities. The typical failure envelope for aclean discontinuous rock is curvilinear as is intact rock.Surfaces of discontinuous rock are composed of irregu-larities or asperities ranging in roughness from almostsmooth to sharply inclined peaks. Conceptually there arethree modes of failure--asperity override at low normalstresses, failure through asperities at high normal stresses,and a combination of asperity override and failure throughasperities at intermediate normal stresses. Typically,those normal stresses imposed by Corps structures aresufficiently low that the mode of failure will be controlledby asperity override. The shear strength that can bedeveloped for the override mode is scale dependent.Initiation of shear displacement causes the override modeto shift from the small scale second-order irregularities tothe large scale first-order irregularities. As indicated inFigure 4-1, first-order irregularities generally have smallerangles of inclination (i angles) than second-order irregu-larities. Shear strengths of discontinuities with roughundulating surfaces reflect the largest scale effects withsmall surface areas (laboratory specimen size) developinghigher shear stress than large surface areas (in-situ scale).Figure 4-2 illustrates the influence of both scale effectsand discontinuity surface roughnesses.
Figure 4-2. Effect of different size specimens selectedalong a rough and a smooth discontinuity surface(after Deere et al. 1967)
c. Filled discontinuities. Failure modes of filleddiscontinuities can range from those modes associated
with clean unfilled discontinuities to those associated withsoil. Four factors contribute to their strength behavior:thickness of the filler material, material type, stresshistory and displacement history.
(1) Thickness. Research indicates that the strengthof discontinuities with filler thicknesses greater than twotimes the amplitude of the surface undulations is control-led by the strength of the filler material. In general, thethicker the filler material with respect to the amplitude ofthe asperities, the less the scale effects.
(2) Material type. The origin of the filler materialand the strength characteristics of the joint are importantindicators. Sources of filler material include products ofweathering or overburden washed into open, water-conducting discontinuities; precipitation of minerals fromthe ground water; by-products of weathering and alter-ations along joint walls; crushing of parent rock surfacesdue to tectonic and shear displacements; and thin seamsdeposited during formation. In general, fine-grained claysare more frequently found as fillers and are more trouble-some in terms of structural stability.
(3) Stress history. For discontinuities containingfine-grained fillers, the past stress history determineswhether the filler behaves as a normally consolidated oroverconsolidated soil.
(4) Displacement history. An important consider-ation in determining the strength of discontinuities filledwith fine-grained cohesive materials is whether or not thediscontinuity has been subjected to recent displacement.If significant displacement has occurred, it makes littledifference whether the material is normally or over-consolidated since it will be at or near its residualstrength.
4-15. Failure Criteria
a. Definition of failure. The term “failure” asapplied to shear strength may be described in terms ofload, stress, deformation, strain or other parameters. Thefailure strengths typically associated with the assessmentof sliding stability are generally expressed in terms ofpeak, residual, ultimate or as the shear strength at a limit-ing strain or displacement as illustrated in Figure 4-3.
4-10

EM 1110-1-290830 Nov 94
The appropriate definition of failure generally depends on
Figure 4-3. Shear test failure as defined by peak, ulti-mate, and residual stress levels (after Nicholson 1983a)
the shape of the shear stress versus shear deformation/strain curve as well as the mode of potential failure.Figure 4-4 illustrates the three general shear stress versusdeformation curves commonly associated with rockfailure.
b. Linear criteria. Failure criteria provide an alge-braic expression for relating the shear strength at failurewith a mathematical model necessary for stability analy-sis. Mathematical limit equilibrium models used to accesssliding stability incorporate linear Mohr-Coulomb failurecriterion as follows:
(4-2)τf c σn tan φ
where
τf = the shearing stress developed at failure
σn = stress normal to the failure plane
The c and φ parameters are the cohesion intercept andangle of internal friction, respectively. Figure 4-5 illu-strates the criterion. It must be recognized that failureenvelopes developed from shear tests on rock are gener-ally curved. However, with proper interpretation, failure
Figure 4-4. Hypothetical shear stress-deformationcurves from drained direct shear tests on: (a) strain-softening; (b) elastic-plastic; and (c) strain-hardeningmaterials (after Nicholson 1983a)
envelopes over most design stress ranges can be closelyapproximated by the linear Coulomb equation required bythe analytical stability model.
c. Bilinear criteria. Bilinear criteria (Patton 1966;Goodman 1980) offer a more realistic representation ofthe shear stress that can be developed along clean(unfilled) discontinuities. These criteria divide a typicalcurved envelope into two linear segments as illustrated inFigure 4-6. The maximum shear strength that can bedeveloped at failure is approximated by the followingequations:
(4-3)τf σn tan (φu i )
and(4-4)τf ca σn tan φr
where
τf = maximum (peak) shear strength at failure
σn = stress normal to the shear plane (discontinuity)
4-11

EM 1110-1-290830 Nov 94
Figure 4-5. Mohr-Coulomb relationship with respect toprincipal stresses and shear stress
φu = the basic friction angle on smooth planar slidingsurface
i = angle of inclination of the first order (major)asperities
φr = the residual friction angle of the material com-prising the asperities
ca = the apparent cohesion (shear strength intercept)derived from the asperities
For unweathered discontinuity surfaces, the basic frictionangle and the residual friction angle are, for practicalpurposes, the same. The intercept of the two equations(i.e. στ in Figure 4-6) occurs at the transition stressbetween the modes of failure represented by asperityoverride and shearing of the asperities. Normal stressesimposed by Corps projects are below the transition stress(στ) for the majority of rock conditions encountered.Hence, maximum shear strengths predicted by Equa-tion 4-3, generally control design.
4-16. Shear Strength Tests
Table 4-3 lists tests that are useful for measuring theshear strength of rock. Details of the tests, test apparatus,and procedures are given in the Rock Testing Handbook(see references Table 4-3), EM 1110-1-1804, and GL-83-14 (Nicholson 1983b.).
Figure 4-6. Typical approximate bilinear and real curvi-linear failure envelopes for modeled discontinuousrock
4-17. Shear Strength Testing Program
The testing program for measuring shear strengths of rockspecimens reflects the intended use of the test results(preliminary or final design), the type of specimens (intactor discontinuous), the cost, and, in some cases, the avail-ability of testing devices. In general, the testing programclosely parallels the field exploration program, advancingfrom preliminary testing where modes of potential failureare poorly defined to detailed testing of specific modes ofpotential failure controlling project design. As a mini-mum, the following factors should be considered prior toinitiating the final detailed phase of testing: the sensi-tivity of stability with respect to strengths, loading condi-tions, suitability of tests used to model modes of failure,and the selection of appropriate test specimens.
a. Sensitivity. A sensitivity analysis should be per-formed to evaluate the relative sensitivity of the shearstrengths required to provide an adequate calculated factorof safety along potential failure planes. Such analysisfrequently indicates that conservative and inexpensivelyobtained strengths often provide an adequate measure ofstability, without the extra cost of more precisely definedin-situ strengths.
4-12

EM 1110-1-290830 Nov 94
Table 4-3Tests to Measure Shear Strength of Rock
Test Reference Remarks
Laboratory direct shear RTH 2031 Strength along planes of weakness(bedding), discontinuities orrock-concrete contact; notrecommended for intact rock.
Laboratory triaxial RTH 202 Deformation and strength ofinclined compression planes ofweakness and discontinuities;strain and strength ofintact rock.
In-situ direct shear RTH 321 Expensive; generally reserved forcritically located discontinuitiesfilled with a thin seam of veryweak material.
In-situ uniaxial RTH 324 Expensive; primarily used fordefining compression scale effectsof weak intact rock; severalspecimen sizes usually tested.
Notes:1. Rock Testing Handbook.
b. Loading conditions. Shear tests on rock specimensshould duplicate the anticipated range of normal stressesimposed by the project structure along potential failureplanes. Duplication of the normal stress range is particu-larly important for tests on intact rock, or rough naturaldiscontinuities, that exhibit strong curvilinear failureenvelopes.
c. Shear test versus mode of failure. Both triaxialand direct shear tests are capable of providing shearstrength results for all potential modes of failure. How-ever, a particular type of test may be considered bettersuited for modes of failure. The suitability of test typeswith respect to modes of failure should be considered inspecifying a testing program.
(1) Laboratory triaxial test. The triaxial compressiontest is primarily used to measure the undrained shearstrength and in some cases the elastic properties of intactrock samples subjected to various confining pressures.By orienting planes of weakness the strength of naturaljoints, seams, and bedding planes can also be measured.The oriented plane variation is particularly useful forobtaining strength information on thinly filled discontinu-ities containing soft material. Confining pressures tend toprevent soft fillers from squeezing out of the discontinu-ity. The primary disadvantage of the triaxial test is thatstresses normal to the failure plane cannot be directlycontrolled. Since clean discontinuities are free draining,
tests on clean discontinuities are considered to be drained.Tests on discontinuities filled with fine-grained materialsare generally considered to be undrained (drained tests arepossible but require special testing procedures). Tests ondiscontinuities with coarse grained fillers are generallyconsidered to be drained. Detailed procedures for makinglaboratory triaxial tests are presented in the Rock TestingHandbook (RTH 204).
(2) Laboratory direct shear test. The laboratorydirect shear test is primarily used to measure the shearstrength, at various normal stresses, along planes of dis-continuity or weakness. Although sometimes used to testintact rock, the potential for developing adverse stressconcentrations and the effects from shear box inducedmoments makes the direct shear test less than ideallysuited for testing intact specimens. Specimen drainageconditions, depending on mode of failure, are essentiallythe same as for laboratory triaxial tests discussed above.The test is performed on core samples ranging from 2 to6 inches in diameter. Detailed test procedures are pre-sented in the Rock Testing Handbook (RTH 203).
(3) In-situ direct shear test. In-situ direct shear testsare expensive and are only performed where criticallylocated, thin, weak, continuous seams exist within rela-tively strong adjacent rock. In such cases, conservativelower bound estimates of shear strength seldom provideadequate assurance against instability. The relatively
4-13

EM 1110-1-290830 Nov 94
large surface area tested is an attempt to address unknownscale effects. However, the question of how large a spec-imen is large enough still remains. The test, as performedon thin, fine-grained, clay seams, is considered to be anundrained test. Test procedure details are provided in theRock Testing Handbook (RTH 321). Technical ReportS-72-12 (Zeigler 1972) provides an indepth review of thein-situ direct shear test.
(4) In-situ uniaxial compression test. In-situ uniaxialcompression tests are expensive. The test is used tomeasure the elastic properties and compressive strength oflarge volumes of virtually intact rock in an unconfinedstate of stress. The uniaxial strength obtained is useful inevaluating the effects of scale. However, the test isseldom performed just to evaluate scale effects onstrength.
d. Selection of appropriate specimens. No otheraspect of rock strength testing is more important than theselection of the test specimens that best represents thepotential failure surfaces of a foundation. Engineeringproperty tests conducted on appropriate specimens directlyinfluence the analysis and design of projects. As a proj-ect progresses, team work between project field personneland laboratory personnel is crucial in changing type oftest, test specimen type, and number of tests when siteconditions dictate. The test specimen should be groupedinto rock types and subgrouped by unconfined compres-sive strength, hardness, texture, and structure, or any otherdistinguishing features of the samples. This process willhelp in defining a material’s physical and mechanicalproperties. General guidance on sample selection is pro-vided in EM 1110-1-1804. However, shear strength ishighly dependent upon the mode of failure, i.e. intactrock, clean discontinuous rock, and discontinuities con-taining fillers. Furthermore, it must be realized that eachmode of failure is scale dependent. In this respect, theselection of appropriate test specimens is central to theprocess of selecting design shear strength parameters.
4-18. Selection of Design Shear StrengthParameters
a. Evaluation procedures. The rock mass within aparticular site is subject to variations in lithology, geo-logic structure, and the in-situ stress. Regardless ofattempts to sample and test specimens with flaws and/orweaknesses present in the rock mass, these attempts, atbest, fall short of the goal. The number, orientation, andsize relationship of the discontinuities and/or weaknessesmay vary considerably, thus affecting load distributionand the final results. In addition to these factors, labora-
tory results are dependent on the details of the testingprocedures, equipment, sampling procedures, and thecondition of the sample at the time of the test. The resultof these numerous variables is an expected variation inthe laboratory test values which further complicates theproblem of data evaluation. The conversion from labora-tory measured strength parameters to in-situ strengthparameters requires a careful evaluation and analysis ofthe geologic and laboratory test data. Also, a combinationof experience and judgment is necessary to assess thedegree or level of confidence that is required in theselected parameters. As a minimum, the following shouldbe considered: the most likely mode of prototype failure,the factor of safety, the design use, the cost of tests, andthe consequence of a failure. A flow diagram illustratingexamples of factors to consider in assessing the level ofconfidence in selected design strengths is shown in Fig-ure 4-7. In general, an increase in assessed confidenceshould either reflect increasing efforts to more closelydefine prototype shear strength, at increasing cost, orincreasing conservatism in selected design strengths toaccount for the uncertainties of the in-situ strength.
b. Selection procedures. Failure envelopes for likelyupper and lower bounds of shear strength can generally bedetermined for the three potential modes of failure; intactrock, clean discontinuities, and filled discontinuities.These limits bound the range within which the in-situstrength is likely to lie. Technical Report GL-83-13(Nicholson 1983a) describes appropriate test methods andprocedures to more accurately estimate in-situ strengthparameters. Efforts to more accurately define in-situstrengths must reflect the level of confidence that isrequired by the design.
(1) Intact rock. Plots of shear stress versus normalstress, from shear test on intact rock, generally result inconsiderable data scatter. In this respect, nine or moretests are usually required to define both the upper andlower bounds of shear strength. Figure 4-8 shows a plotof shear stress versus normal stress for a series of tests ona weak limestone. Failure envelopes obtained from aleast-squares best fit of upper and lower bounds, as wellas all data points, are shown in Figure 4-8. Variations incohesion values are generally greater than the variationsin the friction angle values. With a sufficient number oftests to define scatter trends, over a given range of normalstresses the confidence that can be placed in the frictionangle value exceeds the level of confidence that can beplaced in the cohesion value. As a rule, a sufficient fac-tor of safety can be obtained from lower bound
4-14

EM 1110-1-290830 Nov 94
Figure 4-7. Flow diagram illustrating examples of factors to consider in assessing the confidence to be placed inselected design strengths (after Nicholson 1983a)
estimates of shear strength obtained from laboratory tests.For design cases where lower bound shear strength esti-mates provide marginal factors of safety, the influence ofscale effects must be evaluated. Shear strengths obtainedfrom laboratory tests on small specimens should bereduced to account for scale effects. In this respect, Prattet al. (1972) and Hoek and Brown (1980) suggest that thefull- scale uniaxial compressive strength of intact rock canbe as much as 50 percent lower than the uniaxial com-pressive strength of a small intact laboratory specimen.In the absence of large scale tests to verify the effects ofscale, conservative estimates of the shear strength param-eters (cohesion and friction angle) which account for scaleeffects can be obtained by reducing the lower boundcohesion value by 50 percent. This reduced lower bound
cohesion value is to be used with the lower bound frictionangle value for marginal design cases.
(2) Clean discontinuities. Upper and lower boundsof shear strength for clean discontinuities can be obtainedfrom laboratory tests on specimens containing naturaldiscontinuities and presawn shear surfaces, respectively.The number of tests required to determine the bounds ofstrength depends upon the extent of data scatter observedin plots of shear stress versus normal stress. As a rule,rough natural discontinuity surfaces will generate moredata scatter than smooth discontinuity surfaces. Hence,lower bound strengths obtained from tests on smoothsawn surfaces may require as few as three tests whileupper bound strength from tests on very rough natural
4-15

EM 1110-1-290830 Nov 94
Figure 4-8. Direct shear test results on intact lime-stone illustrating upper and lower bounds of datascatter
engineering judgment can not be overly emphasized.discontinuity surfaces may require nine or more tests.Data scatter and/or curvilinear trends in plots of shearstress versus normal stress may result in cohesion inter-cepts. In such cases, cohesion intercepts are ignored inthe selection of design shear strengths. The lower boundfailure envelope obtained from shear tests on smoothsawn surfaces defines the basic friction angle (φu in Equa-tion 4-3). The friction angle selected for design may beobtained from the sum of the basic friction angle and anangle representative of the effective angle of inclination (iin Equation 4-3) for the first-order asperities. The sum ofthe two angles must not exceed the friction angle obtainedfrom the upper bound shear tests on natural discontinu-ities. The primary difficulty in selecting design frictionvalues lies in the selection of an appropriatei angle.Discontinuity surfaces or outcrop traces of discontinuitiesare not frequently available from which to base a reason-able estimate of first order inclination angles. In suchcases estimates of thei angle must rely on sound engi-neering judgment and extensive experience in similargeology.
(3) Filled discontinuities. In view of the wide varietyof filler materials, previous stress and displacement
histories and discontinuity thicknesses, standardization ofa procedure for selecting design shear strengths repre-sentative of filled discontinuities is difficult. The processis further complicated by the difficulty in retrieving qual-ity specimens that are representative of the discontinuityin question. For these reasons, the use of sound Uncer-tainties associated with unknown conditions effectingshear strength must be reflected in increased conserva-tism. Generally, the scale effects associated withdiscontinuous rock are lessened as the filler materialbecomes thicker in relation to the amplitude of the first-order joint surface undulations. However, potential con-tributions of the first-order asperities to the shear strengthof a filled joint are, as a rule, not considered in thestrength selection process because of the difficulty inassessing their effects. Shear strengths that are selectedbased on in-situ direct shear test of critically located weakdiscontinuities are the exception to this general rule, butthere still remains the problem of appropriate specimensize. As illustrated in Figure 4-9, the displacement his-tory of the discontinuity is of primary concern. If a filleddiscontinuity has experienced recent displacement, asevident by the presence of slicken-sides, gouge, mis-matched joint surfaces, or other features, the strengthrepresentative of the joint is at or near its residual value.In such cases, shear strength selection should be based onlaboratory residual shear tests of the natural joint. Possi-ble cohesion intercepts observed from the test resultsshould not be included in the selection of designstrengths. If the discontinuity has not experienced previ-ous displacement, the shear strength is at or near its peakvalue. Therefore, whether the filler material is normallyor overconsolidated is of considerable importance. In thisrespect, the shear stress level used to define failure oflaboratory test specimens is dependent upon the materialproperties of the filler. The following definitions of fail-ure stress are offered as general guidance to be temperedwith sound engineering judgment: peak strength shouldbe used for filler consisting of normally consolidatedcohesive materials and all cohesionless materials; peak orultimate strength is used for filler consisting of overconso-lidated cohesive material of low plasticity; ultimatestrength, peak strength of remolded filler, or residualstrength is used (depending on material characteristics) forfiller consisting of overconsolidated cohesive material ofmedium to high plasticity.
(4) Combined modes. Combined modes of failurerefer to those modes in which the critical failure path isdefined by segments of both discontinuous planes andplanes passing through intact rock. Selection of appro-priate shear strengths for this mode of failure is
4-16

EM 1110-1-290830 Nov 94
Figure 4-9. Simplified division of filled discontinuities into displaced and undisplaced and normally consolidated(NC) and overconsolidated (OC) categories (after Barton 1974)
particularly difficult for two reasons. First, the precent-ages of the failure path defined by discontinuities or intactrock are seldom known. Second, strains/displacementsnecessary to cause failure of intact rock are typically anorder of magnitude (a factor of 10) smaller than those dis-placements associated with discontinuous rock. Hence,peak strengths of the intact rock proportion will alreadyhave been mobilized and will likely be approaching theirresidual strength before peak strengths along the disconti-nuities can be mobilized. For these reasons, selection ofappropriate strengths must be based on sound engineeringjudgment and experience gained from similar projectsconstructed in similar geological conditions. Shearstrength parameters selected for design must reflect theuncertainties associated with rock mass conditions alongpotential failure paths as well as mechanisms of potentialfailure (i.e. sliding along discontinuities versus shearthrough intact rock).
Section IVDeformation and Settlement
4-19. General
The deformational response of a rock mass is important inseismic analyses of dams and other large structures aswell as the static design of gravity and arch dams, tun-nels, and certain military projects. Analytical solutions
for deformation and settlement of rock foundations areinvariably based on the assumption that the rock massbehaves as a continuum. As such, analytical methodsused to compute deformations and the resulting settle-ments are founded on the theory of elasticity. The selec-tion of design parameters, therefore, involves the selectionof appropriate elastic properties: Poisson’s ratio and theelastic modulus. Although it is generally recognized thatthe Poisson’s ratio for a rock mass is scale and stressdependent, a unique value is frequently assumed. Formost rock masses, Poisson’s ratio is between 0.10 and0.35. As a rule, a poorer quality rock mass has a lowerPoisson’s ratio than good quality rock. Hence, thePoisson’s ratio for a highly fractured rock mass may beassumed as 0.15 while the value for a rock mass withessentially no fractures may be assumed as equal to thevalue of intact rock. A method for determining Poisson’sratios for intact rock core specimens is described in theRock Testing Handbook (RTH 201). The selection of anappropriate elastic modulus is the most important parame-ter in reliable analytical predictions of deformation andsettlement. Rock masses seldom behave as an ideal elas-tic material. Furthermore, modulus is both scale andstress dependent. As a result, stress-strain responsestypical of a rock mass are not linear. The remaining partsof this section will address appropriate definitions ofmodulus, scale effects, available methods for estimatingmodulus values and the selection of design values.
4-17

EM 1110-1-290830 Nov 94
4-20. Moduli Definitions
The elastic modulus relates the change in applied stress tothe change in the resulting strain. Mathematically, it isexpressed as the slope of a given stress-strain response.Since a rock mass seldom behaves as an ideal linearelastic material, the modulus value is dependent upon theproportion of the stress-strain response considered. Fig-ure 4-10 shows a stress-strain curve typical of an in-siturock mass containing discontinuities with the variousmoduli that can be obtained. Although the curve, asshown, is representative of a jointed mass, the curve isalso typical of intact rock except that upper part of thecurve tends to be concaved downward at stress levelsapproaching failure. As can be seen in Figure 4-10 thereare at least four portions of the stress-strain curve usedfor determining in-situ rock mass moduli: the initialtangent modulus, the elastic modulus, the tangent recoverymodulus, and the modulus of deformation.
Figure 4-10. Stress-strain curve typical of in-situ rockmass with various moduli that can be obtained
a. Initial tangent modulus. The initial tangentmodulus is determined from the slope of a line con-structed tangent to the initial concave upward section ofthe stress-strain curve (i.e. line 1 in Figure 4-10). Theinitial curved section reflects the effects of discontinuity
closure in in-situ tests and micro-crack closure in tests onsmall laboratory specimens.
b. Elastic modulus. Upon closure of discontinuities/micro-cracks, the stress-strain becomes essentially linear.The elastic modulus, frequently referred to as the modulusof elasticity, is derived from the slope of this linear (ornear linear) portion of the curve (i.e. line 2 in Fig-ure 4-10). In some cases, the elastic modulus is derivedfrom the slope of a line constructed tangent to the stress-strain curve at some specified stress level. The stresslevel is usually specified as 50 percent of the maximumor peak stress.
c. Recovery modulus. The recovery modulus isobtained from the slope of a line constructed tangent tothe initial segment of the unloading stress-strain curve(i.e. line 3 in Figure 4-10). As such, the recovery mod-ulus is primarily derived from in-situ tests where testspecimens are seldom stressed to failure.
d. Modulus of deformation. Each of the abovemoduli is confined to specific regions of the stress-straincurve. The modulus of deformation is determined fromthe slope of the secant line established between zero andsome specified stress level (i.e. line 4 in Figure 4-10).The stress level is usually specified as the maximum orpeak stress.
4-21. Test Methods for Estimating Modulus
There are at least nine different test methods available toestimate rock modulus. While all nine methods have beenused in estimating modulus for design purpose, only thefollowing seven have been standardized: the uniaxialcompression tests; uniaxial-jacking tests; the pressure-meter test; plate load test; pressure-chamber tests; radial-jack tests; and borehole-jacking tests. Other test methodsthat are not standardized but are described in the literatureinclude flat-jack tests and tunnel-relaxation tests.
a. Uniaxial compression tests. Laboratory uniaxialcompression tests are the most frequently used tests forestimating rock modulus. These tests are performed onrelatively small, intact, specimens devoid of discontinu-ities. As such, the results obtained from these tests overestimate the modulus values required for design analyses.Laboratory tests are useful in that the derived moduliprovide an upper limit estimate. In-situ uniaxial compres-sion tests are capable of testing specimens of sufficientsize to contain a representative number of discontinuities.Modulus values obtained from in-situ tests are consideredto be more reliable. This test method is more versatile
4-18
EM 1110-1-290830 Nov 94
than some in-situ methods in that test specimens can bedeveloped from any exposed surface. However, the testsare expensive. The Rock Testing Handbook describes testprocedures for both laboratory (RTH 201) and in-situ(RTH 324) uniaxial compression tests for the estimationof modulus.
b. Uniaxial jacking tests. The uniaxial jack testinvolves the controlled loading and unloading of opposingrock surfaces developed in a test adit or trench. Theloads are applied by means of large hydraulic jacks whichreact against two opposing bearing pads. Measurement ofthe rock mass deformational response below the bearingpads provides two sets of data from which moduli can bederived. The test is expensive. However, the majority ofthe expense is associated with the excavation of the nec-essary test adit or trench. The test procedures aredescribed in the Rock Testing Handbook (RTH 365).
c. Pressure meter tests. The pressure meter testexpands a fluid filled flexible membrane in a boreholecausing the surrounding wall of rock to deform. Thefluid pressure and the volume of fluid equivalent to thevolume of displaced rock are recorded. From the theoryof elasticity, pressure and volume changes are related tothe modulus. The primary advantage of the pressuremeter is its low cost. The test is restricted to relativelysoft rock. Furthermore, the test influences only a rela-tively small volume of rock. Hence, modulus valuesderived from the tests are not considered to be representa-tive of rock mass conditions. The test procedures aredescribed in the Rock Testing Handbook (RTH 362).
d. Plate load tests. The plate load test is essentiallythe same as the uniaxial jacking test except that only onesurface is generally monitored for deformation. If suffi-cient reaction such as grouted cables can be provided, thetest may be performed on any rock surface. Details ofthe test procedures are discussed in the Rock TestingHandbook (RTH 364-89).
e. Flat-jack tests. The flat-jack test is a simple testin which flat-jacks are inserted into a slot cut into a rocksurface. Deformation of the rock mass caused by pressur-izing the flat-jack is measured by the volumetric changein the jack fluid. The modulus is derived from relation-ships between jack pressure and deformation. However,analysis of the test results is complicated by boundaryconditions imposed by the test configuration. The pri-mary advantages of the test lie in its ability to load alarge volume of rock and its relatively low cost. The testprocedures are described by Lama and Vutukuri (1978).
f. Pressure-chamber tests. Pressure-chamber testsare performed in large, underground openings. Generally,these openings are test excavations such as exploratorytunnels or adits. Pre-existing openings, such as caves ormine chambers, can be used if available and applicable toproject conditions. The opening is lined with an imper-meable membrane and subjected to hydraulic pressure.Instrumented diametrical gages are used to record changesin tunnel diameter as the pressure load increases. The testis usually performed through several load-unload cycles.The data are subsequently analyzed to develop load-deformation curves from which a modulus can beobtained. The test is capable of loading a large volumeof a rock mass from which a representative modulus canbe obtained. The test, however, is extremely expensive.The test procedures are described in the Rock TestingHandbook (RTH-361).
g. Radial jacking tests. Radial jacking test is a mod-ification of the pressure chamber test where pressure isapplied through a series of jacks placed close to eachother. While the jacking system varies, the most commonsystem consists of a series of flat-jacks sandwichedbetween steel rings and the tunnel walls. The Rock Test-ing Handbook (RTH-367) describes the test procedures.
h. Borehole-jacking tests. Instead of applying a uni-form pressure to the full cross-section of a borehole as inpressuremeter tests, the borehole-jack presses platesagainst the borehole walls using hydraulic pistons,wedges, or flatjacks. The technique allows the applicationof significantly higher pressures required to deform hardrock. The Goodman Jack is the best known device forthis test. The test is inexpensive. However, the testinfluences only a small volume of rock and theoreticalproblems associated with stress distribution at the plate/rock interface can lead to problems in interpretation of thetest results. For these reasons, the borehole-jacking testsare considered to be index tests rather than tests fromwhich design moduli values can be estimated. The testsare described in the Rock Testing Handbook (RTH-368).
i. Tunnel relaxation tests. Tunnel relaxation testsinvolve the measurement of wall rock deformationscaused by redistribution of in-situ stresses during tunnelexcavation. Except for a few symmetrically shaped open-ings with known in-situ stresses, back calculations toobtain modulus values from observed deformations gener-ally require numerical modeling using finite element orboundary element computer codes. The high cost of thetest is associated with the expense of tunnel excavation.
4-19

EM 1110-1-290830 Nov 94
4-22. Other Methods for Estimating Modulus
In addition to test methods in which modulus values arederived directly from stress-strain responses of rock, thereare at least two additional methods frequently used toobtain modulus values. The two methods include seismicand empirical methods.
a. Seismic methods. Seismic methods, both downholeand surface, are used on occasion to determine the in-situmodulus of rock. The compressional wave velocity ismathematically combined with the rock’s mass density toestimate a dynamic Young’s modulus, and the shear wavevelocity is similarly used to estimate the dynamic rigiditymodulus. However, since rock particle displacement is sosmall and loading transitory during these seismic tests, theresulting modulus values are nearly always too high.Therefore, the seismic method is generally considered tobe an index test. EM 1110-1-1802 and Goodman (1980)describe the test.
b. Empirical methods. A number of empiricalmethods have been developed that correlate various rockquality indices or classification systems to in-situ modu-lus. The more commonly used include correlationsbetween RQD, RMR and Q.
(1) RQD correlations. Deere, Merritt, and Coon(1969) developed an empirical relationship for the in-situmodulus of deformation according to the followingformula:
(4-5)Ed [ (0.0231)(RQD) 1.32] Et50
where
Ed = in-situ modulus of deformation
RQD = Rock Quality Designation (in percent)
Et50 = laboratory tangent modulus at 50 percent ofthe unconfined compressive strength
From Equation 4-5 it can be seen that the relationship isinvalid for RQD values less than approximately 60 per-cent. In addition, the relationship was developed fromdata that indicated considerable variability between in-situmodulus, RQD, and the laboratory tangent modulus.
(2) RMR correlations. A more recent correlationbetween in-situ modulus of deformation and the RMRClassification system was developed by Serafim and
Pereira (1983) that included an earlier correlation byBieniawski (1978).
Ed 10 RMR 1040
where
Ed = in-situ modulus of deformation (in GPa)
RMR = Rock Mass Rating value
Equation 4-6 is based on correlations between modulus ofdeformation values obtained primarily from plate bearingtests conducted on rock masses of known RMR valuesranging from approximately 25 to 85.
(3) Q correlations. Barton (1983) suggested the fol-lowing relationships between in-situ modulus of deforma-tion andQ values:
(4-7a)Ed (mean) 25 log Q
(4-7b)Ed (min.) 10 log Q
(4-7c)Ed (max.) 40 log Q
where
Ed (mean) = mean value of in-situ modulus of defor-mation (in GPa)
Ed (min.) = minimum or lower bound value of in-situ modulus of deformation (in GPa)
Ed (max.) = maximum or upper bound value of in-situ modulus of deformation (in GPa)
Q = rock mass quality value
4-23. Considerations in Selecting DesignModulus Values
Modulus values intended to be representative of in-siturock mass conditions are subject to extreme variations.There are at least three reasons for these variations:variations in modulus definitions, variability in themethods used to estimate modulus, and rock massvariability.
a. Variations in modulus definitions. As noted inparagraph 4-20, the stress-strain responses of rock massesare not linear. Hence, modulus values used in design are
4-20

EM 1110-1-290830 Nov 94
dependent upon the portion of the stress-strain curveconsidered. Because the modulus of deformation incorpo-rates all of the deformation behavior occurring under agiven design stress range, it is the most commonly usedmodulus in analytical solutions for deformation.
b. Variability in methods. Modulus values obtainedfrom tests are not unique in that the value obtaineddepends, for the most part, on the test selected. There areat least two reasons for this non-uniqueness. First, withthe exception of laboratory compression tests, all of themethods discussed above are in-situ tests in which modu-lus values are calculated from suitable linear elastic solu-tions or represent correlations with modulus valuesderived from in-situ tests. Therefore, the validity of agiven method depends to some extent on how well agiven solution models a particular test. Finally, the vol-ume of rock influenced by a particular test is a significantfactor in how well that test reflects in-situ behavior.Recognizing the potential variation in modulus determina-tions, the plate-load test has become the most commonlyused test for deriving the in-situ modulus of deformationfor those projects requiring confidence in estimated valuesrepresentative of in-situ conditions.
c. Rock mass variability. Deformational predictionsof foundation materials underlying major project struc-tures such as gravity and arch dams may require analyti-cal solutions for multilayer media. In this respect, theselection of appropriate design deformation moduli willrequire consideration of not only natural variability withinrock layers but also variability between layers.
4-24. Selection of Design Moduli
As in the selection of design shear strengths, the modulivalues used for design purposes are selected rather thandetermined. The selection process requires sound engi-neering judgment by an experienced team of field andoffice geotechnical professionals. However, unlike shearstrength selection, in which both upper and lower boundsof strength can generally be defined, only the upper boundof the deformation modulus can be readily predicted.This upper bound is derived from unconfined compressiontests on intact rock. In addition, the natural variability ofthe foundation rock as well as the variability in derivedmodulus values observed from available methods used topredict modulus, complicates the selection of representa-tive values of modulus. For these reasons, the selectionprocess should not rely on a single method for estimatingmodulus, but rather the selection process should involve
an intergrated approach in which a number of methods areincorporated. Index tests, such as the laboratory uncon-fined compression test and borehole test devices (Good-man jack, pressuremeter, and dilatometers), are relativelyinexpensive to perform and provide insight as to the natu-ral variability of the rock as well as establish the likelyupper bounds of the in-situ modulus of deformation.Empirical correlations between the modulus of deforma-tion and rock mass classification systems (i.e. Equa-tions 4-5, 4-6, and 4-7) are helpful in establishing likelyranges of in-situ modulus values and provide approximatevalues for preliminary design. Index testing and empiricalcorrelations provide initial estimates of modulus valuesand form the bases for identifying zones of deformablefoundation rock that may adversely effect the performanceof project structures. Sensitivity analyses, in which initialestimates of deformation moduli are used to predict defor-mation response, are essential to define zones critical todesign. The design of structures founded on rock judgedto be critical to performance must either reflect increasingconservatism in the selected modulus of deformationvalues or an increase in large scale in-situ testing (i.e.plate bearing tests, etc.) to more precisely estimate in-situmoduli. The high cost of in-situ tests generally limits thenumber of tests that can be performed. In this respect, itmay not be economically feasible to conduct tests in rockrepresentative of all critical zones; particularly for largeprojects founded on highly variable rock. In such casessite-specific correlations should be developed between themodulus of deformation values derived from both bore-hole index tests and large scale in-situ tests and rock massclassification systems (i.e. either the RMR system or theQ-system). If care is taken in selecting test locations,such correlations provide a basis for extrapolating modu-lus of deformation values that are representative of a widerange of rock mass conditions.
Section VUse of Selected Design Parameters
4-25. General
For use of the selected design parameters, refer to theappropriate chapters as follows:
a. Chapter 5 - Deformation and Settlement (modulusof deformation).
b. Chapter 6 - Bearing Capacity (shear strength).
c. Chapter 7 - Sliding Stability (shear strength).
4-21

EM 1110-1-290830 Nov 94
d. Chapter 8 - Cut Slope Stability in Rock (shearstrength).
e. Chapter 9 - Anchorage Systems (shear strength).
4-22

EM 1110-1-290830 Nov 94
Chapter 5Deformation and Settlement
5-1. Scope
This chapter describes the necessary elements for estimat-ing and treating settlement, or heave, of structures that arecaused by the deformation of the foundation rock. Thischapter is subdivided into four sections. Topic areas forthe four sections include categories of deformation, ana-lytical methods for predicting the magnitude of deforma-tion, estimating allowable magnitudes of deformation, andmethods available for reducing the magnitude ofdeformation.
Section ICategories of Rock Mass Deformation
5-2. General
Deformations that may lead to settlement or heave ofstructures founded on or in rock may be divided into twogeneral categories: time-dependent deformations andtime-independent deformations.
5-3. Time-Dependent Deformations
Time-dependent deformations can be divided into threedifferent groups according to the mechanistic phenomenacausing the deformation. The three groups include con-solidation, swelling, and creep.
a. Consolidation. Consolidation refers to the expul-sion of pore fluids from voids due to an increase in stress.As a rule, consolidation is associated with soils ratherthan rock masses. However, rock masses may containfractures, shear zones, and seams filled with clay or othercompressible soils. Sedimentary deposits with interbed-ded argillaceous rock such as shales and mud stones mayalso be susceptible to consolidation if subjected to suffi-ciently high stresses. Consolidation theory and analyticalmethods for predicting the magnitude of consolidation areaddressed in EM 1110-1-1904 and in Instruction ReportK-84-7 (Templeton 1984).
b. Swelling. Certain expansive minerals, such asmontmorillonite and anhydrite, react and swell in contactwith water. Upon drying, these minerals are also suscep-tible to shrinking. The montmorillonite minerals aregenerally derived from alteration of ferromagnesian min-erals, calcic feldspars, and volcanic rocks and arecommon in soils and sedimentary rocks. Anhydrite
represents gypsum without its water of crystallization andis usually found as beds or seams in sedimentary rock aswell as in close association with gypsum and halite in theevaporite rocks. Guidance on procedures and techniquesfor predicting the behavior of foundations on or in swell-ing minerals is contained in EM 1110-1-1904, TM 5-818-1, and Miscellaneous Paper GL-89-27 (Johnson 1989).
c. Creep. Creep refers to a process in which a rockmass continues to strain with time upon application ofstress. Creep can be attributed to two different mecha-nisms; mass flow and propagation of microfractures.Mass flow behavior is commonly associated with certainevaporite rock types such as halite and potash. Creepassociated with microfracture propagation has beenobserved in most rock types. Figure 5-1 shows a typicalstrain-time curve for various constant stress levels. Asindicated in Figure 5-1, the shapes of the strain-timecurve are a function of the magnitude of the appliedstress. Creep will generally occur if the applied stress iswithin the range associated with nonstable fracture prop-agation. The transition between stable and nonstablefracture propagation varies, depending upon rock type, buttypically is on the order of, at least, 50 percent of theuniaxial compressive strength. Most structures foundedon rock generate stress levels well below the transitionlevel. Hence, creep is generally not a problem for themajority of Corps projects. Structures founded on weakrock are the possible exceptions to this rule. Althoughstandardized procedures are available to estimate creepproperties of intact rock specimens (i.e. RTH-205) whatthese properties mean in terms of rock mass behavior ispoorly understood. For this reason, estimates of creepresponse for structures founded on rock masses requirespecialized studies and, in some cases, research.
Figure 5-1. Postulated strain-time curves at (1) veryhigh maintained stress levels, (2) moderate maintainedstress levels, and (3) high maintained stress levels(from Farmer 1983)
5-1
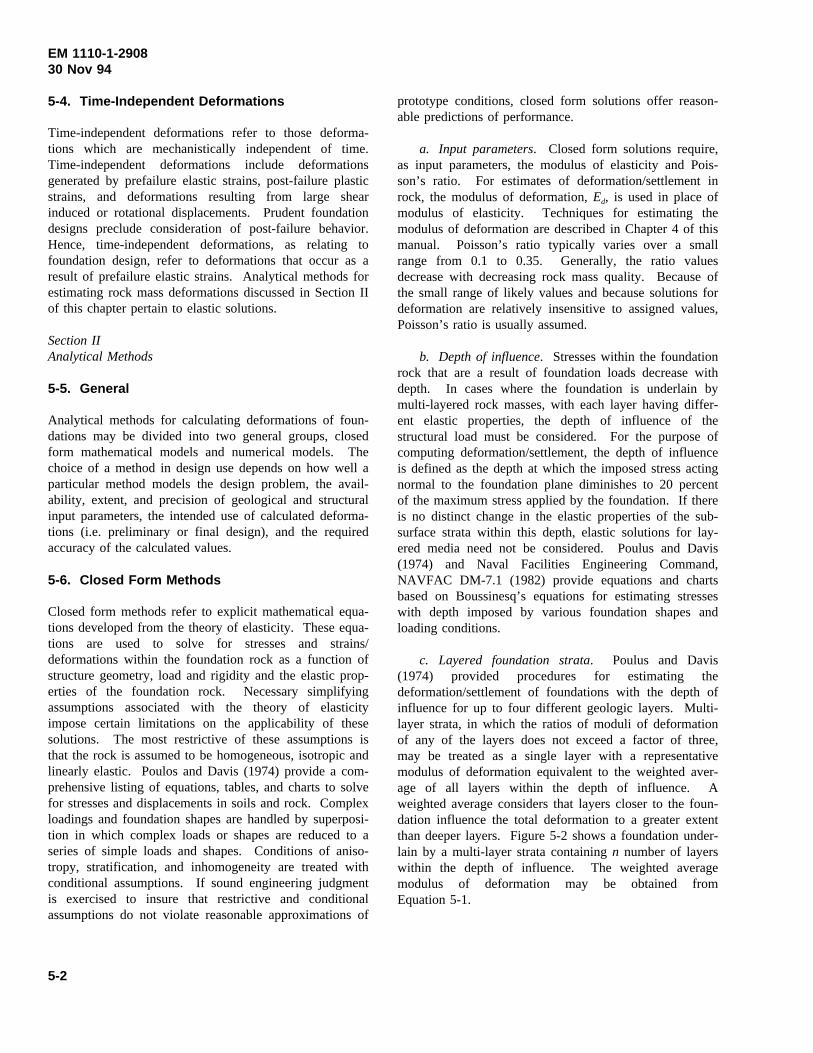
EM 1110-1-290830 Nov 94
5-4. Time-Independent Deformations
Time-independent deformations refer to those deforma-tions which are mechanistically independent of time.Time-independent deformations include deformationsgenerated by prefailure elastic strains, post-failure plasticstrains, and deformations resulting from large shearinduced or rotational displacements. Prudent foundationdesigns preclude consideration of post-failure behavior.Hence, time-independent deformations, as relating tofoundation design, refer to deformations that occur as aresult of prefailure elastic strains. Analytical methods forestimating rock mass deformations discussed in Section IIof this chapter pertain to elastic solutions.
Section IIAnalytical Methods
5-5. General
Analytical methods for calculating deformations of foun-dations may be divided into two general groups, closedform mathematical models and numerical models. Thechoice of a method in design use depends on how well aparticular method models the design problem, the avail-ability, extent, and precision of geological and structuralinput parameters, the intended use of calculated deforma-tions (i.e. preliminary or final design), and the requiredaccuracy of the calculated values.
5-6. Closed Form Methods
Closed form methods refer to explicit mathematical equa-tions developed from the theory of elasticity. These equa-tions are used to solve for stresses and strains/deformations within the foundation rock as a function ofstructure geometry, load and rigidity and the elastic prop-erties of the foundation rock. Necessary simplifyingassumptions associated with the theory of elasticityimpose certain limitations on the applicability of thesesolutions. The most restrictive of these assumptions isthat the rock is assumed to be homogeneous, isotropic andlinearly elastic. Poulos and Davis (1974) provide a com-prehensive listing of equations, tables, and charts to solvefor stresses and displacements in soils and rock. Complexloadings and foundation shapes are handled by superposi-tion in which complex loads or shapes are reduced to aseries of simple loads and shapes. Conditions of aniso-tropy, stratification, and inhomogeneity are treated withconditional assumptions. If sound engineering judgmentis exercised to insure that restrictive and conditionalassumptions do not violate reasonable approximations of
prototype conditions, closed form solutions offer reason-able predictions of performance.
a. Input parameters. Closed form solutions require,as input parameters, the modulus of elasticity and Pois-son’s ratio. For estimates of deformation/settlement inrock, the modulus of deformation,Ed, is used in place ofmodulus of elasticity. Techniques for estimating themodulus of deformation are described in Chapter 4 of thismanual. Poisson’s ratio typically varies over a smallrange from 0.1 to 0.35. Generally, the ratio valuesdecrease with decreasing rock mass quality. Because ofthe small range of likely values and because solutions fordeformation are relatively insensitive to assigned values,Poisson’s ratio is usually assumed.
b. Depth of influence. Stresses within the foundationrock that are a result of foundation loads decrease withdepth. In cases where the foundation is underlain bymulti-layered rock masses, with each layer having differ-ent elastic properties, the depth of influence of thestructural load must be considered. For the purpose ofcomputing deformation/settlement, the depth of influenceis defined as the depth at which the imposed stress actingnormal to the foundation plane diminishes to 20 percentof the maximum stress applied by the foundation. If thereis no distinct change in the elastic properties of the sub-surface strata within this depth, elastic solutions for lay-ered media need not be considered. Poulus and Davis(1974) and Naval Facilities Engineering Command,NAVFAC DM-7.1 (1982) provide equations and chartsbased on Boussinesq’s equations for estimating stresseswith depth imposed by various foundation shapes andloading conditions.
c. Layered foundation strata. Poulus and Davis(1974) provided procedures for estimating thedeformation/settlement of foundations with the depth ofinfluence for up to four different geologic layers. Multi-layer strata, in which the ratios of moduli of deformationof any of the layers does not exceed a factor of three,may be treated as a single layer with a representativemodulus of deformation equivalent to the weighted aver-age of all layers within the depth of influence. Aweighted average considers that layers closer to the foun-dation influence the total deformation to a greater extentthan deeper layers. Figure 5-2 shows a foundation under-lain by a multi-layer strata containingn number of layerswithin the depth of influence. The weighted averagemodulus of deformation may be obtained fromEquation 5-1.
5-2

EM 1110-1-290830 Nov 94
Figure 5-2. Hypothetical foundation underlain by a multilayer strata containing n number of layers within the depthof influence
(5-1)Edw
n
i 1
Ei
i
j 1
hj
n
i 1
1
i
j 1
hj
where
Edw = weighted average modulus ofdeformation
Edi, Edi+1--Edn = modulus of deformation of eachlayer. The ratios of anyEdi,Edi+1---Edn terms <3
hj, hj+1---hn = thickness of each layer
n = Number of layers
d. Solutions for uniformly loaded rectangularfoundations. Rectangular foundations are common shapesfor footings and other structures. Solutions for deforma-tion of uniformly loaded foundations are divided into twocategories, flexible foundations and rigid foundations.
(1) Flexible foundations. Flexible foundations lacksufficient rigidity to resist flexure under load. As indi-cated in Figure 5-3 the maximum deformation of a uni-formly loaded flexible rectangular foundation occurs atthe center of the foundation. The maximum deformation(point a in Figure 5-3) can be estimated from the solutionof Equation 5-2.
(5-2)δa
1.12 qB (1 µ2) (L/B)1/2
Ed
5-3

EM 1110-1-290830 Nov 94
Figure 5-3. Typical deformation profile under a uni-formly loaded, rectangular shaped, flexible foundation
where
δa = maximum deformation (deformation at pointain Figure 5-3)
q = unit load (force/area)
B = foundation width
L = foundation length
µ = Poisson’s ratio of the foundation rock
Ed = modulus of deformation of the foundation rock
Estimates of the deformation of pointsb, c, and d inFigure 5-3 can be obtained by multiplying the estimateddeformation at pointa (Equation 5-2) by a reductionfactor obtained from Figure 5-4.
(2) Rigid foundations. Rigid foundations areassumed to be sufficiently rigid to resist flexure underload. Examples include concrete gravity structures suchas intake and outlet structures. Rigid uniformly loadedfoundations settle uniformly. The estimated deformationcan be obtained by multiplying the maximum estimateddeformation for a flexible foundation of the same dimen-sions from Equation 5-2 by the reduction factor obtainedfrom the average for rigid load curve in Figure 5-4.
Figure 5-4. Reduction factor in percent of settlementunder the center of a flexible rectangular shaped foun-dation (from NAVDOCKS DM-7)
e. Linearly varying loads. In practice, most gravityretaining structures, such as monoliths of gravity damsand lock walls, do not uniformly distribute loads to thefoundation rock. As indicated in Figure 5-5, loading of
Figure 5-5. Assumed linearly varying stressdistribution
5-4

EM 1110-1-290830 Nov 94
these structures may be approximated by assuming line-arly varying load distributions. A complete deformation/settlement analyses require the calculation of deformationsin both the horizontal and vertical planes. Closed formsolutions are available to address linearly varying loads(Poulos and Davis 1974). However, a complete solutionrequires that the loading conditions be divided into anumber of segments. The calculated deformations of eachsegment are summed to provide a complete solution. Inthis respect, closed form solutions are tedious, and,because of simplifying assumptions, provide only approxi-mate solutions.
5-7. Numerical Models
Numerical models refer to those analytical methodswhich, because of their complexity, require the solution ofa large number of simultaneous equations. Such solutionsare only reasonably possible with the aid of a computer.In many cases numerical models provide the only practi-cal alternative for estimating deformation/settlement ofstructures subjected to complicated loading conditionsand/or are founded on anisotropic, nonhomogeneous rock.Numerical approaches can be separated into two generalgroups: discontinuum and continuum.
a. Discontinuum models. Discontinuum modelsfeature numerical approaches involving equations ofmotion for rigid particles or blocks. Such models arefrequently referred to as discrete element models. Disc-ontinuum approaches are primarily used when analyzingthe stability and/or kinematics of one or more independentand recognizable rock blocks. Because the rock blocksare treated as rigid bodies, discontinuum models are notused to analyze magnitudes of rock deformations.
b. Continuum models. Continuum approachesinclude the finite element, finite difference, and boundaryelement methods. All these methods may be used tosolve for estimated magnitudes of deformation/settlement.However, the finite element method is the most popular.Numerical modeling of foundation responses dictates theuse of constitutive relationships which define materialstress-strain behavior. Finite element codes are availablewhich incorporate sophisticated constitutive relationshipscapable of modeling a variety of nonlinear and/or time-dependent stress-strain behavior. Analytical capabilitiesoffered by some of the more sophisticated codes exceedthe ability of the geotechnical engineer to provide mean-ingful material property parameters. For foundation stresslevels and underlying rock types encountered for the
majority of structures, reasonable estimates ofdeformation/settlement can be obtained from linear elasticcodes with the modulus of deformation as the primaryinput parameter. Table 5-1, although not all inclusive,summarizes some of the finite element codes that arecommercially available. The choice of code to use shouldreflect the ability of the code to model the problem athand and the preference of District office geotechnicalprofessionals charged with the responsibility of settlementanalyses.
Section IIIAllowable Settlement
5-8. General
For structures founded on rock, the total deformation/settlement seldom controls design. The design for, orcontrol of, differential settlement between critical elementsof a structure is essential for the proper and safe function-ing of that structure. The total settlement should be com-puted at a sufficient number of points to establish theoverall settlement pattern. From this pattern, the differen-tial settlements can be determined and compared withrecommended allowable values.
5-9. Mass Concrete Structure
Mass concrete structures are uniquely designed and con-structed to meet the needs of a particular project. Thesestructures vary in size, shape, and intended functionbetween projects. As a result, the magnitude of differen-tial settlement that can be tolerated must be establishedfor each structure. Specifications for the allowable mag-nitudes of differential deformation/settlement that can betolerated require the collective efforts of structural andgeotechnical professionals, working together as a team.The magnitude of allowable differential movement shouldbe sufficiently low so as to prevent the development ofshear and/or tensile stresses within the structure in excessof tolerable limits and to insure the proper functioning ofmovable features such as lock and flood control gates.For mass concrete structures founded on soft rock, wherethe modulus of deformation of the rock is significantlyless than the elastic modulus of the concrete, there is atendency for the foundation rock to expand laterally thusproducing additional tensile stresses along the base of thefoundation. Deere et al. (1967) suggested the followingcriteria for evaluating the significance of the ratiosbetween the modulus of deformation of the rock (Edr) andthe elastic modulus of the concrete (Ec):
5-5

EM 1110-1-290830 Nov 94
Table 5-1Summary of Finite Element Programs
Capabilities
Program
2D and 3DSolidElements
BoundaryElements
CrackElements
LinearElasticAnisotropic
NonlinearElastic Plasticity
Viscoelasticor Creep
InteractiveGraphics
ABAQUS X X X X X X
ANSYS X X X X X X X
APPLE-SAP X X X
ASKA X X X X X X X
BEASY X X X
BERSAFE X X X X X X X
BMINES X X X X X X X
DIAL X X X X X X X X
MCAUTOSTRUDL X X X
MSC/NASTRAN X X X X X X X
PAFEC X X X X X X X X
SAP(WES) X X X
E3SAP X X X
NONSAP X X X X X X
TITUS X X X X X X X
a. If Edr/Ec >0.25, then the foundation rock modulushas little effect on stresses generated within the concretemass.
b. If 0.06 <Edr/Ec <0.25, the foundation rock modulusbecomes more significant with respect to stresses generat-ed in the concrete structure. The significance increaseswith decreasing modulus ratio values.
c. If Edr/Ec <0.06, then the foundation rock modulusalmost completely dominates the stresses generated withinthe concrete. Allowable magnitudes of deformation, interms of settlement heave, lateral movement, or angulardistortion for hydraulic structures should be established bythe design team and follow CECW-ED guidance.
Section IVTreatment Methods
5-10. General
In design cases where the magnitudes of differentialdeformation/settlement exceed allowable values the teamof structural and geotechnical professionals charged withthe responsibility of foundation design must make provi-sions for either reducing the magnitude of differentialmovement or design the structure to accommodate thedifferential deformation. A discussion of the latter optionis beyond the scope of this manual. There are twoapproaches available for reducing the magnitude of differ-ential deformation/settlement: improve the rock mass
5-6

EM 1110-1-290830 Nov 94
deformation characteristics and/or modification of thefoundation design.
5-11. Rock Mass Improvement
Rock mass improvement techniques refer to techniqueswhich enhances the ability of a rock mass to resist defor-mation when subjected to an increase in stress. The twotechniques that are available include rock reinforcementand consolidation grouting. As a rule, techniques forincreasing the modulus of deformation of a rock mass arelimited to special cases where only relatively small reduc-tions in deformation are necessary to meet allowabledeformation/settlement requirements.
a. Rock reinforcement. Rock reinforcement (i.e. rockbolts, rock anchor, rock tendon, etc.) is primarily used toenhance the stability of structures founded on rock. How-ever, in specialized cases, constraint offered by a system-atic pattern of rock reinforcement can be effective inreducing structural movement or translations (for example,rotational deformations of retaining structures). Guidancefor rock reinforcement systems is provided in Chapter 9.
b. Consolidation grouting. Consolidation groutingrefers to the injection of cementitious grouts into a rockmass for the primary purpose of increasing the modulusof deformation and/or shear strength. The enhancementcapabilities of consolidation grouting depend upon rock
mass conditions. Consolidation grouting to increase themodulus of deformation is more beneficial in highly frac-tured rock masses with a predominant number of openjoints. Before initiating a consolidation grouting programa pilot field study should be performed to evaluate thepotential enhancement. The pilot field study should con-sist of trial grouting a volume of rock mass representativeof the rock mass to be enhanced. In-situ deformationtests (discussed in Chapter 4) should be performed beforeand after grouting in order to evaluate the degree ofenhancement achieved. Guidance pertaining to consolida-tion grouting is provided in EM 1110-2-3506 and Techni-cal Report REMR-GT-8 (Dickinson 1988).
5-12. Foundation Design Modifications
The most effective means of reducing differentialdeformation/settlement are through modification of thefoundation design. A variety of viable modifications ispossible, but all incorporate one or more of three basicconcepts: reduce stresses applied to the foundation rock;redistribute the applied stresses to stiffer and more compe-tent rock strata; and in cases involving flexible founda-tions, reduce maximum deformations by increasing thefoundation stiffness. The choice of concept incorporatedinto the final design depends on the foundation rock con-ditions, structural considerations, associated cost, andshould be accomplished by the design team in accordancewith CECW-ED guidance.
5-7

EM 1110-1-290830 Nov 94
Chapter 6Bearing Capacity
6-1. Scope
This chapter provides guidance for the determination ofthe ultimate and allowable bearing stress values for foun-dations on rock. The chapter is subdivided into foursections with the following general topic areas: modesand examples of bearing capacity failures; methods forcomputing bearing capacity; allowable bearing capacity;and treatment methods for improving bearing capacity.
6-2. Applicability
a. Modes of failure, methods for estimating the ulti-mate and allowable bearing capacity, and treatments forimproving bearing capacity are applicable to structuresfounded directly on rock or shallow foundations on rockwith depths of embedments less than four times the foun-dation width. Deep foundations such as piles, piers, andcaissons are not addressed.
b. As a rule, the final foundation design is controlledby considerations such as deformation/settlement, slidingstability or overturning rather than by bearing capacity.Nevertheless, the exceptions to the rule, as well as pru-dent design, require that the bearing capacity beevaluated.
Section IFailure Modes
6-3. General
Bearing capacity failures of structures founded on rockmasses are dependent upon joint spacing with respect tofoundation width, joint orientation, joint condition (openor closed), and rock type. Figure 6-1 illustrates typicalfailure modes according to rock mass conditions as modi-fied from suggested modes by Sowers (1979) andKulhawy and Goodman (1980). Prototype failure modesmay actually consist of a combination of modes. Forconvenience of discussion, failure modes will be describedaccording to four general rock mass conditions: intact,jointed, layered, and fractured.
6-4. Intact Rock Mass
For the purpose of bearing capacity failures, intact rockrefers to a rock mass with typical discontinuity spacing
(S term in Figure 6-1) greater than four to five times thewidth (B term in Figure 6-1) of the foundation. As arule, joints are so widely spaced that joint orientation andcondition are of little importance. Two types of failuremodes are possible depending on rock type. The twomodes are local shear failure and general wedge failureassociated with brittle and ductile rock, respectively.
a. Brittle rock. A typical local shear failure is initi-ated at the edge of the foundation as localized crushing(particularly at edges of rigid foundations) and developsinto patterns of wedges and slip surfaces. The slip sur-faces do not reach the ground surface, however, endingsomewhere in the rock mass. Localized shear failures aregenerally associated with brittle rock that exhibit signifi-cant post-peak strength loss (Figure 6-1a).
b. Ductile rock. General shear failures are also initi-ated at the foundation edge, but the slip surfaces developinto well defined wedges which extend to the groundsurface. General shear failures are typically associatedwith ductile rocks which demonstrate post-peak strengthyield (Figure 6-1b).
6-5. Jointed Rock Mass
Bearing capacity failures in jointed rock masses aredependent on discontinuity spacing, orientation, andcondition.
a. Steeply dipping and closely spaced joints. Twotypes of bearing capacity failure modes are possible forstructures founded on rock masses in which the predom-inant discontinuities are steeply dipping and closelyspaced as illustrated in Figure 6-1c and 6-1d. Discon-tinuities that are open (Figure 6-1c) offer little lateralrestraint. Hence, failure is initiated by the compressivefailure of individual rock columns. Tightly closed dis-continuities (Figure 6-1d) on the other hand, providelateral restraint. In such cases, general shear is the likelymode of failure.
b. Steeply dipping and widely spaced joints. Bearingcapacity failures for rock masses with steeply dippingjoints and with joint spacing greater than the width of thefoundation (Figure 6-1e) are likely to be initiated by split-ting that eventually progresses to the general shear mode.
c. Dipping joints. The failure mode for a rock masswith joints dipping between 20 to 70 degrees with respectto the foundation plane is likely to be general shear(Figure 6-1f). Furthermore, since the discontinuity
6-1

EM 1110-1-290830 Nov 94
Figure 6-1. Typical bearing capacity failure modes associated with various rockmass conditions
6-2

EM 1110-1-290830 Nov 94
represents major planes of weakness, a favorably orienteddiscontinuity is likely to define at least one surface of thepotential shear wedge.
6-6. Layered Rock Mass
Failure modes of multilayered rock masses, with eachlayer characterized by different material properties, arecomplicated. Failure modes for two special cases, how-ever, have been identified (Sowers 1979). In both casesthe founding layer consists of a rigid rock underlain by asoft highly deformable layer, with bedding planes dippingat less than 20 degrees with respect to the foundationplane. In the first case (Figure 6-1g), a thick rigid layeroverlies the soft layer, while in the second case (Fig-ure 6-1h) the rigid layer is thin. In both cases, failure isinitiated by tensile failure. However, in the first case,tensile failure is caused by flexure of the rigid thick layer,while in the second case, tensile failure is caused bypunching through the thin rigid upper layer. The limitingthickness of the rigid layer in both cases is controlled bythe material properties of each layer.
6-7. Highly Fractured Rock Masses
A highly fractured rock mass is one that contains two ormore discontinuity sets with typical joint spacings that aresmall with respect to the foundation width (Figure 6-1i).Highly fractured rock behaves in a manner similar todense cohesionless sands and gravels. As such, the modeof failure is likely to be general shear.
6-8. Secondary Causes of Failure
In addition to the failure of the foundation rock, aggres-sive reactions within the rock mineralogy or with groundwater or surface water chemistry can lead to bearingcapacity failure. Examples include: loss of strength withtime typical of some clay shales; reduction of load bear-ing cross-section caused by chemical reaction between thefoundation element and the ground water or surface water;solution-susceptible rock materials; and additional stressesimposed by swelling minerals. Potential secondary causesshould be identified during the site investigation phase ofthe project. Once the potential causes have been identi-fied and addressed, their effects can be minimized.
Section IIMethods for Computing Bearing Capacity
6-9. General
There are a number of techniques available for estimatingthe bearing capacity of rock foundations. These tech-niques include analytical methods, traditional bearingcapacity equations, and field load tests. Of the variousmethods, field load tests are the least commonly used fortwo reasons. First, as discussed in Chapter 4, field loadtests, such as the plate bearing test, are expensive. Sec-ond, although the test provides information as to the loadthat will cause failure, there still remains the question ofscale effects.
6-10. Definitions
Two terms used in the following discussions require defi-nition. They are the ultimate bearing capacity and allow-able bearing value. Definition of the terms are accordingto the American Society for Testing and Materials.
a. Ultimate bearing capacity. The ultimate bearingcapacity is defined as the average load per unit arearequired to produce failure by rupture of a supporting soilor rock mass.
b. Allowable bearing capacity value. The allowablebearing capacity value is defined as the maximum pres-sure that can be permitted on a foundation soil (rockmass), giving consideration to all pertinent factors, withadequate safety against rupture of the soil mass (rockmass) or movement of the foundation of such magnitudethat the structure is impaired. Allowable bearing valueswill be discussed in Section III of this chapter.
6-11. Analytical Methods
The ultimate bearing capacity may be implicitly estimatedfrom a number of analytical methods. The more con-venient of these methods include the finite element andlimit equilibrium methods.
a. Finite element method. The finite elementmethod is particularly suited to analyze foundations with
6-3

EM 1110-1-290830 Nov 94
unusual shapes and/or unusual loading conditions as wellas in situations where the foundation rock is highly vari-able. For example, the potential failure modes for thelayered foundation rock cases illustrated in Figures 6-1gand 6-1h will require consideration of the interactionsbetween the soft and rigid rock layers as well as betweenthe rigid rock layer and the foundation. The primarydisadvantage of the finite element method is that themethod does not provide a direct solution for the ultimatebearing capacity. Such solutions require an analyses ofthe resulting stress distributions with respect to a suitablefailure criterion. In addition to the method’s ability toaddress complex conditions, the primary advantage is thatthe method provides direct solutions for deformation/settlement.
b. Limit equilibrium. The limit equilibrium method isapplicable to bearing capacity failures defined by generalwedge type shear, such as illustrated in Figures 6-1b,6-1d, 6-1f, and 6-1i. The limit equilibrium method, asapplied to sliding stability, is discussed in Chapter 7.Although the principals are the same as in sliding stabilitysolutions, the general form of the equations presented inChapter 7 needs to be cast in a form compatible withbearing capacity problems. The ultimate bearing capacitycorresponds to the foundation loading condition necessaryto cause an impending state of failure (i.e. the loadingcase where the factor of safety is unity).
6-12. Bearing Capacity Equations
A number of bearing capacity equations are reported inthe literature which provide explicit solutions for theultimate bearing capacity. As a rule, the equations repre-sent either empirical or semi-empirical approximations ofthe ultimate bearing capacity and are dependent on themode of potential failure as well as, to some extent, mate-rial properties. In this respect, selection of an appropriateequation must anticipate likely modes of potential failure.The equations recommended in the following discussionsare presented according to potential modes of failure.The appropriate equation number for each mode of failureis given in Figure 6-1.
a. General shear failure. The ultimate bearingcapacity for the general shear mode of failure can beestimated from the traditional Buisman-Terzaghi (Terzaghi1943) bearing capacity expression as defined by Equa-tion 6-1. Equation 6-1 is valid for long continuous foun-dations with length to width ratios in excess of ten.
(6-12)qult cNc 0.5 γBNγ γDNq
where
qult = the ultimate bearing capacity
γ = effective unit weight (i.e. submerged unit wt.if below water table) of the rock mass
B = width of foundation
D = depth of foundation below ground surface
c = the cohesion intercepts for the rock mass
The terms Nc, Nγ, and Nq are bearing capacity factorsgiven by the following equations.
(6-2a)Nc 2 Nφ1/2 (Nφ 1)
(6-2b)Nγ Nφ1/2 N 2φ 1
(6-2c)Nq N 2φ
(6-2d)Nφ tan2 (45 φ /2)
where
φ = angle of internal friction for the rock mass
Equation 6-1 is applicable to failure modes in which bothcohesion and frictional shear strength parameters aredeveloped. As such, Equation 6-1 is applicable to failuremodes illustrated in Figures 6-1b and 6-1d.
b. General shear failure without cohesion. In caseswhere the shear failure is likely to develop along planesof discontinuity or through highly fractured rock massessuch as illustrated in Figures 6-1f and 6-1i, cohesioncannot be relied upon to provide resistance to failure. Insuch cases the ultimate bearing capacity can be estimatedfrom the following equation:
(6-3)qult 0.5 γBNγ γDNq
6-4

EM 1110-1-290830 Nov 94
All terms are as previously defined.
c. Local shear failure. Local shear failure representsa special case where failure surfaces start to develop butdo not propagate to the surface as illustrated in Fig-ure 6-1a. In this respect, the depth of embedment contrib-utes little to the total bearing capacity stability. Anexpression for the ultimate bearing capacity applicable tolocalized shear failure can be written as:
(6-4)qult cNc 0.5γBNγ
All terms are as previously defined.
d. Correction factors. Equations 6-1, 6-3, and 6-4are applicable to long continuous foundations with lengthto width ratios (L/B) greater than ten. Table 6-1 providescorrection factors for circular and square foundations, aswell as rectangular foundations with L/B ratios less thanten. The ultimate bearing capacity is estimated from theappropriate equation by multiplying the correction factorby the value of the corresponding bearing capacity factor.
Table 6-1Correction factors (after Sowers 1979)
Foundation Cc CγShape Nc Correction Nγ Correction
Circular 1.2 0.70
Square 1.25 0.85
Rectangular
L/B = 2 1.12 0.90L/B = 5 1.05 0.95L/B = 10 1.00 1.00
Correction factors for rectangular foundations with L/Bratios other than 2 or 5 can be estimated by linearinterpolation.
e. Compressive failure. Figure 6-1c illustrates a casecharacterized by poorly constrained columns of intactrock. The failure mode in this case is similar to uncon-fined compression failure. The ultimate bearing capacitymay be estimated from Equation 6-5.
(6-5)qqult 2 c tan (45 φ /2)
All parameters are as previously defined.
f. Splitting failure. For widely spaced and verticallyoriented discontinuities, failure generally initiates bysplitting beneath the foundation as illustrated in Fig-ure 6-1e. In such cases Bishnoi (1968) suggested the fol-lowing solutions for the ultimate bearing capacity:
For circular foundations
(6-6a)qult JcNcr
For square foundations
(6-6b)q 0.85JcNcr
For continuous strip foundations for L/B≤ 32
(6-6c)qult JcNcr / (2.2 0.18 L /B)
where
J = correction factor dependent upon thickness of thefoundation rock and width of foundation.
L = length of the foundation
The bearing capacity factorNcr is given by:
(6-6d)Ncr
2N 2φ
1 Nφ
(cotφ) (S/B)
1 1Nφ
Nφ (cotφ) 2Nφ1/2
All other terms are as previously defined. Graphical solu-tions for the correction factor (J) and the bearing capacityfactor (Ncr) are provided in Figures 6-2 and 6-3,respectively.
g. Input parameters. The bearing capacity equationsdiscussed above were developed from considerations ofthe Mohr-Columb failure criteria. In this respect, materialproperty input parameters are limited to two parameters;the cohesion intercept (c) and the angle of internal friction(φ). Guidance for selecting design shear strength parame-ters is provided in Chapter 4. However, since rockmasses generally provide generous margins of safetyagainst bearing capacity failure, it is recommended that
6-5

EM 1110-1-290830 Nov 94
Figure 6-2. Correction factor for discontinuity spacingwith depth (after Bishnoi 1968)
Figure 6-3. Bearing capacity factor for discontinuityspacing (after Bishnoi 1968)
initial values of c and φ selected for assessing bearingcapacity be based on lower bound estimates. While inex-pensive techniques are available on which to base lowerbound estimates of the friction angle, no inexpensivetechniques are available for estimating lower bound cohe-sion values applicable to rock masses. Therefore, forcomputing the ultimate bearing capacity of a rock mass,the lower bound value of cohesion may be estimated fromthe following equation.
(6-7a)cqu (s)
2 tan
45 φ2
where
qu = unconfined compressive strength of the intactrock from laboratory tests.
(6-7b)s exp (RMR 100)9
All other parameters are as previously defined.
6-13. Eccentric Load on a Horizontal Foundation
Eccentric loads acting on foundations effectively reducethe bearing capacity. Figure 6-4a illustrates a typicalstructure subjected to an eccentric load. In order to pre-vent loss of rock/structure contact at the minimum stressedge of the foundation (Figure 6-4a), the structure mustbe designed so that the resultant of all forces acting onthe foundations passes through the center one-third of thefoundation. As indicated in Figure 6-4a, the stress distri-bution can be approximated by linear relationship. Equa-tions 6-8a and 6-8b define the approximate maximum andminimum stress, respectively.
(6-8a)q(max)
QB
1 6eB
(6-8b)q(min)
QB
1 6eB
6-6

EM 1110-1-290830 Nov 94
Figure 6-4. Typical eccentrically loaded structurefoundation
where
q(max) = maximum stress
q(min) = minimum stress
Q = vertical force component of the resultant ofall forces acting on the structure
B = the foundation width
e = distance from the center of the foundation tothe vertical force componentQ
The ultimate bearing capacity of the foundation can beapproximated by assuming that the vertical force com-ponent Q is uniformly distributed across a reducedeffective foundation width as indicated in Figure 6-4b.The effective width is defined by the following equation.
(6-10)B′ B 2e
The effective width (B′) is used in the appropriate bearingcapacity equation to calculate the ultimate bearingcapacity.
6-14. Special Design Cases
The bearing capacity equations discussed above are appli-cable to uniformly loaded foundations situated on planarsurfaces. Frequently, designs suited to the particularrequirements of a project require special considerations.Special design cases for which solutions of the ultimatebearing capacity are readily available are summarized inFigure 6-5. As indicated in Figure 6-5, these specialcases include inclined loads, inclined foundations, andfoundations along or near slopes. Guidance for thesespecial cases is provided in EM 1110-2-2502 and theNAVDOCKS DM-7. Ultimate bearing capacity solutionsfor special design cases should be in keeping with themodes of failure summarized in Figure 6-1.
Section IIIAllowable Bearing Capacity Value
6-15. General
The allowable bearing capacity value is defined in para-graph 6-10b. In essence, the allowable bearing capacity isthe maximum limit of bearing stress that is allowed to beapplied to the foundation rock. This limiting value isintended to provide a sufficient margin of safety withrespect to bearing failures and deformation/settlement.Nevertheless, a prudent design dictates that, once theallowable bearing capacity value has been determined, aseparate calculation be performed in order to verify that
6-7
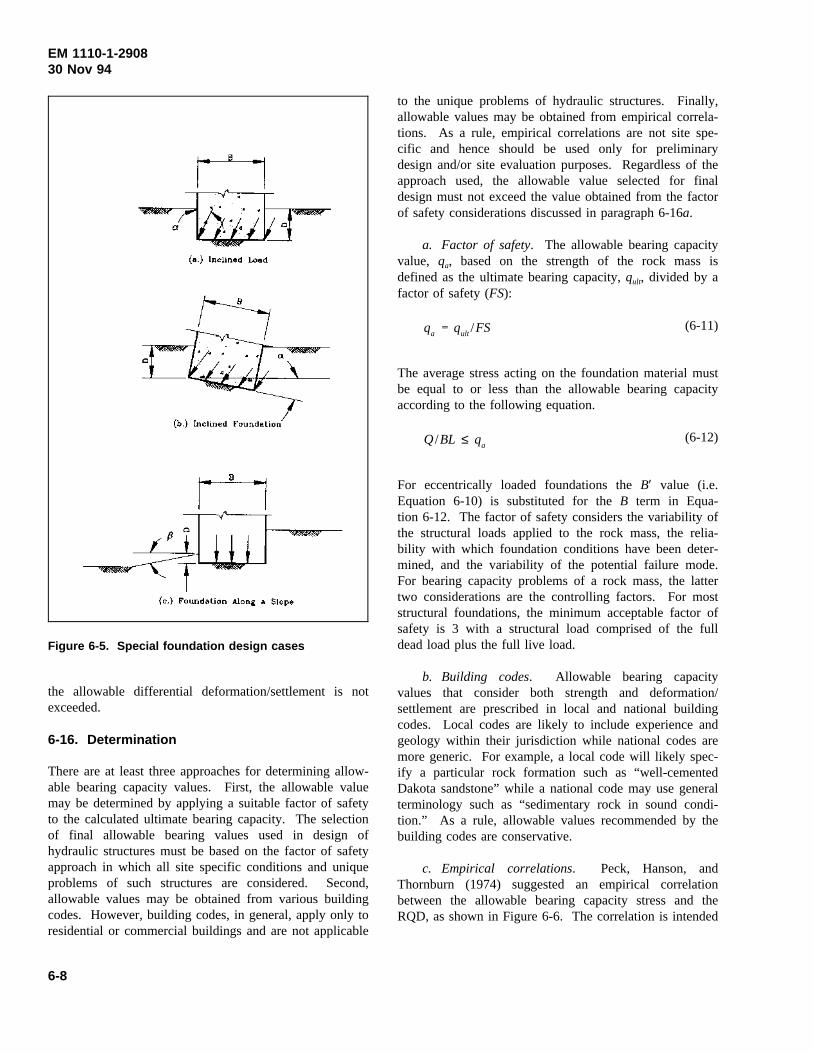
EM 1110-1-290830 Nov 94
Figure 6-5. Special foundation design cases
the allowable differential deformation/settlement is notexceeded.
6-16. Determination
There are at least three approaches for determining allow-able bearing capacity values. First, the allowable valuemay be determined by applying a suitable factor of safetyto the calculated ultimate bearing capacity. The selectionof final allowable bearing values used in design ofhydraulic structures must be based on the factor of safetyapproach in which all site specific conditions and uniqueproblems of such structures are considered. Second,allowable values may be obtained from various buildingcodes. However, building codes, in general, apply only toresidential or commercial buildings and are not applicable
to the unique problems of hydraulic structures. Finally,allowable values may be obtained from empirical correla-tions. As a rule, empirical correlations are not site spe-cific and hence should be used only for preliminarydesign and/or site evaluation purposes. Regardless of theapproach used, the allowable value selected for finaldesign must not exceed the value obtained from the factorof safety considerations discussed in paragraph 6-16a.
a. Factor of safety. The allowable bearing capacityvalue, qa, based on the strength of the rock mass isdefined as the ultimate bearing capacity,qult, divided by afactor of safety (FS):
(6-11)qa qult /FS
The average stress acting on the foundation material mustbe equal to or less than the allowable bearing capacityaccording to the following equation.
(6-12)Q/BL ≤ qa
For eccentrically loaded foundations theB′ value (i.e.Equation 6-10) is substituted for theB term in Equa-tion 6-12. The factor of safety considers the variability ofthe structural loads applied to the rock mass, the relia-bility with which foundation conditions have been deter-mined, and the variability of the potential failure mode.For bearing capacity problems of a rock mass, the lattertwo considerations are the controlling factors. For moststructural foundations, the minimum acceptable factor ofsafety is 3 with a structural load comprised of the fulldead load plus the full live load.
b. Building codes. Allowable bearing capacityvalues that consider both strength and deformation/settlement are prescribed in local and national buildingcodes. Local codes are likely to include experience andgeology within their jurisdiction while national codes aremore generic. For example, a local code will likely spec-ify a particular rock formation such as “well-cementedDakota sandstone” while a national code may use generalterminology such as “sedimentary rock in sound condi-tion.” As a rule, allowable values recommended by thebuilding codes are conservative.
c. Empirical correlations. Peck, Hanson, andThornburn (1974) suggested an empirical correlationbetween the allowable bearing capacity stress and theRQD, as shown in Figure 6-6. The correlation is intended
6-8

EM 1110-1-290830 Nov 94
Figure 6-6. Allowable contact pressure on jointed rock
for a rock mass with discontinuities that “are tight or arenot open wider than a fraction of an inch.”
6-17. Structural Limitations
The maximum load that can be applied to a rock foun-dation is limited by either the rock’s ability to sustain theforce without failure or excessive settlement, or the abilityof the substructure to sustain the load without failure orexcessive deformation. In some cases the structuraldesign of the foundation element will dictate the mini-mum element size, and, consequently, the maximum con-tact stress on the rock. For typical concrete strengths inuse today, the strength of the concrete member is signifi-cantly less than the bearing capacity of many rockmasses.
Section IVTreatment Methods
6-18. General
Treatment methods for satisfying bearing capacity require-ments are essentially the same as those for satisfyingdeformation/settlement requirements discussed in Chap-ter 5. In addition to the previously discussed methods, anexamination of the general ultimate bearing capacity equa-tion (i.e. Equation 6-1) indicates the importance of twoparameters not directly related to deformability. Thesetwo parameters are the effective unit weight of the foun-dation rock and the depth of the foundation below theground surface.
6-19. Effective Unit Weight
For foundations below the water table the effective unitweight is the unit weight of the foundation rock minus theunit weight of water (i.e. submerged unit weight of therock). Hence, foundations located above the water tablewill develop significantly more resistance to potentialbearing capacity failures than foundations below the watertable.
6-20. Foundation Depth
Foundations constructed at greater depths may increasethe ultimate bearing capacity of the foundation. Theimproved capacity is due to a greater passive resistingforce and a general increase in rock mass strength withdepth. The increased lithostatic pressure closes discon-tinuities, and the rock mass is less susceptible to surficialweathering. Occasionally, deeper burial may not beadvantageous. A region with layers of differing rocktypes may contain weaker rock at depth. In such aninstance, a strong rock might overlie a layer such as mud-stone, or, if in a volcanic geology, it might be underlainby a tuff or ash layer. In these instances, deeper burialmay even decrease the bearing capacity. The geologicinvestigation will determine this possibility.
6-9

EM 1110-1-290830 Nov 94
Chapter 7Sliding Stability
7-1. Scope
This chapter provides guidance for assessing the slidingstability of laterally loaded structures founded on rockmasses. Examples of applicable structures include gravitydams, coffer dams, flood walls, lock walls, and retainingstructures. The chapter is divided into three sections toinclude: modes of failure; methods of analyses; and treat-ment methods.
Section IModes of Failure
7-2. General
Paths along which sliding can occur will be confined tothe foundation strata; pass through both the foundationstrata and the structure; or just pass through the structure.This chapter addresses sliding where the failure path isconfined to the foundation strata or at the interfacebetween the strata and the structure’s foundation.Although complex, foundation-structure sliding failure orsliding failure through the structure are conceptually pos-sible and must be checked, such failures are likely tooccur only in earth structures (e.g., embankments). Theanalyses of these later two failure modes are addressed inEM 1110-2-1902.
7-3. Potential Failure Paths
Potential failure paths along which sliding may occur canbe divided into five general categories as illustrated inFigure 7-1.
a. Failure along discontinuities. Figure 7-1a illus-trates a mode of potential failure where the failure pathoccurs along an unfavorably oriented discontinuity. Themode of failure is kinematically possible in cases whereone or more predominate joint sets strike roughly parallelto the structure and dip in the upstream direction. Thecase is particularly hazardous with the presence of anadditional joint set striking parallel to the structure anddipping downstream. In the absence of the additionaljoint set, failure is generally initiated by a tensile failureat the heel of the structure. Where possible the structureshould be aligned in a manner that will minimize thedevelopment of this potential mode of failure.
b. Combined failure. A combined mode of failure ischaracterized by situations where the failure path canoccur both along discontinuities and through intact rock asillustrated in Figure 7-1b. Conceptually, there are anynumber of possible joint orientations that might result in acombined mode of failure. However, the mode of failureis more likely to occur in geology where the rock is hori-zontally or near horizontally bedded and the intact rock isweak.
c. Failure along interface. In cases where structuresare founded on rock masses containing widely spaceddiscontinuities, none of which are unfavorably oriented,the potential failure path is likely to coincide with theinterface between the structure and the foundation strata.The interface mode of failure is illustrated in Figure 7-1c.
d. Generalized rock mass failure. In the generalizedrock mass mode of failure, the failure path is a localizedzone of fractured and crushed rock rather than welldefined surfaces of discontinuity. As implied in Fig-ure 7-1d, a generalized rock mass failure is more likely tooccur in highly fractured rock masses.
e. Buckling failure. Figure 7-1e illustrates a con-ceptual case where failure is initiated by buckling of theupper layer of rock downstream of the structure. Rockmasses conducive to buckling type failures would containthin, horizontally bedded, rock in which the parent rock isstrong and brittle. Although no case histories have beenrecorded where buckling contributed to or caused failure,the potential for a buckling failure should be addressedwhere warranted by site conditions.
Section IIMethods of Analysis
7-4. General Approach
The guidance in this chapter is based on conventionalgeotechnical principles of limit equilibrium. The basicprinciple of this method applies the factor of safety to theleast known conditions affecting sliding stability, this is,the material shear strength. Mathematically, the basicprinciple is expressed as:
(7-1)ττf
FS
7-1

EM 1110-1-290830 Nov 94
Figure 7-1. Potential failure paths
7-2

EM 1110-1-290830 Nov 94
in which τ is the limiting (applied) shear stress requiredfor equilibrium and τf is the maximum available shearstrength that can be developed. The ratio of these twoquantities, expressed by Equation 7-2, is called the factorof safety.
(7-2)FS τf /τ
The maximum available shear strengthτf is defined by theMohr-Coulomb failure criterion. Procedures for selectingthe appropriate shear strength parametersc and φ arediscussed in Chapter 4.
7-5. Conditions for Stability
According to this method, the foundation is stable withrespect to sliding when, for any potential slip surface, theresultant of the applied shear stresses required for equilib-rium is smaller than the maximum shear strength that canbe developed. A factor of safety approaching unity forany given potential slip surface implies failure by slidingis impending. The surface along which sliding has thegreatest probability of occurring is the surface that resultsin the smallest factor of safety. This surface is referred toas the potential critical failure surface.
7-6. Assumptions
As in any mathematical expression which attempts tomodel a geologic phenomenon, the limit equilibriummethod requires the imposition of certain simplifyingassumptions. Assumptions invariably translate into limita-tions in application. Limit equilibrium methods willprovide an adequate assessment of sliding stability pro-vided that sound engineering judgment is exercised. Thisjudgment requires a fundamental appreciation of theassumptions involved and the resulting limitationsimposed. The following discussion emphasizes the moreimportant assumptions and limitations.
a. Failure criterion. Conventional limit equilibriumsolutions for assessing sliding stability incorporate thelinear Mohr-Coulomb failure criterion (see Figure 4-5) forestimating the maximum available shear strength (τf). Itis generally recognized that failure envelopes for allmodes of rock failure are, as a rule, non-linear. As dis-cussed in Chapter 4, imposition of a linear criterion forfailure, as applied to rock, requires experience and judg-ment in selecting appropriate shear strength parameters.
b. Two-dimensional analysis. The method presentedin this chapter is two-dimensional in nature. In most
cases, problems associated with sliding in rock massesinvolve the slippage of three-dimensional wedges isolatedby two or more discontinuities and the ground surface. Insuch cases, a two-dimensional analysis generally results ina conservative assessment of sliding stability. It is possi-ble for a two-dimensional analysis to predict an impend-ing failure where in reality the assumed failuremechanism is kinematically impossible.
c. Failure surface. The stability equations are basedon an assumed failure surface consisting of one or moreplanes. Multiplane surfaces form a series of wedgeswhich are assumed to be rigid. The analysis follows themethod of slices approach common to limit equilibriumgeneralized slip surfaces used in slope stability analysis(e.g., see Janbu 1973). Slices are taken at the intersectionof potential failure surface planes. Two restrictions areimposed by the failure surface assumptions. First, thepotential failure surface underlying the foundation elementis restricted to one plane. Second, planear surfaces arenot conducive to search routines to determine the criticalpotential failure surface. As a result, determination of thecritical failure surface may require a large number of trialsolutions; particularly in rock masses with multiple,closely spaced, joint sets.
d. Force equilibrium. Equations for assessing sta-bility were developed by resolving applied and availableresisting stresses into forces. The following assumptionsare made with respect to forces.
(1) Only force equilibrium is satisfied. Momentequilibrium is not considered. Stability with respect tooverturning must be determined separately.
(2) In order to simplify the stability equations, forcesacting vertically between wedges are assumed to be zero.Neglecting these forces generally results in a conservativeassessment of sliding stability.
(3) Because only forces are considered, the effects ofstress concentrations are unknown. Potential problemsassociated with stress concentrations must be addressedseparately. The finite element method is ideally suited forthis task.
e. Strain compatibility. Considerations regardingdisplacements are excluded from the limit equilibriumapproach. The relative magnitudes of the strain at failurefor different foundation materials may influence theresults of the sliding stability analysis. Such complexstructure-foundation systems may require a more intensivesliding investigation than a limit equilibrium approach. In
7-3

EM 1110-1-290830 Nov 94
this respect, the effects of strain compatibility may requirespecial interpretation of data from in-situ tests, laboratorytests, and finite element analyses.
f. Factor of safety. Limit equilibrium solutions forsliding stability assume that the factor of safety of allwedges are equal.
7-7. Analytical Techniques for Multi-WedgeSystems
a. General wedge equations. The general wedgeequations are derived from force equilibrium of allwedges in a system of wedges defined by the geometry ofthe structure and potential failure surfaces. Consider theith wedge in a system of wedges illustrated in Figure 7-2.The necessary geometry notation for the ith wedge andadjacent wedges are as shown (Figure 7-2). The origin ofthe coordinate system for the wedge considered is locatedin the lower left hand corner of the wedge. Thex and yaxes are horizontal and vertical respectively. Axes whichare tangent (t) and normal (n) to the failure plane areoriented at an angle (α) with respect to the+x and +yaxes. A positive value ofα is a counterclockwise rota-tion, a negative value ofα is a clockwise rotation. Thedistribution of pressures/stresses with resulting forces isillustrated in Figure 7-3. Figure 7-4 illustrates the freebody diagram of the resulting forces. Summing the forcesnormal and tangent to the potential failure surface andsolving for (Pi-1 - Pi) results in the following equation forthe ith wedge:
(7-3)
(Pi 1 Pi ) ((Wi Vi )cosαi
Ui (HLi HRi)sinαi )
tanφi
FSi
(HLi HRi)cosαi
(Wi Vi )sinαi
Ci
FSi
Li
÷
cosαi sinαi
tanφi
FSi
where
i = subscript notation for the wedge considered
Figure 7-2. Hypothetical i th wedge and adjacentwedges subject to potential sliding
P = horizontal residual forces acting betweenwedges as a result of potential sliding
W = the total weight of wedge to include rock, soil,concrete and water (do not use submergedweights)
V = any vertical force applied to the wedge
α = angle of potential failure plane with respect tothe horizontal (-α denotes downslope sliding,+α denotes upslope sliding)
U = the uplift force exerted on the wedge at thepotential failure surface
H = in general, any horizontal force applied to thewedge (HL andHR refers to left and right hardforces as indicated in Figures 7-3 and 7-4)
L = the length of the wedge along the potentialfailure surface
FS = the factor of safety
7-4

EM 1110-1-290830 Nov 94
Figure 7-3. Distribution of pressures, stresses andresultant forces acting on the hypothetical i th wedge
c = the cohesion shear strength parameter
φ = the angle of internal friction
b. Equilibrium requirements. An inspection ofEquation 7-3 reveals that for a given wedge there will betwo unknowns (i.e., (Pi-1 - Pi) and FS). In a wedge sys-tem with n number of wedges, Equation 7-3 will providen number of equations. BecauseFS is the same for allwedges there will ben + 1 unknowns withn number ofequations for solution. The solution for the factor ofsafety is made possible by a conditional equation estab-lishing horizontal equilibrium of the wedge system. Thisequation states that the sum of the differences in horizon-tal residual forces (Pi-1 - Pi) acting between wedges mustequal the differences in the horizontal boundary forces.Since boundary forces are usually equal to zero, the con-ditional equation is expressed as
(7-4)i n
i 1
(Pi 1 Pi ) 0
where
Figure 7-4. Free body diagram of the hypothetical i th
wedge
n = the total number of wedges in the system.
c. Alternate equation. An alternate equation for theimplicit solution of the factor of safety for a system ofnwedges is given below:
(7-5a)FS
i n
i 1
Ci Li cosαi (Wi Vi Ui cosαi ) tanφi
nαi
i n
i 1
[Hi (Wi Vi ) tanαi ]
where
(7-5b)nαi
1tanφi tanαi
FS
1 tan2αi
All other terms are as defined above. The derivation ofEquations 7-5 follows that of Equations 7-3 and 7-4except that forces are summed with respect to thex and ycoordinates.
7-5

EM 1110-1-290830 Nov 94
7-8. Preliminary Procedures
Factor of safety solutions for a multi-wedge system con-taining a number of potential failure surfaces can result ina significant book-keeping problem. For this reason, it isrecommended that prior to the analytical solution for thefactor of safety, the following preliminary procedures beimplemented.
a. Define and identify on a scale drawing all poten-tial failure surfaces based on the stratification, location,orientation, frequency, and distribution of discontinuitieswithin the foundation material as well as the geometry,location, and orientation of the structure.
b. For each potential failure surface, divide the massinto a number of wedges. A wedge must be created eachtime there is a change in slip plane orientation and/or achange in shear strength properties. However, there canbe only one structural wedge.
c. For each wedge draw a free body diagram whichshows all the applied and resulting forces acting on thatwedge. Include all necessary dimensions on the free bodydiagram. Label all forces and dimensions according tothe appropriate parameter notations discussed above.
d. Prepare a table, which lists all parameters, toinclude shear strength parameters for each wedge in thesystem of wedges defining the potential slip mass.
7-9. Analytical Procedures
While both the general wedge equation and the alternateequation will result in the same calculated factor of safetyfor a given design case, the procedure for calculating thatvalue is slightly different. Solutions for hypotheticalexample problems are provided in EM 1110-2-2200 andNicholson (1983a).
a. General wedge method. The solution for thefactor of safety using Equations 7-3 and 7-4 requires atrial-and-error procedure. A trial value for the factor ofsafety,FS, is inserted in Equation 7-3 for each wedge toobtain values of the differences in horizontal residualPforces acting between wedges. The differences inPforces for each wedge are then summed; a negative valueindicates that the trial value ofFS was to high and con-versely a positive value indicates that the trial value ofFSwas too low. The process is repeated until the trialFSvalue results in an equality from Equation 7-4. The valueof FS which results in an equality is the correct value forthe factor of safety. The number of trial-and-error cycles
can be reduced if trial values ofFS are plotted withrespect to the sum of the differences of theP forces (seeexamples in EM 1110-2-2200 and Nicholson (1983a)).
b. Alternate methods. Equations 7-5a and 7-5b,when expanded, can be used to solve for the factor ofsafety for a system containing one or more wedges.Since thenα term, defined by Equation 7-5b, is a functionof FS, the solution forFS requires an iterative process.An assumed initial value ofFS is inserted into thenα termfor each wedge in the expanded form of Equation 7-5a,and a new factor of safety is calculated. The calculatedfactor of safety is then inserted into thenα term. Theprocess is repeated until the inserted value ofFS equalsthe calculated value ofFS. Convergence to within twodecimal places usually occurs in 3 to 4 iteration cycles.
c. Comparison of methods. The general wedge equa-tion (Equation 7-3) was formulated in terms of the differ-ence in horizontal boundary forces to allow the designengineer to solve directly for forces acting on the struc-ture for various selected factors of safety. The procedurehas an advantage for new structures in that it allows arapid assessment of the horizontal forces necessary forequilibrium for prescribed factors of safety. The alternateequation (Equation 7-5a and 7-5b) solves directly forFS.Its advantage is in the assessment of stability for existingstructures. Both equations are mathematically identical(Nicholson 1983a).
7-10. Design Considerations
Some special considerations for applying the generalwedge equation to specific site conditions are discussedbelow.
a. Active wedge. The interface between the group ofactive wedges and the structural wedge is assumed to be avertical plane located at the heel of the structural wedgeand extending to the base of the structural wedge. Themagnitudes of the active forces depend on the actualvalues of the safety factor, the inclination angles (α) ofthe slip path, and the magnitude of the shear strength thatcan be developed. The inclination angles, correspondingto the maximum active residualP forces for each poten-tial failure surface, can be determined by independentlyanalyzing the group of active wedges for trial safety fac-tors. In rock the inclination may be predetermined bydiscontinuities in the foundation.
b. Structural wedge. Discontinuities in the slip pathbeneath the structural wedge should be modeled by
7-6
EM 1110-1-290830 Nov 94
assuming an average slip-plane along the base of thestructural wedge.
c. Passive wedge. The interface between the groupof passive wedges and the structural wedge is assumed tobe a vertical plane located at the toe of the structuralwedge and extending to the base of the structural wedge.The magnitudes of the passive residualP forces dependon the actual values of the safety factor, the inclinationangles of the slip path, and the magnitude of shearstrength that can be developed. The inclination angles,corresponding to the minimum passive residualP forcesfor each potential failure mechanism, can be estimated byindependently analyzing the group of passive wedges fortrial safety factors. When passive resistance is used spe-cial considerations must be made. Removal of the pas-sive wedge by future construction must be prevented.Rock that may be subjected to high velocity water scour-ing should not be used unless amply protected. Also, thecompressive strength of the rock layers must be sufficientto develop the wedge resistance. In some cases wedgeresistance should not be assumed without resorting tospecial treatment such as installing rock anchors.
d. Tension cracks. Sliding analyses should considerthe effects of cracks on the active side of the structuralwedge in the foundation material due to differential settle-ment, shrinkage, or joints in a rock mass. The depth ofcracking in cohesive foundation material can be estimatedin accordance with the following equations.
(7-6a)dc
2cd
γtan
45φd
2
where
(7-6b)cd
cFS
(7-6c)φd tan 1
tanφFS
The value (dc) in a cohesive foundation cannot exceed theembedment of the structural wedge. The depth of crack-ing in massive, strong, rock foundations should beassumed to extend to the base of the structural wedge.Shearing resistance along the crack should be ignored andfull hydrostatic pressure should be assumed to extend tothe bottom of the crack. The hydraulic gradient across
the base of the structural wedge should reflect thepresence of a crack at the heel of the structural wedge.
e. Uplift without drains. The effects of seepageforces should be included in the sliding analysis.Analyses should be based on conservative estimates ofuplift pressures. Estimates of uplift pressures on thewedges can be based on the following assumptions:
(1) The uplift pressure acts over the entire area ofthe base.
(2) If seepage from headwater to tailwater can occuracross a structure, the pressure head at any point shouldreflect the head loss due to water flowing through amedium. The approximate pressure head at any point canbe determined by the line-of-seepage method. Thismethod assumes that the head loss is directly proportionalto the length of the seepage path. The seepage path forthe structural wedge extends from the upper surface (orinternal ground-water level) of the uncracked materialadjacent to the heel of the structure, along the embeddedperimeter of the structural wedge, to the upper surface (orinternal ground-water level) adjacentto the toe of thestructure. Referring to Figure 7-5, the seepage distance isdefined by points a, b, c, and d. The pressure head at anypoint is equal to the elevation head minus the product ofthe hydraulic gradient times the distance along the seep-age path to the point in question. Estimates of pressureheads for the active and passive wedges should be consis-tent with those of the heel and toe of the structural wedge.
(3) For a more detailed discussion of the line-of-seepage method, refer to EM 1110-2-2502, Retaining andFlood Walls. For the majority of structural stability com-putations, the line-of-seepage is considered sufficientlyaccurate. However, there may be special situations wherethe flow net method is required to evaluate seepageproblems.
f. Uplift with drains. Uplift pressures on the base ofthe structural wedge can be reduced by foundation drains.The pressure heads beneath the structural wedge devel-oped from the line-of-seepage analysis should be modifiedto reflect the effects of the foundation drains. The maxi-mum pressure head along the line of foundation drainscan be estimated from Equation 7-7:
(7-7)Ux U1 R
L xL
(U2 U1)
7-7

EM 1110-1-290830 Nov 94
All parameters are defined in Figure 7-5. The uplift
Figure 7-5. Uplift pressures
pressure across the base of the structural wedge usuallyvaries from the undrained pressure head at the heel to theassumed reduced pressure head at the line of drains to theundrained pressure head at the toe, as shown in Fig-ure 7-5. Uplift forces used for the sliding analyses shouldbe selected in consideration of conditions which arepresented in the applicable design memoranda. For amore detailed discussion of uplift under gravity dams,refer to EM 1110-2-2200, Gravity Dams.
g. Overturning. As stated previously, requirementsfor rotational equilibrium are not directly included in thegeneral sliding stability equations. For some load cases,the vertical component of the resultant load will lie out-side the kern of the base area, and a portion of the struc-tural wedge will not be in contact with the foundationmaterial. The sliding analysis should be modified forthese load cases to reflect the following secondary effectsdue to coupling of sliding and overturning behavior.
(1) The uplift pressure on the portion of the basewhich is not in contact with the foundation materialshould be a uniform value which is equal to the maximumvalue of the hydraulic pressure across the base (except forinstantaneous loads such as those due to seismic forces).
(2) The cohesive component of the sliding resistanceshould only include the portion of the base area which isin contact with the foundation material.
(3) The resultant of the lateral earth (soil) pressure isassumed to act at 0.38 of the wall height for horizontal ordownward sloping backfills and at 0.45 of the wall heightfor upward sloping backfills.
(4) Cantilever or gravity walls on rock should bedesigned for at-rest earth pressures unless the foundationrock has an unusually low modulus.
7-11. Seismic Sliding Stability
The sliding stability of a structure for an earthquake-induced base motion should be checked by assuming thespecified horizontal earthquake acceleration coefficientand the vertical earthquake acceleration coefficient, ifincluded in the analysis, to act in the most unfavorabledirection. The earthquake-induced forces on the structureand foundation wedges may then be determined by aquasi-static rigid body analysis. For the quasi-static rigidbody analysis, the horizontal and vertical forces on thestructure and foundation wedges may be determined byusing the following equations:
(7-8)Hdi MiX miX Hi
(7-9)Vdi Mig miy
where
Hd = horizontal forces acting on the structure and/orwedge
Vd = vertical forces acting on the structure and orwedge
M = mass of the structure and/or wedge (weight/g)
m = added mass of reservoir and/or adjacentsoil/rock
7-8

EM 1110-1-290830 Nov 94
g = acceleration of gravity
X = horizontal earthquake acceleration coefficient
ÿ = vertical earthquake acceleration coefficient
The subscripti, H, andV terms are as defined previously.
a. Earthquake acceleration. The horizontal earth-quake acceleration coefficient can be obtained from seis-mic zone maps (ER 1110-2-1806) or, in the case where adesign earthquake has been specified for the structure, anacceleration developed from analysis of the design earth-quake. Guidance is being prepared for the latter type ofanalysis and will be issued in the near future; until then,the seismic coefficient method is the most expedientmethod to use. The vertical earthquake acceleration isnormally neglected but can be taken as two-thirds of thehorizontal acceleration if included in the analysis.
b. Added mass. The added mass of the reservoir andsoil can be approximated by Westergaard’s parabola(EM 1110-2-2200) and the Mononobe-Okabe method(EM 1110-2-2502), respectively. The structure should bedesigned for a simultaneous increase in force on one sideand decrease on the opposite side of the structure whensuch can occur.
c. Analytical procedures. The analytical proceduresfor the seismic quasi-static analyses follows the proce-dures outlined in paragraphs 7-9a and 7-9b for the generalwedge and alternate methods, respectively. However, theHd and Vd terms are substituted for theH and W terms,respectively, in Equations 7-3 and 7-5a.
7-12. Factor of Safety
For major concrete structures (dams, lockwalls, basinwalls which retain a dam embankment, etc.) the minimumrequired factor of safety for normal static loading condi-tions is 2.0. The minimum required factor of safety forseismic loading conditions is 1.3. Retaining walls on rockrequire a safety factor of 1.5; refer to EM 1110-2-2502for a discussion of safety factors for floodwalls. Anyrelaxation of these values will be allowed only with theapproval of CECW-E and should be justified by compre-hensive foundation studies of such nature as to reduceuncertainties to a minimum.
Section IIITreatment Methods
7-13. General
Frequently a sliding stability assessment of structuressubjected to lateral loading results in an unacceptably lowfactor of safety. In such cases, a number of methods areavailable for increasing the resistance to sliding. Anincrease in sliding resistance may be achieved by one or acombination of three mechanistic provisions. The threeprovisions include: increasing the resisting shear strengthby increasing the stress acting normal to the potentialfailure surface; increasing the passive wedge resistance;and providing lateral restraining forces.
7-14. Increase in Shear Strength
The shear strength available to resist sliding is propor-tional to the magnitude of the applied stress acting normalto the potential slip surface. An increase in the normalstress may be achieved by either increasing the verticalload applied to the structural wedge and/or passivewedge(s) or by a reduction in uplift forces. The appliedvertical load can be conveniently increased by increasingthe mass of the structure or placing a berm on the down-stream passive wedge(s). Installation of foundation drainsand/or relief wells to relieve uplift forces is one of themost effective methods by which the stability of a gravityhydraulic structure can be increased.
7-15. Increase in Passive Wedge Resistance
Resistance to sliding is directly influenced by the size ofthe passive wedge acting at the toe of the structure. Thepassive wedge may be increased by increasing the depththe structure is embedded in the foundation rock or byconstruction of a key. Embedment and keys are alsoeffective in transferring the shear stress to deeper andfrequently more competent rock.
7-16. Lateral Restraint
Rock anchors inclined in the direction of the applied shearload provide a force component which acts against theapplied shear load. Guidance for the design of anchorsystems is discussed in Chapter 9 of this manual.
7-9

EM 1110-1-290830 Nov 94
Chapter 8Cut Slope Stability
8-1. Scope
This chapter provides guidance for assessing the slidingstability of slopes formed by excavations in rock or ofnatural rock slopes altered by excavation activities. Typi-cal examples of slopes cut in rock include: foundationexcavations; construction of project access roads; anddevelopment of dam abutments, spillways, and tunnelportals. This chapter is divided into three sectionsaccording to the general topic areas of modes of failure,methods of assessing stability, and treatment methods andplanning considerations.
Section IModes of Failure
8-2. General
The primary objectives of any rock excavation is to mini-mize the volume of rock excavated while providing aneconomical and safe excavation suitable for its intendedfunction. The objectives of economy and safety, as arule, involve the maximization of the angle of inclinationof the slope while assuring stability. Stability assurancerequires an appreciation for the potential modes of failure.
8-3. Types of Failure Modes
Because of its geometry, rock slopes expose two or morefree surfaces. Thus, as a rule, constituent rock blockscontained within the rock mass have a relative high kine-matic potential for instability. In this respect, the type offailure is primarily controlled by the orientation and spac-ing of discontinuities within the rock mass as well as theorientation of the excavation and the angle of inclinationof the slope. The modes of failure which are controlledby the above factors can be divided into three generaltypes: sliding, toppling, and localized sloughing. Eachtype of failure may be characterized by one or more fail-ure mechanisms.
8-4. Sliding Failure Modes
Figure 8-1 illustrates seven failure mechanisms that maybe associated with the sliding failure mode. While otherfailure mechanisms are conceptually possible, the sevenmechanisms illustrated are representative of those
mechanisms most likely to occur. The following discus-sions provide a brief description of the conditions neces-sary to initiate each of the sliding mechanisms.
a. Single block/single sliding plane. A single blockwith potential for sliding along a single plane (Fig-ure 8-1a) represents the simplest sliding mechanism. Themechanism is kinematically possible in cases where atleast one joint set strikes approximately parallel to theslope strike and dips toward the excavation slope. Failureis impending if the joint plane intersects the slope planeand the joint dips at an angle greater than the angle ofinternal friction (φ) of the joint surface.
b. Single block/stepped sliding planes. Single blocksliding along stepped planes (Figure 8-1b) is possible incases where a series of closely spaced parallel joints strikeapproximately parallel to the excavation slope strike anddip toward the excavation slope. The parallel joints mayor may not be continuous. However, at least one jointplane must intersect the slope plane. In the case of con-tinuous parallel joints, a second set of joints is necessary.This second joint set must also strike more or less parallelto the slope and the magnitude and direction of the jointdip angle must be such that the joint plane does not inter-sect the slope plane.
c. Multiple blocks/multiple sliding planes. Multipleblocks, sliding along multiple planes (Figure 8-1c) is themost complicated planar type of sliding. The mechanismis associated with two or more joint sets that strikeapproximately parallel to the slope strike and dip in thedirection of the excavation slope. At least one of the jointplanes must intersect the excavated slope plane. For afailure to occur, the dip angle of the joint defining thebase of the upper most block must be greater than thefriction angle of the the joint surface. Furthermore, addi-tional joints must be present which also strike approxi-mately parallel to the strike of the excavated slope. Theseadditional joints must either dip in a near vertical direc-tion or dip steeply away from the slope plane.
d. Single wedge/two intersecting planes. Singlewedge sliding (Figure 8-1d) can occur in rock masseswith two or more sets of discontinuities whose lines ofintersection are approximately perpendicular to the strikeof the slope and dip toward the plane of the slope. Inaddition, this mode of failure requires that the dip angleof at least one joint-intersect is greater than the frictionangle of the joint surfaces and that the line of joint inter-section intersects the plane of the slope.
8-1

EM 1110-1-290830 Nov 94
Figure 8-1. Failure mechanisms for the sliding failure mode: a) single block with single plane; b) single block withstepped planes; c) multiple blocks with multiple planes; d) single wedge with two intersecting planes; e) singlewedge with multiple intersecting planes; f) multiple wedges with multiple intersecting planes; and g) single blockwith circular slip path
8-2

EM 1110-1-290830 Nov 94
e. Single wedge/multiple intersecting planes. Theconditions for sliding of a single wedge formed by theintersections of at least two discontinuity sets with closelyspaced joints (Figure 8-1e) are essentially the same asdiscussed in paragraph 8-4d. above.
f. Multiple wedges/multiple intersecting planes.Multiple wedges can be formed by the intersection of fouror more sets of discontinuities (Figure 8-1f). Althoughconceptually possible, the sliding failure of a multiplewedge system rarely occurs because of the potential forkinematic constraint.
g. Single block/circular slip path. Single block slid-ing failures along circular slip paths are commonly associ-ated with soil slopes. However, circular slip failures mayoccur in highly weathered and decomposed rock masses,highly fractured rock masses, or in weak rock such asclay shales and poorly cemented sandstones.
8-5. Toppling Failure Mode
Toppling failure involves overturning or rotation of rocklayers. Closely spaced, steeply dipping discontinuity setsthat dip away from the slope surface are necessary pre-requisites for toppling. In the absence of cross jointing,each layer tends to bend downslope under its own weightthus generating flexural cracks. If frequent cross jointsare present, the layers can topple as rigid columns. Ineither case, toppling is usually initiated by layer separa-tion with movement in the direction of the excavation.Layer separation may be rapid or gradual. Rapid separa-tion is associated with block weight and/or stress reliefforces. Gradual separation is usually associated withenvironmental processes such as freeze/thaw cycles.
8-6. Sloughing Failure Mode
Sloughing failures are generally characterized by occa-sional rock falls or localized slumping of rocks degradedby weathering. Rock falls occur when rock blocksbecome loosened and isolated by weathering and erosion.Some rocks disintegrate into soil-like material whenexposed to repeated wetting and drying cycles. Thismaterial can fail in a fashion similar to shallow slumptype failures commonly associated with soil slopes. Bothrock falls and localized slumping constitute more of amaintenance problem than a major slope instability threat.However, slopes in sedimentary rock that are interbeddedwith shale layers can experience major slope failuresinitiated by localized deterioration of the shale layers.Deterioration of the shale layers leads to the underminingand hence failure of the more competent overlying layers.
8-7. Additional Factors Influencing SlopeStability
The geometric boundaries imposed by the orientation,spacing and continuity of the joints, as well as the freesurface boundaries imposed by the excavation, define themodes of potential failure. However, failure itself isfrequently initiated by additional factors not related togeometry. These factors include erosion, ground water,temperature, in-situ stress, and earthquake-inducedloading.
a. Erosion. Two aspects of erosion need to be con-sidered. The first is large scale erosion, such as rivererosion at the base of a cliff. The second is relativelylocalized erosion caused by groundwater or surface run-off. In the first type, erosion changes the geometry of thepotentially unstable rock mass. The removal of materialat the toe of a potential slide reduces the restraining forcethat may be stabilizing the slope. Localized erosion ofjoint filling material, or zones of weathered rock, caneffectively decrease interlocking between adjacent rockblocks. The loss of interlocking can significantly reducethe rock mass shear strength. The resulting decrease inshear strength may allow a previously stable rock mass tomove. In addition, localized erosion may also result inincreased permeability and ground-water flow.
b. Ground water. Ground water occupying the frac-tures within a rock mass can significantly reduce thestability of a rock slope. Water pressure acting within adiscontinuity reduces the effective normal stress acting onthe plane, thus reducing the shear strength along thatplane. Water pressure within discontinuities that runroughly parallel to a slope face also increase the drivingforces acting on the rock mass.
c. Temperature. Occasionally, the effects of temper-ature influence the performance of a rock slope. Largetemperature changes can cause rock to spall due to theaccompanying contraction and expansion. Water freezingin discontinuities causes more significant damage byloosening the rock mass. Repeated freeze/thaw cyclesmay result in gradual loss of strength. Except for peri-odic maintenance requirements, temperature effects are asurface phenomenon and are most likely of little concernfor permanent slopes. However, in a few cases, surfacedeterioration could trigger slope instability on a largerscale.
d. State of stress. In some locations, high in-situstresses may be present within the rock mass. High hori-zontal stresses acting roughly perpendicular to a cut slope
8-3
EM 1110-1-290830 Nov 94
may cause blocks to move outward due to the stress reliefprovided by the cut. High horizontal stresses may alsocause spalling of the surface of a cut slope. Storedstresses will most likely be relieved to some degree nearthe ground surface or perpendicular to nearby valleywalls. For some deep cuts, it may be necessary to deter-mine the state of stress within the rock mass and whateffects these stresses may have on the cut slope.
Section IIMethods for Assessing Stability
8-8. General
This section presents a brief review of some of the morecommonly used methods for assessing the stability ofslopes cut in rock masses. The method selected for anal-yses depends upon the potential failure mode and, to someextent, the preference of the District Office responsiblefor the analyses. In this respect, the discussions will bedivided according to potential failure modes. The poten-tial failure modes include sliding, toppling, and localizedsloughing. A detailed discussion of each of the variousmethods is beyond the scope of this manual. Hoek andBray (1974), Canada Centre for Mineral and EnergyTechnology (1977a), Kovari and Fritz (1989) andHendron, Cording and Aiyers (1980) provide generaldiscussions on analytical methods for accessing the stabil-ity of rock slopes. Specific references are given whichprovide in depth details for each of the methods as theyare discussed.
8-9. Sliding Stability Analyses
The majorities of the methods used in analyzing the slid-ing stability of slopes cut into rock masses are based onthe principles of limit equilibrium. The mathematicalformulation of the various methods depends upon thethree general modes of sliding failure illustrated in Fig-ure 8-1. These three general modes include planar slipsurfaces, three-dimensional wedge shaped slip surfaces,and circular slip surfaces. Since the majority of slidingstability problems are indeterminate, a number of assump-tions must be made about the location, orientation, andpossible magnitude of the forces involved in the analysis.Different methods are presented below along with a shortdescription of the assumptions that are made as well asthe general procedure used for the analyses.
a. Planar slip surfaces. The analyses of planar slipsurfaces assume that stability can be adequately evaluatedfrom two-dimensional considerations. The following
discussions summarize a number of different methods foranalyzing the stability of planar slip surfaces. Themethods are not all inclusive but rather are representativeof commonly used methods that are currently available.
(1) Simple plane method. The simple plane methodis applicable to slopes in which the potential slip surfaceis defined by a single plane, as illustrated in Fig-ure 8-1a. The method is based on equilibrium betweendriving and resisting forces acting parallel and perpen-dicular to the potential slip surface. Mathematicalexpressions of the simple plane method can be found inmost elementary physics text books. Convenient expres-sions are provided by Kovari and Fritz (1989).
(2) Two-dimensional wedge method. The two-dimensional wedge is suited for cases in which the poten-tial failure surface of a rigid rock mass can be closelyapproximated by two or three planes. Hence, the methodassumes that the potential failure mass can be divided intotwo or three two-dimensional wedges. A simplifiedapproach assumes that forces between the wedges arehorizontal. The horizontal force assumption generallyresults in a factor of safety that is within 15 percent (gen-erally on the conservative side) of more accurate tech-niques which satisfy all conditions of equilibrium. Lambeand Whitman (1969) provide a detailed discussion and anexample of the method.
(3) Generalized slip-surface methods for a rigidbody. Generalized slip-surface methods refer to thosemethods which are used to solve two-dimensional rigidbody stability problems using potential slip surfaces ofany arbitrary shape. In this respect, the slip surfaces maybe curvilinear in shape or defined by an assemblage ofany number of linear segments as illustrated inFigure 8-1b. Of the available generalized slip-surfacemethods the two best known methods were proposed byJanbu (1954) and Morgenstern and Price (1965).
(a) Janbu’s generalized slip-surface method is aniterative procedure using vertical slices and any shapeslip-surface. The procedure, in its rigorous form, satisfiesall conditions of equilibrium to include vertical and hori-zontal force equilibrium, moment equilibrium of theslices, and moment equilibrium of the entire slide mass.Complete equilibrium requires the solution of both shearand normal forces acting between slices. In the solutionfor the side forces Janbu’s method assumes the point ofside force application as well as the line of action of allthe side forces. Janbu (1973) provides a detailed discus-sion of theory and application.
8-4

EM 1110-1-290830 Nov 94
(b) Morgenstern and Price’s generalized slip-surfacemethod is similar to Janbu’s method in that the procedureincorporates the interaction between a number of verticalslices. Complete equilibrium is achieved by assuming thevalues of variable ratios between the shear and normalforces acting on the sides of each slice. Morgenstern andPrice (1965) provide a detailed discussion of the method.
(4) Generalized slip-surface methods for two or morerigid bodies. Generalized slip-surface methods for two ormore rigid bodies refer to those analytical methods usedto solve two-dimensional stability problems. In this spe-cial case, sliding can occur along the base of each bodyas well as between each body as illustrated in Fig-ure 8-1c. At least three methods are available for analyz-ing this special case. These three methods includemethods proposed by Kovari and Fritz (1989) and Sarma(1979) as well as the distinct element numerical modelmethod (e.g. Cundall 1980).
(a) Kovari and Fritz’s (1989) method provides arelatively simple solution for the factor of safety of two ormore adjacent blocks subject to sliding. The potentialslide surface along the base of each block is representedby a single plane. Blocks are separated by planes ofdiscontinuity which may be inclined at arbitrary angleswith respect to the base of the potential slide plane. Themethod satisfies force equilibrium. Moment equilibriumis not considered. In this respect, solutions for the factorof safety tend to be conservative.
(b) Sarma (1979) proposed a comprehensive solutionto the two-dimensional, multiple block sliding problemwhich satisfies both moment and force equilibrium. Themethod utilizes slices that can be nonvertical with nonpar-allel sides. Solution for the factor of safety requires aniterative process. As such, from a practical point it isusually more convenient to program the method for useon programmable calculators or personal computers.
(c) The distinct element (e.g. Cundall 1980) methodis based on equations of motion for particles or blocks.The method offers a useful tool for examining the pheno-menology and kinematics of potentially unstable slopes.
b. Three-dimensional wedge shaped slip surfaces.The majority of potentially unstable rock slopes can becharacterized as three-dimensional wedge problems asillustrated in Figure 8-1d, 8-1e, and 8-1f. The analyticalanalysis of three-dimensional problems is substantiallysimplified if the geotechnical professional responsible forthe stability analysis is conversant with the use of stereo-graphic projection. Stereographic projection allows
convenient visualization of the problem being analyzed aswell as the definition of geometric parameters necessaryfor analysis. Goodman (1976), Hoek and Bray (1974),and Priest (1985) provide detailed discussions of theoryand application of stereographic projection techniques.Once the problem geometry has been defined, an analyti-cal method can be selected for assessing the sliding stabil-ity of the slope. For convenience of discussion, methodsfor assessing sliding stability will be divided into twocategories: methods for single three-dimensional wedgesand methods for multiple three-dimensional wedges.
(1) Three-dimensional single wedge methods. Three-dimensional single wedge methods are applicable toslopes in which the potential instability is defined by asingle rigid wedge as illustrated in Figures 8-1d and 8-1e.Sliding may occur along one or more planar surfaces. Asa rule, analytical solutions for the factor of safety arebased on the principles of limit equilibrium in which forceequilibrium is satisfied. A large number of expressionsfor the solution of factors of safety are reported in theliterature. Hendron, Cording, and Aiyer (1980), Hoek andBray (1974), Kovari and Fritz (1989) provide expressionsand detailed discussions of the method. Hendron,Cording, and Aiyer (1980) and Chan and Einstein (1981)also provide methods for addressing potential block rota-tion as well as transverse sliding.
(2) Three-dimensional, multiple wedge, methods.Although conceptually possible, multiple three-dimensional wedge systems seldom fail in sliding becauseof the potential for kinematic constraint. Generalizedanalytical solutions for the factor of safety in such casesare not readily available. In this respect, three-dimensional distinct element methods (Cundall 1980)offer a means of evaluating the kinematics of potentiallyunstable slopes.
c. Circular slip surfaces. As in planar slip surfaces,the analyses of circular slip surfaces assume that stabilitycan be adequately evaluated from two-dimensional consid-erations as illustrated in Figure 8-1g. The methods aregenerally applicable to rock slopes excavated in weakintact rock or in highly fractured rock masses. Of thevarious circular slip surface methods available, two of themore commonly used include the ordinary method ofslices and the simplified Bishop method.
(1) Ordinary method of slices. The ordinary methodof slices (EM 1110-2-1902) is also known as the SwedishCircle Method or the Fellenious Method. In this methodthe potential sliding mass is divided into a number ofvertical slices. The resultant of the forces acting on the
8-5

EM 1110-1-290830 Nov 94
sides of the slices act parallel to the base of that particularslice. Only moment equilibrium is satisfied. In thisrespect, factors of safety calculated by this method aretypically conservative. Factors of safety calculated forflat slopes and/or slopes with high pore pressures can beon the conservative side by as much as 60 percent, atleast when compared with values from more exactsolutions.
(2) Simplified Bishop method. The SimplifiedBishop Method (Janbu et al. 1956) is a modification of amethod originally proposed by Bishop (1955). In thesimplified method, forces acting on the sides of any verti-cal slice is assumed to have a zero resultant in the verticaldirection. Moment equilibrium about the center of theslip surface circle as well as force equilibrium are satis-fied. There is no requirement for moment equilibrium ofindividual slices. However, factors of safety calculatedwith this method compare favorably with values obtainedfrom more exact solution methods.
8-10. Toppling Stability Analyses
Two-dimensional considerations indicate that toppling canoccur if two conditions are present. In this respect, top-pling can occur only if the projected resultant force (bodyweight plus any additional applied forces) acting on anyblock of rock in question falls outside the base of theblock and the inclination of the surface on which theblock rests is less than the friction angle between theblock and surface. However, in actual three-dimensions,rock slopes consist of a number of interacting blockswhich restrict individual block movement. As a result themechanism is likely to be a complex combination ofsliding and toppling. Due to the complexities of failure,generalized analytical methods which attempt to solve forthe factor of safety have not been developed. Three-dimensional numerical methods such as the distinct ele-ment method can, however, offer insight as to thekinematics of failure.
8-11. Localized Sloughing Analyses
Localized sloughing failures refer to a variety of potentialfailure modes. These modes can range from rotationalfailure of individual blocks to minor sliding failures ofindividual small blocks or mass of rock. These types ofpotential instability are frequently treated as routine main-tenance problems and, as such, are seldom analyzed forstability.
8-12. Physical Modeling Techniques
In addition to the analytical methods, there exist a numberof physical modeling techniques used for problems whereanalytical techniques may not be valid or may be toocomplex. Available methods include the Base FrictionModel, Centrifuge Model, and small-scale models. All ofthese techniques have shortcomings in that basic parame-ters to include length, mass, and strength must be scaled.The difficulty arises in that all three parameters must bescaled in the same proportions. Simultaneous scalingrequirements are difficult to achieve in practice. There-fore, it is common to scale the most important parame-ter(s) accurately and then attempt to relate the influenceof the lesser important parameters to the test results.Physical modeling techniques are discussed by Hoek andBray (1974) and Goodman (1976).
a. Base friction modeling. This modeling techniqueuses a frictional rolling base in the form of a long sheetor a conveyor-like belt that simulates gravity. The modelmaterial is typically a sand-flour-vegetable oil materialthat closely models friction angles of discontinuous rock.A two-dimensional model of the slope or excavation isformed on the table. As the belt moves, the model slowlydeforms. The technique cannot be used to modeldynamic loadings. It is an excellent method to investigatethe kinematics of jointed two-dimensional systems.
b. Centrifuge modeling. Centrifuge modelingattempts to realistically scale body forces (i.e., gravita-tional forces). In this respect, centrifuge modeling maybe a possible solution in cases where gravity plays animportant role. Centrifuge methods are presently expen-sive and the available centrifuges typically have longwaiting lists. Generally, these machines only allow rathersmall models to be evaluated. Also, instrumentation ofthese models is required as one cannot scrutinize themodel during testing, except perhaps with the help of avisual aid.
c. Scaled models. These models are straightforward,however, they require model materials to build the scalemodel. The model material development is difficult dueto the previously mentioned scaling problems. Use ofheavy materials such as barite might be of some use inscaling gravitational effects. In addition scaling associ-ated with modeling requirements, the scale effects associ-ated with shear strength selection must be also beconsidered as discussed in Chapter 4 of this manual.
8-6

EM 1110-1-290830 Nov 94
8-13. Design Considerations
A rock slope is accessed to be stable or potentiallyunstable depending upon the value of the calculated factorof safety. The calculated factor of safety is primarilydependent upon the geometry of the potential failure pathselected for analyses and the shear strength representativeof the potential failure surface. In addition, other factors,such as ground water conditions, potential for erosion,seismic loading, and possible blast-induced loosening ofthe rock mass must also be considered.
a. Factor of safety. For major rock slopes where theconsequence of failure is severe, the minimum requiredcalculated factor of safety is 2.0. For minor slopes, ortemporary construction slopes where failure, should itoccur, would not result in bodily harm or a major loss ofproperty, the minimum required factor of safety is 1.3.The minimum required factor of safety for rock slopessubject to and assessed for seismic loading is 1.1. Anyrelaxation of these values will be allowed only with theapproval of CECW-EG and should be justified by com-prehensive studies of such a nature as to reduce uncertain-ties to a minimum.
b. Critical potential failure paths. For a given rockslope, a number of potential failure paths are kinemati-cally possible. Each kinematically possible failure pathmust be analyzed. The critical potential failure path isthat potential slip surface which results in the lowestvalue for the factor of safety. For a rock slope to bejudged safe with respect to failure the factor of safetycalculated for the critical potential failure path must beequal to or greater than the appropriate minimum requiredfactor of safety.
c. Representative shear strength. Procedures forselecting appropriate shear strengths representative ofpotential failure paths are discussed in Chapter 4 of thismanual.
d. Ground water conditions. Unlike natural rockslopes, cut slopes must be analyzed prior to excavation.Hence, while fluctuations in ground water levels may beknown prior to design, the influence on these fluctuationsdue to excavation of a slope is difficult to predict. In thisrespect, assumptions pertaining to the phreatic surface andpotential seepage pressures should be made on the conser-vative side.
e. Effects of erosion. Certain argillaceous rock types(e.g. some shales) are susceptible to erosion caused byslaking upon repeated wetting and drying cycles. Soft
sedimentary rocks, in general, are also susceptible toerosion processes due to normal weathering, stream flow,or wave action. In this respect, stability analyses musteither account for the effects of potential erosion (i.e. lossof slope toe support and/or undermining of more compe-tent upper layers) or the overall design must provideprovision to control the effects of erosion.
f. Seismic loading. Where applicable, the stability ofrock slopes for earthquake induced base motion should bechecked by assuming that the specified horizontal andvertical earthquake accelerations act in the most unfavor-able direction. In this respect, earthquake-induced forcesacting on a potentially unstable rock mass may be deter-mined by a quasi-static rigid body approach in which theforces are estimated by Equations 7-8 and 7-9, as given inChapter 7 of this manual.
g. Potential blast effects. Shear strengths selected fordesign analyses are generally based on preconstructionrock mass conditions. Rock slopes are commonly exca-vated by drill and blast techniques. If improperly used,these excavation techniques can significantly alter thematerial properties of the rock mass comprising the slope.These alterations are more commonly evident as loosenedrock which results in a reduction of strength. Designanalyses must either account for potential blast-inducedloosening with subsequent loss of strength, or ensure thatproper drill and blast procedures are used in the excava-tion process. Proper drill and blast procedures are givenin EM 1110-2-3800.
Section IIITreatment Methods and Planning Considerations
8-14. General
The stability assessment of rock slopes frequently indi-cates an impending failure is possible. In such cases, anumber of methods are available for improving the overallstability. An appreciation of the mechanics associatedwith rock slope stability together with an understanding oftreatment methods for improving the stability of poten-tially unstable slopes permit the detailed planning andimplementation of a slope stability program.
8-15. Treatment Methods
The available treatment methods include alteration ofslope geometry, dewatering to increase resisting shearstrength, rock anchors, and toe berms protection to pre-vent slaking and erosion effects.
8-7

EM 1110-1-290830 Nov 94
a. Slope geometry. In the absence of an imposedload, the forces which tend to cause the instability of aslope are a direct function of both slope height and angleof inclination. A reduction of slope height and/or angleof inclination reduce the driving forces and, as a result,increase stability. In addition, since the majority of rockslope stability problems are three-dimensional in nature, afew degrees of rotation in the strike of the slope can, insome cases, cause a potentially unstable slope to becomekinematically stable.
b. Dewatering. The presence of ground water withina rock slope can effectively reduce the normal stressacting on the potential failure plane. A reduction in nor-mal stress causes a reduction in the normal stress depen-dent friction component of shear strength. Ground waterinduced uplift can be controlled by two methods, internaldrains and external drains. In this respect, drainage isoften the most economical and beneficial treatmentmethod.
(1) Internal drains. Properly designed and installedinternal drains can effectively reduce ground water levelswithin slopes thereby increasing stability. The specificdesign of an effective drain system depends upon thegeohydraulic characteristics of the rock mass (i.e. jointspacing, condition and orientation, as well as source ofground water). As a minimum, a effective drain systemmust be capable of draining the most critical potentialfailure surface. In climates where the ground surfacetemperature remains below freezing for extended periodsof time, the drain outlet must be protected from becomingplugged with ice. Hoek and Bray (1974) describe varioustypes of internal drains.
(2) External drains. External or surface drains aredesigned to collect surface runoff water and divert it awayfrom the slope before it can seep into the rock mass.Surface drains usually consist of drainage ditches or sur-face berms. Unlined ditches should be steeply graded andwell maintained.
c. Rock anchors. Rock bolts, as well as, grouted inplace reinforcement steel and cables are commonly usedto apply restraining forces to potentially unstable rockslopes. Rock anchors may be tensioned or untensioneddepending, primarily, upon the experience and preferenceof the District office in charge of design. It must berealized, however, that untensioned anchors rely on differ-ential movement of the rock mass to supply the necessaryresisting force and that very little cost is involved in ten-sioning. Where deformations must be minimized or
where initial resisting forces must be assured, the tension-ing of rock anchors upon installation may be required.
d. Erosion protection. Shotcrete, frequently with theaddition of wire mesh and/or fibers, is an effective surfacetreatment used to control slaking and raveling of certainargillaceous rock types that can lead to erosion problems.The treatment also prevents loosening of the rock massdue to weathering processes and provides surface restraintbetween rock bolts.
e. Toe berms. Toe berms provide passive resistancethat can be effective in improving the stability of slopeswhich the critical potential failure plane passes withinclose proximity to the toe of the slope.
8-16. Planning Considerations
With the design of numerous slopes or extremely longslopes, it is economically imperative that a system befollowed which will eliminate naturally stable or noncriti-cal slopes from study at a very early stage of investigationand allow concentration of effort and resources on thoseslopes which are critical. In this respect, a rock slopedesign flow chart which shows the steps required fordesign of rock slopes has been proposed by Hoek andBray (1981) and is presented in Figure 8-2 with somemodifications. The approach to the design of a slope isproposed in two phases.
a. Phase one. The first phase involves preliminaryevaluations of available geologic data which may includeair photo interpretations, surface mapping, and gatheringof data from rock cores from boreholes. Preliminarystability studies are then conducted using estimates ofshear strengths of the discontinuities from index tests,experience, and from back analyses of existing slopefailures in the area. These preliminary studies shouldidentify those slopes which are obviously stable and thosein which there are some risks of failure. Slopes whichare proven to be stable from the preliminary analysis canbe designed on the basis of operational considerations.
b. Phase two. Those slopes proved to have a risk offailure require further analyses based upon more detailedinformation of geology, ground water, and mechanicalproperties of the rock mass. These analyses shouldconsider the widest possible range of conditions whichaffect the stability of the slope. Slopes which are shownby detailed analyses to have an unacceptably high risk offailure must be redesigned to include stabilizationmeasures. The operational and cost benefits of the
8-8

EM 1110-1-290830 Nov 94
Figure 8-2. Analysis of the stability of slopes (modified from Hoek and Bray 1981)
stabilization measures should be compared with theirimplementation cost to determine the optimum methods ofstabilization. The risk of failure for some slopes may be
considered acceptable if slope monitoring would allowfailures to be predicted in advance and if the conse-quences of a failure can be made acceptable.
8-9

EM 1110-1-290830 Nov 94
Chapter 9Anchorage Systems
9-1. Scope
This chapter provides guidance for the design and evalu-ation of anchor systems used to prevent the sliding and/oroverturning of laterally loaded structures founded on rockmasses. This chapter supplements guidance provided inEM 1110-1-2907. The chapter is divided into two sec-tions: Modes of Anchor-Rock Interaction and Methods ofAnalyses.
Section IModes of Anchor-Rock Interaction
9-2. General
Anchor systems may be divided into two general cate-gories--tensioned and untensioned. The primary emphasisin the design, or selection of an anchorage system, shouldbe placed on limiting probable modes of deformation thatmay lead to failure or unsatisfactory performance. Theunderlying premise of anchorage is that rock masses aregenerally quite strong if progressive failure along planesof low strength can be prevented. Both tensioned anduntensioned anchors are suitable for the reduction ofsliding failures in, or on, rock foundations. Tensionedanchor systems provide a means for prestressing all, or aportion, of a foundation, thus, minimizing undesirabledeformations or differential settlements. Preconsolidationof rock foundations results in joint closure and whatappears as strain hardening in some foundations.
9-3. Tensioned Anchor Systems
A typical prestressed anchorage system is shown in Fig-ure 9-1. The use of grouted anchorages is practicallyuniversal, particularly with high capacity tendon systems.Upon tensioning, load is transferred from the tensioningelement, through the grout, to the surrounding rock mass.A zone of compression is established (typically assumedas a cone) within the zone of influence. Tensionedanchor systems include rock bolts and rock anchors, ortendons. The following definitions are as given inEM 1110-1-2907.
a. Rock bolt. A tensioned reinforcement elementconsisting of a rod, a mechanical or grouted anchorage,and a plate and nut for tensioning or for retaining tensionapplied by direct pull or by torquing.
Figure 9-1. Typical components of a tensioned rockanchor (from EM 1110-1-2907)
b. Prestressed rock anchor or tendon. A tensionedreinforcing element, generally of higher capacity than arock bolt, consisting of a high strength steel tendon (madeup of one or more wires, strands, or bars) fitted with astressing anchorage at one end and a means permittingforce transfer to the grout and rock at the other end.
9-4. Untensioned Anchor Systems
Untensioned rock anchors are generally referred to as rockdowels and are defined in EM 1110-1-2907 as an unten-sioned reinforcement element consisting of a rod embed-ded in a mortar or grout filled hole. Dowels providepositive resistance to dilation within a rock mass andalong potentially unstable contact surfaces. In addition tothe development of tensile forces resisting dilation, pas-sive resistance against sliding is developed within a rockmass when lateral strains occur. The interaction betweenthe dowel and the rock mass is provided through thecohesion and friction developed along the grout columnwhich bonds the rod and the rock. Untensioned anchorsystems should not be used to stabilize gravity structures.
9-1

EM 1110-1-290830 Nov 94
Section IIMethods of Analysis
9-5. General
Typically, analyses of systems used to anchor mass con-crete structures consist of one of two methods: proce-dures based upon classical theory of elasticity orprocedures based upon empirical rules or trial and errormethods. The gap between the methods has been nar-rowed by research in recent years but has not significantlyclosed to allow purely theoretical analysis of anchorsystems. The following discussions on methods of analy-ses are divided into tensioned and untensioned anchorsystems.
9-6. Analyses for Tension Anchor Systems
The design and analysis of anchor systems include deter-mination of anchor loads, spacing, depth, and bonding ofthe anchor. Safety factors are determined by consider-ation of the following failures; within the rock mass,between the rock and grout/anchor, between the grout andthe tendon or rod, and yield of the tendon or topanchorage.
a. Anchor loads. Anchor loads for prestressed tensi-oned anchors are determined from evaluation of safetyfactor requirements of structures. Anchors may bedesigned for stability considerations other than sliding toinclude overturning and uplift. Other factors must also beconsidered. However, anchor forces required for slidingstability assurance typically control design. Proceduresfor determining anchor forces necessary for stabilityof concrete gravity structures are covered inEM 1110-2-2200.
b. Anchor depths. Anchor depths depend upon thetype of rock mass into which they are installed and theanchor pattern (i.e., single anchor, single row of anchors,or multiple rows of anchors). The anchor depth is takenas the anchor length necessary to develop the anchor forcerequired for stability. The entire anchor depth lies belowthe critical potential failure surface.
(1) Single anchors in competent rock. The depth ofanchorage required for a single anchor in competent rockmass containing few joints may be computed by consider-ing the shear strength of the rock mobilized around thesurface area of a right circular cone with an apex angle of90 degrees (see Figure 9-2a). If it is assumed that thein-situ stresses as well as any stresses imposed on the
Figure 9-2. Geometry of rock mass assumed to bemobilized at failure (a) individual anchor in isotropicmedium and (b) line of anchors in isotropic medium(after Littlejohn 1977)
foundation rock by the structure is zero, then the shearstrength can be conservatively estimated as equal to therock mass cohesion. In such cases the anchor depth canbe estimated from Equation 9-1.
(9-1)D [(FS) (F ) / c π] 1/2
where
D = the required depth of anchorage
FS = the appropriate factor of safety
c = the rock mass cohesion intercept
F = the anchor force required for stability
(2) Single row of anchors in competent rock. Thedepth of anchorage for a single row of anchors (see Fig-ure 9-2b) installed in competent rock and spaced a dis-tances apart may be computed as follows:
(9-2)D(FS) (F)
cs
where
F = the anchorage force on each anchor
9-2

EM 1110-1-290830 Nov 94
All other parameters are as previously defined.
(3) Multiple rows of anchors in competent rock. Fora multiple row of anchors with rows spaced a distanceapart, typically, only the weight of the rock mass affectedis used in calculations of resisting force. Under thisassumption, the depth of anchorage required to resist aanchorage forceF per anchor is computed as follows:
(9-3)D(FS) (F)
γ s
where γ = the unit weight of the rock. All otherparameters are as previously defined.
(4) Single anchor in fractured rock. In fracturedrock, the strength of the rock mass subjected to a tensileforce (the anchor force) cannot typically be relied upon toprovide the necessary resistance. For this reason, only theweight of the affected one is considered. Based upon thisassumption, the depth of anchorage is completed asfollows:
(9-4)D
3(FS) (F)γ π
1/3
where γ = the unit weight of the rock. All other para-meters are as previously defined.
(5) Single row of anchors in fractured rock. As inthe case of a single anchor in fractured rock, typicallyonly the weight of the affected wedge of rock is reliedupon to provide the necessary resistance. Hence, for asingle row of anchors in fractured rock spacedS distanceapart, the anchorage depth is computed as follows:
(9-5)D
(FS) (F)γ S
1/2
All other parameters are as previously defined.
(6) Multiple rows of anchors in fractured rock. Formultiple rows of anchors with rows spaced distanceapart, again only the weight of the affected rock massresists the anchor force. In this respect Equation 9-3 isvalid.
c. Anchor bonding. The above equations, presentedfor analysis of anchor system, assume sufficient bond ofthe anchor to the rock such that failures occur within the
rock mass. The use of grouted anchorages has becomepractically universal with most rock reinforcement sys-tems. The design of grouted anchorages must, therefore,insure against failure between the anchor and the grout, aswell as, between the grout and the rock. Experience andnumerous pull-out tests have shown that the bond devel-oped between the anchor and the grout is typically twicethat developed between the grout and the rock. There-fore, primary emphasis in design and analysis is placedupon the grout/rock interface. For straight shafted,grouted anchors, the anchor force which can be developeddepends upon the bond stress, described as follows:
(9-6a)F πdLτ
(9-6b)τ 0.5τult
where
d = the effective diameter of the borehole
L = length of the grouted portion of the anchorbond length (normally not less than 10 ft)
τ = the working bond strength
τ = the ultimate bond strength at failure
Values of ultimate bond strength are normally determinedfrom shear strength data, or field pull-out tests. In theabsence of such tests, the ultimate bond stress is oftentaken as 1/10 of the uniaxial compressive strength of therock or grout (whichever is less) (Littlejohn 1977) up to amaximum value of 4.2 MPa (i.e., 600 psi).
9-7. Dowels
Structures should in principle be anchored, when required,to rock foundations with tensioned or prestressed anchor-age. Since a displacement or partial shear failure isrequired to activate any resisting anchorage force, analysisof the contribution of dowels to stability is at best diffi-cult. Dilation imparts a tensile force to dowels whendisplacements occur over asperities but the phenomenon israrely quantified for analytical purposes.
9-8. Design Considerations
a. Material properties. The majorities of materialproperties required for the design of anchor systems arealso typically required for the investigation of otheraspects of the foundation design. The selection of
9-3

EM 1110-1-290830 Nov 94
appropriate material properties is discussed in Chapter 4of this manual. Design anchor force derived from cal-culations not associated with sliding instability must con-sider the buoyant weight of rock where such rock is sub-merged below the surface water or ground water table.Tests not necessarily considered for typical foundationinvestigations but needed for anchor evaluations includerock anchor pull-out tests and chemical tests of theground water. Rock anchor pull-out tests (Rock TestingHandbook, RTH 323) provide valuable data for determin-ing anchorage depth and anchor bond strength. Hence, aprudent design dictates that pull-out tests be performed inthe rock mass representative of the foundation conditionsand anticipated anchor depths. Ground water chemicaltests establish sulphate and chloride contents to be used asa guide in designing the anchor grout mix. In addition,the overall corrosion hazard for the anchor tendon steelshould be established by chemical analysis. Such analy-ses are used to determine the amount and type of corro-sion protection required for a particular foundation.
b. Factors of safety. The appropriate factor of safetyto be used in the calculations of anchor force and anchor-age depth must reflect the uncertainties and built-in con-servatism associated with the calculation process. In thisrespect, anchor force calculations should be based on thefactor of safety associated with sliding stability of gravitystructures discussed in Chapter 7. Anchorage depth cal-culations based on the unit weight of the rock mass(Equations 9-3, 9-4, and 9-5) should use a minimumfactor of safety of 1.5. All other anchorage depth calcu-lations (i.e., Equations 9-1 and 9-2) should use a mini-mum factor of safety of 4.0 unless relaxed by CECW-EGfor special circumstances.
c. Total anchor length. In addition to the anchordepth and anchor bonding considerations given by Equa-tions 9-1 to 9-5 and Equation 9-6, respectively, the totalanchor length (Lτ) is controlled by the location at whichthe rock mass is assumed to initiate failure should a gen-eral rock mass failure occur. Littlejohn and Bruce (1975)summarize the assumed location of failure initiation com-monly used in practice. As indicated in Figure 9-3, threelocations are commonly assumed: potential failure initi-ates at the base of the socket; potential failure initiates atthe midpoint of the socket; or potential failure initiates atthe top of the socket. The implication with respect to thetotal anchor length imposed by each failure locationassumption is as shown in Figure 9-3. For the design ofanchors in competent or fractured rock masses where thebond length is supported by pull-out tests, the potentialfor rock mass failure is assumed to initiate at the base ofthe anchor as shown in Figure 6-3a. For preliminary
design where pull-out tests are not yet available or inhighly fractured and very weak material, such as clayshale, the potential for failure is assumed to initiate at themidpoint of the socket as shown in Figure 6-3b. How-ever, in the case of highly fractured and very weak mate-rial, pull-out tests must be performed to verify that thebond length is sufficient to develop the ultimate designload as specified in EM 1110-2-2000. Any relaxation intotal anchor length requirements must be approved byCECW-EG.
d. Corrosion protection. The current industry stan-dard for post-tensioned anchors in structures requiresdouble corrosion protection for all permanent anchors.
e. Design process. The rock anchor design processis conveniently divided into two phases; the initial designphases and the final detailed phase. Additional details areprovided in EM 1110-2-2200 and Post-Tensioning Insti-tute (1986).
(1) Initial phase. The design process is initiated byan evaluation which finds that a given structure is poten-tially unstable without additional restraining forces. If thepotential instability is due to potential for sliding, themagnitude of restraining forces is calculated according toprocedures given in EM 1110-2-2200. Restraining forcesnecessary to control other modes of potential instability,such as overturning, uplift pressures, or excessive differ-ential deformations are determined on a case-to-casebasis. The magnitude of the required restraining force isevaluated with respect to the economics and practicalityof using rock anchors to develop the necessary force.
(2) Final phase. The final detailed design phase is atrial and error process which balances economic andsafety considerations with physical consideration of howto distribute the required restraining force to the structureand still be compatible with structure geometry and foun-dation conditions. While sequential design steps reflectthe preference of the District Office, general design con-straints usually dictate that the total restraining force bedivided among a number of anchors. The number ofanchors and hence the spacing between anchors andanchor rows, as well as the anchor orientation and instal-lation details, are controlled by the geometry of the struc-ture. Foundation conditions control the anchorage depthas well as the amount and type of corrosion protection.Anchor depths between adjacent anchors should be variedin order to minimize adverse stress concentrations.
9-4

EM 1110-1-290830 Nov 94
Figure 9-3. Potential failure surfaces commonly assumed for the design of anchor depths in rock masses:(a) potential failure initiates at the base of the socket; (b) potential failure initiates at the midpoint of the socket;(c) potential failure initiates at the top of the socket
9-5

EM 1110-1-290830 Nov 94
Chapter 10Instrumentation
10-1. Scope
This chapter provides general guidance for the selectionand use of instrumentation to monitor cut slopes such asmight be necessary for the construction of rock founda-tions and roads as well as structures founded on rock suchas dams, lock walls, and retaining structures. Instrumen-tation for monitoring ground vibrations, water levels, andpore-water pressure measurements are discussed in moredetail than other instrumentation because of their wide-spread use. The limitations as well as data interpretationand evaluation considerations are also discussed. Detaileddescriptions and installation considerations, of the varioustypes of instrumentation discussed herein, can be found inthe referenced publications. The chapter is divided intofour sections as follows: Planning Considerations; Typi-cal Applications; Types of Instruments; and Data Interpre-tation and Evaluation.
Section IPlanning Considerations
10-2. General
Instrumentation is necessary on a project to assure thatdesign criteria are being met, thereby assuring the safetyof the structure, gain information valuable to future proj-ect design, monitor suspected problem areas to determinesafety and remedial measures required, and monitor effec-tiveness of remedial measures.
10-3. Program Initiation
An instrumentation program should be planned during thedesign of a project. The specific areas and phases of theproject from which data need to be gathered are deter-mined using the rock mechanics analyses and modelsdiscussed in previous chapters. In order to obtain themost complete picture of how a rock mass is respondingto the construction and operation of a project, instrumen-tation should be installed where possible before or duringconstruction. Early installation rarely increases the costof the instrumentation program, but does require moreplanning.
10-4. Cost Control
The instrumentation program should be well planned toassure that all necessary data will be collected and thatexcessive costs are not incurred. The main expenses ofan instrumentation program include instrument purchase,installation, maintenance, data gathering, and data inter-pretation. Excessive costs in each of these areas areincurred if instrument types and placement are plannedunwisely leading to more instrumentation than is neces-sary for the intended purpose or difficulty in interpretingdata due to lack of information. The instrumentationprogram must be flexible enough to allow for changesnecessary due to actual conditions encountered duringconstruction.
10-5. Types and Number of Instruments
The parameters which are most often measured are defor-mation, load/stress, pore-water pressures and water levels,and ground vibrations. The types of instrumentation usedto measure these parameters are listed in Table 10-1. Thenumber of instruments and various types that will berequired on a specific project are dependent on the pur-pose of the structure and the geologic conditions. Theinstrumentation program for every project should bedesigned specifically for that project and the expectedconditions and should use the principles of rock mechan-ics. Rock instrumentation must reflect conditions over alarge area of rock. Measurements made over small areaswill yield data so influenced by small random featuresthat it will be meaningless. Great care should be taken toassure that the particular instrumentation used will yieldthe type of information required at the necessaryaccuracy. An instrumentation program should be kept assimple as possible and still meet the objectives of the
Table 10-1Types of Rock Foundation Instruments
Pore-Water GroundDeformation Load/Stress Pressure Vibration
Surveying Load Cells Piezometers SeismographsInclinometers PiezometersExtensometers Uplift PressureSettlement Cells
IndicatorsHeave Points
10-1

EM 1110-1-290830 Nov 94
program. A complicated instrument is generally harder tomaintain and less reliable than a simple type. Simple,direct measurements are most easily and quicklyinterpreted.
Section IIApplications
10-6. General
This section describes some of the more common appli-cations of rock mechanics instrumentation. The discus-sions are divided into two general topic areas related toproject features addressed in this manual. These twotopic areas include cut slope instrumentation andstructure/foundation instrumentation.
10-7. Cut Slope Instrumentation
The number, types, and location of instruments used incut slopes are highly dependent on the cut configuration,the geologic conditions that are involved, and the conse-quence should a failure occur. As a rule, however, instru-mentation associated with cut slopes can be grouped intoinstruments used to make surface measurements and thoseused to make subsurface measurements.
a. Surface measurements. Surface measurementinstruments are primarily used to measure surface defor-mations. Since surface instrumentation reveals little as tounderlying mechanisms causing deformation, the instru-mentation is used to detect new areas of distress or pre-cursor monitoring of rock masses subject to impendingfailure. The degree of precision required by the intendedpurpose of instrumentation dictates the type of instrumentused to measure deformation.
(1) Surveying. If the slope is stable, then periodicsurveying of the floor and sidewalls using permanentmonuments and targets may be the only instrumentationrequired. Precise, repetitive surveying of a network ofsuch survey points is a relatively inexpensive method ofdetecting slope movement, both vertical and lateral.When a problem is detected, surveying can be used todefine the area of movement. Evaluation of problemareas is required to determine if additional instrumentationis required. Depending on other factors, surveying maybe continued, perhaps with increasing frequency, untilremedial measures appear to be inevitable. In other cases,the failure of the slope may be more acceptable than thecost of the remedial measures and surveying would becontinued until the slope failed, to insure the safety ofpersonnel and equipment when failure occurs. Details of
the instruments and surveying methods used may befound in TM 5-232, “Elements of Surveying” andTM 5-235, “Special Surveys.”
(2) Surface deformation. In most cases, however,additional instrumentation will be required to provide theinformation which enables the investigator to find or todefine the causes of the movement and to monitor the rateof movement. Tension cracks which appear at the crestof a slope or cut face may be monitored by surface typeextensometers. This type of extensometer generally con-sists of anchor points installed on either side of the zoneto be monitored. The zone may be one joint or crack orseveral such features. A tape or bar, usually composed ofinvar steel, is installed between the anchor points. ANewcastle extensometer may be installed on the tape toallow for very accurate readings which are necessary tomeasure the small initial indications of movement. Formeasuring larger movements, which would occur later andwhen continuous measurements are required, a bar andlinear potentiometer can be installed between the stakes.See Chapter 8 of the Canada Centre for Mineral andEnergy Technology (1977b) for details. If very largemeasurements are expected, a simple inexpensive system,which uses a calibrated tape to measure the change indistance between the two anchor points should be used.The tape can be removed after a reading is made. Thisinstrument aids in the determination of the surface dis-placement of individual blocks and differential displace-ments within an unstable zone. Dunnicliff (1988)provides an excellent review of the various types of sur-face monitored extensometers.
b. Subsurface measurements. Subsurface instrumen-tation provides greater detail of mechanisms causing dis-tress. Because subsurface instruments require installationwithin a borehole and the cost associated with such instal-lations, their use is typically limited to monitoring knownfeatures of potential instability or to investigate suspectedfeatures. Subsurface deformation measurements monitorthe relative movement of zones of rock with respect toeach other. Piezometric pressure measurement alongzones of potential instability monitor the influence ofground water with respect to stability.
(1) Subsurface deformations. Subsurface deforma-tions within rock slopes are commonly measured with oneof two types of downhole instruments, inclinometers, orborehole extensometers.
(a) Inclinometers are installed behind the slope, onflat slopes where drilling access is available, or into theslope and are bottomed in sound, stable rock. Successive
10-2

EM 1110-1-290830 Nov 94
measurements of deflections in the inclinometer are usedto determine the depth, magnitude, and rate of lateralmovement in the rock mass. While commonly installedin vertical boreholes, inclinometers are available thatallow installation in inclined to horizontal boreholes.Because successive deflection measurements can be madeat small intervals, the device is ideally suited to preciselylocate and define as well as monitor zones of instability.Detailed descriptions of inclinometers can be found inEM 1110-2-1908 (Part 2), “Instrumentation of Earth andRock Fill Dams” and Dunnicliff (1988).
(b) Borehole extensometers are often placed into theface of a cut or slope to help in determining the zonesbehind the face which are moving. When a deep cut isbeing made, extensometers may be installed in the wallsas the excavation progresses to monitor the response ofthe slope to an increasing excavation depth. Multipositionborehole extensometers (MPBX), rod or wire, are able tomonitor relative movement of a number of different zonesat varying distances behind the cut face. Such measure-ments help to determine which zones are potentially criti-cal and rate of movement. MPBX’s are particularlyhelpful in distinguishing between surficial and deep-seatedmovement. Extensometers may be equipped withswitches that automatically close and activate warningdevices when a preset movement limit is reached. Unlesscare is taken to isolate downhole wires or rods, installa-tions at great depths are not always practical due to thedifficulty of obtaining a straight borehole. It is necessaryto eliminate, as much as possible, the friction effectsbetween the extensometer wire or rod and the boreholewall. Friction effects can introduce large errors whichmake interpretation of the data impossible. The maxi-mum measurable deformation is relatively small rangingfrom approximately 0.5 to several inches, but this limitcan be extended by resetting the instrument. Extenso-meters are described in EM 1110-2-1908, Part 2 andDunnicliff (1988).
(2) Piezometric pressure. Drainage of a cut slope isoften necessary to increase its stability by reducing pore-water pressures in the slope. The effectiveness of anydrainage measure should be monitored by piezometers.Piezometer data should also be used to determine whenmaintenance of a drainage system is necessary. Piezo-meters should be installed during site investigation activi-ties to determine the ground-water system. Preconstruc-tion installation is important not only for design of theproject but also to determine if construction will adverselyaffect nearby ground-water users. Data should beobtained before, during, and after construction so that acause-affect trend can be determined, if there is one. This
information is very important if there are claims thatconditions in nearby areas have been changed due toactivities at the project. Piezometers are discussed inSection III, of this manual.
(3) Anchor loads. When the instruments discussedabove indicate that remedial measures such as rockboltsare necessary to stabilize a slope, then these sameinstruments are used to monitor the effectiveness of theremedial measures. The actual load or tension acting on arockbolt is monitored with a load cell. This informationis to assure that bolts are acting as designed and that themaximum load on the bolt is not exceeded. A representa-tive number of bolts in a system are usually monitored.The types of load cells include the hydraulic, mechanical,strain gaged, vibrating wire, and photoelastic. The strain-gaged load cell is the type most often used to monitorrockbolt systems. Load cells are described in the RockTesting Handbook as well as Dunnicliff (1988).
10-8. Foundation/Structure Instrumentation
As in the case of cut slopes, foundations and structuressuch as dams, lock walls, and retaining structures mayrequire a large number and variety of instruments. Theseinstruments are frequently similar or the same as thoserequired for slope monitoring and are divided into threegeneral categories dependent upon what observation isbeing measured. The three categories include deformationmeasurements, piezometric pressure measurements, andload/stress measurements.
a. Deformation measurements. Deformations offoundations and structures are generally observed asapparent translation, rotation, or settlement/heave. Appar-ent deformations may actually be the result of a combina-tion of the above deformation modes.
(1) Translation. Translation deformations caused byfoundation/structure interactions are generally apparent assliding along planes of weakness. It is essential to definethe planes along which translation occurs and evaluate theseverity of the problem at an early stage. Translationmeasurements of foundations and structures are generallymonitored with subsurface techniques discussed under cutslope instrumentation.
(2) Rotation. A tiltmeter may be used to determinethe rate, direction, and magnitude of angular deformationwhich a rock mass, a structure, or a particular block ofrock is undergoing. A tiltmeter, unlike an inclinometer,measures only at a discrete, accessible point. The devicemay be permanently buried with a remote readout or may
10-3
EM 1110-1-290830 Nov 94
be installed directly on the rock or structure surface. Ifthere is weathered rock at the surface, the device may bemounted on a monument which is founded in or on intactrock. The tiltmeter consists of a reference plate, which isattached to the surface that is being monitored, and asensing device. A portable sensing device may beinstalled on the reference plate for each reading or apermanent, waterproof housing containing the sensingdevice may be installed directly on the surface to be mon-itored. In the second case, readings may be made from aremote readout station. Tiltmeters may also be installeddirectly on a structure. Tiltmeters are described in moredetail in the Rock Testing Handbook and Dunnicliff(1988).
(3) Settlement/Heave. Settlement refers to compres-sion of the foundation material whereas heave refers toexpansion. Mechanisms that cause settlement are dis-cussed in Chapter 5. Mechanisms which cause heavewere also briefly discussed in Chapter 5, but are discussedin greater detail in Chapter 12.
(a) Settlement of a foundation beneath a structuremay be determined by repeated surveying of the elevationof a settlement gage monument installed directly on thefoundation and protected from frost and vandalism.Points on the structure itself may likewise be surveyed todetermine settlement, especially if direct access to thefoundation is not possible. Settlement indicators may alsobe used to measure settlement. Settlement indicators arecapable of measuring single or multiple points and operateon the same principle as a manometer. In areas beneathbuildings or other areas where direct access to the instru-ment is not available, a remotely read instrument may beused as described by Hanna (1973). The instrument isinstalled in the foundation before the structure is built.The elevation of the measuring point is calculated usingthe elevation of the readout point and a pressure readingat the measurement point. The original elevation of themeasuring point must be determined for comparisons tolater readings.
(b) The floor of an excavation may require monitor-ing for heave or rebound. Heave is not common in allrock or foundation conditions. Heave measurements givevaluable information for use in design of other structuresin similar rock masses and conditions. These measure-ments are also important to correlate performance withdesign assumptions, especially when the foundation is tosupport precise industrial or scientific equipment wherelittle departure from the design criteria can be tolerated.Heave points are the most common technique used tomeasure rebound during excavation. Heave points usually
consist of an anchor point that is placed in a borehole ator below the expected elevation at the bottom of the exca-vation. The elevation of the anchor is determined. Thedrill hole is filled with a bentonite slurry which contains adye to aid in relocating the instrument hole during con-struction. As excavation proceeds, a probe of knownlength is lowered to the top of the anchor point and theelevation of the anchor point is determined by opticalleveling. An alternative method uses a linear potentio-meter as the sensing element in the borehole. This typeof settlement gage is described by Hanna (1973).Settlement/heave gages are also described in EM 1110-2-1908 (Part 2) and Dunnicliff (1988). The method usedfor anchoring the reference point to the rock and protec-tion of the instrument during construction are importantconsiderations.
b. Piezometer pressure measurements. As in rockslopes, piezometers are often installed during site invest-igations and monitored to determine preconstruction con-ditions. A thorough understanding of the preconstructionconditions is very important not only for determining theeffects of such conditions, especially seasonal variations,on the construction and operation of the structure but alsofor determining the effects of the structure on the ground-water flow system. Dewatering activities, construction ofground-water cutoffs, and reservoir filling may affectlocal ground-water elevations and flow systems at somedistance away from the project possibly producing adverseaffects. Once construction begins, piezometers that arenot destroyed should continue to be monitored. Thisinformation can be used as an indication of how ground-water conditions and pore pressures change due to variousconstruction activities such as removal of overburden orthe added weight of the structure. Additional piezometersare installed when the structure is finished to monitor theperformance of cutoffs and drainage systems as well as tomeasure pressures in the foundation underneath a structureor in abutments. The flow rate through the drainagesystem should be measured as another method of monitor-ing its performance. Unexplained changes in seepagerates may warn of a serious problem even before it isreflected by piezometer or other instrumentation data.Calibrated weirs or simply a stopwatch and calibratedcontainer for lower flows are commonly used to measuredrain flows. Other critical areas should also be instru-mented as determined during design. Piezometers aredescribed in more detail in Section III.
c. Load/stress measurements. Instrumentation isfrequently required to check design assumptions relatingto stress distributions caused by rock/structure interactionsas well as to monitor zones of potential distress.
10-4

EM 1110-1-290830 Nov 94
Measurements of stress change in a foundation are madewith earth pressure cells which may be installed at theinterface of the structure and the rock or in a machinedslot within the rock mass. Three commonly used pressurecells, to include vibrating wire, hydraulic (Gloetzl) andWES (similar to Carlson stress meter) type cells, arediscussed in EM 1110-2-4300. It is necessary to install apiezometer near a pressure cell to isolate earth pressurechanges from pore-water pressure changes. Pressure cellsmust be installed carefully to eliminate error caused bysmall localized stress concentrations.
d. Combined measurements. As discussed inChapter 5, settlement or heave frequently is not uniformlydistributed across the foundation. In such cases it may benecessary to monitor the effects of both settlement/heaveand structural rotation. Instruments capable of monitoringthese combined effects include plumb lines, invertedplumb lines and optical plummets. These devices arethoroughly discussed in EM 1110-2-4300.
Section IIITypes of Instruments and Limitations
10-9. General
Section II discussed the general application of a numberof different types of instruments commonly used to moni-tor the performance of cut slopes and foundation rock/structure interactions. References were given that pro-vided detailed descriptions, installation procedures, andlimitations as well as advantages and disadvantages ofvarious devices. This section will address two specifictypes of instruments, piezometers and ground motion/vibration monitoring devices. Piezometers have beenmentioned previously but will be covered in greater detailhere. Ground motion devices, considered to be location/site specific devices, will be briefly discussed in thissection.
10-10. Piezometers
Piezometers are used to measure pore-water pressures andwater levels in the natural ground, foundations, embank-ments, and slopes. Piezometers are also used to monitorthe performance of seepage control measures and drainagesystems and to monitor the affect of construction andoperation of the project on the ground-water system in thevicinity of the project. There are three basic types ofpiezometers: open-system (open standpipe), closed-system (hydraulic), and diaphragm (pneumatic and electri-cal, e.g., vibrating wire). The operation, installation, and
construction of these piezometers are covered in detail inEM 1110-2-1908. The basic criteria for selecting piezom-eter types are reliability, simplicity, ruggedness, and lifeexpectancy. Other considerations are sensitivity, ease ofinstallation, cost, and the capability of being monitoredfrom a remote observation point. Sometimes two or moretypes of piezometers may be required to obtain the mostmeaningful information at a particular site. One of themost important factors to be considered is the impact ofhydrostatic time lag on the intended use of the piezometerdata. Table 10-2 compares the different types ofpiezometers.
a. Open-system piezometers. Open-system piezom-eters are the simplest types of piezometers but they arealso subject to the greatest hydrostatic time lag. They arebest used in areas where slow changes in pore-waterpressure are expected and the permeability is greater than10-5 cm/sec. If rapid pore water pressure changes areexpected, then open-system piezometers should only beused if the permeability is greater than 10-3 cm/sec(EM 1110-2-1908, Part 1 of 2).
b. Closed-system piezometers. The rate of pore-water pressure changes has little effect on the measure-ments obtained with this type of piezometer. This type iscommonly used to measure pore pressures during con-struction of embankments. The readout can be directed toa central location so that there is little interference withconstruction. However, the device must be checked oftenfor leakage and the presence of air. Open-system piezom-eters should be installed near key closed-system piezom-eters to provide a check on the operation of theclosed-system piezometer.
c. Diaphragm piezometers. Diaphragm piezometerscan be used in the same situations as open and closedsystem piezometers. They are very sensitive to pore-water pressure changes and the elevation differencebetween the piezometer tip and the readout point is not alimiting factor. The electrical diaphragm piezometer iscomplex and may be subject to instrument “zero” driftafter calibration and installation, short circuits in the leadcable, stretch and temperature effects in long lead cables,and stray electrical currents.
10-11. Ground Motions/Vibrations
Ground motions/vibrations which can affect a rock foun-dation may be caused by earthquakes or blasting. Con-trolled blasting techniques, as discussed in Chapter 11, areused to minimize damage to foundations and adjacent
10-5

EM 1110-1-290830 Nov 94
Table 10-2Comparison of Piezometer Types
Relative Volume ReadoutBasic Type Demand Equipment Advantages Disadvantages
Open-System(standpipe)
High WaterLevelFinder
Simple; comparativelyinexpensive; generallynot subject to freezing;relatively long life;fairly easy to install;long history of effec-tive operation.
Long time lag in most rock types; cannot measurenegative pore pressure; cannot be used in areassubject to inundation unless offset standpipe used;must be guarded during construction; no centralobservation station is possible; requires soundingprobe. Must be straight; difficulties possible in smalldiameter tubes if water levels significantly below100 feet, or dip less than 45 degrees.
Closed-System(hydraulic)
Medium to low UsuallyBourdongauge ormanometer
Small time lag; can mea-sure negative pore pres-sures; can be used inareas subject to inunda-tion; comparativelylittle interference withconstruction; can beread at central observa-tion stations.
Observation station must be protected againstfreezing; fairly difficult to install; fairly expensivecompared to open systems; sometimes difficult tomaintain an air-free system; most types are fragile;some types have limited service behavior records;requires readout location not significantly abovelowest water level.
Diaphragm Low to negli-gible
Specializedpressuretransmitteror elec-tronicreadout
Simple to operate; ele-vation of observationstation is independentof elevation of piezom-eter tip no protectionagainst freezing re-quired; no de-airingrequired; very smalltime lag.
Limited performance data, some unsatisfactoryexperience; some makes are expensive and requireexpensive readout devices; fragile and requirescareful handling during installation.
Pneumatic. Electricalsource not required; tipand readout devices areless expensive than forelectrical diaphragmtypes.
Often difficult to detect when escape of gas starts;negative pressures cannot be measured; condensa-tion of moisture occurs in cell unless dry gas isused; requires careful application of gas pressureduring observation to avoid damage to cell.
Electrical. Negativepressures can be mea-sured; ideal for remotemonitoring.
Devices subject to full and partial shortcircuits andrepairs to conductors introduce errors; some makesrequire temperature compensation and have prob-lems with zero drift to strain gages; resistance andstray currents in long conductors are a problem insome makes; zero drift possible.
Note:1. Modified from Pit Slope Manual, Chapter 4, 1977 and EM 1110-2-1908 (Part 1).
structures caused by blasting. Seismographs should beused to monitor the levels of vibration actually being pro-duced. Seismograph records (seismograms) are also usedto provide a record of vibrations to assure maximumlevels are not exceeded which could cause damage toadjacent structures. Seismograph is a general term whichcovers all types of seismic instruments that produce apermanent record of earth motion. The three main typesof seismographs measure particle displacement, velocity,
and acceleration. The instruments used in different appli-cations are discussed below.
a. Earthquakes. Measurement of earthquake motionassists in damage assessment after a significant earthquakeand is necessary for improving the design of structures,especially dams, to better resist earthquakes. Guidance isgiven in EM 1110-2-1908 for determining which struc-tures require instrumentation. The strong motion
10-6

EM 1110-1-290830 Nov 94
accelerograph and peak recording accelerograph are theprincipal instruments used to record earthquake motionson engineering projects such as dams. The accelerographmeasures particle acceleration in any direction or direc-tions desired. The strong motion instruments generallyrecord seismic motion between 0.01 g and 1.0 g. Theyare triggered by the minimum level of motion and recordcontinuously during any motion above a preset minimumlevel and for a short time after motion ceases. The peakaccelerograph records only the high amplitudes of theacceleration and does not make a continuous recording.This low cost instrument is used only to supplement datafrom other accelerographs. One or two strong motionaccelerographs may be located on a project and severalpeak accelerographs may be located in other areas toobtain an idea of how the acceleration differs across thesite. EM 1110-2-1908 provides additional discussions.
b. Blasting. As discussed in Chapter 11, constructionblasting should be controlled in order to reduce damageby ground vibrations to the foundation being excavatedand to nearby structures. Seismographs are used to moni-tor the ground vibrations caused by blasting. The peakparticle velocity is normally used as an indication ofpotential damage, therefore, a velocity seismograph isnormally used in engineering applications. The particlevelocity can be inferred from the information obtained byother types of seismographs but it is preferred to measureit directly so that an immediate record is available withoutextensive processing. EM 1110-2-3800, theBlaster’sHandbook(Dupont de Nemours and Company 1977), andDowding (1985) provide additional instrumentdescriptions.
10-12. Limitations
There are certain requirements by which all types of fieldinstrumentation should be evaluated. These include therange, sensitivity, repeatability, accuracy, and survivabilityof the instrument. The range must be adequate to mea-sure the expected changes but not so great that sensitivityis lost. It is not always possible to accurately predict themagnitude of loads and deformations to be expectedbefore construction. The most important of these factorsmay be repeatability because this factor determines thequality of the data. The sensitivity required will varywith the application. Good sensitivity is required forearly detection of hazards but may mean a reduction inthe range and stability of the instrument. If an instrumentwith too narrow a range is chosen, all the necessary datamay not be obtained. If an instrument with too large arange is chosen, then it may not be sensitive enough.Accuracy is difficult to define and to demonstrate. The
anisotropy of a parameter must be predictable if the accu-racy is to be determined. Calibration, consistency, andrepeatability are also used in determining accuracy. Theinstrument chosen for a particular application must also beable to survive the often severe conditions under which itwill be used. Cost should also be considered and the leastexpensive way of obtaining good quality informationshould be used. Table 10-3 provides a summary of someof the major limitations of the various types of instrumen-tation that have been discussed. Ranges and sensitivitiesfor different instrument types may vary between manufac-turers and may change rapidly due to research and devel-opment and so are not listed in this table. Many of theinstruments are also easily modified by a qualified labora-tory to meet the requirements of a particular job.
Section IVData Interpretation and Evaluation
10-13. Reading Frequency
The frequency at which instrument readings are takenshould be based on many factors and will vary by project,instrument type, availability of government personnel totake readings, and location and may even vary throughtime. The availability of government personnel to takethe readings should be determined during the preparationof plans and specifications. If government personnel willnot be available, provisions should be made to have thistask performed by the construction contractor or by anA-E contractor. Some of the factors which should beevaluated include outside influences such as constructionactivities, environmental factors (rainfall events, etc.), thecomplexity of the geology, rate of ground movements,etc. Several sets of readings should be taken initially toestablish a baseline against which other readings are to beevaluated. Daily or even more frequent readings may benecessary during certain construction activities, such asfill placement or blasting. The rate of change of thecondition which is being monitored may vary over time,dictating a change in the established frequency at whichreadings are taken. For example, an unstable slope maymove slowly at first, requiring infrequent readings on aregular basis until a near failure condition is reached, atwhich time readings would have to be taken much morefrequently. Readings of different types of instrumentsshould be made at the same time. Concurrent readingsenables the interpreter to take into account all the factorswhich might impact individual readings of specific param-eters. For example, an increase in pore water pressuremight coincide with increased slope movement. Standardforms should be used to record data when available, or if
10-7

EM 1110-1-290830 Nov 94
Table 10-3Limitations of Rock Instrumentation
MeasuredInstrument Parameter Limitations
Inclinometer
Tiltmeter
Extensometers
Bar
Single Point
Multipoint Rod
Multipoint Wire
Settlement Indicators
Heave Point
Load Cells
Hydraulic
Mechanical
Strain Gage
Vibrating Wire
Photoelastic
Piezometers
Uplift Cells
Standpipe
Diaphragm
Deformation
Deformation
Deformation
Deformation
Deformation
Stress, Load
Load, Stress
Deformation
Life may be limited in hard rock due to sharp edges. Significant drilling costs.
Measures one, near-surface discrete point. Subject to damage during construction.Difficult to detect spurious data. Must be protected from the environment. Subject toerrors caused by bonding material.
Does not distinguish between deep-seated and surficial movement. Limited accuracydue to sag. Measures only one point. Significant drilling costs, a new drill holerequired for each detection point.
Limited to approximately 50-foot depth if each rod is not individually cased within theinstrument hole. Experienced personnel should install them. May be damaged byborehole debris unless protected. Spring anchors may experience variable springtension due to rock movement.
Hydraulic types require de-aired water. Corrections for temperature and barometricpressure differences are required. Access to drill collar is required for some types.
Accuracy is limited by surveying techniques used.
Large size, poor load resolution, temperature sensitivity.
Nonlinear calibration curves.
Requires waterproofing, long term stable bonding method and periodic recalibration.
Large size, expensive, poor temperature compensation, complicated readout, vulner-able to shock.
Coarse calibration. Requires access to borehole collar.
See Table 10-2.
Readings may require either of two methods, sounder or pressure gage.
Susceptible to damage during installation.
not, then forms should be developed for specific instru-ments. Some forms are shown in EM 1110-2-1908. Ifpossible, data should be reduced in the field and com-pared with previous readings so that questionable readingscan be checked immediately. When large amounts ofdata must be managed, automatic recording devices thatrecord data as printed output or on magnetic tape for
processing by computer should be considered. Too manyreadings are not necessarily better than too few. Anexcess of data tends to bog down the interpretationprocess. A thorough evaluation of the purpose of theinstrument program must be used to determine the opti-mum rate at which readings should be taken, thusassuring that data are obtained when it is needed.
10-8

EM 1110-1-290830 Nov 94
10-14. Automatic Data Acquisition Systems
Automatic data acquisition systems and computer dataprocessing are very popular for obtaining and processinginstrumentation data. Computer programs are availablefor reducing and plotting most types of data. Some of theadvantages and disadvantages of these systems are givenby Dunnicliff (1988). Use of computer processing canspeed much tedious processing but should not replaceexamination of all of the data by an experienced person.
10-15. Data Presentation
Most types of data are best presented in graphical form.Graphical presentation facilitates the interpretation ofrelationships and trends in the data. Readings are com-pared over time and with other instrument readings aswell as compared with construction activities and chang-ing environmental conditions. Observed trends should becompared with predicted trends to make an assessment ofoverall performance. The data should be displayed prop-erly or significant trends may be obscured or may becomemisleading. A thorough knowledge and understanding ofthe instrumentation as well as some trial and error isrequired to successfully accomplish good data presenta-tion. Cookbook interpretation methods are available forsome types of data such as that from inclinometers.Cookbook interpretation is discouraged. Every instrumentshould be carefully and impartially analyzed by experi-enced personnel, taking all the available information intoconsideration.
10-16. Data Evaluation
Factors to consider when evaluating instrumentation datainclude instrument drift, cross sensitivity, calibration, and
environmental factors such as temperature and barometricpressure. Instrument drift is the change in instrumentreadings over time when other factors remain constant.Drift can be caused by temperature fluctuations, powersupply instability (weak battery), etc. If drift is notdetected, it can lead to erroneous data interpretation.Periodic calibration of instruments when possible, canreduce drift problems. Making repetitious readings alsohelps to detect and account for drift errors. Field calibra-tion units may be available for some instrument typessuch as inclinometers. Most instrumentation can be iso-lated from effects caused by changing environmentalconditions through the use of protective housings or rela-tively inert material. Invar steel is one material that is notgreatly affected by temperature change. Where protectivemeasures have not been used, environmental effects mustbe taken into account or the data may not be useful.Additional information on data processing and presenta-tion may be found in EM 1110-2-1908, Rock TestingHandbook, Hanna (1973) and Dunnicliff (1988).
10-17. Data Use
An instrumentation program can easily fail if the obtaineddata is never understood and used. A clear understandingof the purpose of the program is necessary for understand-ing of the data obtained. Some idea of the behavior thatis expected of the structure, usually developed duringdesign and adjusted during construction, is necessary inorder to evaluate the actual behavior. This predictedbehavior is the starting point from which all interpreta-tions are made. With these ideas in mind, instrumentationdata should prove to be a helpful tool in clearly under-standing and evaluating the behavior of any rock founda-tion or slope.
10-9

EM 1110-1-290830 Nov 94
Chapter 11Construction Considerations
11-1. Scope
This chapter provides general guidance for factors to beconsidered in the construction of foundations and cutslopes excavated in rock masses. The chapter is dividedinto five sections with general topic areas to include:Excavation; Dewatering and Ground Water Control;Ground Control; Protection of Sensitive Foundation Mate-rials; and Excavation Mapping and Monitoring.
Section IExcavation
11-2. Information Requirements
The factors that should be considered when determiningthe applicability of an excavation method fall into twogroups. The first group includes the characteristics of therock mass to be excavated. The more important of thesecharacteristics are hardness or strength of the intact rock,and the degree of fracturing, jointing, bedding, or foliationof the rock mass. This information will normally havebeen acquired during routine exploration. The secondgroup of factors includes features of the foundationdesign. These features are the size and shape of the exca-vation, the tolerances required along the excavation lines,and any restrictions on the time allowed for the excava-tion to be completed. This second group of factors deter-mines the amount of material to be excavated, therequired rate of excavation, the type of finished excava-tion surface the work must produce, and the amount ofworking space available.
11-3. Excavation Methods
A number of methods are available for excavating rock.These methods include drill and blast, ripping, sawing,water jets, roadheaders and other mechanical excavationmethods.
a. Drill and blast. Drill and blast is the most com-mon method of excavating large volumes of rock. Thehardness of some rock types may eliminate most otherexcavation techniques from consideration for all but thesmallest excavations. Blasting methods can be adapted tomany variations in site conditions. Drill and blast tech-niques, materials, and equipment are thoroughly discussed
in EM 1110-2-3800 and the Blasters Handbook (Dupontde Nemours and Company 1977). Due to the availabilityof that manual, the basics of blasting will not be discussedhere. The emphasis of this section will be on aspects ofdesign and construction operations that must be consid-ered when blasting is to be used as a foundation excava-tion method.
(1) Minimizing foundation damage. Blasting maydamage and loosen the final rock surfaces at the perimeterand bottom of the excavation. Although this damagecannot be eliminated completely, in most cases it can belimited by using controlled blasting techniques. The morecommon of these techniques are presplitting, smoothblasting, cushion blasting, and line drilling.
(a) When presplitting, a line of closely spaced holesis drilled and blasted along the excavation line prior to themain blast. This process creates a fracture plane betweenthe holes that dissipates the energy from the main blastand protects the rock beyond the excavation limits fromdamage.
(b) For the smooth blasting method, the main exca-vation is completed to within a few feet of the excavationperimeter. A line of perimeter holes is then drilled,loaded with light charges, and fired to remove the remain-ing rock. This method delivers much less shock andhence less damage to the final excavation surface thanpresplitting or conventional blasting due to the lightperimeter loads and the high degree of relief provided bythe open face.
(c) Cushion blasting is basically the same as smoothblasting. However, the hole diameter is substantiallygreater than the charge diameter. The annulus is eitherleft empty or filled with stemming. The definitions ofsmooth and cushion blasting are often unclear and shouldbe clearly stated in any blasting specifications.
(d) When using the line drilling method, primaryblasting is done to within two to three drill hole rowsfrom the final excavation line. A line of holes is thendrilled along the excavation line at a spacing of two tofour times their diameter and left unloaded. This createsa plane of weakness to which the main blast can break.This plane also reflects some of the shock from the mainblast. The last rows of blast holes for the main blast aredrilled at reduced spacing and are lightly loaded. Linedrilling is often used to form corners when presplitting isused on the remainder of the excavation.
11-1

EM 1110-1-290830 Nov 94
(e) To minimize damage to the final foundationgrade, generally blast holes should not extend belowgrade. When approaching final grade, the rock should beremoved in shallow lifts. Charge weight and hole spacingshould also be decreased to prevent damage to the finalsurface. Any final trimming can be done with lightcharges, jackhammers, rippers, or other equipment. Incertain types of materials, such as hard massive rock, itmay be necessary to extend blast holes below final gradeto obtain sufficient rock breakage to excavate to finalgrade. This procedure will normally result in overbreakbelow the final grade. Prior to placing concrete or sometypes of embankment material, all loose rock fragmentsand overbreak must be removed to the contractual stan-dard, usually requiring intense hand labor. The overexca-vated areas are then backfilled with appropriate materials.
(2) Adverse effects of blasting. Blasting producesground vibrations, airblast, and flyrock which affect thearea around the site. These effects should be kept to aminimum so that nearby structures and personnel are notdamaged, or injured and complaints from local residentsare kept to a minimum.
(a) Ground vibration is the cause of most complaintsand structural damage. Ground vibration is usuallyexpressed in terms of peak particle velocity, which can beestimated for a certain location using the equation
(11-1)V H(D/W1/2) B
where
V = peak particle velocity in one direction, inchesper second (ips)
D = distance from blast area to point particlevelocity of measurement, ft
W = charge weight per delay, lbs
H, B = constants
The constants,H and B, are site-specific and must bedetermined by conducting test blasts at the site and mea-suring particle velocities with seismographs at severaldifferent distances in different directions. By varying thecharge weight for each blast, a log-log plot of peak parti-cle velocity versus scaled distance (D/W1/2) may be con-structed. The slope of a best fit straight line through thedata is equal to the constantB and the value of velocity ata scaled distance of 1 is equal to the constantH. After
determining the constantsH and B, Equation 11-1 canthen be used to estimate the maximum charge weight thatcan be detonated without causing damage to nearby struc-tures. If test blasts are not conducted at the site todetermine the propagation constants, the maximum chargeweight may be estimated by assuming a value for thescaled distance. A value of 50 ft/lb1/2 is considered aminimum safe scaled distance for a site for which noseismograph information is available. Using this value,
(11-2)D/W1/2 50 ft/lb1/2
and
(11-3)W
D50
2
whereW is the maximum safe charge weight per delay inpounds. The maximum safe peak particle velocity formost residential structures is approximately 2 ips. Groundvibration exceeding this level may result in broken win-dows, cracked walls or foundations, or other types ofdamage. Blasts fired with a high degree of confinement,such as presplit blasts, may cause higher particle veloci-ties than those predicted by the vibration equation. Thisis due to the lack of relief normally provided by a freeexcavation face.
(b) Airblast, or compression waves travelling throughair, may sometimes damage nearby structures. Noise isthat portion of the airblast spectrum having wave frequen-cies of 20-20,000 Hz. Atmospheric overpressure iscaused by the compression wave front. This overpressuremay be measured with microphones or piezoelectric pres-sure gauges. An overpressure of 1 psi will break mostwindows and may crack plaster. Well-mounted windowsare generally safe at overpressures of 0.1 psi, and it isrecommended that overpressures at any structure notexceed this level. Airblast is increased by exposed deto-nating cord, lack of sufficient stemming in blast holes,insufficient burden, heavy low-level cloud cover, highwinds, and atmospheric temperature inversions. All ofthese conditions should be avoided during blasting. Tem-perature inversions are most common from 1 hour beforesunset to 2 hours after sunrise. Blasting should beavoided during these hours if airblast is a concern.
(c) Flyrock is usually caused by loading holes nearthe excavation face with too heavy a charge or by loadingexplosives too close to the top of the holes. These condi-tions should be avoided at all times. Flyrock may also becontrolled with blast mats. These are large woven mats
11-2

EM 1110-1-290830 Nov 94
of wire or rope which are laid over the blast holes or onthe face to contain flying debris. Blast mats should beused when blasting very close to existing structures.Extreme caution must be used when placing blast mats toprevent damage to exposed blasting circuits. An alterna-tive to a blasting mat is to place a layer of soil a few feetthick over the blast area prior to blasting to contain theflyrock.
(d) Complaints or claims of damage from nearbyresidents may be reduced by designing blasts to minimizethe adverse effects on the surrounding area as much aspossible while still maintaining an economic blastingprogram. To aid in the design of the production blast,test blasts should be conducted and closely monitored todevelop attenuation constants for the site. The test blastsshould be conducted at several loading factors in an areaaway from the production blast area or at least away fromcritical areas of the excavation. However, even withcareful blast design, some claims and complaints willmost likely occur. People may become alarmed or claimdamage when vibration and airblast levels are well belowthe damage threshold. There are several steps that maybe taken to protect against fraudulent or mistaken damageclaims. The most basic step is to maintain accuraterecords of every blast. The blasting contractor is requiredto submit a detailed blast plan far enough in advance ofeach shot to allow review by the Government inspector.The blast plan should give all the details of the blastdesign. After each blast, the contractor should submit ablast report giving the details of the actual blast layout,loading, results, and all other pertinent data. A blast planand report are normally required on Corps projects. Theground vibrations and airblast from each blast may alsobe recorded at the nearest structures in several differentdirections. The seismograph records can be used in theevent of a claim to determine if ground vibrations mayhave reached potentially damaging levels. It is also goodpractice to record all blasts on videotape. A video-tapedrecord can be helpful in solving various problems with theblasting operations. These monitoring records should bekept, along with the blast plans and records, as a recordof the conditions and results of each blast.
(e) A further precaution to be taken to protect againstdamage claims is to require that the contractor perform apreblasting survey of structures near the blasting area.The purpose of the survey is to determine the condition ofnearby structures prior to blasting. The survey shouldinclude recording all cracks in plaster, windows, andfoundations and photographing the buildings inside andout. The preblast survey might also include basic waterquality analyses from any wells in the area. It should
also be determined during the survey if there is any sensi-tive or delicate equipment in nearby buildings that maylimit the acceptable peak particle velocity to a value lessthan the normal 2 ips. This survey should be done at nocost to the property owners. If any property ownerrefuses to allow his property to be inspected, he should beasked to sign a statement simply stating that he declinedthe service. The results of the survey will help in deter-mining if damage was pre-existing or is blast-related.The scope of the test blasting, monitoring, and preblastsurvey will be dependent upon the size and duration ofthe production blasting and the anticipated sensitivity ofthe area as determined by the population density and othersocial and environmental factors.
(f) The key to blasting safety is experienced, safety-conscious personnel. All field personnel directly involvedwith a blasting operation must be thoroughly familiar withthe safety rules and regulations governing the use ofexplosives. Information and rules on blasting safety areavailable from explosives manufacturers or the Institute ofMakers of Explosives. Safety regulations that apply toCorps of Engineers projects are stated in EM-385-1-1,Safety and Health Requirements, Section 25. These regu-lations shall be strictly adhered to under all circumstances.The contractor should be required to conduct operations incompliance with all safety regulations. Any unsafe prac-tices must be immediately reported and corrected to avoidaccidents.
b. Ripping. Ripping is a means of loosening rock soit may be excavated with loaders, dozers, or scrapers. Itinvolves the use of one or more long narrow teeth whichare mounted behind a crawler tractor. Downward pres-sure is exerted by the tractor and the teeth are pulledthrough the rock. In addition to standard rippers, impactrippers have been developed in recent years that are capa-ble of breaking relatively strong rock.
(1) Factors influencing rippability. The rock’s sus-ceptibility to ripping is related to the rock structure andhardness. The rock structure, in the form of joints, frac-tures, bedding, faulting, or other discontinuities, deter-mines to a large degree the rippability of the rock mass.These discontinuities represent planes of weakness alongwhich the rock may separate. Rock with closely spaced,continuous, near horizontal fractures is much more easilyripped than rock with widely spaced, discontinuous, highangle fractures. Rock hardness influences the rippabilityby determining the amount of force that must be exertedby a ripper tooth to fracture the intact rock. Rock type,fabric, and weathering can be related to the rippability ofa rock mass because of the influence they have on the
11-3

EM 1110-1-290830 Nov 94
rock structure and hardness. Sedimentary rocks are gen-erally easiest to rip because of their laminated structure.Igneous rock are generally difficult to rip because they areusually hard and lack well-developed lamination. Anyweathering that takes place reduces the hardness of therock and creates additional fractures, making the rockeasier to rip. Due to its lesser degree of homogeneity,rock with a coarse grained fabric is generally weaker thanfine grained rock. Because of this, coarse grained rock isusually easier to excavate by ripping than finer grainedrock types.
(2) Rippability indicators. Seismic wave velocity isoften used as an indicator of the rippability of a rockmass. The seismic wave velocity is dependent on therock density or hardness and the degree of fracturing.Hard, intact rock has a higher seismic velocity than softer,fractured rock. Therefore, rocks with lower seismicvelocities are generally more easily ripped than those withhigher seismic velocities. The seismic wave velocity maybe measured using a refraction seismograph and perform-ing a seismic survey of the excavation site. To determinethe rippability of the rock, the seismic wave velocity mustthen be compared with the seismic wave velocities ofsimilar materials in which ripper performance has beendemonstrated. Tractor manufacturers have publishedcharts showing, for a particular size tractor and specificripper configuration, the degree of rippability for differentrock types with varying seismic velocities. The rippabil-ity of a rock mass may also be assessed by using a rockmass rating system developed by Weaver (1975). Usingthis system, various rock mass parameters are assignednumerical ratings. The numerical values are then addedtogether to give a rippability rating. Lower ratings indi-cate easier ripping. Using tractor manufacturer’s charts,this rating can be correlated to production rate for varioustractor sizes.
(3) Contract considerations. It should never be statedin contract specifications or other legal documents that arock is rippable or inability to rip designates a new payitem without specifying the tractor size, ripper configura-tions and cubic yards loosened per hour (for pay pur-poses) for which the determination of rippability wasmade. Rock that may be rippable using a very largetractor may not be rippable using smaller equipment. Notincluding this qualifying information may lead to claimsby a contractor who, after finding he is unable to rip therock with the size equipment he has available, claims thecontract documents are misleading or incorrect.
(4) Other considerations. Ripping may be used toremove large volumes of rock in areas large enough to
permit equipment access. However, ripping producesvery poorly sorted muck with many large blocks of rock.Muck from ripping may require further breaking or crush-ing to make it suitable for use as fill or riprap.
c. Sawing. Sawing is not a common practice,although it is sometimes used as a way of trimming anexcavation in soft rock to final grade. Saws may also beused to cut a slot along an excavation line prior to blast-ing or ripping as an alternative to line drilling. One ofthe advantages of sawing is that it produces a verysmooth excavation face with minimal disturbance to theremaining rock. It also gives very precise control of theposition of the final excavation face and may be used tofinish fairly complex excavation shapes. Coal saws havebeen used for sawing soft rocks. Concrete saws may beused for very small scale work in harder material.
d. Water jets. High pressure water jets are beginningto find uses as excavation tools in the construction indus-try. Water jets cut rock through erosion and by inducinghigh internal pore pressures which fail the rock in tension.Water jets may range from large water canon to smallhand-held guns. Extremely hard rock may be cut withwater jets. However, the pressures required to cut hardrock are extremely high. Optimum pressures for cuttinggranite may be as high as 50,000 psi. Water jets may beused for cutting slots, drilling holes, trimming to neatexcavation lines, cleaning loose material from an exca-vated surface. Drill holes may also be slotted or belled.Water jets may not be suitable for use in formationswhich are extremely sensitive to changes in moisture.
e. Roadheaders. Roadheaders, which are often usedin underground excavation, may also be used for finaltrimming of surface excavations. Roadheaders canrapidly and accurately excavate rock with little distur-bance to the remaining rock mass. However, due topower and thrust limitations, their use is limited to rockwith a unconfined compressive strength less than approxi-mately 12,000 psi. Large machines may have very highelectrical power requirements. Cutting capabilities, lengthof reach, and power requirements vary widely betweenmodels and manufacturers.
f. Other mechanical excavation methods. Varioustypes of mechanical impactors or borehole devices aresometimes used in rock excavation. Mechanical impact-ors may include hand-operated jackhammers, tractor-mounted rock breakers, or boom-mounted hydraulicimpact hammers. These all use chisel or conical pointsthat are driven into the rock by falling weights or byhydraulic or pneumatic hammers. Wedges or hydraulic
11-4
EM 1110-1-290830 Nov 94
borehole jacks may be driven or expanded in boreholes tosplit the rock. Chemicals have been developed which areplaced in boreholes much like explosives and, throughrapid crystal growth, expand and fracture the rock.Wedges, borehole jacks, or expanding chemicals mayprovide alternative means of excavation in areas wherethe vibration and noise associated with blasting cannot betolerated because of nearby structures or sensitive equip-ment. Because of their generally low production rates,these alternative methods are normally used only on alimited basis, where excavation quantities are small or forbreaking up large pieces of muck resulting from blastingor ripping. Crane-mounted drop balls are also often usedfor secondary muck breakage. Jackhammers may be usedin confined areas where there is not sufficient room formost equipment to operate.
11-4. Effects of Discontinuities on Excavation
a. Overbreak. The amount of overbreak, or rockbreakage beyond intended excavation lines, is stronglyaffected by the number, orientation, and character of thediscontinuities intersecting the faces of the excavation.Discontinuities represent preferred failure planes withinthe rock mass. During excavation the rock will tend tobreak along these planes. In rock with medium to closelyspaced joints that intersect the excavation face, overbreakwill most likely occur and will produce a blocky excava-tion surface. If joints run roughly parallel to the excava-tion face, overbreak may occur as slabbing or spalling.Worsey (1981) found that if a major joint set intersectedthe excavation face at an angle less than 15 degrees,presplit blasting had little or no beneficial effect on theslope configuration. When blasting, overbreak will alsobe more severe at the corners of an excavation. Over-break increases construction costs by increasing muckquantities and backfill or concrete quantities. Because ofthis, the excavation should be planned and carried out in away that limits the amount of overbreak. Special mea-sures may be required in areas where overbreak is likelyto be more severe because of geologic conditions or exca-vation geometry. These measures may include controlledblasting techniques or changes in the shape of theexcavation.
b. Treatment of discontinuities. Sometimes, opendiscontinuities must be treated to strengthen the founda-tion or prevent underseepage. Open discontinuitiesencountered in bore holes below the depth of excavationmay be pressure grouted. Open joints and fractures,solution cavities, faults, unbackfilled exploratory holes, orisolated areas of weathered or otherwise unacceptablerock may be encountered during the excavation process.
These features must be cleaned out and backfilled. Whenthese features are too small to allow access by heavyequipment normally used for excavation, all work must bedone by hand. This process is referred to as dental treat-ment. Any weathered or broken rock present in theopenings is removed with shovels, hand tools, or waterjets. The rock on the sides of the opening should becleaned to provide a good bond with the concrete backfill.Concrete is then placed in the opening, usually by hand.
Section IIDewatering and Ground Water Control
11-5. Purposes
Dewatering of excavations in rock is performed to providedry working conditions for men and equipment and toincrease the stability of the excavation or structures.Most excavations that are left open to precipitation or thatextend below ground water will require some form ofdewatering or ground-water control. Evaluation of thepotential need for dewatering should always be includedin the design of a structure. Construction contract docu-ments should point out any known potential dewateringproblems by the field investigation work.
11-6. Planning Considerations
The complexity of dewatering systems varies widely.Small shallow excavations above ground water mayrequire only ditches to divert surface runoff, or no controlat all if precipitation and surface runoff will not causesignificant construction delays. Extensive dewateringsystems utilizing several water control methods may berequired for larger deeper excavations where inflow ratesare higher and the effects of surface and ground-waterintrusion are more severe. It must be determined whatground-water conditions must be maintained during thevarious stages of the construction of the project. Thedewatering system must then be designed to establish andmaintain those conditions effectively and economically.The size and depth of the excavation, the design andfunctions of the planned structure, and the project con-struction and operating schedule must all be consideredwhen evaluating dewatering needs and methods. Thedewatering methods must also be compatible with theproposed excavation and ground support systems. Thedewatering system should not present obstacles to excava-tion equipment or interfere with the installation or opera-tion of the ground support systems. The rock masspermeability and existing ground-water conditions must bedetermined to evaluate the need for, or adequately design,a ground-water control system. The presence and nature
11-5

EM 1110-1-290830 Nov 94
of fracture or joint-filling material and the hardness orerodibility of the rock should also be determined to assessthe potential for increasing flows during dewatering dueto the enlargement of seepage paths by erosion.
11-7. Dewatering Methods
Dewatering refers to the control of both surface runoffand subsurface ground water for the purpose of enhancingconstruction activities or for improving stability.
a. Surface water control. Runoff and other surfacewaters should be prevented from entering the excavationby properly grading the site. Ditches and dikes may beconstructed to intercept runoff and other surface water anddirect it away from the work area. Ponding of water onthe site should be prevented. Ponded water may infiltrateand act as a recharge source for ground-water seepageinto the excavation.
b. Ground-water control. Ground water may becontrolled by a number of different methods. The morecommonly used methods include open pumping, horizon-tal drains, drainage galleries, wells, and cutoffs.
(1) Open pumping. When dewatering is accom-plished with the open pumping method, groundwater isallowed to enter the excavation. The water is diverted toa convenient sump area where it is collected and pumpedout. Collector ditches or berms constructed inside theexcavation perimeter divert the water to sumps. Pumpsare placed in pits or sumps to pump the water out of theexcavation. Most large excavations will require someform of open pumping system to deal with precipitation.In hard rock with clean fractures, fairly large ground-water flows can be handled in this manner. However, insoft rock or in rock containing soft joint filling material,water flowing into the excavation may erode the fillingmaterial or rock and gradually increase the size of theseepage paths, allowing flows to increase. Other condi-tions favorable for the use of open pumping are lowhydraulic head, slow recharge, stable excavation slopes,large excavations, and open unrestricted work areas.Open-pumping dewatering systems are simple, easilyinstalled, and relatively inexpensive. However, dewater-ing by open pumping does not allow the site to be drainedprior to excavation. This may result in somewhat wetterworking conditions during excavation than would beencountered if the rock mass were predrained. Anotherdisadvantage is that the water pressure in low permeabil-ity rock masses may not be effectively relieved around theexcavation. This method should not be used withoutsupplementary systems if the stability of the excavation is
dependent on lowering the piezometric head in the sur-rounding rock mass. Because the drainage system liesinside the excavation, it may interfere with other construc-tion operations. In some cases, it may be necessary tooverexcavate to provide space for the drainage system. Ifoverexcavation is required, the cost of the system maybecome excessive.
(2) Horizontal drains. Horizontal drains are simplyholes drilled into the side of the excavation to intercepthigh angle fractures within the rock mass. The drainholes are sloped slightly toward the excavation to allowthe water to drain from the fractures. The drains emptyinto ditches and sumps and the water is then pumpedfrom the excavation. This is a very effective and inex-pensive way to relieve excess pore pressure in the rockmass behind the excavation sides or behind a permanentstructure. The drain holes can be drilled as excavationprogresses downward and do not interfere with work orequipment operation after installation. When laying outdrain hole locations, the designers must make sure theywill not interfere with rockbolts or concrete anchors.
(3) Drainage galleries. Drainage galleries are tunnelsexcavated within the rock mass outside the main excava-tion. Drainage galleries normally are oriented parallel tothe excavation slope to be drained. Radial drain holes aredrilled from the gallery to help collect the water in frac-tures and carry it into the drainage gallery, where it isthen pumped out. Drainage galleries must be largeenough to permit access of drilling equipment for drillingthe drain holes and future rehabilitation work. Thismethod is effective in removing large quantities of waterfrom the rock mass. Drainage galleries can be con-structed prior to the foundation excavation using conven-tional tunnel construction methods to predrain the rockmass and they may be utilized as a permanent part of thedrainage system for a large project. However, they arevery expensive to construct and so are only used whenwater must be removed from a large area for extendedperiods of time.
(4) Wells. Pumping wells are often used to dewaterexcavations in rock. Wells can be placed outside theexcavation so they do not interfere with constructionoperations. Wells also allow the rock mass to be pre-drained so that all excavation work is carried out underdry conditions. Wells are capable of producing largedrawdowns over large areas. They are also effective fordewatering low to medium angle fractures that may act asslide planes for excavation slope failures. They will noteffectively relieve the pore pressure in rock masses inwhich the jointing and fracturing is predominantly high
11-6

EM 1110-1-290830 Nov 94
angled. The high angle fractures are not likely to beintersected by the well and so will not be dewateredunless connected to the well by lower angled fractures orpermeable zones. The operating cost of a system ofpumping wells can be high due to the fact that a pumpmust operate in each well. Power requirements for alarge system can be very high. A backup power sourceshould always be included in the system in the event offailure of the primary power source. Loss of power couldresult in failure of the entire system.
(5) Cutoffs. Ground-water cutoffs are barriers oflow permeability intended to stop or impede the move-ment of ground water through the rock mass. Cutoffs areusually constructed in the form of walls or curtains.
(a) Grouting is the most common method of con-structing a cutoff in rock. A grout curtain is formed bypressure grouting parallel lines of drill holes to seal thefractures in the rock. This creates a solid mass throughwhich ground water cannot flow. However, completesealing of all fractures is never achieved in grouting. Theeffectiveness of a grout curtain is difficult to determineuntil it is in operation. Measurements of changes in groutinjection quantities during grouting and pumping testsbefore and after grouting are normally used to estimatethe effectiveness of a grouting operation. Grouting forexcavation dewatering can normally be done outside theexcavation area and is often used to reduce the amount ofwater that must be handled by wells or open pumping. Itis also used to construct permanent seepage cutoffs inrock foundations of hydraulic structures. Corps of Engi-neers publications on grouting include EM 1110-2-3506,EM 1110-2-3504, Albritton, Jackson, and Bangert (1984)(TR GL-84-13).
(b) Sheet pile cutoffs may be used in some very softrocks. However, sheet piling cannot be driven into hardermaterials. The rock around the sheet pile cutoff may befractured by the pilings during installation. This willincrease the amount of flow around and beneath the cutoffwall and greatly reduce its effectiveness.
(c) Slurry walls may also be used as cutoffs in rock.However, due to the difficulty and expense of excavatinga deep narrow trench in rock, slurry walls are usuallylimited to use in soft rocks that may be excavated withmachinery also used in soils.
(d) Recent developments in mechanical rock excava-tors that permit excavation of deep slots in relativelystrong and hard rock have resulted in increased
cost-effectiveness of using diaphragm walls as effectivecutoff barriers.
(e) Ground freezing may be used to control waterflows in areas of brecciated rock, such as fault zones.The use of freezing is generally limited to such soil-likematerials. The design, construction, and operation ofground freezing systems should be performed by an engi-neering firm specializing in this type of work.
Section IIIGround Control
11-8. Stability Through Excavation Planning
During the design or construction planning stages of aproject that involve significant cuts in rock, it is necessaryto evaluate the stability of the planned excavations. Thestability of such excavations is governed by the disconti-nuities within the rock mass. The occurrence, position,and orientations of the prominent discontinuities at a siteshould be established during the exploration phase of theproject. Using the information and the proposed orienta-tions of the various cut faces to be established, vectoranalysis or stereonet projections may be used to determinein which parts of the excavation potentially unstable con-ditions may exist. If serious stability problems are antici-pated, it may be possible to change the position ororientation of the structure or excavation slope to increasethe stability. However, the position of the structure isusually fixed by other factors. It may not be practical tochange either its position or orientation unless the stabilityproblems created by the excavation are so severe that thecost of the necessary stabilizing measures becomes exces-sive. It may never be possible to delineate all discontinu-ities and potentially unstable areas before excavationbegins. Unexpected problems will likely always beexposed as construction progresses and will have to bedealt with at that time. But performing this relativelysimple and inexpensive analysis during design and plan-ning can reduce construction costs. The costs and timedelays caused by unexpected stability problems or failuresduring construction can be extreme. The level of effortinvolved in determining the stability of the excavationslopes will be governed by the scale of the project and theconsequences of a failure. A very detailed stability analy-sis may be performed for a dam project involving verydeep foundation cuts where a large failure would have aserious impact on the economics and safety of the opera-tion. The level of effort for a building with a shallowfoundation may only include a surface reconnaissancesurvey of any exposed rock with minimal subsurface
11-7

EM 1110-1-290830 Nov 94
investigations and then any unstable portions of the exca-vation may be dealt with during construction.
11-9. Selection of Stabilization Measures
When choosing a stabilization method, it is important thatthe applicable methods be compared based on theireffectiveness and cost. In some cases, it may be per-missible to accept the risk of failure and install monitor-ing equipment to give advance warning of an impendingfailure. Hoek and Bray (1977) gives a practical exampleof selecting a stabilization method from several possiblealternatives.
11-10. Stabilization Methods
Remedial treatment methods for stabilizing slopes exca-vated in rock were briefly discussed in Chapter 8. Stabi-lization methods to include drainage slope configuration,reinforcement, mechanical support and shotcrete are dis-cussed in more detail below.
a. Drainage. The least expensive method of increas-ing the stability of a slope is usually to drain the groundwater from the fractures. This can be done by horizontaldrain holes drilled into the face, vertical pumping wellsbehind the face, or drainage galleries within the slope. Inconjunction with drainage of the ground water, surfacewater should be kept from entering the fractures in theslope. The ground surface behind the crest should besloped to prevent pooling and reduce infiltration. Diver-sion ditches may also be constructed to collect runoff andcarry it away from the slope. Diversion and collectionditches should be lined if constructed in highly permeableor moisture sensitive materials.
b. Slope configuration. Other stabilization methodsinvolve excavating the slope to a more stable configura-tion. This can be done by reducing the slope angle or bybenching the slope. Benching results in a reduced overallslope angle and the benches also help to protect the workarea at the base of the slope from rockfall debris. If themajority of the slope is stable and only isolated blocks areknown to be in danger of failing, those blocks may simplybe removed to eliminate the problem. The use of con-trolled blasting techniques may also improve the stabilityof an excavated slope by providing a smoother slope faceand reducing the amount of blast-induced fracturingbehind the face.
c. Rock reinforcement. Rock reinforcement may beused to stabilize an excavation without changing the slopeconfiguration and requiring excess excavation or backfill.
Rock bolts or untensioned dowels are used to control nearsurface movements and to support small to medium sizedblocks. They may be installed at random locations asthey are needed or in a regular pattern where more exten-sive support is required. Rock anchors or tendons areusually used to control movements of larger rock massesbecause of their greater length and higher load capacity.One of the advantages of using reinforcement is that theexcavation face may be progressively supported as theexcavation is deepened. Thus, the height of slope that isleft unsupported at any one time is equal to the depth of asingle excavation lift or bench. After installation, rockreinforcement is also out of the way of activity in thework area and becomes a permanent part of the founda-tion. Rock bolts or anchors may also be installed verti-cally behind the excavation face prior to excavation toprevent sliding along planar discontinuities which will beexposed when the cut face is created. The effects of rockreinforcement are usually determined using limit equilib-rium methods of slope analysis. Methods for determininganchorage force and depth are given in Chapter 9 onAnchorage Systems. While the methods discussed inChapter 9 were primarily developed for calculating anchorforces applicable to gravity structures, the principlesinvolved are also applicable to rock slopes. Additionalinformation may be found in EM 1110-1-2907 (1980) andin the references cited in Chapter 8.
d. Mechanical support and protection methods.Mechanical support methods stabilize a rock mass byusing structural members to carry the load of the unstablerock. These methods do not strengthen the rock mass.The most common type of mechanical support for founda-tion excavations is bracing or shoring. In rock excava-tions, support usually consists of steel beams placedvertically against the excavation face. In narrow excava-tions, such as trenches, the vertical soldier beams are heldin place by horizontal struts spanning the width of thetrench. In wider excavations, the soldier beams are sup-ported by inclined struts anchored at the lower end to thefloor of the excavation. Steel or timber lagging may beplaced between the soldier beams where additional sup-port is needed. One of the disadvantages of bracing andshoring is that mobility in the working area inside theexcavation is hampered by the braces. A common solu-tion to this problem is to tie the soldier beams to the rockface with tensioned rock bolts. This method utilizes thebenefits of rock reinforcement while the beams spread theinfluence of each bolt over a large area. When only smallrock falls are expected to occur, it may not be necessaryto stabilize the rock. It may only be necessary to protectthe work area in the excavation from the falling debris.Wire mesh pinned to the face with short dowels will
11-8

EM 1110-1-290830 Nov 94
prevent loose rock from falling into the excavation. Themesh may be anchored only at its upper edge. In thiscase, the falling debris rolls downslope beneath the meshand falls out at the bottom of the slope. Wire mesh maybe used in conjunction with rock bolts and anchors orbracing to help protect workers from debris fallingbetween larger supports. Buttresses, gabions, andretaining walls, although commonly used for support ofpermanent slopes, are not normally used to support tem-porary foundation excavations.
e. Shotcrete. The application of shotcrete is a verycommon method of preventing rock falls on cut rockslopes. Shotcrete improves the interlock between blockson the exposed rock surface. The shotcrete does not carryany load from the rock and so is more a method of rein-forcement than of support. Shotcrete may also be appliedover wire mesh or with fibers included for added strengthand support. Shotcrete is fast and relatively easy to applyand does not interfere with workings near the rock cut.Shotcrete also aids in stabilizing rock cuts by inhibitingweathering and subsequent degradation of the rock. Thisis discussed further in Section IV on Protection of Sensi-tive Foundations.
Section IVProtection of Sensitive Foundation Materials
11-11. General
Some rocks may weather or deteriorate very rapidly whenexposed to surface conditions by excavation processes.These processes may cause a considerable decrease in thestrength of the near surface materials. The processesmost likely to be responsible for such damage are freeze-thaw, moisture loss or gain, or chemical alteration ofmineral constituents. To preserve the strength and charac-ter of the foundation materials, they must be protectedfrom damaging influences.
11-12. Common Materials Requiring Protection
There are several rock types that, because of their miner-alogy or physical structure, must be protected to preservetheir integrity as foundation materials.
a. Argillaceous rocks. Shales and other argillaceousrocks may tend to slake very rapidly when their moisturecontent decreases because of exposure to air. This slak-ing causes cracking and spalling of the surface, exposingdeeper rock to the drying effects of the air. In severecases, an upper layer of rock may be reduced to a brecci-ated, soil-like mass.
b. Swelling clays. Joint filling materials of mont-morillonitic clays will tend to swell if their moisture con-tent is increased. Swelling of these clays brought aboutby precipitation and runoff entering the joints may causespalling or block movement perpendicular to the joints.
c. Chemically susceptible rock. Some rock typescontain minerals that may chemically weather at a veryrapid rate to a more stable mineral form. The feldspars insome igneous rocks and the chlorite and micas in someschists may rapidly weather to clays when exposed to airand water. This process can produce a layer of clayey,ravelling material over the surface of hard, competentrock.
d. Freeze/thaw. Most rocks are susceptible to somedegree to damage from freezing. Water freezing in thepores and fractures of the rock mass may create highstresses if space is not available to accommodate theexpansion of the ice. These high stresses may create newfractures or enlarge or propagate existing fractures, result-ing in spalling from the exposed face.
11-13. Determination of Protection Requirements
The susceptibility of the foundation materials to rapiddeterioration or frost damage should be determined duringthe exploration phase of a project. If possible, exposuresof the materials should be examined and their conditionand the length of time they have been exposed noted. Ifcore samples are taken as part of the exploration program,their behavior as they are exposed to surface conditions isa very good indication of the sensitivity of the foundationmaterials to moisture loss. Samples may also be sub-jected to freeze-thaw and wet-dry cycles in the laboratory.The behavior of the rock at projects previously con-structed in the same materials is often the best source ofinformation available provided the construction processand schedule are similar. In this respect, the projectdesign, construction plan, and construction schedule playimportant roles in determining the need for foundationprotection. These determine the length of time excavatedsurfaces will be exposed. Climatic conditions during theexposure period will help determine the danger of damagefrom frost or precipitation.
11-14. Foundation Protection Methods
The first step in preventing damage to sensitive founda-tion materials is to plan the construction to minimize thelength of time the material is exposed. Constructionspecifications may specify a maximum length of time asurface may be exposed without requiring a protective
11-9

EM 1110-1-290830 Nov 94
coating. Excavation may be stopped before reaching finalgrade or neat excavation lines if a surface must be leftexposed for an extended period of time. This precautionis particularly wise if the material is to be left exposedover winter. The upper material that is damaged by frostor weathering is then removed when excavation iscontinued to final profiles and the rock can be coveredmore quickly with structural concrete. It may not bepossible to quickly cover the foundation materials withstructural concrete. In this case it is necessary to tempo-rarily protect the foundation from deterioration. This canbe done by placing a protective coating over the exposedfoundation materials.
a. Shotcrete. Sprayed-on concrete, or shotcrete, isbecoming perhaps the most common protective coatingfor sensitive foundation materials. Its popularity is duelargely to the familiarity of engineers, inspectors, andconstruction contractors with its design and application.Shotcrete can be easily and quickly applied to almost anyshape or slope surface. If correctly applied, it preventscontact of the rock with air and surface water. If groundwater is seeping from the rock, weep holes should bemade in the shotcrete to help prevent pressure buildupbetween the rock and the protective layer. Otherwise,spalling of the shotcrete will most likely occur. Theshotcrete may be applied over wire mesh pinned to therock to improve the strength of the protective layer.When used as a protective coating only, the thickness ofthe shotcrete will normally be 2-3 inches.
b. Lean concrete or slush grouting. Slush grouting isa general term used to describe the surface application ofgrout to seal and protect rock surface. The grout used isusually a thin sand cement grout. The mix is spread overthe surface with brooms, shovels, and other hand toolsand worked into cracks. No forms of any kind are used.Lean concrete may also be specified as a protective cover.It is similar to slush grouting in that it is placed andspread largely by hand. However, the mix has a thickerconsistency and a thicker layer is usually applied.Because of the thicker application, some forming may benecessary to prevent lateral spreading. Both methodsprovide protection against surface water and moisture lossto the air. The use of slush grouting and lean concretefor protection are limited to horizontal surfaces and slopesof less than about 45 degrees due to the thin mixes andlack of forming.
c. Plastic sheeting. Sheets of plastic, such as poly-ethylene, may be spread over foundation surfaces to pre-vent seepage of surface moisture into the rock. This mayalso provide a small degree of protection from moisture
loss for a short time. Sheet plastics work best on low tomedium angled slopes. The plastic sheets are difficult tosecure to steep slopes, and water may stand on horizontalsurfaces and penetrate between sheets. The sheets can beconveniently weighted in place with wire mesh.
d. Bituminous coatings. Bituminous or asphalticsprays may also be used as protective coatings. Thesesprays commonly consist of asphalt thinned with petro-leum distillates. The mixture is heated to reduce its vis-cosity and is then sprayed onto the rock surface. Thesecoatings are effective as temporary moisture barriers.However, they are not very durable and usually will notremain effective for more than 2 to 3 days.
e. Resin coatings. Various synthetic resins are man-ufactured for use as protective coatings for rock, concrete,and building stone. These products generally form a lowpermeability membrane when sprayed on a surface. Themembrane protects the rock from air and surface water.Life expectancy, mixes, and materials vary with differentmanufacturers. These materials require specialized equip-ment and experienced personnel for application. Resincoatings may need to be removed from rock surfaces priorto placement of structural concrete to assure proper rock/concrete bond. Sources of additional information arelimited due to the somewhat limited use of these coatings.Potential suppliers of these materials may include manu-facturers of coatings, sealers, or resin grouts.
Section VExcavation Mapping and Monitoring
11-15. Mapping
Geologic mapping should be an integral part of the con-struction inspection of a foundation excavation. Thismapping should be performed by the project geologistwho will prepare the Construction Foundation Reportrequired by ER 1110-2-1801. Thorough constructionmapping ensures that the final excavation surfaces areexamined and so aids in the discovery of any unantici-pated adverse geologic conditions. Mapping also providesa permanent record of the geologic conditions encounteredduring construction. Appendix B of EM 1110-1-1804,Geotechnical Investigations, and Chapter 3 of this reportoutline procedures for mapping open excavations.
11-16. Photography
Photographs should be taken of all excavated surfaces andconstruction operations. As with mapping, photographsshould be taken by the person(s) responsible for
11-10
EM 1110-1-290830 Nov 94
preparation of the Construction Foundation Report(ER 1110-2-1801). However, project staffing may belimited such that it may be necessary to require the con-tractor to take the photographs. All photos must beproperly labeled with date, subject, direction of view,vantage point, photographer, and any other pertinent infor-mation. Photographs of excavated surfaces should be asunobstructed as possible. Complete photographic cover-age of the project is very important. Recently, videotap-ing has also provided benefits. This should be impressedupon the geologists and engineers responsible for con-struction mapping and inspection.
11-17. Construction Monitoring
Monitoring of construction procedures and progressshould be performed on a regular basis by the designers
in accordance with ER 1110-2-112. The schedule ofdesign visits should be included in the Engineering Con-siderations and Instructions to Field Personnel. Excava-tion monitoring must be performed as thoroughly andfrequently as possible to ensure that complete informationis obtained on the as-built condition of the rock founda-tion. A checklist may be used that allows the inspector togive a brief description of various features of the founda-tion and the construction activities. An example of such achecklist is given in Appendix B of EM 1110-1-1804.
11-11

EM 1110-1-290830 Nov 94
Chapter 12Special Topics
12-1. Scope
This chapter provides general guidance in recognizing andtreating special conditions which can be encountered inrock foundations that cause construction or operationproblems. These conditions are likely to be encounteredonly within certain regions and within certain rock types,but geotechnical professionals should be aware of thepotential problems and methods of treatment. This chap-ter is divided into three topic areas: karst, pseudokarst,and mines which produce substantial underground cavi-ties; swelling and squeezing rock, much of which may bedescribed as a rock but treated as a soil; and gradationalsoil-rock contacts, rock weathering, saprolites, and resid-ual soils which make determination, selection, and exca-vation of suitable bearing elevations difficult.
Section IKarst, Pseudokarst, and Mines
12-2. Cavities in Rock
A topic of concern in many projects involving rock exca-vation is whether or not there are undetected cavitiesbelow an apparently solid bedrock surface or whethercavities could develop after construction. These cavitiesmay occur naturally in karst or pseudokarst terrains, maybe induced by human interference in natural processes, orthey may be totally due to man’s activities. The term“cavities” is used since it covers all sizes and origins ofunderground openings of interest in rock excavations.
a. Cavity significance. The presence of cavities hasa number of rock engineering implications, including:
(1) Irregular or potentially irregular bedrock topo-graphy due to collapse or subsidence and associatedunpredictable bearing surface elevations.
(2) Excavation difficulties, with extensive hand-cleaning, grouting, and dental treatment requirements.
(3) Questionable support capacity with a potential forcollapse or subsidence over cavities, or settlement ofdebris piles from prior collapses, all of which may beconcealed by an apparently sound bedrock surface.
(4) Ground water flow problems, with requirementsfor tracing flow paths, or sealing off or diverting flows
around or through the project area. Surface water flowsmay be affected by underground cavities, sometimes bycomplete diversion to the subsurface.
(5) Contaminants may flow rapidly into open chan-nels, with minimal natural filtration and purification,possibly contaminating local water supplies.
b. Problem rocks.
(1) Most natural and induced cavities develop insoluble rocks, most notably limestone, dolomite, gypsum,and rock salt. Typical karst conditions develop in lime-stones and dolomites by solution-widening of joints andbedding planes caused by flowing ground water. Eventu-ally, this process develops into a heterogeneous arrange-ment of cavities with irregular sinkholes occurring wherecavity roofs have collapsed. The amount of solution thatoccurs in limestone and dolomite would be negligible inthe lifetime of a typical project. Hence, existing cavitiesare the major concern.
(2) Gypsum and anhydrite are less common thanlimestones, but they have the additional concern of solu-tion and collapse or settlement during the useful life of atypical structure. Flow of ground water, particularly towater supply wells, has been known to dissolve gypsumand cause collapse of structures. Rock salt is probablyone of the most soluble of common geologic materials,and may be of concern in some areas, particularly alongthe Gulf of Mexico, the Michigan Basin, and in centralKansas. While natural occurrences of cavities in rock saltare rare, cavities may have been formed by solution min-ing methods, and collapse or creep has occurred in someof the mined areas.
(3) Pseudokarst terrain is an infrequently encounteredform that appears to be classic karst topography, butoccurs in a different geologic environment. Cavities andsinkholes can occasionally occur in lava flow tubes, or inpoorly cemented sandstones adjacent to river valleys orcoastlines. The same basic engineering problems andsolutions apply to pseudokarst as to karst topography, butgenerally on a less severe scale. Care should be taken toavoid attributing surface features to pseudokarst condi-tions, when true karst conditions in lower rock strata maybe the actual cause.
c. Mining activities. Mining is the principle cause ofhuman-induced cavities, and subsidence or collapse overold mines is one of the oldest forms of surface disruptioncaused by man. Coal with occurrences shown in
12-1

EM 1110-1-290830 Nov 94
Figure 12-1 is probably the most common materialextracted by underground mining, although nearly anyvaluable mineral may have been mined using any scale ofmining operation. The mines typically follow beds or orebodies that are relatively easy to follow using stratigraphicor structural studies. The actual locations of mined cavi-ties may be more difficult to determine. Mines in recenttimes generally have excellent layout maps available, butolder mines may not be well documented. In some cases,small scale prospect operations may be totally obscureduntil excavations are at an advanced stage.
12-3. Investigations
Cavities are difficult to detect, and are undiscovered untilexposed by construction excavations. A combination ofdetailed preconstruction investigations and constructioninvestigations should be anticipated in potential cavityareas. In this respect, karst topography develops in rela-tively predictable regions of limestones and dolomites,
as shown in Figure 12-2 and Table 12-1. However, theoccurrence of cavities on a local scale is more difficult todetermine, and many significant cavities can be missed bya typical exploration program. The inability to detectspecific cavities also holds true for pseudokarst terrains,rock salt, gypsum, and mine cavities. The GeotechnicalInvestigations Manual, EM 1110-1-1804, provides guid-ance on the screening of an area for sinkholes, anhydritesor gypsum layers, caves, and area subsidence.
a. Initial site investigations. Geophysics may be ofsome use in initial site investigations in locating largercavities, but may miss smaller ones. Remote sensingusing air photos, infrared imagery, and side-looking radarare useful in determining trends of cavities and jointing inan area, as well as determining structural geology featuresassociated with rock salt exposures. Detailed joint strikeand dip mapping, in some cases by removing site over-burden, may be very useful in predicting the trends ofknown cavities which follow joints. In some cases,
Figure 12-1. Location of coal fields in the United States
12-2

EM 1110-1-290830 Nov 94
Figure 12-2. Location of cavern areas in the United States
hydrologic testing using piezometers, dye flow tracers,and pump tests may help determine permeabilities andprobable flow paths along cavities. In the case of mines,stratigraphic analysis of economic minerals and ore bodystudies, along with studies of mining company recordsand Government documents associated with the mine, canhelp in determining the mine layout. Surveys from insidemines are desirable, but may not be possible due to dan-gerous conditions. Borehole cameras may be used todetermine the size and condition of otherwise inaccessiblemines. Table 12-2 shows several exploration and investi-gation methods which may be of more value in detectionof cavities.
b. Cavity detection. Since cavity occurrence is diffi-cult to determine on a local scale, the only practical solu-tion, after initial site studies, is to place a test boring atthe location of each significant load-bearing member.Such an undertaking is costly, but represents the onlyreasonable approach in areas of high concern.
12-4. Alternative Solutions
A number of techniques/methods are available foraddressing design and construction problems associatedwith project sites where cavities are present. The follow-ing provides a brief listing of alternative techniques.
a. Avoid the area for load-bearing use if possible.
b. Bridge the cavity by transferring the loads to thecavity sides.
c. Allow for subsidence and potentially severe dif-ferential settlements in the design of the foundation andstructure.
d. Fill in the cavities to minimize subsidence, preventcatastrophic collapse, and prevent progressiveenlargement. Support piers or walls may be used forpoint supports in larger cavities, or cavities may be filled
12-3

EM 1110-1-290830 Nov 94
Table 12-1Summary of Major Karst Areas of the United States
Karst Area Location Characteristics
Southeastern coastal South Carolina, Rolling, dissected plain, shallow dolines, few caves;plain Georgia Tertiary limestone generally covered by thin deposits
of sand and silt.
Florida Florida, southern Level to rolling plain: Tertiary, flat-lying limestone;Georgia numerous dolines, commonly with ponds; large
springs; moderate sized caves, many water filled.
Appalachian New York, Vermont, Valleys, ridges, and plateau fronts formed south ofsouth to northern Palaeozoic limestones, strongly folded in eastern part;Alabama numerous large caves, dolines, karst valleys, and
deep shafts; extensive areas of karren.
Highland Rim central Kentucky, Highly dissected plateau with Carboniferous, flat-lyingTennessee, limestone; numerous large caves, karren, large dolinesnorthern Georgia and uvala.
Lexington-Nashville north-central Rolling plain, gently arched; Lower Palaeozoic lime-Kentucky, central stone; a few caves, numerous rounded shallowTennessee, south dolines.eastern Indiana
Mammoth Cave- west-central, Rolling plain and low plateau; flat-lying CarboniferousPennyroyal Plain southwestern rocks; numerous dolines, uvala and collapse sinks;
Kentucky, very large caves, karren developed locally, complexsouthern Indiana subterranean drainage, numerous large “disappearing”
streams.
Ozarks southern Missouri, Dissected low plateau and plain; broadly archednorthern Arkansas Lower Palaeozoic limestones and dolomites;
numerous moderate-sized caves, dolines, very largesprings; similar but less extensive karst inWisconsin, Iowa, and northern Illinois.
Canadian River western Oklahoma, Dissected plain, small caves and dolines innorthern Texas Carboniferous gypsum.
Pecos Valley western Texas, Moderately dissected low plateau and plains;southeastern New flat-lying to tilted Upper Palaeozoic limestonesMexico with large caves, dolines, and fissures; sparse
vegetation; some gypsum karst with dolines.
Edwards Plateau southwestern Texas High plateau, flat-lying Cretaceous limestone; deepshafts, moderate-sized caves, dolines; sparsevegetation.
Black Hills western South Highly dissected ridges; folded (domed) PalaeozoicDakota limestone; moderate-sized caves, some karren and
dolines.
Kaibab northern Arizona Partially dissected plateau, flat-lying Carboniferouslimestones; shallow dolines, some with ponds; fewmoderate-sized caves.
Western mountains Wyoming, north Isolated small areas, primarily on tops and flanks ofwestern Utah, ridges, and some area in valleys; primarily in foldedNevada, western and tilted Palaeozoic and Mesozoic limestone; largeMontana, Idaho, caves, some with great vertical extent, in Wyoming,Washington, Oregon, Utah, Montana, and Nevada; small to moderate-sizedCalifornia caves elsewhere; dolines and shafts present; karren
developed locally.
12-4

EM 1110-1-290830 Nov 94
Table 12-2Effectiveness of Cavity Investigation Techniques
Investigation Method Considered1
CavityType
IncreasedBorings Geophysics
RemoteSensing Piezometers
Pump TestsDye FlowTests
DiscontinuityAnalysis
BoreholeCameras
MineRecordStudies
AnhydriteGypsum
2 1 2 1 1 3 1 2
Karst 5 4 4 2 3 5 5 1
Salt 2 3 3 1 1 1 2 3
Mines 4 4 4 1 1 1 5 5
Lava Tubes 4 2 4 2 2 1 3 1
Note:1. Ratings: Grade from 1 = not effective to 5 = highly effective
with sand, gravel, and grout. Cement grout can be usedto fill large cavities to prevent roof slabs from falling,eliminating a potential progression to sinkholes. Groutalso can fill cavities too small for convenient access,thereby reducing permeability and strengthening the rockfoundation.
e. Avoid placing structures over gypsum, salt, oranhydrite beds where seeping or flowing water canrapidly remove the supporting rock.
f. Plan for manual cleaning of pinnacled rock sur-faces with slush grouting and dental treatment of enlargedjoints as shown in Figure 12-3. The exact extent of thiswork is difficult to predict prior to excavation.
g. Control surface and ground-water flow cautiously.Lowering of the water table has induced collapses and theformation of new sinkholes in previously unexpectedareas. Surface drainage in most karst areas is poorlydeveloped, since most drainage has been to thesubsurface.
Section IISwelling and Squeezing Rock
12-5. General
The case of swelling or squeezing rock represents yetanother special problem. In such cases the rock founda-tion changes after it is exposed or unloaded, and the rockexpands (increases in apparent volume) horizontally orvertically. There are at least five mechanisms which can
cause swelling rock. Swelling may be result of a singlemechanism or a combination of several interacting mecha-nisms. The five common mechanisms of swelling rockinclude elasto-plastic rebound (or heave), cation hydration,chemical reaction, loss of internal strength (creep), andfrost action. Some of these mechanisms occur most com-monly in certain rock types. Each category is discussedindividually.
12-6. Rebound
Elasto-plastic rebound is the expansion of rock due to thereduction or removal of external forces acting upon therock mass. In some cases, especially in areas with a highhorizontal stress field, removal of as little as a few feet ofrock or soil may result in an expansion of the exposedrock. The expansion may be expressed as a generalheave of the exposed rock or as a pop-up or buckling.This behavior frequently occurs in areas associated withglacial activity and can occur in most types of rock. Instructural excavations where rebound may be a problem,the surface may be rapidly loaded with a weight equiva-lent to the overburden to prevent rebound of the rock. Inmany nonstructural open cut excavations, this type ofswelling may be more of a minor maintenance problemthan a serious concern.
12-7. Cation Hydration
Cation hydration is another mechanism for swelling that ismost frequently associated with some argillaceous rocks.
12-5
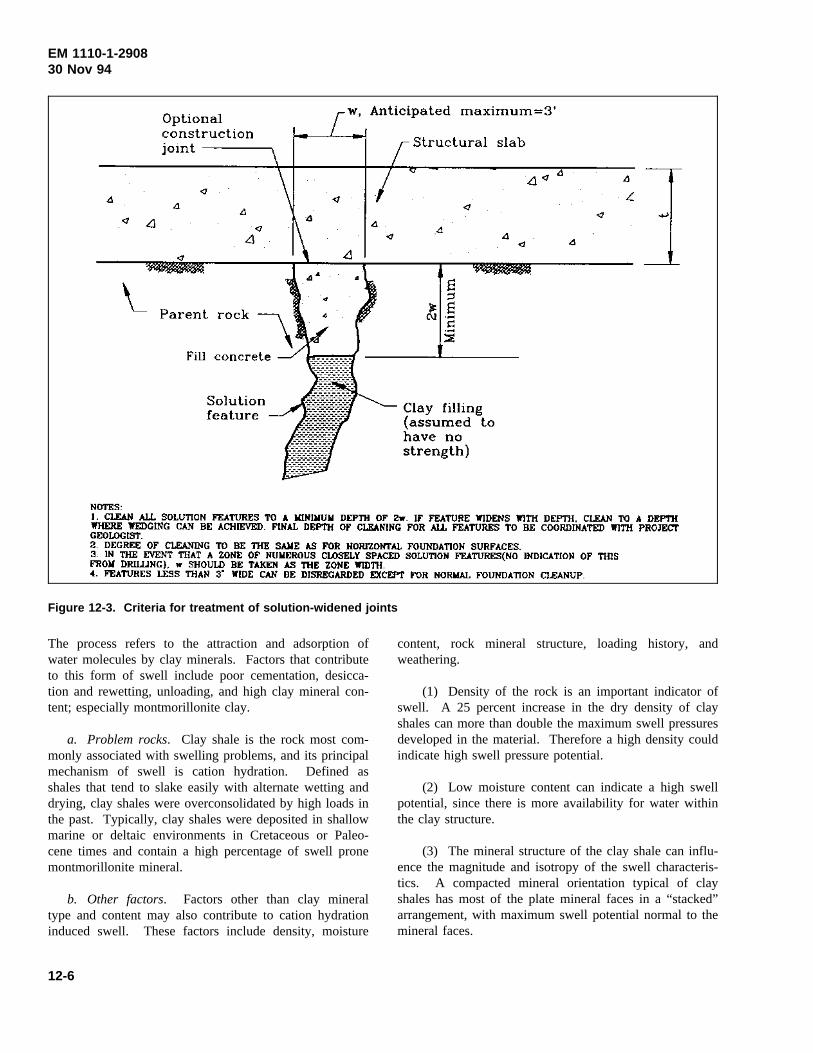
EM 1110-1-290830 Nov 94
Figure 12-3. Criteria for treatment of solution-widened joints
The process refers to the attraction and adsorption ofwater molecules by clay minerals. Factors that contributeto this form of swell include poor cementation, desicca-tion and rewetting, unloading, and high clay mineral con-tent; especially montmorillonite clay.
a. Problem rocks. Clay shale is the rock most com-monly associated with swelling problems, and its principalmechanism of swell is cation hydration. Defined asshales that tend to slake easily with alternate wetting anddrying, clay shales were overconsolidated by high loads inthe past. Typically, clay shales were deposited in shallowmarine or deltaic environments in Cretaceous or Paleo-cene times and contain a high percentage of swell pronemontmorillonite mineral.
b. Other factors. Factors other than clay mineraltype and content may also contribute to cation hydrationinduced swell. These factors include density, moisture
content, rock mineral structure, loading history, andweathering.
(1) Density of the rock is an important indicator ofswell. A 25 percent increase in the dry density of clayshales can more than double the maximum swell pressuresdeveloped in the material. Therefore a high density couldindicate high swell pressure potential.
(2) Low moisture content can indicate a high swellpotential, since there is more availability for water withinthe clay structure.
(3) The mineral structure of the clay shale can influ-ence the magnitude and isotropy of the swell characteris-tics. A compacted mineral orientation typical of clayshales has most of the plate mineral faces in a “stacked”arrangement, with maximum swell potential normal to themineral faces.
12-6

EM 1110-1-290830 Nov 94
(4) The loading history can indicate the degree ofpreconsolidation that the shales have been subjected to inthe past. Changes in the stress environment can be due toerosion, glaciation, stream downcutting, and engineeringactivities.
(5) Weathering of clay shales generally reduces theswell potential unless additional expansive clays areformed.
c. Excavation problems. Excavations in clay shalepresent special problems. If the excavated surface isallowed to dry, the material develops shrinkage cracks,and rebound-type swell induces a relative moisture reduc-tion and density decrease. Water or moisture from con-crete applied to this surface can induce swelling of theclay shale. Slope stability is another prominent problemin clay shales, since any excavation can result in renewedmovement along older, previously stable slide planes.The presence of unfavorably oriented bentonite seamscommon in clay shales can present serious stabilityhazards.
d. Treatment methods. Preventive measures caninclude careful control of the excavation sequence, mois-ture control and surface protection, and favorable strati-graphic placement and orientation of the slopes andstructures. Treatment methods are discussed inChapter 11.
e. Field investigations. Field investigations shouldinclude checks for significant problem prone clay shaleformations, some of which are listed in Table 12-3. Also,some indications of clay shale swell problems includehummocky terrain along river valley slopes, slides alongroad cuts, and tilting or cracking of concrete slabs or lightstructures. Slickensides in shale is another indicator ofswelling potential. The presence of clay shales suscepti-ble to cation hydration swelling in the project regionshould be determined very early in the explorationprogram.
f. Laboratory tests. Laboratory tests to determineengineering properties are similar to those for soilmechanics, and include clay mineral type and percentageanalyses, Atterberg limits, moisture content, consolidationtests, and swell tests. In decreasing order, the significantswell producing clay minerals are montmorillonite, illite,attapulgite, and kaolinite. Atterberg limit tests can indi-cate the swelling nature of clay shale, with high plasticityindices correlating to high swell potential, as shown inTable 12-4. The method of determining the Atterberg
limits of clay shale must be consistent, since air drying,blending, or slaking of the original samples may providevariable results. There are several methods of performingconsolidation and swell tests on clay shales. These meth-ods are summarized in Table 12-5.
12-8. Chemical-Reaction Swelling
Chemical-reaction swelling refers to a mechanism mostcommonly associated with Paleozoic black shales such asthe Conemaugh Formation, or the Monongahela Forma-tion in Pennsylvania. Swell develops when reactions suchas hydration, oxidation, or carbonation of certain constitu-ent minerals create by-products that results in volumessignificantly larger than the original minerals. Thesereactions can result in large swelling deformations andpressures after excavation and construction. The condi-tions that are conducive to this type of swelling may notoccur until after a foundation is in place, and similarconditions may not be reproduced easily in the laboratoryto indicate that it may be a problem. Temperature, pres-sure, moisture, adequate reactants and, in some cases,bacterial action are critical parameters for reaction tooccur.
a. Reactions. The transformation of anhydrite togypsum is one of the more common reactions. In shalescontaining a substantial percentage of free pyrite, a simi-lar reaction can occur. The oxidation of the pyrite canresult in the growth of gypsum crystals or a relatedmineral, jarosite. The presence of sulphur bacteria canaid the reaction, and may be essential to the reaction insome cases. Sulfuric acid produced by the reaction mayreact with any calcite in the shale to increase the devel-opment of gypsum. The resulting growth of gypsumcrystals causes the swelling, which can uplift concretestructures.
b. Treatment methods. Since the reactions are diffi-cult to predict or simulate during exploration and design,it may be desirable to avoid placing structures on pyrite-bearing carbonaceous shales of Paleozoic age, since theserocks are the most common hosts for chemical-reactionswelling. If avoidance is not an option, the exposed sur-faces may be protected from moisture changes by placinga sealing membrane of asphalt or some other suitablematerial. Shotcrete is not a suitable coating material sincethe sulfuric acid produced by the reaction can destroy it.The added source of calcium may even enhance the swell-ing reaction. Another preventive measure may be theapplication of a chemical additive which blocks thegrowth of gypsum crystals. Tests have indicated that
12-7

EM 1110-1-290830 Nov 94
Table 12-3Landslide-Susceptible Clay Shales in United States
Stratigraphic Unit Description
Bearpaw shale Upper Cretaceous; northern, eastern and southern Montana, central northern Wyoming, and southern Alberta,Canada; marine clay shale 600 to 700 ft; in Montana group.
Carlile shale Upper Cretaceous; eastern Colorado and Wyoming, Nebraska, Kansas, and South Dakota, southeastern Montanaand northeastern New Mexico; shale, 175 to 200 ft; in Colorado group.
Cherokee shale Early Pennsylvanian; eastern Kansas, southeastern Nebraska, northwestern Missouri and northeastern Oklahoma;shale, 500 ft; in Des Moines group.
Claggett formation Upper Cretaceous; central and eastern Montana, and central northern Wyoming; marine clay shales and sandstonebeds, 400 ft; in Montana group.
Dawson formation Upper Cretaceous-Lower Tertiary; central Colorado; nonmarine clay shales, siltstone and sandstone, 1000 ft.
Del Rio clay Lower Cretaceous; southern Texas; laminated clay with beds of limestone; in Washita group.
Eden group Upper Ordovician; southwestern Ohio, southern Indiana, and central northern Kentucky; shale with limestone,250 ft; in Cincinnati group.
Fort Union group Paleocene; Montana, Wyoming, North Dakota, northwestern South Dakota, and northwestern Colorado; massivesandstone and shale, 4000 ft +.
Frontier formation Upper Cretaceous; western Wyoming and southern Montana; sandstone with beds of clay and shale, 2000 to 2600ft; in Colorado group.
Fruitland formation Upper Cretaceous; southwestern Colorado and northwestern New Mexico; brackish and freshwater shales andsandstones, 194 to 530 ft; late Montana age.
Graneros shale Upper Cretaceous; eastern Colorado and Wyoming, southeastern Montana, South Dakota, Nebraska, Kansas andnortheastern New Mexico; argillaceous or clayey shale, 200 to 210 ft; in Colorado group.
Gros Ventre formation Middle Cambrian; northwestern Wyoming and central southern Montana; calcareous shale with conglomeratic andoolitic limestone, 800 ft.
Jackson group Upper Eocene; Gulf Coastal Plain (southwestern Alabama to southern Texas); calcareous clay with sand, lime-stone, and marl beds.
Mancos shale Upper Cretaceous; western Colorado, northwestern New Mexico, eastern Utah, southern and central Wyoming;marine, carbonaceous clay shale with sand, 1200 to 2000 ft; of Montana and Colorado age.
Merchantville clay Upper Cretaceous; New Jersey; marly clay, 35 to 60 ft; in Matawan group.
Modelo formation Upper Miocene; southern California; clay, diatomaceous shale, sandstone, and cherty beds, 9000 ft.
Monterey shale Upper, middle and late lower Miocene; western California; hard silica-cemented shale and soft shale, 1000 ft +.
Morrison formation Upper Jurassic; Colorado and Wyoming, south central Montana, western South Dakota, western Kansas, westernOklahoma, northern New Mexico, northeastern Arizona, and eastern Utah; marl with sandstone and limestonebeds, 200 ft +.
Mowry shale Upper Cretaceous; Wyoming, Montana and western South Dakota; hard shale, 150 ft; in Colorado group.
Pepper formation Upper Cretaceous; eastern Texas; clay shale.
Pierre shale Upper Cretaceous; North Dakota, South Dakota, Nebraska, western Minnesota, eastern Montana, easternWyoming, and eastern Colorado; marine clay shale and sandy shale, 700 ft; in Montana group.
Rincon shale Middle or lower Miocene; southern California; clay shale with lime stone, 300 to 2000 ft.
Sundance formation Upper Jurassic; southwestern South Dakota, Wyoming, central southern Montana; northwestern Nebraska; andcentral northern Colorado; shale with sandstone, 60 to 400 ft.
Taylor marl Upper Cretaceous; central and eastern Texas; chalky clay, 1200 ft.
Thermopolis shale Upper Cretaceous; central northern Wyoming, and central southern Montana; shale with persistent sandy bed nearmiddle, 400 to 800 ft; in Colorado group.
Trinity group Lower Cretaceous; Texas, south central and southeastern Oklahoma, southwestern Arkansas, and northwesternLouisiana; fine sand, gypsiferous marl and occasional limestone.
Wasatch formation Lower Eocene; Wyoming, south central and eastern Montana, southwestern North Dakota, western Colorado, Utah,and northwestern New Mexico; sands and clay, 0 to 5000 ft +.
12-8
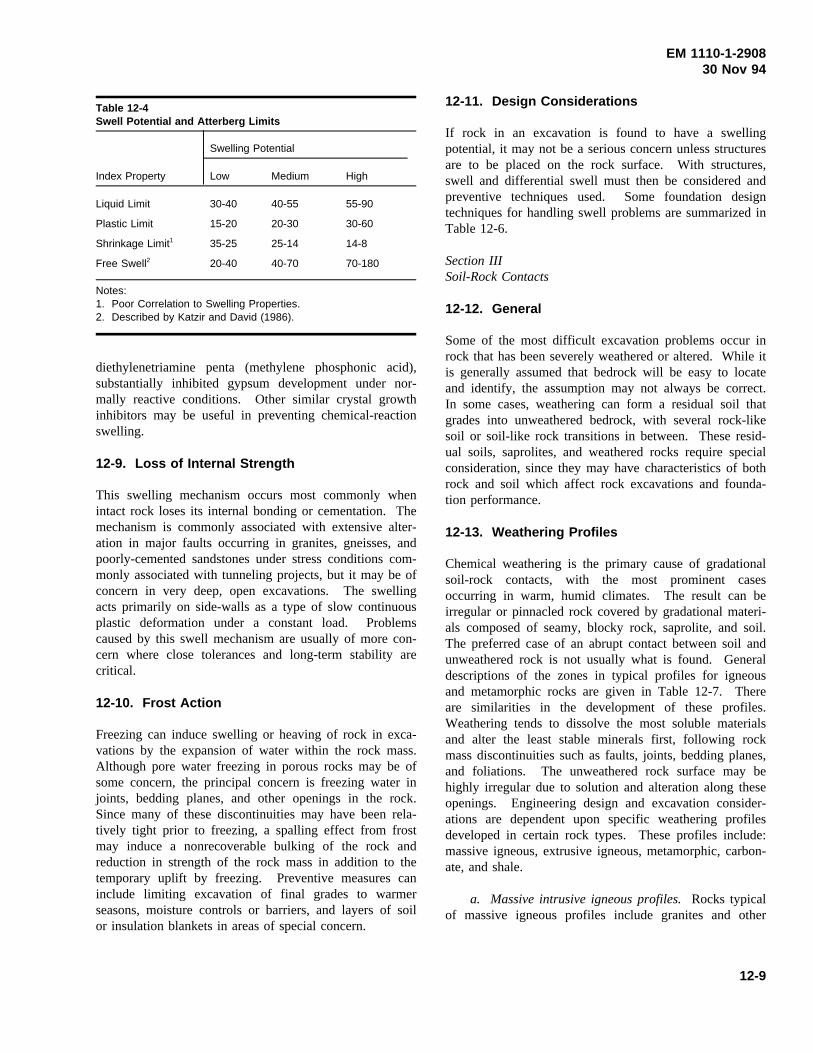
EM 1110-1-290830 Nov 94
Table 12-4Swell Potential and Atterberg Limits
Swelling Potential
Index Property Low Medium High
Liquid Limit 30-40 40-55 55-90
Plastic Limit 15-20 20-30 30-60
Shrinkage Limit1 35-25 25-14 14-8
Free Swell2 20-40 40-70 70-180
Notes:1. Poor Correlation to Swelling Properties.2. Described by Katzir and David (1986).
diethylenetriamine penta (methylene phosphonic acid),substantially inhibited gypsum development under nor-mally reactive conditions. Other similar crystal growthinhibitors may be useful in preventing chemical-reactionswelling.
12-9. Loss of Internal Strength
This swelling mechanism occurs most commonly whenintact rock loses its internal bonding or cementation. Themechanism is commonly associated with extensive alter-ation in major faults occurring in granites, gneisses, andpoorly-cemented sandstones under stress conditions com-monly associated with tunneling projects, but it may be ofconcern in very deep, open excavations. The swellingacts primarily on side-walls as a type of slow continuousplastic deformation under a constant load. Problemscaused by this swell mechanism are usually of more con-cern where close tolerances and long-term stability arecritical.
12-10. Frost Action
Freezing can induce swelling or heaving of rock in exca-vations by the expansion of water within the rock mass.Although pore water freezing in porous rocks may be ofsome concern, the principal concern is freezing water injoints, bedding planes, and other openings in the rock.Since many of these discontinuities may have been rela-tively tight prior to freezing, a spalling effect from frostmay induce a nonrecoverable bulking of the rock andreduction in strength of the rock mass in addition to thetemporary uplift by freezing. Preventive measures caninclude limiting excavation of final grades to warmerseasons, moisture controls or barriers, and layers of soilor insulation blankets in areas of special concern.
12-11. Design Considerations
If rock in an excavation is found to have a swellingpotential, it may not be a serious concern unless structuresare to be placed on the rock surface. With structures,swell and differential swell must then be considered andpreventive techniques used. Some foundation designtechniques for handling swell problems are summarized inTable 12-6.
Section IIISoil-Rock Contacts
12-12. General
Some of the most difficult excavation problems occur inrock that has been severely weathered or altered. While itis generally assumed that bedrock will be easy to locateand identify, the assumption may not always be correct.In some cases, weathering can form a residual soil thatgrades into unweathered bedrock, with several rock-likesoil or soil-like rock transitions in between. These resid-ual soils, saprolites, and weathered rocks require specialconsideration, since they may have characteristics of bothrock and soil which affect rock excavations and founda-tion performance.
12-13. Weathering Profiles
Chemical weathering is the primary cause of gradationalsoil-rock contacts, with the most prominent casesoccurring in warm, humid climates. The result can beirregular or pinnacled rock covered by gradational materi-als composed of seamy, blocky rock, saprolite, and soil.The preferred case of an abrupt contact between soil andunweathered rock is not usually what is found. Generaldescriptions of the zones in typical profiles for igneousand metamorphic rocks are given in Table 12-7. Thereare similarities in the development of these profiles.Weathering tends to dissolve the most soluble materialsand alter the least stable minerals first, following rockmass discontinuities such as faults, joints, bedding planes,and foliations. The unweathered rock surface may behighly irregular due to solution and alteration along theseopenings. Engineering design and excavation consider-ations are dependent upon specific weathering profilesdeveloped in certain rock types. These profiles include:massive igneous, extrusive igneous, metamorphic, carbon-ate, and shale.
a. Massive intrusive igneous profiles.Rocks typicalof massive igneous profiles include granites and other
12-9

EM 1110-1-290830 Nov 94
Table 12-5Summary of Swell Potential Tests
Test Method Test Procedure Summary Remarks
Free-Swell Test This specimen is over-dried, granulated and The rock structure is destroyed and the grainplaced in a test tube. Water is added and the sizes are reduced.amount of volume expansion is recorded.
Calculated-Pressure Test An intact specimen is immersed in kerosene or The loading and confining pressures are notmercury to determine its initial volume. The representative of in-situ conditions.specimen is then placed in water and allowed toswell. If the specimen remains intact, the newvolume can be determined by again immersingthe specimen in mercury. Otherwise, the swell isrecorded as the change in volume of the water-specimen system.
Unconfined Swell Test The specimen is placed in a container and ames The loading and confining pressures are notdials are set to one or more axes of the representative of in-situ conditions.specimen. Water is added and the axial expan-sion is recorded.
Nominal Load Test A specimen is inserted in a consolidometer, a The loading and confining pressures are notnominal seating load is applied (generally 200 psf representative of in-situ conditions.or 0.10 Kg/cm2) and water added. The volumechange is recorded by an ames dial.
Calculated-Pressure Test The specimen placed in a consolidometer andsubjected to a calculated overburden pressure.Free access to water is then permitted and thevolume expansion recorded. Modifications of thistest included rebounding the specimen to theoriginal void ratio.
Constant-Volume Test The specimen is inserted in a consolidometer and Under in-situ conditions, the volume may changea seating load applied. Water is added, and resulting in a reduced final pressure.pressure on the specimen increased such andpressure on the specimen increased such thatthe total volume change of the specimen is zero.The final pressure is taken as the "swellpressure".
Double-Deadmeter Test Two similar specimens are place in separate Results are more typical of field conditions.consolidometers. One specimen is subjected tocalculated overburden pressures and the defor-mation recorded. The other specimen is allowedfree access to water, is permitted to swell andthen is subjected to overburden pressure. Thedifference in deformations or strain of the twospecimens at the overburden pressure is consid-ered the potential swell of the material.
Triaxial Test A specimen is consolidated to the in-situ pressure This test is typical of field conditions, and canas evaluated by stress measurements of statisti- simulate high horizontal stress field.cal analyses. Generally, the horizontal stress isgreater than the applied vertical stress. Thespecimen is then allowed free access to waterand the swell recorded.
12-10

EM 1110-1-290830 Nov 94
Table 12-6Design Techniques and Methods of Treatment for Swelling Rocks (after Linder 1976)
a. Waterproofing Below and Around Foundations: Though successful in preventing drainage into the strata directly below the foundation,this method does not consider evaporation. The technique is best employed to prevent desiccation of strata during construction.
b. Rigid-Box Design: The design of the foundation into separate reinforced concrete units or boxes that can withstand predicted stressesand deformations is a feasible yet expensive solution to swell.
c. Saturation and Control: Saturation of swell-susceptible strata before construction by ponding will help reduce swell after construction.However, if the water content is not maintained additional settlement will be experienced during the life of the structure. Also seasonalfluctuation of the availability of water may cause the structure to rise and fall periodically.
d. High Loading Points: As swell is a function of both deformation and pressure, it was reasoned that foundations with high unit loadingsshould experience less swell. However, such foundations have met numerous problems including uplift on footings. Such foundationsalso influence only a small volume below the footing and swell may be experienced due to swell of deeper strata.
e. Replacement of the Stratum: A drastic, expensive, yet totally effective procedure for near-surface strata.
f. Piers: The concept of placing the base of the foundation below swell susceptible strata or where water content changes are expected tobe minimal has also been employed with varying success. Problems such as side friction and water changes induced by constructionmust be considered.
g. Flexible Construction: For light structures, the division of the structure into units which can move independently of each other can be apractical solution. Differential heave between units will cause no stress to the structure and minor repair work will assure continuingservice.
h. Raised Construction: A little-used alternative is to place the structure on a pile system raised above the surface. This would allownormal air circulation and evaporation below the structure and if drainage is properly designed should cause minimal disturbance to thewater content of swell susceptible strata.
igneous rocks with relatively homogenous, isotropictexture. Since this type of rock has few or no beddingplanes, foliations, or concentrations of minerals relativelysusceptible to weathering, the existing joints, faults, andshear zones control the development of weathering.Stress-relief slabbing or sheeting joints subparallel to theground surface also provide a path for chemical weather-ing, as shown in Figure 12-4. Saprolite (Zone IC in Fig-ure 12-4) in this type of profile may retain the texture andorientation of the parent rock. Relict joints may still actas sliding-failure planes or preferred paths for groundwater flow, so some of the parent rock’s properties stillapply to this material. The transition (Zone IIA) has thesame slide failure and ground water concerns as with thesaprolite, but the element of corestones becomes an addi-tional concern. These are the hard, partially weatheredspheroidal centers of blocks that can range from soft torelatively hard, and from small size to relatively large.The transition zone may require a modification of theexcavation methods used, from purely mechanical soilexcavation methods to the occasional use of explosives orhand-breaking. Corestones in this type of profile are gen-erally spheroidal, which can cause difficulties in excava-tion and removal if they are relatively large.
b. Extrusive igneous profiles. Extrusive rocks suchas basalt develop profiles and conditions similar to thosefound in massive igneous rocks. However, certain struc-tural features common in basalts and tuffs make condi-tions extremely variable in some areas. For example, lavaflow tubes and vesicular basalt may increase the weather-ing path in some zones. The nature of flow deposits maymake rock conditions in excavations difficult to predictsince there may be buried soil profiles and interbeddedash falls or tuffs which are more permeable than adjacentbasalts. These complex permeable zones can increaseweathering and store water under relatively high pres-sures. Also, soils in the upper horizons may have unpre-dictable engineering characteristics due to unusual clayminerals present from the weathering of highly ferromag-nesian parent materials.
c. Metamorphic profiles. Since the structure ortexture of metamorphic rocks can range from schistose tonearly massive gneissic, the weathering profiles can varygreatly, as illustrated in Figure 12-5. Foliations in therocks and changes of the lithology enhance the variabilitythat can be found in the weathering profiles in meta-morphics. The results are differences in the depths
12-11

EM 1110-1-290830 Nov 94
Table 12-7Description of a Typical Weathering Profile
Zone Description
RQD1
(NX Core,percent)
PercentCoreRecovery2
(NX Core)RelativePermeability
RelativeStrength
I Residual Soil 1A-A Horizon - top soil, roots, organicmaterial zone of leachingand eluviation maybe porous
-- 0 medium to high low tomedium
1B-B Horizon - characteristically clay-enriched also accumula-tions of Fe, A1 and Sihence may be cemented
- no relict structurespresent
-- 0 low commonlylow(high ifcemented)
1C-C Horizon - relict rock structuresretained
- silty grading to sandymaterial
- less than 10 percent corestones
- often micaceous
0or notapplicable
generally 0-10 percent
medium low tomedium(relictstructuresverysignificant
II WeatheredRock
IIA-Transition(from residualsoil or saproliteto partlyweatheredrock)
- highly variable, soil-like to rock-like
- fines commonly fine tocoarse sand (USS)
- 10 to 90 percent corestones
- spheroidal weatheringcommon
variable,generally0-50
variable,generally10-90%
high (waterlosses common)
mediumto lowwherewastestructuresand relictstructuresare present
IIB-Partlyweatheredrock
- rock-like, soft to hardrock
- joints stained to altered- some alteration of feld-
spars and micas
generally50-75 percent
generally>90 percent
medium to high medium tohigh2
III UnweatheredRock
- no iron stains to trace
long joints- no weathering of feld- and
micas
>75 percent(generally>90 percent)
generally100 percent
low to medium very high2
Notes:1. The descriptions provide the only reliable means of distinguishing the zones.2. Considering only intact rock masses with no adversely oriented geologic structure.
of weathering profiles developed over each lithology, insome cases up to 50 meters of difference vertically in justa few feet horizontally (Deere and Patton 1971). Intru-sive dikes commonly found in metamorphic terrains mayeither be more or less resistant to weathering than thesurrounding rock, forming either ridges or very deepweathering profiles. Problems in this type of profileinclude slide instability along relict foliation planes,
highly variable depth to unweathered bedrock, and poten-tially high-pressure ground water storage in faults orbehind intrusive dikes.
d. Carbonate profiles. Carbonate rock weatheringwas previously discussed in relation to karst developmentwithin the rock mass. The same weathering conditionsmay affect the surface of the rock. Carbonate rocks
12-12

EM 1110-1-290830 Nov 94
Figure 12-4. Typical weathering profile for intrusiveigneous rocks (from Deere and Patton 1971)
develop into a profile, as illustrated in Figure 12-6, withsharp contacts between soils and weathered rock, unlikeigneous, and metamorphic profiles. Occasionally, carbon-ate rocks may have chert, sand, or clay which form sapro-lite and retain a relict structure upon weathering. In mostcases, however, the carbonates are removed and theremaining insoluble residue, typically a dark red clayey“terra rosa,” lies directly upon weathered rock. A jagged,pinnacled rock surface may develop due to weatheringalong faults or near-vertical joints. Troughs between thepeaks may contain soft, saturated clays called “pockets ofdecalcification.” Construction problems may includeclayey seams, soft clays, rough bedrock surface, unstablecollapse residuum, and rock cavities.
e. Shale profile. Shale weathering profiles alsodevelop primarily along joints and fissures, but the weath-ering profile is generally thinner and the transition fromsoil to unweathered rock tends to be more gradual. Shaleis generally composed of minerals which are the
Figure 12-5. Typical weathering profile for metamor-phic rocks (from Deere and Patton 1971)
weathering by-products of other rocks, so under a newweathering environment they are not affected to the extentother rocks are. Mechanical weathering mechanisms,such as drying and rewetting, freeze-thaw cycles, andstress relief play a more important role in the develop-ment of a shale weathering profile, so increased fracturingis the characteristic of increasingly weathered shale.Interbedded sandstones tend to make the weathering pat-terns and overall stability problems more complex. Forengineering design purposes, the handling of shale exca-vations grades from rock mechanics into soil mechanics,where most weathered shales can be treated as consolid-ated clays.
12-14. Design Considerations in WeatheringProfiles
During subsurface investigations, saprolites most likelyare classified as soils, since the samples recovered bysubsurface drilling programs frequently end up as a
12-13

EM 1110-1-290830 Nov 94
Figure 12-6. Typical weathering profile for carbonaterocks (from Deere and Patton 1971)
disaggregated, crumbly material with no apparent struc-ture. The sampling technique frequently destroys theinterparticle bonding and gives the designer a poor idea ofthe actual conditions. Care should be taken during sam-pling to determine if saprolites and relict structures existif they will be exposed in rock excavations.
Trenching provides a better picture of the weatheringprofile in critical areas.
a. Saprolites. Since relict discontinuities may existin saprolite zones, sliding or toppling of weak blocks maybe difficult to evaluate in stability analyses. In somecases, studies using key-block theory (Goodman and Shi1985) may be applicable to saprolites. The discontinuitiesmay also be the principal permeability path for groundwater in saprolites, and water pressure in relict joints mayplay a substantial part in excavation stability. For designpurposes, saprolites should be considered a weak, blocky,seamy rock in which discontinuities govern the behavior.For excavation purposes, saprolites may be treated as afirm soil, requiring standard soil excavation techniques.
b. Transition materials. Below the saprolites in theweathering profile, the nature of the materials is moredifficult to determine. The materials may act as a soilmatrix with rock fragments of lesser importance, a rockmass with soil-like, compressible seams, or some inter-mediate material. The primary concern is the thicknesscompressibility or stability of the soil-like materialbetween core-blocks or in seams, which governs thebehavior of the material to a larger degree than the moreeasily recovered competent rock. In addition, rock inthese zones may have an irregular surface, but may beadequate for load bearing. These conditions may requireremoval of all pinnacles to a prescribed suitable depth, orcleaning out of the crevices and backfilling with dentalconcrete. Lightly loaded footings on seamy rock may beadequate if the footings are expanded to prevent eccentricloading on individual blocks. If settlements are antici-pated to be excessive using these techniques, drilled piersextending to competent rock at depth may be an economicalternative.
12-14

EM 1110-1-290830 Nov 94
Appendix AReferences
A-1. Required Publications
TM 5-232Elements of Surveying, Headquarters, Department of theArmy
TM 5-235Special Surveys, Headquarters, Department of the Army
TM 5-818-1/AFM 88-3 (Chapter 7)Procedures for Foundation Design of Buildings and OtherStructures
ER 1110-1-1801Construction Foundation Report
ER 1110-1-1802Provision for Spacers to Show Voids and Core Losses inCore Samples and Requirements for Photographic Recordof Cores
ER 1110-2-112Required Visits to Construction Sites by Design Personnel
ER 1110-2-1806Earthquake Design and Analysis for Corps of EngineersProjects
EP 1110-1-10Borehole Viewing Systems
EM 385-1-1Safety and Health Requirements Manual
EM 1110-1-1802Geophysical Exploration
EM 1110-1-1804Geotechnical Investigations
EM 1110-1-1904Settlement Analysis
EM 1110-1-2907Rock Reinforcement
EM 1110-2-1902Stability of Earth and Rockfill Dams
EM 1110-2-1907Soil Sampling
EM 1110-2-1908 (Part 1 of 2)Instrumentation of Earth and Rockfill Dams (GroundWater and Pore Pressure Observations)
EM 1110-2-1908 (Part 2 of 2)Instrumentation of Earth and Rockfill Dams (Earth Move-ment and Pressure Measuring Devices)
EM 1110-2-2200Gravity Dam Design
EM 1110-2-2502Retaining and Flood Walls
EM 1110-2-3504Chemical Grouting
EM 1110-2-3506Grouting Technology
EM 1110-2-3800Systematic Drilling and Blasting for Surface Excavations
EM 1110-2-4300Instrumentation for Concrete Structures
A-2.A-2. RelatedRelated PublicationsPublications
American Society for Testing and Materials StandardMethods of Test D653“Standard Terms and Symbols Relating to Soil andRock,” available from American Society for Testing andMaterials, 1916 Race St., Philadelphia, PA 19103.
Barton 1974Barton, N. 1974. “A Review of the Shear Strength ofFilled Discontinuities,” Norwegian Geotechnical Institute,NR 105, pp. 1-30.
Barton 1983Barton, N. 1983. “Application of Q-System and IndexTests to Estimate Shear Strength and Deformability ofRock Masses,”Proceedings, International Symposium onEngineering Geology and Underground Construction,Laboratorio Nacional de Engenharia Civil, Lisbon, Por-tugal, Vol. II, pp. II.51-II.70.
Barton, Lien, and Lunde 1974Barton, M., Lien, R., and Lunde, J. 1974. “Engineering
A-1

EM 1110-1-290830 Nov 94
Classification of Rock Masses for the Design of TunnelSupport,”Rock Mechanics, Vol. 6, No. 4, pp. 183-236.
Bieniawski 1973Bieniawski, Z. T. 1973. “Engineering Classification ofJointed Rock Masses,”Transactions of the South AfricanInstitution of Civil Engineers, Vol. 15, No. 12, pp. 335-344.
Bieniawski 1978Bieniawski, Z. T. 1978. “Determining Rock MassDeformability: Experience from Case Histories.”Inter-national Journal of Rock Mechanics and Mining Sciences,Vol. 15, pp. 237-248.
Bieniawski 1979Bieniawski, Z. T. 1979. “Tunnel Design by Rock MassClassifications,” Technical Report GL-79-19, U.S. ArmyEngineer Waterways Experiment Station, Vicksburg, MS.
Bishnoi 1968Bishnoi, B. W. 1968. “Bearing Capacity of JointedRock,” Ph.D. Thesis, Georgia Institute of Technology.
Bishop 1955Bishop, A. W. 1955. “The Use of the Slip Circle in theStability Analysis of Earth Slopes,”Geotechnique, Vol. 5,pp. 7-17.
Canada Centre for Mineral and Energy Technology1977aCanada Centre for Mineral and Energy Technology.1977. Pit Slope Manual. CAMMET Report 77-15,Chapter 5; “Design, Minerals Research Program,” MiningResearch Laboratories, available from Printing andPublishing Supply and Services, Canada, Ottawa, CanadaK1A059.
Canada Centre for Mineral and Energy Technology1977bCanada Centre for Mineral and Energy Technology.1977. Pit Slope Manual. CAMMET Report 77-15,Chapter 8; “Monitoring, Minerals Research Program,”Mining Research Laboratories, available from Printingand Publishing Supply and Services, Canada, Ottowa,Canada K1A059.
Chan and Einstein 1981Chan, H. C., and Einstein, H. H. 1981. “Approach toComplete Limit Equilibrium Analysis for Rock Wedges -The Method of Artificial Supports,”Rock Mechanics,Vol. 14, No. 2.
Cundall 1980Cundall, P. A. 1980. “UDEC - A Generalized DistinctElement Program for Modeling Jointed Rock,” EuropeanResearch Office, U.S. Army, AD A087 610.
Deere 1964Deere, D. U. 1964. “Technical Description of RockCores for Engineering Purposes,”Rock Mechanics andEngineering Geology, Vol. 1, No. 1, pp. 17-22.
Deere et al. 1967Deere, D. U. et al. 1967. “Design of Surface and Near-Surface Construction in Rock,”Proceedings of the EighthSymposium on Rock Mechanics(ed. Fairhurst, C.), Ameri-can Institute of Mining, Metallurgical and PetroleumEngineers, pp. 237-302.
Deere and Deere 1989Deere, D. U., and Deere, D. W. 1989. “Rock QualityDesignation (RQD) After Twenty Years,” TechnicalReport GL-89-1, U.S. Army Engineer WaterwaysExperiment Station, Vicksburg, MS 39180.
Deere and Patton 1971Deere, D. U., and Patton, F. D. 1971. “Slope Stability inResidual Soils,”Fourth Panamerican Conference on SoilMechanics and Foundation Engineering, American Soci-ety of Civil Engineers, pp. 87-170.
Deere, Merritt, and Coon 1969Deere, D. U., Merritt, A. H., and Coon, R. F. 1969.“Engineering Classifiction of In-Situ Rock,” TechnicalReport No. AFWL-TR-67-144, Kirtland Air Force Base,New Mexico, 280 pp. Available from the U.S. Depart-ment of Commerce, NTIS, Springfield, VA, Pub. No. AD.848 798.
Dickinson 1988Dickinson, R. M. 1988. “Review of ConsolidationGrouting of Rock Masses and Methods for Evaluation,”U.S. Army Engineer Waterways Experiment Station,Vicksburg, MS.
Dowding 1985Dowding, C. H. 1985. Blast Vibration Monitoring andControl, Prentice-Hall, Englewood Cliffs, NJ.
Dunnicliff 1988Dunnicliff, J. 1988. Geotechnical Instrumentation forMonitoring Field Performance, Wiley and Sons, NY.
A-2

EM 1110-1-290830 Nov 94
DuPont de Nemours 1977DuPont de Nemours (E. I.) and Co., Inc. 1977.Blaster’sHandbook, Wilmington, DE.
Farmer 1983Farmer, I. 1983. Engineering Behavior of Rocks,Chapman and Hall, NY.
Goodman 1976Goodman, R. E. 1976.Methods of Geological Engineer-ing in Discontinuous Rock, West Publishing Company, St.Paul, MN.
Goodman 1980Goodman, R. E. 1980.Methods of Geological Engineer-ing in Discontinuous Rock, Wiley and Sons, NY.
Goodman and Shi 1985Goodman, R. E., and Shi, G. 1985.Block Theory and itsApplication to Rock Engineering, Prentice-Hall, Inc.,Englewood Cliffs, NJ.
Hanna 1973Hanna, T. H. 1973. Foundation Instrumentation, TransTech Publications, Cleveland, OH.
Hendron, Cording, and Aiyer 1980Hendron, A. J., Cording, E. J., and Aiyer, A. K. 1980.“Analytical and Graphical Methods for the Analysis ofSlopes in Rock Masses,” Technical Report GL-80-2,U.S. Army Engineer Waterways Experiment Station,Vicksburg, MS.
Hobst and Zajic 1977Hobst, L., and Zajic, J. 1977. “Anchoring in Rock,”Developments in Geotechnical Engineering 13, ElsevierScientific Publishing Company, NY.
Hoek and Bray 1974Hoek, E., and Bray, J. W. 1974. “Rock Slope Engineer-ing,” The Institution of Mining and Metallurgy, London,England.
Hoek and Bray 1981Hoek, E., and Bray, J. W. 1981. “Rock Slope Engineer-ing,” The Institution of Mining and Metallurgy, London,England.
Hoek and Brown 1980Hoek, E., and Brown, E. T. 1980. “Empirical StrengthCriterion for Rock Masses,”Journal of GeotechnicalEngineering, American Society of Civil Engineers,Vol. 106, No. GT9, pp. 1013-1035.
Janbu 1954Janbu, N. 1954. “Application of Composite SlipSurfaces for Stability Analysis,”Proceeding of the Euro-pean Conference on Stability of Earth Slopes, Sweden,Vol. 3, pp. 43-49.
Janbu 1973Janbu, N. 1973. “Slope Stability Computations,”Embankment Dam Engineering, The Casagrande Volume,Wiley and Sons, NY, pp. 47-86.
Janbu, Bjerrum, and Kjaernsli 1956Janbu, N., Bjerrum, L., and Kjaernsli, B. 1956.“Veiledning Ved Losing av Fandamenteringsoppgaver,”(Soil Mechanics Applied to Some Engineering Problems),in Norwegian with English Summary, NorwegianGeotechnical Institute Publication No. 16, Oslo.
Johnson 1989Johnson, L. D. 1989. “Design and Construction of MatFoundations,” Miscellaneous Paper GL-89-27, U.S. ArmyEngineer Waterways Experiment Station, Vicksburg, MS.
Katzir and David 1968Katzir, M., and David, P. 1968. “Foundations in Expan-sive Marls,” Proceedings, 2nd International Research inEngineering Conference on Expansive Clay Soils, Uni-versity of Texas.
Kovari and Fritz 1989Kovari, K., and Fritz, P. 1989. “Re-evaluation of theSliding Stability of Concrete Structures on Rock withEmphasis on European Experience,” Technical ReportREMR-GT-12, U.S. Army Engineer Waterways Experi-ment Station, Vicksburg, MS.
Kulhawy and Goodman 1980Kulhawy, F. H., and Goodman, R. E. 1980. “Design ofFoundations on Discontinuous Rock,”Proceedings of theInternational Conference on Structural Foundations onRock, International Society for Rock Mechanics, Vol. I,pp. 209-220.
Lama and Vutukuri 1978Lama, R. D., and Vutukuri, V. S. 1978. “Handbook onMechanical Properties of Rocks,”Testing Techniques andResults- Vol. III, No. 2, Trans Tech Publications, (Inter-national Standard Book Number 0-87849-022-1,Clausthal, Germany).
Lambe and Whitman 1969Lambe, T. W., and Whitman, R. V. 1969.Soil Mechan-ics, Wiley and Sons, NY.
A-3

EM 1110-1-290830 Nov 94
Lauffer 1958Lauffer, H. 1958. “Gebirgsklassifizierung fur den Stol-lenbau,” Geologie and Bauwesen, Vol. 24, No. 1,pp. 46-51.
Linder 1976Linder, E. 1976. “Swelling Rock: A Review,”RockEngineering for Foundations and Slopes, American Soci-ety of Civil Engineers Specialty Conference, Boulder, CO,Vol. 1, pp. 141-181.
Littlejohn 1977Littlejohn, G. S. 1977. “Rock Anchors: State-of-the-Art,” Ground Engineering, Foundation Publications Ltd.,Essex, England.
Littlejohn and Bruce 1975Littlejohn, G.S. and Bruce, D.A. 1975. “Rock Anchors:State-of-the-Art Part I, Design,” Ground Engineering,Foundation Publications Ltd., Essex, England.
Morgenstern and Price 1965Morgenstern, N. R., and Price, V. E. 1965. “The Analy-sis of the Stability of General Slip Surfaces,”Geo-technique, Vol. 15, pp. 79-93.
Murphy 1985Murphy, William L. 1985. “Geotechnical Descriptions ofRock and Rock Masses,” Technical Report GL-85-3,U.S. Army Engineer Waterways Experiment Station,Vicksburg, MS 39180.
Naval Facilities Engineering Command 1982Naval Facilities Engineering Command. 1982. “SoilMechanics Design Manual 7.1. NAVFAC DM-7.1,”Department of the Navy, Alexandria, VA.
Nicholson 1983aNicholson, G. A. 1983a. “Design of Gravity Dams andRock Foundations: Sliding Stability Assessment by LimitEquilibrium and Selection of Shear Strength Parameters,”Technical Report GL-83-13, U.S. Army Engineer Water-ways Experiment Station, Vicksburg, MS 39180.
Nicholson 1983bNicholson, G. A. 1983b. “In-Situ and Laboratory ShearDevices for Rock: A Comparison,” Technical Report GL-83-14, U.S. Army Engineer Waterways Experiment Sta-tion, Vicksburg, MS 39180.
Peck, Hanson, and Thornburn 1974Peck, R. B., Hanson, W. E., and Thornburn, T. H. 1974.Foundation Engineering, 2nd ed., Wiley and Sons, NY.
Poulos and Davis 1974Poulos, H. G., and Davis, E. H. 1974.Elastic Solutionsfor Soil and Rock Mechanics, Wiley and Sons, NY.
Pratt et al. 1972Pratt, H. R., et al. 1972. “The Effect of Specimen Sizeon the Mechanical Properties of Unjointed Diorite,”Inter-national Journal of Rock Mechanics and Mining Sciencesand Geomechanics Abstracts, Vol. 9, No. 4, pp. 513-529.
Priest 1985Priest, S. D. 1985.Hemispherical Projection Methods inRock Mechanics, George Allen and Unwin (Publishers),Ltd., London England.
Rock Testing Handbook 1990Rock Testing Handbook. 1990. Available from Techni-cal Information Center, U.S. Army Engineer WaterwaysExperiment Station, 3909 Halls Ferry Road, Vicksburg,MS.
Serafim and Pereira 1983Serafim, J. L., and Pereira, J. P. 1983. “Considerationsof the Geomechanics Classification of Bieniawski,”Pro-ceedings, International Symposium on EngineeringGeology and Underground Construction, LNEC, Lisbon,Portugal, Vol. 1, pp. II.33-II.42.
Sarma 1979Sarma, S. K. 1979. “Stability Analysis of Embankmentsand Slopes,”Journal of the Geotechnical EngineeringDivision, American Society of Civil Engineers, ASCE,Vol. 105, No. GT 12, pp. 1511-1524.
Sowers 1979Sowers, G. F. 1979. Introductory Soil Mechanics andFoundations: Geotechnical Engineering, 4th ed.,McMillan, NY.
Templeton 1984Templeton, A. E. 1984. “User’s Guide: Computer Pro-gram for Determining Induced Stresses and ConsolidationSettlement (CSETT),” Instruction Report K-84-7,U.S. Army Engineer District, Vicksburg, MS.
A-4
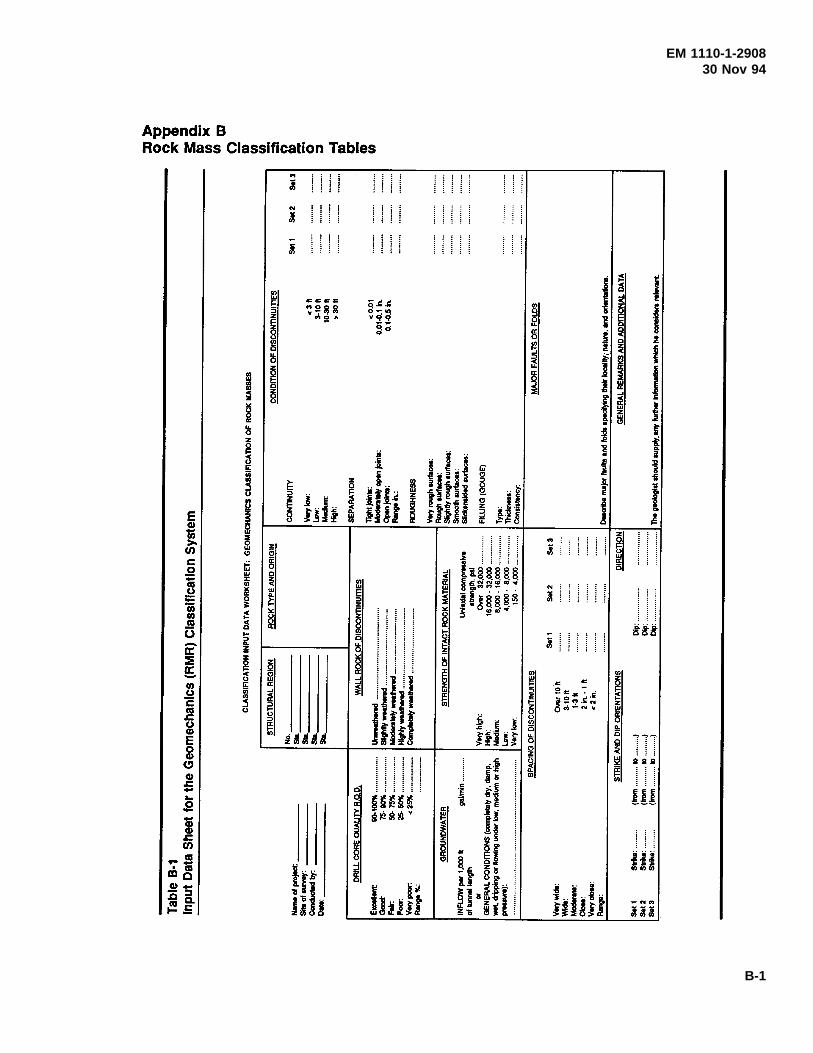
EM 1110-1-290830 Nov 94
B-1

EM 1110-1-290830 Nov 94
B-2

EM 1110-1-290830 Nov 94
B-3

EM 1110-1-290830 Nov 94
B-4

EM 1110-1-290830 Nov 94
B-5

EM 1110-1-290830 Nov 94
B-6


