Embed Size (px)
Citation preview

This article appeared in a journal published by Elsevier. The attachedcopy is furnished to the author for internal non-commercial researchand education use, including for instruction at the authors institution
and sharing with colleagues.
Other uses, including reproduction and distribution, or selling orlicensing copies, or posting to personal, institutional or third party
websites are prohibited.
In most cases authors are permitted to post their version of thearticle (e.g. in Word or Tex form) to their personal website orinstitutional repository. Authors requiring further information
regarding Elsevier’s archiving and manuscript policies areencouraged to visit:
http://www.elsevier.com/copyright
Author's personal copy
Applied Animal Behaviour Science 143 (2013) 18– 30
Contents lists available at SciVerse ScienceDirect
Applied Animal Behaviour Science
j o ur nal homep age : w w w.elsev ier .com/ locate /applan im
Flooring and driving conditions during road transport influence thebehavioural expression of cattle
Catherine. A. Stockmana,∗, Teresa Collinsa, Anne L. Barnesa, David Millera,Sarah L. Wickhama, David T. Beattyb, Dominique Blachec, Francoise Wemelsfelderd,Patricia A. Fleminga
a School of Veterinary and Biomedical Science, Murdoch University, WA 6150, Australiab Meat & Livestock Australia, NSW 2060, Australiac School of Animal Biology, Faculty of Natural and Agricultural Sciences, The University of Western Australia, WA 6009, Australiad Sustainable Livestock Systems Group, Research and Development Division, Scottish Agricultural College, Bush Estate, Penicuik, Midlothian EH26 0PH,Scotland, UK
a r t i c l e i n f o
Article history:Accepted 21 November 2012Available online 20 December 2012
Keywords:Free choice profilingGeneralised procrustes analysisPhysiologyQBARoad transportstress
a b s t r a c t
This study examined whether observers could distinguish between cattle that were exposedto various road transport conditions: Experiment 1 compared a manipulated flooringtreatment (non-grip flooring, NG) with a control transport event (grip flooring, G) andExperiment 2 compared a manipulated driving style (stop-start driving, SS) with a con-trol transport event of smooth, continuous (C) driving. The behavioural expression of cattlewas assessed through the process of Qualitative Behavioural Assessment (QBA), and theseassessments were tested for correlation with various physiological parameters. FourteenAngus steers were assessed. Blood samples were collected immediately before and aftertransport, and heart rate and core body temperature were measured continuously through-out each transport event. Continuous video footage recorded during each transport eventwas edited to isolate short clips of individual animals which were randomly ordered andshown to observers for QBA and analysis by Generalised Procrustes Analysis (GPA) whichidentifies common dimensions of behavioural expression. There was significant consensusamongst 39 observers in their assessment of behavioural expression of the cattle (P < 0.001).In Experiment 1, observers scored cattle exposed to NG flooring during road transport rela-tively higher (on visual analogue scales) for terms such as ‘agitated’, ‘restless’ and ‘anxious’compared with cattle exposed to G flooring, which were scored higher for ‘calm’, ‘com-fortable’ and ‘relaxed’ (GPA dimension 1, P < 0.001). In Experiment 2, cattle exposed to SSdriving received higher average GPA dimension 1 scores (P < 0.01) and higher GPA dimen-sion 2 scores (P < 0.05). These cattle were therefore scored relatively higher for terms such as‘restless’, ‘agitated’ and ‘scared’ (GPA dimension 1) or ‘curious’, ‘interested’ and ‘inquisitive’(GPA dimension 2) compared with cattle exposed to C driving, which were scored higher for‘calm’, ‘relaxed’ and ‘comfortable’ (GPA dimension 1), or ‘stressed’, ‘tense’ and ‘alert’ (GPAdimension 2). There were some significant correlations between physiological responsesand behavioural expression of animals for both experiments, with informative correlationsbetween the different dimensions of behavioural expression and white blood cell counts,red blood cell parameters and heart rate. For example, the neutrophil: lymphocyte ratio, atypical marker of stress in ruminants, was elevated in cattle that were described as more‘agitated’, ‘restless’ and ‘anxious’ (G-NG flooring: GPA dimension 1) or ‘stressed’, ‘tense’
∗ Corresponding author.E-mail address: [email protected] (Catherine.A. Stockman).
0168-1591/$ – see front matter © 2012 Elsevier B.V. All rights reserved.http://dx.doi.org/10.1016/j.applanim.2012.11.003

Author's personal copy
Catherine.A. Stockman et al. / Applied Animal Behaviour Science 143 (2013) 18– 30 19
and ‘alert’ (C-SS driving: GPA dimension 2). These results suggest that the QBA processcaptured behavioural manifestations of stress in cattle. We conclude that QBA is a valuablemethod of assessing cattle welfare under the conditions tested since there was significantconsensus in the ability of human observers to interpret behavioural expression of cattleduring these experimental conditions (i.e. QBA is repeatable), observers could distinguishbetween transport treatments on the basis of the animals’ QBA scores, and these scoreswere correlated with meaningful physiological measures.
© 2012 Elsevier B.V. All rights reserved.
1. Introduction
Most cattle are transported at least once in their life-time (e.g. from source to sale or slaughter) and may beexposed to environmental stressors that can compromiseboth welfare and productivity during transport. The wel-fare of livestock during road transport has received muchattention, with research largely aimed at reducing mor-tality, bruising, and occurrences of low quality meat (e.g.Grigor et al., 2001; Knowles, 1999; Le Neindre et al., 2001;Tarrant, 1990; Trunkfield and Broom, 1990). Increasedpublic scrutiny relating to welfare of animals during trans-port has prompted research addressing environmentalconditions during transport, including length of time intransit (Warriss et al., 1995), stocking rate (Eldridge et al.,1988), driving pattern (Eldridge et al., 1988) and stabil-ity (Tarrant, 1990), as well as variability in responses totransport of different types of animals, e.g. presence ofhorns (Wythes, 1985) and age of animal (Barnes et al.,1975).
Although a great deal of research has investigatedmethods of improving animal welfare during road trans-port, there is still a need for development of welfareassessment methods that can be used to monitor ani-mal welfare under industry situations. Development ofreliable welfare assessment methods will allow improvedanimal management and industry regulation of welfare.Physical changes in an animal, such as injury and mortal-ity, are generally acknowledged to be major indicators ofpoor welfare. However, for some stakeholders, good wel-fare implies much more than good health and low risk ofmortality, and good animal welfare results both from anabsence of negative experiences as well as the presenceof positive affective states (Kendrick, 2007; Mellor, 2012;Yeates and Main, 2008). Physiological responses are widelyregarded by the scientific community as reliable measuresof homeostatic response to stress and therefore indicatorsof animal welfare (Dawkins, 2003). However, physiologi-cal measures are often expensive and need to be carriedout under carefully-controlled conditions by experiencedanimal handlers and practitioners. Assessing welfare viaphysiological responses is therefore difficult to implementunder normal industry conditions, can be highly invasiveand the process of measurement, itself, may influence theoutcome. Finally, the link between physiological changesin normal everyday functioning also needs to be accountedfor if these measures are to be used as indicators of ani-mal welfare. For example, anticipation of food and exerciseresult in increased respiratory rate, corticosteroids andheart rate (e.g. Honma et al., 1983; Sutton and Casey, 1975;Thomas and Pearson, 1986). Also, many parameters also
vary with time of day, temperature and breeding condition(e.g. Piccione and Caola, 2002).
The behaviour of animals may be important to enablevalid interpretation of animal welfare. In the presentstudy, assessment of animal behavioural expression isexamined to test its validity as a potential welfare assess-ment method. Qualitative Behavioural Assessment (QBA)is a method that integrates observations of the wholeanimal, and is potentially a cheap and flexible methodof welfare assessment. Previous studies in cattle haverevealed differences in behavioural expression betweendairy cattle under various housing conditions (Rousing andWemelsfelder, 2006), and have investigated the correla-tion of QBA measures with clinical assessments of vealcalves (Brscic et al., 2009). A study of cattle during trans-port indicated that there were significant differences in thebehavioural expression of animals when they were naïveto, or habituated to, road transport (Stockman et al., 2011).
As part of the process of validation of QBA as an objec-tive, reliable and repeatable method of animal welfareassessment, we compared QBA for cattle that exhibiteda range of behaviour and compared these measures withphysiological parameters. Road transport was selected asthe model because it is a well known stressor for live-stock (Kent and Ewbank, 1983; Murata and Hirose, 1990,1991; Tarrant et al., 1992), and the environment can bemanipulated and is therefore to some degree controllableexperimentally. The physical environment was manipu-lated through altered flooring structure (Experiment 1) anddifferent driving styles (Experiment 2). The aims of theseexperiments were to:
1. determine whether observers could reach consensus intheir assessment of the behavioural expression of cattle;
2. determine whether observers could distinguishbetween experimental treatment groups based onthe animals’ behavioural expression; and
3. determine how QBA scores correlate with physiologicalmeasures that are indicative of the animals’ physiologi-cal and affective states.
2. Materials and methods
2.1. 2.1 Animals and transportation
Fourteen Angus steers (12 months of age; 347 ± 11 kg)were selected randomly from a herd that had the samesire. During the study, cattle were housed in a singlepaddock and group fed with a feedlot ration at 3% liveweight/head/day (Easy Beef, Milne Agrigroup, Welshpool,Western Australia, 14.5% crude protein and 11.0 MJ/kg

Author's personal copy
20 Catherine.A. Stockman et al. / Applied Animal Behaviour Science 143 (2013) 18– 30
metabolisable energy). The same cattle had been used for aprevious study examining their behaviour when they werefirst transported (transport-naïve) or habituated to roadtransport (Stockman et al., 2011).
Cattle were transported by the same driver, in a car-drawn, double-axel trailer with a stock cage (3.66 × 2.05m). Stocking rate on the trailer was within industry rec-ommendations (1.07 m2/head) (Standing Committee onAgricultural and Resource Management, 2002). Due tologistical constraints, cattle were transported in two groupsof seven (transport groups 1 and 2), with the same individ-uals making up each group on successive days. All transportevents were 90 min in length.
Environmental temperature (◦C) and relative humidity(%) were recorded (every 2 s) during transport (Onset HOBOH8 Pros, #H08-032-IS, OneTemp Pty Ltd, Parramatta, NSW,Australia) to ensure that environmental temperature oneach experimental transport event was not significantlydifferent. Each logger was positioned at cattle head height,with one at the front and one at the rear of the trailer.These data were used to dismiss transport events wherethe temperature varied by more than 5 ◦C from the mean;no further analyses were carried out.
The two challenges applied in this study, which com-prise two distinct experiments in regard to analyses andinterpretation, were exposure to altered flooring structure(Experiment 1), and exposure to different driving styles(Experiment 2) during road transport. In Experiment 1,a non-grip flooring (NG) transport event was comparedwith a grip-flooring (G) event. In Experiment 2, we com-pared a stop-start driving (SS) transport with a continuousdriving (C) event. For video footage for QBA, core tem-perature (Tcore) and heart rate (HR) data, we used datarecorded within the first 30 min after departure (Experi-ment 1) or within the final 30 min (Experiment 2), as wepredicted greatest effects of the experimental treatments atthe commencement and end stages of the transport events,respectively.
The trailer had a solid roof and the walls were con-structed from metal slats, allowing plentiful ventilation.The floor was cleaned following each transport event. Thetrailer had a metal-grate placed over the entire floor areafor additional foot stability. The grate consisted of a grid ofhorizontal and vertical 10-mm steel rods, spaced 100 mmapart, placed directly upon the floor (and therefore wasraised a maximum of 20 mm from the steel plate of thefloor). The grate was in place for all transport events exceptthe ‘non-grip’ (NG) event. For Experiment 1, the NG trans-port event was compared with a transport event with thefloor grate in place (‘grip’, G).
For Experiment 2, we manipulated driving style, com-paring smooth, continuous (C) driving with SS driving.Except for the C and SS transport events, the route includedapproximately 65 km of main roads (where the speed limitwas between 50 and 70 km/h) and highways (speed limitbetween 70 and 100 km/h). For Experiment 2, the C drivingroute followed freeways and country roads with minimalstops and an average speed of 85 km/h. This was com-pared with the SS driving event, where the route followedsuburban streets with frequents stops at intersections andfrequent turns; speed averaged 40 km/h.
The experimental period spanned 28 days (cattle werenot transported every day; e.g. we did not transport themduring wet weather) (Table 1). During this period, eachgroup was initially transported eight times to habituatethe cattle to the transport process. For experimental trans-port events, groups 1 and 2 were transported on differentdays but at the same time of day. Note that the G and NGtransport events (Experiment 1), and the C and SS events(Experiment 1) (preceded by a further habituation event),occurred on consecutive days for each transport group(Table 1).
2.2. Physiology
We carried out measurements of physiological vari-ables which have been used by various authors (reviewedby Knowles, 1999) as indicators of altered physiologi-cal state during transport, including body temperature,heart rate, metabolites, hormones, haematological andimmune responses. For example, transport-naïve cat-tle demonstrate increased core temperature, increasedconcentrations of cortisol and glucose, and increased neu-trophil: lymphocyte ratio compared to samples takenfrom the animals once habituated to transport (Stockmanet al., 2011). Similarly, transport-naïve sheep demonstrateincreased core temperature, heart rate, plasma cortisol,white blood cell count and neutrophil: lymphocyte ratiocompared with when they have become habituated to theprocess (Wickham et al., 2012). Many of these measureslink with activation of the hypothalamic-pituitary-adrenalaxis and an immune system response due to stress. Even ifphysiological measures did not show significant transporttreatment effects (i.e. individual variability may exceed thedifferences between treatment groups), individual differ-ences in physiological responses may still be correlatedwith the behavioural expression scores.
2.2.1. Core temperatureTemperature loggers (iButtons, Maxim Integrated Prod-
ucts, Sunnyvale, CA, USA; accuracy ± 0.1 ◦C) were surgicallyimplanted into the peritoneal cavity in the region ofthe right paralumbar fossa of each animal, as describedin Beatty et al. (2006). The surgery took place 16 daysbefore the first transport event, allowing time for recovery.Retrieval of the loggers took place at slaughter, followingcompletion of the experiment; retrieval was unsuccess-ful for two individuals (therefore n = 12 for temperaturedata for both experiments). The loggers were set to recordcore body temperature (Tcore) every 2 min for the durationof the experiment and average and maximum Tcore val-ues were retrieved for the first 30 min after departure forExperiment 1 and the last 30 min for Experiment 2 (‘dur-ing’ transport values). These were compared with averageand maximum Tcore for the same time of day averaged overthree non-transport, non-handling days (weekends whenthese animals were in their home paddock; Table 1).
2.2.2. Blood sampling and analysisBlood was collected by the same person for each
experimental transport event (Table 1) using jugularvenipuncture. As the collection of blood had the potential

Author's personal copy
Catherine.A. Stockman et al. / Applied Animal Behaviour Science 143 (2013) 18– 30 21
Table 1Timetable of the transportation events during 28 days (d).
Week Monday Tuesday Wednesday Thursday Friday Saturday Sunday
1 d1 H 1 d2 H2 d3 NT d4 NT2 d5 d6 H 1 d7 H 1 d8 H 1 d9 H 1 & 2 d10 NT d11 NT3 d12 H 1 & 2 d13 H 1 & 2 d14 H 1 & 2 d15 G 1, pm: H2 d16 NG 1, pm: H2 d17 NT d18 NT4 d19 H 2 d20 G 2 d21 NG 2, pm: H 1 d22 C 1 d23 SS 1 d24 NT d25 NT5 d26 H 2 d27 C 2 d28 SS 2
H: Habituation days, NT: non-transport handling days. Cattle were blood sampled immediately before and after the experimental transport events [shownin bold: grip flooring (G), non-grip flooring (NG), continuous driving (C) and stop-start driving (SS)], heart rate data and video footage were collected duringthese transport events. 1 and 2 refer to the two transport groups.H 1 & 2 indicates that both groups were transported on the same day; groups 1 and 2 were alternated between mornings (am) and afternoons (pm).
to influence cattle behaviour, blood was not collected dur-ing transport but rather ‘before’ and ‘after’ the transportevent. Cattle were moved from their home paddock to aholding yard adjoining the crush and loading ramp andleft to settle for 1 h. During this time, feed was withdrawnbut water was available ad libitum. They were then passedthrough a crush allowing the ‘before’ transport blood sam-ple to be taken and heart rate belts to be fitted (see below).The animals were held in an adjacent holding yard until thewhole group had been sampled (approximately 15 min);cattle were then loaded as a group onto the trailer (withoutthe use of electric prods) for immediate departure. ‘After’transport blood samples were collected once cattle wereunloaded, immediately following the experimental trans-port event (approximately 15 min to sample the group).
Whole blood was collected in EDTA tubes, immedi-ately placed on ice and then refrigerated and used foranalysis of complete haematological profile within 24 hof collection. Haematological variables analysed using theBayer Advia 120 Hematology System (with veterinarysoftware; Siemens Healthcare Diagnostics Inc., Tarrytown,New York, USA) were white blood cell count (WBC), redblood cell count (RBC), haematocrit (HCT), and the pro-portions of neutrophils (%), lymphotcytes (%), eosinophils(%), basophils (%) and monocytes (%). The proportion ofneutrophils: lymphocytes was calculated for analysis sincevalues for these cell types were auto correlated and theneutrophil: lymphocyte ratio is a common measure ofruminant stress (Jones and Allison, 2007).
A second blood sample was taken in EDTA tubes(also immediately placed on ice) and, within 15 minof collection from the last animal, was centrifuged for15 min at 604 g and the plasma removed and frozenbefore batch analysis for cortisol, insulin-like growthfactor (IGF-1), prolactin, �-hydroxy-butyrate and glu-cose. Plasma insulin were measured in duplicate by adouble-antibody radioimmunoassay (Tindal et al., 1978).Plasma IGF-I was assayed in duplicate by double-antibody radioimmunoassay with human recombinantIGF-I (ARM4050, Amersham-Pharmacia Biotech, Buck-inghamshire, England) and antihuman IGF-I antiserum(AFP4892898, National Hormone and Pituitary Program ofthe National Institute of Diabetes and Digestive and KidneyDiseases, California, USA) following acid-ethanol extrac-tion and cryoprecipitation (Breier et al., 1991). Plasmacortisol concentration was determined using a commercialradioimmunoassay kit (Clinical AssaysTM, GammaCoatTM,Cortisol 125I RIA Kit, DiaSorin, USA). All samples were
processed in a single assay and the limit of detectionwas insulin, 0.5 �U/mL; IGF- 1, 0.05 ng/mL; and cor-tisol, 3.5 nmol/L. The assay included six replicates ofthree control samples containing insulin: 10.62, 3.89 and2.49 �U/mL (intra-assay coefficients of variation, CV: 3.9%,1.9% and 5.4%.), or two control samples for IGF-I con-taining 0.39 and 2.14 ng/mL (intra-assay CV: 7.3% and2.3%), and cortisol: 46.1 and 85.65 nmol/L (intra-assay CV:5.0% and 2.1%). Plasma ACTH concentration was measuredusing a solid-phase two-site chemiluminescent enzymeimmunometric assay (Scott-Moncrieff et al., 2003). Thelimit of detection was 5 pg/mL and a working rangeof 12–1250 pg/mL. Plasma glucose (Olympus kit, Cat.No. OSR6121, Europa GmBH, Hamburg, Germany) andplasma beta-hydroxy-butyrate (Randox kit, Ranbut, Cat.No. RB1007, Crumlin, County Antrim, United Kingdom)concentrations were determined using a commercial kitrun on an Olympus AU400 automated chemistry analyser(Olympus Optical Co. Ltd., Olympus, Hamburg, Germany).
2.2.3. Heart rateHeart rate (HR, beats per min) was recorded (every 5 s)
during the experimental transport events with externalheart rate monitors (Polar Equine S625X, Polar Electro Oy,Adelaide, South Australia). Custom-made elastic belts wereused to fix electrodes in place, depending on the animal’ssize. Heart rate monitors were fitted immediately after the‘before’ transport blood sampling and were removed fol-lowing the ‘after’ transport blood sampling. Cattle were alsofitted with the heart rate belts for habituation transportevents to ensure habituation to the fitting and wearing ofthe belts. HR data were averaged for the first 30 min afterdeparture during the G and NG transport treatment (‘dur-ing’ transport) and were compared for HR data collected5–10 min before the animals were loaded (‘before’ trans-port). HR data were not reliably obtained from any animalsduring the C and SS treatments.
2.2.4. Statistical analysisThe physiological data did not violate the assumptions
of parametric analyses (Levene’s test and Shapiro–Wilk’sW test). Physiological data were analysed by two-wayrepeated-measures ANOVA (R-M ANOVA; Statistica 9.0,StatSoft, Tulsa, Oklahoma, USA) for each experiment sepa-rately, with time (see below) and treatment (Experiment1: NG vs. G flooring, or Experiment 2: SS vs. C driving)as the repeated dependent measures, and transport group(transport groups 1 or 2) included as a random factor.

Author's personal copy
22 Catherine.A. Stockman et al. / Applied Animal Behaviour Science 143 (2013) 18– 30
For hormones, metabolites and haematological parame-ters, measures taken ‘before’ transport were comparedwith those collected ‘after’ transport (effect: ‘time’). ForTcore, ‘during’ transport values were compared with valuesat the same time of day over non-transport, non-handlingdays (effect: ‘time’). Due to lost contact and interferenceof heart rate monitors, reliable data were obtained for NG:n = 4 and G: n = 4 and repeated-measures analysis was notpossible; these data were analysed by one-way ANOVA.
2.3. Qualitative Behavioural Assessment (QBA)
2.3.1. Video clip selectionVideo footage (15 frames per s) was recorded during
transport of cattle with four digital cameras (PanasonicSDR-H250 camcorders, Belrose, New South Wales (NSW),Australia) fixed to the front and back of the trailer, abovecattle head height. The first available suitable clip wasselected for each individual to represent its behaviourwithin the first 30 min after departure for Experiment 1(G-NG flooring) and within the final 30 min for Experiment2 (C-SS driving style), as we predicted greatest effects ofthe experimental treatments at the commencement andend stages of the transport events, respectively. Clip suit-ability was determined by clip duration (15 to 30 s long),and the visibility of the animal (head and shoulders visible).The cattle often held their heads down during transport andtherefore, for most animals, there was only one suitable clipof adequate length and quality available. Individuals wereidentified using numbers printed on the outside of the heartrate belts. The 28 clips for Experiment 1 and the 28 clips forExperiment 2 (14 clips – one for each of the 14 individualsfor each of NG, G, SS and C transport events) were editedto highlight individual focal cattle by increasing the opac-ity of the surrounding animals in the same frame (AdobePremiere Pro CS3 and Adobe After Effects CS3, San Jose,California, USA).
2.3.2. QBA sessionsStaff and students from two Western Australian Uni-
versities (Murdoch University and University of WesternAustralia) and livestock professionals (e.g. Departmentof Agriculture & Food, Western Australia) were recruitedby targeted advertising on notice boards and email andaccepting all 39 persons that responded (n = 15 universitystudents, n = 17 livestock industry professionals and n = 7general public; 12 male and 27 female). Importantly,a recent study has demonstrated that despite differentbackgrounds and experience, people can reach consensusin their assessments using QBA (Wemelsfelder et al.,2012). Each observer was required to attend three ses-sions on campus or by correspondence. Observers weregiven detailed instructions on completing the sessionsbut were not told about the experimental treatmentsor that the cattle were being transported. The observerscould not see the floor of the trailer in the field of view,and the vehicle was moving in all clips. The sessions aredetailed below (Sections 2.3.2.1 and 2.3.2.2) and followmethodology of previous QBA studies (e.g. Rousing andWemelsfelder, 2006; Wemelsfelder and Lawrence, 2001).
This methodology has been found to be both reliable andrepeatable (Wemelsfelder and Lawrence, 2001).
2.3.2.1. Term generation (session 1). Observers were shown15 video clips of individual experimental cattle demon-strating a wide range of behaviour to allow observers todescribe as many aspects of their expressive repertoire aspossible. These clips included some of the experimentalfootage but also additional footage of these animals thatwas not included in the quantification sessions; below.After watching each clip, observers were given 2 minto write down any words that they thought describedthat animal’s behavioural expression. There was no limitimposed to the number of descriptive terms an observercould generate, but terms needed to describe not what theanimal was doing (i.e. physical descriptions of the animalsuch as vocalising, chewing, tail flicking), but how the ani-mal was doing it. Subsequent editing of the descriptiveterms by the experimenters was carried out to removeterms that described actions, and terms that were in thenegative form were transformed to the positive for ease ofscoring (e.g. ‘unhappy’ became ‘happy’). Each descriptiveterm was attached to a 100-mm visual analogue scale (min-imum = 0 mm to maximum = 100 mm). The lists of termswere alphabetically arranged and terms with similar mean-ing were not listed one after the other e.g. frightened,scared. This was to encourage the observer to score termson their own merit rather than purposefully replicatingscores for words of similar meaning.
2.3.2.2. Quantification (sessions 2 and 3). Observers viewedand scored the experimental video clips using their ownunique list of descriptive terms. In session 2, observersviewed 28 clips for Experiment 1 (G-NG flooring) and insession 3, observers viewed 28 clips for Experiment 2 (C-SS driving style). Before session 2, observers were givendetailed instructions on how to score each animal’s expres-sion using the visual analogue scale: they were told to thinkof the distance between the zero-point and their mark onthe scale as reflecting the intensity of the animal’s expres-sion.
2.3.3. Statistical analysis.The visual analogue scales were scored as the distance
from the start (0 mm representing minimum values forthat term) to where the observer had made a mark (mea-sured in mm, up to a maximum of 100 mm) against eachdescriptive term. These measurements were entered intoseparate Microsoft Excel (Microsoft Excel 2003, Redmond,Washington, USA) worksheets for each individual observer.Data for the G-NG clips viewed in session 2 (Experiment 1)were analysed by Generalised Procrustes Analysis (GPA)independently from the C-SS clips viewed in session 3(Experiment 2).
GPA was carried out with Genstat as part of a specialisedsoftware edition written for Franc oise Wemelsfelder (Gen-stat 2008, VSN International, Hemel Hempstead, Hertford-shire, UK; Wemelsfelder et al., 2000). See Wemelsfelderet al. (2000) for a detailed description of (GPA) procedures.Briefly summarised, GPA calculates a consensus or ‘bestfit’ profile between observer assessments through complex
Author's personal copy
Catherine.A. Stockman et al. / Applied Animal Behaviour Science 143 (2013) 18– 30 23
pattern matching. The number of dimensions of the con-sensus profile is then reduced to several main dimensions(usually two or three) explaining the variation betweenanimals through Principle Components Analysis (PCA). Themeaning of each GPA dimension is interpreted by analy-sis of the correlations between the consensus scores andeach individual observers’ terms. Terms attributed corre-lation coefficients close to zero did not contribute to thedescription of the consensus dimension, but terms that arestrongly positively or negatively correlated with the axisare descriptive terms that would have contributed to math-ematical calculation of the consensus dimension. Theseterms are then tabulated.
2.3.3.1. Validity of the QBA consensus. A Procrustes Statisticcan be calculated which indicates the degree of consen-sus (i.e. the percentage of variation explained betweenobservers) that was achieved. Whether this consensusis a significant feature of the data set, or, alternatively,an artefact of the Procrustean calculation procedures, isdetermined through a randomisation test (Dijksterhuisand Heiser, 1995). This procedure rearranges at randomeach observer’s scores and produces new permutated datamatrices. By applying GPA to these permutated matri-ces, a ‘randomised’ profile is calculated. This procedureis repeated 100 times, providing a distribution of theProcrustes Statistic indicating how likely it is to find anobserver consensus based on chance alone. Subsequentlya one-way t-test is used to determine whether the actualobserver consensus profile falls significantly outside thedistribution of randomised profiles.
2.3.3.2. Treatment effects in QBA scores. Each clip viewedis ultimately attributed a quantitative score for each ofthe GPA consensus dimensions. These GPA scores did notviolate the assumptions of parametric analyses (Levene’stest and Shapiro–Wilk’s W test). To investigate treatmenteffects, GPA scores for each dimension were analysedusing repeated measures ANOVA, with the scores for eachindividual for the respective treatments compared as therepeated-measures for each of the experiments (i.e. Exper-iment 1: G vs. NG flooring, or Experiment 2: C vs. SS driving).Transport group was included as a random factor (transportgroups 1 and 2).
2.3.3.3. Comparison between QBA scores and physiologi-cal measures. GPA dimension scores were compared withphysiological responses for each transport event for eachindividual animal by Pearson’s correlation (Microsoft Excel2003, Redmond, Washington, USA). The physiologicalresponse was expressed as the change in each parameterdue to transport to obtain a single measure for compari-son with the GPA scores. For hormones, metabolites andhaematological parameters, the change due to transportwas calculated as a proportion of ‘after’ transport to ‘before’transport values. The change in Tcore due to transportwas calculated using ‘during’ transport values [mean offirst 30 min after departure for Experiment 1 (G-NG floor-ing) and mean of the final 30 min for Experiment 2 (C-SSdriving style)] as a proportion of the means of eight non-transport, non-handling days at the same time of day for
the same individual. The change in HR due to transport wascalculated for individual animals as mean values ‘during’transport as a proportion of ‘before’ transport values.
3. Results
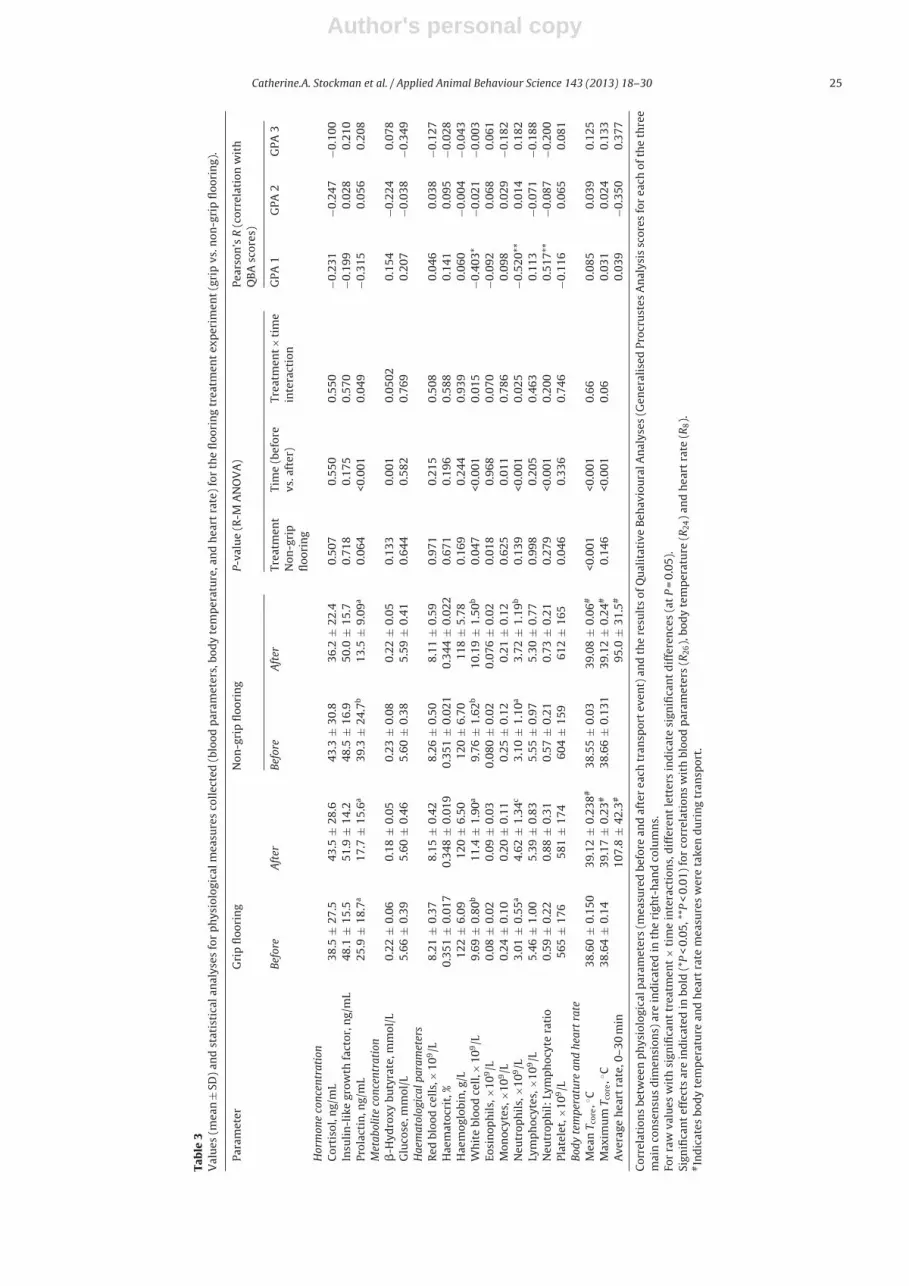
The 39 observers participating in this study gener-ated a total of 180 unique terms to describe the cattlethey were shown, with an average of 17 ± 7 (range 9–47)terms per observer. Fig. 1 shows an example of oneobserver’s terms graphed against GPA dimension 1 and2 for the flooring treatment Experiment 1 (Fig. 1a) andthe driving style Experiment 2 (Fig. 1b). Terms with thestrongest correlation with each of the GPA dimensions areshown in Table 2. The important differences in physiology(Tables 3 and 4) were those that demonstrated a significantTreatment × Time interaction, which would reflect that theexperimental treatments resulted in differing physiology.These are discussed below in respect to each experiment.
3.1. Experiment 1: grip vs. non-grip flooring
3.1.1. PhysiologyA summary of the raw values, results of R-M ANOVA and
correlation with GPA dimension scores is given in Table 3.A significant treatment × time interaction was found for
prolactin, with a substantial decrease over time in pro-lactin concentration for cattle exposed to NG flooring. Therewas also a treatment × time interaction for white blood cellcount and neutrophil numbers, where the elevation overtime due to transport was less pronounced for NG than forthe G treatment.
Being transported (i.e. a significant time effect: beforetransport vs. after transport) resulted in a decrease inmonocyte count, �-hydroxy butyrate and prolactin con-centrations, as well as an increase in WBC, neutrophilcount, neutrophil: lymphocyte ratio and Tcore.
3.1.2. Qualitative Behavioural AssessmentThe Procrustes Statistic generated from the GPA
analysis of the G-NG treatments was 44.7% and this dif-fered significantly (t99 = 61.3, P < 0.001) from the meanrandomised profile (32.3 ± 0.2%), indicating significantconsensus between observers in their use of descriptiveterms to quantify the behavioural expression of these cat-tle. Three main GPA dimensions were identified, explaininga total of 63.7% of the variation between animals (Table 2).
Terms with the strongest correlation with each of theGPA dimensions are shown in Table 2. For GPA dimension1, low values were associated with terms such as ‘calm’,‘comfortable’ and ‘relaxed’ and high values with terms suchas ‘agitated’, ‘restless’ and ‘anxious’. For GPA dimension 2,low values were associated with terms such as ‘curious’,‘interested’ and ‘alert’, and high values with terms such as‘angry’, ‘nervous’ and ‘upset’. For GPA dimension 3, low val-ues were associated with terms such as ‘nervous’, ‘bored’and ‘worried’ and high values with terms such as ‘annoyed’,‘stressed’ and ‘distressed’.
The positions of individual cattle on the first two GPAdimensions are shown in Fig. 2a. Cattle on NG flooringhad a significantly greater GPA score on dimension 1 (F1,

Author's personal copy
24 Catherine.A. Stockman et al. / Applied Animal Behaviour Science 143 (2013) 18– 30Ta
ble
2Te
rms
use
d
by
obse
rver
s
to
des
crib
e
catt
le
beh
avio
ura
l exp
ress
ion
for
the
floo
rin
g
trea
tmen
t
exp
erim
ent
(G-N
G:
grip
vs. n
on-g
rip
floo
rin
g)
and
for
the
dri
vin
g
styl
e
exp
erim
ent
(C-S
S:
con
tin
uou
s
vs. s
top
-sta
rtd
rivi
ng)
.
Trea
tmen
t
GPA
Dim
ensi
onLo
w
valu
es
Hig
h
valu
es
Trea
tmen
tef
fect
G-N
G
1
(46.
7%)
r <
−0.6
:
Cal
m
(7),
com
fort
able
(5),
rela
xed
(4),
atea
se
(2),
con
ten
t
(2),
pre
dic
tabl
e,
sett
led
,co
nfi
den
t,
quie
t,
un
ph
ased
, sle
epy
r>0.
6:
Agi
tate
d
(6),
rest
less
(4),
anxi
ous
(3),
un
sure
(2),
stre
ssed
(2),
toey
,ap
pre
hen
sive
, wan
ts
to
leav
e,
scar
ed,
alar
med
, ten
se, n
ervo
us,
un
cert
ain
,tw
itch
y,
con
fin
ed, p
anic
ked
, flig
hty
,w
orri
ed, r
estr
icte
d
F 1,1
3=
15.0
9,
P
<
0.01
-C
attl
e tr
avel
lin
g
onn
on-g
rip
floo
rin
gsc
ored
hig
her
than
catt
le
that
had
a
met
algr
id
floo
rin
g2
(12.
5%)
r <
−0.5
:
Cu
riou
s
(8),
inte
rest
ed
(5),
aler
t
(5),
inqu
isit
ive
(3),
hap
py
(2),
calm
(2),
awar
e(2
),
con
ten
t,
bore
d, r
elax
ed, q
uie
t,co
nce
ntr
ated
, bri
ght,
focu
ssed
,qu
esti
onin
g,
asse
ssin
g
envi
ron
men
t,re
spon
sive
, sca
red
, wor
ried
r >
0.5:
An
gry
(3),
ner
vou
s
(2),
up
set
(2),
shy
(2),
agit
ated
(2),
anxi
ous,
tire
d, t
rap
ped
,be
wil
der
ed, w
orri
ed, o
pp
ress
ed,
scar
ed, f
righ
ten
ed, f
rust
rate
d, s
ad,
isol
ated
, eva
sive
, for
lorn
, ju
mp
y,al
arm
ed, h
esit
ant,
fid
gety
, on
edge
,tw
itch
y,
dep
ress
ed, a
nn
oyed
ns
3
(5.5
%)
r <
−0.5
:
Ner
vou
s
(2),
bore
d, w
orri
ed, s
ad,
thou
ghtf
ul,
wea
ry, a
frai
d, h
app
y,
calm
,co
mfo
rtab
le, a
lon
e
r >
0.5:
An
noy
ed, s
tres
sed
, dis
tres
sed
, try
ing
toge
t
away
, in
quis
itiv
e,
aler
t,
revv
ed
up
,p
layf
ul,
evas
ive,
cari
ng,
angr
y,
seek
ing
esca
pe,
intr
igu
ed, a
nxi
ous
ns
C-S
S
1
(33.
3%)
r <
−0.6
:
Cal
m
(17)
, rel
axed
(13)
, com
fort
able
(9),
con
ten
t
(5),
at
ease
(3),
hap
py
(2),
quie
t
(2),
pre
dic
tabl
e,
com
pos
ed, a
frai
d, b
ored
r >
0.6:
Res
tles
s (8
),
agit
ated
(8),
scar
ed
(7),
anxi
ous
(7),
wor
ried
(6),
ner
vou
s
(6),
stre
ssed
(5),
alar
med
(5),
ten
se
(5),
aler
t (5
),
dis
tres
sed
(4),
frig
hte
ned
(4),
fear
ful (
4), a
ngr
y
(2),
un
sure
(2),
twit
chy
(2),
both
ered
(2),
con
fuse
d
(2),
flig
hty
(2),
trap
ped
(2),
con
fin
ed
(2),
up
set
(2),
seek
ing
com
pan
ion
s,
boxe
din
, exc
itab
le, a
t
ease
, toe
y,
wan
ts
toes
cap
e,
un
ner
ved
, cra
mp
ed, i
nqu
isit
ive,
swam
ped
, cor
ner
ed, i
nte
rest
ed
F 1,1
3=
12.6
3,
P
<
0.01
-C
attl
e
exp
osed
tost
op-s
tart
dri
vin
gsc
ored
hig
her
than
catt
le
exp
osed
toco
nti
nu
ous
dri
vin
g
2
(16.
0%)
r <
−0.5
:
Cu
riou
s
(8),
inte
rest
ed
(8),
inqu
isit
ive
(7),
aler
t
(4),
calm
(3),
anxi
ous
(3),
obse
rvan
t(2
),
rela
xed
(2),
con
fid
ent
(2),
com
fort
able
(2),
at
ease
(2),
asse
ssin
g
envi
ron
men
t,h
app
y,
brig
ht,
sett
led
, qu
esti
onin
g,
bold
,ca
sual
, agi
tate
d, f
ocu
sed
, see
kin
g,in
vest
igat
ive,
awar
e
r >
0.5:
Stre
ssed
(2),
ten
se
(2),
aler
t,
ner
vou
s,av
oid
ing,
irri
tate
d, w
orri
ed, a
gita
ted
,se
ekin
g
com
fort
, loo
kin
g
for
com
pan
y,on
edge
, an
xiou
s,
pan
icke
d, a
ngr
y,ap
pre
hen
sive
, fri
ghte
ned
, an
noy
ed,
stru
ggli
ng
F 1,1
3=
5.01
, P
<
0.05
-C
attl
e
exp
osed
tost
op-s
tart
dri
vin
gsc
ored
low
er
than
catt
le
exp
osed
toco
nti
nu
ous
dri
vin
g
3
(8.9
%)
r <
−0.5
:
Cal
m
(5),
bore
d
(2),
intr
igu
ed
(2),
rela
xed
(2),
stre
ssed
, com
fort
able
, an
noy
ed, h
app
y,w
orri
ed, c
onfi
ned
, vio
late
d, c
once
rned
,st
uck
, un
sure
, in
dif
fere
nt,
jam
med
,ag
itat
ed, t
ense
, ner
vou
s
r >
0.5:
Stre
ssed
(2),
agit
ated
, afr
aid
,fr
igh
ten
ed, c
omfo
rtab
le, n
ervo
us,
awar
e,
anxi
ous,
curi
ous,
aler
t,
rela
xed
ns
On
ly
term
s
that
show
ed
a
stro
ng
neg
ativ
e
or
pos
itiv
e
corr
elat
ion
(Pea
rson
’s
corr
elat
ion
coef
fici
ent,
r)
wit
h
each
dim
ensi
on
of
the
Gen
eral
ised
Proc
rust
es
An
alys
is
(GPA
)
con
sen
sus
pro
file
are
show
n. O
rder
ofte
rms
is
det
erm
ined
firs
tly
by
nu
mbe
r
of
obse
rver
s
to
use
that
term
(in
par
enth
eses
wh
ere
>1)
and
seco
nd
ly
by
wei
ghti
ng
(cor
rela
tion
, r)
of
each
term
wit
h
the
GPA
con
sen
sus
dim
ensi
ons.
We
hav
e
not
edit
ed
out
term
s
that
may
app
ear
on
mu
ltip
le
list
s
beca
use
this
wou
ld
intr
odu
ce
subj
ecti
vity
(as
to
wh
ich
list
to
rem
ove
the
term
from
),
but
the
read
er
shou
ld
be
min
dfu
l
that
each
ind
ivid
ual
obse
rver
had
a
un
iqu
e
list
of
term
s
and
ther
efor
e
how
they
scor
ed
the
sam
e
term
may
to
som
e
deg
ree
be
infl
uen
ced
by
the
rem
ain
ing
term
s
in
thei
r
rep
erto
ire
Author's personal copy
Catherine.A. Stockman et al. / Applied Animal Behaviour Science 143 (2013) 18– 30 25
Tab
le
3V
alu
es
(mea
n
±
SD)
and
stat
isti
cal a
nal
yses
for
ph
ysio
logi
cal m
easu
res
coll
ecte
d
(blo
od
par
amet
ers,
bod
y
tem
per
atu
re, a
nd
hea
rt
rate
)
for
the
floo
rin
g
trea
tmen
t
exp
erim
ent
(gri
p
vs. n
on-g
rip
floo
rin
g).
Para
met
erG
rip
floo
rin
gN
on-g
rip
floo
rin
gP-
valu
e
(R-M
AN
OV
A)
Pear
son
’s
R
(cor
rela
tion
wit
hQ
BA
scor
es)
Befo
reA
fter
Befo
reA
fter
Trea
tmen
tN
on-g
rip
floo
rin
g
Tim
e
(bef
ore
vs. a
fter
)Tr
eatm
ent ×
tim
ein
tera
ctio
nG
PA
1
GPA
2
GPA
3
Hor
mon
e
conc
entr
atio
nC
orti
sol,
ng/
mL
38.5
±
27.5
43.5
±
28.6
43.3
±
30.8
36.2
±
22.4
0.50
7
0.55
0
0.55
0
−0.2
31
−0.2
47
−0.1
00In
suli
n-l
ike
grow
th
fact
or, n
g/m
L48
.1±
15.5
51.9
±
14.2
48.5
±
16.9
50.0
±
15.7
0.71
8
0.17
5
0.57
0
−0.1
99
0.02
8
0.21
0Pr
olac
tin
, ng/
mL
25.9
±
18.7
a17
.7
±
15.6
a39
.3
±
24.7
b13
.5
±
9.09
a0.
064
<0.0
01
0.04
9 −0
.315
0.05
6
0.20
8M
etab
olit
e
conc
entr
atio
n�
-Hyd
roxy
buty
rate
, mm
ol/L
0.22
±
0.06
0.18
±
0.05
0.23
±
0.08
0.22
±
0.05
0.13
3
0.00
1
0.05
02
0.15
4
−0.2
24
0.07
8G
luco
se, m
mol
/L5.
66
±
0.39
5.60
±
0.46
5.60
±
0.38
5.59
±
0.41
0.64
4
0.58
2
0.76
9
0.20
7
−0.0
38
−0.3
49H
aem
atol
ogic
al
para
met
ers
Red
bloo
d
cell
s,
×10
9/L
8.21
±
0.37
8.15
±
0.42
8.26
±
0.50
8.11
±
0.59
0.97
1
0.21
5
0.50
8
0.04
6
0.03
8
−0.1
27H
aem
atoc
rit,
%0.
351
±
0.01
7
0.34
8
±
0.01
9
0.35
1
±
0.02
1
0.34
4
±
0.02
2
0.67
1
0.19
6 0.
588
0.14
1
0.09
5
−0.0
28H
aem
oglo
bin
, g/L
122
±
6.09
120
±
6.50
120
±
6.70
118
±
5.78
0.16
9
0.24
4 0.
939
0.06
0
−0.0
04
−0.0
43W
hit
e
bloo
d
cell
, ×
109/L
9.69
±
0.80
b11
.4
±
1.90
a9.
76
±
1.62
b10
.19
±
1.50
b0.
047
<0.0
01
0.01
5
−0.4
03*
−0.0
21
−0.0
03Eo
sin
oph
ils,
×109
/L0.
08±
0.02
0.09
±
0.03
0.08
0
±
0.02
0.07
6
±
0.02
0.01
8
0.96
8
0.07
0
−0.0
92
0.06
8
0.06
1M
onoc
ytes
, ×10
9/L
0.24
±
0.10
0.20
±
0.11
0.25
±
0.12
0.21
±
0.12
0.62
5
0.01
1
0.78
6
0.09
8
0.02
9
−0.1
82N
eutr
oph
ils,
×109
/L
3.01
±
0.55
a4.
62
±
1.34
c3.
10
±
1.10
a3.
72
±
1.19
b0.
139
<0.0
01
0.02
5
−0.5
20**
0.01
4
0.18
2Ly
mp
hoc
ytes
, ×10
9/L
5.46
±
1.00
5.39
±
0.83
5.55
±
0.97
5.30
±
0.77
0.99
8 0.
205
0.46
3
0.11
3
−0.0
71
−0.1
88N
eutr
oph
il:
Lym
ph
ocyt
e
rati
o0.
59±
0.22
0.88
±
0.31
0.57
±
0.21
0.73
±
0.21
0.27
9 <0
.001
0.20
0
0.51
7**
−0.0
87
−0.2
00Pl
atel
et, ×
109/L
565
±
176
581
±
174
604
±
159
612
±
165
0.04
6
0.33
6
0.74
6
−0.1
16
0.06
5
0.08
1Bo
dy
tem
pera
ture
and
hear
t
rate
Mea
n
T cor
e,◦ C
38.6
0
±
0.15
0
39.1
2
±
0.23
8#38
.55
±
0.03
39.0
8
±
0.06
#<0
.001
<0.0
01
0.66
0.08
5
0.03
9
0.12
5M
axim
um
T cor
e,◦ C
38.6
4±
0.14
39.1
7±
0.23
#38
.66
±
0.13
1
39.1
2±
0.24
#0.
146
<0.0
01
0.06
0.03
1
0.02
4
0.13
3A
vera
ge
hea
rt
rate
, 0–3
0
min
107.
8
±
42.3
#95
.0
± 31
.5#
0.03
9
−0.3
50
0.37
7
Cor
rela
tion
s
betw
een
ph
ysio
logi
cal p
aram
eter
s
(mea
sure
d
befo
re
and
afte
r
each
tran
spor
t
even
t)
and
the
resu
lts
of
Qu
alit
ativ
e
Beh
avio
ura
l An
alys
es
(Gen
eral
ised
Proc
rust
es
An
alys
is
scor
es
for
each
of
the
thre
em
ain
con
sen
sus
dim
ensi
ons)
are
ind
icat
ed
in
the
righ
t-h
and
colu
mn
s.Fo
r
raw
valu
es
wit
h
sign
ifica
nt
trea
tmen
t
×
tim
e
inte
ract
ion
s,
dif
fere
nt
lett
ers
ind
icat
e
sign
ifica
nt
dif
fere
nce
s
(at
P
=
0.05
).Si
gnifi
can
t
effe
cts
are
ind
icat
ed
in
bold
(*P
<
0.05
, **P
<
0.01
)
for
corr
elat
ion
s
wit
h
bloo
d
par
amet
ers
(R26
),
bod
y
tem
per
atu
re
(R24
)
and
hea
rt
rate
(R8).
#In
dic
ates
bod
y
tem
per
atu
re
and
hea
rt
rate
mea
sure
s
wer
e
take
n
du
rin
g
tran
spor
t.

Author's personal copy
26 Catherine.A. Stockman et al. / Applied Animal Behaviour Science 143 (2013) 18– 30
Tab
le
4V
alu
es
(mea
n
±
SD)
and
stat
isti
cal a
nal
yses
for
ph
ysio
logi
cal m
easu
res
coll
ecte
d
(blo
od
par
amet
ers,
bod
y
tem
per
atu
re)
for
the
dri
vin
g
styl
e
trea
tmen
t
(C-S
S:
con
tin
uou
s
vs. s
top
-sta
rt
dri
vin
g).
Para
met
er
Con
tin
uou
s
Stop
-sta
rt
P-va
lue
(R-M
AN
OV
A)
Pear
son
’s
R
(cor
rela
tion
wit
hQ
BA
scor
es)
Befo
reA
fter
Befo
reA
fter
Trea
tmen
t(S
top
-sta
rt
vs.
con
tin
uou
s)
Tim
e
(bef
ore
vs. a
fter
)Tr
eatm
ent ×
tim
ein
tera
ctio
nG
PA
1G
PA
2G
PA
3
Hor
mon
e
conc
entr
atio
nC
orti
sol,
ng/
mL
23.8
2±
11.5
5
27.5
9±
23.2
7
26.3
7±
18.6
7
31.2
1±
32.2
7
0.74
5
0.72
4
0.87
5 0.
084
−0.1
55
0.40
9*In
suli
n-l
ike
grow
th
fact
or, n
g/m
L
50.9
1
±
16.3
5
51.6
3
±
14.1
3
58.8
1
±
16.7
2
60.1
7
±
23.4
9
0.00
3
0.34
1
0.84
3 0.
088
−0.2
18
−0.0
19Pr
olac
tin
, ng/
mL
21.0
1±
20.1
8
14.5
3±
7.58
25.5
±
18.2
1
22.8
9
±
17.8
0
0.01
2
0.16
3
0.62
2
−0.1
93
−0.0
29
−0.0
23M
etab
olit
e
conc
entr
atio
n�
-Hyd
roxy
buty
rate
, mm
ol/L
0.21
±
0.06
0.19
±
0.05
0.21
±
0.07
0.19
±
0.05
0.95
8
0.00
2
0.93
7
−0.2
07
0.26
3
−0.2
07G
luco
se, m
mol
/L5.
52
±
0.27
5.51
±
0.36
5.49
±
0.37
5.62
±
0.50
0.58
7
0.32
8
0.14
9
−0.1
91
0.00
5
−0.2
38H
aem
atol
ogic
al
para
met
ers
Red
bloo
d
cell
s,
×109
/L8.
22±
0.45
8.19
±
0.44
8.03
±
0.37
8.06
±
0.53
0.00
8
0.97
8 0.
634
−0.0
32
−0.3
42
0.03
5H
aem
atoc
rit,
%
0.34
8
±
0.01
7
0.34
6
±
0.01
9
0.33
9
±
0.01
4
0.34
0
±
0.02
1
0.00
6
0.96
6
0.68
1
−0.0
46
−0.3
45
−0.0
24H
aem
oglo
bin
, g/L
120
±
5.69
119
±
6.12
117
±
5.35
118
±
6.76
0.02
5
0.85
1
0.48
3
−0.0
80
−0.3
29
0.06
3W
hit
e
bloo
d
cell
s,
×109
/L
9.79
±
1.50
10.8
7
±
1.46
9.71
±
1.03
10.9
3
±
1.24
0.98
2
<0.0
01
0.55
0
−0.0
32
−0.3
42
0.03
5Eo
sin
oph
ils,
×109
/L
0.08
5
±
0.02
8
0.08
7
±
0.02
8
0.07
4
±
0.01
8
0.07
7
±
0.01
9
0.00
7
0.49
3
0.87
7
−0.0
46
−0.1
80
−0.0
69M
onoc
ytes
, ×10
9/L
0.42
9±
0.43
3
0.36
2±
0.41
0
0.35
6±
0.27
7
0.25
7±
0.26
5
0.18
3
<0.0
01
0.49
0
−0.2
80
0.01
5
0.11
9N
eutr
oph
ils,
×109
/L
2.77
±
0.97
2
3.88
±
1.19
2.80
±
0.55
3
4.03
±
0.97
9
0.72
8 <0
.001
0.44
4
−0.0
27
−0.4
29*
0.07
8Ly
mp
hoc
ytes
, ×10
9/L
5.56
±
0.62
9
5.39
±
0.60
7
5.41
±
0.69
7
5.22
±
0.66
8
0.12
3 0.
106
0.88
6
0.34
7
0.04
5
−0.0
32N
eutr
oph
il:
Lym
ph
ocyt
e
rati
o
0.50
0
±
0.17
0
0.72
8
±
0.24
5
0.52
6
±
0.13
0
0.79
5
±
0.27
1
0.26
3
<0.0
01
0.55
9
0.12
6
0.34
5
−0.1
51Pl
atel
et, ×
109/L
629
±
151
620
±
163
642
±
167
638
±
162
0.20
4
0.50
8
0.84
1
0.00
1
−0.3
32
0.18
3Bo
dy
tem
pera
ture
Mea
n
T cor
e,◦ C
38.6
3
±
0.10
a38
.85
±
0.38
b#38
.62
±
0.10
a39
.04
±
0.32
c#<0
.001
<0.0
01
<0.0
01
−0.0
38
0.21
5
−0.1
21M
axim
um
T cor
e,◦ C
38.6
7±
0.10
a38
.91
±
0.36
b#38
.67
±
0.11
a39
.07
± 0.
34c#
0.00
8
0.00
8
0.00
2
−0.0
33
0.21
9
−0.0
41
Cor
rela
tion
s
betw
een
ph
ysio
logi
cal p
aram
eter
s
(mea
sure
d
befo
re
and
afte
r
each
tran
spor
t
even
t)
and
the
resu
lts
of
Qu
alit
ativ
e
Beh
avio
ura
l An
alys
es
(Gen
eral
ised
Proc
rust
es
An
alys
is
scor
es
for
each
of
the
thre
em
ain
con
sen
sus
dim
ensi
ons)
are
ind
icat
ed
in
the
righ
t-h
and
colu
mn
s.Fo
r
raw
valu
es
wit
h
sign
ifica
nt
trea
tmen
t ×
tim
e
inte
ract
ion
s,
dif
fere
nt
lett
ers
ind
icat
e
sign
ifica
nt
dif
fere
nce
s
(at
P
=
0.05
).Si
gnifi
can
t
effe
cts
are
ind
icat
ed
in
bold
(*P
<
0.05
)
for
corr
elat
ion
s
wit
h
bloo
d
par
amet
ers
(R26
),
bod
y
tem
per
atu
re
(R24
).#
Ind
icat
es
bod
y
tem
per
atu
re
and
hea
rt
rate
mea
sure
s
wer
e
take
n
du
rin
g
tran
spor
t.

Author's personal copy
Catherine.A. Stockman et al. / Applied Animal Behaviour Science 143 (2013) 18– 30 27
Fig. 1. Example of a word map of consensus profile for Generalised Procrustes Analysis (GPA) dimensions 1 and 2 for one observer viewing cattle from(a) Experiment 1: the flooring treatment experiment (G-NG: grip vs. non-grip flooring) and (b) Experiment 2: for the driving style experiment (C-SS:continuous vs. stop-start driving).
13 = 15.09, P < 0.001) than cattle on G flooring; howeverthere were no treatment effects on GPA dimensions 2 (F1,13 = 0.261, P = 0.619) and 3 (F1, 13 = 0.163, P = 0.694).
3.1.3. Correlation of physiology to behavioural expressionWBC (R = -0.403) and neutrophil count (R = -0.520)
were negatively correlated with GPA dimension 1, whileneutrophil: lymphocyte ratio was positively correlated(R = 0.517) with GPA dimension 1. Therefore WBC andneutrophil count were lower while neutrophil: lympho-cyte ratio was higher in cattle assessed as more ‘agitated’,
‘restless’ and ‘anxious’ (but less ‘calm’, ‘comfortable’ and‘relaxed’).
3.2. Experiment 2: continuous vs. stop-start driving style
3.2.1. PhysiologyA summary of the raw values, results of R-M ANOVA and
correlation with GPA dimension scores is given in Table 4.A significant treatment × time interaction was found for
mean and maximum Tcore, with an elevation over timewhich were greater during SS driving compared with thesame animals exposed to C driving.
Fig. 2. Positions of individual cattle (represented by numbers) on Generalised Procrustes Analysis dimensions 1 and 2 obtained from Qualitative BehaviouralAssessment. Each animal (numbers are individual ID codes) is represented twice on each graph, once for each experimental transport event, where thedatum position indicates its scores on each GPA axis. (a) Experiment 1: flooring treatment experiment (G: grip flooring open circles and NG: non-gripflooring closed circles), and (b) Experiment 2: driving style experiment (C: continuous driving open circles and SS: stop-start driving closed circles).

Author's personal copy
28 Catherine.A. Stockman et al. / Applied Animal Behaviour Science 143 (2013) 18– 30
Being transported (i.e. a significant time effect: beforetransport vs. after transport) resulted in a decrease inmonocyte count, and �-hydroxy butyrate concentration, aswell as an increase in WBC, neutrophil count, neutrophil:lymphocyte ratio and Tcore (note that, with the exceptionof prolactin, which decreased in response to NG transport,the same responses were observed for Experiment 1).
3.2.2. Qualitative Behavioural AssessmentThe Procrustes Statistic generated for GPA analy-
sis of the C-SS treatments (39.4%) differed significantly(t99 = 43.95, P < 0.001) from a mean randomised profile(32.1 ± 0.2%). Three main GPA dimensions were identified,explaining a total of 58.2% of the variation between animals(Table 2).
Terms with the strongest correlation with each of theGPA dimensions are shown in Table 2. For GPA dimension1, low values were associated with terms such as ‘calm’,‘relaxed’ and ‘comfortable’ and high values with terms suchas ‘restless’, ‘agitated’ and ‘scared’. For GPA dimension 2,low values were associated with terms such as ‘curious’,‘interested’ and ‘inquisitive’ and high values with termssuch as ‘stressed’, ‘tense’ and ‘alert’. For GPA dimension3, low values were associated with terms such as ‘calm’,‘bored’ and ‘intrigued’ and high values with terms such as‘stressed’, ‘agitated’ and ‘afraid’.
The positions of individual cattle on the first two GPAdimensions are shown in Fig. 2b. Cattle exposed to SSdriving scored significantly greater values on GPA dimen-sion 1 (F1, 13 = 12.63, P < 0.001) and smaller values on GPAdimension 2 (F1, 13 = 5.01, P < 0.05) than cattle exposed to Cdriving; however, there were no treatment effects on GPAdimension 3 (F1, 13 = 2.91, P = 0.11).
3.2.3. Correlation of physiology to behavioural expressionNeutrophil count (R = -0.429) was negatively correlated
with GPA dimension 2 and were therefore lower for cat-tle also described as more ‘stressed’, ‘tense’ and ‘alert’ (less‘curious’, ‘interested’ and ‘inquisitive’). Plasma cortisol con-centrations were positively correlated (R = 0.409) with GPAdimension 3 and were therefore greater for cattle assessedas more ‘stressed’, ‘agitated’ and ‘afraid’ (or less ‘calm’,‘bored’ and ‘intrigued’).
4. Discussion
There was consensus between observers in regard totheir assessments of behavioural expression of the cattle inthe flooring treatment (G-NG flooring; Experiment 1) andthe driving style (C-SS driving; Experiment 2) experiments,with the GPA consensus profile explaining just under halfthe variation in scores between the observers. Other stud-ies have similarly found consensus between observersindicating that people see common dimensions of animalbehavioural expression. This has been demonstrated foron-farm qualitative assessments of veal calves followingmilk distribution (Brscic et al., 2009), dairy cows in a loosehousing system (Rousing and Wemelsfelder, 2006) andbeef cattle during road transport (Stockman et al., 2011),as well as for other species [pigs (Rutherford et al., 2012;Temple et al., 2011; Wemelsfelder et al., 2000, 2001, 2009),
horses (Minero et al., 2009; Napolitano et al., 2008), sheep(Wickham et al., 2012), poultry (Wemelsfelder, 2007)and dogs (Walker et al., 2010)]. The consensus betweenobservers is an important aspect of QBA, as it indicatesthat the descriptive terms chosen by each observer gavea coherent basis for scoring the behavioural expressionsof animals and the observers based their assessment oncommonly-perceived and systematically-applied criteria.
There were some significant differences in observerscores between treatments. For Experiment 1, cattleexposed to NG flooring were scored as more ‘agitated’,‘restless’ and ‘anxious’ compared with cattle that had Gflooring (more ‘calm’, ‘comfortable’ and ‘relaxed’ on G-NG GPA dimension 1). These data suggest that the abilityof cattle to balance during road transport influences thebehavioural expression of cattle. These results support pre-vious studies that have recorded altered animal behaviourdepending on how a vehicle is driven: acceleration, bra-king, cornering and vibrations affect the movement of thevehicle and in turn the ability of the animals onboard tomaintain their balance and posture (e.g. Eldridge et al.,1988; Tarrant and Grandin, 2000; Tarrant et al., 1992).For example, sheep experience fewer losses of balance,increased lying behaviour, more rumination and fewerdisturbances when travelling on a motorway journey com-pared with single carriageway driving, most likely due toless acceleration, braking and cornering on a motorway(Cockram et al., 2004).
For Experiment 2, the cattle were scored as more ‘rest-less’, ‘agitated’ and ‘scared’ (C-SS GPA dimension 1) or‘curious’, ‘interested’ and ‘inquisitive’ (C-SS GPA dimension2) when they were filmed during SS driving. By contrast,when they were filmed during the C driving event, cattlewere described as more ‘calm’, ‘relaxed’ and ‘comfortable’(C-SS GPA dimension 1), or more ‘stressed’, ‘tense’ and‘alert’ (C-SS GPA dimension 2). Although the result for GPAdimension 2 may seem counterintuitive, GPA dimension 2had less power of explanation for the variation betweenanimals (16%). It is interesting that ‘alert’ appeared onboth the low value and high value side for dimension 2.Some observers applied this term to cattle that were alsodescribed as highly curious and interested in their sur-roundings whilst others used it to describe cattle that werealso scored highly for the terms stressed and tense. Thissuggests that the term ‘alert’ is not helpful in deciding theoverall welfare status of cattle because its meaning is quiteambiguous and does not clearly indicate a positive or neg-ative welfare state.
We recorded physiological changes in our cattle whichsuggested that they experienced varying degrees of stressin response to the transport treatments. For both exper-iments, transport resulted in a decrease in monocytecount and �-hydroxy butyrate concentration, as well as anincrease in white blood cell count, neutrophil count andneutrophil: lymphocyte ratio. Changes in circulating whiteblood cell values in response to road transport has alsobeen found in cattle in previous studies, as indicated by anincrease in WBC and neutrophils and a decrease in the num-ber of lymphocytes, eosinophils and monocytes (Kent andEwbank, 1983; Schaefer et al., 1997; Tarrant et al., 1992).The response of prolactin was not predicted, given past

Author's personal copy
Catherine.A. Stockman et al. / Applied Animal Behaviour Science 143 (2013) 18– 30 29
studies that have found an increase in prolactin concentra-tion in response to stress (Johke, 1970; Raud et al., 1971);however, it has not been studied in cattle in the context oftransport. In the present study, mean and maximum Tcore
increased in cattle in response to transport. An increase inTcore above the normal range may reflect greater muscu-lar exertion to maintain and regain balance during braking,gear changes and cornering during stop-start driving, sinceanimals standing on four legs have difficulty in dealing withdisturbances such as those caused by swinging around cor-ners or sudden braking (Broom, 2007). They do not leanon other individuals and are significantly disturbed by toomuch movement (Broom, 2007).
Not all physiological variables measured demonstratedsignificant treatment effects. For example, we did notrecord significant treatment effects on cortisol in eitherstudy, this may reflect sampling times (before and after90 min transport, which may miss a potential acute peak incortisol concentration during transport) (see also Wickhamet al., 2012). While there are no treatment effects in thesephysiological measures, individual differences may stillreveal important individual responses that were correlatedwith behavioural expression.
Importantly, aspects of the behavioural expression ofcattle were statistically significantly correlated with phys-iological changes in meaningful ways. For example, WBCand neutrophil counts were depressed while the neu-trophil: lymphocyte ratio was elevated for cattle describedas more ‘agitated’, ‘restless’, and ‘anxious’ (G-NG GPAdimension 1) and neutrophil count was similarly corre-lated with C-SS GPA dimension 2 (being higher for animalsalso scored as more ‘stressed’, ‘tense’ and ‘alert’). Plasmacortisol concentrations were greater in cattle also assessedas more ‘stressed’, ‘agitated’ and ‘afraid’ (C-SS GPA dimen-sion 3). These results suggest that the QBA process detectedbehavioural manifestations of stress in cattle during trans-port. The strength of these correlations may have beenimproved with a greater sample size, which was limiteddue to space on the trailer as well as problems with unre-liable equipment (heart rate monitors).
In summary, QBA appears to be a valid, repeatablemethod of assessing cattle welfare during land trans-port. Firstly, we have demonstrated that observers reachconsensus in how they score the behavioural expressionof cattle, using terms that are semantically consistent.Secondly, the method allows discrimination between treat-ment groups, even when observers are not made aware ofthese treatment groups, indicating that subtle differencesin behavioural expression could be detected. Finally, thebehavioural expression scores are meaningfully correlatedwith various physiological parameters, providing furthersupport for the biological validity of QBA, and for the rele-vance of QBA to animal welfare assessment.
QBA allows whole-animal assessment in an integra-tive sense. It takes into account how an animal interactswith its environment. This is an important considerationin applying the technique across different industry situa-tions. The extension of the present study to commercialconditions is likely to require the establishment of fixedlists of terms appropriate for each context, as has beendone by assessors applying QBA to assess cattle under
various on-farm conditions in Europe (e.g. Brscic et al.,2009). In Australia, it is recommended by industry that‘livestock handlers should have experience in animal hand-ling to ensure welfare of cattle in their charge’ (StandingCommittee on Agricultural and Resource Management,2002). This experience recognises the handlers’ ability toundertake assessment of behavioural expressions of ani-mals in much the same manner as we have quantified in thepresent study. Training assessors in the QBA method couldtherefore formalise and encourage stockmanship skills forboth road transport and other livestock industries. In con-clusion, QBA may be useful as an aid to interpretation ofmore detailed welfare measures, or to highlight situationsthat require more intensive welfare assessment, particu-larly in animal production scenarios where more invasivewelfare assessments are difficult to implement.
Acknowledgements
Thanks to T. Tan from Murdoch University ProductionAnimal Unit for help with surgical procedures and M. Dion-isio and P. McGilchrist for their help during experiments.Thanks to Murdoch University farm staff, Kim Thomas(manager) and Don Hook. Thanks also to Murdoch Univer-sity Veterinary Clinical Pathology and M. Blackberry at theUniversity of Western Australia, School of Animal Biologyfor blood analyses. Thanks to the observers who partici-pated in this study. This study was funded by Meat andLivestock Australia and Meat & Wool New Zealand.
References
Barnes, M.A., Carter, R.E., Longnecker, J.V., Riesen, J.W., Woody, C.O., 1975.Age at transport and calf survival. J. Dairy Sci. 58, 1247.
Beatty, D.T., Barnes, A., Taylor, E., Pethick, D., McCarthy, M., Maloney,S.K., 2006. Physiological responses of Bos taurus and Bos indicus toprolonged, continuous heat and humidity. J. Anim. Sci. 84, 972–985.
Breier, B.H., Gallaher, B.W., Gluckman, P.D., 1991. Radioimmunoassay forinsulin-like growth factor-I: solutions to some potential problems andpitfalls. J. Endocrinol. 128, 347–357.
Broom, D.M., 2007. Causes of poor welfare and welfare assessment duringhandling and transport. In: Grandin, T. (Ed.), Livestock Handling andTransport, CAB International, Wallingford, pp. 30–43.
Brscic, M., Wemelsfelder, F., Tessitore, E., Gottardo, F., Cozzi, G., VanReenen, C.G., 2009. Welfare assessment: correlations and integrationbetween a Qualitative Behavioural Assessment and a clinical/healthprotocol applied in veal calves farms. Proceedings of the 18th NationalCongress ASPA Palermo, Italy. Ital. J. Anim. Sci. 8, 601–603.
Dawkins, M.S., 2003. Behaviour as a tool in the assessment of animalwelfare. Zoology 106, 383–387.
Dijksterhuis, G.B., Heiser, W.J., 1995. The role of permutation tests inexploratory multivariate data analysis. Food Qual. Pref. 6, 263–270.
Eldridge, G.A., Winfield, C.G., Cahill, D.J., 1988. Responses of cattle to differ-ent space allowances, pen sizes and road conditions during transport.Aust. J. Exp. Ag. 28, 155–159.
Grigor, P.N., Cockram, M.S., Steele, W.B., Le Sueur, C.J., Forsyth, R.E.,Guthrie, J.A., Johnson, A.K., Sandilands, V., Reid, H.W., Sinclair, C.,Brown, H.K., 2001. Effects of space allowance during transportand duration of mid-journey lairage period on the physiological,behavioural and immunological responses of young calves during andafter transport. Anim. Sci. 73, 341–360.
Honma, K.-I., von Goetz, C., Aschoff, J., 1983. Effects of restricted dailyfeeding on freerunning circadian rhythms in rats. Physiol. Behav. 30,905–913.
Johke, T., 1970. Factors affecting the plasma prolactin level in the cowand the goat as determined by radioimmunoassay. Endocr. Jap. 17,393–396.
Jones, M., Allison, R., 2007. The ruminant complete blood count – eval-uation and interpretation, CanWest Veterinary Conference, Banff,Alberta.

Author's personal copy
30 Catherine.A. Stockman et al. / Applied Animal Behaviour Science 143 (2013) 18– 30
Kendrick, K.M., 2007. Quality of life and the evolution of the brain. AnimalWelfare 16, 9–15.
Kent, J.E., Ewbank, R., 1983. The effect of road transportation on the bloodconstituents and behaviour of calves. I. Six months old. Brit. Vet. J. 139,228–235.
Knowles, T.G., 1999. A review of the road transport of cattle. Vet. Rec. 144,197–201.
Le Neindre, P., Terlouw, C., Boivin, X., Bossy, A., Lensink, J., 2001.Behavioural research and its application to livestock transport andpolicy: A European perspective. J. Anim. Sci. 76, E159–E165.
Mellor, D.J., 2012. Animal emotions, behaviour and the promotion of pos-itive welfare states. N. Z. Vet. J. 60, 1–8.
Minero, M., Tosi, M.V., Canali, E., Wemelsfelder, F., 2009. Quantitative andqualitative assessment of the response of foals to the presence of anunfamiliar human. Appl. Anim. Behav. Sci. 116, 74–81.
Murata, H., Hirose, H., 1990. Impairment of lymphocyte blastogenesis inroad-transported calves observed with a whole blood culture tech-nique. Jap. J. Vet. Sci. 52, 183–185.
Murata, H., Hirose, H., 1991. Suppression of bovine lymphocyte andmacrophage functions by sera from roadtransported calves. Brit. Vet.J. 147, 455–462.
Napolitano, F., De Rosa, G., Braghieri, A., Grasso, F., Bordi, A., Wemelsfelder,F., 2008. The qualitative assessment of responsiveness to environ-mental challenge in horses and ponies. Appl. Anim. Behav. Sci. 109,342–354.
Piccione, G., Caola, G., 2002. Biological rhythm in livestock. J. Vet. Sci. 3,145–157.
Raud, H.R., Kiddy, C.A., Odell, W.D., 1971. The effect of stress upon thedetermination of serum prolactin by radioimmunoassay. Proc. Soc.Exp. Biol. Med. 136, 689–692.
Rousing, T., Wemelsfelder, F., 2006. Qualitative assessment of socialbehaviour of dairy cows housed in loose housing systems. Appl. Anim.Behav. Sci. 101, 40–53.
Rutherford, K.M.D., Donald, R.D., Lawrence, A.B., Wemelsfelder, F., 2012.Qualitative Behavioural Assessment of emotionality in pigs. Appl.Anim. Behav. Sci. 139, 218–224.
Schaefer, A.L., Jones, S.D., Stanley, R.W., 1997. The use of elec-trolyte solutions for reducing transport stress. J. Anim. Sci. 75,258–265.
Scott-Moncrieff, J.C., Koshko, M.A., Brown, J.A., Hill, K., Refsal, K.R., 2003.Validation of a chemiluminescent enzyme immunometric assay forplasma adrenocorticotropic hormone in the dog. Vet. Clin. Path. 32,180–187.
Standing Committee on Agricultural and Resource Management, 2002.Australian model code of practice for the welfare of animals: landtransport of cattle. In: Publishing, C. (Ed.), SCARM Report, p. 77.
Stockman, C.A., Collins, T., Barnes, A.L., Miller, D., Wickham, S.L., Beatty,D.T., Blache, D., Wemelsfelder, F., Fleming, P.A., 2011. Qualitativebehavioural assessment of cattle naïve and habituated to road trans-port. Anim. Prod. Sci. 51, 240–249.
Sutton, J.R., Casey, J.H., 1975. The adrenocortical response to competitiveathletics in veteran athletes. J. Clin. Endocrinol. Metab. 40, 135–138.
Tarrant, P.V., 1990. Transportation of cattle by road. Appl. Anim. Behav.Sci. 28, 153–170.
Tarrant, P.V., Grandin, T., 2000. Cattle transport. In: Grandin, T. (Ed.),Livestock handling and transport. CAB International, Wallingford, pp.109–126.
Tarrant, P.V., Kenny, F.J., Harrington, D., Murphy, M., 1992. Long distancetransportation of steers to slaughter: effect of stocking density onphysiology, behaviour and carcass quality. Livestock Prod. Sci. 30,223–238.
Temple, D., Manteca, X., Velarde, A., Dalmau, A., 2011. Assessment ofanimal welfare through behavioural parameters in Iberian pigs inintensive and extensive conditions. Appl. Anim. Behav. Sci. 131, 29–39.
Thomas, C.K., Pearson, R.A., 1986. Effects of ambient temperature and headcooling on energy expenditure, food intake and heat tolerance of Brah-man and Brahman × Friesian cattle working on treadmills. Anim. Sci.43, 83–90.
Tindal, J.S., Knaggs, G.S., Hart, I.C., Blake, L.A., 1978. Release of growth hor-mone in lactating and non-lactating goats in relation to behaviour,stages of sleep, electroencephalograms, envrionmental stimuli andlevels of prolactin, insulin, glucose and free fatty acids in the circula-tion. J. Endocrinol. 76, 333–346.
Trunkfield, H.R., Broom, D.M., 1990. The welfare of calves during handlingand transport. Appl. Anim. Behav. Sci. 28, 135–152.
Walker, J., Dale, A., Waran, N., Clarke, N., Farnworth, M., Wemelsfelder, F.,2010. The assessment of emotional expression in dogs using a FreeChoice Profiling methodology. Anim. Welf. 19, 75–84.
Warriss, P.D., Brown, S.N., Knowles, T.G., Kestin, S.C., Edwards, J.E., Dolan,S.K., Phillips, A.J., 1995. Effects on cattle of transport by road for up to15 hours. Vet. Rec. 136, 319–323.
Wemelsfelder, F., 2007. How animals communicate quality of life: thequalitative assessment of behaviour. Anim. Welf. 16, 25–31.
Wemelsfelder, F., Hunter, A.E., Paul, E.S., Lawrence, A.B., 2012. Assessingpig body language: agreement and consistency between pig farmers,veterinarians and animal activists. J. Anim. Sci. 90, 3652–3665.
Wemelsfelder, F., Hunter, E.A., Mendl, M.T., Lawrence, A.B., 2000. Thespontaneous qualitative assessment of behavioural expressions inpigs: first explorations of a novel methodology for integrative animalwelfare measurement. Appl. Anim. Behav. Sci. 67, 193–215.
Wemelsfelder, F., Hunter, T.E.A., Mendl, M.T., Lawrence, A.B., 2001.Assessing the ‘whole animal’: a free choice profiling approach. Anim.Behav. 62, 209–220.
Wemelsfelder, F., Nevison, I., Lawrence, A.B., 2009. The effect ofperceived environmental background on qualitative assessments ofpig behaviour. Anim. Behav. 78, 477–484.
Wemelsfelder, F., Lawrence, A.B., 2001. Qualitative assessment of animalbehaviour as an on-farm welfare-monitoring tool. Acta AgriculturaeScandinavica, Section A: Animal Science Suppl. 30, 21–25.
Wickham, S.L., Collins, T., Barnes, A.L., Miller, D., Beatty, D.T., Stock-man, C., Blache, D., Wemelsfelder, F., Fleming, P.A., 2012. Qualitativebehavioural assessment of transport-naïve and transport-habituatedsheep. J. Anim. Sci. In Press [Epub ahead of print].
Wythes, J.R., 1985. Cattle transportation strategies. Proceedings of the FirstNational Grazing Animal Welfare Symposium. Australian VeterinaryAssociation, Brisbane, Australia.
Yeates, J.W., Main, D.C.J., 2008. Assessment of positive welfare: a review.Vet. J. 175, 293–300.