Embed Size (px)
Citation preview
Full Paper
60
Flow-Induced Morphology of iPP Solidified in aShear Device
Roberto Pantani,* Luigi Balzano, Gerrit W. M. Peters
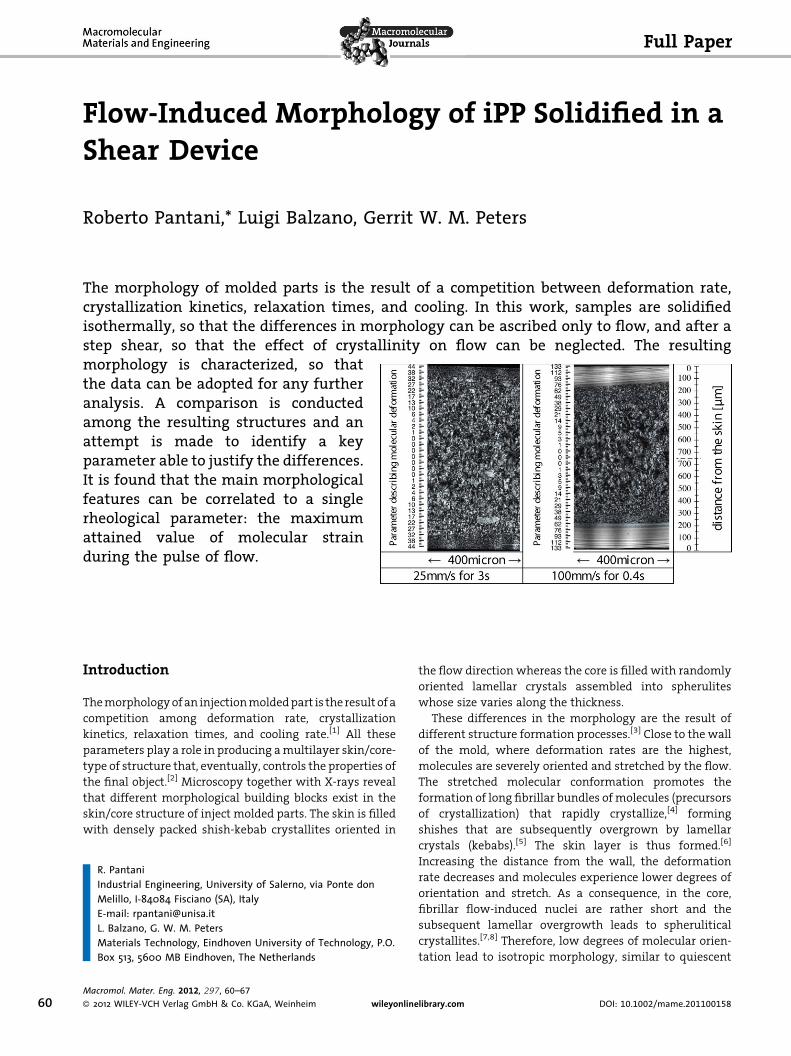
The morphology of molded parts is the result of a competition between deformation rate,crystallization kinetics, relaxation times, and cooling. In this work, samples are solidifiedisothermally, so that the differences in morphology can be ascribed only to flow, and after astep shear, so that the effect of crystallinity on flow can be neglected. The resultingmorphology is characterized, so thatthe data can be adopted for any furtheranalysis. A comparison is conductedamong the resulting structures and anattempt is made to identify a keyparameter able to justify the differences.It is found that the main morphologicalfeatures can be correlated to a singlerheological parameter: the maximumattained value of molecular strainduring the pulse of flow.
Introduction
Themorphologyofan injectionmoldedpart is the resultof a
competition among deformation rate, crystallization
kinetics, relaxation times, and cooling rate.[1] All these
parameters play a role in producing amultilayer skin/core-
type of structure that, eventually, controls the properties of
the final object.[2] Microscopy together with X-rays reveal
that different morphological building blocks exist in the
skin/core structure of inject molded parts. The skin is filled
with densely packed shish-kebab crystallites oriented in
R. PantaniIndustrial Engineering, University of Salerno, via Ponte donMelillo, I-84084 Fisciano (SA), ItalyE-mail: [email protected]. Balzano, G. W. M. PetersMaterials Technology, Eindhoven University of Technology, P.O.Box 513, 5600 MB Eindhoven, The Netherlands
Macromol. Mater. Eng. 2012, 297, 60–67
� 2012 WILEY-VCH Verlag GmbH & Co. KGaA, Weinheim wileyonline
the flow direction whereas the core is filled with randomly
oriented lamellar crystals assembled into spherulites
whose size varies along the thickness.
These differences in the morphology are the result of
different structure formation processes.[3] Close to the wall
of the mold, where deformation rates are the highest,
molecules are severely oriented and stretched by the flow.
The stretched molecular conformation promotes the
formation of long fibrillar bundles ofmolecules (precursors
of crystallization) that rapidly crystallize,[4] forming
shishes that are subsequently overgrown by lamellar
crystals (kebabs).[5] The skin layer is thus formed.[6]
Increasing the distance from the wall, the deformation
rate decreases and molecules experience lower degrees of
orientation and stretch. As a consequence, in the core,
fibrillar flow-induced nuclei are rather short and the
subsequent lamellar overgrowth leads to spherulitical
crystallites.[7,8] Therefore, low degrees of molecular orien-
tation lead to isotropic morphology, similar to quiescent
library.com DOI: 10.1002/mame.201100158
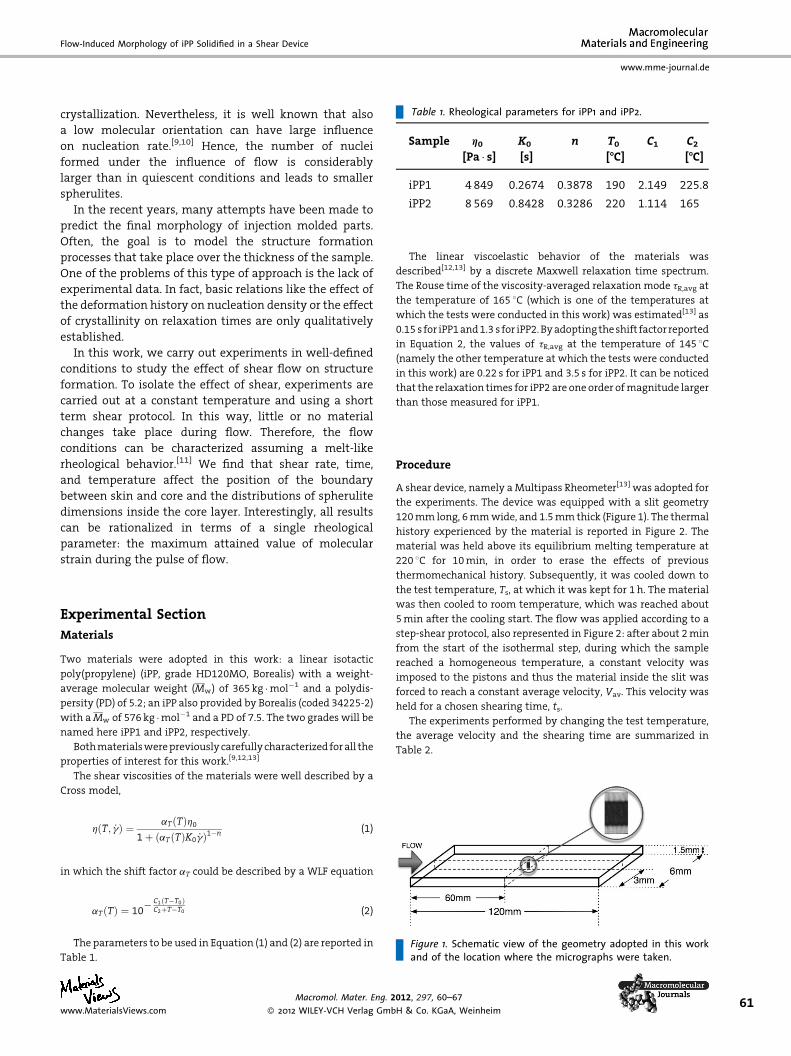
Table 1. Rheological parameters for iPP1 and iPP2.
Sample h0[Pa � s]
K0
[s]
n T0[-C]
C1 C2[-C]
iPP1 4849 0.2674 0.3878 190 2.149 225.8
iPP2 8569 0.8428 0.3286 220 1.114 165
Flow-Induced Morphology of iPP Solidified in a Shear Device
www.mme-journal.de
crystallization. Nevertheless, it is well known that also
a low molecular orientation can have large influence
on nucleation rate.[9,10] Hence, the number of nuclei
formed under the influence of flow is considerably
larger than in quiescent conditions and leads to smaller
spherulites.
In the recent years, many attempts have been made to
predict the final morphology of injection molded parts.
Often, the goal is to model the structure formation
processes that take place over the thickness of the sample.
One of the problems of this type of approach is the lack of
experimental data. In fact, basic relations like the effect of
the deformation history on nucleation density or the effect
of crystallinity on relaxation times are only qualitatively
established.
In this work, we carry out experiments in well-defined
conditions to study the effect of shear flow on structure
formation. To isolate the effect of shear, experiments are
carried out at a constant temperature and using a short
term shear protocol. In this way, little or no material
changes take place during flow. Therefore, the flow
conditions can be characterized assuming a melt-like
rheological behavior.[11] We find that shear rate, time,
and temperature affect the position of the boundary
between skin and core and the distributions of spherulite
dimensions inside the core layer. Interestingly, all results
can be rationalized in terms of a single rheological
parameter: the maximum attained value of molecular
strain during the pulse of flow.
Experimental Section
Materials
Two materials were adopted in this work: a linear isotactic
poly(propylene) (iPP, grade HD120MO, Borealis) with a weight-
average molecular weight (Mw) of 365kg �mol�1 and a polydis-
persity (PD) of 5.2; an iPP also provided by Borealis (coded 34225-2)
with aMw of 576 kg �mol�1 and a PD of 7.5. The two grades will be
named here iPP1 and iPP2, respectively.
Bothmaterialswerepreviouslycarefullycharacterized forall the
properties of interest for this work.[9,12,13]
The shear viscosities of the materials were well described by a
Cross model,
www.M
h T; _gð Þ ¼ aT Tð Þh01þ aT Tð ÞK0 _gð Þ1�n (1)
in which the shift factor aT could be described by a WLF equation
aT Tð Þ ¼ 10� C1 T�T0ð Þ
C2þT�T0 (2)
Figure 1. Schematic view of the geometry adopted in this workand of the location where the micrographs were taken.
The parameters to be used in Equation (1) and (2) are reported in
Table 1.
aterialsViews.com
Macromol. Mater. Eng. 2
� 2012 WILEY-VCH Verlag Gmb
The linear viscoelastic behavior of the materials was
described[12,13] by a discrete Maxwell relaxation time spectrum.
The Rouse time of the viscosity-averaged relaxation mode tR,avg at
the temperature of 165 8C (which is one of the temperatures at
which the tests were conducted in this work) was estimated[13] as
0.15 s for iPP1and1.3 s for iPP2.Byadoptingtheshift factor reported
in Equation 2, the values of tR,avg at the temperature of 145 8C(namely the other temperature at which the tests were conducted
in this work) are 0.22 s for iPP1 and 3.5 s for iPP2. It can be noticed
that the relaxation times for iPP2 are one order ofmagnitude larger
than those measured for iPP1.
Procedure
A shear device, namely aMultipass Rheometer[13] was adopted for
the experiments. The device was equipped with a slit geometry
120mm long, 6mmwide, and 1.5mm thick (Figure 1). The thermal
history experienced by the material is reported in Figure 2. The
material was held above its equilibrium melting temperature at
220 8C for 10min, in order to erase the effects of previous
thermomechanical history. Subsequently, it was cooled down to
the test temperature, Ts, at which it was kept for 1 h. The material
was then cooled to room temperature, which was reached about
5min after the cooling start. The flow was applied according to a
step-shear protocol, also represented in Figure 2: after about 2min
from the start of the isothermal step, during which the sample
reached a homogeneous temperature, a constant velocity was
imposed to the pistons and thus the material inside the slit was
forced to reach a constant average velocity, Vav. This velocity was
held for a chosen shearing time, ts.
The experiments performed by changing the test temperature,
the average velocity and the shearing time are summarized in
Table 2.
012, 297, 60–67
H & Co. KGaA, Weinheim61
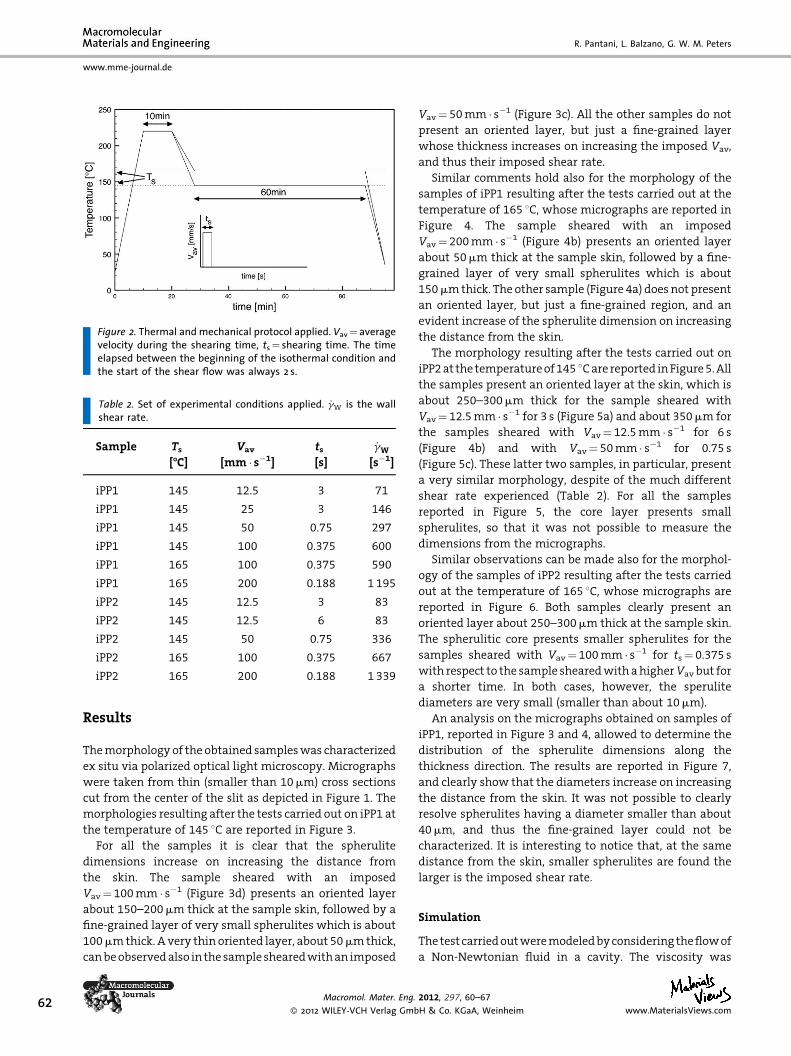
Table 2. Set of experimental conditions applied. _gW is the wallshear rate.
Sample Ts[-C]
Vav
[mm � s�1]
ts[s]
_gW
[s�1]
iPP1 145 12.5 3 71
iPP1 145 25 3 146
iPP1 145 50 0.75 297
iPP1 145 100 0.375 600
iPP1 165 100 0.375 590
iPP1 165 200 0.188 1 195
iPP2 145 12.5 3 83
iPP2 145 12.5 6 83
iPP2 145 50 0.75 336
iPP2 165 100 0.375 667
iPP2 165 200 0.188 1 339
Figure 2. Thermal and mechanical protocol applied. Vav¼ averagevelocity during the shearing time, ts¼ shearing time. The timeelapsed between the beginning of the isothermal condition andthe start of the shear flow was always 2 s.
62
www.mme-journal.de
R. Pantani, L. Balzano, G. W. M. Peters
Results
Themorphology of the obtained sampleswas characterized
ex situ via polarized optical light microscopy. Micrographs
were taken from thin (smaller than 10mm) cross sections
cut from the center of the slit as depicted in Figure 1. The
morphologies resulting after the tests carried out on iPP1 at
the temperature of 145 8C are reported in Figure 3.
For all the samples it is clear that the spherulite
dimensions increase on increasing the distance from
the skin. The sample sheared with an imposed
Vav¼ 100mm � s�1 (Figure 3d) presents an oriented layer
about 150–200mm thick at the sample skin, followed by a
fine-grained layer of very small spherulites which is about
100mmthick. A very thin oriented layer, about 50mmthick,
canbeobservedalso in thesample shearedwithan imposed
Macromol. Mater. Eng.
� 2012 WILEY-VCH Verlag Gmb
Vav¼ 50mm � s�1 (Figure 3c). All the other samples do not
present an oriented layer, but just a fine-grained layer
whose thickness increases on increasing the imposed Vav,
and thus their imposed shear rate.
Similar comments hold also for the morphology of the
samples of iPP1 resulting after the tests carried out at the
temperature of 165 8C, whose micrographs are reported in
Figure 4. The sample sheared with an imposed
Vav¼ 200mm � s�1 (Figure 4b) presents an oriented layer
about 50mm thick at the sample skin, followed by a fine-
grained layer of very small spherulites which is about
150mmthick. The other sample (Figure 4a) doesnot present
an oriented layer, but just a fine-grained region, and an
evident increase of the spherulite dimension on increasing
the distance from the skin.
The morphology resulting after the tests carried out on
iPP2at the temperatureof145 8Care reported inFigure5.All
the samples present an oriented layer at the skin, which is
about 250–300mm thick for the sample sheared with
Vav¼ 12.5mm � s�1 for 3 s (Figure 5a) and about 350mm for
the samples sheared with Vav¼ 12.5mm � s�1 for 6 s
(Figure 4b) and with Vav¼ 50mm � s�1 for 0.75 s
(Figure 5c). These latter two samples, in particular, present
a very similar morphology, despite of the much different
shear rate experienced (Table 2). For all the samples
reported in Figure 5, the core layer presents small
spherulites, so that it was not possible to measure the
dimensions from the micrographs.
Similar observations can be made also for the morphol-
ogy of the samples of iPP2 resulting after the tests carried
out at the temperature of 165 8C, whose micrographs are
reported in Figure 6. Both samples clearly present an
oriented layer about 250–300mm thick at the sample skin.
The spherulitic core presents smaller spherulites for the
samples sheared with Vav¼ 100mm � s�1 for ts¼ 0.375 s
with respect to the sample shearedwithahigherVav but for
a shorter time. In both cases, however, the sperulite
diameters are very small (smaller than about 10mm).
An analysis on the micrographs obtained on samples of
iPP1, reported in Figure 3 and 4, allowed to determine the
distribution of the spherulite dimensions along the
thickness direction. The results are reported in Figure 7,
and clearly show that the diameters increase on increasing
the distance from the skin. It was not possible to clearly
resolve spherulites having a diameter smaller than about
40mm, and thus the fine-grained layer could not be
characterized. It is interesting to notice that, at the same
distance from the skin, smaller spherulites are found the
larger is the imposed shear rate.
Simulation
Thetestcarriedoutweremodeledbyconsidering theflowof
a Non-Newtonian fluid in a cavity. The viscosity was
2012, 297, 60–67
H & Co. KGaA, Weinheim www.MaterialsViews.com
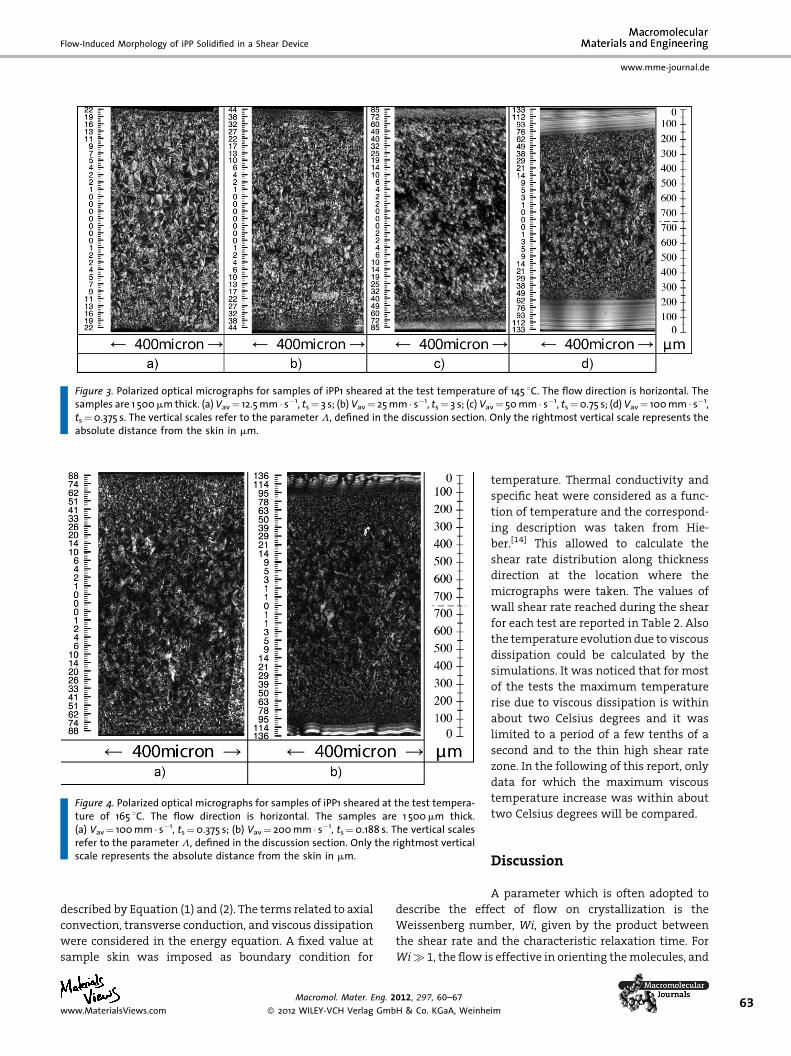
Figure 4. Polarized optical micrographs for samples of iPP1 sheared at the test tempera-ture of 165 8C. The flow direction is horizontal. The samples are 1 500mm thick.(a) Vav¼ 100mm � s�1, ts¼0.375 s; (b) Vav¼ 200mm � s�1, ts¼0.188 s. The vertical scalesrefer to the parameter L, defined in the discussion section. Only the rightmost verticalscale represents the absolute distance from the skin in mm.
Figure 3. Polarized optical micrographs for samples of iPP1 sheared at the test temperature of 145 8C. The flow direction is horizontal. Thesamples are 1 500mmthick. (a)Vav¼ 12.5mm � s�1, ts¼ 3 s; (b) Vav¼ 25mm � s�1, ts¼ 3 s; (c) Vav¼ 50mm � s�1, ts¼0.75 s; (d) Vav¼ 100mm � s�1,ts¼0.375 s. The vertical scales refer to the parameter L, defined in the discussion section. Only the rightmost vertical scale represents theabsolute distance from the skin in mm.
Flow-Induced Morphology of iPP Solidified in a Shear Device
www.mme-journal.de
described by Equation (1) and (2). The terms related to axial
convection, transverse conduction, and viscous dissipation
were considered in the energy equation. A fixed value at
sample skin was imposed as boundary condition for
www.MaterialsViews.com
Macromol. Mater. Eng. 2012, 297, 60–67
� 2012 WILEY-VCH Verlag GmbH & Co. KGaA, Weinhe
temperature. Thermal conductivity and
specific heat were considered as a func-
tion of temperature and the correspond-
ing description was taken from Hie-
ber.[14] This allowed to calculate the
shear rate distribution along thickness
direction at the location where the
micrographs were taken. The values of
wall shear rate reached during the shear
for each test are reported in Table 2. Also
the temperature evolution due to viscous
dissipation could be calculated by the
simulations. It was noticed that for most
of the tests the maximum temperature
rise due to viscous dissipation is within
about two Celsius degrees and it was
limited to a period of a few tenths of a
second and to the thin high shear rate
zone. In the following of this report, only
data for which the maximum viscous
temperature increase was within about
two Celsius degrees will be compared.
Discussion
A parameter which is often adopted to
describe the effect of flow on crystallization is the
Weissenberg number, Wi, given by the product between
the shear rate and the characteristic relaxation time. For
Wi�1, the flow is effective in orienting themolecules, and
im63
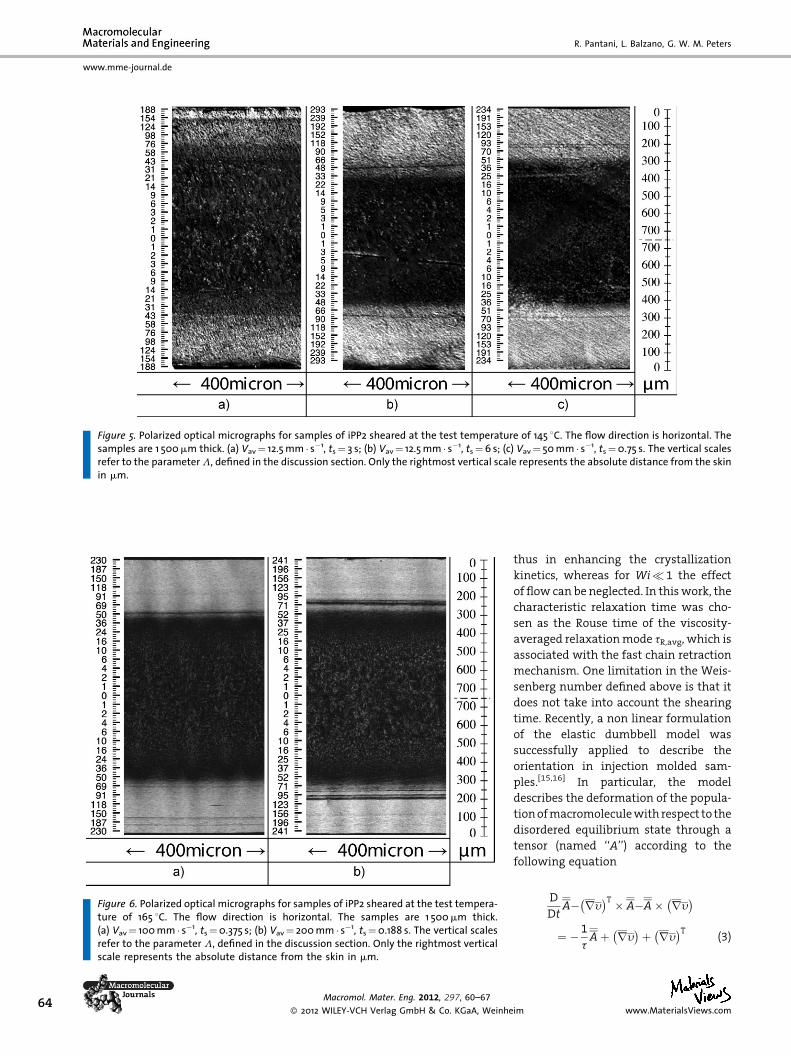
Figure 5. Polarized optical micrographs for samples of iPP2 sheared at the test temperature of 145 8C. The flow direction is horizontal. Thesamples are 1 500mm thick. (a) Vav¼ 12.5mm � s�1, ts¼ 3 s; (b) Vav¼ 12.5mm � s�1, ts¼6 s; (c) Vav¼ 50mm � s�1, ts¼0.75 s. The vertical scalesrefer to the parameterL, defined in the discussion section. Only the rightmost vertical scale represents the absolute distance from the skinin mm.
Figure 6. Polarized optical micrographs for samples of iPP2 sheared at the test tempera-ture of 165 8C. The flow direction is horizontal. The samples are 1 500mm thick.(a) Vav¼ 100mm � s�1, ts¼0.375 s; (b) Vav¼ 200mm � s�1, ts¼0.188 s. The vertical scalesrefer to the parameter L, defined in the discussion section. Only the rightmost verticalscale represents the absolute distance from the skin in mm.
64 Macromol. Mater. Eng. 2012, 297, 60–67
� 2012 WILEY-VCH Verlag GmbH & Co. KGaA, Weinhe
www.mme-journal.de
R. Pantani, L. Balzano, G. W. M. Peters
thus in enhancing the crystallization
kinetics, whereas for Wi� 1 the effect
of flow can be neglected. In thiswork, the
characteristic relaxation time was cho-
sen as the Rouse time of the viscosity-
averaged relaxationmode tR,avg, which is
associated with the fast chain retraction
mechanism. One limitation in the Weis-
senberg number defined above is that it
does not take into account the shearing
time. Recently, a non linear formulation
of the elastic dumbbell model was
successfully applied to describe the
orientation in injection molded sam-
ples.[15,16] In particular, the model
describes the deformation of the popula-
tionofmacromoleculewith respect to the
disordered equilibrium state through a
tensor (named ‘‘A’’) according to the
following equation
im
D
DtA� ry
� �T � A�A� ry� �
¼ � 1
tAþ ry
� �þ ry� �T
(3)
www.MaterialsViews.com
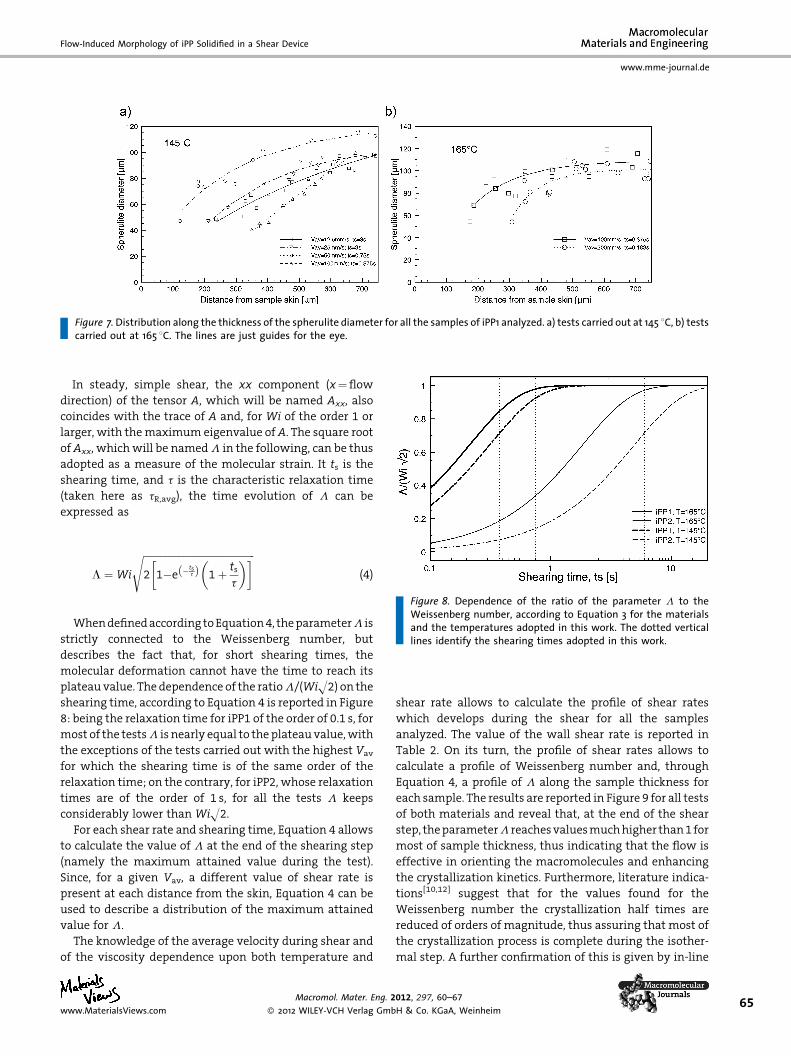
Figure 7.Distribution along the thickness of the spherulite diameter for all the samples of iPP1 analyzed. a) tests carried out at 145 8C, b) testscarried out at 165 8C. The lines are just guides for the eye.
Flow-Induced Morphology of iPP Solidified in a Shear Device
www.mme-journal.de
In steady, simple shear, the xx component (x¼flow
direction) of the tensor A, which will be named Axx, also
coincides with the trace of A and, for Wi of the order 1 or
larger, with themaximum eigenvalue ofA. The square root
ofAxx, whichwill be namedL in the following, can be thus
adopted as a measure of the molecular strain. It ts is the
shearing time, and t is the characteristic relaxation time
(taken here as tR,avg), the time evolution of L can be
expressed as
Figure 8. Dependence of the ratio of the parameter L to theWeissenberg number, according to Equation 3 for the materials
www.M
L ¼ Wi
ffiffiffiffiffiffiffiffiffiffiffiffiffiffiffiffiffiffiffiffiffiffiffiffiffiffiffiffiffiffiffiffiffiffiffiffiffiffiffiffiffiffiffiffiffi2 1�e �ts
tð Þ 1þ tst
� �� �s(4)
and the temperatures adopted in this work. The dotted verticallines identify the shearing times adopted in this work.
Whendefinedaccording toEquation4, theparameterL is
strictly connected to the Weissenberg number, but
describes the fact that, for short shearing times, the
molecular deformation cannot have the time to reach its
plateauvalue. The dependence of the ratioL/(WiH2) on the
shearing time, according to Equation 4 is reported in Figure
8: being the relaxation time for iPP1 of the order of 0.1 s, for
most of the testsL is nearly equal to theplateauvalue,with
the exceptions of the tests carried out with the highest Vav
for which the shearing time is of the same order of the
relaxation time; on the contrary, for iPP2, whose relaxation
times are of the order of 1 s, for all the tests L keeps
considerably lower than WiH2.
For each shear rate and shearing time, Equation 4 allows
to calculate the value of L at the end of the shearing step
(namely the maximum attained value during the test).
Since, for a given Vav, a different value of shear rate is
present at each distance from the skin, Equation 4 can be
used to describe a distribution of the maximum attained
value for L.
The knowledge of the average velocity during shear and
of the viscosity dependence upon both temperature and
aterialsViews.com
Macromol. Mater. Eng. 2
� 2012 WILEY-VCH Verlag Gmb
shear rate allows to calculate the profile of shear rates
which develops during the shear for all the samples
analyzed. The value of the wall shear rate is reported in
Table 2. On its turn, the profile of shear rates allows to
calculate a profile of Weissenberg number and, through
Equation 4, a profile of L along the sample thickness for
each sample. The results are reported in Figure 9 for all tests
of both materials and reveal that, at the end of the shear
step, theparameterL reachesvaluesmuchhigher than1for
most of sample thickness, thus indicating that the flow is
effective in orienting the macromolecules and enhancing
the crystallization kinetics. Furthermore, literature indica-
tions[10,12] suggest that for the values found for the
Weissenberg number the crystallization half times are
reduced of orders of magnitude, thus assuring that most of
the crystallization process is complete during the isother-
mal step. A further confirmation of this is given by in-line
012, 297, 60–67
H & Co. KGaA, Weinheim65
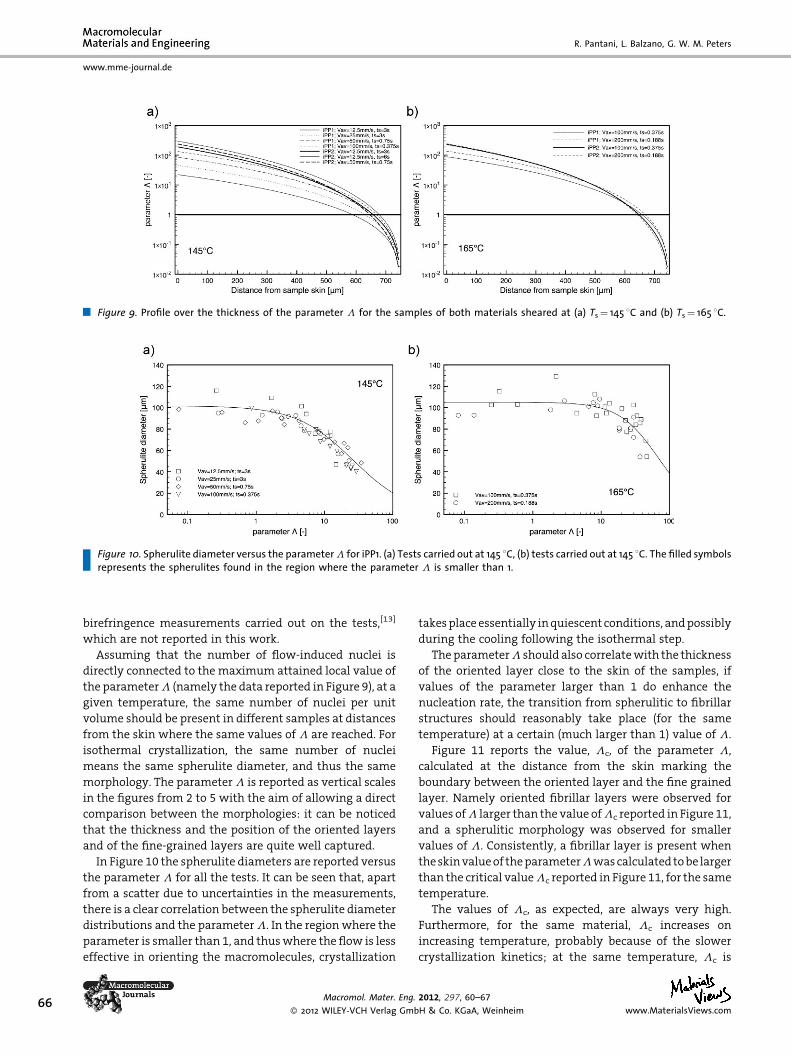
Figure 9. Profile over the thickness of the parameter L for the samples of both materials sheared at (a) Ts¼ 145 8C and (b) Ts¼ 165 8C.
Figure 10. Spherulite diameter versus the parameterL for iPP1. (a) Tests carried out at 145 8C, (b) tests carried out at 145 8C. The filled symbolsrepresents the spherulites found in the region where the parameter L is smaller than 1.
66
www.mme-journal.de
R. Pantani, L. Balzano, G. W. M. Peters
birefringence measurements carried out on the tests,[13]
which are not reported in this work.
Assuming that the number of flow-induced nuclei is
directly connected to the maximum attained local value of
the parameterL (namely the data reported in Figure 9), at a
given temperature, the same number of nuclei per unit
volume should be present in different samples at distances
from the skin where the same values of L are reached. For
isothermal crystallization, the same number of nuclei
means the same spherulite diameter, and thus the same
morphology. The parameterL is reported as vertical scales
in the figures from 2 to 5 with the aim of allowing a direct
comparison between the morphologies: it can be noticed
that the thickness and the position of the oriented layers
and of the fine-grained layers are quite well captured.
In Figure 10 the spherulite diameters are reported versus
the parameter L for all the tests. It can be seen that, apart
from a scatter due to uncertainties in the measurements,
there is a clear correlation between the spherulite diameter
distributions and the parameterL. In the regionwhere the
parameter is smaller than 1, and thuswhere the flow is less
effective in orienting the macromolecules, crystallization
Macromol. Mater. Eng.
� 2012 WILEY-VCH Verlag Gmb
takesplaceessentially inquiescent conditions, andpossibly
during the cooling following the isothermal step.
TheparameterL should also correlatewith the thickness
of the oriented layer close to the skin of the samples, if
values of the parameter larger than 1 do enhance the
nucleation rate, the transition from spherulitic to fibrillar
structures should reasonably take place (for the same
temperature) at a certain (much larger than 1) value of L.
Figure 11 reports the value, Lc, of the parameter L,
calculated at the distance from the skin marking the
boundary between the oriented layer and the fine grained
layer. Namely oriented fibrillar layers were observed for
values ofL larger than the value ofLc reported in Figure 11,
and a spherulitic morphology was observed for smaller
values of L. Consistently, a fibrillar layer is present when
theskinvalueof theparameterLwascalculated tobe larger
than the critical valueLc reported in Figure 11, for the same
temperature.
The values of Lc, as expected, are always very high.
Furthermore, for the same material, Lc increases on
increasing temperature, probably because of the slower
crystallization kinetics; at the same temperature, Lc is
2012, 297, 60–67
H & Co. KGaA, Weinheim www.MaterialsViews.com
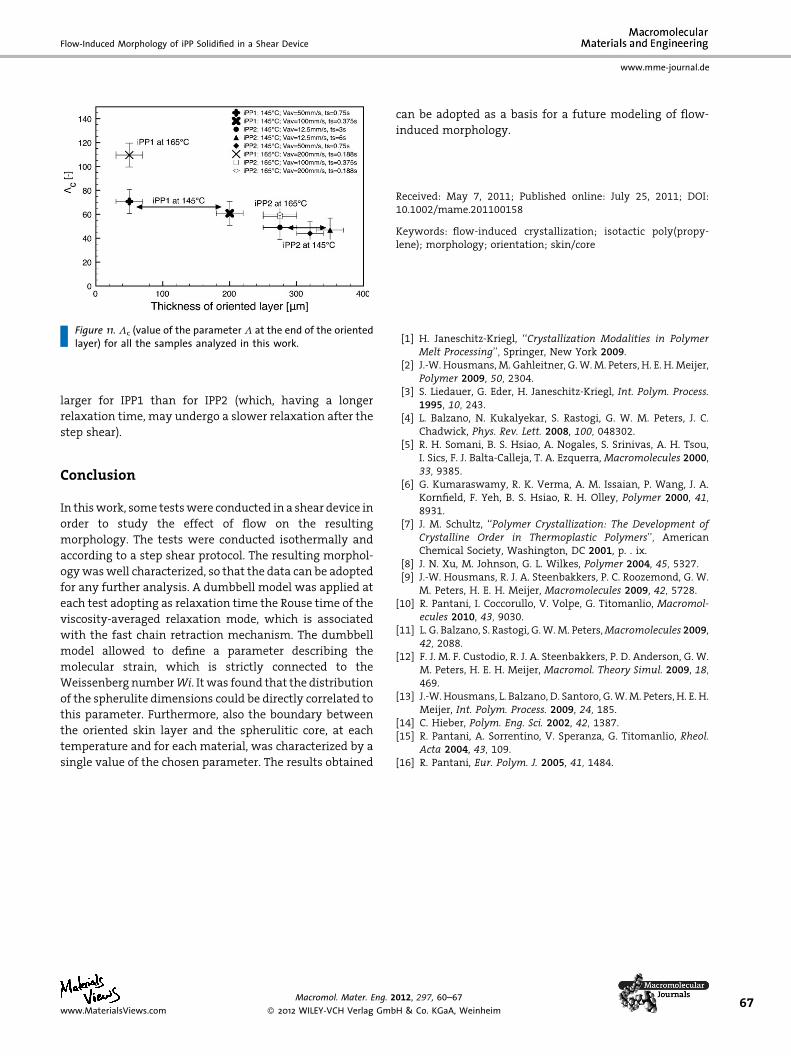
Figure 11.Lc (value of the parameterL at the end of the orientedlayer) for all the samples analyzed in this work.
Flow-Induced Morphology of iPP Solidified in a Shear Device
www.mme-journal.de
larger for IPP1 than for IPP2 (which, having a longer
relaxation time, may undergo a slower relaxation after the
step shear).
Conclusion
In thiswork, some testswere conducted in a shear device in
order to study the effect of flow on the resulting
morphology. The tests were conducted isothermally and
according to a step shear protocol. The resulting morphol-
ogywaswell characterized, so that the data can be adopted
for any further analysis. A dumbbell model was applied at
each test adopting as relaxation time the Rouse time of the
viscosity-averaged relaxation mode, which is associated
with the fast chain retraction mechanism. The dumbbell
model allowed to define a parameter describing the
molecular strain, which is strictly connected to the
Weissenberg numberWi. It was found that the distribution
of the spherulite dimensions could be directly correlated to
this parameter. Furthermore, also the boundary between
the oriented skin layer and the spherulitic core, at each
temperature and for each material, was characterized by a
single value of the chosen parameter. The results obtained
www.MaterialsViews.com
Macromol. Mater. Eng. 2
� 2012 WILEY-VCH Verlag Gmb
can be adopted as a basis for a future modeling of flow-
induced morphology.
Received: May 7, 2011; Published online: July 25, 2011; DOI:10.1002/mame.201100158
Keywords: flow-induced crystallization; isotactic poly(propy-lene); morphology; orientation; skin/core
[1] H. Janeschitz-Kriegl, ‘‘Crystallization Modalities in PolymerMelt Processing’’, Springer, New York 2009.
[2] J.-W. Housmans,M. Gahleitner, G.W.M. Peters, H. E. H.Meijer,Polymer 2009, 50, 2304.
[3] S. Liedauer, G. Eder, H. Janeschitz-Kriegl, Int. Polym. Process.1995, 10, 243.
[4] L. Balzano, N. Kukalyekar, S. Rastogi, G. W. M. Peters, J. C.Chadwick, Phys. Rev. Lett. 2008, 100, 048302.
[5] R. H. Somani, B. S. Hsiao, A. Nogales, S. Srinivas, A. H. Tsou,I. Sics, F. J. Balta-Calleja, T. A. Ezquerra, Macromolecules 2000,33, 9385.
[6] G. Kumaraswamy, R. K. Verma, A. M. Issaian, P. Wang, J. A.Kornfield, F. Yeh, B. S. Hsiao, R. H. Olley, Polymer 2000, 41,8931.
[7] J. M. Schultz, ‘‘Polymer Crystallization: The Development ofCrystalline Order in Thermoplastic Polymers’’, AmericanChemical Society, Washington, DC 2001, p. . ix.
[8] J. N. Xu, M. Johnson, G. L. Wilkes, Polymer 2004, 45, 5327.[9] J.-W. Housmans, R. J. A. Steenbakkers, P. C. Roozemond, G. W.
M. Peters, H. E. H. Meijer, Macromolecules 2009, 42, 5728.[10] R. Pantani, I. Coccorullo, V. Volpe, G. Titomanlio, Macromol-
ecules 2010, 43, 9030.[11] L. G. Balzano, S. Rastogi, G.W.M. Peters,Macromolecules 2009,
42, 2088.[12] F. J. M. F. Custodio, R. J. A. Steenbakkers, P. D. Anderson, G. W.
M. Peters, H. E. H. Meijer, Macromol. Theory Simul. 2009, 18,469.
[13] J.-W. Housmans, L. Balzano, D. Santoro, G.W.M. Peters, H. E. H.Meijer, Int. Polym. Process. 2009, 24, 185.
[14] C. Hieber, Polym. Eng. Sci. 2002, 42, 1387.[15] R. Pantani, A. Sorrentino, V. Speranza, G. Titomanlio, Rheol.
Acta 2004, 43, 109.[16] R. Pantani, Eur. Polym. J. 2005, 41, 1484.
012, 297, 60–67
H & Co. KGaA, Weinheim67


