Embed Size (px)
Citation preview

Ae
PLa
b
Pc
P
a
ARRAA
KVIWEMN
1
ifcdtswbpli
atbsh
0h
Fluid Phase Equilibria 354 (2013) 156–165
Contents lists available at SciVerse ScienceDirect
Fluid Phase Equilibria
journa l h om epage: www.elsev ier .com/ locate / f lu id
new microebulliometer for the measurement of the vapor–liquidquilibrium of ionic liquid systems
edro J. Carvalhoa, Imran Khana, António Moraisa, José F.O. Granjob, Nuno M.C. Oliveirab,uís M.N.B.F. Santosc, João A.P. Coutinhoa,∗
Departamento de Química, CICECO, Universidade de Aveiro, Campus Universitário de Santiago, 3810-193 Aveiro, PortugalDepartamento de Engenharia Química, Faculdade de Ciências e Tecnologia, Universidade de Coimbra, Rua Sílvio Lima – Pólo II, 3030-790 Coimbra,ortugalCentro de Investigac ão em Química, Departamento de Química e Bioquímica, Faculdade de Ciências da Universidade do Porto, Rua do Campo Alegre, 687,-4169-007 Porto, Portugal
r t i c l e i n f o
rticle history:eceived 17 December 2012eceived in revised form 19 April 2013ccepted 11 June 2013vailable online 19 June 2013
a b s t r a c t
Over the last decade ionic liquids appeared as potential entrainers for extractive distillation processes.However experimental vapor–liquid equilibrium data for ionic liquid containing systems is still scarcesince most conventional equilibrium cells are not adequate for these systems. To overcome that limitationa new isobaric microebulliometer, operating at pressures ranging from 0.05 to 0.1 MPa and requiring asample volume lower than 8 mL was developed and validated in this work.
The new apparatus was used to determine isobaric VLE data at pressures of 0.05, 0.07 and
eywords:apor–liquid equilibriumonic liquidsater
thanolicroebulliometer
0.1 MPa for eight binary mixtures of 1-ethyl-3-methylimidazolium chloride ([C2mim][Cl]), 1-butyl-3-methylimidazolium chloride ([C4mim][Cl]), 1-hexyl-3-methylimidazolium chloride ([C6mim][Cl]), andcholine chloride ([N111(2OH)][Cl]) with water and ethanol. The experimental data here measured werecorrelated with the NRTL model.
© 2013 Elsevier B.V. All rights reserved.
RTL. Introduction
Distillation is still the most used separation process in the chem-cal industry and also one of the most energy intensive operations,or which small improvements may turn into large operational andost advantages. One of the most challenging areas in applyingistillation is the separation of azeotropic mixtures. Extractive dis-illation stands as one of the best approaches to deal with theseystems, allowing the entrainer to be kept in the liquid phase fromhere it is later separated in a secondary distillation and, therefore,
e reused. Organic solvents, inorganic salts and hyper-branchedolymers have been investigated as entrainers [1]. Recently, ionic
iquids (ILs) a novel class of solvents have attracted an increasednterest as entrainers for extractive distillation [2].
Ionic liquids (ILs) are salts composed of large organic cationsnd organic or inorganic anions that cannot form an ordered crys-al and thus remain liquid at or near room temperature. They have
een reported to have good entrainer characteristics for azeotropeeparation [3]. Their negligible flammability and vapor pressure,igh thermal stability and solvating capacity for both polar and∗ Corresponding author. Tel.: +351 234 401 507; fax: +351 234 370 084.E-mail address: [email protected] (J.A.P. Coutinho).
378-3812/$ – see front matter © 2013 Elsevier B.V. All rights reserved.ttp://dx.doi.org/10.1016/j.fluid.2013.06.015
non-polar compounds confer them several advantages over otherentrainers. Moreover, the physical and corrosion properties aremore favorable, for separation processes, than those of the com-monly used inorganic molten salts or high-branched polymers[3]. Arlt and co-workers [4] first proposed the use of ionic liq-uids as potential solvents in extractive distillation to separatewater–ethanol mixtures. The authors studied imidazolium-basedILs, with chloride and tetrafluoborate anions, and concluded thatthese solvents are capable of breaking the water–ethanol azeotrope[4]. A recent work by Rebelo’s group [3] reviews the publications onazeotrope breaking using ILs, concluding that imidazolium-basedILs with the chloride anion stands as one of the most promis-ing choices, even over the conventional entrainer, 1,2-ethanediol[4], or even compared with the most overall effective, CaCl2 [3].Nevertheless, and despite the increasing number of publicationsexperimental data is still scarce [5–7], to adequately design orselect the optimal ionic liquid among the 106 potential ILs [8].One major issue that limits the measurement of vapor–liquid equi-librium in systems containing ionic liquids is that the availableequipments, developed for conventional solvents, require a large
sample volume: Wang et al. [9] reported VLE data measured usingan apparatus from Tokyo Rika Kikai Co. with a total volume of500 cm3 of which about 250 cm3 is occupied by the sample; Zhaoet al. [6] used a dual circulation vapor–liquid equilibrium still, with
P.J. Carvalho et al. / Fluid Phase Equilibria 354 (2013) 156–165 157
F agnet7 on sou1 nt 34
a8ias[aiar
tiae
2
2
iacoioTf
ig. 1. Ebulliometer schematic. 1 – ebulliometer, 2 – aluminum block, 3 – heating/m – vacuum line, 8 – Baratron heated capacitance manometer 728A MKS with tensi0 – thermostat bath (Julabo F25 MC), 11 – computer to data acquisition, 12 – Agile
n approximate total volume of the still of 120 cm3, requiring about0 cm3 of sample; Chen et al. [10] used recirculation VLE still with
nternal volume of about 120 cm3 of which the liquid occupiedbout 100 cm3. The VLE cell used by most researchers on this fielduch as Alvarez et al. [7], Andreatta et al. [11,12] and Calvar et al.5,13,14] is a glass Fischer Labodest equilibrium still that requires
sample volume of circa 35 cm3. Consequently, measurements ofonic liquid systems using these equipments are quite expensivend the high viscosity of the mixtures rich in ionic liquid difficult aegular boiling of the mixture.
To overcome these limitations a new isobaric ebulliometer ableo operate at pressures ranging from 0.05 to 0.1 MPa, and requir-ng a sample volume lower than 8 cm3 was developed, validatednd used to determine vapor–liquid equilibria of eight systems ofthanol/water + chloride-based ILs.
. Experimental
.1. Materials
Four ILs based on the chloride anion, 1-ethyl-3-methylmidazolium chloride ([C2mim][Cl]), 1-butyl-3-methylimidzolium chloride ([C4mim][Cl]), 1-hexyl-3-methylimidazoliumhloride ([C6mim][Cl]), and 2-hydroxy-N,N,N-trimethylammnium chloride ([N111(2OH)][Cl], a.k.a. choline chloride), were used
n this study. The 1-alkyl-3-methylimidazolium chloride ILs werebtained from Io·li·tec with mass fraction purities higher than 98%.he 2-hydroxy-N,N,N-trimethylammonium chloride was obtainedrom Sigma–Aldrich with mass fraction purity higher than 99%. Toic stirrer plate with a Pt1000 probe, 4, 5 – Pt100 probes, 6 – sampling/injection port,rce, 9 – Büchi® vacuum system with a V-700 vacuum pump and V-850 controller,
970A data acquisition/switch unit.
reduce to negligible values both water and volatile compounds,high vacuum (10−5 mbar), stirring, and moderate temperature(303 K) for a period of at least 48 h were applied prior to themeasurements. The final IL water content was determined with aMettler Toledo DL32 Karl Fischer coulometer (using the Hydranal– Coulomat E from Riedel-de Haen as analyte), indicating a watermass fraction lower than 30 × 10−6. The purity of each ionic liquidwas further checked by 1H and 13C NMR.
The ethanol used was obtained from Merck with mass fractionpurity higher than 99.8%. Being highly hygroscopic, the ethanolwas kept under low water content through the use of molecularsieves immersed within the compound. Furthermore the ionic liq-uid, prior to use, was kept under low vacuum (10−2 mbar). Thewater used was double distilled and deionized. The decane and p-xylene was obtained from Aldrich and Acros Organics respectively,with mass fraction purity higher than 99.8%.
2.2. Experimental equipment
A new isobaric ebulliometer able to operate at pressures ran-ging from 0.05 up to 0.1 MPa, was designed, assembled and testedin our laboratory. The ebulliometer, schematically presented inFig. 1, is composed by three sections: a glass sample chambercontainer, with a total volume of 8 mL, settled inside of an alu-minum block placed on top of an heating/stirring plate; a glass
condenser, surrounding the top section of the ebulliometer sam-ple chamber, where the temperature is kept constant by meansof a thermostatic bath; a liquid sampling/injection, temperatureprobe and pressure line connections, done by means of vacuum tide
158 P.J. Carvalho et al. / Fluid Phase Equilibria 354 (2013) 156–165
-0.30
-0.20
-0.10
0.00
0.10
0.20
0.30
300 320 340 360 380 400 420 440 460
Dev
ia�o
n/ K
T/K
Water
p-Xylene
Ethanol
Decane
Fig. 2. Average deviations for the boiling temperatures as function of pressure. Experimental boiling temperatures calculated from NIST webbook of Chemistry [21] andD
tgtcttfiamiccmapvactratpibtctt(
lcbtmatfitva
IPPR’s database [22].
eflon sealed ports. Inside the ebulliometer top section a removablelass spiral increases the surface area of the reflux/condenser andhe condenser, placed immediately above the sample chamber andonnected to a thermostatic bath, assure a better condensation ofhe vapor phase generated. Some effort was done in the design ofhis new ebulliometer to have an optimal (low) temperature dif-erence between the evaporation region and the condenser wallsn order to establish a regular reflux with a small energy (heat) bal-nce (low recirculation heat and mass flow). This design strategyakes possible the measurement of the equilibrium temperatures
n conditions of small fractions of volatile component. The cylindri-al aluminum block, with its smooth external wall and the samplehamber placed on its geometrical center, together with the smallagnetic stirrer placed inside the ebulliometer sample chamber
llows good homogenization of the sample concentration and tem-erature. The pressure is controlled and kept constant trough aacuum line, with an internal volume of 5 × 10⁻³ m3, connected to
Büchi V-700 vacuum pump and V-850 pressure monitoring andontroller unit. Pressure measurements are done using a Baratronype capacitance Manometer, MKS model 728A, with temperatureegulation at 100 ◦C to avoid solvent condensation and with anccuracy of 0.5%. The large volume of the vacuum line allows a bet-er pressure regulation. A metallic sealed Pt100 class A temperaturerobe placed in the aluminum block, close to the ebulliometer cav-
ty, is used to measures and control the temperature of the heaterlock. The temperature of the liquid phase inside the ebulliome-er is measured by means of a fast response glass sealed Pt100lass 1/10, calibrated previously against a calibrated platinum resis-ance thermometer, SPRT100 (Fluke-Hart Scientific 1529 Chub-E4),raceable to the National Institute of Standards and TechnologyNIST), with an uncertainty less than 2 × 10⁻².
A mixture rich in ethanol or water is introduced inside the ebul-iometer sample chamber and allowed to reach equilibrium, withonstant and smooth boiling. Once the equilibrium is reached, theoiling temperature is measured, the liquid phase sampled andhe mixture composition determined through an Anton Paar Abbe-
at 500 Refractometer, with an uncertainty of 2 × 10⁻⁵ nD, using calibration curve previously established. This procedure allowshe determination of the sample composition within ±0.001 molraction. Subsequently, fixed amounts of IL, water or ethanol are
ntroduced into the ebulliometer, to change the mixture composi-ion, and the procedure is repeated. The IL is kept under moderateacuum (10−2 mbar) between measurements, to assure no waterbsorption from atmosphere.Since no reference data is available on the literature for thesesystems, and the amount of available data is quite limited, theadequacy of the apparatus to measure this type of systems is hereestablished using the measurements of vapor–liquid equilibriumdata for pure compounds (ethanol, water, p-xylene and decane)covering the temperature range of operation of the equipment andthe binary systems [C4mim][Cl] + H2O, and [C4mim][Cl] + ethanol[5], and [C6mim][Cl] + H2O [15].
3. VLE modeling with the NRTL model
The experimental data gathered was correlated using the NRTLmodel [16] to predict the non-ideal behavior of the liquid phasesolution. This model is based on the local composition concept,to express the effect of the intermolecular forces (short-range) inthe non-randomness of the mixtures, using only binary interac-tion parameters that are estimated from experimental data. Foreach binary molecular pair i–j, the model has three parameters –two interaction parameters �gij and �gji and the non-randomnessparameter ˛ij (˛ij = ˛ji). The expressions for the excess Gibbsenergy (gE) and the logarithm of the activity coefficient (ln �i) givenby the NRTL model can be written as [17]:
gE
RT=
nc∑i
xi ln �i =nc∑i
xiLi
Mi(1)
ln �i = Li
Mi+
nc∑j
xjGij
Mj
(�ij − Lj
Mj
)(2)
Li =nc∑k
xk�kiGki (3)
Mi =nc∑k
xkGki (4)
Gij = e−˛ij�ij (5)
�ij = (gij − gii) = �gij, i /= j and �ij = 0, i = j (6)
RT RT
here i, j, k ∈ {1, 2, 3} represent the different molecular species inthe mixture (1 – water, 2 – ethanol, 3 – IL), nc corresponds to thenumber of components and xi refers to molar fractions.

P.J. Carvalho et al. / Fluid Phase Equilibria 354 (2013) 156–165 159
Table 1Vapor–liquid equilibrium data for the [C2mim][Cl] + H2O system at 0.1, 0.07 and 0.05 MPa.a
xH2O T (K) �H2O xH2O T (K) �H2O xH2O T (K) �H2O xH2O T (K) �H2O xH2O T (K) �H2O xH2O T (K) �H2O
0.1 MPa 0.07 MPa 0.05 MPa
0.998 373.66 0.970 0.749 400.00 0.541 0.998 364.02 0.966 0.780 383.59 0.615 0.998 355.58 0.959 0.806 371.07 0.6610.975 374.88 0.950 0.736 401.71 0.524 0.983 364.72 0.955 0.757 387.45 0.558 0.991 355.66 0.959 0.789 373.68 0.6130.966 375.65 0.934 0.719 404.71 0.490 0.972 365.06 0.952 0.752 388.47 0.544 0.979 356.24 0.951 0.774 375.36 0.5900.955 376.19 0.928 0.713 406.30 0.473 0.955 366.46 0.922 0.746 389.39 0.532 0.970 356.56 0.949 0.756 378.59 0.5390.939 377.52 0.902 0.693 409.47 0.444 0.949 366.67 0.918 0.733 391.36 0.508 0.954 357.69 0.922 0.745 379.47 0.5320.923 378.51 0.885 0.663 414.52 0.402 0.929 368.25 0.886 0.722 393.61 0.480 0.943 358.36 0.906 0.708 385.15 0.4620.909 379.96 0.853 0.654 416.30 0.388 0.907 370.05 0.849 0.713 394.65 0.472 0.927 359.36 0.886 0.698 386.47 0.4490.898 381.12 0.831 0.645 418.65 0.369 0.902 370.30 0.845 0.689 398.79 0.429 0.910 360.94 0.855 0.679 389.51 0.4180.886 382.25 0.811 0.636 419.93 0.361 0.888 371.42 0.825 0.659 403.11 0.393 0.903 361.33 0.849 0.670 391.27 0.4000.868 384.12 0.778 0.625 422.01 0.348 0.877 372.64 0.800 0.651 405.98 0.366 0.892 362.22 0.828 0.653 393.93 0.3770.843 387.10 0.725 0.617 425.00 0.324 0.859 374.55 0.763 0.636 409.01 0.343 0.892 362.22 0.828 0.641 395.61 0.3650.824 389.34 0.689 0.603 426.90 0.315 0.840 376.36 0.732 0.618 413.90 0.307 0.879 363.41 0.801 0.636 397.54 0.3460.813 390.14 0.681 0.592 430.32 0.294 0.832 377.78 0.703 0.598 417.70 0.284 0.866 364.44 0.783 0.618 402.00 0.3100.798 392.58 0.641 0.582 431.99 0.286 0.822 378.36 0.698 0.592 418.77 0.279 0.859 365.26 0.767 0.593 407.18 0.2770.777 394.56 0.618 0.568 435.03 0.271 0.812 379.90 0.670 0.578 421.93 0.263 0.843 367.61 0.713 0.580 409.30 0.2660.763 396.80 0.587 0.793 382.37 0.631 0.826 369.65 0.675
a Standard uncertainties x, T and � are 0.001, 0.02 K and 0.001, respectively.
Table 2Vapor–liquid equilibrium data for the [C4mim][Cl] + H2O system at 0.1, 0.07 and 0.05 MPa.a
xH2O T (K) �H2O xH2O T (K) �H2O xH2O T (K) �H2O xH2O T (K) �H2O xH2O T (K) �H2O xH2O T (K) �H2O
0.1 MPa 0.07 MPa 0.05 MPa
0.988 372.66 1.014 0.762 395.74 0.608 0.985 363.49 0.998 0.766 384.83 0.601 0.988 354.92 0.993 0.769 373.89 0.6260.976 373.55 0.995 0.753 397.15 0.589 0.976 364.38 0.975 0.757 386.57 0.574 0.976 355.92 0.965 0.751 376.21 0.5890.974 374.48 0.965 0.745 397.55 0.588 0.969 364.72 0.969 0.755 386.33 0.581 0.970 356.11 0.965 0.751 376.74 0.5780.970 374.26 0.975 0.729 400.03 0.557 0.969 364.86 0.964 0.730 389.14 0.549 0.969 356.29 0.959 0.730 378.89 0.5530.964 374.67 0.968 0.706 404.19 0.507 0.966 365.21 0.954 0.705 393.19 0.499 0.966 356.50 0.955 0.705 382.70 0.5030.945 374.76 0.983 0.681 408.99 0.457 0.947 365.91 0.949 0.688 396.71 0.458 0.945 357.17 0.949 0.691 386.37 0.4540.921 378.05 0.899 0.666 411.09 0.441 0.922 368.28 0.892 0.649 402.78 0.404 0.923 359.27 0.893 0.684 387.27 0.4450.901 379.17 0.885 0.664 412.40 0.425 0.900 369.76 0.866 0.646 403.13 0.401 0.901 361.06 0.856 0.668 388.50 0.4370.879 380.97 0.853 0.647 415.09 0.405 0.875 371.45 0.838 0.626 405.83 0.382 0.880 362.41 0.834 0.656 391.83 0.4000.866 382.49 0.822 0.628 418.62 0.378 0.863 372.86 0.808 0.620 407.62 0.366 0.867 363.72 0.804 0.651 391.99 0.4010.842 385.00 0.777 0.625 420.09 0.365 0.841 375.23 0.762 0.605 410.88 0.341 0.844 365.28 0.778 0.635 393.77 0.3890.822 387.31 0.737 0.600 424.54 0.337 0.824 377.32 0.723 0.580 414.97 0.317 0.824 367.83 0.725 0.631 394.72 0.3800.789 391.18 0.678 0.585 429.69 0.302 0.801 380.38 0.669 0.802 370.39 0.679 0.609 399.53 0.3390.779 394.25 0.623 430.10 0.301 0.778 382.72 0.635 0.777 373.30 0.632 0.581 405.02 0.301
a Standard uncertainties x, T and � are 0.001, 0.02 K and 0.001, respectively.
Table 3Vapor–liquid equilibrium data for the [C6mim][Cl] + H2O system at 0.1, 0.07 and 0.05 MPa.a
xH2O T (K) �H2O xH2O T (K) �H2O xH2O T (K) �H2O xH2O T (K) �H2O xH2O T (K) �H2O xH2O T (K) �H2O
0.1 MPa 0.07 MPa 0.05 MPa
0.996 373.13 0.988 0.853 383.08 0.818 0.996 363.46 0.989 0.853 372.29 0.833 0.996 354.64 0.994 0.853 362.87 0.8420.994 373.39 0.983 0.840 384.20 0.800 0.993 363.56 0.986 0.840 373.49 0.810 0.994 354.70 0.994 0.840 363.37 0.8390.991 373.66 0.978 0.836 384.59 0.794 0.991 363.74 0.983 0.829 374.67 0.788 0.991 354.83 0.992 0.832 364.28 0.8180.984 373.79 0.977 0.832 385.09 0.784 0.984 363.90 0.983 0.821 375.61 0.769 0.984 355.02 0.991 0.830 364.89 0.8020.980 374.03 0.973 0.820 386.27 0.765 0.980 364.14 0.978 0.820 375.70 0.768 0.982 355.19 0.986 0.827 365.21 0.7950.976 374.33 0.967 0.813 387.08 0.752 0.975 364.45 0.971 0.819 375.83 0.765 0.975 355.42 0.984 0.806 366.01 0.7920.965 374.57 0.969 0.808 388.02 0.734 0.966 364.86 0.966 0.808 376.32 0.762 0.966 356.03 0.970 0.806 366.09 0.7900.954 375.10 0.963 0.796 389.15 0.718 0.956 365.37 0.957 0.800 377.54 0.738 0.956 356.69 0.955 0.800 366.60 0.7810.945 375.57 0.956 0.787 390.07 0.705 0.949 366.01 0.943 0.786 378.83 0.718 0.950 357.06 0.947 0.786 368.16 0.7500.933 376.13 0.949 0.776 391.17 0.690 0.937 366.49 0.938 0.778 379.36 0.712 0.936 357.43 0.947 0.781 369.03 0.7310.918 377.09 0.933 0.767 392.23 0.675 0.920 367.27 0.927 0.775 380.34 0.692 0.920 357.96 0.944 0.774 369.71 0.7200.912 377.80 0.917 0.758 393.39 0.659 0.912 367.94 0.912 0.761 381.53 0.677 0.912 358.91 0.918 0.761 370.34 0.7160.901 378.60 0.902 0.744 394.83 0.641 0.902 368.70 0.898 0.747 382.80 0.660 0.903 359.94 0.890 0.753 371.27 0.6990.887 379.60 0.885 0.718 397.29 0.615 0.888 369.79 0.875 0.725 384.70 0.639 0.889 360.40 0.888 0.721 374.92 0.6410.879 380.37 0.870 0.694 400.21 0.582 0.880 370.33 0.866 0.699 386.81 0.617 0.881 360.93 0.878 0.702 376.29 0.6270.871 381.25 0.851 0.668 403.25 0.552 0.873 370.95 0.854 0.671 391.39 0.555 0.875 361.50 0.865 0.670 381.29 0.5530.864 381.96 0.838 0.649 405.30 0.534 0.864 371.80 0.837 0.655 393.61 0.530 0.864 361.83 0.865 0.655 383.26 0.530
a Standard uncertainties x, T and � are 0.001, 0.02 K and 0.001, respectively.

160 P.J. Carvalho et al. / Fluid Phase Equilibria 354 (2013) 156–165
Table 4Vapor–liquid equilibrium data for the [N111(2OH)][Cl] + H2O system at 0.1, 0.07 and 0.05 MPa.a
xH2O T (K) �H2O xH2O T (K) �H2O xH2O T (K) �H2O xH2O T (K) �H2O xH2O T (K) �H2O xH2O T (K) �H2O
0.1 MPa 0.07 MPa 0.05 MPa
0.985 372.46 1.021 0.859 381.60 0.854 0.985 363.70 0.991 0.859 372.24 0.829 0.985 355.11 0.984 0.860 363.24 0.8240.985 371.97 1.043 0.806 386.80 0.766 0.982 363.47 1.001 0.809 376.75 0.751 0.982 355.15 0.990 0.810 367.70 0.7400.979 372.93 1.013 0.754 392.77 0.675 0.979 363.69 0.997 0.754 382.62 0.658 0.980 355.93 0.960 0.761 372.65 0.6590.971 373.12 1.014 0.705 398.97 0.595 0.972 364.03 0.992 0.705 388.36 0.582 0.972 355.71 0.978 0.704 378.69 0.5770.955 374.00 0.999 0.670 402.54 0.562 0.959 364.72 0.978 0.670 392.82 0.531 0.959 356.36 0.966 0.671 382.75 0.5270.941 375.08 0.978 0.635 407.78 0.508 0.944 365.71 0.957 0.632 398.47 0.472 0.943 357.19 0.948 0.629 388.91 0.4580.933 376.35 0.942 0.618 410.03 0.490 0.933 366.16 0.954 0.619 399.90 0.462 0.936 357.67 0.940 0.623 389.14 0.4600.923 376.33 0.953 0.614 411.12 0.477 0.924 366.91 0.935 0.612 400.27 0.462 0.924 358.26 0.929 0.619 389.79 0.453
baTdwnm
ep
FT
0.900 378.19 0.917 0.900 368.71 0.899
a Standard uncertainties x, T and � are 0.001, 0.02 K and 0.001, respectively.
Although the NRTL model was not developed to describe theehavior of mixtures containing electrolyte species, it has beenpplied successfully in systems with ionic liquid solutions [5,18,19].his can be explained by the fact that in ILs the ion charge is usuallyisperse and the long-range electrostatic forces are weak comparedith the short-range intermolecular forces (so that they can beeglected). Therefore, in the present work the liquid solutions were
odeled as mixtures of non-dissociated components.Different approaches have been considered for the parameterstimation problem with the NRTL model, to obtain the best set ofarameters that describe the VLE data in systems containing ionic
ig. 3. Temperature–composition diagram of (a) [C2mim][Cl] + water, (b) [C4mim][Cl] + whe dashed lines represent the correlation of the data using the NRTL model.
0.900 359.88 0.895
liquids. In the present work, this task was formulated as the solutionof a nonlinear programming problem (NLP), using the weightednorm of the differences between the solvent (water or ethanol)experimental mole fractions and the values predicted by the modelas the objective function:
minϕ =nt∑
ω e (�g )2 (7)
zl
l l ij
In this equation el(�gij) = xexpl
− xmodl
(�gij), where the super-scripts exp and mod correspond to the solvent experimental and
ater, (c) [C6mim][Cl] + water and (d) [N111(2OH)][Cl]+ water at 0.1, 0.07 and 0.05 MPa.

P.J. Carvalho et al. / Fluid Phase Equilibria 354 (2013) 156–165 161
Table 5Vapor–liquid equilibrium data for the [C2mim][Cl] + Ethanol system at 0.1, 0.07 and 0.05 MPa.a
xEtOH T (K) �EtOH xEtOH T (K) �EtOH xEtOH T (K) �EtOH xEtOH T (K) �EtOH xEtOH T (K) �EtOH xEtOH T (K) �EtOH
0.1 MPa 0.07 MPa 0.05 MPa
0.997 351.10 1.002 0.759 369.56 0.662 0.997 342.66 0.986 0.700 361.14 0.678 0.995 334.80 0.989 0.707 351.22 0.7030.979 351.70 0.996 0.756 369.89 0.659 0.992 342.69 0.990 0.681 361.84 0.680 0.974 335.12 1.000 0.674 353.25 0.6820.966 352.25 0.989 0.739 371.34 0.640 0.959 343.31 0.998 0.669 365.37 0.609 0.959 335.53 0.996 0.666 356.30 0.6130.950 353.07 0.974 0.720 373.03 0.619 0.939 344.05 0.987 0.640 366.33 0.614 0.939 336.07 0.989 0.643 357.71 0.6010.936 353.64 0.967 0.712 375.18 0.583 0.922 344.67 0.980 0.613 369.04 0.584 0.922 336.81 0.979 0.626 360.10 0.5650.915 354.63 0.952 0.680 376.96 0.575 0.899 345.61 0.966 0.594 371.72 0.550 0.899 337.33 0.982 0.611 360.60 0.5690.891 356.24 0.918 0.654 378.99 0.559 0.872 347.14 0.936 0.560 372.53 0.567 0.872 339.07 0.940 0.604 360.13 0.5850.871 357.98 0.879 0.651 381.37 0.520 0.846 348.66 0.908 0.538 373.84 0.564 0.850 340.38 0.910 0.561 363.28 0.5600.862 358.80 0.862 0.610 385.17 0.491 0.810 350.92 0.867 0.529 375.32 0.546 0.843 340.33 0.920 0.553 365.46 0.5260.836 361.07 0.817 0.610 383.87 0.511 0.807 351.30 0.859 0.517 375.97 0.547 0.811 342.63 0.869 0.533 365.88 0.5380.834 360.96 0.823 0.578 388.38 0.469 0.786 353.80 0.798 0.490 378.51 0.529 0.783 345.13 0.812 0.523 368.26 0.5030.813 363.21 0.777 0.564 389.89 0.458 0.763 355.88 0.760 0.468 381.44 0.504 0.763 346.28 0.794 0.512 368.83 0.5030.798 364.46 0.757 0.537 392.85 0.440 0.750 357.97 0.714 0.753 346.88 0.785 0.478 371.58 0.4910.795 365.49 0.731 0.532 392.42 0.450 0.718 358.33 0.736 0.753 346.88 0.7850.784 366.90 0.706 0.706 360.00 0.703 0.728 350.03 0.716
a Standard uncertainties x, T and � are 0.001, 0.02 K and 0.001, respectively.
Table 6Vapor–liquid equilibrium data for the [C4mim][Cl] + ethanol system at 0.1, 0.07 and 0.05 MPa.a
xEtOH T (K) �EtOH xEtOH T (K) �EtOH xEtOH T (K) �EtOH xEtOH T (K) �EtOH xEtOH T (K) �EtOH xEtOH T (K) �EtOH
0.1 MPa 0.07 MPa 0.05 MPa
1.000 351.07 0.999 0.749 368.11 0.706 1.000 342.76 0.980 0.780 357.23 0.707 1.000 335.03 0.972 0.736 354.35 0.5980.983 351.42 1.003 0.734 371.50 0.640 0.983 342.87 0.991 0.776 356.19 0.739 0.983 335.25 0.984 0.711 356.97 0.5600.977 351.51 1.005 0.703 375.06 0.592 0.977 342.83 1.000 0.768 358.07 0.695 0.971 334.77 1.016 0.710 357.22 0.5550.951 352.63 0.986 0.681 378.76 0.541 0.963 343.25 0.997 0.734 362.81 0.610 0.959 335.55 0.997 0.683 359.18 0.5360.944 352.98 0.981 0.673 379.12 0.540 0.955 343.59 0.992 0.714 365.59 0.568 0.931 336.70 0.976 0.673 361.50 0.4990.922 353.72 0.976 0.655 380.76 0.526 0.943 343.97 0.987 0.685 368.88 0.527 0.925 337.33 0.954 0.649 363.33 0.4840.917 353.45 0.992 0.647 382.60 0.502 0.925 345.17 0.959 0.669 369.74 0.522 0.887 339.37 0.910 0.642 364.63 0.4680.886 356.11 0.928 0.625 385.78 0.469 0.897 346.41 0.940 0.654 372.06 0.494 0.886 339.20 0.923 0.617 367.44 0.4420.855 358.54 0.876 0.613 387.01 0.460 0.887 347.36 0.915 0.645 372.93 0.486 0.857 341.51 0.864 0.592 370.22 0.4160.848 358.64 0.881 0.601 390.06 0.427 0.861 348.76 0.891 0.624 376.51 0.445 0.849 341.57 0.869 0.579 372.04 0.3980.829 361.14 0.821 0.571 395.14 0.385 0.856 349.48 0.871 0.596 381.44 0.396 0.826 343.80 0.812 0.557 374.57 0.3800.818 361.25 0.827 0.543 399.20 0.360 0.848 349.56 0.876 0.575 384.38 0.373 0.819 343.56 0.828 0.532 378.17 0.3530.796 364.39 0.758 0.542 399.37 0.359 0.825 352.12 0.814 0.544 389.12 0.339 0.797 346.44 0.758 0.513 381.62 0.328
0 0
ctmamac(bm
TV
0.781 365.12 0.753 0.522 402.03 0.345 0.819 352.01 0.8240.767 367.83 0.696 0.500 405.89 0.323 0.797 354.89 0.756
a Standard uncertainties x, T and � are 0.001, 0.02 K and 0.001, respectively.
alculated mole fraction values, respectively. The summation inhis equation is taken over all VLE data points (l) of each binary
olecular pair (water–IL or ethanol–IL), and ωl is a weight factorssociated with each error term. The objective function ϕ was mini-ized by simultaneous determination of all quantities (parameters
nd model predictions, collectively denoted by z), subjected to
onstraints of VLE (Eq. (7)), the NRTL activity coefficient modelEqs. (1)–(6)), sum of molar fraction restrictions, and magnitudeounds for the model parameters �gij . The ˛ij parameters in theodel were considered constant, with ˛13 = 0.2 and ˛23 = 0.3, asable 7apor–liquid equilibrium data for the [C6mim][Cl] + Ethanol system at 0.1, 0.07 and 0.05 M
xEtOH T (K) �EtOH xEtOH T (K) �EtOH xEtOH T (K) �EtOH xE
0.1 MPa 0.07 MPa
0.991 351.94 0.974 0.750 370.60 0.647 0.993 343.07 0.974 0.0.974 352.21 0.981 0.730 373.20 0.608 0.970 343.26 0.989 0.0.962 352.57 0.978 0.707 376.26 0.566 0.962 343.63 0.981 0.0.949 352.97 0.976 0.682 379.50 0.527 0.950 344.05 0.977 0.0.932 353.90 0.959 0.658 383.21 0.484 0.933 344.87 0.962 0.0.913 354.93 0.941 0.625 388.96 0.425 0.913 345.75 0.949 0.0.884 356.83 0.905 0.605 392.29 0.396 0.883 347.68 0.907 0.0.858 358.79 0.865 0.588 394.60 0.380 0.866 348.82 0.882 0.0.848 359.84 0.842 0.576 396.89 0.363 0.848 349.98 0.860 0.0.822 362.09 0.800 0.550 401.81 0.329 0.823 352.13 0.815 0.0.808 364.19 0.753 0.521 406.86 0.302 0.808 354.04 0.770 0.0.788 366.36 0.714 0.504 411.86 0.272 0.788 356.13 0.729 0.0.767 368.68 0.676 0.769 358.19 0.691
a Standard uncertainties x, T and � are 0.001, 0.02 K and 0.001, respectively.
.519 391.89 0.327 0.779 349.33 0.689 0.482 385.12 0.312
.497 394.68 0.314 0.768 351.05 0.652 0.459 388.33 0.296
suggested by Chapeaux et al. [20]. The weights ωl were consideredto be unitary for all data points available.
4. Results and discussion
4.1. Experimental results
In the absence of reference data for VLE of ionic liquid contain-ing systems the new microebulliometer developed on this workwas validated on the measurement of boiling temperatures of the
Pa.a
tOH T (K) �EtOH xEtOH T (K) �EtOH xEtOH T (K) �EtOH
0.05 MPa
752 360.47 0.649 0.992 335.15 0.980 0.751 351.72 0.648734 362.56 0.615 0.971 335.30 0.991 0.733 354.48 0.596709 365.90 0.566 0.962 335.76 0.981 0.708 357.44 0.551681 369.39 0.521 0.949 336.27 0.972 0.678 359.90 0.525656 372.70 0.481 0.932 336.96 0.960 0.657 363.86 0.468623 377.17 0.435 0.911 337.75 0.953 0.625 367.07 0.440605 381.50 0.389 0.883 339.57 0.906 0.600 371.50 0.392578 385.14 0.363 0.866 340.62 0.885 0.574 375.08 0.362560 389.18 0.330 0.850 341.68 0.863 0.548 379.08 0.333551 391.16 0.316 0.823 343.36 0.830 0.520 381.16 0.328521 395.70 0.291 0.808 345.20 0.784 0.502 385.72 0.292504 399.58 0.268 0.787 347.26 0.740 0.463 389.46 0.283
0.769 349.20 0.700
162 P.J. Carvalho et al. / Fluid Phase Equilibria 354 (2013) 156–165
Table 8Vapor–liquid equilibrium data for the [N111(2OH)][Cl] + ethanol system at 0.1, 0.07 and 0.05 MPa.a
xEtOH T (K) �EtOH xEtOH T (K) �EtOH xEtOH T (K) �EtOH xEtOH T (K) �EtOH xEtOH T (K) �EtOH xEtOH T (K) �EtOH
0.1 MPa 0.07 MPa 0.05 MPa
0.996 351.06 0.999 0.947 352.12 1.009 0.995 342.62 0.989 0.949 343.29 1.011 0.995 334.99 0.982 0.952 335.54 1.0020.995 351.48 0.984 0.947 352.13 1.007 0.989 342.53 1.000 0.947 343.51 1.002 0.989 334.81 0.997 0.949 335.55 1.0070.990 351.21 1.000 0.944 352.69 0.992 0.981 342.66 1.002 0.947 343.37 1.010 0.981 334.88 1.001 0.944 335.80 1.0020.983 351.20 1.009 0.943 352.36 1.006 0.972 343.02 0.998 0.944 343.48 1.006 0.972 335.22 0.998 0.943 335.78 1.0020.972 351.88 0.991 0.940 352.86 0.990 0.966 343.05 1.002 0.942 343.56 1.005 0.965 335.31 0.999 0.939 335.84 1.0030.967 351.62 1.008 0.935 352.89 0.994 0.963 343.19 1.000 0.939 343.87 0.997 0.963 335.52 0.994 0.935 335.86 1.0060.963 351.71 1.010 0.933 352.90 0.995 0.962 343.17 1.002 0.935 343.90 1.001 0.962 335.39 0.996 0.934 335.87 1.0080.956 351.99 1.003 0.931 352.88 0.999 0.956 343.37 0.998 0.931 343.87 1.007 0.956 335.59 0.996 0.931 335.89 1.0120.951 352.17 1.006 0.926 353.06 0.994 0.953 343.27 1.007 0.925 344.03 1.005 0.952 335.61 1.001 0.924 336.00 1.010
6
pcptstldt
[[
F0
0.950 352.16 1.008 0.952 343.56 0.99
a Standard uncertainties x, T and � are 0.001, 0.02 K and 0.001, respectively.
ure compounds ethanol, water, p-xylene and decane, chosen toover the temperature range of operation of the ebulliometer com-rised between 310 and 450 K. At each pressure at least 5 boilingemperatures were measured and the average value and the corre-ponding standard deviation are presented. The deviations againsthe boiling temperatures estimated from the vapor pressure corre-ations reported at NIST Webbook of Chemistry [21] and the DIPPRatabase [22] are shown in Fig. 2. An uncertainty on the boilingemperatures of ±0.1 K was obtained.
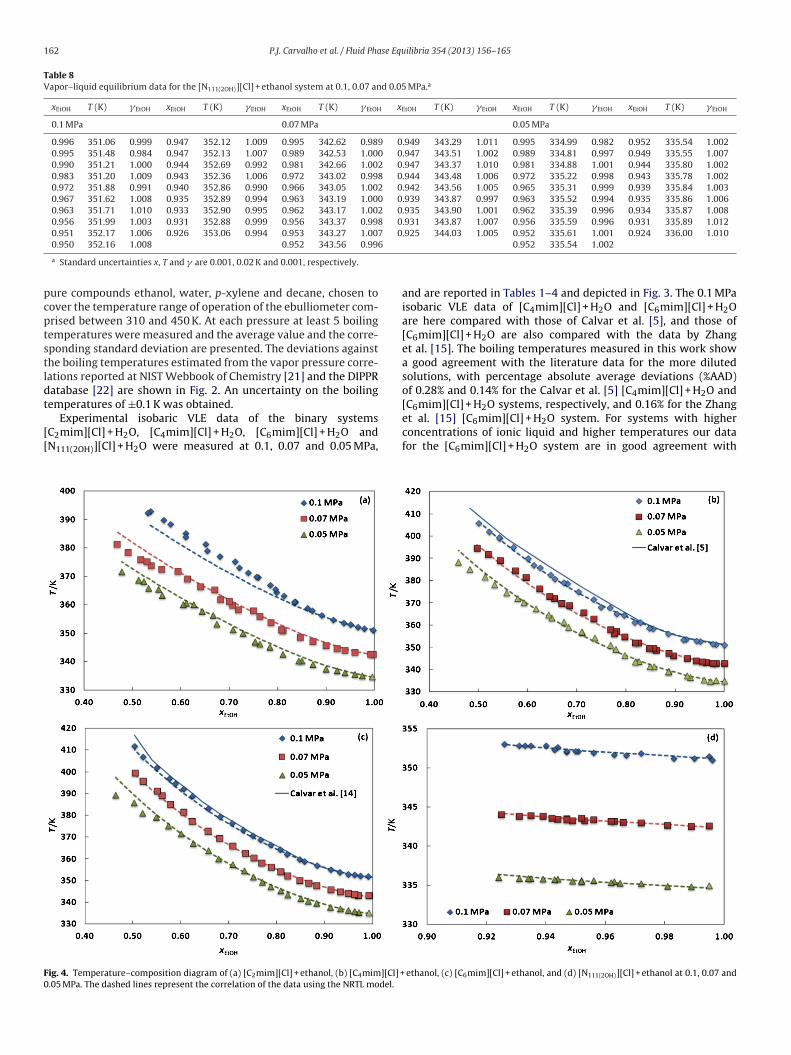
Experimental isobaric VLE data of the binary systemsC2mim][Cl] + H2O, [C4mim][Cl] + H2O, [C6mim][Cl] + H2O andN111(2OH)][Cl] + H2O were measured at 0.1, 0.07 and 0.05 MPa,
ig. 4. Temperature–composition diagram of (a) [C2mim][Cl] + ethanol, (b) [C4mim][Cl] +.05 MPa. The dashed lines represent the correlation of the data using the NRTL model.
0.952 335.54 1.002
and are reported in Tables 1–4 and depicted in Fig. 3. The 0.1 MPaisobaric VLE data of [C4mim][Cl] + H2O and [C6mim][Cl] + H2Oare here compared with those of Calvar et al. [5], and those of[C6mim][Cl] + H2O are also compared with the data by Zhanget al. [15]. The boiling temperatures measured in this work showa good agreement with the literature data for the more dilutedsolutions, with percentage absolute average deviations (%AAD)of 0.28% and 0.14% for the Calvar et al. [5] [C4mim][Cl] + H2O and[C mim][Cl] + H O systems, respectively, and 0.16% for the Zhang
6 2et al. [15] [C6mim][Cl] + H2O system. For systems with higherconcentrations of ionic liquid and higher temperatures our datafor the [C6mim][Cl] + H2O system are in good agreement withethanol, (c) [C6mim][Cl] + ethanol, and (d) [N111(2OH)][Cl] + ethanol at 0.1, 0.07 and

P.J. Carvalho et al. / Fluid Phase Equilibria 354 (2013) 156–165 163
F , [C6m[
tb[sIda
w[[Ab0rAatop
Vowl
ig. 5. Temperature–composition diagram of (a) water + [C2mim][Cl], [C4mim][Cl]N111(2OH)][Cl] at 0.1 MPa.
he data by Zhang et al. [15] but some deviations are observedetween these two sets of data and the data by Calvar et al.5] that for both this system and the [C4mim][Cl] + H2O systemystematically presents higher boiling temperatures for the higherL concentrations. These may be due to overheating of the samplesue to the difficulty to achieve a regular boiling on a large volumepparatus for these concentrated and viscous solutions.
Experimental isobaric VLE data, at 0.1, 0.07 and 0.05 MPa,ere also measured for the systems [C2mim][Cl] + ethanol,
C4mim][Cl] + ethanol, [C6mim][Cl] + ethanol andN111(2OH)][Cl] + Ethanol in the region of complete miscibility.s reported in Tables 5–8 and depicted in Fig. 4, the mixtureoiling temperatures were measured for IL molar fractions up to.35. For the choline chloride its limited miscibility in ethanolestricted the VLE measurements to IL molar fractions below 0.07.lbeit a slight deviation is still observed at high IL concentrations
good agreement between the data reported in this work andhose by Calvar et al. [5] for the system [C6mim][Cl] + ethanol isbserved, with a %AAD of 0.21%. The system [C4mim][Cl] + ethanolresents a %AAD of 0.44%.
An evaluation of the influence of the cation influence on the
LE of the studied systems, presented in Fig. 5, shows some impactf the cation type and alkyl chain length upon the water systemsith lower boiling points occurring with increasing alkyl chainength, that reflects the poorer solvation of these cations with
Fig. 6. Activity coefficients as function of water/ethanol mo
im][Cl]and [N111(2OH)][Cl], (b) ethanol + [C2mim][Cl], [C4mim][Cl], [C6mim][Cl] and
longer chains. Curiously, unlike what is observed for the aqueoussystems, the ethanol + ILs systems present almost no influence ofthe cation that could be related with the no differentiation of thesolvation of the alkyl chain by the ethanol.
To analyze and compare the interactions water-IL with ethanol-IL and evaluate their impact upon the VLE behavior the activitycoefficients of the solvents, water and ethanol, were estimatedusing the following phase equilibrium equation
�i = yiϕip
xiϕ�i
p�i
(8)
where p and p� are the pressure of the system and the saturationvapor pressure of the pure component i at the system temperature,xi and yi represent the mole fractions of component i in the liquidand vapor phases, �i is the fugacity coefficient of component i in thevapor phase, while ϕ�
iis the fugacity coefficient of component i in its
saturated state. The �i and ϕ�i
are very close to unit for the systemsstudied at these low pressures and high temperatures. Since theionic liquid is non-volatile the vapor phase is only composed ofsolvent and therefore yi is equal to one. Thus, the solvent activity
coefficient in solution can be simplified as�i = p
xip�i
(9)
le fractions of the experimental VLE data at 0.1 MPa.

1 se Equ
wac
pnaTtiAeboebtacs
acpbo
64 P.J. Carvalho et al. / Fluid Pha
here subscript i refers to the solvent, water or ethanol. The waternd ethanol pure component saturation vapor pressures, p� , werealculated using correlations obtained from DIPPR’s database [22].
The activity coefficients estimated for the studied systems areresented in Fig. 6. It can be observed that all the systems presentegative deviations to ideality (� < 1), suggesting that the inter-ctions between the ionic liquids and the solvents are favorable.he water + IL systems present activity coefficients that are lowerhan those for ethanol + IL mixtures denoting, thus, more favorablenteractions between the water and the IL than with the ethanol.n almost linear decrease on the activity coefficient of water andthanol with the increase of the ILs mole fraction is observedetween 0.9 and 0.7 mole fraction, in agreement with an increasef the concentration of the ionic liquids and the solvent (water andthanol) that is an indication of a strong specific interaction of 1:1etween the IL and the solvent. It is interesting to suggest thathe decrease of the activity coefficient is pointing out to maximumctivity for a mole fraction around 0.33 (2 ILs:1 H20/ethanol), indi-ating the right molecular ratio between the IL and the (H-bond)olvent.
As expected from the boiling temperatures presented in Fig. 4,nd confirmed by the activity coefficients of Fig. 6, the cholinehloride, albeit presenting favorable interactions with the water,resent interactions clearly less strong than those of imidazolium
ased ionic liquids. This, along with the very high melting pointf this compound and its poor solubility in ethanol suggests thatFig. 7. Activity coefficients for the systems (a) [C2mim][Cl] + H2O, (b) [C6mi
ilibria 354 (2013) 156–165
choline chloride is the worst option, among the ionic liquids studiedon this work, for breaking the ethanol–water azeotrope.
The strong negative deviations to the ideality, with activitycoefficients for equimolar mixtures below 0.5, are not particularfor the systems here reported but can be found in a large numberof isobaric VLE systems containing ionic liquids previously reportedin the literature [3,5,7,14].
An evaluation of the influence of the pressure on the VLE of thestudied systems, presented in Figs. 3 and 4, shows that the pres-sure drop leads to lower boiling points, as would be expected fromEq. (9). Although the boiling points decrease with the pressure,the same behavior is not observed for the activity coefficients. Asdepicted in Fig. 7, the differences between the activity coefficientsat the various pressures are quite small, often within the exper-imental uncertainty, what is in good agreement with the excessvolumes observed for the systems studied.
Relatively to the numerical solution of the NLP problem in Eq.(2), which often leads to multiple local optimal solutions, thiswas implemented in GAMS [21], and tackled using the CONOPT[23] and OQNLP [24] solvers. The computer requirements for theparameter estimation task were of the order of one second of CPUfor CONOPT and were allowed a maximum of 60 CPU minutesfor the runs with the OQNLP solver, on an Intel Xeon 5570 Linuxworkstation. By taking advantage of the multistart feature of the
OQNLP solver, an extensive search for alternative solutions wasperformed within the computation time established. The valuesm][Cl] + H2O, (c) [C4mim][Cl] + Ethanol and (d) [C6mim][Cl] + ethanol.

P.J. Carvalho et al. / Fluid Phase Equ
Table 9NRTL model binary interaction parameters (J mol−1) for the systems: 1 – water, 2 –ethanol and 3 – ionic liquid. ˛13 = 0.2 and ˛23 = 0.3.
Ionic liquid �g13 �g31 �g23 �g32
[C2mim][Cl] −1841.6 −11,871 1366.4 −6543.7[C4mim][Cl] −4666.2 −10,222 −5853.7 −6236.2[C6mim][Cl] 4318.6 −10,435 −7638.2 −6419.8[N111(2OH)][Cl] 3961.8 −10,718 16,113 −9128.3
Table 10Average absolute deviations (%AAD) in water (xH2O)/ethanol (xEtOH) mol fractions forthe systems studied at 0.1, 0.07 and 0.05 MPa.
Ionic liquid p (MPa)
0.1 0.07 0.05
[C2mim][Cl] H2O 0.887 0.921 1.03EtOH 2.77 1.47 1.74
[C4mim][Cl] H2O 0.574 0.464 0.659EtOH 0.615 0.961 1.04
[C6mim][Cl] H2O 0.857 0.520 0.844EtOH 0.613 0.489 0.878
ot
tt(npTbaa
%
fdialhsfc
5
tw
[[
[[
[
[[[
[[[
[
[N111(2OH)][Cl] H2O 0.273 0.241 0.426EtOH 0.640 0.471 0.473
f the local optima solutions found were recorded and sorted byheir quality (decreasing value of �∗).
Table 9 summarizes the best set of values that were found forhe NRTL parameters of the systems under study. The values ofhe residual function � at the optimum varied from 0.1 × 10⁻²
water–[N111(2OH)][Cl] pair) to 7 × 10⁻² (ethanol–[C2mim][Cl]). Theumber of local optima found were comprised between 3 (for theair ethanol–[C2mim][Cl]) and 42 (ethanol–[N111(2OH)][Cl] pair).he solutions delivered by CONOPT corresponded typically to theest local solutions known for each problem. Table 10 lists the aver-ge absolute deviation (AAD%) values in the molar fractions xH2Ond xEtOH defined as
AAD =(
100Np
) Np∑i=1
∣∣xcalc,i − xexp,i
∣∣ (10)
or each water-IL and ethanol-IL binary systems and pressureatasets. In the T–x binary diagrams for the different ionic liquids
n Figs. 1–6, it can be observed that the NRTL model is consistentlyble to provide a good fit of the experimental data. Neverthe-ess, it should be noted that the binary parameter values reportedere were obtained considering only binary data, and consequentlyhould be used with care in extrapolations to ternary systems andor solvent mole fractions outside the regions where they wereorrelated.
. Conclusions
A new microebulliometer for the measurement of the boilingemperatures of ionic liquid systems was developed and validatedith success. It allows the measurement of VLE data for solutions
[
[[
ilibria 354 (2013) 156–165 165
of ionic liquids in volatile solvents using small quantities of ionicliquids.
Boiling temperatures for systems of four chloride containingionic liquids with water and ethanol are reported, with six of thesesystems reported for the first time in the open literature. The resultsshow that the activity coefficients for these systems are temper-ature dependent, suggesting that these systems present positiveexcess enthalpies.
The VLE parameters in the NRTL model for water–IL andethanol–IL binary pairs for four different ionic liquids were esti-mated by minimizing a weighted sum of squared residuals of themolar fractions of the solvent (water or ethanol). A good fit of theexperimental data was obtained, which makes the NRTL modelsuitable to support the preliminary design of extractive distillationschemes, considering these ILs as potential entrainers.
Acknowledgments
The authors are thankful for financial support fromFundac ão para a Ciência e a Tecnologia (Project PTDC/EQU-FTT/102166/2008), Laboratório Associado Centro deInvestigac ão em Materiais Cerâmicos e Compósitos(Project Pest-C/CTM/LA0011/2011), the Doctoral grant(SFRH/BD/64338/2009) of José F.O. Granjo and Post-Doctoralgrants (SFRH/BPD/82264/2011 and SFRH/BPD/76850/2011) ofPedro J. Carvalho and Imran Khan, respectively.
References
[1] M. Seiler, D. Kohler, W. Arlt, Sep. Purif. Technol. 29 (2002) 245–263.[2] Z. Lei, C. Li, B. Chen, Separ. Purif. Rev. 32 (2003) 121–213.[3] A.B. Pereiro, J.M.M. Araújo, J.M.S.S. Esperanc a, I.M. Marrucho, L.P.N. Rebelo, J.
Chem. Thermodyn. 46 (2012) 2–28.[4] M. Seiler, C. Jork, A. Kavarnou, W. Arlt, R. Hirsch, AlChE J. 50 (2004) 2439–2454.[5] N. Calvar, B. González, E. Gómez, Á. Domínguez, J. Chem. Eng. Data 51 (2006)
2178–2181.[6] J. Zhao, C.C. Dong, C.X. Li, H. Meng, Z.H. Wang, Fluid Phase Equilib. 242 (2006)
147–153.[7] V.H. Alvarez, S. Mattedi, M. Aznar, J. Chem. Thermodyn. 43 (2011) 895–900.[8] N.V. Plechkova, K.R. Seddon, Chem. Soc. Rev. 37 (2008) 123–150.[9] J. Wang, D. Zheng, L. Fan, L. Dong, J. Chem. Eng. Data 55 (2010) 2128–2132.10] R. Chen, L. Zhong, C. Xu, J. Chem. Eng. Data 57 (2012) 155–165.11] A.E. Andreatta, M. Francisco, E. Rodil, A. Soto, A. Arce, Fluid Phase Equilib. 300
(2011) 162–171.12] A. Arce, J. Martínez-Ageitos, A. Soto, Fluid Phase Equilib. 122 (1996) 117–129.13] N. Calvar, B.A. González, E. Goımez, A.N. Domiınguez, J. Chem. Eng. Data 54
(2009) 1004–1008.14] N. Calvar, B. González, E. Gómez, A. Domínguez, Fluid Phase Equilib. 259 (2007)
51–56.15] L.Z. Zhang, Y. Ge, D.X. Ji, J.B. Ji, J. Chem. Eng. Data 54 (2009) 2322–2329.16] H. Renon, J.M. Prausnitz, AlChE J. 14 (1968) 135–144.17] J.P. O’Connell, J.M. Haile, Thermodynamics: Fundamentals for Applications,
Cambridge University Press, New York, 2005.18] R. Kato, M. Krummen, J. Gmehling, Fluid Phase Equilib. 224 (2004) 47–54.19] J. Zhao, X.-C. Jiang, C.-X. Li, Z.-H. Wang, Fluid Phase Equilib. 247 (2006) 190–198.20] A. Chapeaux, L.D. Simoni, T.S. Ronan, M.A. Stadtherr, J.F. Brennecke, Green
Chem. 10 (2008) 1301–1306.21] P.J. Linstrom, W.G. Mallard (Eds.), NIST Chemistry WebBook, NIST Standard Ref-
erence Database Number 69, National Institute of Standards and Technology,Gaithersburg, MD, 2012 http://www.webbook.nist.gov
22] DIPPR 801 Thermophysical Property Database and DIADEM Predictive Soft-ware, 2000.
23] A.S. Drud, J. Comput. 6 (1992) 207–216.24] O.a.M.S.D. GAMS Corporation, <http://www.gams.com/dd/docs/solvers/oqnlp.
pdf>, 2010.