Embed Size (px)
Citation preview

Fluorescence Spectroscopic and 19F NMR Studies of Human Thymidylate Synthase with its Cognate RNA
http://www.jbsdonline.com
Abstract
In order to investigate the interaction between hTS protein and its cognate mRNA, a 29nt fragment of TS mRNA was synthesized. This region has been suggested as a putative stem-loop involved in translational autoregulation. The melting temperature of the 29ntRNA was 65 ºC, suggesting that this region does indeed form a stem-loop. Fluorescence spec-troscopy was used to monitor the RNA: hTS protein interaction [dissociation constant (Kd) 3.9 ± 0.8 nM; stoichiometry of binding 1dimeric hTS: 1RNA]. When hTS was ti-trated against FdUMP, this gave the expected stoichiometry of 1dimeric hTS: 1.7 FdUMP but in the presence of the 29ntRNA, the stoichiometry of binding changed to 1dimeric hTS: 1RNA: 1FdUMP. Experiments using methotrexate (MTX) gave a stoichiometry of 1dimeric hTS: 1MTX and in the presence of 29ntRNA, the stoichiometry was unchanged. 19F-NMR spectra of human TS: FdUMP complexes were found to be strikingly similar to analogous NMR spectra of complexes formed by L.casei TS and mouse TS. In the presence of FdUMP, spectra exhibited two additional resonances (-1.50ppm and -34.4ppm). The resonance at -1.50ppm represents non-covalently bound FdUMP, the peak at -34.4ppm rep-resents covalently bound FdUMP. The addition of methotrexate to the binary TS-FdUMP complex caused a displacement of the internal equilibrium, with only the covalently-bound form seen, and with a slightly disturbed 19F chemical shift (-36.5ppm). Similar results were found when MTX was replaced by folinic or folic acid. The addition of 29ntRNA caused no changes to the 19F spectra of either the binary or ternary complexes.
Key words: Human thymidylate synthase; RNA binding; Fluorescence spectroscopy; FdUMP; Methotrexate; 19F NMR
Introduction
The enzyme thymidylate synthase (TS) catalyses the reductive methylation of de-oxyuridine monophosphate (dUMP), using the cofactor methylene tetrahydrofolate (CH2H4F) as a methyl donor. This generates the products deoxythymidine mono-phosphate (dTMP) and dihydrofolic acid (H2F). Because the enzyme is indispens-able for the de novo synthesis of dTMP, it plays an important role in the replication of DNA in actively dividing cells. If the production of dTMP is blocked, then unbalanced growth occurs; whereby protein and RNA continue to be synthesized, but DNA synthesis is inhibited. Eventually the affected cells falter and suffer a thymineless death, largely from irreversible DNA damage and inefficient transcrip-tion. Because the TS cycle plays such an important role in cell division, human thymidylate synthase (hTS) has, for many years, been an attractive target for the development of anticancer drugs (1-4).
However, in addition to its role as a biosynthetic catalyst, it has also been shown that human TS functions as an RNA-binding protein (5-11). This interaction is significant because intracellular levels of hTS protein often increase following treatment with anticancer drugs (leading to drug resistance) and it has been postulated that this may,
Journal of Biomolecular Structure &Dynamics, ISSN 0739-1102Volume 25, Issue Number 3, (2007)©Adenine Press (2007)
Abul Hasnat*
Elena BichenkovaXuan YuJ. R. P. Arnold1
Julie Fisher1
Olga Fedorova2
Julie Andrews
School of Pharmacy and Pharmaceutical SciencesUniversity of ManchesterM13 9PL, UK1School of ChemistryUniversity of LeedsLeeds, LS2 9JT, UK2Institute of Chemical Biology and Fundamental MedicineSB RAS, 8 Lavrentiev Ave.630090, Novosibirsk, Russia
253*Email: [email protected]
254
Hasnat et al.
in part, be due to translational de-repression. In an early hTS protein: mRNA study (using an electrophoretic mobility shift assay), a specific and high affinity interaction between hTS protein and its cognate mRNA was reported (6). In order to locate the binding site on the mRNA more accurately, a series of truncated hTS mRNAs were synthesized and their affinities for hTS protein were determined. A 36nt RNA frag-ment (75-110nt) at the 5ʹ end of the mRNA was found to have an affinity for hTS protein similar to that of full length mRNA and it was proposed that this small frag-ment, containing the AUG start codon as well as a part of the 5ʹ untranslated region (UTR), might have a stem-loop structure. Subsequent studies with a series of control oligonucleotides established the specificity of binding to the sequence 5ʹ GCCAUG 3ʹ, present in the proposed loop portion of the 36nt mRNA fragment. Based on these observations, Chu and Allegra (12) proposed a model of translational autoregulation of hTS, in which the intracellular level of thymidylate synthase was controlled by an autoregulatory mechanism. According to this model, binding of “unliganded” hTS protein (apoenzyme) to this stem loop region would inhibit translation, and prevent further synthesis of hTS protein. Furthermore, it was proposed that this hTS: mRNA interaction would be dependent upon the state of occupancy of the protein, so that if hTS was already occupied either by the physiologic substrates deoxyuridine mo-nophosphate (dUMP) or methylene tetrahydrofolate (CH2H4F), or by the fluorinated nucleotide metabolite 5ʹ-fluoro-2ʹ-deoxyuridine monophosphate (FdUMP), then mRNA binding would no longer be possible. As a result, translational repression would no longer take place, leading to increased intracellular levels of hTS protein. Such a situation would exist in cells exposed to 5ʹ-fluorouracil (5-FU). Thus, the model provided a rational mechanism for the increased level of thymidylate synthase that is often observed following exposure to 5-FU. The hypothesis also provided an alternative explanation as to why cells exposed to 5-FU can often rapidly develop resistance to other TS-directed anticancer agents.
In order to test this hypothesis, we have synthesized a similar, 29nt segment of hTS mRNA (Fig. 1a), containing the proposed hairpin sequence flanking the AUG start codon, and have monitored the hTS: mRNA interaction using both fluores-cence spectroscopy and 19F NMR spectroscopy, in the presence and absence of FdUMP and other ligands.
The fluorescence spectroscopic studies involved the use of two complementary ap-proaches to study this interaction. The first approach involved labeling the terminal 5ʹ-phosphate group of the RNA with fluorescent pyrenyl-1-methylamine group and observing the change in RNA fluorescence in response to the addition of hTS pro-tein (13, 14). The second approach involved monitoring the natural fluorescence of the hTS protein (which contains five tryptophan residues) and observing the change in hTS fluorescence in response to the addition of the RNA. The titration experiments performed with the nucleotide analogue FdUMP and the folate ana-logue methotrexate (MTX) allowed us to calculate dissociation constants for the hTS: RNA complex, as well as the stoichiometry of the hTS: RNA binding, both in the presence and absence of these ligands.
The 19F NMR studies involved observing the formation of binary and ternary com-plexes between human thymidylate synthase and the ligands FdUMP, MTX, folic acid, and folinic acid. Although NMR studies have been published for L.casei TS (15-17) and mouse TS (18), this is the first time that the binding of any ligands with human TS has been reported.
Results
Enzymatic Characterisation of the Human TS Protein
hTS activity and enzyme kinetic parameters were determined using a spectrophoto-metric assay based on the measurement of H2F at 340nm. The observed Kcat value
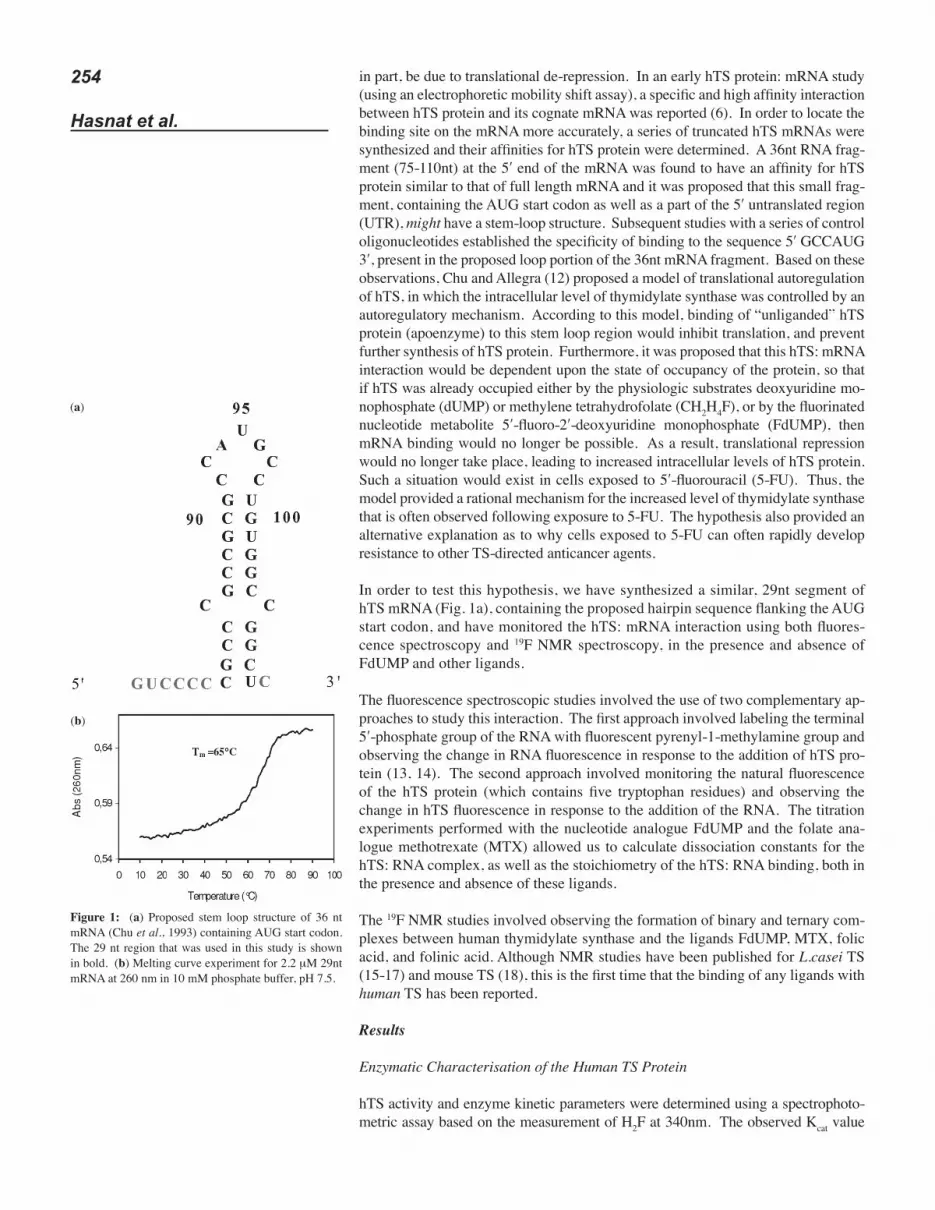
Figure 1: (a) Proposed stem loop structure of 36 nt mRNA (Chu et al., 1993) containing AUG start codon. The 29 nt region that was used in this study is shown in bold. (b) Melting curve experiment for 2.2 μM 29nt mRNA at 260 nm in 10 mM phosphate buffer, pH 7.5.
(a)
(b)

255Human Thymidylate
Synthase and Its Cognate RNA
was found to be 1.46 s-1, which compares favorably with literature values of 1.5-1.6 s-1. The observed Km value of CH2H4F was 7.9 μM, which agrees well with published values in the literature ranging from 6.8-8.4 μM and the Km value for dUMP was 6.5 μM (slightly higher than published values 2.8-4.3 μM) .Based on these results, the quality and activity of the purified enzyme was deemed suitable for further study.
Mass Spectroscopic Characterisation of the Human TS protein
ES-MS of purified His-tagged hTS gave an observed molecular weight which dif-fered by less than 2 Daltons from the expected molecular weight (observed 37,749.9 Da; expected 37,748 Da). Thrombin-cleaved hTS protein (N-terminal His-tag re-moved) gave an observed value of 35,997.0 Da (expected 35,997.2 Da). Tryptic digestions of both His-tagged and thrombin-cleaved hTS samples were carried out and then analysed by MALDI-TOF and MS/MS methodologies. Peptide masses and sequences gave an unambiguous identification as human TS.
Determination of the Tm Value of the 29nt mRNA
Melting curve experiments for free 29nt mRNA produced a sigmoid melting curve with a Tm value of 65 ºC and hyperchromicity of about 18% (Figure 1b). The rela-tively high Tm value suggests an intra-molecular mechanism for the denaturation process. The same Tm value was obtained using a range of concentrations of both phosphate buffer and Tris buffer. The Tm value was found to be independent of RNA concentration (2-50 μM), again suggesting an intra-molecular mechanism of dena-turation. Therefore, it is likely that this region of the mRNA does indeed form an internal stem-loop structure similar to that postulated by Chu et al. (6). Regarding the pyrenyl-modified RNA, it has previously been observed that attachment of mod-ifying groups (e.g., pyrene) at 5ʹ- or 3ʹ terminal phosphate groups does not reduce the hybridization ability of oligonucleotides (18). Therefore, we can assume that the PyRNA will form a similar hairpin structure and will have a similar Tm value.
Specificity of the RNA: Protein Interaction (Electrophorectic Mobility Shift Assay)
When radiolabeled 29 nt mRNA (10 ng) was incubated with different concentrations of hTS and analysed by gel electrophoresis (6) a clear band, corresponding to a retar-dation of a fraction of the radiolabeled RNA was observed. From Figure 2, it can be seen that that both the ammonium sulphate fraction (lane 1) and the purified hTS (lane 2) have strong affinity for 29nt mRNA. No band was observed when 29 nt mRNA was incubated with bovine serum albumin under identical conditions (lane 3).
Specificity of RNA: Protein Interaction (Ultrafiltration Method)
Preliminary experiments showed that the non-specific binding (to cellulose mem-brane and ultrafiltration device) in the absence of protein was sufficiently small (0.2-3.6%) for this technique to be considered viable. The amount of non-specific binding was subtracted from the observed binding values to minimize error. Figure 3 shows that the hTS protein had a high affinity for its cognate 29nt RNA (8.1nM) but much less for the control protein (BSA). Also the hTS protein showed very little binding to the control RNA. The estimates of Kd for the control incubations were all >400nM.
Figure 2: Autoradiograph showing a Gel shift assay of 29 nt mRNA-hTS protein interaction. Lane 1, RNA 10 ng plus 8 μg partially purified hTS in (NH4)2SO4 fraction; Lane 2, RNA 10 ng plus hTS 10 μg; Lane 3, RNA plus BSA 10 μg; Lane 4, RNA plus 5 μl phos-phate buffer (250 mM).

256
Hasnat et al.
Fluorescence Spectroscopy Studies
Titration of PyRNA with hTS Protein
A fixed amount (40 nM) of PyRNA was titrated with increasing concentrations of hTS in EMSA buffer. The EMSA buffer contains 10 mM HEPES (pH 7.4), 40 mM KCl, 3 mM MgCl2, 250 mM 2-mercaptoethanol, and 5% glycerol. This was the same buffer as was used in previous studies (gel electrophoresis mobility shift assays) and has been reported to favor hTS dimer formation (5, 6). The concentra-tion of hTS ranged from 0 to 81 nM in dimer units [hTSdimer] and the temperature was set to 37 ºC. The fluorescence intensity of the solution was recorded at each hTS addition and plotted against hTS concentration (Figure 4a). The excitation and emission wavelengths of PyRNA were 338 nm and 416 nm, respectively. Since the excitation and emission wavelengths of hTS were 281 nm and 338 nm, respec-tively, there was no interference from hTS emission. From Figure 4a, it can be seen that the fluorescence intensity of PyRNA increased with the addition of hTS. This increase in fluorescence has been reported for a range of fluorescently-labeled oligonucleotide probes (25) and the flattening of the curve is consistent with the saturation effect observed at high concentrations of hTS.
Using Equation [8], the stoichiometry of hTS: PyRNA binding was estimated from
the slope of the dependence of (inset Figure 4b). It was
found that slope was 1.06 ± 0.03., i.e., 1 molecule of PyRNA binds to 1 molecule of hTS dimer. The dissociation constant (Kd) can be determined using Equation [11]. In this study, the Kd value was found to be 3.9 ± 0.8 nM (per dimer of hTS). This val-ue is a little higher than the value of 2.6 nM previously reported (5), but we believe the values to be in reasonable agreement, considering that (i) the previous authors used a 36nt RNA fragment and (ii) they used a very different and much less accurate methodology (32P-labeled RNA and electrophoretic gel mobility shift assay).
Titration of hTS by Non-labeled 29nt mRNA
As thymidylate synthase protein is naturally fluorescent, the addition of non-la-beled RNA results in gradual quenching of hTS fluorescence. In this study, the concentration of dimeric hTS was 200 nM and the concentration of non-labeled RNA ranged from 0 to 650 nM.
The concentration of non-labeled RNA against fluorescence intensity was plotted for each addition of RNA to the hTS solution (the concentration of the dimeric form of hTS was used for the calculation) (Figure 5a). Determination of the stoi-chiometry of binding was performed as described above and is shown in Figure 5b (inset). This analysis led to estimation of the slope (n) value ≤ 1.06 ± 0.09, i.e., no more than one RNA molecule interacts with one hTS dimer. The analysis of
Protein : RNA Binding curves
-10
0
10
20
30
40
50
60
70
0 50 100 150 200 250 300 350 400
[Protein] (nM)
RN
A b
ou
nd
(%
)
hTS protein :29nt RNA
BSA protein :29nt RNA
BSA protein:control RNA
hTS protein:control RNAFigure 3: Level of binding (by ultra-filtration) with both protein and RNA controls: (i) hTS protein and the 29nt RNA; (ii) hTS protein and (control) yeast RNA; (iii) BSA (control) protein and 29nt RNA; (iv) BSA (control) protein and (control) yeast RNA.
Figure 4: (a) Determination of dissociation constant (Kd) from the titration of PyRNA with hTS in EMSA buffer at 37 ºC. (b) Stoichiometry of binding from the
slope of the
The concentration of PyRNA is 40 nM and that of hTS ranges from 0 to 80 nM (dimeric).
F – F [hTS]0
F – F [pyRNA]0 py
limpy0
pypy0 vs. .
F – F [hTS]0
F – F [pyRNA]0 py
limpy0
pypy0 vs. .

257Human Thymidylate
Synthase and Its Cognate RNA
the fluorescence curve was performed using Equation [12], which is analogous to Equation [2]. Both the partial fluorescence intensities of free hTS and the complex of hTS, fhTS and f hTS complex, as well as the Kd value were fitted. Calculation of Kd gave a value of 4.8 ± 0.4 nM, which is similar to that calculated for the interaction of PyRNA and hTS (3.9 ± 0.8 nM).
Titration of hTS with FdUMP
In this experiment, hTS was titrated with FdUMP in EMSA buffer. The concentra-tion of dimeric hTS was 301.5 nM and the concentration of the FdUMP ranged from 0 to 2.4 μM. The plot of hTS fluorescence against FdUMP concentration is shown in Figure 6a. Estimation of stoichiometry was as described above and is shown in Figure 6b (inset). It was found that n ≤ 1.7 ± 0.1 showing that, under these condi-tions, each hTS molecule in the dimer can bind FdUMP. These data are consistent with observations by Reilly et al (26) who used rapid chemical quench techniques to show that the enzyme contains two distinct FdUMP binding sites with different affinities. Binding to the first (high affinity site) was rapid (approx. 5 seconds) with a stoichiometry of 1FdUMP: 1 dimeric TS, whereas binding to the second (low af-finity site) was slower and reached a stoichiometry of 1.7 mol of FdUMP per mol dimer. Under the conditions used here we would only expect to see the steady state stoichiometry. The calculation of an approximate Kd value for FdUMP binding was
Figure 5: (a) Determination of dissociation constant (Kd) from the titration of hTS with non-labeled RNA in EMSA buffer at 37 ºC. (b) Stoichiometry of binding
from the slope of The con-
centration of hTS (dimeric) was 200nM and the concen-tration of non-labeled RNA ranged from 0 to 1000nM
F – F [RNA]0
F – F [hTS]0 TS
limTS0
TSTS0 vs. .
Figure 6: (a) Determination of dissociation constant (Kd) value for the titration of hTS with FdUMP in EMSA buffer at 37 ºC. (b) Stoichiometry of binding
from the slope of versus
The concentration of hTS is 300nM (dimeric) and the concentration of [FdUMP] ranges from 0 to 2.4 μM.
F – F [FdUMP]0
F – F [hTS]0 TS
limTS0
TSTS0 vs. .
258
Hasnat et al.
done using Equation [12] and was found to be 129 ± 9 nM. This is a tighter bind-ing than the previously published value of 460 nM (26); however, several studies have indicated that binding of FdUMP to the TS dimer occurs in a biphasic manner and that the second site may possess a higher dissociation constant than the first (27, 28). The calculation of the Kd for FdUMP is also complicated by the fact that a small percentage of the binding (in the first site at least) may also be covalent. However under the conditions used here (short incubations and no cofactor present) the extent of covalent binding is likely to be small.
Titration of hTS with Methotrexate
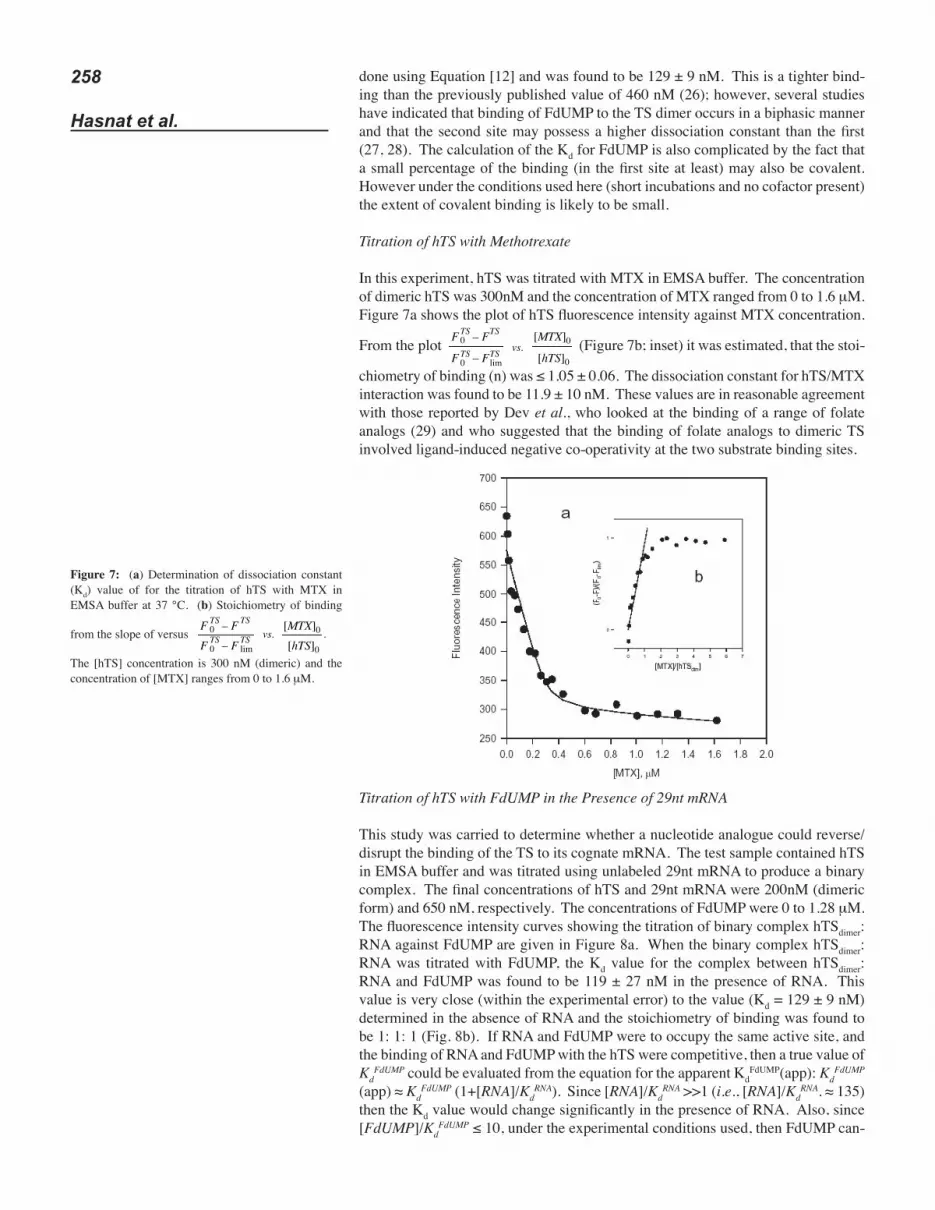
In this experiment, hTS was titrated with MTX in EMSA buffer. The concentration of dimeric hTS was 300nM and the concentration of MTX ranged from 0 to 1.6 μM. Figure 7a shows the plot of hTS fluorescence intensity against MTX concentration.
From the plot (Figure 7b; inset) it was estimated, that the stoi-
chiometry of binding (n) was ≤ 1.05 ± 0.06. The dissociation constant for hTS/MTX interaction was found to be 11.9 ± 10 nM. These values are in reasonable agreement with those reported by Dev et al., who looked at the binding of a range of folate analogs (29) and who suggested that the binding of folate analogs to dimeric TS involved ligand-induced negative co-operativity at the two substrate binding sites.
Titration of hTS with FdUMP in the Presence of 29nt mRNA
This study was carried to determine whether a nucleotide analogue could reverse/disrupt the binding of the TS to its cognate mRNA. The test sample contained hTS in EMSA buffer and was titrated using unlabeled 29nt mRNA to produce a binary complex. The final concentrations of hTS and 29nt mRNA were 200nM (dimeric form) and 650 nM, respectively. The concentrations of FdUMP were 0 to 1.28 μM. The fluorescence intensity curves showing the titration of binary complex hTSdimer: RNA against FdUMP are given in Figure 8a. When the binary complex hTSdimer: RNA was titrated with FdUMP, the Kd value for the complex between hTSdimer: RNA and FdUMP was found to be 119 ± 27 nM in the presence of RNA. This value is very close (within the experimental error) to the value (Kd = 129 ± 9 nM) determined in the absence of RNA and the stoichiometry of binding was found to be 1: 1: 1 (Fig. 8b). If RNA and FdUMP were to occupy the same active site, and the binding of RNA and FdUMP with the hTS were competitive, then a true value of Kd
FdUMP could be evaluated from the equation for the apparent KdFdUMP(app): Kd
FdUMP (app) � Kd
FdUMP (1+[RNA]/KdRNA). Since [RNA]/Kd
RNA >>1 (i.e., [RNA]/KdRNA. ≈ 135)
then the Kd value would change significantly in the presence of RNA. Also, since [FdUMP]/Kd
FdUMP ≤ 10, under the experimental conditions used, then FdUMP can-
F – F [MTX]0
F – F [hTS]0TSlim
TS0
TSTS0
vs.
Figure 7: (a) Determination of dissociation constant (Kd) value of for the titration of hTS with MTX in EMSA buffer at 37 °C. (b) Stoichiometry of binding
from the slope of versus
The [hTS] concentration is 300 nM (dimeric) and the concentration of [MTX] ranges from 0 to 1.6 μM.
F – F [MTX]0
F – F [hTS]0 TS
limTS0
TSTS0 vs. .

259Human Thymidylate
Synthase and Its Cognate RNA
not compete with the RNA for the same binding site, and thus, it binds in an alterna-tive hTS site. It, therefore, seems that even a large excess of FdUMP is unable to displace the RNA from its binding site and so the effect on translational de-repres-sion must be due to the inability of liganded TS to bind to the RNA stem loop, rather than a reversal of the TS:RNA binding by the addition of ligands.
Titration of hTS with Methotrexate in the Presence of RNA
This study was carried out to determine whether a folate analogue could reverse/disrupt the binding of the TS to its cognate mRNA. Non-labeled 29nt mRNA was added to hTSdimer solution in EMSA buffer until fluorescence quenching was com-plete, i.e., the hTSdimer: RNA binary complex was formed. The final concentrations of hTSdimer and RNA were 200nM (dimeric form) and 590nM, respectively. The hTS: RNA complex was then titrated with methotrexate (0.02 to 1.47μM) and the fluorescence value was taken after five minutes of equilibration. When methotrex-ate was added to the hTSdimer: RNA binary complex, it produced further quenching of the hTS fluorescence indicating its binding to the binary complex. Typical fluo-rescence spectra (0.02 to 630 nM MTX) are shown in Figure 9. The dissociation constant (Kd) for hTSdimer: RNA + methotrexate was found to be 11.1 ± 4.9 nM, which is almost identical to that of hTSdimer + methotrexate in the absence of RNA (11.9 ± 10 nM). If RNA and methotrexate were to occupy the same active site, and the binding of RNA and MTX with the hTS were competitive, then a true value of Kd
MTX could be evaluated from the equation for apparent Kd (KdMTX(app)): Kd
MTX (app) � Kd
MTX (1+[RNA]/KdRNA). Since [RNA]/Kd
RNA >>1 (i.e., [RNA]/KdRNA = 122)
and the KdMTX value would change significantly in the presence of RNA. Since
[MTX]/KdMTX changes in the range 1.7-122 during titration, under the experimental
conditions used, then MTX can compete with the RNA for the same binding site only at high concentrations, and thus, it binds in an alternative hTS site. RNA and MTX appear to have similar affinity for hTS (see Table I). Therefore, if RNA and MTX were to compete for the same binding site, Kd
MTX(app) value would be about two times higher than in the absence of RNA. Since Kd
MTX(app) values obtained in the presence and absence of RNA are almost identical, it again lends credence to
Figure 8: (a) A plot for the titration of hTS by FdUMP in presence of non-labeled mRNA. The concentrations of non-labeled RNA and hTS are 650nM and 200nM (dimeric), respectively. (b) Stoichiometry of binding
from the slope of versus
The [hTS] concentration is 300 nM (dimeric) and the concentration of FdUMP ranges from 0 to 1.28 μM.
F – F [MTX]0
F – F [hTS]0 TS
limTS0
TSTS0 vs. .
Figure 9: Titration of hTSdimer with metho-trexate (MTX) in presence of non-labeled RNA. 1 – free hTSdimer (200nM); 2 – hTSdi-mer (200nM) + RNA (590nM) binary com-plex; 3-9 – Typical fluorescence spectra of hTSdimer: RNA binary complex titrated with increasing concentrations of MTX. Where 3 = 20nM, 4 = 45nM, 5 = 68nM, 6 = 102nM, 7 = 303nM, 8 = 523nM, and 9 = 632 nM of MTX, respectively.
Table I Dissociation constants and stoichiometry for the interaction of dimeric hTS with 29 nt mRNA and other ligands (three repetitions).
Type of interaction Stoichiometry of binding
Dissociation constant (Kd), nM ± SD
1 hTS + PyRNA 1:1 3.9 ± 0.8 2 hTS + RNA 1:1 4.8 ± 0.4 3 hTS + FdUMP (no RNA) 1:1.7 129 ± 9 4 hTS:RNA + FdUMP 1:1:1 119 ± 27 5 hTS + MTX (no RNA) 1:1 11.9 ± 10 6 hTS:RNA + MTX 1:1:1 11.1 ± 4.9

260
Hasnat et al.
the notion that the RNA binding site is separate from the binding sites of both the nucleotide (e.g., FdUMP) and folate (e.g., MTX) moieties and that neither ligand can displace the RNA once the TS has already bound.
19F NMR Studies
To our knowledge, the application of NMR methods to a study of the binding of ligands to human TS protein has not previously been reported. The most frequently used method for mapping the interface of a protein-ligand interaction is chemical shift perturbation analysis (30). Its main benefit is the speed of data collection and analysis. Once the structure of a protein is known, surfaces involved in RNA recog-nition can often be determined simply by comparing the NMR spectra of free and li-gand-bound forms of the protein. This technique offers quick insight but exhibits one significant drawback, in that changes in the conformation of the protein upon binding to the ligand can induce chemical shift changes in distal regions of the protein.
Figure 10: 19F NMR spectra of thymidylate synthase-FdUMP binary complexes (A) for mouse TS (Zhang et al., 1991); (B) for L.casei TS (Lewis et al., 1980); and (C) for human TS (this study). Chemical shifts were referenced to free FdUMP at 0 ppm.

261Human Thymidylate
Synthase and Its Cognate RNA
The most convenient NMR technique for the study of TS is to observe the 19F sig-nal of fluorinated ligands bound to the protein. This has been applied to TS from mouse (18) and several microbial sources (15-17, 31, 32). The most convenient 19F signal is that of 5-fluoro-2ʹdeoxyuridine-5ʹ-monophosphate (FdUMP). Figure 10C shows the 19F spectrum of the human TS: FdUMP binary complex, and compares it with the previously published spectra for mouse TS (Fig. 10A) and L.casei TS (Fig. 10B). It can clearly be seen that the spectra are very similar to those previously reported and therefore assignments, which had previously been made for the mouse TS, can readily be transferred to the human TS.
In the binary hTS-FdUMP complex, the 19F spectrum displays a large free FdUMP signal and two smaller signals. Protein bound FdUMP is identified by a broad signal at -1.5ppm for the non-covalent complex, and another smaller signal at -34.4ppm, corresponding to the covalent complex, the latter being a smaller propor-tion. The relatively low intensities of the TS-bound FdUMP signals demonstrate that under the conditions of the acquisition of NMR data (in the absence of cofac-tor) binding of FdUMP to hTS is relatively weak. This weak binding behavior for FdUMP, corresponds closely to what has previously been noted for mouse TS (18), but contrasts with the much tighter binding observed, for example, using fluores-cence under different solution conditions. In our case, this weak binding was not altered by changing the buffer (to phosphate or EMSA), nor by decreasing the concentration of hTS to around 15 μM. Lower TS concentrations than this were not practical, as NMR spectra of useful signal/noise ratio would have taken a pro-hibitive length of time to acquire. Saturation of hTS using higher concentrations of FdUMP was also impractical as the signals of free compound would swamp the much smaller hTS-associated ones.
The addition of methotrexate to the binary TS-FdUMP binary complex caused a displacement of the internal equilibrium between covalent and non-covalently-bound FdUMP. In the presence of folate cofactor, only the covalently-bound form is evident, with a slightly disturbed 19F chemical shift (now at -36.5ppm), and the binding of FdUMP to TS was unchanged, i.e., still relatively weak (Fig. 11). Ini-tially a 5-fold excess of methotrexate over hTS was added, but when this was in-creased to 10- and then 15-fold excesses, the resulting spectra (particularly, relative intensities) were unchanged. This is consistent with a model in which the co-factor binding pocket is saturated under these conditions, while the substrate pocket (oc-cupied here by FdUMP) is evidently not. Similar observations were made when MTX was replaced by folinic acid; a displacement of the internal equilibrium to the covalently-bound FdUMP, now with a slightly altered 19F chemical shift (-32.6ppm) (Table II).This chemical shift was different to that observed in the MTX-contain-ing ternary complex; thus, the signal provided a means of assessing whether MTX was able to displace the folinic acid from hTS. It was observed that the addition of MTX to the hTS-FdUMP-folinic acid complex caused the chemical shift to change to that observed in the hTS-FdUMP-MTX complex (Fig. 11). This involved the addition of a 10-fold excess of MTX over hTS, which was equal to the amount of folinic acid already present. In the reverse experiment, folinic acid did not displace
Table II Characteristics of some hTS-FdUMP complexes deduced by 19F NMR.
Complex mode of FdUMP binding
19F chemical shifts (ppm) a Comments
TS-FdUMP 1:1 noncovalent:covalent
-34.4 (covalent) -1.50 (non-covalent) FdUMP binding weak
TS-FdUMP-MTX covalent -36.5 MTX saturating TS-FdUMP-folinic acid covalent -32.6 Folinic acid can be
displaced by MTX TS-FdUMP- folic acid covalent -36.8 FdUMP binding
enhanced ca. 4-fold b
a referenced to free FdUMP at 0.0 ppm; b compared to other complexes in the table.

262
Hasnat et al.
MTX. It is, therefore, evident that MTX is able to displace folinic acid from its complex with hTS-FdUMP, which again suggests that the co-factor pocket is in fact saturated under these conditions. However, some caution is appropriate, because we are only directly observing a small proportion of the hTS, via the 19F signal of its bound FdUMP. The inferences are made from the behavior of relatively small NMR signals, and do not take into account possibilities such as new hTS-associated signals that may lie under the much larger signals of unbound FdUMP.
The addition of folic acid to the hTS-FdUMP had a similar effect to that of MTX or folinic acid, with the internal equilibrium shifting over to covalently-bound FdUMP. The chemical shift of the hTS-FdUMP-folate complex (-36.8 ppm) was very simi-lar to that of the hTS-FdUMP-MTX complex. The most striking feature was the increased relative intensity of the 19F signal of the complex, compared to the other complexes investigated here. The binding of FdUMP to hTS was evidently en-hanced approximately 4-fold in the presence of folate, compared to that observed in the presence of MTX, folinic acid or no folates. In our experiments, with a typical hTS dimer concentration of 22.5 μM, approximately 20% of the protein is bound to FdUMP in the presence of folic acid, as opposed to around 5% otherwise.
The key observation, however, is that the addition of (1.1 equiv.) of the 29nt RNA hairpin caused no changes to the 19F spectra of the hTS-FdUMP and hTS-FdUMP-
Figure 11: 19F NMR spectra of (A) hTS-FdUMP-fo-late, (B) hTS-FdUMP-folinic acid, (C) hTS-FdUMP-MTX, and (D) hTS-FdUMP complex. The concentra-tions of hTS, FdUMP, MTX, folic acid, and folinic acid were 45 μM, 450 μM, 225 μM, 225 μM, and 225 μM, respectively.

263Human Thymidylate
Synthase and Its Cognate RNA
MTX complexes. So, the internal equilibrium of hTS-FdUMP, and the chemical shifts and linewidths of 19F NMR signals, was not perturbed. This supports the hypothesis that the liganded TS protein is no longer able to interact with the mRNA molecule. If the RNA were to interact in the nucleotide active site, the electron density around 19F nuclei would be changed and, thus, the chemical shift value of FdUMP would be expected to change. This is irrespective of whether RNA binds covalently or non-covalently with hTS since RNA has greater affinity for hTS [Kd = 2.6 nM (6); Kd = 3.9-4.8 nM, this study] than FdUMP [Kd = 460 nM (26); Kd = 129 nM this study]. This suggests that these complexes do not interact with RNA at all.
Materials and Methods
Materials
FdUMP, dUMP, MTX, folic acid, folinic acid, HEPES buffer, glycerol, β-mercapto-ethanol, and tetrahydrofolate (H4F) were purchased from Sigma Chemical Company Ltd. The plasmid pET28c-hTS, containing the human thymidylate synthase gene, was a very kind gift from Professor Frank Maley, New York State Department of Health, U.S.A. The E. coli strains used for expression of the recombinant protein were the inducible strains DH5α and BL21(DE3) and were purchased from Novagen.
Expression, Purification, and Characterization of Human Thymidylate Synthase Protein
His-tagged human thymidylate synthase protein was expressed from the plasmid pET28c-hTS and purified by affinity chromatography according to the method de-scribed previously (19). After removal of the His-tag, hTS activity and binding constants were determined using the spectrophotometric assay method described by Wahba and Friedkin (20). The molecular mass (of both the His-tagged and thrombin-cleaved hTS) were confirmed by ES mass spectrometry. The amino acid sequence was confirmed by tryptic digestion of the protein followed by MALDI-TOF mass spectrometry (21). Samples were also used for ES-MS analysis leading to MS/MS (tandem mass spectrometry) for specific peptide sequence determina-tion. The observed masses/sequences were used for confirmatory identification of hTS by database searching (www.expasy.ch).
Synthesis of 29nt mRNA
The 29-nucleotide mRNA fragment (5ʹ CGCCCGCCGCGCC AUG CCU GUG GCC GGU 3ʹ) of human TS, containing the 5ʹ-untranslated region and the AUG start codon, was chemically synthesized and purified according to the method described previously (22).
Determination of RNA: Protein Binding by Electrophoretic Mobility Shift Assay
5ʹ-end labeling of 29 nt mRNA was performed by incubating 5 μl of mRNA (13.7 μM), 5 μl of 10 × kinase buffer, 150 μCi of γ32P ATP, and 20 units of T4 poly-nucleotide kinase (total volume 50 μl with diethyl pyrocarbonate treated water) for ten minutes at 37 ºC. The reaction was stopped by adding 2 μl of 0.5 M EDTA and heating at 45 ºC for ten minutes. Radiolabeled mRNA was collected by etha-nol precipitation. RNA electrophoretic gel mobility shift assay was performed as previously described (5, 6). In brief, radiolabeled RNAs (10 ng) were incubated with human TS protein at different concentrations in a reaction mixture containing 10 mM Hepes (pH 7.4), 40 mM KCl, 3 mM MgCl2, 250 mM 2-ME, and 5% glyc-erol (EMSA buffer) for 15 minutes at 37 ºC. The total reaction volume was 20 μl. A 4% polyacrylamide gel (acrylamide/methylene-bisacrylamide ratio 60 : 1) was pre-run for 30 minutes at 150 V and 50 mA and the entire reaction mixture, after addition of the native dye (total volume 30 μl), was then loaded onto the gel and run

264
Hasnat et al.
for approximately 30-45 minutes at 250 V and 50 mA. The gel was dried and the radiolabeled RNA was visualised by autoradiography.
Determination of RNA: Protein Binding by Ultrafiltration
The previously reported specificity of the hTS RNA: protein interaction (6, 10) was investigated by preliminary binding studies. Binding of hTS and BSA (control) protein was investigated by a filter binding assay similar to that described by Ghi-solfi-Nieto et al. (1996) (33). A solution of radiolabeled 29nt mRNA or (control) yeast tRNA was prepared in binding buffer (25 mM Tris-HCl, pH 7.5, 200 mM KCl, 5 mM MgCl2, 20% glycerol). Incubation involved heating 3-5 fmol of RNA at 60 ºC for 15 minutes, then slowly cooling to 25 ºC. The RNA was then incubated with different concentrations of purified protein (0, 2, 5, 10, 20, 50, 100, 200, or 400 nM hTS or BSA) in 100 μl of binding buffer for 20 minutes at 25 ºC. The reac-tion mixtures were filtered through wet nitrocellulose filters (Sartorius, Centristart, 12ml, low binding, regenerated, cellulose membrane) followed by three washes with 200 μl of binding buffer. The RNA was essentially intact during the entire procedure as checked by electrophoresis in denaturing polyacrylamide gels. The percentage of bound RNA was determined by Cerenkov (scintillation) counting. The dissociation constant (Kd) was estimated as the protein concentration at which one-half of the RNA bound at saturation was retained on the filter.The non-specific binding was determined by performing the same procedure, but without the addi-tion of protein. The percentage of specifically bound RNA was plotted versus the protein concentration to get an estimate of the dissociation constant (Kd).
Determination of the Tm Value of the 29nt mRNA
UV-visible spectra and melting temperature experiments of the 29nt synthetic RNA were conducted using a Varian Cary 4000 UV-visible spectrophotometer, operat-ing under Varian Cary WinUV software and equipped with a Peltier-thermostatted cuvette holder. Thermal denaturation experiments, monitored at 260nm, were re-corded between 10 and 90 ºC, at a rate of 0.5 ºC/min and a data interval of 0.5 ºC. Tm values, determined in different buffer conditions and with different concentra-tions of RNA (2-50 μM), corresponded to the maximum of the first derivative of the respective melting curve profile (A260 versus T).
Labeling of the 29 nt RNA by Covalent Attachment of Pyrenyl-1-methylamine to the 5ʹ-terminal Phosphate Group
The labeling of 29nt RNA with pyrenyl-1-methylamine involved (i) phosphorylation of the 5ʹ-phosphate group, (ii) removal of excess ATP after phosphorylation, and (iii) attachment of pyrenyl-1-methylamine at the 5ʹ-phosphate group. Phosphorylation was carried out according to the manufacturer’s instructions (Novagen, UK). In brief, 12 nmoles of RNA, 75 units of T4 polynucleotide kinase, 225 nmoles of dATP, 22.5 μl of 10 × kinase buffer, and sufficient distilled water to make a final volume of 225 μl were incubated for 30 minutes at 37 ºC. Excess dATP was removed using Sephadex spun-column chromatography. The methodology for attachment of pyre-nyl-1-methylamine to a 5ʹ-phosphate group has also been previously described (23).
Titration of PyRNA by Human Thymidylate Synthase Protein
The titration of PyRNA by hTS protein was performed in EMSA buffer (10 mM HEPES, pH 7.4, 40 mM KCl, 3 mM MgCl2, 250 mM β-mercaptoethanol, and 5% glycerol) at 37 ºC. The concentration of the hTS protein was determined by the Bradford protein assay method. Since hTS is known to exist primarily in the dimer-ic form, the concentration of hTS was re-calculated as dimer. The concentration of PyRNA was calculated based on its molar extinction coefficient of 254,000 M-1 cm-1 at 260 nm. The excitation and emission λmax values of the PyRNA were found to be

265Human Thymidylate
Synthase and Its Cognate RNA
338 nm and 375 nm, respectively. However, in order to reduce possible interference from hTS fluorescence, a third emission maximum of PyRNA at 416 nm was chosen for the fluorescence detection. The concentrations of PyRNA and hTS protein (di-meric form) were 40 nM and 0 to 81 nM, respectively. Dissociation constants were determined by SigmaPlot 5.0 software using non-linear regression analysis.
Estimation of Stoichiometry of Binding
Scatchard plots were not used to determine the stoichiometry of binding, because concentration of free and bound ligand must be calculated indirectly from the fluo-rescence curve by fitting of partial contribution parameters. For this reason and be-cause of dilution of the solution during the course of the titration, it was not possible to calculate these concentrations with total accuracy. Therefore, the stoichiometric ratio of binding between dimeric hTS and 29nt PyRNA (or non-labeled RNA) was estimated using the following approach: hTS + n(PyRNA) ⇔ hTS · (PyRNA)n [1]
where n is the number of PyRNA molecules bound per molecule of dimeric hTS and hTS · (PyRNA)n is the complex between dimeric hTS and PyRNA.
The intensity of the detected PyRNA fluorescence (Fpy) can then be written as: Fpy = fpyRNA × [PyRNA] + f py
complex × [complex] [2]
where fpyRNA and f pycomplex are the partial fluorescence intensities of free PyRNA and
the hTS · (PyRNA)n complex, respectively.
Values of f can also be written as follows: fpyRNA = F0
py / [PyRNA]0; f pycomplex = Flim py × n / [PyRNA]0 [3]
where [PyRNA]0 is the total amount of PyRNA, F0py and Flim py are the fluorescence in-
tensities when [hTS] = 0 and [hTS] = very high (at the end of curve), respectively.
The mass-balance equations are written in following form: [PyRNA]0 = [PyRNA] + n × [complex] [4] [hTS]0 = [hTS] + [complex] [5]
where [hTS]0 is the total amount of dimeric hTS and [hTS] is the concentration of free hTS.
Combination of Equations [2], [3], and [4] results in Equation [6]:
Therefore, the fraction of complex between hTS and PyRNA, relative to the total concentration of PyRNA [pyRNA]0 is described by the equation:
The concentration of complex hTS · (PyRNA)n is, therefore, equal to [hTS]0 in the case of tight binding or it is lower than [hTS]0 in the case of weak binding, i.e., [complex] ≤ [hTS]0. This means that
Fpy = F0py – × (F0
py – F )n x [complex][PyRNA]0
pylim [6]
[complex][PyRNA]00
0FFFF
pylim
py
pypy
= n ×−−
[7]
[hTS]0[PyRNA]00
0FFFF
pylim
py
pypy
≤ n.−−
[8]

266
Hasnat et al.
Therefore, the slope of the dependence of is equal to or
less than n ( n ≥ slope) and gives the estimation of a minimum value for the stoichi-ometry of binding (hTS : PyRNA = 1 : n), i.e., for the number of PyRNA molecules in the complex with dimeric hTS.
Determination of Dissociation Constant (Kd)
The dissociation constant (Kd) for the hTS · (PyRNA)n complex was determined from the titration of PyRNA with hTS. For the case when n = 1, the equation de-scribing the complex is given below:
It follows from Equations [4], [5], and [9], that the concentration of free PyRNA is described by the equation:
Combination of Equations [4], [9], and [10] results in the following equation, de-scribing the ratio between observed fluorescence intensity Fpy, partial fluorescence intensities fpyRNA and f py
complex and Kd
During titration, the total volume of the solution increased by about 10%. For the most accurate determination of the Kd value from the experimental data (described with Equation [11]) the values of fpyRNA and fcomplex were also fitted using the program SigmaPlot 5.0 applying non-linear regression analysis.
A similar approach was used in the titration experiment, when hTS was titrated with non-labeled 29nt mRNA or other ligands such as FdUMP or methotrexate (MTX). However, in this case Equation [2] was substituted by the equation:
where fhTS and FhTScomplex are the partial fluorescence intensities of free hTS and the
complex of hTS with ligand, respectively.
Stoichiometry of binding (n) was estimated using Equation [13].
The slope of the dependence of is equal to or lower than 1/n
(i.e., n ≤ 1/slope) and gives the estimation of upper value for the stoichiometry of binding (hTS : RNA = 1 : n), for the number of RNA molecules in the complex with dimeric hTS.
Titration of hTS by Non-labeled RNA and/or Other Ligands
( )2
FhTS = fhTS × [hTS] + f × [complex] = f × [TS]0 + (fhTS – f ) ×
+ Kd × [TS]0+[TS]0 – [RNA]0 – Kd
2[TS]0 – [RNA]0 – Kd
2
hTScomplex
hTScomplex
hTScomplex
{ } [12]
[RNA]0[hTS]0lim0
0 1nFF
FFTSTS
TSTS×≤−
−[13]
F – F [RNA]0
F – F [hTS]0 TS
limTS0
TSTS0 vs.
F – F [hTS]0
F – F [pyRNA]0 py
limpy0
pypy0 vs. .
[PyRNA][hTS][complex]
Kd = [9]
[PyRNA]0 – [TS]0 – Kd
2[PyRNA] = + ( )2 + Kd × [PyRNA]0
[PyRNA]0 – [TS]0 – Kd
2[10]
[PyRNA]0 – [TS]0 – Kd
2
Fpy = f × [PyRNA]0 + (fpyRNA – f ) ×
+ Kd × [PyRNA]0+[PyRNA]0 – [TS]0 – Kd
2
pycomplex
pycomplex
[11]

267Human Thymidylate
Synthase and Its Cognate RNA
Naturally fluorescent hTS was titrated by non-labeled RNA and/or the ligands FdUMP and MTX. The experiments were done under the same conditions of buffer and temperature described above. The excitation and emission maxima of hTS were found to be 281 nm and 338 nm, respectively, in EMSA buffer. Because of the higher concentration of RNA and absorbance at 281 nm, the fluorescence intensity values were recalculated taking into account the inner-filter effect. Simi-larly, both for hTS + FdUMP and hTS + MTX interactions, the inner filter effects were calculated using Equation [14].
Inner-Filter Effect Correction
The inner-filter effect occurs when there is absorption of light at both the excitation and emission wavelengths, by components in the solution. This correction is re-quired if the values of excitation and emission maxima change during fluorescence measurement or if the absorption of light occurs due to higher concentration of ligands present. It is, therefore, important to check whether the ligands used have any absorbance at these particular excitation and emission wavelengths (24).
In this study, for PyRNA titrated with hTS protein, the inner-filter correction was not required for low concentrations of RNA, but when hTS was titrated with higher concentrations of RNA, or with FdUMP or MTX, then the inner-filter effect was taken into account. This was calculated using the following equation: Fc = F × 100.5(Aex + Aem) [14]
where Fc is the corrected fluorescence intensity at the particular wavelength, F is the observed fluorescence intensity, Aex is the absorbance of the ligand solution at the excitation wavelength, and Aem is the absorbance of ligand solution at the emission wavelength.
19F NMR Studies
19F spectra were acquired at 470.5 MHz, using a GE Omega 500 spectrometer with a 5 mm 19F/1H probe. Proton decoupling was not used. Sample temperature was 20 ºC. Spectra were generally acquired with a spectral width of 19,000 Hz, col-lected in 32 K of complex points. A 90º pulse was used, and a relaxation delay of 2 s. 19F NMR spectra were acquired overnight, typically involving around 20,000 transients and were recorded in 50% D2O using the same buffer as was used for NMR studies of mouse TS, i.e., 50 mM Tris-HCl pH 7.5, 100 mM KCl, 5 mM DTT, 1 mM EDTA, 0.05% Triton X-100, and 10% glycerol. Typically, NMR samples included a hTS monomer concentration of 45 μM, with a 10-fold excess of FdUMP, and appropriate amounts of other compounds (MTX, folinic acid, or folic acid). For experiments involving RNA, 4 mM of MgCl2 was also present. This was to allow for uptake by EDTA, while leaving free Mg2+ levels comparable to those used in other hTS-RNA binding experiments.
Discussion
Although many of the findings presented here have been proposed in the literature for some time, the experiments presented here provide additional new direct evi-dence for the following:
I. The 5ʹ mRNA sequence does indeed form a stem loop structure; II. The dimeric form of human TS binds with high affinity to this structure
with a stoichiometry of binding of 1:1; III. The RNA binding site is not in the either the nucleotide of folate binding
pockets of the protein; IV. Once the hTS protein has already bound to the RNA, it is not displaced

268
Hasnat et al.
by subsequent ligand binding; and V. Once the hTS has bound FdUMP and a folate analogue it is no longer
able to interact with its cognate RNA
The model of TS: RNA interaction proposed by Chu and Allegra (10), described how anticancer drug resistance might develop via interference with the normal au-toregulatory mechanism of TS protein translation. In vitro studies with a variety of control oligonucleotides established the specificity of hTS protein binding to a specific, short, 5ʹ sequence of its cognate RNA (6), but the model was unclear as to how ligand binding might achieve this result. Our findings confirm that the 5ʹ TS mRNA region identified by Chu and Allegra is indeed a high affinity TS protein binding site and that this region is capable of forming a stem loop structure. How-ever, our findings do not support the notion that hTS protein bound to its cognate mRNA can be displaced by subsequent ligand binding. Instead, our data would sup-port the notion that anticancer agents, such as FdUMP, when bound to the enzyme, cause an allosteric, conformational change in the protein, which then prevents li-ganded TS protein from binding to its cognate RNA stem loop region. Large scale conformational changes in TS protein structure have been identified from X-ray crystallographic studies (34), where the authors have reported that (i) structures of mammalian TS proteins have been elucidated in three states: unliganded/inactive, liganded/active/open, and liganded/active/closed; and (ii) that the human TS is in the closed conformation when complexed with dUMP and the antifolate drug Ralti-trexed. Our observation that the hTS: RNA binary complex is still able to bind both nucleotide and folate ligands, indicates that the drug binding sites are unaffected by the presence of bound RNA and that the RNA binding site must be elsewhere on the molecule. This fits well with observations by Voeller et al. (8) who reported that the RNA binding site was most likely situated in the highly conserved domain at the interface between the 2 subunits of the dimeric protein and away from the active site of the protein. Further studies should be directed to finding out exactly how the binding of TS-targeted drugs changes the conformation of the TS dimer such that it is no longer capable of binding to its cognate RNA.
Acknowledgements
Abul Hasnat expresses his thanks to the Commonwealth Scholarship Commission in UK for PhD funding.
References and Footnotes
1.2.3.
4.5.
6.
7.
8.
9.
10.
11.12.13.14.15.
16.
Y. M. Rustum. Front Biosci 9, 2467-2473 (2004).J. J. McGuire. Curr Pharm Des 9, 2593-2613 (2003).E. Chu, M. A. Callender, M. P. Farrell, J. C. Schmitz. Cancer Chemother Pharmacol 52, Suppl 1 S80-89 (2003).K. T. Douglas. Med Res Rev 7, 441-475 (1987).E. Chu, D. M. Koeller, J. L. Casey, J. C. Drake, B. A. Chabner, P. C. Elwood, S. Zinn, C. J. Allegra. Proc Natl Acad Sci USA 88, 8977-8981 (1991).E. Chu, D. Voeller, D. M. Koeller, J. C. Drake, C. H. Takimoto, G. F. Maley, F. Maley, C. J. Allegra. Proc Natl Acad Sci USA 90, 517-521 (1993).E. Chu, D. M. Voeller, K. L. Jones, T. Takechi, G. F. Maley, F. Maley, S. Segal, C. J. Allegra. Mol Cell Biol 14, 207-213 (1994).D. M. Voeller, M. Zajac-Kaye, R. J. Fisher, C. J. Allegra. Biochem Biophys Res Commun 297, 24-31 (2002).E. Chu, T. Cogliati, S. M. Copur, A. Borre, D. M. Voeller, C. J. Allegra, S. Segal. Nucleic Acids Res 24, 3222-3228 (1996).X. Lin, N. Mizunuma, T. Chen, S. M. Copur, G. F. Maley, J. Liu, F. Maley, E. Chu. Nucleic Acids Res 28, 4266-4274 (2000).E. Chu, C. J. Allegra. Bioessays 18, 191-198 (1996).E. Chu, C. J. Allegra. Adv Enzyme Regul 36, 143-163 (1996).M. L. Carpenter, A. W. Oliver, G. G. Kneale. Methods Mol Biol 148, 491-502 (2001).J. Cho, R. R. Rando. Nucleic Acids Res 28, 2158-2163 (2000).C. A. Lewis, Jr., P. D. Ellis, R. B. Dunlap. Biochem Biophys Res Commun 83, 1509- 1517 (1978).C. A. Lewis, Jr., P. D. Ellis, R. B. Dunlap. Biochemistry 19, 116-123 (1980).

269Human Thymidylate
Synthase and Its Cognate RNA
17.18.
19.20.21.22.23.
24.
25.
26.27.28.29.
30.31.32.33.
34.
C. A. Lewis, Jr., P. D. Ellis, R. B. Dunlap. Biochemistry 20, 2275-2285 (1981).H. C. Zhang, R. J. Cisneros, W. L. Deng, J. W. Zapf, L. F. Johnson, R. B. Dunlap. Biochim Biophys Acta 1077, 35-46 (1991).J. Pedersen-Lane, G. F. Maley, E. Chu, F. Maley. Protein Expr Purif 10, 256-262 (1997).A. J. Wahba, M. Friedkin. J Biol Chem 237, 3794-3801 (1962).R. Bakhtiar, R. W. Nelson. Biochem Pharmacol 59, 891-905 (2000).J. B. Murray, A. K. Collier, J. R. Arnold. Anal Biochem 218, 177-184 (1994).E. V. Bichenkova, S. Frau, O. S. Fedorova, K. T. Douglas. Nucleosides Nucleotides Nucleic Acids 20, 157-168 (2001).O. S. Fedorova, G. A. Nevinsky, V. V. Koval, A. A. Ishchenko, N. L. Vasilenko, K. T. Douglas. Biochemistry 41, 1520-1528 (2002).A. H. Marks, P. K. Bhadra, D. G. McDowell, D. J. French, K. T. Douglas, E. V. Bichenkova, R. A. Bryce. J Biomol Struct Dyn 23, 49-62 (2005).R. T. Reilly, K. W. Barbour, R. B. Dunlap, F. G. Berger. Mol Pharmacol 48, 72-79 (1995).R. T. Reilly, A. M. Forsthoefel, F. G. Berger. Arch Biochem Biophys 342, 338-343 (1997).J. H. Galivan, G. F. Maley, F. Maley. Biochemistry 15, 356-362 (1976).I. K. Dev, W. S. Dallas, R. Ferone, M. Hanlon, D. D. McKee, B. B. Yates. J Biol Chem 269, 1873-1882 (1994).M. Allen, L. Varani, G. Varani. Methods Enzymol 339, 357-376 (2001).R. A. Byrd, W. H. Dawson, P. D. Ellis, R. B. Dunlap. J Am Chem Soc 99, 6139-6141 (1977).T. J. Connick, R. T. Reilly, R. B. Dunlap, P. D. Ellis. Biochemistry 32, 9888-9895 (1993).L. Ghisolfi-Nieto, G. Joseph, F. Puvion-Dutilleul, F. Amalric, P. Bouvet. J Mol Biol 260, 34-53 (1996).J. Phan, S. Koli, W. Minor, R. B. Dunlap, S. H. Berger, L. Lebioda. Biochemistry 40, 1897-1902 (2001).
Date Received: March 9, 2007
Communicated by the Editor Ramaswamy H. Sarma


![Unique dual targeting of thymidylate synthase and topoisomerase1 by FdUMP[10] results in high efficacy against AML and low toxicity](https://img.pdfslide.net/doc/110x75/63459e2f03a48733920b71c2/unique-dual-targeting-of-thymidylate-synthase-and-topoisomerase1-by-fdump10-results.jpg)


