Embed Size (px)
Citation preview

Form 6-K
UNITED STATES SECURITIES AND EXCHANGE COMMISSION
Washington, D.C. 20549
Report of Foreign Private Issuer
Pursuant to Rule 13a-16 or 15d-16 under the Securities Exchange Act of 1934
For the quarter ended December 31, 2014
Commission File Number 001-35754
Infosys Limited
(Exact name of Registrant as specified in its charter)
Not Applicable (Translation of Registrant's name into English)
Electronics City, Hosur Road, Bangalore - 560 100, Karnataka, India. +91-80-2852-0261
(Address of principal executive offices)
Indicate by check mark whether the registrant files or will file annual reports under cover Form 20-F or Form 40-F: Form 20-F Form 40-F
Indicate by check mark if the registrant is submitting the Form 6-K in paper as permitted by Regulation S-T Rule 101(b)(1) :
Indicate by check mark if the registrant is submitting the Form 6-K in paper as permitted by Regulation S-T Rule 101(b)(7) : Currency of presentation and certain defined terms
In this Quarterly Report, references to "U.S." or "United States" are to the United States of America, its territories and its possessions. References to "India" are to the Republic of India. References to "$" or "dollars" or "U.S. dollars" are to the legal currency of the United States and references to " " or "rupees" or "Indian rupees" are to the legal currency of India. Our condensed interim financial statements are presented in U.S. dollars and are prepared in accordance with the International Financial Reporting Standards as issued by the International Accounting Standards Board (IFRS) and in accordance with IAS 34, Interim Financial Reporting. References to "Indian GAAP" are to Indian Generally Accepted Accounting Principles. References to a particular "fiscal" year are to our fiscal year ended March 31 of such year.
All references to "we", "us", "our", "Infosys" or the "Company" shall mean Infosys Limited and our consolidated subsidiaries, unless specifically indicated otherwise or the context indicates otherwise. "Infosys" is a registered trademark of Infosys Limited in the United States and India. All other trademarks or trade names used in this Quarterly Report are the property of their respective owners. All references to “IT Services” exclude business process management services and products business.
Except as otherwise stated in this Quarterly Report, all translations from Indian rupees to U.S. dollars effected are based on the fixing rate in the City of Mumbai on December 31, 2014 for cable transfers in Indian rupees as published by the Foreign Exchange Dealers’ Association of India, or FEDAI, which was 63.04 per $1.00. No representation is made that the Indian rupee amounts have been, could have been or could be converted into U.S. dollars at such a rate or any other rate. Any discrepancies in any table between totals and sums of the amounts listed are due to rounding.

TABLE OF CONTENTS
Part I - Financial Information
Item 1. Financial Statements
Unaudited Condensed Consolidated Interim Balance Sheets Unaudited Condensed Consolidated Interim Statements of Comprehensive Income Unaudited Condensed Consolidated Interim Statements of Changes in Equity Unaudited Condensed Consolidated Interim Statements of Cash Flows Notes to the Unaudited Condensed Consolidated Interim Financial Statements
Item 2. Management's Discussion and Analysis of Financial Condition and Results of Operations Item 3. Quantitative and Qualitative Disclosure about Market Risk Item 4. Controls and Procedures
Part II - Other Information
Item 1. Legal Proceedings Item 1A. Risk Factors Item 2. Unregistered Sales of Equity Securities and Use of Proceeds Item 3. Defaults upon Senior Securities Item 4. Mine Safety Disclosures Item 5. Other Information Item 6. Exhibits
SIGNATURES EXHIBIT INDEX EXHIBIT 31.1 EXHIBIT 32.1 EXHIBIT 99.1
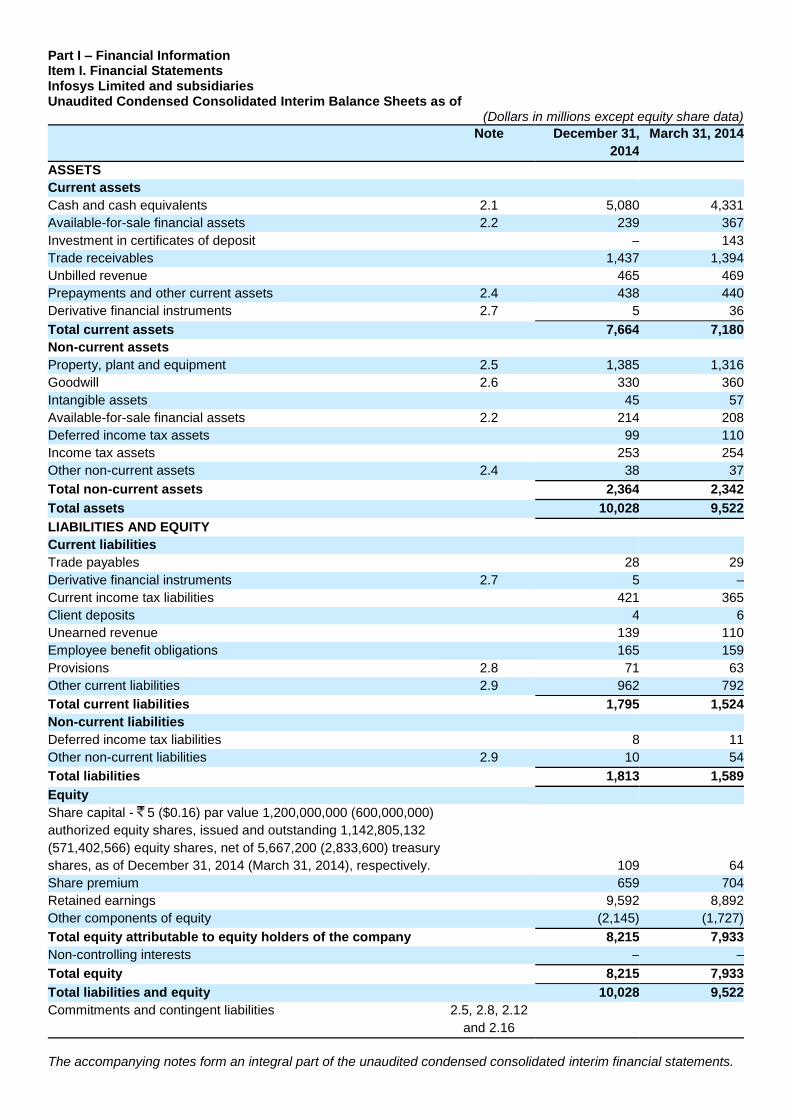
Part I – Financial Information Item I. Financial Statements Infosys Limited and subsidiaries Unaudited Condensed Consolidated Interim Balance Sheets as of
(Dollars in millions except equity share data)
Note December 31,
2014
March 31, 2014
ASSETS
Current assets
Cash and cash equivalents 2.1 5,080 4,331
Available-for-sale financial assets 2.2 239 367
Investment in certificates of deposit – 143
Trade receivables 1,437 1,394
Unbilled revenue 465 469
Prepayments and other current assets 2.4 438 440
Derivative financial instruments 2.7 5 36
Total current assets 7,664 7,180
Non-current assets
Property, plant and equipment 2.5 1,385 1,316
Goodwill 2.6 330 360
Intangible assets 45 57
Available-for-sale financial assets 2.2 214 208
Deferred income tax assets 99 110
Income tax assets 253 254
Other non-current assets 2.4 38 37
Total non-current assets 2,364 2,342
Total assets 10,028 9,522
LIABILITIES AND EQUITY
Current liabilities
Trade payables 28 29
Derivative financial instruments 2.7 5 –
Current income tax liabilities 421 365
Client deposits 4 6
Unearned revenue 139 110
Employee benefit obligations 165 159
Provisions 2.8 71 63
Other current liabilities 2.9 962 792
Total current liabilities 1,795 1,524
Non-current liabilities
Deferred income tax liabilities 8 11
Other non-current liabilities 2.9 10 54
Total liabilities 1,813 1,589
Equity
Share capital - 5 ($0.16) par value 1,200,000,000 (600,000,000)
authorized equity shares, issued and outstanding 1,142,805,132
(571,402,566) equity shares, net of 5,667,200 (2,833,600) treasury
shares, as of December 31, 2014 (March 31, 2014), respectively.
109 64
Share premium 659 704
Retained earnings 9,592 8,892
Other components of equity (2,145) (1,727)
Total equity attributable to equity holders of the company 8,215 7,933
Non-controlling interests – –
Total equity 8,215 7,933
Total liabilities and equity 10,028 9,522
Commitments and contingent liabilities 2.5, 2.8, 2.12
and 2.16
The accompanying notes form an integral part of the unaudited condensed consolidated interim financial statements.
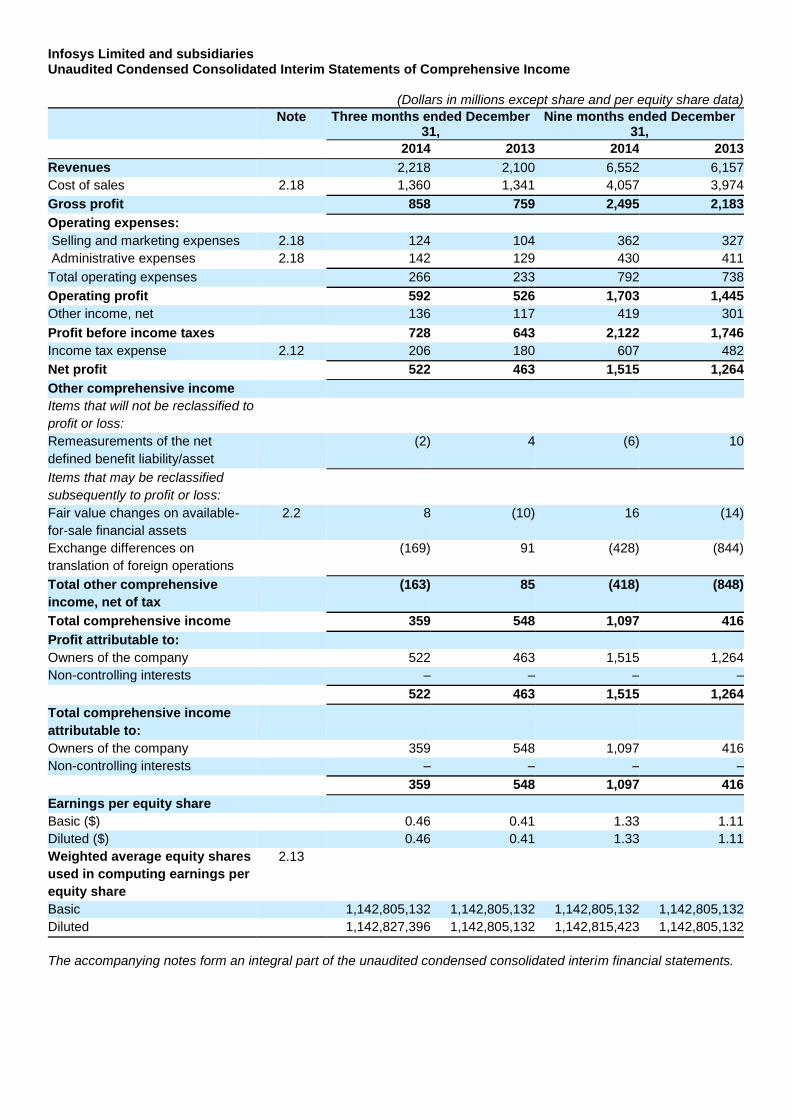
Infosys Limited and subsidiaries Unaudited Condensed Consolidated Interim Statements of Comprehensive Income
(Dollars in millions except share and per equity share data)
Note Three months ended December 31,
Nine months ended December 31,
2014 2013 2014 2013
Revenues 2,218 2,100 6,552 6,157
Cost of sales 2.18 1,360 1,341 4,057 3,974
Gross profit 858 759 2,495 2,183
Operating expenses:
Selling and marketing expenses 2.18 124 104 362 327
Administrative expenses 2.18 142 129 430 411
Total operating expenses 266 233 792 738
Operating profit 592 526 1,703 1,445
Other income, net 136 117 419 301
Profit before income taxes 728 643 2,122 1,746
Income tax expense 2.12 206 180 607 482
Net profit 522 463 1,515 1,264
Other comprehensive income
Items that will not be reclassified to
profit or loss:
Remeasurements of the net
defined benefit liability/asset
(2) 4 (6) 10
Items that may be reclassified
subsequently to profit or loss:
Fair value changes on available-
for-sale financial assets
2.2 8 (10) 16 (14)
Exchange differences on
translation of foreign operations
(169) 91 (428) (844)
Total other comprehensive
income, net of tax
(163) 85 (418) (848)
Total comprehensive income 359 548 1,097 416
Profit attributable to:
Owners of the company 522 463 1,515 1,264
Non-controlling interests – – – –
522 463 1,515 1,264
Total comprehensive income
attributable to:
Owners of the company 359 548 1,097 416
Non-controlling interests – – – –
359 548 1,097 416
Earnings per equity share
Basic ($) 0.46 0.41 1.33 1.11
Diluted ($) 0.46 0.41 1.33 1.11
Weighted average equity shares
used in computing earnings per
equity share
2.13
Basic 1,142,805,132 1,142,805,132 1,142,805,132 1,142,805,132
Diluted 1,142,827,396 1,142,805,132 1,142,815,423 1,142,805,132
The accompanying notes form an integral part of the unaudited condensed consolidated interim financial statements.
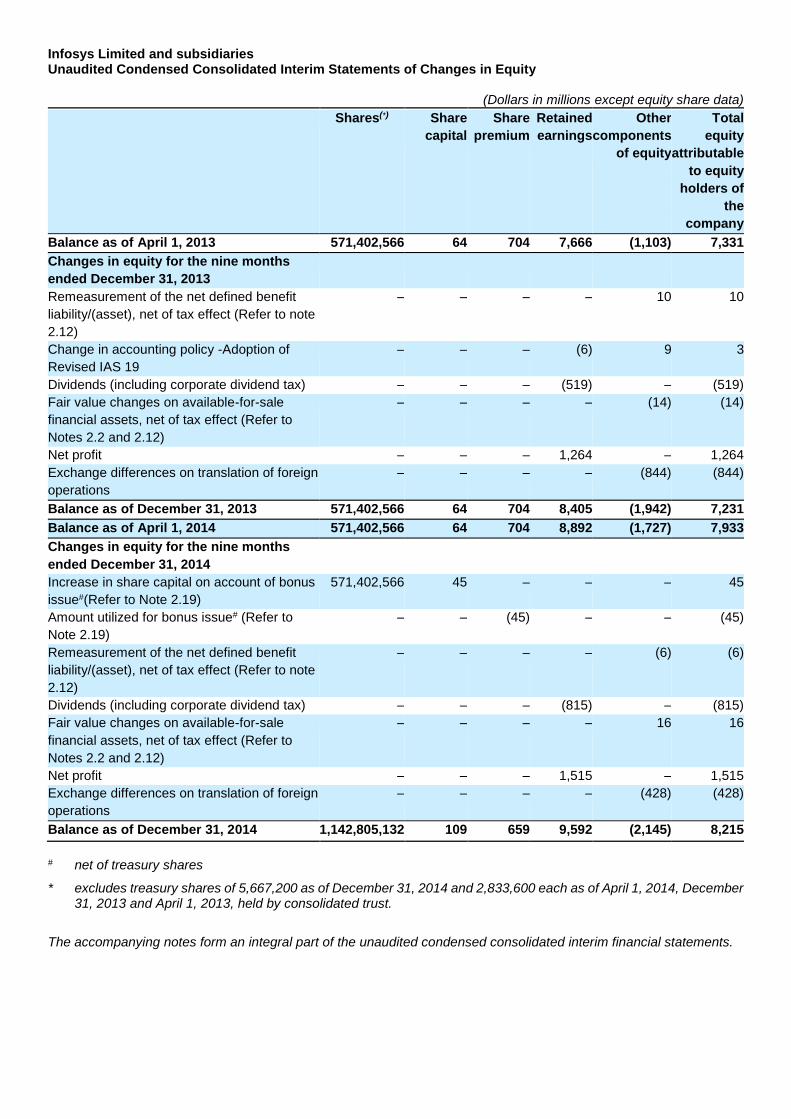
Infosys Limited and subsidiaries Unaudited Condensed Consolidated Interim Statements of Changes in Equity
(Dollars in millions except equity share data)
Shares(*) Share
capital
Share
premium
Retained
earnings
Other
components
of equity
Total
equity
attributable
to equity
holders of
the
company
Balance as of April 1, 2013 571,402,566 64 704 7,666 (1,103) 7,331
Changes in equity for the nine months
ended December 31, 2013
Remeasurement of the net defined benefit
liability/(asset), net of tax effect (Refer to note
2.12)
– – – – 10 10
Change in accounting policy -Adoption of
Revised IAS 19
– – – (6) 9 3
Dividends (including corporate dividend tax) – – – (519) – (519)
Fair value changes on available-for-sale
financial assets, net of tax effect (Refer to
Notes 2.2 and 2.12)
– – – – (14) (14)
Net profit – – – 1,264 – 1,264
Exchange differences on translation of foreign
operations
– – – – (844) (844)
Balance as of December 31, 2013 571,402,566 64 704 8,405 (1,942) 7,231
Balance as of April 1, 2014 571,402,566 64 704 8,892 (1,727) 7,933
Changes in equity for the nine months
ended December 31, 2014
Increase in share capital on account of bonus
issue#(Refer to Note 2.19)
571,402,566 45 – – – 45
Amount utilized for bonus issue# (Refer to
Note 2.19)
– – (45) – – (45)
Remeasurement of the net defined benefit
liability/(asset), net of tax effect (Refer to note
2.12)
– – – – (6) (6)
Dividends (including corporate dividend tax) – – – (815) – (815)
Fair value changes on available-for-sale
financial assets, net of tax effect (Refer to
Notes 2.2 and 2.12)
– – – – 16 16
Net profit – – – 1,515 – 1,515
Exchange differences on translation of foreign
operations
– – – – (428) (428)
Balance as of December 31, 2014 1,142,805,132 109 659 9,592 (2,145) 8,215
# net of treasury shares
* excludes treasury shares of 5,667,200 as of December 31, 2014 and 2,833,600 each as of April 1, 2014, December 31, 2013 and April 1, 2013, held by consolidated trust.
The accompanying notes form an integral part of the unaudited condensed consolidated interim financial statements.
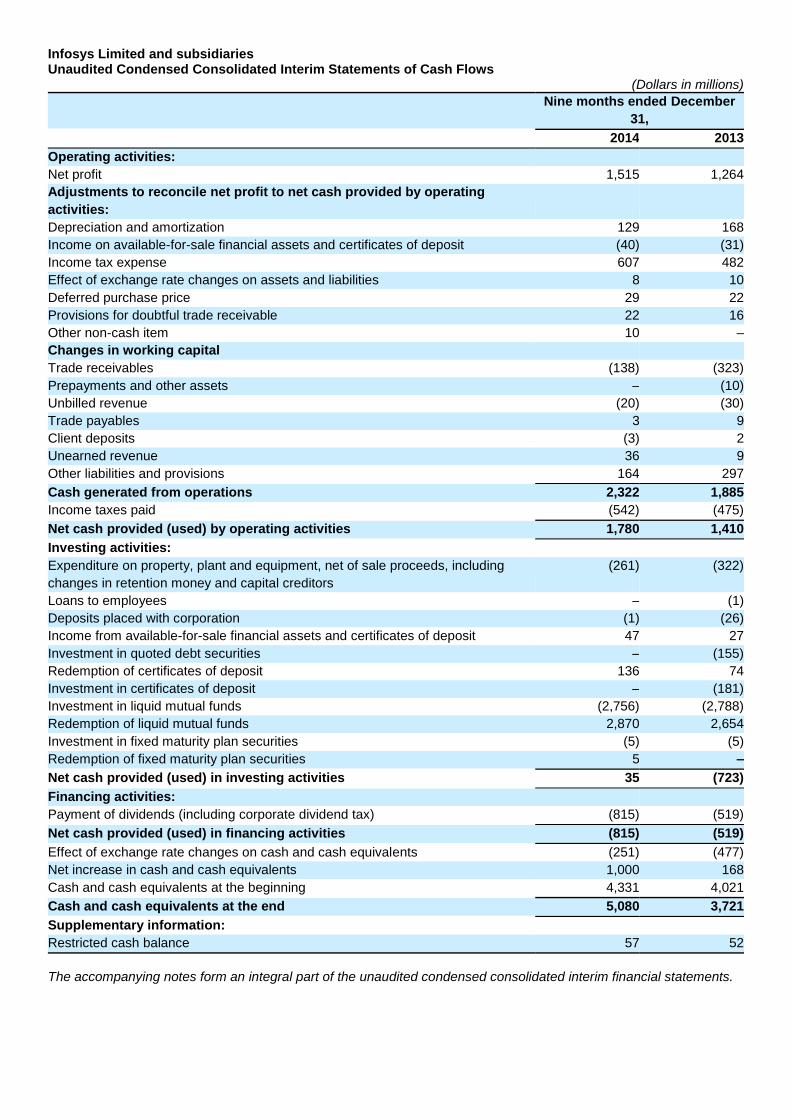
Infosys Limited and subsidiaries Unaudited Condensed Consolidated Interim Statements of Cash Flows
(Dollars in millions)
Nine months ended December
31,
2014 2013
Operating activities:
Net profit 1,515 1,264
Adjustments to reconcile net profit to net cash provided by operating
activities:
Depreciation and amortization 129 168
Income on available-for-sale financial assets and certificates of deposit (40) (31)
Income tax expense 607 482
Effect of exchange rate changes on assets and liabilities 8 10
Deferred purchase price 29 22
Provisions for doubtful trade receivable 22 16
Other non-cash item 10 –
Changes in working capital
Trade receivables (138) (323)
Prepayments and other assets – (10)
Unbilled revenue (20) (30)
Trade payables 3 9
Client deposits (3) 2
Unearned revenue 36 9
Other liabilities and provisions 164 297
Cash generated from operations 2,322 1,885
Income taxes paid (542) (475)
Net cash provided (used) by operating activities 1,780 1,410
Investing activities:
Expenditure on property, plant and equipment, net of sale proceeds, including
changes in retention money and capital creditors
(261) (322)
Loans to employees – (1)
Deposits placed with corporation (1) (26)
Income from available-for-sale financial assets and certificates of deposit 47 27
Investment in quoted debt securities – (155)
Redemption of certificates of deposit 136 74
Investment in certificates of deposit – (181)
Investment in liquid mutual funds (2,756) (2,788)
Redemption of liquid mutual funds 2,870 2,654
Investment in fixed maturity plan securities (5) (5)
Redemption of fixed maturity plan securities 5 –
Net cash provided (used) in investing activities 35 (723)
Financing activities:
Payment of dividends (including corporate dividend tax) (815) (519)
Net cash provided (used) in financing activities (815) (519)
Effect of exchange rate changes on cash and cash equivalents (251) (477)
Net increase in cash and cash equivalents 1,000 168
Cash and cash equivalents at the beginning 4,331 4,021
Cash and cash equivalents at the end 5,080 3,721
Supplementary information:
Restricted cash balance 57 52
The accompanying notes form an integral part of the unaudited condensed consolidated interim financial statements.
Notes to the Unaudited Condensed Consolidated Interim Financial Statements
1. Company Overview and Significant Accounting Policies
1.1 Company overview
Infosys Limited (Infosys or the company) along with its controlled trusts, Infosys Limited Employees’ Welfare Trust and Infosys Science Foundation, majority owned and controlled subsidiary, Infosys BPO Limited (Infosys BPO) and its wholly owned and controlled subsidiaries, and its wholly owned and controlled subsidiaries, Infosys Technologies (Australia) Pty. Limited (Infosys Australia), Infosys Technologies (China) Co. Limited (Infosys China), Infosys Technologies S. DE R.L. de C.V. (Infosys Mexico), Infosys Technologies (Sweden) AB (Infosys Sweden), Infosys Tecnologia do Brasil Ltda (Infosys Brasil), Infosys Public Services, Inc., (Infosys Public Services), Infosys Americas Inc., (Infosys Americas), Edgeverve Systems Limited (Edgeverve), Infosys Technologies (Shanghai) Company Limited (Infosys Shanghai) and Lodestone Holding AG and its controlled subsidiaries (Infosys Lodestone) is a leading global services company. The Infosys group of companies (the Group) provides business consulting, technology, engineering and outsourcing services. In addition, the Group offers software products and platforms. The company is a public limited company incorporated and domiciled in India and has its registered office at Bangalore, Karnataka, India. The company has its primary listings on the Bombay Stock Exchange and National Stock Exchange in India. The company’s American Depositary Shares representing equity shares are also listed on the New York Stock Exchange (NYSE), NYSE Euronext London and NYSE Euronext Paris. The Group’s unaudited condensed consolidated interim financial statements were authorized for issue by the Company’s Board of Directors on January 27, 2015.
1.2 Basis of preparation of financial statements
These condensed consolidated interim financial statements have been prepared in compliance with International Financial Reporting Standards as issued by the International Accounting Standards Board (IFRS) and in accordance with IAS 34, Interim Financial Reporting, under the historical cost convention on the accrual basis except for certain financial instruments and prepaid gratuity benefits which have been measured at fair values. Accordingly, these condensed consolidated interim financial statements do not include all the information required for a complete set of financial statements. These condensed consolidated interim financial statements should be read in conjunction with the consolidated financial statements and related notes included in the company’s Annual Report on Form 20-F for the year ended March 31, 2014. Accounting policies have been applied consistently to all periods presented in these unaudited condensed consolidated interim financial statements. The previously reported information in the Form 6-K for the quarter ended December 31, 2013 has been condensed to conform to the current period’s presentation.
1.3 Basis of consolidation
Infosys consolidates entities which it owns or controls. Control exists when the parent has power over the entity, is exposed, or has rights, to variable returns from its involvement with the entity and has the ability to affect those returns by using its power over the entity. Power is demonstrated through existing rights that give the ability to direct relevant activities, those which significantly affect the entity's returns. Subsidiaries are consolidated from the date control commences until the date control ceases.
The financial statements of the Group companies are consolidated on a line-by-line basis and intra-group balances and transactions including unrealized gain / loss from such transactions are eliminated upon consolidation. These financial statements are prepared by applying uniform accounting policies in use at the Group. Non-controlling interests which represent part of the net profit or loss and net assets of subsidiaries that are not, directly or indirectly, owned or controlled by the company, are excluded. 1.4 Use of estimates
The preparation of the financial statements in conformity with IFRS requires management to make estimates, judgments and assumptions. These estimates, judgments and assumptions affect the application of accounting policies and the reported amounts of assets and liabilities, the disclosures of contingent assets and liabilities at the date of the financial statements and reported amounts of revenues and expenses during the period. Application of accounting policies that require critical accounting estimates involving complex and subjective judgments and the use of assumptions in these financial statements have been disclosed in Note 1.5. Accounting estimates could change from period to period. Actual results could differ from those estimates. Appropriate changes in estimates are made as management becomes aware of changes in circumstances surrounding the estimates. Changes in estimates are reflected in the financial statements in the period in which changes are made and, if material, their effects are disclosed in the notes to the consolidated interim financial statements.
1.5 Critical accounting estimates a. Revenue recognition The company uses the percentage-of-completion method in accounting for its fixed-price contracts. Use of the percentage-of-completion method requires the company to estimate the efforts or costs expended to date as a proportion of the total efforts or costs to be expended. Efforts or costs expended have been used to measure progress towards completion as there is a direct relationship between input and productivity. Provisions for estimated losses, if any, on uncompleted contracts are recorded in the period in which such losses become probable based on the expected contract estimates at the reporting date. b. Income taxes The company's two major tax jurisdictions are India and the U.S., though the company also files tax returns in other overseas jurisdictions. Significant judgments are involved in determining the provision for income taxes, including amount expected to be paid/recovered for uncertain tax positions. c. Business combinations and intangible assets Business combinations are accounted for using IFRS 3 (Revised), Business Combinations. IFRS 3 requires the identifiable intangible assets and contingent consideration to be fair valued in order to ascertain the net fair value of identifiable assets, liabilities and contingent liabilities of the acquiree. Significant estimates are required to be made in determining the value of contingent consideration and intangible assets. These valuations are conducted by independent valuation experts. d. Property, plant and equipment Property, plant and equipment represent a significant proportion of the asset base of the Group. The charge in respect of periodic depreciation is derived after determining an estimate of an asset’s expected useful life and the expected residual value at the end of its life. The useful lives and residual values of Group's assets are determined by management at the time the asset is acquired and reviewed periodically, including at each financial year end. The lives are based on historical experience with similar assets as well as anticipation of future events, which may impact their life, such as changes in technology. 1.6 Property, plant and equipment Property, plant and equipment are stated at cost, less accumulated depreciation and impairment, if any. Costs directly attributable to acquisition are capitalized until the property, plant and equipment are ready for use, as intended by management. The Group depreciates property, plant and equipment over their estimated useful lives using the straight-line method. The estimated useful lives of assets are as follows:
Buildings 22-25 years
Plant and machinery 5 years
Computer equipment 3-5 years
Furniture and fixtures 5 years
Vehicles 5 years
Depreciation methods, useful lives and residual values are reviewed periodically, including at each financial year end. (Refer to Note 2.5) Advances paid towards the acquisition of property, plant and equipment outstanding at each balance sheet date and the cost of assets not put to use before such date are disclosed under ‘Capital work-in-progress’. Subsequent expenditures relating to property, plant and equipment is capitalized only when it is probable that future economic benefits associated with these will flow to the Group and the cost of the item can be measured reliably. Repairs and maintenance costs are recognized in net profit in the statement of comprehensive income when incurred. The cost and related accumulated depreciation are eliminated from the financial statements upon sale or retirement of the asset and the resultant gains or losses are recognized in net profit in the statement of comprehensive income. Assets to be disposed off are reported at the lower of the carrying value or the fair value less cost to sell. 1.7 Business combinations Business combinations have been accounted for using the acquisition method under the provisions of IFRS 3 (Revised), Business Combinations. The cost of an acquisition is measured at the fair value of the assets transferred, equity instruments issued and liabilities incurred or assumed at the date of acquisition, which is the date on which control is transferred to the Group. The cost of acquisition also includes the fair value of any contingent consideration. Identifiable assets acquired and liabilities and
contingent liabilities assumed in a business combination are measured initially at their fair value on the date of acquisition. Business combinations between entities under common control by formation of a new company is outside the scope of IFRS 3 (Revised), Business Combinations and is accounted for at carrying value. Transaction costs that the Group incurs in connection with a business combination such as finders’ fees, legal fees, due diligence fees, and other professional and consulting fees are expensed as incurred. 1.8 Employee benefits
1.8.1 Gratuity Infosys provides for gratuity, a defined benefit retirement plan (the “Gratuity Plan”) covering eligible employees. The Gratuity Plan provides a lump-sum payment to vested employees at retirement, death, incapacitation or termination of employment, of an amount based on the respective employee's salary and the tenure of employment.
Liabilities with regard to the Gratuity Plan are determined by actuarial valuation, performed by an independent actuary, at each balance sheet date using the projected unit credit method. The company fully contributes all ascertained liabilities to the Infosys Limited Employees' Gratuity Fund Trust (the “Trust”). In case of Infosys BPO and Edgeverve, contributions are made to the Infosys BPO's Employees' Gratuity Fund Trust and Edgeverve Systems Limited Employees' Gratuity Fund Trust. Trustees administer contributions made to the Trusts and contributions are invested in a scheme with Life Insurance Corporation of India as permitted by law of India. The Group has adopted Revised IAS 19 effective April 1, 2013. Pursuant to this adoption, the Group recognizes the net obligation of a defined benefit plan in its balance sheet as an asset or liability. The amended standard requires immediate recognition of the gains and losses through re-measurements of the net defined benefit liability/ (asset) through other comprehensive income. Further it also requires the interest expense/(income) on plan assets to be considered in the Profit and Loss to be restricted to the discount rate based on the Government securities yield. The actual return of the portfolio, in excess of such yields is recognized through the other comprehensive income. The Revised IAS 19 also requires effect of any plan amendments to be recognized immediately through the net profits, in the statement of comprehensive income. Previously, the actuarial gains and losses were charged or credited to net profit in the statement of comprehensive income in the period in which they arose and the expected return on plan assets computed based on market expectations were considered as part of the net gratuity cost.
The adoption of Revised IAS 19 Employee Benefits did not have a material impact on the consolidated financial statements. 1.8.2 Superannuation
Certain employees of Infosys are also participants in a defined contribution plan. The company has no further obligations to the Plan beyond its monthly contributions. Certain employees of Infosys BPO are also eligible for superannuation benefit. Infosys BPO has no further obligations to the superannuation plan beyond its monthly contribution which are periodically contributed to a trust fund, the corpus of which is invested with the Life Insurance Corporation of India. Certain employees of Edgeverve are also participants in the Edgeverve Systems Limited Employees Superannuation Fund Trust (the “Plan”) which is a defined contribution plan. The Company has no obligations to the Plan beyond its monthly contributions. 1.8.3 Provident fund Eligible employees of Infosys receive benefits from a provident fund, which is a defined benefit plan. Both the employee and the company make monthly contributions to the provident fund plan equal to a specified percentage of the covered employee's salary. The company contributes a part of the contributions to the Infosys Limited Employees' Provident Fund Trust. The trust invests in specific designated instruments as permitted by Indian law. The remaining portion is contributed to the government administered pension fund. The rate at which the annual interest is payable to the beneficiaries by the trust is being administered by the government. The company has an obligation to make good the shortfall, if any, between the return from the investments of the Trust and the notified interest rate.
In respect of Infosys BPO, eligible employees receive benefits from a provident fund, which is a defined contribution plan. Both the employee and Infosys BPO make monthly contributions to this provident fund plan equal to a specified percentage of the covered employee's salary. Amounts collected under the provident fund plan are deposited in a government administered provident fund. The company has no further obligation to the plan beyond its monthly contributions. In respect of Edgeverve Systems Limited, eligible employees receive benefits from a provident fund, which is a defined contribution plan. Both the employee and the Company make monthly contributions to this provident fund plan equal to a specified percentage of the covered employee's salary. Amounts collected under the provident fund plan are deposited
in a Government administered provident fund. The Company has no further obligations under the provident fund plan beyond its monthly contributions. 1.8.4 Compensated absences The Group has a policy on compensated absences which are both accumulating and non-accumulating in nature. The expected cost of accumulating compensated absences is determined by actuarial valuation using the projected unit credit method on the additional amount expected to be paid / availed as a result of the unused entitlement that has accumulated at the balance sheet date. Expense on non-accumulating compensated absences is recognized in the period in which the absences occur. 1.8.5 Share-based compensation The Group recognizes compensation expense relating to share-based payments in net profit using a fair-value measurement method in accordance with IFRS 2, Share-Based Payment. Under the fair value method, the estimated fair value of awards is charged to income on a straight-line basis over the requisite service period for each separately vesting portion of the award as if the award was in-substance, multiple awards with a corresponding increase to securities premium. 1.9 Earnings per equity share Basic earnings per equity share is computed by dividing the net profit attributable to the equity holders of the Company by the weighted average number of equity shares outstanding during the period. Diluted earnings per equity share is computed by dividing the net profit attributable to the equity holders of the Company by the weighted average number of equity shares considered for deriving basic earnings per equity share and also the weighted average number of equity shares that could have been issued upon conversion of all dilutive potential equity shares. The dilutive potential equity shares are adjusted for the proceeds receivable had the equity shares been actually issued at fair value (i.e. the average market value of the outstanding equity shares). Dilutive potential equity shares are deemed converted as of the beginning of the period, unless issued at a later date. Dilutive potential equity shares are determined independently for each period presented. The number of equity shares and potentially dilutive equity shares are adjusted retrospectively for all periods presented for any share splits and bonus shares issues including for changes effected prior to the approval of the financial statements by the Board of Directors. 1.10 Recent accounting pronouncements 1.10.1 Standards issued but not yet effective IFRS 9 Financial Instruments: In November 2009, the International Accounting Standards Board issued IFRS 9, Financial Instruments: Recognition and Measurement, to reduce the complexity of the current rules on financial instruments as mandated in IAS 39. IFRS 9 has fewer classification and measurement categories as compared to IAS 39 and has eliminated the categories of held to maturity, available for sale and loans and receivables. Further it eliminates the rule-based requirement of segregating embedded derivatives and tainting rules pertaining to held to maturity investments. For an investment in an equity instrument which is not held for trading, IFRS 9 permits an irrevocable election, on initial recognition, on an individual share-by-share basis, to present all fair value changes from the investment in other comprehensive income. No amount recognized in other comprehensive income would ever be reclassified to profit or loss. IFRS 9, was further amended in October 2010, and such amendment introduced requirements on accounting for financial liabilities. This amendment addresses the issue of volatility in the profit or loss due to changes in the fair value of an entity’s own debt. It requires the entity, which chooses to measure a liability at fair value, to present the portion of the fair value change attributable to the entity’s own credit risk in the other comprehensive income. The effective date for adoption of IFRS 9 is annual periods beginning on or after January 1, 2018, though early adoption is permitted. The Group is currently evaluating the requirements of IFRS 9, and has not yet determined the impact on the condensed consolidated interim financial statements. IFRS 15 Revenue from Contracts with Customers: In May 2014, the International Accounting Standards Board issued IFRS 15, Revenue from Contracts with Customers. The core principle of the new standard is that an entity should recognise revenue to depict the transfer of promised goods or services to customers in an amount that reflects the consideration to which the entity expects to be entitled in exchange for those goods or services. Further the new standard requires enhanced disclosures about the nature, amount, timing and uncertainty of revenue and cash flows arising from the entity’s contracts with customers. The standard permits the use of either the retrospective or cumulative effect transition method. The effective date for adoption of IFRS 15 is annual periods beginning on or after January 1, 2017, though early adoption is permitted. The Group has not yet selected a transition method and has not yet evaluated the impact of IFRS 15 on the condensed consolidated interim financial statements.
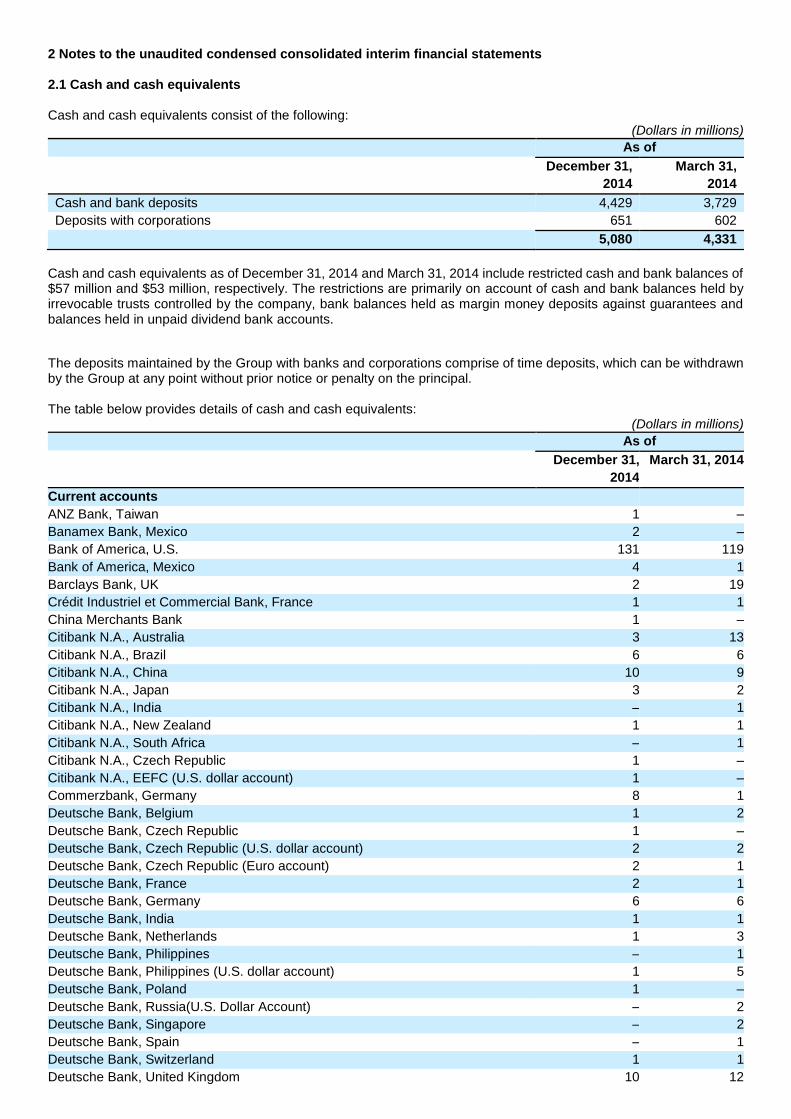
2 Notes to the unaudited condensed consolidated interim financial statements 2.1 Cash and cash equivalents Cash and cash equivalents consist of the following:
(Dollars in millions)
As of
December 31,
2014
March 31,
2014
Cash and bank deposits 4,429 3,729
Deposits with corporations 651 602
5,080 4,331
Cash and cash equivalents as of December 31, 2014 and March 31, 2014 include restricted cash and bank balances of $57 million and $53 million, respectively. The restrictions are primarily on account of cash and bank balances held by irrevocable trusts controlled by the company, bank balances held as margin money deposits against guarantees and balances held in unpaid dividend bank accounts.
The deposits maintained by the Group with banks and corporations comprise of time deposits, which can be withdrawn by the Group at any point without prior notice or penalty on the principal. The table below provides details of cash and cash equivalents:
(Dollars in millions)
As of
December 31,
2014
March 31, 2014
Current accounts
ANZ Bank, Taiwan 1 –
Banamex Bank, Mexico 2 –
Bank of America, U.S. 131 119
Bank of America, Mexico 4 1
Barclays Bank, UK 2 19
Crédit Industriel et Commercial Bank, France 1 1
China Merchants Bank 1 –
Citibank N.A., Australia 3 13
Citibank N.A., Brazil 6 6
Citibank N.A., China 10 9
Citibank N.A., Japan 3 2
Citibank N.A., India – 1
Citibank N.A., New Zealand 1 1
Citibank N.A., South Africa – 1
Citibank N.A., Czech Republic 1 –
Citibank N.A., EEFC (U.S. dollar account) 1 –
Commerzbank, Germany 8 1
Deutsche Bank, Belgium 1 2
Deutsche Bank, Czech Republic 1 –
Deutsche Bank, Czech Republic (U.S. dollar account) 2 2
Deutsche Bank, Czech Republic (Euro account) 2 1
Deutsche Bank, France 2 1
Deutsche Bank, Germany 6 6
Deutsche Bank, India 1 1
Deutsche Bank, Netherlands 1 3
Deutsche Bank, Philippines – 1
Deutsche Bank, Philippines (U.S. dollar account) 1 5
Deutsche Bank, Poland 1 –
Deutsche Bank, Russia(U.S. Dollar Account) – 2
Deutsche Bank, Singapore – 2
Deutsche Bank, Spain – 1
Deutsche Bank, Switzerland 1 1
Deutsche Bank, United Kingdom 10 12
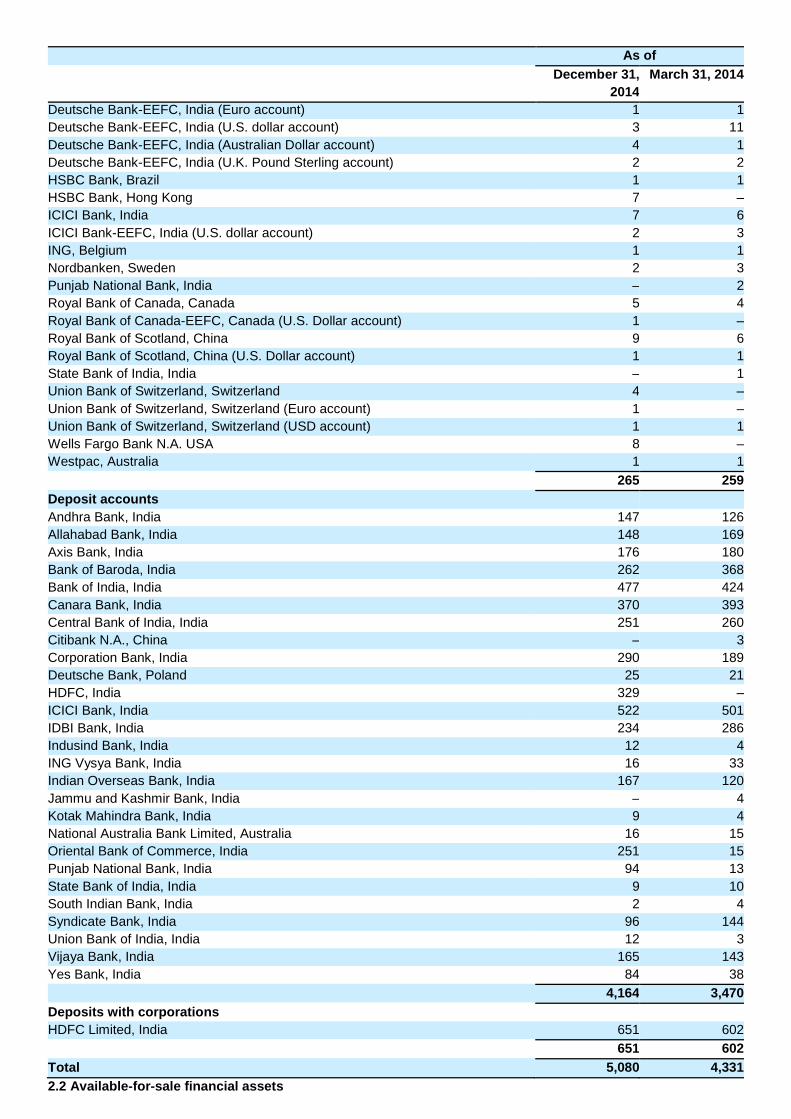
As of
December 31,
2014
March 31, 2014
Deutsche Bank-EEFC, India (Euro account) 1 1
Deutsche Bank-EEFC, India (U.S. dollar account) 3 11
Deutsche Bank-EEFC, India (Australian Dollar account) 4 1
Deutsche Bank-EEFC, India (U.K. Pound Sterling account) 2 2
HSBC Bank, Brazil 1 1
HSBC Bank, Hong Kong 7 –
ICICI Bank, India 7 6
ICICI Bank-EEFC, India (U.S. dollar account) 2 3
ING, Belgium 1 1
Nordbanken, Sweden 2 3
Punjab National Bank, India – 2
Royal Bank of Canada, Canada 5 4
Royal Bank of Canada-EEFC, Canada (U.S. Dollar account) 1 –
Royal Bank of Scotland, China 9 6
Royal Bank of Scotland, China (U.S. Dollar account) 1 1
State Bank of India, India – 1
Union Bank of Switzerland, Switzerland 4 –
Union Bank of Switzerland, Switzerland (Euro account) 1 –
Union Bank of Switzerland, Switzerland (USD account) 1 1
Wells Fargo Bank N.A. USA 8 –
Westpac, Australia 1 1
265 259
Deposit accounts
Andhra Bank, India 147 126
Allahabad Bank, India 148 169
Axis Bank, India 176 180
Bank of Baroda, India 262 368
Bank of India, India 477 424
Canara Bank, India 370 393
Central Bank of India, India 251 260
Citibank N.A., China – 3
Corporation Bank, India 290 189
Deutsche Bank, Poland 25 21
HDFC, India 329 –
ICICI Bank, India 522 501
IDBI Bank, India 234 286
Indusind Bank, India 12 4
ING Vysya Bank, India 16 33
Indian Overseas Bank, India 167 120
Jammu and Kashmir Bank, India – 4
Kotak Mahindra Bank, India 9 4
National Australia Bank Limited, Australia 16 15
Oriental Bank of Commerce, India 251 15
Punjab National Bank, India 94 13
State Bank of India, India 9 10
South Indian Bank, India 2 4
Syndicate Bank, India 96 144
Union Bank of India, India 12 3
Vijaya Bank, India 165 143
Yes Bank, India 84 38
4,164 3,470
Deposits with corporations
HDFC Limited, India 651 602
651 602
Total 5,080 4,331
2.2 Available-for-sale financial assets
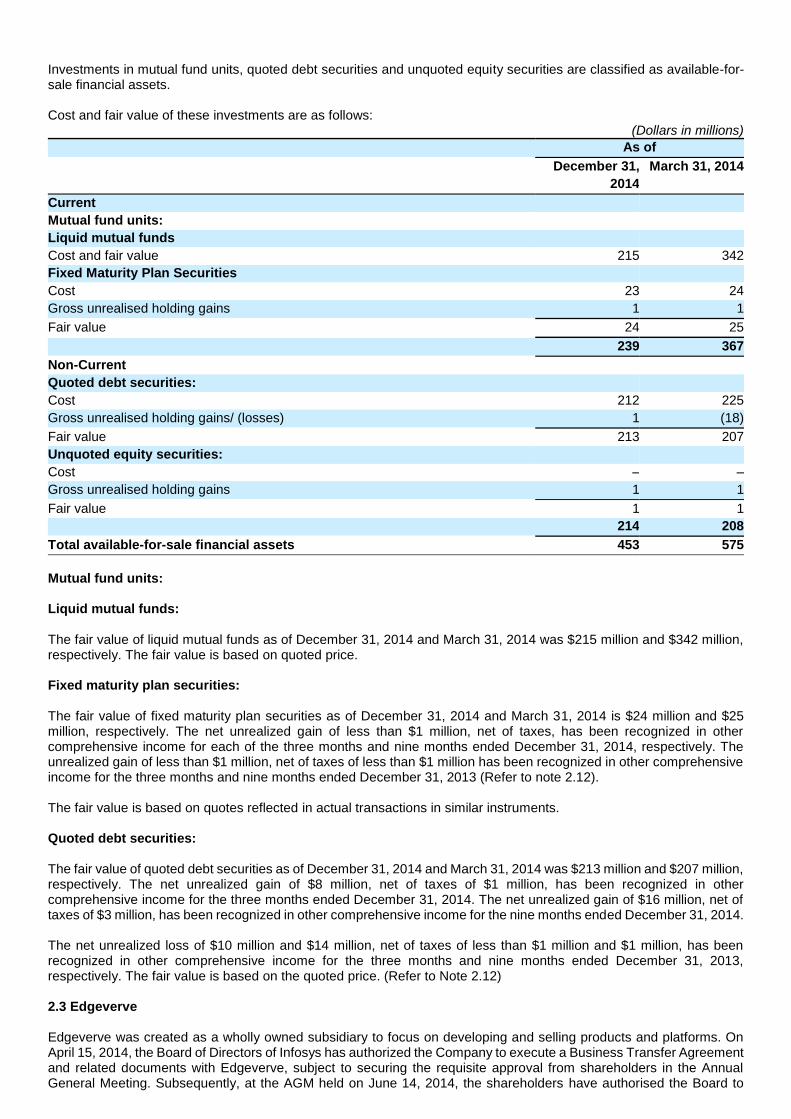
Investments in mutual fund units, quoted debt securities and unquoted equity securities are classified as available-for-sale financial assets.
Cost and fair value of these investments are as follows:
(Dollars in millions)
As of
December 31,
2014
March 31, 2014
Current
Mutual fund units:
Liquid mutual funds
Cost and fair value 215 342
Fixed Maturity Plan Securities
Cost 23 24
Gross unrealised holding gains 1 1
Fair value 24 25
239 367
Non-Current
Quoted debt securities:
Cost 212 225
Gross unrealised holding gains/ (losses) 1 (18)
Fair value 213 207
Unquoted equity securities:
Cost – –
Gross unrealised holding gains 1 1
Fair value 1 1
214 208
Total available-for-sale financial assets 453 575
Mutual fund units: Liquid mutual funds: The fair value of liquid mutual funds as of December 31, 2014 and March 31, 2014 was $215 million and $342 million, respectively. The fair value is based on quoted price. Fixed maturity plan securities: The fair value of fixed maturity plan securities as of December 31, 2014 and March 31, 2014 is $24 million and $25 million, respectively. The net unrealized gain of less than $1 million, net of taxes, has been recognized in other comprehensive income for each of the three months and nine months ended December 31, 2014, respectively. The unrealized gain of less than $1 million, net of taxes of less than $1 million has been recognized in other comprehensive income for the three months and nine months ended December 31, 2013 (Refer to note 2.12). The fair value is based on quotes reflected in actual transactions in similar instruments. Quoted debt securities: The fair value of quoted debt securities as of December 31, 2014 and March 31, 2014 was $213 million and $207 million, respectively. The net unrealized gain of $8 million, net of taxes of $1 million, has been recognized in other comprehensive income for the three months ended December 31, 2014. The net unrealized gain of $16 million, net of taxes of $3 million, has been recognized in other comprehensive income for the nine months ended December 31, 2014. The net unrealized loss of $10 million and $14 million, net of taxes of less than $1 million and $1 million, has been recognized in other comprehensive income for the three months and nine months ended December 31, 2013, respectively. The fair value is based on the quoted price. (Refer to Note 2.12) 2.3 Edgeverve Edgeverve was created as a wholly owned subsidiary to focus on developing and selling products and platforms. On April 15, 2014, the Board of Directors of Infosys has authorized the Company to execute a Business Transfer Agreement and related documents with Edgeverve, subject to securing the requisite approval from shareholders in the Annual General Meeting. Subsequently, at the AGM held on June 14, 2014, the shareholders have authorised the Board to
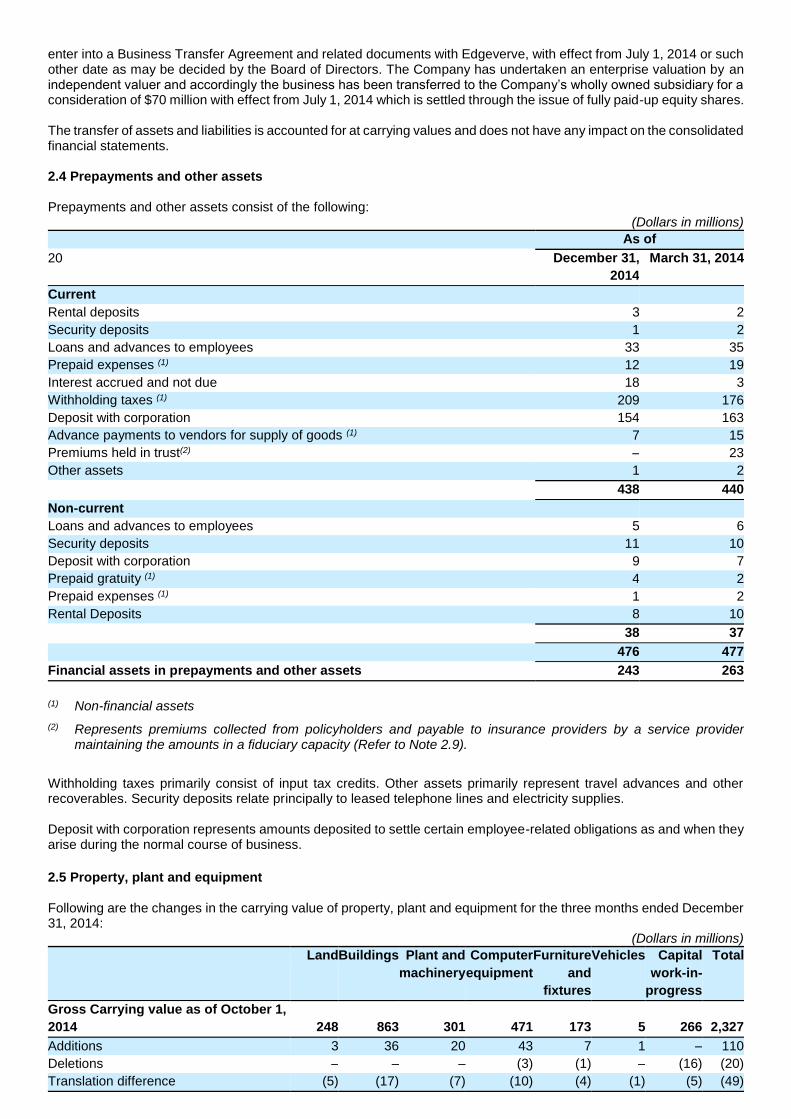
enter into a Business Transfer Agreement and related documents with Edgeverve, with effect from July 1, 2014 or such other date as may be decided by the Board of Directors. The Company has undertaken an enterprise valuation by an independent valuer and accordingly the business has been transferred to the Company’s wholly owned subsidiary for a consideration of $70 million with effect from July 1, 2014 which is settled through the issue of fully paid-up equity shares. The transfer of assets and liabilities is accounted for at carrying values and does not have any impact on the consolidated financial statements.
2.4 Prepayments and other assets Prepayments and other assets consist of the following:
(Dollars in millions)
As of
20 December 31,
2014
March 31, 2014
Current
Rental deposits 3 2
Security deposits 1 2
Loans and advances to employees 33 35
Prepaid expenses (1) 12 19
Interest accrued and not due 18 3
Withholding taxes (1) 209 176
Deposit with corporation 154 163
Advance payments to vendors for supply of goods (1) 7 15
Premiums held in trust(2) – 23
Other assets 1 2
438 440
Non-current
Loans and advances to employees 5 6
Security deposits 11 10
Deposit with corporation 9 7
Prepaid gratuity (1) 4 2
Prepaid expenses (1) 1 2
Rental Deposits 8 10
38 37
476 477
Financial assets in prepayments and other assets 243 263
(1) Non-financial assets
(2) Represents premiums collected from policyholders and payable to insurance providers by a service provider maintaining the amounts in a fiduciary capacity (Refer to Note 2.9).
Withholding taxes primarily consist of input tax credits. Other assets primarily represent travel advances and other recoverables. Security deposits relate principally to leased telephone lines and electricity supplies. Deposit with corporation represents amounts deposited to settle certain employee-related obligations as and when they arise during the normal course of business.
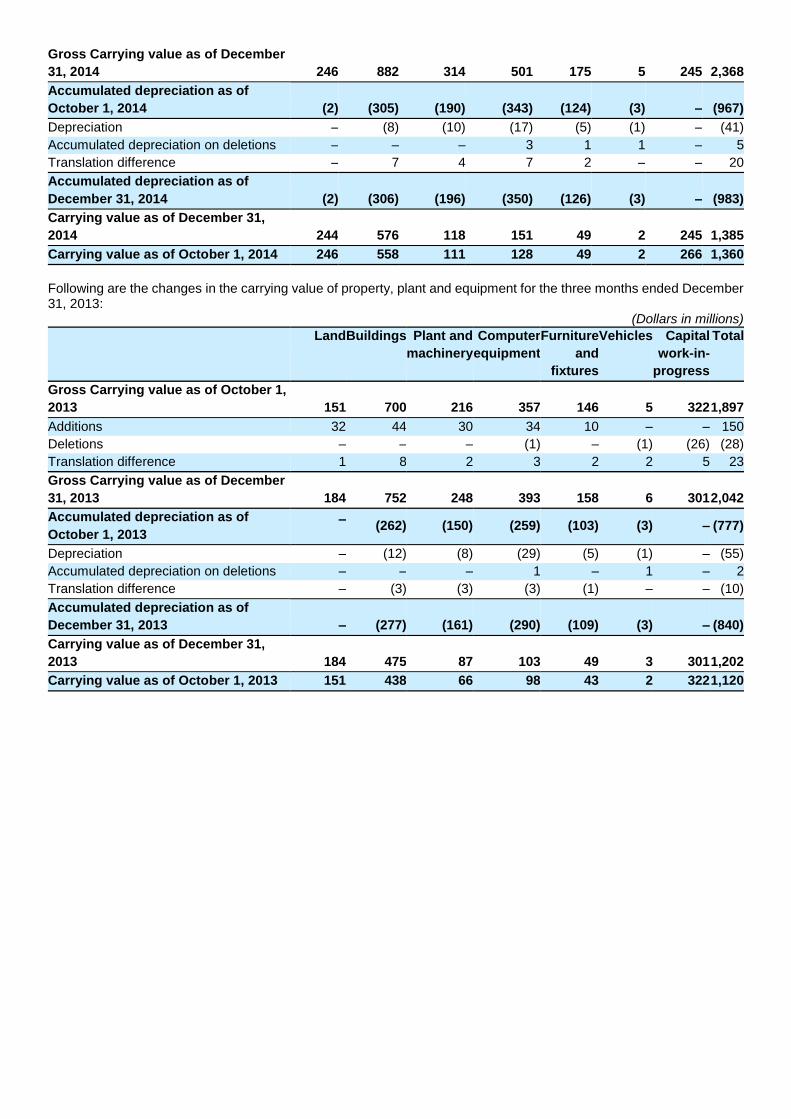
2.5 Property, plant and equipment Following are the changes in the carrying value of property, plant and equipment for the three months ended December 31, 2014:
(Dollars in millions)
Land Buildings Plant and
machinery
Computer
equipment
Furniture
and
fixtures
Vehicles Capital
work-in-
progress
Total
Gross Carrying value as of October 1,
2014 248 863 301 471 173 5 266 2,327
Additions 3 36 20 43 7 1 – 110
Deletions – – – (3) (1) – (16) (20)
Translation difference (5) (17) (7) (10) (4) (1) (5) (49)
Gross Carrying value as of December
31, 2014 246 882 314 501 175 5 245 2,368
Accumulated depreciation as of
October 1, 2014 (2) (305) (190) (343) (124) (3) – (967)
Depreciation – (8) (10) (17) (5) (1) – (41)
Accumulated depreciation on deletions – – – 3 1 1 – 5
Translation difference – 7 4 7 2 – – 20
Accumulated depreciation as of
December 31, 2014 (2) (306) (196) (350) (126) (3) – (983)
Carrying value as of December 31,
2014 244 576 118 151 49 2 245 1,385
Carrying value as of October 1, 2014 246 558 111 128 49 2 266 1,360
Following are the changes in the carrying value of property, plant and equipment for the three months ended December 31, 2013:
(Dollars in millions)
Land Buildings Plant and
machinery
Computer
equipment
Furniture
and
fixtures
Vehicles Capital
work-in-
progress
Total
Gross Carrying value as of October 1,
2013 151 700 216 357 146 5 322 1,897
Additions 32 44 30 34 10 – – 150
Deletions – – – (1) – (1) (26) (28)
Translation difference 1 8 2 3 2 2 5 23
Gross Carrying value as of December
31, 2013 184 752 248 393 158 6 301 2,042
Accumulated depreciation as of
October 1, 2013 –
(262) (150) (259) (103) (3) – (777)
Depreciation – (12) (8) (29) (5) (1) – (55)
Accumulated depreciation on deletions – – – 1 – 1 – 2
Translation difference – (3) (3) (3) (1) – – (10)
Accumulated depreciation as of
December 31, 2013 – (277) (161) (290) (109) (3) – (840)
Carrying value as of December 31,
2013 184 475 87 103 49 3 301 1,202
Carrying value as of October 1, 2013 151 438 66 98 43 2 322 1,120
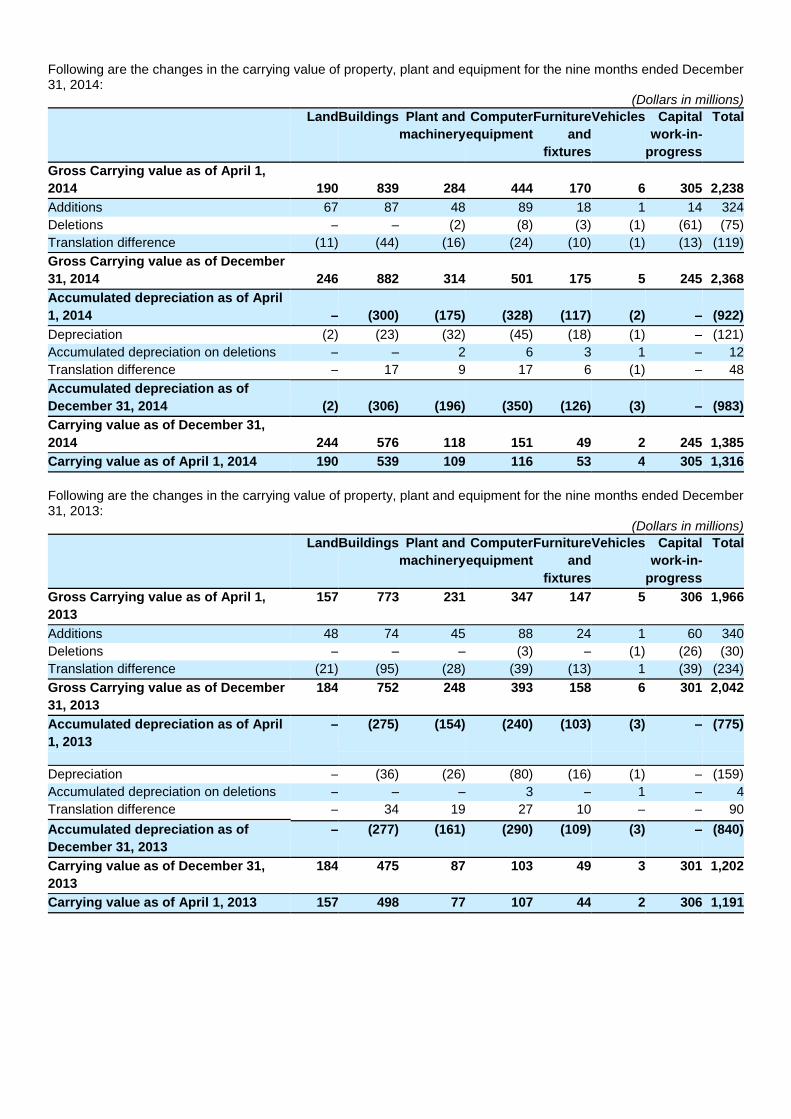
Following are the changes in the carrying value of property, plant and equipment for the nine months ended December 31, 2014:
(Dollars in millions)
Land Buildings Plant and
machinery
Computer
equipment
Furniture
and
fixtures
Vehicles Capital
work-in-
progress
Total
Gross Carrying value as of April 1,
2014 190 839 284 444 170 6 305 2,238
Additions 67 87 48 89 18 1 14 324
Deletions – – (2) (8) (3) (1) (61) (75)
Translation difference (11) (44) (16) (24) (10) (1) (13) (119)
Gross Carrying value as of December
31, 2014 246 882 314 501 175 5 245 2,368
Accumulated depreciation as of April
1, 2014 – (300) (175) (328) (117) (2) – (922)
Depreciation (2) (23) (32) (45) (18) (1) – (121)
Accumulated depreciation on deletions – – 2 6 3 1 – 12
Translation difference – 17 9 17 6 (1) – 48
Accumulated depreciation as of
December 31, 2014 (2) (306) (196) (350) (126) (3) – (983)
Carrying value as of December 31,
2014 244 576 118 151 49 2 245 1,385
Carrying value as of April 1, 2014 190 539 109 116 53 4 305 1,316
Following are the changes in the carrying value of property, plant and equipment for the nine months ended December 31, 2013:
(Dollars in millions)
Land Buildings Plant and
machinery
Computer
equipment
Furniture
and
fixtures
Vehicles Capital
work-in-
progress
Total
Gross Carrying value as of April 1,
2013
157 773 231 347 147 5 306 1,966
Additions 48 74 45 88 24 1 60 340
Deletions – – – (3) – (1) (26) (30)
Translation difference (21) (95) (28) (39) (13) 1 (39) (234)
Gross Carrying value as of December
31, 2013
184 752 248 393 158 6 301 2,042
Accumulated depreciation as of April
1, 2013
– (275) (154) (240) (103) (3) – (775)
Depreciation – (36) (26) (80) (16) (1) – (159)
Accumulated depreciation on deletions – – – 3 – 1 – 4
Translation difference – 34 19 27 10 – – 90
Accumulated depreciation as of
December 31, 2013
– (277) (161) (290) (109) (3) – (840)
Carrying value as of December 31,
2013
184 475 87 103 49 3 301 1,202
Carrying value as of April 1, 2013 157 498 77 107 44 2 306 1,191
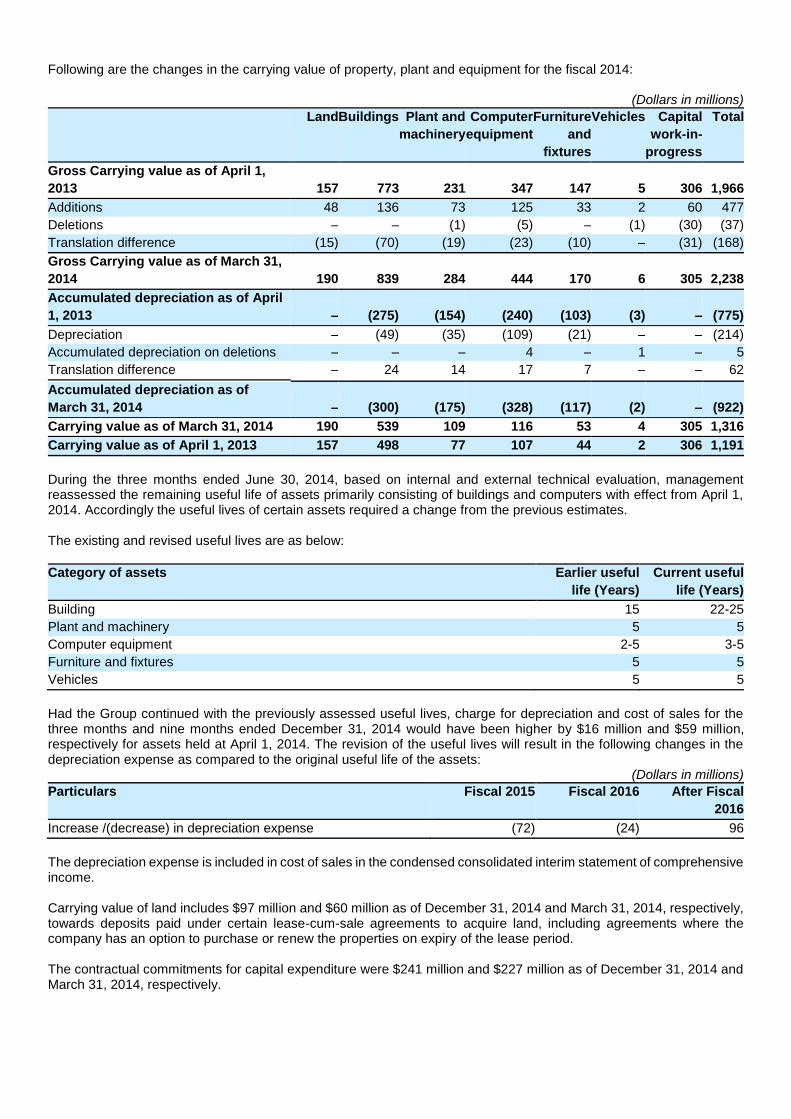
Following are the changes in the carrying value of property, plant and equipment for the fiscal 2014:
(Dollars in millions)
Land Buildings Plant and
machinery
Computer
equipment
Furniture
and
fixtures
Vehicles Capital
work-in-
progress
Total
Gross Carrying value as of April 1,
2013 157 773 231 347 147 5 306 1,966
Additions 48 136 73 125 33 2 60 477
Deletions – – (1) (5) – (1) (30) (37)
Translation difference (15) (70) (19) (23) (10) – (31) (168)
Gross Carrying value as of March 31,
2014 190 839 284 444 170 6 305 2,238
Accumulated depreciation as of April
1, 2013 – (275) (154) (240) (103) (3) – (775)
Depreciation – (49) (35) (109) (21) – – (214)
Accumulated depreciation on deletions – – – 4 – 1 – 5
Translation difference – 24 14 17 7 – – 62
Accumulated depreciation as of
March 31, 2014 – (300) (175) (328) (117) (2) – (922)
Carrying value as of March 31, 2014 190 539 109 116 53 4 305 1,316
Carrying value as of April 1, 2013 157 498 77 107 44 2 306 1,191
During the three months ended June 30, 2014, based on internal and external technical evaluation, management reassessed the remaining useful life of assets primarily consisting of buildings and computers with effect from April 1, 2014. Accordingly the useful lives of certain assets required a change from the previous estimates. The existing and revised useful lives are as below:
Category of assets Earlier useful
life (Years)
Current useful
life (Years)
Building 15 22-25
Plant and machinery 5 5
Computer equipment 2-5 3-5
Furniture and fixtures 5 5
Vehicles 5 5
Had the Group continued with the previously assessed useful lives, charge for depreciation and cost of sales for the three months and nine months ended December 31, 2014 would have been higher by $16 million and $59 million, respectively for assets held at April 1, 2014. The revision of the useful lives will result in the following changes in the depreciation expense as compared to the original useful life of the assets:
(Dollars in millions)
Particulars Fiscal 2015 Fiscal 2016 After Fiscal
2016
Increase /(decrease) in depreciation expense (72) (24) 96
The depreciation expense is included in cost of sales in the condensed consolidated interim statement of comprehensive income. Carrying value of land includes $97 million and $60 million as of December 31, 2014 and March 31, 2014, respectively, towards deposits paid under certain lease-cum-sale agreements to acquire land, including agreements where the company has an option to purchase or renew the properties on expiry of the lease period. The contractual commitments for capital expenditure were $241 million and $227 million as of December 31, 2014 and March 31, 2014, respectively.
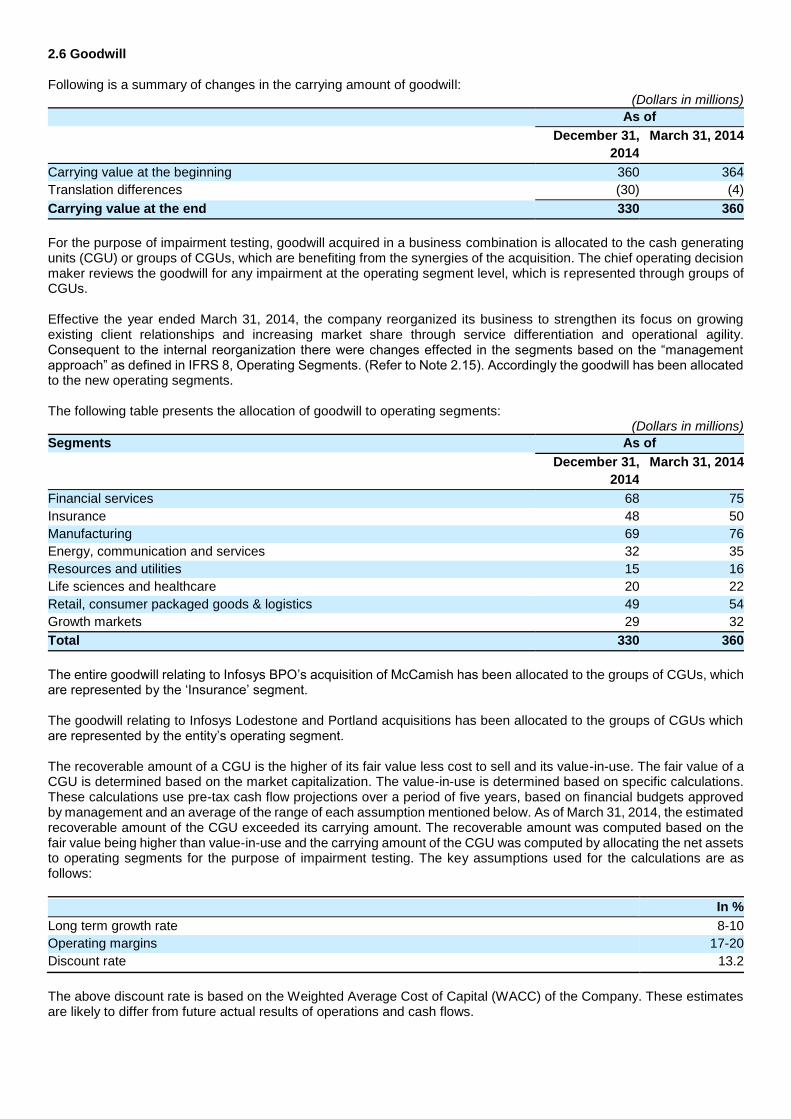
2.6 Goodwill Following is a summary of changes in the carrying amount of goodwill:
(Dollars in millions)
As of
December 31,
2014
March 31, 2014
Carrying value at the beginning 360 364
Translation differences (30) (4)
Carrying value at the end 330 360
For the purpose of impairment testing, goodwill acquired in a business combination is allocated to the cash generating units (CGU) or groups of CGUs, which are benefiting from the synergies of the acquisition. The chief operating decision maker reviews the goodwill for any impairment at the operating segment level, which is represented through groups of CGUs. Effective the year ended March 31, 2014, the company reorganized its business to strengthen its focus on growing existing client relationships and increasing market share through service differentiation and operational agility. Consequent to the internal reorganization there were changes effected in the segments based on the “management approach” as defined in IFRS 8, Operating Segments. (Refer to Note 2.15). Accordingly the goodwill has been allocated to the new operating segments. The following table presents the allocation of goodwill to operating segments:
(Dollars in millions)
Segments As of
December 31,
2014
March 31, 2014
Financial services 68 75
Insurance 48 50
Manufacturing 69 76
Energy, communication and services 32 35
Resources and utilities 15 16
Life sciences and healthcare 20 22
Retail, consumer packaged goods & logistics 49 54
Growth markets 29 32
Total 330 360
The entire goodwill relating to Infosys BPO’s acquisition of McCamish has been allocated to the groups of CGUs, which are represented by the ‘Insurance’ segment. The goodwill relating to Infosys Lodestone and Portland acquisitions has been allocated to the groups of CGUs which are represented by the entity’s operating segment. The recoverable amount of a CGU is the higher of its fair value less cost to sell and its value-in-use. The fair value of a CGU is determined based on the market capitalization. The value-in-use is determined based on specific calculations. These calculations use pre-tax cash flow projections over a period of five years, based on financial budgets approved by management and an average of the range of each assumption mentioned below. As of March 31, 2014, the estimated recoverable amount of the CGU exceeded its carrying amount. The recoverable amount was computed based on the fair value being higher than value-in-use and the carrying amount of the CGU was computed by allocating the net assets to operating segments for the purpose of impairment testing. The key assumptions used for the calculations are as follows:
In %
Long term growth rate 8-10
Operating margins 17-20
Discount rate 13.2
The above discount rate is based on the Weighted Average Cost of Capital (WACC) of the Company. These estimates are likely to differ from future actual results of operations and cash flows.
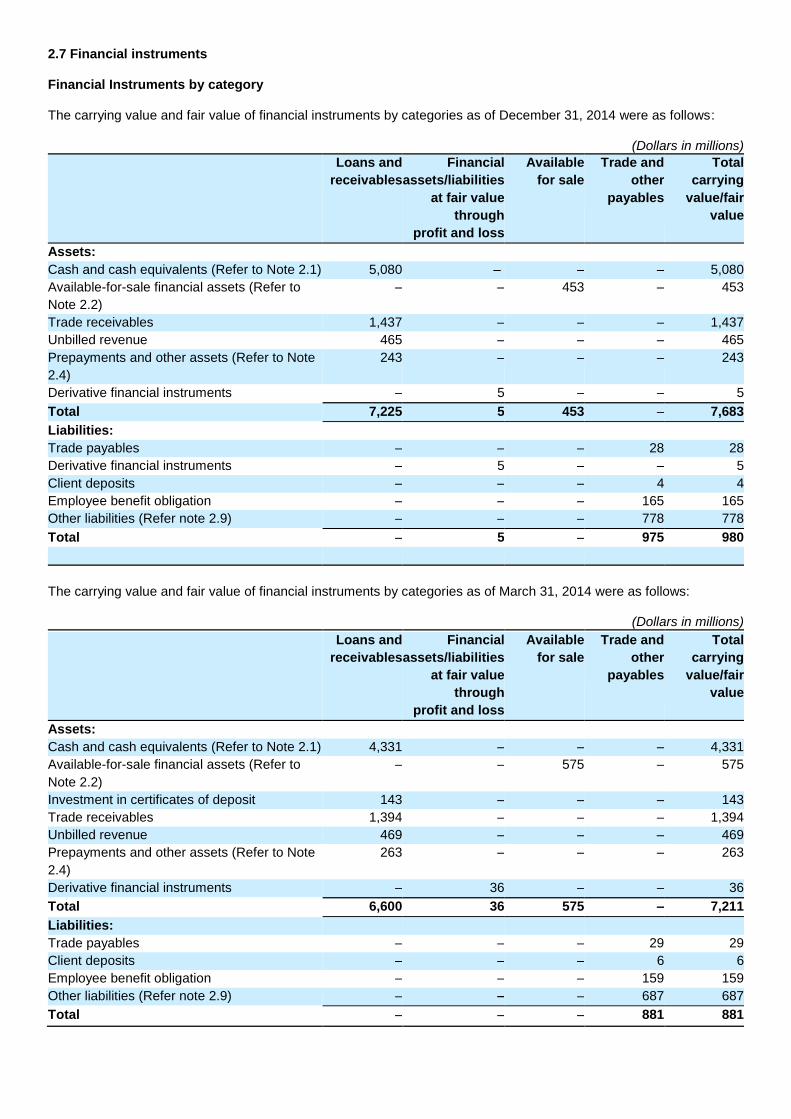
2.7 Financial instruments Financial Instruments by category The carrying value and fair value of financial instruments by categories as of December 31, 2014 were as follows:
(Dollars in millions)
Loans and
receivables
Financial
assets/liabilities
at fair value
through
profit and loss
Available
for sale
Trade and
other
payables
Total
carrying
value/fair
value
Assets:
Cash and cash equivalents (Refer to Note 2.1) 5,080 – – – 5,080
Available-for-sale financial assets (Refer to
Note 2.2)
– – 453 – 453
Trade receivables 1,437 – – – 1,437
Unbilled revenue 465 – – – 465
Prepayments and other assets (Refer to Note
2.4)
243 – – – 243
Derivative financial instruments – 5 – – 5
Total 7,225 5 453 – 7,683
Liabilities:
Trade payables – – – 28 28
Derivative financial instruments – 5 – – 5
Client deposits – – – 4 4
Employee benefit obligation – – – 165 165
Other liabilities (Refer note 2.9) – – – 778 778
Total – 5 – 975 980
The carrying value and fair value of financial instruments by categories as of March 31, 2014 were as follows:
(Dollars in millions)
Loans and
receivables
Financial
assets/liabilities
at fair value
through
profit and loss
Available
for sale
Trade and
other
payables
Total
carrying
value/fair
value
Assets:
Cash and cash equivalents (Refer to Note 2.1) 4,331 – – – 4,331
Available-for-sale financial assets (Refer to
Note 2.2)
– – 575 – 575
Investment in certificates of deposit 143 – – – 143
Trade receivables 1,394 – – – 1,394
Unbilled revenue 469 – – – 469
Prepayments and other assets (Refer to Note
2.4)
263 – – – 263
Derivative financial instruments – 36 – – 36
Total 6,600 36 575 – 7,211
Liabilities:
Trade payables – – – 29 29
Client deposits – – – 6 6
Employee benefit obligation – – – 159 159
Other liabilities (Refer note 2.9) – – – 687 687
Total – – – 881 881
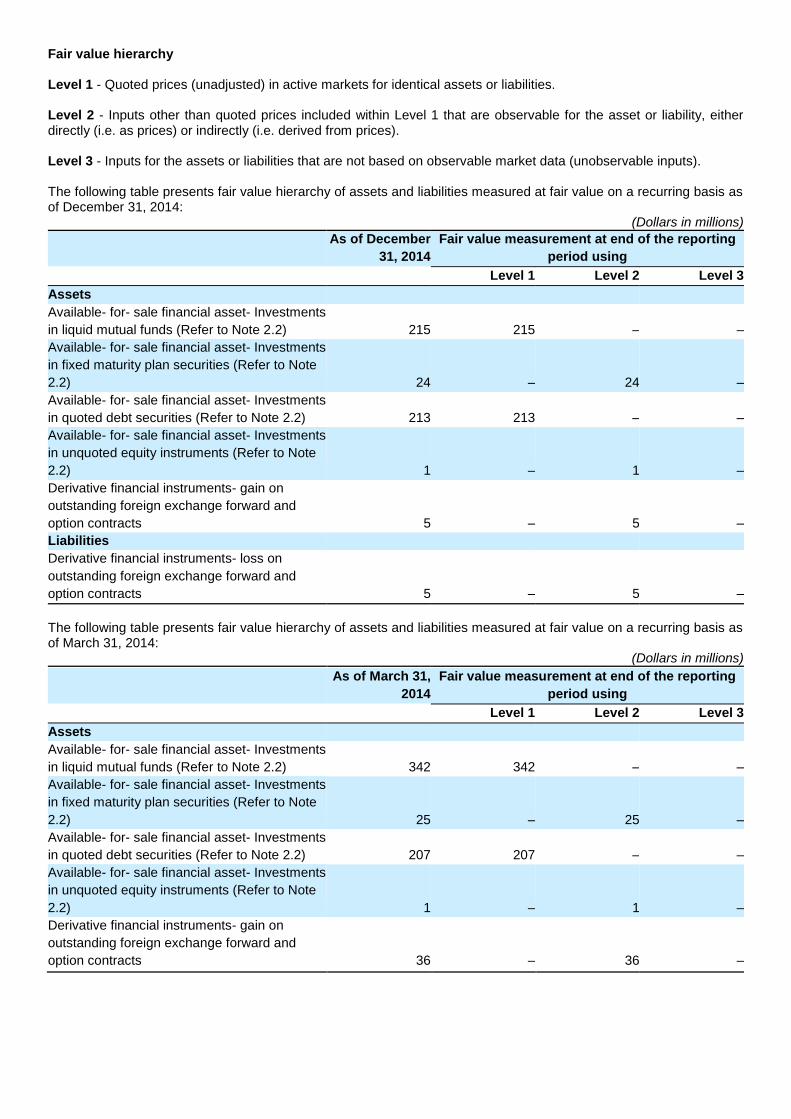
Fair value hierarchy Level 1 - Quoted prices (unadjusted) in active markets for identical assets or liabilities. Level 2 - Inputs other than quoted prices included within Level 1 that are observable for the asset or liability, either directly (i.e. as prices) or indirectly (i.e. derived from prices). Level 3 - Inputs for the assets or liabilities that are not based on observable market data (unobservable inputs). The following table presents fair value hierarchy of assets and liabilities measured at fair value on a recurring basis as of December 31, 2014:
(Dollars in millions)
As of December
31, 2014
Fair value measurement at end of the reporting
period using
Level 1 Level 2 Level 3
Assets
Available- for- sale financial asset- Investments
in liquid mutual funds (Refer to Note 2.2) 215 215 – –
Available- for- sale financial asset- Investments
in fixed maturity plan securities (Refer to Note
2.2) 24 – 24 –
Available- for- sale financial asset- Investments
in quoted debt securities (Refer to Note 2.2) 213 213 – –
Available- for- sale financial asset- Investments
in unquoted equity instruments (Refer to Note
2.2) 1 – 1 –
Derivative financial instruments- gain on
outstanding foreign exchange forward and
option contracts 5 – 5 –
Liabilities
Derivative financial instruments- loss on
outstanding foreign exchange forward and
option contracts 5 – 5 –
The following table presents fair value hierarchy of assets and liabilities measured at fair value on a recurring basis as of March 31, 2014:
(Dollars in millions)
As of March 31,
2014
Fair value measurement at end of the reporting
period using
Level 1 Level 2 Level 3
Assets
Available- for- sale financial asset- Investments
in liquid mutual funds (Refer to Note 2.2) 342 342 – –
Available- for- sale financial asset- Investments
in fixed maturity plan securities (Refer to Note
2.2) 25 – 25 –
Available- for- sale financial asset- Investments
in quoted debt securities (Refer to Note 2.2) 207 207 – –
Available- for- sale financial asset- Investments
in unquoted equity instruments (Refer to Note
2.2) 1 – 1 –
Derivative financial instruments- gain on
outstanding foreign exchange forward and
option contracts 36 – 36 –
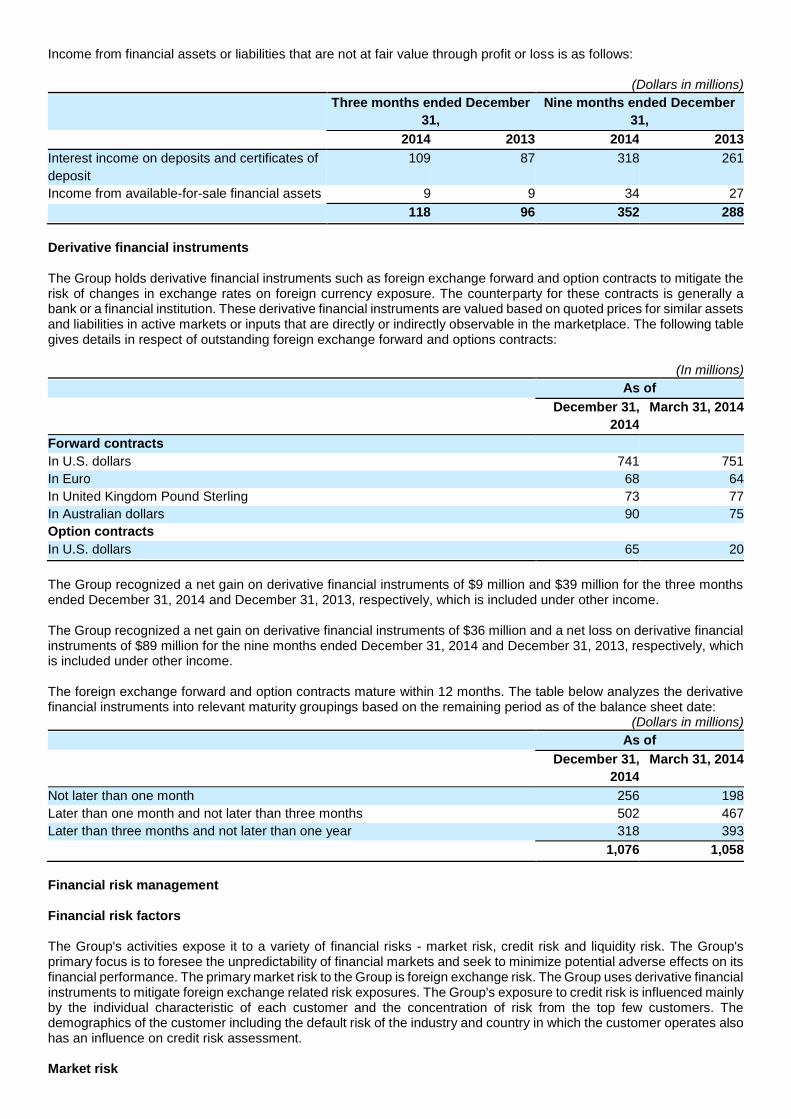
Income from financial assets or liabilities that are not at fair value through profit or loss is as follows:
(Dollars in millions)
Three months ended December
31,
Nine months ended December
31,
2014 2013 2014 2013
Interest income on deposits and certificates of
deposit
109 87 318 261
Income from available-for-sale financial assets 9 9 34 27
118 96 352 288
Derivative financial instruments The Group holds derivative financial instruments such as foreign exchange forward and option contracts to mitigate the risk of changes in exchange rates on foreign currency exposure. The counterparty for these contracts is generally a bank or a financial institution. These derivative financial instruments are valued based on quoted prices for similar assets and liabilities in active markets or inputs that are directly or indirectly observable in the marketplace. The following table gives details in respect of outstanding foreign exchange forward and options contracts:
(In millions)
As of
December 31,
2014
March 31, 2014
Forward contracts
In U.S. dollars 741 751
In Euro 68 64
In United Kingdom Pound Sterling 73 77
In Australian dollars 90 75
Option contracts
In U.S. dollars 65 20
The Group recognized a net gain on derivative financial instruments of $9 million and $39 million for the three months ended December 31, 2014 and December 31, 2013, respectively, which is included under other income. The Group recognized a net gain on derivative financial instruments of $36 million and a net loss on derivative financial instruments of $89 million for the nine months ended December 31, 2014 and December 31, 2013, respectively, which is included under other income. The foreign exchange forward and option contracts mature within 12 months. The table below analyzes the derivative financial instruments into relevant maturity groupings based on the remaining period as of the balance sheet date:
(Dollars in millions)
As of
December 31,
2014
March 31, 2014
Not later than one month 256 198
Later than one month and not later than three months 502 467
Later than three months and not later than one year 318 393
1,076 1,058
Financial risk management Financial risk factors The Group's activities expose it to a variety of financial risks - market risk, credit risk and liquidity risk. The Group's primary focus is to foresee the unpredictability of financial markets and seek to minimize potential adverse effects on its financial performance. The primary market risk to the Group is foreign exchange risk. The Group uses derivative financial instruments to mitigate foreign exchange related risk exposures. The Group's exposure to credit risk is influenced mainly by the individual characteristic of each customer and the concentration of risk from the top few customers. The demographics of the customer including the default risk of the industry and country in which the customer operates also has an influence on credit risk assessment. Market risk
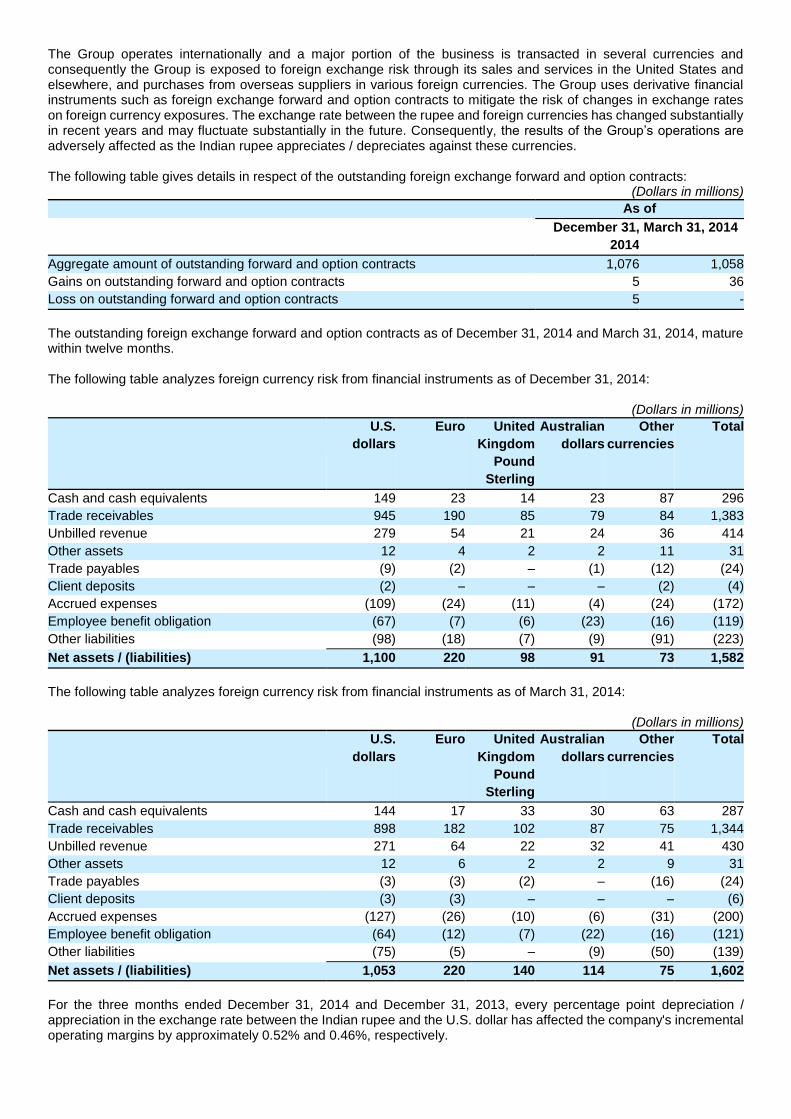
The Group operates internationally and a major portion of the business is transacted in several currencies and consequently the Group is exposed to foreign exchange risk through its sales and services in the United States and elsewhere, and purchases from overseas suppliers in various foreign currencies. The Group uses derivative financial instruments such as foreign exchange forward and option contracts to mitigate the risk of changes in exchange rates on foreign currency exposures. The exchange rate between the rupee and foreign currencies has changed substantially in recent years and may fluctuate substantially in the future. Consequently, the results of the Group’s operations are adversely affected as the Indian rupee appreciates / depreciates against these currencies. The following table gives details in respect of the outstanding foreign exchange forward and option contracts:
(Dollars in millions)
As of
December 31,
2014
March 31, 2014
Aggregate amount of outstanding forward and option contracts 1,076 1,058
Gains on outstanding forward and option contracts 5 36
Loss on outstanding forward and option contracts 5 -
The outstanding foreign exchange forward and option contracts as of December 31, 2014 and March 31, 2014, mature within twelve months. The following table analyzes foreign currency risk from financial instruments as of December 31, 2014:
(Dollars in millions)
U.S.
dollars
Euro United
Kingdom
Pound
Sterling
Australian
dollars
Other
currencies
Total
Cash and cash equivalents 149 23 14 23 87 296
Trade receivables 945 190 85 79 84 1,383
Unbilled revenue 279 54 21 24 36 414
Other assets 12 4 2 2 11 31
Trade payables (9) (2) – (1) (12) (24)
Client deposits (2) – – – (2) (4)
Accrued expenses (109) (24) (11) (4) (24) (172)
Employee benefit obligation (67) (7) (6) (23) (16) (119)
Other liabilities (98) (18) (7) (9) (91) (223)
Net assets / (liabilities) 1,100 220 98 91 73 1,582
The following table analyzes foreign currency risk from financial instruments as of March 31, 2014:
(Dollars in millions)
U.S.
dollars
Euro United
Kingdom
Pound
Sterling
Australian
dollars
Other
currencies
Total
Cash and cash equivalents 144 17 33 30 63 287
Trade receivables 898 182 102 87 75 1,344
Unbilled revenue 271 64 22 32 41 430
Other assets 12 6 2 2 9 31
Trade payables (3) (3) (2) – (16) (24)
Client deposits (3) (3) – – – (6)
Accrued expenses (127) (26) (10) (6) (31) (200)
Employee benefit obligation (64) (12) (7) (22) (16) (121)
Other liabilities (75) (5) – (9) (50) (139)
Net assets / (liabilities) 1,053 220 140 114 75 1,602
For the three months ended December 31, 2014 and December 31, 2013, every percentage point depreciation / appreciation in the exchange rate between the Indian rupee and the U.S. dollar has affected the company's incremental operating margins by approximately 0.52% and 0.46%, respectively.
For the nine months ended December 31, 2014 and December 31, 2013, every percentage point depreciation / appreciation in the exchange rate between the Indian rupee and the U.S. dollar has affected the company's incremental operating margins by approximately 0.53% and 0.46%, respectively. Sensitivity analysis is computed based on the changes in the income and expenses in foreign currency upon conversion into functional currency, due to exchange rate fluctuations between the previous reporting period and the current reporting period.
Credit risk
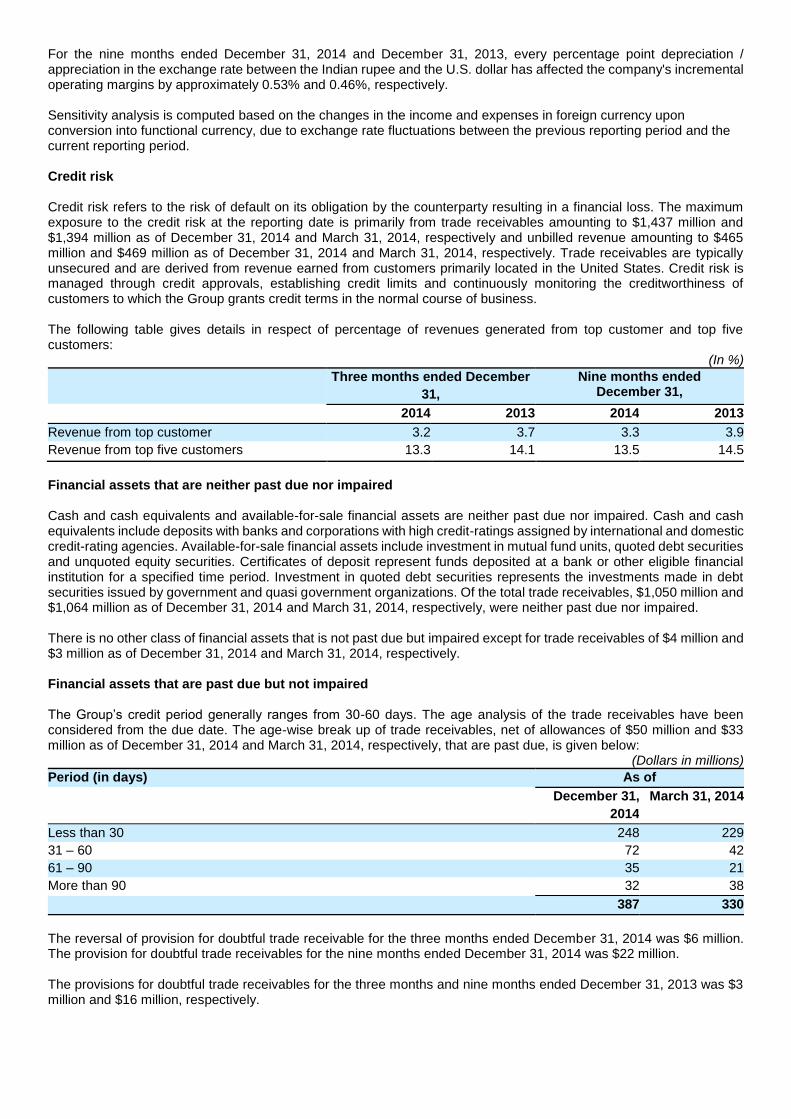
Credit risk refers to the risk of default on its obligation by the counterparty resulting in a financial loss. The maximum exposure to the credit risk at the reporting date is primarily from trade receivables amounting to $1,437 million and $1,394 million as of December 31, 2014 and March 31, 2014, respectively and unbilled revenue amounting to $465 million and $469 million as of December 31, 2014 and March 31, 2014, respectively. Trade receivables are typically unsecured and are derived from revenue earned from customers primarily located in the United States. Credit risk is managed through credit approvals, establishing credit limits and continuously monitoring the creditworthiness of customers to which the Group grants credit terms in the normal course of business.
The following table gives details in respect of percentage of revenues generated from top customer and top five customers:
(In %)
Three months ended December
31,
Nine months ended December 31,
2014 2013 2014 2013
Revenue from top customer 3.2 3.7 3.3 3.9
Revenue from top five customers 13.3 14.1 13.5 14.5
Financial assets that are neither past due nor impaired
Cash and cash equivalents and available-for-sale financial assets are neither past due nor impaired. Cash and cash equivalents include deposits with banks and corporations with high credit-ratings assigned by international and domestic credit-rating agencies. Available-for-sale financial assets include investment in mutual fund units, quoted debt securities and unquoted equity securities. Certificates of deposit represent funds deposited at a bank or other eligible financial institution for a specified time period. Investment in quoted debt securities represents the investments made in debt securities issued by government and quasi government organizations. Of the total trade receivables, $1,050 million and $1,064 million as of December 31, 2014 and March 31, 2014, respectively, were neither past due nor impaired. There is no other class of financial assets that is not past due but impaired except for trade receivables of $4 million and $3 million as of December 31, 2014 and March 31, 2014, respectively. Financial assets that are past due but not impaired The Group’s credit period generally ranges from 30-60 days. The age analysis of the trade receivables have been considered from the due date. The age-wise break up of trade receivables, net of allowances of $50 million and $33 million as of December 31, 2014 and March 31, 2014, respectively, that are past due, is given below:
(Dollars in millions)
Period (in days) As of
December 31,
2014
March 31, 2014
Less than 30 248 229
31 – 60 72 42
61 – 90 35 21
More than 90 32 38
387 330
The reversal of provision for doubtful trade receivable for the three months ended December 31, 2014 was $6 million. The provision for doubtful trade receivables for the nine months ended December 31, 2014 was $22 million. The provisions for doubtful trade receivables for the three months and nine months ended December 31, 2013 was $3 million and $16 million, respectively.
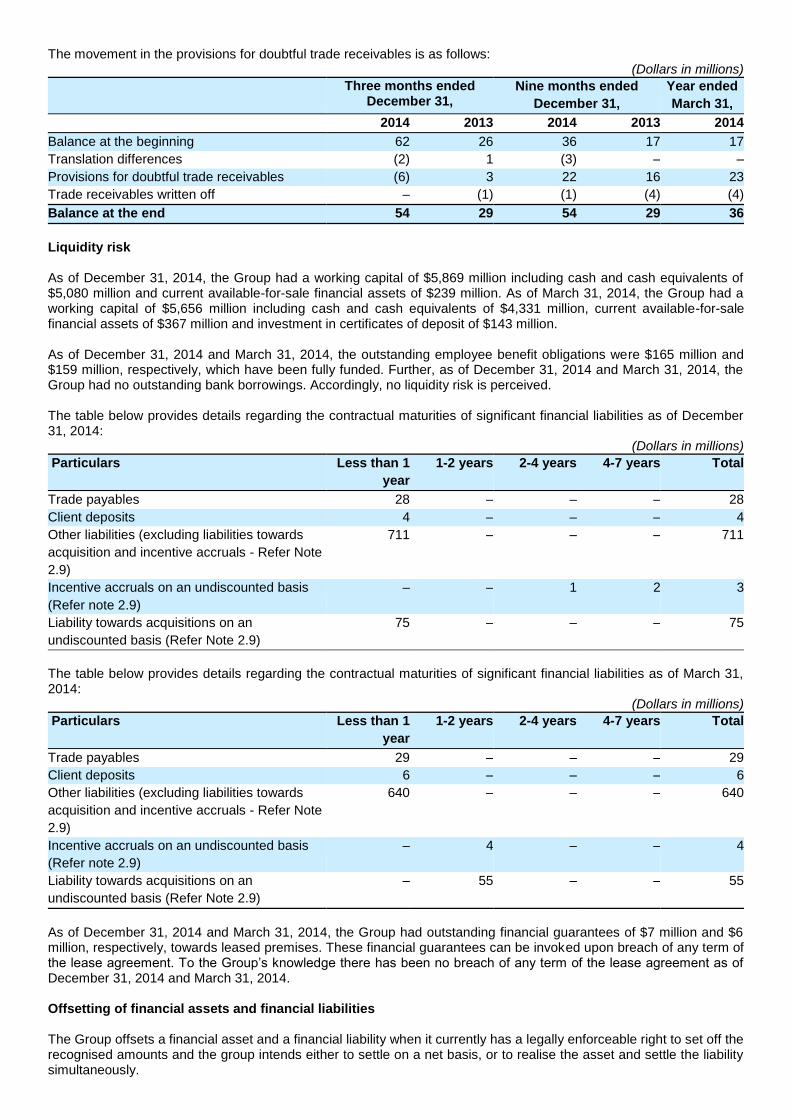
The movement in the provisions for doubtful trade receivables is as follows: (Dollars in millions)
Three months ended December 31,
Nine months ended
December 31,
Year ended
March 31,
2014 2013 2014 2013 2014
Balance at the beginning 62 26 36 17 17
Translation differences (2) 1 (3) – –
Provisions for doubtful trade receivables (6) 3 22 16 23
Trade receivables written off – (1) (1) (4) (4)
Balance at the end 54 29 54 29 36
Liquidity risk As of December 31, 2014, the Group had a working capital of $5,869 million including cash and cash equivalents of $5,080 million and current available-for-sale financial assets of $239 million. As of March 31, 2014, the Group had a working capital of $5,656 million including cash and cash equivalents of $4,331 million, current available-for-sale financial assets of $367 million and investment in certificates of deposit of $143 million. As of December 31, 2014 and March 31, 2014, the outstanding employee benefit obligations were $165 million and $159 million, respectively, which have been fully funded. Further, as of December 31, 2014 and March 31, 2014, the Group had no outstanding bank borrowings. Accordingly, no liquidity risk is perceived. The table below provides details regarding the contractual maturities of significant financial liabilities as of December 31, 2014:
(Dollars in millions)
Particulars Less than 1
year
1-2 years 2-4 years 4-7 years Total
Trade payables 28 – – – 28
Client deposits 4 – – – 4
Other liabilities (excluding liabilities towards
acquisition and incentive accruals - Refer Note
2.9)
711 – – – 711
Incentive accruals on an undiscounted basis
(Refer note 2.9)
– – 1 2 3
Liability towards acquisitions on an
undiscounted basis (Refer Note 2.9)
75 – – – 75
The table below provides details regarding the contractual maturities of significant financial liabilities as of March 31, 2014:
(Dollars in millions)
Particulars Less than 1
year
1-2 years 2-4 years 4-7 years Total
Trade payables 29 – – – 29
Client deposits 6 – – – 6
Other liabilities (excluding liabilities towards
acquisition and incentive accruals - Refer Note
2.9)
640 – – – 640
Incentive accruals on an undiscounted basis
(Refer note 2.9)
– 4 – – 4
Liability towards acquisitions on an
undiscounted basis (Refer Note 2.9)
– 55 – – 55
As of December 31, 2014 and March 31, 2014, the Group had outstanding financial guarantees of $7 million and $6 million, respectively, towards leased premises. These financial guarantees can be invoked upon breach of any term of the lease agreement. To the Group’s knowledge there has been no breach of any term of the lease agreement as of December 31, 2014 and March 31, 2014. Offsetting of financial assets and financial liabilities The Group offsets a financial asset and a financial liability when it currently has a legally enforceable right to set off the recognised amounts and the group intends either to settle on a net basis, or to realise the asset and settle the liability simultaneously.
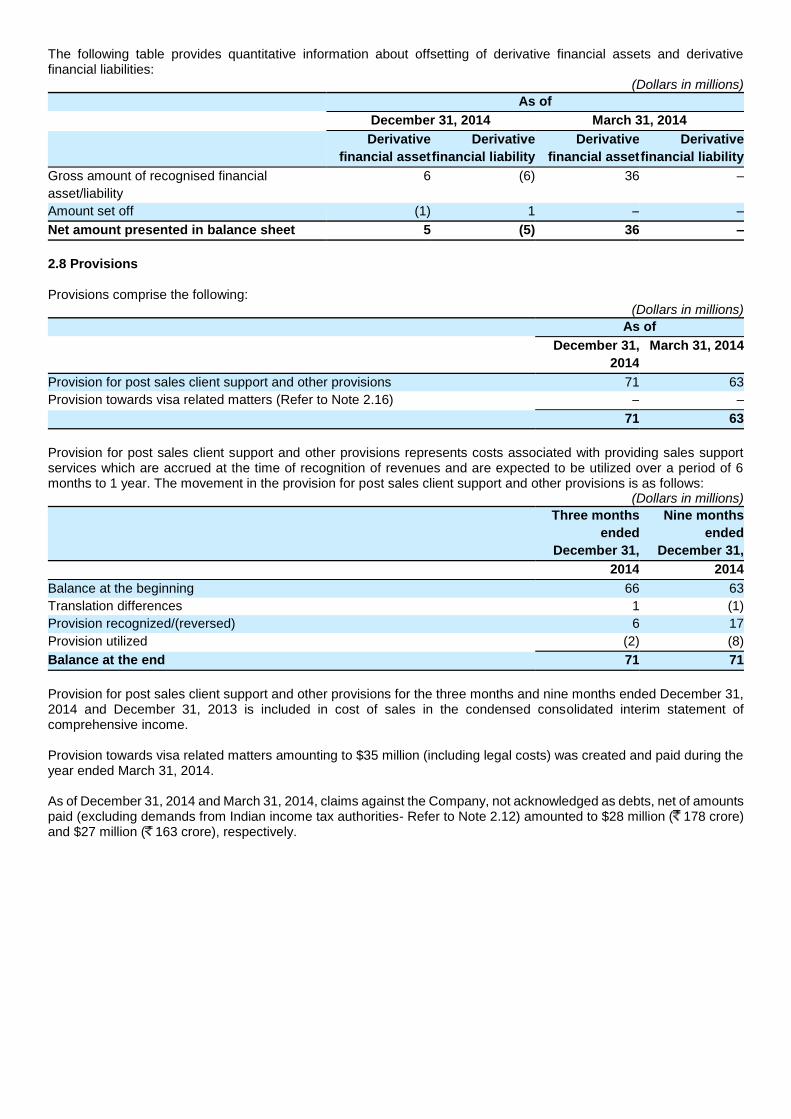
The following table provides quantitative information about offsetting of derivative financial assets and derivative financial liabilities:
(Dollars in millions)
As of
December 31, 2014 March 31, 2014
Derivative
financial asset
Derivative
financial liability
Derivative
financial asset
Derivative
financial liability
Gross amount of recognised financial
asset/liability
6 (6) 36 –
Amount set off (1) 1 – –
Net amount presented in balance sheet 5 (5) 36 –
2.8 Provisions Provisions comprise the following:
(Dollars in millions)
As of
December 31,
2014
March 31, 2014
Provision for post sales client support and other provisions 71 63
Provision towards visa related matters (Refer to Note 2.16) – –
71 63
Provision for post sales client support and other provisions represents costs associated with providing sales support services which are accrued at the time of recognition of revenues and are expected to be utilized over a period of 6 months to 1 year. The movement in the provision for post sales client support and other provisions is as follows:
(Dollars in millions)
Three months
ended
December 31,
Nine months
ended
December 31,
2014 2014
Balance at the beginning 66 63
Translation differences 1 (1)
Provision recognized/(reversed) 6 17
Provision utilized (2) (8)
Balance at the end 71 71
Provision for post sales client support and other provisions for the three months and nine months ended December 31, 2014 and December 31, 2013 is included in cost of sales in the condensed consolidated interim statement of comprehensive income. Provision towards visa related matters amounting to $35 million (including legal costs) was created and paid during the year ended March 31, 2014. As of December 31, 2014 and March 31, 2014, claims against the Company, not acknowledged as debts, net of amounts paid (excluding demands from Indian income tax authorities- Refer to Note 2.12) amounted to $28 million ( 178 crore) and $27 million ( 163 crore), respectively.
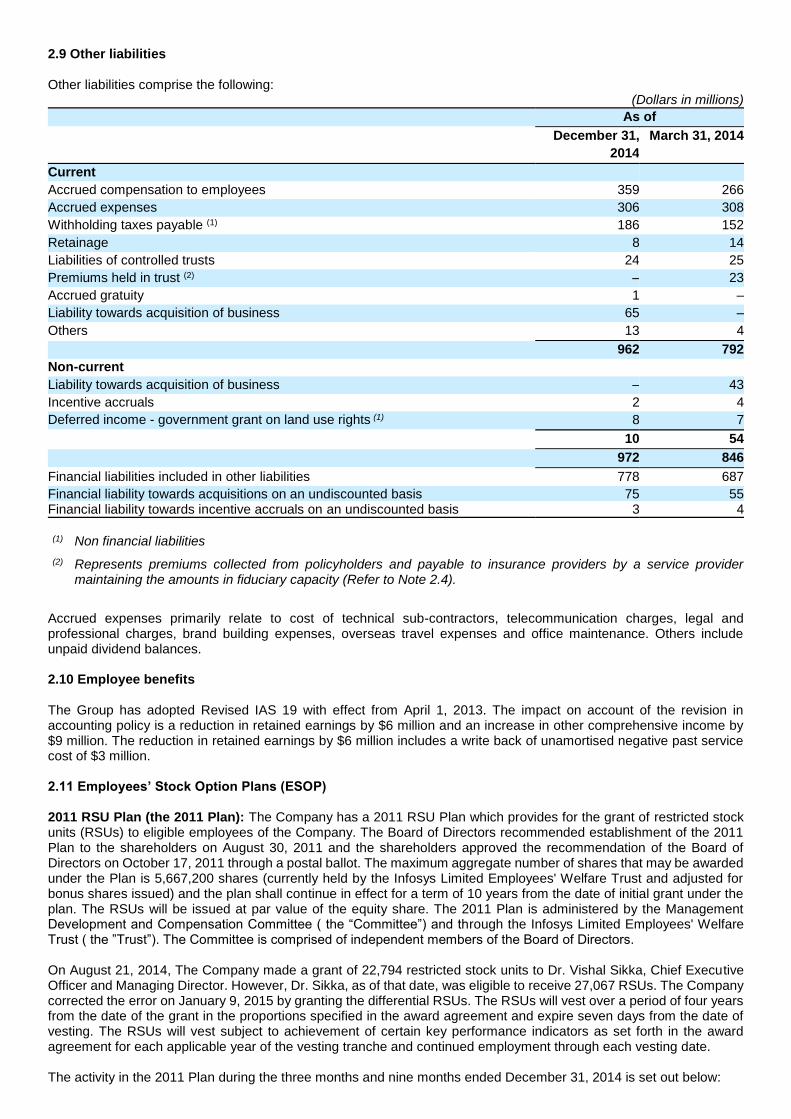
2.9 Other liabilities
Other liabilities comprise the following: (Dollars in millions)
As of
December 31,
2014
March 31, 2014
Current
Accrued compensation to employees 359 266
Accrued expenses 306 308
Withholding taxes payable (1) 186 152
Retainage 8 14
Liabilities of controlled trusts 24 25
Premiums held in trust (2) – 23
Accrued gratuity 1 –
Liability towards acquisition of business 65 –
Others 13 4
962 792
Non-current
Liability towards acquisition of business – 43
Incentive accruals 2 4
Deferred income - government grant on land use rights (1) 8 7
10 54
972 846
Financial liabilities included in other liabilities 778 687
Financial liability towards acquisitions on an undiscounted basis 75 55
Financial liability towards incentive accruals on an undiscounted basis 3 4 (1) Non financial liabilities
(2) Represents premiums collected from policyholders and payable to insurance providers by a service provider maintaining the amounts in fiduciary capacity (Refer to Note 2.4).
Accrued expenses primarily relate to cost of technical sub-contractors, telecommunication charges, legal and professional charges, brand building expenses, overseas travel expenses and office maintenance. Others include unpaid dividend balances. 2.10 Employee benefits
The Group has adopted Revised IAS 19 with effect from April 1, 2013. The impact on account of the revision in accounting policy is a reduction in retained earnings by $6 million and an increase in other comprehensive income by $9 million. The reduction in retained earnings by $6 million includes a write back of unamortised negative past service cost of $3 million.
2.11 Employees’ Stock Option Plans (ESOP) 2011 RSU Plan (the 2011 Plan): The Company has a 2011 RSU Plan which provides for the grant of restricted stock units (RSUs) to eligible employees of the Company. The Board of Directors recommended establishment of the 2011 Plan to the shareholders on August 30, 2011 and the shareholders approved the recommendation of the Board of Directors on October 17, 2011 through a postal ballot. The maximum aggregate number of shares that may be awarded under the Plan is 5,667,200 shares (currently held by the Infosys Limited Employees' Welfare Trust and adjusted for bonus shares issued) and the plan shall continue in effect for a term of 10 years from the date of initial grant under the plan. The RSUs will be issued at par value of the equity share. The 2011 Plan is administered by the Management Development and Compensation Committee ( the “Committee”) and through the Infosys Limited Employees' Welfare Trust ( the ”Trust”). The Committee is comprised of independent members of the Board of Directors. On August 21, 2014, The Company made a grant of 22,794 restricted stock units to Dr. Vishal Sikka, Chief Executive Officer and Managing Director. However, Dr. Sikka, as of that date, was eligible to receive 27,067 RSUs. The Company corrected the error on January 9, 2015 by granting the differential RSUs. The RSUs will vest over a period of four years from the date of the grant in the proportions specified in the award agreement and expire seven days from the date of vesting. The RSUs will vest subject to achievement of certain key performance indicators as set forth in the award agreement for each applicable year of the vesting tranche and continued employment through each vesting date. The activity in the 2011 Plan during the three months and nine months ended December 31, 2014 is set out below:
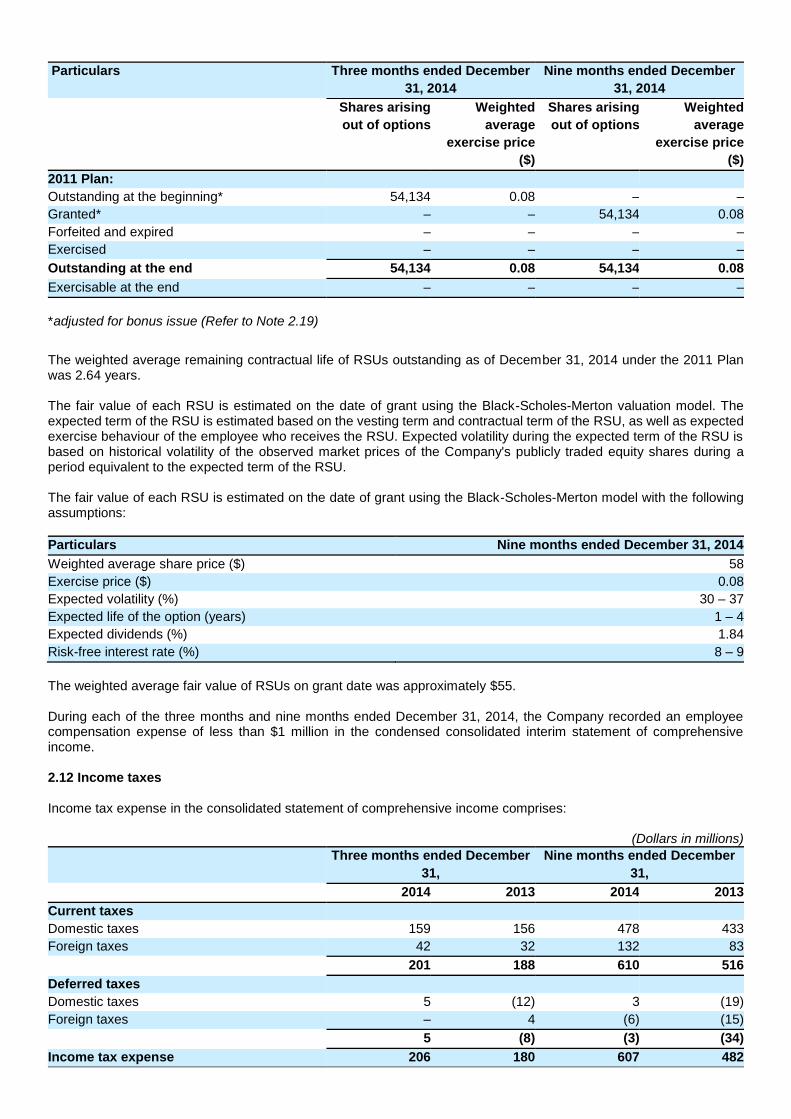
Particulars Three months ended December
31, 2014
Nine months ended December
31, 2014
Shares arising
out of options
Weighted
average
exercise price
($)
Shares arising
out of options
Weighted
average
exercise price
($)
2011 Plan:
Outstanding at the beginning* 54,134 0.08 – –
Granted* – – 54,134 0.08
Forfeited and expired – – – –
Exercised – – – –
Outstanding at the end 54,134 0.08 54,134 0.08
Exercisable at the end – – – –
* adjusted for bonus issue (Refer to Note 2.19)
The weighted average remaining contractual life of RSUs outstanding as of December 31, 2014 under the 2011 Plan was 2.64 years. The fair value of each RSU is estimated on the date of grant using the Black-Scholes-Merton valuation model. The expected term of the RSU is estimated based on the vesting term and contractual term of the RSU, as well as expected exercise behaviour of the employee who receives the RSU. Expected volatility during the expected term of the RSU is based on historical volatility of the observed market prices of the Company's publicly traded equity shares during a period equivalent to the expected term of the RSU. The fair value of each RSU is estimated on the date of grant using the Black-Scholes-Merton model with the following assumptions:
Particulars Nine months ended December 31, 2014
Weighted average share price ($) 58
Exercise price ($) 0.08
Expected volatility (%) 30 – 37
Expected life of the option (years) 1 – 4
Expected dividends (%) 1.84
Risk-free interest rate (%) 8 – 9
The weighted average fair value of RSUs on grant date was approximately $55. During each of the three months and nine months ended December 31, 2014, the Company recorded an employee compensation expense of less than $1 million in the condensed consolidated interim statement of comprehensive income. 2.12 Income taxes
Income tax expense in the consolidated statement of comprehensive income comprises:
(Dollars in millions)
Three months ended December
31,
Nine months ended December
31,
2014 2013 2014 2013
Current taxes
Domestic taxes 159 156 478 433
Foreign taxes 42 32 132 83
201 188 610 516
Deferred taxes
Domestic taxes 5 (12) 3 (19)
Foreign taxes – 4 (6) (15)
5 (8) (3) (34)
Income tax expense 206 180 607 482
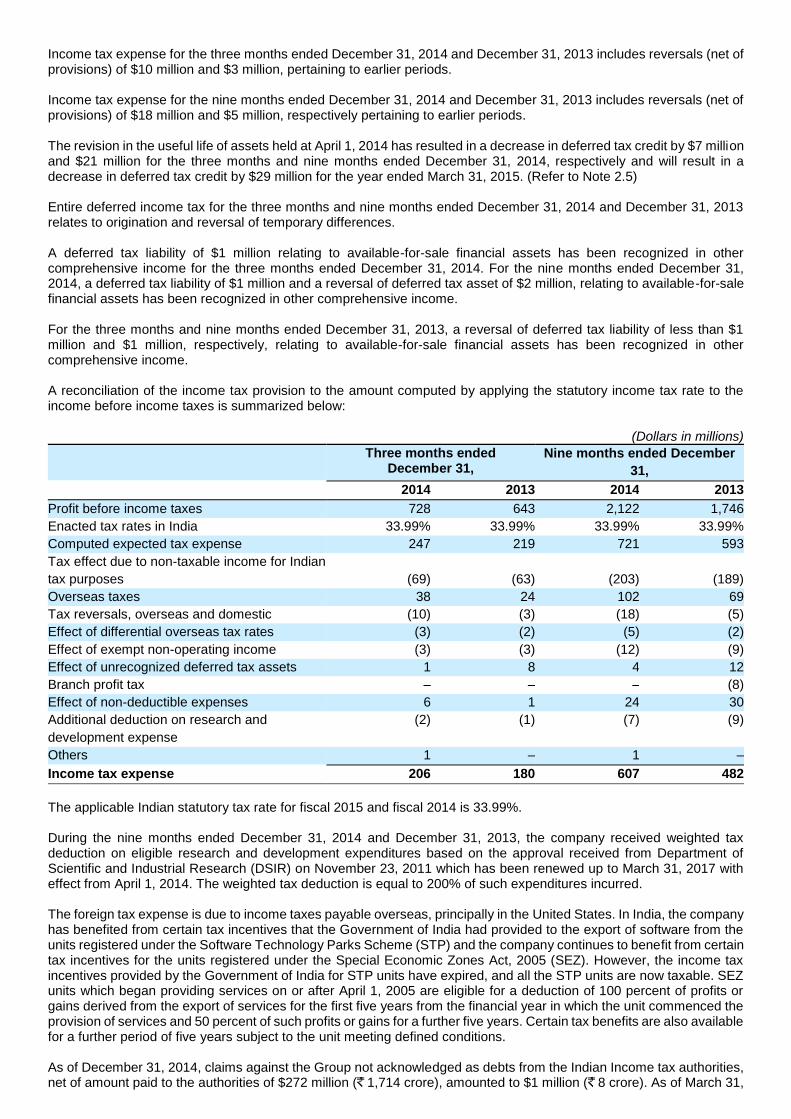
Income tax expense for the three months ended December 31, 2014 and December 31, 2013 includes reversals (net of provisions) of $10 million and $3 million, pertaining to earlier periods. Income tax expense for the nine months ended December 31, 2014 and December 31, 2013 includes reversals (net of provisions) of $18 million and $5 million, respectively pertaining to earlier periods. The revision in the useful life of assets held at April 1, 2014 has resulted in a decrease in deferred tax credit by $7 million and $21 million for the three months and nine months ended December 31, 2014, respectively and will result in a decrease in deferred tax credit by $29 million for the year ended March 31, 2015. (Refer to Note 2.5) Entire deferred income tax for the three months and nine months ended December 31, 2014 and December 31, 2013 relates to origination and reversal of temporary differences. A deferred tax liability of $1 million relating to available-for-sale financial assets has been recognized in other comprehensive income for the three months ended December 31, 2014. For the nine months ended December 31, 2014, a deferred tax liability of $1 million and a reversal of deferred tax asset of $2 million, relating to available-for-sale financial assets has been recognized in other comprehensive income. For the three months and nine months ended December 31, 2013, a reversal of deferred tax liability of less than $1 million and $1 million, respectively, relating to available-for-sale financial assets has been recognized in other comprehensive income. A reconciliation of the income tax provision to the amount computed by applying the statutory income tax rate to the income before income taxes is summarized below:
(Dollars in millions)
Three months ended December 31,
Nine months ended December
31,
2014 2013 2014 2013
Profit before income taxes 728 643 2,122 1,746
Enacted tax rates in India 33.99% 33.99% 33.99% 33.99%
Computed expected tax expense 247 219 721 593
Tax effect due to non-taxable income for Indian
tax purposes (69) (63) (203) (189)
Overseas taxes 38 24 102 69
Tax reversals, overseas and domestic (10) (3) (18) (5)
Effect of differential overseas tax rates (3) (2) (5) (2)
Effect of exempt non-operating income (3) (3) (12) (9)
Effect of unrecognized deferred tax assets 1 8 4 12
Branch profit tax – – – (8)
Effect of non-deductible expenses 6 1 24 30
Additional deduction on research and
development expense
(2) (1) (7) (9)
Others 1 – 1 –
Income tax expense 206 180 607 482
The applicable Indian statutory tax rate for fiscal 2015 and fiscal 2014 is 33.99%. During the nine months ended December 31, 2014 and December 31, 2013, the company received weighted tax deduction on eligible research and development expenditures based on the approval received from Department of Scientific and Industrial Research (DSIR) on November 23, 2011 which has been renewed up to March 31, 2017 with effect from April 1, 2014. The weighted tax deduction is equal to 200% of such expenditures incurred. The foreign tax expense is due to income taxes payable overseas, principally in the United States. In India, the company has benefited from certain tax incentives that the Government of India had provided to the export of software from the units registered under the Software Technology Parks Scheme (STP) and the company continues to benefit from certain tax incentives for the units registered under the Special Economic Zones Act, 2005 (SEZ). However, the income tax incentives provided by the Government of India for STP units have expired, and all the STP units are now taxable. SEZ units which began providing services on or after April 1, 2005 are eligible for a deduction of 100 percent of profits or gains derived from the export of services for the first five years from the financial year in which the unit commenced the provision of services and 50 percent of such profits or gains for a further five years. Certain tax benefits are also available for a further period of five years subject to the unit meeting defined conditions. As of December 31, 2014, claims against the Group not acknowledged as debts from the Indian Income tax authorities, net of amount paid to the authorities of $272 million ( 1,714 crore), amounted to $1 million ( 8 crore). As of March 31,
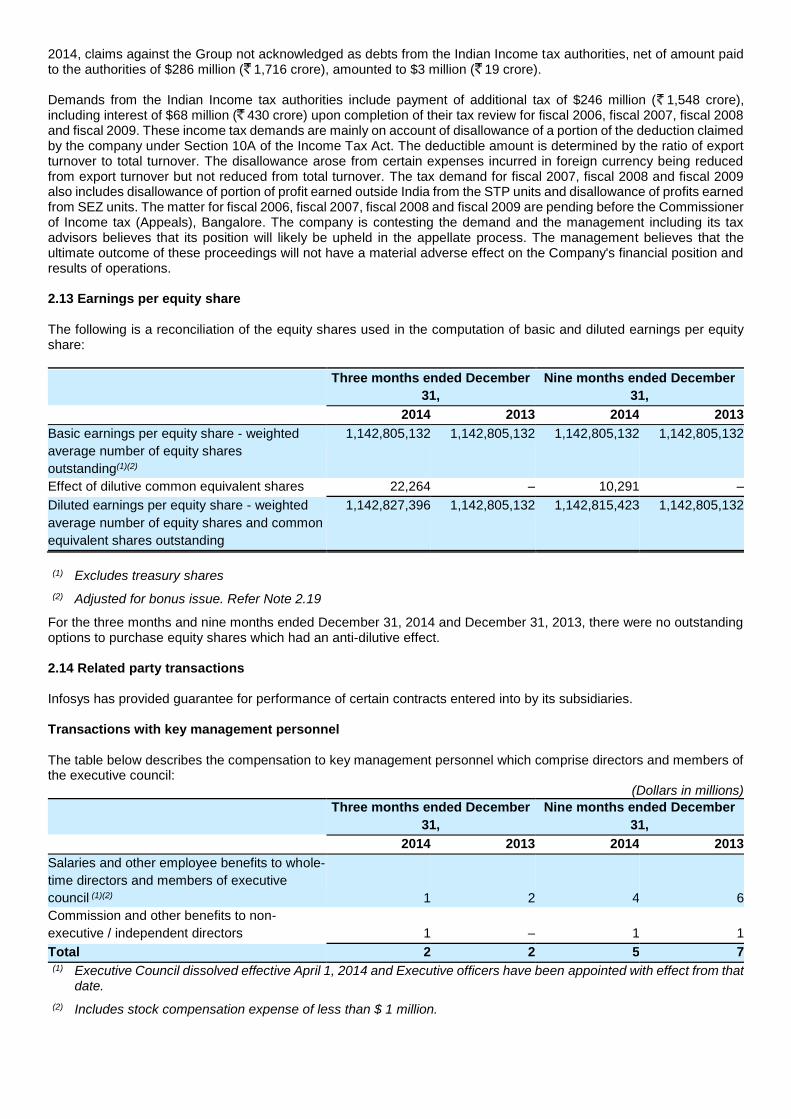
2014, claims against the Group not acknowledged as debts from the Indian Income tax authorities, net of amount paid to the authorities of $286 million ( 1,716 crore), amounted to $3 million ( 19 crore). Demands from the Indian Income tax authorities include payment of additional tax of $246 million ( 1,548 crore), including interest of $68 million ( 430 crore) upon completion of their tax review for fiscal 2006, fiscal 2007, fiscal 2008 and fiscal 2009. These income tax demands are mainly on account of disallowance of a portion of the deduction claimed by the company under Section 10A of the Income Tax Act. The deductible amount is determined by the ratio of export turnover to total turnover. The disallowance arose from certain expenses incurred in foreign currency being reduced from export turnover but not reduced from total turnover. The tax demand for fiscal 2007, fiscal 2008 and fiscal 2009 also includes disallowance of portion of profit earned outside India from the STP units and disallowance of profits earned from SEZ units. The matter for fiscal 2006, fiscal 2007, fiscal 2008 and fiscal 2009 are pending before the Commissioner of Income tax (Appeals), Bangalore. The company is contesting the demand and the management including its tax advisors believes that its position will likely be upheld in the appellate process. The management believes that the ultimate outcome of these proceedings will not have a material adverse effect on the Company's financial position and results of operations. 2.13 Earnings per equity share The following is a reconciliation of the equity shares used in the computation of basic and diluted earnings per equity share:
Three months ended December
31,
Nine months ended December
31,
2014 2013 2014 2013
Basic earnings per equity share - weighted
average number of equity shares
outstanding(1)(2)
1,142,805,132 1,142,805,132 1,142,805,132 1,142,805,132
Effect of dilutive common equivalent shares 22,264 – 10,291 –
Diluted earnings per equity share - weighted
average number of equity shares and common
equivalent shares outstanding
1,142,827,396 1,142,805,132 1,142,815,423 1,142,805,132
(1) Excludes treasury shares
(2) Adjusted for bonus issue. Refer Note 2.19
For the three months and nine months ended December 31, 2014 and December 31, 2013, there were no outstanding options to purchase equity shares which had an anti-dilutive effect. 2.14 Related party transactions Infosys has provided guarantee for performance of certain contracts entered into by its subsidiaries. Transactions with key management personnel The table below describes the compensation to key management personnel which comprise directors and members of the executive council:
(Dollars in millions)
Three months ended December
31,
Nine months ended December
31,
2014 2013 2014 2013
Salaries and other employee benefits to whole-
time directors and members of executive
council (1)(2) 1 2 4 6
Commission and other benefits to non-
executive / independent directors 1 – 1 1
Total 2 2 5 7 (1) Executive Council dissolved effective April 1, 2014 and Executive officers have been appointed with effect from that
date.
(2) Includes stock compensation expense of less than $ 1 million.
2.15 Segment reporting
IFRS 8 establishes standards for the way that public business enterprises report information about operating segments and related disclosures about products and services, geographic areas, and major customers. The Company's operations predominantly relate to providing end-to-end business solutions to enable clients to enhance business performance. During the year ended March 31, 2014, the Company reorganized its segments to strengthen its focus on growing existing client relationships and increasing market share through service differentiation and operational agility. Consequent to the internal reorganization there were changes effected in the reportable business segments based on the "management approach" as defined in IFRS 8, Operating Segments. The Chief Operating Decision Maker evaluates the Company's performance and allocates resources based on an analysis of various performance indicators by business segments and geographic segments. Accordingly, information has been presented both along business segments and geographic segments. The accounting principles used in the preparation of the financial statements are consistently applied to record revenue and expenditure in individual segments, and are as set out in the significant accounting policies. Business segments of the Company is determined based on (i) industry class of the customers (outside of the growth markets) and; (ii) presence of customers in growth markets across industry classes. Business segments of the Company are primarily enterprises in Financial Services and Insurance (FSI), enterprises in Manufacturing (MFG), enterprises in the Energy & utilities, Communication and Services (ECS), enterprises in Retail, Consumer packaged goods and Logistics (RCL), enterprises in Life Sciences and Healthcare (LSH) and enterprises in Growth Markets (GMU) comprising enterprises in APAC (Asia Pacific) and Africa. The FSI reportable segments have been aggregated to include the Financial Services operating segment and Insurance operating segment and the ECS reportable segment has been aggregated to include Energy, Communication and Services operating segment and Resources & Utilities operating segments. Geographic segmentation is based on business sourced from that geographic region and delivered from both on-site and off-shore. North America comprises the United States of America, Canada and Mexico, Europe includes continental Europe (both the east and the west), Ireland and the United Kingdom, and the Rest of the World comprising all other places except those mentioned above and India. Consequent to the above change in the composition of reportable business segments, the prior year comparatives have been restated. Revenue and identifiable operating expenses in relation to segments are categorized based on items that are individually identifiable to that segment. Allocated expenses of segments include expenses incurred for rendering services from the Company's offshore software Development Centers and on-site expenses, which are categorized in relation to the associated turnover of the segment. Certain expenses such as depreciation, which form a significant component of total expenses, are not specifically allocable to specific segments as the underlying assets are used interchangeably. Management believes that it is not practical to provide segment disclosures relating to those costs and expenses, and accordingly these expenses are separately disclosed as "unallocated" and adjusted against the total income of the Company. Assets and liabilities used in the Company's business are not identified to any of the reportable segments, as these are used interchangeably between segments. Management believes that it is currently not practical to provide segment disclosures relating to total assets and liabilities since a meaningful segregation of the available data is onerous. Geographical information on revenue and business segment revenue information is collated based on individual customers invoiced or in relation to which the revenue is otherwise recognized.
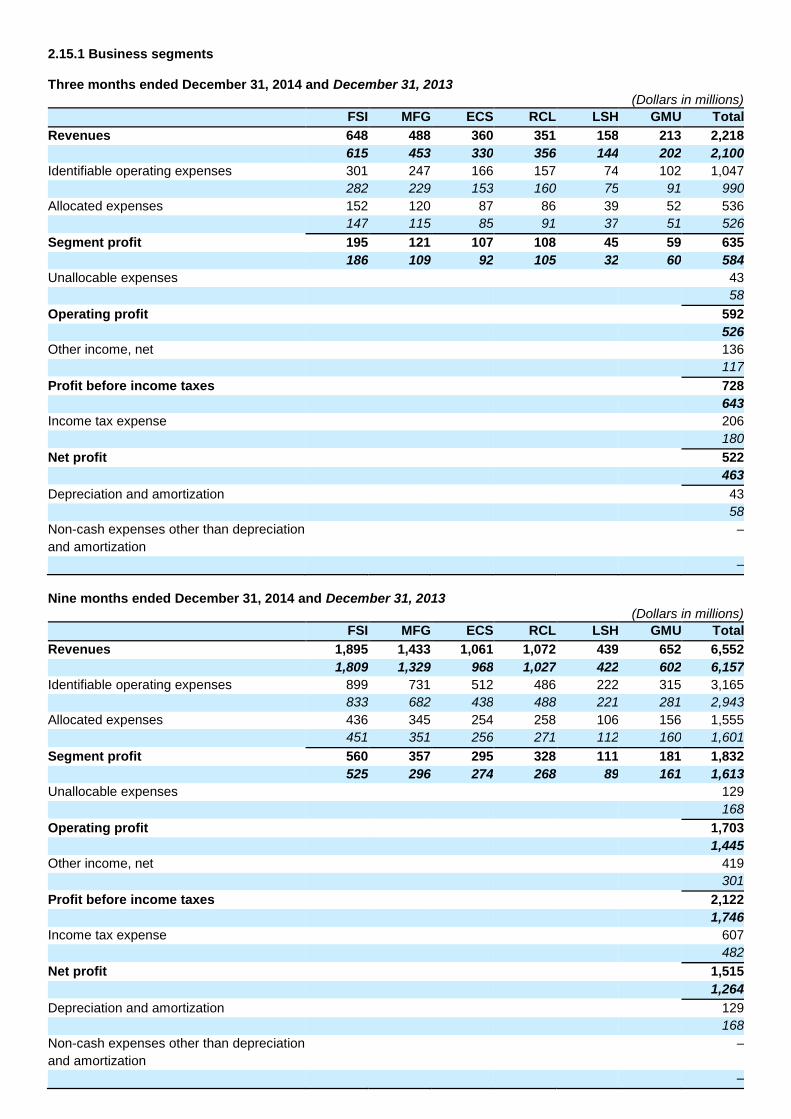
2.15.1 Business segments Three months ended December 31, 2014 and December 31, 2013
(Dollars in millions)
FSI MFG ECS RCL LSH GMU Total
Revenues 648 488 360 351 158 213 2,218
615 453 330 356 144 202 2,100
Identifiable operating expenses 301 247 166 157 74 102 1,047
282 229 153 160 75 91 990
Allocated expenses 152 120 87 86 39 52 536
147 115 85 91 37 51 526
Segment profit 195 121 107 108 45 59 635
186 109 92 105 32 60 584
Unallocable expenses 43
58
Operating profit 592
526
Other income, net 136
117
Profit before income taxes 728
643
Income tax expense 206
180
Net profit 522
463
Depreciation and amortization 43
58
Non-cash expenses other than depreciation
and amortization
–
–
Nine months ended December 31, 2014 and December 31, 2013
(Dollars in millions)
FSI MFG ECS RCL LSH GMU Total
Revenues 1,895 1,433 1,061 1,072 439 652 6,552
1,809 1,329 968 1,027 422 602 6,157
Identifiable operating expenses 899 731 512 486 222 315 3,165
833 682 438 488 221 281 2,943
Allocated expenses 436 345 254 258 106 156 1,555
451 351 256 271 112 160 1,601
Segment profit 560 357 295 328 111 181 1,832
525 296 274 268 89 161 1,613
Unallocable expenses 129
168
Operating profit 1,703
1,445
Other income, net 419
301
Profit before income taxes 2,122
1,746
Income tax expense 607
482
Net profit 1,515
1,264
Depreciation and amortization 129
168
Non-cash expenses other than depreciation
and amortization
–
–
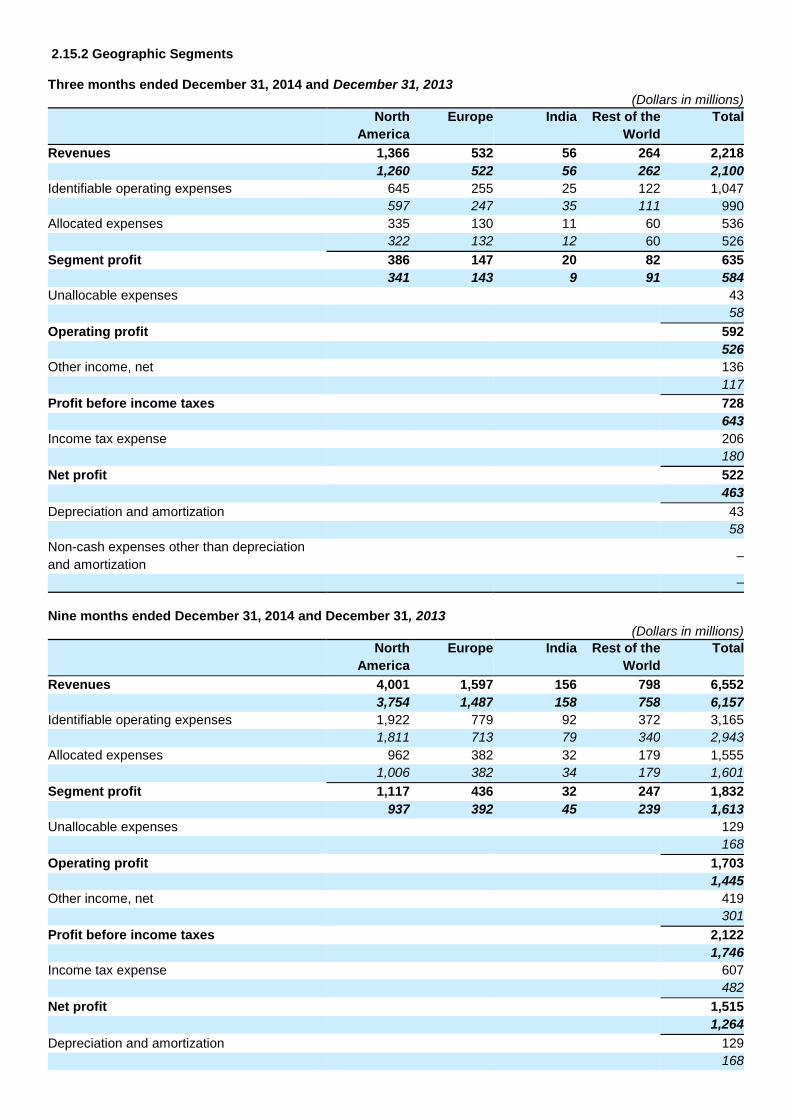
2.15.2 Geographic Segments Three months ended December 31, 2014 and December 31, 2013
(Dollars in millions)
North
America
Europe India Rest of the
World
Total
Revenues 1,366 532 56 264 2,218
1,260 522 56 262 2,100
Identifiable operating expenses 645 255 25 122 1,047
597 247 35 111 990
Allocated expenses 335 130 11 60 536
322 132 12 60 526
Segment profit 386 147 20 82 635
341 143 9 91 584
Unallocable expenses 43
58
Operating profit 592
526
Other income, net 136
117
Profit before income taxes 728
643
Income tax expense 206
180
Net profit 522
463
Depreciation and amortization 43
58
Non-cash expenses other than depreciation
and amortization
–
–
Nine months ended December 31, 2014 and December 31, 2013
(Dollars in millions)
North
America
Europe India Rest of the
World
Total
Revenues 4,001 1,597 156 798 6,552
3,754 1,487 158 758 6,157
Identifiable operating expenses 1,922 779 92 372 3,165
1,811 713 79 340 2,943
Allocated expenses 962 382 32 179 1,555
1,006 382 34 179 1,601
Segment profit 1,117 436 32 247 1,832
937 392 45 239 1,613
Unallocable expenses 129
168
Operating profit 1,703
1,445
Other income, net 419
301
Profit before income taxes 2,122
1,746
Income tax expense 607
482
Net profit 1,515
1,264
Depreciation and amortization 129
168
Non-cash expenses other than depreciation
and amortization
–
–
2.15.3 Significant clients No client individually accounted for more than 10% of the revenues for the three months and nine months ended December 31, 2014 and December 31, 2013. 2.16 Litigation On May 23, 2011, the company received a subpoena from a grand jury in the United States District Court for the Eastern District of Texas. The subpoena required that the company provide to the grand jury certain documents and records related to its sponsorships for, and uses of, B1 business visas. In addition, the U.S. Department of Homeland Security (“DHS”) has reviewed the company’s employer eligibility verifications on Form I-9 with respect to its employees working in the United States. In connection with this review, the company was advised that the DHS has found errors in a significant percentage of its Forms I-9 that the DHS has reviewed, and may impose fines and penalties on the company related to such alleged errors. On October 30, 2013, the company settled the foregoing matters and entered into a Settlement Agreement (“Settlement Agreement”) with the U.S. Attorney, the DHS and the United States Department of State (“State,” and collectively with the U.S. Attorney and the DHS, the “United States”). In the Settlement Agreement, the company denied and disputed all allegations made by the United States, except for the allegation that the company failed to maintain accurate Forms I-9 records for many of its foreign nationals in the United States in 2010 and 2011 as required by law, and that such failure constituted civil violations of certain laws. During the year ended March 31, 2014 the Company recorded a charge related to the Settlement Agreement (including legal costs) of $35 million related to the matters that were the subject of the Settlement agreement. The said amount was paid prior to December 31, 2013. In addition, the company is subject to legal proceedings and claims, which have arisen in the ordinary course of business. The company’s management does not reasonably expect that these legal actions, when ultimately concluded and determined, will have a material and adverse effect on the company’s results of operations or financial condition. 2.17 Corporate Social Responsibility (CSR) Administrative expenses for three months and nine months ended December 31, 2014 includes contribution to Infosys Foundation towards CSR. Consequent to the requirements of the Companies Act, 2013, a CSR committee has been formed by the company to formulate and monitor the CSR policy of the company. The proposed areas for CSR activities are, eradication of hunger, poverty and malnutrition and the promotion of education and healthcare and rural development projects. The funds will be allocated to a corpus and utilised through the year on these activities which are specified in Schedule VII of the Indian Companies Act, 2013. 2.18 Dividends The Board of Directors, in their meeting on October 10, 2014, declared an interim dividend of approximately $0.49 per equity share ( 30 per equity share), which has resulted in a cash outflow of $336 million, inclusive of corporate dividend tax. 2.19 Share capital and share premium The Company has only one class of shares, referred to as equity shares, having a par value of 5. The Company has allotted 574,236,166 fully paid up equity shares of face value 5/- each during the quarter ended December 31, 2014 pursuant to a bonus issue approved by the shareholders through postal ballot. The record date fixed by the Board of Directors was December 3, 2014. A bonus share of one equity share for every equity share held, and a bonus issue, viz., a stock dividend of one American Depositary Share (ADS) for every ADS held, respectively, has been allotted. Consequently, the ratio of equity shares underlying the ADSs held by an American Depositary Receipt holder remains unchanged. Options granted under the stock option plan have been adjusted for bonus shares. 5,667,200 and 2,833,600 shares were held by controlled trust, as of December 31, 2014 and March 31, 2014, respectively. The amount received in excess of the par value has been classified as share premium. Additionally, share-based compensation recognized in net profit in the condensed consolidated interim statement of comprehensive income is credited to share premium. Amounts have been utilised for bonus issue from the Company’s share premium account.
Item 2. Management's Discussion and Analysis of Financial Condition and Results of Operations In addition to historical information, this discussion contains certain forward-looking statements within the meaning of Section 27A of the Securities Act of 1933, as amended, and Section 21E of the Securities Exchange Act of 1934, as amended. When used in this discussion, the words “anticipate,” “believe,” “estimate,” “expect,” “intend,” “project,” “seek,” “should,” “will” and other similar expressions as they relate to us or our business are intended to identify such forward-looking statements. The forward-looking statements contained herein are subject to certain risks and uncertainties that could cause actual results to differ materially from those reflected in the forward-looking statements. Factors that might cause such differences include but are not limited to, those discussed in the section entitled “Risk Factors” in our Annual Report on Form 20-F for the year ended March 31, 2014, in our Quarterly Report on Form 6-K for the quarters ended June 30, 2014 and September 30, 2014 and updates, if any, in the section entitled “Risk Factors” and elsewhere in this Quarterly Report on Form 6-K. Readers are cautioned not to place undue reliance on these forward-looking statements, which reflect management's analysis only as of the date of this Quarterly Report on Form 6-K. The following discussion and analysis should be read in conjunction with our condensed interim financial statements included herein and the notes thereto. We undertake no obligation to publicly update or revise any forward-looking statements, whether as a result of new information, future events or otherwise, unless required by law. Overview We are a leading global services company that provides business consulting, technology, engineering and outsourcing services. In addition, we offer products, platforms and solutions to clients in different industries. Our professionals deliver high quality solutions by leveraging our Global Delivery Model through which we divide projects into components that we execute simultaneously at client sites and at our Development Centers in India and around the world. We seek to optimize our cost structure by maintaining the flexibility to execute project components where it is most cost effective. Our Global Delivery Model also allows us to provide clients with high quality solutions in reduced time-frames enabling them to achieve efficiencies. Our sales, marketing and business development teams are organized to focus on specific geographies and business segments and this helps us customize our service offerings to our client's needs. Our primary geographic markets are North America, Europe and the Asia Pacific region. We serve clients in financial services and insurance, manufacturing, energy, communications and services, resources and utilities, retail, consumer packaged goods and logistics, life sciences and healthcare and various other segments. There is an increasing need for highly skilled technology professionals in the markets in which we operate and in the industries to which we provide services. At the same time, companies are reluctant to expand their internal IT departments and increase costs. These factors have increased the reliance of companies on their outsourcing service providers and are expected to continue to drive future growth for outsourcing services. We believe that because the effective use of offshore technology services offers lower total costs of ownership of IT infrastructure, lower labor costs, improved quality and innovation and faster delivery of technology solutions, companies are increasingly turning to offshore technology service providers. India, in particular, has become a premier destination for offshore technology services. The key factors contributing to the growth of IT and IT enabled services in India include high quality delivery, significant cost benefits and the availability of a large and growing skilled and English speaking IT professionals. Our proven Global Delivery Model, our comprehensive end-to-end solutions, our commitment to superior quality and process execution, our long standing client relationships, our ability to service clients across industries and our ability to scale, make us one of the leading offshore service providers in India. There are numerous risks and challenges affecting the business. These risks and challenges are discussed in detail in the section entitled 'Risk Factors' in our Annual Report on Form 20-F for the year ended March 31, 2014, in our Quarterly Report on Form 6-K for the quarters ended June 30, 2014 and September 30, 2014 and updates, if any, in the section entitled “Risk Factors” and elsewhere in this Quarterly Report on Form 6-K. We were founded in 1981 and are headquartered in Bangalore, India. We completed our initial public offering of equity shares in India in 1993 and our initial public offering of ADSs in the United States in 1999. We completed three sponsored secondary ADS offerings in the United States in August 2003, June 2005 and November 2006. We did not receive any of the proceeds from any of our sponsored secondary offerings. On October 22, 2012, we acquired 100% of the voting interests in Lodestone Holding AG, a global management consultancy firm headquartered in Zurich, Switzerland. The Hon’ble High Court of Karnataka sanctioned the scheme of amalgamation of Infosys Consulting India Limited (ICIL) with Infosys Limited with an effective date of August 23, 2013. Accordingly, during fiscal 2014, all the assets and liabilities of ICIL were transferred to Infosys Limited on a going concern basis. As ICIL was a wholly owned subsidiary of Infosys Limited, no shares have been allocated to the shareholders upon the scheme becoming effective. We incorporated wholly owned subsidiary, Infosys Americas Inc., on June 25, 2013. On February 14, 2014, wholly owned subsidiary, Edgeverve Systems Limited (Edgeverve) was incorporated. Edgeverve was set up to focus on developing and selling products and platforms. On April 15, 2014, the Board of Directors of Infosys has authorized the Company to execute a Business Transfer Agreement and related documents with Edgeverve,
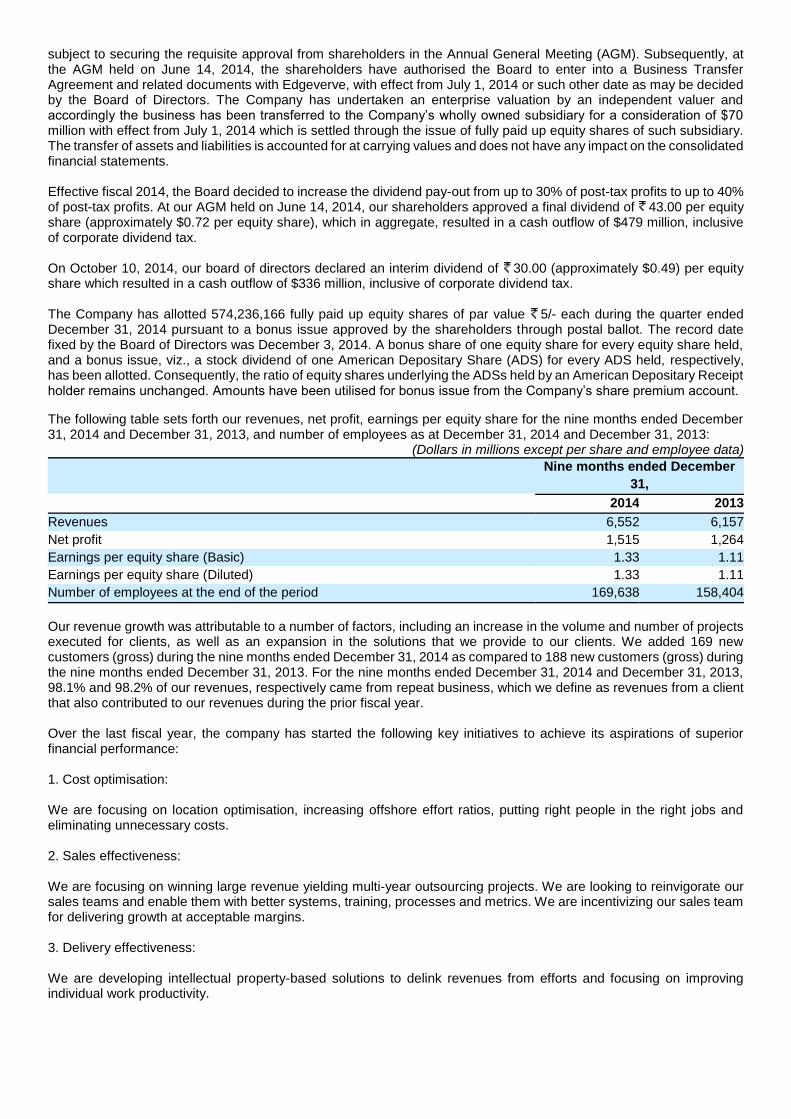
subject to securing the requisite approval from shareholders in the Annual General Meeting (AGM). Subsequently, at the AGM held on June 14, 2014, the shareholders have authorised the Board to enter into a Business Transfer Agreement and related documents with Edgeverve, with effect from July 1, 2014 or such other date as may be decided by the Board of Directors. The Company has undertaken an enterprise valuation by an independent valuer and accordingly the business has been transferred to the Company’s wholly owned subsidiary for a consideration of $70 million with effect from July 1, 2014 which is settled through the issue of fully paid up equity shares of such subsidiary. The transfer of assets and liabilities is accounted for at carrying values and does not have any impact on the consolidated financial statements. Effective fiscal 2014, the Board decided to increase the dividend pay-out from up to 30% of post-tax profits to up to 40% of post-tax profits. At our AGM held on June 14, 2014, our shareholders approved a final dividend of 43.00 per equity share (approximately $0.72 per equity share), which in aggregate, resulted in a cash outflow of $479 million, inclusive of corporate dividend tax. On October 10, 2014, our board of directors declared an interim dividend of 30.00 (approximately $0.49) per equity share which resulted in a cash outflow of $336 million, inclusive of corporate dividend tax. The Company has allotted 574,236,166 fully paid up equity shares of par value 5/- each during the quarter ended December 31, 2014 pursuant to a bonus issue approved by the shareholders through postal ballot. The record date fixed by the Board of Directors was December 3, 2014. A bonus share of one equity share for every equity share held, and a bonus issue, viz., a stock dividend of one American Depositary Share (ADS) for every ADS held, respectively, has been allotted. Consequently, the ratio of equity shares underlying the ADSs held by an American Depositary Receipt holder remains unchanged. Amounts have been utilised for bonus issue from the Company’s share premium account.
The following table sets forth our revenues, net profit, earnings per equity share for the nine months ended December 31, 2014 and December 31, 2013, and number of employees as at December 31, 2014 and December 31, 2013:
(Dollars in millions except per share and employee data)
Nine months ended December
31,
2014 2013
Revenues 6,552 6,157
Net profit 1,515 1,264
Earnings per equity share (Basic) 1.33 1.11
Earnings per equity share (Diluted) 1.33 1.11
Number of employees at the end of the period 169,638 158,404
Our revenue growth was attributable to a number of factors, including an increase in the volume and number of projects executed for clients, as well as an expansion in the solutions that we provide to our clients. We added 169 new customers (gross) during the nine months ended December 31, 2014 as compared to 188 new customers (gross) during the nine months ended December 31, 2013. For the nine months ended December 31, 2014 and December 31, 2013, 98.1% and 98.2% of our revenues, respectively came from repeat business, which we define as revenues from a client that also contributed to our revenues during the prior fiscal year. Over the last fiscal year, the company has started the following key initiatives to achieve its aspirations of superior financial performance: 1. Cost optimisation: We are focusing on location optimisation, increasing offshore effort ratios, putting right people in the right jobs and eliminating unnecessary costs. 2. Sales effectiveness: We are focusing on winning large revenue yielding multi-year outsourcing projects. We are looking to reinvigorate our sales teams and enable them with better systems, training, processes and metrics. We are incentivizing our sales team for delivering growth at acceptable margins. 3. Delivery effectiveness: We are developing intellectual property-based solutions to delink revenues from efforts and focusing on improving individual work productivity.
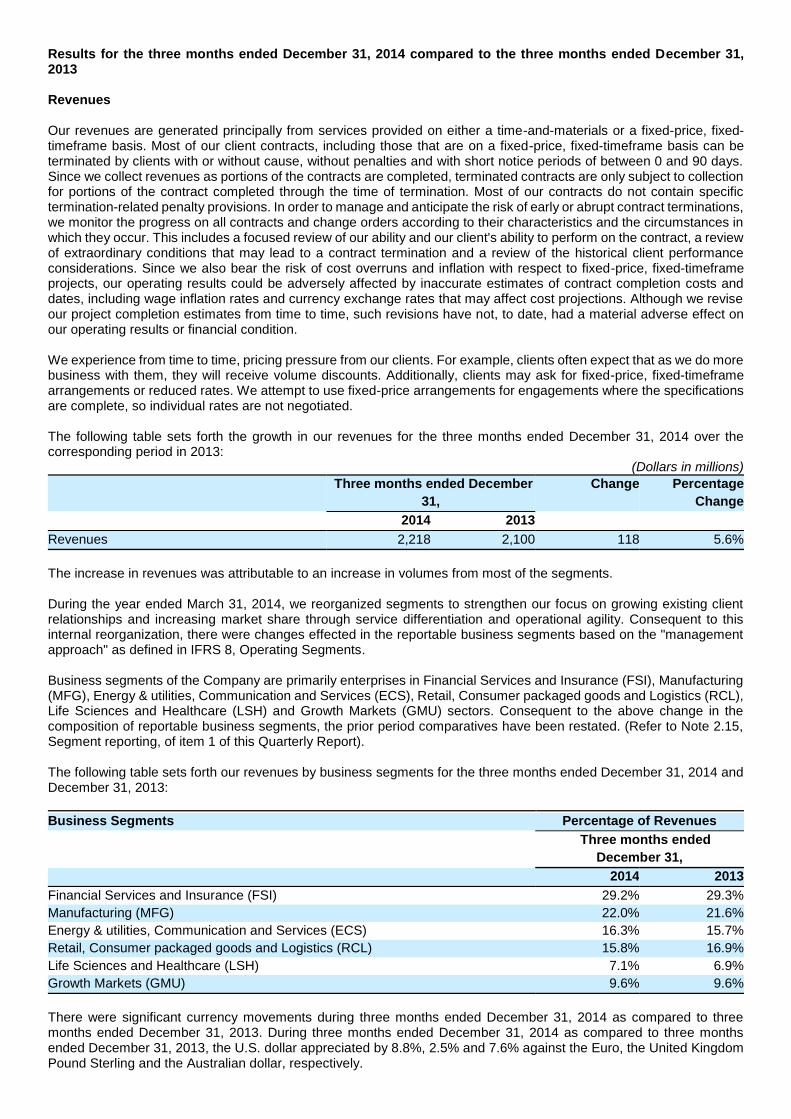
Results for the three months ended December 31, 2014 compared to the three months ended December 31, 2013 Revenues Our revenues are generated principally from services provided on either a time-and-materials or a fixed-price, fixed-timeframe basis. Most of our client contracts, including those that are on a fixed-price, fixed-timeframe basis can be terminated by clients with or without cause, without penalties and with short notice periods of between 0 and 90 days. Since we collect revenues as portions of the contracts are completed, terminated contracts are only subject to collection for portions of the contract completed through the time of termination. Most of our contracts do not contain specific termination-related penalty provisions. In order to manage and anticipate the risk of early or abrupt contract terminations, we monitor the progress on all contracts and change orders according to their characteristics and the circumstances in which they occur. This includes a focused review of our ability and our client's ability to perform on the contract, a review of extraordinary conditions that may lead to a contract termination and a review of the historical client performance considerations. Since we also bear the risk of cost overruns and inflation with respect to fixed-price, fixed-timeframe projects, our operating results could be adversely affected by inaccurate estimates of contract completion costs and dates, including wage inflation rates and currency exchange rates that may affect cost projections. Although we revise our project completion estimates from time to time, such revisions have not, to date, had a material adverse effect on our operating results or financial condition. We experience from time to time, pricing pressure from our clients. For example, clients often expect that as we do more business with them, they will receive volume discounts. Additionally, clients may ask for fixed-price, fixed-timeframe arrangements or reduced rates. We attempt to use fixed-price arrangements for engagements where the specifications are complete, so individual rates are not negotiated. The following table sets forth the growth in our revenues for the three months ended December 31, 2014 over the corresponding period in 2013:
(Dollars in millions)
Three months ended December
31,
Change Percentage
Change
2014 2013
Revenues 2,218 2,100 118 5.6%
The increase in revenues was attributable to an increase in volumes from most of the segments. During the year ended March 31, 2014, we reorganized segments to strengthen our focus on growing existing client relationships and increasing market share through service differentiation and operational agility. Consequent to this internal reorganization, there were changes effected in the reportable business segments based on the "management approach" as defined in IFRS 8, Operating Segments. Business segments of the Company are primarily enterprises in Financial Services and Insurance (FSI), Manufacturing (MFG), Energy & utilities, Communication and Services (ECS), Retail, Consumer packaged goods and Logistics (RCL), Life Sciences and Healthcare (LSH) and Growth Markets (GMU) sectors. Consequent to the above change in the composition of reportable business segments, the prior period comparatives have been restated. (Refer to Note 2.15, Segment reporting, of item 1 of this Quarterly Report). The following table sets forth our revenues by business segments for the three months ended December 31, 2014 and December 31, 2013:
Business Segments Percentage of Revenues
Three months ended
December 31,
2014 2013
Financial Services and Insurance (FSI) 29.2% 29.3%
Manufacturing (MFG) 22.0% 21.6%
Energy & utilities, Communication and Services (ECS) 16.3% 15.7%
Retail, Consumer packaged goods and Logistics (RCL) 15.8% 16.9%
Life Sciences and Healthcare (LSH) 7.1% 6.9%
Growth Markets (GMU) 9.6% 9.6%
There were significant currency movements during three months ended December 31, 2014 as compared to three months ended December 31, 2013. During three months ended December 31, 2014 as compared to three months ended December 31, 2013, the U.S. dollar appreciated by 8.8%, 2.5% and 7.6% against the Euro, the United Kingdom Pound Sterling and the Australian dollar, respectively.
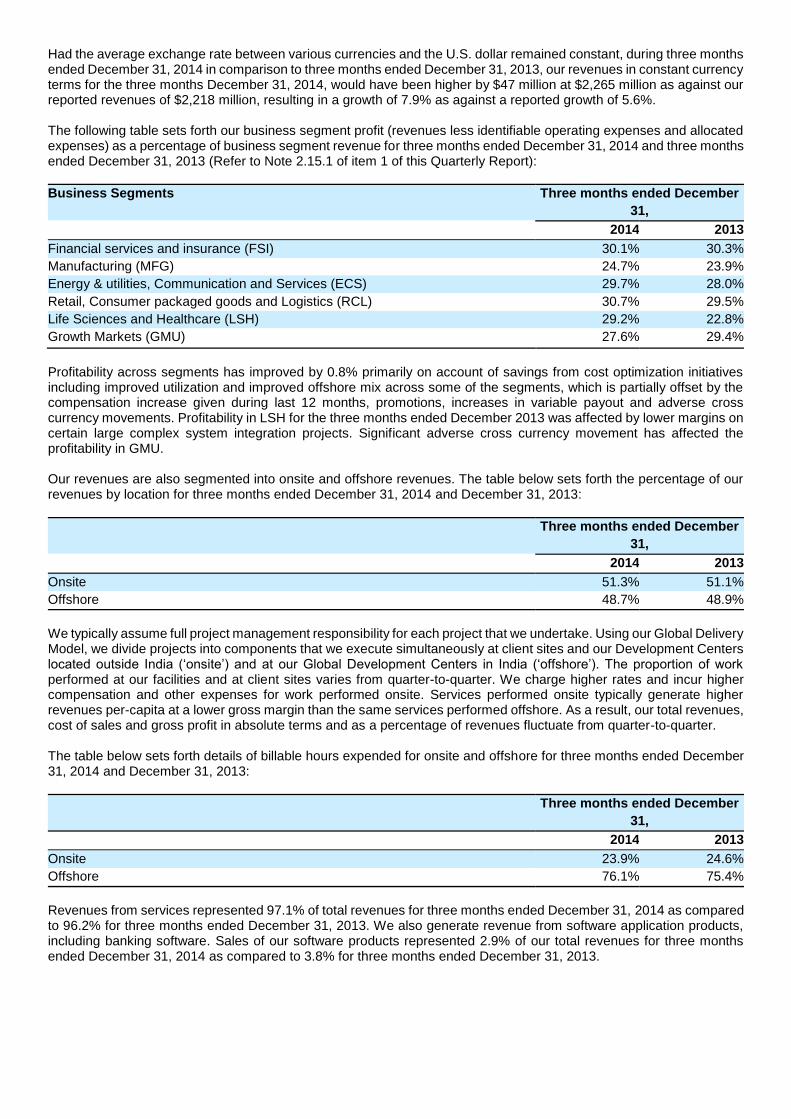
Had the average exchange rate between various currencies and the U.S. dollar remained constant, during three months ended December 31, 2014 in comparison to three months ended December 31, 2013, our revenues in constant currency terms for the three months December 31, 2014, would have been higher by $47 million at $2,265 million as against our reported revenues of $2,218 million, resulting in a growth of 7.9% as against a reported growth of 5.6%. The following table sets forth our business segment profit (revenues less identifiable operating expenses and allocated expenses) as a percentage of business segment revenue for three months ended December 31, 2014 and three months ended December 31, 2013 (Refer to Note 2.15.1 of item 1 of this Quarterly Report):
Business Segments Three months ended December
31,
2014 2013
Financial services and insurance (FSI) 30.1% 30.3%
Manufacturing (MFG) 24.7% 23.9%
Energy & utilities, Communication and Services (ECS) 29.7% 28.0%
Retail, Consumer packaged goods and Logistics (RCL) 30.7% 29.5%
Life Sciences and Healthcare (LSH) 29.2% 22.8%
Growth Markets (GMU) 27.6% 29.4%
Profitability across segments has improved by 0.8% primarily on account of savings from cost optimization initiatives including improved utilization and improved offshore mix across some of the segments, which is partially offset by the compensation increase given during last 12 months, promotions, increases in variable payout and adverse cross currency movements. Profitability in LSH for the three months ended December 2013 was affected by lower margins on certain large complex system integration projects. Significant adverse cross currency movement has affected the profitability in GMU. Our revenues are also segmented into onsite and offshore revenues. The table below sets forth the percentage of our revenues by location for three months ended December 31, 2014 and December 31, 2013:
Three months ended December
31,
2014 2013
Onsite 51.3% 51.1%
Offshore 48.7% 48.9%
We typically assume full project management responsibility for each project that we undertake. Using our Global Delivery Model, we divide projects into components that we execute simultaneously at client sites and our Development Centers located outside India (‘onsite’) and at our Global Development Centers in India (‘offshore’). The proportion of work performed at our facilities and at client sites varies from quarter-to-quarter. We charge higher rates and incur higher compensation and other expenses for work performed onsite. Services performed onsite typically generate higher revenues per-capita at a lower gross margin than the same services performed offshore. As a result, our total revenues, cost of sales and gross profit in absolute terms and as a percentage of revenues fluctuate from quarter-to-quarter. The table below sets forth details of billable hours expended for onsite and offshore for three months ended December 31, 2014 and December 31, 2013:
Three months ended December
31,
2014 2013
Onsite 23.9% 24.6%
Offshore 76.1% 75.4%
Revenues from services represented 97.1% of total revenues for three months ended December 31, 2014 as compared to 96.2% for three months ended December 31, 2013. We also generate revenue from software application products, including banking software. Sales of our software products represented 2.9% of our total revenues for three months ended December 31, 2014 as compared to 3.8% for three months ended December 31, 2013.
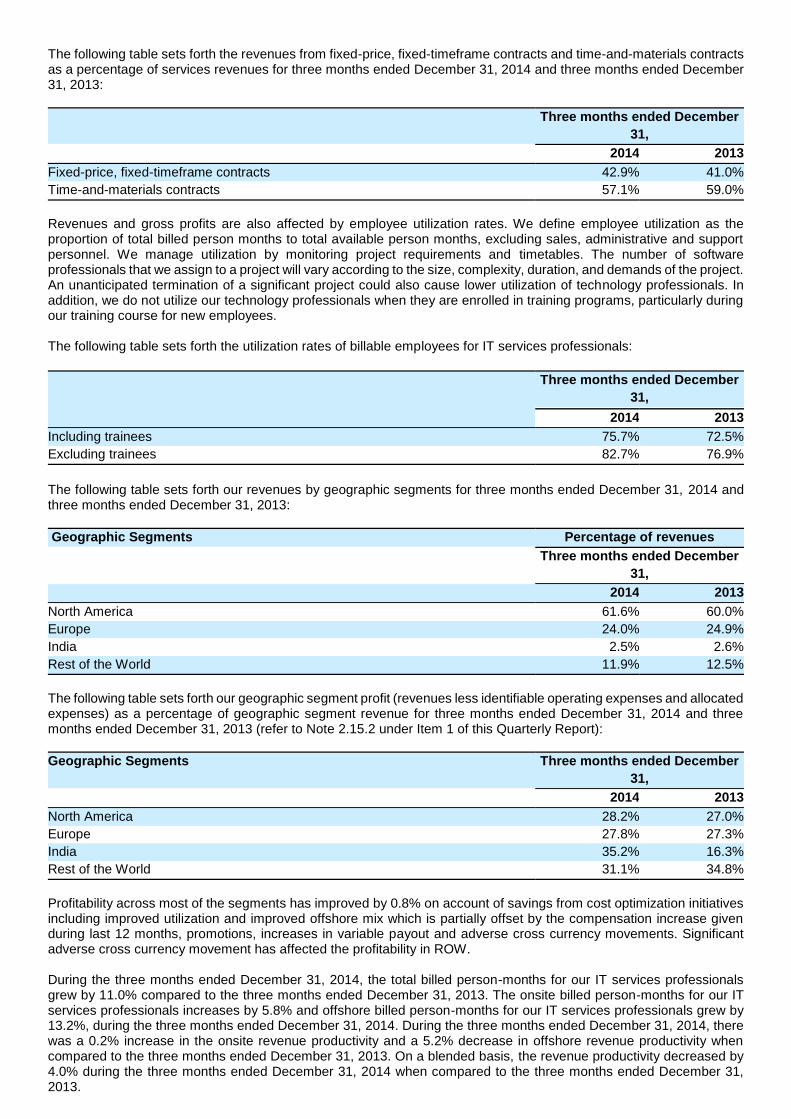
The following table sets forth the revenues from fixed-price, fixed-timeframe contracts and time-and-materials contracts as a percentage of services revenues for three months ended December 31, 2014 and three months ended December 31, 2013:
Three months ended December
31,
2014 2013
Fixed-price, fixed-timeframe contracts 42.9% 41.0%
Time-and-materials contracts 57.1% 59.0%
Revenues and gross profits are also affected by employee utilization rates. We define employee utilization as the proportion of total billed person months to total available person months, excluding sales, administrative and support personnel. We manage utilization by monitoring project requirements and timetables. The number of software professionals that we assign to a project will vary according to the size, complexity, duration, and demands of the project. An unanticipated termination of a significant project could also cause lower utilization of technology professionals. In addition, we do not utilize our technology professionals when they are enrolled in training programs, particularly during our training course for new employees. The following table sets forth the utilization rates of billable employees for IT services professionals:
Three months ended December
31,
2014 2013
Including trainees 75.7% 72.5%
Excluding trainees 82.7% 76.9%
The following table sets forth our revenues by geographic segments for three months ended December 31, 2014 and three months ended December 31, 2013:
Geographic Segments Percentage of revenues
Three months ended December
31,
2014 2013
North America 61.6% 60.0%
Europe 24.0% 24.9%
India 2.5% 2.6%
Rest of the World 11.9% 12.5%
The following table sets forth our geographic segment profit (revenues less identifiable operating expenses and allocated expenses) as a percentage of geographic segment revenue for three months ended December 31, 2014 and three months ended December 31, 2013 (refer to Note 2.15.2 under Item 1 of this Quarterly Report):
Geographic Segments Three months ended December
31,
2014 2013
North America 28.2% 27.0%
Europe 27.8% 27.3%
India 35.2% 16.3%
Rest of the World 31.1% 34.8%
Profitability across most of the segments has improved by 0.8% on account of savings from cost optimization initiatives including improved utilization and improved offshore mix which is partially offset by the compensation increase given during last 12 months, promotions, increases in variable payout and adverse cross currency movements. Significant adverse cross currency movement has affected the profitability in ROW. During the three months ended December 31, 2014, the total billed person-months for our IT services professionals grew by 11.0% compared to the three months ended December 31, 2013. The onsite billed person-months for our IT services professionals increases by 5.8% and offshore billed person-months for our IT services professionals grew by 13.2%, during the three months ended December 31, 2014. During the three months ended December 31, 2014, there was a 0.2% increase in the onsite revenue productivity and a 5.2% decrease in offshore revenue productivity when compared to the three months ended December 31, 2013. On a blended basis, the revenue productivity decreased by 4.0% during the three months ended December 31, 2014 when compared to the three months ended December 31, 2013.
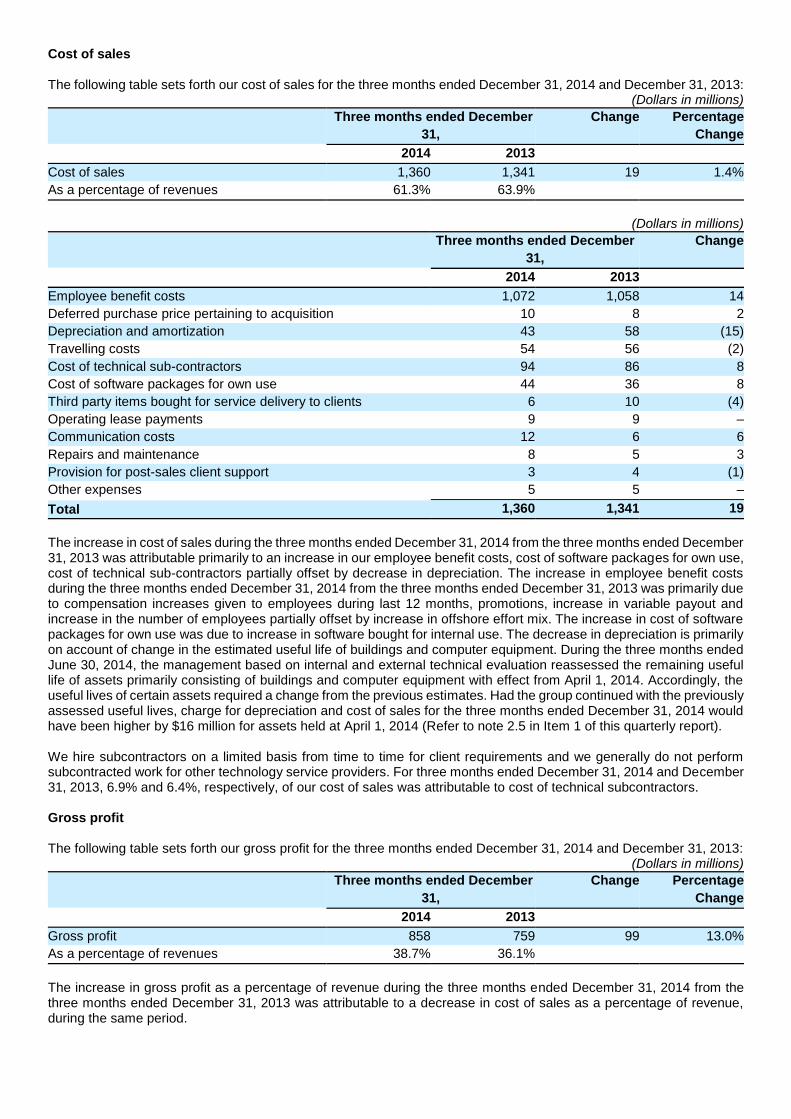
Cost of sales
The following table sets forth our cost of sales for the three months ended December 31, 2014 and December 31, 2013: (Dollars in millions)
Three months ended December
31,
Change Percentage
Change
2014 2013
Cost of sales 1,360 1,341 19 1.4%
As a percentage of revenues 61.3% 63.9%
(Dollars in millions)
Three months ended December
31,
Change
2014 2013
Employee benefit costs 1,072 1,058 14
Deferred purchase price pertaining to acquisition 10 8 2
Depreciation and amortization 43 58 (15)
Travelling costs 54 56 (2)
Cost of technical sub-contractors 94 86 8
Cost of software packages for own use 44 36 8
Third party items bought for service delivery to clients 6 10 (4)
Operating lease payments 9 9 –
Communication costs 12 6 6
Repairs and maintenance 8 5 3
Provision for post-sales client support 3 4 (1)
Other expenses 5 5 –
Total 1,360 1,341 19
The increase in cost of sales during the three months ended December 31, 2014 from the three months ended December 31, 2013 was attributable primarily to an increase in our employee benefit costs, cost of software packages for own use, cost of technical sub-contractors partially offset by decrease in depreciation. The increase in employee benefit costs during the three months ended December 31, 2014 from the three months ended December 31, 2013 was primarily due to compensation increases given to employees during last 12 months, promotions, increase in variable payout and increase in the number of employees partially offset by increase in offshore effort mix. The increase in cost of software packages for own use was due to increase in software bought for internal use. The decrease in depreciation is primarily on account of change in the estimated useful life of buildings and computer equipment. During the three months ended June 30, 2014, the management based on internal and external technical evaluation reassessed the remaining useful life of assets primarily consisting of buildings and computer equipment with effect from April 1, 2014. Accordingly, the useful lives of certain assets required a change from the previous estimates. Had the group continued with the previously assessed useful lives, charge for depreciation and cost of sales for the three months ended December 31, 2014 would have been higher by $16 million for assets held at April 1, 2014 (Refer to note 2.5 in Item 1 of this quarterly report). We hire subcontractors on a limited basis from time to time for client requirements and we generally do not perform subcontracted work for other technology service providers. For three months ended December 31, 2014 and December 31, 2013, 6.9% and 6.4%, respectively, of our cost of sales was attributable to cost of technical subcontractors. Gross profit
The following table sets forth our gross profit for the three months ended December 31, 2014 and December 31, 2013:
(Dollars in millions)
Three months ended December
31,
Change Percentage
Change
2014 2013
Gross profit 858 759 99 13.0%
As a percentage of revenues 38.7% 36.1%
The increase in gross profit as a percentage of revenue during the three months ended December 31, 2014 from the three months ended December 31, 2013 was attributable to a decrease in cost of sales as a percentage of revenue, during the same period.
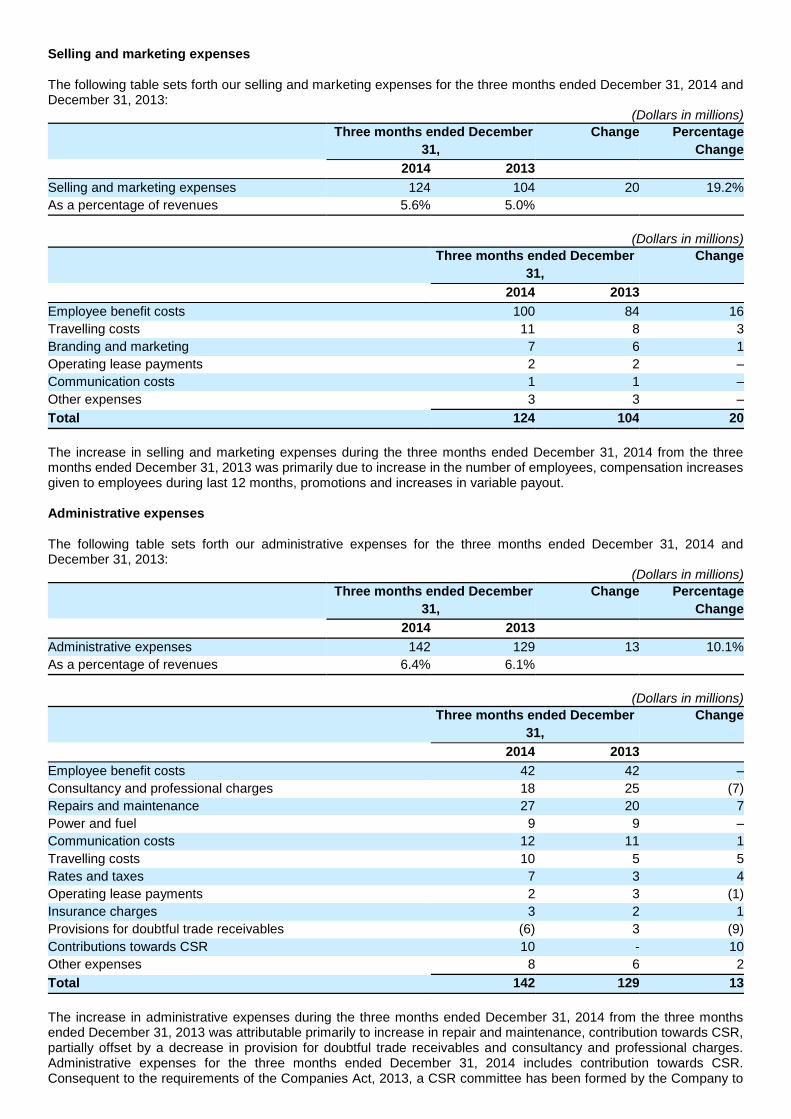
Selling and marketing expenses
The following table sets forth our selling and marketing expenses for the three months ended December 31, 2014 and December 31, 2013:
(Dollars in millions)
Three months ended December
31,
Change Percentage
Change
2014 2013
Selling and marketing expenses 124 104 20 19.2%
As a percentage of revenues 5.6% 5.0%
(Dollars in millions)
Three months ended December
31,
Change
2014 2013
Employee benefit costs 100 84 16
Travelling costs 11 8 3
Branding and marketing 7 6 1
Operating lease payments 2 2 –
Communication costs 1 1 –
Other expenses 3 3 –
Total 124 104 20
The increase in selling and marketing expenses during the three months ended December 31, 2014 from the three months ended December 31, 2013 was primarily due to increase in the number of employees, compensation increases given to employees during last 12 months, promotions and increases in variable payout. Administrative expenses
The following table sets forth our administrative expenses for the three months ended December 31, 2014 and December 31, 2013:
(Dollars in millions)
Three months ended December
31,
Change Percentage
Change
2014 2013
Administrative expenses 142 129 13 10.1%
As a percentage of revenues 6.4% 6.1%
(Dollars in millions)
Three months ended December
31,
Change
2014 2013
Employee benefit costs 42 42 –
Consultancy and professional charges 18 25 (7)
Repairs and maintenance 27 20 7
Power and fuel 9 9 –
Communication costs 12 11 1
Travelling costs 10 5 5
Rates and taxes 7 3 4
Operating lease payments 2 3 (1)
Insurance charges 3 2 1
Provisions for doubtful trade receivables (6) 3 (9)
Contributions towards CSR 10 - 10
Other expenses 8 6 2
Total 142 129 13
The increase in administrative expenses during the three months ended December 31, 2014 from the three months ended December 31, 2013 was attributable primarily to increase in repair and maintenance, contribution towards CSR, partially offset by a decrease in provision for doubtful trade receivables and consultancy and professional charges. Administrative expenses for the three months ended December 31, 2014 includes contribution towards CSR. Consequent to the requirements of the Companies Act, 2013, a CSR committee has been formed by the Company to
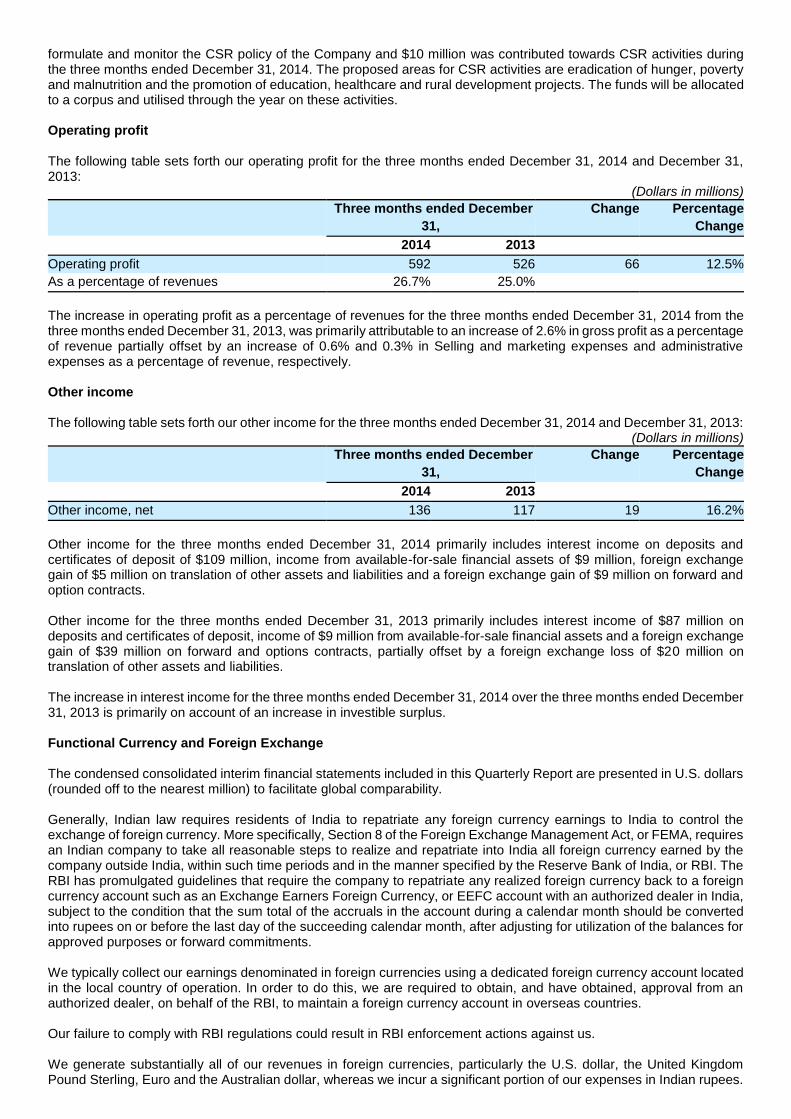
formulate and monitor the CSR policy of the Company and $10 million was contributed towards CSR activities during the three months ended December 31, 2014. The proposed areas for CSR activities are eradication of hunger, poverty and malnutrition and the promotion of education, healthcare and rural development projects. The funds will be allocated to a corpus and utilised through the year on these activities. Operating profit
The following table sets forth our operating profit for the three months ended December 31, 2014 and December 31, 2013:
(Dollars in millions)
Three months ended December
31,
Change Percentage
Change
2014 2013
Operating profit 592 526 66 12.5%
As a percentage of revenues 26.7% 25.0%
The increase in operating profit as a percentage of revenues for the three months ended December 31, 2014 from the three months ended December 31, 2013, was primarily attributable to an increase of 2.6% in gross profit as a percentage of revenue partially offset by an increase of 0.6% and 0.3% in Selling and marketing expenses and administrative expenses as a percentage of revenue, respectively. Other income The following table sets forth our other income for the three months ended December 31, 2014 and December 31, 2013:
(Dollars in millions)
Three months ended December
31,
Change Percentage
Change
2014 2013
Other income, net 136 117 19 16.2%
Other income for the three months ended December 31, 2014 primarily includes interest income on deposits and certificates of deposit of $109 million, income from available-for-sale financial assets of $9 million, foreign exchange gain of $5 million on translation of other assets and liabilities and a foreign exchange gain of $9 million on forward and option contracts. Other income for the three months ended December 31, 2013 primarily includes interest income of $87 million on deposits and certificates of deposit, income of $9 million from available-for-sale financial assets and a foreign exchange gain of $39 million on forward and options contracts, partially offset by a foreign exchange loss of $20 million on translation of other assets and liabilities. The increase in interest income for the three months ended December 31, 2014 over the three months ended December 31, 2013 is primarily on account of an increase in investible surplus.
Functional Currency and Foreign Exchange
The condensed consolidated interim financial statements included in this Quarterly Report are presented in U.S. dollars (rounded off to the nearest million) to facilitate global comparability.
Generally, Indian law requires residents of India to repatriate any foreign currency earnings to India to control the exchange of foreign currency. More specifically, Section 8 of the Foreign Exchange Management Act, or FEMA, requires an Indian company to take all reasonable steps to realize and repatriate into India all foreign currency earned by the company outside India, within such time periods and in the manner specified by the Reserve Bank of India, or RBI. The RBI has promulgated guidelines that require the company to repatriate any realized foreign currency back to a foreign currency account such as an Exchange Earners Foreign Currency, or EEFC account with an authorized dealer in India, subject to the condition that the sum total of the accruals in the account during a calendar month should be converted into rupees on or before the last day of the succeeding calendar month, after adjusting for utilization of the balances for approved purposes or forward commitments. We typically collect our earnings denominated in foreign currencies using a dedicated foreign currency account located in the local country of operation. In order to do this, we are required to obtain, and have obtained, approval from an authorized dealer, on behalf of the RBI, to maintain a foreign currency account in overseas countries.
Our failure to comply with RBI regulations could result in RBI enforcement actions against us. We generate substantially all of our revenues in foreign currencies, particularly the U.S. dollar, the United Kingdom Pound Sterling, Euro and the Australian dollar, whereas we incur a significant portion of our expenses in Indian rupees.
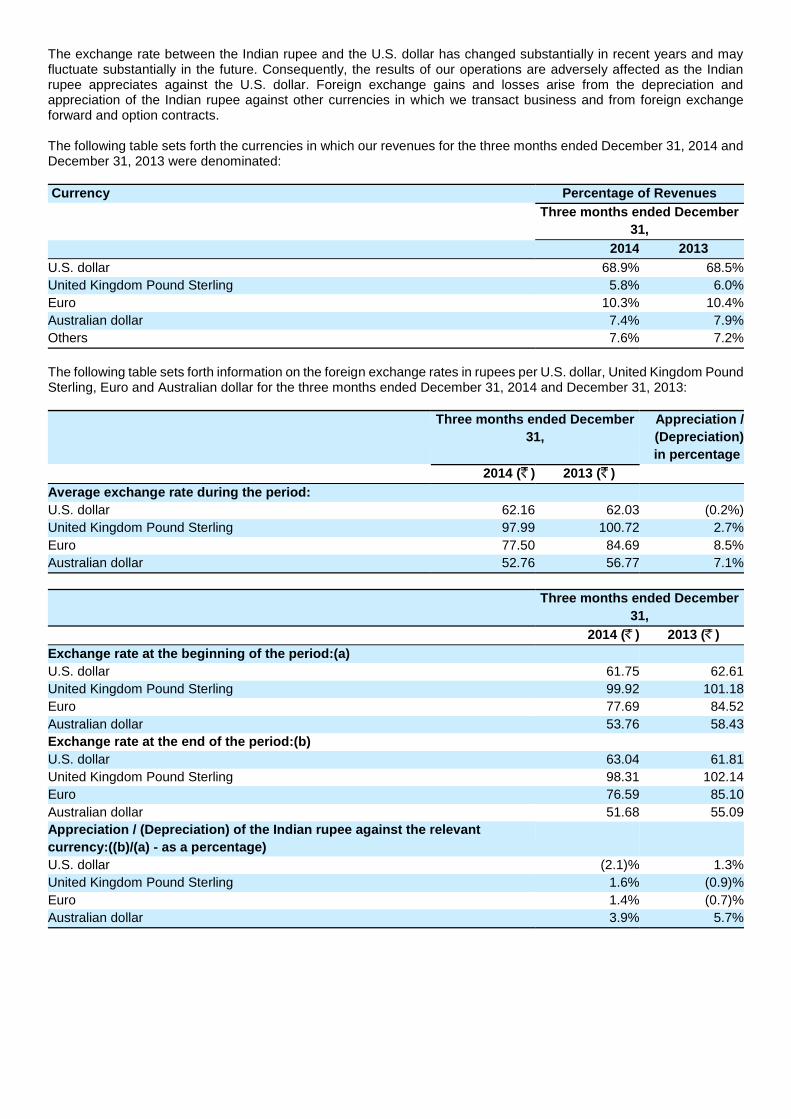
The exchange rate between the Indian rupee and the U.S. dollar has changed substantially in recent years and may fluctuate substantially in the future. Consequently, the results of our operations are adversely affected as the Indian rupee appreciates against the U.S. dollar. Foreign exchange gains and losses arise from the depreciation and appreciation of the Indian rupee against other currencies in which we transact business and from foreign exchange forward and option contracts.
The following table sets forth the currencies in which our revenues for the three months ended December 31, 2014 and December 31, 2013 were denominated:
Currency Percentage of Revenues
Three months ended December
31,
2014 2013
U.S. dollar 68.9% 68.5%
United Kingdom Pound Sterling 5.8% 6.0%
Euro 10.3% 10.4%
Australian dollar 7.4% 7.9%
Others 7.6% 7.2%
The following table sets forth information on the foreign exchange rates in rupees per U.S. dollar, United Kingdom Pound Sterling, Euro and Australian dollar for the three months ended December 31, 2014 and December 31, 2013:
Three months ended December
31,
Appreciation /
(Depreciation)
in percentage
2014 ( ) 2013 ( )
Average exchange rate during the period:
U.S. dollar 62.16 62.03 (0.2%)
United Kingdom Pound Sterling 97.99 100.72 2.7%
Euro 77.50 84.69 8.5%
Australian dollar 52.76 56.77 7.1%
Three months ended December
31,
2014 ( ) 2013 ( )
Exchange rate at the beginning of the period:(a)
U.S. dollar 61.75 62.61
United Kingdom Pound Sterling 99.92 101.18
Euro 77.69 84.52
Australian dollar 53.76 58.43
Exchange rate at the end of the period:(b)
U.S. dollar 63.04 61.81
United Kingdom Pound Sterling 98.31 102.14
Euro 76.59 85.10
Australian dollar 51.68 55.09
Appreciation / (Depreciation) of the Indian rupee against the relevant
currency:((b)/(a) - as a percentage)
U.S. dollar (2.1)% 1.3%
United Kingdom Pound Sterling 1.6% (0.9)%
Euro 1.4% (0.7)%
Australian dollar 3.9% 5.7%
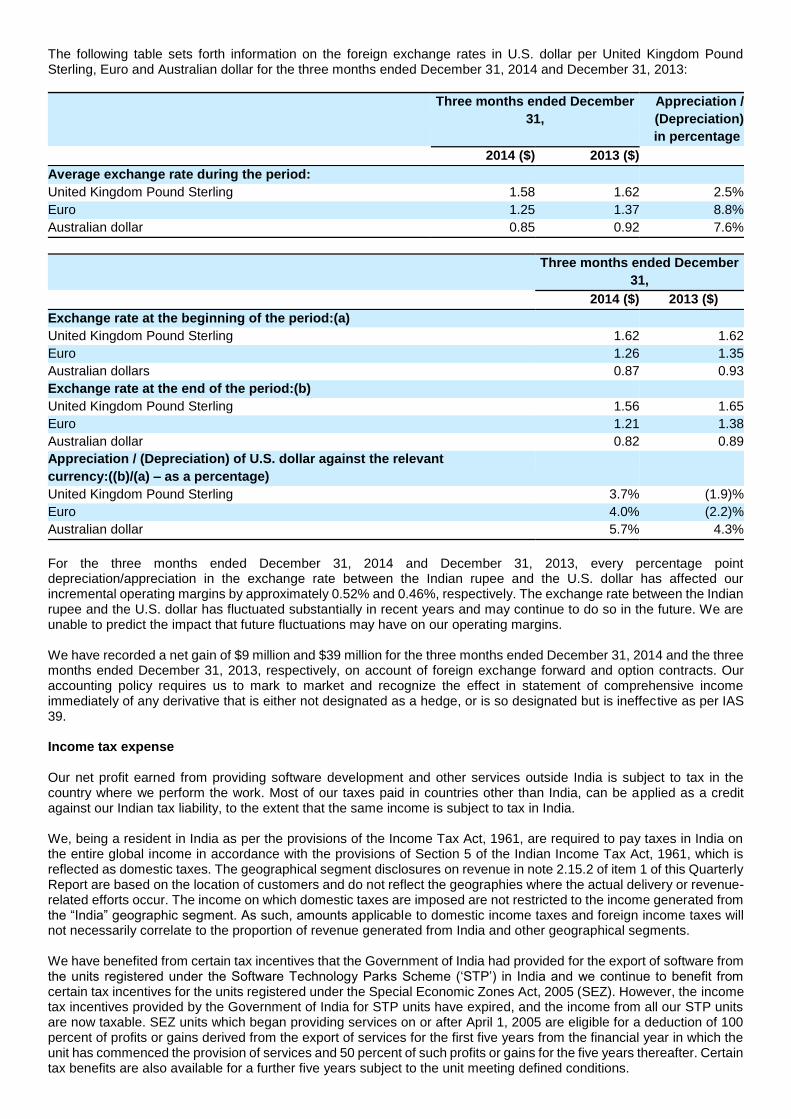
The following table sets forth information on the foreign exchange rates in U.S. dollar per United Kingdom Pound Sterling, Euro and Australian dollar for the three months ended December 31, 2014 and December 31, 2013:
Three months ended December
31,
Appreciation /
(Depreciation)
in percentage
2014 ($) 2013 ($)
Average exchange rate during the period:
United Kingdom Pound Sterling 1.58 1.62 2.5%
Euro 1.25 1.37 8.8%
Australian dollar 0.85 0.92 7.6%
Three months ended December
31,
2014 ($) 2013 ($)
Exchange rate at the beginning of the period:(a)
United Kingdom Pound Sterling 1.62 1.62
Euro 1.26 1.35
Australian dollars 0.87 0.93
Exchange rate at the end of the period:(b)
United Kingdom Pound Sterling 1.56 1.65
Euro 1.21 1.38
Australian dollar 0.82 0.89
Appreciation / (Depreciation) of U.S. dollar against the relevant
currency:((b)/(a) – as a percentage)
United Kingdom Pound Sterling 3.7% (1.9)%
Euro 4.0% (2.2)%
Australian dollar 5.7% 4.3%
For the three months ended December 31, 2014 and December 31, 2013, every percentage point depreciation/appreciation in the exchange rate between the Indian rupee and the U.S. dollar has affected our incremental operating margins by approximately 0.52% and 0.46%, respectively. The exchange rate between the Indian rupee and the U.S. dollar has fluctuated substantially in recent years and may continue to do so in the future. We are unable to predict the impact that future fluctuations may have on our operating margins. We have recorded a net gain of $9 million and $39 million for the three months ended December 31, 2014 and the three months ended December 31, 2013, respectively, on account of foreign exchange forward and option contracts. Our accounting policy requires us to mark to market and recognize the effect in statement of comprehensive income immediately of any derivative that is either not designated as a hedge, or is so designated but is ineffective as per IAS 39. Income tax expense Our net profit earned from providing software development and other services outside India is subject to tax in the country where we perform the work. Most of our taxes paid in countries other than India, can be applied as a credit against our Indian tax liability, to the extent that the same income is subject to tax in India. We, being a resident in India as per the provisions of the Income Tax Act, 1961, are required to pay taxes in India on the entire global income in accordance with the provisions of Section 5 of the Indian Income Tax Act, 1961, which is reflected as domestic taxes. The geographical segment disclosures on revenue in note 2.15.2 of item 1 of this Quarterly Report are based on the location of customers and do not reflect the geographies where the actual delivery or revenue-related efforts occur. The income on which domestic taxes are imposed are not restricted to the income generated from the “India” geographic segment. As such, amounts applicable to domestic income taxes and foreign income taxes will not necessarily correlate to the proportion of revenue generated from India and other geographical segments. We have benefited from certain tax incentives that the Government of India had provided for the export of software from the units registered under the Software Technology Parks Scheme (‘STP’) in India and we continue to benefit from certain tax incentives for the units registered under the Special Economic Zones Act, 2005 (SEZ). However, the income tax incentives provided by the Government of India for STP units have expired, and the income from all our STP units are now taxable. SEZ units which began providing services on or after April 1, 2005 are eligible for a deduction of 100 percent of profits or gains derived from the export of services for the first five years from the financial year in which the unit has commenced the provision of services and 50 percent of such profits or gains for the five years thereafter. Certain tax benefits are also available for a further five years subject to the unit meeting defined conditions.
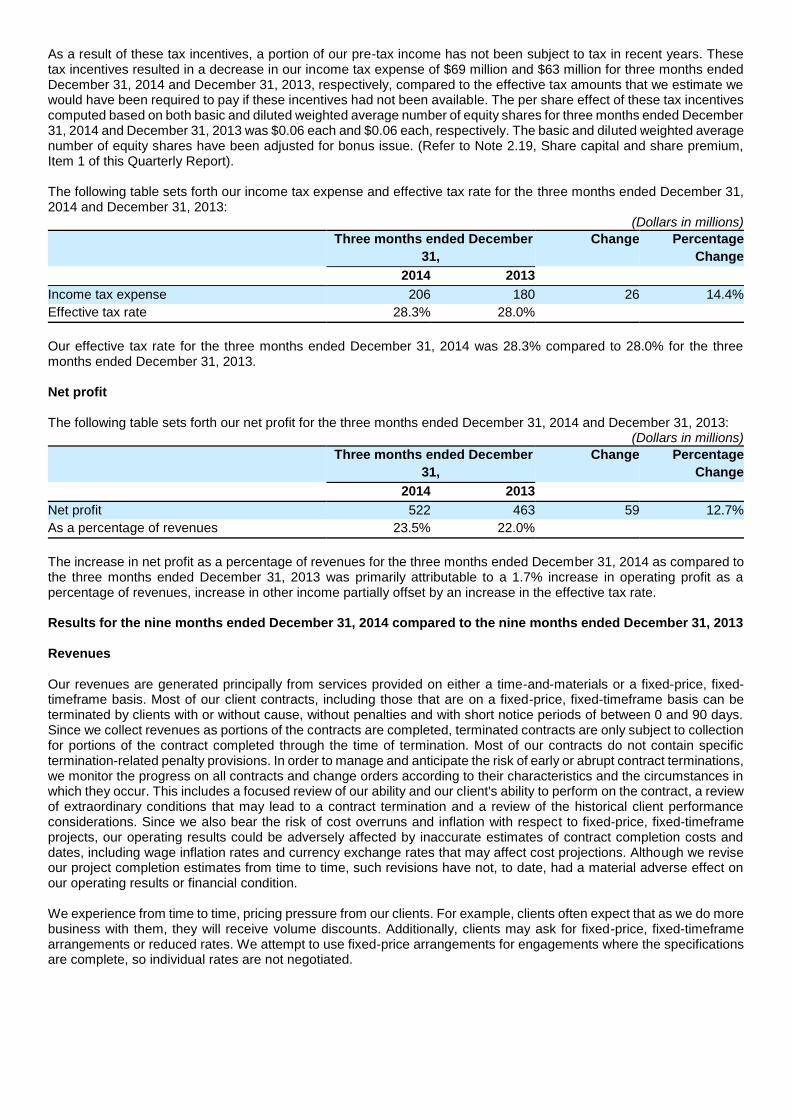
As a result of these tax incentives, a portion of our pre-tax income has not been subject to tax in recent years. These tax incentives resulted in a decrease in our income tax expense of $69 million and $63 million for three months ended December 31, 2014 and December 31, 2013, respectively, compared to the effective tax amounts that we estimate we would have been required to pay if these incentives had not been available. The per share effect of these tax incentives computed based on both basic and diluted weighted average number of equity shares for three months ended December 31, 2014 and December 31, 2013 was $0.06 each and $0.06 each, respectively. The basic and diluted weighted average number of equity shares have been adjusted for bonus issue. (Refer to Note 2.19, Share capital and share premium, Item 1 of this Quarterly Report). The following table sets forth our income tax expense and effective tax rate for the three months ended December 31, 2014 and December 31, 2013:
(Dollars in millions)
Three months ended December
31,
Change Percentage
Change
2014 2013
Income tax expense 206 180 26 14.4%
Effective tax rate 28.3% 28.0%
Our effective tax rate for the three months ended December 31, 2014 was 28.3% compared to 28.0% for the three months ended December 31, 2013. Net profit The following table sets forth our net profit for the three months ended December 31, 2014 and December 31, 2013:
(Dollars in millions)
Three months ended December
31,
Change Percentage
Change
2014 2013
Net profit 522 463 59 12.7%
As a percentage of revenues 23.5% 22.0%
The increase in net profit as a percentage of revenues for the three months ended December 31, 2014 as compared to the three months ended December 31, 2013 was primarily attributable to a 1.7% increase in operating profit as a percentage of revenues, increase in other income partially offset by an increase in the effective tax rate. Results for the nine months ended December 31, 2014 compared to the nine months ended December 31, 2013
Revenues Our revenues are generated principally from services provided on either a time-and-materials or a fixed-price, fixed-timeframe basis. Most of our client contracts, including those that are on a fixed-price, fixed-timeframe basis can be terminated by clients with or without cause, without penalties and with short notice periods of between 0 and 90 days. Since we collect revenues as portions of the contracts are completed, terminated contracts are only subject to collection for portions of the contract completed through the time of termination. Most of our contracts do not contain specific termination-related penalty provisions. In order to manage and anticipate the risk of early or abrupt contract terminations, we monitor the progress on all contracts and change orders according to their characteristics and the circumstances in which they occur. This includes a focused review of our ability and our client's ability to perform on the contract, a review of extraordinary conditions that may lead to a contract termination and a review of the historical client performance considerations. Since we also bear the risk of cost overruns and inflation with respect to fixed-price, fixed-timeframe projects, our operating results could be adversely affected by inaccurate estimates of contract completion costs and dates, including wage inflation rates and currency exchange rates that may affect cost projections. Although we revise our project completion estimates from time to time, such revisions have not, to date, had a material adverse effect on our operating results or financial condition. We experience from time to time, pricing pressure from our clients. For example, clients often expect that as we do more business with them, they will receive volume discounts. Additionally, clients may ask for fixed-price, fixed-timeframe arrangements or reduced rates. We attempt to use fixed-price arrangements for engagements where the specifications are complete, so individual rates are not negotiated.
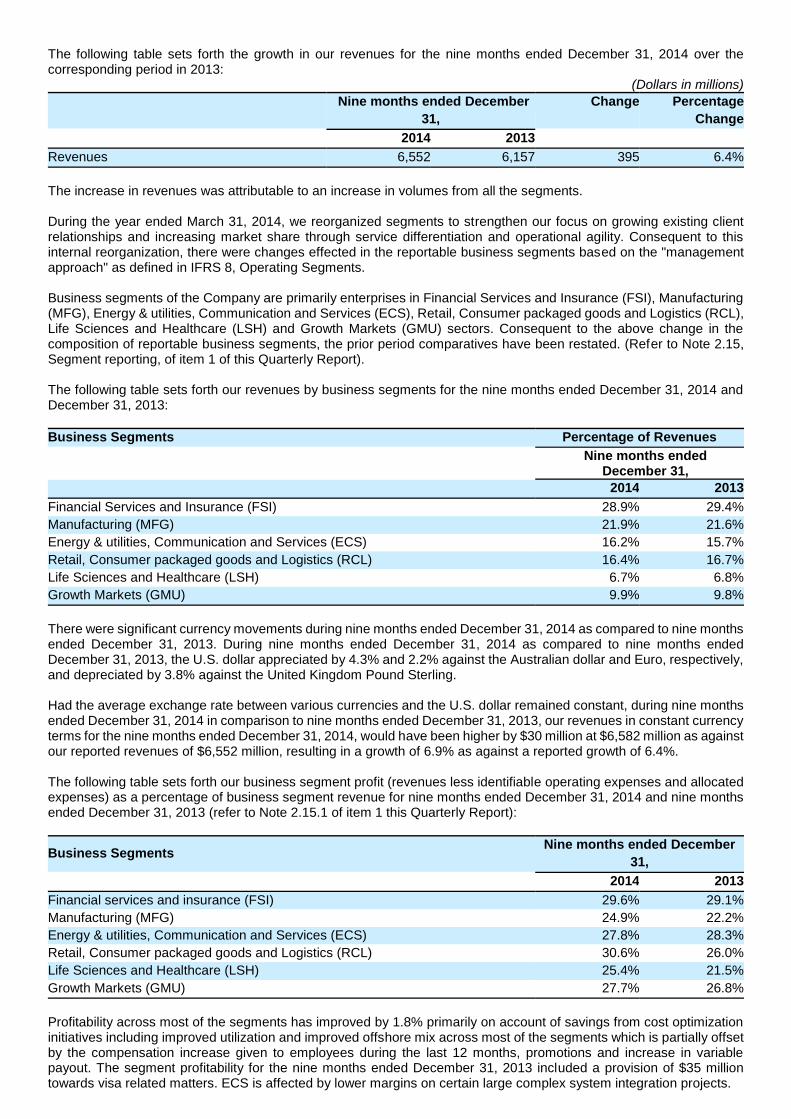
The following table sets forth the growth in our revenues for the nine months ended December 31, 2014 over the corresponding period in 2013:
(Dollars in millions)
Nine months ended December
31,
Change Percentage
Change
2014 2013
Revenues 6,552 6,157 395 6.4%
The increase in revenues was attributable to an increase in volumes from all the segments. During the year ended March 31, 2014, we reorganized segments to strengthen our focus on growing existing client relationships and increasing market share through service differentiation and operational agility. Consequent to this internal reorganization, there were changes effected in the reportable business segments based on the "management approach" as defined in IFRS 8, Operating Segments. Business segments of the Company are primarily enterprises in Financial Services and Insurance (FSI), Manufacturing (MFG), Energy & utilities, Communication and Services (ECS), Retail, Consumer packaged goods and Logistics (RCL), Life Sciences and Healthcare (LSH) and Growth Markets (GMU) sectors. Consequent to the above change in the composition of reportable business segments, the prior period comparatives have been restated. (Refer to Note 2.15, Segment reporting, of item 1 of this Quarterly Report). The following table sets forth our revenues by business segments for the nine months ended December 31, 2014 and December 31, 2013:
Business Segments Percentage of Revenues
Nine months ended
December 31,
2014 2013
Financial Services and Insurance (FSI) 28.9% 29.4%
Manufacturing (MFG) 21.9% 21.6%
Energy & utilities, Communication and Services (ECS) 16.2% 15.7%
Retail, Consumer packaged goods and Logistics (RCL) 16.4% 16.7%
Life Sciences and Healthcare (LSH) 6.7% 6.8%
Growth Markets (GMU) 9.9% 9.8%
There were significant currency movements during nine months ended December 31, 2014 as compared to nine months ended December 31, 2013. During nine months ended December 31, 2014 as compared to nine months ended December 31, 2013, the U.S. dollar appreciated by 4.3% and 2.2% against the Australian dollar and Euro, respectively, and depreciated by 3.8% against the United Kingdom Pound Sterling.
Had the average exchange rate between various currencies and the U.S. dollar remained constant, during nine months ended December 31, 2014 in comparison to nine months ended December 31, 2013, our revenues in constant currency terms for the nine months ended December 31, 2014, would have been higher by $30 million at $6,582 million as against our reported revenues of $6,552 million, resulting in a growth of 6.9% as against a reported growth of 6.4%. The following table sets forth our business segment profit (revenues less identifiable operating expenses and allocated expenses) as a percentage of business segment revenue for nine months ended December 31, 2014 and nine months ended December 31, 2013 (refer to Note 2.15.1 of item 1 this Quarterly Report):
Business Segments Nine months ended December
31,
2014 2013
Financial services and insurance (FSI) 29.6% 29.1%
Manufacturing (MFG) 24.9% 22.2%
Energy & utilities, Communication and Services (ECS) 27.8% 28.3%
Retail, Consumer packaged goods and Logistics (RCL) 30.6% 26.0%
Life Sciences and Healthcare (LSH) 25.4% 21.5%
Growth Markets (GMU) 27.7% 26.8%
Profitability across most of the segments has improved by 1.8% primarily on account of savings from cost optimization initiatives including improved utilization and improved offshore mix across most of the segments which is partially offset by the compensation increase given to employees during the last 12 months, promotions and increase in variable payout. The segment profitability for the nine months ended December 31, 2013 included a provision of $35 million towards visa related matters. ECS is affected by lower margins on certain large complex system integration projects.
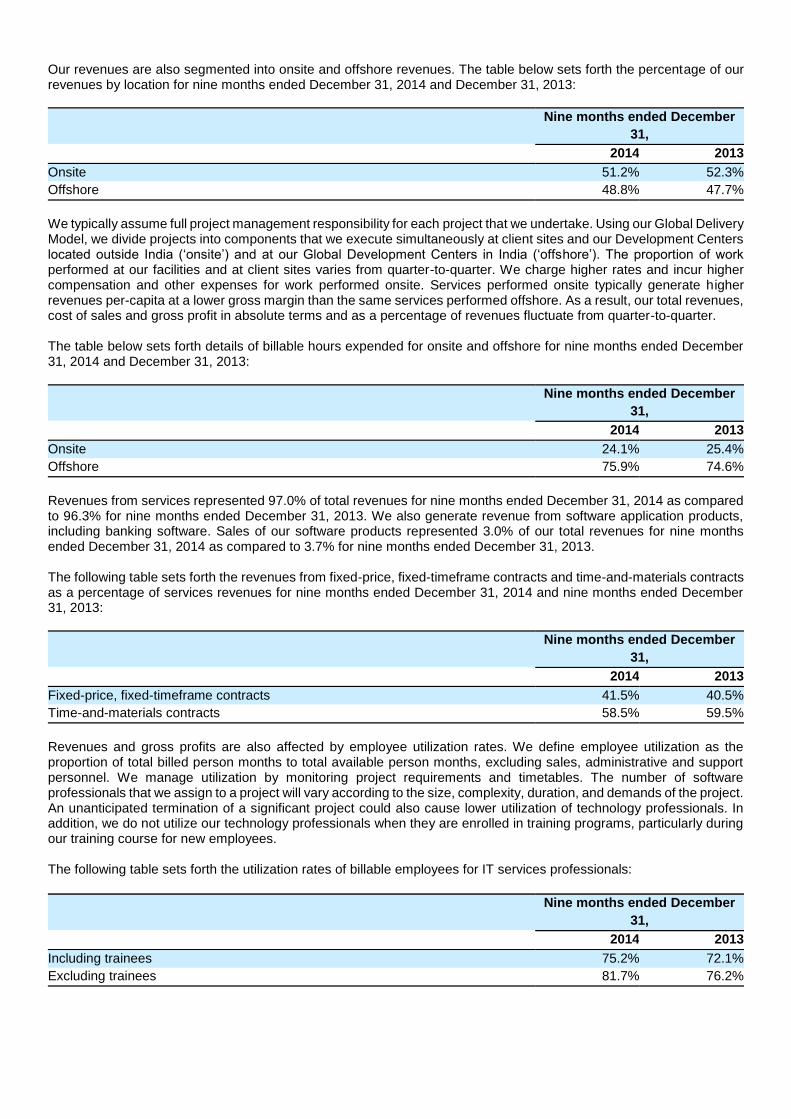
Our revenues are also segmented into onsite and offshore revenues. The table below sets forth the percentage of our revenues by location for nine months ended December 31, 2014 and December 31, 2013:
Nine months ended December
31,
2014 2013
Onsite 51.2% 52.3%
Offshore 48.8% 47.7%
We typically assume full project management responsibility for each project that we undertake. Using our Global Delivery Model, we divide projects into components that we execute simultaneously at client sites and our Development Centers located outside India (‘onsite’) and at our Global Development Centers in India (‘offshore’). The proportion of work performed at our facilities and at client sites varies from quarter-to-quarter. We charge higher rates and incur higher compensation and other expenses for work performed onsite. Services performed onsite typically generate higher revenues per-capita at a lower gross margin than the same services performed offshore. As a result, our total revenues, cost of sales and gross profit in absolute terms and as a percentage of revenues fluctuate from quarter-to-quarter. The table below sets forth details of billable hours expended for onsite and offshore for nine months ended December 31, 2014 and December 31, 2013:
Nine months ended December
31,
2014 2013
Onsite 24.1% 25.4%
Offshore 75.9% 74.6%
Revenues from services represented 97.0% of total revenues for nine months ended December 31, 2014 as compared to 96.3% for nine months ended December 31, 2013. We also generate revenue from software application products, including banking software. Sales of our software products represented 3.0% of our total revenues for nine months ended December 31, 2014 as compared to 3.7% for nine months ended December 31, 2013.
The following table sets forth the revenues from fixed-price, fixed-timeframe contracts and time-and-materials contracts as a percentage of services revenues for nine months ended December 31, 2014 and nine months ended December 31, 2013:
Nine months ended December
31,
2014 2013
Fixed-price, fixed-timeframe contracts 41.5% 40.5%
Time-and-materials contracts 58.5% 59.5%
Revenues and gross profits are also affected by employee utilization rates. We define employee utilization as the proportion of total billed person months to total available person months, excluding sales, administrative and support personnel. We manage utilization by monitoring project requirements and timetables. The number of software professionals that we assign to a project will vary according to the size, complexity, duration, and demands of the project. An unanticipated termination of a significant project could also cause lower utilization of technology professionals. In addition, we do not utilize our technology professionals when they are enrolled in training programs, particularly during our training course for new employees. The following table sets forth the utilization rates of billable employees for IT services professionals:
Nine months ended December
31,
2014 2013
Including trainees 75.2% 72.1%
Excluding trainees 81.7% 76.2%
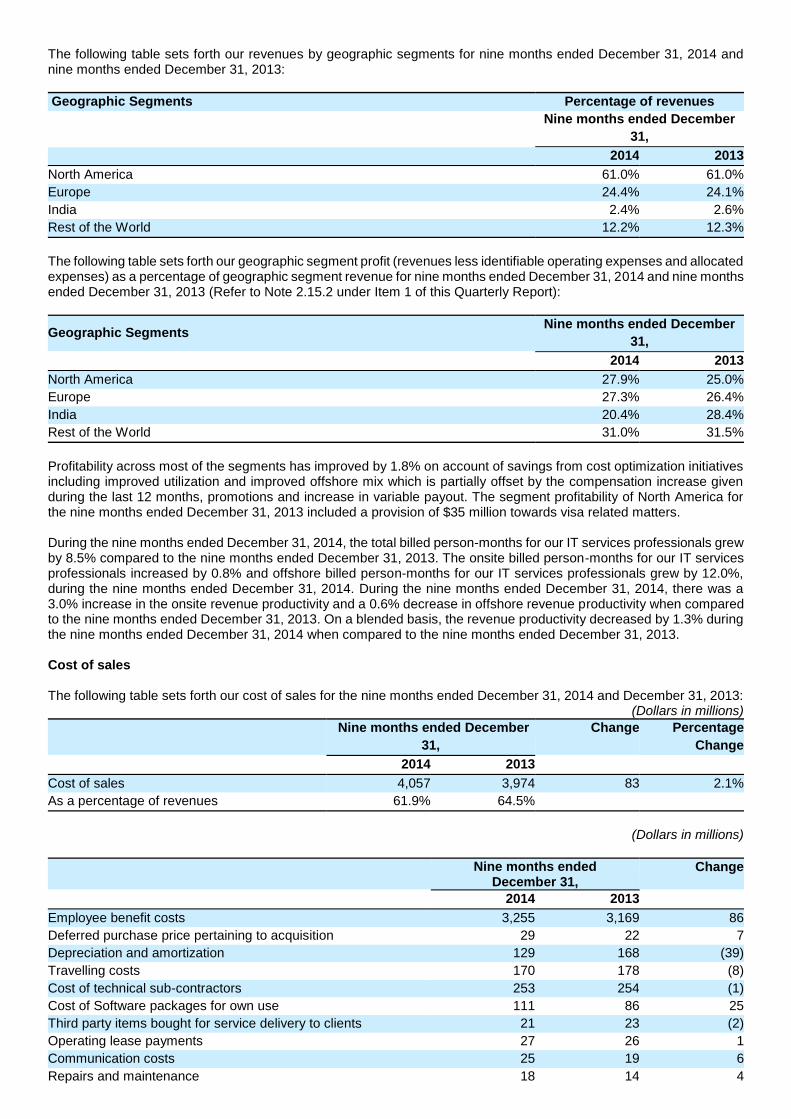
The following table sets forth our revenues by geographic segments for nine months ended December 31, 2014 and nine months ended December 31, 2013:
Geographic Segments Percentage of revenues
Nine months ended December
31,
2014 2013
North America 61.0% 61.0%
Europe 24.4% 24.1%
India 2.4% 2.6%
Rest of the World 12.2% 12.3%
The following table sets forth our geographic segment profit (revenues less identifiable operating expenses and allocated expenses) as a percentage of geographic segment revenue for nine months ended December 31, 2014 and nine months ended December 31, 2013 (Refer to Note 2.15.2 under Item 1 of this Quarterly Report):
Geographic Segments Nine months ended December
31,
2014 2013
North America 27.9% 25.0%
Europe 27.3% 26.4%
India 20.4% 28.4%
Rest of the World 31.0% 31.5%
Profitability across most of the segments has improved by 1.8% on account of savings from cost optimization initiatives including improved utilization and improved offshore mix which is partially offset by the compensation increase given during the last 12 months, promotions and increase in variable payout. The segment profitability of North America for the nine months ended December 31, 2013 included a provision of $35 million towards visa related matters. During the nine months ended December 31, 2014, the total billed person-months for our IT services professionals grew by 8.5% compared to the nine months ended December 31, 2013. The onsite billed person-months for our IT services professionals increased by 0.8% and offshore billed person-months for our IT services professionals grew by 12.0%, during the nine months ended December 31, 2014. During the nine months ended December 31, 2014, there was a 3.0% increase in the onsite revenue productivity and a 0.6% decrease in offshore revenue productivity when compared to the nine months ended December 31, 2013. On a blended basis, the revenue productivity decreased by 1.3% during the nine months ended December 31, 2014 when compared to the nine months ended December 31, 2013.
Cost of sales
The following table sets forth our cost of sales for the nine months ended December 31, 2014 and December 31, 2013:
(Dollars in millions)
Nine months ended December
31,
Change Percentage
Change
2014 2013
Cost of sales 4,057 3,974 83 2.1%
As a percentage of revenues 61.9% 64.5%
(Dollars in millions)
Nine months ended
December 31, Change
2014 2013
Employee benefit costs 3,255 3,169 86
Deferred purchase price pertaining to acquisition 29 22 7
Depreciation and amortization 129 168 (39)
Travelling costs 170 178 (8)
Cost of technical sub-contractors 253 254 (1)
Cost of Software packages for own use 111 86 25
Third party items bought for service delivery to clients 21 23 (2)
Operating lease payments 27 26 1
Communication costs 25 19 6
Repairs and maintenance 18 14 4
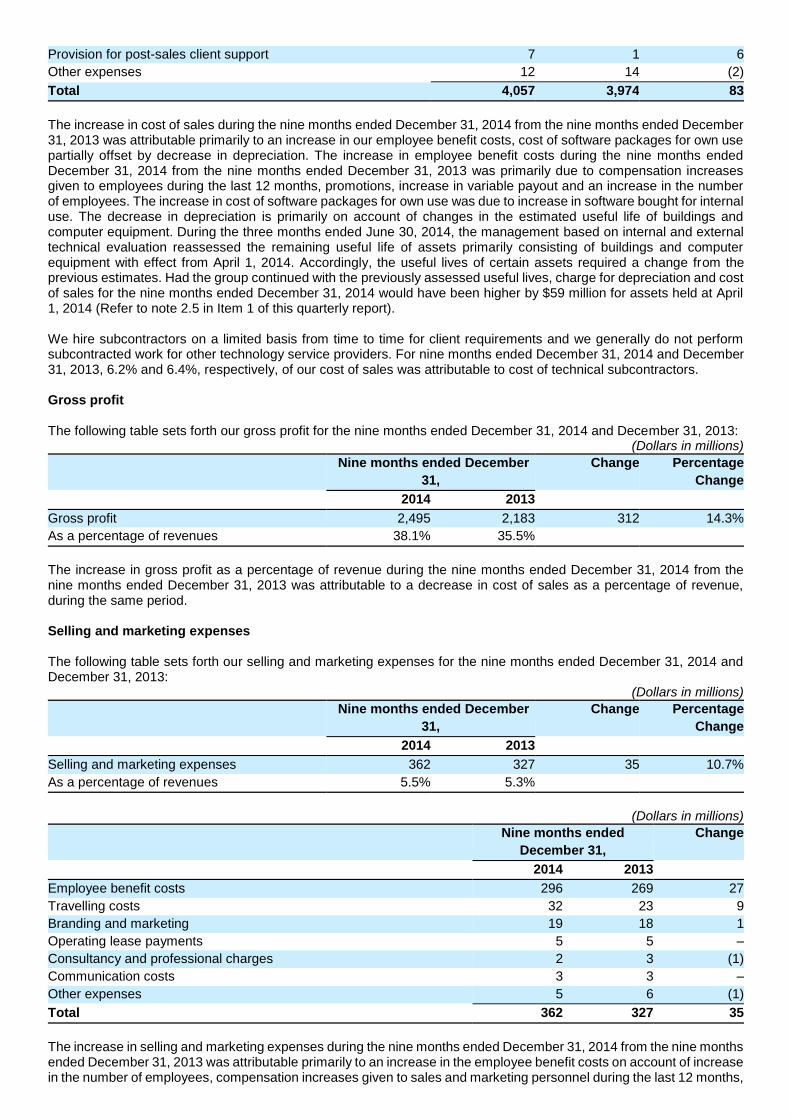
Provision for post-sales client support 7 1 6
Other expenses 12 14 (2)
Total 4,057 3,974 83
The increase in cost of sales during the nine months ended December 31, 2014 from the nine months ended December 31, 2013 was attributable primarily to an increase in our employee benefit costs, cost of software packages for own use partially offset by decrease in depreciation. The increase in employee benefit costs during the nine months ended December 31, 2014 from the nine months ended December 31, 2013 was primarily due to compensation increases given to employees during the last 12 months, promotions, increase in variable payout and an increase in the number of employees. The increase in cost of software packages for own use was due to increase in software bought for internal use. The decrease in depreciation is primarily on account of changes in the estimated useful life of buildings and computer equipment. During the three months ended June 30, 2014, the management based on internal and external technical evaluation reassessed the remaining useful life of assets primarily consisting of buildings and computer equipment with effect from April 1, 2014. Accordingly, the useful lives of certain assets required a change from the previous estimates. Had the group continued with the previously assessed useful lives, charge for depreciation and cost of sales for the nine months ended December 31, 2014 would have been higher by $59 million for assets held at April 1, 2014 (Refer to note 2.5 in Item 1 of this quarterly report). We hire subcontractors on a limited basis from time to time for client requirements and we generally do not perform subcontracted work for other technology service providers. For nine months ended December 31, 2014 and December 31, 2013, 6.2% and 6.4%, respectively, of our cost of sales was attributable to cost of technical subcontractors. Gross profit
The following table sets forth our gross profit for the nine months ended December 31, 2014 and December 31, 2013:
(Dollars in millions)
Nine months ended December
31,
Change Percentage
Change
2014 2013
Gross profit 2,495 2,183 312 14.3%
As a percentage of revenues 38.1% 35.5%
The increase in gross profit as a percentage of revenue during the nine months ended December 31, 2014 from the nine months ended December 31, 2013 was attributable to a decrease in cost of sales as a percentage of revenue, during the same period. Selling and marketing expenses The following table sets forth our selling and marketing expenses for the nine months ended December 31, 2014 and December 31, 2013:
(Dollars in millions)
Nine months ended December
31,
Change Percentage
Change
2014 2013
Selling and marketing expenses 362 327 35 10.7%
As a percentage of revenues 5.5% 5.3%
(Dollars in millions)
Nine months ended
December 31,
Change
2014 2013
Employee benefit costs 296 269 27
Travelling costs 32 23 9
Branding and marketing 19 18 1
Operating lease payments 5 5 –
Consultancy and professional charges 2 3 (1)
Communication costs 3 3 –
Other expenses 5 6 (1)
Total 362 327 35
The increase in selling and marketing expenses during the nine months ended December 31, 2014 from the nine months ended December 31, 2013 was attributable primarily to an increase in the employee benefit costs on account of increase in the number of employees, compensation increases given to sales and marketing personnel during the last 12 months,
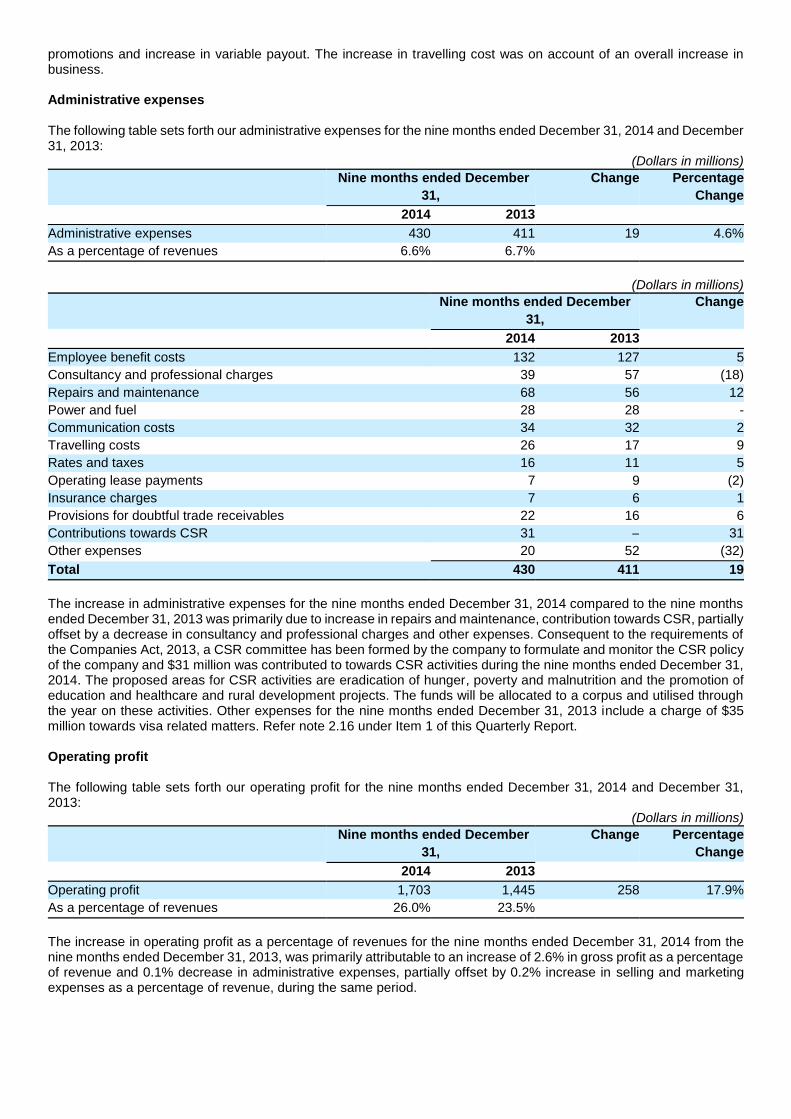
promotions and increase in variable payout. The increase in travelling cost was on account of an overall increase in business. Administrative expenses The following table sets forth our administrative expenses for the nine months ended December 31, 2014 and December 31, 2013:
(Dollars in millions)
Nine months ended December
31,
Change Percentage
Change
2014 2013
Administrative expenses 430 411 19 4.6%
As a percentage of revenues 6.6% 6.7%
(Dollars in millions)
Nine months ended December
31,
Change
2014 2013
Employee benefit costs 132 127 5
Consultancy and professional charges 39 57 (18)
Repairs and maintenance 68 56 12
Power and fuel 28 28 -
Communication costs 34 32 2
Travelling costs 26 17 9
Rates and taxes 16 11 5
Operating lease payments 7 9 (2)
Insurance charges 7 6 1
Provisions for doubtful trade receivables 22 16 6
Contributions towards CSR 31 – 31
Other expenses 20 52 (32)
Total 430 411 19
The increase in administrative expenses for the nine months ended December 31, 2014 compared to the nine months ended December 31, 2013 was primarily due to increase in repairs and maintenance, contribution towards CSR, partially offset by a decrease in consultancy and professional charges and other expenses. Consequent to the requirements of the Companies Act, 2013, a CSR committee has been formed by the company to formulate and monitor the CSR policy of the company and $31 million was contributed to towards CSR activities during the nine months ended December 31, 2014. The proposed areas for CSR activities are eradication of hunger, poverty and malnutrition and the promotion of education and healthcare and rural development projects. The funds will be allocated to a corpus and utilised through the year on these activities. Other expenses for the nine months ended December 31, 2013 include a charge of $35 million towards visa related matters. Refer note 2.16 under Item 1 of this Quarterly Report. Operating profit
The following table sets forth our operating profit for the nine months ended December 31, 2014 and December 31, 2013:
(Dollars in millions)
Nine months ended December
31,
Change Percentage
Change
2014 2013
Operating profit 1,703 1,445 258 17.9%
As a percentage of revenues 26.0% 23.5%
The increase in operating profit as a percentage of revenues for the nine months ended December 31, 2014 from the nine months ended December 31, 2013, was primarily attributable to an increase of 2.6% in gross profit as a percentage of revenue and 0.1% decrease in administrative expenses, partially offset by 0.2% increase in selling and marketing expenses as a percentage of revenue, during the same period.
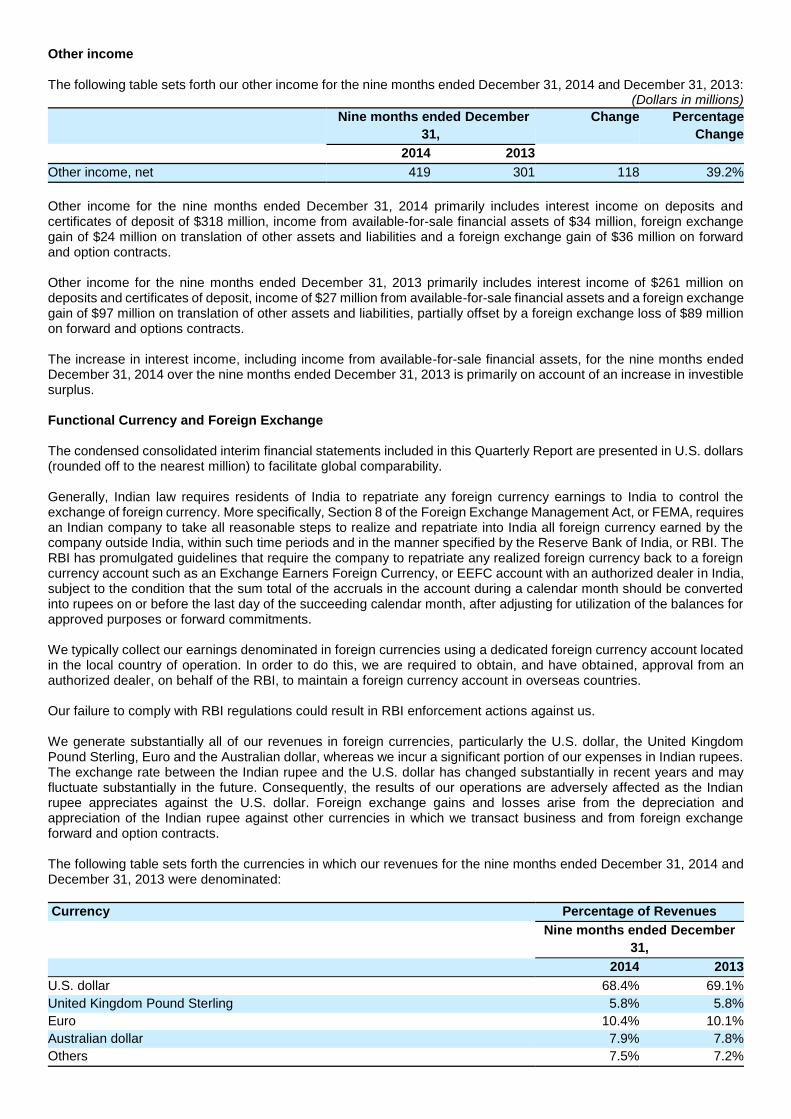
Other income The following table sets forth our other income for the nine months ended December 31, 2014 and December 31, 2013:
(Dollars in millions)
Nine months ended December
31,
Change Percentage
Change
2014 2013
Other income, net 419 301 118 39.2%
Other income for the nine months ended December 31, 2014 primarily includes interest income on deposits and certificates of deposit of $318 million, income from available-for-sale financial assets of $34 million, foreign exchange gain of $24 million on translation of other assets and liabilities and a foreign exchange gain of $36 million on forward and option contracts. Other income for the nine months ended December 31, 2013 primarily includes interest income of $261 million on deposits and certificates of deposit, income of $27 million from available-for-sale financial assets and a foreign exchange gain of $97 million on translation of other assets and liabilities, partially offset by a foreign exchange loss of $89 million on forward and options contracts. The increase in interest income, including income from available-for-sale financial assets, for the nine months ended December 31, 2014 over the nine months ended December 31, 2013 is primarily on account of an increase in investible surplus.
Functional Currency and Foreign Exchange
The condensed consolidated interim financial statements included in this Quarterly Report are presented in U.S. dollars (rounded off to the nearest million) to facilitate global comparability.
Generally, Indian law requires residents of India to repatriate any foreign currency earnings to India to control the exchange of foreign currency. More specifically, Section 8 of the Foreign Exchange Management Act, or FEMA, requires an Indian company to take all reasonable steps to realize and repatriate into India all foreign currency earned by the company outside India, within such time periods and in the manner specified by the Reserve Bank of India, or RBI. The RBI has promulgated guidelines that require the company to repatriate any realized foreign currency back to a foreign currency account such as an Exchange Earners Foreign Currency, or EEFC account with an authorized dealer in India, subject to the condition that the sum total of the accruals in the account during a calendar month should be converted into rupees on or before the last day of the succeeding calendar month, after adjusting for utilization of the balances for approved purposes or forward commitments. We typically collect our earnings denominated in foreign currencies using a dedicated foreign currency account located in the local country of operation. In order to do this, we are required to obtain, and have obtained, approval from an authorized dealer, on behalf of the RBI, to maintain a foreign currency account in overseas countries.
Our failure to comply with RBI regulations could result in RBI enforcement actions against us. We generate substantially all of our revenues in foreign currencies, particularly the U.S. dollar, the United Kingdom Pound Sterling, Euro and the Australian dollar, whereas we incur a significant portion of our expenses in Indian rupees. The exchange rate between the Indian rupee and the U.S. dollar has changed substantially in recent years and may fluctuate substantially in the future. Consequently, the results of our operations are adversely affected as the Indian rupee appreciates against the U.S. dollar. Foreign exchange gains and losses arise from the depreciation and appreciation of the Indian rupee against other currencies in which we transact business and from foreign exchange forward and option contracts.
The following table sets forth the currencies in which our revenues for the nine months ended December 31, 2014 and December 31, 2013 were denominated:
Currency Percentage of Revenues
Nine months ended December
31,
2014 2013
U.S. dollar 68.4% 69.1%
United Kingdom Pound Sterling 5.8% 5.8%
Euro 10.4% 10.1%
Australian dollar 7.9% 7.8%
Others 7.5% 7.2%
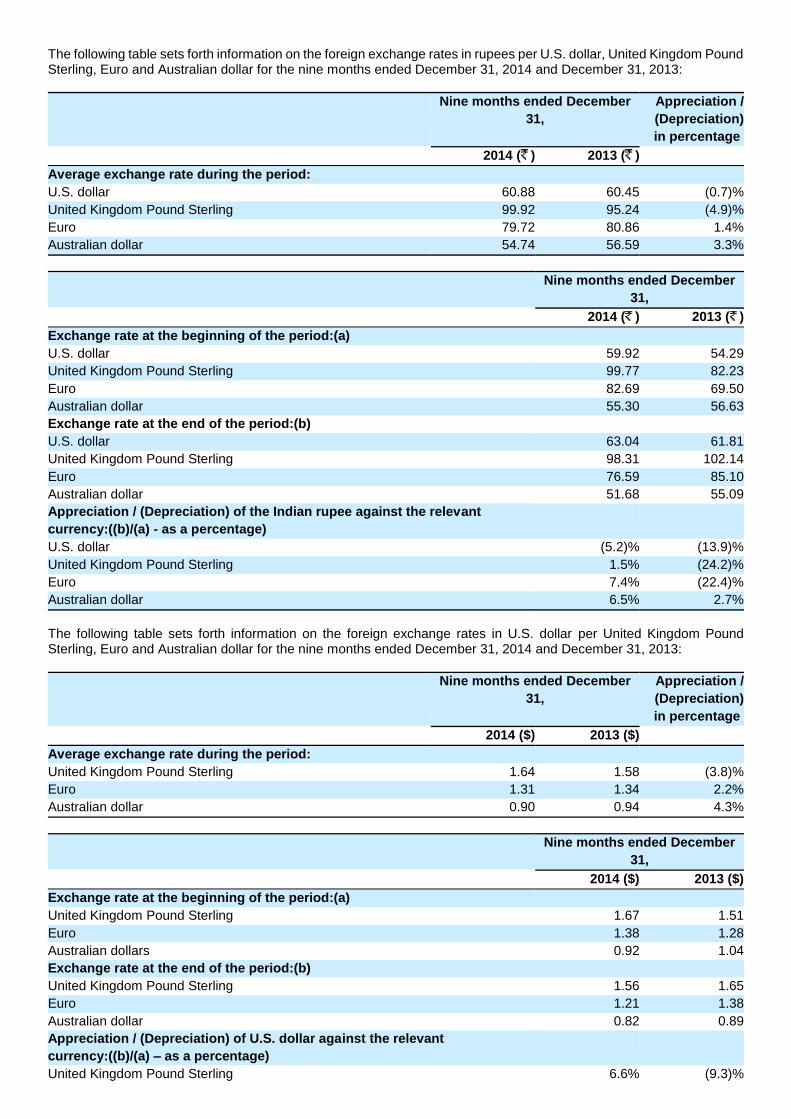
The following table sets forth information on the foreign exchange rates in rupees per U.S. dollar, United Kingdom Pound Sterling, Euro and Australian dollar for the nine months ended December 31, 2014 and December 31, 2013:
Nine months ended December
31,
Appreciation /
(Depreciation)
in percentage
2014 ( ) 2013 ( )
Average exchange rate during the period:
U.S. dollar 60.88 60.45 (0.7)%
United Kingdom Pound Sterling 99.92 95.24 (4.9)%
Euro 79.72 80.86 1.4%
Australian dollar 54.74 56.59 3.3%
Nine months ended December
31,
2014 ( ) 2013 ( )
Exchange rate at the beginning of the period:(a)
U.S. dollar 59.92 54.29
United Kingdom Pound Sterling 99.77 82.23
Euro 82.69 69.50
Australian dollar 55.30 56.63
Exchange rate at the end of the period:(b)
U.S. dollar 63.04 61.81
United Kingdom Pound Sterling 98.31 102.14
Euro 76.59 85.10
Australian dollar 51.68 55.09
Appreciation / (Depreciation) of the Indian rupee against the relevant
currency:((b)/(a) - as a percentage)
U.S. dollar (5.2)% (13.9)%
United Kingdom Pound Sterling 1.5% (24.2)%
Euro 7.4% (22.4)%
Australian dollar 6.5% 2.7%
The following table sets forth information on the foreign exchange rates in U.S. dollar per United Kingdom Pound Sterling, Euro and Australian dollar for the nine months ended December 31, 2014 and December 31, 2013:
Nine months ended December
31,
Appreciation /
(Depreciation)
in percentage
2014 ($) 2013 ($)
Average exchange rate during the period:
United Kingdom Pound Sterling 1.64 1.58 (3.8)%
Euro 1.31 1.34 2.2%
Australian dollar 0.90 0.94 4.3%
Nine months ended December
31,
2014 ($) 2013 ($)
Exchange rate at the beginning of the period:(a)
United Kingdom Pound Sterling 1.67 1.51
Euro 1.38 1.28
Australian dollars 0.92 1.04
Exchange rate at the end of the period:(b)
United Kingdom Pound Sterling 1.56 1.65
Euro 1.21 1.38
Australian dollar 0.82 0.89
Appreciation / (Depreciation) of U.S. dollar against the relevant
currency:((b)/(a) – as a percentage)
United Kingdom Pound Sterling 6.6% (9.3)%
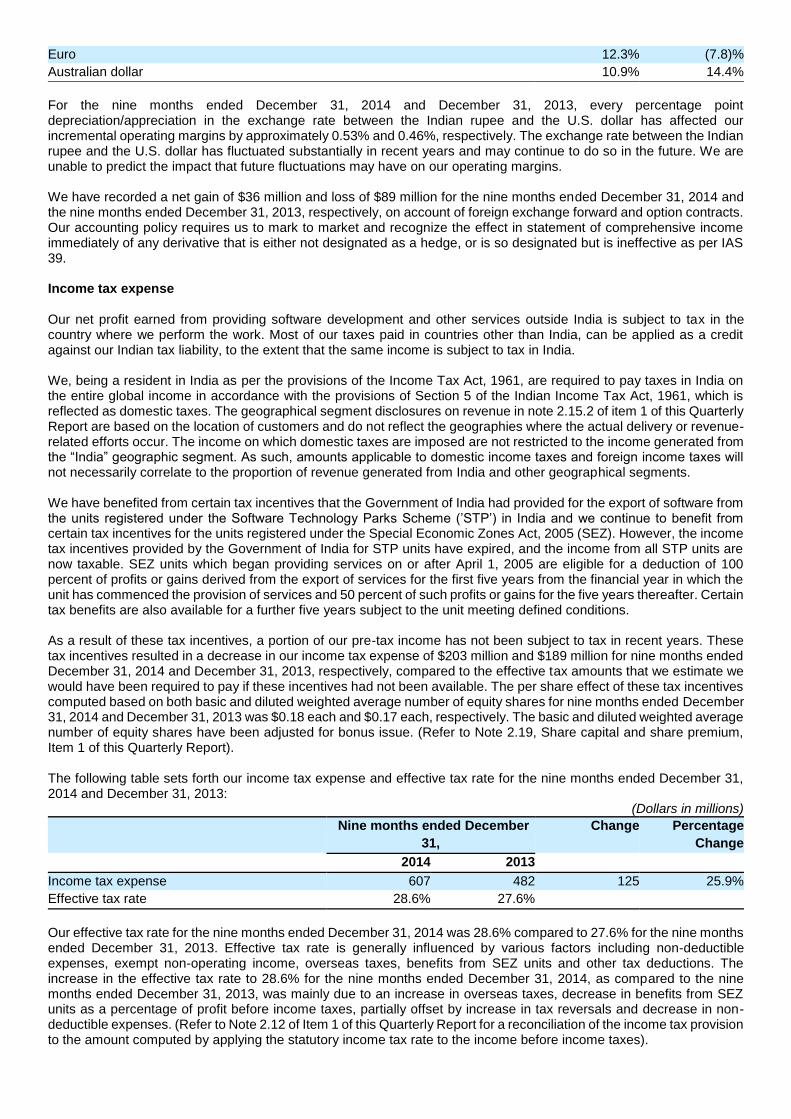
Euro 12.3% (7.8)%
Australian dollar 10.9% 14.4%
For the nine months ended December 31, 2014 and December 31, 2013, every percentage point depreciation/appreciation in the exchange rate between the Indian rupee and the U.S. dollar has affected our incremental operating margins by approximately 0.53% and 0.46%, respectively. The exchange rate between the Indian rupee and the U.S. dollar has fluctuated substantially in recent years and may continue to do so in the future. We are unable to predict the impact that future fluctuations may have on our operating margins. We have recorded a net gain of $36 million and loss of $89 million for the nine months ended December 31, 2014 and the nine months ended December 31, 2013, respectively, on account of foreign exchange forward and option contracts. Our accounting policy requires us to mark to market and recognize the effect in statement of comprehensive income immediately of any derivative that is either not designated as a hedge, or is so designated but is ineffective as per IAS 39. Income tax expense Our net profit earned from providing software development and other services outside India is subject to tax in the country where we perform the work. Most of our taxes paid in countries other than India, can be applied as a credit against our Indian tax liability, to the extent that the same income is subject to tax in India. We, being a resident in India as per the provisions of the Income Tax Act, 1961, are required to pay taxes in India on the entire global income in accordance with the provisions of Section 5 of the Indian Income Tax Act, 1961, which is reflected as domestic taxes. The geographical segment disclosures on revenue in note 2.15.2 of item 1 of this Quarterly Report are based on the location of customers and do not reflect the geographies where the actual delivery or revenue-related efforts occur. The income on which domestic taxes are imposed are not restricted to the income generated from the “India” geographic segment. As such, amounts applicable to domestic income taxes and foreign income taxes will not necessarily correlate to the proportion of revenue generated from India and other geographical segments. We have benefited from certain tax incentives that the Government of India had provided for the export of software from the units registered under the Software Technology Parks Scheme (’STP’) in India and we continue to benefit from certain tax incentives for the units registered under the Special Economic Zones Act, 2005 (SEZ). However, the income tax incentives provided by the Government of India for STP units have expired, and the income from all STP units are now taxable. SEZ units which began providing services on or after April 1, 2005 are eligible for a deduction of 100 percent of profits or gains derived from the export of services for the first five years from the financial year in which the unit has commenced the provision of services and 50 percent of such profits or gains for the five years thereafter. Certain tax benefits are also available for a further five years subject to the unit meeting defined conditions. As a result of these tax incentives, a portion of our pre-tax income has not been subject to tax in recent years. These tax incentives resulted in a decrease in our income tax expense of $203 million and $189 million for nine months ended December 31, 2014 and December 31, 2013, respectively, compared to the effective tax amounts that we estimate we would have been required to pay if these incentives had not been available. The per share effect of these tax incentives computed based on both basic and diluted weighted average number of equity shares for nine months ended December 31, 2014 and December 31, 2013 was $0.18 each and $0.17 each, respectively. The basic and diluted weighted average number of equity shares have been adjusted for bonus issue. (Refer to Note 2.19, Share capital and share premium, Item 1 of this Quarterly Report). The following table sets forth our income tax expense and effective tax rate for the nine months ended December 31, 2014 and December 31, 2013:
(Dollars in millions)
Nine months ended December
31,
Change Percentage
Change
2014 2013
Income tax expense 607 482 125 25.9%
Effective tax rate 28.6% 27.6%
Our effective tax rate for the nine months ended December 31, 2014 was 28.6% compared to 27.6% for the nine months ended December 31, 2013. Effective tax rate is generally influenced by various factors including non-deductible expenses, exempt non-operating income, overseas taxes, benefits from SEZ units and other tax deductions. The increase in the effective tax rate to 28.6% for the nine months ended December 31, 2014, as compared to the nine months ended December 31, 2013, was mainly due to an increase in overseas taxes, decrease in benefits from SEZ units as a percentage of profit before income taxes, partially offset by increase in tax reversals and decrease in non-deductible expenses. (Refer to Note 2.12 of Item 1 of this Quarterly Report for a reconciliation of the income tax provision to the amount computed by applying the statutory income tax rate to the income before income taxes).
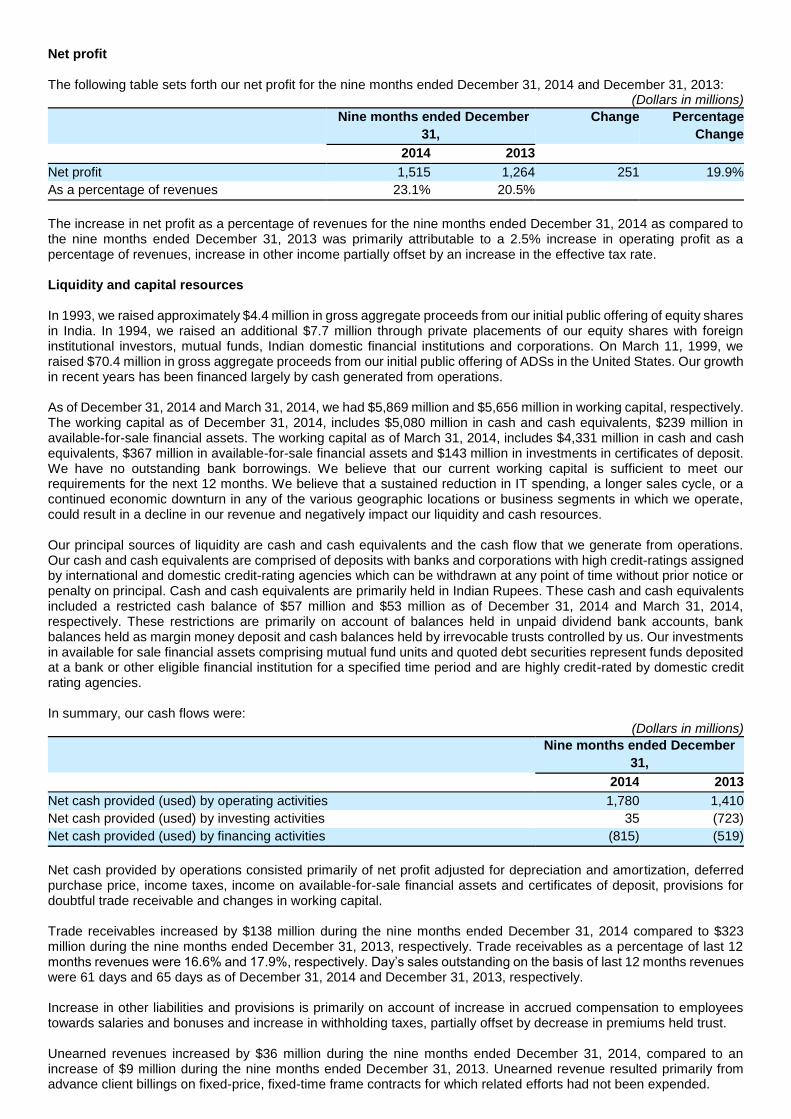
Net profit The following table sets forth our net profit for the nine months ended December 31, 2014 and December 31, 2013:
(Dollars in millions)
Nine months ended December
31,
Change Percentage
Change
2014 2013
Net profit 1,515 1,264 251 19.9%
As a percentage of revenues 23.1% 20.5%
The increase in net profit as a percentage of revenues for the nine months ended December 31, 2014 as compared to the nine months ended December 31, 2013 was primarily attributable to a 2.5% increase in operating profit as a percentage of revenues, increase in other income partially offset by an increase in the effective tax rate. Liquidity and capital resources
In 1993, we raised approximately $4.4 million in gross aggregate proceeds from our initial public offering of equity shares in India. In 1994, we raised an additional $7.7 million through private placements of our equity shares with foreign institutional investors, mutual funds, Indian domestic financial institutions and corporations. On March 11, 1999, we raised $70.4 million in gross aggregate proceeds from our initial public offering of ADSs in the United States. Our growth in recent years has been financed largely by cash generated from operations.
As of December 31, 2014 and March 31, 2014, we had $5,869 million and $5,656 million in working capital, respectively. The working capital as of December 31, 2014, includes $5,080 million in cash and cash equivalents, $239 million in available-for-sale financial assets. The working capital as of March 31, 2014, includes $4,331 million in cash and cash equivalents, $367 million in available-for-sale financial assets and $143 million in investments in certificates of deposit. We have no outstanding bank borrowings. We believe that our current working capital is sufficient to meet our requirements for the next 12 months. We believe that a sustained reduction in IT spending, a longer sales cycle, or a continued economic downturn in any of the various geographic locations or business segments in which we operate, could result in a decline in our revenue and negatively impact our liquidity and cash resources.
Our principal sources of liquidity are cash and cash equivalents and the cash flow that we generate from operations. Our cash and cash equivalents are comprised of deposits with banks and corporations with high credit-ratings assigned by international and domestic credit-rating agencies which can be withdrawn at any point of time without prior notice or penalty on principal. Cash and cash equivalents are primarily held in Indian Rupees. These cash and cash equivalents included a restricted cash balance of $57 million and $53 million as of December 31, 2014 and March 31, 2014, respectively. These restrictions are primarily on account of balances held in unpaid dividend bank accounts, bank balances held as margin money deposit and cash balances held by irrevocable trusts controlled by us. Our investments in available for sale financial assets comprising mutual fund units and quoted debt securities represent funds deposited at a bank or other eligible financial institution for a specified time period and are highly credit-rated by domestic credit rating agencies. In summary, our cash flows were:
(Dollars in millions)
Nine months ended December
31,
2014 2013
Net cash provided (used) by operating activities 1,780 1,410
Net cash provided (used) by investing activities 35 (723)
Net cash provided (used) by financing activities (815) (519)
Net cash provided by operations consisted primarily of net profit adjusted for depreciation and amortization, deferred purchase price, income taxes, income on available-for-sale financial assets and certificates of deposit, provisions for doubtful trade receivable and changes in working capital.
Trade receivables increased by $138 million during the nine months ended December 31, 2014 compared to $323 million during the nine months ended December 31, 2013, respectively. Trade receivables as a percentage of last 12 months revenues were 16.6% and 17.9%, respectively. Day’s sales outstanding on the basis of last 12 months revenues were 61 days and 65 days as of December 31, 2014 and December 31, 2013, respectively. Increase in other liabilities and provisions is primarily on account of increase in accrued compensation to employees towards salaries and bonuses and increase in withholding taxes, partially offset by decrease in premiums held trust. Unearned revenues increased by $36 million during the nine months ended December 31, 2014, compared to an increase of $9 million during the nine months ended December 31, 2013. Unearned revenue resulted primarily from advance client billings on fixed-price, fixed-time frame contracts for which related efforts had not been expended.
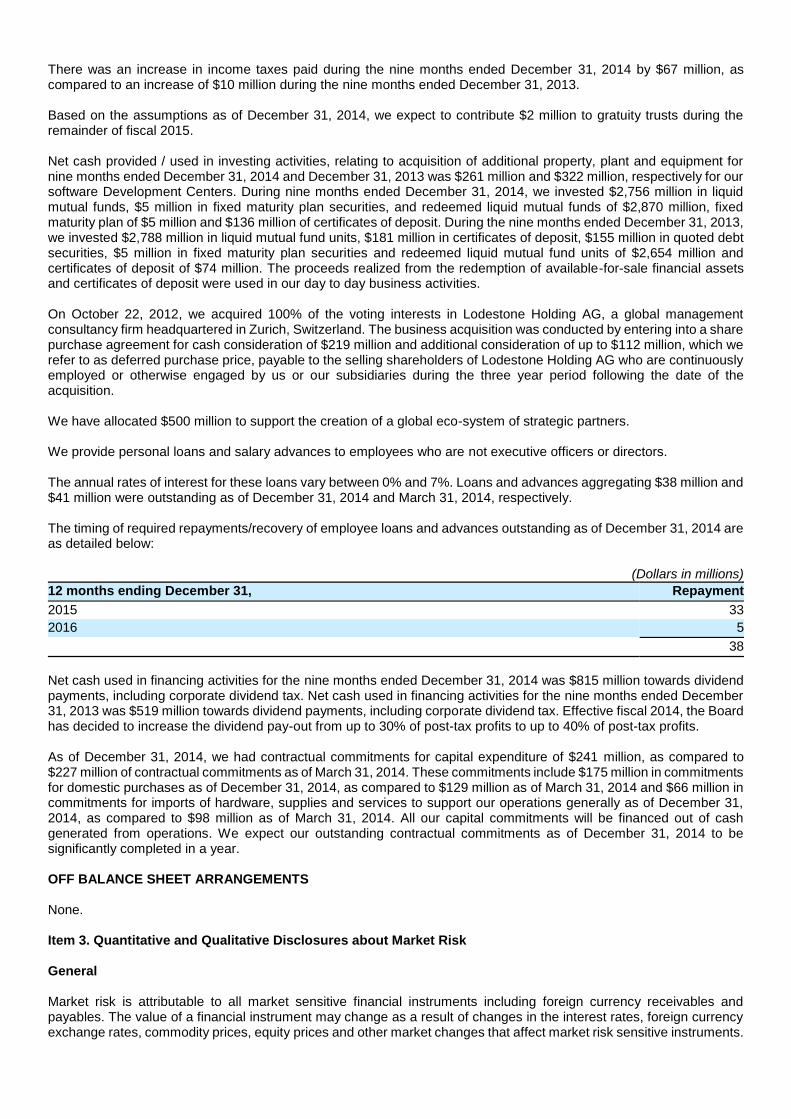
There was an increase in income taxes paid during the nine months ended December 31, 2014 by $67 million, as compared to an increase of $10 million during the nine months ended December 31, 2013. Based on the assumptions as of December 31, 2014, we expect to contribute $2 million to gratuity trusts during the remainder of fiscal 2015.
Net cash provided / used in investing activities, relating to acquisition of additional property, plant and equipment for nine months ended December 31, 2014 and December 31, 2013 was $261 million and $322 million, respectively for our software Development Centers. During nine months ended December 31, 2014, we invested $2,756 million in liquid mutual funds, $5 million in fixed maturity plan securities, and redeemed liquid mutual funds of $2,870 million, fixed maturity plan of $5 million and $136 million of certificates of deposit. During the nine months ended December 31, 2013, we invested $2,788 million in liquid mutual fund units, $181 million in certificates of deposit, $155 million in quoted debt securities, $5 million in fixed maturity plan securities and redeemed liquid mutual fund units of $2,654 million and certificates of deposit of $74 million. The proceeds realized from the redemption of available-for-sale financial assets and certificates of deposit were used in our day to day business activities. On October 22, 2012, we acquired 100% of the voting interests in Lodestone Holding AG, a global management consultancy firm headquartered in Zurich, Switzerland. The business acquisition was conducted by entering into a share purchase agreement for cash consideration of $219 million and additional consideration of up to $112 million, which we refer to as deferred purchase price, payable to the selling shareholders of Lodestone Holding AG who are continuously employed or otherwise engaged by us or our subsidiaries during the three year period following the date of the acquisition. We have allocated $500 million to support the creation of a global eco-system of strategic partners. We provide personal loans and salary advances to employees who are not executive officers or directors.
The annual rates of interest for these loans vary between 0% and 7%. Loans and advances aggregating $38 million and $41 million were outstanding as of December 31, 2014 and March 31, 2014, respectively. The timing of required repayments/recovery of employee loans and advances outstanding as of December 31, 2014 are as detailed below:
(Dollars in millions)
12 months ending December 31, Repayment
2015 33
2016 5
38
Net cash used in financing activities for the nine months ended December 31, 2014 was $815 million towards dividend payments, including corporate dividend tax. Net cash used in financing activities for the nine months ended December 31, 2013 was $519 million towards dividend payments, including corporate dividend tax. Effective fiscal 2014, the Board has decided to increase the dividend pay-out from up to 30% of post-tax profits to up to 40% of post-tax profits.
As of December 31, 2014, we had contractual commitments for capital expenditure of $241 million, as compared to $227 million of contractual commitments as of March 31, 2014. These commitments include $175 million in commitments for domestic purchases as of December 31, 2014, as compared to $129 million as of March 31, 2014 and $66 million in commitments for imports of hardware, supplies and services to support our operations generally as of December 31, 2014, as compared to $98 million as of March 31, 2014. All our capital commitments will be financed out of cash generated from operations. We expect our outstanding contractual commitments as of December 31, 2014 to be significantly completed in a year. OFF BALANCE SHEET ARRANGEMENTS
None. Item 3. Quantitative and Qualitative Disclosures about Market Risk
General
Market risk is attributable to all market sensitive financial instruments including foreign currency receivables and payables. The value of a financial instrument may change as a result of changes in the interest rates, foreign currency exchange rates, commodity prices, equity prices and other market changes that affect market risk sensitive instruments.
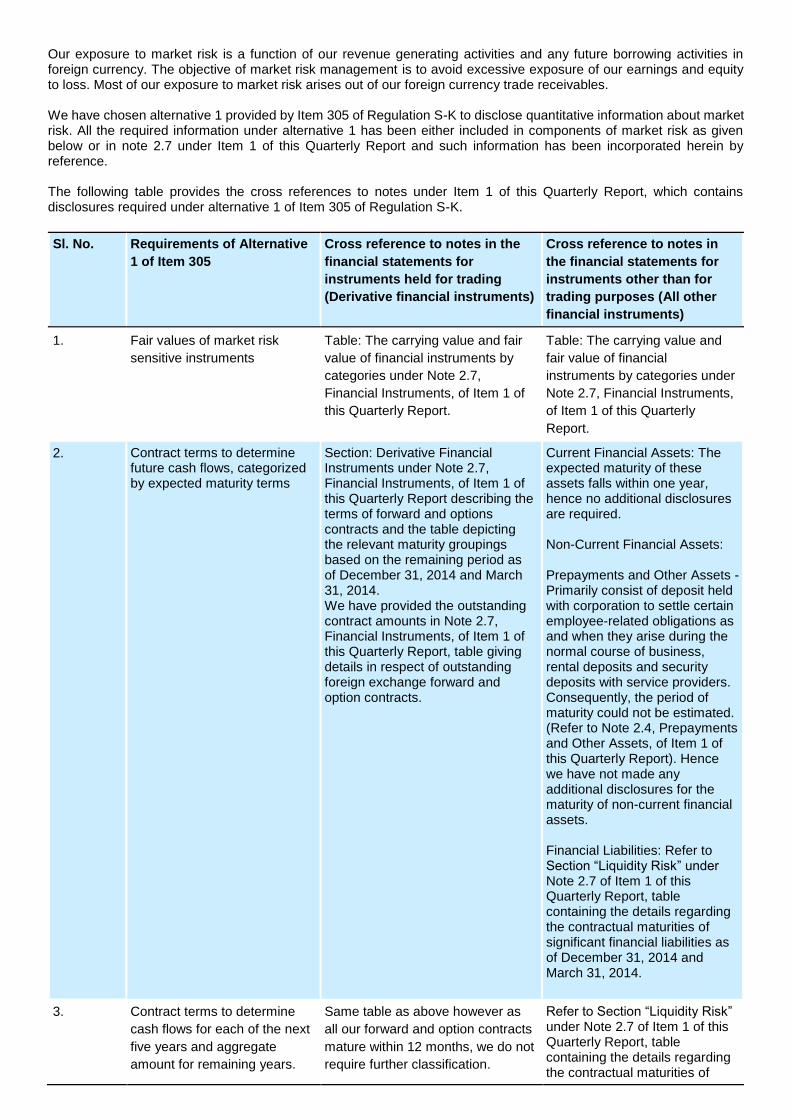
Our exposure to market risk is a function of our revenue generating activities and any future borrowing activities in foreign currency. The objective of market risk management is to avoid excessive exposure of our earnings and equity to loss. Most of our exposure to market risk arises out of our foreign currency trade receivables.
We have chosen alternative 1 provided by Item 305 of Regulation S-K to disclose quantitative information about market risk. All the required information under alternative 1 has been either included in components of market risk as given below or in note 2.7 under Item 1 of this Quarterly Report and such information has been incorporated herein by reference.
The following table provides the cross references to notes under Item 1 of this Quarterly Report, which contains disclosures required under alternative 1 of Item 305 of Regulation S-K.
Sl. No. Requirements of Alternative
1 of Item 305
Cross reference to notes in the
financial statements for
instruments held for trading
(Derivative financial instruments)
Cross reference to notes in
the financial statements for
instruments other than for
trading purposes (All other
financial instruments)
1. Fair values of market risk
sensitive instruments
Table: The carrying value and fair
value of financial instruments by
categories under Note 2.7,
Financial Instruments, of Item 1 of
this Quarterly Report.
Table: The carrying value and
fair value of financial
instruments by categories under
Note 2.7, Financial Instruments,
of Item 1 of this Quarterly
Report.
2. Contract terms to determine future cash flows, categorized by expected maturity terms
Section: Derivative Financial Instruments under Note 2.7, Financial Instruments, of Item 1 of this Quarterly Report describing the terms of forward and options contracts and the table depicting the relevant maturity groupings based on the remaining period as of December 31, 2014 and March 31, 2014. We have provided the outstanding contract amounts in Note 2.7, Financial Instruments, of Item 1 of this Quarterly Report, table giving details in respect of outstanding foreign exchange forward and option contracts.
Current Financial Assets: The expected maturity of these assets falls within one year, hence no additional disclosures are required.
Non-Current Financial Assets:
Prepayments and Other Assets - Primarily consist of deposit held with corporation to settle certain employee-related obligations as and when they arise during the normal course of business, rental deposits and security deposits with service providers. Consequently, the period of maturity could not be estimated. (Refer to Note 2.4, Prepayments and Other Assets, of Item 1 of this Quarterly Report). Hence we have not made any additional disclosures for the maturity of non-current financial assets.
Financial Liabilities: Refer to Section “Liquidity Risk” under Note 2.7 of Item 1 of this Quarterly Report, table containing the details regarding the contractual maturities of significant financial liabilities as of December 31, 2014 and March 31, 2014.
3. Contract terms to determine
cash flows for each of the next
five years and aggregate
amount for remaining years.
Same table as above however as
all our forward and option contracts
mature within 12 months, we do not
require further classification.
Refer to Section “Liquidity Risk” under Note 2.7 of Item 1 of this Quarterly Report, table containing the details regarding the contractual maturities of
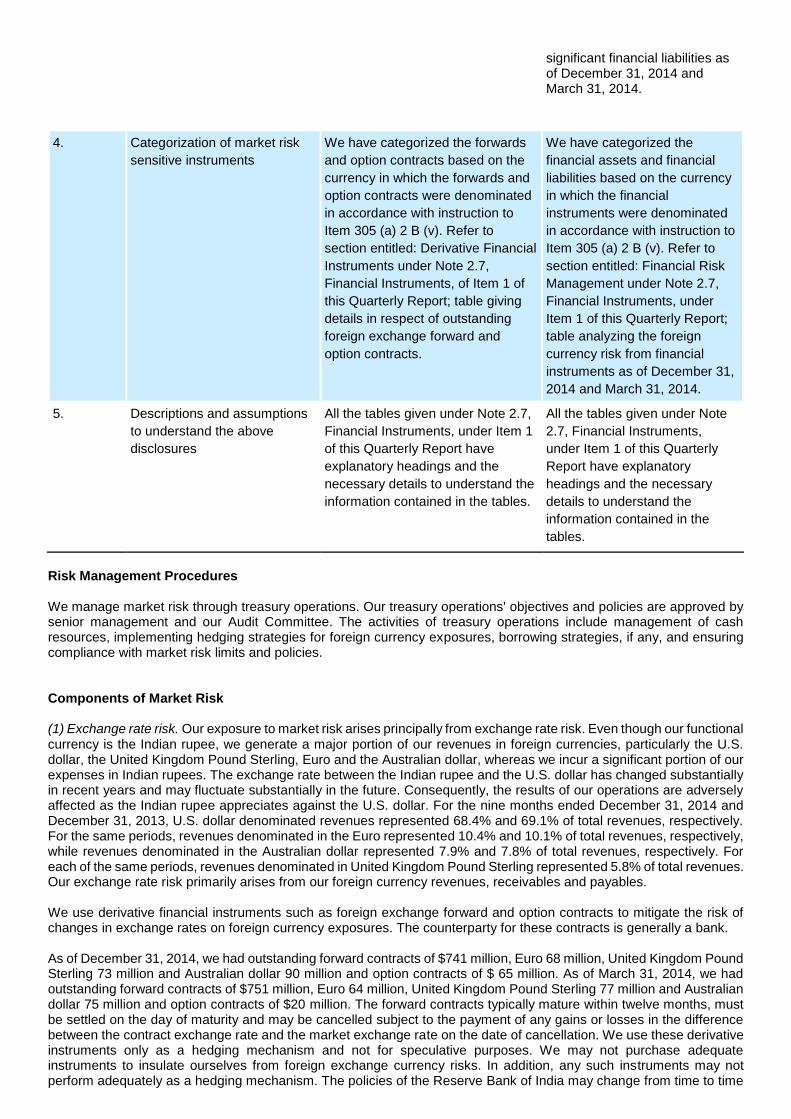
significant financial liabilities as of December 31, 2014 and March 31, 2014.
4. Categorization of market risk
sensitive instruments
We have categorized the forwards
and option contracts based on the
currency in which the forwards and
option contracts were denominated
in accordance with instruction to
Item 305 (a) 2 B (v). Refer to
section entitled: Derivative Financial
Instruments under Note 2.7,
Financial Instruments, of Item 1 of
this Quarterly Report; table giving
details in respect of outstanding
foreign exchange forward and
option contracts.
We have categorized the
financial assets and financial
liabilities based on the currency
in which the financial
instruments were denominated
in accordance with instruction to
Item 305 (a) 2 B (v). Refer to
section entitled: Financial Risk
Management under Note 2.7,
Financial Instruments, under
Item 1 of this Quarterly Report;
table analyzing the foreign
currency risk from financial
instruments as of December 31,
2014 and March 31, 2014.
5. Descriptions and assumptions
to understand the above
disclosures
All the tables given under Note 2.7,
Financial Instruments, under Item 1
of this Quarterly Report have
explanatory headings and the
necessary details to understand the
information contained in the tables.
All the tables given under Note
2.7, Financial Instruments,
under Item 1 of this Quarterly
Report have explanatory
headings and the necessary
details to understand the
information contained in the
tables.
Risk Management Procedures
We manage market risk through treasury operations. Our treasury operations' objectives and policies are approved by senior management and our Audit Committee. The activities of treasury operations include management of cash resources, implementing hedging strategies for foreign currency exposures, borrowing strategies, if any, and ensuring compliance with market risk limits and policies.
Components of Market Risk
(1) Exchange rate risk. Our exposure to market risk arises principally from exchange rate risk. Even though our functional currency is the Indian rupee, we generate a major portion of our revenues in foreign currencies, particularly the U.S. dollar, the United Kingdom Pound Sterling, Euro and the Australian dollar, whereas we incur a significant portion of our expenses in Indian rupees. The exchange rate between the Indian rupee and the U.S. dollar has changed substantially in recent years and may fluctuate substantially in the future. Consequently, the results of our operations are adversely affected as the Indian rupee appreciates against the U.S. dollar. For the nine months ended December 31, 2014 and December 31, 2013, U.S. dollar denominated revenues represented 68.4% and 69.1% of total revenues, respectively. For the same periods, revenues denominated in the Euro represented 10.4% and 10.1% of total revenues, respectively, while revenues denominated in the Australian dollar represented 7.9% and 7.8% of total revenues, respectively. For each of the same periods, revenues denominated in United Kingdom Pound Sterling represented 5.8% of total revenues. Our exchange rate risk primarily arises from our foreign currency revenues, receivables and payables.
We use derivative financial instruments such as foreign exchange forward and option contracts to mitigate the risk of changes in exchange rates on foreign currency exposures. The counterparty for these contracts is generally a bank.
As of December 31, 2014, we had outstanding forward contracts of $741 million, Euro 68 million, United Kingdom Pound Sterling 73 million and Australian dollar 90 million and option contracts of $ 65 million. As of March 31, 2014, we had outstanding forward contracts of $751 million, Euro 64 million, United Kingdom Pound Sterling 77 million and Australian dollar 75 million and option contracts of $20 million. The forward contracts typically mature within twelve months, must be settled on the day of maturity and may be cancelled subject to the payment of any gains or losses in the difference between the contract exchange rate and the market exchange rate on the date of cancellation. We use these derivative instruments only as a hedging mechanism and not for speculative purposes. We may not purchase adequate instruments to insulate ourselves from foreign exchange currency risks. In addition, any such instruments may not perform adequately as a hedging mechanism. The policies of the Reserve Bank of India may change from time to time
which may limit our ability to hedge our foreign currency exposures adequately. We may, in the future, adopt more active hedging policies, and have done so in the past.
(2) Fair value. The fair value of our market rate risk sensitive instruments approximates their carrying value. Recent Accounting Pronouncements IFRS 9 Financial Instruments: In November 2009, the International Accounting Standards Board issued IFRS 9, Financial Instruments: Recognition and Measurement, to reduce the complexity of the current rules on financial instruments as mandated in IAS 39. IFRS 9 has fewer classification and measurement categories as compared to IAS 39 and has eliminated the categories of held to maturity, available for sale and loans and receivables. Further it eliminates the rule-based requirement of segregating embedded derivatives and tainting rules pertaining to held to maturity investments. For an investment in an equity instrument which is not held for trading, IFRS 9 permits an irrevocable election, on initial recognition, on an individual share-by-share basis, to present all fair value changes from the investment in other comprehensive income. No amount recognized in other comprehensive income would ever be reclassified to profit or loss. IFRS 9, was further amended in October 2010, and such amendment introduced requirements on accounting for financial liabilities. This amendment addresses the issue of volatility in the profit or loss due to changes in the fair value of an entity’s own debt. It requires the entity, which chooses to measure a liability at fair value, to present the portion of the fair value change attributable to the entity’s own credit risk in the other comprehensive income. The effective date for adoption of IFRS 9 is annual periods beginning on or after January 1, 2018, though early adoption is permitted. The Group is currently evaluating the requirements of IFRS 9, and has not yet determined the impact on the condensed consolidated interim financial statements. IFRS 15 Revenue from Contracts with Customers: In May 2014, the International Accounting Standards Board issued IFRS 15, Revenue from Contracts with Customers. The core principle of the new standard is that an entity should recognise revenue to depict the transfer of promised goods or services to customers in an amount that reflects the consideration to which the entity expects to be entitled in exchange for those goods or services. Further the new standard requires enhanced disclosures about the nature, amount, timing and uncertainty of revenue and cash flows arising from the entity’s contracts with customers. The standard permits the use of either the retrospective or cumulative effect transition method. The effective date for adoption of IFRS 15 is annual periods beginning on or after January 1, 2017, though early adoption is permitted. The Group has not yet selected a transition method and has not yet evaluated the impact of IFRS 15 on the condensed consolidated interim financial statements. Critical Accounting Policies We consider the policies discussed below to be critical to an understanding of our financial statements as their application places the most significant demands on management's judgment, with financial reporting results relying on estimation about the effect of matters that are inherently uncertain. Specific risks for these critical accounting policies are described in the following paragraphs. For all of these policies, future events rarely develop exactly as forecast, and the best estimates routinely require adjustment. Estimates We prepare financial statements in conformity with IFRS, which requires us to make estimates, judgments and assumptions. These estimates, judgements and assumptions affect the application of accounting policies and the reported amounts of assets and liabilities, the disclosures of contingent assets and liabilities at the date of the financial statements and reported amounts of revenues and expenses during the period. Application of accounting policies which require critical accounting estimates involving complex and subjective judgments and the use of assumptions in the consolidated financial statements have been disclosed below. However, accounting estimates could change from period to period and actual results could differ from those estimates. Appropriate changes in estimates are made as and when we become aware of changes in circumstances surrounding the estimates. Changes in estimates are reflected in the period in which changes are made and, if material, their effects are disclosed in the notes to the condensed consolidated interim financial statements. a. Revenue recognition We use the percentage-of-completion method in accounting for fixed-price contracts. Use of the percentage-of-completion method requires us to estimate the efforts or costs expended to date as a proportion of the total efforts or costs to be expended. Efforts or costs expended have been used to measure progress towards completion as there is a direct relationship between input and productivity. Provisions for estimated losses, if any, on uncompleted contracts are recorded in the period in which such losses become probable based on the expected contract estimates at the reporting date. b. Income taxes Our two major tax jurisdictions are India and the U.S., though we also file tax returns in other foreign jurisdictions. Significant judgments are involved in determining the provision for income taxes, including the amount expected to be paid/recovered for uncertain tax positions.
c. Business combinations and Intangible assets Our business combinations are accounted for using IFRS 3 (Revised), Business Combinations. IFRS 3 requires us to fair value identifiable intangible assets and contingent consideration to ascertain the net fair value of identifiable assets, liabilities and contingent liabilities of the acquiree. Significant estimates are required to be made in determining the value of contingent consideration and intangible assets. These valuations are conducted by independent valuation experts. d. Property, plant and equipment Property, plant and equipment represent a significant proportion of the asset base of the Group. The charge in respect of periodic depreciation is derived after determining an estimate of an asset’s expected useful life and the expected residual value at the end of its life. The useful lives and residual values of Group's assets are determined by management at the time the asset is acquired and reviewed periodically, including at each financial year end. The lives are based on historical experience with similar assets as well as anticipation of future events, which may impact their life, such as changes in technology. Revenue Recognition We derive our revenues primarily from software development and related services and the licensing of software products. Arrangements with customers for software development and related services are either on a fixed-price, fixed-timeframe or on a time-and-material basis. We recognize revenue on time-and-material contracts as the related services are performed. Revenue from the end of the last billing to the balance sheet date is recognized as unbilled revenues. Revenue from fixed-price, fixed-timeframe contracts, where there is no uncertainty as to measurement or collectability of consideration, is recognized as per the percentage-of-completion method. When there is uncertainty as to measurement or ultimate collectability, revenue recognition is postponed until such uncertainty is resolved. Efforts or costs expended have been used to measure progress towards completion as there is a direct relationship between input and productivity. Provisions for estimated losses, if any, on uncompleted contracts are recorded in the period in which such losses become probable based on the current contract estimates. Costs and earnings in excess of billings have been classified as unbilled revenue while billings in excess of costs and earnings have been classified as unearned revenue. At the end of every reporting period, we evaluate each project for estimated revenue and estimated efforts or costs. Any revisions or updates to existing estimates are made wherever required by obtaining approvals from officers having the requisite authority. Management regularly reviews and evaluates the status of each contract in progress to estimate the profit or loss. As part of the review, detailed actual efforts or costs and a realistic estimate of efforts or costs to complete all phases of the project are compared with the details of the original estimate and the total contract price. To date, we have not had any fixed-price, fixed-timeframe contracts that resulted in a material loss. We evaluate change orders according to their characteristics and the circumstances in which they occur. If such change orders are considered by the parties to be a normal element within the original scope of the contract, no change in the contract price is made. Otherwise, the adjustment to the contract price may be routinely negotiated. Contract revenue and costs are adjusted to reflect change orders approved by the client and us, regarding both scope and price. Changes are reflected in revenue recognition only after the change order has been approved by both parties. The same principle is also followed for escalation clauses. In arrangements for software development and related services and maintenance services, we have applied the guidance in IAS 18, Revenue, by applying the revenue recognition criteria for each separately identifiable component of a single transaction. The arrangements generally meet the criteria for considering software development and related services as separately identifiable components. For allocating the consideration, we have measured the revenue in respect of each separable component of a transaction at its fair value, in accordance with principles given in IAS 18. The price that is regularly charged for an item when sold separately is the best evidence of its fair value. In cases where we are unable to establish objective and reliable evidence of fair value for the software development and related services, we have used a residual method to allocate the arrangement consideration. In these cases the balance consideration after allocating the fair values of undelivered components of a transaction has been allocated to the delivered components for which specific fair values do not exist. License fee revenues have been recognized when the general revenue recognition criteria given in IAS 18 are met. Arrangements to deliver software products generally have three components: license, implementation and Annual Technical Services (ATS). We have applied the principles given in IAS 18 to account for revenues from these multiple element arrangements. Objective and reliable evidence of fair value has been established for ATS. Objective and reliable evidence of fair value is the price charged when the element is sold separately. When other services are provided in conjunction with the licensing arrangement and objective and reliable evidence of their fair values have been established, the revenue from such contracts are allocated to each component of the contract in a manner, whereby revenue is deferred for the undelivered services and the residual amounts are recognized as revenue for delivered components. In the absence of objective and reliable evidence of fair value for implementation, the entire arrangement fee for license and implementation is recognized using the percentage-of-completion method as the implementation is performed. Revenue from client training, support and other services arising due to the sale of software products is
recognized as the services are performed. ATS revenue is recognized rateably over the period in which the services are rendered. Advances received for services and products are reported as client deposits until all conditions for revenue recognition are met. We account for volume discounts and pricing incentives to customers by reducing the amount of discount from the amount of revenue recognized at the time of sale. In some arrangements, the level of discount varies with increases in the levels of revenue transactions. The discounts are passed on to the customer either as direct payments or as a reduction of payments due from the customer. Further, we recognize discount obligations as a reduction of revenue based on the rateable allocation of the discount to each of the underlying revenue transactions that result in progress by the customer toward earning the discount. We recognize the liability based on an estimate of the customer's future purchases. If it is probable that the criteria for the discount will not be met, or if the amount thereof cannot be estimated reliably, then discount is not recognized until the payment is probable and the amount can be estimated reliably. We recognize changes in the estimated amount of obligations for discounts using a cumulative catch-up adjustment. We present revenues net of sales and value-added taxes in our condensed consolidated statement of comprehensive income. Income Tax Our income tax expense comprises current and deferred income tax and is recognized in net profit in the statement of comprehensive income except to the extent that it relates to items recognized directly in equity, in which case it is recognized in equity. Current income tax for current and prior periods is recognized at the amount expected to be paid to or recovered from the tax authorities, using the tax rates and tax laws that have been enacted or substantively enacted by the balance sheet date. Deferred income tax assets and liabilities are recognized for all temporary differences arising between the tax bases of assets and liabilities and their carrying amounts in the financial statements except when the deferred income tax arises from the initial recognition of goodwill or an asset or liability in a transaction that is not a business combination and affects neither accounting nor taxable profit or loss at the time of the transaction. Deferred tax assets are reviewed at each reporting date and are reduced to the extent that it is no longer probable that the related tax benefit will be realized. Deferred income tax assets and liabilities are measured using tax rates and tax laws that have been enacted or substantively enacted by the balance sheet date and are expected to apply to taxable income in the years in which those temporary differences are expected to be recovered or settled. The effect of changes in tax rates on deferred income tax assets and liabilities is recognized as income or expense in the period that includes the enactment or the substantive enactment date. A deferred income tax asset is recognized to the extent that it is probable that future taxable profit will be available against which the deductible temporary differences and tax losses can be utilized. Deferred income taxes are not provided on the undistributed earnings of subsidiaries and branches outside India where it is expected that the earnings of the foreign subsidiary or branch will not be distributed in the foreseeable future. The income tax provision for the interim period is made based on the best estimate of the annual average tax rate expected to be applicable for the full financial year. We offset current tax assets and current tax liabilities, where we have a legally enforceable right to set off the recognized amounts and where we intend either to settle on a net basis, or to realise the asset and settle the liability simultaneously. We offset deferred tax assets and deferred tax liabilities wherever we have a legally enforceable right to set off current tax assets against current tax liabilities and where the deferred tax assets and deferred tax liabilities relate to income taxes levied by the same taxation authority. Tax benefits of deductions earned on exercise of employee share options in excess of compensation charged to income are credited to share premium. Business Combinations, Goodwill and Intangible Assets Business combinations have been accounted for using the acquisition method under the provisions of IFRS 3 (Revised), Business Combinations. The cost of an acquisition is measured at the fair value of the assets transferred, equity instruments issued and liabilities incurred or assumed at the date of acquisition. The cost of acquisition also includes the fair value of any contingent consideration. Identifiable assets acquired and liabilities and contingent liabilities assumed in a business combination are measured initially at their fair value on the date of acquisition. Business combinations between entities under common control by formation of a new company is outside the scope of IFRS 3 (Revised), Business Combinations and is accounted for at carrying value. Transaction costs that we incur in connection with a business combination such as finders’ fees, legal fees, due diligence fees, and other professional and consulting fees are expensed as incurred. Goodwill represents the cost of business acquisition in excess of our interest in the net fair value of identifiable assets, liabilities and contingent liabilities of the acquiree. When the net fair value of the identifiable assets, liabilities and contingent liabilities acquired exceed the cost of the business acquisition, we recognize a gain immediately in net profit in the statement of comprehensive income. Goodwill arising on the acquisition of a non-controlling interest in a subsidiary represents the excess of the cost of the additional investment over the fair value of the net assets acquired at the acquisition date and is measured at cost less accumulated impairment losses.
Intangible assets are stated at cost less accumulated amortization and impairments. They are amortized over their respective individual estimated useful lives on a straight-line basis, from the date that they are available for use. The estimated useful life of an identifiable intangible asset is based on a number of factors including the effects of obsolescence, demand, competition, and other economic factors (such as the stability of the industry, and known technological advances), and the level of maintenance expenditures required to obtain the expected future cash flows from the asset. We expense research costs as and when the same are incurred. Software product development costs are expensed as incurred unless technical and commercial feasibility of the project is demonstrated, future economic benefits are probable, we have the intention and ability to complete and use or sell the software and the costs can be measured reliably. The costs which can be capitalized include the cost of material, direct labour, overhead costs that are directly attributable to preparing the asset for its intended use. Research and development costs and software development costs incurred under contractual arrangements with customers are accounted as cost of sales. Item 4. Controls and Procedures
As of the end of the period covered by this Quarterly Report on Form 6-K, our management, with the participation of our Chief Executive Officer and Chief Financial Officer, has carried out an evaluation of the effectiveness of our disclosure controls and procedures. The term “disclosure controls and procedures” means controls and other procedures that are designed to ensure that information required to be disclosed in the reports we file or submit under the Securities Exchange Act of 1934, as amended, or the Exchange Act, is recorded, processed, summarized and reported, within the time periods specified in the rules and forms of the SEC. Disclosure controls and procedures include, without limitation, controls and procedures designed to ensure that information required to be disclosed by us in our reports that we file or submit under the Exchange Act is accumulated and communicated to management, including our Chief Executive Officer and Chief Financial Officer, as appropriate to allow timely decisions regarding our required disclosure. In designing and evaluating our disclosure controls and procedures, management recognizes that any controls and procedures, no matter how well conceived and operated, can only provide reasonable assurance that the objectives of the disclosure controls and procedures are met. Based on their evaluation as of the end of the period covered by this Quarterly Report on Form 6-K, our Chief Executive Officer and Chief Financial Officer have concluded that our disclosure controls and procedures were effective to provide reasonable assurance that the information required to be disclosed in filings and submissions under the Exchange Act, is recorded, processed, summarized, and reported within the time periods specified by the SEC's rules and forms, and that material information related to us and our consolidated subsidiaries is accumulated and communicated to management, including the Chief Executive Officer and Chief Financial Officer, as appropriate to allow timely decisions about required disclosure. There has been no change in our internal control over financial reporting that occurred during the period covered by this Quarterly Report that has materially affected, or is reasonably likely to affect, our internal control over financial reporting. Part II - Other Information Item 1 - Legal Proceedings The company is subject to legal proceedings and claims, which have arisen in the ordinary course of business. The company’s management does not reasonably expect that these legal actions, when ultimately concluded and determined, will have a material and adverse effect on the company’s results of operations or financial condition. Item 1 A. Risk Factors Risk Factors Investing in our American Depositary Shares, or ADSs, involves a high degree of risk. You should carefully consider the risks and uncertainties described in our Annual Report on Form 20-F for the fiscal year ended March 31, 2014 and in our Quarterly Report on Form 6-K for the quarters ended June 30, 2014 and September 30, 2014, together with all of the other information in this Quarterly Report on Form 6-K, including the section titled “Management’s Discussion and Analysis of Financial Condition and Results of Operations” and our condensed consolidated interim financial statements and related notes, before making a decision to invest in our ADSs. The risks and uncertainties described in our prior Annual and Quarterly Reports may not be the only ones we face. There were no material changes to the risk factors as previously discussed in our Annual Report on Form 20-F for the fiscal year ended March 31, 2014 and in our Quarterly Report on Form 6-K for the quarters ended June 30, 2014 and September 30, 2014, which risk factors are incorporated herein by reference. If any of the risks actually occur, our business, financial condition, operating results and prospects could be materially and adversely affected. In that event, the market price of our ADSs could decline, and you could lose part or all of your investment. Item 2. Unregistered Sales of Equity Securities and Use of Proceeds None.
Item 3. Defaults Upon Senior Securities None. Item 4. Mine Safety Disclosures Not Applicable. Item 5. Other Information None. Item 6. Exhibits The Exhibit Index attached hereto is incorporated by reference to this Item.
SIGNATURES
Pursuant to the requirements of the Securities Exchange Act of 1934, the registrant has duly caused this report to be signed on its behalf by the undersigned, thereunto duly authorized.
Infosys Limited
/s/ Dr. Vishal Sikka
Date: January 28, 2015 Dr. Vishal Sikka
Chief Executive Officer
EXHIBIT INDEX
Exhibit
Number
Description of Document
31.1 Certification of Chief Executive Officer and Chief Financial Officer pursuant to Section 302 of the Sarbanes
Oxley Act of 2002.
32.1 Certification of Chief Executive Officer and Chief Financial Officer pursuant to Section 906 of the Sarbanes
Oxley Act of 2002.
99.1 Independent Auditors' Report on Review of Unaudited Condensed Consolidated Interim Financial
Statements.
Exhibit 31.1
Certification of Chief Executive Officer
Pursuant to Section 302 of the Sarbanes-Oxley Act of 2002
I, Dr. Vishal Sikka, certify that:
1. I have reviewed this quarterly report on Form 6-K of Infosys Limited;
2. Based on my knowledge, this report does not contain any untrue statement of a material fact or omit to state a material fact necessary to make the statements made, in light of the circumstances under which such statements were made, not misleading with respect to the period covered by this report;
3. Based on my knowledge, the financial statements, and other financial information included in this report, fairly present in all material respects the financial condition, results of operations and cash flows of the registrant as of, and for, the periods presented in this report;
4. The registrant's other certifying officer and I are responsible for establishing and maintaining disclosure controls and procedures (as defined in Exchange Act Rules 13a-15(e) and 15d-15(e)) and internal control over financial reporting (as defined in Exchange Act Rules 13a-15(f) and 15d-15(f)) for the registrant and have:
(a) Designed such disclosure controls and procedures, or caused such disclosure controls and procedures to be designed under our supervision, to ensure that material information relating to the registrant, including its consolidated subsidiaries, is made known to us by others within those entities, particularly during the period in which this report is being prepared;
(b) Designed such internal control over financial reporting, or caused such internal control over financial reporting to be designed under our supervision, to provide reasonable assurance regarding the reliability of financial reporting and the preparation of financial statements for external purposes in accordance with generally accepted accounting principles;
(c) Evaluated the effectiveness of the registrant's disclosure controls and procedures and presented in this report our conclusions about the effectiveness of the disclosure controls and procedures, as of the end of the period covered by this report based on such evaluation; and
(d) Disclosed in this report any change in the registrant's internal control over financial reporting that occurred during the registrant's most recent fiscal quarter that has materially affected, or is reasonably likely to materially affect, the registrant's internal control over financial reporting; and
5. The registrant's other certifying officer and I have disclosed, based on our most recent evaluation of internal control over financial reporting, to the registrant's auditors and the audit committee of the registrant's board of directors (or persons performing the equivalent functions):
(a) All significant deficiencies and material weaknesses in the design or operation of internal control over financial reporting which are reasonably likely to adversely affect the registrant's ability to record, process, summarize and report financial information; and
(b) Any fraud, whether or not material, that involves management or other employees who have a significant role in the registrant's internal control over financial reporting.
Date: January 27, 2015
/s/ Dr. Vishal Sikka
Dr. Vishal Sikka Chief Executive Officer
Certification of Chief Financial Officer
Pursuant to Section 302 of the Sarbanes-Oxley Act of 2002
I, Rajiv Bansal, certify that:
1. I have reviewed this quarterly report on Form 6-K of Infosys Limited;
2. Based on my knowledge, this report does not contain any untrue statement of a material fact or omit to state a material fact necessary to make the statements made, in light of the circumstances under which such statements were made, not misleading with respect to the period covered by this report;
3. Based on my knowledge, the financial statements, and other financial information included in this report, fairly present in all material respects the financial condition, results of operations and cash flows of the registrant as of, and for, the periods presented in this report;
4. The registrant's other certifying officer and I are responsible for establishing and maintaining disclosure controls and procedures (as defined in Exchange Act Rules 13a-15(e) and 15d-15(e)) and internal control over financial reporting (as defined in Exchange Act Rules 13a-15(f) and 15d-15(f)) for the registrant and have:
(a) Designed such disclosure controls and procedures, or caused such disclosure controls and procedures to be designed under our supervision, to ensure that material information relating to the registrant, including its consolidated subsidiaries, is made known to us by others within those entities, particularly during the period in which this report is being prepared;
(b) Designed such internal control over financial reporting, or caused such internal control over financial reporting to be designed under our supervision, to provide reasonable assurance regarding the reliability of financial reporting and the preparation of financial statements for external purposes in accordance with generally accepted accounting principles;
(c) Evaluated the effectiveness of the registrant's disclosure controls and procedures and presented in this report our conclusions about the effectiveness of the disclosure controls and procedures, as of the end of the period covered by this report based on such evaluation; and
(d) Disclosed in this report any change in the registrant's internal control over financial reporting that occurred during the registrant's most recent fiscal quarter that has materially affected, or is reasonably likely to materially affect, the registrant's internal control over financial reporting; and
5. The registrant's other certifying officer and I have disclosed, based on our most recent evaluation of internal control over financial reporting, to the registrant's auditors and the audit committee of the registrant's board of directors (or persons performing the equivalent functions):
(a) All significant deficiencies and material weaknesses in the design or operation of internal control over financial reporting which are reasonably likely to adversely affect the registrant's ability to record, process, summarize and report financial information; and
(b) Any fraud, whether or not material, that involves management or other employees who have a significant role in the registrant's internal control over financial reporting.
Date: January 27, 2015
/s/ Rajiv Bansal
Rajiv Bansal Chief Financial Officer
Exhibit 32.1
CERTIFICATION OF CHIEF EXECUTIVE OFFICER PURSUANT TO 18 U.S.C. SECTION 1350, AS ADOPTED
PURSUANT TO SECTION 906 OF THE SARBANES-OXLEY ACT OF 2002
I, Dr. Vishal Sikka, certify, pursuant to 18 U.S.C. Section 1350, as adopted pursuant to Section 906 of the Sarbanes-Oxley Act of 2002, that the quarterly report of Infosys Limited on Form 6-K for the quarterly period ended December 31, 2014, fully complies with the requirements of Section 13(a) or 15(d) of the Securities Exchange Act of 1934, as amended, and that information contained in such quarterly report on Form 6-K fairly presents in all material respects the financial condition and results of operations of Infosys Limited.
Date: January 27, 2015
/s/ Dr. Vishal Sikka
Dr. Vishal Sikka Chief Executive Officer
CERTIFICATION OF CHIEF FINANCIAL OFFICER PURSUANT TO 18 U.S.C. SECTION 1350, AS ADOPTED
PURSUANT TO SECTION 906 OF THE SARBANES-OXLEY ACT OF 2002
I, Rajiv Bansal, certify, pursuant to 18 U.S.C. Section 1350, as adopted pursuant to Section 906 of the Sarbanes-Oxley Act of 2002, that the quarterly report of Infosys Limited on Form 6-K for the quarterly period ended December 31, 2014, fully complies with the requirements of Section 13(a) or 15(d) of the Securities Exchange Act of 1934, as amended, and that information contained in such quarterly report on Form 6-K fairly presents in all material respects the financial condition and results of operations of Infosys Limited.
Date: January 27, 2015
/s/ Rajiv Bansal
Rajiv Bansal Chief Financial Officer
Exhibit 99.1
Report of Independent Registered Public Accounting Firm
The Board of Directors and Shareholders Infosys Limited:
We have reviewed the accompanying condensed consolidated interim balance sheet of Infosys Limited (“the Company”) and subsidiaries as of December 31, 2014, the related condensed consolidated interim statements of comprehensive income for the three months and nine months periods ended December 31, 2014 and 2013, the related condensed consolidated interim statements of changes in equity and cash flows for the nine month period ended December 31, 2014 and 2013, and a summary of significant accounting policies and other explanatory notes. These condensed consolidated interim financial statements are the responsibility of the Company’s management. We conducted our review in accordance with the standards of the Public Company Accounting Oversight Board (United States). A review of condensed interim financial information consists principally of applying analytical procedures and making inquiries of persons responsible for financial and accounting matters. It is substantially less in scope than an audit conducted in accordance with the standards of the Public Company Accounting Oversight Board (United States), the objective of which is the expression of an opinion regarding the financial statements taken as a whole. Accordingly, we do not express such an opinion. Based on our review, we are not aware of any material modifications that should be made to the condensed consolidated interim financial statements referred to above for them to be in conformity with International Financial Reporting Standards as issued by International Accounting Standards Board. We have previously audited, in accordance with standards of the Public Company Accounting Oversight Board (United States), the consolidated balance sheet of the Company and subsidiaries as of March 31, 2014, and the related consolidated statements of comprehensive income, changes in equity and cash flows for the year then ended (not presented herein); and in our report dated May 09, 2014, we expressed an unqualified opinion on those consolidated financial statements. In our opinion, the information set forth in the accompanying condensed consolidated interim balance sheet as of March 31, 2014, is fairly stated, in all material respects, in relation to the consolidated balance sheet from which it has been derived.
KPMG Bangalore, India January 27, 2015


