Embed Size (px)
Citation preview
22FEB201723444404
UNITED STATESSECURITIES AND EXCHANGE COMMISSION
Washington, D.C. 20549
FORM 10-K� ANNUAL REPORT PURSUANT TO SECTION 13 OR 15(d) OF THE
SECURITIES EXCHANGE ACT OF 1934For the fiscal year ended: December 31, 2017
OR
� TRANSITION REPORT PURSUANT TO SECTION 13 OR 15(d) OF THESECURITIES EXCHANGE ACT OF 1934
For the transition period from to
Commission File Number: 1-14066
SOUTHERN COPPER CORPORATION(Exact name of registrant as specified in its charter)
Delaware 13-3849074(State or other jurisdiction of (I.R.S. Employerincorporation or organization) Identification No.)
1440 East Missouri Avenue Suite 160 Phoenix, AZ 85014(Address of principal executive offices) (Zip code)
Registrant’s telephone number, including area code: (602) 264-1375
Securities registered pursuant to Section 12(b) of the Act:
Title of each class: Name of each exchange on which registered:
Common stock, par value $0.01 per share New York Stock ExchangeLima Stock Exchange
Securities registered pursuant to Section 12(g) of the Act: None
Indicate by check mark if the registrant is a well-known seasoned issuer, as defined in Rule 405 of the SecuritiesAct. Yes � No �
Indicate by check mark if the registrant is not required to file reports pursuant to Section 13 or Section 15(d) of theAct. Yes � No �
Indicate by check mark whether the registrant (1) has filed all reports required to be filed by Section 13 or 15(d) of the SecuritiesExchange Act of 1934 during the preceding 12 months (or for such shorter period that the registrant was required to file such reports),and (2) has been subject to such filing requirements for the past 90 days. Yes � No �
Indicate by check mark whether the registrant has submitted electronically and posted on its corporate Website, if any, everyInteractive Data File required to be submitted and posted pursuant to Rule 405 of Regulation S-T (§ 232.405 of this chapter) during thepreceding 12 months (or for such shorter period that the registrant was required to submit and post such files). Yes � No �
Indicate by check mark if disclosure of delinquent filers pursuant to Item 405 of Regulation S-K (§ 229.405 of this chapter) is notcontained herein, and will not be contained, to the best of registrant’s knowledge, in definitive proxy or information statementsincorporated by reference in Part III of this Form 10-K or any amendment to this Form 10-K. �
Indicate by check mark whether the registrant is a large accelerated filer, an accelerated filer, a non-accelerated filer, smallerreporting company, or an emerging growth company. See definitions of ‘‘large accelerated filer,’’ ‘‘accelerated filer,’’ ‘‘smaller reportingcompany’’ and ‘‘emerging growth company’’ in Rule 12b-2 of the Exchange Act.
Large accelerated filer � Accelerated filer � Non-accelerated filer � Smaller reporting company �(Do not check if a Emerging growth company �
smaller reporting company)
If an emerging growth company, indicate by check mark if the registrant has elected not to use the extended transition period forcomplying with any new or revised financial accounting standards provided pursuant to Section 13(a) of the Exchange Act. �
Indicate by check mark whether the registrant is a shell company (as defined in Rule 12b-2 of the Act). Yes � No �
At February 23, 2018, there were of record 773,028,469 shares of common stock, par value $0.01 per share, outstanding.
The aggregate market value of the shares of common stock (based upon the closing price at June 30, 2017 as reported on the NewYork Stock Exchange—Composite Transactions) of Southern Copper Corporation held by non-affiliates was approximately$2,969.6 million.
PORTIONS OF THE FOLLOWING DOCUMENTS ARE INCORPORATED BY REFERENCE:
Part III: Proxy statement for 2018 Annual Meeting of StockholdersPart IV: Exhibit Index is on Page 146 through 148
Southern Copper Corporation (‘‘SCC’’)
INDEX TO FORM 10-K
Page No.
PART I.
Item 1 Business . . . . . . . . . . . . . . . . . . . . . . . . . . . . . . . . . . . . . . . . . . . . . . . . . . . . 3 - 12
Item 1A Risk factors . . . . . . . . . . . . . . . . . . . . . . . . . . . . . . . . . . . . . . . . . . . . . . . . . . 13 - 22
Item 1B Unresolved Staff Comments . . . . . . . . . . . . . . . . . . . . . . . . . . . . . . . . . . . . . . 22
Item 2 Properties . . . . . . . . . . . . . . . . . . . . . . . . . . . . . . . . . . . . . . . . . . . . . . . . . . . 23 - 61
Item 3 Legal Proceedings . . . . . . . . . . . . . . . . . . . . . . . . . . . . . . . . . . . . . . . . . . . . . 61
Item 4 Mine Safety Disclosure . . . . . . . . . . . . . . . . . . . . . . . . . . . . . . . . . . . . . . . . . 61
PART II.
Item 5. Market for Registrant’s Common Equity, Related Stockholder Matters andIssuer Purchases of Equity Securities . . . . . . . . . . . . . . . . . . . . . . . . . . . . . . 62 - 64
Item 6. Selected Financial Data . . . . . . . . . . . . . . . . . . . . . . . . . . . . . . . . . . . . . . . . . 65 - 67
Item 7. Management’s Discussion and Analysis of Financial Condition and Results ofOperations . . . . . . . . . . . . . . . . . . . . . . . . . . . . . . . . . . . . . . . . . . . . . . . . . 68 - 97
Item 7A. Quantitative and Qualitative Disclosures about Market Risk . . . . . . . . . . . . . . 98 - 99
Item 8. Financial Statements and Supplementary Data . . . . . . . . . . . . . . . . . . . . . . . . 100 - 168
Item 9. Changes in and Disagreements with Accountant on Accounting and FinancialDisclosure . . . . . . . . . . . . . . . . . . . . . . . . . . . . . . . . . . . . . . . . . . . . . . . . . 169
Item 9A. Controls and Procedures . . . . . . . . . . . . . . . . . . . . . . . . . . . . . . . . . . . . . . . . 169 - 171
Item 9B. Other Information . . . . . . . . . . . . . . . . . . . . . . . . . . . . . . . . . . . . . . . . . . . . . 172
PART III.
Item 10. Directors, Executive Officers and Corporate Governance . . . . . . . . . . . . . . . . . 172 - 174
Item 11. Executive Compensation . . . . . . . . . . . . . . . . . . . . . . . . . . . . . . . . . . . . . . . . 172 - 174
Item 12. Security Ownership of Certain Beneficial Owners and Management andRelated Stockholder Matters. . . . . . . . . . . . . . . . . . . . . . . . . . . . . . . . . . . . 172 - 174
Item 13. Certain Relationships and Related Transactions and Director Independence. . . . 172 - 174
Item 14. Principal Accounting Fees and Services . . . . . . . . . . . . . . . . . . . . . . . . . . . . . . 172 - 174
PART IV.
Item 15. Exhibits, Financial Statement Schedule . . . . . . . . . . . . . . . . . . . . . . . . . . . . . . 175 - 178
Supplemental information. . . . . . . . . . . . . . . . . . . . . . . . . . . . . . . . . . . . . . . . 179 - 182
Signatures . . . . . . . . . . . . . . . . . . . . . . . . . . . . . . . . . . . . . . . . . . . . . . . . . . . 183 - 184
2
PART I
ITEM 1. BUSINESS
THE COMPANY
Southern Copper Corporation (‘‘SCC’’, ‘‘Southern Copper’’ or the ‘‘Company’’) is one of thelargest integrated copper producers in the world. Our major production includes copper, molybdenum,zinc and silver. All of our mining, smelting and refining facilities are located in Peru and Mexico andwe conduct exploration activities in those countries and in Argentina, Chile and Ecuador. See Item 2‘‘Properties—Review of Operations’’ for maps of our principal mines, smelting facilities and refineries.Our operations make us one of the largest mining companies in Peru and Mexico. We believe we havethe largest copper reserves in the world. We were incorporated in Delaware in 1952 and haveconducted copper mining operations since 1960. Since 1996, our common stock has been listed on boththe New York and Lima Stock Exchanges.
Our Peruvian copper operations involve mining, milling and flotation of copper ore to producecopper concentrates and molybdenum concentrates; the smelting of copper concentrates to produceblister and anode copper; and the refining of anode copper to produce copper cathodes. As part of thisproduction process, we also produce significant amounts of molybdenum concentrate and sulfuric acid.Our precious metals plant at the Ilo refinery produces refined silver, gold, and other materials.Additionally, we produce refined copper using solvent extraction/electrowinning technology (‘‘SX-EW’’).We operate the Toquepala and Cuajone open-pit mines high in the Andes Mountains, approximately860 kilometers southeast of the city of Lima, Peru. We also operate a smelter and refinery west of theToquepala and Cuajone mines in the coastal city of Ilo, Peru.
Our Mexican operations are conducted through our subsidiary, Minera Mexico S.A. de C.V.(‘‘Minera Mexico’’), which we acquired in 2005. Minera Mexico engages primarily in the mining andprocessing of copper, molybdenum, zinc, silver, gold and lead. Minera Mexico operates throughsubsidiaries that are grouped into three separate units. Mexicana de Cobre S.A. de C.V. (together withits subsidiaries, the ‘‘La Caridad’’ unit) operates La Caridad, an open-pit copper mine, a copper oreconcentrator, a SX-EW plant, a smelter, refinery and a rod plant. The La Caridad refinery has aprecious metals plant which produces refined silver, gold and other materials. Operadora de Minas eInstalaciones Mineras S.A de C.V. (the ‘‘Buenavista unit’’) operates Buenavista, an open-pit coppermine, which is located at the site of one of the world’s largest copper ore deposits, two copperconcentrators and three SX-EW plants. Industrial Minera Mexico, S.A. de C.V. (together with itssubsidiaries, the ‘‘IMMSA unit’’) operates five underground mines that produce zinc, lead, copper,silver and gold, a coal mine and a zinc refinery.
We utilize modern, state of the art mining and processing methods, including global positioningsystems and computerized mining processes. Our operations have a high level of vertical integrationthat allows us to manage the entire production process, from the mining of the ore to the productionof refined copper rod and other products and most related transport and logistics functions, using ourown facilities, employees and equipment.
The sales prices for our products are largely determined by market forces out of our control. Ourmanagement, therefore, focuses on cost control and production enhancement to remain profitable. Weendeavor to achieve these goals through capital spending programs, exploration efforts and costreduction programs. Our focus is to remain profitable during periods of low copper prices and onmaximizing results in periods of high copper prices. For additional information on the sale prices of themetals we produce, please see ‘‘Metal Prices’’ in this Item 1.
3
24FEB201809455196
Currency Information:
Unless stated otherwise, all our financial information is presented in U.S. dollars and any referenceherein to ‘‘U.S. dollars’’, ‘‘dollars’’, or ‘‘$’’ are to U.S. dollars; references to ‘‘sol’’, ‘‘soles’’ or ‘‘S/’’, areto Peruvian soles; and references to ‘‘peso’’, ‘‘pesos’’, or ‘‘Ps.’’, are to Mexican pesos.
Unit Information:
Unless otherwise noted, all tonnages are in metric tons. To convert to short tons, multiply by 1.102.All ounces are troy ounces. All distances are in kilometers. To convert to miles, multiply by 0.621. Toconvert hectares to acres, multiply by 2.47.
ORGANIZATIONAL STRUCTURE
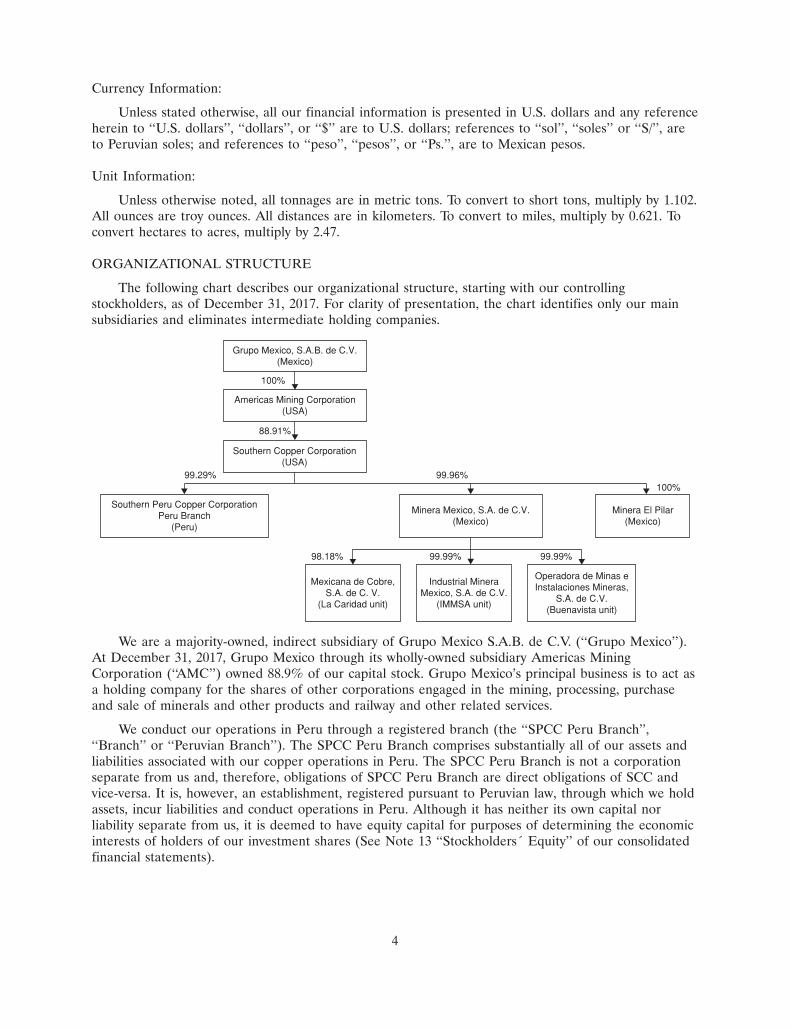
The following chart describes our organizational structure, starting with our controllingstockholders, as of December 31, 2017. For clarity of presentation, the chart identifies only our mainsubsidiaries and eliminates intermediate holding companies.
Grupo Mexico, S.A.B. de C.V.(Mexico)
Americas Mining Corporation(USA)
Southern Copper Corporation(USA)
Mexicana de Cobre,S.A. de C. V.
(La Caridad unit)
Industrial MineraMexico, S.A. de C.V.
(IMMSA unit)
Operadora de Minas eInstalaciones Mineras,
S.A. de C.V.(Buenavista unit)
Southern Peru Copper CorporationPeru Branch
(Peru)
99.96%
100%
88.91%
98.18% 99.99% 99.99%
99.29%
Minera Mexico, S.A. de C.V.(Mexico)
Minera El Pilar(Mexico)
100%
We are a majority-owned, indirect subsidiary of Grupo Mexico S.A.B. de C.V. (‘‘Grupo Mexico’’).At December 31, 2017, Grupo Mexico through its wholly-owned subsidiary Americas MiningCorporation (‘‘AMC’’) owned 88.9% of our capital stock. Grupo Mexico’s principal business is to act asa holding company for the shares of other corporations engaged in the mining, processing, purchaseand sale of minerals and other products and railway and other related services.
We conduct our operations in Peru through a registered branch (the ‘‘SPCC Peru Branch’’,‘‘Branch’’ or ‘‘Peruvian Branch’’). The SPCC Peru Branch comprises substantially all of our assets andliabilities associated with our copper operations in Peru. The SPCC Peru Branch is not a corporationseparate from us and, therefore, obligations of SPCC Peru Branch are direct obligations of SCC andvice-versa. It is, however, an establishment, registered pursuant to Peruvian law, through which we holdassets, incur liabilities and conduct operations in Peru. Although it has neither its own capital norliability separate from us, it is deemed to have equity capital for purposes of determining the economicinterests of holders of our investment shares (See Note 13 ‘‘Stockholders´ Equity’’ of our consolidatedfinancial statements).
4
In April 2005, we acquired Minera Mexico, from Americas Mining Corporation (‘‘AMC’’), asubsidiary of Grupo Mexico, our controlling stockholder. Minera Mexico is a holding company and allof its operations are conducted through subsidiaries that are grouped into three units: (i) the LaCaridad unit (ii) the Buenavista unit and (iii) the IMMSA unit. We own 99.96% of Minera Mexico.
In 2008, our Board of Directors (‘‘BOD’’) authorized a $500 million share repurchase programthat has since been increased by the BOD and is currently authorized to $3 billion. Pursuant to thisprogram, through December 31, 2017 we have purchased 119.5 million shares of our common stock ata cost of $2,918.4 million. These shares are available for general corporate purposes. We may purchaseadditional shares from time to time, based on market conditions and other factors. This repurchaseprogram has no expiration date and may be modified or discontinued at any time.
REPUBLIC OF PERU AND MEXICO
Our revenues are derived primarily from our operations in Peru and Mexico. Risks related to ouroperations in both countries include those associated with economic and political conditions, the effectsof currency fluctuations and inflation, the effects of government regulations and the geographicconcentration of our operations.
AVAILABLE INFORMATION
We file annual, quarterly and current reports, proxy statements and other information with theU.S. Securities and Exchange Commission (‘‘SEC’’). You may read and copy any document we file atthe SEC’s Public Reference Room at 100 F Street NE, Washington, D.C. 20549. Please call the SECat 1-800-SEC-0330 for information on the Public Reference Room. The SEC maintains a website thatcontains annual, quarterly and current reports, proxy statements and other information that issuers(including Southern Copper Corporation) file electronically with the SEC. The SEC’s websiteis www.sec.gov.
Our website is www.southerncoppercorp.com. Beginning with the Form 8-K dated March 14, 2003,we have made available on this website, free of charge, our annual, quarterly and current reports, assoon as reasonably practical after we electronically file such material with, or furnish it to, the SEC.Our website also includes the Company’s Corporate Governance guidelines and the charters of ourprincipal Board Committees. However, the information found on our website is not part of this or anyother report.
CAUTIONARY STATEMENT
Forward-looking statements in this report and in other Company statements include informationregarding expected commencement dates of mining or metal production operations, projectedquantities of future metal production, anticipated production rates, operating efficiencies, costs andexpenditures, including taxes, as well as projected demand or supply for the Company’s products.Actual results could differ materially depending upon certain factors, including the risks anduncertainties relating to general U.S. and international economic and political conditions, the cyclicaland volatile prices of copper, other commodities and supplies, including fuel and electricity, theavailability of materials, insurance coverage, equipment, required permits or approvals and financing,the occurrence of unusual weather or operating conditions, lower than expected ore grades, water andgeological problems, the failure of equipment or processes to operate in accordance with specifications,failure to obtain financial assurance to meet closure and remediation obligations, labor relations,litigation and environmental risks, as well as political and economic risk associated with foreignoperations. Results of operations are directly affected by metal prices on commodity exchanges, whichcan be volatile.
5
Additional business information follows:
COPPER BUSINESS
Copper is an important component in the world’s infrastructure. It is the third most widely usedmetal, after iron and aluminum. Copper has unique chemical and physical properties, including highductility, malleability, thermal and electrical conductivity, and resistance to corrosion that has made it asuperior material for use in electrical and electronic products, including power transmission andgeneration, which accounts for about three quarters of copper global use, telecommunications, buildingconstruction, transportation and industrial machinery. Copper is also an important metal innon-electrical applications such as plumbing and roofing and, when alloyed with zinc to form brass, inmany industrial and consumer applications.
Copper is an internationally traded commodity with prices principally determined by the majormetal exchanges, the Commodities Exchange, or ‘‘COMEX’’, in New York and the London MetalExchange or ‘‘LME.’’ Copper is usually found in nature in association with sulfur. Pure copper metal isgenerally produced from a multistage process, beginning with the mining and concentrating oflow-grade ores containing copper sulfide minerals, and followed by smelting and electrolytic refining toproduce a pure copper cathode. An increasing share of copper is produced from acid leaching ofoxidized ores. Copper is one of the oldest metals ever used and has been one of the most importantmaterials in the development of civilization.
BUSINESS REPORTING SEGMENTS:
Our management views Southern Copper as having three reportable segments and manages it onthe basis of these segments.
The three segments identified are groups of individual mines, each of which constitutes anoperating segment with similar economic characteristics, type of products, processes and supportfacilities, regulatory environments, employee bargaining contracts and currency risks. In addition, eachmine within the individual group earns revenues from similar types of customers for their products andservices and each group incurs expenses independently, including commercial transactions betweengroups.
Inter-segment sales are based on arm’s length prices at the time of sale. These may not bereflective of actual prices realized by the Company due to various factors, including additionalprocessing, timing of sales to outside customers and transportation cost. Added to the segment data isinformation regarding the Company’s sales. The segments identified by the Company are:
1. Peruvian operations, which include the Toquepala and Cuajone mine complexes and thesmelting and refining plants, including a precious metals plant, industrial railroad and portfacilities that service both mines. Sales of its products are recorded as revenue of our Peruvianmines. The Peruvian operations produce copper, with production of by-products ofmolybdenum, silver and other materials.
2. Mexican open-pit operations, which include the La Caridad and Buenavista mine complexesand the smelting and refining plants, including a precious metals plant and a copper rod plantand support facilities that service both mines. Sales of its products are recorded as revenue ofour Mexican mines. The Mexican open-pit operations produce copper, with production ofby-products of molybdenum, silver and other materials.
3. Mexican underground mining operations, which include five underground mines that producezinc, copper, lead, silver and gold, a coal mine that produces coal and coke, and a zincrefinery. This group is identified as the IMMSA unit and sales of its products are recorded asrevenue of the IMMSA unit.
6
Financial information is regularly prepared for each of the three segments and the results arereported to Senior management on a segment basis. Senior management focuses on operating incomeand on total assets as measures of performance to evaluate different segments and to make decisions toallocate resources to the reported segments. These are common measures in the mining industry.
Segment information is included in Item 2 ‘‘Properties,’’ under the captions—‘‘Metal Production bySegments’’ and ‘‘Ore Reserves.’’ More information on business segment and segment financialinformation is included in Note 17 ‘‘Segment and Related Information’’ of our consolidated financialstatements.
CAPITAL INVESTMENT PROGRAM AND EXPLORATION ACTIVITIES
For a description of our capital investment program, see Item 7 ‘‘Management’s Discussion andAnalysis of Financial Condition and Results of Operations—Capital Investment Program’’ and for ourexploration activities, see Item 2 ‘‘Properties—Explorations Activities.’’
PRINCIPAL PRODUCTS AND MARKETS
Copper is primarily used in the building and construction industries, in the power generation andtransmission industry, in electrical and electronic products and, to a lesser extent, in industrialmachinery and equipment, consumer products and in the automotive and transportation industries.Molybdenum is used to toughen alloy steels and soften tungsten alloy and is also used in fertilizers,dyes, enamels and reagents. Silver is used for photographic, electrical and electronic products and, to alesser extent, in brazing alloys and solder, jewelry, coinage, silverware and catalysts. Zinc is primarilyused as a coating on iron and steel to protect against corrosion and is also used to make die cast parts,in the manufacturing of batteries and in the form of sheets for architectural purposes.
Our marketing strategy and annual sales planning emphasize developing and maintaining long-termcustomer relationships. Thus acquiring annual or other long-term contracts for the sale of our productsis a high priority. Generally, 80% to 90% of our metal production is sold under annual or longer-termcontracts. Sales prices are determined based on the prevailing commodity prices for the quotationperiod according to the terms of the contract.
We focus on the ultimate end-user customers as opposed to selling on the spot market or totrading companies. In addition, we devote significant marketing efforts to diversifying our sales both byregion and by customer base. We also strive to provide superior customer service, including timelydeliveries of our products. Our ability to consistently fulfill customer demand is supported by oursubstantial production capacity.
For additional information on sales please see ‘‘Revenue recognition’’ in Note 2 ‘‘Summary ofSignificant Accounting Policies’’ and Note 17 ‘‘Segment and Related Information’’ of our consolidatedfinancial statements.
METALS PRICES
Prices for our products are principally a function of supply and demand and, with the exception ofmolybdenum, are established on COMEX and LME. Prices for our molybdenum products areestablished by reference to the publication Platt’s Metals Week. Our contract prices also reflect anynegotiated premiums and the costs of freight and other factors. From time to time, we have enteredinto hedging transactions to provide partial protection against future decreases in the market price ofmetals and we may do so under certain market conditions. For a further discussion of our productsmarket prices, please see Item 7 ‘‘Management’s Discussion and Analysis of Financial Condition andResults of Operations—Metal Prices.’’
7
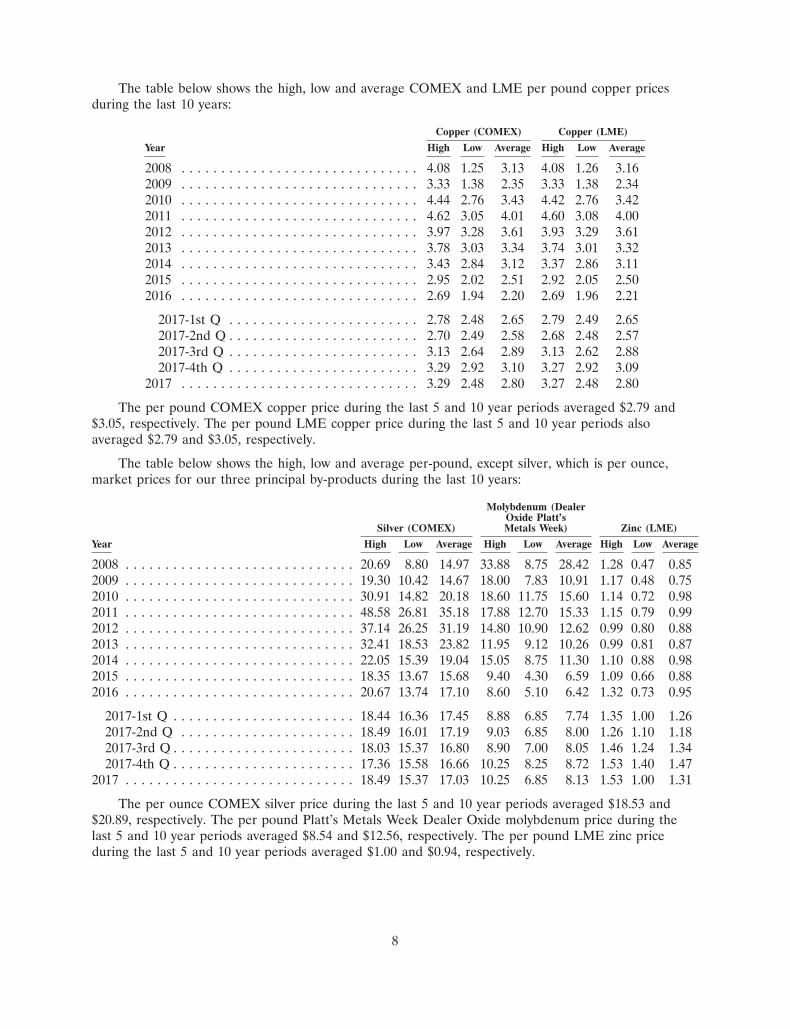
The table below shows the high, low and average COMEX and LME per pound copper pricesduring the last 10 years:
Copper (COMEX) Copper (LME)
Year High Low Average High Low Average
2008 . . . . . . . . . . . . . . . . . . . . . . . . . . . . . . 4.08 1.25 3.13 4.08 1.26 3.162009 . . . . . . . . . . . . . . . . . . . . . . . . . . . . . . 3.33 1.38 2.35 3.33 1.38 2.342010 . . . . . . . . . . . . . . . . . . . . . . . . . . . . . . 4.44 2.76 3.43 4.42 2.76 3.422011 . . . . . . . . . . . . . . . . . . . . . . . . . . . . . . 4.62 3.05 4.01 4.60 3.08 4.002012 . . . . . . . . . . . . . . . . . . . . . . . . . . . . . . 3.97 3.28 3.61 3.93 3.29 3.612013 . . . . . . . . . . . . . . . . . . . . . . . . . . . . . . 3.78 3.03 3.34 3.74 3.01 3.322014 . . . . . . . . . . . . . . . . . . . . . . . . . . . . . . 3.43 2.84 3.12 3.37 2.86 3.112015 . . . . . . . . . . . . . . . . . . . . . . . . . . . . . . 2.95 2.02 2.51 2.92 2.05 2.502016 . . . . . . . . . . . . . . . . . . . . . . . . . . . . . . 2.69 1.94 2.20 2.69 1.96 2.21
2017-1st Q . . . . . . . . . . . . . . . . . . . . . . . . 2.78 2.48 2.65 2.79 2.49 2.652017-2nd Q . . . . . . . . . . . . . . . . . . . . . . . . 2.70 2.49 2.58 2.68 2.48 2.572017-3rd Q . . . . . . . . . . . . . . . . . . . . . . . . 3.13 2.64 2.89 3.13 2.62 2.882017-4th Q . . . . . . . . . . . . . . . . . . . . . . . . 3.29 2.92 3.10 3.27 2.92 3.09
2017 . . . . . . . . . . . . . . . . . . . . . . . . . . . . . . 3.29 2.48 2.80 3.27 2.48 2.80
The per pound COMEX copper price during the last 5 and 10 year periods averaged $2.79 and$3.05, respectively. The per pound LME copper price during the last 5 and 10 year periods alsoaveraged $2.79 and $3.05, respectively.
The table below shows the high, low and average per-pound, except silver, which is per ounce,market prices for our three principal by-products during the last 10 years:
Molybdenum (DealerOxide Platt’s
Silver (COMEX) Metals Week) Zinc (LME)
Year High Low Average High Low Average High Low Average
2008 . . . . . . . . . . . . . . . . . . . . . . . . . . . . . 20.69 8.80 14.97 33.88 8.75 28.42 1.28 0.47 0.852009 . . . . . . . . . . . . . . . . . . . . . . . . . . . . . 19.30 10.42 14.67 18.00 7.83 10.91 1.17 0.48 0.752010 . . . . . . . . . . . . . . . . . . . . . . . . . . . . . 30.91 14.82 20.18 18.60 11.75 15.60 1.14 0.72 0.982011 . . . . . . . . . . . . . . . . . . . . . . . . . . . . . 48.58 26.81 35.18 17.88 12.70 15.33 1.15 0.79 0.992012 . . . . . . . . . . . . . . . . . . . . . . . . . . . . . 37.14 26.25 31.19 14.80 10.90 12.62 0.99 0.80 0.882013 . . . . . . . . . . . . . . . . . . . . . . . . . . . . . 32.41 18.53 23.82 11.95 9.12 10.26 0.99 0.81 0.872014 . . . . . . . . . . . . . . . . . . . . . . . . . . . . . 22.05 15.39 19.04 15.05 8.75 11.30 1.10 0.88 0.982015 . . . . . . . . . . . . . . . . . . . . . . . . . . . . . 18.35 13.67 15.68 9.40 4.30 6.59 1.09 0.66 0.882016 . . . . . . . . . . . . . . . . . . . . . . . . . . . . . 20.67 13.74 17.10 8.60 5.10 6.42 1.32 0.73 0.95
2017-1st Q . . . . . . . . . . . . . . . . . . . . . . . 18.44 16.36 17.45 8.88 6.85 7.74 1.35 1.00 1.262017-2nd Q . . . . . . . . . . . . . . . . . . . . . . 18.49 16.01 17.19 9.03 6.85 8.00 1.26 1.10 1.182017-3rd Q . . . . . . . . . . . . . . . . . . . . . . . 18.03 15.37 16.80 8.90 7.00 8.05 1.46 1.24 1.342017-4th Q . . . . . . . . . . . . . . . . . . . . . . . 17.36 15.58 16.66 10.25 8.25 8.72 1.53 1.40 1.47
2017 . . . . . . . . . . . . . . . . . . . . . . . . . . . . . 18.49 15.37 17.03 10.25 6.85 8.13 1.53 1.00 1.31
The per ounce COMEX silver price during the last 5 and 10 year periods averaged $18.53 and$20.89, respectively. The per pound Platt’s Metals Week Dealer Oxide molybdenum price during thelast 5 and 10 year periods averaged $8.54 and $12.56, respectively. The per pound LME zinc priceduring the last 5 and 10 year periods averaged $1.00 and $0.94, respectively.
8
COMPETITIVE CONDITIONS
Competition in the copper market is based primarily on price and service basis, with price beingthe most important factor when supplies of copper are ample. Our products compete with othermaterials, including aluminum and plastics. For additional information, see Item 1A ‘‘RiskFactors—The copper mining industry is highly competitive.’’
LABOR FORCE
As of December 31, 2017, we had 13,140 employees, approximately 71.8% of whom are unionizedand represented by eight different labor unions. Despite the three strikes in 2017 at our Peruvianoperations, we believe the Company has a positive labor environment in our operations in Mexico andPeru, which is allowing us to increase productivity as well as helping us achieve the goals of our capitalexpansion program.
Peru
69% of our 4,628 Peruvian employees were unionized at December 31, 2017. Currently, there aresix separate unions, one large union and five smaller unions. In the first quarter of 2016, the Companysigned three-year agreements with five unions. These agreements include, among other things, annualsalary increases of 5% for each of the three years.
In April 2017, the Unified Labor Union of SPCC workers and one of Toquepala’s unions began astrike, demanding a review of certain health and profit sharing benefits. The strike lasted 12 days.These two unions began illegal strikes in July and November 2017, that lasted five days and 21 days,respectively. The Company estimates that the loss of copper production resulting from the 2017 strikeswas not significant and our sales contracts were not affected.
Employees of the Toquepala and Cuajone units reside in townsites, where we have built 3,700houses and apartments. We also have 90 houses at Ilo for staff personnel. Housing, together withmaintenance and utility services, is provided at minimal cost to most of our employees. Our townsiteand housing complexes include schools, medical facilities, churches, social clubs and recreationalfacilities. We also provide shopping, banking and other services at the townsites.
Mexico
74% of our 8,450 Mexican employees were unionized at December 31, 2017, represented by threeseparate unions. Under Mexican law, the terms of employment for unionized workers are set forth incollective bargaining agreements. Mexican companies negotiate the salary provisions of collectivebargaining agreements with the labor unions annually and negotiate other benefits every two years. Weconduct negotiations separately at each mining complex and each processing plant.
Our Taxco and San Martin mines in Mexico have been on strike since July 2007. For a discussionof labor matters reference is made to the information contained under the caption ‘‘Labor matters’’ inNote 12 ‘‘Commitments and Contingencies’’ of the consolidated financial statements.
Employees of La Caridad and Buenavista units reside in townsites at Nacozari and Cananea,where we have built approximately 2,000 and 275 houses and apartments, respectively. Most of theemployees of the IMMSA unit reside on the grounds of the mining or processing complexes in whichthey work and where we have built approximately 900 houses and apartments. Housing, together withmaintenance and utility services, is provided at minimal cost to most of our employees. Our townsitesand housing complexes include educational and medical facilities, churches, social clubs, shoppingcenters, banking and other services. Through 2007, the Buenavista unit provided health care services toemployees and retired unionized employees and their families through its own hospital at theBuenavista unit. In 2010, the Company signed an agreement with the Secretary of Health of the State
9
of Sonora to provide these services to its retired workers and their families. The new workers ofBuenavista receive health services through the Mexican Institute of Social Security as is the case for allMexican workers.
FUEL, ELECTRICITY AND WATER SUPPLIES
The principal raw materials used in our operations are fuel, electricity and water. We use naturalgas to power boilers and generators, and for metallurgical processes at our Mexican operations anddiesel fuel to power mining equipment. We believe that sources of fuel, electricity and water are readilyavailable. The prices of these raw materials may fluctuate outside of our control, therefore we focusour efforts to reduce these costs through cost and energy saving measures.
Energy is the principal cost in mining, so the concern for its conservation and efficient usage isvery important. We have energy management committees at most of our mines, which meet periodicallyto discuss consumption and to develop measures directed at saving energy. Also, alternative sources arebeing analyzed at the corporate level, from both traditional and renewable energy sources. This hashelped us to develop a culture of energy conservation directed at the sustainability of our operations.
Peru:
Fuel: In Peru, we obtain fuel primarily from local companies. The Company believes thatadequate supplies of fuel are available in Peru.
Electricity: In June 2014, we entered into a power purchase agreement for 120 megawatt(‘‘MW’’) with the state company Electroperu S.A., which began supplying energy for our Peruvianoperations for twenty years starting on April 17, 2017. In July 2014, we entered into a power purchaseagreement for 120MW with a private power generator Kallpa Generacion S.A. (‘‘Kallpa’’), which begansupplying energy for our Peruvian operations for ten years starting on April 17, 2017. In May 2016, wesigned an additional power purchase agreement for a maximum of 80MW with Kallpa, under whichKallpa will supply energy for the operations related to the Toquepala Expansion and other minorprojects for ten years starting on May 1, 2017 and ending after ten years of commercial operation ofthe Toquepala Expansion or on April 30, 2029; whichever occurs first. In addition, we feel confidentthat additional power can be obtained from the Peruvian national grid, should the need arise.
Additionally, we have nine megawatts of power generation capacity from two smallhydro-generating installations at Cuajone. Power is distributed over a 224-kilometer closed looptransmission circuit, which is interconnected with the Peruvian network.
Water: We have water rights or licenses for up to 1,950 liters per second from well fields at theHuaitire, Vizcachas and Titijones aquifers and surface water rights from the Suches lake and two smallwater courses, Quebrada Honda and Quebrada Tacalaya. We believe these water sources are sufficientto supply the needs of our operating units at Toquepala and Cuajone. At Ilo, we have desalinationplants that produce water for industrial use and domestic consumption that we believe are sufficient forour current and projected needs.
Mexico:
Fuel: In Mexico, fuel is purchased directly from Petroleos Mexicanos (‘‘PEMEX’’), the state oilmonopoly.
The La Caridad unit imports natural gas from the United States through its pipeline (betweenDouglas, Arizona and Nacozari, Sonora), which allows us to import natural gas from the United Statesat market prices and thereby reduce operating costs. Several contracts with PEMEX and theUnited States provide us with the option of using a monthly or daily fixed price for our natural gaspurchases.
10
Natural gas is used for metallurgical processes, to power furnaces, converters, casting wheels,boilers and electric generators. Diesel oil is a backup for all these uses. We use diesel oil to powermining equipment at our operations.
Electricity: Electricity is used as the main energy source at our mining complexes. We purchasemost of our electricity from Mexico Generadora de Energia S. de R. L. (‘‘MGE’’), a subsidiary ofGrupo Mexico which has two power plants designed to supply power to La Caridad and Buenavistaunits. MGE is supplying 13.5% of its power output to third party energy users. These plants are naturalgas-fired combined cycle power generating units, with a net total capacity of 516.2 megawatts. In 2012,we entered into a power supply agreement with MGE through 2032. The first plant was completed in2013 and the second was completed in the second quarter of 2014. The first plant began to supplypower to the Company in December 2013, and the second plant began to supply power in June 2015.
We also purchase electricity from the Comision Federal de Electricidad (the Federal ElectricityCommission or the ‘‘CFE’’), the state’s electrical power producer. In addition, we recover some energyfrom waste heat boilers at the La Caridad smelter. Accordingly, a significant portion of our operatingcosts in Mexico is dependent upon the pricing policies of CFE, as well as PEMEX, which reflectgovernment policy, as well as international market prices for crude oil, natural gas and conditions inthe refinery markets.
Some of the mining operations also purchase electricity from Eolica el Retiro, S.A.P.I de C.V.(‘‘Eolica’’), a windfarm energy producer that is an indirect subsidiary of Grupo Mexico. In August 2013,IMMSA and other of the mining operations of the Company entered into a purchase agreement and inlate 2014 started to purchase electricity. Most of the purchases from Eolica were made by IMMSA, dueto the nature of the production process there is not a set amount of KWh contracted. In 2017 the totalpurchases were of approximately 55.3 million KWh.
Water: In Mexico, water is deemed a public property and industries not connected to a publicservice water supply must obtain a water concession from Comision Nacional del Agua (the NationalWater Commission or the ‘‘CNA’’). Water usage fees are established in the Ley Federal de Derechos (theFederal Rights Law), which distinguishes several availability zones with different fees per unit ofvolume according to each zone, with the exception of Mexicana de Cobre. All of our operations haveone or several water concessions and pump out the required water from wells. Mexicana de Cobrepumps water from the La Angostura dam, which is close to the mine and plants. At our Buenavistafacility, we maintain our own wells and pay the CNA for water usage. Water conservation committeeshave been established in each plant in order to conserve and recycle water. Water usage fees areupdated on a yearly basis and have been increasing in recent years.
ENVIRONMENTAL MATTERS
For a discussion of environmental matters reference is made to the information contained underthe caption ‘‘Environmental matters’’ in Note 12 ‘‘Commitments and Contingencies’’ of theconsolidated financial statements.
11
MINING RIGHTS AND CONCESSIONS
Peru:
We have 131,278 hectares in concessions from the Peruvian government for our exploration,exploitation, extraction and production operations, at various sites, as follows:
Toquepala Cuajone Ilo Other Total
(hectares)
Plants . . . . . . . . . . . . . . . . . . . . . . . . 300 456 421 — 1,177Operations . . . . . . . . . . . . . . . . . . . . 24,679 21,255 4,525 35,459 85,918Exploration . . . . . . . . . . . . . . . . . . . . — — — 44,183 44,183
Total . . . . . . . . . . . . . . . . . . . . . . . 24,979 21,711 4,946 79,642 131,278
We believe that our Peruvian concessions are in full force and in effect under applicable Peruvianlaws and that we are in compliance with all material terms and requirements applicable to theseconcessions. The concessions have indefinite terms, subject to our payment of concession fees of up to$3.00 per hectare annually for the mining concessions and a fee based on nominal capacity for theprocessing concessions. Fees paid during 2017, 2016 and 2015, were approximately $1.2 million,$1.3 million and $1.7 million, respectively. We have two types of mining concessions in Peru: metallicand non-metallic concessions.
In 2011, the Peruvian Congress approved an amendment to the mining royalty charge. The newmining royalty charge is based on operating income margins with graduated rates ranging from 1% to12% of operating profits, with a minimum royalty charge assessed at 1% of net sales. If the operatingincome margin is 10% or less, the royalty charge is 1% and for each 5% increment in the operatingincome margin, the royalty charge rate increases by 0.75%, up to a maximum of 12%. In 2017, 2016and 2015, we made provisions of $23.4 million, $16.8 million and $22.9 million, respectively.
At the same time the Peruvian Congress amended the mining royalty charge, it enacted a new taxfor the mining industry. This tax is also based on operating income and its rates range from 2% to8.4%. For additional information see Note 7 ‘‘Income Taxes’’ to the consolidated financial statements.
Mexico:
In Mexico we have 532,457 hectares in concessions from the Mexican government for ourexploration and exploitation activities as outlined on the table below.
IMMSA La Caridad Buenavista Projects Total
(hectares)
Mine concessions . . . . . . . . . . 187,930 102,699 93,706 148,122 532,457
We believe that our Mexican concessions are in full force and in effect under applicable Mexicanlaws and that we are in compliance with all material terms and requirements applicable to theseconcessions. Under Mexican law, mineral resources belong to the Mexican nation and a concessionfrom the Mexican federal government is required to explore or mine mineral reserves. Miningconcessions have a 50-year term that can be renewed for another 50 years. Holding fees for miningconcessions can be from $0.36 to $7.82 per hectare depending on the beginning date of the miningconcession. Fees paid during 2017, 2016 and 2015 were approximately $5.8 million, $5.4 million and$5.6 million, respectively. In addition, all of our operating units in Mexico have water concessions thatare in full force and effect. Although ownership is not required in order to explore or mine aconcession, we generally own the land related to our Mexican concessions. We also own all of theprocessing facilities of our Mexican operations and the land on which they are constructed.
In December 2013, the Mexican government enacted a new law which, among other things,established a mining royalty charge of 7.5% on earnings before taxes as defined by Mexican taxregulations and an additional royalty charge of 0.5% over gross income from sales of gold, silver andplatinum. These charges were effective January 2014 and are deductible for income tax purposes.
12
ITEM 1A. RISK FACTORS
Every investor or potential investor in Southern Copper Corporation should carefully consider thefollowing risk factors.
Financial risks
Our financial performance is highly dependent on the price of copper and the other metals we produce.
Our financial performance is significantly affected by the market prices of the metals that weproduce, particularly the market prices of copper, molybdenum, zinc and silver. Historically, theseprices have been subject to wide fluctuations and are affected by numerous factors out of our control,including international economic and political conditions, levels of supply and demand, the availabilityand costs of substitutes, inventory levels maintained by users, actions of participants in the commoditiesmarkets and currency exchange rates. In addition, the market prices of copper and certain other metalshave on occasion been subject to rapid short-term changes.
In the last three years, approximately 80% of our revenues came from the sale of copper, 5%came from molybdenum and 9% came from silver and zinc. Please see the distribution of our revenuesper product on Item 7 ‘‘Management’s Discussion and Analysis of Financial Condition and Results ofOperations’’ caption ‘‘Results of operations—net sales’’ on page 80.
See also historical average price of our products on Item 1 Business caption ‘‘Metals prices’’.
We cannot predict whether metals prices will rise or fall in the future. Future declines in metalsprices, and in particular copper, will have an adverse impact on our results of operations and financialcondition. In very adverse market conditions, we might consider curtailing or modifying some of ourmining and processing operations.
Our business requires levels of capital investments which we may not be able to maintain.
Our business is capital intensive. Specifically, the exploration and exploitation of copper and othermetal reserves, mining, smelting and refining costs, the maintenance of machinery and equipment andcompliance with laws and regulations require significant capital investments. We must continue to investcapital to maintain or increase the amount of copper reserves that we exploit and the amount ofcopper and other metals we produce. We cannot assure you that we will be able to maintain ourproduction levels to generate sufficient cash, or that we have access to sufficient financing to continueour exploration, exploitation and refining activities at or above present levels.
Restrictive covenants in the agreements governing our indebtedness and the indebtedness of our MineraMexico subsidiary may restrict our ability to pursue our business strategies.
Our financing instruments and those of our Minera Mexico subsidiary include financial and otherrestrictive covenants that, among other things, limit our and Minera Mexico’s abilities to incuradditional debt and sell assets. If either we or our Minera Mexico subsidiary do not comply with theseobligations, we could be in default under the applicable agreements which, if not addressed or waived,could require repayment of the indebtedness immediately. Our Minera Mexico subsidiary is furtherlimited by the terms of its outstanding notes, which also restrict the Company’s applicable incurrence ofdebt and liens. In addition, future credit facilities may contain limitations on our incurrence ofadditional debt and liens, on our ability to dispose of assets, or on our ability to pay dividends to ourcommon stockholders.
13
We may not pay a significant amount of our net income as cash dividends on our common stock in thefuture.
We distributed a significant amount of our net income as dividends since 1996. Our dividendpractice is subject to change at the discretion of our Board of Directors at any time. The amount thatwe pay in dividends is subject to a number of factors, including our results of operations, financialcondition, cash requirements, tax considerations, future prospects, legal restrictions, contractualrestrictions in credit agreements, limitations imposed by the government of Peru, Mexico or othercountries where we have significant operations and other factors that our Board of Directors may deemrelevant. In light of our capital investment program and global economic conditions, it is possible thatfuture dividend distributions will be reduced from the levels of recent years.
Our ability to recognize the benefits of deferred tax assets is dependent on future cash flows and taxableincome.
Through 2017 the Company recognized the expected future tax benefit from deferred tax assetswhen the tax benefit was considered to be more likely than not of being realized, otherwise, a valuationallowance was applied against deferred tax assets. Assessing the recoverability of deferred tax assetsrequires management to make significant estimates related to expectations of future taxable income andexisting tax laws.
The Tax Cuts and Jobs Act of 2017 (‘‘the Act’’) was enacted into U.S. tax law on December 22,2017 and contains many significant changes to the U.S. federal income tax laws. The Company alsoadopted SEC Staff Accounting Bulletin 118 (‘‘SAB 118’’). Accordingly, the accounting for the effect ofthe Act is based on the Company’s best estimate, which may require adjustment. However, theCompany was able to make reasonable estimates of certain effects and therefore, recorded aprovisional $785.9 million non-cash tax expense for the estimated effects of the Act. These adjustmentswere related to the valuation allowance for foreign tax credits, and other US deferred tax assets,revaluation of our deferred tax assets due to the rate change from 35% to 21% and the transition taxon the repatriation of cumulative foreign earnings. The ultimate impact may differ from theCompany´s estimate due to changes in estimates or further clarification of the new law.
Operational risks
Our actual reserves may not conform to our current estimates of our ore deposits and we depend on ourability to replenish ore reserves for our long-term viability.
There is a degree of uncertainty attributable to the calculation of reserves. Until reserves areactually mined and processed, the quantity of ore and grades must be considered as estimates only. Theproven and probable ore reserves data included in this report are estimates prepared by us based onevaluation methods generally used in the mining industry. We may be required in the future to reviseour reserves estimates based on our actual production. We cannot assure you that our actual reservesconform to geological, metallurgical or other expectations or that the estimated volume and grade ofore will be recovered. Market prices of our metals, increased production costs, reduced recovery rates,short-term operating factors, royalty charges and other factors may render proven and probablereserves uneconomic to exploit and may result in revisions of reserves data from time to time. Reservesdata are not indicative of future results of operations. Our reserves are depleted as we mine. Wedepend on our ability to replenish our ore reserves for our long-term viability. We use several strategiesto replenish and increase our ore reserves, including exploration and investment in properties locatednear our existing mine sites and investing in technology that could extend the life of a mine by allowingus to cost-effectively process ore types that were previously considered uneconomic. Acquisitions mayalso contribute to increase ore reserves and we review potential acquisition opportunities on a regular
14
basis. However, we cannot assure you that we will be able to continue with our strategy to replenishreserves indefinitely.
Our operations are subject to risks, some of which are not insurable.
The business of mining, smelting and refining copper, zinc and other metals is subject to a numberof risks and hazards, including industrial accidents, labor disputes, unusual or unexpected geologicalconditions, changes in the regulatory environment, environmental hazards, weather and other naturalphenomena, such as seismic activity. Such occurrences could result in damage to, or destruction of,mining operations resulting in monetary losses and possible legal liability. In particular, surface andunderground mining and related processing activities present inherent risks of injury to personnel anddamage to equipment. We maintain insurance against many of these and other risks, which in certaincircumstances may not provide adequate coverage. Insurance against certain risks, including certainliabilities for environmental damage or hazards as a result of exploration and production, is notgenerally available to us or other companies within the mining industry. Nevertheless recentenvironmental legal initiatives have considered future regulations regarding environmental damageinsurance. In case such regulations come into force, we will have to analyze the need to obtain suchinsurance. We do not have, and do not intend to obtain, political risk insurance. These or otheruninsured events may adversely affect our financial condition and the results of operations.
Changes in the demand level for our products and copper sales agreements could adversely affect ourrevenues.
Our financial results are subject to fluctuations on the level of industrial and consumer demand forthe refined, semi-refined metal products and concentrates we sell, as well as global economicslow-downs or recessions. Also, changes in technology, industrial processes, concerns over weaknessesin the global economy and consumer habits may affect the level of demand to the extent that thoseincrease or decrease the need for our metal products. Likewise, our revenues could be adverselyaffected by events of force majeure that could have a negative impact on our sales agreements. Theseevents include acts of nature, labor strikes, fires, floods, wars, transportation delays, government actionsor other events that are beyond the control of the parties of the agreement.
Interruptions of energy supply or increases in energy costs, shortages of water supply, critical parts, equipment,skilled labor and other production costs may adversely affect our results of operations.
We require substantial amounts of fuel oil, electricity, water and other resources for ouroperations. Fuel, gas and power costs constituted approximately 31%, 30% and 32% of our totalproduction cost in 2017, 2016 and 2015, respectively. We rely upon third parties for our supply of theenergy resources consumed in our operations so that prices for and availability of energy resources maybe subject to change or curtailment, due to, among other things, new laws or regulations, imposition ofnew taxes or tariffs, interruptions in production by suppliers, worldwide price levels and marketconditions. Regarding water consumption, although each operation currently has sufficient water rightsto cover its operational demands, the loss of some or all water rights for any of our mines oroperations, in whole or in part, or shortages of water to which we have rights could require us tocurtail or shut down mining production and could prevent us from pursuing expansion opportunities. Inaddition, future shortages of critical parts, equipment and skilled labor could adversely affect ouroperations and development projects.
Our Company is subject to health and safety laws which may restrict our operations, result in operationaldelays or increase our operating costs and adversely affect our financial results of operations.
We are required to comply with occupational health and safety laws and regulations in Peru andMexico where our operations are subject to periodic inspections by the relevant governmental
15
authorities. These laws and regulations govern, among others, health and safety work place conditions,including high risk labor and the handling, storage and disposal of chemical and other hazardoussubstances. We believe our operations are in compliance in all material respects with applicable healthand safety laws and regulations in the countries in which we operate. Compliance with these laws andregulations and new or existing regulations that may be applicable to us in the future could increaseour operating costs and adversely affect our financial results of operations and cash flows.
Our efforts are focused on the health and safety of our workforce in order to consistently improveperformance and compliance through the implementation of occupational health programs, adequatetraining and safety incentives at our operations. Despite the Company’s efforts, we are not exempt fromaccidents. These are reported to Mexican and Peruvian authorities as required. Regarding non-fatalaccidents, in the last three years, the Company’s Dart rate (rate to measure workplace injuries severeenough to warrant Day Away from work, job Restrictions and/or job Transfers) was much lower thanthe MSHA Dart rate (the MSHA Dart rate is published by the U.S.’s Mine Safety and HealthAdministration, and is used as an industry benchmark). In 2017, 2016 and 2015 we had two, six andone fatalities, respectively, in Mexico and Peru. The amounts paid to the Mexican and Peruvianauthorities for reportable accidents did not have an adverse effect on our results. Under Mexican andPeruvian law penalties and fines for safety violations are generally monetary, but in certain cases maylead to the temporary or permanent shutdown of the affected facility or the suspension or revocation ofpermits or licenses. Also, violations of security and safety laws and regulations in our Peruvianoperations can be considered a crime, punishable with a sentence of up to 10 years of prison.
Our metals exploration efforts are highly speculative in nature and may be unsuccessful.
Metals exploration is highly speculative in nature. It involves many risks and is frequentlyunsuccessful. Once mineralization is discovered, it may take a number of years from the initial phasesof drilling until production is possible, during which time the economic feasibility of production maychange. Substantial expenditures are required to establish proven and probable ore reserves throughdrilling, to determine metallurgical processes to extract the metals from the ore and, in the case of newproperties, to construct mining and processing facilities. We cannot assure you that our explorationprograms will result in the expansion or replacement of current production with new proven andprobable ore reserves.
Development projects have no operating history upon which we can base estimates of proven andprobable ore reserves and estimates of future cash operating costs. Estimates are, to a large extent,based upon the interpretation of geological data obtained from drill holes and other samplingtechniques, and feasibility studies that derive estimates of cash operating costs based upon anticipatedtonnage and grades of ore to be mined and processed, the configuration of the ore body, expectedrecovery rates of the mineral from the ore, comparable facility and equipment operating costs,anticipated climatic conditions and other factors. As a result, actual cash operating costs and economicreturns based upon development of proven and probable ore reserves may differ significantly fromthose originally estimated. Moreover, significant decreases in actual or expected prices may meanreserves, once found, will be uneconomical to produce.
We may be adversely affected by challenges relating to slope stability.
Our open-pit mines get deeper as we mine them, presenting certain geotechnical challengesincluding the possibility of slope failure. If we are required to decrease pit slope angles or provideadditional road access to prevent such a failure, our stated reserves could be negatively affected.Furthermore, hydrological conditions relating to pit slopes, renewal of material displaced by slopefailures and increased stripping requirements could also negatively affect our stated reserves. We havetaken actions in order to maintain slope stability, but we cannot assure you that we will not have totake additional action in the future or that our actions taken to date will be sufficient. Unexpected
16
failure or additional requirements to prevent slope failure may negatively affect our results ofoperations and financial condition, as well as have the effect of diminishing our stated ore reserves.
We may be adversely affected by labor disputes.
In the last several years we have experienced a number of strikes or other labor disruptions thathave had an adverse impact on our operations and operating results. As of December 31, 2017, unionsrepresented approximately 71.8% of our workforce. Currently, we have labor agreements in effect forour Mexican and Peruvian operations.
During 2017, the Unified Labor Union of SPCC workers and one of Toquepala’s unions held threeseparate strikes. The Company estimates that the loss of copper production resulting from the 2017strikes was not significant and our sales contracts were not affected.
Our Taxco and San Martin mines in Mexico have been on strike since July 2007. It is expected thatoperations at these mines will remain suspended until these labor issues are resolved.
We cannot assure you when these strikes will be settled, or that in the future we will notexperience strikes or other labor related work stoppages that could have a material adverse effect onour financial condition and results of operations.
Our mining or metal production projects may be subject to additional costs due to community actions andother factors.
In recent years, worldwide mining activity has been pressured by neighboring communities forfinancial commitments to fund social benefit programs and infrastructure improvements. Our projectsin Peru are not exempt from these pressures. Our Tia Maria project in Peru has experienced delayswhile trying to resolve issues with community groups.
It appears that it is becoming a part of the Peruvian mining environment that in order to obtainacceptance from local communities for projects in their localities, demands for substantial investmentsin community infrastructure and upgrades must be met in order to proceed with the mining projects.
We are confident that we will move forward with the Tia Maria project. However, we cannotassure you when and that we will not continue to incur additional costs for community infrastructureand upgrades in order to obtain the approval of current or future mining projects.
Environmental, regulatory response to climate change, and other regulations may increase our costs of doingbusiness, restrict our operations or result in operational delays.
Our exploration, mining, milling, smelting and refining activities are subject to a number ofPeruvian and Mexican laws and regulations, including environmental laws and regulations, and certainindustry technical standards. Additional matters subject to regulation include, but are not limited to,concession fees, transportation, production, water use and discharge, power use and generation, useand storage of explosives, surface rights, housing and other facilities for workers, reclamation, taxation,labor standards, mine safety and occupational health.
Environmental regulations in Peru and Mexico have become increasingly stringent over the lastdecade and we have been required to dedicate more time and money to compliance and remediationactivities. Furthermore, the Mexican authorities have become more rigorous and strict in enforcingMexican environmental laws. We expect additional laws and regulations will be enacted over time withrespect to environmental matters.
Please refer to Note 12 ‘‘Commitments and Contingencies—Environmental matters’’ of ourfinancial statements for further information on this subject.
17
The potential physical impacts of climate change on our operations are highly uncertain, andwould be particular to the geographic location of our facilities. These may include changes in rainfallpatterns, water shortages, changing sea levels, changing storm patterns and intensities, and changingtemperatures. These effects may adversely impact the cost, production and financial performance of ouroperations.
We are aware of fluctuations in weather patterns in the areas where we operate. Aligned withgovernment efforts, we are working in measuring its carbon footprint in order to reduce anycontribution to greenhouse gases generated by our operations. Similarly, we evaluate our waterdemand, as weather changes may result in increase/decrease scenarios that affect our needs.
The development of more stringent environmental protection programs in Peru and Mexico and inrelevant trade agreements could impose constraints and additional costs on our operations requiring usto make significant investments in the future. We cannot assure you that current or future legislative,regulatory or trade developments will not have an adverse effect on our business, properties, operatingresults, financial condition or prospects.
Our mining and metal production projects may subject us to new risks.
Our Company is in the midst of a large expansion program, which may subject us to additionalrisks of industrial accidents. While we believe our contractors employ safety standards and otherprocedures to ensure these projects are completed with proper governance, it is possible that theincreased activity occurring at our sites could cause accidents of an environmental nature or danger tohuman life.
In August 2014, our new SX-EW plant in Mexico had an industrial accident caused by a rock slide,coupled with a construction defect in the seal of a pipe at the new leaching system containment dam,which caused a spill of copper sulfate solution in to the Bacanuchi River, a tributary of the SonoraRiver. As a result of this accident the Company absorbed charges of $126.2 million through 2017. Inaddition, there are a number of collective action lawsuits and civil action lawsuits, filed against theCompany in Mexico´s federal courts and the state courts of Sonora. A number of constitutionallawsuits have also been filed against various governmental authorities and against the Company. Theselawsuits are seeking damages and requesting remedial actions to restore the environment. TheCompany believes that it is not possible to determine the extent of the damages sought and considersthe lawsuits without merit. However the Company cannot offer any assurances that the outcome ofthese lawsuits will not have an adverse effect on the Company.
While this is an unusual event in the Company’s history, we cannot offer assurance that anaccident related to our project development program will not occur again in the future and causeenvironmental damage or damage that causes harm or loss of life.
Our business depends upon information technology systems which may be adversely affected by disruptions,damage, failure and risks associated with implementation and integration.
Our operations depend upon information technology systems which may be subject to disruption,damage or failure from different sources, including, without limitation, installation of malicioussoftware, computer viruses, security breaches, cyber-attacks and defects in design. In recent years,cybersecurity incidents have increased in frequency and include, but are not limited to, malicioussoftware, attempts to gain unauthorized access to data and other electronic security breaches that couldlead to disruptions in systems, unauthorized release of confidential or otherwise protected informationand the corruption of data. We believe that we have implemented appropriate preventative measures tomitigate potential risks by implementing a certified IT service management system with the necessarycontrols that are frequently reviewed and tested, including a risk matrix that considers all the possiblethreats with an impact and probability analysis, actions to avoid or mitigate them and the corresponding
18
testing plan. However, given the unpredictability of the timing, nature and scope of informationtechnology disruptions, we could potentially be subject to manipulation or improper use of our systemsand networks, operational delays, the compromising of confidential or otherwise protected information,destruction or corruption of data, security breaches, financial losses from remedial actions, any of whichcould have a material adverse effect on our cash flows, competitive position, financial condition orresults of operations.
Other risks
Applicable law restricts the payment of dividends from our Minera Mexico subsidiary to us.
Our subsidiary, Minera Mexico, is a Mexican company and, as such, may pay dividends only out ofnet income that has been approved by the shareholders. Shareholders must also approve the actualdividend payment, after mandatory legal reserves have been created and losses for prior fiscal yearshave been satisfied. These legal constraints may limit the ability of Minera Mexico to pay dividends tous, which in turn, may have an impact on our ability to pay stockholder dividends or to service debt.
Global and local market conditions, including the high competitiveness in the copper mining industry, mayadversely affect our profitability.
Our industry is cyclical by nature and fluctuates with economic cycles. Therefore, we are subject tothe risks arising from adverse changes in domestic and global economic and political conditions, such aslower levels of consumer and corporate confidence, decreased business investment, increasedunemployment, reduced income and asset values in many areas, currency volatility and limitedavailability of credit and access to capital. Additionally, we face competition from other copper miningand producing companies around the world; significant competition exists to acquire propertiesproducing or capable of producing copper and other metals as well as consolidation among some ofour main competitors that make them more diversified than we are.
We cannot assure you that changes in market conditions, including competition, will not adverselyaffect us to compete in the future on the basis of price or other factors with companies that maybenefit from future favorable trading or other arrangements.
We are controlled by Grupo Mexico, which exercises control over our affairs and policies and whose interestsmay be different from yours.
At December 31, 2017, Grupo Mexico owned indirectly 88.9% of our capital stock. Certain of ourand Minera Mexico’s officers and directors are also directors and/or officers of Grupo Mexico and/or ofits affiliates. We cannot assure you that the interests of Grupo Mexico will not conflict with ourminority stockholders.
Grupo Mexico has the ability to determine the outcome of substantially all matters submitted for avote to our stockholders and thus exercises control over our business policies and affairs, including thefollowing:
• the composition of our Board of Directors and, as a result, any determinations of our Boardwith respect to our business direction and policy, including the appointment and removal of ourofficers;
• determinations with respect to mergers and other business combinations, including those thatmay result in a change of control;
• whether dividends are paid or other distributions are made and the amount of any dividends orother distributions;
• sales and dispositions of our assets;
19
• the amount of debt financing that we incur; and
• the approval of capital projects.
We cannot assure you that increased financial obligations of Grupo Mexico or AMC resulting fromfinancings or for other reasons will not result in our parent corporations obtaining loans, increaseddividends or other funding from us.
In addition, we have in the past engaged in, and expect to continue to engage in, transactions withGrupo Mexico and its other affiliates which are related party transactions and may present conflicts ofinterest. For additional information regarding the share ownership of, and our relationships with,Grupo Mexico and its affiliates, see Note 16 ‘‘Related Party Transactions.’’
Unanticipated litigation or negative developments in pending litigation or with respect to other contingenciesmay adversely affect our financial condition and results of operations.
We are currently, and may in the future become, subject to litigation, arbitration or other legalproceedings with other parties. If decided adversely to the Company, these legal proceedings, or othersthat could be brought against us in the future, may adversely affect our financial position or prospects.For further detailed discussion of pending litigation, please see Note 12 ‘‘Commitment andContingencies—Litigation matters’’.
International Risks
We are a company with substantial assets located outside of the United States. We conductproduction operations in Peru and Mexico and exploration activities in these countries as well as inChile, Argentina and Ecuador. Accordingly, in addition to the usual risks associated with conductingbusiness in foreign countries, our business may be adversely affected by political, economic and socialuncertainties in each of these countries. Such risks include possible expropriation or nationalization ofproperty, confiscatory taxes or royalties, possible foreign exchange controls, changes in the nationalpolicy toward foreign investors, extreme environmental standards, etc.
Our insurance does not cover most losses caused by the above described risks. Consequently, ourproduction, development and exploration activities in these countries could be substantially affected byfactors out of control, some of which could materially and adversely affect our financial position orresults of operations.
Risks Associated with Doing Business in Peru and Mexico
There is uncertainty as to the termination and renewal of our mining concessions.
Under the laws of Peru and Mexico, mineral resources belong to the state and government andconcessions are required in both countries to explore for or exploit mineral reserves. In Peru, ourmineral rights derive from concessions from Ministry of Energy and Mines (‘‘MINEM’’) for ourexploration, exploitation, extraction and/or production operations. In Mexico, our mineral rights derivefrom concessions granted, on a discretionary basis, by the Ministry of Economy, pursuant to Mexicanmining law and regulations thereunder.
Mining concessions in both Peru and Mexico may be terminated if the obligations of theconcessioner are not satisfied. In Peru, we are obligated to pay certain fees for our mining concession.In Mexico, we are obligated, among other things, to explore or exploit the relevant concession, to payany relevant fees, to comply with all environmental and safety standards, to provide information to theMinistry of Economy and to allow inspections by the Ministry of Economy. Any termination orunfavorable modification of the terms of one or more of our concessions, or failure to obtain renewals
20
of such concessions subject to renewal or extensions, could have a material adverse effect on ourfinancial condition and prospects.
Peruvian economic and political conditions may have an adverse impact on our business.
A significant part of our operations are conducted in Peru. Accordingly, our business, financialcondition or results of operations could be affected by changes in economic or other policies of thePeruvian government or other political, regulatory or economic developments in the country. Duringthe past several decades, Peru has had a succession of regimes with differing policies and programs.Past governments have frequently intervened in the nation’s economy and social structure. Amongother actions, past governments have imposed controls on prices, exchange rates and local and foreigninvestments, as well as limitations on imports, have restricted the ability of companies to dismissemployees and have prohibited the remittance of profits to foreign investors.
In more recent years Peru has had political and social stability. The Peruvian government’seconomic policies reduced inflation and the Peruvian economy has experienced significant growth.
Because we have significant operations in Peru, we cannot provide any assurance that politicaldevelopments and economic conditions in Peru and/or other factors will not have a material adverseeffect on market conditions, prices of our securities, our ability to obtain financing and our results ofoperations and financial condition.
Mexican economic and political conditions, as well as drug-related violence, may have an adverse impact onour business.
The Mexican economy is highly sensitive to economic developments in the United States, mainlybecause of its high level of exports to this market. Gross domestic product grew by 2.3% in 2016, 1.7%in 2017 and is expected to grow 2.3% in 2018. Other risks in Mexico are increases in taxes on themining sector and higher royalties as was enacted in 2013. As has occurred in other metal producingcountries, the mining industry may be perceived as a source of additional fiscal revenue.
In addition, security institutions in Mexico are under significant stress, as a result of drug-relatedviolence. This situation creates potential risks especially for transportation of minerals and finishedproducts, which affect a small part of our production. However, drug-related violence has had a limitedimpact on our operations as it has tended to concentrate outside our areas of production. If this wereto change, the potential risks to our operations might increase.
Because we have significant operations in Mexico, we cannot provide any assurance that politicaldevelopments and economic conditions as well as drug-related violence, in Mexico will not have amaterial adverse effect on market conditions, prices of our securities, on our ability to obtain financing,and on our results of operations and financial condition.
Peruvian inflation and fluctuations in the sol exchange rate may adversely affect our financial condition andresults of operations.
Although the U.S. dollar is our functional currency and our revenues are primarily denominated inU.S. dollars, as we operate in Peru, portions of our operating costs are denominated in Peruvian soles.Accordingly, when inflation or deflation in Peru is not offset by a change in the exchange rate of thesol, our financial position, results of operations, cash flows and the market price of our common stockcould be affected.
Over the past several years, Peru has experienced one of its best economic periods. Inflation in2017, 2016 and 2015 was 1.5%, 3.2% and 4.4%, respectively. The value of the sol has appreciatedagainst the U.S. dollar 3.4% and 1.6% in 2017 and 2016, respectively, and it has depreciated 14.2% in2015. Although the Peruvian government’s economic policy reduced inflation and the economy has
21
experienced significant growth in recent years, we cannot assure you that inflation will not increasefrom its current level or that such growth will continue in the future at similar rates or at all.Additionally a global financial economic crisis, could negatively affect the Peruvian economy.
To manage the volatility related to the risk of currency rate fluctuations, we may enter into forwardexchange contracts. We cannot assure you, however, that currency fluctuations will not have an impacton our financial condition and results of operations.
Mexican inflation, restrictive exchange control policies and fluctuations in the peso exchange rate mayadversely affect our financial condition and results of operations.
Although all of our Mexican operations’ sales of metals are priced and invoiced in U.S. dollars, asubstantial portion of its costs are denominated in pesos. Accordingly, when inflation in Mexicoincreases without a corresponding depreciation of the peso, the net income generated by our Mexicanoperations is adversely affected. The annual inflation rate in Mexico was 6.8% in 2017, 3.4% in 2016and 2.1% in 2015.
At the same time, the peso has been subject in the past to significant volatility, which may nothave been proportionate to the inflation rate and may not be proportionate to the inflation rate in thefuture. The value of the peso relative to the U.S. dollar increased by 4.5% in 2017, and decreased by20.1% in 2016 and 16.9% in 2015.
The Mexican government does not currently restrict the ability of Mexican companies orindividuals to convert pesos into dollars or other currencies. While we do not expect the Mexicangovernment to impose any restriction or exchange control policies in the future, it is an area we closelymonitor. We cannot assure you the Mexican government will maintain its current policies with regardto the peso or that the peso’s value will not fluctuate significantly in the future. The imposition ofexchange control policies could impair Minera Mexico’s ability to obtain imported goods and to meetits U.S. dollar-denominated obligations and could have an adverse effect on our business and financialcondition.
Developments in the United States, Europe and emerging market countries may adversely affect the Companybusiness, our common stock price and our debt securities.
The business and market value of securities of companies with significant operations in Peru andMexico is, to varying degrees, affected by the economic policies and market conditions in theUnited States, Europe and emerging market countries. Although economic policies and conditions insuch countries may significantly differ from economic conditions in Peru or Mexico, as the case may be,the business community reactions to developments in any of these countries may adversely effect theCompany business or the market value or trading price of the securities, including debt securities, ofissuers that have significant operations in Peru or Mexico.
In addition, in recent years economic conditions in Mexico have increasingly become correlated toU.S. economic conditions. Therefore, changes in economic policies and conditions in the United Statescould also have a significant adverse effect on Mexican economic conditions, affecting our business, theprice of our common stock or debt securities. In 2017, the United States, Canada and Mexico began adiscussion leading towards an update of the North American Free Trade Agreement (‘‘NAFTA’’). As ofJanuary 2018, six rounds of discussions have taken place and more than thirty issues are beingdiscussed.
We cannot assure you that the market value or trading prices of our common stock and debtsecurities, will not be adversely affected by events in the United States or elsewhere, including inemerging market countries.
ITEM 1B. UNRESOLVED STAFF COMMENTS
None.
22
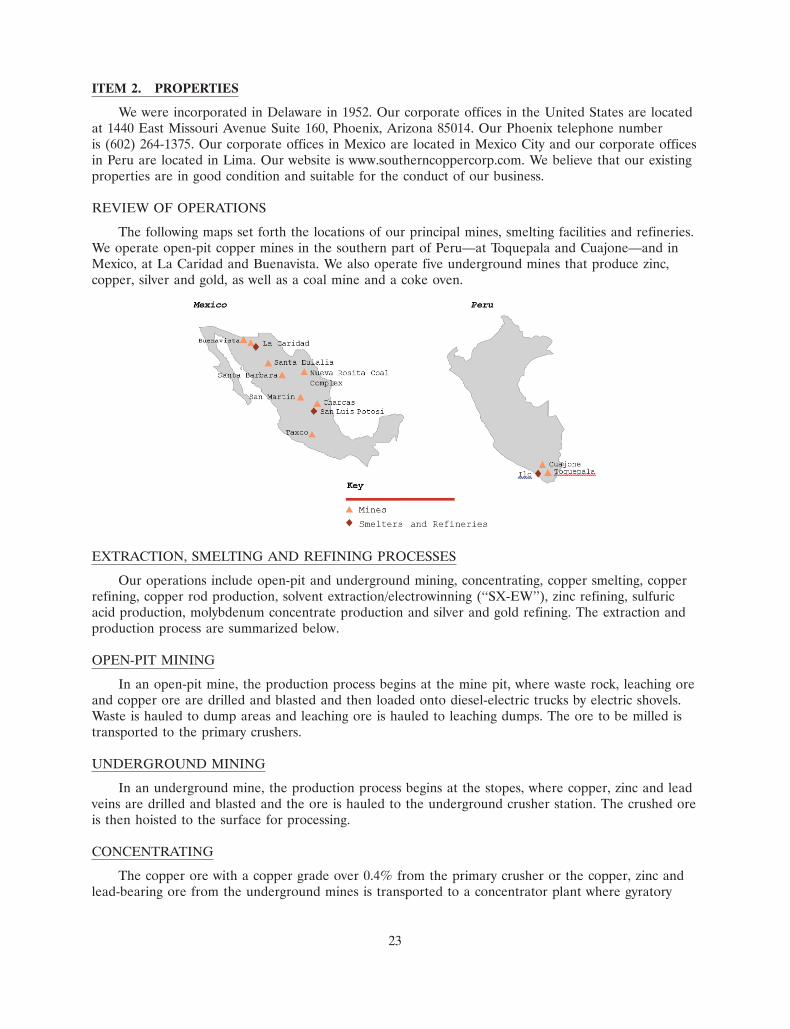
24FEB201809455665
ITEM 2. PROPERTIES
We were incorporated in Delaware in 1952. Our corporate offices in the United States are locatedat 1440 East Missouri Avenue Suite 160, Phoenix, Arizona 85014. Our Phoenix telephone numberis (602) 264-1375. Our corporate offices in Mexico are located in Mexico City and our corporate officesin Peru are located in Lima. Our website is www.southerncoppercorp.com. We believe that our existingproperties are in good condition and suitable for the conduct of our business.
REVIEW OF OPERATIONS
The following maps set forth the locations of our principal mines, smelting facilities and refineries.We operate open-pit copper mines in the southern part of Peru—at Toquepala and Cuajone—and inMexico, at La Caridad and Buenavista. We also operate five underground mines that produce zinc,copper, silver and gold, as well as a coal mine and a coke oven.
EXTRACTION, SMELTING AND REFINING PROCESSES
Our operations include open-pit and underground mining, concentrating, copper smelting, copperrefining, copper rod production, solvent extraction/electrowinning (‘‘SX-EW’’), zinc refining, sulfuricacid production, molybdenum concentrate production and silver and gold refining. The extraction andproduction process are summarized below.
OPEN-PIT MINING
In an open-pit mine, the production process begins at the mine pit, where waste rock, leaching oreand copper ore are drilled and blasted and then loaded onto diesel-electric trucks by electric shovels.Waste is hauled to dump areas and leaching ore is hauled to leaching dumps. The ore to be milled istransported to the primary crushers.
UNDERGROUND MINING
In an underground mine, the production process begins at the stopes, where copper, zinc and leadveins are drilled and blasted and the ore is hauled to the underground crusher station. The crushed oreis then hoisted to the surface for processing.
CONCENTRATING
The copper ore with a copper grade over 0.4% from the primary crusher or the copper, zinc andlead-bearing ore from the underground mines is transported to a concentrator plant where gyratory
23
crushers break the ore into sizes no larger than three-quarter of an inch. The ore is then sent to a millsection where it is ground to the consistency of fine powder. The finely ground ore is mixed with waterand chemical reagents and pumped as a slurry to the flotation separator where it is mixed with certainchemicals. In the flotation separator, reagent solutions and air pumped into the flotation cells cause theminerals to separate from the waste rock and bubble to the surface where they are collected and dried.
If the bulk concentrated copper contains molybdenum, it is first processed in a molybdenum plantas described below under ‘‘Molybdenum Production.’’
COPPER SMELTING
Copper concentrates are transported to a smelter, where they are smelted using a furnace,converter and anode furnace to produce either blister copper (which is in the form of cakes with airpockets) or copper anodes (which are cleaned of air pockets). At the smelter, the concentrates aremixed with flux (a chemical substance intentionally included for high temperature processing) and thensent to reverberatory furnaces producing copper matte and slag (a mixture of iron and otherimpurities). Copper matte contains approximately 65% copper. Copper matte is then sent to theconverters, where the material is oxidized in two steps: (i) the iron sulfides in the matte are oxidizedwith silica, producing slag that is returned to the reverberatory furnaces, and (ii) the copper containedin the matte sulfides is then oxidized to produce copper that, after casting, is called blister copper,containing approximately 98% to 99% copper, or anodes, containing approximately 99.7% copper. Mostof the blister and anode production is sent to the refinery and the remainder is sold to customers.
COPPER REFINING
Anodes are suspended in tanks with a solution containing water, sulfuric acid and copper sulfate.A weak electrical current is passed through the anodes and chemical solution and the dissolved copperis deposited on very thin starting sheets to produce copper cathodes containing approximately 99.99%copper. During this process, silver, gold and other metals (for example, palladium, platinum andselenium), along with other impurities, settle on the bottom of the tank (anodic muds). This anodicmud is processed at a precious metal plant where selenium, silver and gold are recovered.
COPPER ROD PLANT
To produce copper rod, copper cathodes are first smelted in a furnace and then dosified in acasting machine. The dosified copper is then extruded and passed through a cooling system that beginssolidification of copper into a 60�50 millimeter copper bar. The resulting copper bar is graduallystretched in a rolling mill to achieve the desired diameter. The rolled bar is then cooled and sprayedwith wax as a preservation agent and collected into a rod coil that is compacted and sent to market.
SOLVENT EXTRACTION/ELECTROWINNING (‘‘SX-EW’’)
A complementary processing method is the leaching and SX-EW process. During the SX-EWprocess, low-grade sulfides ore and copper oxides are leached with sulfuric acid to allow copper contentrecovery. The acid and copper solution is then agitated with a solvent that contains chemical additivesthat attract copper ions. As the solvent is lighter than water, it floats to the surface carrying with it thecopper content. The solvent is then separated using an acid solution, freeing the copper. The acidsolution containing the copper is then moved to electrolytic extraction tanks to produce coppercathodes.
24
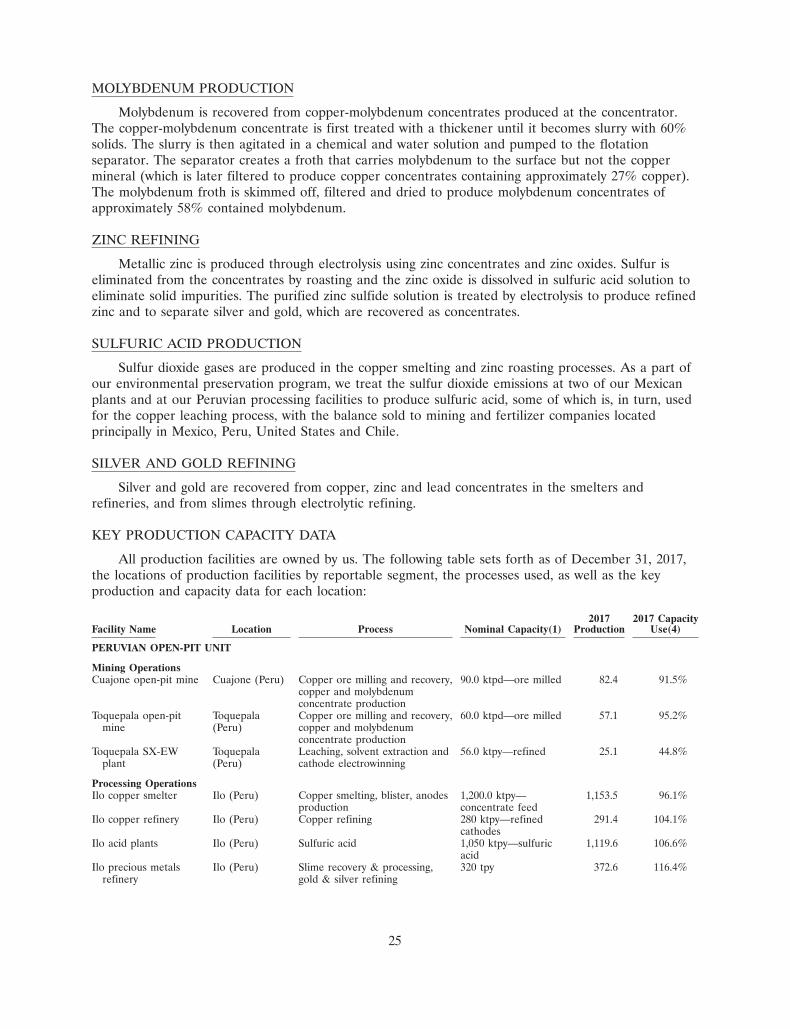
MOLYBDENUM PRODUCTION
Molybdenum is recovered from copper-molybdenum concentrates produced at the concentrator.The copper-molybdenum concentrate is first treated with a thickener until it becomes slurry with 60%solids. The slurry is then agitated in a chemical and water solution and pumped to the flotationseparator. The separator creates a froth that carries molybdenum to the surface but not the coppermineral (which is later filtered to produce copper concentrates containing approximately 27% copper).The molybdenum froth is skimmed off, filtered and dried to produce molybdenum concentrates ofapproximately 58% contained molybdenum.
ZINC REFINING
Metallic zinc is produced through electrolysis using zinc concentrates and zinc oxides. Sulfur iseliminated from the concentrates by roasting and the zinc oxide is dissolved in sulfuric acid solution toeliminate solid impurities. The purified zinc sulfide solution is treated by electrolysis to produce refinedzinc and to separate silver and gold, which are recovered as concentrates.
SULFURIC ACID PRODUCTION
Sulfur dioxide gases are produced in the copper smelting and zinc roasting processes. As a part ofour environmental preservation program, we treat the sulfur dioxide emissions at two of our Mexicanplants and at our Peruvian processing facilities to produce sulfuric acid, some of which is, in turn, usedfor the copper leaching process, with the balance sold to mining and fertilizer companies locatedprincipally in Mexico, Peru, United States and Chile.
SILVER AND GOLD REFINING
Silver and gold are recovered from copper, zinc and lead concentrates in the smelters andrefineries, and from slimes through electrolytic refining.
KEY PRODUCTION CAPACITY DATA
All production facilities are owned by us. The following table sets forth as of December 31, 2017,the locations of production facilities by reportable segment, the processes used, as well as the keyproduction and capacity data for each location:
2017 2017 CapacityFacility Name Location Process Nominal Capacity(1) Production Use(4)
PERUVIAN OPEN-PIT UNIT
Mining OperationsCuajone open-pit mine Cuajone (Peru) Copper ore milling and recovery, 90.0 ktpd—ore milled 82.4 91.5%
copper and molybdenumconcentrate production
Toquepala open-pit Toquepala Copper ore milling and recovery, 60.0 ktpd—ore milled 57.1 95.2%mine (Peru) copper and molybdenum
concentrate productionToquepala SX-EW Toquepala Leaching, solvent extraction and 56.0 ktpy—refined 25.1 44.8%
plant (Peru) cathode electrowinning
Processing OperationsIlo copper smelter Ilo (Peru) Copper smelting, blister, anodes 1,200.0 ktpy— 1,153.5 96.1%
production concentrate feedIlo copper refinery Ilo (Peru) Copper refining 280 ktpy—refined 291.4 104.1%
cathodesIlo acid plants Ilo (Peru) Sulfuric acid 1,050 ktpy—sulfuric 1,119.6 106.6%
acidIlo precious metals Ilo (Peru) Slime recovery & processing, 320 tpy 372.6 116.4%
refinery gold & silver refining
25
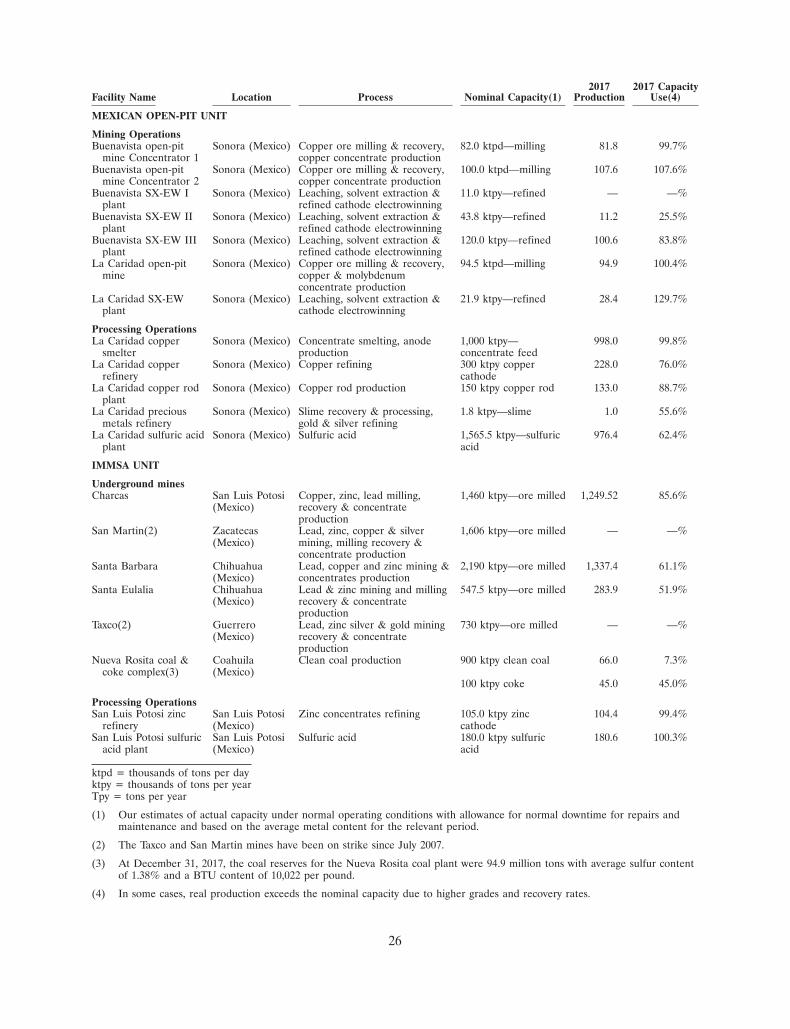
2017 2017 CapacityFacility Name Location Process Nominal Capacity(1) Production Use(4)
MEXICAN OPEN-PIT UNIT
Mining OperationsBuenavista open-pit Sonora (Mexico) Copper ore milling & recovery, 82.0 ktpd—milling 81.8 99.7%
mine Concentrator 1 copper concentrate productionBuenavista open-pit Sonora (Mexico) Copper ore milling & recovery, 100.0 ktpd—milling 107.6 107.6%
mine Concentrator 2 copper concentrate productionBuenavista SX-EW I Sonora (Mexico) Leaching, solvent extraction & 11.0 ktpy—refined — —%
plant refined cathode electrowinningBuenavista SX-EW II Sonora (Mexico) Leaching, solvent extraction & 43.8 ktpy—refined 11.2 25.5%
plant refined cathode electrowinningBuenavista SX-EW III Sonora (Mexico) Leaching, solvent extraction & 120.0 ktpy—refined 100.6 83.8%
plant refined cathode electrowinningLa Caridad open-pit Sonora (Mexico) Copper ore milling & recovery, 94.5 ktpd—milling 94.9 100.4%
mine copper & molybdenumconcentrate production
La Caridad SX-EW Sonora (Mexico) Leaching, solvent extraction & 21.9 ktpy—refined 28.4 129.7%plant cathode electrowinning
Processing OperationsLa Caridad copper Sonora (Mexico) Concentrate smelting, anode 1,000 ktpy— 998.0 99.8%
smelter production concentrate feedLa Caridad copper Sonora (Mexico) Copper refining 300 ktpy copper 228.0 76.0%
refinery cathodeLa Caridad copper rod Sonora (Mexico) Copper rod production 150 ktpy copper rod 133.0 88.7%
plantLa Caridad precious Sonora (Mexico) Slime recovery & processing, 1.8 ktpy—slime 1.0 55.6%
metals refinery gold & silver refiningLa Caridad sulfuric acid Sonora (Mexico) Sulfuric acid 1,565.5 ktpy—sulfuric 976.4 62.4%
plant acid
IMMSA UNIT
Underground minesCharcas San Luis Potosi Copper, zinc, lead milling, 1,460 ktpy—ore milled 1,249.52 85.6%
(Mexico) recovery & concentrateproduction
San Martin(2) Zacatecas Lead, zinc, copper & silver 1,606 ktpy—ore milled — —%(Mexico) mining, milling recovery &
concentrate productionSanta Barbara Chihuahua Lead, copper and zinc mining & 2,190 ktpy—ore milled 1,337.4 61.1%
(Mexico) concentrates productionSanta Eulalia Chihuahua Lead & zinc mining and milling 547.5 ktpy—ore milled 283.9 51.9%
(Mexico) recovery & concentrateproduction
Taxco(2) Guerrero Lead, zinc silver & gold mining 730 ktpy—ore milled — —%(Mexico) recovery & concentrate
productionNueva Rosita coal & Coahuila Clean coal production 900 ktpy clean coal 66.0 7.3%
coke complex(3) (Mexico)100 ktpy coke 45.0 45.0%
Processing OperationsSan Luis Potosi zinc San Luis Potosi Zinc concentrates refining 105.0 ktpy zinc 104.4 99.4%
refinery (Mexico) cathodeSan Luis Potosi sulfuric San Luis Potosi Sulfuric acid 180.0 ktpy sulfuric 180.6 100.3%
acid plant (Mexico) acid
ktpd = thousands of tons per dayktpy = thousands of tons per yearTpy = tons per year
(1) Our estimates of actual capacity under normal operating conditions with allowance for normal downtime for repairs andmaintenance and based on the average metal content for the relevant period.
(2) The Taxco and San Martin mines have been on strike since July 2007.
(3) At December 31, 2017, the coal reserves for the Nueva Rosita coal plant were 94.9 million tons with average sulfur contentof 1.38% and a BTU content of 10,022 per pound.
(4) In some cases, real production exceeds the nominal capacity due to higher grades and recovery rates.
26
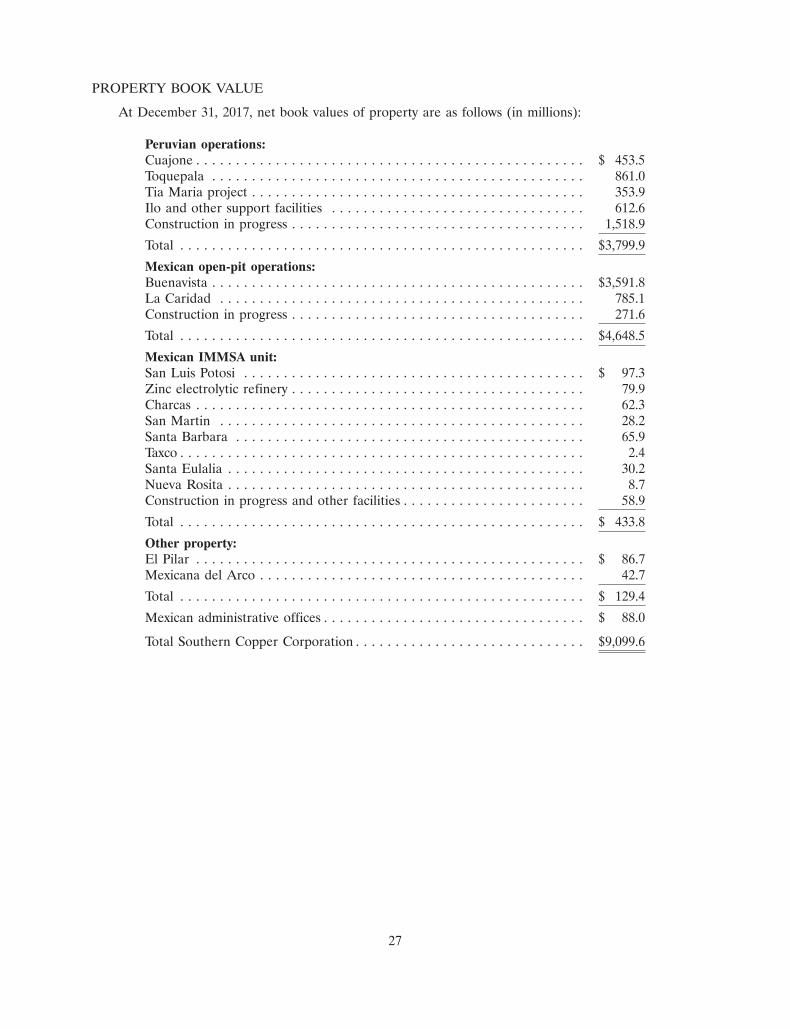
PROPERTY BOOK VALUE
At December 31, 2017, net book values of property are as follows (in millions):
Peruvian operations:Cuajone . . . . . . . . . . . . . . . . . . . . . . . . . . . . . . . . . . . . . . . . . . . . . . . . . $ 453.5Toquepala . . . . . . . . . . . . . . . . . . . . . . . . . . . . . . . . . . . . . . . . . . . . . . . 861.0Tia Maria project . . . . . . . . . . . . . . . . . . . . . . . . . . . . . . . . . . . . . . . . . . 353.9Ilo and other support facilities . . . . . . . . . . . . . . . . . . . . . . . . . . . . . . . . 612.6Construction in progress . . . . . . . . . . . . . . . . . . . . . . . . . . . . . . . . . . . . . 1,518.9
Total . . . . . . . . . . . . . . . . . . . . . . . . . . . . . . . . . . . . . . . . . . . . . . . . . . . $3,799.9
Mexican open-pit operations:Buenavista . . . . . . . . . . . . . . . . . . . . . . . . . . . . . . . . . . . . . . . . . . . . . . . $3,591.8La Caridad . . . . . . . . . . . . . . . . . . . . . . . . . . . . . . . . . . . . . . . . . . . . . . 785.1Construction in progress . . . . . . . . . . . . . . . . . . . . . . . . . . . . . . . . . . . . . 271.6
Total . . . . . . . . . . . . . . . . . . . . . . . . . . . . . . . . . . . . . . . . . . . . . . . . . . . $4,648.5
Mexican IMMSA unit:San Luis Potosi . . . . . . . . . . . . . . . . . . . . . . . . . . . . . . . . . . . . . . . . . . . $ 97.3Zinc electrolytic refinery . . . . . . . . . . . . . . . . . . . . . . . . . . . . . . . . . . . . . 79.9Charcas . . . . . . . . . . . . . . . . . . . . . . . . . . . . . . . . . . . . . . . . . . . . . . . . . 62.3San Martin . . . . . . . . . . . . . . . . . . . . . . . . . . . . . . . . . . . . . . . . . . . . . . 28.2Santa Barbara . . . . . . . . . . . . . . . . . . . . . . . . . . . . . . . . . . . . . . . . . . . . 65.9Taxco . . . . . . . . . . . . . . . . . . . . . . . . . . . . . . . . . . . . . . . . . . . . . . . . . . . 2.4Santa Eulalia . . . . . . . . . . . . . . . . . . . . . . . . . . . . . . . . . . . . . . . . . . . . . 30.2Nueva Rosita . . . . . . . . . . . . . . . . . . . . . . . . . . . . . . . . . . . . . . . . . . . . . 8.7Construction in progress and other facilities . . . . . . . . . . . . . . . . . . . . . . . 58.9
Total . . . . . . . . . . . . . . . . . . . . . . . . . . . . . . . . . . . . . . . . . . . . . . . . . . . $ 433.8
Other property:El Pilar . . . . . . . . . . . . . . . . . . . . . . . . . . . . . . . . . . . . . . . . . . . . . . . . . $ 86.7Mexicana del Arco . . . . . . . . . . . . . . . . . . . . . . . . . . . . . . . . . . . . . . . . . 42.7
Total . . . . . . . . . . . . . . . . . . . . . . . . . . . . . . . . . . . . . . . . . . . . . . . . . . . $ 129.4
Mexican administrative offices . . . . . . . . . . . . . . . . . . . . . . . . . . . . . . . . . $ 88.0
Total Southern Copper Corporation . . . . . . . . . . . . . . . . . . . . . . . . . . . . . $9,099.6
27
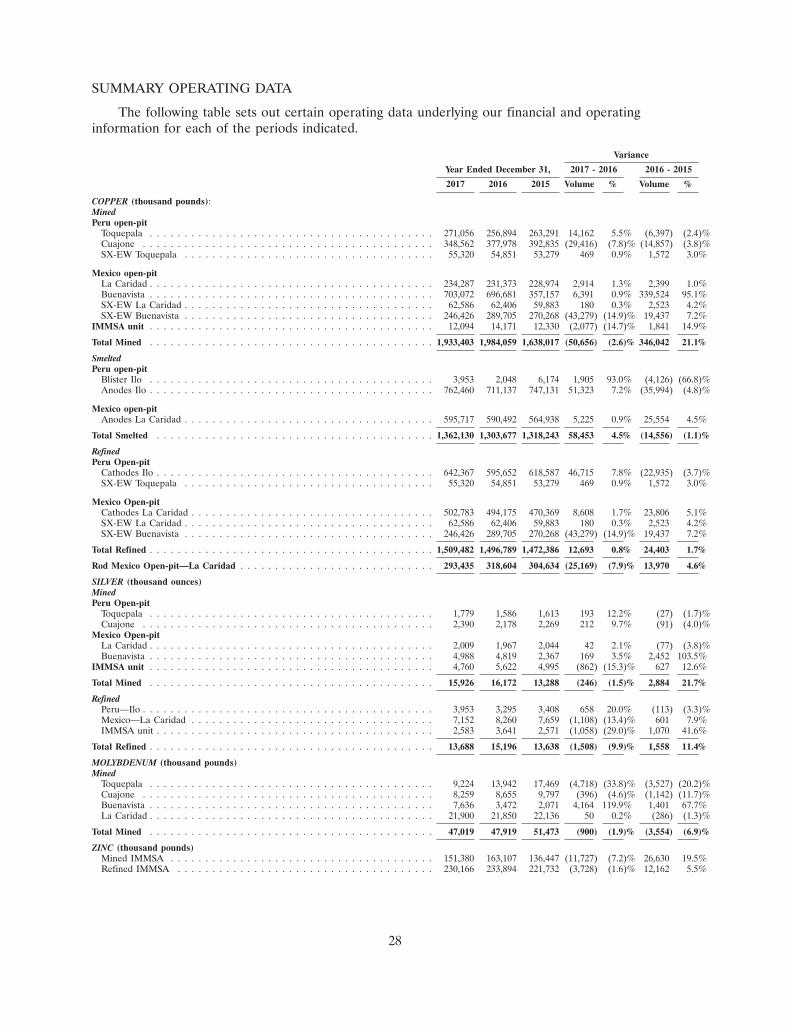
SUMMARY OPERATING DATA
The following table sets out certain operating data underlying our financial and operatinginformation for each of the periods indicated.
Variance
2017 - 2016 2016 - 2015Year Ended December 31,
2017 2016 2015 Volume % Volume %
COPPER (thousand pounds):MinedPeru open-pit
Toquepala . . . . . . . . . . . . . . . . . . . . . . . . . . . . . . . . . . . . . . . . . 271,056 256,894 263,291 14,162 5.5% (6,397) (2.4)%Cuajone . . . . . . . . . . . . . . . . . . . . . . . . . . . . . . . . . . . . . . . . . . 348,562 377,978 392,835 (29,416) (7.8)% (14,857) (3.8)%SX-EW Toquepala . . . . . . . . . . . . . . . . . . . . . . . . . . . . . . . . . . . . 55,320 54,851 53,279 469 0.9% 1,572 3.0%
Mexico open-pitLa Caridad . . . . . . . . . . . . . . . . . . . . . . . . . . . . . . . . . . . . . . . . . 234,287 231,373 228,974 2,914 1.3% 2,399 1.0%Buenavista . . . . . . . . . . . . . . . . . . . . . . . . . . . . . . . . . . . . . . . . . 703,072 696,681 357,157 6,391 0.9% 339,524 95.1%SX-EW La Caridad . . . . . . . . . . . . . . . . . . . . . . . . . . . . . . . . . . . . 62,586 62,406 59,883 180 0.3% 2,523 4.2%SX-EW Buenavista . . . . . . . . . . . . . . . . . . . . . . . . . . . . . . . . . . . . 246,426 289,705 270,268 (43,279) (14.9)% 19,437 7.2%
IMMSA unit . . . . . . . . . . . . . . . . . . . . . . . . . . . . . . . . . . . . . . . . . 12,094 14,171 12,330 (2,077) (14.7)% 1,841 14.9%
Total Mined . . . . . . . . . . . . . . . . . . . . . . . . . . . . . . . . . . . . . . . . . 1,933,403 1,984,059 1,638,017 (50,656) (2.6)% 346,042 21.1%
SmeltedPeru open-pit
Blister Ilo . . . . . . . . . . . . . . . . . . . . . . . . . . . . . . . . . . . . . . . . . 3,953 2,048 6,174 1,905 93.0% (4,126) (66.8)%Anodes Ilo . . . . . . . . . . . . . . . . . . . . . . . . . . . . . . . . . . . . . . . . . 762,460 711,137 747,131 51,323 7.2% (35,994) (4.8)%
Mexico open-pitAnodes La Caridad . . . . . . . . . . . . . . . . . . . . . . . . . . . . . . . . . . . . 595,717 590,492 564,938 5,225 0.9% 25,554 4.5%
Total Smelted . . . . . . . . . . . . . . . . . . . . . . . . . . . . . . . . . . . . . . . . 1,362,130 1,303,677 1,318,243 58,453 4.5% (14,556) (1.1)%
RefinedPeru Open-pit
Cathodes Ilo . . . . . . . . . . . . . . . . . . . . . . . . . . . . . . . . . . . . . . . . 642,367 595,652 618,587 46,715 7.8% (22,935) (3.7)%SX-EW Toquepala . . . . . . . . . . . . . . . . . . . . . . . . . . . . . . . . . . . . 55,320 54,851 53,279 469 0.9% 1,572 3.0%
Mexico Open-pitCathodes La Caridad . . . . . . . . . . . . . . . . . . . . . . . . . . . . . . . . . . . 502,783 494,175 470,369 8,608 1.7% 23,806 5.1%SX-EW La Caridad . . . . . . . . . . . . . . . . . . . . . . . . . . . . . . . . . . . . 62,586 62,406 59,883 180 0.3% 2,523 4.2%SX-EW Buenavista . . . . . . . . . . . . . . . . . . . . . . . . . . . . . . . . . . . . 246,426 289,705 270,268 (43,279) (14.9)% 19,437 7.2%
Total Refined . . . . . . . . . . . . . . . . . . . . . . . . . . . . . . . . . . . . . . . . . 1,509,482 1,496,789 1,472,386 12,693 0.8% 24,403 1.7%
Rod Mexico Open-pit—La Caridad . . . . . . . . . . . . . . . . . . . . . . . . . . . . 293,435 318,604 304,634 (25,169) (7.9)% 13,970 4.6%
SILVER (thousand ounces)MinedPeru Open-pit
Toquepala . . . . . . . . . . . . . . . . . . . . . . . . . . . . . . . . . . . . . . . . . 1,779 1,586 1,613 193 12.2% (27) (1.7)%Cuajone . . . . . . . . . . . . . . . . . . . . . . . . . . . . . . . . . . . . . . . . . . 2,390 2,178 2,269 212 9.7% (91) (4.0)%
Mexico Open-pitLa Caridad . . . . . . . . . . . . . . . . . . . . . . . . . . . . . . . . . . . . . . . . . 2,009 1,967 2,044 42 2.1% (77) (3.8)%Buenavista . . . . . . . . . . . . . . . . . . . . . . . . . . . . . . . . . . . . . . . . . 4,988 4,819 2,367 169 3.5% 2,452 103.5%
IMMSA unit . . . . . . . . . . . . . . . . . . . . . . . . . . . . . . . . . . . . . . . . . 4,760 5,622 4,995 (862) (15.3)% 627 12.6%
Total Mined . . . . . . . . . . . . . . . . . . . . . . . . . . . . . . . . . . . . . . . . . 15,926 16,172 13,288 (246) (1.5)% 2,884 21.7%
RefinedPeru—Ilo . . . . . . . . . . . . . . . . . . . . . . . . . . . . . . . . . . . . . . . . . . 3,953 3,295 3,408 658 20.0% (113) (3.3)%Mexico—La Caridad . . . . . . . . . . . . . . . . . . . . . . . . . . . . . . . . . . . 7,152 8,260 7,659 (1,108) (13.4)% 601 7.9%IMMSA unit . . . . . . . . . . . . . . . . . . . . . . . . . . . . . . . . . . . . . . . . 2,583 3,641 2,571 (1,058) (29.0)% 1,070 41.6%
Total Refined . . . . . . . . . . . . . . . . . . . . . . . . . . . . . . . . . . . . . . . . . 13,688 15,196 13,638 (1,508) (9.9)% 1,558 11.4%
MOLYBDENUM (thousand pounds)Mined
Toquepala . . . . . . . . . . . . . . . . . . . . . . . . . . . . . . . . . . . . . . . . . 9,224 13,942 17,469 (4,718) (33.8)% (3,527) (20.2)%Cuajone . . . . . . . . . . . . . . . . . . . . . . . . . . . . . . . . . . . . . . . . . . 8,259 8,655 9,797 (396) (4.6)% (1,142) (11.7)%Buenavista . . . . . . . . . . . . . . . . . . . . . . . . . . . . . . . . . . . . . . . . . 7,636 3,472 2,071 4,164 119.9% 1,401 67.7%La Caridad . . . . . . . . . . . . . . . . . . . . . . . . . . . . . . . . . . . . . . . . . 21,900 21,850 22,136 50 0.2% (286) (1.3)%
Total Mined . . . . . . . . . . . . . . . . . . . . . . . . . . . . . . . . . . . . . . . . . 47,019 47,919 51,473 (900) (1.9)% (3,554) (6.9)%
ZINC (thousand pounds)Mined IMMSA . . . . . . . . . . . . . . . . . . . . . . . . . . . . . . . . . . . . . . 151,380 163,107 136,447 (11,727) (7.2)% 26,630 19.5%Refined IMMSA . . . . . . . . . . . . . . . . . . . . . . . . . . . . . . . . . . . . . 230,166 233,894 221,732 (3,728) (1.6)% 12,162 5.5%
28
SLOPE STABILITY:
Peruvian Operations
The Toquepala and Cuajone pits are approximately 825 meters and 930 meters deep, respectively.Under the present mine plan configuration the Toquepala pit will reach a depth of 1,635 meters andthe Cuajone pit will reach a depth of 1,290 meters. The deepening pits present us with a number ofgeotechnical challenges. Perhaps the foremost concern is the possibility of slope failure, a possibilitythat all open-pit mines face. In the past, in order to maintain slope stability, we have decreased pitslope angles, installed additional or duplicate haul road access, and increased stripping requirements.We have also responded to hydrological conditions and removed material displaced by slope failures. Tomeet the geotechnical challenges relating to slope stability of the open-pit mines, we have taken thefollowing steps:
In the late 1990s, we hosted round table meetings in Vancouver, B.C. with a group of recognizedslope stability and open-pit mining specialists. The agenda for these meetings was principally a reviewof pit design for mines with greater than 700 meter depth. The discussions included practices formonitoring, data collection and blasting processes.
Based on the concepts defined at the Vancouver meetings, we initiated slope stability studies todefine the mining of reserves by optimum design. These studies were performed by outside consultantsand included slope stability appraisals, evaluation of the numerical modeling, slope performance andinter-ramp angle design and evaluation of hydrological conditions.
The studies were completed in 2000 and we believe we implemented the study recommendations.One of the major changes implemented was slope angle reduction at both mines, at Toquepala by anaverage of five degrees and at Cuajone by an average of seven degrees. Although this increased thewaste included in the mineable reserve calculation, it also improved the stability of the pits.
Since 1998, a wall depressurization program has been in place in both pits. This consists of ahorizontal drilling program, which improves drainage thereby reducing saturation and increasing wallstability. Additionally, a new blasting control program was put in place, implementing vibrationmonitoring and blasting designs of low punctual energy and pre-split techniques. Also a new slopemonitoring system was implemented using reflection prisms, deformation inclinometers and piezometersfor water level control, as well as real-time robotic monitoring equipment.
Toquepala:
In 2007, we installed 20 meter wide geotechnical berms every 10 benches at the Toquepala mine.We believe this will further strengthen the stability of the Toquepala pit. In October 2012, twointerferometric radars were put in place to monitor slope stability at the Toquepala mine, and inSeptember 2013, new full monitoring software (FMS360) was installed. These systems improve thereliability of instrumentation, the information quality for assessing the behavior of the slopes andanticipates the risks of instability.
In 2013, a mining consulting group began a study of dump stability at the Toquepala mine. Thisstudy assessed the current stability of the dumps and is developing a geotechnical campaign to obtaininformation to assess the stability of the future and final stages of the dumps. In 2016, the stabilitystudy was resumed by executing geophysical test and test pits for the characterization of the dumps.The execution of sonic perforations and complementary geophysical tests are currently pending. OnDecember 2016, the consultants also presented the report ‘‘Slope Stability Analysis in Deposits of Wasteand Leachable Material’’.
In 2016, the mining consultants presented the final report ‘‘Physical Stability of the QuebradaHonda tailings dam’’. This study consisted in the development of geotechnical investigations, static,
29
seismic and post-seismic stability analysis, filtration analysis, deformation analysis, liquefaction potentialanalysis and dynamic analysis.
In 2016, as part of the slope stability upgrade study, a geotechnical and hydrological oriented drillprogram of 3,470 meters was executed at the Toquepala mine. This program was conducted in order tocomplement the study and to get a better understanding of the behavior of the rock mass. Thegeotechnical drilling program involved 11 diamond drill holes, six geotechnical drills and fivehydrogeological drills, all of them with geological and geotechnical logging. During the execution ofthese hydrogeological drills, permeability tests in the rock were executed as well as slug tests andconstant load tests. Additionally, instrumentation was implemented with five vibrating wire piezometersfor the monitoring of water table and to give support to the hydrogeological model. Also in 2016, theexternal mining consultants began the report for phase three of this study, which was concluded in2017. They submitted and updated the block models of inter-ramp angles, the model of rock mass, thehydrogeological model and the 3D structural model. In addition, fieldwork continued on the ‘‘SlopeStability Analysis in Deposits of Waste and Leachable Material’’ study by executing geophysical tests,sampling and laboratory tests of soil mechanics. In recent years, we have destined efforts for thedevelopment of stability studies of slopes of the pit, dumps and leachable deposits and tailings; thusguaranteeing the safety of personnel and equipment, the continuity of the operations, and complyingwith Peruvian regulations.
Cuajone:
At the Cuajone mine, in 2007 in order to minimize the damage to the slopes caused by productionblast vibrations, blasting control using three pre-split drills was implemented. Also, the slope monitoringsystem with reflection prisms has been replaced by a system using slope monitoring radar. In February2012, the first radar equipment was put in service followed in August 2013 with the second radarinstallation and a geotechnical surveillance camera was added. This system improved the reliability andcontinuity of monitoring, improved the quality of information used to evaluate the performance of theslopes and helped better anticipate the risk of instability. The sub-surface deformation and the waterlevel are still monitored with inclinometers and piezometers. In September 2012, we completed aprogram of oriented geotechnical drilling totaling 17,938 meters, and in May 2013 we completed aprogram of vertical geotechnical drilling totaling 2,814 meters, with hydraulic tests performed on rockand subsequently instrumented with inclinometers/piezometers. The geotechnical and hydraulicinformation obtained from the two programs will be used in the development of a geotechnical studyfor the new 15 year mine development plan (2015-2029). Also during 2013, we drilled 772 meters ofsub-horizontal holes in order to drain the east slope of the pit. The geotechnical study for the new15-year mine development plan was completed at the end of 2015 and the result of this study is theincrease by an average of three degrees of the inter ramp angle and include 40 meters widegeotechnical berms for inter ramp heights above 150 meters. This study also contains recommendationsfor improving the stability of the pit slopes.
In 2013, the Board of Directors approved a project to improve slope stability at the south area ofthe Cuajone mine, which will remove approximately 148 million tons of waste material in order toimprove the mine design without reducing our actual production level. As of December 31, 2017,86.8 million tons of waste material have been removed. For further information see Item 7‘‘Management Discussion and Analysis—Capital Investment Program.’’
In 2017, we installed three vibration monitoring stations and ten digital extensometers to monitorsurface deformations on waste dumps in real time. We also completed the detailed engineering for theconstruction of the coronation channel in the west Torata waste dump.
To increase the possibility of mining in the event of a slide, we have provided for two extractionramps for each open-pit mine. While these measures cannot guarantee that a slope failure will not
30
occur, we believe that our mining practices are sound and that the steps taken and the ongoing reviewsperformed are a prudent methodology for open-pit mining.
Mexican operations
In 2004, our 15-year mine plan study for the La Caridad mine was awarded to an independentconsulting firm to conduct a geotechnical evaluation. The purpose of the plan was to develop aprogram of optimum bench design and inter-ramp slope angles for the open-pit. The results of theevaluation presented by the consultants included a recommendation of a maximum average bench faceangle of 72 degrees. Additionally, single benching was recommended for the upper sections of the west,south and east walls of the main pit. Likewise, double benching was recommended for the lower levelsof the main pit and single benching for the upper slope segments that consist of either alluvial material,mine waste dumps or mineralized stockpile material. Alternatively, slopes in these types of materials,may be designed with an overall 37 degree slope. The geostructural and geotechnical parametersrecommended were applied in the pit design for the new life of the mine plan for La Caridad mineprepared in 2015. This mine plan replaced the 15-year mine plan prepared in 2010. However, sincefinal pit limits have not been yet established at La Caridad, all current pit walls are effectively workingslopes. Geostructural and geotechnical data collected at the open-pit mine from cell-mapping andoriented-core drilling databases provided the basis for the geotechnical evaluation andrecommendations. We continue to collect new information related to geotechnical data and othergeology features from the mine pit and diamond drill hole, in order to ensure the structural securityand also to improve the geotechnical data base for future studies.
At the Buenavista mine, we are following the recommendations of a geotechnical evaluation ofdesign slope for the 15-year pit plan. This evaluation was prepared by an independent mine consultingfirm. This evaluation included the determination of optimum pit slope design angles and bench designparameters for the proposed mine plan. The objective of the study was: (1) to determine optimuminter-ramp slope angles and bench design parameters for the 15-year plan and (2) to identify andanalyze any potential major instability that could adversely impact mine operation. In 2012, we installeda radar system to monitor the walls of the mine.
The following recommendations were made for the Buenavista mine: inter-ramp slope designangles for the 15-year pit plan, for all of the 21 design sectors, defined on a rock-fabric-based catchbench analysis, using double bench, can range from 48� and 55�, and the inter-ramp slope angles arebased on geometries that resulted from the back-break analysis using 80% reliability of achieving therequired 7.5 meter catch bench width for a single bench configuration and 10.6 meter catch benchwidth for a double bench configuration. Preliminary observations suggest the 15-year pit walls may berelative free-draining, the back-break analysis assumed depressurized conditions of mine benches, andthe inter-ramp stability analysis were performed for both, saturated and depressurized conditions.
A pit dewatering/depressurization plan for the Buenavista mine was also recommended to addressthe issues of open-pit drainage, dewatering plan and future slope depressurization. Phase I of thegeohydrological study was completed by an independent consultant. The analysis included a preliminaryassessment and work plan implementations.
In 2011, five wells for extraction and monitoring were drilled close to the mine. Also, we began adrilling program to monitor possible water filtration beyond the limits of the open-pit mine. All theinformation obtained from these well drilling programs has been analyzed and included in thehydrologic model. The open-pit dewatering program from the bottom benches also continued during2012 with a drilling program of 3,797 meters in several monitoring wells in order to allow us tocontinue with the current mining plan.
In 2013, Buenavista continued the drilling program monitoring the extraction wells in the area ofIncrement (Phase) five of the mine and beyond the current limits of the open pit mine.
31
During 2013, the program to dewater the Buenavista pit bottom was continued in accordance withthe short and medium term mine plans. Pumping from sumps located in Increment five, permittedmining of high grade copper blocks. Concurrent with this operational task, a geophysical study wasconducted to determine the best locations for water extraction wells to control the inflow of water tothe pit bottom and thus allow us to continue our mining operations. The water extracted is being usedfor various purposes, including road irrigation for dust mitigation. The geophysical investigation alsopermitted the location of underground workings and the filtration and seepage through fractures.
A total of 7,339 meters were drilled during 2013 for 30 extraction wells, three of these wells arelocated in the area of Increment (Phase) five. The rest were drilled at various locations outside of thecurrent open pit mine limit.
In 2014, we continued collecting new geotechnical information from two exploration drillingprojects; this data is available to analyze the geotechnical data base for new studies in accordance withslope angle for the open pit excavations. In the free face benches at the open pit mine operations, thecell-mapping were prepared to increment the geotechnical data base. Following the recommendationsof geotechnical evaluation we continued monitoring the walls using the radar system.
Various studies are now being conducted by outside specialized consultants in order to establishlong-range mine water management objectives and to implement recommendations for the efficient useof this resource.
METAL PRODUCTION BY SEGMENTS
Set forth below are descriptions of the operations and other information relating to the operationsincluded in each of our three segments.
PERUVIAN OPERATIONS
Our Peruvian segment operations include the Cuajone and Toquepala mine complexes and thesmelting and refining plants, industrial railroad which links Ilo, Toquepala and Cuajone and the portfacilities.
32
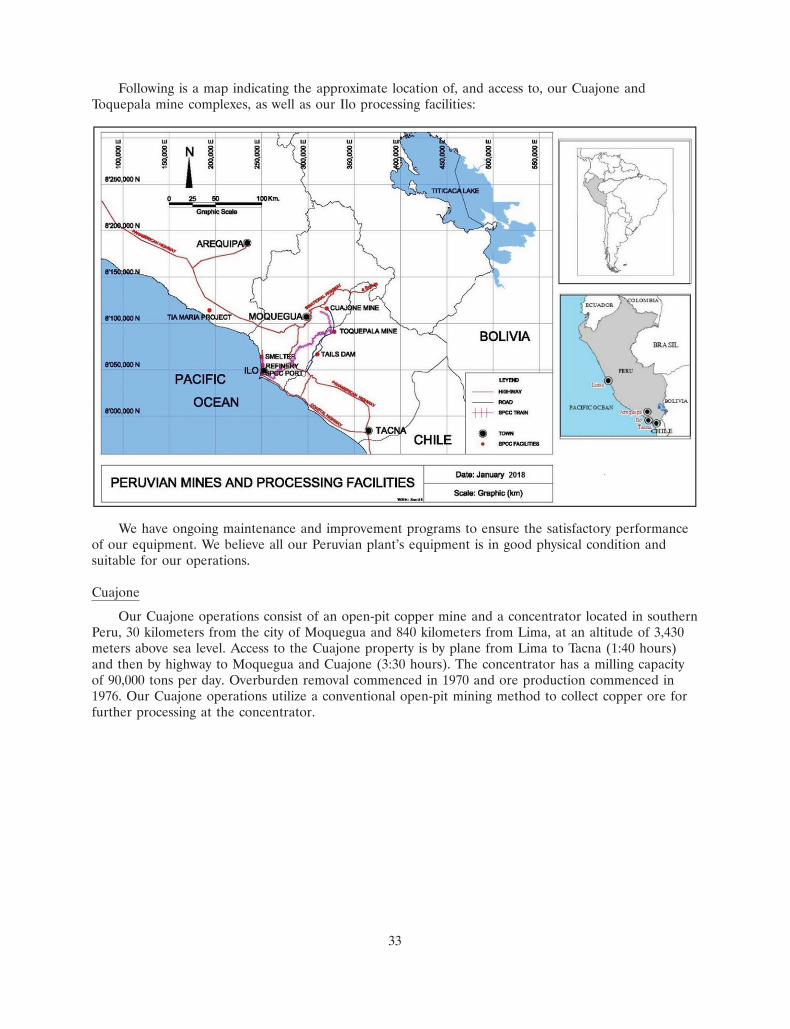
24FEB201809455349
Following is a map indicating the approximate location of, and access to, our Cuajone andToquepala mine complexes, as well as our Ilo processing facilities:
We have ongoing maintenance and improvement programs to ensure the satisfactory performanceof our equipment. We believe all our Peruvian plant’s equipment is in good physical condition andsuitable for our operations.
Cuajone
Our Cuajone operations consist of an open-pit copper mine and a concentrator located in southernPeru, 30 kilometers from the city of Moquegua and 840 kilometers from Lima, at an altitude of 3,430meters above sea level. Access to the Cuajone property is by plane from Lima to Tacna (1:40 hours)and then by highway to Moquegua and Cuajone (3:30 hours). The concentrator has a milling capacityof 90,000 tons per day. Overburden removal commenced in 1970 and ore production commenced in1976. Our Cuajone operations utilize a conventional open-pit mining method to collect copper ore forfurther processing at the concentrator.
33
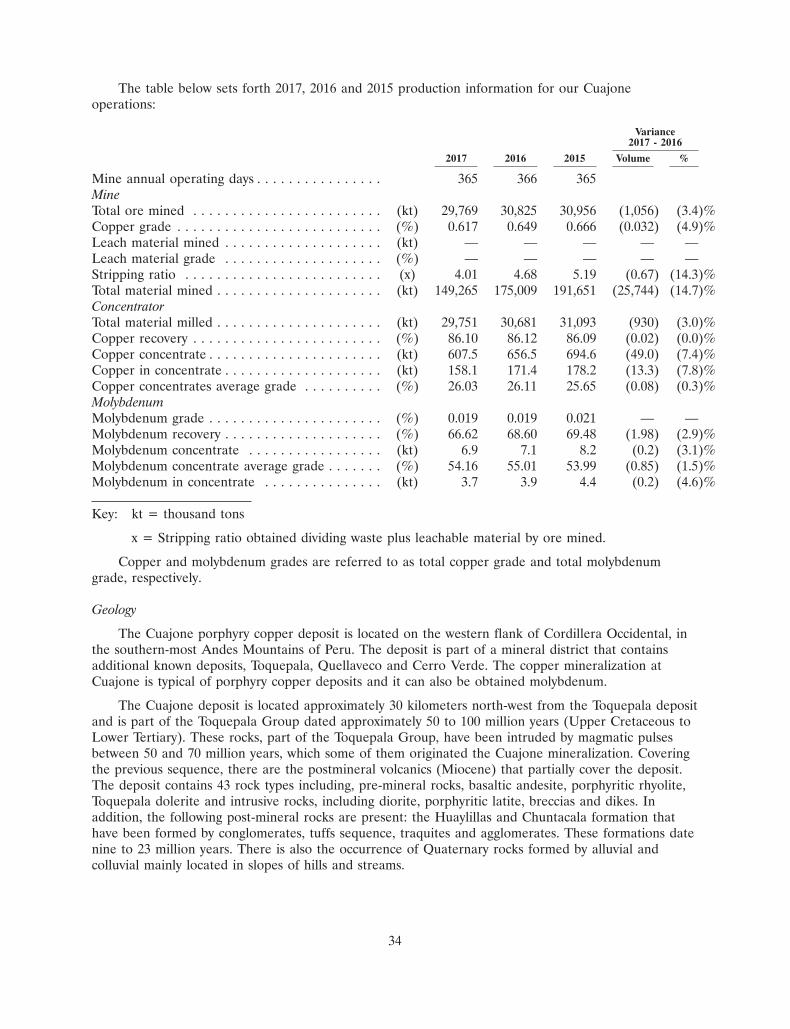
The table below sets forth 2017, 2016 and 2015 production information for our Cuajoneoperations:
Variance2017 - 2016
2017 2016 2015 Volume %
Mine annual operating days . . . . . . . . . . . . . . . . 365 366 365MineTotal ore mined . . . . . . . . . . . . . . . . . . . . . . . . (kt) 29,769 30,825 30,956 (1,056) (3.4)%Copper grade . . . . . . . . . . . . . . . . . . . . . . . . . . (%) 0.617 0.649 0.666 (0.032) (4.9)%Leach material mined . . . . . . . . . . . . . . . . . . . . (kt) — — — — —Leach material grade . . . . . . . . . . . . . . . . . . . . (%) — — — — —Stripping ratio . . . . . . . . . . . . . . . . . . . . . . . . . (x) 4.01 4.68 5.19 (0.67) (14.3)%Total material mined . . . . . . . . . . . . . . . . . . . . . (kt) 149,265 175,009 191,651 (25,744) (14.7)%ConcentratorTotal material milled . . . . . . . . . . . . . . . . . . . . . (kt) 29,751 30,681 31,093 (930) (3.0)%Copper recovery . . . . . . . . . . . . . . . . . . . . . . . . (%) 86.10 86.12 86.09 (0.02) (0.0)%Copper concentrate . . . . . . . . . . . . . . . . . . . . . . (kt) 607.5 656.5 694.6 (49.0) (7.4)%Copper in concentrate . . . . . . . . . . . . . . . . . . . . (kt) 158.1 171.4 178.2 (13.3) (7.8)%Copper concentrates average grade . . . . . . . . . . (%) 26.03 26.11 25.65 (0.08) (0.3)%MolybdenumMolybdenum grade . . . . . . . . . . . . . . . . . . . . . . (%) 0.019 0.019 0.021 — —Molybdenum recovery . . . . . . . . . . . . . . . . . . . . (%) 66.62 68.60 69.48 (1.98) (2.9)%Molybdenum concentrate . . . . . . . . . . . . . . . . . (kt) 6.9 7.1 8.2 (0.2) (3.1)%Molybdenum concentrate average grade . . . . . . . (%) 54.16 55.01 53.99 (0.85) (1.5)%Molybdenum in concentrate . . . . . . . . . . . . . . . (kt) 3.7 3.9 4.4 (0.2) (4.6)%
Key: kt = thousand tons
x = Stripping ratio obtained dividing waste plus leachable material by ore mined.
Copper and molybdenum grades are referred to as total copper grade and total molybdenumgrade, respectively.
Geology
The Cuajone porphyry copper deposit is located on the western flank of Cordillera Occidental, inthe southern-most Andes Mountains of Peru. The deposit is part of a mineral district that containsadditional known deposits, Toquepala, Quellaveco and Cerro Verde. The copper mineralization atCuajone is typical of porphyry copper deposits and it can also be obtained molybdenum.
The Cuajone deposit is located approximately 30 kilometers north-west from the Toquepala depositand is part of the Toquepala Group dated approximately 50 to 100 million years (Upper Cretaceous toLower Tertiary). These rocks, part of the Toquepala Group, have been intruded by magmatic pulsesbetween 50 and 70 million years, which some of them originated the Cuajone mineralization. Coveringthe previous sequence, there are the postmineral volcanics (Miocene) that partially cover the deposit.The deposit contains 43 rock types including, pre-mineral rocks, basaltic andesite, porphyritic rhyolite,Toquepala dolerite and intrusive rocks, including diorite, porphyritic latite, breccias and dikes. Inaddition, the following post-mineral rocks are present: the Huaylillas and Chuntacala formation thathave been formed by conglomerates, tuffs sequence, traquites and agglomerates. These formations datenine to 23 million years. There is also the occurrence of Quaternary rocks formed by alluvial andcolluvial mainly located in slopes of hills and streams.
34
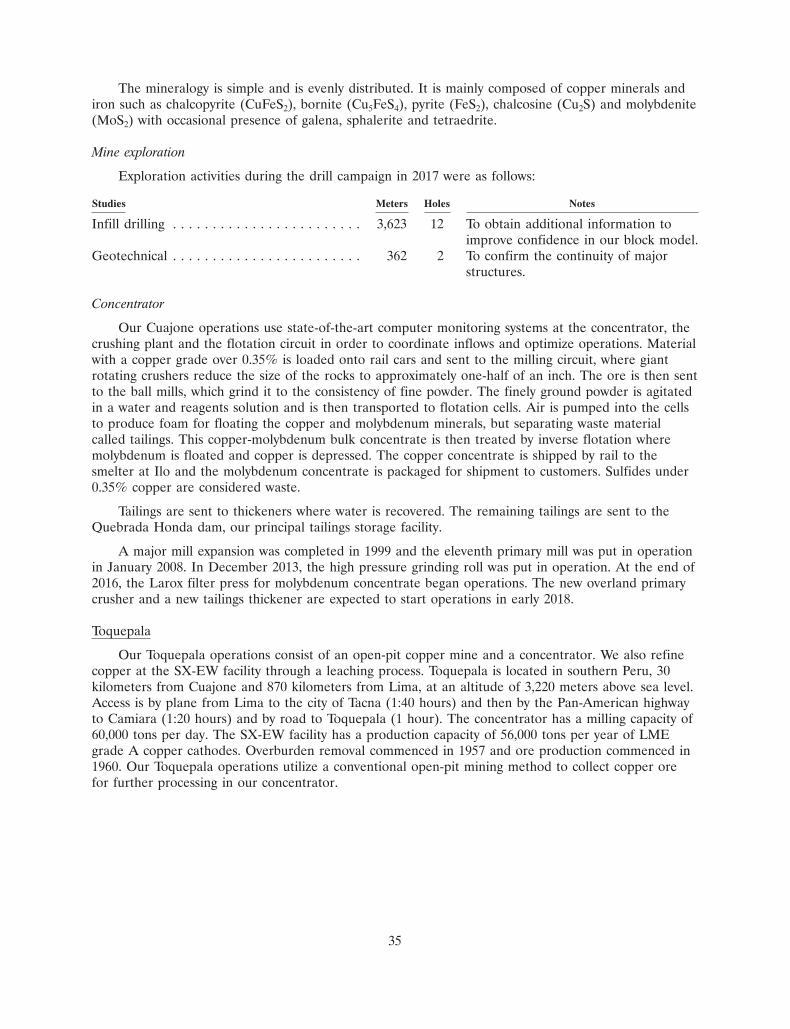
The mineralogy is simple and is evenly distributed. It is mainly composed of copper minerals andiron such as chalcopyrite (CuFeS2), bornite (Cu5FeS4), pyrite (FeS2), chalcosine (Cu2S) and molybdenite(MoS2) with occasional presence of galena, sphalerite and tetraedrite.
Mine exploration
Exploration activities during the drill campaign in 2017 were as follows:
Studies Meters Holes Notes
Infill drilling . . . . . . . . . . . . . . . . . . . . . . . . 3,623 12 To obtain additional information toimprove confidence in our block model.
Geotechnical . . . . . . . . . . . . . . . . . . . . . . . . 362 2 To confirm the continuity of majorstructures.
Concentrator
Our Cuajone operations use state-of-the-art computer monitoring systems at the concentrator, thecrushing plant and the flotation circuit in order to coordinate inflows and optimize operations. Materialwith a copper grade over 0.35% is loaded onto rail cars and sent to the milling circuit, where giantrotating crushers reduce the size of the rocks to approximately one-half of an inch. The ore is then sentto the ball mills, which grind it to the consistency of fine powder. The finely ground powder is agitatedin a water and reagents solution and is then transported to flotation cells. Air is pumped into the cellsto produce foam for floating the copper and molybdenum minerals, but separating waste materialcalled tailings. This copper-molybdenum bulk concentrate is then treated by inverse flotation wheremolybdenum is floated and copper is depressed. The copper concentrate is shipped by rail to thesmelter at Ilo and the molybdenum concentrate is packaged for shipment to customers. Sulfides under0.35% copper are considered waste.
Tailings are sent to thickeners where water is recovered. The remaining tailings are sent to theQuebrada Honda dam, our principal tailings storage facility.
A major mill expansion was completed in 1999 and the eleventh primary mill was put in operationin January 2008. In December 2013, the high pressure grinding roll was put in operation. At the end of2016, the Larox filter press for molybdenum concentrate began operations. The new overland primarycrusher and a new tailings thickener are expected to start operations in early 2018.
Toquepala
Our Toquepala operations consist of an open-pit copper mine and a concentrator. We also refinecopper at the SX-EW facility through a leaching process. Toquepala is located in southern Peru, 30kilometers from Cuajone and 870 kilometers from Lima, at an altitude of 3,220 meters above sea level.Access is by plane from Lima to the city of Tacna (1:40 hours) and then by the Pan-American highwayto Camiara (1:20 hours) and by road to Toquepala (1 hour). The concentrator has a milling capacity of60,000 tons per day. The SX-EW facility has a production capacity of 56,000 tons per year of LMEgrade A copper cathodes. Overburden removal commenced in 1957 and ore production commenced in1960. Our Toquepala operations utilize a conventional open-pit mining method to collect copper orefor further processing in our concentrator.
35
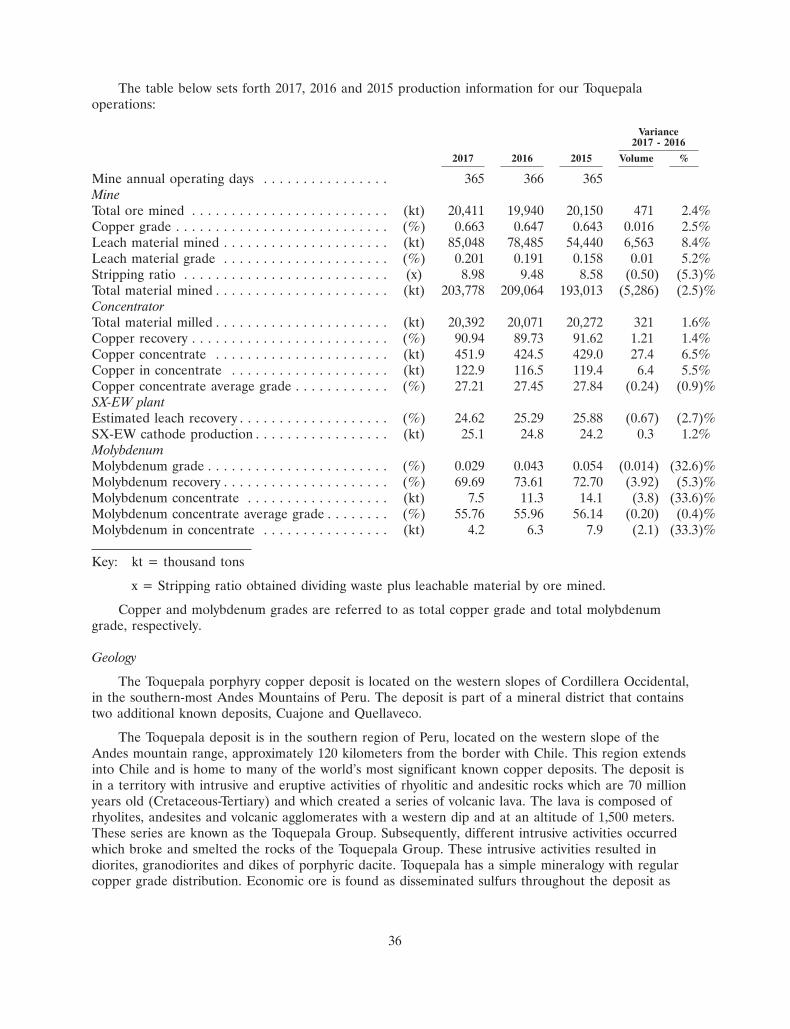
The table below sets forth 2017, 2016 and 2015 production information for our Toquepalaoperations:
Variance2017 - 2016
2017 2016 2015 Volume %
Mine annual operating days . . . . . . . . . . . . . . . . 365 366 365MineTotal ore mined . . . . . . . . . . . . . . . . . . . . . . . . . (kt) 20,411 19,940 20,150 471 2.4%Copper grade . . . . . . . . . . . . . . . . . . . . . . . . . . . (%) 0.663 0.647 0.643 0.016 2.5%Leach material mined . . . . . . . . . . . . . . . . . . . . . (kt) 85,048 78,485 54,440 6,563 8.4%Leach material grade . . . . . . . . . . . . . . . . . . . . . (%) 0.201 0.191 0.158 0.01 5.2%Stripping ratio . . . . . . . . . . . . . . . . . . . . . . . . . . (x) 8.98 9.48 8.58 (0.50) (5.3)%Total material mined . . . . . . . . . . . . . . . . . . . . . . (kt) 203,778 209,064 193,013 (5,286) (2.5)%ConcentratorTotal material milled . . . . . . . . . . . . . . . . . . . . . . (kt) 20,392 20,071 20,272 321 1.6%Copper recovery . . . . . . . . . . . . . . . . . . . . . . . . . (%) 90.94 89.73 91.62 1.21 1.4%Copper concentrate . . . . . . . . . . . . . . . . . . . . . . (kt) 451.9 424.5 429.0 27.4 6.5%Copper in concentrate . . . . . . . . . . . . . . . . . . . . (kt) 122.9 116.5 119.4 6.4 5.5%Copper concentrate average grade . . . . . . . . . . . . (%) 27.21 27.45 27.84 (0.24) (0.9)%SX-EW plantEstimated leach recovery . . . . . . . . . . . . . . . . . . . (%) 24.62 25.29 25.88 (0.67) (2.7)%SX-EW cathode production . . . . . . . . . . . . . . . . . (kt) 25.1 24.8 24.2 0.3 1.2%MolybdenumMolybdenum grade . . . . . . . . . . . . . . . . . . . . . . . (%) 0.029 0.043 0.054 (0.014) (32.6)%Molybdenum recovery . . . . . . . . . . . . . . . . . . . . . (%) 69.69 73.61 72.70 (3.92) (5.3)%Molybdenum concentrate . . . . . . . . . . . . . . . . . . (kt) 7.5 11.3 14.1 (3.8) (33.6)%Molybdenum concentrate average grade . . . . . . . . (%) 55.76 55.96 56.14 (0.20) (0.4)%Molybdenum in concentrate . . . . . . . . . . . . . . . . (kt) 4.2 6.3 7.9 (2.1) (33.3)%
Key: kt = thousand tons
x = Stripping ratio obtained dividing waste plus leachable material by ore mined.
Copper and molybdenum grades are referred to as total copper grade and total molybdenumgrade, respectively.
Geology
The Toquepala porphyry copper deposit is located on the western slopes of Cordillera Occidental,in the southern-most Andes Mountains of Peru. The deposit is part of a mineral district that containstwo additional known deposits, Cuajone and Quellaveco.
The Toquepala deposit is in the southern region of Peru, located on the western slope of theAndes mountain range, approximately 120 kilometers from the border with Chile. This region extendsinto Chile and is home to many of the world’s most significant known copper deposits. The deposit isin a territory with intrusive and eruptive activities of rhyolitic and andesitic rocks which are 70 millionyears old (Cretaceous-Tertiary) and which created a series of volcanic lava. The lava is composed ofrhyolites, andesites and volcanic agglomerates with a western dip and at an altitude of 1,500 meters.These series are known as the Toquepala Group. Subsequently, different intrusive activities occurredwhich broke and smelted the rocks of the Toquepala Group. These intrusive activities resulted indiorites, granodiorites and dikes of porphyric dacite. Toquepala has a simple mineralogy with regularcopper grade distribution. Economic ore is found as disseminated sulfurs throughout the deposit as
36
veinlets, replenishing empty places or as small aggregates. Ore minerals include chalcopyrite (CuFeS2),chalcosine (Cu2S) and molybdenite (MoS2). A secondary enrichment zone is also found withthicknesses between 0 and 150 meters.
Mine Exploration
Exploration activities during the drill campaign in 2017 were as follows:
Studies Meters Holes Notes
Ore and leach confirmation to reserves and phases . 20,837 32 To confirm the continuity of theore and leach material.
Study of Slopes Stability Instability-South east . . . . 140 1 To define the potential depth ofinstability.
Exploration geotechnical and hydrogeological drill . 4,142 11 To define rock mass quality andhydrogeological behavior.
Total . . . . . . . . . . . . . . . . . . . . . . . . . . . . . . . . . . 25,119 44
Concentrator
Our Toquepala concentrator operations use state-of-the-art computer monitoring systems in orderto coordinate inflows and optimize operations. Material with a copper grade over 0.40% is loaded ontorail cars and sent to the crushing circuit, where rotating crushers reduce the size of the rocks byapproximately 85%, to less than one-half of an inch. The ore is then sent to the rod and ball mills,which grind it in a mix with water to the consistency of fine powder. The finely ground powder mixedwith water is then transported to flotation cells. Air is pumped into the cells producing a froth, whichcarries the copper mineral to the surface but not the waste rock, or tailings. The bulk concentrate withsufficient molybdenum content is processed to recover molybdenum by inverse flotation. This finalcopper concentrate with a content of approximately 26.5% of copper is filtered in order to reducemoisture to 8.5% or less. Concentrates are then shipped by rail to the Ilo smelter.
Tailings are sent to thickeners where water is recovered. The remaining tailings are sent to theQuebrada Honda dam, our principal tailings storage facility.
SX-EW Plant
The SX-EW facility at Toquepala produces grade A LME electrowon copper cathodes of 99.999%purity from solutions obtained by leaching low-grade ore stored at the Toquepala and Cuajone mines.The leach plant commenced operations in 1995 with a design capacity of 35,629 tons per year of coppercathodes. In 1999, the capacity was expanded to 56,000 tons per year.
Copper oxides from Cuajone with a copper grade higher than 0.208%, with an acid solubility indexhigher than 43% and a cyanide solubility index higher than 17% are leached. In Toquepala, the coppersulfides cutoff grade is 0.153% and therefore material with a total copper grade between 0.153% and0.300% are leached. Copper in solution produced at Cuajone is sent to Toquepala through aneight-inch pipe laid alongside the Cuajone-Toquepala railroad track.
Plant and equipment are supported by a maintenance plan and a quality management system toassure good physical condition and high availability. The SX-EW plant management quality system(including leaching operations) has been audited periodically since 2002 by an external audit company,and found to be in compliance with the requirements of the ISO 9001-2008 standard. In 2012, weobtained the certification OHSAS 18001 of our occupational health and safety system and theISO14001-2004 for our environmental standards at the SX-EW plant.
37
Processing Facilities—Ilo
Our Ilo smelter and refinery complex is located in the southern part of Peru, 17 kilometers northof the city of Ilo, 121 kilometers from Toquepala, 147 kilometers from Cuajone and 1,240 kilometersfrom the city of Lima. Access is by plane from Lima to Tacna (1:40 hours) and then by highway to thecity of Ilo (2:00 hours). Additionally, we maintain a port facility in Ilo, from which we ship ourproducts and receive supplies. Products shipped and supplies received are moved between Toquepala,Cuajone and Ilo on our industrial railroad.
Smelter
Our Ilo smelter produces copper anodes for the refinery we operate as part of the same facility.Copper produced by the smelter exceeds the refinery’s capacity and the excess is sold to otherrefineries around the world. In 2007, we completed a major modernization of the smelter. The nominalinstalled capacity of the smelter is 1,200,000 tons of concentrate per year.
Copper concentrates from Toquepala and Cuajone are transported by railroad to the smelter,where they are smelted using an ISASMELT furnace, converters and anode furnaces to produce copperanodes with 99.7% copper. At the smelter, the concentrates are mixed with flux and other material andsent to the ISASMELT furnace producing a mixture of copper matte and slag, which is tapped througha taphole to either of two rotary holding furnaces, where these smelted phases will be separated.Copper matte contains approximately 63% copper. Copper matte is then sent to the four Pierce Smithconverters, where the material is oxidized in two steps: (1) the iron sulfides in the matte are oxidizedwith oxygen enriched air and silica is added producing slag that is sent to the slag cleaning furnaces,and (2) the copper contained in the matte sulfides is then oxidized to produce blister copper,containing approximately 99.3% copper. The blister copper is refined in two anode furnaces byoxidation to remove sulfur with compressed air injected into the bath. Finally, the oxygen content ofthe molten copper is adjusted by reduction with injection of liquefied petroleum gas with steam intothe bath. Anodes, containing approximately 99.7% copper, are cast in two casting wheels. The smelteralso can produce blister copper bars, especially when an anode furnace is in general repair.
The table below sets forth 2017, 2016 and 2015 production and sales information for our Ilosmelter plant:
Variance2017 - 2016
Smelter 2017 2016 2015 Volume %
Concentrate smelted . . . . . . . . . . . . . . . . . . . . . . . . (kt) 1,153.5 1,070.6 1,143.7 82.9 7.7%Average copper recovery . . . . . . . . . . . . . . . . . . . . . (%) 97.4 97.4 97.4 — —Anode production . . . . . . . . . . . . . . . . . . . . . . . . . . (kt) 346.6 323.3 339.7 23.3 7.2%Average anode grade . . . . . . . . . . . . . . . . . . . . . . . (%) 99.77 99.77 99.76 — —Blister production . . . . . . . . . . . . . . . . . . . . . . . . . . kt 1.8 0.9 2.8 0.9 92.8%Average blister grade . . . . . . . . . . . . . . . . . . . . . . . (%) 99.32 99.23 99.31 0.09 0.1%Sulfuric acid produced . . . . . . . . . . . . . . . . . . . . . . (kt) 1,119.6 1,036.3 1,104.7 83.3 8.0%
Key: kt = thousand tons
The off gases from the smelter are treated to recover over 92% of the incoming sulfur received inthe concentrates producing 98.5% sulfuric acid. The gas stream from the smelter with 11.34% SO2 issplit between two plants: The No. 1 acid plant (single absorption/single contact) and the No. 2 plant(double absorption/double contact). Approximately, 16% of the acid produced is used at our facilitieswith the balance sold to third parties. We anticipate that our internal usage will be over 80% when theTia Maria project begins operation.
38
The smelter also has two oxygen plants. Plant No. 1, with 272 tons per day of production capacity,and Plant No.2, with 1,045 tons per day of capacity.
In 2010, the Ilo smelter marine trestle started operation. This facility allows us to offload directlyto offshore ships the sulfuric acid produced, avoiding hauling cargo through the city of Ilo. The500 meter long marine trestle is the last part of the Ilo smelter modernization project. Currently alloverseas shipments of sulfuric acid are being made using the marine trestle.
Refinery
The Ilo refinery consists of an electrolytic plant, a precious metal plant and a number of ancillaryinstallations. The refinery is producing grade A copper cathode of 99.998% purity. The nominalcapacity is 280,000 tons per year. Anodic slimes are recovered from the refining process and then sentto the precious metals facility to produce refined silver, refined gold and commercial grade selenium.
Anodes are suspended in tanks containing a solution of sulfuric acid and copper sulfate. A lowvoltage but high amperage electrical current is passed through the anodes, chemical solution andcathodes in order to dissolve copper which is deposited on initially very thin starting sheets increasingits thickness to produce high grade copper cathodes. During this process, silver, gold and other metals,including palladium, platinum and selenium, along with other impurities, settle on the bottom of thetank in the form of anodic slime. This anodic slime is processed in a precious metal plant where silver,gold and selenium are recovered.
The table below sets forth 2017, 2016 and 2015 production and sales information for our Ilorefinery and precious metals plants:
Variance2017 - 2016
Refinery 2017 2016 2015 Volume %
Cathodes produced . . . . . . . . . . . . . . . . . . . . . . (kt) 291.4 270.2 280.6 21.2 7.8%Average copper grade . . . . . . . . . . . . . . . . . . . . (%) 99.999 99.998 99.998 0.001 0.0%Refined silver produced . . . . . . . . . . . . . . . . . . . (000 Kg) 123.0 102.5 106.0 20.5 20.0%Refined gold produced . . . . . . . . . . . . . . . . . . . . (kg) 237.7 209.9 190.9 27.8 13.2%Commercial grade selenium produced . . . . . . . . . (tons) 49.2 48.7 54.4 0.5 1.1%
Key: kt = thousand tons
In addition to the processing facilities, the refinery has a production control section, a laboratorywhich provides sample analysis throughout the Company, a maintenance department, a desalinizationplant and other support facilities.
Other facilities in Ilo are a coquina plant with a production capacity of 200,000 tons per year ofseashells and a lime plant with a capacity of 80,000 tons per year. We also operate an industrialrailroad to haul production and supplies between Toquepala, Cuajone and Ilo.
The industrial railroad’s main equipment includes locomotives of different types and rolling stockwith different types of cars and capacities. The track runs in a single 214 kilometer standard gauge lineand supports a 30-ton axle load. The total length of the track system is around 257 kilometers includingmain yards and sidings. The infrastructure includes 27 kilometers of track under tunnels and oneconcrete bridge. The industrial railroad includes a car repair shop which is responsible for maintenanceand repair of the car fleet. Annual tonnage transported is approximately 4.7 million tons.
39
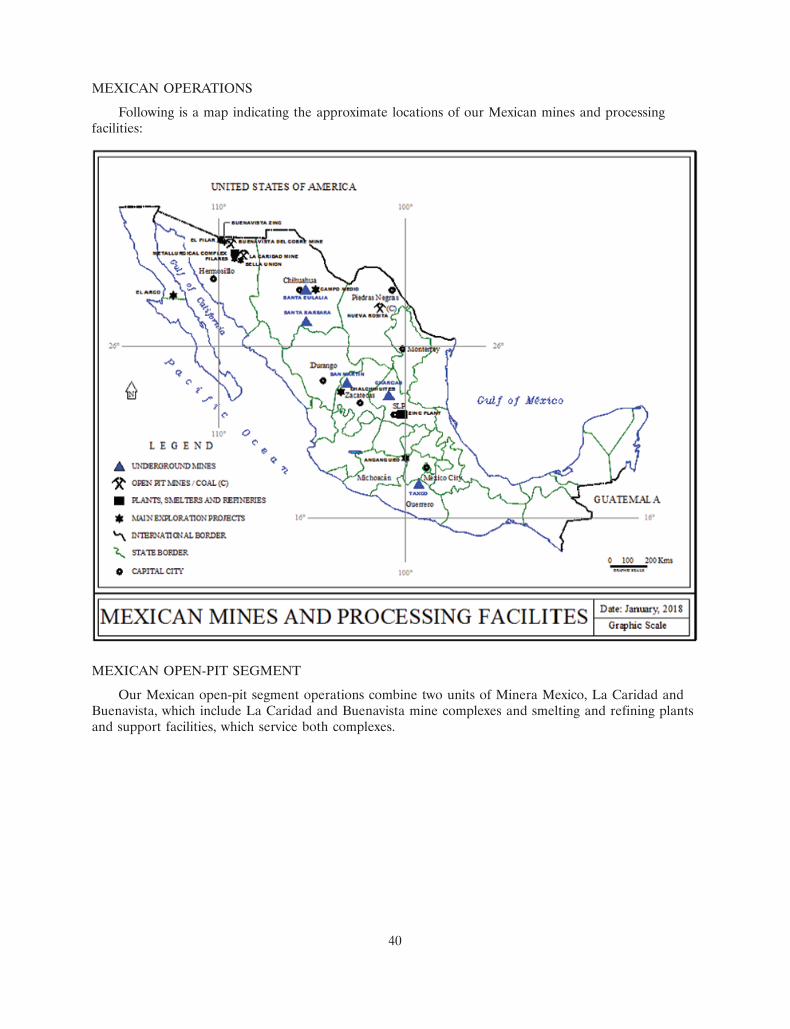
24FEB201809455011
MEXICAN OPERATIONS
Following is a map indicating the approximate locations of our Mexican mines and processingfacilities:
MEXICAN OPEN-PIT SEGMENT
Our Mexican open-pit segment operations combine two units of Minera Mexico, La Caridad andBuenavista, which include La Caridad and Buenavista mine complexes and smelting and refining plantsand support facilities, which service both complexes.
40
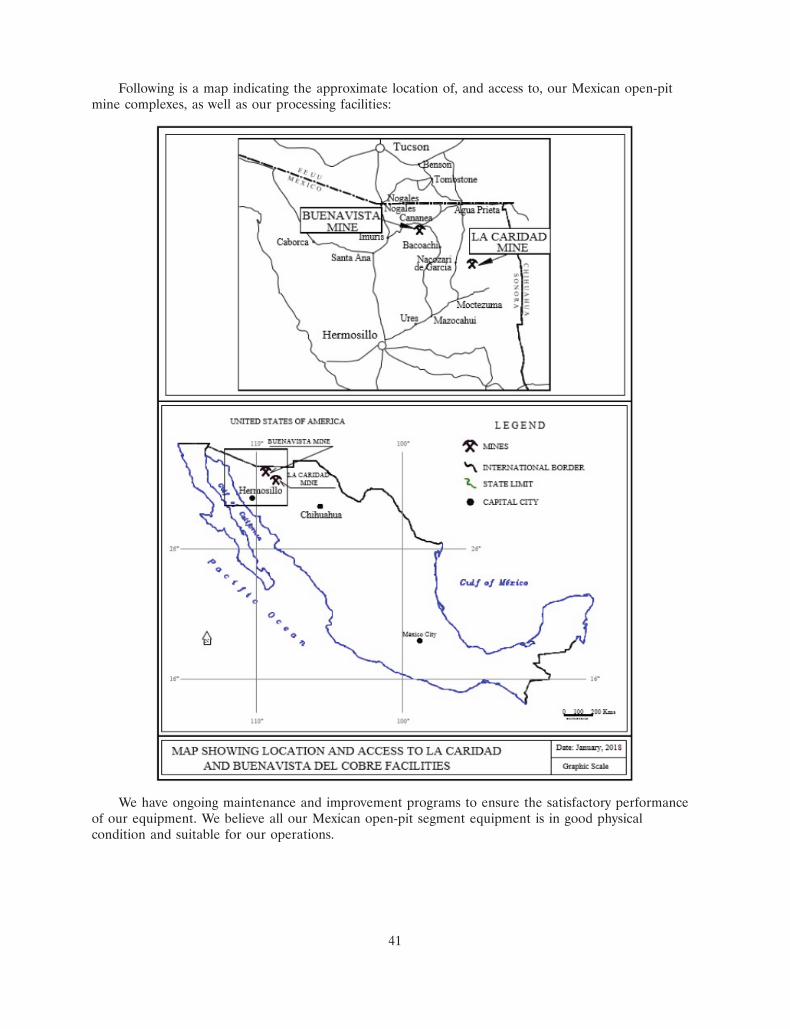
24FEB201809454659
Following is a map indicating the approximate location of, and access to, our Mexican open-pitmine complexes, as well as our processing facilities:
We have ongoing maintenance and improvement programs to ensure the satisfactory performanceof our equipment. We believe all our Mexican open-pit segment equipment is in good physicalcondition and suitable for our operations.
41
Buenavista
The Buenavista mining unit operates an open-pit copper mine, two concentrators and threeSX-EW plants. It is located 100 air-kilometers northwest of La Caridad and 40 kilometers south of theArizona, U.S.—Mexican border, at an altitude of 1,900 meters above sea level. It lies on the outskirtsof the city of Cananea. Buenavista is connected by paved highways to the border city of Agua Prieta tothe northeast, to the town of Nacozari in the southeast and to the town of Imuris to the west.Buenavista is also connected by railway to Agua Prieta and Nogales. A municipal airport is locatedapproximately 20 kilometers to the northeast of Buenavista.
We have concluded our $3.5 billion investment program in Mexico and all of the projects of thisprogram are in full operation. The program included a third SX-EW plant, completed in June 2014,with a rated annual capacity of 120,000 tons of copper. A new concentrator, completed in 2015, with anannual copper production capacity of 188,000 tons. The program includes two molybdenum plants witha combined annual capacity of 4,600 tons. The first plant was completed in 2013 and the second one, in2016. Additionally, the program included the Crushing, Conveying and Spreading System for LeachableOre (Quebalix IV), which has been completed on time and under budget and is currently operatingsteadily. This project will reduce mining costs as well as increase SX-EW copper recovery, allowing theBuenavista unit to reach its copper production capacity of 500,000 tons.
The original concentrator currently has a nominal milling capacity of 76,700 tons per day. Thesecond concentrator began operations in 2015 with a nominal milling capacity of 100,000 tons per day.The SX-EW facilities have a cathode production capacity of 174,470 tons per year. The Buenavista orebody is considered one of the world’s largest porphyry copper deposits. Buenavista is the oldestcontinuously operated copper mine in North America, with operations dating back to 1899. High gradeore deposits in the district were mined exclusively using underground methods. The AnacondaCompany acquired the property in 1917. In the early 1940s, Anaconda started developing the firstopen-pit in Buenavista. In 1990, through a public auction procedure, Minera Mexico acquired 100% ofthe Buenavista mining assets for $475 million. Buenavista is currently applying conventional open-pitmining methods to extract copper ore for further processing in the concentrator.
42
The following table shows 2017, 2016 and 2015 production information for Buenavista:
2017 - 2016Variance
2017 2016 2015 Volume %
Mine annual operating days . . . . . . . . . . . . . . . . 365 366 365Mine:Total ore mined . . . . . . . . . . . . . . . . . . . . . . . . . (kt) 69,773 66,328 33,726 3,445 5.2%Copper grade . . . . . . . . . . . . . . . . . . . . . . . . . . (%) 0.547 0.566 0.593 (0.019) (3.4)%Leach material mined . . . . . . . . . . . . . . . . . . . . (kt) 157,802 123,738 150,546 34,064 27.5%Leach material grade . . . . . . . . . . . . . . . . . . . . . (%) 0.261 0.281 0.293 (0.020) (7.1)%Stripping ratio . . . . . . . . . . . . . . . . . . . . . . . . . . (x) 3.14 2.88 6.23 0.26 9.0%Total material mined . . . . . . . . . . . . . . . . . . . . . (kt) 288,716 257,395 282,954 31,321 12.2%Concentrator:Total material milled . . . . . . . . . . . . . . . . . . . . . (kt) 69,294 66,112 33,141 3,182 4.8%Copper recovery . . . . . . . . . . . . . . . . . . . . . . . . (%) 84.12 84.50 82.50 (0.38) (0.5)%Copper concentrate . . . . . . . . . . . . . . . . . . . . . . (kt) 1,361.8 1,329.6 705.0 32.2 2.4%Copper in concentrate . . . . . . . . . . . . . . . . . . . . (kt) 319.0 316.0 162.0 3.0 1.0%Copper concentrate average grade . . . . . . . . . . . (%) 23.42 23.77 22.98 (0.35) (1.5)%SX-EW plantEstimated leach recovery . . . . . . . . . . . . . . . . . . (%) 70.00 70.77 47.78 (0.77) (1.1)%SX-EW cathode production . . . . . . . . . . . . . . . . (kt) 111.8 131.4 122.5 (19.6) (14.9)%MolybdenumMolybdenum grade . . . . . . . . . . . . . . . . . . . . . . (%) 0.013 0.013 0.013 — —Molybdenum recovery . . . . . . . . . . . . . . . . . . . . (%) 39.85 25.11 25.55 14.74 58.7%Molybdenum concentrate . . . . . . . . . . . . . . . . . . (kt) 6.74 3.19 1.87 3.55 111.3%Molybdenum concentrate average grade . . . . . . . (%) 51.38 49.45 50.25 1.93 3.9%Molybdenum in concentrate . . . . . . . . . . . . . . . . (kt) 3.46 1.58 0.94 1.88 119.0%
Key: kt = thousand tons
x = Stripping ratio obtained dividing waste plus leachable material by ore mined.
The copper and molybdenum grade are total grade.
Geology
The Buenavista mining district lies on the southern cordilleran orogen, which extends fromsouthern Mexico to northwestern United States. It also falls within the Basin and Range metallogenicprovince. Geological and structural features in the district are representative of large, disseminatedtype, porphyry copper deposits. A calcareous sedimentary sequence of lower Paleozoic age,lithologically correlated with a similar section in southeastern Arizona, uncomformably overliesPrecambrian granite basement. The entire section was covered by volcanic rocks of Mesozoic age andlater intruded by deep seated granodiorite batholith of Tertiary age, with further quartz monzoniteporphyry differentiates of Laramide age.
Mineralization in the district is extensive covering a surface area of approximately 30 squarekilometers. An early pegmatitic stage associated with bornite-chalcopyrite-molybdenite assemblage wasfollowed by a widespread flooding of hydrothermal solutions with quartz-pyrite-chalcopyrite. Apervasive quartz-sericite alteration is evident throughout the district’s igneous rock fabric.
An extensive and economically important zone of supergene enrichment, with disseminated andstockworks of chalcocite (Cu2S), developed below the iron oxide capping. This zone coincides with thetopography and has an average thickness of 300 meters. A mixed zone of secondary and primary
43
sulfides underlay the chalcocite blanket. The hypogene mineralization, principally chalcopyrite(CuFeS2), extensively underlies the ore body. Molybdenite occurs throughout the deposit and thecontent tends to increase with depth.
The Buenavista copper porphyry is considered world-class and unique. The deepest explorationresults in the core of the deposit have confirmed significant increase in copper grades. Similar porphyrycopper deposits usually contain lower grades at depth. The district is also unique for the occurrence ofhigh-grade breccia pipes, occurring in clusters following the trend of the district.
Current dimensions of the mineralized ore body are 5x3 kilometers, and projects to more than onekilometer at depth. Considering the geological and economic potential of the Buenavista porphyrycopper deposit, it is expected that the operation can support a sizeable increase in copper productioncapacity.
Mine Exploration
In-fill core drilling was conducted in 2011 at the Buenavista zinc-copper-silver deposit, includingdirectional drilling for geotechnical purposes. A deep drilling campaign was initiated in 2011 to explorethe extent of the deposit at depth, drilling a total of 3,860 meters in 2012. For short-term mineplanning, 6,652 meters were drilled to confirm copper grade and metallurgical recoveries. Also, in 2011,a condemnation drilling program was initiated to define areas for future infrastructure, as well as areaswhere leach and waste dumps will be deposited. A total of 28,369 meters of core drilling werecompleted in 2011. A geohydrology program was initiated in 2011 to explore the possibility ofgroundwater sources within the mine limits, and a total of 29,750 meters of diamond drilling weredrilled in 2012. In addition, 3,797 meters were drilled for water monitoring wells. We did not have adrilling campaign in 2013. In 2014, we performed a drilling program of 20,000 meters in order to verifythe reserves. In 2015, we complied with our drilling program target of 15,000 meters to define reservesand to confirm copper and molybdenum grades. For 2018, we plan to drill 10,000 meters to furtherdefine reserves and confirm grades.
Concentrator
Buenavista uses state-of-the-art computer monitoring systems at the concentrators, the crushingplant and the flotation circuit in order to coordinate inflows and optimize operations. In the originalconcentrator, material with a copper grade over 0.38% is loaded onto trucks and sent to the millingcircuit, where giant rotating crushers reduce the size of the ore to approximately one-half of an inch.The ore is then sent to the ball mills, which grind it to the consistency of fine powder. The finelyground powder is agitated in a water and reagents solution and is then transported to flotation cells.Air is pumped into the cells producing a froth, which carries the copper mineral to the surface but notthe waste rock, or tailings. Recovered copper, with the consistency of froth, is filtered and dried toproduce copper concentrates with an average copper content of approximately 24%. Concentrates arethen shipped by rail to the smelter at La Caridad.
In the second concentrator, material with a copper grade over 0.57% is sent to a three-phasemilling circuit, where the ore size is reduced to approximately one-half inch. The ore is then sent to acircuit of six ball mills, which grind it to the consistency of fine powder. The finely ground powder isagitated in a water and reagents solution and is then transported to flotation cells. Air is pumped intothe cells producing a froth, which carries the copper mineral to the surface but not the waste rock, ortailings. Recovered copper, with the consistency of froth, is filtered and dried to produce copperconcentrates with an average copper content of approximately 24%. Concentrates are then sent bytrucks or by railroad to the La Caridad smelter or to the Guaymas port, at Sonora, for exporting.
As part of the expansion program for this unit, in 2013 we completed the construction of the firstmolybdenum plant with an annual production capacity of 2,000 tons of molybdenum contained in
44
concentrate. The plant was designed to process 1,500 tons of copper-molybdenum concentrates per daywith a recovery of approximately 80%of copper and 50% of molybdenum content. The molybdenumplant consists of thickeners, homogenizer tanks, flotation cells, column cells and a holo-flite dryer. Thesecond molybdenum plant obtained its first production lot in July 2016 and fully initiated operations inNovember 2016.
SX-EW Plant
The Buenavista unit operates a leaching facility and three SX-EW plants. All copper ore with agrade lower than the mill cut-off grade of 0.38%, but higher than 0.25%, is delivered to the leachdumps. A cycle of leaching and resting occurs for approximately five years in the run-of-mine dumpsand three years for the crushed leach material.
There are three irrigation systems for the dumps and eleven dams for the pregnant leach solution(PLS). Plant I has four solvent extraction tanks with a nominal capacity of 18,000 liters per minute ofPLS and 54 electrowinning cells and has a daily production capacity of 30 tons of copper cathodes with99.999% purity. Plant II has five trains of solvent extraction with a nominal capacity of 62,000 liters perminute of PLS and 220 cells distributed in two bays and has a daily production capacity of 120 tons ofcopper cathodes with 99.9% purity. Plant III has three trains of solvent extraction with a nominalcapacity of 167,100 liters per minute of PLS and 270 cells distributed in two bays and has a dailyproduction capacity of 328 tons of copper cathodes with 99.9% purity. The plant produces coppercathodes of LME grade A. Please see ‘‘Capital Investment Program’’ under Item 7 for furtherinformation.
La Caridad
The La Caridad complex includes an open-pit mine, concentrator, smelter, copper refinery,precious metals refinery, rod plant, SX-EW plant, lime plant and two sulfuric acid plants.
La Caridad mine and mill are located about 23 kilometers southeast of the town of Nacozari innortheastern Sonora, at an altitude of 2,000 meters above sea level. Nacozari is about 264 kilometersnortheast of the Sonora state capital of Hermosillo and 121 kilometers south of the U.S.-Mexicoborder. Nacozari is connected by paved highway with Hermosillo and Agua Prieta and by rail with theinternational port of Guaymas, and the Mexican and United States rail systems. An airstrip with areported runway length of 2,500 meters is located 36 kilometers north of Nacozari, less than onekilometer away from the La Caridad copper smelter and refinery. The smelter and the sulfuric acidplants, as well as the refineries and rod plant, are located approximately 24 kilometers from the mine.Access is by paved highway and by railroad.
The concentrator began operations in 1979, the molybdenum plant was added in 1982, the smelterin 1986, the first sulfuric acid plant in 1988, the SX-EW plant in 1995, the second sulfuric acid plant in1997, the copper refinery in 1997, the rod plant in 1998, the precious metals refinery in 1999 and thedust and effluents plant in 2012.
45
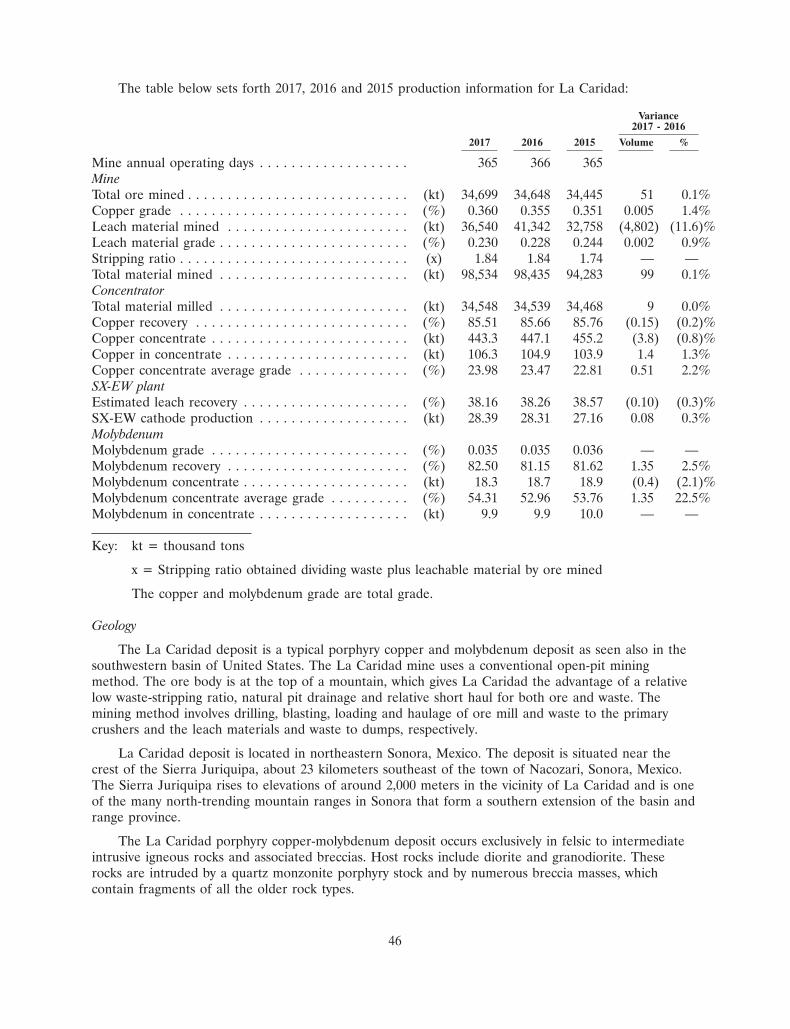
The table below sets forth 2017, 2016 and 2015 production information for La Caridad:
Variance2017 - 2016
2017 2016 2015 Volume %
Mine annual operating days . . . . . . . . . . . . . . . . . . . 365 366 365MineTotal ore mined . . . . . . . . . . . . . . . . . . . . . . . . . . . . (kt) 34,699 34,648 34,445 51 0.1%Copper grade . . . . . . . . . . . . . . . . . . . . . . . . . . . . . (%) 0.360 0.355 0.351 0.005 1.4%Leach material mined . . . . . . . . . . . . . . . . . . . . . . . (kt) 36,540 41,342 32,758 (4,802) (11.6)%Leach material grade . . . . . . . . . . . . . . . . . . . . . . . . (%) 0.230 0.228 0.244 0.002 0.9%Stripping ratio . . . . . . . . . . . . . . . . . . . . . . . . . . . . . (x) 1.84 1.84 1.74 — —Total material mined . . . . . . . . . . . . . . . . . . . . . . . . (kt) 98,534 98,435 94,283 99 0.1%ConcentratorTotal material milled . . . . . . . . . . . . . . . . . . . . . . . . (kt) 34,548 34,539 34,468 9 0.0%Copper recovery . . . . . . . . . . . . . . . . . . . . . . . . . . . (%) 85.51 85.66 85.76 (0.15) (0.2)%Copper concentrate . . . . . . . . . . . . . . . . . . . . . . . . . (kt) 443.3 447.1 455.2 (3.8) (0.8)%Copper in concentrate . . . . . . . . . . . . . . . . . . . . . . . (kt) 106.3 104.9 103.9 1.4 1.3%Copper concentrate average grade . . . . . . . . . . . . . . (%) 23.98 23.47 22.81 0.51 2.2%SX-EW plantEstimated leach recovery . . . . . . . . . . . . . . . . . . . . . (%) 38.16 38.26 38.57 (0.10) (0.3)%SX-EW cathode production . . . . . . . . . . . . . . . . . . . (kt) 28.39 28.31 27.16 0.08 0.3%MolybdenumMolybdenum grade . . . . . . . . . . . . . . . . . . . . . . . . . (%) 0.035 0.035 0.036 — —Molybdenum recovery . . . . . . . . . . . . . . . . . . . . . . . (%) 82.50 81.15 81.62 1.35 2.5%Molybdenum concentrate . . . . . . . . . . . . . . . . . . . . . (kt) 18.3 18.7 18.9 (0.4) (2.1)%Molybdenum concentrate average grade . . . . . . . . . . (%) 54.31 52.96 53.76 1.35 22.5%Molybdenum in concentrate . . . . . . . . . . . . . . . . . . . (kt) 9.9 9.9 10.0 — —
Key: kt = thousand tons
x = Stripping ratio obtained dividing waste plus leachable material by ore mined
The copper and molybdenum grade are total grade.
Geology
The La Caridad deposit is a typical porphyry copper and molybdenum deposit as seen also in thesouthwestern basin of United States. The La Caridad mine uses a conventional open-pit miningmethod. The ore body is at the top of a mountain, which gives La Caridad the advantage of a relativelow waste-stripping ratio, natural pit drainage and relative short haul for both ore and waste. Themining method involves drilling, blasting, loading and haulage of ore mill and waste to the primarycrushers and the leach materials and waste to dumps, respectively.
La Caridad deposit is located in northeastern Sonora, Mexico. The deposit is situated near thecrest of the Sierra Juriquipa, about 23 kilometers southeast of the town of Nacozari, Sonora, Mexico.The Sierra Juriquipa rises to elevations of around 2,000 meters in the vicinity of La Caridad and is oneof the many north-trending mountain ranges in Sonora that form a southern extension of the basin andrange province.
The La Caridad porphyry copper-molybdenum deposit occurs exclusively in felsic to intermediateintrusive igneous rocks and associated breccias. Host rocks include diorite and granodiorite. Theserocks are intruded by a quartz monzonite porphyry stock and by numerous breccia masses, whichcontain fragments of all the older rock types.
46
Supergene enrichment consists of complete to partial chalcosite (Cu2S) replacement of chalcopyrite(CuFeS2). The zone of supergene enrichment occurs as a flat and tabular blanket with an averagediameter of 1,700 meters and thickness generally between 0 and 90 meters.
Economic ore is found as disseminated sulfurs within the central part of the deposit. Sulfide-filledbreccia cavities are most abundant in the intrusive breccia. This breccia-cavity mineralization occurs assulfide aggregates which have crystallized in the spaces separating breccia clasts. Near the margins ofthe deposit, mineralization occurs almost exclusively in veinlets. Ore minerals include chalcopyrite(CuFeS2), chalcosite (Cu2S) and molybdenite (MoS2).
Mine Exploration
The La Caridad ore body has been mined for over 35 years. The extent of the model area isapproximately 6,000 meters by 4,000 meters with elevation ranging from 750 to 1,800 meters. Seventeendrilling campaigns have been conducted on the property since 1968. These campaigns drilled a total of3,349 drill holes: 1,186 were diamond drill holes and 2,163 were reverse circulation. We have alsodrilled some hammer and percussion drill holes.
In 2008, La Caridad finished a large exploration program of 50,000 meters. The target was toreach to the 900 level in order to reduce the drilling space and to define the copper and molybdenummineralization continuity and also carry out metallurgical testing for the flotation and leachingprocesses. There was no exploration program in 2009, 2011 and 2013. In 2012 we drilled 10,000 metersand further defined the extent of the copper and molybdenum mineralization. From 2014 to 2017 wedrilled 96 diamond drill holes equivalent to 38,984 meters in order to define a high grade ore bodylocated in the south western edge of the pit (Bella Union location).
Concentrator
La Caridad uses state-of-the-art computer monitoring systems at the concentrator, the crushingplant and the flotation circuit in order to coordinate inflows and optimize operations. The concentratorhas a current capacity of 94,500 tons of ore per day.
Ore extracted from the mine with a copper grade over 0.30% is sent to the concentrator and isprocessed into copper concentrates and molybdenum concentrates. The copper concentrates are sent tothe smelter and the molybdenum concentrate is sold to a Mexican customer. The molybdenum recoveryplant has a capacity of 2,000 tons per day of copper-molybdenum concentrates. The lime plant has acapacity of 340 tons of finished product per day.
SX-EW Plant
Approximately 835.5 million tons of leaching ore with an average grade of approximately 0.243%copper have been extracted from the La Caridad open-pit mine and deposited in leaching dumps fromMay 1995 to December 31, 2017. All copper ore with a grade lower than the mill cut-off grade 0.30%,but higher than 0.15% copper, is delivered to the leaching dumps. In 1995, we completed theconstruction of a SX-EW facility at La Caridad that has allowed processing of this ore and certainleach ore reserves that were not mined and has resulted in a reduction in our copper production costs.The SX-EW facility has an annual design capacity of 21,900 tons of copper cathodes.
The plant has three trains of solvent extraction with a nominal capacity of 2,400 cubic meters perhour and 94 electrowinning cells distributed in one single electrolytic bay. The plant has a dailyproduction capacity of 65 tons of copper cathodes with 99.999% purity.
47
Processing Facilities—La Caridad
Our La Caridad complex includes a smelter, an electrolytic copper refinery, a precious metalrefinery, a copper rod plant and an effluent and dust treatment plant. The distance between thiscomplex and the La Caridad mine is approximately 24 kilometers.
Smelter
Copper concentrates from Buenavista, Santa Barbara, Charcas and La Caridad are transported byrail and truck to the La Caridad smelter where they are processed and cast into copper anodes of99.2% purity. Sulfur dioxide off-gases collected from the flash furnace, the El Teniente converter andconventional converters are processed into sulfuric acid at two sulfuric acid plants. Approximately 2%to 3% of this acid is used by our SX-EW plants and the balance is sold to third parties.
All of the anodes produced in the smelter are sent to the La Caridad copper refinery. The actualinstalled capacity of the smelter is 1,000,000 tons per year, a capacity that is sufficient to treat all theconcentrates of La Caridad and almost 40.5% of total production of the OMIMSA I and OMIMSA IIconcentrators from Buenavista, and starting in 2010, the concentrates from the IMMSA mines, as weclosed the San Luis Potosi smelter.
Other facilities in the smelter include two sulfuric acid plants with capacities of 2,625 and 2,135tons per day, three oxygen plants each with a production capacity of 275 tons per day; and one powerturbine which generates 11.5 MWh.
Refinery
La Caridad includes an electrolytic copper refinery that uses permanent cathode technology. Theinstalled capacity of the refinery is 300,000 tons per year. The refinery consists of an anode plant with apreparation area, an electrolytic plant with an electrolytic cell house with 1,115 cells and 32 liberatorcells, two cathode stripping machines, an anode washing machine, a slime treatment plant and anumber of ancillary installations. The refinery is producing grade A (LME) and grade 1 (COMEX)copper cathode of 99.99% purity. Anodic slimes are recovered from the refining process and sent tothe slimes treatment plant where additional copper is extracted. The slimes are then filtered, dried,packed and shipped to the La Caridad precious metals refinery to produce silver and gold.
Precious Metals Plant
The operations of the precious metal refinery begin with the reception of anodic slimes, which aredried in a steam dryer. After this, the dried slime is smelted and a gold and silver alloy is obtained,which is known as Dore. The precious metal refinery plant has a hydrometallurgical stage and apyrometallurgical stage, besides a steam dryer, Dore casting system, Kaldo furnace, 20 electrolytic cellsin the silver refinery, one induction furnace for fine silver, one silver ingot casting system and tworeactors for obtaining fine gold. The process ends with the refining of the gold and silver alloy. We alsorecover commercial selenium from the gas produced by the Kaldo furnace process.
Copper Rod Plant
A rod plant at the La Caridad complex began operations in 1998 and reached its full annualoperating capacity of 150,000 tons in 1999. The plant is producing eight millimeter copper rods with apurity of 99.99%.
Effluent and Dust Treatment Plant
In 2012, we started operating a dust and effluent plant with a treatment capacity of 5,000 tons ofsmelter dusts per year which will produce 1,500 tons of copper by-products and 2,500 tons of leadsulfates per year. This plant is designed to reduce dust emissions from La Caridad metallurgicalcomplex.
48
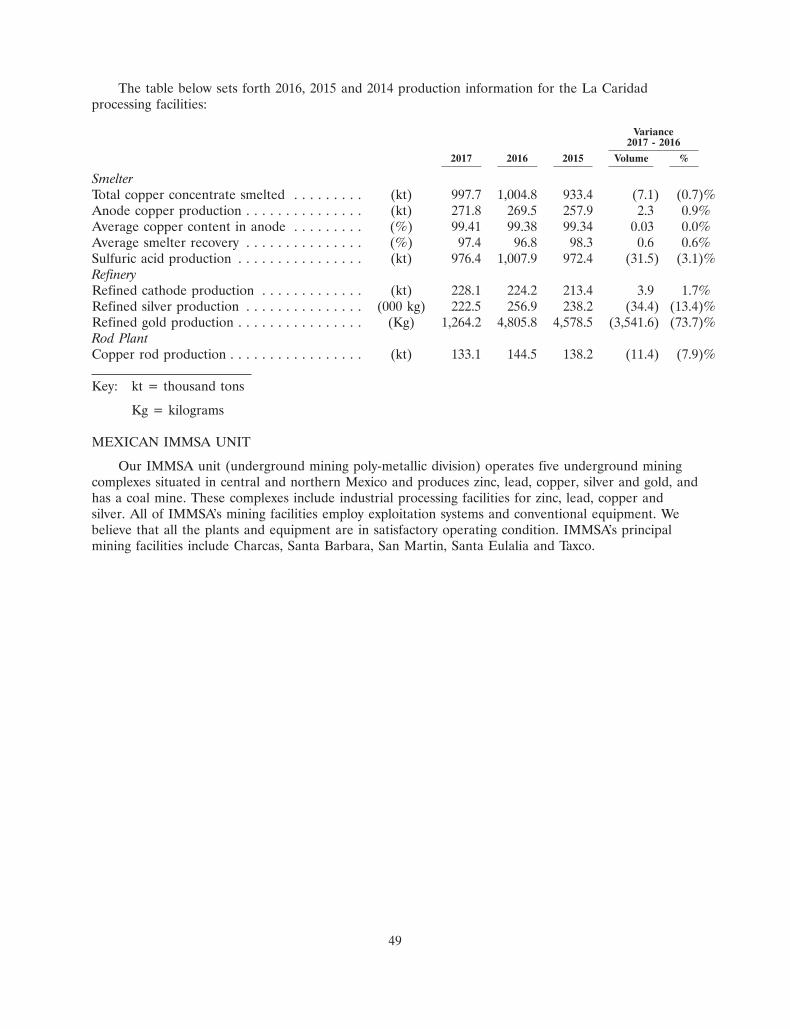
The table below sets forth 2016, 2015 and 2014 production information for the La Caridadprocessing facilities:
Variance2017 - 2016
2017 2016 2015 Volume %
SmelterTotal copper concentrate smelted . . . . . . . . . (kt) 997.7 1,004.8 933.4 (7.1) (0.7)%Anode copper production . . . . . . . . . . . . . . . (kt) 271.8 269.5 257.9 2.3 0.9%Average copper content in anode . . . . . . . . . (%) 99.41 99.38 99.34 0.03 0.0%Average smelter recovery . . . . . . . . . . . . . . . (%) 97.4 96.8 98.3 0.6 0.6%Sulfuric acid production . . . . . . . . . . . . . . . . (kt) 976.4 1,007.9 972.4 (31.5) (3.1)%RefineryRefined cathode production . . . . . . . . . . . . . (kt) 228.1 224.2 213.4 3.9 1.7%Refined silver production . . . . . . . . . . . . . . . (000 kg) 222.5 256.9 238.2 (34.4) (13.4)%Refined gold production . . . . . . . . . . . . . . . . (Kg) 1,264.2 4,805.8 4,578.5 (3,541.6) (73.7)%Rod PlantCopper rod production . . . . . . . . . . . . . . . . . (kt) 133.1 144.5 138.2 (11.4) (7.9)%
Key: kt = thousand tons
Kg = kilograms
MEXICAN IMMSA UNIT
Our IMMSA unit (underground mining poly-metallic division) operates five underground miningcomplexes situated in central and northern Mexico and produces zinc, lead, copper, silver and gold, andhas a coal mine. These complexes include industrial processing facilities for zinc, lead, copper andsilver. All of IMMSA’s mining facilities employ exploitation systems and conventional equipment. Webelieve that all the plants and equipment are in satisfactory operating condition. IMMSA’s principalmining facilities include Charcas, Santa Barbara, San Martin, Santa Eulalia and Taxco.
49
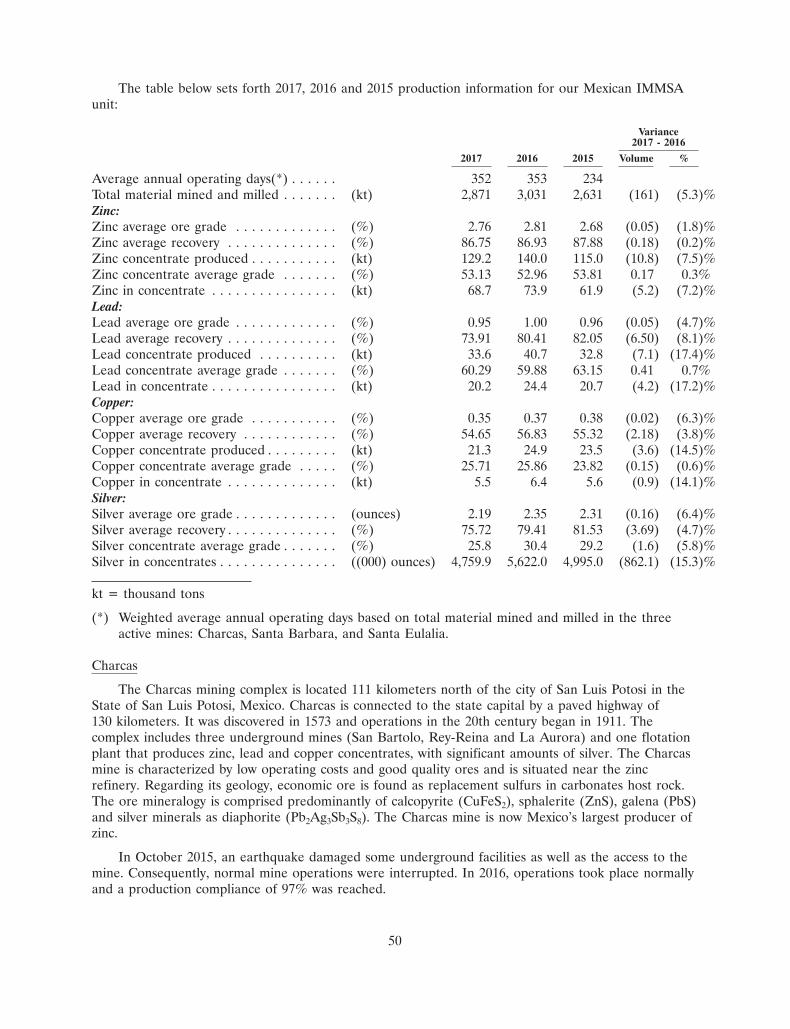
The table below sets forth 2017, 2016 and 2015 production information for our Mexican IMMSAunit:
Variance2017 - 2016
2017 2016 2015 Volume %
Average annual operating days(*) . . . . . . 352 353 234Total material mined and milled . . . . . . . (kt) 2,871 3,031 2,631 (161) (5.3)%Zinc:Zinc average ore grade . . . . . . . . . . . . . (%) 2.76 2.81 2.68 (0.05) (1.8)%Zinc average recovery . . . . . . . . . . . . . . (%) 86.75 86.93 87.88 (0.18) (0.2)%Zinc concentrate produced . . . . . . . . . . . (kt) 129.2 140.0 115.0 (10.8) (7.5)%Zinc concentrate average grade . . . . . . . (%) 53.13 52.96 53.81 0.17 0.3%Zinc in concentrate . . . . . . . . . . . . . . . . (kt) 68.7 73.9 61.9 (5.2) (7.2)%Lead:Lead average ore grade . . . . . . . . . . . . . (%) 0.95 1.00 0.96 (0.05) (4.7)%Lead average recovery . . . . . . . . . . . . . . (%) 73.91 80.41 82.05 (6.50) (8.1)%Lead concentrate produced . . . . . . . . . . (kt) 33.6 40.7 32.8 (7.1) (17.4)%Lead concentrate average grade . . . . . . . (%) 60.29 59.88 63.15 0.41 0.7%Lead in concentrate . . . . . . . . . . . . . . . . (kt) 20.2 24.4 20.7 (4.2) (17.2)%Copper:Copper average ore grade . . . . . . . . . . . (%) 0.35 0.37 0.38 (0.02) (6.3)%Copper average recovery . . . . . . . . . . . . (%) 54.65 56.83 55.32 (2.18) (3.8)%Copper concentrate produced . . . . . . . . . (kt) 21.3 24.9 23.5 (3.6) (14.5)%Copper concentrate average grade . . . . . (%) 25.71 25.86 23.82 (0.15) (0.6)%Copper in concentrate . . . . . . . . . . . . . . (kt) 5.5 6.4 5.6 (0.9) (14.1)%Silver:Silver average ore grade . . . . . . . . . . . . . (ounces) 2.19 2.35 2.31 (0.16) (6.4)%Silver average recovery . . . . . . . . . . . . . . (%) 75.72 79.41 81.53 (3.69) (4.7)%Silver concentrate average grade . . . . . . . (%) 25.8 30.4 29.2 (1.6) (5.8)%Silver in concentrates . . . . . . . . . . . . . . . ((000) ounces) 4,759.9 5,622.0 4,995.0 (862.1) (15.3)%
kt = thousand tons
(*) Weighted average annual operating days based on total material mined and milled in the threeactive mines: Charcas, Santa Barbara, and Santa Eulalia.
Charcas
The Charcas mining complex is located 111 kilometers north of the city of San Luis Potosi in theState of San Luis Potosi, Mexico. Charcas is connected to the state capital by a paved highway of130 kilometers. It was discovered in 1573 and operations in the 20th century began in 1911. Thecomplex includes three underground mines (San Bartolo, Rey-Reina and La Aurora) and one flotationplant that produces zinc, lead and copper concentrates, with significant amounts of silver. The Charcasmine is characterized by low operating costs and good quality ores and is situated near the zincrefinery. Regarding its geology, economic ore is found as replacement sulfurs in carbonates host rock.The ore mineralogy is comprised predominantly of calcopyrite (CuFeS2), sphalerite (ZnS), galena (PbS)and silver minerals as diaphorite (Pb2Ag3Sb3S8). The Charcas mine is now Mexico’s largest producer ofzinc.
In October 2015, an earthquake damaged some underground facilities as well as the access to themine. Consequently, normal mine operations were interrupted. In 2016, operations took place normallyand a production compliance of 97% was reached.
50
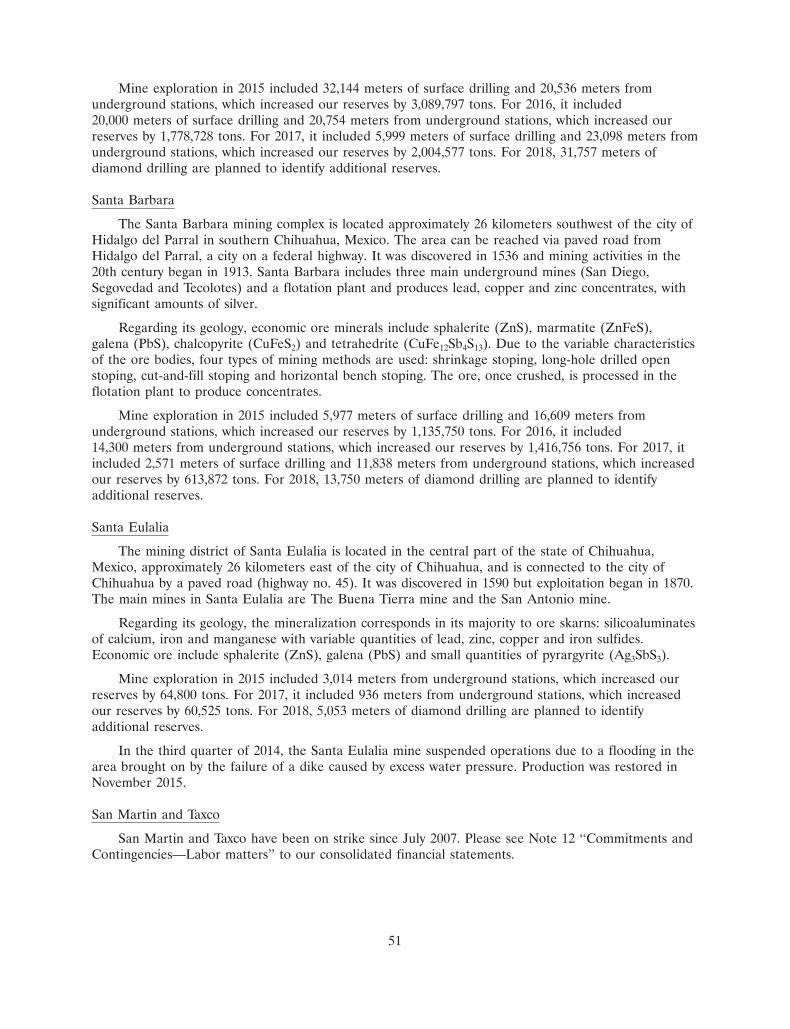
Mine exploration in 2015 included 32,144 meters of surface drilling and 20,536 meters fromunderground stations, which increased our reserves by 3,089,797 tons. For 2016, it included20,000 meters of surface drilling and 20,754 meters from underground stations, which increased ourreserves by 1,778,728 tons. For 2017, it included 5,999 meters of surface drilling and 23,098 meters fromunderground stations, which increased our reserves by 2,004,577 tons. For 2018, 31,757 meters ofdiamond drilling are planned to identify additional reserves.
Santa Barbara
The Santa Barbara mining complex is located approximately 26 kilometers southwest of the city ofHidalgo del Parral in southern Chihuahua, Mexico. The area can be reached via paved road fromHidalgo del Parral, a city on a federal highway. It was discovered in 1536 and mining activities in the20th century began in 1913. Santa Barbara includes three main underground mines (San Diego,Segovedad and Tecolotes) and a flotation plant and produces lead, copper and zinc concentrates, withsignificant amounts of silver.
Regarding its geology, economic ore minerals include sphalerite (ZnS), marmatite (ZnFeS),galena (PbS), chalcopyrite (CuFeS2) and tetrahedrite (CuFe12Sb4S13). Due to the variable characteristicsof the ore bodies, four types of mining methods are used: shrinkage stoping, long-hole drilled openstoping, cut-and-fill stoping and horizontal bench stoping. The ore, once crushed, is processed in theflotation plant to produce concentrates.
Mine exploration in 2015 included 5,977 meters of surface drilling and 16,609 meters fromunderground stations, which increased our reserves by 1,135,750 tons. For 2016, it included14,300 meters from underground stations, which increased our reserves by 1,416,756 tons. For 2017, itincluded 2,571 meters of surface drilling and 11,838 meters from underground stations, which increasedour reserves by 613,872 tons. For 2018, 13,750 meters of diamond drilling are planned to identifyadditional reserves.
Santa Eulalia
The mining district of Santa Eulalia is located in the central part of the state of Chihuahua,Mexico, approximately 26 kilometers east of the city of Chihuahua, and is connected to the city ofChihuahua by a paved road (highway no. 45). It was discovered in 1590 but exploitation began in 1870.The main mines in Santa Eulalia are The Buena Tierra mine and the San Antonio mine.
Regarding its geology, the mineralization corresponds in its majority to ore skarns: silicoaluminatesof calcium, iron and manganese with variable quantities of lead, zinc, copper and iron sulfides.Economic ore include sphalerite (ZnS), galena (PbS) and small quantities of pyrargyrite (Ag3SbS3).
Mine exploration in 2015 included 3,014 meters from underground stations, which increased ourreserves by 64,800 tons. For 2017, it included 936 meters from underground stations, which increasedour reserves by 60,525 tons. For 2018, 5,053 meters of diamond drilling are planned to identifyadditional reserves.
In the third quarter of 2014, the Santa Eulalia mine suspended operations due to a flooding in thearea brought on by the failure of a dike caused by excess water pressure. Production was restored inNovember 2015.
San Martin and Taxco
San Martin and Taxco have been on strike since July 2007. Please see Note 12 ‘‘Commitments andContingencies—Labor matters’’ to our consolidated financial statements.
51
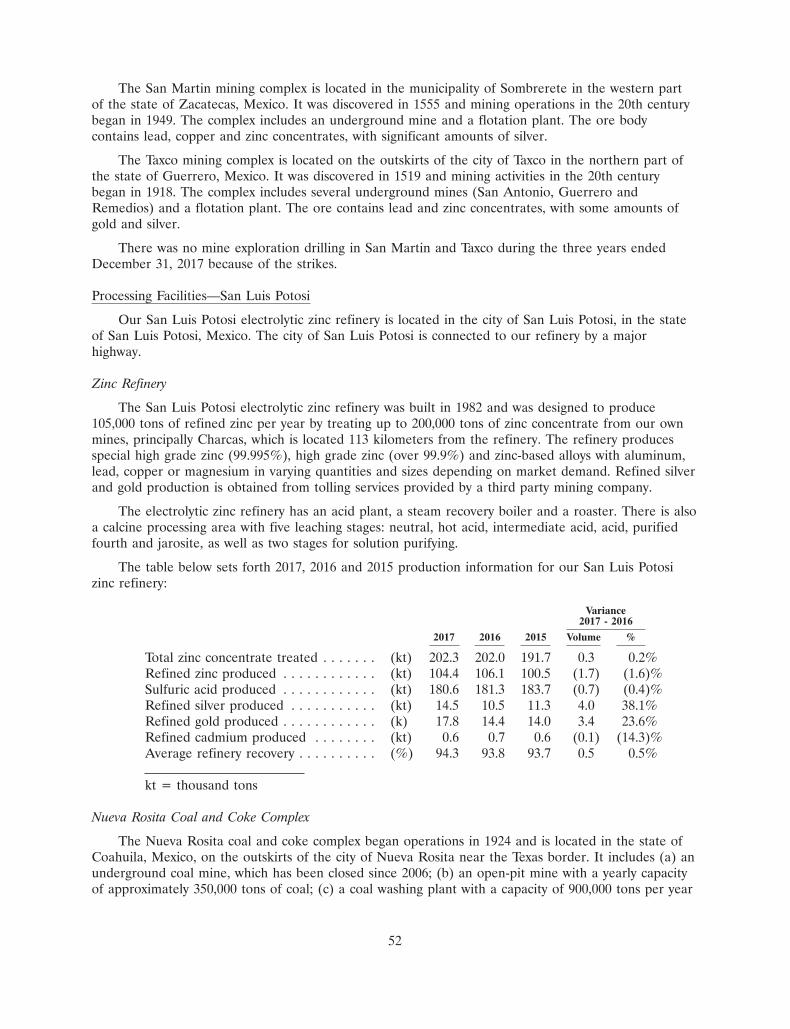
The San Martin mining complex is located in the municipality of Sombrerete in the western partof the state of Zacatecas, Mexico. It was discovered in 1555 and mining operations in the 20th centurybegan in 1949. The complex includes an underground mine and a flotation plant. The ore bodycontains lead, copper and zinc concentrates, with significant amounts of silver.
The Taxco mining complex is located on the outskirts of the city of Taxco in the northern part ofthe state of Guerrero, Mexico. It was discovered in 1519 and mining activities in the 20th centurybegan in 1918. The complex includes several underground mines (San Antonio, Guerrero andRemedios) and a flotation plant. The ore contains lead and zinc concentrates, with some amounts ofgold and silver.
There was no mine exploration drilling in San Martin and Taxco during the three years endedDecember 31, 2017 because of the strikes.
Processing Facilities—San Luis Potosi
Our San Luis Potosi electrolytic zinc refinery is located in the city of San Luis Potosi, in the stateof San Luis Potosi, Mexico. The city of San Luis Potosi is connected to our refinery by a majorhighway.
Zinc Refinery
The San Luis Potosi electrolytic zinc refinery was built in 1982 and was designed to produce105,000 tons of refined zinc per year by treating up to 200,000 tons of zinc concentrate from our ownmines, principally Charcas, which is located 113 kilometers from the refinery. The refinery producesspecial high grade zinc (99.995%), high grade zinc (over 99.9%) and zinc-based alloys with aluminum,lead, copper or magnesium in varying quantities and sizes depending on market demand. Refined silverand gold production is obtained from tolling services provided by a third party mining company.
The electrolytic zinc refinery has an acid plant, a steam recovery boiler and a roaster. There is alsoa calcine processing area with five leaching stages: neutral, hot acid, intermediate acid, acid, purifiedfourth and jarosite, as well as two stages for solution purifying.
The table below sets forth 2017, 2016 and 2015 production information for our San Luis Potosizinc refinery:
Variance2017 - 2016
2017 2016 2015 Volume %
Total zinc concentrate treated . . . . . . . (kt) 202.3 202.0 191.7 0.3 0.2%Refined zinc produced . . . . . . . . . . . . (kt) 104.4 106.1 100.5 (1.7) (1.6)%Sulfuric acid produced . . . . . . . . . . . . (kt) 180.6 181.3 183.7 (0.7) (0.4)%Refined silver produced . . . . . . . . . . . (kt) 14.5 10.5 11.3 4.0 38.1%Refined gold produced . . . . . . . . . . . . (k) 17.8 14.4 14.0 3.4 23.6%Refined cadmium produced . . . . . . . . (kt) 0.6 0.7 0.6 (0.1) (14.3)%Average refinery recovery . . . . . . . . . . (%) 94.3 93.8 93.7 0.5 0.5%
kt = thousand tons
Nueva Rosita Coal and Coke Complex
The Nueva Rosita coal and coke complex began operations in 1924 and is located in the state ofCoahuila, Mexico, on the outskirts of the city of Nueva Rosita near the Texas border. It includes (a) anunderground coal mine, which has been closed since 2006; (b) an open-pit mine with a yearly capacityof approximately 350,000 tons of coal; (c) a coal washing plant with a capacity of 900,000 tons per year
52
that produces high quality clean coal; and d) a re-engineered and modernized 21 ovens coke facilitycapable of producing 100,000 tons of coke per year (metallurgical, nut and fine) of which, 95,000 tonsare metallurgical coke. There is also a by-product plant to clean the coke gas oven in which tar,ammonium sulfate and light crude oil are recovered. There are also two boilers, which produce80,000 pounds of steam that is used in the by-products plant. In September 2017, a decision was madeto close the coke plant, and initiate the cleaning and remediation process.
Carbon mine exploration
In Coahuila, an intensive exploration program of diamond drilling has identified two additionalareas, Esperanza with a potential for more than 30 million tons of ‘‘in place’’ mineralized coal andGuayacan with a potential for 15 million tons of ‘‘in place’’ mineralized coal, that could be used for afuture coal-fired power plant. In 2015, we drilled 3,046 meters and increased our reserves by465,509 tons. In 2016, we drilled 1,052 meters and finished the last stage of exploration in two areas foropen pit, San Jose y Cuatro y medio, and increased reserves by 607,532. In 2017, we did not undertakeexploration activites.
The table below sets forth 2017, 2016 and 2015 production information for our Nueva Rosita coaland coke complex:
Variance2017 - 2016
2017 2016 2015 Volume %
Coal mined—open-pit . . . . . . . . . . . . . . . . . . . . (kt) 132.7 194.3 248.5 (61.6) (31.7)%Average BTU content . . . . . . . . . . . . . . . . . . . . BTU/Lb 10,022 9,485 9,485 537 5.7%Average percent sulfur . . . . . . . . . . . . . . . . . . . % 1.38 1.49 1.49 (0.11) (7.4)%Clean coal produced . . . . . . . . . . . . . . . . . . . . . (kt) 66.4 86.2 114.3 (19.8) (23.0)%Coke tonnage produced . . . . . . . . . . . . . . . . . . (kt) 45.4 71.7 97.5 (26.3) (36.7)%Average realized price—Coal . . . . . . . . . . . . . . . ($ per ton) 29.2 40.2 39.9 (11.0) (27.4)%Average realized price—Coke . . . . . . . . . . . . . . ($ per ton) 233.0 215.0 250.0 18.0 5.7%
kt = thousand tons
ORE RESERVES
Ore reserves are those estimated quantities of proven and probable material that may beeconomically mined and processed for extraction of their mineral content, at the time of the reservedetermination. ‘‘Proven’’ (measured) reserves are reserves for which (a) quantity is computed fromdimensions revealed in outcrops, trenches, workings or drill holes; (b) grade and/or quality arecomputed from the results of detailed samplings; and (c) the sites for inspection, sampling andmeasurement are spaced so closely and the geologic character is so well defined that size, shape, depthand mineral content of reserves are well-established. ‘‘Probable’’ (indicated) reserves are reserves forwhich quantity and grade and/or quality are computed from information similar to that used for proven(measured) reserves, but the sites for inspection, sampling, and measurement are farther apart or areotherwise less adequately spaced. The degree of assurance, although lower than that for proven(measured) reserves, is high enough to assume continuity between points of observation. ‘‘Mineralizedmaterial,’’ on the other hand, is a mineralized body that has been delineated by appropriately spaceddrilling and/or underground sampling to support the reported tonnage and average grade of metal(s).Such a deposit does not qualify as a reserve until legal and economic feasibility are concluded basedupon a comprehensive evaluation of unit costs, grade, recoveries and other material factors.
Our proven and probable ore reserve estimates are based on engineering evaluations of assayvalues derived from the sampling of drill holes and other openings. We believe that the samplings taken
53
are spaced at intervals close enough and the geological characteristics of the deposits are sufficientlywell defined to render the estimates reliable. The ore reserves estimates include assessments of theresource, mining and metallurgy, as well as economic, marketing, legal, environmental, governmental,social and other necessary considerations.
Our Peruvian operations, including the Toquepala and Cuajone reserves, are classified into proven(measured), probable (indicated) and possible (inferred) categories based on a Relative ConfidenceBound Index (‘‘RCB Index’’) that measures our level of geologic knowledge and confidence in eachblock. The RCB index is a measure of relative confidence in the block grade estimate. This approachcombines the local variability of the composites used to krig a block with the kriging variance andincorporates the use of confidence intervals in measuring uncertainty of the block estimates relative toeach other. The final resource classification is then based on the distribution of these RCB values forblocks above 0.05% copper. It is the distribution that is used to find the breaks between proven/probable and probable/possible.
Our Mexican operations, including the Buenavista and La Caridad reserves, are calculated using amathematical block model and applying the MineSight software system. The estimated grades per blockare classified as proven and probable. These grades are calculated applying a three-dimensionalinterpolation procedure and the inverse distance squared. Likewise, the quadrant method or sphericalsearch is implemented in order to limit the number of composites that will affect the block’sinterpolated value. The composites data is derived from the geological exploration of the ore body. Inorder to classify the individual blocks in the model, a thorough geostatistical variogram analysis isconducted, taking into consideration the principal characteristics of the deposit. Based on this blockmodel classification, and with the implementation of the Lerch-Grossman algorithm, and the MineSightPit Optimizer procedure, mineable reserves are determined. The calculated proven and probablereserves include those blocks that are economically feasible to mine by open-pit method within aparticular mine design.
For the IMMSA unit, the basis for reserve estimations are sampling of mining operations anddrilling exploration, geographical and topographic surveys, tracking down all the foregoing in thecorresponding maps, measurement, calculation and interpretation based on the maps and reports fromthe mines, the mills and/or smelters. Mineral reserves are mineral stock which is estimated forextraction, to exploit if necessary, to sell or utilize economically, all or in part, taking into considerationthe quotations, subsidies, costs, availability of treatment plants and other conditions which we estimatewill prevail in the period for which reserves are being calculated. The reserves are divided into proven(85% reliable or more according to statistical studies) and probable (70%-80% reliable or moreaccording to statistical studies) categories according to their level of reliability and availability. In orderto comply with SEC regulations, proven reserves is a classification that can only be used for suchmineral found on top of the last level of the mine (either mineral up to 15 meters below the last levelor below the first 15 meters only with sufficient drilling (25 or 30 meters between each drill)).
Annually our engineering department reviews in detail the reserve computations. In addition, ourengineering department reviews the computation when changes in assumptions occur. Changes canoccur for price or cost assumptions, results in field drilling or new geotechnical parameters. We alsoengage third party consultants to review mine planning procedures.
Pursuant to SEC guidance, the reserves information in this report are calculated using averagemetals prices over the most recent three years unless otherwise stated. We refer to these three-yearaverage metals prices as ‘‘current prices.’’ Our current prices for copper are calculated using pricesquoted by COMEX, and our current prices for molybdenum are calculated according to Platt’s MetalsWeek. Unless otherwise stated, reserves estimates in this report use $2.50 per pound for copper and$7.07 per pound for molybdenum, both current prices as of December 31, 2017. The current prices forcopper and molybdenum were $2.61 and $8.10 as of December 31, 2016 and $2.99 and $9.38 as ofDecember 31, 2015, respectively.
54
For internal ore reserve estimation, our management uses long-term metal price assumptions forcopper and molybdenum, which are intended to approximate average prices over the long term. AtDecember 31, 2017, we consider $2.90 per pound of copper and $7.50 per pound of molybdenum. AtDecember 31,2016, we considered $2.90 per pound of copper and $6.50 per pound of molybdenum.
The average metal prices over the last 10 and 15 years periods and the continued positive outlookfor these metals have led us to use these prices. For other forecast and planning purposes, particularlyrelated to merger and acquisition activities, our management considers other price scenarios. Thesechanges, however, do not affect the preparation of our financial statements.
For the years 2017, 2016 and 2015, we have used reserve estimates based on current average pricesas of the most recent three years then ended to determine amortization of mine development andintangible assets.
We periodically reevaluate estimates of our ore reserves, which represent our estimate as to theamount of unmined copper remaining in our existing mine locations that can be produced and sold at aprofit. These estimates are based on engineering evaluations derived from samples of drill holes andother openings, combined with assumptions about copper market prices and production costs at each ofour mines.
The persons responsible for ore reserve calculations are as follows:
Peruvian open-pit:
Cuajone mine—Edgar A. Pena Valenzuela, Mine Engineering SuperintendentToquepala mine—Wilbert Perez, Mine Engineering Superintendent
Tia Maria project:
Jaime Arana Murriel, Investment Projects Leaching Manager
Mexican open-pit:
La Caridad Mine—Gilberto Quintana, Mine Manager (with support of Hexagon Mining)Buenavista mine—Jesus Molinares, Engineering and Mine Planning Superintendent
IMMSA unit:
Santa Barbara—Raul Guerrero Valdez, ManagerCharcas—Juan J. Aguilar, Planning and Control SuperintendentSanta Eulalia—Jose Rovelo Saenz, ManagerTaxco—Jose M. Espinosa, ManagerSan Martin—Maria I. Carrillo, Planning Manager
El Arco project:
Michelle P. Cerecer A., Planning Engineer (with support of Hexagon Mining)
El Pilar project:
Michelle P. Cerecer A., Planning Engineer (with support of Hexagon Mining)
Pilares project:
Michelle P. Cerecer A., Planning Engineer (with support of Hexagon Mining)
For more information regarding our reserve estimates, please see Item 7 ‘‘Management’sDiscussion and Analysis of Financial Condition and Results of Operations—Critical Accounting Policiesand Estimates—Ore Reserves.’’
55
Ore Reserves Estimated at Current Prices:
The table below details our estimated proven and probable copper and molybdenum reserves atDecember 31, 2017 based on the last three year average market prices following SEC guidance:
PERUVIAN MEXICANOPEN-PIT UNIT OPEN-PIT UNIT DEVELOPMENT PROJECTSTOTAL MEXICAN
Cuajone Toquepala Buenavista La Caridad OPEN-PIT IMMSA TiaMine(1) Mine(1) Mine(1) Mine(1) MINES UNIT(2) Maria El Arco El Pilar Pilares
Mineral ReservesMetal prices:Copper ($/lb.) . . . . . . . . 2.50 2.50 2.50 2.50 2.50 2.50 2.50 2.50 2.50 2.50Molybdenum ($/lb.) . . . . 7.07 7.07 7.07 7.07 7.07 7.07Cut-off grade . . . . . . . . 0.228% 0.242% 0.209% 0.121% 0.200% 0.221% 0.150% 0.195%ProvenSulfide ore reserves(kt) . . 1,035,113 1,854,882 2,355,862 1,611,033 6,856,890 18,227 — 1,353,678 — 10,736Average grade:
Copper . . . . . . . . . . 0.581% 0.563% 0.504% 0.253% 0.473% 0.470% — 0.446% — 0.854%Molybdenum . . . . . . . 0.019% 0.034% 0.007% 0.027% 0.021% — 0.007%Lead . . . . . . . . . . . . — — — — — 1.220% — — — —Zinc . . . . . . . . . . . . — — — — — 2.800% — — — —
Leachable material(kt) . . . 615 743,090 2,225,252 636,312 3,605,269 — 211,187 188,556 276,962 —Leachable material grade . 0.648% 0.213% 0.192% 0.171% 0.193% — 0.331% 0.330% 0.293% —ProbableSulfide ore reserves(kt) . . 746,881 159,836 1,103,853 638,494 2,649,064 28,559 — 950,039 — 25,621Average grade:
Copper . . . . . . . . . . 0.422% 0.373% 0.448% 0.250% 0.388% 0.520% — 0.410% — 0.761%Molybdenum . . . . . . . 0.016% 0.012% 0.007% 0.028% 0.015% — — 0.008% —Lead . . . . . . . . . . . . — — — — — 0.870% — — — —Zinc . . . . . . . . . . . . — — — — — 2.840% — — — —
Leachable material(kt) . . . 2,533 992,528 832,605 232,742 2,060,408 — 510,258 65,919 18,259 —Leachable material grade . 0.775% 0.154% 0.169% 0.162% 0.162% — 0.371% 0.159% 0.266% —TotalSulfide ore reserves(kt) . . 1,781,994 2,014,718 3,459,714 2,249,527 9,505,953 46,785 — 2,303,717 — 36,357Average grade:
Copper . . . . . . . . . . 0.515% 0.548% 0.486% 0.252% 0.449% 0.501% — 0.431% — 0.788%Molybdenum . . . . . . . 0.018% 0.032% 0.007% 0.027% 0.019% — — 0.007% — —Lead . . . . . . . . . . . . — — — — — 1.006% — — — —Zinc . . . . . . . . . . . . — — — — — 2.824% — — — —
Leachable material(kt) . . . 3,148 1,735,618 3,057,858 869,054 5,665,678 — 721,445 254,475 295,221 —Leachable material grade . 0.750% 0.179% 0.186% 0.169% 0.181% — 0.359% 0.286% 0.291% 0.000%Waste(kt) . . . . . . . . . . 4,819,036 7,770,720 5,508,426 1,441,730 19,539,912 — 644,868 1,997,867 446,828 180,165Total material(kt) . . . . . . 6,604,178 11,521,056 12,025,998 4,560,311 34,711,543 46,785 1,366,312 4,556,059 742,049 216,522Stripping ratio((W+L)/O) . 2.71 4.72 2.48 1.03 2.65 — 0.98 4.96Stripping ratio(W/(L+O)) . 2.70 2.07 0.85 0.46 1.29 — 0.89 0.78 1.51 4.96Leachable materialReserves in stock(kt) . . . . 17,904 1,446,708 1,530,984 835,546 3,831,142 — — — — —Average copper grade . . . 0.492% 0.156% 0.159% 0.244% 0.178% — — — — —In pit reserves:Proven(kt) . . . . . . . . . . 615 743,090 2,225,252 636,312 3,605,269 — 211,187 188,556 276,962 —Average copper grade . . . 0.648% 0.213% 0.192% 0.171% 0.193% — 0.331% 0.330% 0.293% 0.000%Probable(kt) . . . . . . . . . 2,533 992,528 832,605 232,742 2,060,408 — 510,258 65,919 18,259 —Average copper grade . . . 0.775% 0.154% 0.169% 0.162% 0.162% — 0.371% 0.159% 0.266% 0.000%Total leachable reserves(kt) 21,052 3,182,326 4,588,842 1,704,600 9,496,820 — 721,445 254,475 295,221 —Average copper grade . . . 0.531% 0.169% 0.177% 0.206% 0.180% — 0.359% 0.286% 0.291% 0.000%Copper contained in ore
reserves in pit(kt)(3) . . 9,201 14,147 22,502 7,138 52,988 234 2,590 10,657 859 286
kt = Thousand tons
W= Waste, L= Leachable material; O= Ore.
(1) The Cuajone, Toquepala, Buenavista and La Caridad concentrator recoveries calculated for these reserves were 86.1%, 87.4%, 83.0%, and82.5%, respectively, obtained by using recovery formulas according to the different milling capacity and geo-metallurgical zones.
(2) The IMMSA unit includes the Charcas, Santa Barbara, San Martin, Santa Eulalia and Taxco mines. Zinc and lead contained in ore reservesare as follows:
Proven Probable Total(in thousand tons)Zinc . . . . . . . . . . . . . . . . . . . . . . . . . . . . . . . . . . . . . . . . . . . . . . . . . . . . . 510.3 811.1 1,321.4Lead . . . . . . . . . . . . . . . . . . . . . . . . . . . . . . . . . . . . . . . . . . . . . . . . . . . . . 222.4 248.5 470.9
(3) Copper contained in ore reserves for open-pit mines is (i) the product of sulfide ore reserves and the average copper grade proven plus (ii) theproduct of sulfide ore reserves and the average copper grade probable plus (iii) the product of in-pit leachable reserves and the average coppergrade. Copper contained in ore reserves for underground mines is the product of sulfide ore reserves and the average copper grade.
56
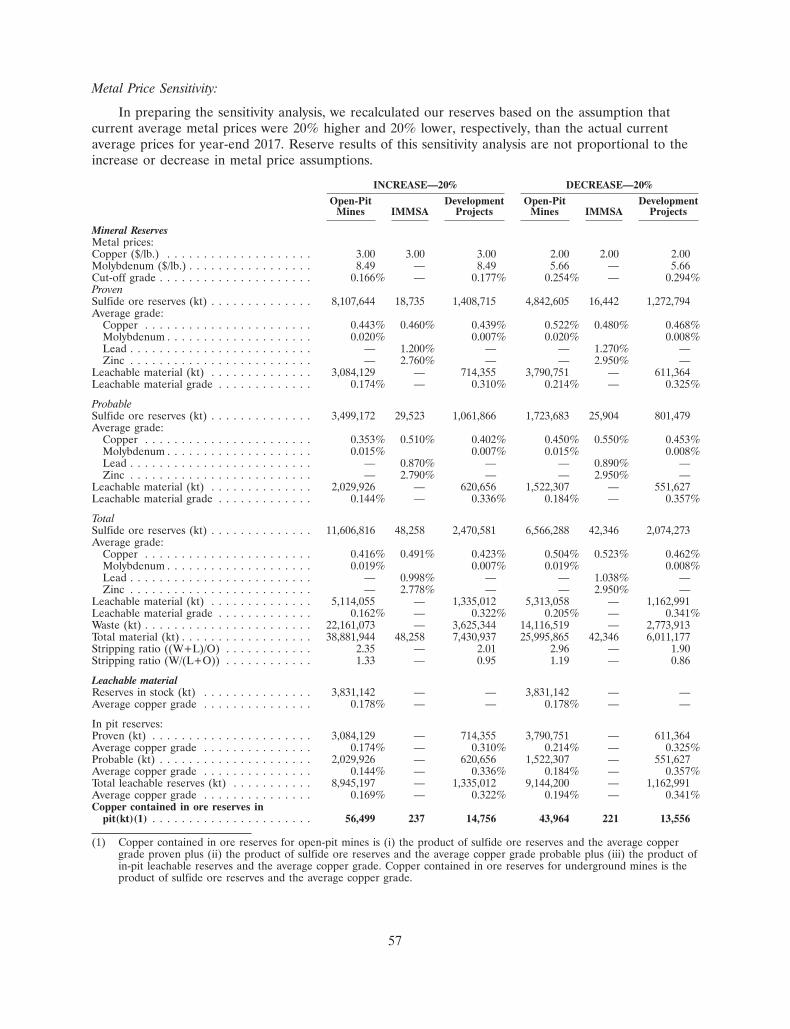
Metal Price Sensitivity:
In preparing the sensitivity analysis, we recalculated our reserves based on the assumption thatcurrent average metal prices were 20% higher and 20% lower, respectively, than the actual currentaverage prices for year-end 2017. Reserve results of this sensitivity analysis are not proportional to theincrease or decrease in metal price assumptions.
INCREASE—20% DECREASE—20%
Open-Pit Development Open-Pit DevelopmentMines IMMSA Projects Mines IMMSA Projects
Mineral ReservesMetal prices:Copper ($/lb.) . . . . . . . . . . . . . . . . . . . . 3.00 3.00 3.00 2.00 2.00 2.00Molybdenum ($/lb.) . . . . . . . . . . . . . . . . . 8.49 — 8.49 5.66 — 5.66Cut-off grade . . . . . . . . . . . . . . . . . . . . . 0.166% — 0.177% 0.254% — 0.294%ProvenSulfide ore reserves (kt) . . . . . . . . . . . . . . 8,107,644 18,735 1,408,715 4,842,605 16,442 1,272,794Average grade:
Copper . . . . . . . . . . . . . . . . . . . . . . . 0.443% 0.460% 0.439% 0.522% 0.480% 0.468%Molybdenum . . . . . . . . . . . . . . . . . . . . 0.020% 0.007% 0.020% 0.008%Lead . . . . . . . . . . . . . . . . . . . . . . . . . — 1.200% — — 1.270% —Zinc . . . . . . . . . . . . . . . . . . . . . . . . . — 2.760% — — 2.950% —
Leachable material (kt) . . . . . . . . . . . . . . 3,084,129 — 714,355 3,790,751 — 611,364Leachable material grade . . . . . . . . . . . . . 0.174% — 0.310% 0.214% — 0.325%
ProbableSulfide ore reserves (kt) . . . . . . . . . . . . . . 3,499,172 29,523 1,061,866 1,723,683 25,904 801,479Average grade:
Copper . . . . . . . . . . . . . . . . . . . . . . . 0.353% 0.510% 0.402% 0.450% 0.550% 0.453%Molybdenum . . . . . . . . . . . . . . . . . . . . 0.015% 0.007% 0.015% 0.008%Lead . . . . . . . . . . . . . . . . . . . . . . . . . — 0.870% — — 0.890% —Zinc . . . . . . . . . . . . . . . . . . . . . . . . . — 2.790% — — 2.950% —
Leachable material (kt) . . . . . . . . . . . . . . 2,029,926 — 620,656 1,522,307 — 551,627Leachable material grade . . . . . . . . . . . . . 0.144% — 0.336% 0.184% — 0.357%
TotalSulfide ore reserves (kt) . . . . . . . . . . . . . . 11,606,816 48,258 2,470,581 6,566,288 42,346 2,074,273Average grade:
Copper . . . . . . . . . . . . . . . . . . . . . . . 0.416% 0.491% 0.423% 0.504% 0.523% 0.462%Molybdenum . . . . . . . . . . . . . . . . . . . . 0.019% 0.007% 0.019% 0.008%Lead . . . . . . . . . . . . . . . . . . . . . . . . . — 0.998% — — 1.038% —Zinc . . . . . . . . . . . . . . . . . . . . . . . . . — 2.778% — — 2.950% —
Leachable material (kt) . . . . . . . . . . . . . . 5,114,055 — 1,335,012 5,313,058 — 1,162,991Leachable material grade . . . . . . . . . . . . . 0.162% — 0.322% 0.205% — 0.341%Waste (kt) . . . . . . . . . . . . . . . . . . . . . . . 22,161,073 — 3,625,344 14,116,519 — 2,773,913Total material (kt) . . . . . . . . . . . . . . . . . . 38,881,944 48,258 7,430,937 25,995,865 42,346 6,011,177Stripping ratio ((W+L)/O) . . . . . . . . . . . . 2.35 — 2.01 2.96 — 1.90Stripping ratio (W/(L+O)) . . . . . . . . . . . . 1.33 — 0.95 1.19 — 0.86
Leachable materialReserves in stock (kt) . . . . . . . . . . . . . . . 3,831,142 — — 3,831,142 — —Average copper grade . . . . . . . . . . . . . . . 0.178% — — 0.178% — —
In pit reserves:Proven (kt) . . . . . . . . . . . . . . . . . . . . . . 3,084,129 — 714,355 3,790,751 — 611,364Average copper grade . . . . . . . . . . . . . . . 0.174% — 0.310% 0.214% — 0.325%Probable (kt) . . . . . . . . . . . . . . . . . . . . . 2,029,926 — 620,656 1,522,307 — 551,627Average copper grade . . . . . . . . . . . . . . . 0.144% — 0.336% 0.184% — 0.357%Total leachable reserves (kt) . . . . . . . . . . . 8,945,197 — 1,335,012 9,144,200 — 1,162,991Average copper grade . . . . . . . . . . . . . . . 0.169% — 0.322% 0.194% — 0.341%Copper contained in ore reserves in
pit(kt)(1) . . . . . . . . . . . . . . . . . . . . . . 56,499 237 14,756 43,964 221 13,556
(1) Copper contained in ore reserves for open-pit mines is (i) the product of sulfide ore reserves and the average coppergrade proven plus (ii) the product of sulfide ore reserves and the average copper grade probable plus (iii) the product ofin-pit leachable reserves and the average copper grade. Copper contained in ore reserves for underground mines is theproduct of sulfide ore reserves and the average copper grade.
57
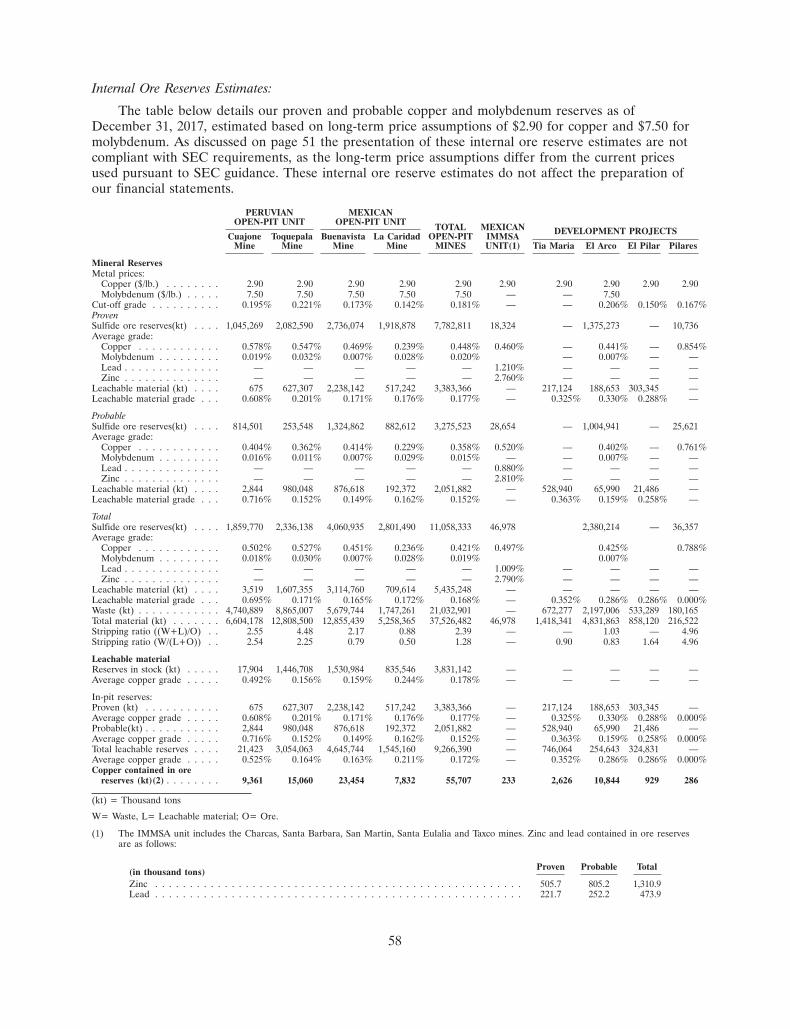
Internal Ore Reserves Estimates:
The table below details our proven and probable copper and molybdenum reserves as ofDecember 31, 2017, estimated based on long-term price assumptions of $2.90 for copper and $7.50 formolybdenum. As discussed on page 51 the presentation of these internal ore reserve estimates are notcompliant with SEC requirements, as the long-term price assumptions differ from the current pricesused pursuant to SEC guidance. These internal ore reserve estimates do not affect the preparation ofour financial statements.
PERUVIAN MEXICANOPEN-PIT UNIT OPEN-PIT UNIT TOTAL MEXICAN DEVELOPMENT PROJECTSCuajone Toquepala Buenavista La Caridad OPEN-PIT IMMSAMine Mine Mine Mine MINES UNIT(1) Tia Maria El Arco El Pilar Pilares
Mineral ReservesMetal prices:
Copper ($/lb.) . . . . . . . . 2.90 2.90 2.90 2.90 2.90 2.90 2.90 2.90 2.90 2.90Molybdenum ($/lb.) . . . . . 7.50 7.50 7.50 7.50 7.50 — — 7.50
Cut-off grade . . . . . . . . . . 0.195% 0.221% 0.173% 0.142% 0.181% — — 0.206% 0.150% 0.167%ProvenSulfide ore reserves(kt) . . . . 1,045,269 2,082,590 2,736,074 1,918,878 7,782,811 18,324 — 1,375,273 — 10,736Average grade:
Copper . . . . . . . . . . . . 0.578% 0.547% 0.469% 0.239% 0.448% 0.460% — 0.441% — 0.854%Molybdenum . . . . . . . . . 0.019% 0.032% 0.007% 0.028% 0.020% — 0.007% — —Lead . . . . . . . . . . . . . . — — — — — 1.210% — — — —Zinc . . . . . . . . . . . . . . — — — — — 2.760% — — — —
Leachable material (kt) . . . . 675 627,307 2,238,142 517,242 3,383,366 — 217,124 188,653 303,345 —Leachable material grade . . . 0.608% 0.201% 0.171% 0.176% 0.177% — 0.325% 0.330% 0.288% —
ProbableSulfide ore reserves(kt) . . . . 814,501 253,548 1,324,862 882,612 3,275,523 28,654 — 1,004,941 — 25,621Average grade:
Copper . . . . . . . . . . . . 0.404% 0.362% 0.414% 0.229% 0.358% 0.520% — 0.402% — 0.761%Molybdenum . . . . . . . . . 0.016% 0.011% 0.007% 0.029% 0.015% — — 0.007% — —Lead . . . . . . . . . . . . . . — — — — — 0.880% — — — —Zinc . . . . . . . . . . . . . . — — — — — 2.810% — — — —
Leachable material (kt) . . . . 2,844 980,048 876,618 192,372 2,051,882 — 528,940 65,990 21,486 —Leachable material grade . . . 0.716% 0.152% 0.149% 0.162% 0.152% — 0.363% 0.159% 0.258% —
TotalSulfide ore reserves(kt) . . . . 1,859,770 2,336,138 4,060,935 2,801,490 11,058,333 46,978 2,380,214 — 36,357Average grade:
Copper . . . . . . . . . . . . 0.502% 0.527% 0.451% 0.236% 0.421% 0.497% 0.425% 0.788%Molybdenum . . . . . . . . . 0.018% 0.030% 0.007% 0.028% 0.019% 0.007%Lead . . . . . . . . . . . . . . — — — — — 1.009% — — — —Zinc . . . . . . . . . . . . . . — — — — — 2.790% — — — —
Leachable material (kt) . . . . 3,519 1,607,355 3,114,760 709,614 5,435,248 — — — — —Leachable material grade . . . 0.695% 0.171% 0.165% 0.172% 0.168% — 0.352% 0.286% 0.286% 0.000%Waste (kt) . . . . . . . . . . . . 4,740,889 8,865,007 5,679,744 1,747,261 21,032,901 — 672,277 2,197,006 533,289 180,165Total material (kt) . . . . . . . 6,604,178 12,808,500 12,855,439 5,258,365 37,526,482 46,978 1,418,341 4,831,863 858,120 216,522Stripping ratio ((W+L)/O) . . 2.55 4.48 2.17 0.88 2.39 — — 1.03 — 4.96Stripping ratio (W/(L+O)) . . 2.54 2.25 0.79 0.50 1.28 — 0.90 0.83 1.64 4.96
Leachable materialReserves in stock (kt) . . . . . 17,904 1,446,708 1,530,984 835,546 3,831,142 — — — — —Average copper grade . . . . . 0.492% 0.156% 0.159% 0.244% 0.178% — — — — —
In-pit reserves:Proven (kt) . . . . . . . . . . . 675 627,307 2,238,142 517,242 3,383,366 — 217,124 188,653 303,345 —Average copper grade . . . . . 0.608% 0.201% 0.171% 0.176% 0.177% — 0.325% 0.330% 0.288% 0.000%Probable(kt) . . . . . . . . . . . 2,844 980,048 876,618 192,372 2,051,882 — 528,940 65,990 21,486 —Average copper grade . . . . . 0.716% 0.152% 0.149% 0.162% 0.152% — 0.363% 0.159% 0.258% 0.000%Total leachable reserves . . . . 21,423 3,054,063 4,645,744 1,545,160 9,266,390 — 746,064 254,643 324,831 —Average copper grade . . . . . 0.525% 0.164% 0.163% 0.211% 0.172% — 0.352% 0.286% 0.286% 0.000%Copper contained in ore
reserves (kt)(2) . . . . . . . . 9,361 15,060 23,454 7,832 55,707 233 2,626 10,844 929 286
(kt) = Thousand tons
W= Waste, L= Leachable material; O= Ore.
(1) The IMMSA unit includes the Charcas, Santa Barbara, San Martin, Santa Eulalia and Taxco mines. Zinc and lead contained in ore reservesare as follows:
Proven Probable Total(in thousand tons)Zinc . . . . . . . . . . . . . . . . . . . . . . . . . . . . . . . . . . . . . . . . . . . . . . . . . . . . . 505.7 805.2 1,310.9Lead . . . . . . . . . . . . . . . . . . . . . . . . . . . . . . . . . . . . . . . . . . . . . . . . . . . . . 221.7 252.2 473.9
58
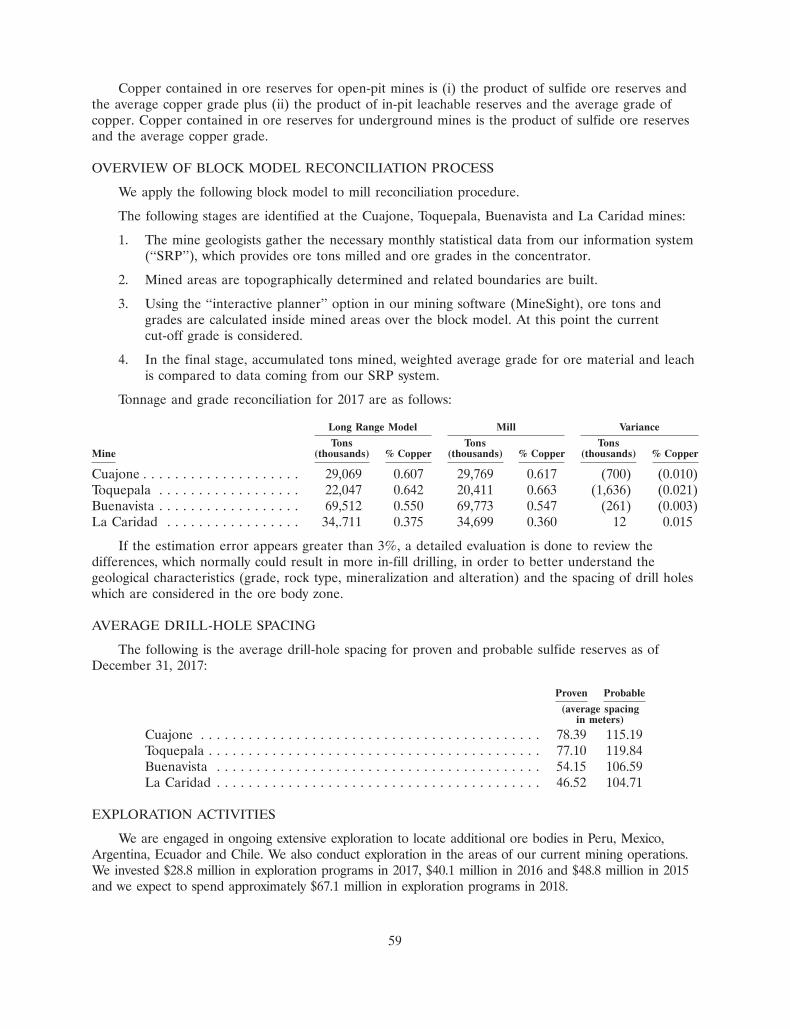
Copper contained in ore reserves for open-pit mines is (i) the product of sulfide ore reserves andthe average copper grade plus (ii) the product of in-pit leachable reserves and the average grade ofcopper. Copper contained in ore reserves for underground mines is the product of sulfide ore reservesand the average copper grade.
OVERVIEW OF BLOCK MODEL RECONCILIATION PROCESS
We apply the following block model to mill reconciliation procedure.
The following stages are identified at the Cuajone, Toquepala, Buenavista and La Caridad mines:
1. The mine geologists gather the necessary monthly statistical data from our information system(‘‘SRP’’), which provides ore tons milled and ore grades in the concentrator.
2. Mined areas are topographically determined and related boundaries are built.
3. Using the ‘‘interactive planner’’ option in our mining software (MineSight), ore tons andgrades are calculated inside mined areas over the block model. At this point the currentcut-off grade is considered.
4. In the final stage, accumulated tons mined, weighted average grade for ore material and leachis compared to data coming from our SRP system.
Tonnage and grade reconciliation for 2017 are as follows:
Long Range Model Mill Variance
Tons Tons TonsMine (thousands) % Copper (thousands) % Copper (thousands) % Copper
Cuajone . . . . . . . . . . . . . . . . . . . . 29,069 0.607 29,769 0.617 (700) (0.010)Toquepala . . . . . . . . . . . . . . . . . . 22,047 0.642 20,411 0.663 (1,636) (0.021)Buenavista . . . . . . . . . . . . . . . . . . 69,512 0.550 69,773 0.547 (261) (0.003)La Caridad . . . . . . . . . . . . . . . . . 34,.711 0.375 34,699 0.360 12 0.015
If the estimation error appears greater than 3%, a detailed evaluation is done to review thedifferences, which normally could result in more in-fill drilling, in order to better understand thegeological characteristics (grade, rock type, mineralization and alteration) and the spacing of drill holeswhich are considered in the ore body zone.
AVERAGE DRILL-HOLE SPACING
The following is the average drill-hole spacing for proven and probable sulfide reserves as ofDecember 31, 2017:
Proven Probable
(average spacingin meters)
Cuajone . . . . . . . . . . . . . . . . . . . . . . . . . . . . . . . . . . . . . . . . . . . 78.39 115.19Toquepala . . . . . . . . . . . . . . . . . . . . . . . . . . . . . . . . . . . . . . . . . . 77.10 119.84Buenavista . . . . . . . . . . . . . . . . . . . . . . . . . . . . . . . . . . . . . . . . . 54.15 106.59La Caridad . . . . . . . . . . . . . . . . . . . . . . . . . . . . . . . . . . . . . . . . . 46.52 104.71
EXPLORATION ACTIVITIES
We are engaged in ongoing extensive exploration to locate additional ore bodies in Peru, Mexico,Argentina, Ecuador and Chile. We also conduct exploration in the areas of our current mining operations.We invested $28.8 million in exploration programs in 2017, $40.1 million in 2016 and $48.8 million in 2015and we expect to spend approximately $67.1 million in exploration programs in 2018.
59
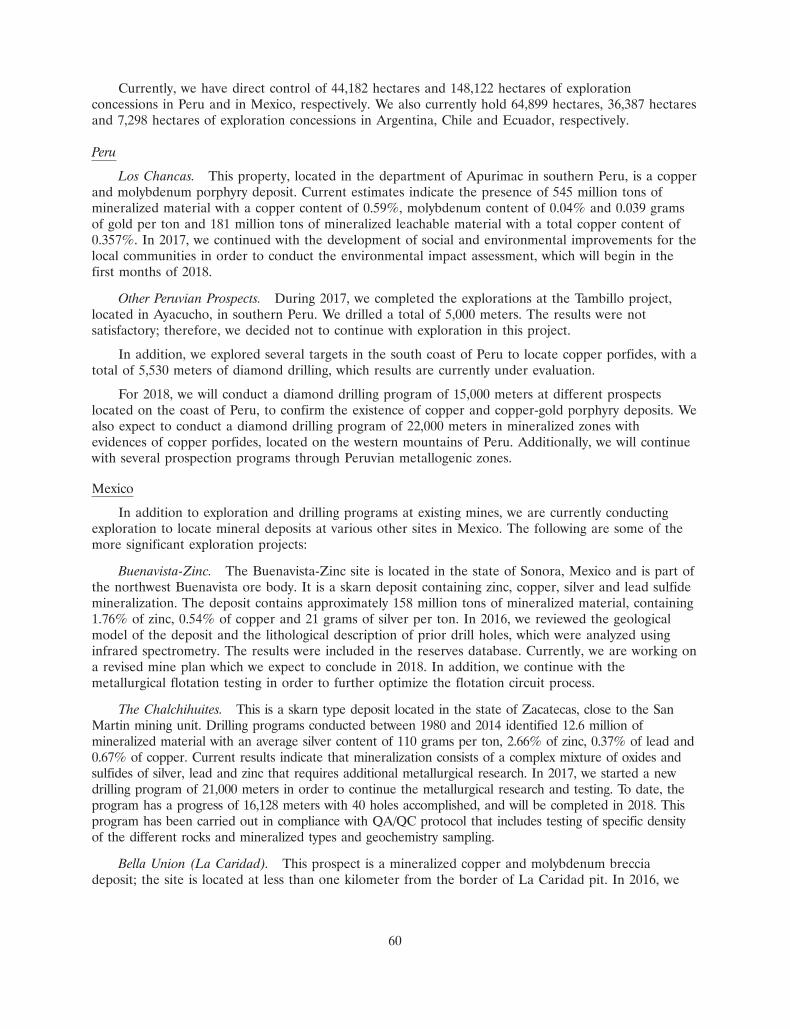
Currently, we have direct control of 44,182 hectares and 148,122 hectares of explorationconcessions in Peru and in Mexico, respectively. We also currently hold 64,899 hectares, 36,387 hectaresand 7,298 hectares of exploration concessions in Argentina, Chile and Ecuador, respectively.
Peru
Los Chancas. This property, located in the department of Apurimac in southern Peru, is a copperand molybdenum porphyry deposit. Current estimates indicate the presence of 545 million tons ofmineralized material with a copper content of 0.59%, molybdenum content of 0.04% and 0.039 gramsof gold per ton and 181 million tons of mineralized leachable material with a total copper content of0.357%. In 2017, we continued with the development of social and environmental improvements for thelocal communities in order to conduct the environmental impact assessment, which will begin in thefirst months of 2018.
Other Peruvian Prospects. During 2017, we completed the explorations at the Tambillo project,located in Ayacucho, in southern Peru. We drilled a total of 5,000 meters. The results were notsatisfactory; therefore, we decided not to continue with exploration in this project.
In addition, we explored several targets in the south coast of Peru to locate copper porfides, with atotal of 5,530 meters of diamond drilling, which results are currently under evaluation.
For 2018, we will conduct a diamond drilling program of 15,000 meters at different prospectslocated on the coast of Peru, to confirm the existence of copper and copper-gold porphyry deposits. Wealso expect to conduct a diamond drilling program of 22,000 meters in mineralized zones withevidences of copper porfides, located on the western mountains of Peru. Additionally, we will continuewith several prospection programs through Peruvian metallogenic zones.
Mexico
In addition to exploration and drilling programs at existing mines, we are currently conductingexploration to locate mineral deposits at various other sites in Mexico. The following are some of themore significant exploration projects:
Buenavista-Zinc. The Buenavista-Zinc site is located in the state of Sonora, Mexico and is part ofthe northwest Buenavista ore body. It is a skarn deposit containing zinc, copper, silver and lead sulfidemineralization. The deposit contains approximately 158 million tons of mineralized material, containing1.76% of zinc, 0.54% of copper and 21 grams of silver per ton. In 2016, we reviewed the geologicalmodel of the deposit and the lithological description of prior drill holes, which were analyzed usinginfrared spectrometry. The results were included in the reserves database. Currently, we are working ona revised mine plan which we expect to conclude in 2018. In addition, we continue with themetallurgical flotation testing in order to further optimize the flotation circuit process.
The Chalchihuites. This is a skarn type deposit located in the state of Zacatecas, close to the SanMartin mining unit. Drilling programs conducted between 1980 and 2014 identified 12.6 million ofmineralized material with an average silver content of 110 grams per ton, 2.66% of zinc, 0.37% of lead and0.67% of copper. Current results indicate that mineralization consists of a complex mixture of oxides andsulfides of silver, lead and zinc that requires additional metallurgical research. In 2017, we started a newdrilling program of 21,000 meters in order to continue the metallurgical research and testing. To date, theprogram has a progress of 16,128 meters with 40 holes accomplished, and will be completed in 2018. Thisprogram has been carried out in compliance with QA/QC protocol that includes testing of specific densityof the different rocks and mineralized types and geochemistry sampling.
Bella Union (La Caridad). This prospect is a mineralized copper and molybdenum brecciadeposit; the site is located at less than one kilometer from the border of La Caridad pit. In 2016, we
60
conducted a drilling program of 21,730 meters to define the geometry of the deposit. The resultsallowed the identification of 63.3 million tons of mineralized material with an average of 0.43% ofcopper content and 0.04% of molybdenum. In 2017, a diamond drilling program of 15,000 meters wascontinued. During the year 9,448 meters were drilled, and 5,552 meters remain to be drilled in 2018.Once the drilling has been completed, the estimation of resources and reserves will be made to definethe potential of the Bella Union project.
Campo Medio (Santa Eulalia). This prospect is located close to the west border of the Santa Eulaliamine. Preliminary geological surveying in the zone indicates the possible presence of replacement orebodies in limestone, similar to ore bodies currently being mined at Santa Eulalia. During 2016, wecompleted a geochemical and geological survey of 800 hectares between the two currently operating minesand from which we obtained in the past more than 25 million metric tons of ore. The results obtainedindicate the presence of potential mineralization in five different zones. In 2017, 1,000 geochemical sampleswere taken to define in more detail the five zones highlighted by the geological survey. The 2018exploration program contemplates the surveying using an electrical geophysical method. With the resultsobtained from this study, a drilling program of 10,000 meters will be designed.
Chile
El Salado (Montonero). A copper-gold prospect located in the Atacama region, northern Chile isbeing explored for copper and molybdenum porphyry since 2014. In 2016, we conducted a diamonddrilling program of 12,169 meters in order to define mineral classification. In 2017, we drilled a total of9,939 meters and finished the conceptual study, which is currently under evaluation.
Resguardo de la Costa. An epithermal gold deposit located at southern Chanaral. In 2017, weconducted a diamond drilling program of 3,000 meters. The results were not satisfactory; therefore, wedecided not to continue with exploration in this project.
Other Chilean Prospects. For 2018, we expect to conduct a diamond drilling program of10,000 meters in copper-gold prospects located in the Antofagasta region at the north of Chile.
Ecuador
Chaucha. The Ruta del Cobre (‘‘Copper Road’’) project is located west of Cuenca city and southof Guayaquil. The mineralization is characteristic of a copper-molybdenum porphyry system which isbeing explored since 2014. In 2016, we conducted a diamond drilling program of 25,081 meters, incompliance with the socioenvironmental regulations of Ecuador. This drilling allowed us to consolidatethe information obtained for a better geological and economic interpretation. In 2017, we conducted adiamond drilling program of 12,980 meters, which has allowed us to consolidate information in order tobegin the conceptual study for an initial economic evaluation of the project. This study was initiatedtowards the end of 2017 and is expected to continue during 2018.
Argentina
In 2011, we started exploration activities in Argentina. In 2015, we performed geologicalexploration in the Salta, Rio Negro and Neuquen provinces where we expected to locate copperporphyry with precious metals epithermal systems. In 2017, we performed prospection and geologicalevaluation work in the provinces of San Juan and Rio Negro. For 2018, we plan to conduct a diamonddrilling program of 10,000 meters in order to continue with the exploration of the silver-goldepithermal systems, denominated the Caldera project, located in the Rio Negro province.
ITEM 3. LEGAL PROCEEDINGS
Reference is made to the information under the caption ‘‘Litigation Matters’’ in the consolidatedfinancial statement Note 12 ‘‘Commitments and contingencies.’’
ITEM 4. MINE SAFETY DISCLOSURE
Not applicable.
61
PART II
ITEM 5. MARKET FOR REGISTRANT’S COMMON EQUITY, RELATED STOCKHOLDERMATTERS AND ISSUER PURCHASES OF EQUITY SECURITIES
SCC COMMON STOCK:
SCC’s common stock is traded on the New York Stock Exchange (‘‘NYSE’’) and the Lima StockExchange (‘‘BVL’’). SCC’s common stock symbol is SCCO on both the NYSE and the BVL. AtDecember 31, 2017, there were 985 holders of record of our common stock.
DIVIDEND AND STOCK MARKET PRICES:
The table below sets forth the cash dividends paid per share of capital stock and the high and lowstock prices on both the NYSE and the BVL for the periods indicated.
For the year 2017
NYSE: BVL:DividendQuarters per Share High Low High Low
1st . . . . . . . . . . . . . . . . . . . . . . . . . . $0.08 $39.10 $32.38 $39.15 $32.272nd . . . . . . . . . . . . . . . . . . . . . . . . . . $0.12 $36.48 $33.01 $36.44 $33.003rd . . . . . . . . . . . . . . . . . . . . . . . . . . $0.14 $41.77 $34.75 $41.64 $34.654th . . . . . . . . . . . . . . . . . . . . . . . . . . $0.25 $47.63 $39.76 $47.56 $40.54
Year . . . . . . . . . . . . . . . . . . . . . . . . . $0.59 $47.63 $32.38 $47.56 $32.27
For the year 2016
NYSE: BVL:DividendQuarters per Share High Low High Low
1st . . . . . . . . . . . . . . . . . . . . . . . . . . $0.03 $28.44 $22.29 $28.30 $22.372nd . . . . . . . . . . . . . . . . . . . . . . . . . . $0.05 $30.21 $25.52 $30.00 $25.303rd . . . . . . . . . . . . . . . . . . . . . . . . . . $0.05 $26.76 $25.20 $26.60 $25.204th . . . . . . . . . . . . . . . . . . . . . . . . . . $0.05 $34.98 $26.01 $34.76 $26.02
Year . . . . . . . . . . . . . . . . . . . . . . . . . $0.18 $34.98 $22.29 $34.76 $22.37
On January 25, 2018, the Board of Directors (‘‘BOD’’) authorized a dividend of $0.30 per sharepaid on February 27, 2018, to shareholders of record at the close of business on February 13, 2018.
For a description of limitations on our ability to make dividend distributions, see ‘‘Management’sDiscussion and Analysis of Financial Condition and Results of Operations—‘‘Liquidity and CapitalResources’’ and Note 10 ‘‘Financing’’ to our consolidated financial statements.
DIRECTORS’ STOCK AWARD PLAN
The following table sets forth certain information related to our shares held as treasury stock forthe Directors’ stock award plan at December 31, 2017:
Equity Compensation Plan Information
Number of securities to be Weighted-average Number of securitiesissued upon exercise of exercise price of remaining available
Plan Category outstanding options outstanding options for future issuance
Directors’ stock award plan . . . . . . . . . . N/A N/A 253,200
62
For additional information see Note 13—‘‘Stockholders Equity—Directors’ Stock Award Plan.’’
SCC COMMON STOCK REPURCHASE PLAN:
In 2008, our BOD authorized a $500 million share repurchase program that has since beenincreased by the BOD and is currently authorized to $3 billion. Pursuant to this program, the Companypurchased common stock as shown in the table below. These shares are available for general corporatepurposes. The Company may purchase additional shares of its common stock from time to time, basedon market conditions and other factors. This repurchase program has no expiration date and may bemodified or discontinued at any time.
Total Number of Maximum Number ofTotal Shares Purchased Shares that May YetPeriod Number of Shares Average Price as Part of Publicly Be Purchased Under Total Cost
From To Purchased Paid per Share Announced Plan the Plan @ $47.45(1) ($ in millions)
2008 2012 46,914,486 $18.72 46,914,486 878.12013: 10,245,000 27.47 57,159,486 281.42014: 22,711,428 30.06 79,870,914 682.82015: 36,689,052 27.38 116,559,966 1,004.42016: 2,937,801 24.42 119,497,767 71.7Total purchased 119,497,767 $24.42 1,720,408 $2,918.4
(1) NYSE closing price of SCC common shares at December 31, 2017.
There has not been any activity in the SCC share repurchase program since the third quarter of2016. The NYSE closing price of SCC common shares at December 31, 2017 was $47.45 and themaximum number of shares that the Company could purchase at that price is 1.7 million shares.
As a result of the repurchase of shares of SCC’s common stock, Grupo Mexico’s direct andindirect ownership was 88.9% as of December 31, 2017 and 2016.
SHAREHOLDER RETURN PERFORMANCE PRESENTATION
Set forth below is a line graph comparing the yearly change in the cumulative total returns on theCompany’s common stock against cumulative total return on the S&P 500 Stock Index and the S&PMetals and Mining Select Industry Index, for the five year period ending December 31, 2017. The chartbelow analyzes the total return on SCC’s common stock for the period commencing December 31, 2012and ending December 31, 2017, compared to the total return of the S&P 500 and the S&P Metals andMining Select Industry Index for the same five-year period.
63
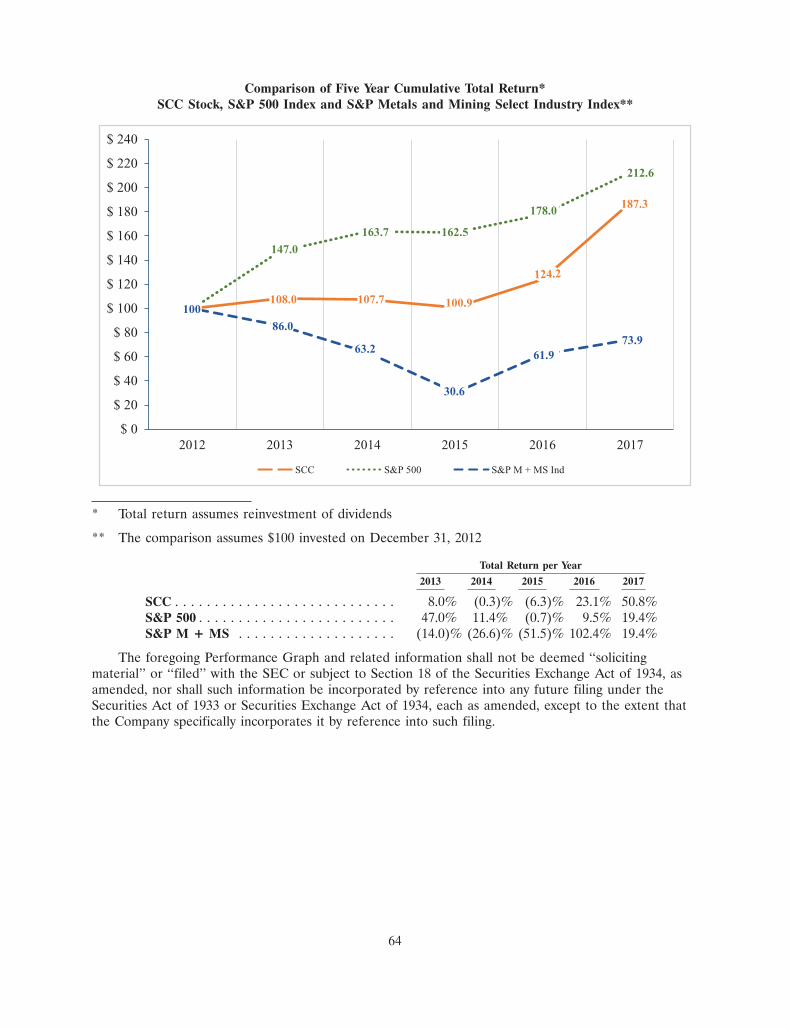
24FEB201809454877
Comparison of Five Year Cumulative Total Return*SCC Stock, S&P 500 Index and S&P Metals and Mining Select Industry Index**
SCC S&P 500 S&P M + MS Ind
$ 02012
147.0
163.7 162.5
178.0
212.6
108.0 100.9
187.3
124.2
86.0
30.6
61.973.9
2013 2014 2015 2016 2017
$ 20
$ 40
$ 60
$ 80
$ 100
$ 120
$ 140
$ 160
$ 180
$ 200
$ 220
$ 240
107.7
63.2
100
* Total return assumes reinvestment of dividends
** The comparison assumes $100 invested on December 31, 2012
Total Return per Year
2013 2014 2015 2016 2017
SCC . . . . . . . . . . . . . . . . . . . . . . . . . . . . 8.0% (0.3)% (6.3)% 23.1% 50.8%S&P 500 . . . . . . . . . . . . . . . . . . . . . . . . . 47.0% 11.4% (0.7)% 9.5% 19.4%S&P M + MS . . . . . . . . . . . . . . . . . . . . (14.0)% (26.6)% (51.5)% 102.4% 19.4%
The foregoing Performance Graph and related information shall not be deemed ‘‘solicitingmaterial’’ or ‘‘filed’’ with the SEC or subject to Section 18 of the Securities Exchange Act of 1934, asamended, nor shall such information be incorporated by reference into any future filing under theSecurities Act of 1933 or Securities Exchange Act of 1934, each as amended, except to the extent thatthe Company specifically incorporates it by reference into such filing.
64
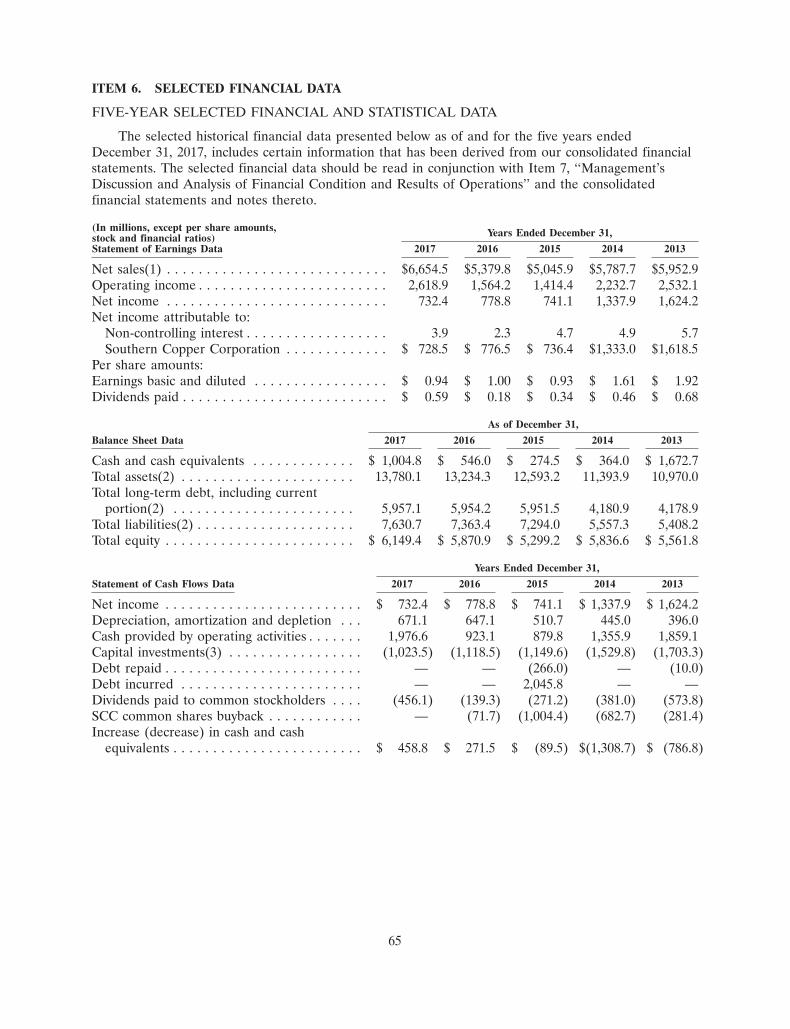
ITEM 6. SELECTED FINANCIAL DATA
FIVE-YEAR SELECTED FINANCIAL AND STATISTICAL DATA
The selected historical financial data presented below as of and for the five years endedDecember 31, 2017, includes certain information that has been derived from our consolidated financialstatements. The selected financial data should be read in conjunction with Item 7, ‘‘Management’sDiscussion and Analysis of Financial Condition and Results of Operations’’ and the consolidatedfinancial statements and notes thereto.
(In millions, except per share amounts, Years Ended December 31,stock and financial ratios)Statement of Earnings Data 2017 2016 2015 2014 2013
Net sales(1) . . . . . . . . . . . . . . . . . . . . . . . . . . . . $6,654.5 $5,379.8 $5,045.9 $5,787.7 $5,952.9Operating income . . . . . . . . . . . . . . . . . . . . . . . . 2,618.9 1,564.2 1,414.4 2,232.7 2,532.1Net income . . . . . . . . . . . . . . . . . . . . . . . . . . . . 732.4 778.8 741.1 1,337.9 1,624.2Net income attributable to:
Non-controlling interest . . . . . . . . . . . . . . . . . . 3.9 2.3 4.7 4.9 5.7Southern Copper Corporation . . . . . . . . . . . . . $ 728.5 $ 776.5 $ 736.4 $1,333.0 $1,618.5
Per share amounts:Earnings basic and diluted . . . . . . . . . . . . . . . . . $ 0.94 $ 1.00 $ 0.93 $ 1.61 $ 1.92Dividends paid . . . . . . . . . . . . . . . . . . . . . . . . . . $ 0.59 $ 0.18 $ 0.34 $ 0.46 $ 0.68
As of December 31,
Balance Sheet Data 2017 2016 2015 2014 2013
Cash and cash equivalents . . . . . . . . . . . . . $ 1,004.8 $ 546.0 $ 274.5 $ 364.0 $ 1,672.7Total assets(2) . . . . . . . . . . . . . . . . . . . . . . 13,780.1 13,234.3 12,593.2 11,393.9 10,970.0Total long-term debt, including current
portion(2) . . . . . . . . . . . . . . . . . . . . . . . 5,957.1 5,954.2 5,951.5 4,180.9 4,178.9Total liabilities(2) . . . . . . . . . . . . . . . . . . . . 7,630.7 7,363.4 7,294.0 5,557.3 5,408.2Total equity . . . . . . . . . . . . . . . . . . . . . . . . $ 6,149.4 $ 5,870.9 $ 5,299.2 $ 5,836.6 $ 5,561.8
Years Ended December 31,
Statement of Cash Flows Data 2017 2016 2015 2014 2013
Net income . . . . . . . . . . . . . . . . . . . . . . . . . $ 732.4 $ 778.8 $ 741.1 $ 1,337.9 $ 1,624.2Depreciation, amortization and depletion . . . 671.1 647.1 510.7 445.0 396.0Cash provided by operating activities . . . . . . . 1,976.6 923.1 879.8 1,355.9 1,859.1Capital investments(3) . . . . . . . . . . . . . . . . . (1,023.5) (1,118.5) (1,149.6) (1,529.8) (1,703.3)Debt repaid . . . . . . . . . . . . . . . . . . . . . . . . . — — (266.0) — (10.0)Debt incurred . . . . . . . . . . . . . . . . . . . . . . . — — 2,045.8 — —Dividends paid to common stockholders . . . . (456.1) (139.3) (271.2) (381.0) (573.8)SCC common shares buyback . . . . . . . . . . . . — (71.7) (1,004.4) (682.7) (281.4)Increase (decrease) in cash and cash
equivalents . . . . . . . . . . . . . . . . . . . . . . . . $ 458.8 $ 271.5 $ (89.5) $(1,308.7) $ (786.8)
65
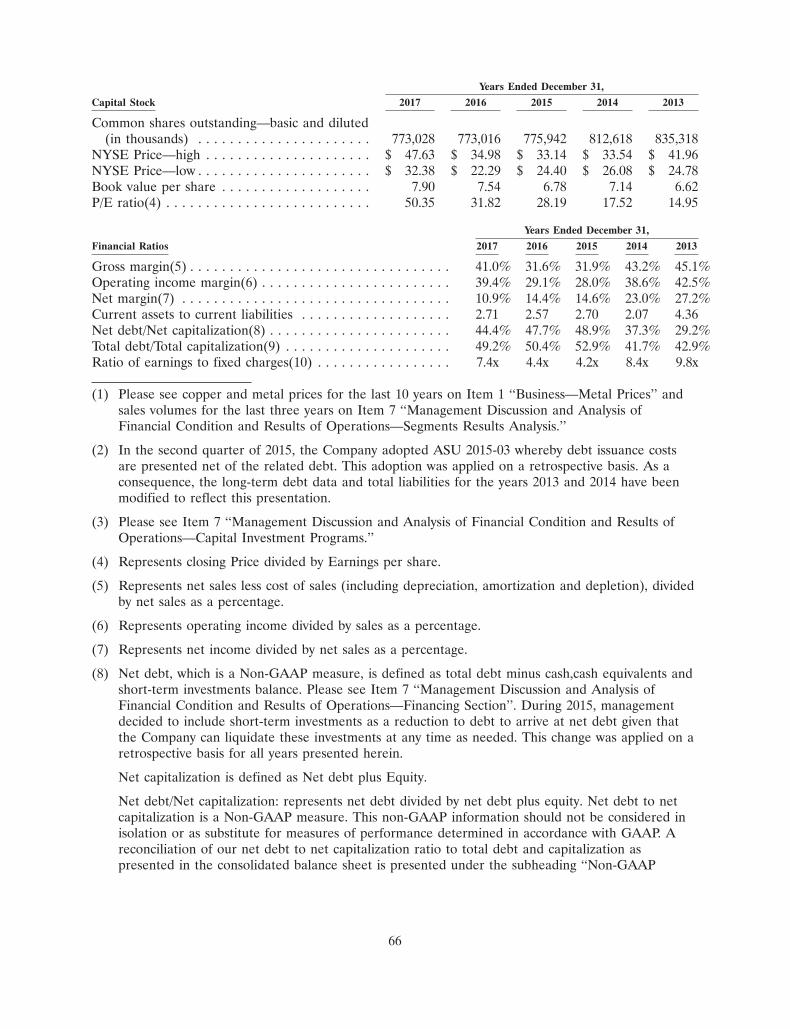
Years Ended December 31,
Capital Stock 2017 2016 2015 2014 2013
Common shares outstanding—basic and diluted(in thousands) . . . . . . . . . . . . . . . . . . . . . . 773,028 773,016 775,942 812,618 835,318
NYSE Price—high . . . . . . . . . . . . . . . . . . . . . $ 47.63 $ 34.98 $ 33.14 $ 33.54 $ 41.96NYSE Price—low . . . . . . . . . . . . . . . . . . . . . . $ 32.38 $ 22.29 $ 24.40 $ 26.08 $ 24.78Book value per share . . . . . . . . . . . . . . . . . . . 7.90 7.54 6.78 7.14 6.62P/E ratio(4) . . . . . . . . . . . . . . . . . . . . . . . . . . 50.35 31.82 28.19 17.52 14.95
Years Ended December 31,
Financial Ratios 2017 2016 2015 2014 2013
Gross margin(5) . . . . . . . . . . . . . . . . . . . . . . . . . . . . . . . . . 41.0% 31.6% 31.9% 43.2% 45.1%Operating income margin(6) . . . . . . . . . . . . . . . . . . . . . . . . 39.4% 29.1% 28.0% 38.6% 42.5%Net margin(7) . . . . . . . . . . . . . . . . . . . . . . . . . . . . . . . . . . 10.9% 14.4% 14.6% 23.0% 27.2%Current assets to current liabilities . . . . . . . . . . . . . . . . . . . 2.71 2.57 2.70 2.07 4.36Net debt/Net capitalization(8) . . . . . . . . . . . . . . . . . . . . . . . 44.4% 47.7% 48.9% 37.3% 29.2%Total debt/Total capitalization(9) . . . . . . . . . . . . . . . . . . . . . 49.2% 50.4% 52.9% 41.7% 42.9%Ratio of earnings to fixed charges(10) . . . . . . . . . . . . . . . . . 7.4x 4.4x 4.2x 8.4x 9.8x
(1) Please see copper and metal prices for the last 10 years on Item 1 ‘‘Business—Metal Prices’’ andsales volumes for the last three years on Item 7 ‘‘Management Discussion and Analysis ofFinancial Condition and Results of Operations—Segments Results Analysis.’’
(2) In the second quarter of 2015, the Company adopted ASU 2015-03 whereby debt issuance costsare presented net of the related debt. This adoption was applied on a retrospective basis. As aconsequence, the long-term debt data and total liabilities for the years 2013 and 2014 have beenmodified to reflect this presentation.
(3) Please see Item 7 ‘‘Management Discussion and Analysis of Financial Condition and Results ofOperations—Capital Investment Programs.’’
(4) Represents closing Price divided by Earnings per share.
(5) Represents net sales less cost of sales (including depreciation, amortization and depletion), dividedby net sales as a percentage.
(6) Represents operating income divided by sales as a percentage.
(7) Represents net income divided by net sales as a percentage.
(8) Net debt, which is a Non-GAAP measure, is defined as total debt minus cash,cash equivalents andshort-term investments balance. Please see Item 7 ‘‘Management Discussion and Analysis ofFinancial Condition and Results of Operations—Financing Section’’. During 2015, managementdecided to include short-term investments as a reduction to debt to arrive at net debt given thatthe Company can liquidate these investments at any time as needed. This change was applied on aretrospective basis for all years presented herein.
Net capitalization is defined as Net debt plus Equity.
Net debt/Net capitalization: represents net debt divided by net debt plus equity. Net debt to netcapitalization is a Non-GAAP measure. This non-GAAP information should not be considered inisolation or as substitute for measures of performance determined in accordance with GAAP. Areconciliation of our net debt to net capitalization ratio to total debt and capitalization aspresented in the consolidated balance sheet is presented under the subheading ‘‘Non-GAAP
66
information reconciliation’’ in Item 7 ‘‘Management’s Discussion and Analysis of FinancialCondition and Results of Operations.’’
(9) Total capitalization is defined as Total debt plus Equity.
Total debt/Total capitalization: represents total debt divided by total debt plus equity.
(10) Represents earnings divided by fixed charges. Earnings are defined as earnings before income taxesand before adjustment for income or loss from equity investees, plus equity earnings of affiliate,fixed charges and amortization of interest capitalized, less interest capitalized. Fixed charges aredefined as the sum of interest expense without the discount of capitalized interest, plus amortizedpremiums, discounts and capitalized expenses related to indebtedness.
67
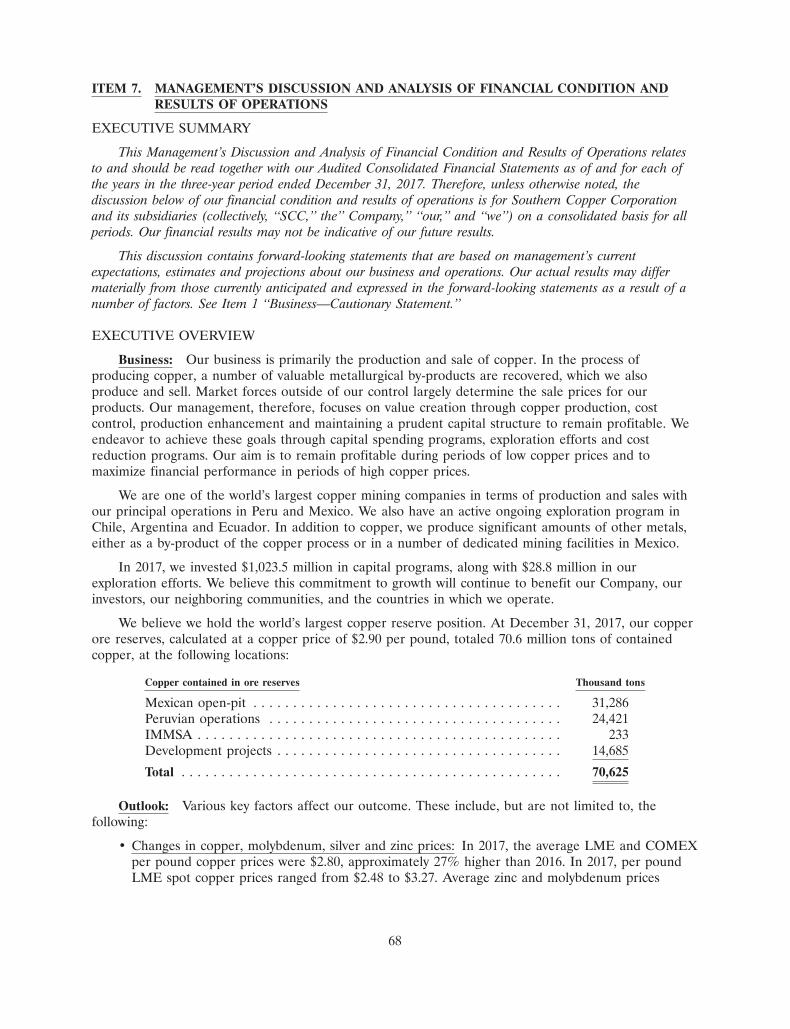
ITEM 7. MANAGEMENT’S DISCUSSION AND ANALYSIS OF FINANCIAL CONDITION ANDRESULTS OF OPERATIONS
EXECUTIVE SUMMARY
This Management’s Discussion and Analysis of Financial Condition and Results of Operations relatesto and should be read together with our Audited Consolidated Financial Statements as of and for each ofthe years in the three-year period ended December 31, 2017. Therefore, unless otherwise noted, thediscussion below of our financial condition and results of operations is for Southern Copper Corporationand its subsidiaries (collectively, ‘‘SCC,’’ the’’ Company,’’ ‘‘our,’’ and ‘‘we’’) on a consolidated basis for allperiods. Our financial results may not be indicative of our future results.
This discussion contains forward-looking statements that are based on management’s currentexpectations, estimates and projections about our business and operations. Our actual results may differmaterially from those currently anticipated and expressed in the forward-looking statements as a result of anumber of factors. See Item 1 ‘‘Business—Cautionary Statement.’’
EXECUTIVE OVERVIEW
Business: Our business is primarily the production and sale of copper. In the process ofproducing copper, a number of valuable metallurgical by-products are recovered, which we alsoproduce and sell. Market forces outside of our control largely determine the sale prices for ourproducts. Our management, therefore, focuses on value creation through copper production, costcontrol, production enhancement and maintaining a prudent capital structure to remain profitable. Weendeavor to achieve these goals through capital spending programs, exploration efforts and costreduction programs. Our aim is to remain profitable during periods of low copper prices and tomaximize financial performance in periods of high copper prices.
We are one of the world’s largest copper mining companies in terms of production and sales withour principal operations in Peru and Mexico. We also have an active ongoing exploration program inChile, Argentina and Ecuador. In addition to copper, we produce significant amounts of other metals,either as a by-product of the copper process or in a number of dedicated mining facilities in Mexico.
In 2017, we invested $1,023.5 million in capital programs, along with $28.8 million in ourexploration efforts. We believe this commitment to growth will continue to benefit our Company, ourinvestors, our neighboring communities, and the countries in which we operate.
We believe we hold the world’s largest copper reserve position. At December 31, 2017, our copperore reserves, calculated at a copper price of $2.90 per pound, totaled 70.6 million tons of containedcopper, at the following locations:
Copper contained in ore reserves Thousand tons
Mexican open-pit . . . . . . . . . . . . . . . . . . . . . . . . . . . . . . . . . . . . . . . 31,286Peruvian operations . . . . . . . . . . . . . . . . . . . . . . . . . . . . . . . . . . . . . 24,421IMMSA . . . . . . . . . . . . . . . . . . . . . . . . . . . . . . . . . . . . . . . . . . . . . . 233Development projects . . . . . . . . . . . . . . . . . . . . . . . . . . . . . . . . . . . . 14,685
Total . . . . . . . . . . . . . . . . . . . . . . . . . . . . . . . . . . . . . . . . . . . . . . . . 70,625
Outlook: Various key factors affect our outcome. These include, but are not limited to, thefollowing:
• Changes in copper, molybdenum, silver and zinc prices: In 2017, the average LME and COMEXper pound copper prices were $2.80, approximately 27% higher than 2016. In 2017, per poundLME spot copper prices ranged from $2.48 to $3.27. Average zinc and molybdenum prices
68
increased in 2017 by 37.9% and 26.6%, respectively, compared to 2016. The average silver pricedecreased by 0.4% in 2017 compared to 2016.
• Sales structure: In the last three years, approximately 80% of our revenues came from the saleof copper, 5% from molybdenum, 5% from silver, 4% from zinc and 6% from various otherproducts, including gold, sulfuric acid and other materials.
• Copper: During the last quarter, the LME copper price has increased significantly, from anaverage of $2.40 per pound in the fourth quarter of 2016 to $3.09 per pound in the fourthquarter of 2017 and up to an average of $3.21 per pound in January 2018. We believe this priceimprovement is the result of the synchronized economic growth recovery of the majoreconomies.
We believe that the world economy is accelerating its growth to an expected 3.9% in 2018.China, the world’s largest copper consumer with over 45% of the demand, is expected tocontinue its growth, in line with its estimated 6.8% GDP increase in 2017. For global refinedcopper demand in 2018, we expect growth of about 2.1%, which amounts to approximately500,000 tons of new copper demand.
With respect to copper supply, we expect a weak response as a result of the consistent decline ininvestments by several companies in recent years. Additionally, labor unrest, excess governmenttaxation and technical difficulties are further affecting production. As a result of these factors,we expect a supply growth of approximately 1% in 2018, yielding a copper market deficit thisyear which will give strong support for copper prices.
• Silver: We believe that silver prices will have support due to its industrial uses as well as beingperceived as a value shelter in times of economic uncertainty. Silver represented 4.3% of oursales in 2017.
• Molybdenum: It was about 5.3% of our sales in 2017. Molybdenum prices averaged $8.72 perpound in the fourth quarter of 2017, which compares to $6.58 a year ago; a 32.5% increase.January 2018 prices averaged $11.54 per pound.
Molybdenum is mainly used for the production of special alloys of stainless steel that requiresignificant hardness, corrosion and heat resistance. A new use for this metal is in lubricants andsulfur filtering of heavy oils and shale gas production.
• Zinc: It has very good long term fundamentals due to its significant industrial consumption andthe expected production. Through 2017 zinc inventories have decreased over 50% in the majorwarehouses, improving this metal’s price support. Zinc represented 4.9% of our sales in 2017.
• Production: In 2018, we will commence production at the new Toquepala concentrator andexpect to be able to produce 931,000 tons of copper, a 6% increase from the 877,000 tons weproduced in 2017.
We also expect to produce 17.5 million ounces of silver, about 10% higher than the 2017production of 15.9 million ounces. In 2018, we expect to produce 84,600 tons of zinc from ourmines, up 23% from 2017 production of 68,665 tons, as a result of the recovery of production atthe Santa Eulalia and Santa Barbara mines. Additionally, we expect to produce 21,700 tons ofmolybdenum, an increase of 1.7% due to additional production from Buenavista and therecovery of our Peruvian operations.
69
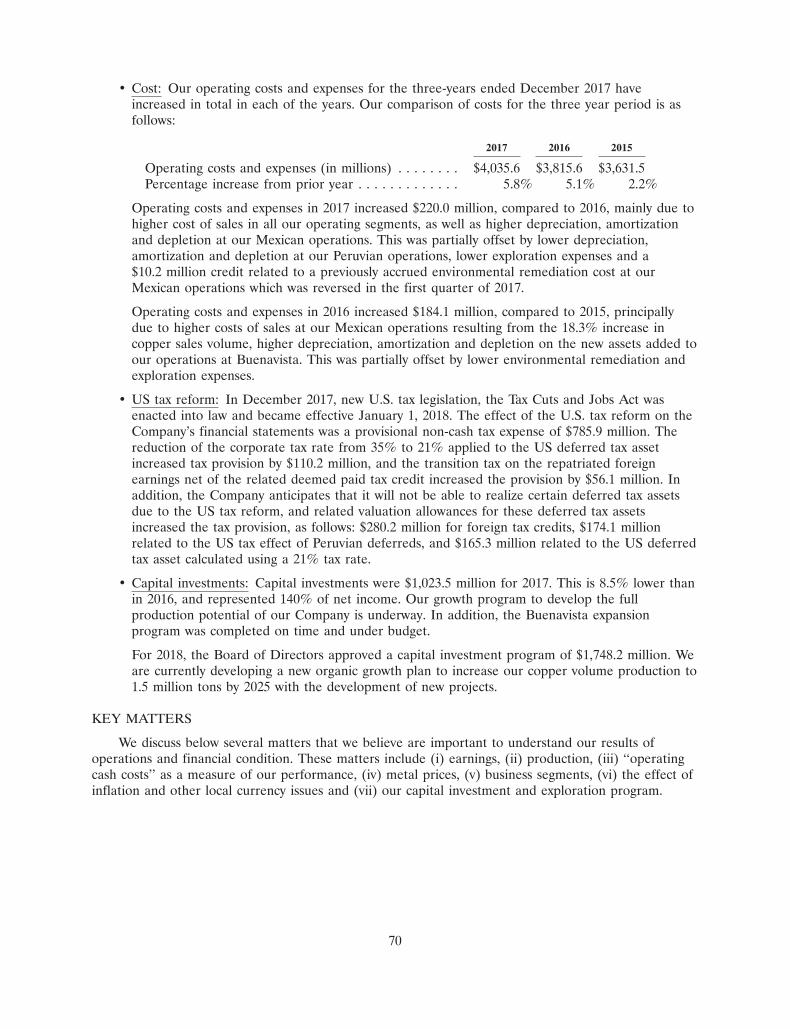
• Cost: Our operating costs and expenses for the three-years ended December 2017 haveincreased in total in each of the years. Our comparison of costs for the three year period is asfollows:
2017 2016 2015
Operating costs and expenses (in millions) . . . . . . . . $4,035.6 $3,815.6 $3,631.5Percentage increase from prior year . . . . . . . . . . . . . 5.8% 5.1% 2.2%
Operating costs and expenses in 2017 increased $220.0 million, compared to 2016, mainly due tohigher cost of sales in all our operating segments, as well as higher depreciation, amortizationand depletion at our Mexican operations. This was partially offset by lower depreciation,amortization and depletion at our Peruvian operations, lower exploration expenses and a$10.2 million credit related to a previously accrued environmental remediation cost at ourMexican operations which was reversed in the first quarter of 2017.
Operating costs and expenses in 2016 increased $184.1 million, compared to 2015, principallydue to higher costs of sales at our Mexican operations resulting from the 18.3% increase incopper sales volume, higher depreciation, amortization and depletion on the new assets added toour operations at Buenavista. This was partially offset by lower environmental remediation andexploration expenses.
• US tax reform: In December 2017, new U.S. tax legislation, the Tax Cuts and Jobs Act wasenacted into law and became effective January 1, 2018. The effect of the U.S. tax reform on theCompany’s financial statements was a provisional non-cash tax expense of $785.9 million. Thereduction of the corporate tax rate from 35% to 21% applied to the US deferred tax assetincreased tax provision by $110.2 million, and the transition tax on the repatriated foreignearnings net of the related deemed paid tax credit increased the provision by $56.1 million. Inaddition, the Company anticipates that it will not be able to realize certain deferred tax assetsdue to the US tax reform, and related valuation allowances for these deferred tax assetsincreased the tax provision, as follows: $280.2 million for foreign tax credits, $174.1 millionrelated to the US tax effect of Peruvian deferreds, and $165.3 million related to the US deferredtax asset calculated using a 21% tax rate.
• Capital investments: Capital investments were $1,023.5 million for 2017. This is 8.5% lower thanin 2016, and represented 140% of net income. Our growth program to develop the fullproduction potential of our Company is underway. In addition, the Buenavista expansionprogram was completed on time and under budget.
For 2018, the Board of Directors approved a capital investment program of $1,748.2 million. Weare currently developing a new organic growth plan to increase our copper volume production to1.5 million tons by 2025 with the development of new projects.
KEY MATTERS
We discuss below several matters that we believe are important to understand our results ofoperations and financial condition. These matters include (i) earnings, (ii) production, (iii) ‘‘operatingcash costs’’ as a measure of our performance, (iv) metal prices, (v) business segments, (vi) the effect ofinflation and other local currency issues and (vii) our capital investment and exploration program.
70
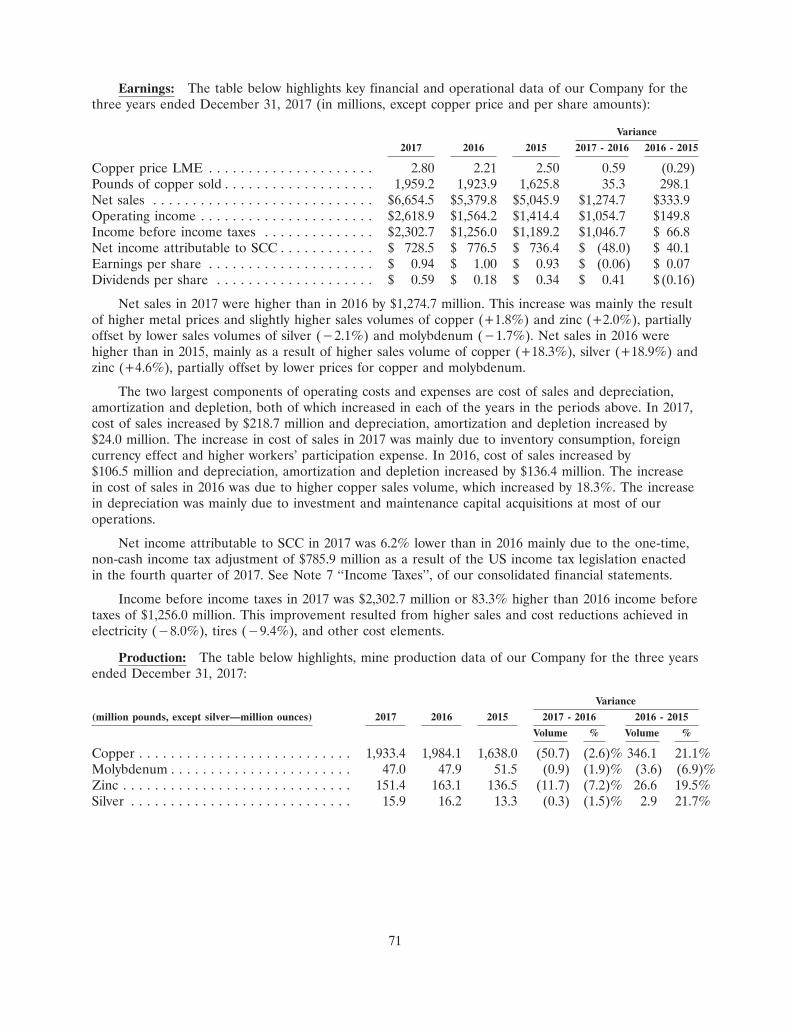
Earnings: The table below highlights key financial and operational data of our Company for thethree years ended December 31, 2017 (in millions, except copper price and per share amounts):
Variance
2017 2016 2015 2017 - 2016 2016 - 2015
Copper price LME . . . . . . . . . . . . . . . . . . . . . 2.80 2.21 2.50 0.59 (0.29)Pounds of copper sold . . . . . . . . . . . . . . . . . . . 1,959.2 1,923.9 1,625.8 35.3 298.1Net sales . . . . . . . . . . . . . . . . . . . . . . . . . . . . $6,654.5 $5,379.8 $5,045.9 $1,274.7 $333.9Operating income . . . . . . . . . . . . . . . . . . . . . . $2,618.9 $1,564.2 $1,414.4 $1,054.7 $149.8Income before income taxes . . . . . . . . . . . . . . $2,302.7 $1,256.0 $1,189.2 $1,046.7 $ 66.8Net income attributable to SCC . . . . . . . . . . . . $ 728.5 $ 776.5 $ 736.4 $ (48.0) $ 40.1Earnings per share . . . . . . . . . . . . . . . . . . . . . $ 0.94 $ 1.00 $ 0.93 $ (0.06) $ 0.07Dividends per share . . . . . . . . . . . . . . . . . . . . $ 0.59 $ 0.18 $ 0.34 $ 0.41 $(0.16)
Net sales in 2017 were higher than in 2016 by $1,274.7 million. This increase was mainly the resultof higher metal prices and slightly higher sales volumes of copper (+1.8%) and zinc (+2.0%), partiallyoffset by lower sales volumes of silver (�2.1%) and molybdenum (�1.7%). Net sales in 2016 werehigher than in 2015, mainly as a result of higher sales volume of copper (+18.3%), silver (+18.9%) andzinc (+4.6%), partially offset by lower prices for copper and molybdenum.
The two largest components of operating costs and expenses are cost of sales and depreciation,amortization and depletion, both of which increased in each of the years in the periods above. In 2017,cost of sales increased by $218.7 million and depreciation, amortization and depletion increased by$24.0 million. The increase in cost of sales in 2017 was mainly due to inventory consumption, foreigncurrency effect and higher workers’ participation expense. In 2016, cost of sales increased by$106.5 million and depreciation, amortization and depletion increased by $136.4 million. The increasein cost of sales in 2016 was due to higher copper sales volume, which increased by 18.3%. The increasein depreciation was mainly due to investment and maintenance capital acquisitions at most of ouroperations.
Net income attributable to SCC in 2017 was 6.2% lower than in 2016 mainly due to the one-time,non-cash income tax adjustment of $785.9 million as a result of the US income tax legislation enactedin the fourth quarter of 2017. See Note 7 ‘‘Income Taxes’’, of our consolidated financial statements.
Income before income taxes in 2017 was $2,302.7 million or 83.3% higher than 2016 income beforetaxes of $1,256.0 million. This improvement resulted from higher sales and cost reductions achieved inelectricity (�8.0%), tires (�9.4%), and other cost elements.
Production: The table below highlights, mine production data of our Company for the three yearsended December 31, 2017:
Variance
(million pounds, except silver—million ounces) 2017 2016 2015 2017 - 2016 2016 - 2015
Volume % Volume %
Copper . . . . . . . . . . . . . . . . . . . . . . . . . . . 1,933.4 1,984.1 1,638.0 (50.7) (2.6)% 346.1 21.1%Molybdenum . . . . . . . . . . . . . . . . . . . . . . . 47.0 47.9 51.5 (0.9) (1.9)% (3.6) (6.9)%Zinc . . . . . . . . . . . . . . . . . . . . . . . . . . . . . 151.4 163.1 136.5 (11.7) (7.2)% 26.6 19.5%Silver . . . . . . . . . . . . . . . . . . . . . . . . . . . . 15.9 16.2 13.3 (0.3) (1.5)% 2.9 21.7%
71
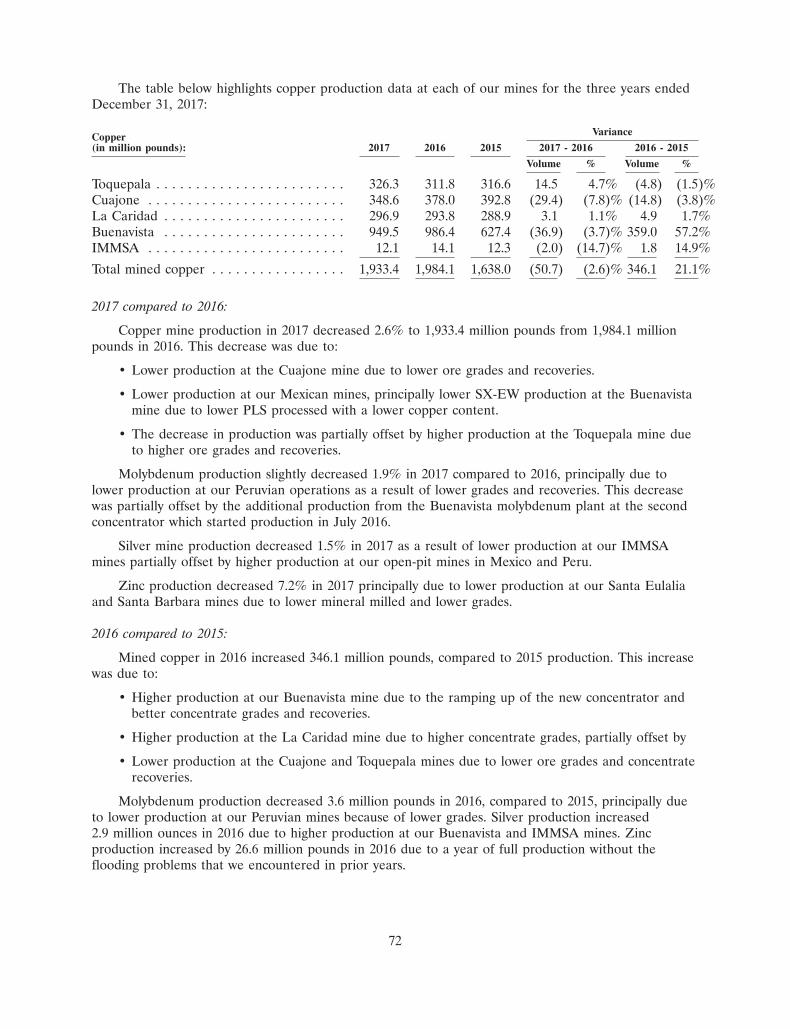
The table below highlights copper production data at each of our mines for the three years endedDecember 31, 2017:
VarianceCopper(in million pounds): 2017 2016 2015 2017 - 2016 2016 - 2015
Volume % Volume %
Toquepala . . . . . . . . . . . . . . . . . . . . . . . . 326.3 311.8 316.6 14.5 4.7% (4.8) (1.5)%Cuajone . . . . . . . . . . . . . . . . . . . . . . . . . 348.6 378.0 392.8 (29.4) (7.8)% (14.8) (3.8)%La Caridad . . . . . . . . . . . . . . . . . . . . . . . 296.9 293.8 288.9 3.1 1.1% 4.9 1.7%Buenavista . . . . . . . . . . . . . . . . . . . . . . . 949.5 986.4 627.4 (36.9) (3.7)% 359.0 57.2%IMMSA . . . . . . . . . . . . . . . . . . . . . . . . . 12.1 14.1 12.3 (2.0) (14.7)% 1.8 14.9%
Total mined copper . . . . . . . . . . . . . . . . . 1,933.4 1,984.1 1,638.0 (50.7) (2.6)% 346.1 21.1%
2017 compared to 2016:
Copper mine production in 2017 decreased 2.6% to 1,933.4 million pounds from 1,984.1 millionpounds in 2016. This decrease was due to:
• Lower production at the Cuajone mine due to lower ore grades and recoveries.
• Lower production at our Mexican mines, principally lower SX-EW production at the Buenavistamine due to lower PLS processed with a lower copper content.
• The decrease in production was partially offset by higher production at the Toquepala mine dueto higher ore grades and recoveries.
Molybdenum production slightly decreased 1.9% in 2017 compared to 2016, principally due tolower production at our Peruvian operations as a result of lower grades and recoveries. This decreasewas partially offset by the additional production from the Buenavista molybdenum plant at the secondconcentrator which started production in July 2016.
Silver mine production decreased 1.5% in 2017 as a result of lower production at our IMMSAmines partially offset by higher production at our open-pit mines in Mexico and Peru.
Zinc production decreased 7.2% in 2017 principally due to lower production at our Santa Eulaliaand Santa Barbara mines due to lower mineral milled and lower grades.
2016 compared to 2015:
Mined copper in 2016 increased 346.1 million pounds, compared to 2015 production. This increasewas due to:
• Higher production at our Buenavista mine due to the ramping up of the new concentrator andbetter concentrate grades and recoveries.
• Higher production at the La Caridad mine due to higher concentrate grades, partially offset by
• Lower production at the Cuajone and Toquepala mines due to lower ore grades and concentraterecoveries.
Molybdenum production decreased 3.6 million pounds in 2016, compared to 2015, principally dueto lower production at our Peruvian mines because of lower grades. Silver production increased2.9 million ounces in 2016 due to higher production at our Buenavista and IMMSA mines. Zincproduction increased by 26.6 million pounds in 2016 due to a year of full production without theflooding problems that we encountered in prior years.
72
Operating Cash Costs: An overall benchmark used by us and a common industry metric tomeasure performance is operating cash costs per pound of copper produced. Operating cash cost is anon-GAAP measure that does not have a standardized meaning and may not be comparable tosimilarly titled measures provided by other companies. This non-GAAP information should not beconsidered in isolation or as substitute for measures of performance determined in accordance withGAAP. A reconciliation of our operating cash cost per pound of copper produced to the cost of sales(exclusive of depreciation, amortization and depletion) as presented in the consolidated statement ofearnings is presented under the subheading, ‘‘Non-GAAP Information Reconciliation’’ on page 87. Wedisclose operating cash cost per pound of copper produced, both before and net of by-productrevenues.
We define operating cash cost per pound of copper produced before by-product revenues as cost of sales(exclusive of depreciation, amortization and depletion), plus selling, general and administrative charges,treatment and refining charges net of sales premiums; less the cost of purchased concentrates, workers’participation and other miscellaneous charges, including royalty charges, and the change in inventorylevels; divided by total pounds of copper produced by our own mines.
In our calculation of operating cash cost per pound of copper produced, we exclude depreciation,amortization and depletion, which are considered non-cash expenses. Exploration is considered adiscretionary expenditure and is also excluded. Workers’ participation provisions are determined on thebasis of pre-tax earnings and are also excluded. Additionally excluded from operating cash costs areitems of a non-recurring nature and the mining royalty charge as it is based on various calculations oftaxable income, depending on which jurisdiction, Peru or Mexico, is imposing the charge. We believethese adjustments will allow our management and stakeholders to see a presentation of our controllablecash cost, which we consider is one of the lowest of copper producing companies of similar size.
We define operating cash cost per pound of copper produced net of by-product revenues as operatingcash cost per pound of copper produced, as defined in the previous paragraph, less by-productrevenues and net revenue (loss) on sale of metal purchased from third parties.
In our calculation of operating cash cost per pound of copper produced, net of by-productrevenues, we credit against our costs the revenues from the sale of all our by-products, including,molybdenum, zinc, silver, gold, etc. and the net revenue (loss) on sale of metals purchased from thirdparties. We disclose this measure netting the by-product revenues in this way because we consider ourprincipal business to be the production and sale of copper. As part of our copper production process,much of our by-products are recovered. These by-products, as well as the processing of copperpurchased from third parties, are a supplemental part of our production process and their sales valuecontribute to cover part of our incurred fixed costs. We believe that our Company is viewed by theinvestment community as a copper company, and is valued, in large part, by the investmentcommunity’s view of the copper market and our ability to produce copper at a reasonable cost.
We believe that both of these measures are useful tools for our management and our stakeholders.Our cash costs before by-product revenues allow us to monitor our cost structure and address withoperating management areas of concern. The measure operating cash cost per pound of copperproduced net of by-product revenues is a common measure used in the copper industry and is a usefulmanagement tool that allows us to track our performance and better allocate our resources. Thismeasure is also used in our investment project evaluation process to determine a project’s potentialcontribution to our operations, its competitiveness and its relative strength in different price scenarios.The expected contribution of by-products is generally a significant factor used by the copper industry indetermining whether to move forward with the development of a new mining project. As the price ofour by-product commodities can have significant fluctuations from period to period, the value of itscontribution to our costs can be volatile.
73
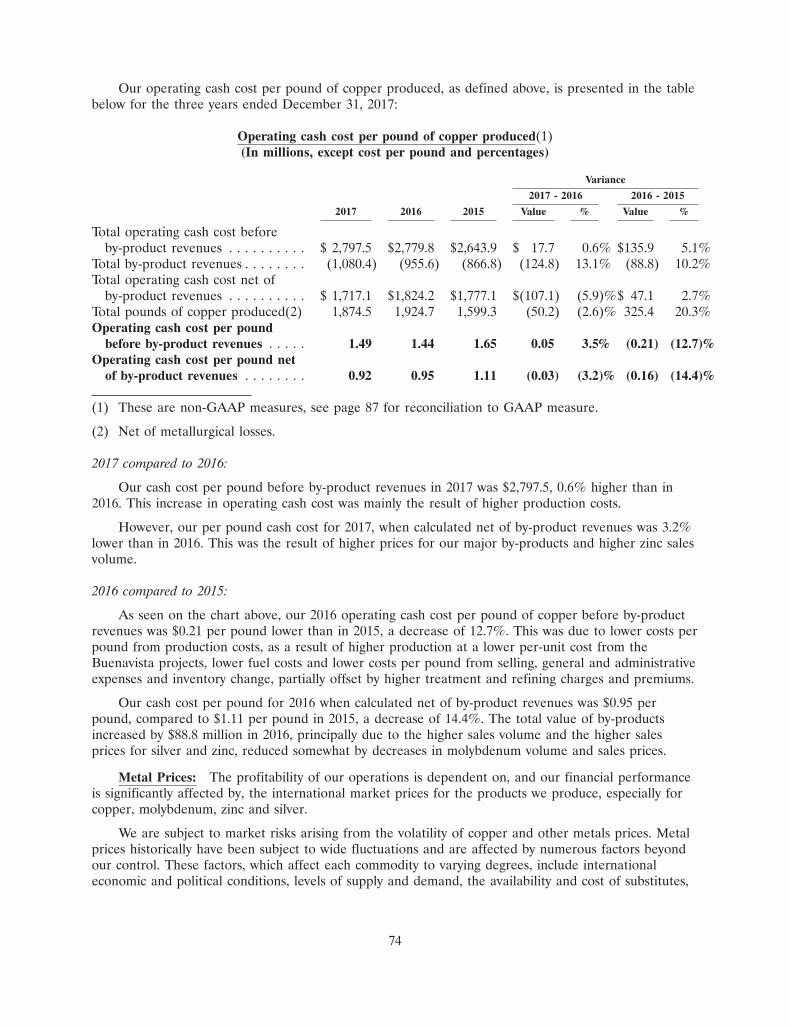
Our operating cash cost per pound of copper produced, as defined above, is presented in the tablebelow for the three years ended December 31, 2017:
Operating cash cost per pound of copper produced(1)(In millions, except cost per pound and percentages)
Variance
2017 - 2016 2016 - 2015
2017 2016 2015 Value % Value %
Total operating cash cost beforeby-product revenues . . . . . . . . . . $ 2,797.5 $2,779.8 $2,643.9 $ 17.7 0.6% $135.9 5.1%
Total by-product revenues . . . . . . . . (1,080.4) (955.6) (866.8) (124.8) 13.1% (88.8) 10.2%Total operating cash cost net of
by-product revenues . . . . . . . . . . $ 1,717.1 $1,824.2 $1,777.1 $(107.1) (5.9)%$ 47.1 2.7%Total pounds of copper produced(2) 1,874.5 1,924.7 1,599.3 (50.2) (2.6)% 325.4 20.3%Operating cash cost per pound
before by-product revenues . . . . . 1.49 1.44 1.65 0.05 3.5% (0.21) (12.7)%Operating cash cost per pound net
of by-product revenues . . . . . . . . 0.92 0.95 1.11 (0.03) (3.2)% (0.16) (14.4)%
(1) These are non-GAAP measures, see page 87 for reconciliation to GAAP measure.
(2) Net of metallurgical losses.
2017 compared to 2016:
Our cash cost per pound before by-product revenues in 2017 was $2,797.5, 0.6% higher than in2016. This increase in operating cash cost was mainly the result of higher production costs.
However, our per pound cash cost for 2017, when calculated net of by-product revenues was 3.2%lower than in 2016. This was the result of higher prices for our major by-products and higher zinc salesvolume.
2016 compared to 2015:
As seen on the chart above, our 2016 operating cash cost per pound of copper before by-productrevenues was $0.21 per pound lower than in 2015, a decrease of 12.7%. This was due to lower costs perpound from production costs, as a result of higher production at a lower per-unit cost from theBuenavista projects, lower fuel costs and lower costs per pound from selling, general and administrativeexpenses and inventory change, partially offset by higher treatment and refining charges and premiums.
Our cash cost per pound for 2016 when calculated net of by-product revenues was $0.95 perpound, compared to $1.11 per pound in 2015, a decrease of 14.4%. The total value of by-productsincreased by $88.8 million in 2016, principally due to the higher sales volume and the higher salesprices for silver and zinc, reduced somewhat by decreases in molybdenum volume and sales prices.
Metal Prices: The profitability of our operations is dependent on, and our financial performanceis significantly affected by, the international market prices for the products we produce, especially forcopper, molybdenum, zinc and silver.
We are subject to market risks arising from the volatility of copper and other metals prices. Metalprices historically have been subject to wide fluctuations and are affected by numerous factors beyondour control. These factors, which affect each commodity to varying degrees, include internationaleconomic and political conditions, levels of supply and demand, the availability and cost of substitutes,
74
inventory levels maintained by producers and others and, to a lesser degree, inventory carrying costsand currency exchange rates. In addition, the market prices of certain metals have on occasion beensubject to rapid short-term changes due to economic concerns and financial investments.
For 2018, assuming that expected metal production and sales are achieved, that 2017 tax rates areunchanged and giving no effect to potential hedging programs, metal price sensitivity factors wouldindicate the following change in estimated annual net income attributable to SCC resulting from metalprice changes:
Copper Molybdenum Zinc Silver
Change in metal prices (per pound except silver—per ounce) . . . . $ 0.10 $1.00 $0.10 $1.00Change in net earnings (in millions) . . . . . . . . . . . . . . . . . . . . . . $143.9 $32.0 $16.9 $14.9
Business Segments: We view our Company as having three reportable segments and manage it onthe basis of these segments. These segments are (1) our Peruvian operations, (2) our Mexican open-pitoperations and (3) our Mexican underground operations, known as our IMMSA unit. Our Peruvianoperations include the Toquepala and Cuajone mine complexes and the smelting and refining plants,industrial railroad and port facilities that service both mines. Our Mexican open-pit operations includeLa Caridad and Buenavista mine complexes, the smelting and refining plants and support facilities,which service both mines. Our IMMSA unit includes five underground mines, a coal mine, and severalindustrial processing facilities.
Segment information is included in our review of ‘‘Results of Operations’’ in this item and also inNote 17 ‘‘Segment and Related Information’’ of our consolidated financial statements.
Inflation and Exchange Rate Effect of the Peruvian sol and the Mexican peso: Our functionalcurrency is the U.S. dollar and our revenues are primarily denominated in U.S. dollars. Significantportions of our operating costs are denominated in Peruvian sol and Mexican pesos. Accordingly, wheninflation and currency devaluation/appreciation of the Peruvian and Mexican currency occur, ouroperating results can be affected. In recent years, we do believe such changes have not had a materialeffect on our results and financial position. Please see Item 7A ‘‘Quantitative and QualitativeDisclosures about Market Risk’’ for more detailed information.
Capital Investment Program: We made capital investments of $1,023.5 million in 2017,$1,118.5 million in 2016 (including the El Pilar acquisition) and $1,250.0 million in 2015 (including theEl Pilar acquisition). In general, the capital investments and projects described below are intended toincrease production, decrease costs or address social and environmental commitments.
75
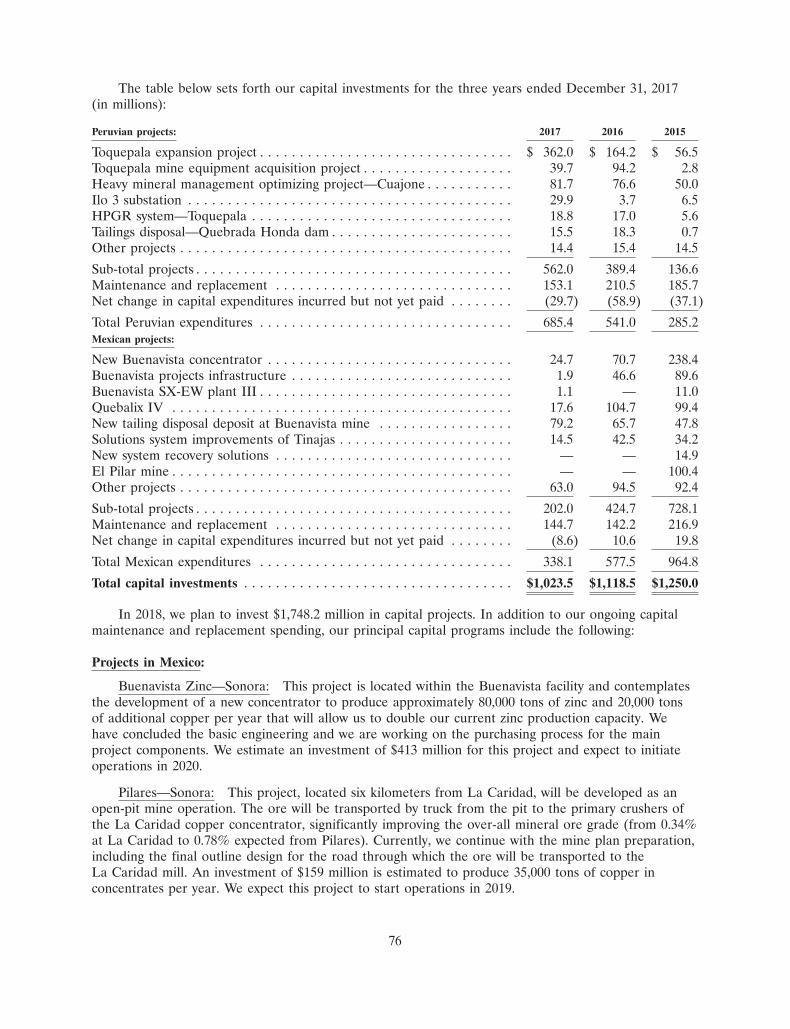
The table below sets forth our capital investments for the three years ended December 31, 2017(in millions):
Peruvian projects: 2017 2016 2015
Toquepala expansion project . . . . . . . . . . . . . . . . . . . . . . . . . . . . . . . . $ 362.0 $ 164.2 $ 56.5Toquepala mine equipment acquisition project . . . . . . . . . . . . . . . . . . . 39.7 94.2 2.8Heavy mineral management optimizing project—Cuajone . . . . . . . . . . . 81.7 76.6 50.0Ilo 3 substation . . . . . . . . . . . . . . . . . . . . . . . . . . . . . . . . . . . . . . . . . 29.9 3.7 6.5HPGR system—Toquepala . . . . . . . . . . . . . . . . . . . . . . . . . . . . . . . . . 18.8 17.0 5.6Tailings disposal—Quebrada Honda dam . . . . . . . . . . . . . . . . . . . . . . . 15.5 18.3 0.7Other projects . . . . . . . . . . . . . . . . . . . . . . . . . . . . . . . . . . . . . . . . . . 14.4 15.4 14.5
Sub-total projects . . . . . . . . . . . . . . . . . . . . . . . . . . . . . . . . . . . . . . . . 562.0 389.4 136.6Maintenance and replacement . . . . . . . . . . . . . . . . . . . . . . . . . . . . . . 153.1 210.5 185.7Net change in capital expenditures incurred but not yet paid . . . . . . . . (29.7) (58.9) (37.1)
Total Peruvian expenditures . . . . . . . . . . . . . . . . . . . . . . . . . . . . . . . . 685.4 541.0 285.2Mexican projects:
New Buenavista concentrator . . . . . . . . . . . . . . . . . . . . . . . . . . . . . . . 24.7 70.7 238.4Buenavista projects infrastructure . . . . . . . . . . . . . . . . . . . . . . . . . . . . 1.9 46.6 89.6Buenavista SX-EW plant III . . . . . . . . . . . . . . . . . . . . . . . . . . . . . . . . 1.1 — 11.0Quebalix IV . . . . . . . . . . . . . . . . . . . . . . . . . . . . . . . . . . . . . . . . . . . 17.6 104.7 99.4New tailing disposal deposit at Buenavista mine . . . . . . . . . . . . . . . . . 79.2 65.7 47.8Solutions system improvements of Tinajas . . . . . . . . . . . . . . . . . . . . . . 14.5 42.5 34.2New system recovery solutions . . . . . . . . . . . . . . . . . . . . . . . . . . . . . . — — 14.9El Pilar mine . . . . . . . . . . . . . . . . . . . . . . . . . . . . . . . . . . . . . . . . . . . — — 100.4Other projects . . . . . . . . . . . . . . . . . . . . . . . . . . . . . . . . . . . . . . . . . . 63.0 94.5 92.4
Sub-total projects . . . . . . . . . . . . . . . . . . . . . . . . . . . . . . . . . . . . . . . . 202.0 424.7 728.1Maintenance and replacement . . . . . . . . . . . . . . . . . . . . . . . . . . . . . . 144.7 142.2 216.9Net change in capital expenditures incurred but not yet paid . . . . . . . . (8.6) 10.6 19.8
Total Mexican expenditures . . . . . . . . . . . . . . . . . . . . . . . . . . . . . . . . 338.1 577.5 964.8
Total capital investments . . . . . . . . . . . . . . . . . . . . . . . . . . . . . . . . . . $1,023.5 $1,118.5 $1,250.0
In 2018, we plan to invest $1,748.2 million in capital projects. In addition to our ongoing capitalmaintenance and replacement spending, our principal capital programs include the following:
Projects in Mexico:
Buenavista Zinc—Sonora: This project is located within the Buenavista facility and contemplatesthe development of a new concentrator to produce approximately 80,000 tons of zinc and 20,000 tonsof additional copper per year that will allow us to double our current zinc production capacity. Wehave concluded the basic engineering and we are working on the purchasing process for the mainproject components. We estimate an investment of $413 million for this project and expect to initiateoperations in 2020.
Pilares—Sonora: This project, located six kilometers from La Caridad, will be developed as anopen-pit mine operation. The ore will be transported by truck from the pit to the primary crushers ofthe La Caridad copper concentrator, significantly improving the over-all mineral ore grade (from 0.34%at La Caridad to 0.78% expected from Pilares). Currently, we continue with the mine plan preparation,including the final outline design for the road through which the ore will be transported to theLa Caridad mill. An investment of $159 million is estimated to produce 35,000 tons of copper inconcentrates per year. We expect this project to start operations in 2019.
76
Projects in Peru:
We currently have a portfolio of projects in Peru, with a total capital budget of $2,900 million, outof which $1,620 million have already been invested.
Toquepala Expansion Project—Tacna: This $1.2 billion project includes a new state-of-the-artconcentrator which will increase Toquepala’s annual copper production by 100,000 tons to reach245,000 tons in 2019, a 69% production increase. Through December 31, 2017, we have invested$892.9 million in this expansion. The project has reached 87% progress and is expected to initiateproduction in June 2018.
The project to improve the crushing process at Toquepala with the installation of a High PressureGrinding Roll (HPGR) system, has as its main objective, to ensure that our existing concentrator willoperate at its maximum annual production capacity of 117,000 tons of copper while reducing operatingcosts through ore crushing efficiencies, even with an increase of the ore material hardness index. Thebudget for this project is $50 million and as of December 31, 2017, we have invested $38.9 million inthis project. We expect that it will be completed by the first quarter of 2018.
Cuajone Projects—Moquegua: The Mineral Crushing and Hauling Project consisted of replacingrail haulage at the Cuajone mine by an in-pit primary crusher with a 7 km overland conveyor beltsystem to move ore to the concentrator. Operating savings are estimated at $23 million annually. As ofDecember 31, 2017, the project is already completed and in operation. Total investment was$226 million, as budgeted.
The Cuajone tailing thickeners project at the concentrator will replace two of the three existingthickeners with a new hi-rate thickener. The purpose is to streamline the concentrator flotation processand improve water recovery efficiency, increasing the tailings solids content from 54% to 61%, therebyreducing fresh water consumption and replacing it with recovered water. Equipment assembly iscompleted and we are in the commissioning process. As of December 31, 2017, we have invested$27.6 million in this project out of the approved capital budget of $30 million. We expect the project tobe completed by the end of the first quarter of 2018.
Tailings disposal at Quebrada Honda—Moquegua: This project increases the height of theexisting Quebrada Honda dam to impound future tailings from the Toquepala and Cuajone mills andwill extend the expected life of this tailings facility by 25 years. The first stage and construction of thedrainage system for the lateral dam is finished. We finished the second stage with the installation of anew cyclone battery station that allows us to place more slurry at the dams. We are in a biddingprocess for a new stage which will improve the operational processes. The project has a total budgetedcost of $116.0 million. We have invested $85.7 million through December 31, 2017 and expect theproject to be completed by the fourth quarter of 2018.
Potential projects:
We have a number of other projects that we may develop in the future. We continuously evaluatenew projects on the basis of our long-term corporate objectives, strategic and operating fit, expectedreturn on investment, required investment, estimated production, estimated cash-flow profile, social andenvironmental considerations, among other factors. All capital spending plans will continue to bereviewed and adjusted to respond to changes in the economy or market conditions. We are currentlydeveloping a new organic growth plan to increase our annual copper production to 1.5 million tons by2025 with the development of new projects, which include the following:
El Arco: This is a world class copper deposit located in the central part of the Baja Californiapeninsula, with ore reserves over 2.7 billion tons with an ore grade of 0.399% and 0.11 grams of goldper ton. This project, includes an open-pit mine combining concentrator and SX-EW operations with
77
an estimated production of 190,000 tons of copper and 105,000 ounces of gold annually. Between July2015 and February 2016, we conducted a drilling program of 20,170 meters in order to further definethe deposit at lower depths of between 300 and 600 meters. In 2018, we expect to conduct furtherexploration activities. In addition, we will begin an engineering study to define optimization alternativesfor the project and update the feasibility study, besides further analysis in the electrical energy supply.
El Pilar: This is a fully permitted, low capital intensity copper development project strategicallylocated in Sonora, Mexico, approximately 45 kilometers from our Buenavista mine. Its copper oxidemineralization contains estimated proven and probable reserves of 325 million tons of ore with anaverage copper grade of 0.287%. El Pilar will operate as a conventional open-pit mine and coppercathodes will be produced using the highly cost efficient and environmentally friendly SX-EWtechnology. Average annual production is currently estimated at 35,000 tons of copper cathodes over aninitial 13-year mine life, with start of commercial operations forecasted for 2019. On a preliminarybasis, we estimate a development investment of approximately $310 million. In 2016, we conducted adiamond drilling program of 3,700 meters and a geophysical survey of 40 kilometers in order to confirmthe reserves. Additionally, the results allowed us to identify potential new areas of interest. During thefirst half of 2017, we initiated a reserve estimation program. In July 2017, we started a 20,000 meterdrilling program focused on further assessing the geophysical anomalies detected in the explorationprogram of 2016. During 2018 we will continue with the metallurgical testing program and the leachingoptimization studies.
Tia Maria: We have completed engineering and after having complied with all environmentalrequirements, we have obtained the approval of the environmental impact assessment. We are workingjointly with the Peruvian Government to obtain the construction license for this 120,000 tons of SX-EWcopper per year greenfield project with a total capital investment of $1,400 million. We expect thelicense to be issued in the first half of 2018.
This greenfield project, located in Arequipa, Peru, will use state of the art SX-EW technology withthe highest international environmental standards. SX-EW facilities are the most environmentallyfriendly in the industry due to their technical process with no emissions released into the atmosphere.The project will use seawater, transporting it more than 25 kilometers to an altitude of 1,000 metersabove sea level. The construction of the desalinization plant requires an investment of approximately$95 million.
We expect the project to generate 3,600 jobs during the construction phase. When in operation,Tia Maria will directly employ 600 workers and indirectly provide jobs to another 4,200. Through itsexpected twenty-year life, the project related services will create significant business opportunities in theArequipa region. Tia Maria has complied with all existing requirements and regulations and thereforethe Company trusts that it will soon receive from government authorities the construction licenses andpermits required in order to begin construction of this project.
Los Chancas. This greenfield project, located in Apurimac, Peru, is a copper and molybdenumporphyry deposit. Current estimates indicate the presence of 545 million tons of mineralized materialwith a copper content of 0.59%, molybdenum content of 0.04% and 0.039 grams of gold per ton as wellas, 181 million tons of mineralized leachable material with a total copper content of 0.357%. LosChancas project envisions an open-pit mine with a combined operation of concentrator and SX-EWprocesses to produce 130,000 tons of copper and 7,500 tons of molybdenum. The estimated capitalinvestment is $2,800 million and is expected to be in operation in 2022. In 2016 and 2017, we continuedwith the development of social and environmental improvements for the local communities in order toconduct the environmental impact assessment, which will begin in the first months of 2018.
The above information is based on estimates only. We cannot make any assurances that we willundertake any of these projects or that the information noted is accurate.
78
CRITICAL ACCOUNTING POLICIES AND ESTIMATES
Our significant accounting policies are discussed in Note 2 ‘‘Summary of Significant AccountingPolicies’’ of the Notes to Consolidated Financial Statements, included in Item 8 ‘‘Financial Statementsand Supplementary Data’’ of this Annual Report.
Our discussion and analysis of financial condition and results of operations, as well as quantitativeand qualitative disclosures about market risks, are based upon our consolidated financial statements,which have been prepared in accordance with U.S. GAAP. Preparation of these consolidated financialstatements requires our management to make estimates and assumptions that affect the reportedamounts of assets and liabilities and disclosures of contingent assets and liabilities at the date of thefinancial statements and the reported amounts of revenues and expenses during the reporting period.We make our best estimate of the ultimate outcome for these items based on historical trends andother information available when the financial statements are prepared. Changes in estimates arerecognized in accordance with the accounting rules for the estimate, which is typically in the periodwhen new information becomes available to management. Areas where the nature of the estimatemakes it reasonably possible that actual results could materially differ from amounts estimated include:ore reserves, revenue recognition, leachable material and related amortization, estimated impairment ofassets, asset retirement obligations, valuation allowances for deferred tax assets and unrecognized taxbenefits. We base our estimates on historical experience and on various other assumptions that webelieve to be reasonable under the circumstances. Actual results may differ from these estimates underdifferent assumptions or conditions.
Ore Reserves: For internal ore reserve estimation, we use metal price assumptions of $2.90 perpound for copper and $7.50 per pound for molybdenum. These prices are intended to conservativelyapproximate average prices over the long term.
However, pursuant to SEC guidance, the reserve information in this report is calculated usingaverage metals prices over the most recent three years, except as otherwise stated. We refer to thesethree-year average metals prices as ‘‘current average prices.’’ Our current average prices for copper arecalculated using prices quoted by COMEX, and our current average prices for molybdenum arecalculated using prices published in Platt’s Metals Week. Unless otherwise stated, reserve estimates inthis report use the following three years average prices for copper and molybdenum as ofDecember 31, 2017:
Average2017 2016 2015 2017 - 2015
Copper ($ per pound) . . . . . . . . . . . . . . . . . . . . $2.80 $2.20 $2.51 $2.50Molybdenum ($ per pound) . . . . . . . . . . . . . . . . $8.21 $6.42 $6.59 $7.07
Certain financial information is based on reserve estimates calculated on the basis of currentaverage prices. These include amortization of intangible assets and mine development. Variations in orereserve calculations from changes in metal price assumptions generally do not create material changesto our financial results. However, significant decreases in metal prices could adversely affect ourearnings by causing, among other things, asset impairment charges, please see ‘‘Assets impairment’’below. A 20% increase or decrease in three-year average copper prices (current prices), for mineralreserves estimation, which is a reasonable possibility, would not materially affect our statement ofearnings as the amount of reserves would not change significantly. Please see Item 2 ‘‘Properties—caption Ore reserves.’’
Ore stockpiles on leach pads: The leaching process is an integral part of the mining operationscarried out at our open-pit mines. We capitalize the production cost of leachable material at ourToquepala, La Caridad and Buenavista mines recognizing it as inventory. The estimates of recoverablemineral content contained in the leaching dumps are supported by engineering studies. As the
79
production cycle of the leaching process is significantly longer than the conventional process ofconcentrating, smelting and electrolytic refining, we include on our balance sheet, current leachinventory (as part of work-in-process inventories) and long-term leach inventory. Amortization ofleachable material is recorded by the units of production method.
Asset Retirement Obligation: Our mining and exploration activities are subject to various lawsand regulations governing the protection of the environment. Accounting for reclamation andremediation obligations requires management to make estimates unique to each mining operation ofthe future costs we will incur to complete the reclamation and remediation work required to complywith existing laws and regulations. These estimates are based in part on our inflation and credit rateassumptions. Actual costs incurred in future periods could differ from amounts estimated. Additionally,future changes to environmental laws and regulations could increase the extent of reclamation andremediation work required to be performed by us. Any such increases in future costs could materiallyimpact the amounts charged to operations for reclamation and remediation.
Asset retirement obligations are further discussed in Note 9 ‘‘Asset Retirement Obligation’’ to ourconsolidated financial statements included herein.
Revenue Recognition: For certain of our sales of copper and molybdenum products, customercontracts allow for pricing based on a month subsequent to shipping, in most cases within the followingthree months and in few cases perhaps a few further months. In such cases, revenue is recorded at aprovisional price at the time of shipment. The provisionally priced copper sales are adjusted to reflectforward LME or COMEX copper prices at the end of each month until a final adjustment is made tothe price of the shipments upon settlement with customers pursuant to the terms of the contract. In thecase of molybdenum sales, for which there are no published forward prices, the provisionally pricedsales are adjusted to reflect the market prices at the end of each month until a final adjustment ismade to the price of the shipments upon settlement with customers pursuant to the terms of thecontract. (See details in ‘‘Provisionally Priced Sales’’ under this Item 7).
Income Taxes: In preparing our consolidated financial statements, we recognize income taxes ineach of the jurisdictions in which we operate. For each jurisdiction, we calculate the actual amountcurrently payable or receivable, as well as deferred tax assets and liabilities attributable to temporarydifferences between the financial statement carrying amounts of existing assets and liabilities and theirrespective tax bases. Deferred income tax assets and liabilities are measured using enacted tax ratesexpected to apply to taxable income in the years in which these temporary differences are expected tobe recovered or settled. The effect on deferred tax assets and liabilities of a change in rate isrecognized through the income tax provision in the period that the change is enacted.
A valuation allowance is provided for those deferred tax assets for which it is more likely than notthat the related benefits will not be realized. In determining the amount of the valuation allowance, weconsider estimated future taxable income, as well as feasible tax planning strategies in each jurisdiction.If we determine that we will not realize all or a portion of our deferred tax assets, we will increase ourvaluation allowance with a charge to income tax expense. Conversely, if we determine that we willultimately be able to realize all or a portion of the related benefits for which a valuation allowance hasbeen provided, all or a portion of the related valuation allowance will be reduced with a credit toincome tax expense.
Our Company’s operations involve dealing with uncertainties and judgments in the application ofcomplex tax regulations in multiple jurisdictions. The final taxes paid are dependent upon many factors,including negotiations with taxing authorities in various jurisdictions and resolution of disputes arisingfrom federal, state, and international tax audits. We recognize potential liabilities and record taxliabilities for anticipated tax audit issues in the U.S. and other tax jurisdictions based on our estimateof whether, and the extent to which, additional taxes will be due. We follow the guidance of ASC 740
80
‘‘Income Taxes’’ to record these liabilities. (See Note 7 ‘‘Income Taxes’’ of the consolidated financialstatements for additional information). We adjust these reserves in light of changing facts andcircumstances; however, due to the complexity of some of these uncertainties, the ultimate resolutionmay result in a payment that is materially different from our current estimate of the tax liabilities. Ifour estimate of tax liabilities proves to be less than the ultimate assessment, an additional charge toexpense would result. If payment of these amounts ultimately proves to be less than the recordedamounts, the reversal of the liabilities would result in tax benefits being recognized in the period whenwe determine the liabilities are no longer necessary. We recognize interest and penalties, if any, relatedto unrecognized tax benefits in income tax expense.
On December 22, 2017, the President of the United States signed into law the Tax Cuts and JobsAct (‘‘the Act’’). The Act significantly changes U.S. tax law by, among other things, lowering corporateincome tax rates, implementing a territorial tax system and imposing a repatriation tax on deemedrepatriated earnings of foreign subsidiaries. The Act permanently reduces the U.S. corporate incometax rate from a maximum of 35% to a flat 21% effective January 1, 2018. The SEC staff issued StaffAccounting Bulletin No. 118 (‘‘SAB 118’’) to address the application of U.S. GAAP in situations whena registrant does not have the necessary information available, prepared, or analyzed (includingcomputations) in reasonable detail to complete the accounting for certain income tax effects of the Act.The Company has recognized the provisional tax impacts related to deemed repatriated earnings andthe revaluation of deferred tax assets and liabilities and included these amounts in its consolidatedfinancial statements for the year ended December 31, 2017. The ultimate impact may differ from theseprovisional amounts, possibly materially, due to, among other things, additional analysis, changes ininterpretations and assumptions the Company has made, additional regulatory guidance that may beissued, and actions the Company may take as a result of the Act. The accounting is expected to becomplete in the fourth quarter of 2018 in accordance with SAB 118. For further information, seeNote 7 ‘‘Income Taxes’’, of our consolidated financial statements.
Asset Impairments: We evaluate our long-term assets when events or changes in economiccircumstances indicate that the carrying amount of such assets may not be recoverable. Our evaluationsare based on business plans that are prepared using a time horizon that is reflective of our expectationsof metal prices over our business cycle. We are currently using an average copper price of $2.20 perpound and an average molybdenum price of $5.00 per pound, reflective of what we believe is the lowerlevel of the current price environment, for our impairment tests. The results of our impairmentsensitivity analysis, which included a stress test using a copper price assumption of $2.00 per pound anda molybdenum price assumption of $4.00 per pound showed projected discounted cash flows in excessof the carrying amounts of long-lived assets by margins ranging from 2.15 to 4.05 times such carryingamount.
In recent years our assumptions for long-term average prices resulted in stricter evaluations forimpairment analysis than using the three year average prices for copper and molybdenum prices.Should this situation reverse in the future with three year average prices below the long-term priceassumption, we would assess the need to use the three year average prices in our evaluations. We usean estimate of the future undiscounted net cash flows of the related asset or asset group over theremaining life to measure whether the assets are recoverable and measure any impairment by referenceto fair value.
81
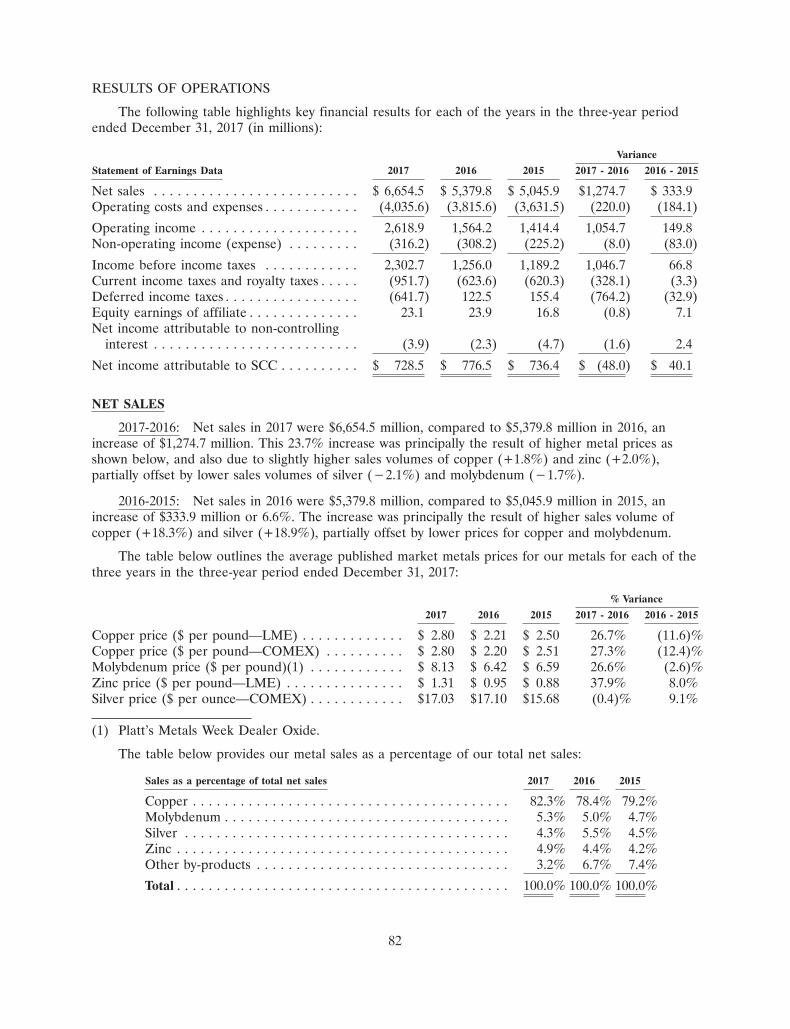
RESULTS OF OPERATIONS
The following table highlights key financial results for each of the years in the three-year periodended December 31, 2017 (in millions):
Variance
Statement of Earnings Data 2017 2016 2015 2017 - 2016 2016 - 2015
Net sales . . . . . . . . . . . . . . . . . . . . . . . . . . $ 6,654.5 $ 5,379.8 $ 5,045.9 $1,274.7 $ 333.9Operating costs and expenses . . . . . . . . . . . . (4,035.6) (3,815.6) (3,631.5) (220.0) (184.1)
Operating income . . . . . . . . . . . . . . . . . . . . 2,618.9 1,564.2 1,414.4 1,054.7 149.8Non-operating income (expense) . . . . . . . . . (316.2) (308.2) (225.2) (8.0) (83.0)
Income before income taxes . . . . . . . . . . . . 2,302.7 1,256.0 1,189.2 1,046.7 66.8Current income taxes and royalty taxes . . . . . (951.7) (623.6) (620.3) (328.1) (3.3)Deferred income taxes . . . . . . . . . . . . . . . . . (641.7) 122.5 155.4 (764.2) (32.9)Equity earnings of affiliate . . . . . . . . . . . . . . 23.1 23.9 16.8 (0.8) 7.1Net income attributable to non-controlling
interest . . . . . . . . . . . . . . . . . . . . . . . . . . (3.9) (2.3) (4.7) (1.6) 2.4
Net income attributable to SCC . . . . . . . . . . $ 728.5 $ 776.5 $ 736.4 $ (48.0) $ 40.1
NET SALES
2017-2016: Net sales in 2017 were $6,654.5 million, compared to $5,379.8 million in 2016, anincrease of $1,274.7 million. This 23.7% increase was principally the result of higher metal prices asshown below, and also due to slightly higher sales volumes of copper (+1.8%) and zinc (+2.0%),partially offset by lower sales volumes of silver (�2.1%) and molybdenum (�1.7%).
2016-2015: Net sales in 2016 were $5,379.8 million, compared to $5,045.9 million in 2015, anincrease of $333.9 million or 6.6%. The increase was principally the result of higher sales volume ofcopper (+18.3%) and silver (+18.9%), partially offset by lower prices for copper and molybdenum.
The table below outlines the average published market metals prices for our metals for each of thethree years in the three-year period ended December 31, 2017:
% Variance
2017 2016 2015 2017 - 2016 2016 - 2015
Copper price ($ per pound—LME) . . . . . . . . . . . . . $ 2.80 $ 2.21 $ 2.50 26.7% (11.6)%Copper price ($ per pound—COMEX) . . . . . . . . . . $ 2.80 $ 2.20 $ 2.51 27.3% (12.4)%Molybdenum price ($ per pound)(1) . . . . . . . . . . . . $ 8.13 $ 6.42 $ 6.59 26.6% (2.6)%Zinc price ($ per pound—LME) . . . . . . . . . . . . . . . $ 1.31 $ 0.95 $ 0.88 37.9% 8.0%Silver price ($ per ounce—COMEX) . . . . . . . . . . . . $17.03 $17.10 $15.68 (0.4)% 9.1%
(1) Platt’s Metals Week Dealer Oxide.
The table below provides our metal sales as a percentage of our total net sales:
Sales as a percentage of total net sales 2017 2016 2015
Copper . . . . . . . . . . . . . . . . . . . . . . . . . . . . . . . . . . . . . . . . 82.3% 78.4% 79.2%Molybdenum . . . . . . . . . . . . . . . . . . . . . . . . . . . . . . . . . . . . 5.3% 5.0% 4.7%Silver . . . . . . . . . . . . . . . . . . . . . . . . . . . . . . . . . . . . . . . . . 4.3% 5.5% 4.5%Zinc . . . . . . . . . . . . . . . . . . . . . . . . . . . . . . . . . . . . . . . . . . 4.9% 4.4% 4.2%Other by-products . . . . . . . . . . . . . . . . . . . . . . . . . . . . . . . . 3.2% 6.7% 7.4%
Total . . . . . . . . . . . . . . . . . . . . . . . . . . . . . . . . . . . . . . . . . . 100.0% 100.0% 100.0%
82
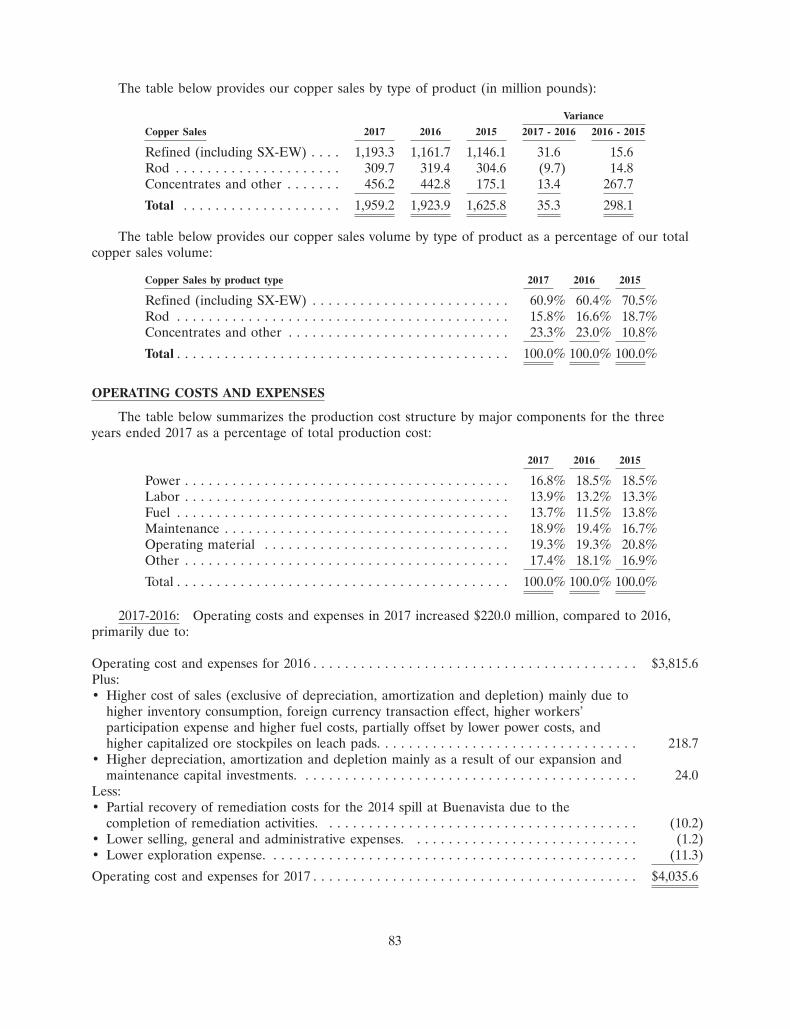
The table below provides our copper sales by type of product (in million pounds):
Variance
Copper Sales 2017 2016 2015 2017 - 2016 2016 - 2015
Refined (including SX-EW) . . . . 1,193.3 1,161.7 1,146.1 31.6 15.6Rod . . . . . . . . . . . . . . . . . . . . . 309.7 319.4 304.6 (9.7) 14.8Concentrates and other . . . . . . . 456.2 442.8 175.1 13.4 267.7
Total . . . . . . . . . . . . . . . . . . . . 1,959.2 1,923.9 1,625.8 35.3 298.1
The table below provides our copper sales volume by type of product as a percentage of our totalcopper sales volume:
Copper Sales by product type 2017 2016 2015
Refined (including SX-EW) . . . . . . . . . . . . . . . . . . . . . . . . . 60.9% 60.4% 70.5%Rod . . . . . . . . . . . . . . . . . . . . . . . . . . . . . . . . . . . . . . . . . . 15.8% 16.6% 18.7%Concentrates and other . . . . . . . . . . . . . . . . . . . . . . . . . . . . 23.3% 23.0% 10.8%
Total . . . . . . . . . . . . . . . . . . . . . . . . . . . . . . . . . . . . . . . . . . 100.0% 100.0% 100.0%
OPERATING COSTS AND EXPENSES
The table below summarizes the production cost structure by major components for the threeyears ended 2017 as a percentage of total production cost:
2017 2016 2015
Power . . . . . . . . . . . . . . . . . . . . . . . . . . . . . . . . . . . . . . . . . 16.8% 18.5% 18.5%Labor . . . . . . . . . . . . . . . . . . . . . . . . . . . . . . . . . . . . . . . . . 13.9% 13.2% 13.3%Fuel . . . . . . . . . . . . . . . . . . . . . . . . . . . . . . . . . . . . . . . . . . 13.7% 11.5% 13.8%Maintenance . . . . . . . . . . . . . . . . . . . . . . . . . . . . . . . . . . . . 18.9% 19.4% 16.7%Operating material . . . . . . . . . . . . . . . . . . . . . . . . . . . . . . . 19.3% 19.3% 20.8%Other . . . . . . . . . . . . . . . . . . . . . . . . . . . . . . . . . . . . . . . . . 17.4% 18.1% 16.9%
Total . . . . . . . . . . . . . . . . . . . . . . . . . . . . . . . . . . . . . . . . . . 100.0% 100.0% 100.0%
2017-2016: Operating costs and expenses in 2017 increased $220.0 million, compared to 2016,primarily due to:
Operating cost and expenses for 2016 . . . . . . . . . . . . . . . . . . . . . . . . . . . . . . . . . . . . . . . . . $3,815.6Plus:• Higher cost of sales (exclusive of depreciation, amortization and depletion) mainly due to
higher inventory consumption, foreign currency transaction effect, higher workers’participation expense and higher fuel costs, partially offset by lower power costs, andhigher capitalized ore stockpiles on leach pads. . . . . . . . . . . . . . . . . . . . . . . . . . . . . . . . . 218.7
• Higher depreciation, amortization and depletion mainly as a result of our expansion andmaintenance capital investments. . . . . . . . . . . . . . . . . . . . . . . . . . . . . . . . . . . . . . . . . . . 24.0
Less:• Partial recovery of remediation costs for the 2014 spill at Buenavista due to the
completion of remediation activities. . . . . . . . . . . . . . . . . . . . . . . . . . . . . . . . . . . . . . . . (10.2)• Lower selling, general and administrative expenses. . . . . . . . . . . . . . . . . . . . . . . . . . . . . (1.2)• Lower exploration expense. . . . . . . . . . . . . . . . . . . . . . . . . . . . . . . . . . . . . . . . . . . . . . . (11.3)
Operating cost and expenses for 2017 . . . . . . . . . . . . . . . . . . . . . . . . . . . . . . . . . . . . . . . . . $4,035.6
83
2016-2015: Operating costs and expenses in 2016 increased $184.1 million, compared to 2015,primarily due to:
Operating cost and expenses for 2015 . . . . . . . . . . . . . . . . . . . . . . . . . . . . . . . . . . . . . . . . . $3,631.5Plus:• Higher cost of sales (exclusive of depreciation, amortization and depletion), mainly as a
result of higher sales volume, capitalized leachable material, maintentance costs, and salesexpenses; partially offset by lower fuel costs, inventory consumption, and lower cost ofmetals purchased from third parties. . . . . . . . . . . . . . . . . . . . . . . . . . . . . . . . . . . . . . . . . 106.5
• Higher depreciation, amortization and depletion mainly as a result of our expansion andmaintenance capital investments. . . . . . . . . . . . . . . . . . . . . . . . . . . . . . . . . . . . . . . . . . . 136.4
Less:• Lower environmental remediation expenses from the 2014 spill at Buenavista. . . . . . . . . . (45.0)• Lower exploration expenses in Mexico, Peru and other exploration locations. . . . . . . . . . . (8.7)• Lower selling, general and administrative expenses. . . . . . . . . . . . . . . . . . . . . . . . . . . . . (5.1)
Operating cost and expenses for 2016 . . . . . . . . . . . . . . . . . . . . . . . . . . . . . . . . . . . . . . . . . $3,815.6
VarianceNON-OPERATINGINCOME (EXPENSE) 2017 2016 2015 2017 - 2016 2016 - 2015
Interest expense . . . . . . . . . . . . . . . . . . . . . . . . . $(357.4) $(360.3) $(334.0) $ 2.9 $(26.3)Capitalized interest . . . . . . . . . . . . . . . . . . . . . . . 51.4 69.6 123.2 (18.2) (53.6)Other (expense) income . . . . . . . . . . . . . . . . . . . (15.7) (24.6) (25.3) 8.9 0.7Interest income . . . . . . . . . . . . . . . . . . . . . . . . . 5.5 7.1 10.9 (1.6) (3.8)
Total non-operating income (expense) . . . . . . . . . $(316.2) $(308.2) $(225.2) $ (8.0) $(83.0)
2017-2016: Non-operating income and expense were a net expense of $316.2 million in 2017compared to a net expense of $308.2 million in 2016. The $8.0 million variance in net expense in 2017was mainly due to:
• $ 18.2 million of lower capitalized interest mainly due to an adjustment in capitalized interestcomputation,
• $ 1.6 million of lower interest income; partially offset by,
• $ 8.9 million of lower miscellaneous expense, net; and,
• $ 2.9 million of lower interest expense.
2016-2015: Non-operating income and expense were a net expense of $308.2 million in 2016compared to a net expense of $225.2 million in 2015. The $83.0 million increase in net expense in 2016was mainly due to:
• $53.6 million of lower capitalized interest, as completed Buenavista projects have beentransferred to operations,
• $26.3 million of higher interest expense related to the $2 billion bond issue, in April 2015,
• $3.8 million of lower interest income; partially offset by,
• $0.7 million of higher miscellaneous income.
84
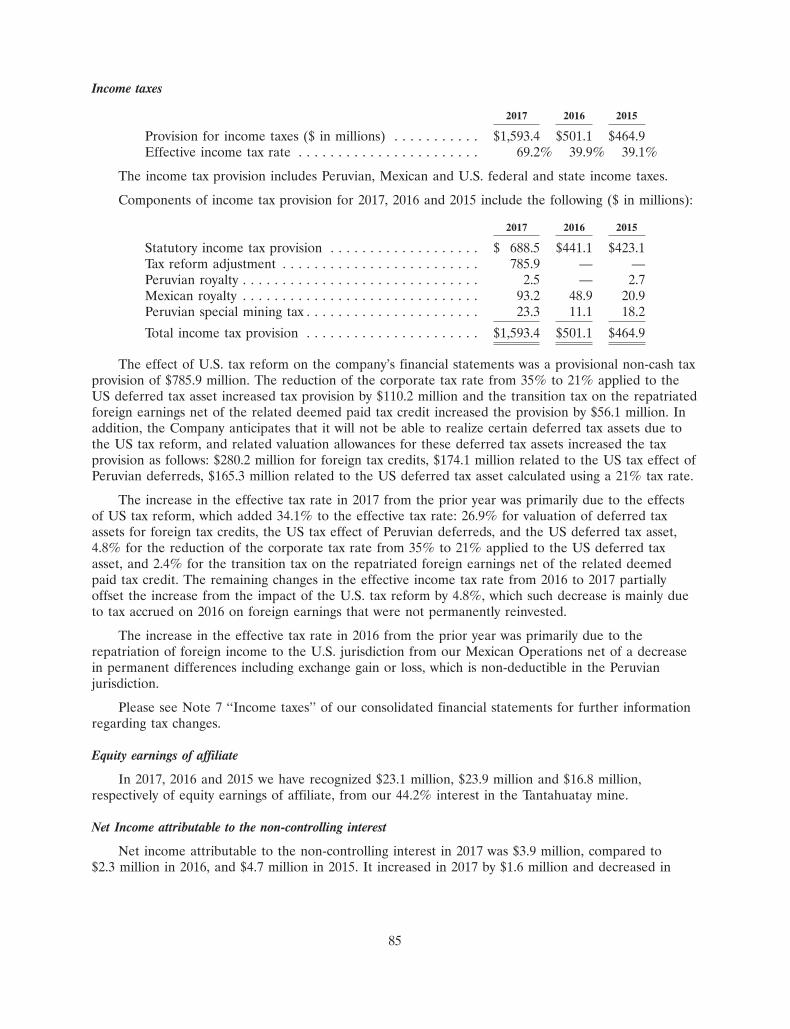
Income taxes
2017 2016 2015
Provision for income taxes ($ in millions) . . . . . . . . . . . $1,593.4 $501.1 $464.9Effective income tax rate . . . . . . . . . . . . . . . . . . . . . . . 69.2% 39.9% 39.1%
The income tax provision includes Peruvian, Mexican and U.S. federal and state income taxes.
Components of income tax provision for 2017, 2016 and 2015 include the following ($ in millions):
2017 2016 2015
Statutory income tax provision . . . . . . . . . . . . . . . . . . . $ 688.5 $441.1 $423.1Tax reform adjustment . . . . . . . . . . . . . . . . . . . . . . . . . 785.9 — —Peruvian royalty . . . . . . . . . . . . . . . . . . . . . . . . . . . . . . 2.5 — 2.7Mexican royalty . . . . . . . . . . . . . . . . . . . . . . . . . . . . . . 93.2 48.9 20.9Peruvian special mining tax . . . . . . . . . . . . . . . . . . . . . . 23.3 11.1 18.2
Total income tax provision . . . . . . . . . . . . . . . . . . . . . . $1,593.4 $501.1 $464.9
The effect of U.S. tax reform on the company’s financial statements was a provisional non-cash taxprovision of $785.9 million. The reduction of the corporate tax rate from 35% to 21% applied to theUS deferred tax asset increased tax provision by $110.2 million and the transition tax on the repatriatedforeign earnings net of the related deemed paid tax credit increased the provision by $56.1 million. Inaddition, the Company anticipates that it will not be able to realize certain deferred tax assets due tothe US tax reform, and related valuation allowances for these deferred tax assets increased the taxprovision as follows: $280.2 million for foreign tax credits, $174.1 million related to the US tax effect ofPeruvian deferreds, $165.3 million related to the US deferred tax asset calculated using a 21% tax rate.
The increase in the effective tax rate in 2017 from the prior year was primarily due to the effectsof US tax reform, which added 34.1% to the effective tax rate: 26.9% for valuation of deferred taxassets for foreign tax credits, the US tax effect of Peruvian deferreds, and the US deferred tax asset,4.8% for the reduction of the corporate tax rate from 35% to 21% applied to the US deferred taxasset, and 2.4% for the transition tax on the repatriated foreign earnings net of the related deemedpaid tax credit. The remaining changes in the effective income tax rate from 2016 to 2017 partiallyoffset the increase from the impact of the U.S. tax reform by 4.8%, which such decrease is mainly dueto tax accrued on 2016 on foreign earnings that were not permanently reinvested.
The increase in the effective tax rate in 2016 from the prior year was primarily due to therepatriation of foreign income to the U.S. jurisdiction from our Mexican Operations net of a decreasein permanent differences including exchange gain or loss, which is non-deductible in the Peruvianjurisdiction.
Please see Note 7 ‘‘Income taxes’’ of our consolidated financial statements for further informationregarding tax changes.
Equity earnings of affiliate
In 2017, 2016 and 2015 we have recognized $23.1 million, $23.9 million and $16.8 million,respectively of equity earnings of affiliate, from our 44.2% interest in the Tantahuatay mine.
Net Income attributable to the non-controlling interest
Net income attributable to the non-controlling interest in 2017 was $3.9 million, compared to$2.3 million in 2016, and $4.7 million in 2015. It increased in 2017 by $1.6 million and decreased in
85
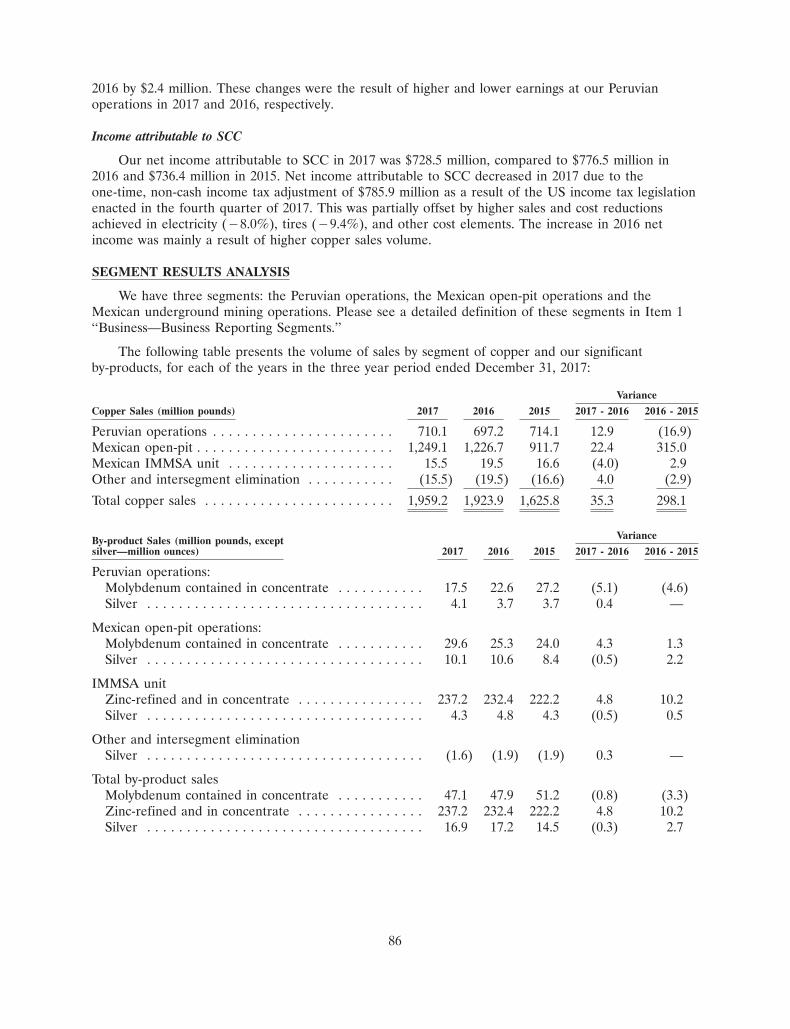
2016 by $2.4 million. These changes were the result of higher and lower earnings at our Peruvianoperations in 2017 and 2016, respectively.
Income attributable to SCC
Our net income attributable to SCC in 2017 was $728.5 million, compared to $776.5 million in2016 and $736.4 million in 2015. Net income attributable to SCC decreased in 2017 due to theone-time, non-cash income tax adjustment of $785.9 million as a result of the US income tax legislationenacted in the fourth quarter of 2017. This was partially offset by higher sales and cost reductionsachieved in electricity (�8.0%), tires (�9.4%), and other cost elements. The increase in 2016 netincome was mainly a result of higher copper sales volume.
SEGMENT RESULTS ANALYSIS
We have three segments: the Peruvian operations, the Mexican open-pit operations and theMexican underground mining operations. Please see a detailed definition of these segments in Item 1‘‘Business—Business Reporting Segments.’’
The following table presents the volume of sales by segment of copper and our significantby-products, for each of the years in the three year period ended December 31, 2017:
Variance
Copper Sales (million pounds) 2017 2016 2015 2017 - 2016 2016 - 2015
Peruvian operations . . . . . . . . . . . . . . . . . . . . . . . 710.1 697.2 714.1 12.9 (16.9)Mexican open-pit . . . . . . . . . . . . . . . . . . . . . . . . . 1,249.1 1,226.7 911.7 22.4 315.0Mexican IMMSA unit . . . . . . . . . . . . . . . . . . . . . 15.5 19.5 16.6 (4.0) 2.9Other and intersegment elimination . . . . . . . . . . . (15.5) (19.5) (16.6) 4.0 (2.9)
Total copper sales . . . . . . . . . . . . . . . . . . . . . . . . 1,959.2 1,923.9 1,625.8 35.3 298.1
VarianceBy-product Sales (million pounds, exceptsilver—million ounces) 2017 2016 2015 2017 - 2016 2016 - 2015
Peruvian operations:Molybdenum contained in concentrate . . . . . . . . . . . 17.5 22.6 27.2 (5.1) (4.6)Silver . . . . . . . . . . . . . . . . . . . . . . . . . . . . . . . . . . . 4.1 3.7 3.7 0.4 —
Mexican open-pit operations:Molybdenum contained in concentrate . . . . . . . . . . . 29.6 25.3 24.0 4.3 1.3Silver . . . . . . . . . . . . . . . . . . . . . . . . . . . . . . . . . . . 10.1 10.6 8.4 (0.5) 2.2
IMMSA unitZinc-refined and in concentrate . . . . . . . . . . . . . . . . 237.2 232.4 222.2 4.8 10.2Silver . . . . . . . . . . . . . . . . . . . . . . . . . . . . . . . . . . . 4.3 4.8 4.3 (0.5) 0.5
Other and intersegment eliminationSilver . . . . . . . . . . . . . . . . . . . . . . . . . . . . . . . . . . . (1.6) (1.9) (1.9) 0.3 —
Total by-product salesMolybdenum contained in concentrate . . . . . . . . . . . 47.1 47.9 51.2 (0.8) (3.3)Zinc-refined and in concentrate . . . . . . . . . . . . . . . . 237.2 232.4 222.2 4.8 10.2Silver . . . . . . . . . . . . . . . . . . . . . . . . . . . . . . . . . . . 16.9 17.2 14.5 (0.3) 2.7
86
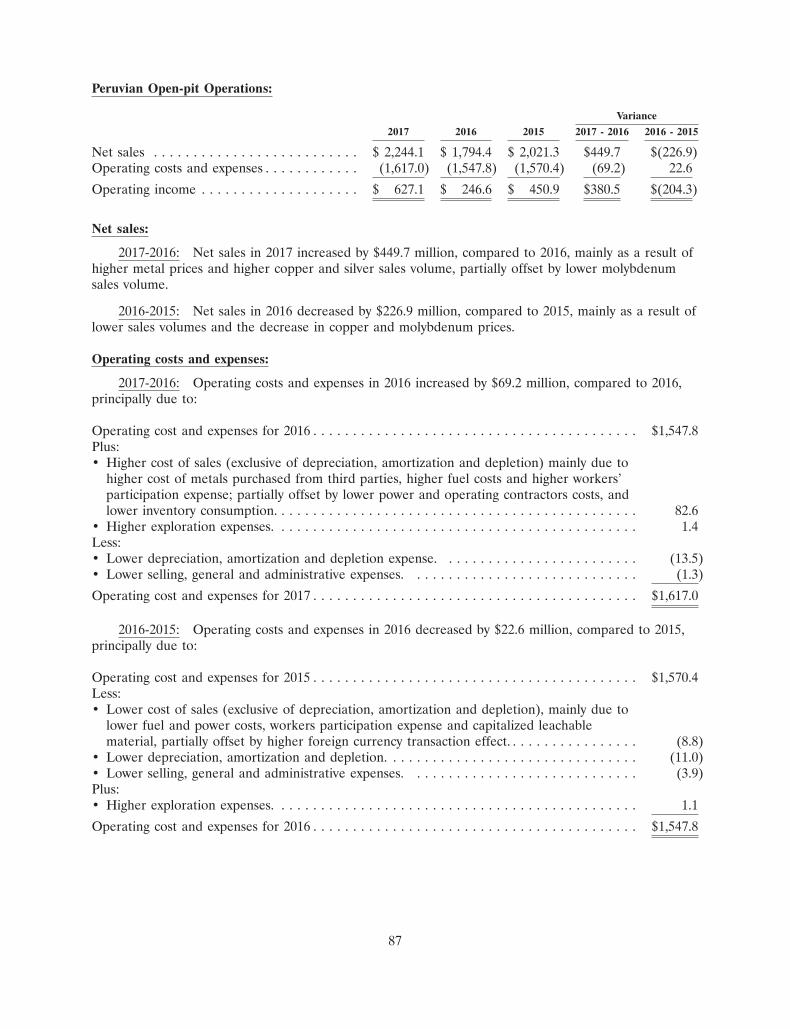
Peruvian Open-pit Operations:
Variance
2017 2016 2015 2017 - 2016 2016 - 2015
Net sales . . . . . . . . . . . . . . . . . . . . . . . . . . $ 2,244.1 $ 1,794.4 $ 2,021.3 $449.7 $(226.9)Operating costs and expenses . . . . . . . . . . . . (1,617.0) (1,547.8) (1,570.4) (69.2) 22.6
Operating income . . . . . . . . . . . . . . . . . . . . $ 627.1 $ 246.6 $ 450.9 $380.5 $(204.3)
Net sales:
2017-2016: Net sales in 2017 increased by $449.7 million, compared to 2016, mainly as a result ofhigher metal prices and higher copper and silver sales volume, partially offset by lower molybdenumsales volume.
2016-2015: Net sales in 2016 decreased by $226.9 million, compared to 2015, mainly as a result oflower sales volumes and the decrease in copper and molybdenum prices.
Operating costs and expenses:
2017-2016: Operating costs and expenses in 2016 increased by $69.2 million, compared to 2016,principally due to:
Operating cost and expenses for 2016 . . . . . . . . . . . . . . . . . . . . . . . . . . . . . . . . . . . . . . . . . $1,547.8Plus:• Higher cost of sales (exclusive of depreciation, amortization and depletion) mainly due to
higher cost of metals purchased from third parties, higher fuel costs and higher workers’participation expense; partially offset by lower power and operating contractors costs, andlower inventory consumption. . . . . . . . . . . . . . . . . . . . . . . . . . . . . . . . . . . . . . . . . . . . . . 82.6
• Higher exploration expenses. . . . . . . . . . . . . . . . . . . . . . . . . . . . . . . . . . . . . . . . . . . . . . 1.4Less:• Lower depreciation, amortization and depletion expense. . . . . . . . . . . . . . . . . . . . . . . . . (13.5)• Lower selling, general and administrative expenses. . . . . . . . . . . . . . . . . . . . . . . . . . . . . (1.3)
Operating cost and expenses for 2017 . . . . . . . . . . . . . . . . . . . . . . . . . . . . . . . . . . . . . . . . . $1,617.0
2016-2015: Operating costs and expenses in 2016 decreased by $22.6 million, compared to 2015,principally due to:
Operating cost and expenses for 2015 . . . . . . . . . . . . . . . . . . . . . . . . . . . . . . . . . . . . . . . . . $1,570.4Less:• Lower cost of sales (exclusive of depreciation, amortization and depletion), mainly due to
lower fuel and power costs, workers participation expense and capitalized leachablematerial, partially offset by higher foreign currency transaction effect. . . . . . . . . . . . . . . . . (8.8)
• Lower depreciation, amortization and depletion. . . . . . . . . . . . . . . . . . . . . . . . . . . . . . . . (11.0)• Lower selling, general and administrative expenses. . . . . . . . . . . . . . . . . . . . . . . . . . . . . (3.9)Plus:• Higher exploration expenses. . . . . . . . . . . . . . . . . . . . . . . . . . . . . . . . . . . . . . . . . . . . . . 1.1
Operating cost and expenses for 2016 . . . . . . . . . . . . . . . . . . . . . . . . . . . . . . . . . . . . . . . . . $1,547.8
87
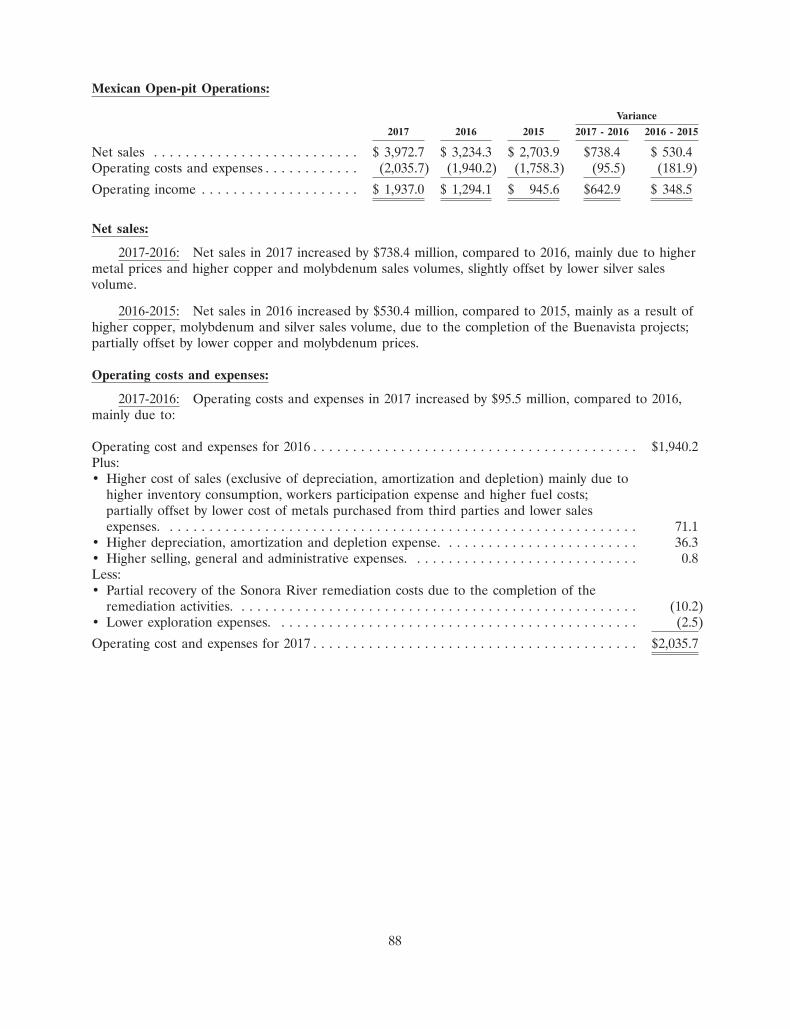
Mexican Open-pit Operations:
Variance
2017 2016 2015 2017 - 2016 2016 - 2015
Net sales . . . . . . . . . . . . . . . . . . . . . . . . . . $ 3,972.7 $ 3,234.3 $ 2,703.9 $738.4 $ 530.4Operating costs and expenses . . . . . . . . . . . . (2,035.7) (1,940.2) (1,758.3) (95.5) (181.9)
Operating income . . . . . . . . . . . . . . . . . . . . $ 1,937.0 $ 1,294.1 $ 945.6 $642.9 $ 348.5
Net sales:
2017-2016: Net sales in 2017 increased by $738.4 million, compared to 2016, mainly due to highermetal prices and higher copper and molybdenum sales volumes, slightly offset by lower silver salesvolume.
2016-2015: Net sales in 2016 increased by $530.4 million, compared to 2015, mainly as a result ofhigher copper, molybdenum and silver sales volume, due to the completion of the Buenavista projects;partially offset by lower copper and molybdenum prices.
Operating costs and expenses:
2017-2016: Operating costs and expenses in 2017 increased by $95.5 million, compared to 2016,mainly due to:
Operating cost and expenses for 2016 . . . . . . . . . . . . . . . . . . . . . . . . . . . . . . . . . . . . . . . . . $1,940.2Plus:• Higher cost of sales (exclusive of depreciation, amortization and depletion) mainly due to
higher inventory consumption, workers participation expense and higher fuel costs;partially offset by lower cost of metals purchased from third parties and lower salesexpenses. . . . . . . . . . . . . . . . . . . . . . . . . . . . . . . . . . . . . . . . . . . . . . . . . . . . . . . . . . . . 71.1
• Higher depreciation, amortization and depletion expense. . . . . . . . . . . . . . . . . . . . . . . . . 36.3• Higher selling, general and administrative expenses. . . . . . . . . . . . . . . . . . . . . . . . . . . . . 0.8Less:• Partial recovery of the Sonora River remediation costs due to the completion of the
remediation activities. . . . . . . . . . . . . . . . . . . . . . . . . . . . . . . . . . . . . . . . . . . . . . . . . . . (10.2)• Lower exploration expenses. . . . . . . . . . . . . . . . . . . . . . . . . . . . . . . . . . . . . . . . . . . . . . (2.5)
Operating cost and expenses for 2017 . . . . . . . . . . . . . . . . . . . . . . . . . . . . . . . . . . . . . . . . . $2,035.7
88
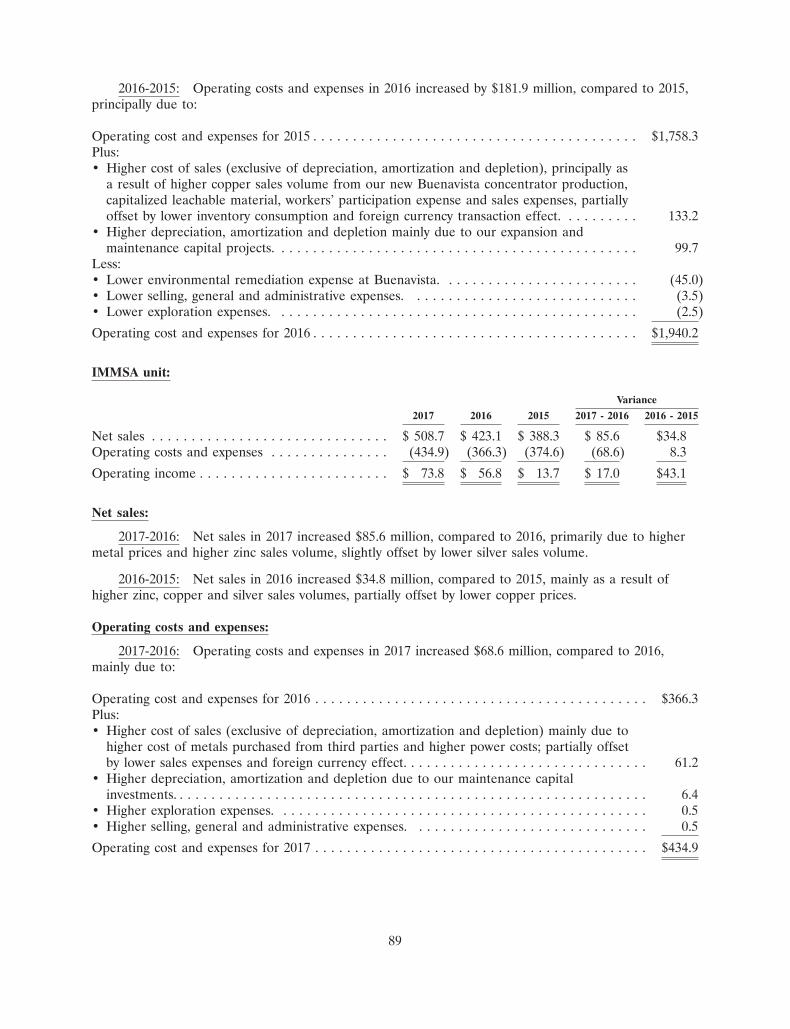
2016-2015: Operating costs and expenses in 2016 increased by $181.9 million, compared to 2015,principally due to:
Operating cost and expenses for 2015 . . . . . . . . . . . . . . . . . . . . . . . . . . . . . . . . . . . . . . . . . $1,758.3Plus:• Higher cost of sales (exclusive of depreciation, amortization and depletion), principally as
a result of higher copper sales volume from our new Buenavista concentrator production,capitalized leachable material, workers’ participation expense and sales expenses, partiallyoffset by lower inventory consumption and foreign currency transaction effect. . . . . . . . . . 133.2
• Higher depreciation, amortization and depletion mainly due to our expansion andmaintenance capital projects. . . . . . . . . . . . . . . . . . . . . . . . . . . . . . . . . . . . . . . . . . . . . . 99.7
Less:• Lower environmental remediation expense at Buenavista. . . . . . . . . . . . . . . . . . . . . . . . . (45.0)• Lower selling, general and administrative expenses. . . . . . . . . . . . . . . . . . . . . . . . . . . . . (3.5)• Lower exploration expenses. . . . . . . . . . . . . . . . . . . . . . . . . . . . . . . . . . . . . . . . . . . . . . (2.5)
Operating cost and expenses for 2016 . . . . . . . . . . . . . . . . . . . . . . . . . . . . . . . . . . . . . . . . . $1,940.2
IMMSA unit:
Variance
2017 2016 2015 2017 - 2016 2016 - 2015
Net sales . . . . . . . . . . . . . . . . . . . . . . . . . . . . . . $ 508.7 $ 423.1 $ 388.3 $ 85.6 $34.8Operating costs and expenses . . . . . . . . . . . . . . . (434.9) (366.3) (374.6) (68.6) 8.3
Operating income . . . . . . . . . . . . . . . . . . . . . . . . $ 73.8 $ 56.8 $ 13.7 $ 17.0 $43.1
Net sales:
2017-2016: Net sales in 2017 increased $85.6 million, compared to 2016, primarily due to highermetal prices and higher zinc sales volume, slightly offset by lower silver sales volume.
2016-2015: Net sales in 2016 increased $34.8 million, compared to 2015, mainly as a result ofhigher zinc, copper and silver sales volumes, partially offset by lower copper prices.
Operating costs and expenses:
2017-2016: Operating costs and expenses in 2017 increased $68.6 million, compared to 2016,mainly due to:
Operating cost and expenses for 2016 . . . . . . . . . . . . . . . . . . . . . . . . . . . . . . . . . . . . . . . . . . $366.3Plus:• Higher cost of sales (exclusive of depreciation, amortization and depletion) mainly due to
higher cost of metals purchased from third parties and higher power costs; partially offsetby lower sales expenses and foreign currency effect. . . . . . . . . . . . . . . . . . . . . . . . . . . . . . . 61.2
• Higher depreciation, amortization and depletion due to our maintenance capitalinvestments. . . . . . . . . . . . . . . . . . . . . . . . . . . . . . . . . . . . . . . . . . . . . . . . . . . . . . . . . . . . 6.4
• Higher exploration expenses. . . . . . . . . . . . . . . . . . . . . . . . . . . . . . . . . . . . . . . . . . . . . . . 0.5• Higher selling, general and administrative expenses. . . . . . . . . . . . . . . . . . . . . . . . . . . . . . 0.5
Operating cost and expenses for 2017 . . . . . . . . . . . . . . . . . . . . . . . . . . . . . . . . . . . . . . . . . . $434.9
89
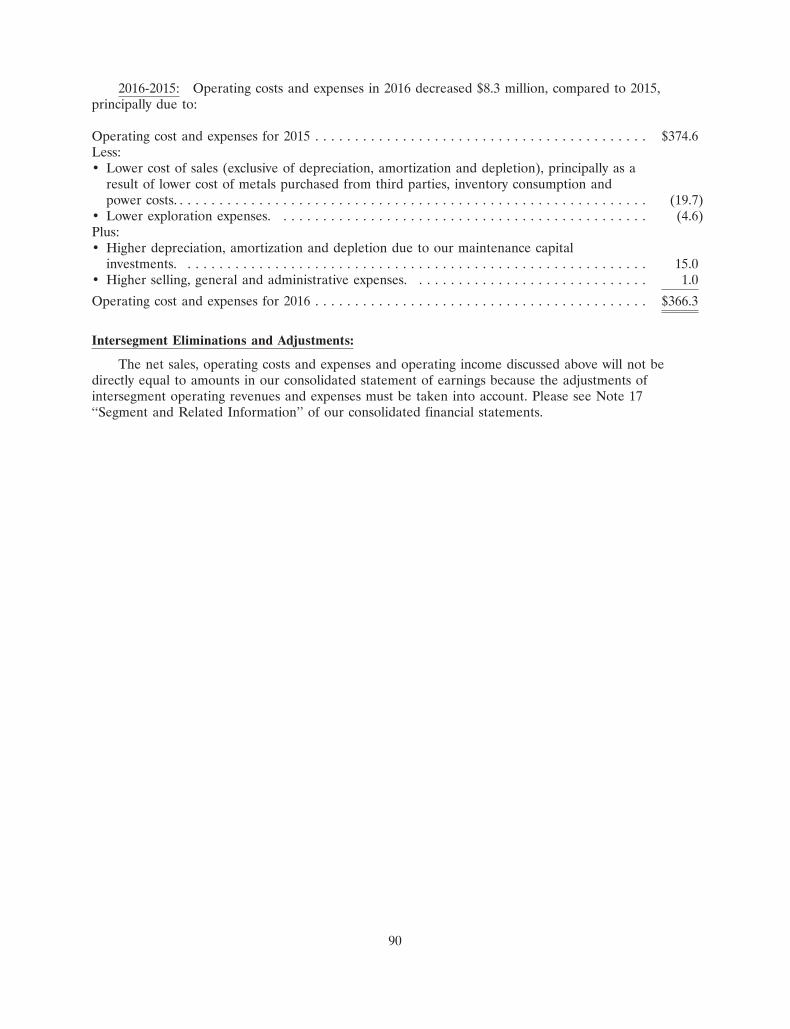
2016-2015: Operating costs and expenses in 2016 decreased $8.3 million, compared to 2015,principally due to:
Operating cost and expenses for 2015 . . . . . . . . . . . . . . . . . . . . . . . . . . . . . . . . . . . . . . . . . . $374.6Less:• Lower cost of sales (exclusive of depreciation, amortization and depletion), principally as a
result of lower cost of metals purchased from third parties, inventory consumption andpower costs. . . . . . . . . . . . . . . . . . . . . . . . . . . . . . . . . . . . . . . . . . . . . . . . . . . . . . . . . . . . (19.7)
• Lower exploration expenses. . . . . . . . . . . . . . . . . . . . . . . . . . . . . . . . . . . . . . . . . . . . . . . (4.6)Plus:• Higher depreciation, amortization and depletion due to our maintenance capital
investments. . . . . . . . . . . . . . . . . . . . . . . . . . . . . . . . . . . . . . . . . . . . . . . . . . . . . . . . . . . 15.0• Higher selling, general and administrative expenses. . . . . . . . . . . . . . . . . . . . . . . . . . . . . . 1.0
Operating cost and expenses for 2016 . . . . . . . . . . . . . . . . . . . . . . . . . . . . . . . . . . . . . . . . . . $366.3
Intersegment Eliminations and Adjustments:
The net sales, operating costs and expenses and operating income discussed above will not bedirectly equal to amounts in our consolidated statement of earnings because the adjustments ofintersegment operating revenues and expenses must be taken into account. Please see Note 17‘‘Segment and Related Information’’ of our consolidated financial statements.
90
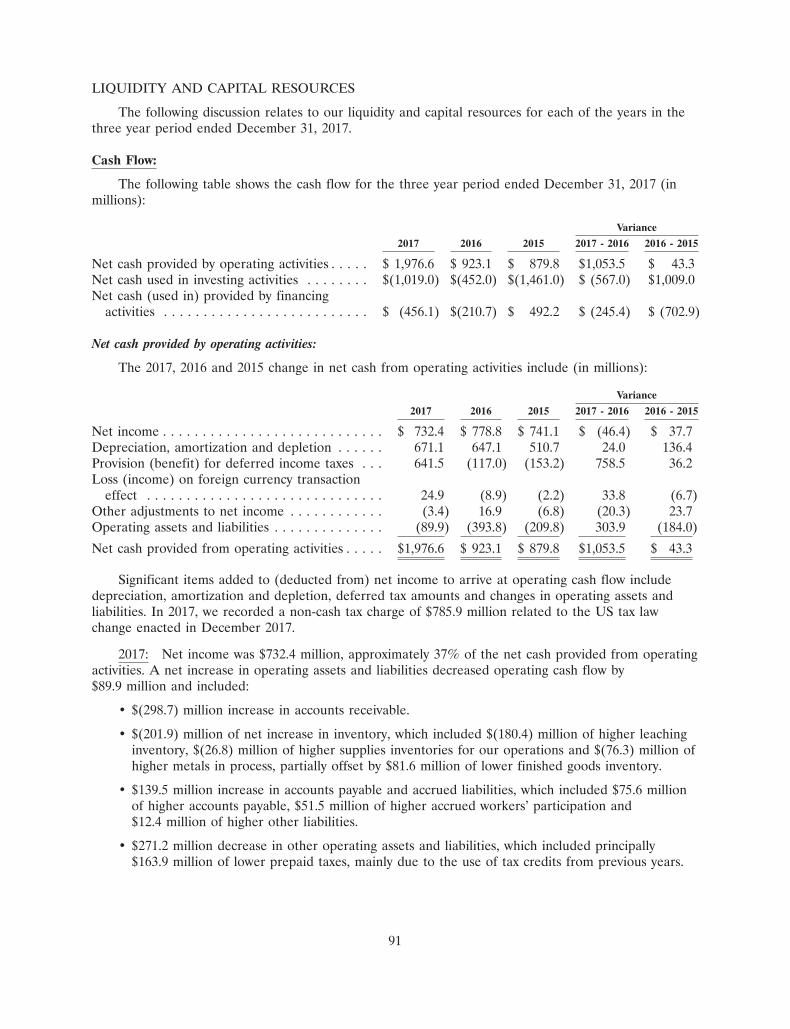
LIQUIDITY AND CAPITAL RESOURCES
The following discussion relates to our liquidity and capital resources for each of the years in thethree year period ended December 31, 2017.
Cash Flow:
The following table shows the cash flow for the three year period ended December 31, 2017 (inmillions):
Variance
2017 2016 2015 2017 - 2016 2016 - 2015
Net cash provided by operating activities . . . . . $ 1,976.6 $ 923.1 $ 879.8 $1,053.5 $ 43.3Net cash used in investing activities . . . . . . . . $(1,019.0) $(452.0) $(1,461.0) $ (567.0) $1,009.0Net cash (used in) provided by financing
activities . . . . . . . . . . . . . . . . . . . . . . . . . . $ (456.1) $(210.7) $ 492.2 $ (245.4) $ (702.9)
Net cash provided by operating activities:
The 2017, 2016 and 2015 change in net cash from operating activities include (in millions):
Variance
2017 2016 2015 2017 - 2016 2016 - 2015
Net income . . . . . . . . . . . . . . . . . . . . . . . . . . . . $ 732.4 $ 778.8 $ 741.1 $ (46.4) $ 37.7Depreciation, amortization and depletion . . . . . . 671.1 647.1 510.7 24.0 136.4Provision (benefit) for deferred income taxes . . . 641.5 (117.0) (153.2) 758.5 36.2Loss (income) on foreign currency transaction
effect . . . . . . . . . . . . . . . . . . . . . . . . . . . . . . 24.9 (8.9) (2.2) 33.8 (6.7)Other adjustments to net income . . . . . . . . . . . . (3.4) 16.9 (6.8) (20.3) 23.7Operating assets and liabilities . . . . . . . . . . . . . . (89.9) (393.8) (209.8) 303.9 (184.0)
Net cash provided from operating activities . . . . . $1,976.6 $ 923.1 $ 879.8 $1,053.5 $ 43.3
Significant items added to (deducted from) net income to arrive at operating cash flow includedepreciation, amortization and depletion, deferred tax amounts and changes in operating assets andliabilities. In 2017, we recorded a non-cash tax charge of $785.9 million related to the US tax lawchange enacted in December 2017.
2017: Net income was $732.4 million, approximately 37% of the net cash provided from operatingactivities. A net increase in operating assets and liabilities decreased operating cash flow by$89.9 million and included:
• $(298.7) million increase in accounts receivable.
• $(201.9) million of net increase in inventory, which included $(180.4) million of higher leachinginventory, $(26.8) million of higher supplies inventories for our operations and $(76.3) million ofhigher metals in process, partially offset by $81.6 million of lower finished goods inventory.
• $139.5 million increase in accounts payable and accrued liabilities, which included $75.6 millionof higher accounts payable, $51.5 million of higher accrued workers’ participation and$12.4 million of higher other liabilities.
• $271.2 million decrease in other operating assets and liabilities, which included principally$163.9 million of lower prepaid taxes, mainly due to the use of tax credits from previous years.
91
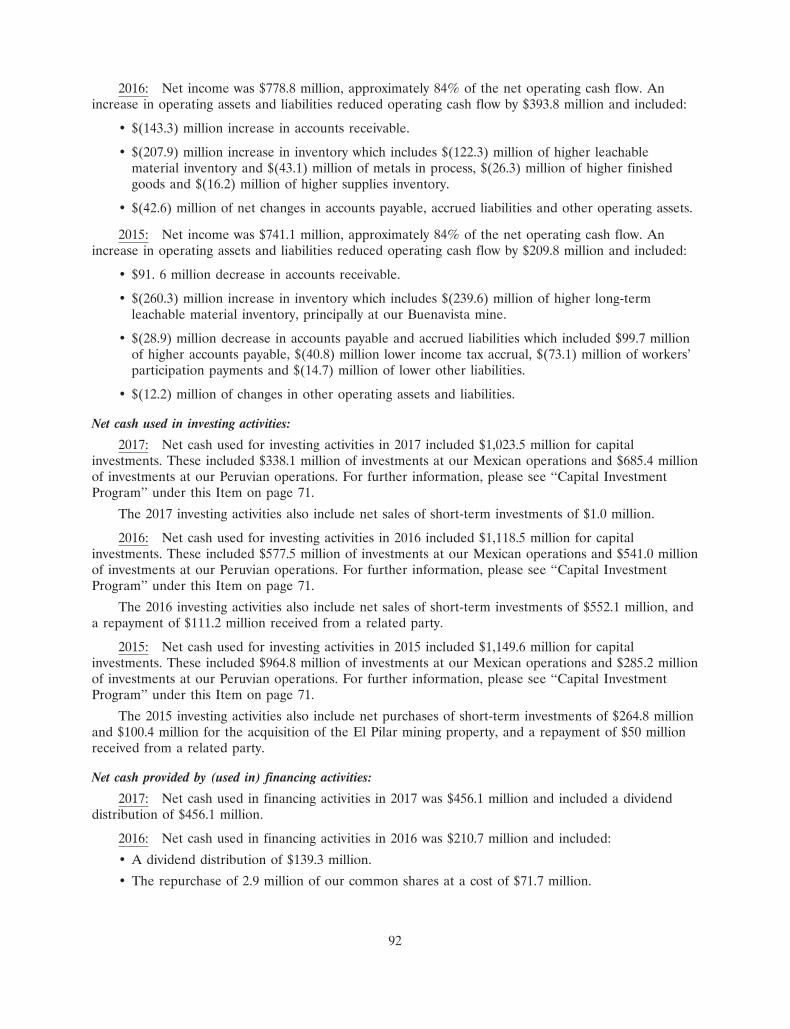
2016: Net income was $778.8 million, approximately 84% of the net operating cash flow. Anincrease in operating assets and liabilities reduced operating cash flow by $393.8 million and included:
• $(143.3) million increase in accounts receivable.
• $(207.9) million increase in inventory which includes $(122.3) million of higher leachablematerial inventory and $(43.1) million of metals in process, $(26.3) million of higher finishedgoods and $(16.2) million of higher supplies inventory.
• $(42.6) million of net changes in accounts payable, accrued liabilities and other operating assets.
2015: Net income was $741.1 million, approximately 84% of the net operating cash flow. Anincrease in operating assets and liabilities reduced operating cash flow by $209.8 million and included:
• $91. 6 million decrease in accounts receivable.
• $(260.3) million increase in inventory which includes $(239.6) million of higher long-termleachable material inventory, principally at our Buenavista mine.
• $(28.9) million decrease in accounts payable and accrued liabilities which included $99.7 millionof higher accounts payable, $(40.8) million lower income tax accrual, $(73.1) million of workers’participation payments and $(14.7) million of lower other liabilities.
• $(12.2) million of changes in other operating assets and liabilities.
Net cash used in investing activities:
2017: Net cash used for investing activities in 2017 included $1,023.5 million for capitalinvestments. These included $338.1 million of investments at our Mexican operations and $685.4 millionof investments at our Peruvian operations. For further information, please see ‘‘Capital InvestmentProgram’’ under this Item on page 71.
The 2017 investing activities also include net sales of short-term investments of $1.0 million.
2016: Net cash used for investing activities in 2016 included $1,118.5 million for capitalinvestments. These included $577.5 million of investments at our Mexican operations and $541.0 millionof investments at our Peruvian operations. For further information, please see ‘‘Capital InvestmentProgram’’ under this Item on page 71.
The 2016 investing activities also include net sales of short-term investments of $552.1 million, anda repayment of $111.2 million received from a related party.
2015: Net cash used for investing activities in 2015 included $1,149.6 million for capitalinvestments. These included $964.8 million of investments at our Mexican operations and $285.2 millionof investments at our Peruvian operations. For further information, please see ‘‘Capital InvestmentProgram’’ under this Item on page 71.
The 2015 investing activities also include net purchases of short-term investments of $264.8 millionand $100.4 million for the acquisition of the El Pilar mining property, and a repayment of $50 millionreceived from a related party.
Net cash provided by (used in) financing activities:
2017: Net cash used in financing activities in 2017 was $456.1 million and included a dividenddistribution of $456.1 million.
2016: Net cash used in financing activities in 2016 was $210.7 million and included:
• A dividend distribution of $139.3 million.
• The repurchase of 2.9 million of our common shares at a cost of $71.7 million.
92
2015: Net cash provided by financing activities in 2015 was $492.2 million and included:
• Gross proceeds of $2,045.8 million from the issuance of unsecured notes, net of an underwritingdiscount and $66 million of short-term borrowing in Peru.
• Repayment of a short-term Peruvian loan of $66 million, and the repayment of $200 million often year senior unsecured notes.
• A dividend distribution of $271.2 million.
• The repurchase of 36.7 million of our common shares at a cost of $1,004.4 million.
• Payment of debt issuance cost of $11.8 million.
• A distribution of $0.5 million to the non-controlling interest.
Other Liquidity Considerations
We expect that we will meet our cash requirements for 2018 and beyond from cash on hand andinternally generated funds. In addition, we believe that we will be able to access additional externalfinancing on reasonable terms, if required.
As of December 31, 2017, $517.7 million of the Company´s total cash, cash equivalents, restrictedcash and short-term investments of $1,055.3 million was held by foreign subsidiaries. The cash, cashequivalents and short-term investments maintained in our foreign operations are generally used tocover local operating and investment expenses. At December 31, 2016, Minera Mexico determined thatit had $470.5 million in earnings available for dividends to the United States. These earnings had notbeen remitted, but U.S. federal income tax, net of foreign tax credit was recognized in 2016 resulting inan increase tax of $45.7 million. At December 31, 2017, Minera Mexico had determined that it hadearnings available for dividends to the United States of $555.5 million. The 2017 U.S. tax reformintroduced a one-time transition tax that is based upon the Company’s total accumulated post-1986prescribed foreign earnings and profits (‘‘E&P’’) estimated to be $8.9 billion, the majority of which waspreviously considered to be indefinitely reinvested and accordingly, no U.S. federal and state incometaxes were provided. Upon enactment of the 2017 U.S. tax reform, the Company calculated andrecorded a provisional tax amount of $181.1 million as a reasonable estimate for its one-time transitiontax liability, which was completely offset by foreign tax credit carryforwards. Because of thecomplexities of tax reform and the transition tax calculation, the Company is still finalizing itscalculation of the total accumulated post-1986 prescribed E&P for the applicable entities. Further, thetransition tax is based in part on the amount of those earnings held in liquid and non-liquid E&P. Untilthe calculation of E&P is completed and the transition tax is finalized during 2018 it is not practicableto estimate any amount of unrecognized deferred tax liability, if any, to any additional outside basisdifferences in the Company’s foreign subsidiaries. Earnings from the Company’s Peruvian branch to theUnited States are not subject to transition taxes since they are taxed on a current basis, regardless ofremittances.
Share repurchase program: In 2008, our BOD authorized a $500 million share repurchaseprogram that has since been increased by the BOD and is currently authorized to $3 billion. Since theinception of the program through December 31, 2017, we have purchased 119.5 million shares of ourcommon stock at a cost of $2.9 billion. These shares are available for general corporate purposes. Wemay purchase additional shares of our common stock from time to time based on market conditionsand other factors. This repurchase program has no expiration date and may be modified ordiscontinued at any time. For further details please see Item 5 ‘‘Market for Registrant’s CommonEquity, Related Stockholder Matters and Issuer Purchases of Equity Securities—SCC common stockrepurchase plan.’’
Dividend: On January 25, 2018, the Board of Directors (‘‘BOD’’) authorized a dividend of $0.30per share paid on February 27, 2018, to shareholders of record at the close of business on February 13,2018.
93
FINANCING
Our total debt at December 31, 2017 was $5,957.1 million, compared to $5,954.2 million atDecember 31, 2016, net of the unamortized discount and issuance costs of notes issued under par of$94.1 million and $97.0 million at December 31, 2017 and 2016, respectively. This debt is alldenominated in dollars at fixed interest rates, weighed at 5.89%.
The ratio of total debt to total capitalization was 49.2% at December 31, 2017, compared to 50.4%at December 31, 2016. Also the ratio of net debt to net capitalization was 44.4% at December 31, 2017,compared to 47.7% at December 31, 2016.
We define net debt as total debt, including current maturities, minus cash, cash equivalents andshort-term investments balance. We believe that net debt is useful to investors as a measure of ourfinancial position. We define net capitalization as the sum of net debt and equity. We use the net debtto net capitalization ratio as measure of our indebtedness position and to determine how much debt wecan take in addition to the use of the equity and the balance sheet in general. We define totalcapitalization as the sum of the carrying values of our total debt, including current maturities, andequity. A reconciliation of our net debt to net capitalization and total debt to total capitalization asincluded in the consolidated balance sheet is presented under the sub heading ‘‘Non-GAAPInformation Reconciliation’’ below.
Please see Note 10 ‘‘Financing’’ for a discussion about the covenants requirements related to ourlong-term debt.
Capital investment programs
A discussion of our capital investment programs is an important part of understanding our liquidityand capital resources. We expect to meet the cash requirements for these capital investments from cashon hand, internally generated funds and from additional external financing if required. For informationregarding our capital expenditure programs, please see the discussion under the caption ‘‘CapitalInvestment Program’’ under this Item 7.
CONTRACTUAL OBLIGATIONS
The following table summarizes our significant contractual obligations as of December 31, 2017:
Payments due by Period
2023 andTotal 2018 2019 2020 2021 2022 Thereafter
(dollars in millions)
Long-term debt . . . . . . . . . . . . . . $ 6,051.1 $ — $ — $ 400.0 $ — $ 300.0 $ 5,351.1Interest on debt . . . . . . . . . . . . . . 7,257.3 356.5 356.5 341.3 334.9 333.4 5,534.7Uncertain tax position(a) . . . . . . . 214.5 — — — — — —Workers’ participation . . . . . . . . . 176.9 176.9 — — — — —Pension and post-retirement
obligations . . . . . . . . . . . . . . . . 31.4 3.2 2.6 2.7 2.8 2.9 17.2Asset retirement obligation . . . . . 234.1 — — — — — 234.1Purchase obligations:Commitment to purchase energy . 3,016.0 356.1 356.1 358.4 358.4 365.5 1,221.5Capital investment projects . . . . . 1,409.3 508.8 428.5 330.0 142.0 — —
Total . . . . . . . . . . . . . . . . . . . . . . $18,390.6 $1,401.5 $1,143.7 $1,432.4 $838.1 $1,001.8 $12,358.6
(a) The above table does not include any scheduled payments related to uncertain tax positionliabilities because there is often a high degree of uncertainty regarding the timing of future cash
94
outflows. As of December 31, 2017, the tax liability recognized by the Company is $214.5 millionand is included as non-current liability in the consolidated Balance Sheet.
Long-term debt payments do not include the debt discount valuation account and issuance costs of$94.1 million.
Interest on debt is calculated at rates in effect at December 31, 2017. As all our debt is at fixedrates, future expenditures will not change due to rate changes. Please refer to Note 10 ‘‘Financing’’ ofour consolidated financial statements for a description of our long-term debt arrangements and creditfacilities.
Workers’ participation is currently calculated based on Peruvian Branch and Mexican pre-taxearnings. In Peru, the provision for workers’ participation is calculated at 8% of pre-tax earnings. Thecurrent portion of this participation, which is accrued during the year, is based on the PeruvianBranch’s taxable income and is largely distributed to workers following determination of final resultsfor the year. Amounts in excess of 18 times a worker’s salary is distributed to governmental bodies. InMexico, workers’ participation is determined using the guidelines established in the Mexican income taxlaw at a rate of 10% of pre-tax earnings as adjusted by the tax law.
Pension and post retirement obligations include the benefits expected to be paid under ourpension and post-retirement benefit plans. Please refer to Note 11 ‘‘Benefit Plans’’ of our consolidatedfinancial statements.
Asset retirement obligations include the aggregate amount of the closure and remediation costs ofour Peruvian mines and facilities to be paid under the mine closure plans approved by MINEM andthe closure and remediation costs of our Mexican operations. See Note 9 ‘‘Asset RetirementObligation.’’
In June 2014, we entered into a power purchase agreement for 120 megawatt (‘‘MW’’) with thestate company Electroperu S.A., which began supplying energy for our Peruvian operations for twentyyears starting on April 17, 2017. In July 2014, we entered into a power purchase agreement for 120MWwith a private power generator Kallpa Generacion S.A. (‘‘Kallpa’’), which began supplying energy forour Peruvian operations for ten years starting on April 17, 2017. In May 2016, we signed an additionalpower purchase agreement for a maximum of 80MW with Kallpa, under which Kallpa will supplyenergy for the operations related to the Toquepala Expansion and other minor projects for ten yearsstarting on May 1, 2017 and ending after ten years of commercial operation of the ToquepalaExpansion or on April 30, 2029; whichever occurs first.
Also we have a commitment to purchase power for our Mexican operations from MGE, asubsidiary of Grupo Mexico through 2032. See Note 12 ‘‘Commitment and Contingencies—Othercommitments’’.
Amounts indicated on the above table are based on our long-term estimated power costs, whichare subject to change as energy generation costs change and our forecasted power requirementsthrough the life of the agreements change.
Capital investment projects include committed purchase orders and executed contracts for ourMexican projects, and for our Peruvian expansion projects at Tia Maria and the Toquepala mine.
95
NON-GAAP INFORMATION RECONCILIATION
Operating cash cost: Following is a reconciliation of ‘‘Operating Cash Cost’’ (see page 69) to costof sales (exclusive of depreciation, amortization and depletion) as reported in our consolidatedstatement of earnings, in millions of dollars and dollars per pound in the table below:
2017 2016 2015
$ per $ per $ per$ millions pound $ millions pound $ millions pound
Cost of sales (exclusive of depreciation,amortization and depletion) . . . . . . . . . . . . . . . $ 3,252.8 $ 1.74 $3,034.1 $ 1.58 $2,927.6 $ 1.83
Add:Selling, general and administrative . . . . . . . . . . . 93.1 0.05 94.3 0.05 99.4 0.06Sales premiums, net of treatment and refining
charges . . . . . . . . . . . . . . . . . . . . . . . . . . . . . 22.4 0.01 24.4 0.01 (34.5) (0.02)Less:Workers’ participation . . . . . . . . . . . . . . . . . . . . (196.4) (0.11) (130.2) (0.07) (116.1) (0.07)Cost of metals purchased from third parties . . . . . (363.2) (0.19) (329.9) (0.17) (351.8) (0.22)Royalty charge and other, net . . . . . . . . . . . . . . . (150.3) (0.08) (74.9) (0.04) (72.9) (0.05)Inventory change . . . . . . . . . . . . . . . . . . . . . . . . 139.1 0.07 162.0 0.08 192.2 0.12
Operating Cash Cost before by-product revenues . $ 2,797.5 $ 1.49 $2,779.8 $ 1.44 $2,643.9 $ 1.65
Add:By-product revenues(1) . . . . . . . . . . . . . . . . . . . (1,030.2) (0.55) (904.9) (0.47) (806.1) (0.50)Net revenue on sale of metal purchased from
third parties . . . . . . . . . . . . . . . . . . . . . . . . . . (50.2) (0.02) (50.7) (0.03) (60.7) (0.04)
Add:Total by-product revenues . . . . . . . . . . . . . . . . . . (1,080.4) (0.57) (955.6) (0.50) (866.8) (0.54)
Operating Cash Cost net of by-product revenues . 1,717.1 0.92 1,824.2 0.95 1,777.1 $ 1.11
Total pounds of copper produced (in millions) . . . 1,874.5 1,924.7 1,599.3
(1) By-product revenues included in our presentation of operating cash cost contain the following:
2017 2016 2015
$ per $ per $ per$ millions pound $ millions pound $ millions pound
Molybdenum . . . . . . . . . . . . . . . . . . . . . . . . $ (353.4) $(0.19) $(268.1) $(0.14) $(239.0) $(0.15)Silver . . . . . . . . . . . . . . . . . . . . . . . . . . . . . (254.9) (0.14) (246.3) (0.13) (193.0) (0.12)Zinc . . . . . . . . . . . . . . . . . . . . . . . . . . . . . . (221.6) (0.12) (189.3) (0.10) (148.9) (0.09)Sulfuric Acid . . . . . . . . . . . . . . . . . . . . . . . . (71.9) (0.04) (87.6) (0.04) (127.6) (0.08)Gold . . . . . . . . . . . . . . . . . . . . . . . . . . . . . . (61.7) (0.03) (50.6) (0.02) (35.1) (0.02)Other . . . . . . . . . . . . . . . . . . . . . . . . . . . . . (66.7) (0.03) (63.0) (0.04) (62.5) (0.04)
Total . . . . . . . . . . . . . . . . . . . . . . . . . . . . . . $(1,030.2) $(0.55) $(904.9) $(0.47) $(806.1) $(0.50)
The by-product revenue presented does not match with the sales value reported by segment onpage 136 because the above table excludes purchases from third parties, which are reclassified to netrevenue on sale of metal purchased from third parties.
96
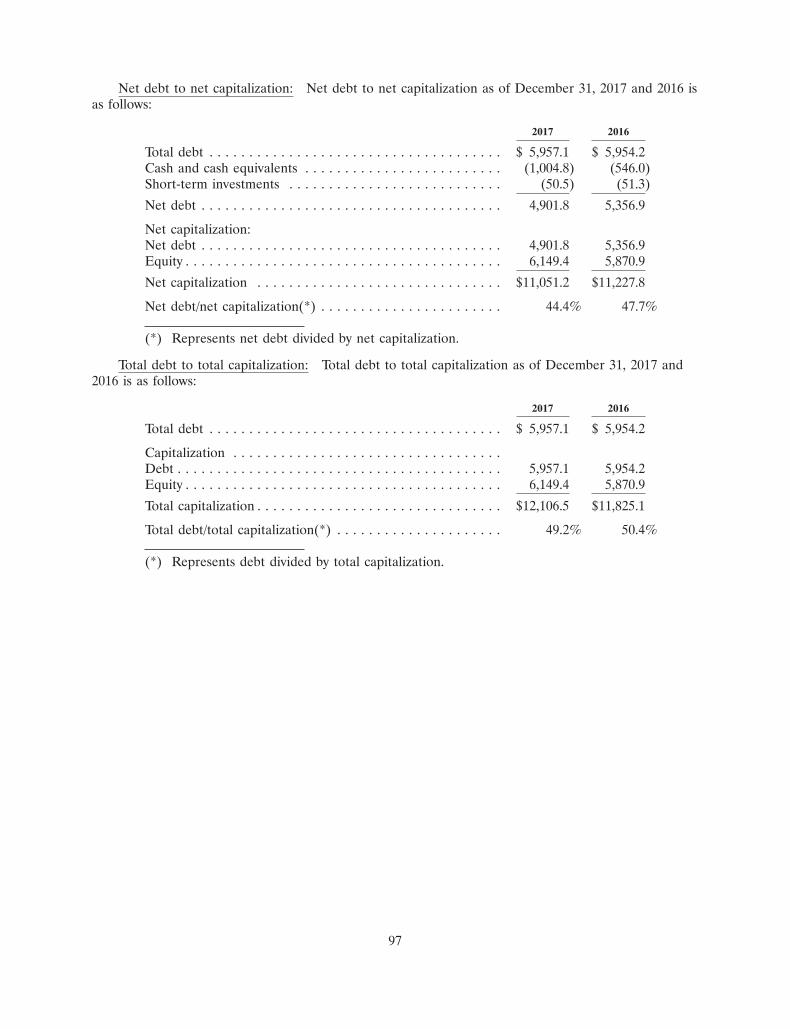
Net debt to net capitalization: Net debt to net capitalization as of December 31, 2017 and 2016 isas follows:
2017 2016
Total debt . . . . . . . . . . . . . . . . . . . . . . . . . . . . . . . . . . . . . $ 5,957.1 $ 5,954.2Cash and cash equivalents . . . . . . . . . . . . . . . . . . . . . . . . . (1,004.8) (546.0)Short-term investments . . . . . . . . . . . . . . . . . . . . . . . . . . . (50.5) (51.3)
Net debt . . . . . . . . . . . . . . . . . . . . . . . . . . . . . . . . . . . . . . 4,901.8 5,356.9
Net capitalization:Net debt . . . . . . . . . . . . . . . . . . . . . . . . . . . . . . . . . . . . . . 4,901.8 5,356.9Equity . . . . . . . . . . . . . . . . . . . . . . . . . . . . . . . . . . . . . . . . 6,149.4 5,870.9
Net capitalization . . . . . . . . . . . . . . . . . . . . . . . . . . . . . . . $11,051.2 $11,227.8
Net debt/net capitalization(*) . . . . . . . . . . . . . . . . . . . . . . . 44.4% 47.7%
(*) Represents net debt divided by net capitalization.
Total debt to total capitalization: Total debt to total capitalization as of December 31, 2017 and2016 is as follows:
2017 2016
Total debt . . . . . . . . . . . . . . . . . . . . . . . . . . . . . . . . . . . . . $ 5,957.1 $ 5,954.2
Capitalization . . . . . . . . . . . . . . . . . . . . . . . . . . . . . . . . . .Debt . . . . . . . . . . . . . . . . . . . . . . . . . . . . . . . . . . . . . . . . . 5,957.1 5,954.2Equity . . . . . . . . . . . . . . . . . . . . . . . . . . . . . . . . . . . . . . . . 6,149.4 5,870.9
Total capitalization . . . . . . . . . . . . . . . . . . . . . . . . . . . . . . . $12,106.5 $11,825.1
Total debt/total capitalization(*) . . . . . . . . . . . . . . . . . . . . . 49.2% 50.4%
(*) Represents debt divided by total capitalization.
97
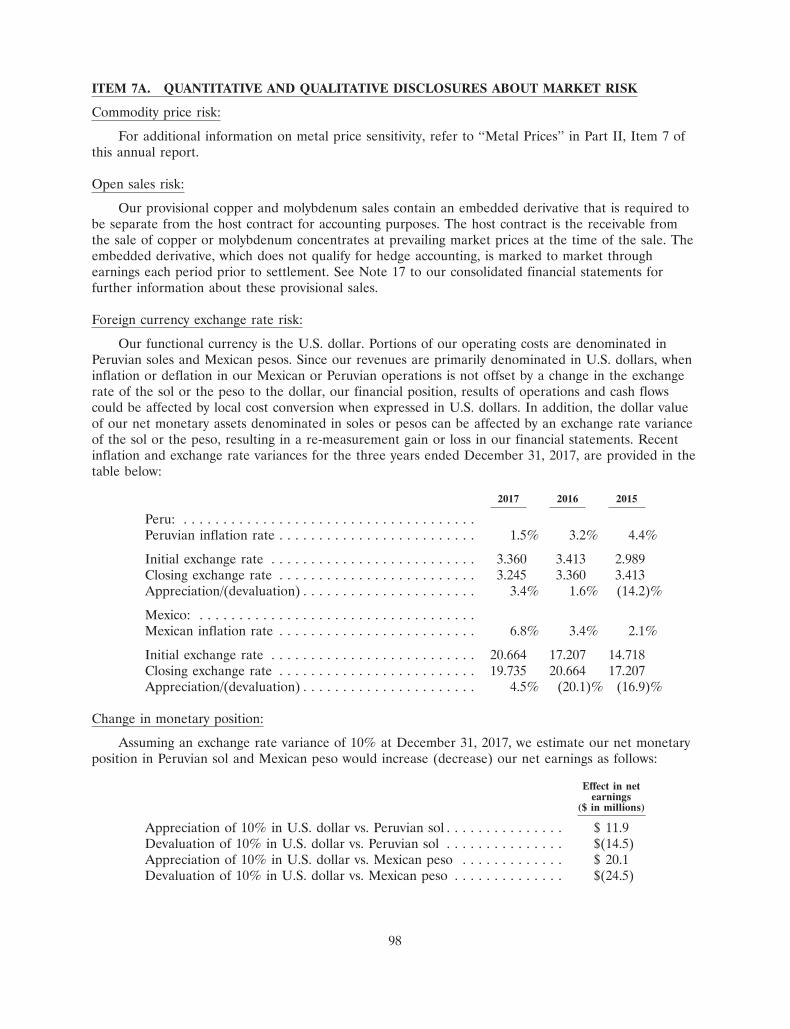
ITEM 7A. QUANTITATIVE AND QUALITATIVE DISCLOSURES ABOUT MARKET RISK
Commodity price risk:
For additional information on metal price sensitivity, refer to ‘‘Metal Prices’’ in Part II, Item 7 ofthis annual report.
Open sales risk:
Our provisional copper and molybdenum sales contain an embedded derivative that is required tobe separate from the host contract for accounting purposes. The host contract is the receivable fromthe sale of copper or molybdenum concentrates at prevailing market prices at the time of the sale. Theembedded derivative, which does not qualify for hedge accounting, is marked to market throughearnings each period prior to settlement. See Note 17 to our consolidated financial statements forfurther information about these provisional sales.
Foreign currency exchange rate risk:
Our functional currency is the U.S. dollar. Portions of our operating costs are denominated inPeruvian soles and Mexican pesos. Since our revenues are primarily denominated in U.S. dollars, wheninflation or deflation in our Mexican or Peruvian operations is not offset by a change in the exchangerate of the sol or the peso to the dollar, our financial position, results of operations and cash flowscould be affected by local cost conversion when expressed in U.S. dollars. In addition, the dollar valueof our net monetary assets denominated in soles or pesos can be affected by an exchange rate varianceof the sol or the peso, resulting in a re-measurement gain or loss in our financial statements. Recentinflation and exchange rate variances for the three years ended December 31, 2017, are provided in thetable below:
2017 2016 2015
Peru: . . . . . . . . . . . . . . . . . . . . . . . . . . . . . . . . . . . . .Peruvian inflation rate . . . . . . . . . . . . . . . . . . . . . . . . . 1.5% 3.2% 4.4%
Initial exchange rate . . . . . . . . . . . . . . . . . . . . . . . . . . 3.360 3.413 2.989Closing exchange rate . . . . . . . . . . . . . . . . . . . . . . . . . 3.245 3.360 3.413Appreciation/(devaluation) . . . . . . . . . . . . . . . . . . . . . . 3.4% 1.6% (14.2)%
Mexico: . . . . . . . . . . . . . . . . . . . . . . . . . . . . . . . . . . .Mexican inflation rate . . . . . . . . . . . . . . . . . . . . . . . . . 6.8% 3.4% 2.1%
Initial exchange rate . . . . . . . . . . . . . . . . . . . . . . . . . . 20.664 17.207 14.718Closing exchange rate . . . . . . . . . . . . . . . . . . . . . . . . . 19.735 20.664 17.207Appreciation/(devaluation) . . . . . . . . . . . . . . . . . . . . . . 4.5% (20.1)% (16.9)%
Change in monetary position:
Assuming an exchange rate variance of 10% at December 31, 2017, we estimate our net monetaryposition in Peruvian sol and Mexican peso would increase (decrease) our net earnings as follows:
Effect in netearnings
($ in millions)
Appreciation of 10% in U.S. dollar vs. Peruvian sol . . . . . . . . . . . . . . . $ 11.9Devaluation of 10% in U.S. dollar vs. Peruvian sol . . . . . . . . . . . . . . . $(14.5)Appreciation of 10% in U.S. dollar vs. Mexican peso . . . . . . . . . . . . . $ 20.1Devaluation of 10% in U.S. dollar vs. Mexican peso . . . . . . . . . . . . . . $(24.5)
98
The net monetary position is net of those assets and liabilities that are sol or peso denominated atDecember 31, 2017.
Short-term investments:
For additional information on our trading securities and available-for-sale investments, refer toNote 3 Short-term Investments in Part II, Item 8 of this annual report.
99
ITEM 8. FINANCIAL STATEMENTS AND SUPPLEMENTAL DATA
REPORT OF INDEPENDENT REGISTERED PUBLIC ACCOUNTING FIRM
To the Board of Directors and Stockholders of Southern Copper Corporation:
Opinion on the Consolidated Financial Statements
We have audited the accompanying consolidated balance sheets of Southern Copper Corporationand subsidiaries (the ‘‘Company’’) as of December 31, 2017 and 2016, the related consolidatedstatements of earnings, comprehensive income, changes in stockholders´equity, and cash flows for eachof the three years in the period ended December 31, 2017 and the related notes and schedule listed inthe Index at Item 15 (collectively referred to as the ‘‘consolidated financial statements’’). In ouropinion, the consolidated financial statements present fairly, in all material respects, the financialposition of the Company as of December 31, 2017 and 2016, and the results of its operations and itscash flows for each of the three years in the period ended December 31, 2017, in conformity withaccounting principles generally accepted in the United States of America.
We have also audited, in accordance with the standards of the Public Company AccountingOversight Board (United States) (‘‘PCAOB’’), the Company’s internal control over financial reportingas of December 31, 2017, based on criteria established in Internal Control—Integrated Framework(2013) issued by the Committee of Sponsoring Organizations of the Treadway Commission and ourreport dated March 1, 2018 expressed an unqualified opinion on the Company’s internal control overfinancial reporting.
Basis for Opinion
These consolidated financial statements are the responsibility of the Company’s management. Ourresponsibility is to express an opinion on the Company’s consolidated financial statements based on ouraudits. We are a public accounting firm registered with the PCAOB and are required to beindependent with respect to the Company in accordance with the U.S. federal securities laws and theapplicable rules and regulations of the Securities and Exchange Commission and the PCAOB.
We conducted our audits in accordance with the standards of the PCAOB. Those standards requirethat we plan and perform the audit to obtain reasonable assurance about whether the consolidatedfinancial statements are free of material misstatement whether due to error or fraud. Our auditsincluded performing procedures to assess the risks of material misstatement of the consolidatedfinancial statements, whether due to error or fraud, and performing procedures that respond to thoserisks. Such procedures included examining, on a test basis, evidence regarding the amounts anddisclosures in the consolidated financial statements. Our audits also included evaluating the accountingprinciples used and significant estimates made by management, as well as evaluating the overallpresentation of the consolidated financial statements. We believe that our audits provide a reasonablebasis for our opinion.
Galaz, Yamazaki, Ruiz Urquiza S.C.Member of Deloitte Touche Tohmatsu Limited
/s/ MIGUEL ANGEL ANDRADE LEVEN
C.P.C. Miguel Angel Andrade LevenWe have served as the Company’s auditor since 2009Mexico City, MexicoMarch 1, 2018
100
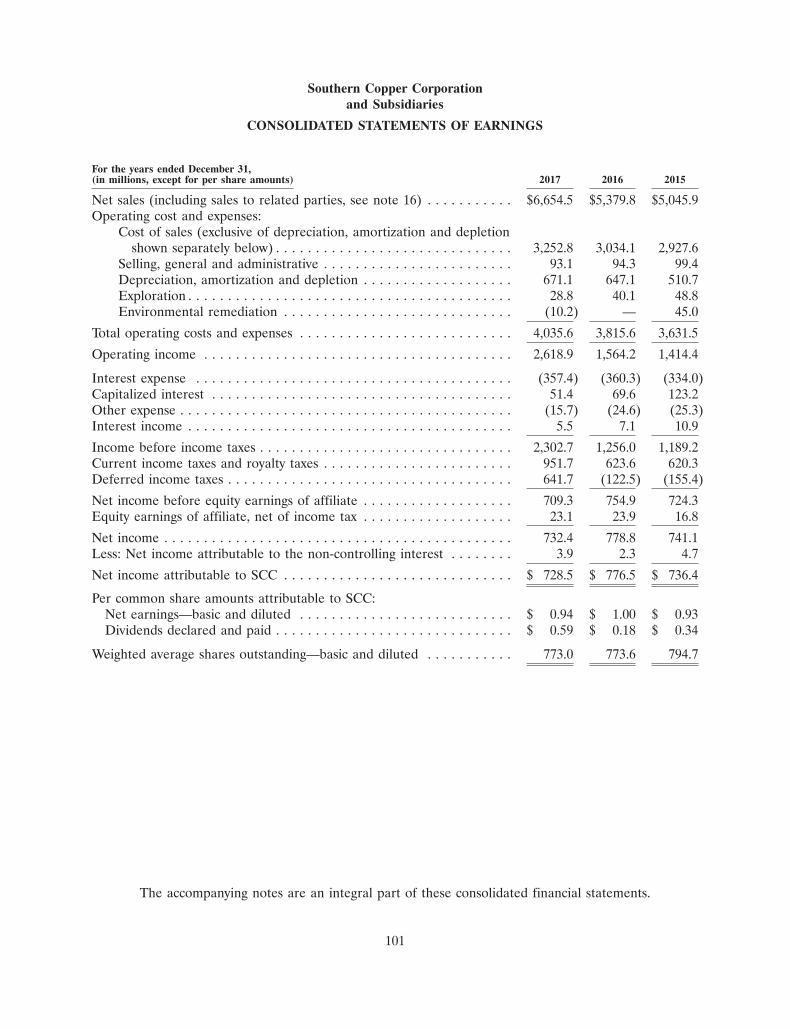
Southern Copper Corporationand Subsidiaries
CONSOLIDATED STATEMENTS OF EARNINGS
For the years ended December 31,(in millions, except for per share amounts) 2017 2016 2015
Net sales (including sales to related parties, see note 16) . . . . . . . . . . . $6,654.5 $5,379.8 $5,045.9Operating cost and expenses:
Cost of sales (exclusive of depreciation, amortization and depletionshown separately below) . . . . . . . . . . . . . . . . . . . . . . . . . . . . . . 3,252.8 3,034.1 2,927.6
Selling, general and administrative . . . . . . . . . . . . . . . . . . . . . . . . 93.1 94.3 99.4Depreciation, amortization and depletion . . . . . . . . . . . . . . . . . . . 671.1 647.1 510.7Exploration . . . . . . . . . . . . . . . . . . . . . . . . . . . . . . . . . . . . . . . . . 28.8 40.1 48.8Environmental remediation . . . . . . . . . . . . . . . . . . . . . . . . . . . . . (10.2) — 45.0
Total operating costs and expenses . . . . . . . . . . . . . . . . . . . . . . . . . . . 4,035.6 3,815.6 3,631.5
Operating income . . . . . . . . . . . . . . . . . . . . . . . . . . . . . . . . . . . . . . . 2,618.9 1,564.2 1,414.4
Interest expense . . . . . . . . . . . . . . . . . . . . . . . . . . . . . . . . . . . . . . . . (357.4) (360.3) (334.0)Capitalized interest . . . . . . . . . . . . . . . . . . . . . . . . . . . . . . . . . . . . . . 51.4 69.6 123.2Other expense . . . . . . . . . . . . . . . . . . . . . . . . . . . . . . . . . . . . . . . . . . (15.7) (24.6) (25.3)Interest income . . . . . . . . . . . . . . . . . . . . . . . . . . . . . . . . . . . . . . . . . 5.5 7.1 10.9
Income before income taxes . . . . . . . . . . . . . . . . . . . . . . . . . . . . . . . . 2,302.7 1,256.0 1,189.2Current income taxes and royalty taxes . . . . . . . . . . . . . . . . . . . . . . . . 951.7 623.6 620.3Deferred income taxes . . . . . . . . . . . . . . . . . . . . . . . . . . . . . . . . . . . . 641.7 (122.5) (155.4)
Net income before equity earnings of affiliate . . . . . . . . . . . . . . . . . . . 709.3 754.9 724.3Equity earnings of affiliate, net of income tax . . . . . . . . . . . . . . . . . . . 23.1 23.9 16.8
Net income . . . . . . . . . . . . . . . . . . . . . . . . . . . . . . . . . . . . . . . . . . . . 732.4 778.8 741.1Less: Net income attributable to the non-controlling interest . . . . . . . . 3.9 2.3 4.7
Net income attributable to SCC . . . . . . . . . . . . . . . . . . . . . . . . . . . . . $ 728.5 $ 776.5 $ 736.4
Per common share amounts attributable to SCC:Net earnings—basic and diluted . . . . . . . . . . . . . . . . . . . . . . . . . . . $ 0.94 $ 1.00 $ 0.93Dividends declared and paid . . . . . . . . . . . . . . . . . . . . . . . . . . . . . . $ 0.59 $ 0.18 $ 0.34
Weighted average shares outstanding—basic and diluted . . . . . . . . . . . 773.0 773.6 794.7
The accompanying notes are an integral part of these consolidated financial statements.
101
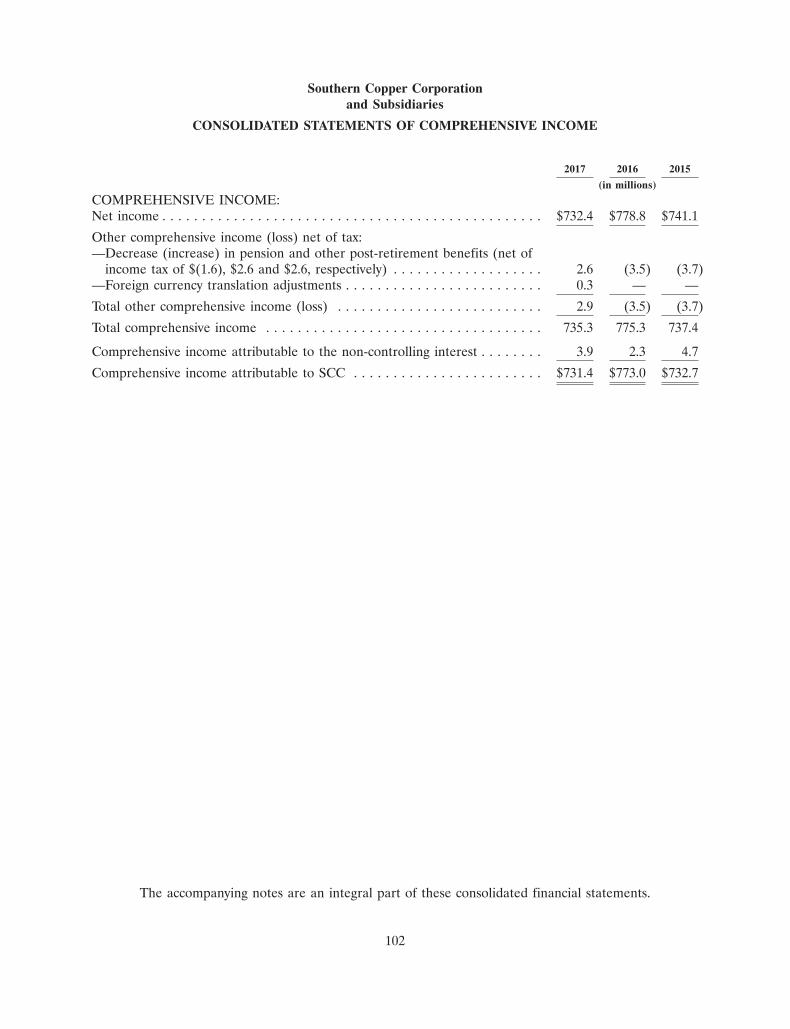
Southern Copper Corporationand Subsidiaries
CONSOLIDATED STATEMENTS OF COMPREHENSIVE INCOME
2017 2016 2015
(in millions)
COMPREHENSIVE INCOME:Net income . . . . . . . . . . . . . . . . . . . . . . . . . . . . . . . . . . . . . . . . . . . . . . . . $732.4 $778.8 $741.1
Other comprehensive income (loss) net of tax:—Decrease (increase) in pension and other post-retirement benefits (net of
income tax of $(1.6), $2.6 and $2.6, respectively) . . . . . . . . . . . . . . . . . . . 2.6 (3.5) (3.7)—Foreign currency translation adjustments . . . . . . . . . . . . . . . . . . . . . . . . . 0.3 — —
Total other comprehensive income (loss) . . . . . . . . . . . . . . . . . . . . . . . . . . 2.9 (3.5) (3.7)
Total comprehensive income . . . . . . . . . . . . . . . . . . . . . . . . . . . . . . . . . . . 735.3 775.3 737.4
Comprehensive income attributable to the non-controlling interest . . . . . . . . 3.9 2.3 4.7
Comprehensive income attributable to SCC . . . . . . . . . . . . . . . . . . . . . . . . $731.4 $773.0 $732.7
The accompanying notes are an integral part of these consolidated financial statements.
102
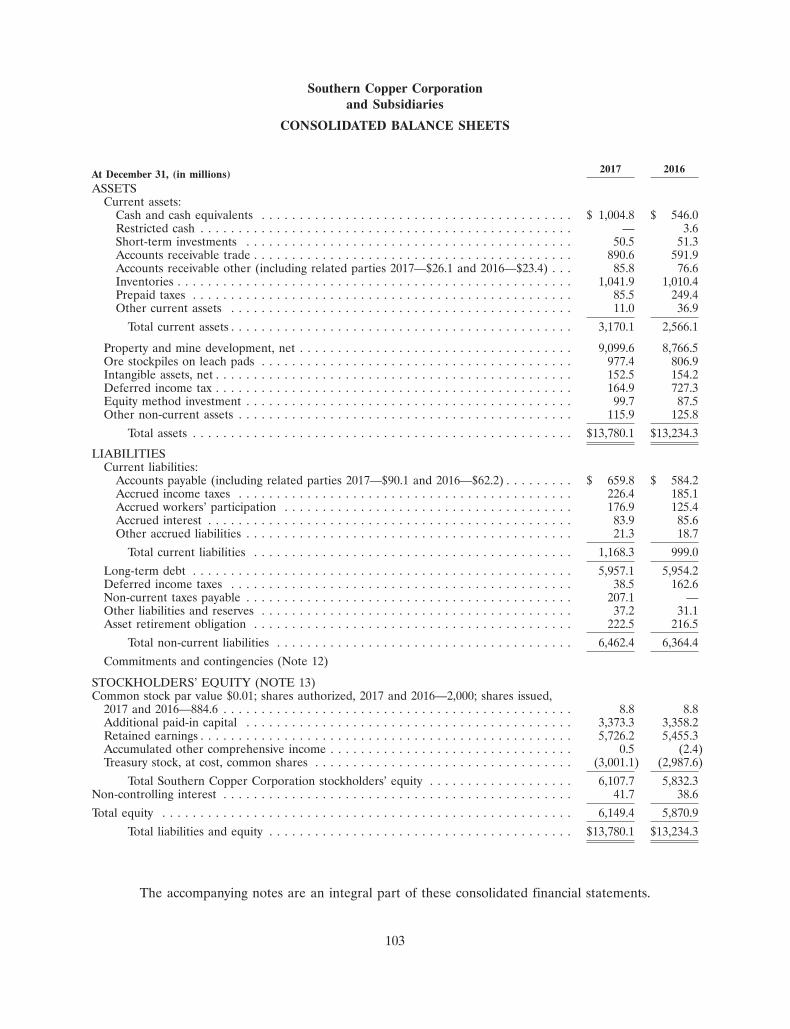
Southern Copper Corporationand Subsidiaries
CONSOLIDATED BALANCE SHEETS
2017 2016At December 31, (in millions)ASSETS
Current assets:Cash and cash equivalents . . . . . . . . . . . . . . . . . . . . . . . . . . . . . . . . . . . . . . . . . $ 1,004.8 $ 546.0Restricted cash . . . . . . . . . . . . . . . . . . . . . . . . . . . . . . . . . . . . . . . . . . . . . . . . . — 3.6Short-term investments . . . . . . . . . . . . . . . . . . . . . . . . . . . . . . . . . . . . . . . . . . . 50.5 51.3Accounts receivable trade . . . . . . . . . . . . . . . . . . . . . . . . . . . . . . . . . . . . . . . . . . 890.6 591.9Accounts receivable other (including related parties 2017—$26.1 and 2016—$23.4) . . . 85.8 76.6Inventories . . . . . . . . . . . . . . . . . . . . . . . . . . . . . . . . . . . . . . . . . . . . . . . . . . . . 1,041.9 1,010.4Prepaid taxes . . . . . . . . . . . . . . . . . . . . . . . . . . . . . . . . . . . . . . . . . . . . . . . . . . 85.5 249.4Other current assets . . . . . . . . . . . . . . . . . . . . . . . . . . . . . . . . . . . . . . . . . . . . . 11.0 36.9
Total current assets . . . . . . . . . . . . . . . . . . . . . . . . . . . . . . . . . . . . . . . . . . . . . 3,170.1 2,566.1
Property and mine development, net . . . . . . . . . . . . . . . . . . . . . . . . . . . . . . . . . . . . 9,099.6 8,766.5Ore stockpiles on leach pads . . . . . . . . . . . . . . . . . . . . . . . . . . . . . . . . . . . . . . . . . 977.4 806.9Intangible assets, net . . . . . . . . . . . . . . . . . . . . . . . . . . . . . . . . . . . . . . . . . . . . . . . 152.5 154.2Deferred income tax . . . . . . . . . . . . . . . . . . . . . . . . . . . . . . . . . . . . . . . . . . . . . . . 164.9 727.3Equity method investment . . . . . . . . . . . . . . . . . . . . . . . . . . . . . . . . . . . . . . . . . . . 99.7 87.5Other non-current assets . . . . . . . . . . . . . . . . . . . . . . . . . . . . . . . . . . . . . . . . . . . . 115.9 125.8
Total assets . . . . . . . . . . . . . . . . . . . . . . . . . . . . . . . . . . . . . . . . . . . . . . . . . . $13,780.1 $13,234.3
LIABILITIESCurrent liabilities:
Accounts payable (including related parties 2017—$90.1 and 2016—$62.2) . . . . . . . . . $ 659.8 $ 584.2Accrued income taxes . . . . . . . . . . . . . . . . . . . . . . . . . . . . . . . . . . . . . . . . . . . . 226.4 185.1Accrued workers’ participation . . . . . . . . . . . . . . . . . . . . . . . . . . . . . . . . . . . . . . 176.9 125.4Accrued interest . . . . . . . . . . . . . . . . . . . . . . . . . . . . . . . . . . . . . . . . . . . . . . . . 83.9 85.6Other accrued liabilities . . . . . . . . . . . . . . . . . . . . . . . . . . . . . . . . . . . . . . . . . . . 21.3 18.7
Total current liabilities . . . . . . . . . . . . . . . . . . . . . . . . . . . . . . . . . . . . . . . . . . 1,168.3 999.0
Long-term debt . . . . . . . . . . . . . . . . . . . . . . . . . . . . . . . . . . . . . . . . . . . . . . . . . . 5,957.1 5,954.2Deferred income taxes . . . . . . . . . . . . . . . . . . . . . . . . . . . . . . . . . . . . . . . . . . . . . 38.5 162.6Non-current taxes payable . . . . . . . . . . . . . . . . . . . . . . . . . . . . . . . . . . . . . . . . . . . 207.1 —Other liabilities and reserves . . . . . . . . . . . . . . . . . . . . . . . . . . . . . . . . . . . . . . . . . 37.2 31.1Asset retirement obligation . . . . . . . . . . . . . . . . . . . . . . . . . . . . . . . . . . . . . . . . . . 222.5 216.5
Total non-current liabilities . . . . . . . . . . . . . . . . . . . . . . . . . . . . . . . . . . . . . . . 6,462.4 6,364.4
Commitments and contingencies (Note 12)
STOCKHOLDERS’ EQUITY (NOTE 13)Common stock par value $0.01; shares authorized, 2017 and 2016—2,000; shares issued,
2017 and 2016—884.6 . . . . . . . . . . . . . . . . . . . . . . . . . . . . . . . . . . . . . . . . . . . . . . 8.8 8.8Additional paid-in capital . . . . . . . . . . . . . . . . . . . . . . . . . . . . . . . . . . . . . . . . . . . 3,373.3 3,358.2Retained earnings . . . . . . . . . . . . . . . . . . . . . . . . . . . . . . . . . . . . . . . . . . . . . . . . . 5,726.2 5,455.3Accumulated other comprehensive income . . . . . . . . . . . . . . . . . . . . . . . . . . . . . . . . 0.5 (2.4)Treasury stock, at cost, common shares . . . . . . . . . . . . . . . . . . . . . . . . . . . . . . . . . . (3,001.1) (2,987.6)
Total Southern Copper Corporation stockholders’ equity . . . . . . . . . . . . . . . . . . . 6,107.7 5,832.3Non-controlling interest . . . . . . . . . . . . . . . . . . . . . . . . . . . . . . . . . . . . . . . . . . . . . . 41.7 38.6
Total equity . . . . . . . . . . . . . . . . . . . . . . . . . . . . . . . . . . . . . . . . . . . . . . . . . . . . . . 6,149.4 5,870.9
Total liabilities and equity . . . . . . . . . . . . . . . . . . . . . . . . . . . . . . . . . . . . . . . . $13,780.1 $13,234.3
The accompanying notes are an integral part of these consolidated financial statements.
103
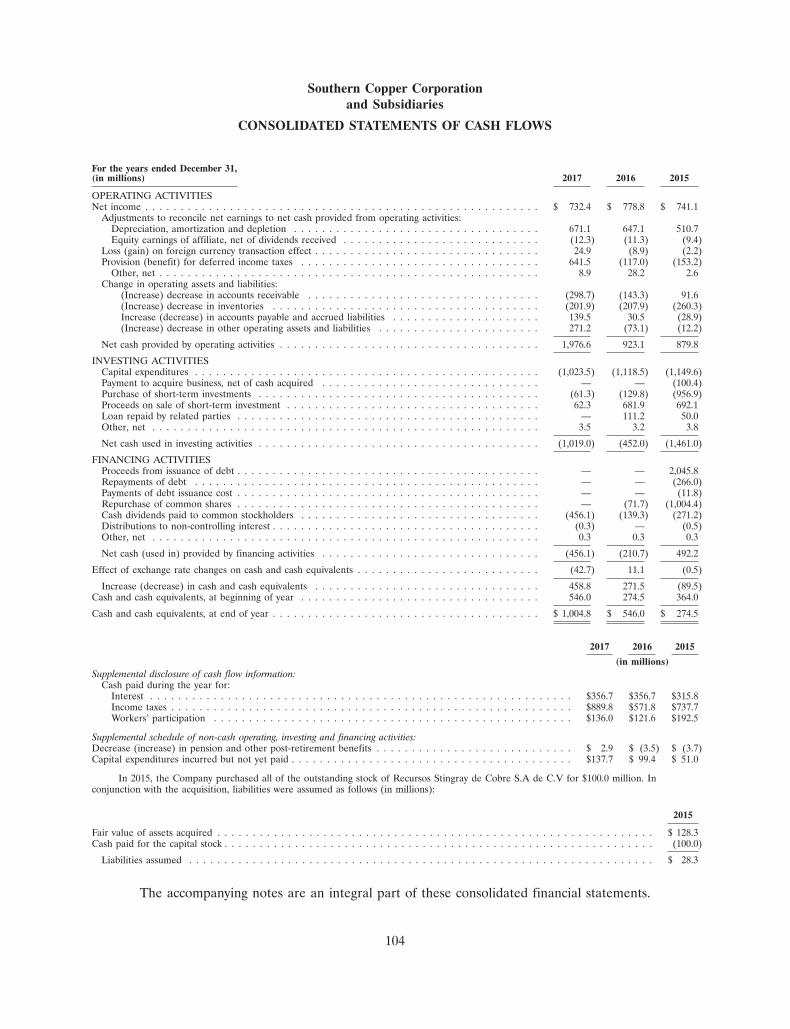
Southern Copper Corporationand Subsidiaries
CONSOLIDATED STATEMENTS OF CASH FLOWS
For the years ended December 31,(in millions) 2017 2016 2015
OPERATING ACTIVITIESNet income . . . . . . . . . . . . . . . . . . . . . . . . . . . . . . . . . . . . . . . . . . . . . . . . . . . . . . . . $ 732.4 $ 778.8 $ 741.1
Adjustments to reconcile net earnings to net cash provided from operating activities:Depreciation, amortization and depletion . . . . . . . . . . . . . . . . . . . . . . . . . . . . . . . . . . . 671.1 647.1 510.7Equity earnings of affiliate, net of dividends received . . . . . . . . . . . . . . . . . . . . . . . . . . . . (12.3) (11.3) (9.4)
Loss (gain) on foreign currency transaction effect . . . . . . . . . . . . . . . . . . . . . . . . . . . . . . . . 24.9 (8.9) (2.2)Provision (benefit) for deferred income taxes . . . . . . . . . . . . . . . . . . . . . . . . . . . . . . . . . . 641.5 (117.0) (153.2)
Other, net . . . . . . . . . . . . . . . . . . . . . . . . . . . . . . . . . . . . . . . . . . . . . . . . . . . . . . 8.9 28.2 2.6Change in operating assets and liabilities:
(Increase) decrease in accounts receivable . . . . . . . . . . . . . . . . . . . . . . . . . . . . . . . . . (298.7) (143.3) 91.6(Increase) decrease in inventories . . . . . . . . . . . . . . . . . . . . . . . . . . . . . . . . . . . . . . (201.9) (207.9) (260.3)Increase (decrease) in accounts payable and accrued liabilities . . . . . . . . . . . . . . . . . . . . . 139.5 30.5 (28.9)(Increase) decrease in other operating assets and liabilities . . . . . . . . . . . . . . . . . . . . . . . 271.2 (73.1) (12.2)
Net cash provided by operating activities . . . . . . . . . . . . . . . . . . . . . . . . . . . . . . . . . . . . . 1,976.6 923.1 879.8
INVESTING ACTIVITIESCapital expenditures . . . . . . . . . . . . . . . . . . . . . . . . . . . . . . . . . . . . . . . . . . . . . . . . . (1,023.5) (1,118.5) (1,149.6)Payment to acquire business, net of cash acquired . . . . . . . . . . . . . . . . . . . . . . . . . . . . . . . — — (100.4)Purchase of short-term investments . . . . . . . . . . . . . . . . . . . . . . . . . . . . . . . . . . . . . . . . (61.3) (129.8) (956.9)Proceeds on sale of short-term investment . . . . . . . . . . . . . . . . . . . . . . . . . . . . . . . . . . . . 62.3 681.9 692.1Loan repaid by related parties . . . . . . . . . . . . . . . . . . . . . . . . . . . . . . . . . . . . . . . . . . . — 111.2 50.0Other, net . . . . . . . . . . . . . . . . . . . . . . . . . . . . . . . . . . . . . . . . . . . . . . . . . . . . . . . 3.5 3.2 3.8
Net cash used in investing activities . . . . . . . . . . . . . . . . . . . . . . . . . . . . . . . . . . . . . . . . (1,019.0) (452.0) (1,461.0)
FINANCING ACTIVITIESProceeds from issuance of debt . . . . . . . . . . . . . . . . . . . . . . . . . . . . . . . . . . . . . . . . . . . — — 2,045.8Repayments of debt . . . . . . . . . . . . . . . . . . . . . . . . . . . . . . . . . . . . . . . . . . . . . . . . . — — (266.0)Payments of debt issuance cost . . . . . . . . . . . . . . . . . . . . . . . . . . . . . . . . . . . . . . . . . . . — — (11.8)Repurchase of common shares . . . . . . . . . . . . . . . . . . . . . . . . . . . . . . . . . . . . . . . . . . . — (71.7) (1,004.4)Cash dividends paid to common stockholders . . . . . . . . . . . . . . . . . . . . . . . . . . . . . . . . . . (456.1) (139.3) (271.2)Distributions to non-controlling interest . . . . . . . . . . . . . . . . . . . . . . . . . . . . . . . . . . . . . . (0.3) — (0.5)Other, net . . . . . . . . . . . . . . . . . . . . . . . . . . . . . . . . . . . . . . . . . . . . . . . . . . . . . . . 0.3 0.3 0.3
Net cash (used in) provided by financing activities . . . . . . . . . . . . . . . . . . . . . . . . . . . . . . . (456.1) (210.7) 492.2
Effect of exchange rate changes on cash and cash equivalents . . . . . . . . . . . . . . . . . . . . . . . . . . (42.7) 11.1 (0.5)
Increase (decrease) in cash and cash equivalents . . . . . . . . . . . . . . . . . . . . . . . . . . . . . . . . 458.8 271.5 (89.5)Cash and cash equivalents, at beginning of year . . . . . . . . . . . . . . . . . . . . . . . . . . . . . . . . . . 546.0 274.5 364.0
Cash and cash equivalents, at end of year . . . . . . . . . . . . . . . . . . . . . . . . . . . . . . . . . . . . . . $ 1,004.8 $ 546.0 $ 274.5
2017 2016 2015
(in millions)Supplemental disclosure of cash flow information:
Cash paid during the year for:Interest . . . . . . . . . . . . . . . . . . . . . . . . . . . . . . . . . . . . . . . . . . . . . . . . . . . . . . . . . . . . $356.7 $356.7 $315.8Income taxes . . . . . . . . . . . . . . . . . . . . . . . . . . . . . . . . . . . . . . . . . . . . . . . . . . . . . . . . . $889.8 $571.8 $737.7Workers’ participation . . . . . . . . . . . . . . . . . . . . . . . . . . . . . . . . . . . . . . . . . . . . . . . . . . . $136.0 $121.6 $192.5
Supplemental schedule of non-cash operating, investing and financing activities:Decrease (increase) in pension and other post-retirement benefits . . . . . . . . . . . . . . . . . . . . . . . . . . . . $ 2.9 $ (3.5) $ (3.7)Capital expenditures incurred but not yet paid . . . . . . . . . . . . . . . . . . . . . . . . . . . . . . . . . . . . . . . . $137.7 $ 99.4 $ 51.0
In 2015, the Company purchased all of the outstanding stock of Recursos Stingray de Cobre S.A de C.V for $100.0 million. Inconjunction with the acquisition, liabilities were assumed as follows (in millions):
2015
Fair value of assets acquired . . . . . . . . . . . . . . . . . . . . . . . . . . . . . . . . . . . . . . . . . . . . . . . . . . . . . . . . . . . . . . $ 128.3Cash paid for the capital stock . . . . . . . . . . . . . . . . . . . . . . . . . . . . . . . . . . . . . . . . . . . . . . . . . . . . . . . . . . . . . (100.0)
Liabilities assumed . . . . . . . . . . . . . . . . . . . . . . . . . . . . . . . . . . . . . . . . . . . . . . . . . . . . . . . . . . . . . . . . . . $ 28.3
The accompanying notes are an integral part of these consolidated financial statements.
104
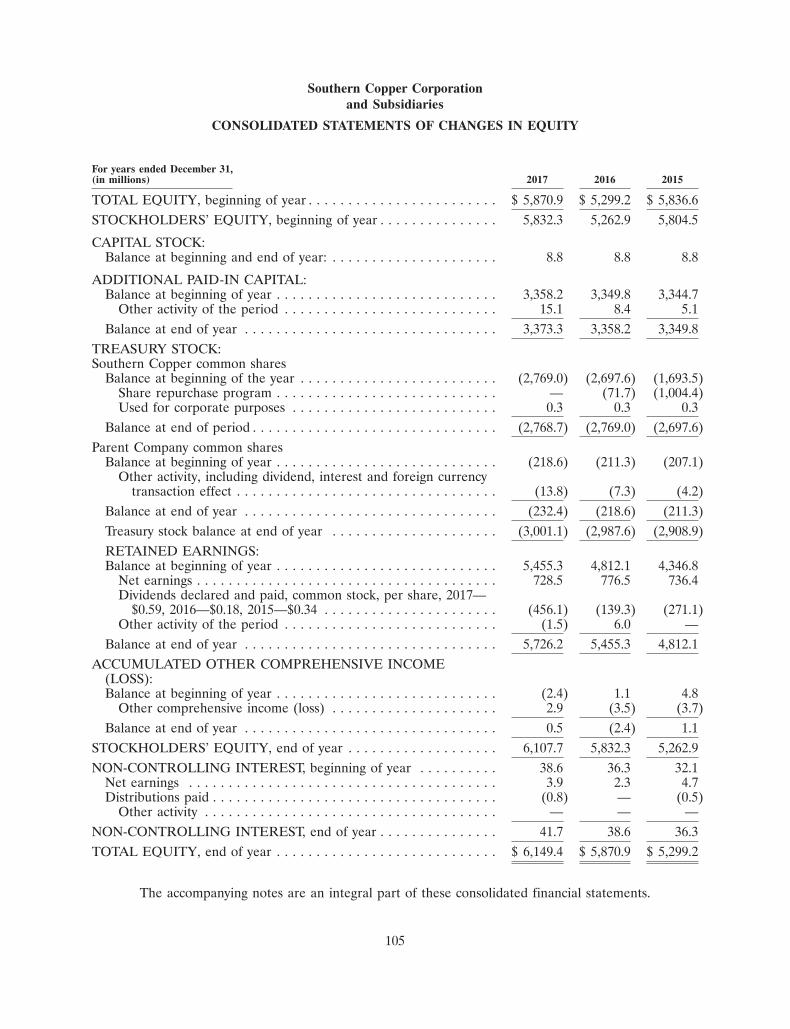
Southern Copper Corporationand Subsidiaries
CONSOLIDATED STATEMENTS OF CHANGES IN EQUITY
For years ended December 31,(in millions) 2017 2016 2015
TOTAL EQUITY, beginning of year . . . . . . . . . . . . . . . . . . . . . . . . $ 5,870.9 $ 5,299.2 $ 5,836.6STOCKHOLDERS’ EQUITY, beginning of year . . . . . . . . . . . . . . . 5,832.3 5,262.9 5,804.5
CAPITAL STOCK:Balance at beginning and end of year: . . . . . . . . . . . . . . . . . . . . . 8.8 8.8 8.8
ADDITIONAL PAID-IN CAPITAL:Balance at beginning of year . . . . . . . . . . . . . . . . . . . . . . . . . . . . 3,358.2 3,349.8 3,344.7
Other activity of the period . . . . . . . . . . . . . . . . . . . . . . . . . . . 15.1 8.4 5.1Balance at end of year . . . . . . . . . . . . . . . . . . . . . . . . . . . . . . . . 3,373.3 3,358.2 3,349.8
TREASURY STOCK:Southern Copper common shares
Balance at beginning of the year . . . . . . . . . . . . . . . . . . . . . . . . . (2,769.0) (2,697.6) (1,693.5)Share repurchase program . . . . . . . . . . . . . . . . . . . . . . . . . . . . — (71.7) (1,004.4)Used for corporate purposes . . . . . . . . . . . . . . . . . . . . . . . . . . 0.3 0.3 0.3
Balance at end of period . . . . . . . . . . . . . . . . . . . . . . . . . . . . . . . (2,768.7) (2,769.0) (2,697.6)Parent Company common shares
Balance at beginning of year . . . . . . . . . . . . . . . . . . . . . . . . . . . . (218.6) (211.3) (207.1)Other activity, including dividend, interest and foreign currency
transaction effect . . . . . . . . . . . . . . . . . . . . . . . . . . . . . . . . . (13.8) (7.3) (4.2)Balance at end of year . . . . . . . . . . . . . . . . . . . . . . . . . . . . . . . . (232.4) (218.6) (211.3)Treasury stock balance at end of year . . . . . . . . . . . . . . . . . . . . . (3,001.1) (2,987.6) (2,908.9)RETAINED EARNINGS:Balance at beginning of year . . . . . . . . . . . . . . . . . . . . . . . . . . . . 5,455.3 4,812.1 4,346.8
Net earnings . . . . . . . . . . . . . . . . . . . . . . . . . . . . . . . . . . . . . . 728.5 776.5 736.4Dividends declared and paid, common stock, per share, 2017—
$0.59, 2016—$0.18, 2015—$0.34 . . . . . . . . . . . . . . . . . . . . . . (456.1) (139.3) (271.1)Other activity of the period . . . . . . . . . . . . . . . . . . . . . . . . . . . (1.5) 6.0 —
Balance at end of year . . . . . . . . . . . . . . . . . . . . . . . . . . . . . . . . 5,726.2 5,455.3 4,812.1ACCUMULATED OTHER COMPREHENSIVE INCOME
(LOSS):Balance at beginning of year . . . . . . . . . . . . . . . . . . . . . . . . . . . . (2.4) 1.1 4.8
Other comprehensive income (loss) . . . . . . . . . . . . . . . . . . . . . 2.9 (3.5) (3.7)Balance at end of year . . . . . . . . . . . . . . . . . . . . . . . . . . . . . . . . 0.5 (2.4) 1.1
STOCKHOLDERS’ EQUITY, end of year . . . . . . . . . . . . . . . . . . . 6,107.7 5,832.3 5,262.9NON-CONTROLLING INTEREST, beginning of year . . . . . . . . . . 38.6 36.3 32.1
Net earnings . . . . . . . . . . . . . . . . . . . . . . . . . . . . . . . . . . . . . . . 3.9 2.3 4.7Distributions paid . . . . . . . . . . . . . . . . . . . . . . . . . . . . . . . . . . . . (0.8) — (0.5)
Other activity . . . . . . . . . . . . . . . . . . . . . . . . . . . . . . . . . . . . . — — —NON-CONTROLLING INTEREST, end of year . . . . . . . . . . . . . . . 41.7 38.6 36.3TOTAL EQUITY, end of year . . . . . . . . . . . . . . . . . . . . . . . . . . . . $ 6,149.4 $ 5,870.9 $ 5,299.2
The accompanying notes are an integral part of these consolidated financial statements.
105
SOUTHERN COPPER CORPORATION AND SUBSIDIARIES
NOTES TO CONSOLIDATED FINANCIAL STATEMENTS
NOTE 1—DESCRIPTION OF THE BUSINESS:
The Company is a majority-owned, indirect subsidiary of Grupo Mexico S.A.B. de C.V. (‘‘GrupoMexico’’). At December 31, 2017, Grupo Mexico through its wholly-owned subsidiary Americas MiningCorporation (‘‘AMC’’) owned 88.9% of the Company’s capital stock. The consolidated financialstatements presented herein consist of the accounts of Southern Copper Corporation (‘‘SCC’’ or the‘‘Company’’), a Delaware corporation, and its subsidiaries. The Company is an integrated producer ofcopper and other minerals, and operates mining, smelting and refining facilities in Peru and Mexico.The Company conducts its primary operations in Peru through a registered branch (the ‘‘PeruvianBranch’’ or ‘‘Branch’’ or ‘‘SPCC Peru Branch’’). The Peruvian Branch is not a corporation separatefrom the Company. The Company’s Mexican operations are conducted through subsidiaries. TheCompany also conducts exploration activities in Argentina, Chile, Ecuador, Mexico and Peru.
NOTE 2—SUMMARY OF SIGNIFICANT ACCOUNTING POLICIES:
Principles of consolidation—
The consolidated financial statements include the accounts of subsidiaries of which the Companyhas voting control, in accordance with Accounting Standards Codification (‘‘ASC’’) 810 Consolidation.Such financial statements are prepared in accordance with accounting principles generally accepted inthe United States (‘‘U.S. GAAP’’).
Use of estimates—
The preparation of financial statements in conformity with U.S. GAAP requires management tomake estimates and assumptions that affect the reported amounts of assets and liabilities, anddisclosure of contingent assets and liabilities at the date of the financial statements, and the reportedamounts of revenues and expenses during the reporting period. Significant items subject to suchestimates and assumptions include the carrying value of ore reserves that are the basis for future cashflow estimates and amortization calculations; environmental reclamation, closure and retirementobligations; estimates of recoverable copper in mill and leach stockpiles; asset impairments (includingestimates of future cash flows); unrecognized tax benefits; valuation allowances for deferred tax assets;and fair value of financial instruments. Management bases its estimates on the Company’s historicalexperience and on various other assumptions that are believed to be reasonable under thecircumstances. Actual results could differ from those estimates.
Revenue recognition—
Substantially all of the Company’s copper and non-copper products are sold under annual or otherlonger-term contracts.
Revenue is recognized when title passes to the customer. The passing of title is based on terms ofthe contract, generally upon shipment. Copper and non-copper revenues are determined based on themonthly average of prevailing commodity prices according to the terms of the contracts. The Companyprovides allowances for doubtful accounts based upon historical bad debt and claims experience andperiodic evaluation of specific customer accounts.
For certain of the Company’s sales of copper and molybdenum products, customer contracts allowfor pricing based on a month subsequent to shipping, in most cases within the following three monthsand occasionally in some cases a few additional months. In such cases, revenue is recorded at a
106
SOUTHERN COPPER CORPORATION AND SUBSIDIARIES
NOTES TO CONSOLIDATED FINANCIAL STATEMENTS (Continued)
NOTE 2—SUMMARY OF SIGNIFICANT ACCOUNTING POLICIES: (Continued)
provisional price at the time of shipment. The provisionally priced copper sales are adjusted to reflectforward LME or COMEX copper prices at the end of each month until a final adjustment is made tothe price of the shipments upon settlement with customers pursuant to the terms of the contract. In thecase of molybdenum sales, for which there are no published forward prices, the provisionally pricedsales are adjusted to reflect the market prices at the end of each month until a final adjustment ismade to the price of the shipments upon settlement with customers pursuant to the terms of thecontract.
These provisional pricing arrangements are accounted for separately from the contract as anembedded derivative instrument under ASC 815-30 ‘‘Derivatives and Hedging—Cash Flow Hedges.’’The Company sells copper in concentrate, anode, blister and refined form at industry standardcommercial terms. Net sales include the invoiced value of copper, zinc, silver, molybdenum, sulfuricacid and other metals and the corresponding fair value adjustment of the related forward contract ofcopper and molybdenum.
Shipping and handling fees and costs—
Amounts billed to customers for shipping and handling are classified as sales. Amounts incurredfor shipping and handling are included in cost of sales (exclusive of depreciation, amortization anddepletion).
Cash and cash equivalents—
Cash and cash equivalents include bank deposits, certificates of deposit and short-term investmentfunds with original maturities of three months or less at the date of purchase. The carrying value ofcash and cash equivalents approximates fair value.
Short-term investments—
The Company accounts for short-term investments in accordance with ASC 320-10 ‘‘InvestmentsDebt and Equity Securities—Recognition.’’ The Company determines the appropriate classification ofall short-term investments as held-to-maturity, available-for-sale or trading at the time of purchase andre-evaluates such classifications as of each balance sheet date. Unrealized gains and losses onavailable-for-sale investments, net of taxes, are reported as a component of accumulated othercomprehensive income (loss) in stockholders’ equity, unless such loss is deemed to be other thantemporary.
Inventories—
The Company principally produces copper and, in the production process, obtains severalby-products, including molybdenum, silver, zinc, sulfuric acid and other metals.
Metal inventories, consisting of work-in-process and finished goods, are carried at the lower ofaverage cost or market. Costs of work-in-process inventories and finished goods mainly include power,labor, fuel, operating and repair materials, depreciation, amortization, depletion, and other necessarycosts related to the extraction and processing of ore, including mining, milling, concentrating, smelting,refining, leaching and chemical processing. Costs incurred in the production of metal inventoriesexclude general and administrative costs. Once molybdenum, silver, zinc and other by-products are
107
SOUTHERN COPPER CORPORATION AND SUBSIDIARIES
NOTES TO CONSOLIDATED FINANCIAL STATEMENTS (Continued)
NOTE 2—SUMMARY OF SIGNIFICANT ACCOUNTING POLICIES: (Continued)
identified, they are transferred to their respective production facilities and the incremental costrequired to complete production is assigned to their inventory value.
Work-in-process inventories represent materials that are in the process of being converted into asaleable product. Conversion processes vary depending on the nature of the copper ore and the specificmining operation. For sulfide ores, processing includes milling and concentrating and results in theproduction of copper and molybdenum concentrates.
Finished goods include saleable products (e.g., copper concentrates, copper anodes, coppercathodes, copper rod, molybdenum concentrate and other metallurgical products).
Supplies inventories are carried at the lower of average cost or market.
Long-term inventory—Ore stockpiles on leach pads.
The leaching process is an integral part of the mining operations carried out at the Company’sopen-pit mines. The Company capitalizes the production cost of leachable material at its Toquepala, LaCaridad and Buenavista mines recognizing it as inventory. This cost includes mining and haulage costsincurred to deliver ore to leach pads, depreciation, amortization, depletion and site overhead costs. Theestimates of recoverable mineral content contained in the leaching dumps are supported by engineeringstudies. As the production cycle of the leaching process is significantly longer than the conventionalprocess of concentrating, smelting and electrolytic refining, the Company includes on its balance sheetcurrent leach inventory (included in work-in-process inventories) and long-term leach inventory.Amortization of leachable material is recorded by the units of production method.
Property—
Property is recorded at acquisition cost, net of accumulated depreciation and amortization. Costincludes major expenditures for improvements and replacements, which extend useful lives or increasecapacity and interest costs associated with significant capital additions. Maintenance, repairs, normaldevelopment costs at existing mines and gains or losses on assets retired or sold are reflected inearnings as incurred.
Buildings and equipment are depreciated on the straight-line method over estimated lives from fiveto 40 years or the estimated life of the mine if shorter.
Mine development—
Mine development includes primarily the cost of acquiring land rights to an exploitable ore body,pre-production stripping costs at new mines that are commercially exploitable, costs associated withbringing new mineral properties into production, and removal of overburden to prepare unique andidentifiable areas outside the current mining area for such future production. Mine development costsare amortized on a unit of production basis over the remaining life of the mines.
There is a diversity of practices in the mining industry in the treatment of drilling and otherrelated costs to delineate new ore reserves. The Company follows the practices outlined in the next twoparagraphs in its treatment of drilling and related costs.
Drilling and other associated costs incurred in the Company’s efforts to delineate new resources,whether near-mine or Greenfield are expensed as incurred. These costs are classified as mineral
108
SOUTHERN COPPER CORPORATION AND SUBSIDIARIES
NOTES TO CONSOLIDATED FINANCIAL STATEMENTS (Continued)
NOTE 2—SUMMARY OF SIGNIFICANT ACCOUNTING POLICIES: (Continued)
exploration costs. Once the Company determines through feasibility studies that proven and probablereserves exist and that the drilling and other associated costs embody a probable future benefit thatinvolves a capacity, singly or in combination with other assets, to contribute directly or indirectly tofuture net cash inflow, then the costs are classified as mine development costs. These minedevelopment costs incurred prospectively to develop the property are capitalized as incurred, until thecommencement of production, and are amortized using the units of production method over estimatedlife of the ore body. During the production stage, drilling and other related costs incurred to maintainproduction are included in production cost in the period in which they are incurred.
Drilling and other related costs incurred in the Company’s efforts to delineate a major expansionof reserves at an existing production property are expensed as incurred. Once the Company determinesthrough feasibility studies that proven and probable incremental reserves exist and that the drilling andother associated costs embody a probable future benefit that involves a capacity, singly or incombination with other assets, to contribute directly or indirectly to future net cash inflow, then thecosts are classified as mine development costs. These incremental mine development costs arecapitalized as incurred, until the commencement of production and amortized using the units ofproduction method over the estimated life of the ore body. A major expansion of reserves is one thatincreases total reserves at a property by approximately 10% or more.
For the years ended December 31, 2017, 2016 and 2015, the Company did not capitalize anydrilling and related costs.
Asset retirement obligations (reclamation and remediation costs)—
The fair value of a liability for asset retirement obligations is recognized in the period in which theliability is incurred. The liability is measured at fair value and is adjusted to its present value insubsequent periods as accretion expense is recorded. The corresponding asset retirement costs arecapitalized as part of the carrying value of the related long-lived assets and depreciated over the asset’suseful life.
Intangible assets—
Intangible assets include primarily the excess amount paid over the book value for investmentshares which are presented as mining concessions, and mining and engineering development studies.Intangible assets are carried at acquisition costs, net of accumulated amortization and are amortizedprincipally on a unit of production basis over the estimated remaining life of the mines. Intangibleassets are reviewed for impairment whenever events or changes in circumstances indicate that thecarrying amount of the asset may not be recoverable.
Debt issuance costs—
Debt issuance costs related to a recognized debt liability are presented in the balance sheet as adirect deduction from the carrying amount of that debt liability, consistent with the treatment of a debtdiscount.
109
SOUTHERN COPPER CORPORATION AND SUBSIDIARIES
NOTES TO CONSOLIDATED FINANCIAL STATEMENTS (Continued)
NOTE 2—SUMMARY OF SIGNIFICANT ACCOUNTING POLICIES: (Continued)
Ore reserves—
The Company periodically reevaluates estimates of its ore reserves, which represent the Company’sestimate as to the amount of unmined copper remaining in its existing mine locations that can beproduced and sold at a profit. Such estimates are based on engineering evaluations derived fromsamples of drill holes and other openings, combined with assumptions about copper market prices andproduction costs at each of the respective mines.
The Company updates its estimate of ore reserves at the beginning of each year. In thiscalculation, the Company uses current metal prices which are defined as the average metal price overthe preceding three years. The current price per pound of copper, as defined, was $2.50, $2.61 and$2.99 at the end of 2017, 2016 and 2015, respectively. The ore reserve estimates are used to determinethe amortization of mine development and intangible assets.
Once the Company determines through feasibility studies that proven and probable reserves existand that the drilling and other associated costs embody a probable future benefit that involves acapacity, singly or in combination with other assets, to contribute directly or indirectly to future netcash inflow, then the costs are classified as mine development costs and the Company discloses therelated ore reserves.
Exploration—
Tangible and intangible costs incurred in the search for mineral properties are charged againstearnings when incurred.
Income taxes—
Provisions for income taxes are based on taxes payable or refundable for the current year anddeferred taxes on temporary differences between the amount of taxable income and pretax financialincome and between the tax bases of assets and liabilities and their reported amounts in the financialstatements. Deferred tax assets and liabilities are included in the financial statements at currentlyenacted income tax rates applicable to the period in which the deferred tax assets and liabilities areexpected to be realized and settled as prescribed in ASC 740 ‘‘Income taxes.’’ As changes in tax laws orrates are enacted, deferred tax assets and liabilities are adjusted through the provision for income taxes.Deferred income tax assets are reduced by any benefits that, in the opinion of management, are morelikely not to be realized.
The Company’s operations involve dealing with uncertainties and judgments in the application ofcomplex tax regulations in multiple jurisdictions. The final taxes paid are dependent upon many factors,including negotiations with taxing authorities in various jurisdictions and resolution of disputes arisingfrom federal, state, and international tax audits. The Company recognizes potential liabilities andrecords tax liabilities for anticipated tax audit issues in the U.S. and other tax jurisdictions based on itsestimate of whether, and the extent to which, additional taxes will be due. The Company follows theguidance of ASC 740 ‘‘Income taxes’’ to record these liabilities. (See Note 7 ‘‘Income taxes’’ of theconsolidated financial statements for additional information). The Company adjusts these reserves inlight of changing facts and circumstances; however, due to the complexity of some of theseuncertainties, the ultimate resolution may result in a payment that is materially different from theCompany’s current estimate of the tax liabilities. If its estimate of tax liabilities proves to be less than
110
SOUTHERN COPPER CORPORATION AND SUBSIDIARIES
NOTES TO CONSOLIDATED FINANCIAL STATEMENTS (Continued)
NOTE 2—SUMMARY OF SIGNIFICANT ACCOUNTING POLICIES: (Continued)
the ultimate assessment, an additional charge to expense would result. If payment of these amountsultimately proves to be less than the recorded amounts, the reversal of the liabilities would result in taxbenefits being recognized in the period when the Company determines the liabilities are no longernecessary.
The Company classifies income tax-related interest and penalties as income taxes in the financialstatements, as well as interest and penalties, if any, related to unrecognized tax benefits.
On December 22, 2017, the U.S. government enacted the ‘‘Tax Cuts and Jobs Act’’ (the ‘‘Act’’).The Act contains numerous provisions, the following of which most significantly impact the Company:(i) a decrease in the corporate tax rate from 35% to 21%; (ii) a transition of the U.S. taxation ofinternational operation from a worldwide system to a quasi-territorial system and a one-time transitiontax on the mandatory deemed repatriation of cumulative foreign earnings as of December 31, 2017,(iii) generally eliminates U.S. federal income taxes on dividends from foreign subsidiaries, requiring acurrent inclusion in U.S. federal taxable income of certain earnings of controlled foreign corporationsand (iv) limitations on the use of foreign tax credits to reduce the U.S. income tax liability.
The U.S. Securities and Exchange Commission (‘‘SEC’’) issued Staff Accounting Bulletin No. 118(‘‘SAB 118’’), which provides guidance on accounting for the tax effects of the Act. The Company hasadopted SAB 118. Accordingly, the provisions of the Act deemed most relevant to the Company havebeen considered in preparation of its financial statements as of December 31, 2017 based on theCompany’s best estimate. See further disclosure regarding the impacts of the Act and the adoption ofSAB 118 in Note 7 to the accompanying consolidated financial statements.
Foreign exchange—
The Company’s functional currency is the U.S. dollar. As required by local law, both the PeruvianBranch and Minera Mexico maintain their books of accounts in Peruvian soles and Mexican pesos,respectively.
Foreign currency assets and liabilities are remeasured into U.S. dollars at current exchange rates,except for non-monetary items such as inventory, property, intangible assets and other assets which areremeasured at historical exchange rates. Revenues and expenses are generally translated at actualexchange rates in effect during the period, except for those items related to balance sheet amounts thatare remeasured at historical exchange rates. Gains and losses from foreign currency remeasurement areincluded in earnings of the period.
Gains and (losses) resulting from foreign currency transactions are included in ‘‘Cost of sales(exclusive of depreciation, amortization and depletion).’’
Asset impairments—
The Company evaluates long-term assets when events or changes in economic circumstancesindicate that the carrying amount of such assets may not be recoverable. These evaluations are basedon business plans that are prepared using a time horizon that is reflective of the Company’sexpectations of metal prices over its business cycle. The Company is currently using a long-termaverage copper price and an average molybdenum price for impairment tests, reflective of what theCompany believes is the lower level of the current price environment. The results of its impairment
111
SOUTHERN COPPER CORPORATION AND SUBSIDIARIES
NOTES TO CONSOLIDATED FINANCIAL STATEMENTS (Continued)
NOTE 2—SUMMARY OF SIGNIFICANT ACCOUNTING POLICIES: (Continued)
tests using these long-term copper and molybdenum prices show no impairment in the carrying value oftheir assets.
In recent years testing using assumptions for long-term average prices have resulted in stricterevaluation for impairment analysis than would the higher three year average prices for copper andmolybdenum prices. Should this situation reverse in the future with three year average prices below thelong-term price assumption, the Company would assess the need to use the three year average prices inits evaluations. The Company uses an estimate of the future undiscounted net cash flows of the relatedasset or asset group over the remaining life to measure whether the assets are recoverable andmeasures any impairment by reference to fair value.
Other comprehensive income—
Comprehensive income represents changes in equity during a period, except those resulting frominvestments by owners and distributions to owners. During the fiscal years ended December 31, 2017,2016 and 2015, the components of ‘‘other comprehensive income (loss)’’ were, the unrecognized gain(loss) on employee benefit obligations and foreign currency translation adjustments.
Business segments—
Company management views Southern Copper as having three reportable segments and manages iton the basis of these segments. The segments identified by the Company are: 1) the Peruvianoperations, which include the two open-pit copper mines in Peru and the plants and services supportingsuch mines, 2) the Mexican open-pit copper mines, which include La Caridad and Buenavista minecomplexes and their supporting facilities and 3) the Mexican underground mining operations, whichinclude five underground mines that produce zinc, lead, copper, silver and gold, a coal mine and a zincrefinery. Please see Note 17 ‘‘Segments and Related Information.’’
Senior management of the Company focus on operating income as measure of performance toevaluate different segments, and to make decisions to allocate resources to the reported segments. Thisis a common measure in the mining industry.
ADOPTION OF REVENUE RECOGNITION STANDARD
In May 2014, the FASB issued ASU 2014-09 ‘‘Revenue from Contracts with Customers’’ (Topic606). The objective of the new revenue standard is to provide a single comprehensive revenuerecognition model for all contracts with customers to improve comparability within industries, acrossindustries and across capital markets.
The core principle of the standard is that the Company should recognize revenue to represent thetransfer of promised goods or services to customers in an amount that reflects the consideration towhich the Company expects to be entitled in exchange for those goods or services.
The Company should apply the following five steps to achieve the core principle:
Step 1: Identify the contract(s) with a customer.Step 2: Identify the performance obligations (promises) in the contract.Step 3: Determine the transaction price.
112
SOUTHERN COPPER CORPORATION AND SUBSIDIARIES
NOTES TO CONSOLIDATED FINANCIAL STATEMENTS (Continued)
NOTE 2—SUMMARY OF SIGNIFICANT ACCOUNTING POLICIES: (Continued)
Step 4: Allocate the transaction price to the performance obligations in the contract.Step 5: Recognize revenue when (or as) the Company satisfies a performance obligation.
The guidance also specifies the accounting for some costs to obtain or fulfill a contract with acustomer. Additionally, the Company should disclose sufficient qualitative and quantitative informationto enable users of financial statements to understand the nature, amount, timing, and uncertainty ofrevenue and cash flows arising from contracts with customers.
In March 2016, The FASB issued ASU 2016-08 Revenue from Contracts with Customers—(Topic606) Principal versus Agent Considerations (Reporting Revenue Gross versus Net). This updateclarifies the implementation guidance on principal versus agent considerations. When another party isinvolved in providing goods or services to a customer, an entity is required to determine whether thenature of its promise is to provide the specified good or service itself (that is, the entity is a principal)or to arrange for that good or service to be provided by the other party (that is, the entity is an agent).
This revenue standard is effective for the first interim period within annual reporting periodsbeginning after December 15, 2017, and early adoption is not permitted. The Company has adopted thenew guidance effective January 1, 2018, applying the modified retrospective approach. Under thisapproach, the results for reporting periods beginning after January 1, 2018 will be presented in theconsolidated financial statements under the guidance, while prior period amounts will not be adjustedand will continue to be reported under the guidance in effect for those periods. Upon adoption by theCompany, no cumulative effect adjustment is required to be recognized at January 1, 2018, as theadoption of the standard has not resulted in a change to the way the Company recognizes its revenue.The Company will apply the related disclosure requirements of the new standard beginning in 2018.
OTHER NEW ACCOUNTING STANDARDS
In January 2016, The FASB issued ASU 2016-01 ‘‘Financial instruments—Overall (Subtopic825-10): Recognition and Measurement of Financial Assets and Financial Liabilities’’ which requiresentities to measure equity investments that do not result in consolidation and are not accounted forunder the equity method at fair value and to recognize any changes in fair value in net income. Thisupdate also includes certain disclosure requirements. This update is effective in fiscal years, includinginterim periods, beginning after December 15, 2017, and upon adoption, an entity should apply theamendments with the cumulative effect of initially applying the guidance recognized at January 1, 2018.Early adoption is not permitted. The Company has completed its assessment of the adoption of thisstandard and has determined that it will not have a material impact on its consolidated financialinformation.
On February 25, 2016, the FASB issued ASU 2016-02 ‘‘Leases’’ (Topic 842). This Updatesignificantly modifies the accounting model of leases for lessees; as it requires them to recognize assetsand liabilities in the balance sheet for virtually all leases. However, the classification of leases asfinance leases or operating leases is maintained for lessees. In addition, for leases with a term of12 months or less, a lessee can elect by class of underlying asset not to record assets and liabilities onthe balance sheet, and recognize lease expense on a straight-line basis over the lease term.
The lessor accounting model for leases remains mostly unchanged from previous guidance, exceptfor specific profit recognition requirements which were modified in order to align them to the new
113
SOUTHERN COPPER CORPORATION AND SUBSIDIARIES
NOTES TO CONSOLIDATED FINANCIAL STATEMENTS (Continued)
NOTE 2—SUMMARY OF SIGNIFICANT ACCOUNTING POLICIES: (Continued)
revenue recognition standard issued by the FASB, and the lease classification criteria, to ensureconsistency with those for a lessee.
The amendments in this Update are effective for public business entities for fiscal years, andinterim periods within those fiscal years, beginning after December 15, 2018 and early adoption ispermitted. The Company is evaluating the impact of the adoption of this new standard on theconsolidated financial information.
In June 2016, the FASB issued ASU 2016-13 ‘‘Financial Instruments—Credit Losses (Topic 326):Measurement of Credit Losses on Financial Instruments’’ This ASU amends guidance on reportingcredit losses for assets held at amortized cost basis and available for sale debt securities and requires afinancial asset (or a group of financial assets) measured at amortized cost basis to be presented at thenet amount expected to be collected. The allowance for credit losses is a valuation account that isdeducted from the amortized cost basis of the financial asset(s) to present the net carrying value at theamount expected to be collected on the financial asset. For available for sale debt securities, creditlosses should be measured in a manner similar to current GAAP, however Topic 326 will require thatcredit losses be presented as an allowance rather than as a write-down.
This update is effective for fiscal years beginning after December 15, 2019, including interimperiods within those fiscal years. The Company is evaluating the impact of the adoption of this newstandard on the consolidated financial information.
Other ASUs issued by the FASB that are pending adoption as of December 31, 2017 are notanticipated to have a significant impact on the Company’s consolidated financial statements.
NOTE 3—SHORT-TERM INVESTMENTS:
Short-term investments were as follows ($ in millions):
AtDecember 31,
2017 2016
Trading securities . . . . . . . . . . . . . . . . . . . . . . . . . . . . . . . . . . . . . . $49.5 $49.2Weighted average interest rate . . . . . . . . . . . . . . . . . . . . . . . . . . . . . 1.8% 2.2%
Available-for-sale . . . . . . . . . . . . . . . . . . . . . . . . . . . . . . . . . . . . . . $ 1.0 $ 2.1Weighted average interest rate . . . . . . . . . . . . . . . . . . . . . . . . . . . . . 0.70% 0.78%
Total . . . . . . . . . . . . . . . . . . . . . . . . . . . . . . . . . . . . . . . . . . . . . . . $50.5 $51.3
Trading securities consist of bonds issued by public companies and are publicly traded. Eachfinancial instrument is independent of the others. The Company has the intention to sell these bonds inthe short-term.
Available-for-sale investments consist of securities issued by public companies. Each security isindependent of the others and, as of December 31, 2017 and 2016, included corporate bonds and assetand mortgage backed obligations. As of December 31, 2017 and 2016, gross unrealized gains and losseson available-for-sale securities were not material.
114
SOUTHERN COPPER CORPORATION AND SUBSIDIARIES
NOTES TO CONSOLIDATED FINANCIAL STATEMENTS (Continued)
NOTE 3—SHORT-TERM INVESTMENTS: (Continued)
Related to these investments the Company earned interest, which was recorded as interest incomein the consolidated statement of earnings. Also the Company redeemed some of these securities andrecognized gains (losses) due to changes in fair value, which were recorded as other income (expense)in the consolidated statement of earnings.
The following table summarizes the activity of these investments by category (in millions):
Years endedDecember 31,
2017 2016
Trading:Interest earned . . . . . . . . . . . . . . . . . . . . . . . . . . . . . . . . . . . . . . . . . $0.7 $1.5Unrealized gain (loss) at December 31, . . . . . . . . . . . . . . . . . . . . . . . $0.1 $0.4
Available-for-sale:Interest earned . . . . . . . . . . . . . . . . . . . . . . . . . . . . . . . . . . . . . . . . . (*) (*)Investment redeemed . . . . . . . . . . . . . . . . . . . . . . . . . . . . . . . . . . . . $1.1 $1.2
(*) Less than $0.1 million
At December 31, 2017 and 2016, contractual maturities of the available-for-sale debt securities areas follows (in millions):
2017 2016
One year or less . . . . . . . . . . . . . . . . . . . . . . . . . . . . . . . . . . . . . . . . . $ — $ —Maturing after one year through five years . . . . . . . . . . . . . . . . . . . . . . — —Maturing after five years through ten years . . . . . . . . . . . . . . . . . . . . . — —Due after 10 years . . . . . . . . . . . . . . . . . . . . . . . . . . . . . . . . . . . . . . . 1.0 2.1
Total debt securities . . . . . . . . . . . . . . . . . . . . . . . . . . . . . . . . . . . . . . $1.0 $2.1
NOTE 4—INVENTORIES:
At December 31,
2017 2016(in millions)
Inventory, current:Metals at average cost:
Finished goods . . . . . . . . . . . . . . . . . . . . . . . . . . . . . . . . . . $ 48.8 $ 130.5Work-in-process . . . . . . . . . . . . . . . . . . . . . . . . . . . . . . . . . 308.0 231.6Ore stockpiles on leach pads . . . . . . . . . . . . . . . . . . . . . . . . 320.9 310.9
Supplies at average cost . . . . . . . . . . . . . . . . . . . . . . . . . . . . . 364.2 337.4
Total current inventory . . . . . . . . . . . . . . . . . . . . . . . . . . . . . . $1,041.9 $1,010.4
Inventory, long-term:Ore stockpiles on leach pads . . . . . . . . . . . . . . . . . . . . . . . . . . $ 977.4 $ 806.9
115
SOUTHERN COPPER CORPORATION AND SUBSIDIARIES
NOTES TO CONSOLIDATED FINANCIAL STATEMENTS (Continued)
NOTE 4—INVENTORIES: (Continued)
Total leaching costs added as long-term inventory of ore stockpiles in leach pads amounted to$513.9 million, $439.0 million and $506.9 million in 2017, 2016 and 2015, respectively. Long-termleaching inventories recognized as cost of sales amounted to $333.5 million, $316.6 million and$274.1 million in 2017, 2016 and 2015, respectively.
NOTE 5—PROPERTY:
At December 31,
2017 2016(in millions)
Buildings and equipment . . . . . . . . . . . . . . . . . . . . . . . . . . . $12,552.8 $12,177.1Construction in progress . . . . . . . . . . . . . . . . . . . . . . . . . . . 2,301.9 1,811.8Mine development . . . . . . . . . . . . . . . . . . . . . . . . . . . . . . . . 267.9 259.1Mineral assets . . . . . . . . . . . . . . . . . . . . . . . . . . . . . . . . . . . 83.2 83.2Land, other than mineral . . . . . . . . . . . . . . . . . . . . . . . . . . . 218.4 142.1
Total property . . . . . . . . . . . . . . . . . . . . . . . . . . . . . . . . . . . 15,424.2 14,473.3Accumulated depreciation, amortization and depletion . . . . . (6,324.6) (5,706.8)
Total property and mine development, net . . . . . . . . . . . . . . $ 9,099.6 $ 8,766.5
Construction in progress increased in 2017 as a result of the spending on the Company expansionprojects. For more detailed information, please see Item 7 ‘‘Management Discussion and Analysis ofFinancial Condition and Results of Operations—Capital Investment Program.’’
Depreciation and depletion expense for the years ended December 31, 2017, 2016 and 2015,amounted to $665.2 million, $639.1 million and $503.6 million, respectively.
NOTE 6—INTANGIBLE ASSETS:
At December 31,
2017 2016(in millions)
Mining concessions . . . . . . . . . . . . . . . . . . . . . . . . . . . . . . . . . . . $121.2 $121.2Mine engineering and development studies . . . . . . . . . . . . . . . . . . 19.8 19.8Software . . . . . . . . . . . . . . . . . . . . . . . . . . . . . . . . . . . . . . . . . . . 49.0 44.8
190.0 185.8Accumulated amortization:Mining concessions . . . . . . . . . . . . . . . . . . . . . . . . . . . . . . . . . . . (36.6) (35.6)Mine engineering and development studies . . . . . . . . . . . . . . . . . . (15.3) (14.8)Software . . . . . . . . . . . . . . . . . . . . . . . . . . . . . . . . . . . . . . . . . . . (27.5) (23.1)
(79.4) (73.5)
Goodwill . . . . . . . . . . . . . . . . . . . . . . . . . . . . . . . . . . . . . . . . . . . 41.9 41.9
Intangible assets, net . . . . . . . . . . . . . . . . . . . . . . . . . . . . . . . . . . $152.5 $154.2
116
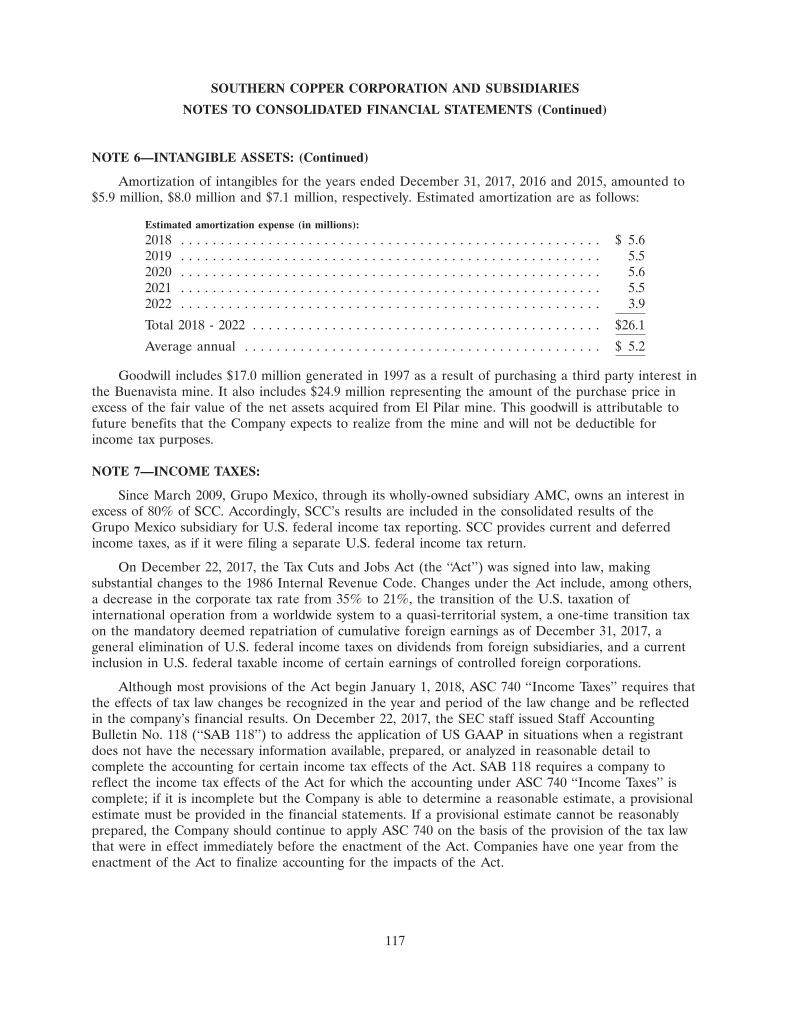
SOUTHERN COPPER CORPORATION AND SUBSIDIARIES
NOTES TO CONSOLIDATED FINANCIAL STATEMENTS (Continued)
NOTE 6—INTANGIBLE ASSETS: (Continued)
Amortization of intangibles for the years ended December 31, 2017, 2016 and 2015, amounted to$5.9 million, $8.0 million and $7.1 million, respectively. Estimated amortization are as follows:
Estimated amortization expense (in millions):
2018 . . . . . . . . . . . . . . . . . . . . . . . . . . . . . . . . . . . . . . . . . . . . . . . . . . . . . $ 5.62019 . . . . . . . . . . . . . . . . . . . . . . . . . . . . . . . . . . . . . . . . . . . . . . . . . . . . . 5.52020 . . . . . . . . . . . . . . . . . . . . . . . . . . . . . . . . . . . . . . . . . . . . . . . . . . . . . 5.62021 . . . . . . . . . . . . . . . . . . . . . . . . . . . . . . . . . . . . . . . . . . . . . . . . . . . . . 5.52022 . . . . . . . . . . . . . . . . . . . . . . . . . . . . . . . . . . . . . . . . . . . . . . . . . . . . . 3.9
Total 2018 - 2022 . . . . . . . . . . . . . . . . . . . . . . . . . . . . . . . . . . . . . . . . . . . . $26.1
Average annual . . . . . . . . . . . . . . . . . . . . . . . . . . . . . . . . . . . . . . . . . . . . . $ 5.2
Goodwill includes $17.0 million generated in 1997 as a result of purchasing a third party interest inthe Buenavista mine. It also includes $24.9 million representing the amount of the purchase price inexcess of the fair value of the net assets acquired from El Pilar mine. This goodwill is attributable tofuture benefits that the Company expects to realize from the mine and will not be deductible forincome tax purposes.
NOTE 7—INCOME TAXES:
Since March 2009, Grupo Mexico, through its wholly-owned subsidiary AMC, owns an interest inexcess of 80% of SCC. Accordingly, SCC’s results are included in the consolidated results of theGrupo Mexico subsidiary for U.S. federal income tax reporting. SCC provides current and deferredincome taxes, as if it were filing a separate U.S. federal income tax return.
On December 22, 2017, the Tax Cuts and Jobs Act (the ‘‘Act’’) was signed into law, makingsubstantial changes to the 1986 Internal Revenue Code. Changes under the Act include, among others,a decrease in the corporate tax rate from 35% to 21%, the transition of the U.S. taxation ofinternational operation from a worldwide system to a quasi-territorial system, a one-time transition taxon the mandatory deemed repatriation of cumulative foreign earnings as of December 31, 2017, ageneral elimination of U.S. federal income taxes on dividends from foreign subsidiaries, and a currentinclusion in U.S. federal taxable income of certain earnings of controlled foreign corporations.
Although most provisions of the Act begin January 1, 2018, ASC 740 ‘‘Income Taxes’’ requires thatthe effects of tax law changes be recognized in the year and period of the law change and be reflectedin the company’s financial results. On December 22, 2017, the SEC staff issued Staff AccountingBulletin No. 118 (‘‘SAB 118’’) to address the application of US GAAP in situations when a registrantdoes not have the necessary information available, prepared, or analyzed in reasonable detail tocomplete the accounting for certain income tax effects of the Act. SAB 118 requires a company toreflect the income tax effects of the Act for which the accounting under ASC 740 ‘‘Income Taxes’’ iscomplete; if it is incomplete but the Company is able to determine a reasonable estimate, a provisionalestimate must be provided in the financial statements. If a provisional estimate cannot be reasonablyprepared, the Company should continue to apply ASC 740 on the basis of the provision of the tax lawthat were in effect immediately before the enactment of the Act. Companies have one year from theenactment of the Act to finalize accounting for the impacts of the Act.
117
SOUTHERN COPPER CORPORATION AND SUBSIDIARIES
NOTES TO CONSOLIDATED FINANCIAL STATEMENTS (Continued)
NOTE 7—INCOME TAXES: (Continued)
The Company adopted SAB 118 and accordingly, its accounting for the effect of the Act is basedon its best estimate, which may require adjustment in 2018. However, the Company was able to makereasonable estimates of certain effects and, therefore, recorded a provisional $785.9 million non-cashtax expense for the estimated effects of the Act. These adjustments were related to the valuationallowances for foreign tax credits and other deferred tax assets, valuation of our net deferred tax assetsdue to the rate change from 35% to 21% and the transition tax on the repatriation of cumulativeforeign earnings . The ultimate impact of the Act may differ from these provisional amounts, possiblymaterially. After the Company files its 2017 U.S. federal income tax return and finalizes certain taxpositions it will conclude whether further adjustments are required to its net deferred tax assets orliabilities, current year foreign tax credits and any liability associated with the one-time mandatory taxon the repatriation of foreign earnings.
The Act also provides for two new taxes that become effective in tax years beginning afterDecember 31, 2017: the Global Intangible Low Tax Income or GILTI tax and the Base ErosionAnti-Abuse or BEAT tax. The GILTI provisions impose a tax on foreign income in excess of a deemedreturn on tangible assets of foreign corporations. FASB guidance released in January 2018 indicatesthat either accounting for deferred taxes related to GILTI inclusions or treating any taxes on GILTIinclusions as period cost are both acceptable methods subject to an accounting policy election. Ourselection of an accounting policy with respect to the new GILTI tax rules will depend, in part, onanalyzing our global income to determine whether we expect to have future U.S. inclusions in taxableincome related to GILTI and, if so, what the impact is expected to be. Because whether we expect tohave future US inclusions in taxable income related to GILTI depends on not only our currentstructure and estimated future results of global operations but also our intent and ability to modify ourstructure and/or our business, we are not yet able to reasonably estimate the effect of this provision ofthe Tax Act. Therefore, we have not made any adjustments related to potential GILTI tax in ourfinancial statements and have not made a policy decision regarding whether to record deferred taxes onGILTI. The BEAT tax is a 5% minimum tax for tax years beginning in 2018 (12.5% after 2025) and iscalculated on a base equal to the Company’s income determined without the tax benefit arising frombase erosion payments. The erosion payments are a specifically defined set of deductible expenses.However, the provisions are unclear as to which payments should be characterized as base erosionpayments. The tax reform prescribes that the Secretary issue Regulations to prevent the avoidance ofthe BEAT tax, which have still not been finalized. Additionally, the Company needs to evaluate anyinteraction between the GILTI and the BEAT taxes. Therefore, the Company is still is in the process ofanalyzing the provisions of these taxes and the effect they may or may not have on future results andfinancial reporting. Accordingly, for 2017, there is no change made to the accounting under ASC 740and the Company is following current tax law with respect to these specific items.
118
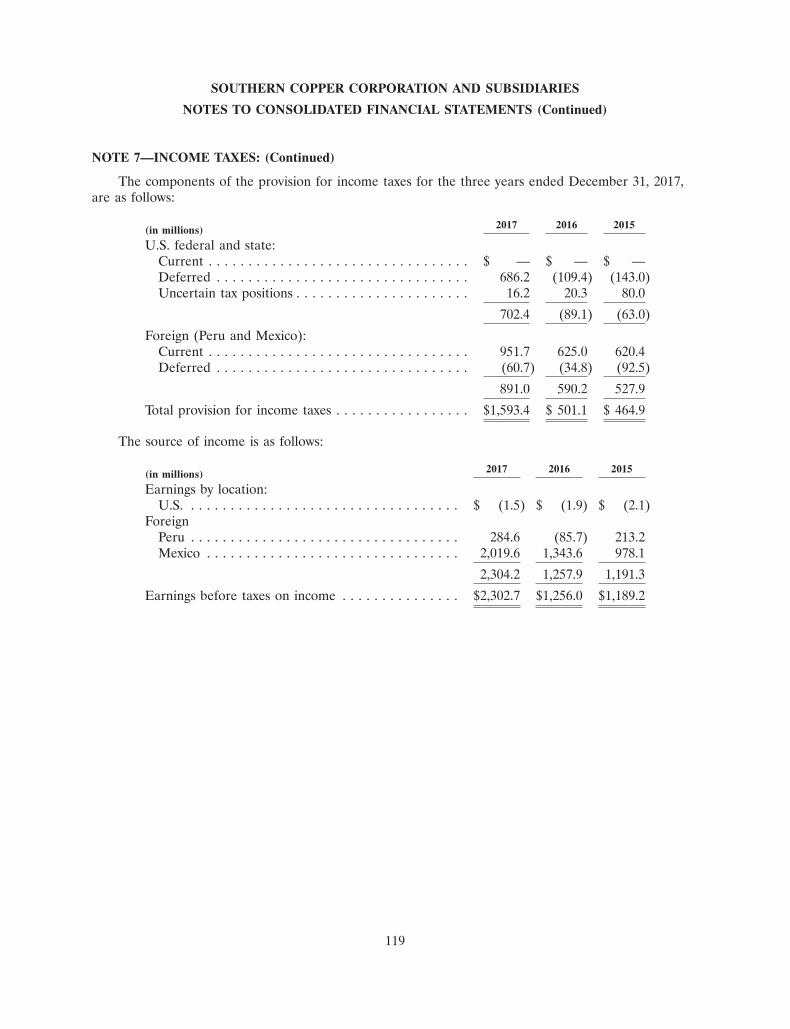
SOUTHERN COPPER CORPORATION AND SUBSIDIARIES
NOTES TO CONSOLIDATED FINANCIAL STATEMENTS (Continued)
NOTE 7—INCOME TAXES: (Continued)
The components of the provision for income taxes for the three years ended December 31, 2017,are as follows:
2017 2016 2015(in millions)
U.S. federal and state:Current . . . . . . . . . . . . . . . . . . . . . . . . . . . . . . . . . $ — $ — $ —Deferred . . . . . . . . . . . . . . . . . . . . . . . . . . . . . . . . 686.2 (109.4) (143.0)Uncertain tax positions . . . . . . . . . . . . . . . . . . . . . . 16.2 20.3 80.0
702.4 (89.1) (63.0)
Foreign (Peru and Mexico):Current . . . . . . . . . . . . . . . . . . . . . . . . . . . . . . . . . 951.7 625.0 620.4Deferred . . . . . . . . . . . . . . . . . . . . . . . . . . . . . . . . (60.7) (34.8) (92.5)
891.0 590.2 527.9
Total provision for income taxes . . . . . . . . . . . . . . . . . $1,593.4 $ 501.1 $ 464.9
The source of income is as follows:
2017 2016 2015(in millions)
Earnings by location:U.S. . . . . . . . . . . . . . . . . . . . . . . . . . . . . . . . . . . $ (1.5) $ (1.9) $ (2.1)
ForeignPeru . . . . . . . . . . . . . . . . . . . . . . . . . . . . . . . . . . 284.6 (85.7) 213.2Mexico . . . . . . . . . . . . . . . . . . . . . . . . . . . . . . . . 2,019.6 1,343.6 978.1
2,304.2 1,257.9 1,191.3
Earnings before taxes on income . . . . . . . . . . . . . . . $2,302.7 $1,256.0 $1,189.2
119
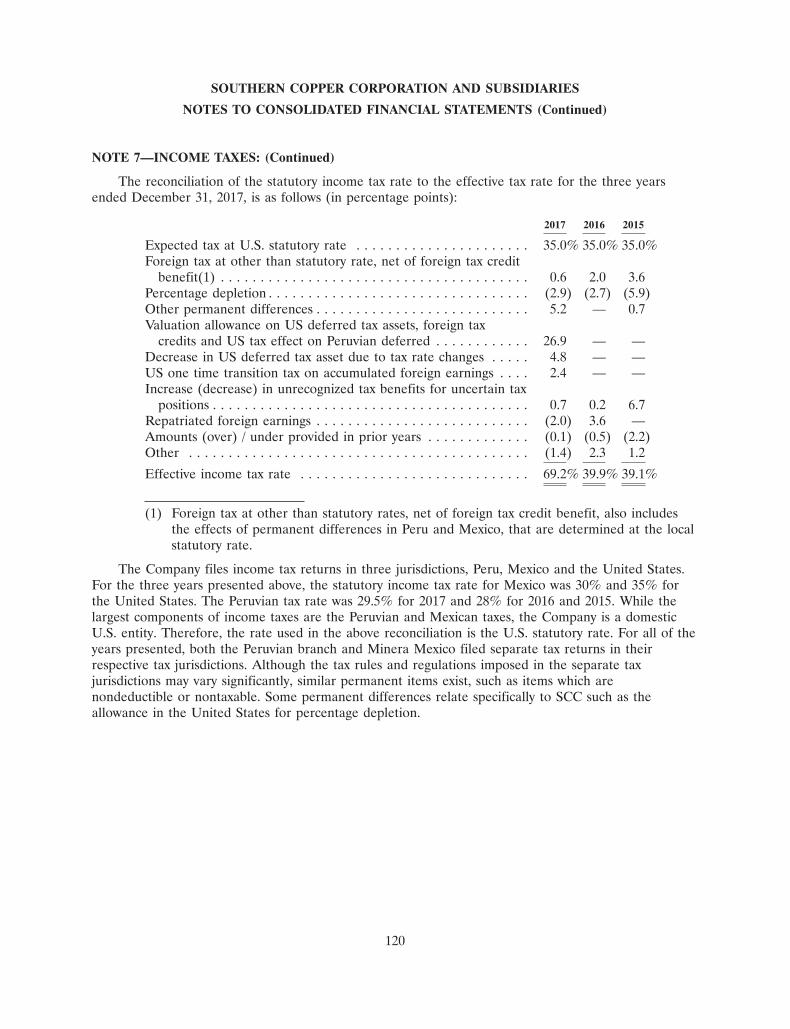
SOUTHERN COPPER CORPORATION AND SUBSIDIARIES
NOTES TO CONSOLIDATED FINANCIAL STATEMENTS (Continued)
NOTE 7—INCOME TAXES: (Continued)
The reconciliation of the statutory income tax rate to the effective tax rate for the three yearsended December 31, 2017, is as follows (in percentage points):
2017 2016 2015
Expected tax at U.S. statutory rate . . . . . . . . . . . . . . . . . . . . . . 35.0% 35.0% 35.0%Foreign tax at other than statutory rate, net of foreign tax credit
benefit(1) . . . . . . . . . . . . . . . . . . . . . . . . . . . . . . . . . . . . . . . 0.6 2.0 3.6Percentage depletion . . . . . . . . . . . . . . . . . . . . . . . . . . . . . . . . . (2.9) (2.7) (5.9)Other permanent differences . . . . . . . . . . . . . . . . . . . . . . . . . . . 5.2 — 0.7Valuation allowance on US deferred tax assets, foreign tax
credits and US tax effect on Peruvian deferred . . . . . . . . . . . . 26.9 — —Decrease in US deferred tax asset due to tax rate changes . . . . . 4.8 — —US one time transition tax on accumulated foreign earnings . . . . 2.4 — —Increase (decrease) in unrecognized tax benefits for uncertain tax
positions . . . . . . . . . . . . . . . . . . . . . . . . . . . . . . . . . . . . . . . . 0.7 0.2 6.7Repatriated foreign earnings . . . . . . . . . . . . . . . . . . . . . . . . . . . (2.0) 3.6 —Amounts (over) / under provided in prior years . . . . . . . . . . . . . (0.1) (0.5) (2.2)Other . . . . . . . . . . . . . . . . . . . . . . . . . . . . . . . . . . . . . . . . . . . (1.4) 2.3 1.2
Effective income tax rate . . . . . . . . . . . . . . . . . . . . . . . . . . . . . 69.2% 39.9% 39.1%
(1) Foreign tax at other than statutory rates, net of foreign tax credit benefit, also includesthe effects of permanent differences in Peru and Mexico, that are determined at the localstatutory rate.
The Company files income tax returns in three jurisdictions, Peru, Mexico and the United States.For the three years presented above, the statutory income tax rate for Mexico was 30% and 35% forthe United States. The Peruvian tax rate was 29.5% for 2017 and 28% for 2016 and 2015. While thelargest components of income taxes are the Peruvian and Mexican taxes, the Company is a domesticU.S. entity. Therefore, the rate used in the above reconciliation is the U.S. statutory rate. For all of theyears presented, both the Peruvian branch and Minera Mexico filed separate tax returns in theirrespective tax jurisdictions. Although the tax rules and regulations imposed in the separate taxjurisdictions may vary significantly, similar permanent items exist, such as items which arenondeductible or nontaxable. Some permanent differences relate specifically to SCC such as theallowance in the United States for percentage depletion.
120
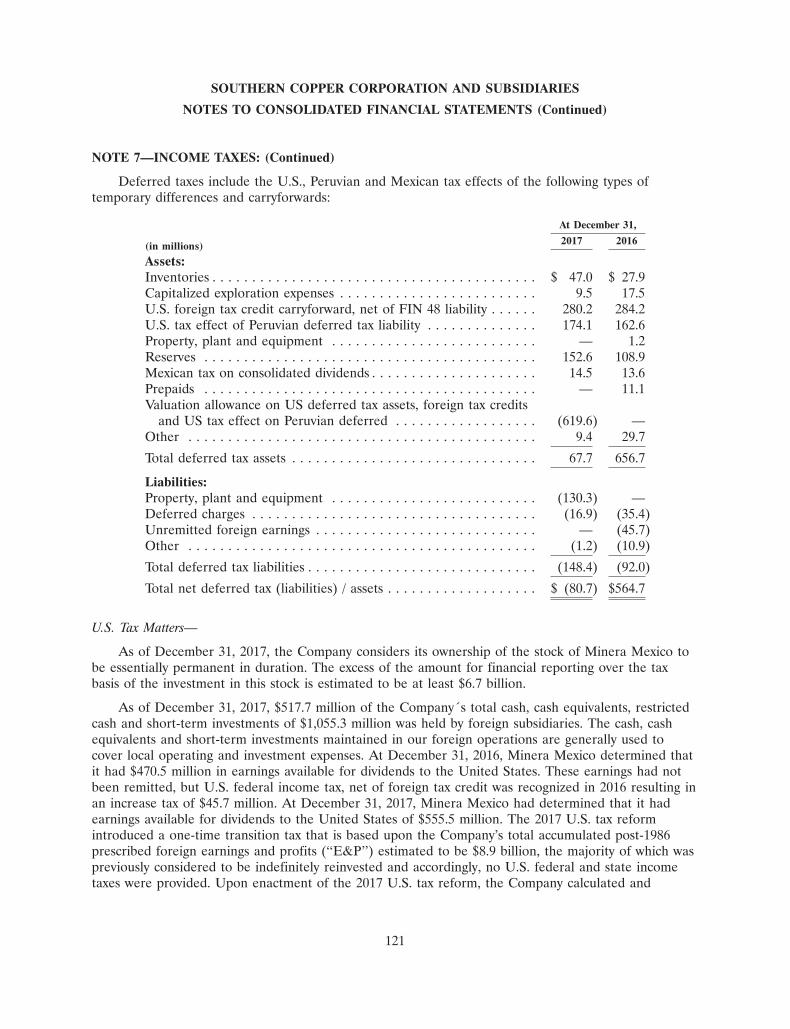
SOUTHERN COPPER CORPORATION AND SUBSIDIARIES
NOTES TO CONSOLIDATED FINANCIAL STATEMENTS (Continued)
NOTE 7—INCOME TAXES: (Continued)
Deferred taxes include the U.S., Peruvian and Mexican tax effects of the following types oftemporary differences and carryforwards:
At December 31,
2017 2016(in millions)
Assets:Inventories . . . . . . . . . . . . . . . . . . . . . . . . . . . . . . . . . . . . . . . . . $ 47.0 $ 27.9Capitalized exploration expenses . . . . . . . . . . . . . . . . . . . . . . . . . 9.5 17.5U.S. foreign tax credit carryforward, net of FIN 48 liability . . . . . . 280.2 284.2U.S. tax effect of Peruvian deferred tax liability . . . . . . . . . . . . . . 174.1 162.6Property, plant and equipment . . . . . . . . . . . . . . . . . . . . . . . . . . — 1.2Reserves . . . . . . . . . . . . . . . . . . . . . . . . . . . . . . . . . . . . . . . . . . 152.6 108.9Mexican tax on consolidated dividends . . . . . . . . . . . . . . . . . . . . . 14.5 13.6Prepaids . . . . . . . . . . . . . . . . . . . . . . . . . . . . . . . . . . . . . . . . . . — 11.1Valuation allowance on US deferred tax assets, foreign tax credits
and US tax effect on Peruvian deferred . . . . . . . . . . . . . . . . . . (619.6) —Other . . . . . . . . . . . . . . . . . . . . . . . . . . . . . . . . . . . . . . . . . . . . 9.4 29.7
Total deferred tax assets . . . . . . . . . . . . . . . . . . . . . . . . . . . . . . . 67.7 656.7
Liabilities:Property, plant and equipment . . . . . . . . . . . . . . . . . . . . . . . . . . (130.3) —Deferred charges . . . . . . . . . . . . . . . . . . . . . . . . . . . . . . . . . . . . (16.9) (35.4)Unremitted foreign earnings . . . . . . . . . . . . . . . . . . . . . . . . . . . . — (45.7)Other . . . . . . . . . . . . . . . . . . . . . . . . . . . . . . . . . . . . . . . . . . . . (1.2) (10.9)
Total deferred tax liabilities . . . . . . . . . . . . . . . . . . . . . . . . . . . . . (148.4) (92.0)
Total net deferred tax (liabilities) / assets . . . . . . . . . . . . . . . . . . . $ (80.7) $564.7
U.S. Tax Matters—
As of December 31, 2017, the Company considers its ownership of the stock of Minera Mexico tobe essentially permanent in duration. The excess of the amount for financial reporting over the taxbasis of the investment in this stock is estimated to be at least $6.7 billion.
As of December 31, 2017, $517.7 million of the Company´s total cash, cash equivalents, restrictedcash and short-term investments of $1,055.3 million was held by foreign subsidiaries. The cash, cashequivalents and short-term investments maintained in our foreign operations are generally used tocover local operating and investment expenses. At December 31, 2016, Minera Mexico determined thatit had $470.5 million in earnings available for dividends to the United States. These earnings had notbeen remitted, but U.S. federal income tax, net of foreign tax credit was recognized in 2016 resulting inan increase tax of $45.7 million. At December 31, 2017, Minera Mexico had determined that it hadearnings available for dividends to the United States of $555.5 million. The 2017 U.S. tax reformintroduced a one-time transition tax that is based upon the Company’s total accumulated post-1986prescribed foreign earnings and profits (‘‘E&P’’) estimated to be $8.9 billion, the majority of which waspreviously considered to be indefinitely reinvested and accordingly, no U.S. federal and state incometaxes were provided. Upon enactment of the 2017 U.S. tax reform, the Company calculated and
121
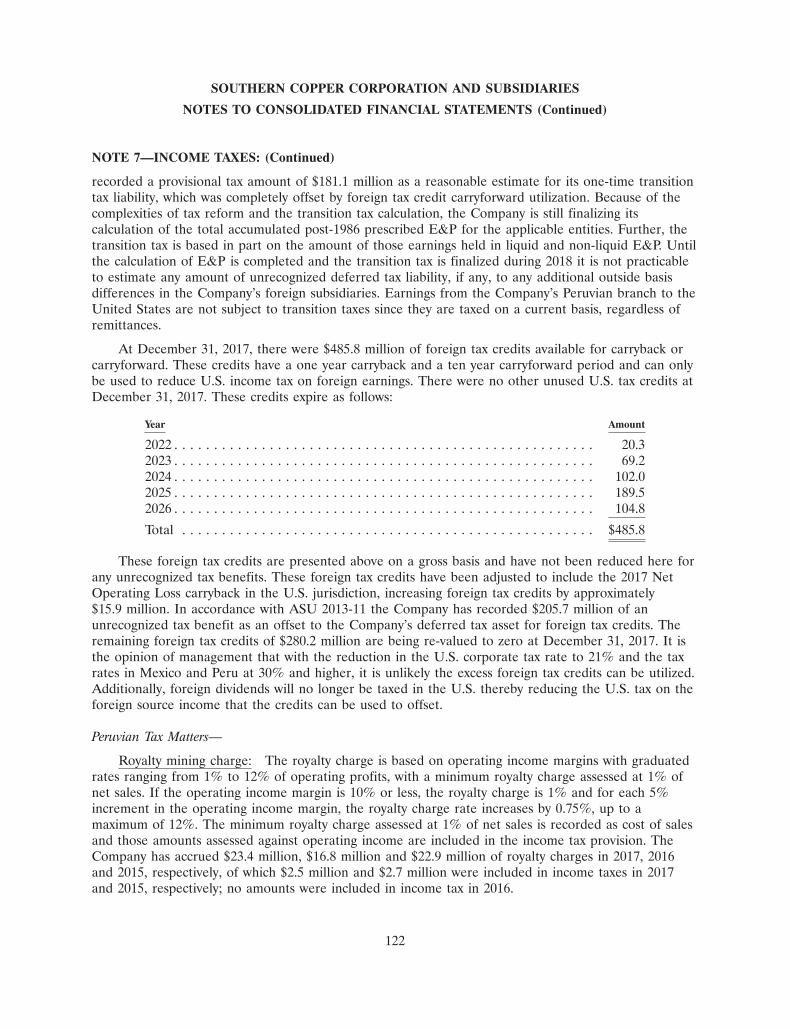
SOUTHERN COPPER CORPORATION AND SUBSIDIARIES
NOTES TO CONSOLIDATED FINANCIAL STATEMENTS (Continued)
NOTE 7—INCOME TAXES: (Continued)
recorded a provisional tax amount of $181.1 million as a reasonable estimate for its one-time transitiontax liability, which was completely offset by foreign tax credit carryforward utilization. Because of thecomplexities of tax reform and the transition tax calculation, the Company is still finalizing itscalculation of the total accumulated post-1986 prescribed E&P for the applicable entities. Further, thetransition tax is based in part on the amount of those earnings held in liquid and non-liquid E&P. Untilthe calculation of E&P is completed and the transition tax is finalized during 2018 it is not practicableto estimate any amount of unrecognized deferred tax liability, if any, to any additional outside basisdifferences in the Company’s foreign subsidiaries. Earnings from the Company’s Peruvian branch to theUnited States are not subject to transition taxes since they are taxed on a current basis, regardless ofremittances.
At December 31, 2017, there were $485.8 million of foreign tax credits available for carryback orcarryforward. These credits have a one year carryback and a ten year carryforward period and can onlybe used to reduce U.S. income tax on foreign earnings. There were no other unused U.S. tax credits atDecember 31, 2017. These credits expire as follows:
Year Amount
2022 . . . . . . . . . . . . . . . . . . . . . . . . . . . . . . . . . . . . . . . . . . . . . . . . . . . . . 20.32023 . . . . . . . . . . . . . . . . . . . . . . . . . . . . . . . . . . . . . . . . . . . . . . . . . . . . . 69.22024 . . . . . . . . . . . . . . . . . . . . . . . . . . . . . . . . . . . . . . . . . . . . . . . . . . . . . 102.02025 . . . . . . . . . . . . . . . . . . . . . . . . . . . . . . . . . . . . . . . . . . . . . . . . . . . . . 189.52026 . . . . . . . . . . . . . . . . . . . . . . . . . . . . . . . . . . . . . . . . . . . . . . . . . . . . . 104.8
Total . . . . . . . . . . . . . . . . . . . . . . . . . . . . . . . . . . . . . . . . . . . . . . . . . . . . $485.8
These foreign tax credits are presented above on a gross basis and have not been reduced here forany unrecognized tax benefits. These foreign tax credits have been adjusted to include the 2017 NetOperating Loss carryback in the U.S. jurisdiction, increasing foreign tax credits by approximately$15.9 million. In accordance with ASU 2013-11 the Company has recorded $205.7 million of anunrecognized tax benefit as an offset to the Company’s deferred tax asset for foreign tax credits. Theremaining foreign tax credits of $280.2 million are being re-valued to zero at December 31, 2017. It isthe opinion of management that with the reduction in the U.S. corporate tax rate to 21% and the taxrates in Mexico and Peru at 30% and higher, it is unlikely the excess foreign tax credits can be utilized.Additionally, foreign dividends will no longer be taxed in the U.S. thereby reducing the U.S. tax on theforeign source income that the credits can be used to offset.
Peruvian Tax Matters—
Royalty mining charge: The royalty charge is based on operating income margins with graduatedrates ranging from 1% to 12% of operating profits, with a minimum royalty charge assessed at 1% ofnet sales. If the operating income margin is 10% or less, the royalty charge is 1% and for each 5%increment in the operating income margin, the royalty charge rate increases by 0.75%, up to amaximum of 12%. The minimum royalty charge assessed at 1% of net sales is recorded as cost of salesand those amounts assessed against operating income are included in the income tax provision. TheCompany has accrued $23.4 million, $16.8 million and $22.9 million of royalty charges in 2017, 2016and 2015, respectively, of which $2.5 million and $2.7 million were included in income taxes in 2017and 2015, respectively; no amounts were included in income tax in 2016.
122
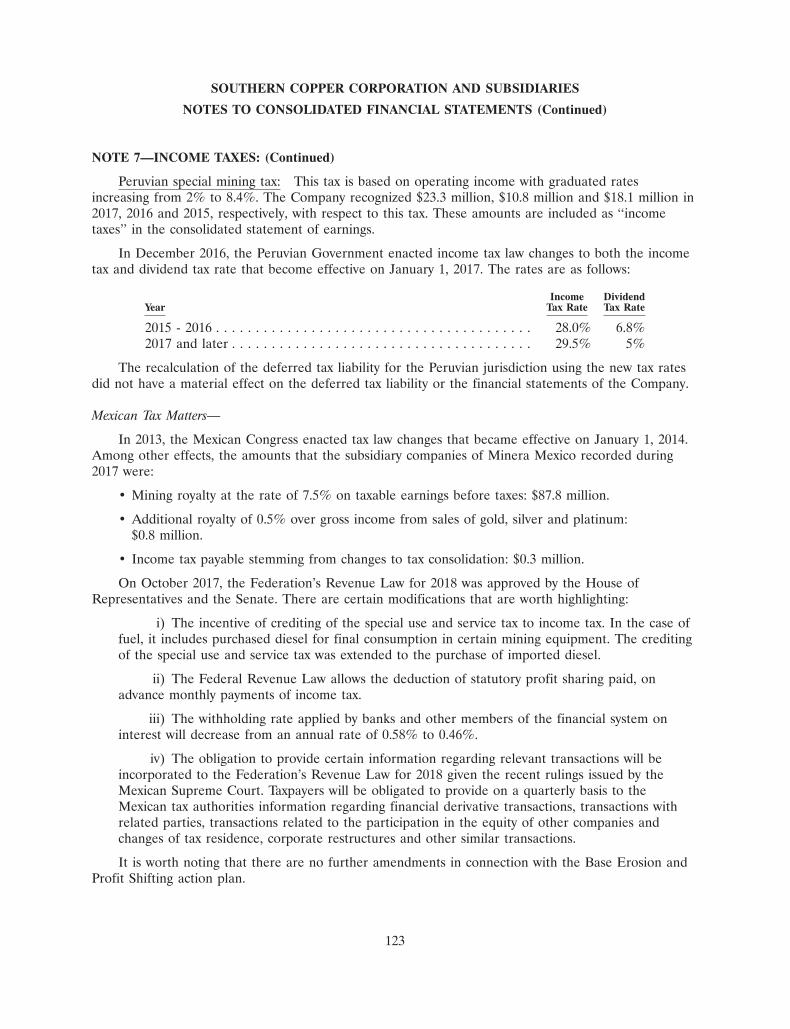
SOUTHERN COPPER CORPORATION AND SUBSIDIARIES
NOTES TO CONSOLIDATED FINANCIAL STATEMENTS (Continued)
NOTE 7—INCOME TAXES: (Continued)
Peruvian special mining tax: This tax is based on operating income with graduated ratesincreasing from 2% to 8.4%. The Company recognized $23.3 million, $10.8 million and $18.1 million in2017, 2016 and 2015, respectively, with respect to this tax. These amounts are included as ‘‘incometaxes’’ in the consolidated statement of earnings.
In December 2016, the Peruvian Government enacted income tax law changes to both the incometax and dividend tax rate that become effective on January 1, 2017. The rates are as follows:
Income DividendYear Tax Rate Tax Rate
2015 - 2016 . . . . . . . . . . . . . . . . . . . . . . . . . . . . . . . . . . . . . . . . 28.0% 6.8%2017 and later . . . . . . . . . . . . . . . . . . . . . . . . . . . . . . . . . . . . . . 29.5% 5%
The recalculation of the deferred tax liability for the Peruvian jurisdiction using the new tax ratesdid not have a material effect on the deferred tax liability or the financial statements of the Company.
Mexican Tax Matters—
In 2013, the Mexican Congress enacted tax law changes that became effective on January 1, 2014.Among other effects, the amounts that the subsidiary companies of Minera Mexico recorded during2017 were:
• Mining royalty at the rate of 7.5% on taxable earnings before taxes: $87.8 million.
• Additional royalty of 0.5% over gross income from sales of gold, silver and platinum:$0.8 million.
• Income tax payable stemming from changes to tax consolidation: $0.3 million.
On October 2017, the Federation’s Revenue Law for 2018 was approved by the House ofRepresentatives and the Senate. There are certain modifications that are worth highlighting:
i) The incentive of crediting of the special use and service tax to income tax. In the case offuel, it includes purchased diesel for final consumption in certain mining equipment. The creditingof the special use and service tax was extended to the purchase of imported diesel.
ii) The Federal Revenue Law allows the deduction of statutory profit sharing paid, onadvance monthly payments of income tax.
iii) The withholding rate applied by banks and other members of the financial system oninterest will decrease from an annual rate of 0.58% to 0.46%.
iv) The obligation to provide certain information regarding relevant transactions will beincorporated to the Federation’s Revenue Law for 2018 given the recent rulings issued by theMexican Supreme Court. Taxpayers will be obligated to provide on a quarterly basis to theMexican tax authorities information regarding financial derivative transactions, transactions withrelated parties, transactions related to the participation in the equity of other companies andchanges of tax residence, corporate restructures and other similar transactions.
It is worth noting that there are no further amendments in connection with the Base Erosion andProfit Shifting action plan.
123
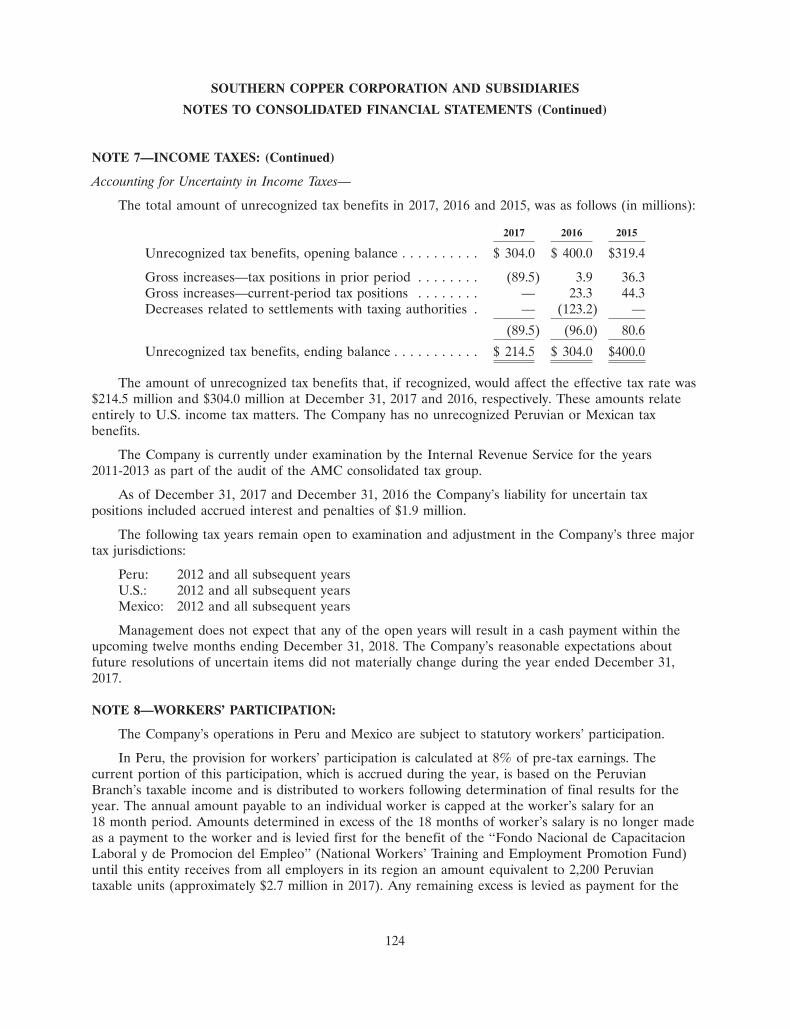
SOUTHERN COPPER CORPORATION AND SUBSIDIARIES
NOTES TO CONSOLIDATED FINANCIAL STATEMENTS (Continued)
NOTE 7—INCOME TAXES: (Continued)
Accounting for Uncertainty in Income Taxes—
The total amount of unrecognized tax benefits in 2017, 2016 and 2015, was as follows (in millions):
2017 2016 2015
Unrecognized tax benefits, opening balance . . . . . . . . . . $ 304.0 $ 400.0 $319.4
Gross increases—tax positions in prior period . . . . . . . . (89.5) 3.9 36.3Gross increases—current-period tax positions . . . . . . . . — 23.3 44.3Decreases related to settlements with taxing authorities . — (123.2) —
(89.5) (96.0) 80.6
Unrecognized tax benefits, ending balance . . . . . . . . . . . $ 214.5 $ 304.0 $400.0
The amount of unrecognized tax benefits that, if recognized, would affect the effective tax rate was$214.5 million and $304.0 million at December 31, 2017 and 2016, respectively. These amounts relateentirely to U.S. income tax matters. The Company has no unrecognized Peruvian or Mexican taxbenefits.
The Company is currently under examination by the Internal Revenue Service for the years2011-2013 as part of the audit of the AMC consolidated tax group.
As of December 31, 2017 and December 31, 2016 the Company’s liability for uncertain taxpositions included accrued interest and penalties of $1.9 million.
The following tax years remain open to examination and adjustment in the Company’s three majortax jurisdictions:
Peru: 2012 and all subsequent yearsU.S.: 2012 and all subsequent yearsMexico: 2012 and all subsequent years
Management does not expect that any of the open years will result in a cash payment within theupcoming twelve months ending December 31, 2018. The Company’s reasonable expectations aboutfuture resolutions of uncertain items did not materially change during the year ended December 31,2017.
NOTE 8—WORKERS’ PARTICIPATION:
The Company’s operations in Peru and Mexico are subject to statutory workers’ participation.
In Peru, the provision for workers’ participation is calculated at 8% of pre-tax earnings. Thecurrent portion of this participation, which is accrued during the year, is based on the PeruvianBranch’s taxable income and is distributed to workers following determination of final results for theyear. The annual amount payable to an individual worker is capped at the worker’s salary for an18 month period. Amounts determined in excess of the 18 months of worker’s salary is no longer madeas a payment to the worker and is levied first for the benefit of the ‘‘Fondo Nacional de CapacitacionLaboral y de Promocion del Empleo’’ (National Workers’ Training and Employment Promotion Fund)until this entity receives from all employers in its region an amount equivalent to 2,200 Peruviantaxable units (approximately $2.7 million in 2017). Any remaining excess is levied as payment for the
124
SOUTHERN COPPER CORPORATION AND SUBSIDIARIES
NOTES TO CONSOLIDATED FINANCIAL STATEMENTS (Continued)
NOTE 8—WORKERS’ PARTICIPATION: (Continued)
benefit of the regional governments. These levies fund worker training, employment promotion,entrepreneurship and various other programs.
In Mexico, workers’ participation is determined using the guidelines established in the Mexicanincome tax law at a rate of 10% of pre-tax earnings as adjusted by the tax law.
The provision for workers’ participation is allocated to ‘‘Cost of sales (exclusive of depreciation,amortization and depletion)’’ and to ‘‘selling, general and administrative’’ in the consolidated statementof earnings, proportional to the number of workers in the production and administrative areas,respectively. Workers’ participation expense for the three years ended December 31, 2017 was asfollows (in millions):
2017 2016 2015
Current . . . . . . . . . . . . . . . . . . . . . . . . . . . . . . . . . . . . . $192.7 $131.8 $140.8Deferred . . . . . . . . . . . . . . . . . . . . . . . . . . . . . . . . . . . . 6.6 (13.4) (19.8)
$199.3 $118.4 $121.0
NOTE 9—ASSET RETIREMENT OBLIGATION:
The Company maintains an estimated asset retirement obligation for its mining properties in Peru,as required by the Peruvian Mine Closure Law. In accordance with the requirements of this law, theCompany’s closure plans were approved by the Peruvian Ministry of Energy and Mines (‘‘MINEM’’).As part of the closure plans, the Company is required to provide annual guarantees over the estimatedlife of the mines, based on a present value approach, and to furnish the funds for the asset retirementobligation. This law requires a review of closing plans every five years. Currently and for the near-termfuture, the Company has pledged the value of its Lima office complex as support for this obligation.The accepted value of the Lima office building for this purpose is $36.9 million. Through January 2018,the Company has provided guarantees of $32.3 million. The closure cost recognized for this liabilityincludes the cost, as outlined in its closure plans, of dismantling the Toquepala and Cuajoneconcentrators, the smelter and refinery in Ilo, and the shops and auxiliary facilities at the three units.In 2015, we added $12.5 million related to the Toquepala expansion closure plan. In 2017, according toPeruvian law requirements, the Cuajone mine closure plan was reviewed. As a result of this, anadjustment of $11.6 million was recorded.
In 2010, the Company announced to the Mexican federal environmental authorities its closureplans for the copper smelter plant at San Luis Potosi. The Company initiated a program for plantdemolition and soil remediation with a budget of $66.2 million, which has been spent throughDecember 31, 2017. Plant demolition and construction of a confinement area at the south of theproperty were completed in 2012. In accordance with remediation goals previously approved byenvironmental authorities, soil remediation and on-site encapsulation on a second confinement area ofimpacted soils have been completed. Confirmation sampling was successfully completed. OnSeptember 2, 2016, the environmental authorities approved the conclusion of the remediation effort forSan Luis Potosi. The Company continues studying the possibilities for this property in order to decidewhether to sell or develop the property. The overall cost recognized for mining closure in Mexicoincludes the estimated costs of dismantling concentrators, smelter and refinery plants, shops and other
125
SOUTHERN COPPER CORPORATION AND SUBSIDIARIES
NOTES TO CONSOLIDATED FINANCIAL STATEMENTS (Continued)
NOTE 9—ASSET RETIREMENT OBLIGATION: (Continued)
facilities. In 2016, the Company added $9.5 million related to the Quebalix IV closure plan, a projectthat is part of the Buenavista expansion.
The following table summarizes the asset retirement obligation activity for years endedDecember 31, 2017 and 2016 (in millions):
2017 2016
Balance as of January 1 . . . . . . . . . . . . . . . . . . . . . . . . . . . . . . . . $216.5 $190.9Changes in estimates . . . . . . . . . . . . . . . . . . . . . . . . . . . . . . . . . . (11.6) —Additions . . . . . . . . . . . . . . . . . . . . . . . . . . . . . . . . . . . . . . . . . . — 10.5Closure payments . . . . . . . . . . . . . . . . . . . . . . . . . . . . . . . . . . . . (0.3) (2.0)Accretion expense . . . . . . . . . . . . . . . . . . . . . . . . . . . . . . . . . . . . 17.9 17.1
Balance as of December 31, . . . . . . . . . . . . . . . . . . . . . . . . . . . . . $222.5 $216.5
NOTE 10—FINANCING:
Long-term debt (in millions):
Carryingvalue as of
Face Issuance Issuance December 31,amount discount costs 2017
5.375% Senior unsecured notes due 2020 . . . . . . . . . . . . . . . $ 400 $ (0.6) $ (0.6) $ 398.83.500% Senior unsecured notes due 2022 . . . . . . . . . . . . . . . 300 (0.5) (0.8) 298.73.875% Senior unsecured notes due 2025 . . . . . . . . . . . . . . . 500 (2.1) (2.0) 495.99.250% Yankee Bonds due 2028 . . . . . . . . . . . . . . . . . . . . . . 125 — — 51.27.500% Senior unsecured notes due 2035 . . . . . . . . . . . . . . . 1,000 (13.2) (8.8) 978.06.750% Senior unsecured notes due 2040 . . . . . . . . . . . . . . . 1,100 (7.4) (5.9) 1,086.75.250% Senior unsecured notes due 2042 . . . . . . . . . . . . . . . 1,200 (19.8) (6.6) 1,173.65.875% Senior unsecured notes due 2045 . . . . . . . . . . . . . . . 1,500 (16.9) (8.9) 1,474.2
Total . . . . . . . . . . . . . . . . . . . . . . . . . . . . . . . . . . . . . . . . . . $6,125 $(60.5) $(33.6) 5,957.1
Less, current portion . . . . . . . . . . . . . . . . . . . . . . . . . . . . . . —
Total long-term debt . . . . . . . . . . . . . . . . . . . . . . . . . . . . . . $5,957.1
126
SOUTHERN COPPER CORPORATION AND SUBSIDIARIES
NOTES TO CONSOLIDATED FINANCIAL STATEMENTS (Continued)
NOTE 10—FINANCING: (Continued)
Carryingvalue as of
Face Issuance Issuance December 31,amount discount costs 2016
5.375% Senior unsecured notes due 2020 . . . . . . . . . . . . . . . $ 400 $ (0.8) $ (0.9) $ 398.33.500% Senior unsecured notes due 2022 . . . . . . . . . . . . . . . 300 (0.7) (0.9) 298.43.875% Senior unsecured notes due 2025 . . . . . . . . . . . . . . . 500 (2.3) (2.2) 495.59.250% Yankee Bonds due 2028 . . . . . . . . . . . . . . . . . . . . . . 125 — — 51.27.500% Senior unsecured notes due 2035 . . . . . . . . . . . . . . . 1,000 (13.6) (8.9) 977.56.750% Senior unsecured notes due 2040 . . . . . . . . . . . . . . . 1,100 (7.5) (6.1) 1,086.45.250% Senior unsecured notes due 2042 . . . . . . . . . . . . . . . 1,200 (20.2) (6.7) 1,173.15.875% Senior unsecured notes due 2045 . . . . . . . . . . . . . . . 1,500 (17.1) (9.1) 1,473.8
Total . . . . . . . . . . . . . . . . . . . . . . . . . . . . . . . . . . . . . . . . . . $6,125 $(62.2) $(34.8) 5,954.2
Less, current portion . . . . . . . . . . . . . . . . . . . . . . . . . . . . . . —
Total long-term debt . . . . . . . . . . . . . . . . . . . . . . . . . . . . . . $5,954.2
The bonds, referred above as ‘‘Yankee bonds’’, contain a covenant requiring Minera Mexico tomaintain a ratio of EBITDA to interest expense of not less than 2.5 to 1.0 as such terms are defined inthe debt instrument. At December 31, 2017, Minera Mexico was in compliance with this covenant.
Between July 2005 and November 2012 the Company issued senior unsecured notes six timestotaling $4.2 billion, as listed above. Interest on the notes is paid semi-annually in arrears. The notesrank pari passu with each other and rank pari passu in right of payment with all of the Company’s otherexisting and future unsecured and unsubordinated indebtedness.
On April 20, 2015, the Company issued $2.0 billion of fixed-rate senior unsecured notes. This debtwas issued in two tranches, $500 million due 2025 at an annual interest rate of 3.875% and $1.5 billiondue 2045 at an annual interest rate of 5.875%. These notes are general unsecured obligations of theCompany and rank equally with all of its existing and future unsecured and unsubordinated debt. Netproceeds are being used for general corporate purposes, including the financing of the Company´scapital investment program. The notes were issued with an underwriters’ discount of $20.2 million.Additionally, issuance costs of $11.8 million associated with these notes were paid and deferred. Theunamortized balance of the discount and the costs are presented net of the carrying value of the debtissued and are amortized as interest expense over the life of the loan.
The indentures relating to the notes contain certain restrictive covenants, including limitations onliens, limitations on sale and leaseback transactions, rights of the holders of the notes upon theoccurrence of a change of control triggering event, limitations on subsidiary indebtedness andlimitations on consolidations, mergers, sales or conveyances. Certain of these covenants cease to beapplicable before the notes mature if the Company obtains an investment grade rating. The Companyobtained investment grade rating in 2005. The Company has registered these notes under the SecuritiesAct of 1933, as amended. The Company may issue additional debt from time to time pursuant tocertain of the indentures.
If the Company experiences a ‘‘Change of Control Triggering Event’’, the Company must offer torepurchase the notes at a purchase price equal to 101% of the principal amount thereof, plus accruedand unpaid interest, if any. A Change of Control Trigger Event means a Change of Control (as
127
SOUTHERN COPPER CORPORATION AND SUBSIDIARIES
NOTES TO CONSOLIDATED FINANCIAL STATEMENTS (Continued)
NOTE 10—FINANCING: (Continued)
defined) and a rating decline (as defined), that is, if the rating of the notes, by at least one of therating agencies shall be decreased by one or more gradations.
At December 31, 2017, the Company was in compliance with the covenants of the notes.
Aggregate maturities of the outstanding borrowings at December 31, 2017, are as follows:
PrincipalYears Due(*)
(in millions)
2018 . . . . . . . . . . . . . . . . . . . . . . . . . . . . . . . . . . . . . . . . . . . . . . . . . . $ —2019 . . . . . . . . . . . . . . . . . . . . . . . . . . . . . . . . . . . . . . . . . . . . . . . . . . —2020 . . . . . . . . . . . . . . . . . . . . . . . . . . . . . . . . . . . . . . . . . . . . . . . . . . 400.02021 . . . . . . . . . . . . . . . . . . . . . . . . . . . . . . . . . . . . . . . . . . . . . . . . . . —2022 . . . . . . . . . . . . . . . . . . . . . . . . . . . . . . . . . . . . . . . . . . . . . . . . . . 300.0Thereafter . . . . . . . . . . . . . . . . . . . . . . . . . . . . . . . . . . . . . . . . . . . . . 5,351.2
Total . . . . . . . . . . . . . . . . . . . . . . . . . . . . . . . . . . . . . . . . . . . . . . . . . . $6,051.2
(*) Total debt maturities do not include the debt discount valuation account of $94.1 million.
NOTE 11—BENEFIT PLANS:
Post retirement defined benefit plans
The Company has two noncontributory defined benefit pension plans covering former salariedemployees in the United States and certain former expatriate employees in Peru (the ‘‘ExpatriatePlan’’). Effective October 31, 2000, the Board of Directors amended the qualified pension plan tosuspend the accrual of benefits.
In addition, the Company’s Mexican subsidiaries have a defined contribution pension plan forsalaried employees and a non-contributory defined benefit pension plan for union employees (the‘‘Mexican Plan’’).
The components of net periodic benefit costs calculated in accordance with ASC 715‘‘Compensation retirement benefits,’’ using December 31 as a measurement date, consist of thefollowing:
Years endedDecember 31,
2017 2016 2015(in millions)
Service cost . . . . . . . . . . . . . . . . . . . . . . . . . . . . . . . . . . . . . $ 0.8 $ 0.7 $ 1.1Interest cost . . . . . . . . . . . . . . . . . . . . . . . . . . . . . . . . . . . . . 1.4 1.0 1.0Expected return on plan assets . . . . . . . . . . . . . . . . . . . . . . . (2.9) (2.2) (3.0)Amortization of transition assets, net . . . . . . . . . . . . . . . . . . . 0.1 0.1 0.1Amortization of net actuarial loss . . . . . . . . . . . . . . . . . . . . . — — (0.5)Settlement / Curtailment . . . . . . . . . . . . . . . . . . . . . . . . . . . . 0.1 (0.2) —Amortization of net loss/(gain) . . . . . . . . . . . . . . . . . . . . . . . 0.2 0.2 0.2
Net periodic benefit cost . . . . . . . . . . . . . . . . . . . . . . . . . . . . $(0.3) $(0.4) $(1.1)
128
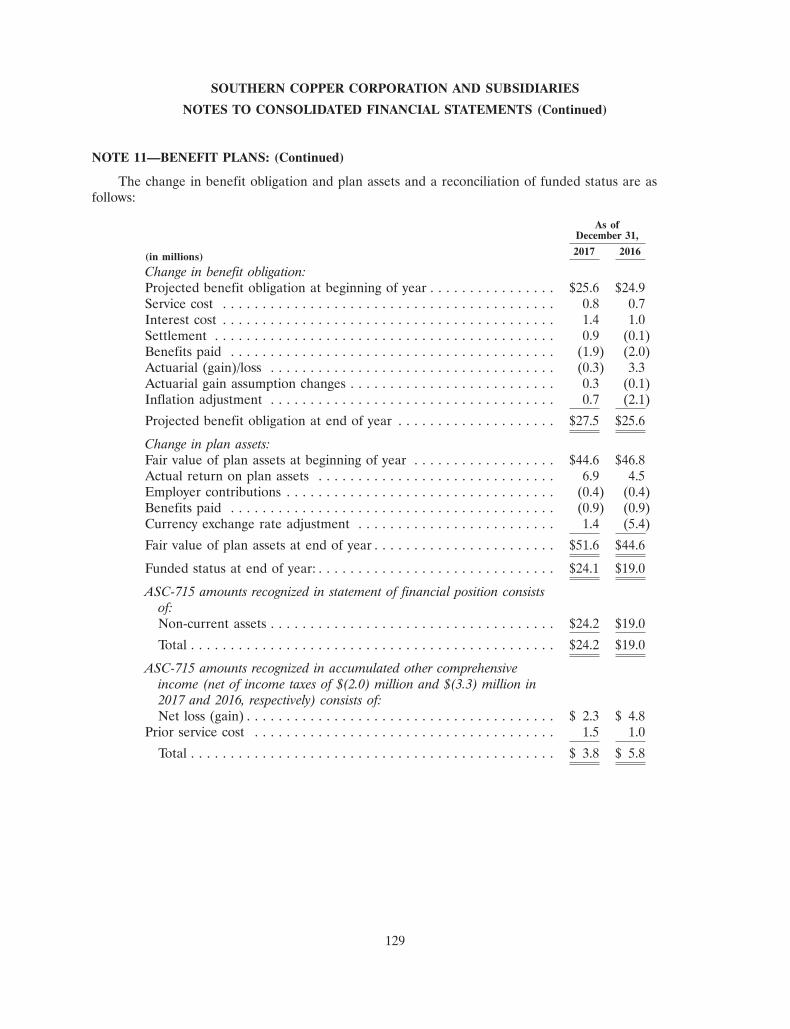
SOUTHERN COPPER CORPORATION AND SUBSIDIARIES
NOTES TO CONSOLIDATED FINANCIAL STATEMENTS (Continued)
NOTE 11—BENEFIT PLANS: (Continued)
The change in benefit obligation and plan assets and a reconciliation of funded status are asfollows:
As ofDecember 31,
2017 2016(in millions)
Change in benefit obligation:Projected benefit obligation at beginning of year . . . . . . . . . . . . . . . . $25.6 $24.9Service cost . . . . . . . . . . . . . . . . . . . . . . . . . . . . . . . . . . . . . . . . . . 0.8 0.7Interest cost . . . . . . . . . . . . . . . . . . . . . . . . . . . . . . . . . . . . . . . . . . 1.4 1.0Settlement . . . . . . . . . . . . . . . . . . . . . . . . . . . . . . . . . . . . . . . . . . . 0.9 (0.1)Benefits paid . . . . . . . . . . . . . . . . . . . . . . . . . . . . . . . . . . . . . . . . . (1.9) (2.0)Actuarial (gain)/loss . . . . . . . . . . . . . . . . . . . . . . . . . . . . . . . . . . . . (0.3) 3.3Actuarial gain assumption changes . . . . . . . . . . . . . . . . . . . . . . . . . . 0.3 (0.1)Inflation adjustment . . . . . . . . . . . . . . . . . . . . . . . . . . . . . . . . . . . . 0.7 (2.1)
Projected benefit obligation at end of year . . . . . . . . . . . . . . . . . . . . $27.5 $25.6
Change in plan assets:Fair value of plan assets at beginning of year . . . . . . . . . . . . . . . . . . $44.6 $46.8Actual return on plan assets . . . . . . . . . . . . . . . . . . . . . . . . . . . . . . 6.9 4.5Employer contributions . . . . . . . . . . . . . . . . . . . . . . . . . . . . . . . . . . (0.4) (0.4)Benefits paid . . . . . . . . . . . . . . . . . . . . . . . . . . . . . . . . . . . . . . . . . (0.9) (0.9)Currency exchange rate adjustment . . . . . . . . . . . . . . . . . . . . . . . . . 1.4 (5.4)
Fair value of plan assets at end of year . . . . . . . . . . . . . . . . . . . . . . . $51.6 $44.6
Funded status at end of year: . . . . . . . . . . . . . . . . . . . . . . . . . . . . . . $24.1 $19.0
ASC-715 amounts recognized in statement of financial position consistsof:Non-current assets . . . . . . . . . . . . . . . . . . . . . . . . . . . . . . . . . . . . $24.2 $19.0
Total . . . . . . . . . . . . . . . . . . . . . . . . . . . . . . . . . . . . . . . . . . . . . . $24.2 $19.0
ASC-715 amounts recognized in accumulated other comprehensiveincome (net of income taxes of $(2.0) million and $(3.3) million in2017 and 2016, respectively) consists of:Net loss (gain) . . . . . . . . . . . . . . . . . . . . . . . . . . . . . . . . . . . . . . . $ 2.3 $ 4.8
Prior service cost . . . . . . . . . . . . . . . . . . . . . . . . . . . . . . . . . . . . . . 1.5 1.0
Total . . . . . . . . . . . . . . . . . . . . . . . . . . . . . . . . . . . . . . . . . . . . . . $ 3.8 $ 5.8
129
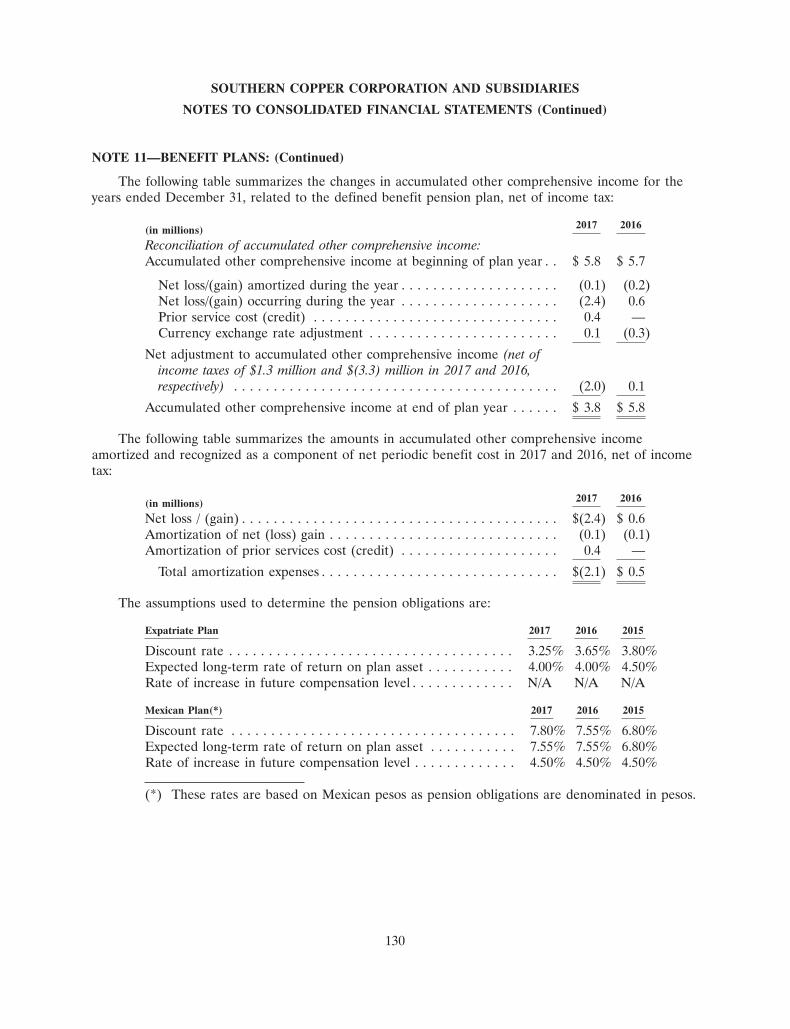
SOUTHERN COPPER CORPORATION AND SUBSIDIARIES
NOTES TO CONSOLIDATED FINANCIAL STATEMENTS (Continued)
NOTE 11—BENEFIT PLANS: (Continued)
The following table summarizes the changes in accumulated other comprehensive income for theyears ended December 31, related to the defined benefit pension plan, net of income tax:
2017 2016(in millions)
Reconciliation of accumulated other comprehensive income:Accumulated other comprehensive income at beginning of plan year . . $ 5.8 $ 5.7
Net loss/(gain) amortized during the year . . . . . . . . . . . . . . . . . . . . (0.1) (0.2)Net loss/(gain) occurring during the year . . . . . . . . . . . . . . . . . . . . (2.4) 0.6Prior service cost (credit) . . . . . . . . . . . . . . . . . . . . . . . . . . . . . . . 0.4 —Currency exchange rate adjustment . . . . . . . . . . . . . . . . . . . . . . . . 0.1 (0.3)
Net adjustment to accumulated other comprehensive income (net ofincome taxes of $1.3 million and $(3.3) million in 2017 and 2016,respectively) . . . . . . . . . . . . . . . . . . . . . . . . . . . . . . . . . . . . . . . . . (2.0) 0.1
Accumulated other comprehensive income at end of plan year . . . . . . $ 3.8 $ 5.8
The following table summarizes the amounts in accumulated other comprehensive incomeamortized and recognized as a component of net periodic benefit cost in 2017 and 2016, net of incometax:
2017 2016(in millions)
Net loss / (gain) . . . . . . . . . . . . . . . . . . . . . . . . . . . . . . . . . . . . . . . . $(2.4) $ 0.6Amortization of net (loss) gain . . . . . . . . . . . . . . . . . . . . . . . . . . . . . (0.1) (0.1)Amortization of prior services cost (credit) . . . . . . . . . . . . . . . . . . . . 0.4 —
Total amortization expenses . . . . . . . . . . . . . . . . . . . . . . . . . . . . . . $(2.1) $ 0.5
The assumptions used to determine the pension obligations are:
Expatriate Plan 2017 2016 2015
Discount rate . . . . . . . . . . . . . . . . . . . . . . . . . . . . . . . . . . . . 3.25% 3.65% 3.80%Expected long-term rate of return on plan asset . . . . . . . . . . . 4.00% 4.00% 4.50%Rate of increase in future compensation level . . . . . . . . . . . . . N/A N/A N/A
Mexican Plan(*) 2017 2016 2015
Discount rate . . . . . . . . . . . . . . . . . . . . . . . . . . . . . . . . . . . . 7.80% 7.55% 6.80%Expected long-term rate of return on plan asset . . . . . . . . . . . 7.55% 7.55% 6.80%Rate of increase in future compensation level . . . . . . . . . . . . . 4.50% 4.50% 4.50%
(*) These rates are based on Mexican pesos as pension obligations are denominated in pesos.
130
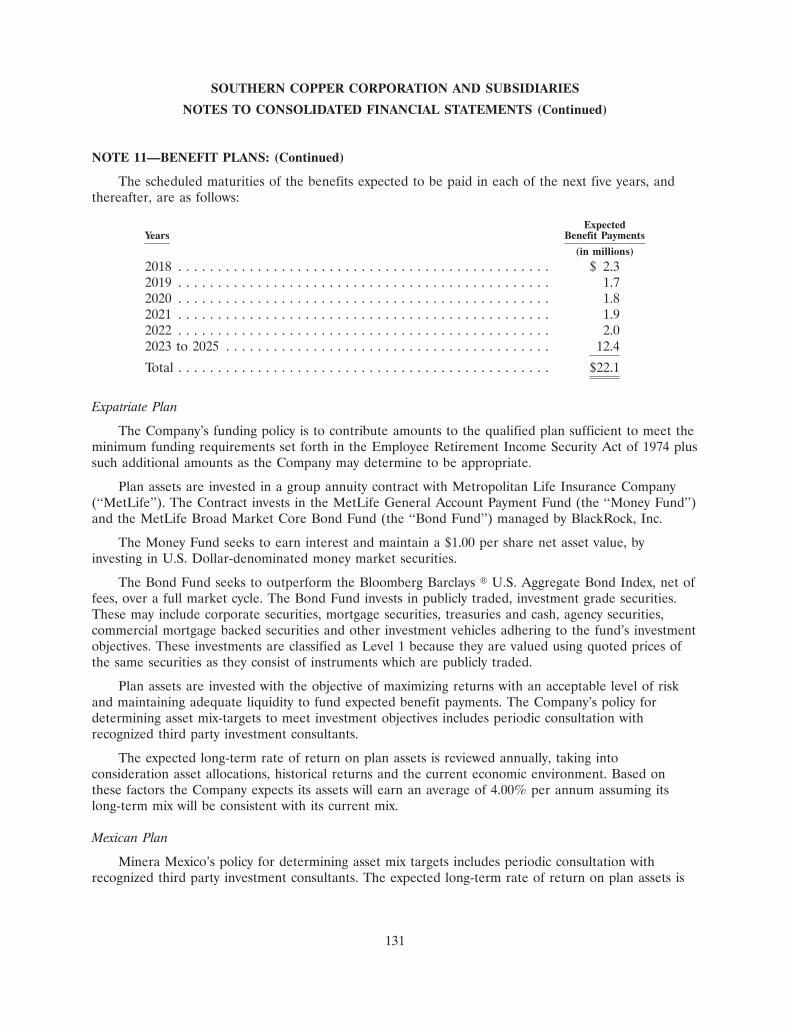
SOUTHERN COPPER CORPORATION AND SUBSIDIARIES
NOTES TO CONSOLIDATED FINANCIAL STATEMENTS (Continued)
NOTE 11—BENEFIT PLANS: (Continued)
The scheduled maturities of the benefits expected to be paid in each of the next five years, andthereafter, are as follows:
ExpectedYears Benefit Payments
(in millions)
2018 . . . . . . . . . . . . . . . . . . . . . . . . . . . . . . . . . . . . . . . . . . . . . . . $ 2.32019 . . . . . . . . . . . . . . . . . . . . . . . . . . . . . . . . . . . . . . . . . . . . . . . 1.72020 . . . . . . . . . . . . . . . . . . . . . . . . . . . . . . . . . . . . . . . . . . . . . . . 1.82021 . . . . . . . . . . . . . . . . . . . . . . . . . . . . . . . . . . . . . . . . . . . . . . . 1.92022 . . . . . . . . . . . . . . . . . . . . . . . . . . . . . . . . . . . . . . . . . . . . . . . 2.02023 to 2025 . . . . . . . . . . . . . . . . . . . . . . . . . . . . . . . . . . . . . . . . . 12.4
Total . . . . . . . . . . . . . . . . . . . . . . . . . . . . . . . . . . . . . . . . . . . . . . . $22.1
Expatriate Plan
The Company’s funding policy is to contribute amounts to the qualified plan sufficient to meet theminimum funding requirements set forth in the Employee Retirement Income Security Act of 1974 plussuch additional amounts as the Company may determine to be appropriate.
Plan assets are invested in a group annuity contract with Metropolitan Life Insurance Company(‘‘MetLife’’). The Contract invests in the MetLife General Account Payment Fund (the ‘‘Money Fund’’)and the MetLife Broad Market Core Bond Fund (the ‘‘Bond Fund’’) managed by BlackRock, Inc.
The Money Fund seeks to earn interest and maintain a $1.00 per share net asset value, byinvesting in U.S. Dollar-denominated money market securities.
The Bond Fund seeks to outperform the Bloomberg Barclays � U.S. Aggregate Bond Index, net offees, over a full market cycle. The Bond Fund invests in publicly traded, investment grade securities.These may include corporate securities, mortgage securities, treasuries and cash, agency securities,commercial mortgage backed securities and other investment vehicles adhering to the fund’s investmentobjectives. These investments are classified as Level 1 because they are valued using quoted prices ofthe same securities as they consist of instruments which are publicly traded.
Plan assets are invested with the objective of maximizing returns with an acceptable level of riskand maintaining adequate liquidity to fund expected benefit payments. The Company’s policy fordetermining asset mix-targets to meet investment objectives includes periodic consultation withrecognized third party investment consultants.
The expected long-term rate of return on plan assets is reviewed annually, taking intoconsideration asset allocations, historical returns and the current economic environment. Based onthese factors the Company expects its assets will earn an average of 4.00% per annum assuming itslong-term mix will be consistent with its current mix.
Mexican Plan
Minera Mexico’s policy for determining asset mix targets includes periodic consultation withrecognized third party investment consultants. The expected long-term rate of return on plan assets is
131
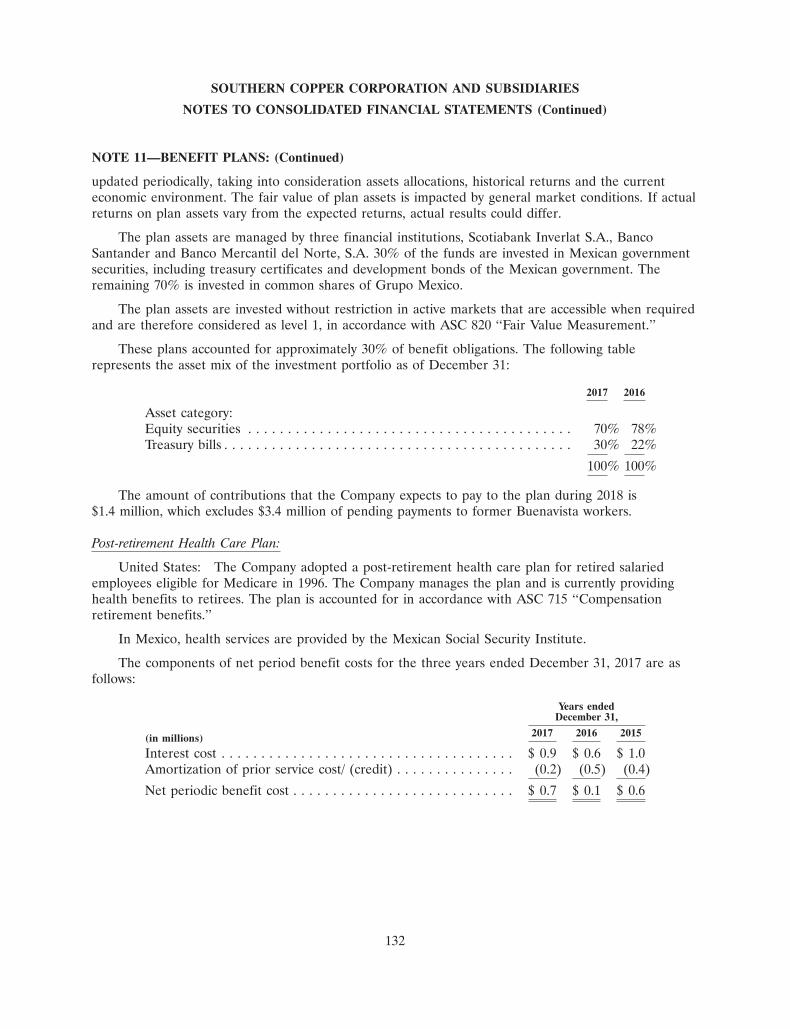
SOUTHERN COPPER CORPORATION AND SUBSIDIARIES
NOTES TO CONSOLIDATED FINANCIAL STATEMENTS (Continued)
NOTE 11—BENEFIT PLANS: (Continued)
updated periodically, taking into consideration assets allocations, historical returns and the currenteconomic environment. The fair value of plan assets is impacted by general market conditions. If actualreturns on plan assets vary from the expected returns, actual results could differ.
The plan assets are managed by three financial institutions, Scotiabank Inverlat S.A., BancoSantander and Banco Mercantil del Norte, S.A. 30% of the funds are invested in Mexican governmentsecurities, including treasury certificates and development bonds of the Mexican government. Theremaining 70% is invested in common shares of Grupo Mexico.
The plan assets are invested without restriction in active markets that are accessible when requiredand are therefore considered as level 1, in accordance with ASC 820 ‘‘Fair Value Measurement.’’
These plans accounted for approximately 30% of benefit obligations. The following tablerepresents the asset mix of the investment portfolio as of December 31:
2017 2016
Asset category:Equity securities . . . . . . . . . . . . . . . . . . . . . . . . . . . . . . . . . . . . . . . . . 70% 78%Treasury bills . . . . . . . . . . . . . . . . . . . . . . . . . . . . . . . . . . . . . . . . . . . . 30% 22%
100% 100%
The amount of contributions that the Company expects to pay to the plan during 2018 is$1.4 million, which excludes $3.4 million of pending payments to former Buenavista workers.
Post-retirement Health Care Plan:
United States: The Company adopted a post-retirement health care plan for retired salariedemployees eligible for Medicare in 1996. The Company manages the plan and is currently providinghealth benefits to retirees. The plan is accounted for in accordance with ASC 715 ‘‘Compensationretirement benefits.’’
In Mexico, health services are provided by the Mexican Social Security Institute.
The components of net period benefit costs for the three years ended December 31, 2017 are asfollows:
Years endedDecember 31,
2017 2016 2015(in millions)
Interest cost . . . . . . . . . . . . . . . . . . . . . . . . . . . . . . . . . . . . . $ 0.9 $ 0.6 $ 1.0Amortization of prior service cost/ (credit) . . . . . . . . . . . . . . . (0.2) (0.5) (0.4)
Net periodic benefit cost . . . . . . . . . . . . . . . . . . . . . . . . . . . . $ 0.7 $ 0.1 $ 0.6
132
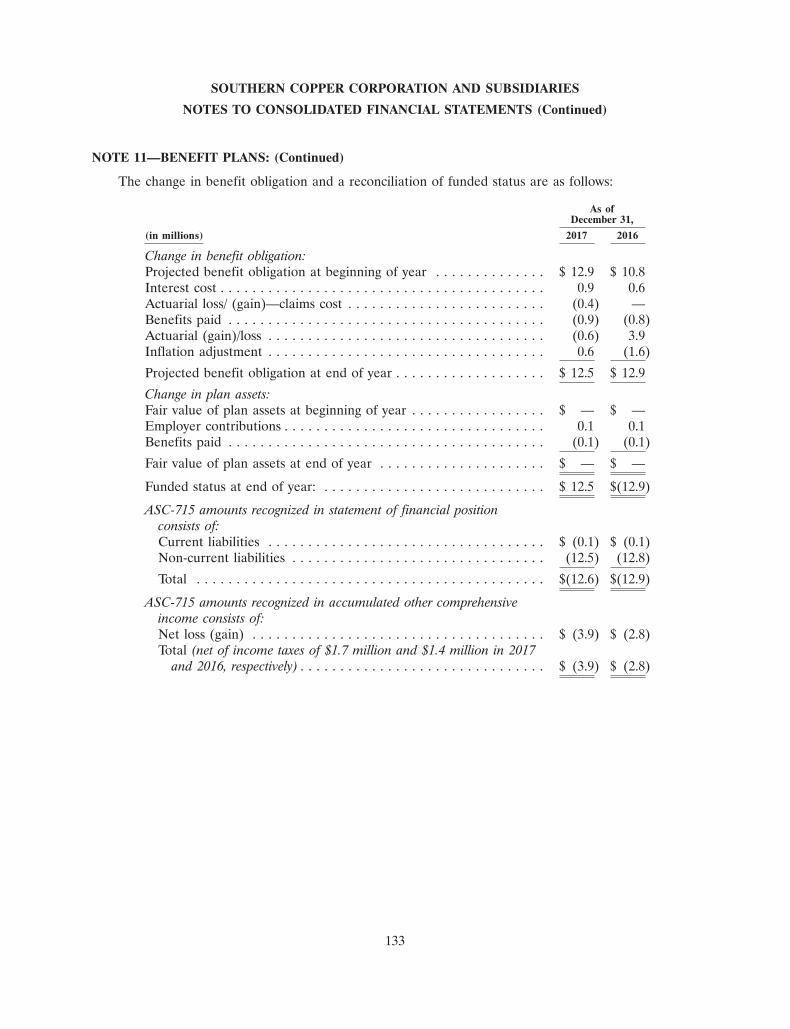
SOUTHERN COPPER CORPORATION AND SUBSIDIARIES
NOTES TO CONSOLIDATED FINANCIAL STATEMENTS (Continued)
NOTE 11—BENEFIT PLANS: (Continued)
The change in benefit obligation and a reconciliation of funded status are as follows:
As ofDecember 31,
(in millions) 2017 2016
Change in benefit obligation:Projected benefit obligation at beginning of year . . . . . . . . . . . . . . $ 12.9 $ 10.8Interest cost . . . . . . . . . . . . . . . . . . . . . . . . . . . . . . . . . . . . . . . . . 0.9 0.6Actuarial loss/ (gain)—claims cost . . . . . . . . . . . . . . . . . . . . . . . . . (0.4) —Benefits paid . . . . . . . . . . . . . . . . . . . . . . . . . . . . . . . . . . . . . . . . (0.9) (0.8)Actuarial (gain)/loss . . . . . . . . . . . . . . . . . . . . . . . . . . . . . . . . . . . (0.6) 3.9Inflation adjustment . . . . . . . . . . . . . . . . . . . . . . . . . . . . . . . . . . . 0.6 (1.6)
Projected benefit obligation at end of year . . . . . . . . . . . . . . . . . . . $ 12.5 $ 12.9
Change in plan assets:Fair value of plan assets at beginning of year . . . . . . . . . . . . . . . . . $ — $ —Employer contributions . . . . . . . . . . . . . . . . . . . . . . . . . . . . . . . . . 0.1 0.1Benefits paid . . . . . . . . . . . . . . . . . . . . . . . . . . . . . . . . . . . . . . . . (0.1) (0.1)
Fair value of plan assets at end of year . . . . . . . . . . . . . . . . . . . . . $ — $ —
Funded status at end of year: . . . . . . . . . . . . . . . . . . . . . . . . . . . . $ 12.5 $(12.9)
ASC-715 amounts recognized in statement of financial positionconsists of:Current liabilities . . . . . . . . . . . . . . . . . . . . . . . . . . . . . . . . . . . $ (0.1) $ (0.1)Non-current liabilities . . . . . . . . . . . . . . . . . . . . . . . . . . . . . . . . (12.5) (12.8)
Total . . . . . . . . . . . . . . . . . . . . . . . . . . . . . . . . . . . . . . . . . . . . $(12.6) $(12.9)
ASC-715 amounts recognized in accumulated other comprehensiveincome consists of:Net loss (gain) . . . . . . . . . . . . . . . . . . . . . . . . . . . . . . . . . . . . . $ (3.9) $ (2.8)Total (net of income taxes of $1.7 million and $1.4 million in 2017
and 2016, respectively) . . . . . . . . . . . . . . . . . . . . . . . . . . . . . . . $ (3.9) $ (2.8)
133
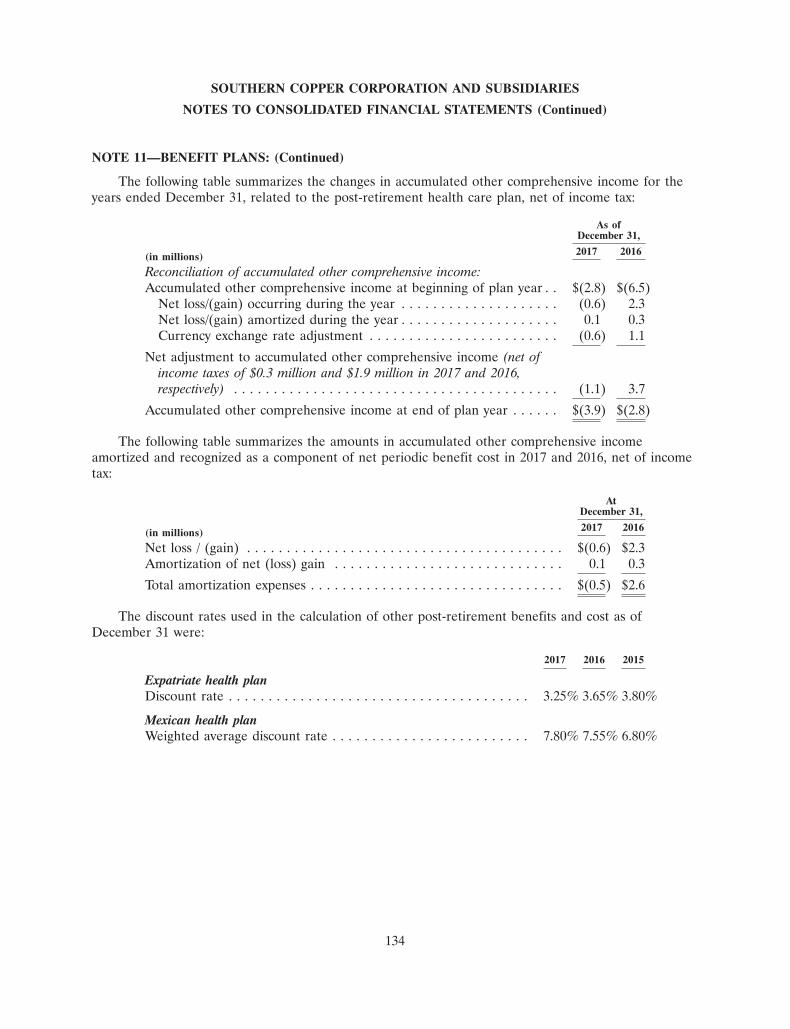
SOUTHERN COPPER CORPORATION AND SUBSIDIARIES
NOTES TO CONSOLIDATED FINANCIAL STATEMENTS (Continued)
NOTE 11—BENEFIT PLANS: (Continued)
The following table summarizes the changes in accumulated other comprehensive income for theyears ended December 31, related to the post-retirement health care plan, net of income tax:
As ofDecember 31,
2017 2016(in millions)
Reconciliation of accumulated other comprehensive income:Accumulated other comprehensive income at beginning of plan year . . $(2.8) $(6.5)
Net loss/(gain) occurring during the year . . . . . . . . . . . . . . . . . . . . (0.6) 2.3Net loss/(gain) amortized during the year . . . . . . . . . . . . . . . . . . . . 0.1 0.3Currency exchange rate adjustment . . . . . . . . . . . . . . . . . . . . . . . . (0.6) 1.1
Net adjustment to accumulated other comprehensive income (net ofincome taxes of $0.3 million and $1.9 million in 2017 and 2016,respectively) . . . . . . . . . . . . . . . . . . . . . . . . . . . . . . . . . . . . . . . . . (1.1) 3.7
Accumulated other comprehensive income at end of plan year . . . . . . $(3.9) $(2.8)
The following table summarizes the amounts in accumulated other comprehensive incomeamortized and recognized as a component of net periodic benefit cost in 2017 and 2016, net of incometax:
AtDecember 31,
2017 2016(in millions)
Net loss / (gain) . . . . . . . . . . . . . . . . . . . . . . . . . . . . . . . . . . . . . . . . $(0.6) $2.3Amortization of net (loss) gain . . . . . . . . . . . . . . . . . . . . . . . . . . . . . 0.1 0.3
Total amortization expenses . . . . . . . . . . . . . . . . . . . . . . . . . . . . . . . . $(0.5) $2.6
The discount rates used in the calculation of other post-retirement benefits and cost as ofDecember 31 were:
2017 2016 2015
Expatriate health planDiscount rate . . . . . . . . . . . . . . . . . . . . . . . . . . . . . . . . . . . . . . 3.25% 3.65% 3.80%
Mexican health planWeighted average discount rate . . . . . . . . . . . . . . . . . . . . . . . . . 7.80% 7.55% 6.80%
134
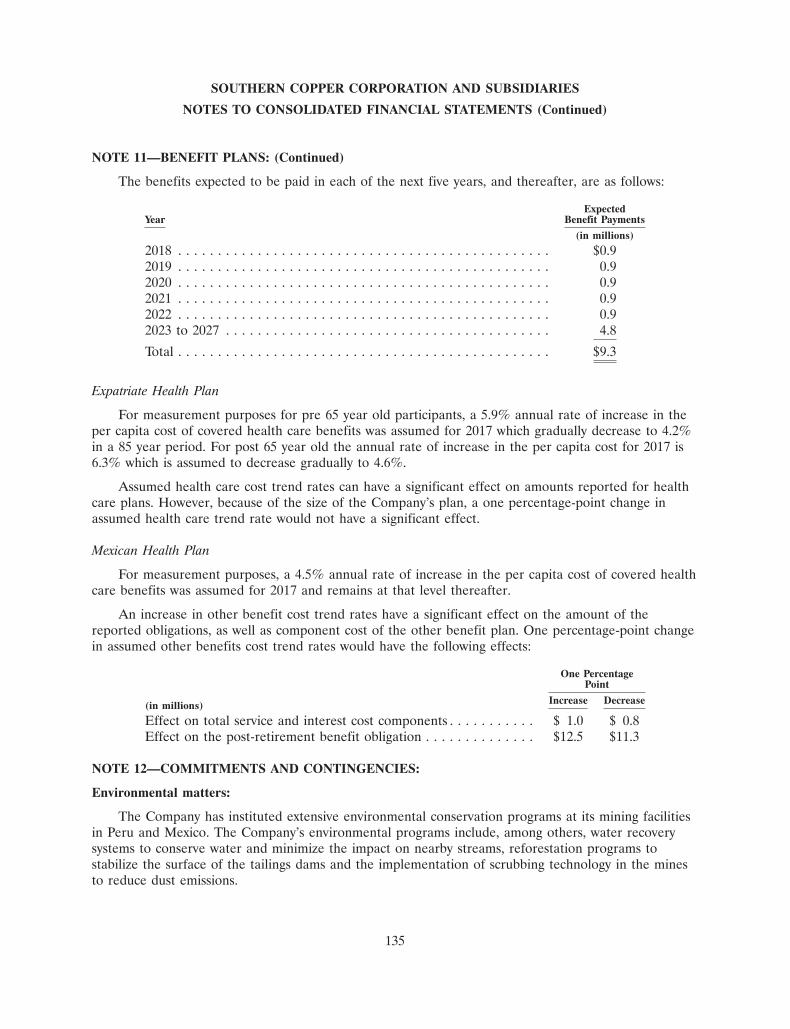
SOUTHERN COPPER CORPORATION AND SUBSIDIARIES
NOTES TO CONSOLIDATED FINANCIAL STATEMENTS (Continued)
NOTE 11—BENEFIT PLANS: (Continued)
The benefits expected to be paid in each of the next five years, and thereafter, are as follows:
ExpectedYear Benefit Payments
(in millions)
2018 . . . . . . . . . . . . . . . . . . . . . . . . . . . . . . . . . . . . . . . . . . . . . . . $0.92019 . . . . . . . . . . . . . . . . . . . . . . . . . . . . . . . . . . . . . . . . . . . . . . . 0.92020 . . . . . . . . . . . . . . . . . . . . . . . . . . . . . . . . . . . . . . . . . . . . . . . 0.92021 . . . . . . . . . . . . . . . . . . . . . . . . . . . . . . . . . . . . . . . . . . . . . . . 0.92022 . . . . . . . . . . . . . . . . . . . . . . . . . . . . . . . . . . . . . . . . . . . . . . . 0.92023 to 2027 . . . . . . . . . . . . . . . . . . . . . . . . . . . . . . . . . . . . . . . . . 4.8
Total . . . . . . . . . . . . . . . . . . . . . . . . . . . . . . . . . . . . . . . . . . . . . . . $9.3
Expatriate Health Plan
For measurement purposes for pre 65 year old participants, a 5.9% annual rate of increase in theper capita cost of covered health care benefits was assumed for 2017 which gradually decrease to 4.2%in a 85 year period. For post 65 year old the annual rate of increase in the per capita cost for 2017 is6.3% which is assumed to decrease gradually to 4.6%.
Assumed health care cost trend rates can have a significant effect on amounts reported for healthcare plans. However, because of the size of the Company’s plan, a one percentage-point change inassumed health care trend rate would not have a significant effect.
Mexican Health Plan
For measurement purposes, a 4.5% annual rate of increase in the per capita cost of covered healthcare benefits was assumed for 2017 and remains at that level thereafter.
An increase in other benefit cost trend rates have a significant effect on the amount of thereported obligations, as well as component cost of the other benefit plan. One percentage-point changein assumed other benefits cost trend rates would have the following effects:
One PercentagePoint
Increase Decrease(in millions)
Effect on total service and interest cost components . . . . . . . . . . . $ 1.0 $ 0.8Effect on the post-retirement benefit obligation . . . . . . . . . . . . . . $12.5 $11.3
NOTE 12—COMMITMENTS AND CONTINGENCIES:
Environmental matters:
The Company has instituted extensive environmental conservation programs at its mining facilitiesin Peru and Mexico. The Company’s environmental programs include, among others, water recoverysystems to conserve water and minimize the impact on nearby streams, reforestation programs tostabilize the surface of the tailings dams and the implementation of scrubbing technology in the minesto reduce dust emissions.
135
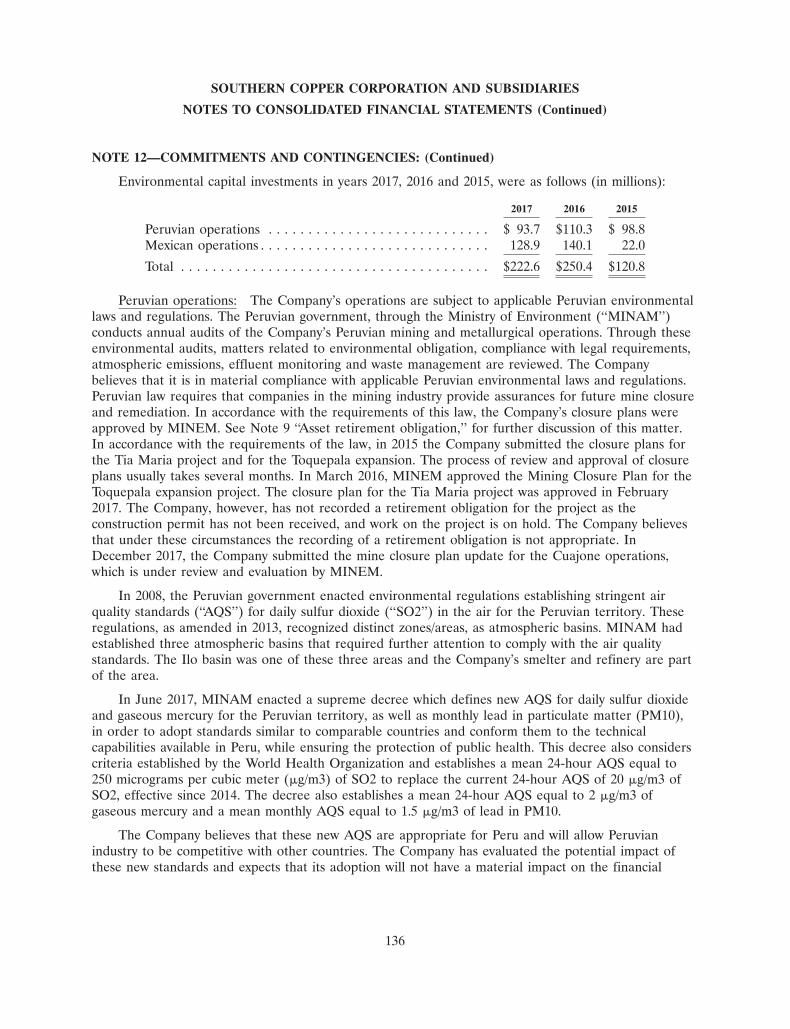
SOUTHERN COPPER CORPORATION AND SUBSIDIARIES
NOTES TO CONSOLIDATED FINANCIAL STATEMENTS (Continued)
NOTE 12—COMMITMENTS AND CONTINGENCIES: (Continued)
Environmental capital investments in years 2017, 2016 and 2015, were as follows (in millions):
2017 2016 2015
Peruvian operations . . . . . . . . . . . . . . . . . . . . . . . . . . . . $ 93.7 $110.3 $ 98.8Mexican operations . . . . . . . . . . . . . . . . . . . . . . . . . . . . . 128.9 140.1 22.0
Total . . . . . . . . . . . . . . . . . . . . . . . . . . . . . . . . . . . . . . . $222.6 $250.4 $120.8
Peruvian operations: The Company’s operations are subject to applicable Peruvian environmentallaws and regulations. The Peruvian government, through the Ministry of Environment (‘‘MINAM’’)conducts annual audits of the Company’s Peruvian mining and metallurgical operations. Through theseenvironmental audits, matters related to environmental obligation, compliance with legal requirements,atmospheric emissions, effluent monitoring and waste management are reviewed. The Companybelieves that it is in material compliance with applicable Peruvian environmental laws and regulations.Peruvian law requires that companies in the mining industry provide assurances for future mine closureand remediation. In accordance with the requirements of this law, the Company’s closure plans wereapproved by MINEM. See Note 9 ‘‘Asset retirement obligation,’’ for further discussion of this matter.In accordance with the requirements of the law, in 2015 the Company submitted the closure plans forthe Tia Maria project and for the Toquepala expansion. The process of review and approval of closureplans usually takes several months. In March 2016, MINEM approved the Mining Closure Plan for theToquepala expansion project. The closure plan for the Tia Maria project was approved in February2017. The Company, however, has not recorded a retirement obligation for the project as theconstruction permit has not been received, and work on the project is on hold. The Company believesthat under these circumstances the recording of a retirement obligation is not appropriate. InDecember 2017, the Company submitted the mine closure plan update for the Cuajone operations,which is under review and evaluation by MINEM.
In 2008, the Peruvian government enacted environmental regulations establishing stringent airquality standards (‘‘AQS’’) for daily sulfur dioxide (‘‘SO2’’) in the air for the Peruvian territory. Theseregulations, as amended in 2013, recognized distinct zones/areas, as atmospheric basins. MINAM hadestablished three atmospheric basins that required further attention to comply with the air qualitystandards. The Ilo basin was one of these three areas and the Company’s smelter and refinery are partof the area.
In June 2017, MINAM enacted a supreme decree which defines new AQS for daily sulfur dioxideand gaseous mercury for the Peruvian territory, as well as monthly lead in particulate matter (PM10),in order to adopt standards similar to comparable countries and conform them to the technicalcapabilities available in Peru, while ensuring the protection of public health. This decree also considerscriteria established by the World Health Organization and establishes a mean 24-hour AQS equal to250 micrograms per cubic meter (�g/m3) of SO2 to replace the current 24-hour AQS of 20 �g/m3 ofSO2, effective since 2014. The decree also establishes a mean 24-hour AQS equal to 2 �g/m3 ofgaseous mercury and a mean monthly AQS equal to 1.5 �g/m3 of lead in PM10.
The Company believes that these new AQS are appropriate for Peru and will allow Peruvianindustry to be competitive with other countries. The Company has evaluated the potential impact ofthese new standards and expects that its adoption will not have a material impact on the financial
136
SOUTHERN COPPER CORPORATION AND SUBSIDIARIES
NOTES TO CONSOLIDATED FINANCIAL STATEMENTS (Continued)
NOTE 12—COMMITMENTS AND CONTINGENCIES: (Continued)
position of the Company, as currently the Company maintains a lower daily average level of �g/m3 ofSO2, than those required by the new AQS.
In addition, in June 2017, MINAM enacted a supreme decree which establishes new qualitystandards for water in the Peruvian territory. The Company has reviewed this decree and considers thatits adoption will not have a material impact on its financial position.
In 2013, the Peruvian government enacted soil environmental quality standards (‘‘SQS’’) applicableto any existing facility or project that generates or could generate the risk of soil contamination in itsarea of operation or influence. In March 2014, MINAM issued a supreme decree, which establishesadditional provisions for the gradual implementation of SQS. Under this rule the Company had twelvemonths to identify contaminated sites in and around its facilities and present a report of identifiedcontaminated sites. These documents were submitted to MINEM for approval in April 2015. AfterMINEM’s review, the documents for the Company’s operations were fully approved in July 2017. Thenext step is for the Company to prepare a characterization study to determine the depth, extent andphysio-chemical composition of the contaminated areas and define an appropriate remediation planwith time-frame for completion. In addition, the Company must submit for approval a SoilDecontamination Plan (SDP) within 30 months after being notified by the authority. This SDP mustinclude remediation actions, a schedule and compliance deadlines. Also under this rule, if deemednecessary and given reasonable justification, the Company may request a one year extension for thedecontamination plan.
Soil confirmation tests must be carried out after completion of decontamination actions (within theapproved schedule) and results must be presented to authorities within 30 days after receiving suchresults. Non-compliance with this obligation or with decontamination goals will carry penalties, althoughno specific sanctions have been established yet. During compliance with this schedule, companiescannot be penalized for non-compliance with the SQS.
While the Company believes that there is a reasonable possibility that a potential loss contingencymay exist, it cannot currently estimate the amount of the contingency. The Company believes that areasonable determination of the loss will be possible once the characterization study and the SDP aresubstantially completed, which is expected for the first quarter of 2020. At that time the Company willbe in a position to estimate the remediation cost. Further, the Company does not believe that it canestimate a reasonable range of possible costs until the noted studies have substantially progressed andtherefore is not be able to disclose a range of costs that is meaningful.
Mexican operations: The Company’s operations are subject to applicable Mexican federal, stateand municipal environmental laws, to Mexican official standards, and to regulations for the protectionof the environment, including regulations relating to water supply, water quality, air quality, noise levelsand hazardous and solid waste.
The principal legislation applicable to the Company’s Mexican operations is the Federal GeneralLaw of Ecological Balance and Environmental Protection (the ‘‘General Law’’), which is enforced bythe Federal Bureau of Environmental Protection (‘‘PROFEPA’’). PROFEPA monitors compliance withenvironmental legislation and enforces Mexican environmental laws, regulations and official standards.It may also initiate administrative proceedings against companies that violate environmental laws, whichin the most extreme cases may result in the temporary or permanent shutdown of non-complyingfacilities, the revocation of operating licenses and/or other sanctions or fines.
137
SOUTHERN COPPER CORPORATION AND SUBSIDIARIES
NOTES TO CONSOLIDATED FINANCIAL STATEMENTS (Continued)
NOTE 12—COMMITMENTS AND CONTINGENCIES: (Continued)
In 2011, the General Law was amended, giving an individual or entity the ability to contestadministrative acts, including environmental authorizations, permits or concessions granted, without theneed to demonstrate the actual existence of harm to the environment as long as it can be argued thatthe harm may be caused. In addition, in 2011, amendments to the Civil Federal Procedures Code(‘‘CFPC’’) were enacted. These amendments establish three categories of collective actions by means ofwhich 30 or more people claiming injury derived from environmental, consumer protection, financialservices and economic competition issues will be considered to be sufficient in order to have alegitimate interest to seek through a civil procedure restitution or economic compensation orsuspension of the activities from which the alleged injury derived. The amendments to the CFPC mayresult in more litigation, with plaintiffs seeking remedies, including suspension of the activities allegedto cause harm.
In 2013, the Environmental Liability Federal Law was enacted. The law establishes generalguidelines for actions to be considered to likely cause environmental harm. If a possible determinationregarding harm occurs, environmental clean-up and remedial actions sufficient to restore environmentto a pre-existing condition should be taken. Under this law, if restoration is not possible, compensationmeasures should be provided. Criminal penalties and monetary fines can be imposed under this law.
2014 accidental spill at Buenavista mine: In 2014, an accidental spill of approximately 40,000 cubicmeters of copper sulfate solution occurred at a Buenavista mine leaching pond. This solution reachedthe Bacanuchi River and the Sonora River. The Company took immediate actions to contain the spill,and to comply with all necessary legal requirements. The Company hired contractors includingenvironmental specialists and assigned more than 1,200 of its own personnel to clean the river. Inaddition, the Company developed a service program to assist the residents of the Sonora River region.
• Administrative proceedings: The National Water Commission, the Federal Commission for theProtection of Sanitary Risk and PROFEPA initiated administrative proceedings regarding thespill to determine possible environmental and health damages. On September 15, 2014, theCompany executed an administrative agreement with PROFEPA, providing for the submission ofa remediation action plan to the Mexican Ministry of Environment and Natural Resources(Secretaria de Medio Ambiente y Recursos Naturales ‘‘SEMARNAT’’). The general remediationprogram submitted to SEMARNAT was approved on January 6, 2015.
The Company also created a trust with a Mexican development bank, acting as a Trustee tosupport environmental remedial actions in connection with the spill, to comply with the remedialaction plan and to compensate those persons adversely affected by the spill. The Companycommitted up to two billion Mexican pesos (approximately $150 million). A technical committeefor the trust was created with representatives from the federal government, the Company andspecialists assisted by a team of environmental experts to ensure the proper use of the funds.Along with the administrative agreement executed with PROFEPA, the trust served as analternative mechanism for dispute resolution to mitigate public and private litigation risks.
On December 1, 2016, SEMARNAT issued its final resolution which held that all remediationactions contained in the remediation plan, had been fulfilled and that all requirements had beencomplied with, except for biological monitoring activities at the Sonora River that will continueuntil the first semester of 2019 pursuant to the plan. On January 26, 2017, PROFEPA issued itsfinal resolution under which it declared all mitigation actions completed and its investigation
138
SOUTHERN COPPER CORPORATION AND SUBSIDIARIES
NOTES TO CONSOLIDATED FINANCIAL STATEMENTS (Continued)
NOTE 12—COMMITMENTS AND CONTINGENCIES: (Continued)
closed. In light of the above, the Company has obtained all necessary formal rulings fromSEMARNAT and PROFEPA. On February 7, 2017, the Company closed the trust. As a result,$10.2 million of excess provision was credited to income in the first quarter of 2017. The totalexpense recorded for this accident in 2014 and 2015 was $136.4 million. Therefore, theremediation concerns raised by SEMARNAT and PROFEPA have been addressed.
• Other procedures: On August 19, 2014, PROFEPA, as part of the administrative proceedinginitiated after the spill, announced the filing of a criminal complaint against Buenavista delCobre S.A. de C.V. (‘‘BVC’’), a subsidiary of the Company, in order to determine thoseresponsible for the environmental damages. The Company is vigorously defending itself againstthis complaint. As of December 31, 2017, the case remains pending resolution.
Through the first half of 2015, six collective action lawsuits were filed in federal courts inMexico City and Sonora against two subsidiaries of the Company seeking economiccompensation, clean up and remedial activities in order to restore the environment to itspre-existing conditions. Two of the collective action lawsuits have been dismissed by the court.The plaintiffs in the four remaining lawsuits are: Acciones Colectivas de Sinaloa, A.C. whichestablished two collective actions, Defensa Colectiva A.C.; and Ana Luisa Salazar Medina et al.which has been granted a collective action certification. The remaining plaintiffs have requestedcautionary measures on the construction of facilities for the monitoring of public health servicesand the prohibition of the closure of the Rıo Sonora Trust. As of December 31, 2017, thesecases remain pending resolution.
Similarly, during 2015, eight civil action lawsuits were filed against BVC in the state courts ofSonora seeking damages for alleged injuries and for moral damages as a consequence of thespill. The plaintiffs in the state court lawsuits are: Jose Vicente Arriola Nunez et al; SantanaRuiz Molina et al; Andres Nogales Romero et al; Teodoro Javier Robles et al; Gildardo VasquezCarvajal et al; Rafael Noriega Souffle et al; Grupo Banamichi Unido de Sonora El Dorado,S.C. de R.L. de C.V; and Marcelino Mercado Cruz. In 2016, three additional civil actionlawsuits, claiming similar damages, were filed by Juan Melquicedec Lebaron; Blanca LidiaValenzuela Rivera et al and Ramona Franco Quijada et al. In 2017, BVC was served withthirty-three additional civil action lawsuits, claiming similar damages. The lawsuits were filed byFrancisco Javier Molina Peralta et al; Anacleto Cohen Machini et al; Francisco Rafael AlvarezRuiz et al; Jose Alberto Martinez Bracamonte et al; Gloria del Carmen Ramirez Duarte et al;Flor Margarita Sabori et al; Blanca Esthela Ruiz Toledo et al; Julio Alfonso Corral Domınguezet al; Maria Eduwiges Bracamonte Villa et al; Francisca Marquez Dominguez et al; Jose JuanRomo Bravo et al; Jose Alfredo Garcia Leyva et al; Gloria Irma Dominguez Perez et al; Mariadel Refugio Romero et al; Miguel Rivas Medina et al; Yolanda Valenzuela Garrobo et al; MariaElena Garcia Leyva et al; Manuel Alfonso Ortiz Valenzuela et al; Francisco Alberto ArvayoRomero et al; Maria del Carmen Villanueva Lopez et al; Manuel Martin Garcia Salazar; MiguelGarcia Arguelles et al; Dora Elena Rodriguez Ochoa et al; Honora Eduwiges Ortiz Rodriguez etal; Francisco Jose Martinez Lopez et al; Maria Eduwiges Lopez Bustamante; Rodolfo BarronVilla et al, Jose Carlos Martinez Fernandez et al, Maria de los Angeles Fabela et al; RafaelaEdith Haro et al; Luz Mercedes Cruz et al; Juan Pedro Montano et al; and Juana Irma AldayVilla. As of December 31, 2017, these cases remain pending resolution.
139
SOUTHERN COPPER CORPORATION AND SUBSIDIARIES
NOTES TO CONSOLIDATED FINANCIAL STATEMENTS (Continued)
NOTE 12—COMMITMENTS AND CONTINGENCIES: (Continued)
During 2015, four constitutional lawsuits (juicios de amparo) were filed before Federal Courtsagainst various authorities and against a subsidiary of the Company, arguing; (i) the alleged lackof a waste management program approved by SEMARNAT; (ii) the alleged lack of aremediation plan approved by SEMARNAT with regard to the August 2014 spill; (iii) thealleged lack of community approval regarding the environmental impact authorizations grantedby SEMARNAT to one subsidiary of the Company; and (iv) the alleged inactivity of theauthorities with regard of the spill in August 2014. The plaintiffs of these lawsuits are: FranciscaGarcia Enriquez, et al which established two lawsuits, Francisco Ramon Miranda, et al and JesusDavid Lopez Peralta et al. During the third quarter of 2016, four additional constitutionallawsuits, claiming similar damages were filed by Mario Alberto Salcido et al; Maria ElenaHeredia Bustamante et al; Martin Eligio Ortiz Gamez et al; and Maria de los Angeles EnriquezBacame et al. During the third quarter of 2017, BVC was served with another constitutionallawsuit filed by Francisca Garcıa Enriquez et al. As of December 31, 2017, these cases remainpending resolution.
It is not currently possible to determine the extent of the damages sought in these state andfederal lawsuits but the Company considers that these lawsuits are without merit. Accordingly, theCompany is vigorously defending against them. Nevertheless, the Company considers that none of thelegal proceedings resulting from the spill, individually or in the aggregate, would have a material effecton its financial position or results of operations.
The Company believes that all of its facilities in Peru and Mexico are in material compliance withapplicable environmental, mining and other laws and regulations.
The Company also believes that continued compliance with environmental laws of Mexico andPeru will not have a material adverse effect on the Company’s business, properties, result of operations,financial condition or prospects and will not result in material capital investments.
Litigation matters:
The ‘‘Virgen Maria’’ Mining Concessions of the Tia Maria Mining Project
The Tia Maria project includes various mining concessions, totaling 32,989.64 hectares. One of theconcessions is the ‘‘Virgen Maria’’ mining concession totaling 943.72 hectares or 2.9% of the totalmining concessions.
Related to the ‘‘Virgen Maria’’ mining concessions, in August 2009, a lawsuit was filed againstSCC’s Branch by the former stockholders of Exploraciones de Concesiones Metalicas S.A.C.(‘‘Excomet’’). The plaintiffs allege that the acquisition of Excomet’s shares by the Branch is null andvoid because the $2 million purchase price paid by the Branch for the shares of Excomet was not fairlynegotiated by the plaintiffs and the Branch. In 2005, the Branch acquired the shares of Excomet afterlengthy negotiations with the plaintiffs, and after the plaintiffs, which were all the stockholders ofExcomet, approved the transaction in a general stockholders’ meeting. Excomet was at the time ownerof the ‘‘Virgen Maria’’ mining concession. In October 2011, the civil court dismissed the case on thegrounds that the claim had been barred by the statute of limitations. On appeal by the plaintiffs, theSuperior Court reversed the lower court’s decision and remanded it to the lower court for furtherproceedings. In August 2015, the lower court dismissed the case on the grounds that the plaintiffs hadnot proven the alleged unfairness of the negotiations. The plaintiffs appealed this resolution before the
140
SOUTHERN COPPER CORPORATION AND SUBSIDIARIES
NOTES TO CONSOLIDATED FINANCIAL STATEMENTS (Continued)
NOTE 12—COMMITMENTS AND CONTINGENCIES: (Continued)
Superior Court. In September 2016, the Superior Court confirmed the lower court’s resolution and theplaintiffs filed an extraordinary appeal in order to have the case reviewed by the Supreme Court. InJune 2017, the Supreme Court dismissed the extraordinary appeal filed by the plaintiffs. Therefore, thelawsuit ended favorably for the Company.
The Tia Maria Mining Project
There are four lawsuits filed against the Peruvian Branch of the Company related to the Tia Mariaproject. The lawsuits seek (i) to declare null and void the resolution which approved the EnvironmentalImpact Assessment of the project; (ii) the cancellation of the project and the withdrawal of miningactivities in the area and (iii) to declare null and void the mining concession application of the TiaMaria project. The lawsuits were filed by Messrs. Jorge Isaac del Carpio Lazo (filed May 22, 2015),Ernesto Mendoza Padilla (filed May 26, 2015), Juan Alberto Guillen Lopez (filed June 18, 2015) andNicolas Belfiore Nicolini (filed November 13, 2015).
The del Carpio Lazio case was rejected by the court of first instance on November 14, 2016. Theplaintiff filed an appeal before the Superior Court on January 3, 2017. On January 9, 2018, the lawyersof both parties presented their respective positions before the Appellate Court. As of February 20,2018, the case remains pending resolution.
The Mendoza Padilla case was rejected by the lower court on July 8, 2015. This ruling wasconfirmed by the Superior Court on June 14, 2016. On July 12, 2016, the case was appealed before theConstitutional Court. As of December 31, 2017, the case remains pending resolution without furtherdevelopments.
The Guillen Lopez case is currently before the lower court. As of December 31, 2017, the caseremains pending resolution without further developments.
In the Belfiore Nicolini case, the court ruled partially in favor of the plaintiff. However, theCompany filed an appeal to challenge said decision. As of February 20, 2018, the file was sent to theAppelllate Court for reviewing.
The Company asserts that these lawsuits are without merit and is vigorously defending againstthem. The potential contingency amount for these cases cannot be reasonably estimated bymanagement at this time.
Special Regional Pasto Grande Project (‘‘Pasto Grande Project’’)
In 2012, the Pasto Grande Project, an entity of the Regional Government of Moquegua, filed alawsuit against SCC’s Peruvian Branch alleging property rights over a certain area used by the PeruvianBranch and seeking the demolition of the tailings dam where SCC’s Peruvian Branch has deposited itstailings from the Toquepala and Cuajone operations since 1995. The Peruvian Branch has had title touse the area in question since 1960 and has constructed and operated the tailing dams with propergovernmental authorization, since 1995. Upon a motion filed by the Peruvian Branch, the lower courthas included MINEM as a defendant in this lawsuit. MINEM has answered the complaint and deniedthe validity of the claim. As of December 31, 2017, the case remains pending resolution without furtherdevelopments. SCC’s Peruvian Branch asserts that the lawsuit is without merit and is vigorouslydefending against it. The amount of this contingency cannot be reasonably estimated by management atthis time.
141
SOUTHERN COPPER CORPORATION AND SUBSIDIARIES
NOTES TO CONSOLIDATED FINANCIAL STATEMENTS (Continued)
NOTE 12—COMMITMENTS AND CONTINGENCIES: (Continued)
Carla Lacey and Barbara Siegfried, on behalf of themselves and all other similarly situated stockholdersof Southern Copper Corporation, and derivatively on behalf of Southern Copper Corporation
A purported class action derivative lawsuit filed in the Delaware Court of Chancery was served onthe Company and its Directors in February 2016 relating to the 2012 capitalization of 99.999% of MGEby Controladora de Infraestructura Energetica Mexico, S.A. de C.V., an indirect subsidiary of GrupoMexico (the ‘‘CIEM Capitalization’’), the Company’s entry into a power purchase agreement withMGE in 2012 (the ‘‘MGE Power Purchase Agreement’’), and the 2012 restructuring of a loan from theCompany’s Mexican Operations to MGE for the construction of two power plants to supply power tothe Company’s Mexican operations (the ‘‘MGE Loan Restructuring’’). The action purports to bebrought on behalf of the Company and its common stockholders. The complaint alleges, among otherthings, that the CIEM Capitalization, the MGE Power Purchase Agreement and the MGE LoanRestructuring were the result of breaches of fiduciary duties and the Company’s charter. The Companyhas filed a response denying these allegations and is currently in the discovery process.
Labor matters:
Peruvian operations: 69% of the Company’s 4,628 Peruvian employees were unionized atDecember, 2017. Currently, there are six separate unions, one large union and five smaller unions. Inthe first quarter of 2016, the Company signed three-year agreements with five unions. Theseagreements include, among other things, annual salary increases of 5% for each of the three years.
In April 2017, the Unified Labor Union of SPCC workers and one of Toquepala’s unions began astrike, demanding a review of certain health and profit sharing benefits. The strike ended after 12 days.These two unions began illegal strikes in July and November 2017, that lasted five days and 21 days,respectively. The Company estimates that the loss of copper production resulting from the 2017 strikeswas not significant and its sales contracts were not affected.
Mexican operations: In recent years, the Mexican operations have experienced a positiveimprovement of their labor environment, as its workers opted to change their affiliation from theSindicato Nacional de Trabajadores Mineros, Metalurgicos y Similares de la Republica Mexicana (the‘‘National Mining Union’’) to other less politicized unions.
However, the workers of the San Martin and Taxco mines, are still under the National MiningUnion and have been on strike since July 2007. On December 10, 2009, a federal court confirmed thelegality of the San Martin strike. In order to recover the control of the San Martin mine and resumeoperations, the Company filed a court petition on January 27, 2011 requesting that the court, amongother things, define the termination payment for each unionized worker. The court denied the petitionalleging that, according to federal labor law, the union was the only legitimate party to file suchpetition. On appeal by the Company, on May 13, 2011, the Mexican federal tribunal accepted thepetition. In July 2011, the National Mining Union appealed the favorable court decision before theSupreme Court. On November 7, 2012, the Supreme Court affirmed the decision of the federaltribunal. The Company filed a new proceeding before the labor court on the basis of the SupremeCourt decision, which recognized the right of the labor court to define responsibility for the strike andthe termination payment for each unionized worker. A favorable decision of the labor court in this newproceeding would have the effect of terminating the protracted strike at San Martin. As ofDecember 31, 2017, the case remains pending resolution without further developments.
142
SOUTHERN COPPER CORPORATION AND SUBSIDIARIES
NOTES TO CONSOLIDATED FINANCIAL STATEMENTS (Continued)
NOTE 12—COMMITMENTS AND CONTINGENCIES: (Continued)
In the case of the Taxco mine, following the workers refusal to allow exploration of new reserves,the Company commenced litigation seeking to terminate the labor relationship with workers at themine (including termination of the related collective bargaining agreement). On September 1, 2010, thefederal labor court issued a ruling approving the termination of the collective bargaining agreement andall the individual labor contracts of the workers affiliated with the Mexican mining union at the Taxcomine. The mining union appealed the labor court ruling before a federal court. In September 2011, thefederal court accepted the union’s appeal and remanded the case to the federal labor court forreconsideration. After several legal proceedings on January 25, 2013, the Company filed a newproceeding before the labor court. On June 16, 2014, the labor court denied the petition of theCompany. The resolution issued by the labor court was challenged by the Company before a federalcourt. In August 2015, the Supreme Court decided to assert jurisdiction over the case and to rule on itdirectly. As of December 31, 2017, the case remains pending resolution without further developments.
It is expected that operations at these mines will remain suspended until these labor issues areresolved. In view of these lengthy strikes, the Company has reviewed the carrying value of the SanMartin and Taxco mines to ascertain whether impairment exists. The Company concluded that there isa non-material impairment of the assets located at these mines.
Other legal matters:
The Company is involved in various other legal proceedings incidental to its operations, but doesnot believe that decisions adverse to it in any such proceedings, individually or in the aggregate, wouldhave a material effect on its financial position or results of operations.
Other commitments:
Peruvian Operations
Tia Maria:
On August 1, 2014, the Company received the final approval of Tia Maria´s Environmental ImpactAssessment (‘‘EIA’’). However, the issuance of the project´s construction permit has been delayed dueto pressures from anti-mining groups. The Company continues working with community groups in orderto resolve open issues concerning the project. The Company is also working jointly with the PeruvianGovernment to obtain the construction license for this 120,000 tons of SX-EW copper per yeargreenfield project. The Company expects the license to be issued in the first half of 2018.
Tia Maria´s project budget is approximately $1.4 billion, of which $353.9 million has been investedthrough December 31, 2017. When completed, it is expected to produce 120,000 tons of coppercathodes per year. This project will use state-of-the-art SX-EW technology with the highestinternational environmental standards. SX-EW facilities are the most environmentally friendly in theindustry as they do not require a smelting process and consequently, no emissions are released into theatmosphere. The project will only use seawater, transporting this more than 25 kilometers to1,000 meters above sea level, and includes a desalinization plant which will be constructed at a cost of$95 million. Consequently, the Tambo river water resources and the water resources from the wells inthe area will be used solely for farming and human consumption.
The Company expects the project to generate 3,500 jobs during the construction phase. When inoperation, Tia Maria will directly employ 600 workers and indirectly provide jobs to another 2,000.
143
SOUTHERN COPPER CORPORATION AND SUBSIDIARIES
NOTES TO CONSOLIDATED FINANCIAL STATEMENTS (Continued)
NOTE 12—COMMITMENTS AND CONTINGENCIES: (Continued)
Through its expected twenty-year life, the project related services will create significant businessopportunities in the Arequipa region.
In view of the delay in this project, the Company continues to review the carrying value of thisasset to ascertain whether impairment exists. Should the Tia Maria project not move forward, theCompany is confident that most of the project equipment will continue to be used productively,through reassignment to other mine locations operated by the Company. The Company believes that animpairment loss, if any, will not be material.
Toquepala Concentrator Expansion:
In April 2015, the construction permit for the Toquepala expansion project was approved by theMINEM. The project budget is $1.2 billion, of which $892.9 million has been expended throughDecember 31, 2017. When completed, this expansion project is expected to increase annual productioncapacity by 100,000 tons of copper and 3,100 tons of molybdenum. The project has reached 87%progress and is expected to be completed by the third quarter of 2018.
Corporate Social Responsibility:
The Company has a corporate social responsibility policy to maintain and promote continuity of itsmining operations and obtain the best results. The main objective of this policy is to integrate itsoperations with the local communities in the areas of influence of its operations by creating apermanent positive relationship with them, in order to develop the optimum social conditions and topromote sustainable development in the area. Accordingly, the Company has made the followingcommitments:
Tacna Region: In connection with the Toquepala concentrator expansion, the Company hascommitted to fund various social and infrastructure improvement projects in Toquepala’s neighboringcommunities. The total amount committed for these purposes is S/ 445.0 million (approximately$132 million).
Moquegua Region: In the Moquegua region, the Company is part of a ‘‘development roundtable’’in which the local municipal authorities, the community representatives and the Company discuss thesocial needs and the way the Company could contribute to sustainable development in the region. Aspart of this, the roundtable is discussing the creation of a Moquegua Region Development Fund forwhich the Company has offered a contribution of S/ 700 million (approximately $209 million). Whilefinal funding is not yet settled, the Company has committed to contribute S/ 108.5 million(approximately $32 million) in advance, which is being utilized in an educational project andS/ 48.4 million (approximately $14 million) for a residual water treatment plant in Ilo, a sea-wallembankment and a fresh water facility at El Algarrobal.
In addition, the Company has committed S/ 143.0 million (approximately $43 million) for theconstruction of five infrastructure projects in the Moquegua region under the ‘‘social investment fortaxes’’ (obras por impuestos) program which allows the Company to use these amounts as an advancepayment of taxes.
144
SOUTHERN COPPER CORPORATION AND SUBSIDIARIES
NOTES TO CONSOLIDATED FINANCIAL STATEMENTS (Continued)
NOTE 12—COMMITMENTS AND CONTINGENCIES: (Continued)
These commitments are subject to the continuity of the respective mine operations and, as such,are not considered to be present obligations of the Company. Therefore, the Company has notrecorded a liability in its consolidated financial statements.
Power purchase agreements
• Electroperu S.A.: In June 2014, the Company entered into a power purchase agreement for120 megawatt (‘‘MW’’) with the state power company Electroperu S.A., under whichElectroperu S.A. began supplying energy for the Peruvian operations for twenty years starting onApril 17, 2017.
• Kallpa Generacion S.A. (‘‘Kallpa’’): In July 2014, the Company entered into a power purchaseagreement for 120MW with Kallpa, an independent Israeli owned power company, under whichKallpa will supply energy for the Peruvian operations for ten years starting on April 17, 2017and ending on April 30, 2027. In May 2016, the Company signed an additional power purchaseagreement for a maximum of 80MW with Kallpa, under which Kallpa began supplying energyfor the Peruvian operations related to the Toquepala Expansion and other minor projects for tenyears starting on May 1, 2017 and ending after ten years of commercial operation of theToquepala Expansion or on April 30, 2029; whichever occurs first. On August 16, 2017, Kallpamerged with Cerro del Aguila S.A. (another power generating company owned by the sameeconomic group); the name of the merged entity is still Kallpa Generacion S.A. and both powerpurchase agreements signed with Kallpa have not been affected by the noted merger.
Mexican operations
Power purchase agreements:
• MGE: In 2012, the Company signed a power purchase agreement with MGE, an indirectsubsidiary of Grupo Mexico, to supply power to some of the Company’s Mexican operationsthrough 2032. For further information, please see Note 16 ‘‘Related party transactions’’.
• Eolica el Retiro S.A.P.I. de C.V.: In 2013, the Company signed a power purchase agreement withEolica el Retiro, S.A.P.I de C.V. a windfarm energy producer that is an indirect subsidiary ofGrupo Mexico, to supply power to some of the Company´s Mexican operations. For furtherinformation, please see Note 16 ‘‘Related party transactions’’.
For an estimate of the Company’s contractual obligations for power purchases, please see,‘‘Contractual Obligations’’ under Item 7 ‘‘Management Discussion and Analysis of Financial Conditionand Results of Operations.’’
Commitment for Capital projects:
As of December 31, 2017, the Company has committed approximately $1,409.3 million for thedevelopment of its capital investment projects.
Tax contingency matters:
Tax contingencies are provided for under ASC 740-10-50-15 Uncertain tax position (seeNote 7 ‘‘Income taxes’’).
145
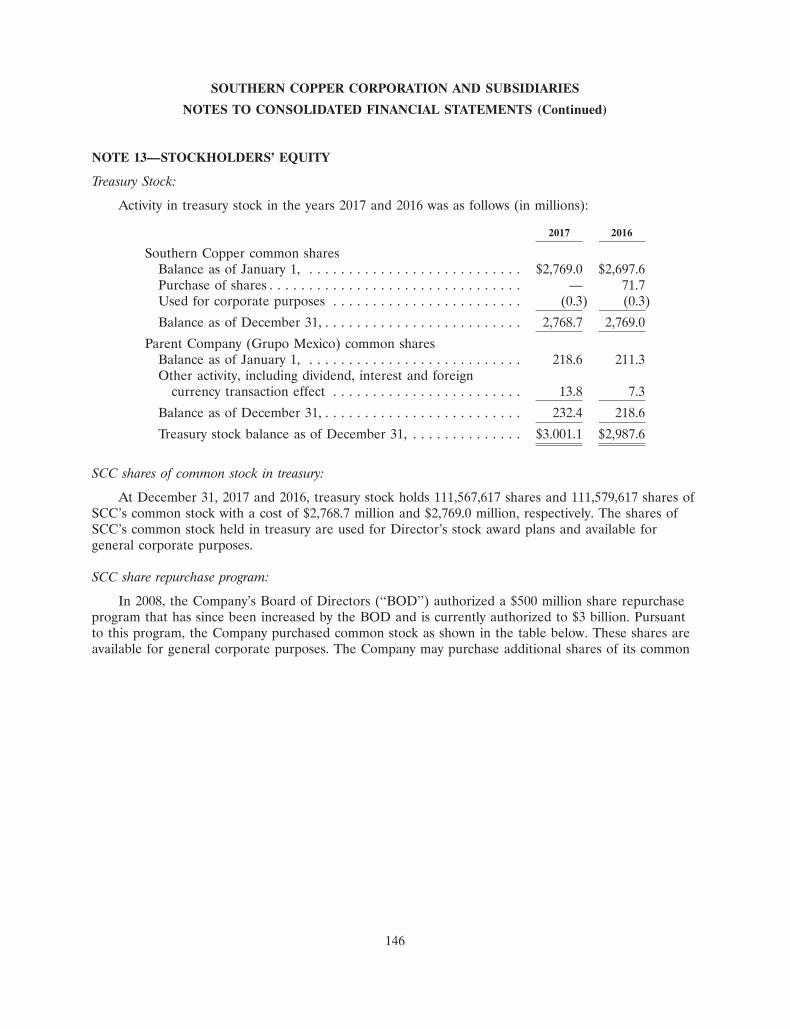
SOUTHERN COPPER CORPORATION AND SUBSIDIARIES
NOTES TO CONSOLIDATED FINANCIAL STATEMENTS (Continued)
NOTE 13—STOCKHOLDERS’ EQUITY
Treasury Stock:
Activity in treasury stock in the years 2017 and 2016 was as follows (in millions):
2017 2016
Southern Copper common sharesBalance as of January 1, . . . . . . . . . . . . . . . . . . . . . . . . . . . $2,769.0 $2,697.6Purchase of shares . . . . . . . . . . . . . . . . . . . . . . . . . . . . . . . . — 71.7Used for corporate purposes . . . . . . . . . . . . . . . . . . . . . . . . (0.3) (0.3)
Balance as of December 31, . . . . . . . . . . . . . . . . . . . . . . . . . 2,768.7 2,769.0
Parent Company (Grupo Mexico) common sharesBalance as of January 1, . . . . . . . . . . . . . . . . . . . . . . . . . . . 218.6 211.3Other activity, including dividend, interest and foreign
currency transaction effect . . . . . . . . . . . . . . . . . . . . . . . . 13.8 7.3
Balance as of December 31, . . . . . . . . . . . . . . . . . . . . . . . . . 232.4 218.6
Treasury stock balance as of December 31, . . . . . . . . . . . . . . $3.001.1 $2,987.6
SCC shares of common stock in treasury:
At December 31, 2017 and 2016, treasury stock holds 111,567,617 shares and 111,579,617 shares ofSCC’s common stock with a cost of $2,768.7 million and $2,769.0 million, respectively. The shares ofSCC’s common stock held in treasury are used for Director’s stock award plans and available forgeneral corporate purposes.
SCC share repurchase program:
In 2008, the Company’s Board of Directors (‘‘BOD’’) authorized a $500 million share repurchaseprogram that has since been increased by the BOD and is currently authorized to $3 billion. Pursuantto this program, the Company purchased common stock as shown in the table below. These shares areavailable for general corporate purposes. The Company may purchase additional shares of its common
146
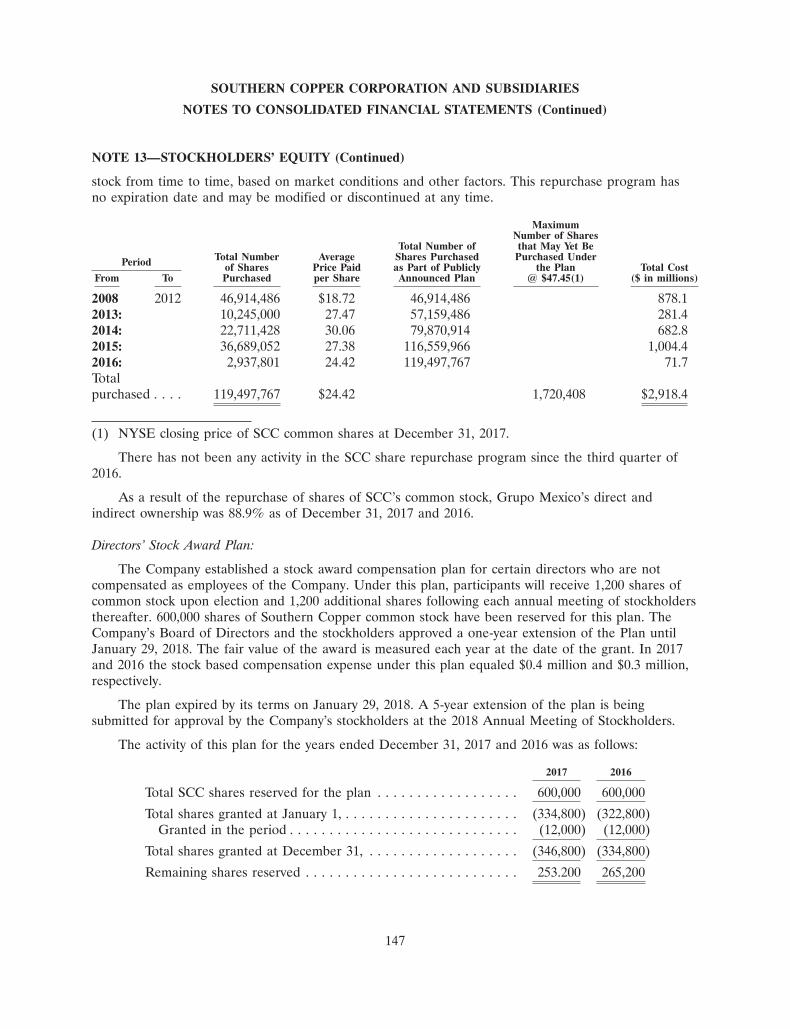
SOUTHERN COPPER CORPORATION AND SUBSIDIARIES
NOTES TO CONSOLIDATED FINANCIAL STATEMENTS (Continued)
NOTE 13—STOCKHOLDERS’ EQUITY (Continued)
stock from time to time, based on market conditions and other factors. This repurchase program hasno expiration date and may be modified or discontinued at any time.
MaximumNumber of Shares
Total Number of that May Yet BeTotal Number Average Shares Purchased Purchased UnderPeriod of Shares Price Paid as Part of Publicly the Plan Total Cost
From To Purchased per Share Announced Plan @ $47.45(1) ($ in millions)
2008 2012 46,914,486 $18.72 46,914,486 878.12013: 10,245,000 27.47 57,159,486 281.42014: 22,711,428 30.06 79,870,914 682.82015: 36,689,052 27.38 116,559,966 1,004.42016: 2,937,801 24.42 119,497,767 71.7Totalpurchased . . . . 119,497,767 $24.42 1,720,408 $2,918.4
(1) NYSE closing price of SCC common shares at December 31, 2017.
There has not been any activity in the SCC share repurchase program since the third quarter of2016.
As a result of the repurchase of shares of SCC’s common stock, Grupo Mexico’s direct andindirect ownership was 88.9% as of December 31, 2017 and 2016.
Directors’ Stock Award Plan:
The Company established a stock award compensation plan for certain directors who are notcompensated as employees of the Company. Under this plan, participants will receive 1,200 shares ofcommon stock upon election and 1,200 additional shares following each annual meeting of stockholdersthereafter. 600,000 shares of Southern Copper common stock have been reserved for this plan. TheCompany’s Board of Directors and the stockholders approved a one-year extension of the Plan untilJanuary 29, 2018. The fair value of the award is measured each year at the date of the grant. In 2017and 2016 the stock based compensation expense under this plan equaled $0.4 million and $0.3 million,respectively.
The plan expired by its terms on January 29, 2018. A 5-year extension of the plan is beingsubmitted for approval by the Company’s stockholders at the 2018 Annual Meeting of Stockholders.
The activity of this plan for the years ended December 31, 2017 and 2016 was as follows:
2017 2016
Total SCC shares reserved for the plan . . . . . . . . . . . . . . . . . . 600,000 600,000
Total shares granted at January 1, . . . . . . . . . . . . . . . . . . . . . . (334,800) (322,800)Granted in the period . . . . . . . . . . . . . . . . . . . . . . . . . . . . . (12,000) (12,000)
Total shares granted at December 31, . . . . . . . . . . . . . . . . . . . (346,800) (334,800)
Remaining shares reserved . . . . . . . . . . . . . . . . . . . . . . . . . . . 253.200 265,200
147
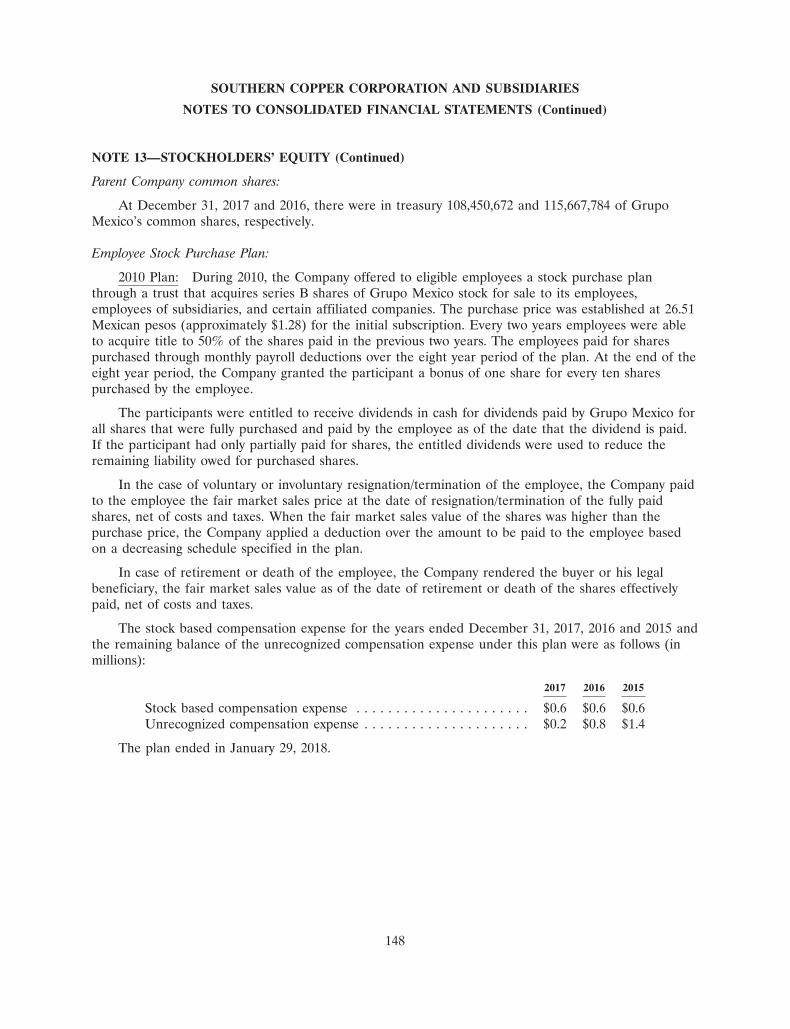
SOUTHERN COPPER CORPORATION AND SUBSIDIARIES
NOTES TO CONSOLIDATED FINANCIAL STATEMENTS (Continued)
NOTE 13—STOCKHOLDERS’ EQUITY (Continued)
Parent Company common shares:
At December 31, 2017 and 2016, there were in treasury 108,450,672 and 115,667,784 of GrupoMexico’s common shares, respectively.
Employee Stock Purchase Plan:
2010 Plan: During 2010, the Company offered to eligible employees a stock purchase planthrough a trust that acquires series B shares of Grupo Mexico stock for sale to its employees,employees of subsidiaries, and certain affiliated companies. The purchase price was established at 26.51Mexican pesos (approximately $1.28) for the initial subscription. Every two years employees were ableto acquire title to 50% of the shares paid in the previous two years. The employees paid for sharespurchased through monthly payroll deductions over the eight year period of the plan. At the end of theeight year period, the Company granted the participant a bonus of one share for every ten sharespurchased by the employee.
The participants were entitled to receive dividends in cash for dividends paid by Grupo Mexico forall shares that were fully purchased and paid by the employee as of the date that the dividend is paid.If the participant had only partially paid for shares, the entitled dividends were used to reduce theremaining liability owed for purchased shares.
In the case of voluntary or involuntary resignation/termination of the employee, the Company paidto the employee the fair market sales price at the date of resignation/termination of the fully paidshares, net of costs and taxes. When the fair market sales value of the shares was higher than thepurchase price, the Company applied a deduction over the amount to be paid to the employee basedon a decreasing schedule specified in the plan.
In case of retirement or death of the employee, the Company rendered the buyer or his legalbeneficiary, the fair market sales value as of the date of retirement or death of the shares effectivelypaid, net of costs and taxes.
The stock based compensation expense for the years ended December 31, 2017, 2016 and 2015 andthe remaining balance of the unrecognized compensation expense under this plan were as follows (inmillions):
2017 2016 2015
Stock based compensation expense . . . . . . . . . . . . . . . . . . . . . . $0.6 $0.6 $0.6Unrecognized compensation expense . . . . . . . . . . . . . . . . . . . . . $0.2 $0.8 $1.4
The plan ended in January 29, 2018.
148
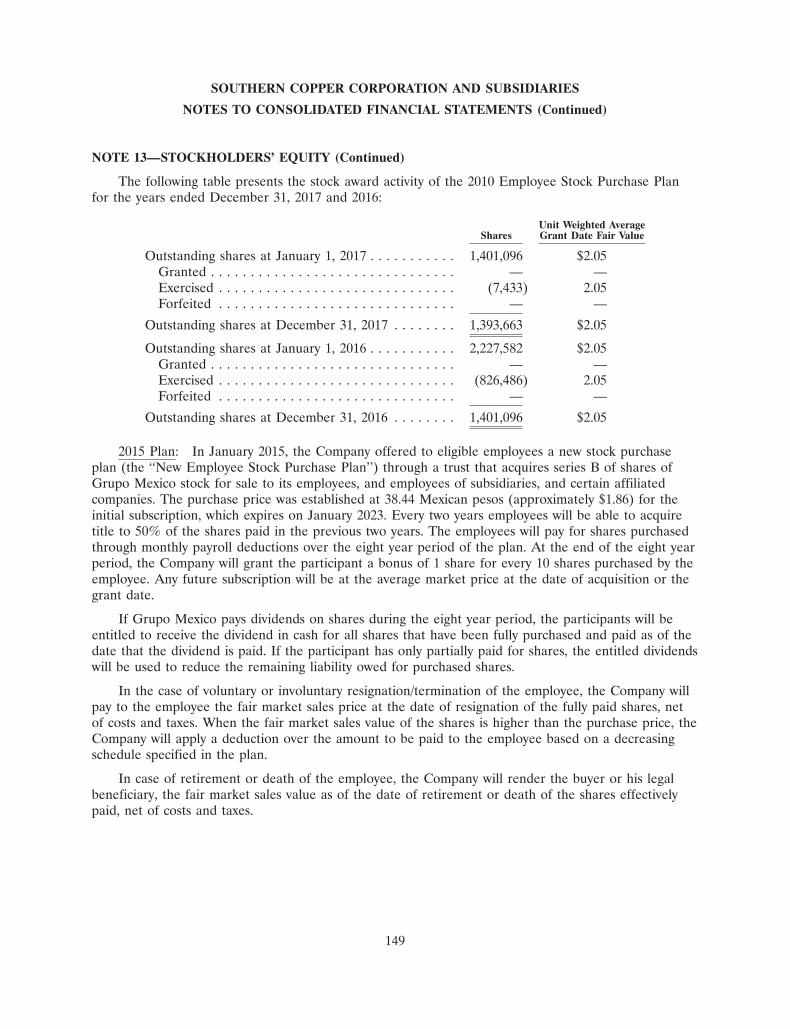
SOUTHERN COPPER CORPORATION AND SUBSIDIARIES
NOTES TO CONSOLIDATED FINANCIAL STATEMENTS (Continued)
NOTE 13—STOCKHOLDERS’ EQUITY (Continued)
The following table presents the stock award activity of the 2010 Employee Stock Purchase Planfor the years ended December 31, 2017 and 2016:
Unit Weighted AverageShares Grant Date Fair Value
Outstanding shares at January 1, 2017 . . . . . . . . . . . 1,401,096 $2.05Granted . . . . . . . . . . . . . . . . . . . . . . . . . . . . . . . — —Exercised . . . . . . . . . . . . . . . . . . . . . . . . . . . . . . (7,433) 2.05Forfeited . . . . . . . . . . . . . . . . . . . . . . . . . . . . . . — —
Outstanding shares at December 31, 2017 . . . . . . . . 1,393,663 $2.05
Outstanding shares at January 1, 2016 . . . . . . . . . . . 2,227,582 $2.05Granted . . . . . . . . . . . . . . . . . . . . . . . . . . . . . . . — —Exercised . . . . . . . . . . . . . . . . . . . . . . . . . . . . . . (826,486) 2.05Forfeited . . . . . . . . . . . . . . . . . . . . . . . . . . . . . . — —
Outstanding shares at December 31, 2016 . . . . . . . . 1,401,096 $2.05
2015 Plan: In January 2015, the Company offered to eligible employees a new stock purchaseplan (the ‘‘New Employee Stock Purchase Plan’’) through a trust that acquires series B of shares ofGrupo Mexico stock for sale to its employees, and employees of subsidiaries, and certain affiliatedcompanies. The purchase price was established at 38.44 Mexican pesos (approximately $1.86) for theinitial subscription, which expires on January 2023. Every two years employees will be able to acquiretitle to 50% of the shares paid in the previous two years. The employees will pay for shares purchasedthrough monthly payroll deductions over the eight year period of the plan. At the end of the eight yearperiod, the Company will grant the participant a bonus of 1 share for every 10 shares purchased by theemployee. Any future subscription will be at the average market price at the date of acquisition or thegrant date.
If Grupo Mexico pays dividends on shares during the eight year period, the participants will beentitled to receive the dividend in cash for all shares that have been fully purchased and paid as of thedate that the dividend is paid. If the participant has only partially paid for shares, the entitled dividendswill be used to reduce the remaining liability owed for purchased shares.
In the case of voluntary or involuntary resignation/termination of the employee, the Company willpay to the employee the fair market sales price at the date of resignation of the fully paid shares, netof costs and taxes. When the fair market sales value of the shares is higher than the purchase price, theCompany will apply a deduction over the amount to be paid to the employee based on a decreasingschedule specified in the plan.
In case of retirement or death of the employee, the Company will render the buyer or his legalbeneficiary, the fair market sales value as of the date of retirement or death of the shares effectivelypaid, net of costs and taxes.
149
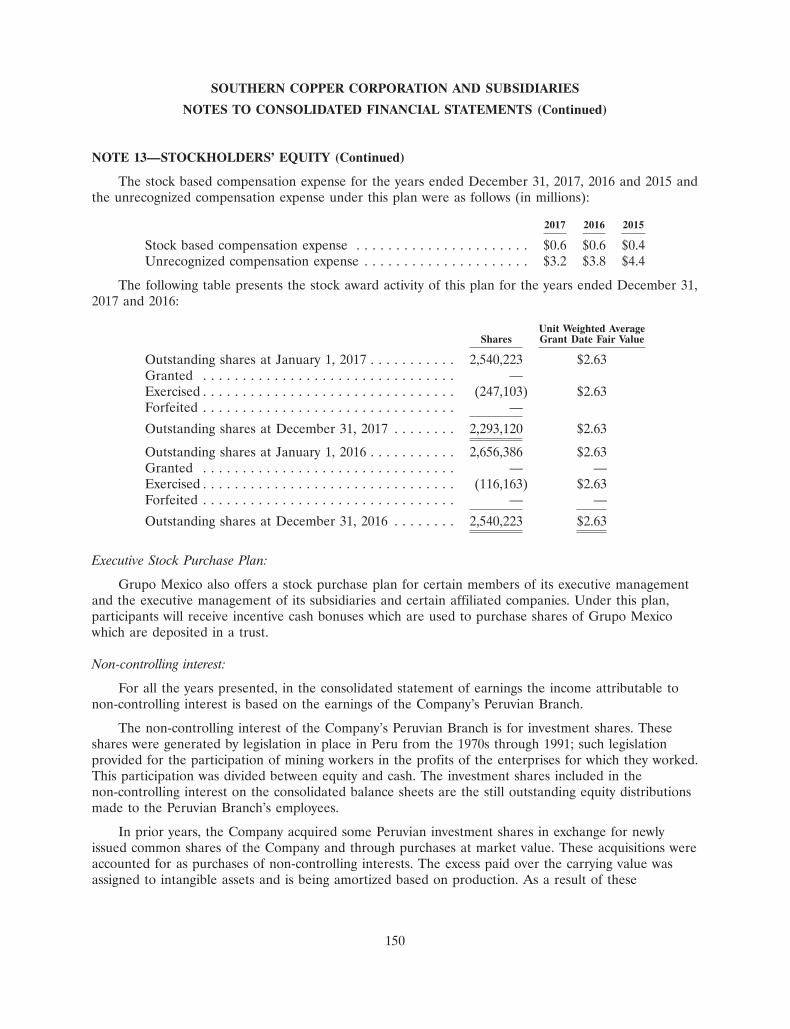
SOUTHERN COPPER CORPORATION AND SUBSIDIARIES
NOTES TO CONSOLIDATED FINANCIAL STATEMENTS (Continued)
NOTE 13—STOCKHOLDERS’ EQUITY (Continued)
The stock based compensation expense for the years ended December 31, 2017, 2016 and 2015 andthe unrecognized compensation expense under this plan were as follows (in millions):
2017 2016 2015
Stock based compensation expense . . . . . . . . . . . . . . . . . . . . . . $0.6 $0.6 $0.4Unrecognized compensation expense . . . . . . . . . . . . . . . . . . . . . $3.2 $3.8 $4.4
The following table presents the stock award activity of this plan for the years ended December 31,2017 and 2016:
Unit Weighted AverageShares Grant Date Fair Value
Outstanding shares at January 1, 2017 . . . . . . . . . . . 2,540,223 $2.63Granted . . . . . . . . . . . . . . . . . . . . . . . . . . . . . . . . —Exercised . . . . . . . . . . . . . . . . . . . . . . . . . . . . . . . . (247,103) $2.63Forfeited . . . . . . . . . . . . . . . . . . . . . . . . . . . . . . . . —
Outstanding shares at December 31, 2017 . . . . . . . . 2,293,120 $2.63
Outstanding shares at January 1, 2016 . . . . . . . . . . . 2,656,386 $2.63Granted . . . . . . . . . . . . . . . . . . . . . . . . . . . . . . . . — —Exercised . . . . . . . . . . . . . . . . . . . . . . . . . . . . . . . . (116,163) $2.63Forfeited . . . . . . . . . . . . . . . . . . . . . . . . . . . . . . . . — —
Outstanding shares at December 31, 2016 . . . . . . . . 2,540,223 $2.63
Executive Stock Purchase Plan:
Grupo Mexico also offers a stock purchase plan for certain members of its executive managementand the executive management of its subsidiaries and certain affiliated companies. Under this plan,participants will receive incentive cash bonuses which are used to purchase shares of Grupo Mexicowhich are deposited in a trust.
Non-controlling interest:
For all the years presented, in the consolidated statement of earnings the income attributable tonon-controlling interest is based on the earnings of the Company’s Peruvian Branch.
The non-controlling interest of the Company’s Peruvian Branch is for investment shares. Theseshares were generated by legislation in place in Peru from the 1970s through 1991; such legislationprovided for the participation of mining workers in the profits of the enterprises for which they worked.This participation was divided between equity and cash. The investment shares included in thenon-controlling interest on the consolidated balance sheets are the still outstanding equity distributionsmade to the Peruvian Branch’s employees.
In prior years, the Company acquired some Peruvian investment shares in exchange for newlyissued common shares of the Company and through purchases at market value. These acquisitions wereaccounted for as purchases of non-controlling interests. The excess paid over the carrying value wasassigned to intangible assets and is being amortized based on production. As a result of these
150
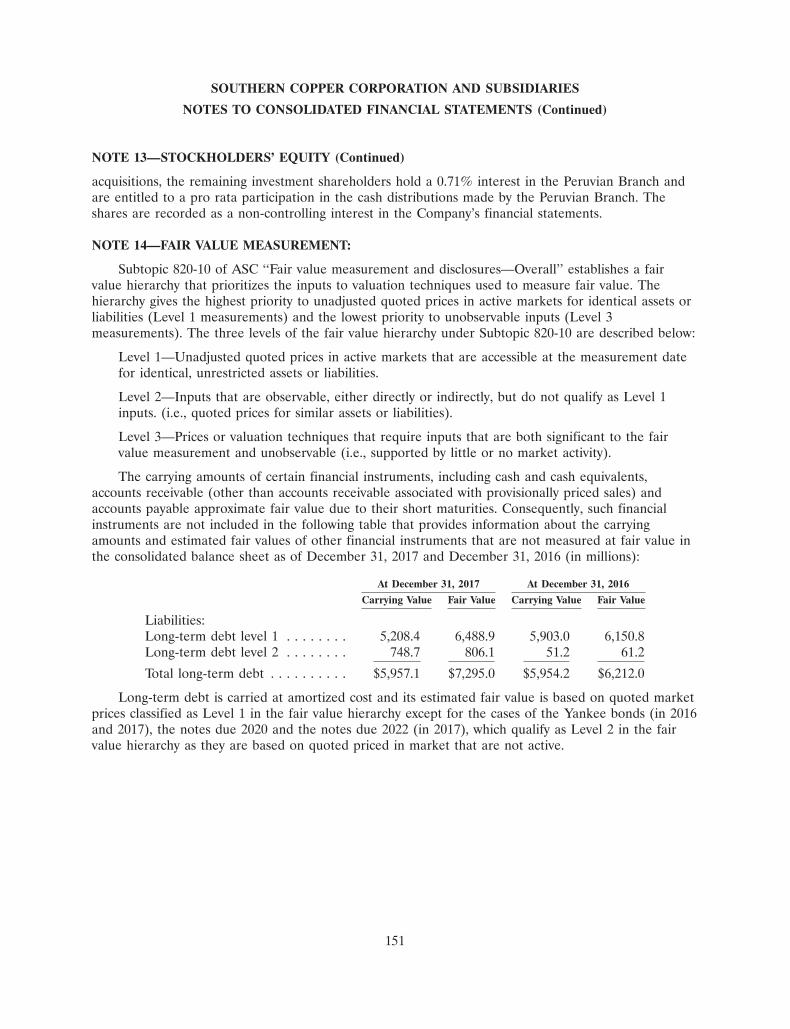
SOUTHERN COPPER CORPORATION AND SUBSIDIARIES
NOTES TO CONSOLIDATED FINANCIAL STATEMENTS (Continued)
NOTE 13—STOCKHOLDERS’ EQUITY (Continued)
acquisitions, the remaining investment shareholders hold a 0.71% interest in the Peruvian Branch andare entitled to a pro rata participation in the cash distributions made by the Peruvian Branch. Theshares are recorded as a non-controlling interest in the Company’s financial statements.
NOTE 14—FAIR VALUE MEASUREMENT:
Subtopic 820-10 of ASC ‘‘Fair value measurement and disclosures—Overall’’ establishes a fairvalue hierarchy that prioritizes the inputs to valuation techniques used to measure fair value. Thehierarchy gives the highest priority to unadjusted quoted prices in active markets for identical assets orliabilities (Level 1 measurements) and the lowest priority to unobservable inputs (Level 3measurements). The three levels of the fair value hierarchy under Subtopic 820-10 are described below:
Level 1—Unadjusted quoted prices in active markets that are accessible at the measurement datefor identical, unrestricted assets or liabilities.
Level 2—Inputs that are observable, either directly or indirectly, but do not qualify as Level 1inputs. (i.e., quoted prices for similar assets or liabilities).
Level 3—Prices or valuation techniques that require inputs that are both significant to the fairvalue measurement and unobservable (i.e., supported by little or no market activity).
The carrying amounts of certain financial instruments, including cash and cash equivalents,accounts receivable (other than accounts receivable associated with provisionally priced sales) andaccounts payable approximate fair value due to their short maturities. Consequently, such financialinstruments are not included in the following table that provides information about the carryingamounts and estimated fair values of other financial instruments that are not measured at fair value inthe consolidated balance sheet as of December 31, 2017 and December 31, 2016 (in millions):
At December 31, 2017 At December 31, 2016
Carrying Value Fair Value Carrying Value Fair Value
Liabilities:Long-term debt level 1 . . . . . . . . 5,208.4 6,488.9 5,903.0 6,150.8Long-term debt level 2 . . . . . . . . 748.7 806.1 51.2 61.2
Total long-term debt . . . . . . . . . . $5,957.1 $7,295.0 $5,954.2 $6,212.0
Long-term debt is carried at amortized cost and its estimated fair value is based on quoted marketprices classified as Level 1 in the fair value hierarchy except for the cases of the Yankee bonds (in 2016and 2017), the notes due 2020 and the notes due 2022 (in 2017), which qualify as Level 2 in the fairvalue hierarchy as they are based on quoted priced in market that are not active.
151
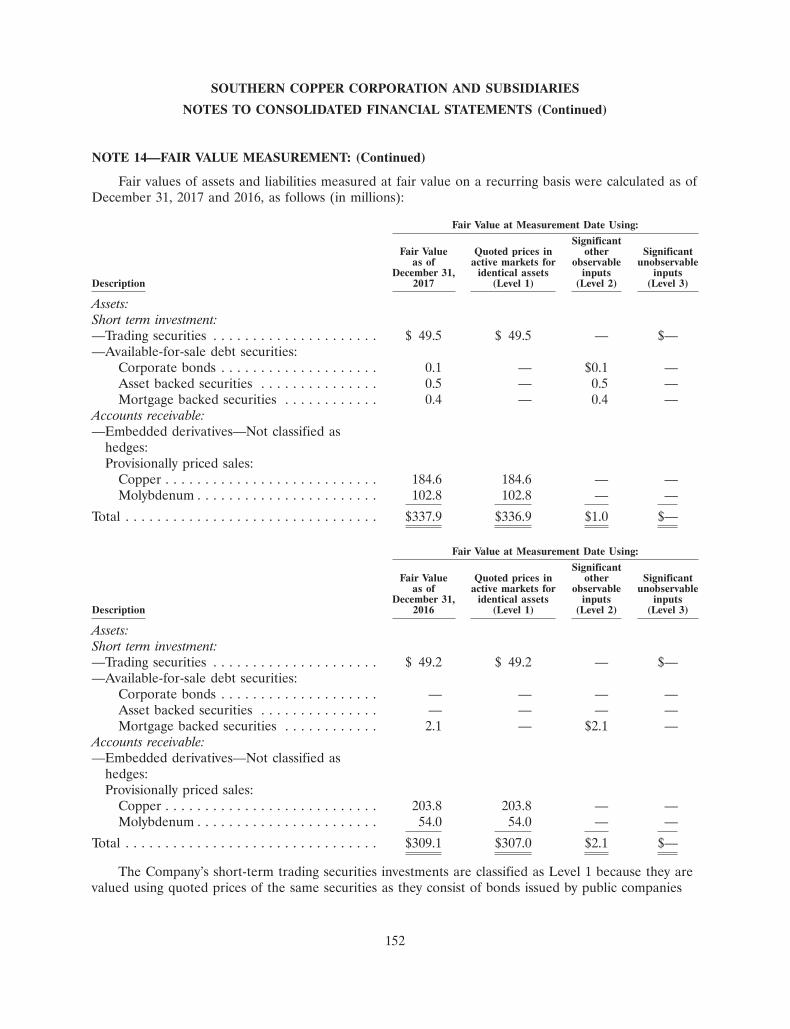
SOUTHERN COPPER CORPORATION AND SUBSIDIARIES
NOTES TO CONSOLIDATED FINANCIAL STATEMENTS (Continued)
NOTE 14—FAIR VALUE MEASUREMENT: (Continued)
Fair values of assets and liabilities measured at fair value on a recurring basis were calculated as ofDecember 31, 2017 and 2016, as follows (in millions):
Fair Value at Measurement Date Using:
SignificantFair Value Quoted prices in other Significant
as of active markets for observable unobservableDecember 31, identical assets inputs inputs
Description 2017 (Level 1) (Level 2) (Level 3)
Assets:Short term investment:—Trading securities . . . . . . . . . . . . . . . . . . . . . $ 49.5 $ 49.5 — $——Available-for-sale debt securities:
Corporate bonds . . . . . . . . . . . . . . . . . . . . 0.1 — $0.1 —Asset backed securities . . . . . . . . . . . . . . . 0.5 — 0.5 —Mortgage backed securities . . . . . . . . . . . . 0.4 — 0.4 —
Accounts receivable:—Embedded derivatives—Not classified as
hedges:Provisionally priced sales:
Copper . . . . . . . . . . . . . . . . . . . . . . . . . . . 184.6 184.6 — —Molybdenum . . . . . . . . . . . . . . . . . . . . . . . 102.8 102.8 — —
Total . . . . . . . . . . . . . . . . . . . . . . . . . . . . . . . . $337.9 $336.9 $1.0 $—
Fair Value at Measurement Date Using:
SignificantFair Value Quoted prices in other Significant
as of active markets for observable unobservableDecember 31, identical assets inputs inputs
Description 2016 (Level 1) (Level 2) (Level 3)
Assets:Short term investment:—Trading securities . . . . . . . . . . . . . . . . . . . . . $ 49.2 $ 49.2 — $——Available-for-sale debt securities:
Corporate bonds . . . . . . . . . . . . . . . . . . . . — — — —Asset backed securities . . . . . . . . . . . . . . . — — — —Mortgage backed securities . . . . . . . . . . . . 2.1 — $2.1 —
Accounts receivable:—Embedded derivatives—Not classified as
hedges:Provisionally priced sales:
Copper . . . . . . . . . . . . . . . . . . . . . . . . . . . 203.8 203.8 — —Molybdenum . . . . . . . . . . . . . . . . . . . . . . . 54.0 54.0 — —
Total . . . . . . . . . . . . . . . . . . . . . . . . . . . . . . . . $309.1 $307.0 $2.1 $—
The Company’s short-term trading securities investments are classified as Level 1 because they arevalued using quoted prices of the same securities as they consist of bonds issued by public companies
152
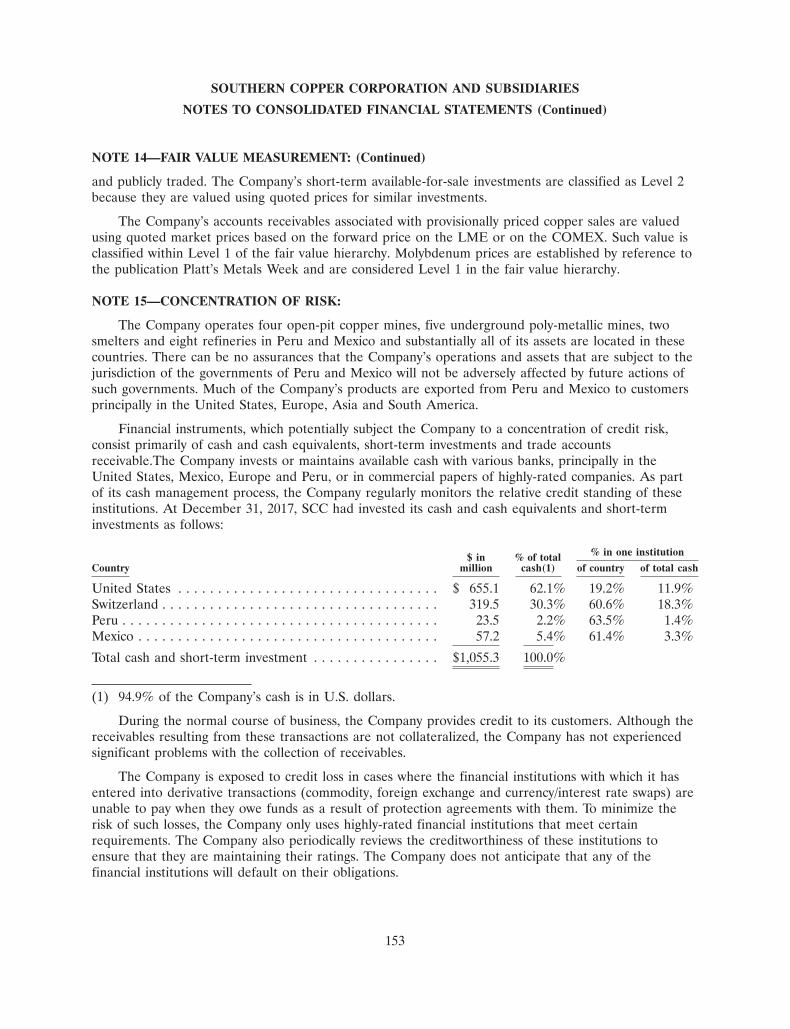
SOUTHERN COPPER CORPORATION AND SUBSIDIARIES
NOTES TO CONSOLIDATED FINANCIAL STATEMENTS (Continued)
NOTE 14—FAIR VALUE MEASUREMENT: (Continued)
and publicly traded. The Company’s short-term available-for-sale investments are classified as Level 2because they are valued using quoted prices for similar investments.
The Company’s accounts receivables associated with provisionally priced copper sales are valuedusing quoted market prices based on the forward price on the LME or on the COMEX. Such value isclassified within Level 1 of the fair value hierarchy. Molybdenum prices are established by reference tothe publication Platt’s Metals Week and are considered Level 1 in the fair value hierarchy.
NOTE 15—CONCENTRATION OF RISK:
The Company operates four open-pit copper mines, five underground poly-metallic mines, twosmelters and eight refineries in Peru and Mexico and substantially all of its assets are located in thesecountries. There can be no assurances that the Company’s operations and assets that are subject to thejurisdiction of the governments of Peru and Mexico will not be adversely affected by future actions ofsuch governments. Much of the Company’s products are exported from Peru and Mexico to customersprincipally in the United States, Europe, Asia and South America.
Financial instruments, which potentially subject the Company to a concentration of credit risk,consist primarily of cash and cash equivalents, short-term investments and trade accountsreceivable.The Company invests or maintains available cash with various banks, principally in theUnited States, Mexico, Europe and Peru, or in commercial papers of highly-rated companies. As partof its cash management process, the Company regularly monitors the relative credit standing of theseinstitutions. At December 31, 2017, SCC had invested its cash and cash equivalents and short-terminvestments as follows:
% in one institution$ in % of totalCountry million cash(1) of country of total cash
United States . . . . . . . . . . . . . . . . . . . . . . . . . . . . . . . . . $ 655.1 62.1% 19.2% 11.9%Switzerland . . . . . . . . . . . . . . . . . . . . . . . . . . . . . . . . . . . 319.5 30.3% 60.6% 18.3%Peru . . . . . . . . . . . . . . . . . . . . . . . . . . . . . . . . . . . . . . . . 23.5 2.2% 63.5% 1.4%Mexico . . . . . . . . . . . . . . . . . . . . . . . . . . . . . . . . . . . . . . 57.2 5.4% 61.4% 3.3%
Total cash and short-term investment . . . . . . . . . . . . . . . . $1,055.3 100.0%
(1) 94.9% of the Company’s cash is in U.S. dollars.
During the normal course of business, the Company provides credit to its customers. Although thereceivables resulting from these transactions are not collateralized, the Company has not experiencedsignificant problems with the collection of receivables.
The Company is exposed to credit loss in cases where the financial institutions with which it hasentered into derivative transactions (commodity, foreign exchange and currency/interest rate swaps) areunable to pay when they owe funds as a result of protection agreements with them. To minimize therisk of such losses, the Company only uses highly-rated financial institutions that meet certainrequirements. The Company also periodically reviews the creditworthiness of these institutions toensure that they are maintaining their ratings. The Company does not anticipate that any of thefinancial institutions will default on their obligations.
153
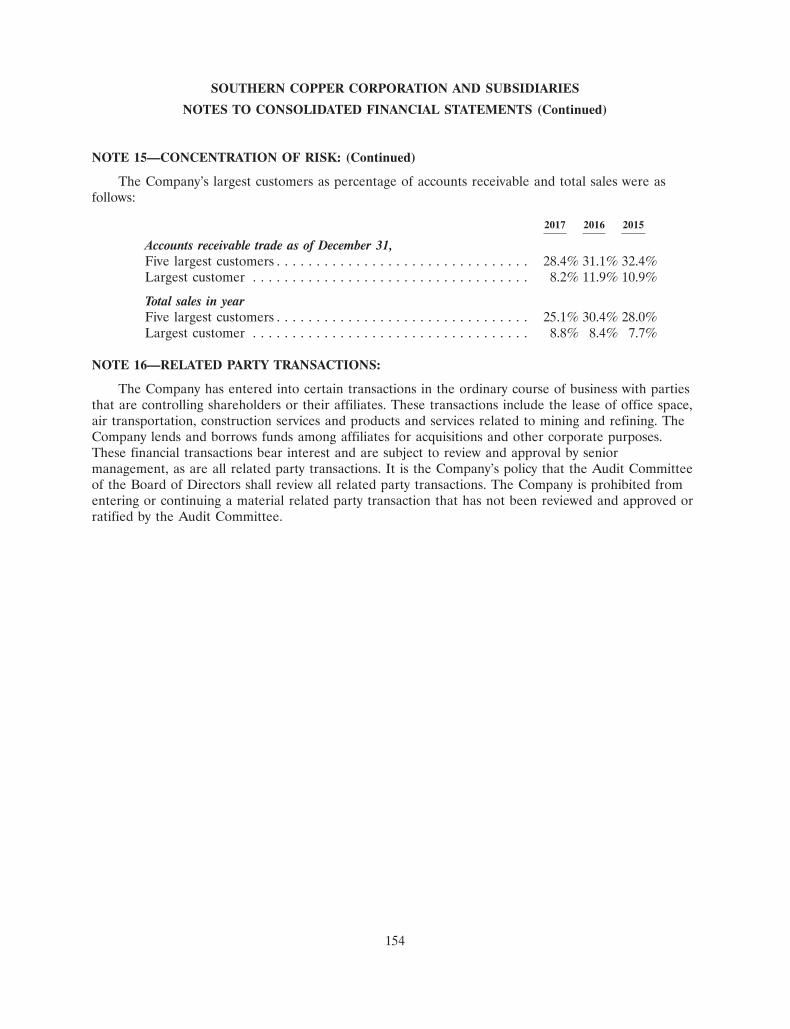
SOUTHERN COPPER CORPORATION AND SUBSIDIARIES
NOTES TO CONSOLIDATED FINANCIAL STATEMENTS (Continued)
NOTE 15—CONCENTRATION OF RISK: (Continued)
The Company’s largest customers as percentage of accounts receivable and total sales were asfollows:
2017 2016 2015
Accounts receivable trade as of December 31,Five largest customers . . . . . . . . . . . . . . . . . . . . . . . . . . . . . . . . 28.4% 31.1% 32.4%Largest customer . . . . . . . . . . . . . . . . . . . . . . . . . . . . . . . . . . . 8.2% 11.9% 10.9%
Total sales in yearFive largest customers . . . . . . . . . . . . . . . . . . . . . . . . . . . . . . . . 25.1% 30.4% 28.0%Largest customer . . . . . . . . . . . . . . . . . . . . . . . . . . . . . . . . . . . 8.8% 8.4% 7.7%
NOTE 16—RELATED PARTY TRANSACTIONS:
The Company has entered into certain transactions in the ordinary course of business with partiesthat are controlling shareholders or their affiliates. These transactions include the lease of office space,air transportation, construction services and products and services related to mining and refining. TheCompany lends and borrows funds among affiliates for acquisitions and other corporate purposes.These financial transactions bear interest and are subject to review and approval by seniormanagement, as are all related party transactions. It is the Company’s policy that the Audit Committeeof the Board of Directors shall review all related party transactions. The Company is prohibited fromentering or continuing a material related party transaction that has not been reviewed and approved orratified by the Audit Committee.
154
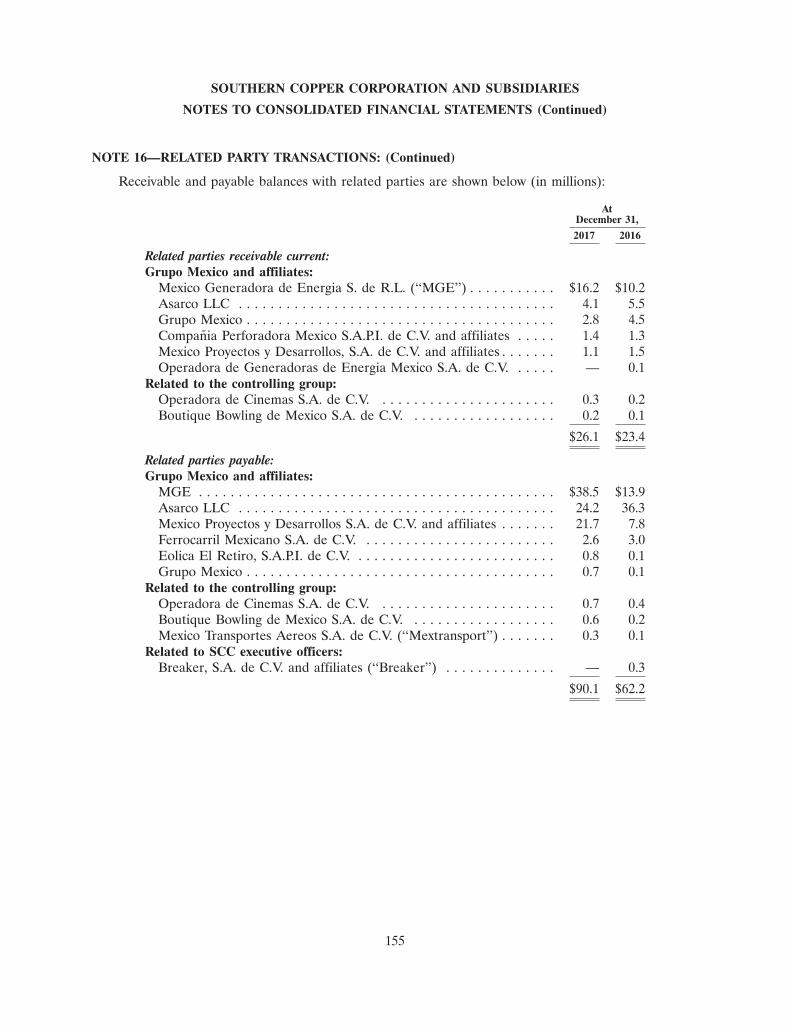
SOUTHERN COPPER CORPORATION AND SUBSIDIARIES
NOTES TO CONSOLIDATED FINANCIAL STATEMENTS (Continued)
NOTE 16—RELATED PARTY TRANSACTIONS: (Continued)
Receivable and payable balances with related parties are shown below (in millions):
AtDecember 31,
2017 2016
Related parties receivable current:Grupo Mexico and affiliates:
Mexico Generadora de Energia S. de R.L. (‘‘MGE’’) . . . . . . . . . . . $16.2 $10.2Asarco LLC . . . . . . . . . . . . . . . . . . . . . . . . . . . . . . . . . . . . . . . . 4.1 5.5Grupo Mexico . . . . . . . . . . . . . . . . . . . . . . . . . . . . . . . . . . . . . . . 2.8 4.5Compania Perforadora Mexico S.A.P.I. de C.V. and affiliates . . . . . 1.4 1.3Mexico Proyectos y Desarrollos, S.A. de C.V. and affiliates . . . . . . . 1.1 1.5Operadora de Generadoras de Energia Mexico S.A. de C.V. . . . . . — 0.1
Related to the controlling group:Operadora de Cinemas S.A. de C.V. . . . . . . . . . . . . . . . . . . . . . . 0.3 0.2Boutique Bowling de Mexico S.A. de C.V. . . . . . . . . . . . . . . . . . . 0.2 0.1
$26.1 $23.4
Related parties payable:Grupo Mexico and affiliates:
MGE . . . . . . . . . . . . . . . . . . . . . . . . . . . . . . . . . . . . . . . . . . . . . $38.5 $13.9Asarco LLC . . . . . . . . . . . . . . . . . . . . . . . . . . . . . . . . . . . . . . . . 24.2 36.3Mexico Proyectos y Desarrollos S.A. de C.V. and affiliates . . . . . . . 21.7 7.8Ferrocarril Mexicano S.A. de C.V. . . . . . . . . . . . . . . . . . . . . . . . . 2.6 3.0Eolica El Retiro, S.A.P.I. de C.V. . . . . . . . . . . . . . . . . . . . . . . . . . 0.8 0.1Grupo Mexico . . . . . . . . . . . . . . . . . . . . . . . . . . . . . . . . . . . . . . . 0.7 0.1
Related to the controlling group:Operadora de Cinemas S.A. de C.V. . . . . . . . . . . . . . . . . . . . . . . 0.7 0.4Boutique Bowling de Mexico S.A. de C.V. . . . . . . . . . . . . . . . . . . 0.6 0.2Mexico Transportes Aereos S.A. de C.V. (‘‘Mextransport’’) . . . . . . . 0.3 0.1
Related to SCC executive officers:Breaker, S.A. de C.V. and affiliates (‘‘Breaker’’) . . . . . . . . . . . . . . — 0.3
$90.1 $62.2
155
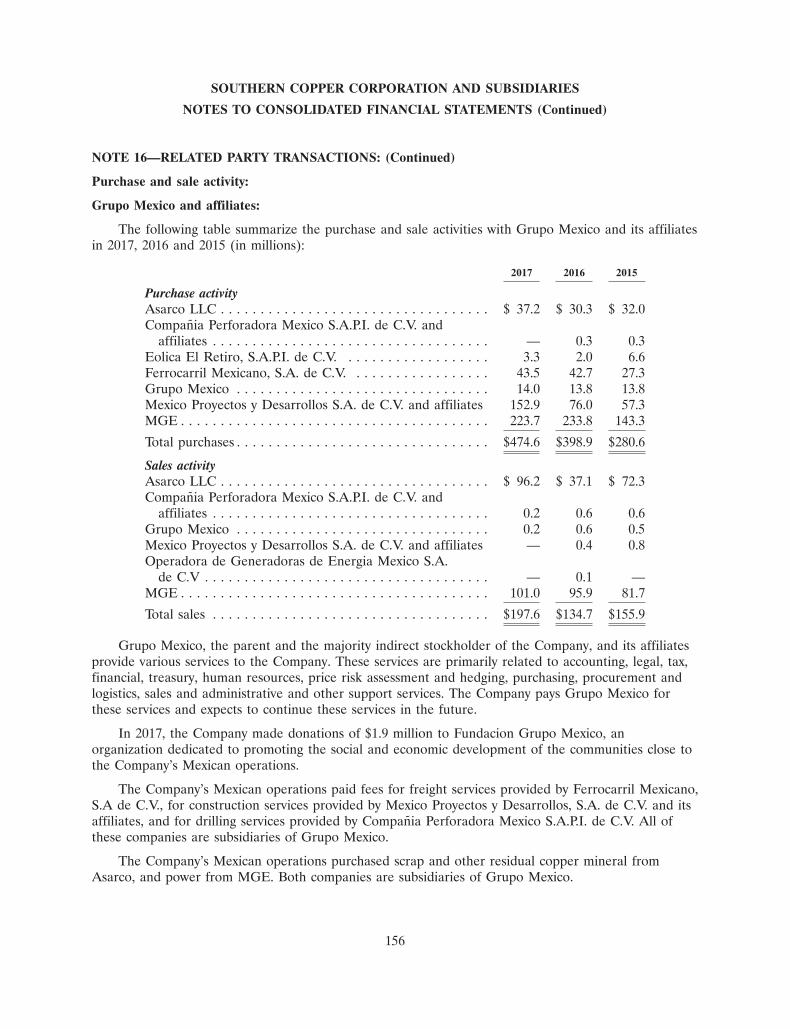
SOUTHERN COPPER CORPORATION AND SUBSIDIARIES
NOTES TO CONSOLIDATED FINANCIAL STATEMENTS (Continued)
NOTE 16—RELATED PARTY TRANSACTIONS: (Continued)
Purchase and sale activity:
Grupo Mexico and affiliates:
The following table summarize the purchase and sale activities with Grupo Mexico and its affiliatesin 2017, 2016 and 2015 (in millions):
2017 2016 2015
Purchase activityAsarco LLC . . . . . . . . . . . . . . . . . . . . . . . . . . . . . . . . . . $ 37.2 $ 30.3 $ 32.0Compania Perforadora Mexico S.A.P.I. de C.V. and
affiliates . . . . . . . . . . . . . . . . . . . . . . . . . . . . . . . . . . . — 0.3 0.3Eolica El Retiro, S.A.P.I. de C.V. . . . . . . . . . . . . . . . . . . 3.3 2.0 6.6Ferrocarril Mexicano, S.A. de C.V. . . . . . . . . . . . . . . . . . 43.5 42.7 27.3Grupo Mexico . . . . . . . . . . . . . . . . . . . . . . . . . . . . . . . . 14.0 13.8 13.8Mexico Proyectos y Desarrollos S.A. de C.V. and affiliates 152.9 76.0 57.3MGE . . . . . . . . . . . . . . . . . . . . . . . . . . . . . . . . . . . . . . . 223.7 233.8 143.3
Total purchases . . . . . . . . . . . . . . . . . . . . . . . . . . . . . . . . $474.6 $398.9 $280.6
Sales activityAsarco LLC . . . . . . . . . . . . . . . . . . . . . . . . . . . . . . . . . . $ 96.2 $ 37.1 $ 72.3Compania Perforadora Mexico S.A.P.I. de C.V. and
affiliates . . . . . . . . . . . . . . . . . . . . . . . . . . . . . . . . . . . 0.2 0.6 0.6Grupo Mexico . . . . . . . . . . . . . . . . . . . . . . . . . . . . . . . . 0.2 0.6 0.5Mexico Proyectos y Desarrollos S.A. de C.V. and affiliates — 0.4 0.8Operadora de Generadoras de Energia Mexico S.A.
de C.V . . . . . . . . . . . . . . . . . . . . . . . . . . . . . . . . . . . . — 0.1 —MGE . . . . . . . . . . . . . . . . . . . . . . . . . . . . . . . . . . . . . . . 101.0 95.9 81.7
Total sales . . . . . . . . . . . . . . . . . . . . . . . . . . . . . . . . . . . $197.6 $134.7 $155.9
Grupo Mexico, the parent and the majority indirect stockholder of the Company, and its affiliatesprovide various services to the Company. These services are primarily related to accounting, legal, tax,financial, treasury, human resources, price risk assessment and hedging, purchasing, procurement andlogistics, sales and administrative and other support services. The Company pays Grupo Mexico forthese services and expects to continue these services in the future.
In 2017, the Company made donations of $1.9 million to Fundacion Grupo Mexico, anorganization dedicated to promoting the social and economic development of the communities close tothe Company’s Mexican operations.
The Company’s Mexican operations paid fees for freight services provided by Ferrocarril Mexicano,S.A de C.V., for construction services provided by Mexico Proyectos y Desarrollos, S.A. de C.V. and itsaffiliates, and for drilling services provided by Compania Perforadora Mexico S.A.P.I. de C.V. All ofthese companies are subsidiaries of Grupo Mexico.
The Company’s Mexican operations purchased scrap and other residual copper mineral fromAsarco, and power from MGE. Both companies are subsidiaries of Grupo Mexico.
156
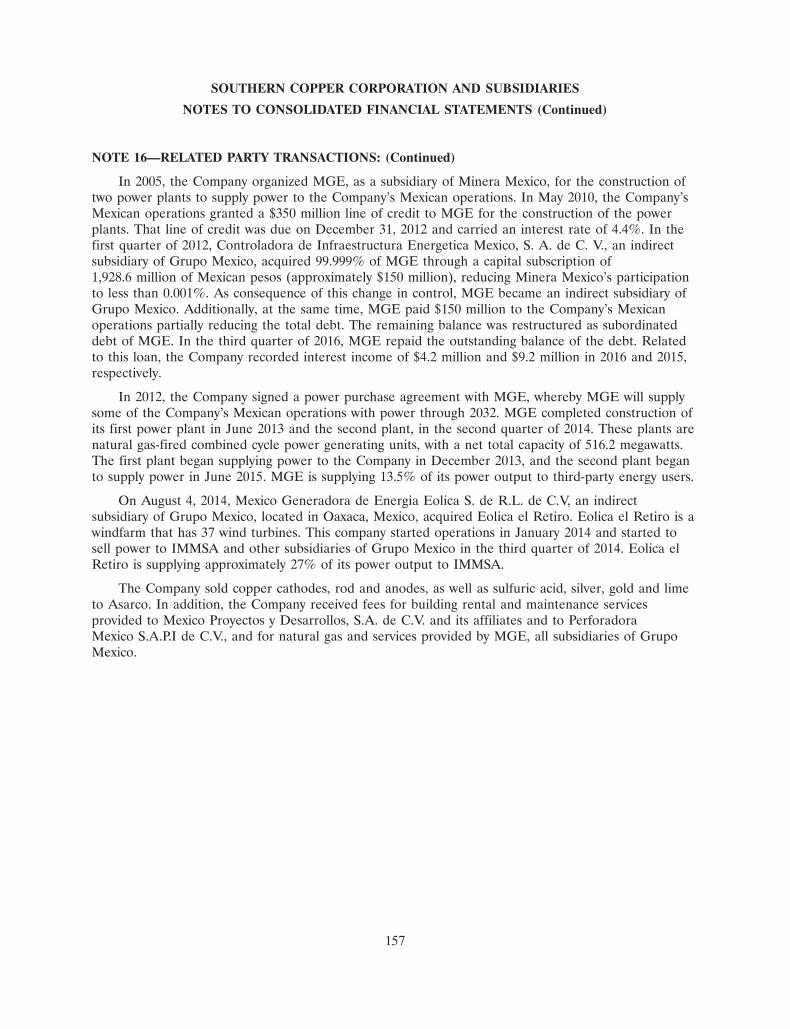
SOUTHERN COPPER CORPORATION AND SUBSIDIARIES
NOTES TO CONSOLIDATED FINANCIAL STATEMENTS (Continued)
NOTE 16—RELATED PARTY TRANSACTIONS: (Continued)
In 2005, the Company organized MGE, as a subsidiary of Minera Mexico, for the construction oftwo power plants to supply power to the Company’s Mexican operations. In May 2010, the Company’sMexican operations granted a $350 million line of credit to MGE for the construction of the powerplants. That line of credit was due on December 31, 2012 and carried an interest rate of 4.4%. In thefirst quarter of 2012, Controladora de Infraestructura Energetica Mexico, S. A. de C. V., an indirectsubsidiary of Grupo Mexico, acquired 99.999% of MGE through a capital subscription of1,928.6 million of Mexican pesos (approximately $150 million), reducing Minera Mexico’s participationto less than 0.001%. As consequence of this change in control, MGE became an indirect subsidiary ofGrupo Mexico. Additionally, at the same time, MGE paid $150 million to the Company’s Mexicanoperations partially reducing the total debt. The remaining balance was restructured as subordinateddebt of MGE. In the third quarter of 2016, MGE repaid the outstanding balance of the debt. Relatedto this loan, the Company recorded interest income of $4.2 million and $9.2 million in 2016 and 2015,respectively.
In 2012, the Company signed a power purchase agreement with MGE, whereby MGE will supplysome of the Company’s Mexican operations with power through 2032. MGE completed construction ofits first power plant in June 2013 and the second plant, in the second quarter of 2014. These plants arenatural gas-fired combined cycle power generating units, with a net total capacity of 516.2 megawatts.The first plant began supplying power to the Company in December 2013, and the second plant beganto supply power in June 2015. MGE is supplying 13.5% of its power output to third-party energy users.
On August 4, 2014, Mexico Generadora de Energia Eolica S. de R.L. de C.V, an indirectsubsidiary of Grupo Mexico, located in Oaxaca, Mexico, acquired Eolica el Retiro. Eolica el Retiro is awindfarm that has 37 wind turbines. This company started operations in January 2014 and started tosell power to IMMSA and other subsidiaries of Grupo Mexico in the third quarter of 2014. Eolica elRetiro is supplying approximately 27% of its power output to IMMSA.
The Company sold copper cathodes, rod and anodes, as well as sulfuric acid, silver, gold and limeto Asarco. In addition, the Company received fees for building rental and maintenance servicesprovided to Mexico Proyectos y Desarrollos, S.A. de C.V. and its affiliates and to PerforadoraMexico S.A.P.I de C.V., and for natural gas and services provided by MGE, all subsidiaries of GrupoMexico.
157
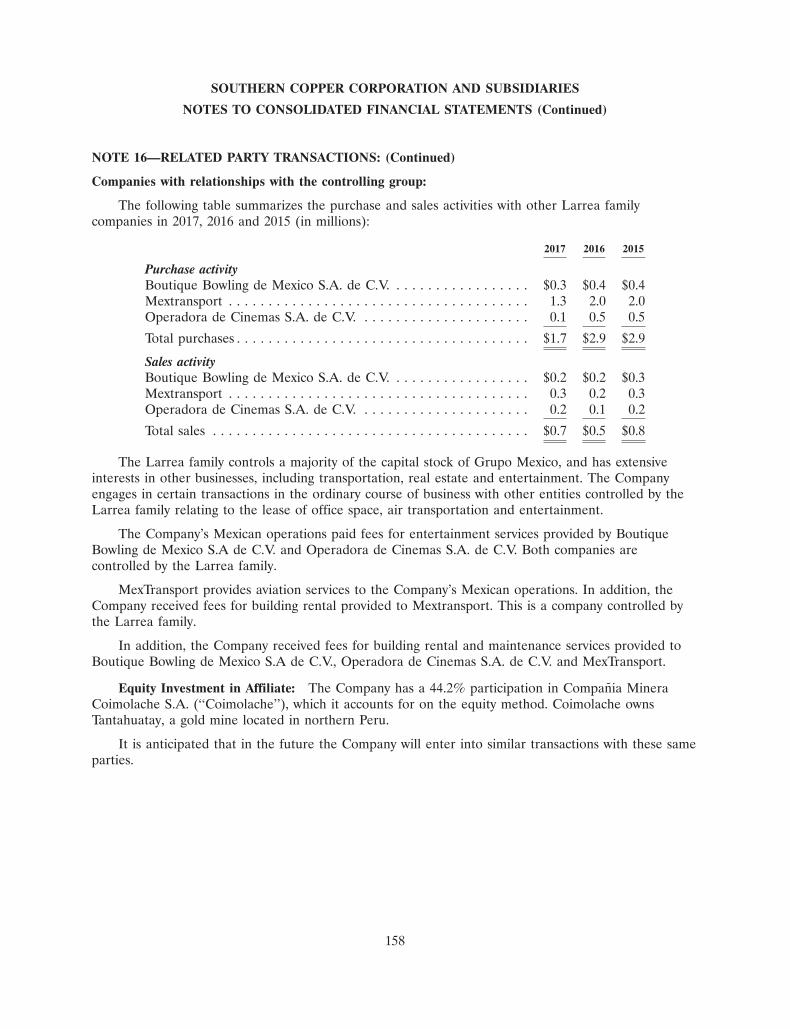
SOUTHERN COPPER CORPORATION AND SUBSIDIARIES
NOTES TO CONSOLIDATED FINANCIAL STATEMENTS (Continued)
NOTE 16—RELATED PARTY TRANSACTIONS: (Continued)
Companies with relationships with the controlling group:
The following table summarizes the purchase and sales activities with other Larrea familycompanies in 2017, 2016 and 2015 (in millions):
2017 2016 2015
Purchase activityBoutique Bowling de Mexico S.A. de C.V. . . . . . . . . . . . . . . . . . $0.3 $0.4 $0.4Mextransport . . . . . . . . . . . . . . . . . . . . . . . . . . . . . . . . . . . . . . 1.3 2.0 2.0Operadora de Cinemas S.A. de C.V. . . . . . . . . . . . . . . . . . . . . . 0.1 0.5 0.5
Total purchases . . . . . . . . . . . . . . . . . . . . . . . . . . . . . . . . . . . . . $1.7 $2.9 $2.9
Sales activityBoutique Bowling de Mexico S.A. de C.V. . . . . . . . . . . . . . . . . . $0.2 $0.2 $0.3Mextransport . . . . . . . . . . . . . . . . . . . . . . . . . . . . . . . . . . . . . . 0.3 0.2 0.3Operadora de Cinemas S.A. de C.V. . . . . . . . . . . . . . . . . . . . . . 0.2 0.1 0.2
Total sales . . . . . . . . . . . . . . . . . . . . . . . . . . . . . . . . . . . . . . . . $0.7 $0.5 $0.8
The Larrea family controls a majority of the capital stock of Grupo Mexico, and has extensiveinterests in other businesses, including transportation, real estate and entertainment. The Companyengages in certain transactions in the ordinary course of business with other entities controlled by theLarrea family relating to the lease of office space, air transportation and entertainment.
The Company’s Mexican operations paid fees for entertainment services provided by BoutiqueBowling de Mexico S.A de C.V. and Operadora de Cinemas S.A. de C.V. Both companies arecontrolled by the Larrea family.
MexTransport provides aviation services to the Company’s Mexican operations. In addition, theCompany received fees for building rental provided to Mextransport. This is a company controlled bythe Larrea family.
In addition, the Company received fees for building rental and maintenance services provided toBoutique Bowling de Mexico S.A de C.V., Operadora de Cinemas S.A. de C.V. and MexTransport.
Equity Investment in Affiliate: The Company has a 44.2% participation in Compania MineraCoimolache S.A. (‘‘Coimolache’’), which it accounts for on the equity method. Coimolache ownsTantahuatay, a gold mine located in northern Peru.
It is anticipated that in the future the Company will enter into similar transactions with these sameparties.
158

SOUTHERN COPPER CORPORATION AND SUBSIDIARIES
NOTES TO CONSOLIDATED FINANCIAL STATEMENTS (Continued)
NOTE 16—RELATED PARTY TRANSACTIONS: (Continued)
Companies with relationships with SCC executive officers:
The following table summarizes the purchase activities with companies with relationships to SCCexecutive officers in 2017, 2016 and 2015 (in millions):
2017 2016 2015
Breaker . . . . . . . . . . . . . . . . . . . . . . . . . . . . . . . . . . . . . . . . . . $ — $0.5 $5.5Higher Technology S.A.C. . . . . . . . . . . . . . . . . . . . . . . . . . . . . — 1.0 1.4Servicios y Fabricaciones Mecanicas S.A.C. . . . . . . . . . . . . . . . . 0.2 0.5 0.7Sempertrans . . . . . . . . . . . . . . . . . . . . . . . . . . . . . . . . . . . . . . . — — 1.2
Total purchased . . . . . . . . . . . . . . . . . . . . . . . . . . . . . . . . . . . . $0.2 $2.0 $8.8
In 2016, the Company purchased industrial materials from Breaker S.A. de C.V., BreakerPeru S.A.C., and Pigoba S.A. de C.V. in which the SCC´s Chief Executive Officer´s sons, CarlosGonzalez and Alejandro Gonzalez, and son-in-law, Jorge Gonzalez, have a proprietary interest. Also,the Company purchased industrial material from Higher Technology S.A.C. and paid fees formaintenance services provided by Servicios y Fabricaciones Mecanicas S.A.C., companies in whichCarlos Gonzalez, the son of SCC´s Chief Executive Officer, had a proprietary interest through June 6,2016.
Tax Agreement: On, February 28, 2017, AMC and the Company entered into a tax agreement,effective as of February 20, 2017, pursuant to which AMC, as the parent of the consolidated group ofwhich the Company is a member and joins in the filing of a U.S. federal income tax return, (a) will beresponsible for and discharge, any and all liabilities and payments due to the IRS on account of anyincremental tax liabilities of the Company in connection with the potential adjustments beingconsidered by the IRS in connection with the interest of the 2012 Judgment, (b) will not seekreimbursement, contribution or collection of any amounts of money or any other asset in connectiontherewith from the Company, and (c) will indemnify, defend and hold harmless the Company from anysuch liability, including the cost of such defense.
NOTE 17—SEGMENT AND RELATED INFORMATION:
Company management views Southern Copper as having three reportable segments and manages iton the basis of these segments. The reportable segments identified by the Company are: the Peruvianoperations, the Mexican open-pit operations and the Mexican underground mining operations segmentidentified as the IMMSA unit.
The three reportable segments identified are groups of mines, each of which constitute anoperating segment, with similar economic characteristics, type of products, processes and supportfacilities, similar regulatory environments, similar employee bargaining contracts and similar currencyrisks. In addition, each mine within the individual group earns revenues from similar type of customersfor their products and services and each group incurs expenses independently, including commercialtransactions between groups.
Intersegment sales are based on arm’s length prices at the time of sale. These may not bereflective of actual prices realized by the Company due to various factors, including additional
159
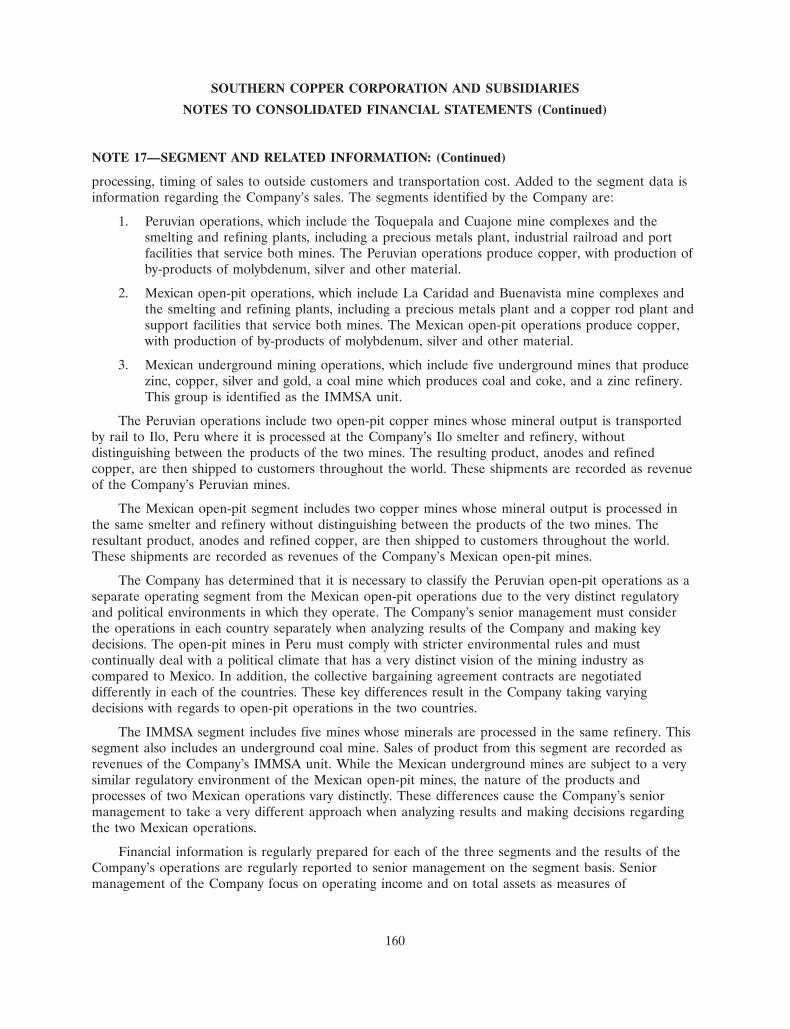
SOUTHERN COPPER CORPORATION AND SUBSIDIARIES
NOTES TO CONSOLIDATED FINANCIAL STATEMENTS (Continued)
NOTE 17—SEGMENT AND RELATED INFORMATION: (Continued)
processing, timing of sales to outside customers and transportation cost. Added to the segment data isinformation regarding the Company’s sales. The segments identified by the Company are:
1. Peruvian operations, which include the Toquepala and Cuajone mine complexes and thesmelting and refining plants, including a precious metals plant, industrial railroad and portfacilities that service both mines. The Peruvian operations produce copper, with production ofby-products of molybdenum, silver and other material.
2. Mexican open-pit operations, which include La Caridad and Buenavista mine complexes andthe smelting and refining plants, including a precious metals plant and a copper rod plant andsupport facilities that service both mines. The Mexican open-pit operations produce copper,with production of by-products of molybdenum, silver and other material.
3. Mexican underground mining operations, which include five underground mines that producezinc, copper, silver and gold, a coal mine which produces coal and coke, and a zinc refinery.This group is identified as the IMMSA unit.
The Peruvian operations include two open-pit copper mines whose mineral output is transportedby rail to Ilo, Peru where it is processed at the Company’s Ilo smelter and refinery, withoutdistinguishing between the products of the two mines. The resulting product, anodes and refinedcopper, are then shipped to customers throughout the world. These shipments are recorded as revenueof the Company’s Peruvian mines.
The Mexican open-pit segment includes two copper mines whose mineral output is processed inthe same smelter and refinery without distinguishing between the products of the two mines. Theresultant product, anodes and refined copper, are then shipped to customers throughout the world.These shipments are recorded as revenues of the Company’s Mexican open-pit mines.
The Company has determined that it is necessary to classify the Peruvian open-pit operations as aseparate operating segment from the Mexican open-pit operations due to the very distinct regulatoryand political environments in which they operate. The Company’s senior management must considerthe operations in each country separately when analyzing results of the Company and making keydecisions. The open-pit mines in Peru must comply with stricter environmental rules and mustcontinually deal with a political climate that has a very distinct vision of the mining industry ascompared to Mexico. In addition, the collective bargaining agreement contracts are negotiateddifferently in each of the countries. These key differences result in the Company taking varyingdecisions with regards to open-pit operations in the two countries.
The IMMSA segment includes five mines whose minerals are processed in the same refinery. Thissegment also includes an underground coal mine. Sales of product from this segment are recorded asrevenues of the Company’s IMMSA unit. While the Mexican underground mines are subject to a verysimilar regulatory environment of the Mexican open-pit mines, the nature of the products andprocesses of two Mexican operations vary distinctly. These differences cause the Company’s seniormanagement to take a very different approach when analyzing results and making decisions regardingthe two Mexican operations.
Financial information is regularly prepared for each of the three segments and the results of theCompany’s operations are regularly reported to senior management on the segment basis. Seniormanagement of the Company focus on operating income and on total assets as measures of
160
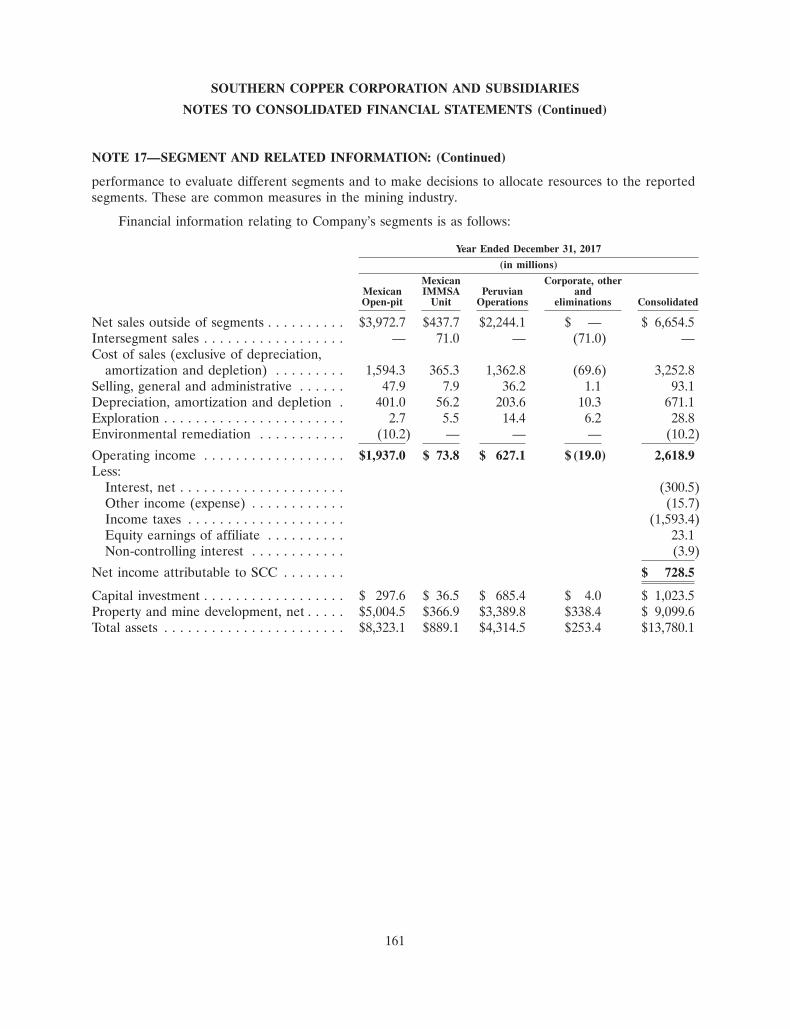
SOUTHERN COPPER CORPORATION AND SUBSIDIARIES
NOTES TO CONSOLIDATED FINANCIAL STATEMENTS (Continued)
NOTE 17—SEGMENT AND RELATED INFORMATION: (Continued)
performance to evaluate different segments and to make decisions to allocate resources to the reportedsegments. These are common measures in the mining industry.
Financial information relating to Company’s segments is as follows:
Year Ended December 31, 2017
(in millions)
Mexican Corporate, otherMexican IMMSA Peruvian andOpen-pit Unit Operations eliminations Consolidated
Net sales outside of segments . . . . . . . . . . $3,972.7 $437.7 $2,244.1 $ — $ 6,654.5Intersegment sales . . . . . . . . . . . . . . . . . . — 71.0 — (71.0) —Cost of sales (exclusive of depreciation,
amortization and depletion) . . . . . . . . . 1,594.3 365.3 1,362.8 (69.6) 3,252.8Selling, general and administrative . . . . . . 47.9 7.9 36.2 1.1 93.1Depreciation, amortization and depletion . 401.0 56.2 203.6 10.3 671.1Exploration . . . . . . . . . . . . . . . . . . . . . . . 2.7 5.5 14.4 6.2 28.8Environmental remediation . . . . . . . . . . . (10.2) — — — (10.2)
Operating income . . . . . . . . . . . . . . . . . . $1,937.0 $ 73.8 $ 627.1 $(19.0) 2,618.9Less:
Interest, net . . . . . . . . . . . . . . . . . . . . . (300.5)Other income (expense) . . . . . . . . . . . . (15.7)Income taxes . . . . . . . . . . . . . . . . . . . . (1,593.4)Equity earnings of affiliate . . . . . . . . . . 23.1Non-controlling interest . . . . . . . . . . . . (3.9)
Net income attributable to SCC . . . . . . . . $ 728.5
Capital investment . . . . . . . . . . . . . . . . . . $ 297.6 $ 36.5 $ 685.4 $ 4.0 $ 1,023.5Property and mine development, net . . . . . $5,004.5 $366.9 $3,389.8 $338.4 $ 9,099.6Total assets . . . . . . . . . . . . . . . . . . . . . . . $8,323.1 $889.1 $4,314.5 $253.4 $13,780.1
161
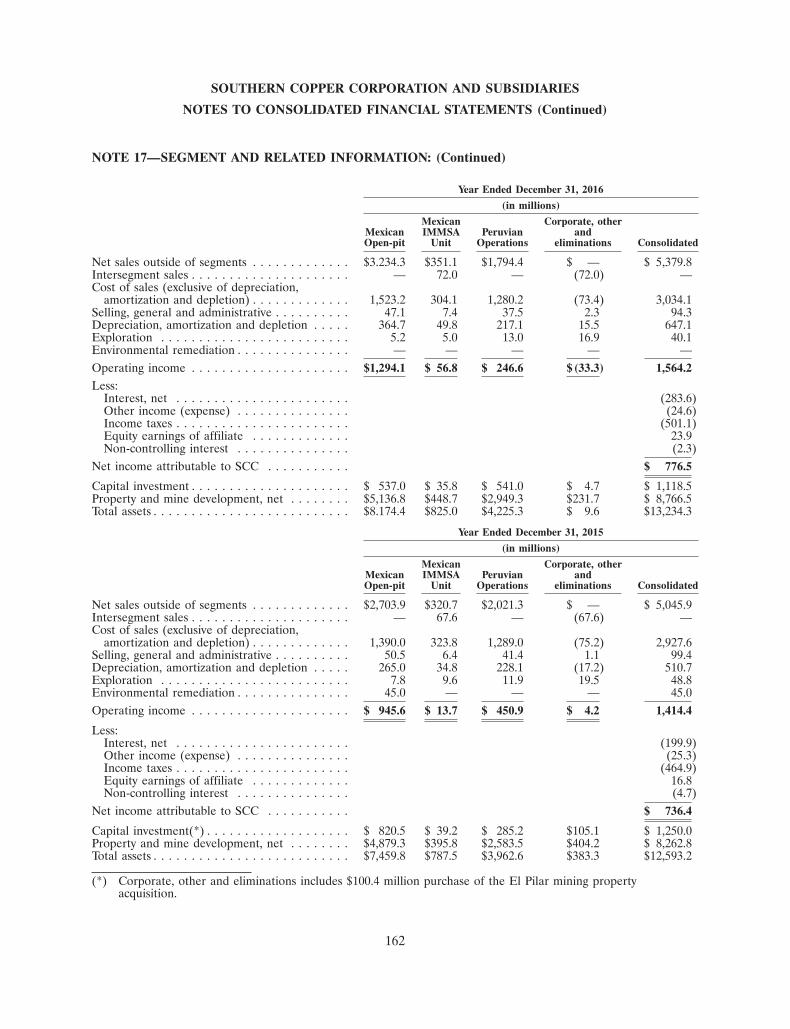
SOUTHERN COPPER CORPORATION AND SUBSIDIARIES
NOTES TO CONSOLIDATED FINANCIAL STATEMENTS (Continued)
NOTE 17—SEGMENT AND RELATED INFORMATION: (Continued)
Year Ended December 31, 2016
(in millions)
Mexican Corporate, otherMexican IMMSA Peruvian andOpen-pit Unit Operations eliminations Consolidated
Net sales outside of segments . . . . . . . . . . . . . $3.234.3 $351.1 $1,794.4 $ — $ 5,379.8Intersegment sales . . . . . . . . . . . . . . . . . . . . . — 72.0 — (72.0) —Cost of sales (exclusive of depreciation,
amortization and depletion) . . . . . . . . . . . . . 1,523.2 304.1 1,280.2 (73.4) 3,034.1Selling, general and administrative . . . . . . . . . . 47.1 7.4 37.5 2.3 94.3Depreciation, amortization and depletion . . . . . 364.7 49.8 217.1 15.5 647.1Exploration . . . . . . . . . . . . . . . . . . . . . . . . . 5.2 5.0 13.0 16.9 40.1Environmental remediation . . . . . . . . . . . . . . . — — — — —Operating income . . . . . . . . . . . . . . . . . . . . . $1,294.1 $ 56.8 $ 246.6 $(33.3) 1,564.2
Less:Interest, net . . . . . . . . . . . . . . . . . . . . . . . (283.6)Other income (expense) . . . . . . . . . . . . . . . (24.6)Income taxes . . . . . . . . . . . . . . . . . . . . . . . (501.1)Equity earnings of affiliate . . . . . . . . . . . . . 23.9Non-controlling interest . . . . . . . . . . . . . . . (2.3)
Net income attributable to SCC . . . . . . . . . . . $ 776.5
Capital investment . . . . . . . . . . . . . . . . . . . . . $ 537.0 $ 35.8 $ 541.0 $ 4.7 $ 1,118.5Property and mine development, net . . . . . . . . $5,136.8 $448.7 $2,949.3 $231.7 $ 8,766.5Total assets . . . . . . . . . . . . . . . . . . . . . . . . . . $8.174.4 $825.0 $4,225.3 $ 9.6 $13,234.3
Year Ended December 31, 2015
(in millions)
Mexican Corporate, otherMexican IMMSA Peruvian andOpen-pit Unit Operations eliminations Consolidated
Net sales outside of segments . . . . . . . . . . . . . $2,703.9 $320.7 $2,021.3 $ — $ 5,045.9Intersegment sales . . . . . . . . . . . . . . . . . . . . . — 67.6 — (67.6) —Cost of sales (exclusive of depreciation,
amortization and depletion) . . . . . . . . . . . . . 1,390.0 323.8 1,289.0 (75.2) 2,927.6Selling, general and administrative . . . . . . . . . . 50.5 6.4 41.4 1.1 99.4Depreciation, amortization and depletion . . . . . 265.0 34.8 228.1 (17.2) 510.7Exploration . . . . . . . . . . . . . . . . . . . . . . . . . 7.8 9.6 11.9 19.5 48.8Environmental remediation . . . . . . . . . . . . . . . 45.0 — — — 45.0Operating income . . . . . . . . . . . . . . . . . . . . . $ 945.6 $ 13.7 $ 450.9 $ 4.2 1,414.4
Less:Interest, net . . . . . . . . . . . . . . . . . . . . . . . (199.9)Other income (expense) . . . . . . . . . . . . . . . (25.3)Income taxes . . . . . . . . . . . . . . . . . . . . . . . (464.9)Equity earnings of affiliate . . . . . . . . . . . . . 16.8Non-controlling interest . . . . . . . . . . . . . . . (4.7)
Net income attributable to SCC . . . . . . . . . . . $ 736.4
Capital investment(*) . . . . . . . . . . . . . . . . . . . $ 820.5 $ 39.2 $ 285.2 $105.1 $ 1,250.0Property and mine development, net . . . . . . . . $4,879.3 $395.8 $2,583.5 $404.2 $ 8,262.8Total assets . . . . . . . . . . . . . . . . . . . . . . . . . . $7,459.8 $787.5 $3,962.6 $383.3 $12,593.2
(*) Corporate, other and eliminations includes $100.4 million purchase of the El Pilar mining propertyacquisition.
162
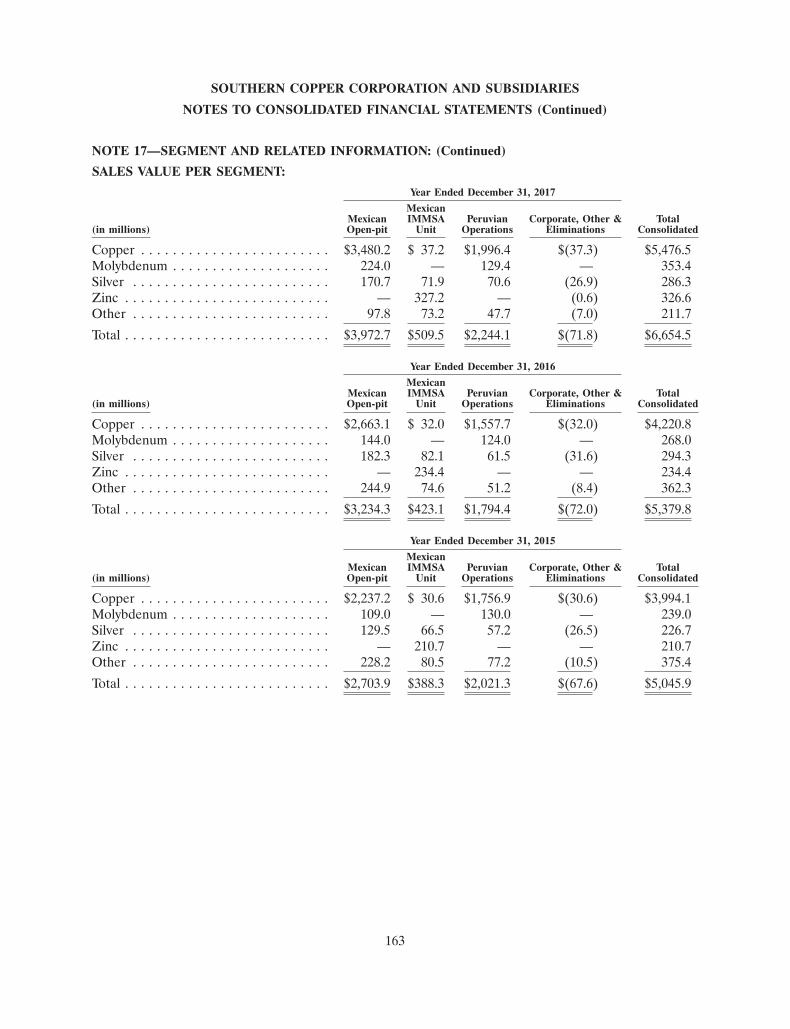
SOUTHERN COPPER CORPORATION AND SUBSIDIARIES
NOTES TO CONSOLIDATED FINANCIAL STATEMENTS (Continued)
NOTE 17—SEGMENT AND RELATED INFORMATION: (Continued)
SALES VALUE PER SEGMENT:
Year Ended December 31, 2017
MexicanMexican IMMSA Peruvian Corporate, Other & Total
(in millions) Open-pit Unit Operations Eliminations Consolidated
Copper . . . . . . . . . . . . . . . . . . . . . . . . $3,480.2 $ 37.2 $1,996.4 $(37.3) $5,476.5Molybdenum . . . . . . . . . . . . . . . . . . . . 224.0 — 129.4 — 353.4Silver . . . . . . . . . . . . . . . . . . . . . . . . . 170.7 71.9 70.6 (26.9) 286.3Zinc . . . . . . . . . . . . . . . . . . . . . . . . . . — 327.2 — (0.6) 326.6Other . . . . . . . . . . . . . . . . . . . . . . . . . 97.8 73.2 47.7 (7.0) 211.7
Total . . . . . . . . . . . . . . . . . . . . . . . . . . $3,972.7 $509.5 $2,244.1 $(71.8) $6,654.5
Year Ended December 31, 2016
MexicanMexican IMMSA Peruvian Corporate, Other & Total
(in millions) Open-pit Unit Operations Eliminations Consolidated
Copper . . . . . . . . . . . . . . . . . . . . . . . . $2,663.1 $ 32.0 $1,557.7 $(32.0) $4,220.8Molybdenum . . . . . . . . . . . . . . . . . . . . 144.0 — 124.0 — 268.0Silver . . . . . . . . . . . . . . . . . . . . . . . . . 182.3 82.1 61.5 (31.6) 294.3Zinc . . . . . . . . . . . . . . . . . . . . . . . . . . — 234.4 — — 234.4Other . . . . . . . . . . . . . . . . . . . . . . . . . 244.9 74.6 51.2 (8.4) 362.3
Total . . . . . . . . . . . . . . . . . . . . . . . . . . $3,234.3 $423.1 $1,794.4 $(72.0) $5,379.8
Year Ended December 31, 2015
MexicanMexican IMMSA Peruvian Corporate, Other & Total
(in millions) Open-pit Unit Operations Eliminations Consolidated
Copper . . . . . . . . . . . . . . . . . . . . . . . . $2,237.2 $ 30.6 $1,756.9 $(30.6) $3,994.1Molybdenum . . . . . . . . . . . . . . . . . . . . 109.0 — 130.0 — 239.0Silver . . . . . . . . . . . . . . . . . . . . . . . . . 129.5 66.5 57.2 (26.5) 226.7Zinc . . . . . . . . . . . . . . . . . . . . . . . . . . — 210.7 — — 210.7Other . . . . . . . . . . . . . . . . . . . . . . . . . 228.2 80.5 77.2 (10.5) 375.4
Total . . . . . . . . . . . . . . . . . . . . . . . . . . $2,703.9 $388.3 $2,021.3 $(67.6) $5,045.9
163
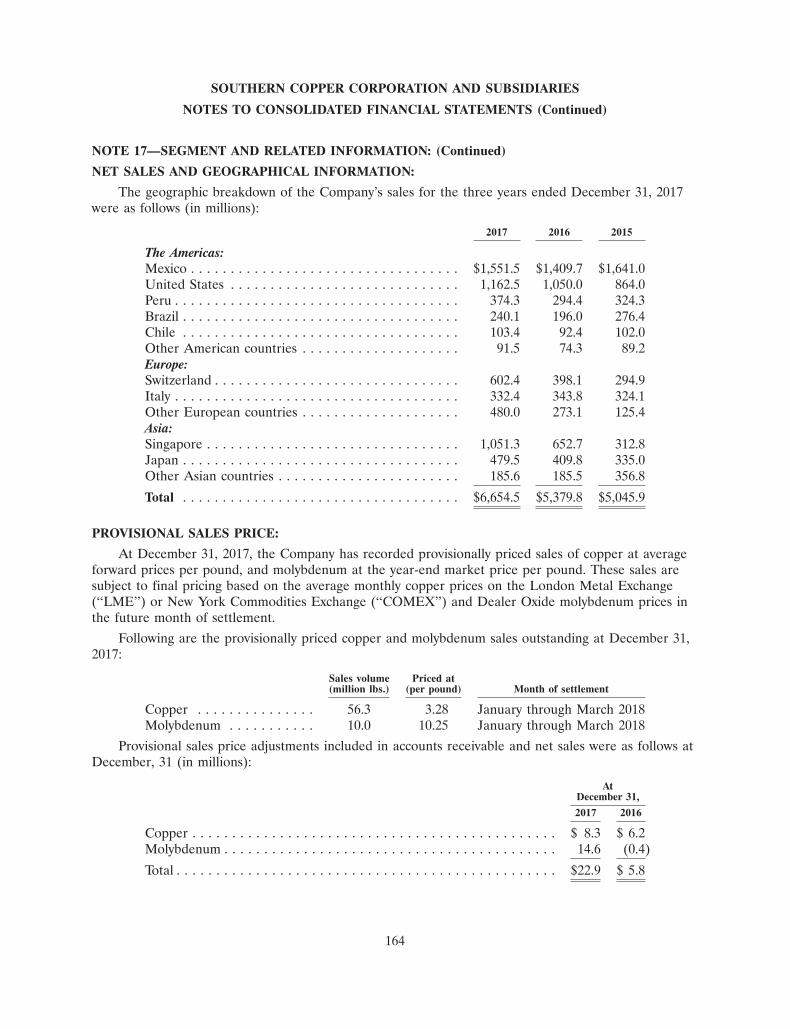
SOUTHERN COPPER CORPORATION AND SUBSIDIARIES
NOTES TO CONSOLIDATED FINANCIAL STATEMENTS (Continued)
NOTE 17—SEGMENT AND RELATED INFORMATION: (Continued)
NET SALES AND GEOGRAPHICAL INFORMATION:
The geographic breakdown of the Company’s sales for the three years ended December 31, 2017were as follows (in millions):
2017 2016 2015
The Americas:Mexico . . . . . . . . . . . . . . . . . . . . . . . . . . . . . . . . . . $1,551.5 $1,409.7 $1,641.0United States . . . . . . . . . . . . . . . . . . . . . . . . . . . . . 1,162.5 1,050.0 864.0Peru . . . . . . . . . . . . . . . . . . . . . . . . . . . . . . . . . . . . 374.3 294.4 324.3Brazil . . . . . . . . . . . . . . . . . . . . . . . . . . . . . . . . . . . 240.1 196.0 276.4Chile . . . . . . . . . . . . . . . . . . . . . . . . . . . . . . . . . . . 103.4 92.4 102.0Other American countries . . . . . . . . . . . . . . . . . . . . 91.5 74.3 89.2Europe:Switzerland . . . . . . . . . . . . . . . . . . . . . . . . . . . . . . . 602.4 398.1 294.9Italy . . . . . . . . . . . . . . . . . . . . . . . . . . . . . . . . . . . . 332.4 343.8 324.1Other European countries . . . . . . . . . . . . . . . . . . . . 480.0 273.1 125.4Asia:Singapore . . . . . . . . . . . . . . . . . . . . . . . . . . . . . . . . 1,051.3 652.7 312.8Japan . . . . . . . . . . . . . . . . . . . . . . . . . . . . . . . . . . . 479.5 409.8 335.0Other Asian countries . . . . . . . . . . . . . . . . . . . . . . . 185.6 185.5 356.8
Total . . . . . . . . . . . . . . . . . . . . . . . . . . . . . . . . . . . $6,654.5 $5,379.8 $5,045.9
PROVISIONAL SALES PRICE:
At December 31, 2017, the Company has recorded provisionally priced sales of copper at averageforward prices per pound, and molybdenum at the year-end market price per pound. These sales aresubject to final pricing based on the average monthly copper prices on the London Metal Exchange(‘‘LME’’) or New York Commodities Exchange (‘‘COMEX’’) and Dealer Oxide molybdenum prices inthe future month of settlement.
Following are the provisionally priced copper and molybdenum sales outstanding at December 31,2017:
Sales volume Priced at(million lbs.) (per pound) Month of settlement
Copper . . . . . . . . . . . . . . . 56.3 3.28 January through March 2018Molybdenum . . . . . . . . . . . 10.0 10.25 January through March 2018
Provisional sales price adjustments included in accounts receivable and net sales were as follows atDecember, 31 (in millions):
AtDecember 31,
2017 2016
Copper . . . . . . . . . . . . . . . . . . . . . . . . . . . . . . . . . . . . . . . . . . . . . . $ 8.3 $ 6.2Molybdenum . . . . . . . . . . . . . . . . . . . . . . . . . . . . . . . . . . . . . . . . . . 14.6 (0.4)
Total . . . . . . . . . . . . . . . . . . . . . . . . . . . . . . . . . . . . . . . . . . . . . . . . $22.9 $ 5.8
164
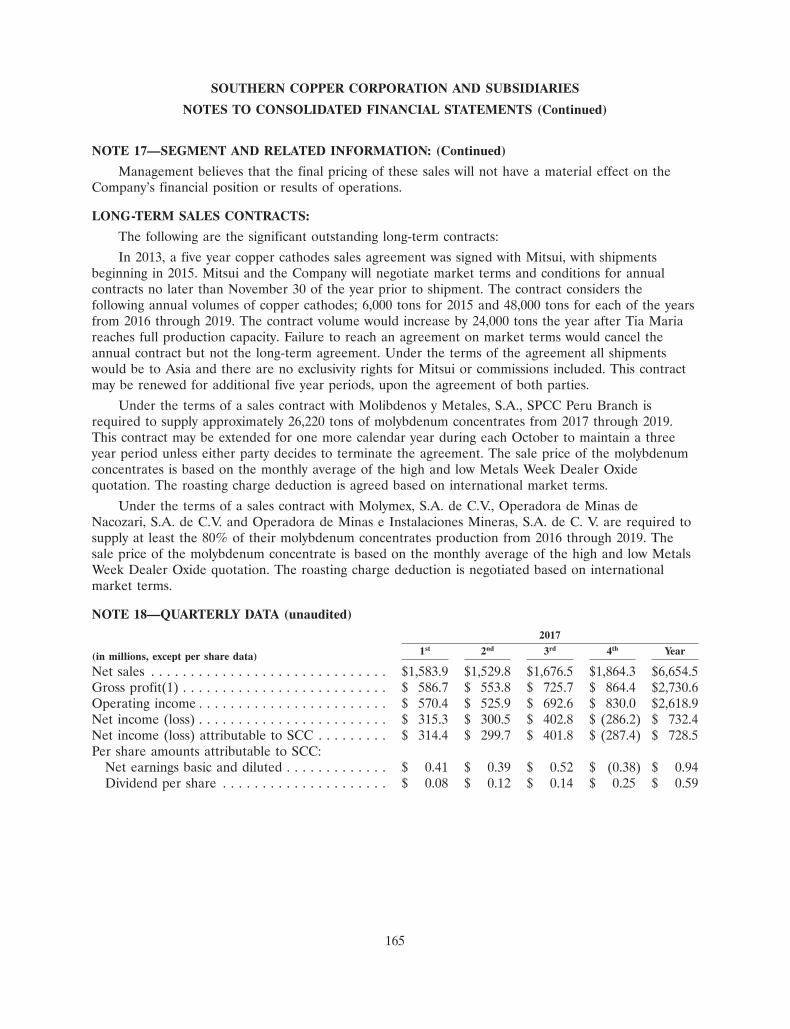
SOUTHERN COPPER CORPORATION AND SUBSIDIARIES
NOTES TO CONSOLIDATED FINANCIAL STATEMENTS (Continued)
NOTE 17—SEGMENT AND RELATED INFORMATION: (Continued)
Management believes that the final pricing of these sales will not have a material effect on theCompany’s financial position or results of operations.
LONG-TERM SALES CONTRACTS:
The following are the significant outstanding long-term contracts:
In 2013, a five year copper cathodes sales agreement was signed with Mitsui, with shipmentsbeginning in 2015. Mitsui and the Company will negotiate market terms and conditions for annualcontracts no later than November 30 of the year prior to shipment. The contract considers thefollowing annual volumes of copper cathodes; 6,000 tons for 2015 and 48,000 tons for each of the yearsfrom 2016 through 2019. The contract volume would increase by 24,000 tons the year after Tia Mariareaches full production capacity. Failure to reach an agreement on market terms would cancel theannual contract but not the long-term agreement. Under the terms of the agreement all shipmentswould be to Asia and there are no exclusivity rights for Mitsui or commissions included. This contractmay be renewed for additional five year periods, upon the agreement of both parties.
Under the terms of a sales contract with Molibdenos y Metales, S.A., SPCC Peru Branch isrequired to supply approximately 26,220 tons of molybdenum concentrates from 2017 through 2019.This contract may be extended for one more calendar year during each October to maintain a threeyear period unless either party decides to terminate the agreement. The sale price of the molybdenumconcentrates is based on the monthly average of the high and low Metals Week Dealer Oxidequotation. The roasting charge deduction is agreed based on international market terms.
Under the terms of a sales contract with Molymex, S.A. de C.V., Operadora de Minas deNacozari, S.A. de C.V. and Operadora de Minas e Instalaciones Mineras, S.A. de C. V. are required tosupply at least the 80% of their molybdenum concentrates production from 2016 through 2019. Thesale price of the molybdenum concentrate is based on the monthly average of the high and low MetalsWeek Dealer Oxide quotation. The roasting charge deduction is negotiated based on internationalmarket terms.
NOTE 18—QUARTERLY DATA (unaudited)
2017
1st 2nd 3rd 4th Year(in millions, except per share data)
Net sales . . . . . . . . . . . . . . . . . . . . . . . . . . . . . . $1,583.9 $1,529.8 $1,676.5 $1,864.3 $6,654.5Gross profit(1) . . . . . . . . . . . . . . . . . . . . . . . . . . $ 586.7 $ 553.8 $ 725.7 $ 864.4 $2,730.6Operating income . . . . . . . . . . . . . . . . . . . . . . . . $ 570.4 $ 525.9 $ 692.6 $ 830.0 $2,618.9Net income (loss) . . . . . . . . . . . . . . . . . . . . . . . . $ 315.3 $ 300.5 $ 402.8 $ (286.2) $ 732.4Net income (loss) attributable to SCC . . . . . . . . . $ 314.4 $ 299.7 $ 401.8 $ (287.4) $ 728.5Per share amounts attributable to SCC:
Net earnings basic and diluted . . . . . . . . . . . . . $ 0.41 $ 0.39 $ 0.52 $ (0.38) $ 0.94Dividend per share . . . . . . . . . . . . . . . . . . . . . $ 0.08 $ 0.12 $ 0.14 $ 0.25 $ 0.59
165
SOUTHERN COPPER CORPORATION AND SUBSIDIARIES
NOTES TO CONSOLIDATED FINANCIAL STATEMENTS (Continued)
NOTE 18—QUARTERLY DATA (unaudited) (Continued)
2016
1st 2nd 3rd 4th Year
Net sales . . . . . . . . . . . . . . . . . . . . . . . . . . . . . . $1,245.1 $1,335.1 $1,400.7 $1,398.9 $5,379.8Gross profit(1) . . . . . . . . . . . . . . . . . . . . . . . . . . $ 382.9 $ 419.0 $ 394.7 $ 502.0 $1,698.6Operating income . . . . . . . . . . . . . . . . . . . . . . . . $ 346.2 $ 385.1 $ 362.4 $ 470.5 $1,564.2Net income . . . . . . . . . . . . . . . . . . . . . . . . . . . . $ 185.7 $ 222.6 $ 198.2 $ 172.3 $ 778.8Net income attributable to SCC . . . . . . . . . . . . . $ 185.1 $ 221.9 $ 197.6 $ 171.9 $ 776.5Per share amounts attributable to SCC:
Net earnings basic and diluted . . . . . . . . . . . . . $ 0.23 $ 0.29 $ 0.26 $ 0.22 $ 1.00Dividend per share . . . . . . . . . . . . . . . . . . . . . $ 0.03 $ 0.05 $ 0.05 $ 0.05 $ 0.18
(1) Gross profit is the result of net sales less cost of sales (excluding depreciation, amortization anddepletion) and less depreciation, amortization and depletion.
NOTE 19—SUBSEQUENT EVENTS
DIVIDENDS:
On January 25, 2018, the Board of Directors authorized a dividend of $0.30 per share paid onFebruary 27, 2018, to shareholders of record at the close of business on February 13, 2018.
MICHIQUILLAY PROJECT ACQUISITION:
On February 20, 2018, the Company won the public bidding process for the Michiquillay project inCajamarca, Peru. The Company’s tender proposed a price of $400 million and an annual royalty of 3%on net sales. Michiquillay is a mining project with 1,150 million tons of mineralized material with acopper content of 0.63%. The estimated capital investment is approximately $2,500 million and it isexpected to start production in 2025 with a production of 225,000 tons of copper per year for an initialestimated mine life of more than 25 years.
SAN MARTIN STRIKE:
On February 28, 2018, the striking workers of the San Martın mine of IMMSA held an election tovote on the union that will hold the collective bargaining agreement at the San Martın mine. TheFederacıon Nacional de Sindicatos Independientes (the National Federation of Independent Unions),won the vote by a majority. As a result, once the Federal Mediation and Arbitration Board issues aruling recognizing the election results, IMMSA will be entitled to negotiate and enter into a collectivebargaining agreement with the Federacıon Nacional de Sindicatos Independientes to end the strike thatbegan in 2007 and resume operations at the San Martın Mine.
166
OTHER COMPANY INFORMATION:
ANNUAL MEETING
The annual stockholders meeting of Southern Copper Corporation will be held on Tuesday,April 24, 2018, at 9:00 am, Mexico City time, at Edificio Parque Reforma, Campos Eliseos 400,9th Floor, Colonia Lomas de Chapultepec, Delegacion Miguel Hidalgo, C.P. 11000, Mexico City,Mexico.
TRANSFER AGENT, REGISTRAR AND STOCKHOLDERS’ SERVICES
Computershare480 Washington BoulevardJersey City, NJ 07310-1900Phone: (866) 230-0172
DIVIDEND REINVESTMENT PROGRAM
SCC stockholders can have their dividends automatically reinvested in SCC common shares. SCCpays all administrative and brokerage fees. This plan is administered by Computershare. For moreinformation, contact Computershare at (866) 230-0172.
STOCK EXCHANGE LISTING
The principal markets for SCC’s common stock are the NYSE and the Lima Stock Exchange(BVL). SCC’s common stock symbol is SCCO on both the NYSE and the Lima Stock Exchange.
OTHER SECURITIES
The Branch in Peru has issued, in accordance with Peruvian Law, ‘‘investment shares’’ (formerlynamed labor shares) that are quoted on the Lima Stock Exchange under symbols SPCCPI1 andSPCCPI2. Transfer Agent, registrar and stockholders services are provided by Credicorp Capital,Avenida EI Derby 055, Torre 4, Piso 10, Santiago de Surco, Cod postal 15039, Peru.Telephone (51-1)416-3333, Extensions 32478 and 32441.
OTHER CORPORATE INFORMATION
For other information on the Company or to obtain, free of charge, additional copies of theAnnual Report on Form 10-K, contact the Investor Relations Department at:
1440 East Missouri Avenue, Suite 160 Phoenix, Az. 85014, USATelephone: (602)264-1375
SOUTHERN COPPER CORPORATION
USA1440 East Missouri Ave, Suite 160Phoenix, AZ 85014, USAPhone: (602) 264-1375Fax: (602) 264-1397
167
MexicoCampos Eliseos 400Colonia Lomas de ChapultepecDelegacion Miguel HidalgoC.P. 11000—MEXICOPhone: (5255) 1103-5000Fax: (5255) 1103-5567
PeruAv. Caminos del Inca 171Urb. Chacarilla del EstanqueSantiago de SurcoCod postal 15038—PERUPhone: (511) 512-0440 Ext 3181Fax: (511) 512-0492
Website: www.southerncoppercorp.comEmail address: [email protected]
168
ITEM 9. CHANGES IN AND DISAGREEMENTS WITH ACCOUNT ON ACCOUNTING ANDFINANCIAL DISCLOSURE
Not applicable.
ITEM 9A. CONTROLS AND PROCEDURES
As of December 31, 2017, the Company conducted an evaluation under the supervision and withthe participation of the Company’s disclosure committee and the Company’s management, includingthe Chief Executive Officer and Chief Financial Officer, of the effectiveness and the design andoperation of the Company’s disclosure controls and procedures (as defined in Exchange ActRules 13a-15(e) and 15d-15(e). Based on that evaluation, the Chief Executive Officer and the ChiefFinancial Officer have concluded that the Company’s disclosure controls and procedures are effectiveas of December 31, 2017, to ensure that information required to be disclosed in reports filed orsubmitted under the Exchange Act is:
1. Recorded, processed, summarized and reported within the time periods specified in the SEC’srules and forms, and
2. Accumulated and communicated to management, including the Chief Executive Officer andChief Financial Officer, as appropriate, to allow timely decisions regarding required disclosure.
CHANGES IN INTERNAL CONTROL OVER FINANCIAL REPORTING
There were no changes in the Company’s internal control over financial reporting (as such term isdefined in Rules 13a-15(f) and 15d-15(f) under the Securities Exchange Act of 1934, as amended) thatoccurred during the fourth quarter ended December 31, 2017 that have materially affected, or arereasonably likely to materially affect, the Company’s internal controls over financial reporting,
MANAGEMENT’S REPORT ON INTERNAL CONTROL OVER FINANCIAL REPORTING
Management is responsible for establishing and maintaining adequate internal control overfinancial reporting (as defined in Exchange Act Rules 13a-15(f) and 15d-15(f)) for the Company.
Because of its inherent limitations, internal control over financial reporting may not prevent ordetect misstatements. Also, projections of any evaluation of effectiveness for future periods are subjectto the risk that controls may become inadequate because of changes in conditions, or that the degreeof compliance with policies or procedures may deteriorate.
Under the supervision and with the participation of the Company’s management, including theChief Executive Officer and Chief Financial Officer, the Company conducted an evaluation of theeffectiveness of its internal control over financial reporting based on the framework in Internal Control-Integrated Framework (2013) issued by the Committee of Sponsoring Organization of the TreadwayCommission. Based on the evaluation made under this framework, management concluded that as ofDecember 31, 2017 such internal control over financial reporting is effective.
Our internal control over financial reporting as of December 31, 2017 has been audited by Galaz,Yamazaki, Ruiz Urquiza, S.C. member of Deloitte Touche Tohmatsu Limited, an independentregistered public accounting firm, as stated in their report which is provided below.
169
REPORT OF INDEPENDENT REGISTERED PUBLIC ACCOUNTING FIRM
To the Board of Directors and Stockholders of Southern Copper Corporation
Opinion on Internal Control over Financial Reporting
We have audited the internal control over financial reporting of Southern Copper Corporation andsubsidiaries (the ‘‘Company’’) as of December 31, 2017, based on criteria established in InternalControl—Integrated Framework (2013) issued by the Committee of Sponsoring Organizations of theTreadway Commission (COSO). In our opinion, the Company maintained, in all material respects,effective internal control over financial reporting as of December 31, 2017, based on the criteriaestablished in Internal Control—Integrated Framework (2013) issued by COSO.
We have also audited, in accordance with the standards of the Public Company AccountingOversight Board (United States) (PCAOB), the consolidated financial statements and financialstatement schedule as of and for the year ended December 31, 2017, of the Company and our reportdated March 1, 2018, expressed an unqualified opinion on those financial statements and financialstatement schedule.
Basis for Opinion
The Company’s management is responsible for maintaining effective internal control over financialreporting and for its assessment of the effectiveness of internal control over financial reporting,included in the accompanying ‘‘Management’s Report on Internal Control over Financial Reporting’’appearing in Item 9A. Our responsibility is to express an opinion on the Company’s internal controlover financial reporting based on our audit. We are a public accounting firm registered with thePCAOB and are required to be independent with respect to the Company in accordance with the U.S.federal securities laws and the applicable rules and regulations of the Securities and ExchangeCommission and the PCAOB.
We conducted our audit in accordance with the standards of the PCAOB. Those standards requirethat we plan and perform the audit to obtain reasonable assurance about whether effective internalcontrol over financial reporting was maintained in all material respects. Our audit included obtainingan understanding of internal control over financial reporting, assessing the risk that a materialweakness exists, testing and evaluating the design and operating effectiveness of internal control basedon the assessed risk, and performing such other procedures as we considered necessary in thecircumstances. We believe that our audit provides a reasonable basis for our opinion.
Definition and Limitations of Internal Control over Financial Reporting
A Company’s internal control over financial reporting is a process designed to provide reasonableassurance regarding the reliability of financial reporting and the preparation of financial statements forexternal purposes in accordance with generally accepted accounting principles. A Company’s internalcontrol over financial reporting includes those policies and procedures that (1) pertain to themaintenance of records that, in reasonable detail, accurately and fairly reflect the transactions anddispositions of the assets of the Company; (2) provide reasonable assurance that transactions arerecorded as necessary to permit preparation of financial statements in accordance with generallyaccepted accounting principles, and that receipts and expenditures of the Company are being madeonly in accordance with authorizations of management and directors of the Company; and (3) providereasonable assurance regarding prevention or timely detection of unauthorized acquisition, use, ordisposition of the Company’s assets that could have a material effect on the financial statements.
Because of its inherent limitations, internal control over financial reporting may not prevent ordetect misstatements. Also, projections of any evaluation of the effectiveness to future periods are
170
subject to the risk that controls may become inadequate because of changes in conditions, or that thedegree of compliance with the policies or procedures may deteriorate.
Galaz, Yamazaki, Ruiz Urquiza, S.C.Member of Deloitte Touche Tohmatsu Limited
/s/ MIGUEL ANGEL ANDRADE LEVEN
C.P.C. Miguel Angel Andrade LevenMexico City, MexicoMarch 1, 2018
171
ITEM 9B. OTHER INFORMATION
None.
PART III
ITEM 10, 11, 12, 13 AND 14
EXECUTIVE OFFICERS OF THE REGISTRANT
Set forth below are the executive officers of the Company, their ages as of January 31, 2018 andtheir positions.
Name Age Position
German Larrea Mota-Velasco . . . . . . . . . . . . . 64 Chairman of the Board and DirectorOscar Gonzalez Rocha . . . . . . . . . . . . . . . . . . 79 President, Chief Executive Officer and DirectorDaniel Muniz Quintanilla . . . . . . . . . . . . . . . . 44 Executive Vice PresidentRaul Jacob Ruisanchez . . . . . . . . . . . . . . . . . . 59 Vice President, Finance, Treasurer and Chief
Financial OfficerJulian Jorge Lazalde Psihas . . . . . . . . . . . . . . . 49 SecretaryAndres Carlos Ferrero Ghislieri . . . . . . . . . . . . 49 General CounselLina Vingerhoets Vilca . . . . . . . . . . . . . . . . . . 56 ComptrollerEdgard Corrales Aguilar . . . . . . . . . . . . . . . . . 62 Vice President, ExplorationRafael Lopez Abad . . . . . . . . . . . . . . . . . . . . 54 General Auditor
German Larrea Mota-Velasco has served as our Chairman of the Board since December 1999,Chief Executive Officer from December 1999 to October 2004 and as a member of our Board ofDirectors since November 1999. He has been Chairman of the board of directors, President and ChiefExecutive Officer of Grupo Mexico (holding) since 1994. Mr. Larrea has been Chairman of the boardof directors and Chief Executive Officer of Grupo Ferroviario Mexicano S.A. de C.V (railroadcompany) since 1997. Mr. Larrea was previously Executive Vice Chairman of Grupo Mexico and hasbeen a member of the board of directors since 1981. He is also Chairman of the board of directors andChief Executive Officer of Empresarios Industriales de Mexico, S.A. de C.V. (holding) and FondoInmobiliario (real estate company), since 1992. He founded Grupo Impresa, a printing and publishingcompany in 1978, remaining as the Chairman and Chief Executive Officer until 1989 when the companywas sold. He is a director of the Consejo Mexicano de Negocios since 1999, was a director of BancoNacional de Mexico, S.A. (Citigroup) from 1992 to 2015 and Grupo Televisa, S.A.B. from 1999 to 2014.
Oscar Gonzalez Rocha has served as our President since December 1999 and our President andChief Executive Officer since October 21, 2004. He has been our Director since November 1999.Mr. Gonzalez Rocha has been the President and Chief Executive Officer of Americas MiningCorporation since November 1, 2014 and the Chief Executive Officer and a director of Asarco LLC(integrated US copper producer), an affiliate of the Company, since August 2010. Previously, he wasour President and General Director and Chief Operating Officer from December 1999 to October 20,2004. He has been a director of Grupo Mexico since 2002. He was General Director of Mexicana deCobre, S.A. de C.V. from 1986 to 1999 and of Buenavista del Cobre S.A. de C.V. (formerly Mexicanade Cananea, S.A. de C.V.) from 1990 to 1999. He was an alternate director of Grupo Mexico from1988 to April 2002. Mr. Gonzalez Rocha is a civil engineer with a degree from the AutonomousNational University of Mexico (‘‘UNAM’’) in Mexico City, Mexico.
Daniel Muniz Quintanilla has been a Director of the Company since May 28, 2008. EffectiveApril 28, 2016, he was elected to hold the office of Executive Vice President of the Company.Mr. Muniz has been the Chief Financial Officer of Grupo Mexico since April 2007. Prior to joiningGrupo Mexico, Mr. Muniz was a practicing corporate-finance lawyer from 1996 to 2006. During this
172
time he worked at Cortes, Muniz y Nunez Sarrapy; Mijares, Angoitia, Cortes y Fuentes; and Baker &McKenzie (London and Mexico City offices). He holds a Master’s degree in Financial Law fromGeorgetown University Law Center in Washington D.C., and a Master’s degree in BusinessAdministration from Instituto de Empresa in Madrid, Spain.
Raul Jacob Ruisanchez has served as our Vice President, Finance and Chief Financial Officersince April 18, 2013. He was appointed Treasurer of the Company on April 28, 2016. He was ourComptroller from October 27, 2011 until April 18, 2013. He has held various positions focusedprimarily in financial planning, treasury, corporate finance, investor relations and project evaluationwith the Company since 1992. In September 2011, he was appointed Director of Controller andFinance of the Company’s Peruvian Branch and Vice President and Chief Financial Officer of SouthernPeru Limited, one of our subsidiaries. In 2017, 2016 and 2014, Mr. Jacob was considered byInstitutional Investor among the top three Chief Financial Officers of the mining industry of LatinAmerica. In 2010, he was ranked among the top three Investor Relations executives of the miningindustry of Latin America by the same publication. From 2015 to through January 2017, he was VicePresident of the Peruvian National Mining, Oil and Energy Association and President of its miningchapter. He is currently a member of its Executive Committee and Board. Mr. Jacob is currently amember of the consulting board of the MBA program (Finance) of the Universidad del Pacifico inLima, Peru. Until March of 2010, he was President of the Strategic Studies Center of IPAE, anentrepreneurial association. Between 2004 and 2006, he was the President of the Finance AffairsCommittee of the American Chamber of Commerce of Peru. Mr. Jacob holds an economics degreefrom Universidad del Pacifico, a Master’s Degree from the University of Texas (Austin) and a Degreein International Business Management from the Stockholm School of Economics.
Julian Jorge Lazalde Psihas, our Secretary, has been a Director, Executive Vice President andGeneral Counsel of Asarco LLC since December 2009. Since October 2015 he is also General Counselof Americas Mining Corporation, both subsidiaries of Grupo Mexico, S.A.B. de C.V., the parentcompany of the Company. Mr. Lazalde was General Counsel of Asarco Inc., the predecessor ofAsarco LLC, from September 2006 until December 2009. Mr. Lazalde holds a law degree from theAutonomous Institute of Mexico, known as ITAM, and has degrees from the Panamerican University intwo special areas, tax law and commercial law.
Andres Carlos Ferrero Ghislieri, our General Counsel, has been a member of the LegalDepartment of our Peruvian Branch since December 1995. Prior to this, he served as a TechnicalAdvisor to the World Bank’s Energy and Mines Technical Assistance Loan (EMTAL) Project assignedto the National Society of Mining, Energy and Petroleum. He has also worked as a mining lawconsultant for the South African Government from May to October 2001. He was electedSuperintendent of the Legal Affairs of the Peruvian Branch in March 2008. He is a member of theBoard of Companıa Minera Los Tolmos, S.A. which is subsidiary of the Company’s Peruvian Branch.He holds a law degree from the University of Lima, Peru and a Master of Law or LLM degree inResources Law and Policy from Dundee University, United Kingdom.
Lina Vingerhoets Vilca, our Comptroller, has been the Assistant Comptroller of the Companysince April 2015 and Controller of the Peruvian Branch of the Company since July 2015.Ms. Vingerhoets has worked for the Company’s Peruvian Branch in various capacities since 1991. From2013 to 2015, she was in charge of Internal Control. From 2006 to 2015, she was in charge ofAccounting Quality and SEC reporting. In addition, she has held other positions in Financial Planning,Finance and Accounting with the Company’s Peruvian Branch. Ms. Vingerhoets is a Peruvian certifiedpublic accountant and holds Accounting and MBA degrees from the Universidad del Pacifico, in Lima,Peru.
Edgard Corrales Aguilar has served as Vice President, Exploration since July 18, 2013.Mr. Corrales has been working with the Peruvian Branch of SCC since 1983 in various positions,
173
including as senior geologist of the Toquepala mine, head of the geology department of the Cuajonemine and manager of the exploration department of the Peruvian Branch of SCC. Currently he isExploration Director of the Peruvian Branch of SCC and general manager of SCC’s Branch in Chile.Mr. Corrales has a degree in geology and engineering from the Universidad Nacional San Agustin,Arequipa, Peru and has followed specialized studies at the Catholic University of Caracas, Venezuelaand the MacKay School of Mines at the University of Reno, Nevada. He has also completed extensivestudies in management at various universities in Peru.
Rafael Lopez Abad, our General Auditor, with 30 years of auditing experience, has been theManager of Internal Audit of the Peruvian Branch of the Company since September 1994. Previouslyhe was an auditor for PricewaterhouseCoopers and Ernst &Young. He is currently the President of theInstitute of Internal Auditors of Peru. Mr. Lopez Abad is a Peruvian certified public accountant with adegree from the University of Saint Martin of Porres, in Lima, Peru. He holds a Master’s degree inCommunication Science, or MSC, from the Peruvian National Engineering University (UNI), School ofMining Engineering and a post-graduate degree from the Superior School for Business Management,known as ‘‘Universidad ESAN’’. He teaches internal auditing post-graduate courses in variousprestigious universities in Lima, Peru.
Information in response to the additional disclosure requirements specified by Part III, Items 10,11, 12, 13 and 14 will be included in a definitive proxy statement, which will be filed pursuant toRegulation 14A of the 1934 Securities Exchange Act, as amended, prior to April 30, 2018, or will beprovided by amendment to this Form 10-K, also to be filed no later than April 30, 2018.
The information contained in such definitive proxy statement is incorporated herein by reference,excluding the information under the caption ‘‘Compensation Committee Report,’’ which shall not bedeemed filed.
174
PART IV.
ITEM 15. EXHIBITS, FINANCIAL STATEMENTS, SCHEDULE.
The following documents are filed as part of this report:
1. Financial Statements
The following financial statements of Southern Copper Corporation and its subsidiaries areincluded at the indicated pages of the document as stated below:
Form 10-KPages
Report of Independent Registered Public Accounting Firm . . . . . . . . . . . . . . . . . . . . . . . . 99Consolidated statements of earnings for the years ended December 31, 2017, 2016 and 2015 100Consolidated statements of comprehensive income for the years ended December 31, 2017,
2016 and 2015 . . . . . . . . . . . . . . . . . . . . . . . . . . . . . . . . . . . . . . . . . . . . . . . . . . . . . . . 101Consolidated balance sheets at December 31, 2017 and 2016 . . . . . . . . . . . . . . . . . . . . . . . 102Consolidated statements of cash flows for the years ended December 31, 2017, 2016 and
2015 . . . . . . . . . . . . . . . . . . . . . . . . . . . . . . . . . . . . . . . . . . . . . . . . . . . . . . . . . . . . . . 103Consolidated statements of changes in equity for the years ended December 31, 2017, 2016
and 2015 . . . . . . . . . . . . . . . . . . . . . . . . . . . . . . . . . . . . . . . . . . . . . . . . . . . . . . . . . . . 104Notes to the consolidated financial statements . . . . . . . . . . . . . . . . . . . . . . . . . . . . . . . . . 105 - 163
2. Exhibits:
3.1 (a) Amended and Restated Certificate of Incorporation, filed on October 11, 2005.
(b) Certificate of Amendment of Amended and Restated Certificate of Incorporation datedMay 2, 2006.
(c) Certificate of Amendment of Amended and Restated Certificate of Incorporation datedMay 28, 2008.
3.2 By-Laws, as last amended on January 27, 2011.
4.1 Indenture governing $200 million 6.375% Notes due 2015, by and among Southern CopperCorporation, The Bank of New York and The Bank of New York (Luxembourg) S.A.
4.2 (a) Indenture governing $600 million 7.500% Notes due 2035, by and among SouthernCopper Corporation, The Bank of New York and The Bank of New York(Luxembourg) S.A.
(b) Indenture governing $400 million 7.500% Notes due 2035, by and among SouthernCopper Corporation, The Bank of New York, and The Bank of New York(Luxembourg) S.A.
4.3 Form of 6.375% Note (included in Exhibit 4.1).
4.4 Form of New 7.500% Note (included in Exhibit 4.2(a)).
4.5 Form of New 7.500% Note (included in Exhibit 4.2(b)).
4.6 Indenture, dated as of April 16, 2010, between Southern Copper Corporation and WellsFargo Bank, National Association, as trustee, pursuant to which $400 million of 5.375%Notes due 2020 and $1.1 billion of 6.750% Notes due 2040 were issued.
175
4.7 First Supplemental Indenture, dated as of April 16, 2010, between Southern CopperCorporation and Wells Fargo Bank, National Association, as trustee, pursuant to which the5.375% Notes due 2020 were issued.
4.8 Second Supplemental Indenture, dated as of April 16, 2010, between Southern CopperCorporation and Wells Fargo Bank, National Association, as trustee, pursuant to which the6.750% Notes due 2040 were issued.
4.9 Form of 5.375% Notes due 2020.
4.10 Form of 6.750% Notes due 2040.
4.11 Third Supplemental Indenture, dated as of November 8, 2012, between Southern CopperCorporation and Wells Fargo Bank, National Association, as trustee, pursuant to which the3.500% Notes due 2022 were issued.
4.12 Fourth Supplemental Indenture, dated as of November 8, 2012, between Southern CopperCorporation and Wells Fargo Bank, National Association, as trustee, pursuant to which the5.250% Notes due 2042 were issued.
4.13 Form of 3.500% Notes due 2022.
4.14 Form of 5.250% Notes due 2042.
4.15 Fifth Supplemental Indenture dated as of April 23, 2015, between Southern CopperCorporation and Wells Fargo Bank, National Association, as trustee, pursuant to which the3.875% Notes due 2025 were issued.
4.16 Sixth Supplemental Indenture, dated as of April 23, 2015, between Southern CopperCorporation and Wells Fargo Bank, National Association, as trustee, pursuant to which the5.875% Notes due 2045 were issued.
4.17 Form of 3.875% Notes due 2025.
4.18 Form of 5.875% Notes due 2045.
10.1 Directors’ Stock Award Plan of the Company, as amended through January 30, 2017.
10.2 Service Agreement entered into by the Company with a subsidiary of Grupo Mexico S.A.B.de C.V., assigned upon the same terms and conditions to Grupo Mexico S.A.B. de C.V. inFebruary 2004.
10.3 Agreement and Plan of Merger, dated as of October 21, 2004, by and among SouthernCopper Corporation, SCC Merger Sub, Inc., Americas Sales Company, Inc., AmericasMining Corporation and Minera Mexico S.A. de C.V.
10.4 Tax Agreement entered into by the Company and Americas Mining Corporation, effectiveas of February 20, 2017.
12.1 Computation of financial ratios.
14.0 Code of Business Conduct and Ethics adopted by the Board of Directors on May 8, 2003and amended on April 23, 2015.
21.1 Subsidiaries of the Company.
23.1 Consent of Registered Public Accounting Firm (Galaz, Yamazaki, Ruiz Urquiza, S.C.,Member of Deloitte Touche Tohmatsu, Limited).
31.1 Certification Pursuant to Section 302 of the Sarbanes-Oxley Act of 2002.
176
31.2 Certification Pursuant to Section 302 of the Sarbanes-Oxley Act of 2002.
32.1 Certification Pursuant to Section 906 of the Sarbanes-Oxley Act of 2002, 18 U.S.C.,Section 1350. This document is being furnished in accordance with SEC ReleaseNo. 33-8328.
32.2 Certification Pursuant to Section 906 of the Sarbanes-Oxley Act of 2002, 18 U.S.C.,Section 1350. This document is being furnished in accordance with SEC ReleaseNo. 33-8328.
101.INS XBRL Instance Document (submitted electronically with this report).
101.SCH XBRL Taxonomy Extension Schema Document (submitted electronically with this report).
101.CAL XBRL Taxonomy Calculation Linkbase Document (submitted electronically with thisreport).
101.DEF XBRL Taxonomy Extension Definition Linkbase Document (submitted electronically withthis report).
101.LAB XBRL Taxonomy Label Linkbase Document (submitted electronically with this report).
101.PRE XBRL Taxonomy Presentation Linkbase Document (submitted electronically with thisreport).
The exhibit listed as 10.1 is the management contract or compensatory plan or arrangementrequired to be filed pursuant to Item 15(b) of Form 10-K.
Attached as Exhibit 101 to this report are the following documents formatted in XBRL (ExtensibleBusiness Reporting Language): (i) the Consolidated Statements of Earnings for the years endedDecember 31, 2017, 2016 and 2015; (ii) the Consolidated Statements of Comprehensive Income for theyears ended December 31, 2017, 2016 and 2015; (iii) the Consolidated Balance Sheets at December 31,2017 and 2016; (iv) the Consolidated Statements of Cash Flows for the years ended December 31,2017, 2016 and 2015; (v) the Consolidated Statements of changes in equity for the years endedDecember 31, 2017, 2016 and 2015, and (vi) the Notes to Consolidated Financial Statements tagged indetail. Users of this data are advised pursuant to Rule 406T of Regulation S-T that this interactive datafile is deemed not filed or part of a registration statement or prospectus for purposes of sections 11 or12 of the Securities Act of 1933, is deemed not filed for purposes of section 18 of the SecuritiesExchange Act of 1934, and otherwise is not subject to liability under these sections.
177
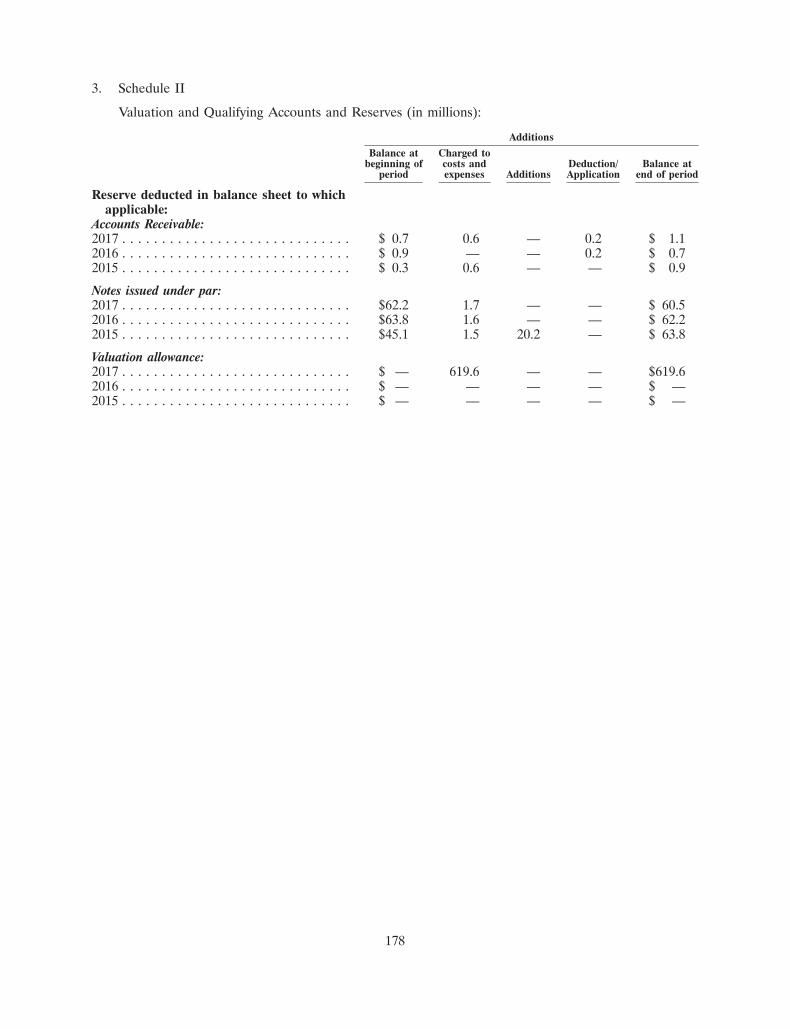
3. Schedule II
Valuation and Qualifying Accounts and Reserves (in millions):
Additions
Balance at Charged tobeginning of costs and Deduction/ Balance at
period expenses Additions Application end of period
Reserve deducted in balance sheet to whichapplicable:
Accounts Receivable:2017 . . . . . . . . . . . . . . . . . . . . . . . . . . . . . $ 0.7 0.6 — 0.2 $ 1.12016 . . . . . . . . . . . . . . . . . . . . . . . . . . . . . $ 0.9 — — 0.2 $ 0.72015 . . . . . . . . . . . . . . . . . . . . . . . . . . . . . $ 0.3 0.6 — — $ 0.9
Notes issued under par:2017 . . . . . . . . . . . . . . . . . . . . . . . . . . . . . $62.2 1.7 — — $ 60.52016 . . . . . . . . . . . . . . . . . . . . . . . . . . . . . $63.8 1.6 — — $ 62.22015 . . . . . . . . . . . . . . . . . . . . . . . . . . . . . $45.1 1.5 20.2 — $ 63.8
Valuation allowance:2017 . . . . . . . . . . . . . . . . . . . . . . . . . . . . . $ — 619.6 — — $619.62016 . . . . . . . . . . . . . . . . . . . . . . . . . . . . . $ — — — — $ —2015 . . . . . . . . . . . . . . . . . . . . . . . . . . . . . $ — — — — $ —
178
Supplemental information
Southern Copper CorporationExhibit Index
SequentialExhibit PageNumber Document Description Number
3.1 (a) Amended and Restated Certificate of Incorporation, filed on October 11, 2005.(Filed as Exhibit 3.1 to the Company’s Quarterly Report on Form 10-Q for thethird quarter of 2005 and incorporated herein by reference).
(b) Certificate of Amendment of Amended and Restated Certificate ofIncorporation dated May 2, 2006. (Filed as Exhibit 3.1 to Registration Statementon Form S-4, File No. 333-135170, filed on June 20, 2006 and incorporated hereinby reference).
(c) Certificate of Amendment of Amended and Restated Certificate ofIncorporation dated May 28, 2008. (Filed as Exhibit 3.1 to the Company’sQuarterly Report on Form 10-Q for the second quarter of 2008 and incorporatedherein by reference).
3.2 By-Laws, as last amended on January 27, 2011. (Filed as Exhibit 3.2 to theCompany’s 2010 Annual Report on Form 10-K and incorporated herein byreference).
4.1 Indenture governing $200 million 6.375% Notes due 2015, by and among SouthernCopper Corporation, The Bank of New York and The Bank of New York(Luxembourg) S.A. (Filed as Exhibit 4.1 to the Company’s Current Report onForm 8-K filed on August 1, 2005 and incorporated by reference).
4.2 (a) Indenture governing $600 million 7.500% Notes due 2035, by and amongSouthern Copper Corporation, The Bank of New York and The Bank of NewYork (Luxembourg) S.A. (Filed as Exhibit 4.2 to the Company’s Current Reporton Form 8-K filed on August 1, 2005 and incorporated herein by reference).
(b) Indenture governing $400 million 7.500% Notes due 2035, by and amongSouthern Copper Corporation, The Bank of New York, and The Bank of NewYork (Luxembourg) S.A. (Filed as Exhibit 4.2 to the Company’s Current Reporton Form 8-K filed on August 1, 2005 and incorporated herein by reference).
4.3 Form of 6.375% Note (included in exhibit 4.1).
4.4 Form of New 7.500% Note (included in Exhibit 4.2(a)).
4.5 Form of New 7.500% Note (included in Exhibit 4.2(b))
4.6 Indenture, dated as of April 16, 2010, between Southern Copper Corporation andWells Fargo Bank, National Association, as trustee, pursuant to which $400 millionof 5.375% Notes due 2020 and $1.1 billion of 6.750% Notes due 2040 were issued.(Filed as Exhibit 4.1 to the Company’s Current Report on Form 8-K filed onApril 19, 2010 and incorporated herein by reference).
179
SequentialExhibit PageNumber Document Description Number
4.7 First Supplemental Indenture dated as of April 16, 2010, between SouthernCopper Corporation and Wells Fargo Bank, National Association, as trustee,pursuant to which the 5.375% Notes due 2020 were issued (Filed as an Exhibit tothe Company’s Current Report on Form 8-K filed on April 19, 2010 andincorporated herein by reference).
4.8 Second Supplemental Indenture, dated as of April 16, 2010, between SouthernCopper Corporation and Wells Fargo Bank, National Association, as trustee,pursuant to which the 6.750% Notes due 2040 were issued. (Filed as an Exhibit tothe Company’s Current Report on Form 8-K filed on April 19, 2010 andincorporated herein by reference).
4.9 Form of 5.375% Notes due 2020. (Filed as an Exhibit to the Company’s CurrentReport on Form 8-K filed on April 19, 2010 and incorporated herein byreference).
4.10 Form of 6.750% Notes due 2040. (Filed as an Exhibit to the Company’s CurrentReport on Form 8-K filed on April 19, 2010 and incorporated herein byreference).
4.11 Third Supplemental Indenture, dated as of November 8, 2012, between SouthernCopper Corporation and Wells Fargo Bank, National Association, as trustee,pursuant to which the 3.500% Notes due 2022 were issued (Filed as an Exhibit tothe Company’s Current Report on Form 8-K filed on November 9, 2012 andincorporated herein by reference).
4.12 Fourth Supplemental Indenture, dated as of November 8, 2012, between SouthernCopper Corporation and Wells Fargo Bank, National Association, as trustee,pursuant to which the 5.250% Notes due 2042 were issued. (Filed as an Exhibit tothe Company’s Current Report on Form 8-K filed on November 9, 2012 andincorporated herein by reference).
4.13 Form of 3.500% Notes due 2022. (Filed as an Exhibit to the Company’s CurrentReport on Form 8-K filed on November 9, 2012 and incorporated herein byreference).
4.14 Form of 5.250% Notes due 2042. (Filed as an Exhibit to the Company’s CurrentReport on Form 8-K filed on November 9, 2012 and incorporated herein byreference).
4.15 Fifth Supplemental Indenture dated as of April 23, 2015, between SouthernCopper Corporation and Wells Fargo Bank, National Association, as trustee,pursuant to which the 3.875% Notes due 2025 were issued. (Filed as an Exhibit tothe Company’s Current Report on Form 8-K filed on April 24, 2015 andincorporated herein by reference).
4.16 Sixth Supplemental Indenture, dated as of April 23, 2015, between SouthernCopper Corporation and Wells Fargo Bank, National Association, as trustee,pursuant to which the 5.875% Notes due 2045 were issued. (Filed as an Exhibit tothe Company’s Current Report on Form 8-K filed on April 24, 2015 andincorporated herein by reference).
180
SequentialExhibit PageNumber Document Description Number
4.17 Form of 3.875% Notes due 2025. (Filed as Exhibit A to Exhibit 4.1 to theCompany’s Current Report on Form 8-K filed on April 24, 2015 and incorporatedherein by reference).
4.18 Form of 5.875% Notes due 2045. (Filed as Exhibit A to Exhibit 4.2 to theCompany’s Current Report on Form 8-K filed on April 24, 2015 and incorporatedherein by reference).
10.1 Directors’ Stock Award Plan of the Company. (Filed as an exhibit to theCompany’s 2016 Proxy Statement and incorporated herein by reference). The planexpired by its terms on January 30, 2017. A 10-year extension of the plan is beingsubmitted for approval by the Company’s stockholders at the 2017 Annual Meetingof Stockholders.
10.2 Service Agreement entered into by the Company with a subsidiary of GrupoMexico S.A.B. de C.V., assigned upon the same terms and conditions to GrupoMexico S.A.B. de C.V. in February 2004. (Filed as Exhibit 10.10 to the Company’s2002 Annual Report on Form 10-K and incorporated herein by reference).
10.3 Agreement and Plan of Merger, dated as of October 21, 2004, by and amongSouthern Copper Corporation, SCC Merger Sub, Inc., Americas SalesCompany, Inc., Americas Mining Corporation and Minera Mexico S.A. de C.V.(Filed as an Exhibit to Current Report on Form 8-K filed on October 22, 2004 andincorporated herein by reference).
10.4 Tax Agreement entered into by the Company and Americas Mining Corporation,effective as of February 20, 2017. (Filed as Exhibit 10.4 to the Company’sQuarterly Report on Form 10-Q for the first quarter of 2017 and incorporatedherein by reference).
12.1 Computation of financial ratios (filed herewith).
14.0 Code of Business Conduct and Ethics adopted by the Board of Directors onMay 8, 2003 and amended on April 23, 2015. (Filed as Exhibit 14 to theCompany’s Current Report on Form 8-K filed April 29, 2015 and incorporatedherein by reference).
21.1 Subsidiaries of the Company (filed herewith).
23.1 Consent of Registered Public Accounting Firm (Galaz, Yamazaki, Ruiz Urquiza,S.C.—Member of Deloitte Touche Tohmatsu, Limited) (filed herewith).
31.1 Certification Pursuant to Section 302 of the Sarbanes-Oxley Act of 2002 (filedherewith).
31.2 Certification Pursuant to Section 302 of the Sarbanes-Oxley Act of 2002 (filedherewith).
32.1 Certification Pursuant to Section 906 of the Sarbanes-Oxley Act of 2002,18 U.S.C., section 1350. This document is being furnished in accordance with SECRelease No. 33-8238.
32.2 Certification Pursuant to Section 906 of the Sarbanes-Oxley Act of 2002,18 U.S.C., section 1350. This document is being furnished in accordance with SECRelease No. 33-8238.
181
SequentialExhibit PageNumber Document Description Number
101.INS XBRL Instance Document (submitted electronically with this report).
101.SCH XBRL Taxonomy Extension Schema Document (submitted electronically with thisreport).
101.CAL XBRL Taxonomy Calculation Linkbase Document (submitted electronically withthis report).
101.DEF XBRL Taxonomy Extension Definition Linkbase Document (submittedelectronically with this report).
101.LAB XBRL Taxonomy Label Linkbase Document (submitted electronically with thisreport).
101.PRE XBRL Taxonomy Presentation Linkbase Document (submitted electronically withthis report).
The exhibit listed as 10.1 is the management contract or compensatory plan or arrangementrequired to be filed pursuant to Item 15(b) of Form 10-K.
Attached as Exhibit 101 to this report are the following documents formatted in XBRL (ExtensibleBusiness Reporting Language): (i) the Consolidated Statements of Earnings for the years endedDecember 31, 2017, 2016 and 2015; (ii) the Consolidated Statements of Comprehensive Income for theyears ended December 31, 2017, 2016 and 2015; (iii) the Consolidated Balance Sheets at December 31,2017 and 2016; (iv) the Consolidated Statements of Cash Flows for the years ended December 31,2017, 2016 and 2015; (v) the Consolidated Statements of changes in equity for the years endedDecember 31, 2017, 2016 and 2015, and (vi) the Notes to Consolidated Financial Statements tagged indetail. Users of this data are advised pursuant to Rule 406T of Regulation S-T that this interactive datafile is deemed not filed or part of a registration statement or prospectus for purposes of sections 11 or12 of the Securities Act of 1933, is deemed not filed for purposes of section 18 of the SecuritiesExchange Act of 1934, and otherwise is not subject to liability under these sections.
182
Signatures
Pursuant to the requirements of Section 13 or 15(d) of the Securities Exchange Act of 1934, asamended, the Registrant has duly caused this Report on Form 10-K to be signed on its behalf by theundersigned, thereunto duly authorized.
SOUTHERN COPPER CORPORATION(Registrant)
By: /s/ OSCAR GONZALEZ ROCHA
Oscar Gonzalez RochaPresident and Chief Executive Officer
Date: March 1, 2018
Pursuant to requirements of the Securities Exchange Act of 1934, this Report on Form 10-K hasbeen signed below by the following persons on behalf of the Registrant and in the capacities and onthe dates indicated.
/s/ GERMAN LARREA MOTA-VELASCOChairman of the Board, and Director
German Larrea Mota-Velasco
/s/ OSCAR GONZALEZ ROCHAPresident, Chief Executive Officer and Director
Oscar Gonzalez Rocha
/s/ RAUL JACOB RUISANCHEZ Vice President, Finance, Treasurer and ChiefFinancial Officer (Principal Financial Officer)Raul Jacob Ruisanchez
/s/ LINA A. VINGERHOETS VILCAComptroller (Principal Accounting Officer)
Lina A. Vingerhoets Vilca
DIRECTORS
s/ GERMAN LARREA MOTA-VELASCO /s/ OSCAR GONZALEZ ROCHA
German Larrea Mota-Velasco Oscar Gonzalez Rocha
/s/ EMILIO CARRILLO GAMBOA /s/ DANIEL MUNIZ QUINTANILLA
Emilio Carrillo Gamboa Daniel Muniz Quintanilla
183
/s/ ALFREDO CASAR PEREZ /s/ L. MIGUEL PALOMINO BONILLA
Alfredo Casar Perez L. Miguel Palomino Bonilla
/s/ GILBERTO PEREZALONSO CIFUENTES /s/ ENRIQUE CASTILLO SANCHEZ MEJORADA
Gilberto Perezalonso Cifuentes Enrique Castillo Sanchez Mejorada
/s/ CARLOS RUIZ SACRISTAN /s/ XAVIER GARCIA DE QUEVEDO
Carlos Ruiz Sacristan Xavier Garcia de Quevedo
/s/ RAFAEL MAC GREGOR ANCIOLA
Rafael Mac Gregor Anciola
Date: March 1, 2018
184
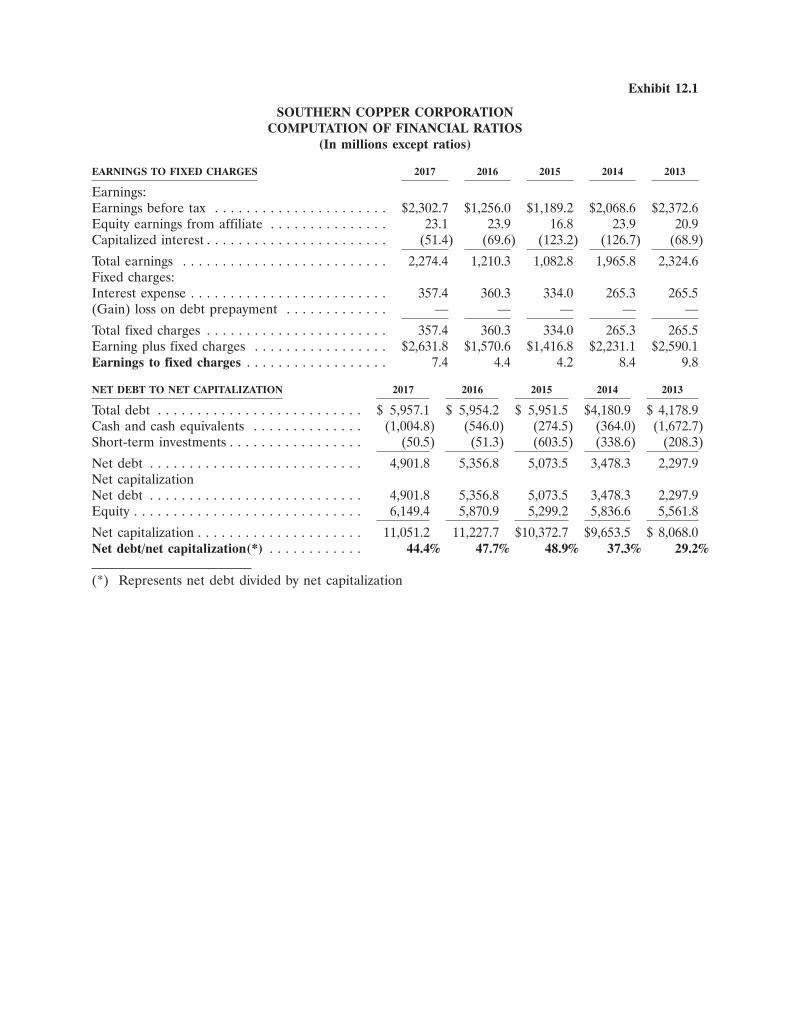
Exhibit 12.1
SOUTHERN COPPER CORPORATIONCOMPUTATION OF FINANCIAL RATIOS
(In millions except ratios)
EARNINGS TO FIXED CHARGES 2017 2016 2015 2014 2013
Earnings:Earnings before tax . . . . . . . . . . . . . . . . . . . . . . $2,302.7 $1,256.0 $1,189.2 $2,068.6 $2,372.6Equity earnings from affiliate . . . . . . . . . . . . . . . 23.1 23.9 16.8 23.9 20.9Capitalized interest . . . . . . . . . . . . . . . . . . . . . . . (51.4) (69.6) (123.2) (126.7) (68.9)
Total earnings . . . . . . . . . . . . . . . . . . . . . . . . . . 2,274.4 1,210.3 1,082.8 1,965.8 2,324.6Fixed charges:Interest expense . . . . . . . . . . . . . . . . . . . . . . . . . 357.4 360.3 334.0 265.3 265.5(Gain) loss on debt prepayment . . . . . . . . . . . . . — — — — —
Total fixed charges . . . . . . . . . . . . . . . . . . . . . . . 357.4 360.3 334.0 265.3 265.5Earning plus fixed charges . . . . . . . . . . . . . . . . . $2,631.8 $1,570.6 $1,416.8 $2,231.1 $2,590.1Earnings to fixed charges . . . . . . . . . . . . . . . . . . 7.4 4.4 4.2 8.4 9.8
NET DEBT TO NET CAPITALIZATION 2017 2016 2015 2014 2013
Total debt . . . . . . . . . . . . . . . . . . . . . . . . . . $ 5,957.1 $ 5,954.2 $ 5,951.5 $4,180.9 $ 4,178.9Cash and cash equivalents . . . . . . . . . . . . . . (1,004.8) (546.0) (274.5) (364.0) (1,672.7)Short-term investments . . . . . . . . . . . . . . . . . (50.5) (51.3) (603.5) (338.6) (208.3)
Net debt . . . . . . . . . . . . . . . . . . . . . . . . . . . 4,901.8 5,356.8 5,073.5 3,478.3 2,297.9Net capitalizationNet debt . . . . . . . . . . . . . . . . . . . . . . . . . . . 4,901.8 5,356.8 5,073.5 3,478.3 2,297.9Equity . . . . . . . . . . . . . . . . . . . . . . . . . . . . . 6,149.4 5,870.9 5,299.2 5,836.6 5,561.8
Net capitalization . . . . . . . . . . . . . . . . . . . . . 11,051.2 11,227.7 $10,372.7 $9,653.5 $ 8,068.0Net debt/net capitalization(*) . . . . . . . . . . . . 44.4% 47.7% 48.9% 37.3% 29.2%
(*) Represents net debt divided by net capitalization
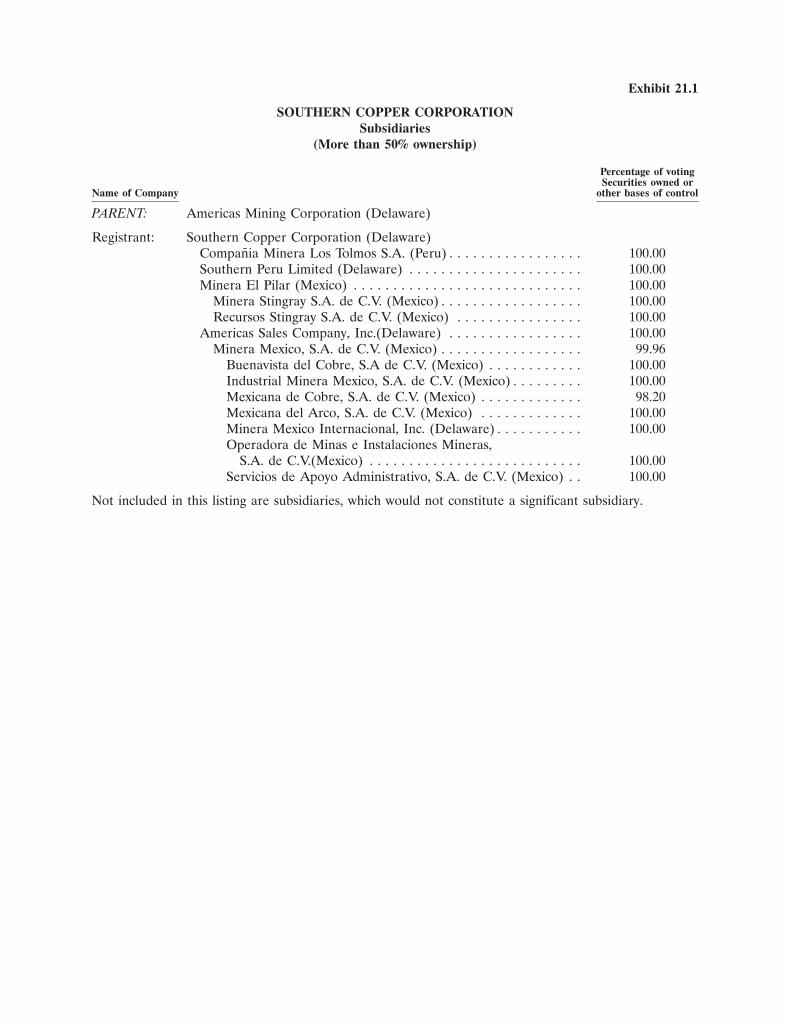
Exhibit 21.1
SOUTHERN COPPER CORPORATIONSubsidiaries
(More than 50% ownership)
Percentage of votingSecurities owned or
Name of Company other bases of control
PARENT: Americas Mining Corporation (Delaware)
Registrant: Southern Copper Corporation (Delaware)Compania Minera Los Tolmos S.A. (Peru) . . . . . . . . . . . . . . . . . 100.00Southern Peru Limited (Delaware) . . . . . . . . . . . . . . . . . . . . . . 100.00Minera El Pilar (Mexico) . . . . . . . . . . . . . . . . . . . . . . . . . . . . . 100.00
Minera Stingray S.A. de C.V. (Mexico) . . . . . . . . . . . . . . . . . . 100.00Recursos Stingray S.A. de C.V. (Mexico) . . . . . . . . . . . . . . . . 100.00
Americas Sales Company, Inc.(Delaware) . . . . . . . . . . . . . . . . . 100.00Minera Mexico, S.A. de C.V. (Mexico) . . . . . . . . . . . . . . . . . . 99.96
Buenavista del Cobre, S.A de C.V. (Mexico) . . . . . . . . . . . . 100.00Industrial Minera Mexico, S.A. de C.V. (Mexico) . . . . . . . . . 100.00Mexicana de Cobre, S.A. de C.V. (Mexico) . . . . . . . . . . . . . 98.20Mexicana del Arco, S.A. de C.V. (Mexico) . . . . . . . . . . . . . 100.00Minera Mexico Internacional, Inc. (Delaware) . . . . . . . . . . . 100.00Operadora de Minas e Instalaciones Mineras,
S.A. de C.V.(Mexico) . . . . . . . . . . . . . . . . . . . . . . . . . . . 100.00Servicios de Apoyo Administrativo, S.A. de C.V. (Mexico) . . 100.00
Not included in this listing are subsidiaries, which would not constitute a significant subsidiary.
Exhibit 23.1
CONSENT OF INDEPENDENT REGISTERED PUBLIC ACCOUNTING FIRM
We consent to the incorporation by reference in Post-Effective Amendment No.2 to RegistrationStatement No. 333-150982 on Form S-8, and Registration Statement No. 333-203237 on Form S-3 ofour reports dated March 1, 2018, relating to the financial statements and financial statement scheduleof Southern Copper Corporation, and the effectiveness of Southern Copper Corporation’s internalcontrol over financial reporting, appearing in the Annual Report on Form 10-K of Southern CopperCorporation for the year ended December 31, 2017.
Galaz, Yamazaki, Ruiz Urquiza, S.C.Member of Deloitte Touche Tohmatsu Limited
/s/ MIGUEL ANGEL ANDRADE LEVEN
C.P.C. Miguel Angel Andrade LevenMexico City, MexicoMarch 1, 2018
Exhibit 31.1
CERTIFICATION PURSUANT TOSection 302 of the Sarbanes-Oxley Act of 2002
I, Oscar Gonzalez Rocha certify that:
1. I have reviewed this report on Form 10-K of Southern Copper Corporation;
2. Based on my knowledge, this report does not contain any untrue statement of a material fact oromit to state a material fact necessary to make the statements made, in light of the circumstancesunder which such statements were made, not misleading with respect to the period covered by thisreport;
3. Based on my knowledge, the financial statements, and other financial information included in thisreport, fairly present in all material respects the financial condition, results of operations and cashflows of the registrant as of, and for, the periods presented in this report;
4. The registrant’s other certifying officers and I are responsible for establishing and maintainingdisclosure controls and procedures (as defined in Exchange Act Rules 13a-15(e) and 15d-15 (e))and internal control over financial reporting (as defined in Exchange Act Rules 13a-15(f) and15d-15(f)) for the registrant and have:
a. Designed such disclosure controls and procedures, or caused such disclosure controls andprocedures to be designed under our supervision, to ensure that material information relatingto the registrant, including its consolidated subsidiaries, is made known to us by others withinthose entities, particularly during the period in which this report is being prepared;
b. Designed such internal control over financial reporting, or caused such internal control overfinancial reporting to be designed under our supervision, to provide reasonable assuranceregarding the reliability of financial reporting and the preparation of financial statements forexternal purposes in accordance with generally accepted accounting principles;
c. Evaluated the effectiveness of the registrant’s disclosure controls and procedures andpresented in this report our conclusions about the effectiveness of the disclosure controls andprocedures, as of the end of the period covered by this report based on such evaluation; and
d. Disclosed in this report any change in the registrant’s internal control over financial reportingthat occurred during the registrant’s fourth fiscal quarter that has materially affected, or isreasonably likely to materially affect, the registrant’s internal control over financial reporting;and
5. The registrant’s other certifying officer(s) and I have disclosed, based on our most recentevaluation of internal control over financial reporting to the registrant’s auditors and the auditcommittee of the registrant’s board of directors (or persons performing the equivalent functions):
a. All significant deficiencies and material weaknesses in the design or operation of internalcontrol over financial reporting which are reasonably likely to adversely affect the registrant’sability to record, process, summarize and report financial information; and
b. Any fraud, whether or not material, that involves management or other employees who have asignificant role in the registrant’s internal control over financial reporting.
March 1, 2018
/s/ OSCAR GONZALEZ ROCHA
Oscar Gonzalez RochaPresident and Chief Executive Officer
Exhibit 31.2
CERTIFICATION PURSUANT TOSection 302 of the Sarbanes-Oxley Act of 2002
I, Raul Jacob, certify that:
1. I have reviewed this report on Form 10-K of Southern Copper Corporation;
2. Based on my knowledge, this report does not contain any untrue statement of a material fact oromit to state a material fact necessary to make the statements made, in light of the circumstancesunder which such statements were made, not misleading with respect to the period covered by thisreport;
3. Based on my knowledge, the financial statements, and other financial information included in thisreport, fairly present in all material respects the financial condition, results of operations and cashflows of the registrant as of, and for, the periods presented in this report;
4. The registrant’s other certifying officers and I are responsible for establishing and maintainingdisclosure controls and procedures (as defined in Exchange Act Rules 13a-15(e) and 15d-15 (e))and internal control over financial reporting (as defined in Exchange Act Rules 13a-15(f) and15d-15(f)) for the registrant and have:
a. Designed such disclosure controls and procedures, or caused such disclosure controls andprocedures to be designed under our supervision, to ensure that material information relatingto the registrant, including its consolidated subsidiaries, is made known to us by others withinthose entities, particularly during the period in which this report is being prepared;
b. Designed such internal control over financial reporting, or caused such internal control overfinancial reporting to be designed under our supervision, to provide reasonable assuranceregarding the reliability of financial reporting and the preparation of financial statements forexternal purposes in accordance with generally accepted accounting principles;
c. Evaluated the effectiveness of the registrant’s disclosure controls and procedures andpresented in this report our conclusions about the effectiveness of the disclosure controls andprocedures, as of the end of the period covered by this report based on such evaluation; and
d. Disclosed in this report any change in the registrant’s internal control over financial reportingthat occurred during the registrant’s fourth fiscal quarter that has materially affected, or isreasonably likely to materially affect, the registrant’s internal control over financial reporting;and
5. The registrant’s other certifying officer(s) and I have disclosed, based on our most recentevaluation of internal control over financial reporting to the registrant’s auditors and the auditcommittee of the registrant’s board of directors (or persons performing the equivalent functions):
a. All significant deficiencies and material weaknesses in the design or operation of internalcontrol over financial reporting which are reasonably likely to adversely affect the registrant’sability to record, process, summarize and report financial information; and
b. Any fraud, whether or not material, that involves management or other employees who have asignificant role in the registrant’s internal control over financial reporting.
March 1, 2018
/s/ RAUL JACOB
Raul JacobVice President, Finance,Treasurer and Chief
Financial Officer

Exhibit 32.1
CERTIFICATION PURSUANT TO18 U.S.C. SECTION 1350,
AS ADOPTED PURSUANT TOSECTION 906 OF THE SARBANES-OXLEY ACT OF 2002
In connection with the Annual Report of Southern Copper Corporation (the ‘‘Company’’) onForm 10-K for the period ending December 31, 2017 as filed with the Securities and ExchangeCommission on the date hereof (the ‘‘Report’’), I, Oscar Gonzalez Rocha, President and ChiefExecutive Officer of the Company, certify pursuant to 18 U.S.C. Section 1350, as adopted pursuant toSection 906 of the Sarbanes-Oxley Act of 2002, that:
(1) The Report fully complies with the requirements of section 13(a) or 15(d) of the SecuritiesExchange Act of 1934; and
(2) The information contained in the Report fairly presents, in all material respects, the financialcondition and results of operations of the Company.
/s/ OSCAR GONZALEZ ROCHA
Oscar Gonzalez RochaPresident and Chief Executive Officer
March 1, 2018
A signed original of this written statement required by section 906 has been provided to SouthernCopper Corporation and will be retained by Southern Copper Corporation and furnished to theSecurities and Exchange Commission or its staff upon request.
Exhibit 32.2
CERTIFICATION PURSUANT TO18 U.S.C. SECTION 1350,
AS ADOPTED PURSUANT TOSECTION 906 OF THE SARBANES-OXLEY ACT OF 2002
In connection with the Annual Report of Southern Copper Corporation (the ‘‘Company’’) onForm 10-K for the period ending December 31, 2017 as filed with the Securities and ExchangeCommission on the date hereof (the ‘‘Report’’), I, Raul Jacob, Vice President, Finance and ChiefFinancial Officer of the Company, certify pursuant to 18 U.S.C. Section 1350, as adopted pursuant toSection 906 of the Sarbanes-Oxley Act of 2002, that:
(1) The Report fully complies with the requirements of section 13(a) or 15(d) of the SecuritiesExchange Act of 1934; and
(2) The information contained in the Report fairly presents, in all material respects, the financialcondition and results of operations of the Company.
/s/ RAUL JACOB
Raul JacobVice President, Finance, Treasurer and Chief
Financial Officer
March 1, 2018
A signed original of this written statement required by section 906 has been provided to SouthernCopper Corporation and will be retained by Southern Copper Corporation and furnished to theSecurities and Exchange Commission or its staff upon request.


