Embed Size (px)
Citation preview

ForthWind Offshore Wind Demonstration Project,
Methil, Fife.
Volume 3: Technical Appendices
July 2015

Forthwind Ltd Environmental Statement
FORTHWIND LTD: ENVIRONMENT STATEMENT
TABLE OF CONTENTS
The following Environment Statement and Technical Appendices constitutes Volume 3 of the Forthwind
Environment Statement.
It is supported by Volume 1: Environment Statement and Volume 2: Figures and Visualisations which are
provided in a separate folder
Section Number Appendix Title
Volume 3 Technical Appendices
A6.1 Aspect Geophysical Report
A7.1 Ornithology Technical Appendix
A7.2 Habitats Regulation Assessment Appendix
A10.1 Methil Benthic Survey Report
A12.1 Cultural Heritage DBA
A14.1 Survey Record Sheets and Calculations Certificates
A14.2 Noise Survey Wind Speed and Directions
A15.1 Navigational Risk Assessment
A19.1 Phase 1 FEPOWDT Phase 1 Survey Results

Aspect Land & Hydrographic Surveys Ltd
Thornhouse Business Centre Ballot Road, Irvine, Ayrshire KA12 0HW Tel: 01294 313 399 Fax: 01294 313 389
E-mail: [email protected]
Web: www.aspectsurveys.com
MULTIBEAM AND GEOPHYSICAL SURVEY
WIND TURBINE DEMONSTRATION PROJECT
METHIL
FIRTH OF FORTH
FINAL SURVEY REPORT
A5353
12th December 2014
COMPILED: E J Stacey
APPROVED: C D Thomson
Client:
2-B Energy Ltd Quayside House Dock Road Methil Dock Business Park Methil Fife KY8 3SR

2 A5353_Report of Survey_Rev 1
Table of Contents 1. Introduction ................................................................................................................................................ 2
2. Scope of Works .......................................................................................................................................... 4
3. Geodesy & Datum ...................................................................................................................................... 5
4. Multibeam Bathymetric Survey ................................................................................................................... 6
4.1 Multibeam Bathymetric Survey Equipment and Methods .................................................................... 6
4.2 Multibeam Bathymetric Survey Results .............................................................................................. 7
4.3 Multibeam Backscatter Survey Results............................................................................................... 9
5. Sub-Bottom Profiler Survey ...................................................................................................................... 10
5.1 Sub-Bottom Profiler Survey Equipment and Methods ....................................................................... 10
5.2 Sub-Bottom Profiler Survey Results ................................................................................................. 11
6. Sidescan Sonar Survey ............................................................................................................................ 18
6.1 Sidescan Sonar Survey Equipment and Methods ............................................................................. 25
6.2 Sidescan Sonar Survey Results ....................................................................................................... 25
7. Magnetometer Survey .............................................................................................................................. 35
7.1 Magnetometer Survey Equipment and Methods ............................................................................... 35
7.2 Magnetometer Survey Results ......................................................................................................... 35
8. Survey Vessels ........................................................................................................................................ 35
9. Survey Standards ..................................................................................................................................... 36
10. Personnel............................................................................................................................................. 37
Annex A ............................................................................................................................................................ 38
Annex B ............................................................................................................................................................ 39
Annex C............................................................................................................................................................ 40
Annex D............................................................................................................................................................ 42
Annex E ............................................................................................................................................................ 43
FIGURE 1 – MULTIBEAM BATHYMETRIC DATA AND PHASE 1 (BLACK) ........................................................ 5
FIGURE 2 - R2SONIC 2024 SYSTEM USED FOR THE BATHYMETRIC SURVEY ............................................. 6
FIGURE 3 – OVERVIEW OF BATHYMETRIC DATA IN SURVEY AREA, DEPTHS TO CD ................................. 7
FIGURE 4 – SECTION OF THE CABLE ROUTE LOOKING NORTH-EAST RUNNING FROM THE SHORE OUT
TO APPROX. 500M ............................................................................................................................................ 8
FIGURE 5 – EXAMPLE OF MBES BACKSCATTER IMAGERY SHOWING CHANGING GEOMORPHOLOGY
OUT TO 200M FROM THE SHORE .................................................................................................................... 9
FIGURE 6 – APPLIED ACOUSTICS CSP-P POWER SUPPLY ......................................................................... 10
FIGURE 7 – AA201 BOOMER PLATE AND 20-ELEMENT HYDROPHONE TOWED BEHIND VESSEL ........... 10
FIGURE 8 – DIPPING STRATA EXPOSED AT SURFACE (CABLE ROUTE SHORE – T2) ............................. 12
FIGURE 9 – RECOMMENDED SAMPLING LOCATION (CABLE ROUTE SHORE – T3)................................... 13
FIGURE 10 – EXISTING BOREHOLE LOCATIONS .......................................................................................... 13

3 A5353_Report of Survey_Rev 1
FIGURE 11 – SEGMENT OF LINE 20141107_142743 SHOWING ROCK OUTCROP ON CABLE ROUTE
336731, 697480 ................................................................................................................................................ 15
FIGURE 12 – LINE 20141110_120426 SHOWING POSITION OF T2 ............................................................... 16
FIGURE 13 – LINE 20141118-095955 SHOWING POSITION OF T3 ................................................................ 17
FIGURE 14 – LINE 20141120-125651 SHOWING POSITION OF T1 ................................................................ 18
FIGURE 15 – LINE 20141118-140112 SHOWING POSITION OF T4 ................................................................ 19
FIGURE 16 – LINE 20141118-151719 SHOWING POSITION OF T5 ................................................................ 20
FIGURE 17 – LINE 20141119-132208 SHOWING POSITION OF T6 ................................................................ 21
FIGURE 18 – LINE 20141118-151719 SHOWING POSITION OF T7 ................................................................ 22
FIGURE 19 – LINE 20141120-111146 SHOWING POSITION OF T8 ................................................................ 23
FIGURE 20 – LINE 20141120-151241 SHOWING POSITION OF T9 ................................................................ 24
FIGURE 21 – EDGETECH SIDESCAN SONAR ................................................................................................ 25
FIGURE 22 – EDGE OF OUTCROPPING ROCK IN NORTH OF AREA ............................................................ 26
FIGURE 23 – LINEAR BANDS OF ROCK ......................................................................................................... 27
FIGURE 24 – SAND PATCHES WITH SAND WAVES BETWEEN ROCK OUTCROPS .................................... 28
FIGURE 25 – TYRES ON SEABED .................................................................................................................. 29
FIGURE 26 – IMAGERY OF CONTACT A5353_0004 SHOWING LINEAR DEBRIS ON SEABED .................... 32
FIGURE 27 – IMAGERY OF CONTACT A5353_0005 SHOWING LARGE ANCHOR ON SEABED ................... 33
FIGURE 28 – OVERVIEW OF GEOMORPHOLOGICAL BOUNDARIES IDENTIFIED IN THE SIDESCAN
SONAR SURVEY ............................................................................................................................................. 34
FIGURE 29 – GEOMETRICS G882 CAESIUM VAPOUR MAGNETOMETER ................................................... 35
FIGURE 30 – SURVEY VESSEL MARINE SENSOR ........................................................................................ 36
FIGURE 31 – SURVEY VESSEL REMOTE SENSOR ....................................................................................... 36
TABLE OF REVISIONS
DATE REVISION AUTHOR CHECKED STATUS
4/12/2014 00 EJS Draft, SBP Phase 1
12/12/14 01 EJS CDT Original

4 A5353_Report of Survey_Rev 1
1. Introduction On the instructions of 2-B Energy Ltd, Aspect Land and Hydrographic Surveys Ltd (ALHS) carried out multibeam
bathymetric (MBES), magnetometer, side-scan sonar (SSS) and geophysical surveys at Methil in the Firth of
Forth.
The program of events was as follows:
6th – 8th August 2014 MBES Survey
3rd – 7th November 2014 SSS Survey
4th November 2014 Magnetometer Survey
7th – 21st November 2014 Geophysical Survey
2. Scope of Works The aim of the survey was to allow better understanding of the seabed as part of the licence application process
for a wind turbine demonstration field. The survey methods used aimed to give information on the topography
and distribution of any seabed objects in addition to an indication of seabed geomorphology and the depth of
sediment overburden.
The survey area encompassed the proposed sites of the turbines, the cable routes between them and the cable
route to shore (Figure 1). This was further divided into two areas with differing survey requirements. Phase 1 is
shown in Figure 1 enclosed by a black boundary. This includes turbines 2 and 3 and the cable route to shore.
Outwith this boundary is the Phase 2 area.

5 A5353_Report of Survey_Rev 1
FIGURE 1 – MULTIBEAM BATHYMETRIC DATA AND PHASE 1 (BLACK)
3. Geodesy & Datum The horizontal datum used throughout the data gathering phase of the survey was OSGB36 (OSTN02™). Data
has been rendered in OSGB36 Datum, British National Grid. The vertical datum for all rendered data is Chart
Datum.
OSTN02™ defines OSGB36 National Grid in conjunction with the National GPS Network. In this respect
OSTN02™ can be considered error free (not including any GPS positional errors). The agreement between
OSTN02™ and the old triangulation network stations (down to 3rd order) is 0.1m rms.

6 A5353_Report of Survey_Rev 1
4. Multibeam Bathymetric Survey
4.1 Multibeam Bathymetric Survey Equipment and Methods ALHS’ R2Sonic 2024 multibeam sonar system (Figure 2) was controlled using R2Sonic Sonic Control 2000
software during the course of data gathering.
Very detailed data with full seafloor coverage was gathered over the area of the survey using the R2Sonic 2024.
It’s narrow beam width (0.5°), high ping rate and the selection of 400 kHz as the main operating frequency
ensured that the highest possible detail was achieved.
The system was operated at the maximum ping rate achievable throughout the survey, such that the ping rate
was controlled by the depth of water.
Sound Velocity (SV) dips were carried out prior to commencing survey operations and thereafter whenever the
surface sound velocity varied by more than 2ms-1.
FIGURE 2 - R2SONIC 2024 SYSTEM USED FOR THE BATHYMETRIC SURVEY
During the survey there was little freshwater input and the waters were well mixed, resulting in little variation over
the survey area. SV dips were carried out using an AML SVP dipping probe and SeaCast software, and the data
incorporated into the Hysweep Survey software for real-time corrections.
Positioning was achieved using a CODA F185 R+ INS RTK GPS system, providing horizontal and vertical
positioning as well as precise heading. Full motion compensation for use in the multibeam sonar data gathering
system was also provided by this CODA unit. The motion reference unit was co-located with the sonar head,
providing high quality and frequent motion compensation as required by the multibeam sonar system. The
situation of the motion system in this way also minimises lever arm errors.
The sonar and ancillary sensor data was gathered in the Sonar Interface Module (SIM) on the boat, which
combined sonar data from the head with motion (TSS1) and array face SV to accurately steer the sonar system
in real time. The data was transmitted to the survey laptop running Hypack Hysweep over an Ethernet

7 A5353_Report of Survey_Rev 1
connection where the data was then amalgamated with position, motion and sound velocity through the water
column to provide precise depth and position data on the seabed.
Data was gathered with a planned insonification of 200% in order to allow online and post-survey quality
assurance checks to be carried out reliably.
Calibration values for the system were calculated from a patch test conducted on the 6th August 2014 in the
survey area. Details of the patch test can be seen in Annex D.
Latency -0.1
Pitch -5.00
Roll 0.35
Yaw 2.00
Data gathering was done in Hypack Hysweep Survey. Hypack was then used to post-process in the MBMax
software. The stages of Hypack processing are detailed in Annex C.
4.2 Multibeam Bathymetric Survey Results Depths in the survey area ranged from 2m above to 28m below Chart Datum. The depth increases steadily
moving offshore. Much of the seabed is featureless with the exception of frequent scattered boulders. An
overview of the multibeam bathymetric data can be seen in Figure 3.
FIGURE 3 – OVERVIEW OF BATHYMETRIC DATA IN SURVEY AREA, DEPTHS TO CD

8 A5353_Report of Survey_Rev 1
The most rugged seabed topography can be seen on the cable route between the shore and T2 where there
appears to be outcropping rock (see also 6.2 Sidescan Survey Results). This rock strikes 010/190 and has a
direction of dip of 100. A point-cloud image showing a section of the cable route from the shore outwards can be
seen in Figure 4.
FIGURE 4 – SECTION OF THE CABLE ROUTE LOOKING NORTH-EAST RUNNING FROM THE SHORE OUT TO APPROX. 500M

9 A5353_Report of Survey_Rev 1
4.3 Multibeam Backscatter Survey Results Backscatter data showing the intensity of the seabed return was collected by the R2Sonic 2024 MBES system.
The backscatter data effectively shows variations in seabed geomorphology. An extract of the backscatter
mosaic can be seen in Figure 5.
FIGURE 5 – EXAMPLE OF MBES BACKSCATTER IMAGERY SHOWING CHANGING GEOMORPHOLOGY OUT TO 200M FROM THE SHORE
Armour Stone
Fine Sediment
Coarse Sediment
Outcropping
Rock
~200m

10 A5353_Report of Survey_Rev 1
5. Sub-Bottom Profiler Survey
5.1 Sub-Bottom Profiler Survey Equipment and Methods An Applied Acoustics boomer system was utilised for the geophysical work. The boomer system was chosen as
the sensor for this task in order to allow penetration of the sediments and rock to identify sub-bottom horizons.
This system comprises:
High Voltage Power Supply CSP-P 50-350 Joule (Figure 6)
AA201 Boomer Plate (sound source) towed behind the survey vessel (Figure 7)
Twenty element Hydrophone (receiver) towed behind the survey vessel (Figure 7)
Chesapeake Analogue to Digital converter
Chesapeake SonarWiz5 on-line data acquisition software
FIGURE 6 – APPLIED ACOUSTICS CSP-P POWER SUPPLY
FIGURE 7 – AA201 BOOMER PLATE AND 20-ELEMENT HYDROPHONE TOWED BEHIND VESSEL

11 A5353_Report of Survey_Rev 1
The sub-bottom profiler lines were run at 25m intervals.
Before the start of the sub-bottom profiler survey each day a pre-shooting search was carried out by a qualified
Marine Mammal Observer (MMO) in line with Marine Scotland guidelines. The search was followed by a soft-
start procedure whereby the power of the sub-bottom profiler was increased from the minimum level (50J) up to
the operational level for the area (generally 200J) over a period of 20 to 30 minutes. This was done in order to
reduce the impact of the works on marine wildlife in the area. There were no marine mammals sighted prior
to commencing operations throughout the period of the survey or during data gathering.
The geophysical data was interpreted in Chesapeake SonarWiz geophysical survey processing software. This
allowed full resolution data to be viewed and interpreted with individual horizons digitised as required. Further
details of the data processing procedures can be seen in Annex C.
Thicknesses were calculated for all horizons to the seafloor in SonarWiz. These were then landformed (reduced)
to the seabed levels obtained from the multibeam survey such that all horizons could be reported as a level to
Chart Datum.
5.2 Sub-Bottom Profiler Survey Results Six sub-bottom horizons were identified in the geophysical data. These are coloured on both the images and
rendered DWG files according to the following classification:
Horizon 1 Representing the limit of acoustic detection, the base of layered sediments which is likely to represent the first hard return
Horizon 2 Not shown on DWG. This horizon is visible on the rendered SBP Images showing what appear as dipping strata below Horizon 1. This is particularly found around the area of the cable route from the shore to T2. From the MBES the orientation of these beds appears to be Strike (010/190) Dip direction 100. From the SBP the Dip angle appears to be around 5º. This is depicted in Figure 8.
Horizon 3 Represents an interface between differing layered sediment types
Horizon 4 Represents an interface between differing layered sediment types
Horizon 5 Represents an interface between differing layered sediment types
Horizon 6 Represents an interface between differing layered sediment types

12 A5353_Report of Survey_Rev 1
FIGURE 8 – DIPPING STRATA EXPOSED AT SURFACE (CABLE ROUTE SHORE – T2)
It is recommended that the morphology of these features be intrusively investigated.
2 locations that are thought well suited to investigation of these features have been provided as detailed below
and imaged in Figure 9.
A 336731 697480 5m CD ridge in surrounding depths of 7m B 336637 697962 5.1mCD ridge in surrounding depths of 6.5m

13 A5353_Report of Survey_Rev 1
FIGURE 9 – RECOMMENDED SAMPLING LOCATION (CABLE ROUTE SHORE – T3)
There are 2 boreholes existing within 2km of the survey area. These gleaned the following information:
FIGURE 10 – EXISTING BOREHOLE LOCATIONS

14 A5353_Report of Survey_Rev 1
BH04A showed the following succession with the seabed at a depth of 3.7m below CD close offshore of the Fife
Energy Park.
3.5m SAND 3.1m CLAY 3.73m MUDSTONE 3.97m SANDSTONE 2.0m SILTSTONE 12.24m MUDSTONE
A COAL BOARD borehole from 1961 lies approximately 1.4km to the north and 300m to the east of T3. This
shows GREY SHALE on the surface with COAL, SHALE, SANDSTONE, SILTSTONE and MUDSTONE below.
Figures 11-19 and images provided with this report are not tidally corrected so the range lines on the
image do not represent depths to Chart Datum, but can be used to assess relative thickness between
horizons approximately.
The provided DWG files give the horizon level to CD as they are landformed to the bathymetric survey and the
drawing A5353_METHIL SBP.dwg should be referred to for horizon levels.
Figure 11 below shows an example of what is thought to be outcropping rock seen on shore-T2 cable route,
digitised in green.
Figure 12 below shows a line across T2 turbine location. The location of the turbine itself is marked by a white
vertical line. A surface layer of sediment is seen, the base of which is digitised as Horizon 3 (Orange). Below
Horizon 3 there are layers of what is thought to be denser sediments, digitised as Horizons 4 and 5. Horizon 1,
thought to be a hard return which may be rock, is seen rising up towards the shore end of the line (NW) with
dipping strata below (Horizon 2).
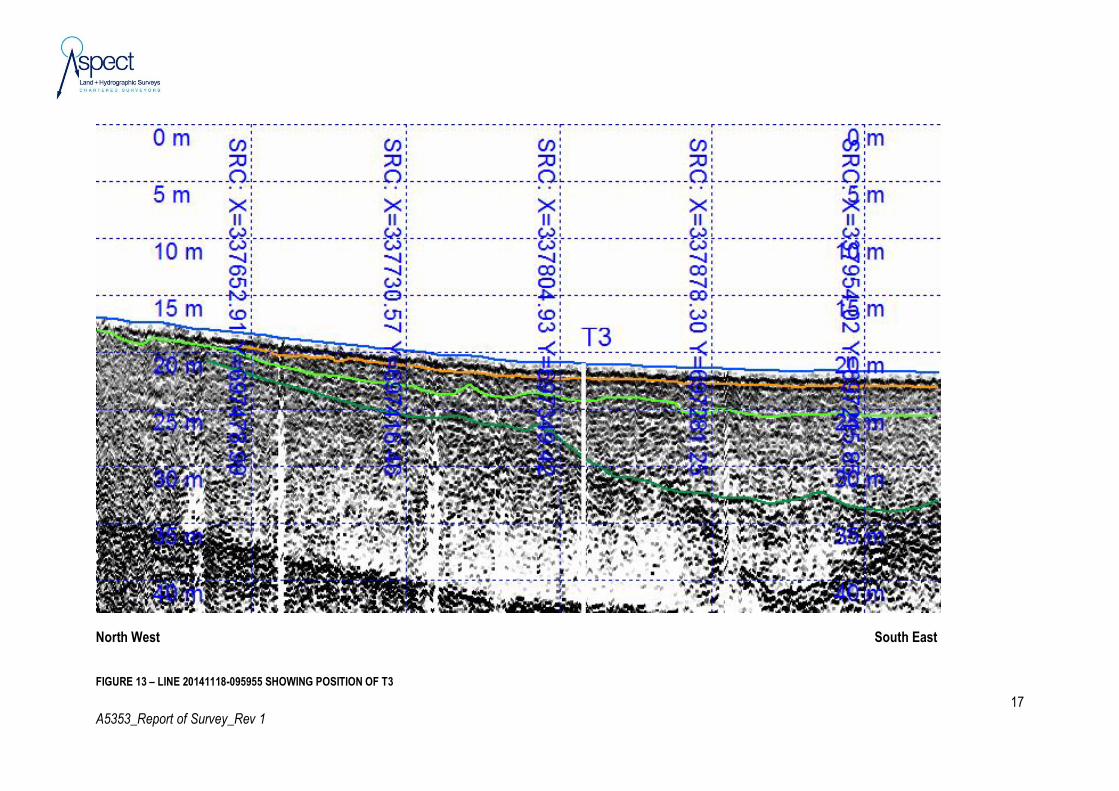
Figure 13 below shows a line across T3 turbine location. The location of the turbine itself is marked by a white
vertical line. A surface layer of sediment is seen, the base of which is digitised as Horizon 3 (Orange).Below
Horizon 3 there is a layer of what is thought to be a denser material which is overlain on Horizon 1. Horizon 4
and 5 are absent from this turbine. Horizon 1 is seen 3-4m below the surface with dipping strata (Horizon 2).
Figures 14 to 20 show images of the sub bottom information at each of the turbine locations in Phase 2 area.
These show a varying overburden which generally increases as you move further offshore.

North South
FIGURE 11 – SEGMENT OF LINE 20141107_142743 SHOWING ROCK OUTCROP ON CABLE ROUTE 336731, 697480

16 A5353_Report of Survey_Rev 1
North West South East
FIGURE 12 – LINE 20141110_120426 SHOWING POSITION OF T2
17 A5353_Report of Survey_Rev 1
North West South East
FIGURE 13 – LINE 20141118-095955 SHOWING POSITION OF T3

18 A5353_Report of Survey_Rev 1
North West South East
FIGURE 14 – LINE 20141120-125651 SHOWING POSITION OF T1

19 A5353_Report of Survey_Rev 1
North West South East
FIGURE 15 – LINE 20141118-140112 SHOWING POSITION OF T4

20 A5353_Report of Survey_Rev 1
North West South East
FIGURE 16 – LINE 20141118-151719 SHOWING POSITION OF T5

21 A5353_Report of Survey_Rev 1
North West South East
FIGURE 17 – LINE 20141119-132208 SHOWING POSITION OF T6

22 A5353_Report of Survey_Rev 1
South East North West
FIGURE 18 – LINE 20141118-151719 SHOWING POSITION OF T7

23 A5353_Report of Survey_Rev 1
North West South East
FIGURE 19 – LINE 20141120-111146 SHOWING POSITION OF T8

24 A5353_Report of Survey_Rev 1
North West South East
FIGURE 20 – LINE 20141120-151241 SHOWING POSITION OF T9

6. Sidescan Sonar Survey
6.1 Sidescan Sonar Survey Equipment and Methods An Edgetech 4125 dual frequency sonar (Figure 21) was used for the side-scan sonar survey. Both high (900
kHz) and low (400 kHz) frequency data was collected allowing the morphology of the seabed to be fully
understood and small objects to be detected.
FIGURE 21 – EDGETECH SIDESCAN SONAR
The side-scan sonar files were processed and mosaicked in Chesapeake SonarWiz software. The generated
mosaics were then inserted into an AutoCAD drawing. The line spacing was 20m, with a range scale of 50m in
order to guarantee full insonification of the seabed. Details of the side-scan sonar processing procedures are
detailed in Annex C.
6.2 Sidescan Sonar Survey Results Along the route from the shore to T2 outcropping rock could be seen. Linear bands of rock, also seen in the
multibeam data, run from NNE to SSW. Between the outcrops areas of sand can be seen, which in some cases
has sand waves superimposed on it suggesting a dynamic environment with a strong flow. Numerous boulders
are present throughout the survey area, although some areas of smooth sand do exist.

26 A5353_Report of Survey_Rev 1
FIGURE 22 – EDGE OF OUTCROPPING ROCK IN NORTH OF AREA

27 A5353_Report of Survey_Rev 1
FIGURE 23 – LINEAR BANDS OF ROCK

28 A5353_Report of Survey_Rev 1
FIGURE 24 – SAND PATCHES WITH SAND WAVES BETWEEN ROCK OUTCROPS
Along the route from the shore to T2 numerous buoys thought to mark lobster pots were observed. Individual
lobster pots have not been targeted as they cannot be reliably distinguished among the boulders. Throughout the
area surveyed several tyres could also be seen.

29 A5353_Report of Survey_Rev 1
FIGURE 25 – TYRES ON SEABED
Non-natural objects within the survey area have been targeted and are detailed below.
Target Image Target Info User Entered Info
A5353_0001
● Sonar Time at Target: 11/5/2014 10:29:18 AM
● Click Position
56.1579793863 -3.0197428382 (WGS84)
0.0000000000 0.0000000000 (NAD27LL)
56.1579793863 -3.0197428382 (LocalLL)
(X) 336758.68 (Y) 696613.63 (Projected
Coordinates)
● Map Projection: OSGB-GPS-2002
● Acoustic Source File: C:\SonarWiz-
Projects\A5353_SSS\SBP\20141105102143.jsf
● Ping Number: 39714
● Range to target: 19.38 Meters
● Fish Height: 3.96 Meters
● Heading: 216.500 Degrees
● Water Depth: 13.58 Meters
Dimensions and attributes
● Target Width: 0.23 Meters
● Target Height: 0.34 Meters
● Target Length: 9.19 Meters
● Target Shadow: 1.87 Meters
● Description: Linear object
A5353_0002
● Sonar Time at Target: 11/5/2014 1:44:07 PM
● Click Position
56.1575709524 -3.0116423290 (WGS84)
0.0000000000 0.0000000000 (NAD27LL)
56.1575709524 -3.0116423290 (LocalLL)
(X) 337261.15 (Y) 696560.76 (Projected
Coordinates)
● Map Projection: OSGB-GPS-2002
● Acoustic Source File: C:\SonarWiz-
Projects\A5353_SSS\SBP\20141105133930.jsf
● Ping Number: 207580
● Range to target: 7.03 Meters
● Fish Height: 4.48 Meters
● Heading: 231.100 Degrees
● Water Depth: 14.79 Meters
Dimensions and attributes
● Target Width: 0.00 Meters
● Target Height: 0.00 Meters
● Target Length: 0.00 Meters
● Target Shadow: 0.00 Meters
● Description: Rope/Chain/Wire

30 A5353_Report of Survey_Rev 1
A5353_0003
● Sonar Time at Target: 11/7/2014 12:40:12 PM
● Click Position
56.1636888750 -3.0062548501 (WGS84)
0.0000000000 0.0000000000 (NAD27LL)
56.1636888750 -3.0062548501 (LocalLL)
(X) 337605.72 (Y) 697236.78 (Projected
Coordinates)
● Map Projection: OSGB-GPS-2002
● Acoustic Source File: C:\SonarWiz-
Projects\A5353_SSS\SBP\20141107123410.jsf
● Ping Number: 38830
● Range to target: 16.24 Meters
● Fish Height: 5.70 Meters
● Heading: 219.390 Degrees
● Water Depth: 12.93 Meters
Dimensions and attributes
● Target Width: 0.84 Meters
● Target Height: 0.50 Meters
● Target Length: 2.41 Meters
● Target Shadow: 1.65 Meters
● Description: Object
A5353_0004
● Sonar Time at Target: 11/3/2014 4:23:18 PM
● Click Position
56.1637824475 -3.0061181367 (WGS84)
0.0000000000 0.0000000000 (NAD27LL)
56.1637824475 -3.0061181367 (LocalLL)
(X) 337614.36 (Y) 697247.08 (Projected
Coordinates)
● Map Projection: OSGB-GPS-2002
● Acoustic Source File: C:\SonarWiz-
Projects\A5353_SSS\SBP\20141103171503.jsf
● Ping Number: 80043
● Range to target: 46.04 Meters
● Fish Height: 4.49 Meters
● Heading: 223.000 Degrees
● Water Depth: 10.86 Meters
Dimensions and attributes
● Target Width: 0.00 Meters
● Target Height: 0.00 Meters
● Target Length: 0.00 Meters
● Target Shadow: 0.00 Meters
● Description: Rope/Chain/Wire
A5353_0005
● Sonar Time at Target: 11/3/2014 3:56:28 PM
● Click Position
56.1643070393 -3.0078935641 (WGS84)
0.0000000000 0.0000000000 (NAD27LL)
56.1643070393 -3.0078935641 (LocalLL)
(X) 337504.95 (Y) 697307.07 (Projected
Coordinates)
● Map Projection: OSGB-GPS-2002
● Acoustic Source File: C:\SonarWiz-
Projects\A5353_SSS\SBP\20141103164746.jsf
● Ping Number: 56929
● Range to target: 5.27 Meters
● Fish Height: 4.33 Meters
● Heading: 220.190 Degrees
● Water Depth: 10.23 Meters
Dimensions and attributes
● Target Width: 1.08 Meters
● Target Height: 1.81 Meters
● Target Length: 2.53 Meters
● Target Shadow: 4.90 Meters
● Description: Anchor
A5353_0006
● Sonar Time at Target: 11/3/2014 3:51:41 PM
● Click Position
56.1668235347 -3.0033811851 (WGS84)
0.0000000000 0.0000000000 (NAD27LL)
56.1668235347 -3.0033811851 (LocalLL)
(X) 337789.26 (Y) 697583.07 (Projected
Coordinates)
● Map Projection: OSGB-GPS-2002
● Acoustic Source File: C:\SonarWiz-
Projects\A5353_SSS\SBP\20141103164746.jsf
● Ping Number: 52804
● Range to target: 10.02 Meters
● Fish Height: 3.12 Meters
● Heading: 243.690 Degrees
● Water Depth: 10.75 Meters
Dimensions and attributes
● Target Width: 0.62 Meters
● Target Height: 0.29 Meters
● Target Length: 1.70 Meters
● Target Shadow: 1.06 Meters
● Description: Object among boulders

31 A5353_Report of Survey_Rev 1
A5353_0007
● Sonar Time at Target: 11/3/2014 4:34:03 PM
● Click Position
56.1647681532 -3.0046463757 (WGS84)
0.0000000000 0.0000000000 (NAD27LL)
56.1647681532 -3.0046463757 (LocalLL)
(X) 337707.36 (Y) 697355.45 (Projected
Coordinates)
● Map Projection: OSGB-GPS-2002
● Acoustic Source File: C:\SonarWiz-
Projects\A5353_SSS\SBP\20141103172734.jsf
● Ping Number: 89317
● Range to target: 7.82 Meters
● Fish Height: 5.22 Meters
● Heading: 213.390 Degrees
● Water Depth: 10.66 Meters
Dimensions and attributes
● Target Width: 0.00 Meters
● Target Height: 0.00 Meters
● Target Length: 2.39 Meters
● Target Shadow: 0.00 Meters
● Description: Linear object
A5353_0008
● Sonar Time at Target: 11/4/2014 12:52:14 PM
● Click Position
56.1671460721 -3.0213025770 (WGS84)
0.0000000000 0.0000000000 (NAD27LL)
56.1671460721 -3.0213025770 (LocalLL)
(X) 336676.91 (Y) 697635.31 (Projected
Coordinates)
● Map Projection: OSGB-GPS-2002
● Acoustic Source File: C:\SonarWiz-
Projects\A5353_SSS\SBP\20141104124640.jsf
● Ping Number: 147689
● Range to target: 15.42 Meters
● Fish Height: 5.11 Meters
● Heading: 252.500 Degrees
● Water Depth: 7.05 Meters
Dimensions and attributes
● Target Width: 0.00 Meters
● Target Height: 0.00 Meters
● Target Length: 0.00 Meters
● Target Shadow: 0.00 Meters
● Description: Possible static fishing gear

32 A5353_Report of Survey_Rev 1
FIGURE 26 – IMAGERY OF CONTACT A5353_0004 SHOWING LINEAR DEBRIS ON SEABED

33 A5353_Report of Survey_Rev 1
FIGURE 27 – IMAGERY OF CONTACT A5353_0005 SHOWING LARGE ANCHOR ON SEABED
Some distinct geomorphological boundaries could be identified in the sidescan sonar data. An overview of these
is shown in Figure 28. Light green indicates the edge of the rock armour slope, dark green the edge of exposed
rock and yellow the boundary between differing sediment types. These boundaries are given as indicative only,
and their nature should be confirmed by way of grab sampling or intrusive investigation.

34 A5353_Report of Survey_Rev 1
FIGURE 28 – OVERVIEW OF GEOMORPHOLOGICAL BOUNDARIES IDENTIFIED IN THE SIDESCAN SONAR SURVEY

35 A5353_Report of Survey_Rev 1
7. Magnetometer Survey
7.1 Magnetometer Survey Equipment and Methods The magnetometer survey was carried out with a Geometrics G882 Caesium Vapour magnetometer (Figure 29)
which can measure total field strength to a precision of 0.02nT. The magnetometer was towed along 5m spaced
lines in two directions, resulting in a 70x70m grid of data centred on turbine locations 2 and 3. The
magnetometer was towed as close to the seabed as safe and practicable in order to detect objects with small
magnetic signatures.
FIGURE 29 – GEOMETRICS G882 CAESIUM VAPOUR MAGNETOMETER
Details of the data processing procedures used with the magnetometer data are detailed in Annex C.
7.2 Magnetometer Survey Results No significant magnetic contacts were found in the areas surveyed. The background magnetic field varied slightly
between the areas, but no specific magnetic anomalies typical of ferrous metal objects were seen in the data.
8. Survey Vessels Survey vessels Marine Sensor (Figure 30) and Remote Sensor (Figure 31) were used to carry out the survey
work. Both are fibreglass catamarans certified Cat III by the Maritime and Coastguard Agency with ample deck
and cabin space to house crew and equipment.
Marine Sensor was used to carry out the multibeam bathymetric, magnetometer and part of the sidescan sonar
survey. The vessel has a dedicated central moon pool in order to allow the multibeam sonar head to be easily
deployed and recovered. The sub-bottom profiler and the remainder of the sidescan sonar survey were carried
out from Remote Sensor.

36 A5353_Report of Survey_Rev 1
FIGURE 30 – SURVEY VESSEL MARINE SENSOR
FIGURE 31 – SURVEY VESSEL REMOTE SENSOR
9. Survey Standards The Hydrographic survey is considered complete to International Hydrographic Organisation Special Order
standard, with a Full Sea Floor Search being achieved as per IHO publication S44, Table 1. A representation of
the section of interest within that document is shown in Table 6:

37 A5353_Report of Survey_Rev 1
Order Examples of Typical Areas
Horizontal Accuracy (95% Confidence Level)
Depth Accuracy for Reduced Depths (95% Confidence Level)
100% Bottom Search
System Detection Capability
Maximum Line Spacing
Special Harbours, berthing area and associated critical channels with minimum under keel clearances
2m a = 0.25m b = 0.0075
Compulsory Cubic features > 1m
Not applicable as 100% search compulsory
Table 2 - Taken From IHO Publication S44, Table 1, Showing Requirements Of A Special Order Survey
The error limits for depth accuracy are calculated by introducing the values listed in Table 2 for a and b into the
formula ±√[a2+(b*d)2], where:
a constant depth error, i.e. the sum of all constant errors
b*d depth dependent error, i.e. the sum of all depth dependent errors
b factor of depth dependent error
d depth1
The line spacing used for side-scan sonar, magnetometer and sub-bottom profiler surveys are considered well
suited to achieve a full understanding of the environment. The multibeam system and associated backscatter
was shown on numerous instances to be capable of detecting objects far smaller than the 1m cubic features
specified for a Special Order survey.
10. Personnel The following personnel were involved during the survey:
NAME POSITION
C D Thomson Hydrographic Survey Manager/ MMO/QA
C K Stephenson Hydrographic Surveyor/MMO/Data Processing
E J Stacey Hydrographic Surveyor/MMO/Data Processing
G D Bennett Hydrographic Surveyor/MMO/Data Processing
A McCormick Vessel Skipper/MMO
P McCormick Survey Assistant/MMO
R Gigli Survey Assistant
1 IHO 2005. Publication M-13 ‘Manual on Hydrography’. Chapter 1, Pages 9-10.

38 A5353_Report of Survey_Rev 1
Annex A Drawing Record
A5353
File Description
AutoCAD DWG Files: A5353_MBES.dwg A5353_MBES_1 to 5000.dwg A5353_MBES Backscatter.dwg A5353_Mag.dwg A5353_SSS.dwg A5353_SBP_Phase 1.dwg A5353_METHIL SBP.dwg
Drawing showing bathymetry to CD Large-scale drawing showing bathymetry to CD Drawing showing MBES backscatter data Drawing showing magnetometer data Drawing showing sidescan sonar data Drawing showing SBP horizons to CD (Phases 1) Drawing showing SBP horizons to CD (Full Area)
PDF Files: A5353_MBES-(SHORE,T1,T2,T3,T4,T5,T6,T7,T8,T9).pdf A5353_MBES_1 to 5000-(OVERVIEW 1,OVERVIEW 2).pdf A5353_MBES Backscatter-( SHORE,T1,T2,T3,T4,T5,T6,T7,T8,T9).pdf A5353_Mag-(T2,T3).pdf A5353_SSS-(SHORE,T2,T3).pdf
Drawings showing bathymetry to CD Large-scale drawings showing bathymetry to CD Drawings showing MBES backscatter data Drawings showing magnetometer data Drawings showing sidescan sonar data Drawings showing SBP horizons to CD
GeoTIF Files: A5353_MBES_1m.tif/tfw 1_0-2m.tif/tfw – 9_0-2m.tif/tfw A5353_SSS.tif/tfw
Georeferenced imagery of bathymetric data Georeferenced imagery of MBES backscatter data Georeferenced imagery of sidescan sonar mosaic
XYZ Files: A5353_CD_1M_20140806.xyz A5353_Gratio_T2 A5353_Gratio_T3
Bathymetric data gridded at 1m post spacing to CD Magnetometer data at T2 Magnetometer data at T3 Sub Bottom Profiled Information for Horizons 1 to 6 referred to Chart Datum in ASCII xyz format

39 A5353_Report of Survey_Rev 1
Annex B Horizontal and Vertical Positioning System Precision
A5353
Marine Sensor CODA F185 +R INS Geodetic grade GPS Receiver and Heading system, utilising RTK corrections.
HORIZONTAL ACCURACY VERTICAL ACCURACY
REAL TIME KINEMATIC ±10mm + 1ppm RMS ±20mm + 1ppm RMS
Remote Sensor
Trimble SPS 461 Geodetic grade GPS Receiver and Heading system, using RTK corrections.
HORIZONTAL ACCURACY VERTICAL ACCURACY
REAL TIME KINEMATIC ±10mm + 1ppm RMS ±20mm + 1ppm RMS
All horizontal positions in the survey are referred to OSGB and have used the OSTN 02 model to transform
WGS84 positions obtained from GPS observations.

40 A5353_Report of Survey_Rev 1
Annex C Data Processing Procedures
A5353
Multibeam Processing Stages
Sonar Control 2000 software was used to control the MBES system during the data gathering phase.
Data was logged in HYPACK HYSWEEP software.
After data gathering the data was post processed in HYPACK MBMax where the following stages of processing
were undertaken:
Navigation data was processed.
Motion Sensor data was examined and edited as required.
Tidal data was examined and edited as required
Automatic filtering of the data was carried out.
Individual lines of MBES sounding data were manually edited.
Processed files were loaded into Fledermaus visualisation and editing software and fully quality assured
before being unloaded back to Hypack.
The data was gridded at an appropriate post spacing for the scale of plot requested by the client. This
was exported to AutoCAD for presentation.
The data was contoured at 0.5m intervals in Hypack and exported to AutoCAD.
Side-Scan Sonar Processing Stages
The side-scan data was processed in Chesapeake SonarWiz5 software where the following procedures
were undertaken:
Import of all side-scan jsf files into Chesapeake SonarWiz Software
Lines were replayed to assess the bottom tracking, gain and time variable gain settings and these were
adjusted as necessary to ensure optimal representation of the sonar record.
All lines were examined for any significant sonar contacts.
Any detected sonar contacts were sized, heighted and checked to see that they had been adequately
depicted in the bathymetric survey.
A sonar mosaic was prepared to show the seabed type over the entire survey area.
A Sidescan Sonar Mosaic of the entire area was prepared in Chesapeake SonarWiz and AutoCAD and
rendered in AutoCAD dwg format.

41 A5353_Report of Survey_Rev 1
Magnetometer Processing Stages
The magnetometer data was recorded in Hypack. The Hypack Single Beam Editor was used for processing, with
the following procedures undertaken:
Import of all HSX files into Single Beam Editor software
Lines replayed and data spikes examined and edited as necessary to ensure optimal representation of
the magnetometer record
Lines examined for any significant magnetic anomalies
Data exported in xyz format
3D rendering and magnetic field strength contours generated and plotted in AutoCAD dwg format
Sub-bottom Profiler Processing Stages
The sub-bottom profiler data was collected and processed using Chesapeake SonarWiz Software.
SEG-Y data was imported into the software
Frequency filtering, gain and time-variable gain settings were adjusted to ensure that the best possible
picture of the sub-bottom data was available to the user
Each individual horizon was digitised
An xyz of the thickeness between the seabed and each horizon was prepared and exported to
McCarthy Taylor System LSS 3D modelling software
LSS was used to prepare isopach xyz and to export isopach dxf of the sediment thickness
A drawing file was prepared in AutoCAD to show the sediment thickness detected during the survey

42 A5353_Report of Survey_Rev 1
Annex D Multibeam Echosounder Calibration
A5353
Patch tests are tests which are performed after initial equipment installation, and periodically thereafter as well as
if sensors are modified, to quantify any residual biases from the initial system alignment.
During this calibration series, four separate tests must be performed to determine residual alignment biases for:
Roll offset Position Time Delay (Latency) Pitch Offset Yaw (Heading) Offset
ROLL
PITCH
Sonar and Motion Reference Unit (MRU) alignment relative to vertical.
Can cause large depth and position errors at outer beams.
Sonar and MRU alignment relative to vertical.
Can cause depth and position errors across the swath.
LATENCY
YAW (HEADING)
The delay between position and fix
transmission.
Will cause positional errors.
Error is independent of multibeam system.
Sonar and MRU alignment relative to vertical Can cause depth and position errors across
the swath.

43 A5353_Report of Survey_Rev 1
Annex E Standard Disclaimer
A5353
1. All client-supplied data is taken on trust as being accurate and correct, and the sub-contractor cannot be held responsible for the quality and accuracy of that data set.
2. Geophysical interpretation of bathymetry and sonar is based on an informed opinion of the supplied data, and is subject to inherent errors out with the control of the interpretational hydrographer or geophysicist, which include but are not limited to GPS positioning errors, navigation busts, data quality, assumed speed velocity sediment profiles in the absence of Geotechnical data, sub bottom profile pulse width, and induced scaling errors therein associated with seismic signature. Seabed geomorphology and sub-seabed geology should be further investigated by visual or intrusive methods.
3. The limits of this survey are defined by the data set; out with the survey limits are not covered at any level by the sub-contractor.
4. The data is accurate at the time of data acquisition, the sub-contractor cannot be held responsible for environmental changes, and the client by accepting this report accepts that the environment of the seabed is subject to continuous change, that items of debris, hard contacts etc. may move, appear, be relocated or removed, thickness of surficial sediment change out with the knowledge of the sub-contractor and they will not be held responsible for such actions at any level.

FORTHWIND DEMONSTRATION PROJECT
TECHNICAL APPENDIX A7.1 ORNITHOLOGY
JULY 2015


Prepared By:
Arcus Consultancy Services
Suite 1C Swinegate Court East
3 Swinegate
York North Yorkshire
YO1 8AJ
T +44 (0)1904 715 470 l E [email protected] w www.arcusconsulting.co.uk
Registered in England & Wales No. 5644976


Technical Appendix A7.1
Forthwind Ltd
Page i
TABLE OF CONTENTS
1 INTRODUCTION ........................................................................................................ 2
1.1 Introduction to the Development .................................................................. 2
1.1.1 Site Consenting Background (Stage 1) ..................................................................... 2
1.1.2 Proposed Development Summary (Stages 2 and 3) .................................................. 2
1.1.3 Terminology and Survey Areas ................................................................................ 3
2 CONSULTATIONS ....................................................................................................... 4
3 DESIGNATED SITES ................................................................................................... 4
4 BASELINE SURVEY METHODS ................................................................................... 8
4.1 Flight Activity Surveys .................................................................................... 8
4.2 Sea Use Survey ............................................................................................. 10
5 BASELINE SURVEY RESULTS ................................................................................... 10
5.1 Flight Activity ............................................................................................... 10
5.1.1 Target Species Summary ...................................................................................... 10
5.1.2 Secondary Species................................................................................................ 12
5.1.3 Collision Risk Modelling ......................................................................................... 13
5.2 Sea Use Surveys ........................................................................................... 20

Technical Appendix A7.1
Forthwind Demonstration Project
Page 2
1 INTRODUCTION
This Ornithology Technical Appendix 7.1 presents the following information in support of Chapter 7: Ornithology of the proposed Forthwind Demonstration Project Environmental
Statement (“the ES”):
Introduction to the Development: describes the evolution of the Forthwind Demonstration
Project (“the Development”), project description and terminology used within this report;
Consultations: a summary record of meetings/correspondence with Marine Scotland
Licensing Operations Team (MS-LOT), Scottish Natural Heritage (SNH) and Royal Society
for the Protection of Birds (RSPB); Designated Sites: information on designated sites with potential connectivity to the
Development;
Baseline Survey Methods: the survey methods used to provide baseline data on the
breeding and non-breeding bird interest for the assessment; and Baseline Survey Results: the results of the baseline surveys carried out for the
assessment, providing Collision Risk Modelling and sea-use density calculations.
1.1 Introduction to the Development
Full details of the Development can be found in Chapter 1: Introduction and Chapter 3:
Project Description of the ES. A summary of information relevant to this Technical Appendix
7.1 and Chapter 7: Ornithology is provided herein.
1.1.1 Site Consenting Background (Stage 1)
An application was submitted by 2-B Energy in April 2010 and subsequently granted consent by Marine Scotland in November 2011 for the construction and 5-year operation of a single
185 m tip-height, 2-bladed wind turbine with an installed capacity of 6 MW, located in a
nearshore area adjacent to the Fife Energy Park (FEP) near Methil. This consent was subject to an agreement for the lease of the seabed being reached with the Crown Estate. Due to
various commercial reasons, the applicant decided not to construct this development.
In July 2012, an application for consent for the construction and 5-year operation of a single
196 m tip-height, 3-bladed turbine at the same nearshore location was submitted by Scottish Enterprise. The project, known as the Fife Energy Park Offshore Demonstration Wind Turbine
(FEPODWT), was consented by the Scottish Government in May 2013 (hereafter referred as
“the Consented Development”). Samsung, in association with Scottish Enterprise, constructed the 3-bladed turbine which is currently operational at the nearshore site. The Consented
Development is located approximately 35 m from the mean high water springs (MHWS) mark and 48.3 m from the FEP boundary.
1.1.2 Proposed Development Summary (Stages 2 and 3)
The proposal is for the implementation of development Stages 2 and 3 as described in the Scoping Report issued in December 2009 for the Methil Wind Turbine Demonstration
Project. Stage 1 of the proposal has not been implemented by 2-B Energy, although Scottish Enterprise and Samsung Heavy Industry have developed a turbine at approximately the same
location (as described above).
The proposal is for the construction and operation of up to two offshore wind turbines with associated infrastructure including foundations, scour protection, transformers, inter-array
cables between the turbines, an onshore control building and substation, and an export cable connecting the turbines to the onshore substation. Due to the uncertainties associated with
offshore construction, it is not possible to define a fully detailed project design at this point in the development process.
Aspects of the Development that cannot be determined at this stage include:
Model, dimensions and precise location of turbines;
Turbine foundation and substructure types; and

Technical Appendix A7.1
Forthwind Demonstration Project
Page 3
Lengths and layouts of the inter array and export cables.
In order to ensure that the ES is sufficiently robust and has taken account of the worst case
likely significant effects arising from the Development, a set of parameters has been developed, within which the final parameters will fall. These parameters are collectively
referred to as a ‘Rochdale Envelope’, which can be defined as a range of parameters within which the final Development must fall. The Rochdale cases1 established that it is acceptable
for an ES to assess the worst case likely significant effects of a project through implementing
the Rochdale Envelope approach.
The two main ornithological impacts of the Development will be displacement of birds from
the area around the operational turbines and collision mortality. Of those aspects of the Development listed above, it is the variation in turbine dimensions (principally number of
rotors, rotor size, speed and height above the water) that will have the greatest influence on the magnitude of impact on birds, due to the difference in collision risk associated with
difference in hub height of the turbines2. Most seabirds fly low above the sea surface and
exhibit positively skewed flight height distributions; i.e. most flights are low, with decreasing flight activity with increasing height above the surface. The worst-case scenario for the
Rochdale Envelope in terms of collision risk is therefore the turbine model with three rotor blades of largest size and with the lowest sweep. For the purposes of the collision risk
assessment, the model presented uses the parameters for operation of two, 3-bladed turbines
with a rotor diameter of 172 m and hub height of 110 m.
The 2-B turbine model under consideration is a 2-bladed model with a rotor diameter of up to
155 m. As there are only two rotor blades, the collision risk would inherently be two-thirds that of a similarly proportioned 3-bladed turbine model. Although the 2-bladed model has a
lattice structure tower, it is not automatically considered to provide increased risk over and above the tubular tower 3-bladed turbine, because the lattice is deigned in such a way to
avoid horizontal perching opportunities that might attract birds.
In terms of displacement, there is unlikely to be any material difference in the effects on birds between the different turbine models under consideration.
The consent period being applied for will be for 20 years of operation to reflect the purpose of the project, which is to test, certify and demonstrate the new technology to the UK market.
The location of landfall is to be within the Fife Energy Park where a compound of up to 720
m2 will be established to house the site offices and transformer unit.
1.1.3 Terminology and Survey Areas
Surveys were centred on a ‘Core Survey Area’ (CSA). The CSA was a 33.62 ha (c. 0.34 km2) polygon, located between approximately 1.0 and 1.8 km off the Fife coastline at the site of
the Fife Energy Park (Figure 7.1).
At the time the baseline surveys were being carried out (and consultation regarding this project was being carried out), it was understood that the two turbines would be located
within, or on the periphery of the CSA. For a number of reasons, outlined above and within Chapter 1: Introduction and Chapter 3: Project Description of the ES, the two proposed
turbine locations are now situated just outwith, but close to the periphery of the CSA.
Due to the close proximity of the proposed turbine locations to the CSA and the similar
distance from the shoreline, it is considered that the survey data collected from the Core
Survey Area are representative; for example, the surveyor commented that the majority of birds were recorded moving on an axis parallel to the shoreline, at various distances from the
shore. There is not likely to be a significant difference between the flight activity and density of birds within the CSA and the flight activity and density of birds within a zone of influence
1 R v Rochdale MBC ex. parte Tew and R v Rochdale MBC ex parte Milne 1999 2 Johnston, A., Cook, A.S.C.P., Wright, L.J., Humphreys, E.M. & Burton, N.H.K. (2014) Modelling flight heights of marine birds
to more accurately assess collision risk with offshore wind turbines. Journal of Applied Ecology. (DOI: 10.1111/1365-2664.12191).
Technical Appendix A7.1
Forthwind Demonstration Project
Page 4
(of up to 1 km) around the proposed turbine locations. The data should therefore provide a
suitable baseline for the EIA/HRA.
2 CONSULTATIONS
A consultee meeting was held on 21st July 2010 between Fiona Thompson (MS-LOT), Catriona Gall and Ross McGregor (SNH), Scott Harper (2-B Energy), Fiona MacGregor and Mike
Armitage (Arcus), to discuss the assessment for the nearshore turbine and to discuss and
agree on the survey method for the two offshore turbines. It was agreed that:
The offshore Development would not require boat-based survey work;
A coastal Vantage Point (VP) was suitable so long as it was no more than 2 km from the
proposed turbine locations;
Survey area should comprise a 500 m zone around the proposed turbines3;
SNH preference for a ‘2 minus 1’ approach to number of years survey required; i.e. two
years of baseline survey should be committed to, reducing to one year, if the data demonstrated that there would clearly be no likely significant effects;
5-minute summary counts is a suitable recording method for the frequent gannet and
herring gull flights; Sea state should be recorded in accordance with relevant COWRIE guidance; and
The Band collision risk model is suitable for a two-bladed, down-wind rotor.
Discussions with MS-LOT regarding the Development were restarted by 2-B Energy and Arcus
in April 2014 and a Consultation Document was provided in July 2014. The Consultation
Document provided:
an introduction to the Development;
details of baseline survey methods and results; and
a discussion on the proposed assessment methods, use of collision risk analysis and
modelling.
A meeting was held between MS-LOT, SNH, 2-B Energy and Arcus on 17th September 2014 where the above document and responses were discussed. This Technical Appendix 7.1 and
Chapter 7: Ornithology of the ES takes account of written responses to the Consultation Document from the above parties (and RSPB), and discussions held at the meeting.
3 DESIGNATED SITES
A search was conducted for internationally designated sites of ornithological interest (Special Protection Areas (SPAs) and Ramsar sites) within 20 km that are likely to have connectivity
with the Development site, and a search radius of 5 km for other statutory designated sites of ornithological value (Sites of Special Scientific Interest (SSSIs), National Nature Reserves
(NNRs), Local Nature Reserves (LNRs)) and 2 km for non-statutory designated sites.
SNH provided details of a draft Special Protection Area (dSPA), at present referred to as the Outer Firth of Forth and Tay Bay Complex dSPA. SNH recommends that the HRA considers
this dSPA in relation to the Development), although at this stage the site does not hold any legal standing. If the dSPA was adopted as a proposed SPA (pSPA) the site would have the
full legislative protection afforded to SPAs and would therefore legally be subject to HRA.
Data on statutory and non-statutory designated sites were obtained from the Multi-Agency Geographic Information for the Countryside (MAGIC)4. Designated sites with potential
connectivity to the Development site are presented in Table 1 and Figure 7.2.
3 At the time of consultation, the CSA had already been defined. The CSA encompassed the original locations of the two
proposed turbines, but did not comprise a complete 500 m buffer around them. The CSA was defined by features in the sea-scape and land on the opposite shore of the Firth of Forth that were easily identifiable and allowed accurate repetition of the surveys. As described above, it was considered that the CSA provided a representative sample of bird movement and use of the sea at and around the locations of the turbines. 4 MAGIC (2014) ‘Various Mapping’ [online]. Available from: http://magic.defra.gov.uk/ (Accessed May 2014).

Technical Appendix A7.1
Forthwind Demonstration Project
Page 5
Table 1: Designated Sites Site Designation,
Distance and Direction
Details (Based on SPA Citation)
Cameron Reservoir “A water supply reservoir created by impounding freshwater from upland streams. The open water is used as a roost by an internationally important wintering population of Pink-footed Goose”
SPA, 16 km to north-east
This site qualifies under Article 4.2 of the Directive (2009/147/EC) by supporting populations of European importance of the following migratory species: Over winter: Pink-footed goose: 16,233 birds, 7.2 % of wintering Eastern Greenland/Iceland/UK population (5-year peak mean 1991/92-1995/96)
Firth of Forth “The Firth of Forth SPA is a complex of estuarine and coastal habitats in south east Scotland stretching east from Alloa to the coasts of Fife and East Lothian. The site includes extensive invertebrate-rich intertidal flats and rocky shores, areas of saltmarsh, lagoons and sand dune”
SPA, RAMSAR, SSSI, adjacent to terrestrial parts of Development, 1.2 km from turbine locations
This site qualifies under Article 4.1 of the Directive (2009/147/EC) by supporting populations of European importance of the following species listed on Annex I of the Directive: Over winter: Red-throated diver: 90 birds, 2 % of GB population (5-year peak mean 1993/94-1997/98) Oystercatcher: 7,846 birds, 2 % of GB population (5-year peak mean 1993/94-1997/98) Slavonian grebe: 84 birds, 21 % of GB population (5-year peak mean 1993/94-1997/98)
Bar-tailed godwit: 1,974 birds, 4 % of GB population
(5-year peak mean 1993/94-1997/98) Golden plover: 2,949 birds, 2 % of GB population (5-year peak mean 1993/94-1997/98) On Passage: Sandwich tern: 1,617 birds, 6 % of GB population (5-year peak mean 1993/94-1997/98) This site also qualifies under Article 4.2 of the
Directive (2009/147/EC) by supporting populations of European importance of the following migratory species: Over winter: Pink-footed goose: 10,852 birds, 6 % of Eastern Greenland/Iceland/UK population (5-year peak mean 1993/94-1997/98) Shelduck: 4,509 birds, 2 % of North-western Europe population (5-year peak mean 1993/94-1997/98) Knot: 9,258 birds, 3 % of North-eastern Canada/Greenland/Iceland/North-western Europe
population (5-year peak mean 1991/92-1995/96) Redshank: 4,341 birds, 3 % of Eastern Atlantic – wintering population (5-year peak mean 1993/94-

Technical Appendix A7.1
Forthwind Demonstration Project
Page 6
Site Designation, Distance and Direction
Details (Based on SPA Citation)
1997/98) Turnstone: 860 individuals, 1 % of Western Palearctic wintering population (5-year peak mean 1993/94-1997/98) Assemblage qualification: An internationally important assemblage of birds. The area qualifies under Article 4.2 of the Directive (2009/147/EC) by regularly supporting at least 20,000 waterfowl: Over winter, the area regularly supports 95,000 individual waterfowl (5-year peak mean 01/08/2000) including: red-throated diver, great crested grebe, Slavonian grebe, cormorant, pink-footed goose, shelduck, wigeon, mallard, scaup, eider, long-tailed duck, common scoter, velvet scoter, goldeneye, red-breasted merganser, oystercatcher, ringed plover, golden plover, grey plover, lapwing, knot, dunlin, bar-tailed godwit, curlew, redshank and turnstone.
Forth Islands “Forth Islands SPA consists of a series of islands supporting the main seabird colonies in the Firth of Forth. The islands of Inchmickery, Isle of May, Fidra, The Lamb, Craigleith and Bass Rock were classified on 25 April 1990. The extension to the site, classified on the 13th February 2004 consists of the island of Long Craig, which supports the largest colony of roseate tern in Scotland. It is the most northerly of only six regular British colonies”
SPA, 17 km to south-east
This site qualifies under Article 4.1 of the Directive (2009/147/EC) by supporting populations of European importance of the following species listed on Annex I of the Directive: Breeding Season: Arctic tern: 540 pairs, 1.2 % of GB population (5-year mean 1992-1996) Roseate tern: 8 pairs, 13 % of GB population (5-year mean 1997-2001) Common tern: 334 pairs, 3 % of GB population (5-year mean 1997-2001) Sandwich tern: 440 pairs, 3 % of GB population (SCRC 1985-1988) This site also qualifies under Article 4.2 of the Directive (2009/147/EC) by supporting populations of European importance of the following migratory species: Breeding Season: Gannet: 21,600 pairs, 8.2 % of world population (SCRC 1985-1988) Shag: 2,400 pairs, 1.9 % of northern Europe population (SCRC 1985-1988) Lesser black-backed gull: 1,500 pairs, 1.2 % of graellsii subspecies world breeding population (SCRC 1985-1988)
Puffin: 14,000 pairs, 1.5 % of grabae subspecies world population (SCRC 1985-1988) Assemblage qualification: An internationally important

Technical Appendix A7.1
Forthwind Demonstration Project
Page 7
Site Designation, Distance and Direction
Details (Based on SPA Citation)
assemblage of birds. The area qualifies under Article 4.2 of the Directive (2009/147/EC) by regularly supporting at least 20,000 waterfowl: During the breeding season, the area regularly supports 90,000 seabirds (SCRC 1985-1988) including: razorbill, puffin, fulmar, herring gull, lesser black-backed gull, gannet, shag, cormorant, kittiwake, roseate tern, common tern, Arctic tern, sandwich tern and guillemot.
Loch Leven “Loch Leven in central Scotland is the largest natural eutrophic lake in Britain. It is a relatively shallow loch, surrounded by farmland, with a diverse aquatic flora and shoreline vegetation. The boundary of the Loch Leven SPA follows that of the Loch Leven SSSI except for the exclusion of 4 ha of SSSI towards the northern end of the loch.”
SPA, 19 km to west-south-west
This site qualifies under Article 4.1 of the Directive (2009/147/EC) by supporting populations of European importance of the following species listed on Annex I of the Directive: Over winter: Whooper swan: 97 birds, 2 % of the population in Great Britain (5-year peak mean 1993/94-1997/98) This site also qualifies under Article 4.2 of the Directive (2009/147/EC) by supporting populations of European importance of the following migratory species: Over winter: Pink-footed goose: 17,163 birds, 8 % of Eastern Greenland/Iceland/UK population (5-year peak mean 1993/94-1997/98) Shoveler: 509 birds, 1 % of North-western/Central European population (5-year peak mean 1993/94-1997-1998) Assemblage qualification: An internationally important assemblage of birds. The area qualifies under Article 4.2 of the Directive (2009/147/EC) by regularly supporting at least 20,000 waterfowl: Over winter, the area regularly supports 34,280 individual waterfowl (5-year peak mean 01/03/2000) including: whooper swan, pink-footed goose and shoveler.
Outer Firth of Forth and Tay Bay
Complex5
“A large marine area covering 312,982.11 ha”
Draft SPA (dSPA), Development site is within the dSPA
Currently a draft SPA included at request of SNH. The species listed for dSPAs do not always occur in important numbers throughout the dSPA and throughout the year. Rather, some species have distinct areas of elevated densities or foraging effort within the overall boundary and most exhibit strong seasonal variations in abundance (though this information is not provided within the Release Pack). Qualifying bird species in the dSPA include: Annex 1 species (presumably meeting Article 4.1
criteria): red-throated diver, Slavonian grebe, little gull, common tern and Arctic tern.
5 Release pack for Marine SPAs http://www.snh.gov.uk/docs/A1350044.pdf

Technical Appendix A7.1
Forthwind Demonstration Project
Page 8
Site Designation, Distance and Direction
Details (Based on SPA Citation)
Migratory species (presumably meeting Article 4.2 criteria): eider, long-tailed duck, common scoter, velvet scoter, goldeneye, red-breasted merganser, gannet, Manx shearwater, shag, kittiwake, guillemot, razorbill, puffin, black-headed gull, common gull, herring gull.
4 BASELINE SURVEY METHODS
The surveys reported herein were carried out between December 2009 and July 2010, and
between June 2011 and June 2012 following the principles of prevailing best practice for
onshore wind energy developments, specifically SNH guidance: Survey methods for use in assessing the impacts of onshore wind farms on bird communities (SNH 2005 updated 20106).
During the consultation process SNH/MS-LOT requested further information/clarification on the (previously agreed) survey methodology regarding how distance and flight heights were
estimated from the land-based observer and how the issue of poor visibility was considered. This is addressed in the sections below.
All surveys were carried out by local ornithologist Alan Leitch. Alan previously worked for SNH
and at the time the survey methodology was agreed, Alan was known to SNH and they were prepared to trust Alan’s judgement on the survey methodology. Alan has been watching birds
for nearly 50 years, carrying out a wide range of surveys and research. He has been carrying out vantage point watches for the last eight years and before that carried out a study of 100
Environmental Statements on windfarms for SNH, and helped in drawing up the 2005 SNH
Guidance6. Alan was secretary of The Seabird Group, and worked extensively for a number of years on seabirds on the Isle of May, and on St Kilda. He has been ringing and counting
seabirds for nearly 50 years and has carried out numerous WeBS Counts and similar wildfowl and wader counts over the years. Alan is therefore extremely familiar with seabird survey and
identification.
4.1 Flight Activity Surveys
The main purpose of flight activity surveys is to collect flight activity data on target and
secondary species that will enable an assessment of the collision risk presented by the Development and to identify patterns of movement across the survey area.
VP watches were undertaken using an adapted methodology (as presented in SNH 2005 updated 20106) to provide the data required for the collision risk assessment. Target species
included all species listed on the Firth of Forth SPA, SSSI and RAMSAR citations, and Forth
Islands SPA citations, as well as all raptors and skuas7. In agreement with SNH, gannets and gulls were recorded using the secondary species method (5-minute sampling to record
minimum numbers of birds attributable to flight activity) to simplify the field recording of these species; they were very frequent in the survey area and it was necessary to make
recording their numbers easier to ensure that flight activity of all species was captured during
the observations.
Observations were carried out from a single vantage point, located at OS National Grid
Reference NT 36599 98364, shown in Figure 7.1. The CSA, which encompassed the original two proposed turbine locations, was defined as a polygon with the four points at 1,014 m,
1,261 m, 1,621 m, and 1,785 m from the VP respectively (also shown in Figure 7.1). This area was chosen based on identifiable features visible from the VP in the sea-scape and shoreline
on the opposite side of the Firth of Forth.
6 SNH (2005 updated 2010) Survey methods for use in assessing the impacts of onshore wind farms on bird communities. SNH, Battleby. 7 Species listed for the Outer Firth of Forth and Tay Bay Complex dSPA would have been recorded as either target or
secondary species, although information regarding the dSPA became available after the baseline data collection period.

Technical Appendix A7.1
Forthwind Demonstration Project
Page 9
In order to record the location of the flight activity (and Sea Use in Section 4.2), the surveyor
calculated an arc of view on a map to encompass the CSA. In order to accurately record distance from the VP the observer spent some time at North Berwick in East Lothian looking
at the island of Craigleith, just over 1 km off the coast, to get used to the viewing distance. The surveyor also marked focal points on his telescope to aid in the above. It was
hoped to have deployed buoys on the boundary of the survey area to further aid viewing from
the VP location. Unfortunately this proved to be impossible, due to issues with navigation of vessels in the Firth of Forth and permission was not obtained. There were buoys in the sea
that the surveyor could use to judge positions, but these were not located within the viewing area. A combination of the above helped the surveyor to identify the extent of the CSA and
improve repeatable accuracy of flight line recording.
All target species flights that passed through the CSA were recorded. Secondary species were
recorded from 18th February 2010 onwards. Gannets were treated as a target species from
December 2009 up until 14th April 2010, when the number of gannet flights became unsuitable for data collection using the focal recording method, and were thereafter treated
as secondary species (following agreement from SNH) to make recording their numbers easier to ensure that flight activity of all species was captured during the observations.
A total of 235.5 hours of survey was carried out. Tables 2 and 3 provide the survey
breakdown per month for the 2009-2010 and 2011-2012 survey periods.
Table 2: Monthly VP Survey Breakdown (hours surveyed per VP) 2009-2010 Month and Year of Survey
2009 2010
De
ce
mb
er
Ja
nu
ary
Fe
bru
ary
Ma
rch
Ap
ril
Ma
y
Ju
ne
Ju
ly
Hours of survey
9 12 6 16.5 9 15 12 12
Table 3: Monthly VP Survey Breakdown (hours surveyed per VP) 2011-2012
Month and Year of Survey
2011 2012
Ju
ne
Ju
ly
Au
gu
st
Se
pte
mb
er
Octo
be
r
No
ve
mb
er
De
ce
mb
er
Ja
nu
ary
Fe
bru
ary
Ma
rch
Ap
ril
Ma
y
Ju
ne
Hours of survey
12 6 18 6 18 9 12 9 18 6 12 6 12
Surveys were carried out at various times of day, and in a variety of weather conditions and
sea states. The weather conditions during each watch were recorded (data within Appendix 1.1).
Surveys were limited by various weather conditions. If visibility was poor because of rain or fog, or if the sea was very rough, surveys were not carried out. When the sea was rough, the
wind was too strong to watch properly which meant the observer was unable to use his telescope at full 60x magnification, making the detection and identification of flights difficult.
As the VP was facing due south, it was initially thought that the sun would be a continuous
hindrance to surveys as light reflected off the water. However, the band of dazzle was much smaller than the surveyors viewing arc. As birds were virtually all flying from one side of the
survey area to the other in an east-west or west-east direction the observer found that he could still detect the flights either side of the area of sun dazzle. The surveyor is of the
opinion that nothing of any significance was missed at these times. There was some
discussion in the early stages about not doing observations on sunny days in order to reduce the effect of glare; however, it was considered that the effect was minimal based on the
reasons stated above. The surveyor does not consider that weather conditions affected the

Technical Appendix A7.1
Forthwind Demonstration Project
Page 10
observations, apart from not carrying out surveys during times of poor visibility and strong
winds.
Watches usually comprised one or two sessions of three hours, with occasional shorter
sessions of one and a half hours. Surveys were usually separated by a break of 5-35 minutes in order to avoid observer fatigue.
For each target species flight the following details were recorded:
Species;
Number of birds;
Time; Duration of flight within the CSA; and
Flying height in three height bands corresponding to height band 1: 0–40 m, height
band 2: 40-175 m, and height band 3: >175 m based on the early iterations of the
proposed scheme8.
Most seabirds fly close to the water, they have no need to go very high and it was easy to see that most birds were well below potential collision risk height (PCRH) (i.e. within height
band 1). Gannets and gulls would occasionally fly at PCRH. The surveyor used the lighting towers over the old rig yard to help judge height in these circumstances. Although it is
possibly easier in an onshore situation to estimate flight heights, with more features to use as
markers, it is still not easy, in the end it comes down to the experience of the observer and we are confident that the observations made are representative of what was happening in the
survey area.
The flight path of each target species recorded was drawn as accurately as possible on to a
large scale map in the field. Each recorded flight path was numbered and cross-referenced to
the flight data.
Secondary species were recorded in 5-minute summaries. During each 5-minute period of the
watch, the minimum number of each species passing through the CSA in each different height band was recorded.
4.2 Sea Use Survey
Birds sitting on the sea (e.g. foraging, roosting, loafing) within the CSA (an area of 33.619 ha;
c. 0.34 km2) were recorded on arrival and at each 30-minute interval during the VP surveys.
The species and number of sitting birds within the CSA were recorded. The weather data were also updated at 30-minute intervals throughout the surveys.
The aim of this survey was to allow an estimation of the density of seabirds using the CSA to be calculated.
5 BASELINE SURVEY RESULTS
5.1 Flight Activity
5.1.1 Target Species Summary
A total of 1,936 observed flights were recorded during the VP surveys. Table 4 presents a summary of the number of target species flights within each height band across the entire
survey period (Year 1: December 2009-July 2010 and Year 2: June 2011-June 2012). Details of each flight recorded are provided in Appendix 1.2.
Of the 1,936 flights recorded, 81 flights (4.18 %) occurred between 40-175 m; 1,846 flights
(95.35 %) occurred below 40 m and nine flights (0.47 %) occurred above 175 m.
8 A precautionary approach was taken so that any flight occurring at more than one height band within the CSA was considered to be at PCRH for the purpose of collision risk modelling.

Technical Appendix A7.1
Forthwind Demonstration Project
Page 11
Table 4: Target Species Records and Flight Heights Species
Year 1 No of flights (peak flock)
Year 2 No of flights (peak flock)
Total No of flights
Ht Band 1 No. of Flights <40 m
Ht Band 2 No. of Flights 40-175 m
Ht Band 3 No. of Flights >175 m
Pink-footed goose
3 (27) 3 (110) 6 0 2 4
Greylag goose 2 (27) 1 (20) 3 2 1 0
Goose species 0 1 (40) 1 0 1 0
Shelduck 0 1 (2) 1 1 0 0
Teal 0 1 (1) 1 0 1 0
Mallard 0 1 (6) 1 0 1 0
Scaup 0 1 (16) 1 1 0 0
Eider 51 (10) 68 (4) 119 119 0 0
Long-tailed duck
74 (9) 43 (7) 117 117 0 0
Common scoter
33 (35) 50 (25) 83 81 2 0
Velvet scoter 22 (12) 43 (10) 65 64 1 0
Scoter species 7 (6) 0 7 7 0 0
Goldeneye 4 (4) 0 4 3 1 0
Red-breasted merganser
8 (2) 6 (3) 14 10 4 0
Duck species 6 (12) 1 (1) 7 6 1 0
Red-throated diver
26 (2) 56 (3) 82 77 4 1
Fulmar 28 (20) 27 (2) 55 47 6 2
Shearwater
species9
1 (28) 0 1 1 0 0
Manx shearwater
3 (5) 5 (30) 8 8 0 0
Gannet10 68 (10) - 68 54 14 0
Cormorant 122 (2) 156 (7) 278 271 7 0
Shag 71 (2) 194 (5) 265 265 0 0
Grey heron 1 (1) 0 1 0 1 0
Peregrine falcon
0 1 (1) 1 0 1 0
Oystercatcher 2 (6) 2 (1) 4 3 1 0
Knot 0 1 (3) 1 1 0 0
Curlew 5 (6) 7 (2) 12 8 2 2
Wader species 0 2 (6) 2 0 2 0
Arctic skua 0 3 (2) 3 2 1 0
Great skua 0 3 (1) 3 2 1 0
Kittiwake 45 (3) 226 (40) 271 250 21 0
Sandwich tern 13 (7) 62 (5) 75 72 3 0
Tern species11 92 (5) 81 (10) 173 171 2 0
Guillemot 0 19 (5) 19 19 0 0
Razorbill 1 (1) 11 (2) 12 12 0 0
Puffin 3 (1) 15 (20) 18 18 0 0
Auk species 31 (7) 123 (8) 154 154 0 0
Total 722 1,214 1,936 1,846 81 9
The majority of target species flights occurred in height band 1 (1,846 flights; 95.35 %) and
typically flew on an axis parallel to the shore, either in a roughly east to west direction, or vice versa, with the exception of cormorants and terns which took less predictable flightlines
across the CSA.
9 This record refers to Manx or sooty shearwater. 10 Gannet was only treated as a target species between December 2009 and April 2010. 11 Flights comprised of 18 ‘comic terns’ (common and/or arctic tern) flights and 155 unidentified tern species flights.

Technical Appendix A7.1
Forthwind Demonstration Project
Page 12
The observer noted a particular problem with the recording of tern flights. A combination of
distance and glare from the sea often made observation of these small, white birds extremely difficult, and most flights were recorded as ‘tern species’ rather than attempting identification
to species level. Furthermore it was noted that when sun glare was in the centre of the CSA it was often possible to spot terns, but not to follow their flight across the entire CSA,
particularly when low to the water, in which instances the duration of the flight was
estimated. The observer did however note that although tern flights were often more meandering and less direct than the other species recorded, they only extremely rarely flew at
PCRH (e.g. five out of 246 tern flights (2.03 %) were recorded in height band 2).
CRM has not been undertaken for most of the target species12 recorded but has been carried
out for fulmar and kittiwake as requested by SNH (see Section 5.1.3). Flight activity of the remaining target species at PCRH was very infrequent and as a result, predicted collision risk
would be zero or negligible, based upon data collected during the flight activity surveys.
5.1.2 Secondary Species
Secondary species recorded included gannet, black-headed gull, common gull, lesser black-
backed gull, herring gull and great black-backed gull.
Of the 7,008 birds recorded, 1,284 birds (18.32 %) occurred in height band 2 between 40-
175 m; 5,450 birds (77.77 %) occurred in height band 1 below 40 m and 274 birds (3.91 %)
occurred in height band 3 above 175 m.
Monthly totals of flights are provided in Table 5 (Year 1) and Table 6 (Year 2) below. The
table shows the total number of birds recorded each month and the number recorded in height bands 2 and 3 in square brackets.
Table 5: Secondary Species Monthly Totals at PCRH (Year 1) Month
Gannet13 Black-headed gull
Common gull
Herring gull
Lesser black-backed gull
Great black-backed gull
December 2009 No secondary species recording during these months
January 2010
February 2010 7 [0]
0 [0]
0 [0]
95 [2]
0 [0]
2 [0]
March 2010 105 [18]
7 [0]
34 [8]
519 [80]
2 [2]
59 [4]
April 2010 220 [30]
0 [0]
1 [0]
72 [16]
6 [2]
7 [3]
May 2010 199 [98]
1 [1]
2 [0]
621 [38]
20 [2]
26 [2]
June 2010 298 [118]
1 [1]
0 [0]
119 [64]
32 [16]
48 [24]
July 2010 46 [27]
2 [1]
0 [0]
7 [2]
1 [0]
15 [4]
Total 875 [291]
11 [3]
37 [8]
1433 [202]
61 [22]
157 [37]
12 An exception to this is gannet which was initially treated as a target species but became a secondary species, in agreement
with SNH, and was included within the collision risk modelling process. 13 Gannet was recorded as a target species between December 2009 and April 2010, totals from target species recording have
been incorporated into this table.

Technical Appendix A7.1
Forthwind Demonstration Project
Page 13
Table 6: Secondary Species Monthly Totals at PCRH (Year 2) Month
Gannet13 Black-headed gull
Common gull
Herring gull
Lesser black-backed gull
Great black-backed gull
June 2011 270 [78]
0 [0]
2 [0]
94 [42]
47 [11]
17 [6]
July 2011 153 [36]
1 [0]
0 [0]
24 [11]
8 [0]
5 [4]
August 2011 347 [55]
1 [0]
2 [0]
94 [17]
88 [8]
60 [19]
September 2011 183 [27]
148 [0]
0 [0]
172 [21]
0 [0]
4 [3]
October 2011 169 [7]
43 [9]
24 [1]
122 [46]
10 [1]
40 [22]
November 2011 19 [0]
1 [0]
1 [0]
48 [10]
0 [0]
40 [5]
December 2011 1 [0]
15 [5]
14 [0]
175 [91]
3 [0]
42 [9]
January 2012 0 [0]
8 [0]
20 [2]
110 [41]
0 [0]
26 [6]
February 2012 5 [0]
9 [3]
6 [0]
147 [58]
2 [2]
29 [7]
March 2012 87 [17]
0 [0]
7 [0]
80 [35]
0 [0]
12 [7]
April 2012 97 [43]
1 [0]
8 [2]
200 [46]
3 [2]
14 [2]
May 2012 70 [0]
2 [0]
6 [0]
60 [24]
3 [2]
4 [3]
June 2012 551
[42]
2
[0]
4
[2]
446
[108]
24
[5]
23
[12]
Total 1952 [305]
231 [17]
94 [7]
1772 [550]
188 [31]
316 [105]
Based on the frequency of occurrence of flights in height bands 2 and 3, and based on
discussions held with SNH, collision risk modelling has been conducted on the following secondary species: gannet, herring gull, lesser black-backed gull and great black-backed gull.
5.1.3 Collision Risk Modelling
Collision risk assessment for large offshore wind energy developments relies upon a different methodology from onshore wind energy developments, both in terms of the survey data
collection (boat-based transect sampling) and in the mathematical model. For this small Development, it was considered most appropriate to use the same flight activity data
collection methodology as for onshore wind energy projects, because the CSA was entirely visible within 2 km from the shoreline. This allowed recording of flight lines and heights and
absolute numbers of birds passing through the CSA during each survey; hence bird density
estimates has not been necessary for this project as it might be for typical large offshore projects. We therefore considered that the most appropriate method for assessing the
collision risk to birds is to employ the Band model typically used for onshore wind energy projects, as described below. This approach was agreed through consultation with SNH.
The onshore model developed by W. Band (Band et al. 200714) estimates the number of bird
collisions with the turbine rotors during a specified time period. The risk is calculated in two stages:
14 Band, W., Madders, M. and Whitfield, D.P. (2007) Developing field and analytical methods to assess avian collision risk at
wind farms. In de Lucas, M., Janss, G. and Ferrer, M. (eds.) Birds and Wind Power. Quercus, Madrid.
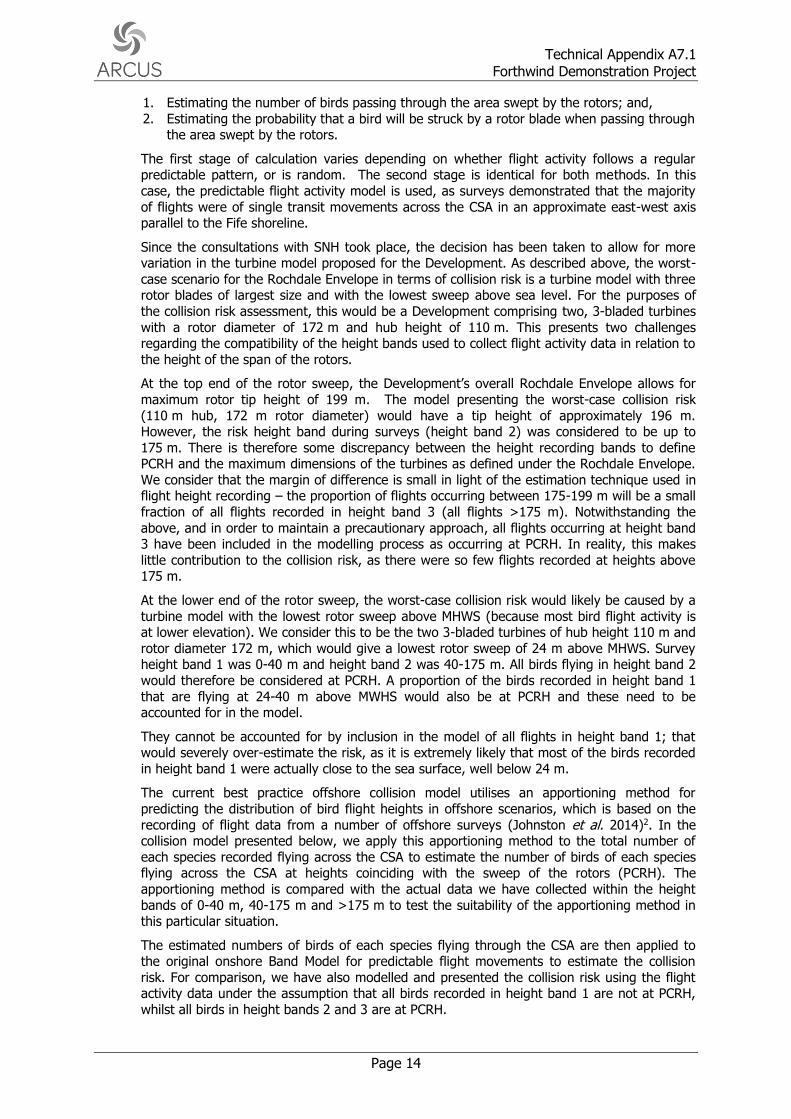
Technical Appendix A7.1
Forthwind Demonstration Project
Page 14
1. Estimating the number of birds passing through the area swept by the rotors; and,
2. Estimating the probability that a bird will be struck by a rotor blade when passing through the area swept by the rotors.
The first stage of calculation varies depending on whether flight activity follows a regular predictable pattern, or is random. The second stage is identical for both methods. In this
case, the predictable flight activity model is used, as surveys demonstrated that the majority
of flights were of single transit movements across the CSA in an approximate east-west axis parallel to the Fife shoreline.
Since the consultations with SNH took place, the decision has been taken to allow for more variation in the turbine model proposed for the Development. As described above, the worst-
case scenario for the Rochdale Envelope in terms of collision risk is a turbine model with three rotor blades of largest size and with the lowest sweep above sea level. For the purposes of
the collision risk assessment, this would be a Development comprising two, 3-bladed turbines
with a rotor diameter of 172 m and hub height of 110 m. This presents two challenges regarding the compatibility of the height bands used to collect flight activity data in relation to
the height of the span of the rotors.
At the top end of the rotor sweep, the Development’s overall Rochdale Envelope allows for
maximum rotor tip height of 199 m. The model presenting the worst-case collision risk
(110 m hub, 172 m rotor diameter) would have a tip height of approximately 196 m. However, the risk height band during surveys (height band 2) was considered to be up to
175 m. There is therefore some discrepancy between the height recording bands to define PCRH and the maximum dimensions of the turbines as defined under the Rochdale Envelope.
We consider that the margin of difference is small in light of the estimation technique used in flight height recording – the proportion of flights occurring between 175-199 m will be a small
fraction of all flights recorded in height band 3 (all flights >175 m). Notwithstanding the
above, and in order to maintain a precautionary approach, all flights occurring at height band 3 have been included in the modelling process as occurring at PCRH. In reality, this makes
little contribution to the collision risk, as there were so few flights recorded at heights above 175 m.
At the lower end of the rotor sweep, the worst-case collision risk would likely be caused by a
turbine model with the lowest rotor sweep above MHWS (because most bird flight activity is at lower elevation). We consider this to be the two 3-bladed turbines of hub height 110 m and
rotor diameter 172 m, which would give a lowest rotor sweep of 24 m above MHWS. Survey height band 1 was 0-40 m and height band 2 was 40-175 m. All birds flying in height band 2
would therefore be considered at PCRH. A proportion of the birds recorded in height band 1
that are flying at 24-40 m above MWHS would also be at PCRH and these need to be accounted for in the model.
They cannot be accounted for by inclusion in the model of all flights in height band 1; that would severely over-estimate the risk, as it is extremely likely that most of the birds recorded
in height band 1 were actually close to the sea surface, well below 24 m.
The current best practice offshore collision model utilises an apportioning method for
predicting the distribution of bird flight heights in offshore scenarios, which is based on the
recording of flight data from a number of offshore surveys (Johnston et al. 2014)2. In the collision model presented below, we apply this apportioning method to the total number of
each species recorded flying across the CSA to estimate the number of birds of each species flying across the CSA at heights coinciding with the sweep of the rotors (PCRH). The
apportioning method is compared with the actual data we have collected within the height
bands of 0-40 m, 40-175 m and >175 m to test the suitability of the apportioning method in this particular situation.
The estimated numbers of birds of each species flying through the CSA are then applied to the original onshore Band Model for predictable flight movements to estimate the collision
risk. For comparison, we have also modelled and presented the collision risk using the flight activity data under the assumption that all birds recorded in height band 1 are not at PCRH,
whilst all birds in height bands 2 and 3 are at PCRH.

Technical Appendix A7.1
Forthwind Demonstration Project
Page 15
The length of the breeding season of each species of seabird on the Forth Islands SPA varies
and as collision risk will be assessed separately for the breeding season and non-breeding season, it is necessary to define the seasons for each species. During the consultation
process, SNH provided definitions for the breeding seasons of those species associated with the Forth Islands SPA (Table 7). The modelling has been carried out to provide a working
comparison for various seasons within both periods of survey (Year 1: December 2009-July
2010 and Year 2: June 2011-June 2012).
Table 7: Breeding Seasons used in CRM (and other assessments)15 Species Breeding Season
Arctic tern May-August
Common tern May-August
Roseate tern (May-August)
Sandwich tern (April-August)
Gannet April-September
Great black-backed gull April-August
Lesser black-backed gull April-August
Puffin April-August
Shag (April-August)
Razorbill April-July
Guillemot April-July
Kittiwake April-August
Herring gull April-August
Cormorant (April-August)
Fulmar May-September
5.1.3.1 Predictable Flight Activity Model
CRM using the predictable model has been carried for fulmar, gannet, kittiwake, herring gull, lesser black-backed gull and great black-backed gull because these species showed a frequent
and predictable pattern of movement across the survey area. All other species were recorded so infrequently at PCRH that the risk is predicted to be negligible without the need to examine
it thoroughly through a collision risk model.
A ‘risk window’ was defined through which these species approaching the turbines were
predicted to pass. The window measured 172 m tall (the span of the largest rotors) and
1,076 m wide (the distance across the CSA) on a perpendicular axis to the primary flight direction. The cross-sectional area (W) of the risk window was calculated (width × height).
The mean number of flights per hour of observation that flew through the risk window each season was determined for each species – this is the sum of the number of birds observed
passing through the risk window at risk height during the season divided by the observation
duration at the VP for that season.
As described above, an apportioning method for flight heights used in offshore collision risk
modelling has been applied here to account for the discrepancy between the height recording bands used in the surveys and the height span of the turbine rotors. Table 8 provides the
percentage of birds (i) recorded by the surveys above 40 m; (ii) estimated above 24 m by the
apportioning tool available on the Strategic Ornithological Support Services (SOSS) website16; and (iii) estimated above 40 m by the apportioning tool, for comparative purposes.
15 Based on SNH Update 22.04.2013. The breeding seasons in brackets have been estimated from similar species and
literature, e.g. Snow, D.W. and Perrins, C.M. (1998) The Birds of the Western Palearctic. Concise edition. Oxford University Press. 16 http://www.bto.org/sites/default/files/u28/downloads/Projects/Final_Report_SOSS02_FlightHeights2014.xls

Technical Appendix A7.1
Forthwind Demonstration Project
Page 16
Table 8: Percentage of birds flying at risk height
Species >40 m (survey) >24 m (from Johnston et al. 2014)
>40 m (from Johnston et al. 2014)
Fulmar 12.07 % 0.41 % 0.01 %
Gannet 21.08 % 8.30 % 1.55 %
Kittiwake 6.30 % 10.22 % 2.20 %
Herring gull 23.46 % 25.44 % 10.08 %
Lesser black-backed gull 21.29 % 21.89 % 7.85 %
Great black-backed gull 30.02 % 26.04 % 10.66 %
The data show that for all the species the proportion of birds observed flying above 40 m (height bands 2 and 3) was much higher than that predicted by the height apportioning tool.
The collision risk using the Band model (for onshore wind farms) is presented using the two different methods to estimate the number of passes through the risk area at PCRH (n): (i)
using the observed survey data under the assumption that birds >40 m are at PCRH and
those < 40 m are not at PCRH and (ii) using the number of birds >24 m estimated by the apportioning tool.
The number of birds (n) assumed to fly through the risk window during each season was calculated by multiplying the mean number of birds estimated flying through the risk window
at risk height per hour within the season by the number of hours that they are potentially
active in the season based on data within Table 7 and based on information supplied by SNH regarding potential nocturnal activity (Table 9).
Table 9: Hours used in CRM Species Hours in CRM Breeding Season Non-breeding Season
Fulmar Daylight +4 hours 2,938 hours 2,936 hours
Gannet Daylight +1 hour 2,869 hours 1,910 hours
Kittiwake Daylight +3 hours 2,755 hours 2,754 hours
Herring gull Daylight +2 hours 2,602 hours 2,542 hours
Lesser black-backed gull Daylight +2 hours 2,602 hours 2,542 hours
Great black-backed gull Daylight +2 hours 2,602 hours 2,542 hours
The area (A) presented by the wind turbine rotors within the risk window was calculated by
multiplying the number of turbines (2) by the area swept by one rotor. This model is based on a 3-bladed turbine.
The proportion of the risk window occupied by the rotors is A/W. Therefore the number of
birds assumed to pass through the rotors each year (NTRANSIT) is the number of birds estimated to cross the risk window each year multiplied by the proportion of the risk window
occupied by the rotors (n × A/W).
The probability of a bird that flies through the area swept by the rotors being hit by a rotor
blade (p) depends on a number of parameters: the dimensions of the bird and type of flight
(speed, and flapping or gliding), and the size and rotation speed of the rotors. For this assessment, birds were assumed to use flapping flight for kittiwake, herring gull, lesser black-
backed gull and great black-backed gull and gliding flight for fulmar and gannet.
Flight speeds used in the modelling were: fulmar 13.0 m/s17, gannet 14.9 m/s17,
kittiwake 13.1 m/s18, herring gull 12.8 m/s18, lesser black-backed gull 13.1 m/s19 and great
black-backed gull 13.1 m/s20. Bird lengths and wingspans were taken from Snow and Perrins (199821).
17 Pennycuick, C.J. (1997) Actual and ‘optimum’ flight speeds: field data reassessed. Journal of Experimental Biology. 200:
2,355-2,361. 18 Alerstam, T., Rosén, M., Bäackman, J., Ericson, P.G.P. and Hellgren, O. (2007) Flight speeds among bird species: allometric
and phylogenetic effects. PLoS Biol. 5(8): e197. 19 Information supplied by SNH as value used in the Forth and Tay assessments. 20 Considered to be similar to flight speed provided by SNH for lesser black-backed gull. 21 Snow, D.W. and Perrins, C.M. (1998). The Birds of the Western Palearctic. Concise Edition. Oxford University Press.

Technical Appendix A7.1
Forthwind Demonstration Project
Page 17
These parameters were input into a bespoke Excel spreadsheet that calculates the average
collision risk for a single transit of a bird flying through the rotors, expressed as a percentage.
From the above results, the number of birds colliding with the rotors during each season was
calculated, assuming that birds take no avoiding action, by multiplying the number of transits (NTRANSIT) by the probability of being struck by the rotor during a single transit (p). Note that
the assumption has been made that turbines are operational for a maximum of 85 % of the
time; therefore the collision risk has been reduced by 15 %, as birds are unlikely to be at risk of collision with the stationary turbine structure.
The above calculations make an estimate of collision risk, assuming that birds take no action to avoid being struck by the operating rotor blades. In reality, as described above, a very high
proportion of birds are likely to take avoiding action. In agreement with SNH an avoidance rate of 98 % has been used, however recent work has shown that an avoidance rate of 99 %
may be more suitable for some species in relation to offshore windfarms (Cook et al. 201222);
therefore collision risk assuming an avoidance rate of 99 % has also been presented.
5.1.3.2 CRM Results
Table 10 provides the results for all CRM (collisions per year and years per collision) for fulmar, gannet, kittiwake, herring gull, lesser black-backed gull and great black-backed gull
using observed data on bird flight heights, under the assumption that birds in flight height
bands 2 and 3 are equivalent to PCRH. Results are presented for the 2010, 2011 and 2012 breeding season, and the 2011-12 non-breeding season.
Table 10: Collision Risk Modelling Outputs Species Season Collision
Risk Collisions/
Year (98 %)
Collision Risk Years/
Collision (98 %)
Collision Risk
Collisions/ Year (99 %)
Collision Risk Years/
Collision (99 %)
Fulmar (Predictable model - gliding)
2010 breeding season
0.13 7.86 0.06 15.72
2011 breeding season
0.02 42.33 0.01 84.67
2012 breeding season
Negligible, none recorded in height bands 2 and 3
2011-12 non-breeding season
Negligible, too few flights to model
Gannet (Predictable model - gliding)
2010 breeding season
6.25 0.16 3.12 0.32
2011 breeding season
5.12 0.20 2.56 0.39
2012 breeding season
3.11 0.32 1.56 0.64
2011-12 non-breeding season
0.24 4.10 0.12 8.21
Kittiwake (Predictable model - flapping)
2010 breeding season
0.07 13.41 0.04 26.82
2011 breeding season
0.27 3.66 0.14 7.31
2012 breeding season
0.39 2.58 0.19 5.16
2011-12 non-breeding season
0.07 14.53 0.03 29.06
Herring gull
(Predictable
2010 breeding
season 2.44 0.41 1.22 0.82
22 Cook, A.S.C.P., Johnston, A., Wright, L.J. and Burton, N.H.K. (2012). A review of flight heights and avoidance rates of birds
in relation to offshore wind farms. BTO Research Report Number 618. British Trust for Ornithology.
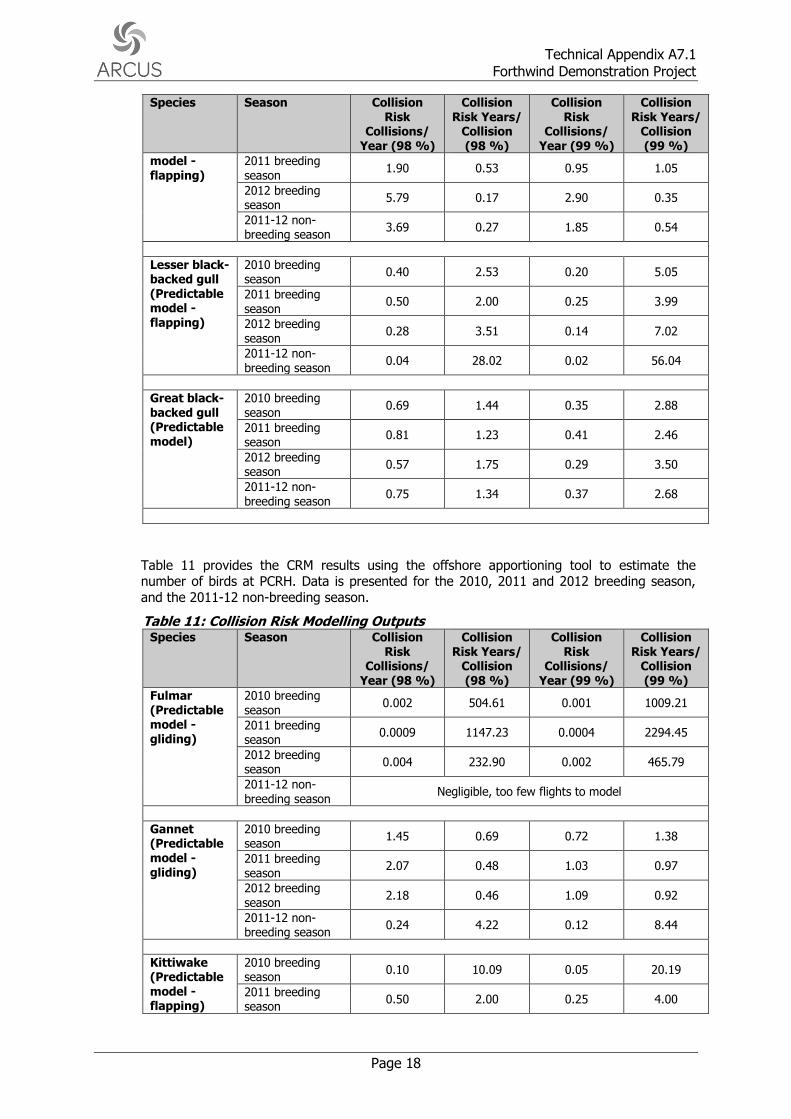
Technical Appendix A7.1
Forthwind Demonstration Project
Page 18
Species Season Collision Risk
Collisions/ Year (98 %)
Collision Risk Years/
Collision (98 %)
Collision Risk
Collisions/ Year (99 %)
Collision Risk Years/
Collision (99 %)
model - flapping)
2011 breeding season
1.90 0.53 0.95 1.05
2012 breeding season
5.79 0.17 2.90 0.35
2011-12 non-breeding season
3.69 0.27 1.85 0.54
Lesser black-backed gull (Predictable model -
flapping)
2010 breeding season
0.40 2.53 0.20 5.05
2011 breeding season
0.50 2.00 0.25 3.99
2012 breeding season
0.28 3.51 0.14 7.02
2011-12 non-breeding season
0.04 28.02 0.02 56.04
Great black-backed gull (Predictable model)
2010 breeding season
0.69 1.44 0.35 2.88
2011 breeding season
0.81 1.23 0.41 2.46
2012 breeding season
0.57 1.75 0.29 3.50
2011-12 non-breeding season
0.75 1.34 0.37 2.68
Table 11 provides the CRM results using the offshore apportioning tool to estimate the number of birds at PCRH. Data is presented for the 2010, 2011 and 2012 breeding season,
and the 2011-12 non-breeding season.
Table 11: Collision Risk Modelling Outputs Species Season Collision
Risk Collisions/
Year (98 %)
Collision Risk Years/
Collision (98 %)
Collision Risk
Collisions/ Year (99 %)
Collision Risk Years/
Collision (99 %)
Fulmar (Predictable model - gliding)
2010 breeding season
0.002 504.61 0.001 1009.21
2011 breeding season
0.0009 1147.23 0.0004 2294.45
2012 breeding season
0.004 232.90 0.002 465.79
2011-12 non-breeding season
Negligible, too few flights to model
Gannet (Predictable model - gliding)
2010 breeding season
1.45 0.69 0.72 1.38
2011 breeding season
2.07 0.48 1.03 0.97
2012 breeding season
2.18 0.46 1.09 0.92
2011-12 non-breeding season
0.24 4.22 0.12 8.44
Kittiwake (Predictable model - flapping)
2010 breeding season
0.10 10.09 0.05 20.19
2011 breeding season
0.50 2.00 0.25 4.00

Technical Appendix A7.1
Forthwind Demonstration Project
Page 19
Species Season Collision Risk
Collisions/ Year (98 %)
Collision Risk Years/
Collision (98 %)
Collision Risk
Collisions/ Year (99 %)
Collision Risk Years/
Collision (99 %)
2012 breeding season
0.43 2.34 0.21 4.69
2011-12 non-breeding season
0.06 17.41 0.03 34.82
Herring gull (Predictable model - flapping)
2010 breeding season
4.24 0.24 2.12 0.47
2011 breeding season
1.46 0.68 0.73 1.37
2012 breeding season
5.84 0.17 2.92 0.34
2011-12 non-breeding season
2.66 0.38 1.33 0.75
Lesser black-backed gull (Predictable model - flapping)
2010 breeding season
0.26 3.91 0.13 7.83
2011 breeding season
0.83 1.21 0.41 2.42
2012 breeding season
0.21 4.81 0.10 9.62
2011-12 non-breeding season
0.04 25.60 0.02 51.20
Great black-backed gull
(Predictable model)
2010 breeding season
0.53 1.90 0.26 3.80
2011 breeding season
0.60 1.67 0.30 3.34
2012 breeding season
0.36 2.78 0.18 5.57
2011-12 non-breeding season
0.64 1.57 0.32 3.15

Technical Appendix A7.1
Forthwind Demonstration Project
Page 20
5.2 Sea Use Surveys
A total of 20 species were recorded on the sea inside the CSA during the survey period. The survey results for each month have been combined to give monthly maximum and average
counts which are provided in Appendix 2.
The summary tables below show average and maximum sea use for each
qualifying/assemblage species listed for the SPAs in Table 1. Seasons are based on
information provided by SNH and shown in Table 7. Qualifying/Assemblage species listed on the Cameron Reservoir SPA and Loch Leven SPA were not recorded during the surveys and
are not considered further.
Sea use by Firth of Forth SPA Qualifying/Assemblage species is shown in Table 12. The
following species were not recorded and are therefore not included in Table 12: oystercatcher, Slavonian grebe, bar-tailed godwit, golden plover, sandwich tern, pink-footed
goose, shelduck, knot, redshank, turnstone, great crested grebe, Slavonian grebe, wigeon,
mallard, scaup, goldeneye, ringed plover, lapwing, dunlin and curlew.
Table 12: Mean and maximum monthly sea use for the Firth of Forth SPA Qualifying/Assemblage species
Species Mean monthly count over
season23
Maximum monthly count over season23
Wintering Species (Article 4.1)
Red-throated diver 1.55 birds 4 (December 2009)
Wintering Species (Article 4.2) Assemblage
Red-throated diver 1.55 birds 4 (December 2009)
Cormorant 2.64 birds 7 (March 2010)
Eider 11.00 birds 30 (January 2010)
Long-tailed duck 6.45 birds 32 (January 2010)
Common scoter 8.45 birds 37 (March 2010)
Velvet scoter 3.91 birds 15 (March 2010)
Red-breasted merganser 0.27 birds 2 (January 2010)
Sea use by Forth Islands SPA Qualifying/Assemblage species is shown in Table 13. The
following species were not recorded and are therefore not included in Table 11: Arctic tern, roseate tern, common tern, sandwich tern and fulmar.
Table 13: Mean and maximum monthly sea use for the Forth Islands SPA Qualifying/Assemblage species
Species Mean monthly count over
season24
Maximum monthly count over season24
Breeding Species (Article 4.2)
Gannet 5.36 birds 23 (June 2011)
Shag 2.40 birds 6 (April 2012)
Lesser black-backed gull 4.60 birds 22 (August 2011)
Puffin 1.50 birds 8 (June 2011)
Breeding Species (Article 4.2) Assemblage
Razorbill 1.00 birds 4 (June 2012)
Puffin 1.50 birds 8 (June 2011)
Herring gull 17.60 birds 52 (May 2010)
Lesser black-backed gull 4.60 birds 22 (August 2011)
Gannet 5.36 birds 23 (June 2011)
Shag 2.40 birds 6 (April 2012)
23 Wintering species data based on two non-breeding seasons (2009-2010 and 2011-2012). 24 Breeding species data based on three breeding seasons (2010, 2011 and 2012).

Technical Appendix A7.1
Forthwind Demonstration Project
Page 21
Species Mean monthly count over
season24
Maximum monthly count over season24
Cormorant 1.00 birds 2 (July 2010, August 2011 and April
2012)
Kittiwake 5.00 birds 40 (June 2011)
Guillemot 9.44 birds 25 (June 2011)
Sea use by the Upper Firth of Forth and Tay Bay Complex dSPA (presumed Qualifying/Assemblage species) are not included here as it is not known whether species are
included due to their breeding, passage or wintering value in the area. Most species, with the exception of black-headed gull and common gull are shown in the likely season of interest in
Tables 12 and 13 above. Both black-headed gull and common gull were recorded infrequently
during the survey period in low numbers.
The following two species not listed as SPA qualifying/assemblage species were also recorded
during the sea use surveys: goosander and great skua.
In order to allow potential disturbance/displacement to be investigated it is necessary to
understand the density of birds using the Core Survey Area during the breeding and non-
breeding season (Table 14). Densities are calculated based on the maximum monthly count in the Core Survey Area (covers an area of 0.34 km2) calculated as follows:
Density = (1 km2 / 0.34 km2) x Peak Count
Table 14: Peak Densities for key species
Species Season Peak Count
(Month/Year) Density
(Number/km2)
Red-throated diver Non-breeding 4 11.76
Cormorant Non-breeding 7 20.59
Eider Non-breeding 30 88.24
Long-tailed duck Non-breeding 32 94.12
Common scoter Non-breeding 37 108.82
Velvet scoter Non-breeding 15 44.12
Red-breasted merganser Non-breeding 2 5.88
Razorbill Breeding 4 11.76
Puffin Breeding 8 23.53
Herring gull Breeding 52 152.94
Lesser black-backed gull Breeding 22 64.71
Gannet Breeding 23 67.65
Shag Breeding 6 17.65
Cormorant Breeding 2 5.88
Kittiwake Breeding 40 117.65
Guillemot Breeding 25 73.53

FORTHWIND DEMONSTRATION PROJECT
Appendices to Technical Appendix A7.1
JULY 2015


Prepared By:
Arcus Consultancy Services
Suite 1C Swinegate Court East
3 Swinegate York
North Yorkshire YO1 8AJ
T +44 (0)1904 715 470 l E [email protected]
w www.arcusconsulting.co.uk
Registered in England & Wales No. 5644976


Appendices to Technical Appendix A7.1
Forthwind Demonstration Project
Page i
TABLE OF CONTENTS
1 APPENDIX 1 ............................................................................................................... 2
1.1 Weather .......................................................................................................... 2
1.2 Vantage Point Surveys ................................................................................. 13
1.2.1 Target Species ..................................................................................................... 13
1.2.2 Secondary Species................................................................................................ 59
2 APPENDIX 2 ............................................................................................................. 62
2.1 Sea Use Surveys ........................................................................................... 62

Appendices to Technical Appendix A7.1
Forthwind Ltd
Page 2
1 APPENDIX 1
1.1 Weather
Table A1.1: Weather for All Surveys Survey Date Start Finish Period Weather
1 14/12/2009 12:15 15:15 0 Dry, overcast, wind 2/3 west
1 14/12/2009 12:15 15:15 30 2/3 W
1 14/12/2009 12:15 15:15 60 2/3 W
1 14/12/2009 12:15 15:15 90 2/3 W
1 14/12/2009 12:15 15:15 120 2/3 W
1 14/12/2009 12:15 15:15 150 Wind 0 no rain, light poor
1 14/12/2009 12:15 15:15 180 1 W
2 15/12/2009 11:10 14:20 0 Dry, overcast, wind 1/2 northeast
2 15/12/2009 11:10 14:20 30 1/2 NE
2 15/12/2009 11:10 14:20 60 1/2 NE
2 15/12/2009 11:10 14:20 90 1/2 NE
2 15/12/2009 11:10 14:20 120 3 NE
2 15/12/2009 11:10 14:20 150 3+ NE
2 15/12/2009 11:10 14:20 180 3 NE
3 16/12/2009 10:50 13:50 0 Dry, Overcast Wind 1 Northeast
3 16/12/2009 10:50 13:50 30 1 NE, Light Rain
3 16/12/2009 10:50 13:50 60 1 NE, Light Rain
3 16/12/2009 10:50 13:50 90 1 NE, Dry
3 16/12/2009 10:50 13:50 120 1/2 NE
3 16/12/2009 10:50 13:50 150 2 NE, Light Rain
3 16/12/2009 10:50 13:50 180 2 NE
4 08/01/2010 11:00 14:00 0 Dry Wind 1 NE Poor Vis sun obscuring 15% view
-5oC
4 08/01/2010 11:00 14:00 30 1 NW
4 08/01/2010 11:00 14:00 60 1 NW
4 08/01/2010 11:00 14:00 90 1 NW
4 08/01/2010 11:00 14:00 120 1 NW, vis poor, but sun no longer in FOV
4 08/01/2010 11:00 14:00 150 1 NW, vis poor, but sun no longer in FOV
4 08/01/2010 11:00 14:00 180 1 NW, vis poor, but sun no longer in FOV
5 22/01/2010 09:00 12:00 0 Dry, overcast, <1 N
5 22/01/2010 09:00 12:00 30 0
5 22/01/2010 09:00 12:00 60 0
5 22/01/2010 09:00 12:00 90 1 N
5 22/01/2010 09:00 12:00 120 1 N
5 22/01/2010 09:00 12:00 150 1 N
5 22/01/2010 09:00 12:00 180 1 N
6 22/01/2010 12:30 15:30 0 Dry, overcast, slight mist, wind 1 N
6 22/01/2010 12:30 15:30 30 1 N
6 22/01/2010 12:30 15:30 60 1 N
6 22/01/2010 12:30 15:30 90 1 N
6 22/01/2010 12:30 15:30 120 1 N
6 22/01/2010 12:30 15:30 150 1 N
6 22/01/2010 12:30 15:30 180 1 N
7 26/01/2010 11:30 14:30 0 Rain, Wind 2/3 NW, Vis poor but adequate
7 26/01/2010 11:30 14:30 30 3 NW
7 26/01/2010 11:30 14:30 60 3 NW
7 26/01/2010 11:30 14:30 90 2 NW Rain stopped
7 26/01/2010 11:30 14:30 120 2 NW
7 26/01/2010 11:30 14:30 150 2 NW
7 26/01/2010 11:30 14:30 180 2 NW
8 02/02/2010 11:10 14:10 0 Dry, overcast initially, clearing later, Wind 1 S
8 02/02/2010 11:10 14:10 30 1 W
8 02/02/2010 11:10 14:10 60 1 NW Sun glare
8 02/02/2010 11:10 14:10 90 1 NW Sun glare

Appendices to Technical Appendix A7.1
Forthwind Demonstration Project
Page 3
Survey Date Start Finish Period Weather
8 02/02/2010 11:10 14:10 120 2 NW Sun off to West
8 02/02/2010 11:10 14:10 150 1 NW
8 02/02/2010 11:10 14:10 180 1 NW
9 18/02/2010 11:15 14:15 0 Dry, Wind E 1, 1/3 cloud, sunny, sun obscuring part of site
9 18/02/2010 11:15 14:15 30 1 E
9 18/02/2010 11:15 14:15 60 0
9 18/02/2010 11:15 14:15 90 0
9 18/02/2010 11:15 14:15 120 1 SW
9 18/02/2010 11:15 14:15 150 1 SW
9 18/02/2010 11:15 14:15 180 1 SW
10 01/03/2010 09:30 12:30 0 Dry, Wind 2 N, clear, sunney 20% obscured by sun
10 01/03/2010 09:30 12:30 30 2 N
10 01/03/2010 09:30 12:30 60 3 N sun in face 50% obscured
10 01/03/2010 09:30 12:30 90 2 N sun in face 50% obscured
10 01/03/2010 09:30 12:30 120 2 N sun in face 30% obscured
10 01/03/2010 09:30 12:30 150 2 N sun in face 20% obscured
10 01/03/2010 09:30 12:30 180 2 N no direct sun in face
11 01/03/2010 13:00 16:00 0 Dry, sunny, clear, No direct sun, some glare, Wind 2 N
11 01/03/2010 13:00 16:00 30 2 N
11 01/03/2010 13:00 16:00 60 2 N
11 01/03/2010 13:00 16:00 90 2 N Glare reducing
11 01/03/2010 13:00 16:00 120 2 N no glare
11 01/03/2010 13:00 16:00 150 2 N
11 01/03/2010 13:00 16:00 180 2 N
12 02/03/2010 13:00 16:00 0 Dry, sunny, clear, Wind 1 N, heat haze
12 02/03/2010 13:00 16:00 30 0
12 02/03/2010 13:00 16:00 60 0
12 02/03/2010 13:00 16:00 90 1 SW
12 02/03/2010 13:00 16:00 120 1 SW
12 02/03/2010 13:00 16:00 150 2 SW
12 02/03/2010 13:00 16:00 180 1 SW
13 16/03/2010 09:40 12:40 0 Dry, cloudy, some sun/glare, wind NW 2/3
13 16/03/2010 09:40 12:40 30 2 NW
13 16/03/2010 09:40 12:40 60 2 NW glare
13 16/03/2010 09:40 12:40 90 2 NW strong glare
13 16/03/2010 09:40 12:40 120 2 NW strong glare
13 16/03/2010 09:40 12:40 150 2 NW no glare
13 16/03/2010 09:40 12:40 180 1 NW
14 16/03/2010 13:10 16:10 0 Dry, cloudy, wind 1 NW
14 16/03/2010 13:10 16:10 30 1 SW
14 16/03/2010 13:10 16:10 60 1 W
14 16/03/2010 13:10 16:10 90 1 WSW
14 16/03/2010 13:10 16:10 120 1 SW
14 16/03/2010 13:10 16:10 150 0
14 16/03/2010 13:10 16:10 180 0
15 29/03/2010 09:40 11:10 0 Slight drizzle, cloudy, wind 1 NE
15 29/03/2010 09:40 11:10 30 1/2 N
15 29/03/2010 09:40 11:10 60 2/3 NNE
15 29/03/2010 09:40 11:10 90 4 N
15 29/03/2010 09:40 11:10 120 Null
15 29/03/2010 09:40 11:10 150 Null
15 29/03/2010 09:40 11:10 180 Null
16 14/04/2010 11:00 12:30 0 Full cloud, overcast, dry Wind 2 ENE
16 14/04/2010 11:00 12:30 30 2 E
16 14/04/2010 11:00 12:30 60 3 E
16 14/04/2010 11:00 12:30 90 3 E
16 14/04/2010 11:00 12:30 120 Null

Appendices to Technical Appendix A7.1
Forthwind Ltd
Page 4
Survey Date Start Finish Period Weather
16 14/04/2010 11:00 12:30 150 Null
16 14/04/2010 11:00 12:30 180 Null
17 14/04/2010 13:00 16:00 0 Dry, overcast, Wind 3 ESE
17 14/04/2010 13:00 16:00 30 3 SE
17 14/04/2010 13:00 16:00 60 2 SE
17 14/04/2010 13:00 16:00 90 2 SE
17 14/04/2010 13:00 16:00 120 2 SE
17 14/04/2010 13:00 16:00 150 2 E
17 14/04/2010 13:00 16:00 180 2 SE
18 23/04/2010 10:15 13:15 0 Cold 8/8 Wind 2+ SE
18 23/04/2010 10:15 13:15 30 2 SE
18 23/04/2010 10:15 13:15 60 2/3 SE
18 23/04/2010 10:15 13:15 90 3 SE
18 23/04/2010 10:15 13:15 120 3 SE rain
18 23/04/2010 10:15 13:15 150 3 E rain
18 23/04/2010 10:15 13:15 180 3 E rain heavier, poor vis
19 23/04/2010 13:40 15:10 0 Rain, cloudy 8/8 Wind 2 E
19 23/04/2010 13:40 15:10 30 3 E rain
19 23/04/2010 13:40 15:10 60 3 E heavy rain
19 23/04/2010 13:40 15:10 90 3 E heavy rain, poor vis
19 23/04/2010 13:40 15:10 120 Null
19 23/04/2010 13:40 15:10 150 Null
19 23/04/2010 13:40 15:10 180 Null
20 17/05/2010 13:10 16:10 0 Dry, sunny, cloud land not sea, slight glare, no direct sun, wind 1/2 SE
20 17/05/2010 13:10 16:10 30 2 S
20 17/05/2010 13:10 16:10 60 2 S
20 17/05/2010 13:10 16:10 90 2 S
20 17/05/2010 13:10 16:10 120 3 S
20 17/05/2010 13:10 16:10 150 3 S 50% cloud
20 17/05/2010 13:10 16:10 180 2 S sunny
21 18/05/2010 09:30 12:30 0 Dry, 3/8 cloud Sunny, Wind 1 S
21 18/05/2010 09:30 12:30 30 1 SW
21 18/05/2010 09:30 12:30 60 1 SW
21 18/05/2010 09:30 12:30 90 1 SW
21 18/05/2010 09:30 12:30 120 1 SW
21 18/05/2010 09:30 12:30 150 1 S
21 18/05/2010 09:30 12:30 180 0
22 18/05/2010 13:00 16:00 0 Dry, sunny, Wind 1 S
22 18/05/2010 13:00 16:00 30 3 S Difficult to see Terns against Glare
22 18/05/2010 13:00 16:00 60 3 S
22 18/05/2010 13:00 16:00 90 3 S
22 18/05/2010 13:00 16:00 120 3 S
22 18/05/2010 13:00 16:00 150 2 SE
22 18/05/2010 13:00 16:00 180 2 SE
23 25/05/2010 09:30 12:30 0 Dry, sunny, 3/8 cloud, Wind 1 S
23 25/05/2010 09:30 12:30 30 1 S
23 25/05/2010 09:30 12:30 60 1/2 S
23 25/05/2010 09:30 12:30 90 2 S
23 25/05/2010 09:30 12:30 120 1 S
23 25/05/2010 09:30 12:30 150 2 SSW
23 25/05/2010 09:30 12:30 180 2 SSW
24 25/05/2010 13:00 16:00 0 Dry, sunny, 5/8 cloud, Wind 2/3 S
24 25/05/2010 13:00 16:00 30 2/3 S
24 25/05/2010 13:00 16:00 60 3 S
24 25/05/2010 13:00 16:00 90 3 S
24 25/05/2010 13:00 16:00 120 3 S
24 25/05/2010 13:00 16:00 150 2 S
24 25/05/2010 13:00 16:00 180 1 S
25 16/06/2010 10:10 13:10 0 Dry, 8/8 cloud, Wind <1 S
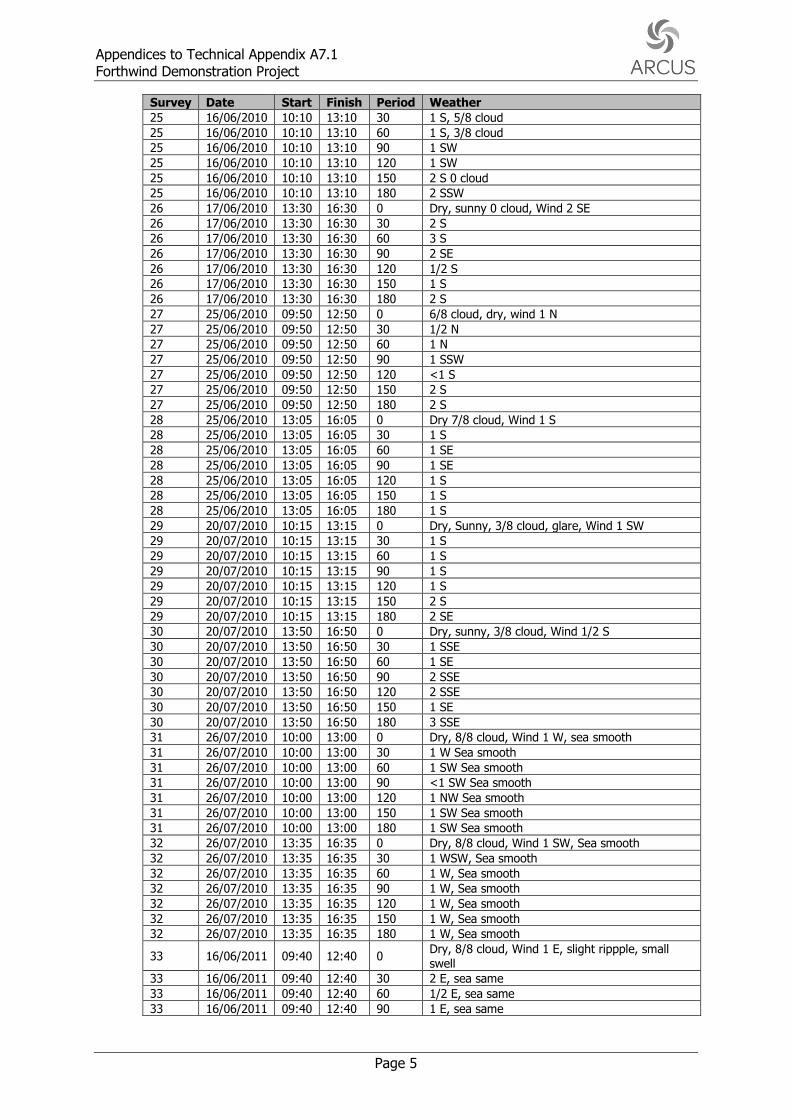
Appendices to Technical Appendix A7.1
Forthwind Demonstration Project
Page 5
Survey Date Start Finish Period Weather
25 16/06/2010 10:10 13:10 30 1 S, 5/8 cloud
25 16/06/2010 10:10 13:10 60 1 S, 3/8 cloud
25 16/06/2010 10:10 13:10 90 1 SW
25 16/06/2010 10:10 13:10 120 1 SW
25 16/06/2010 10:10 13:10 150 2 S 0 cloud
25 16/06/2010 10:10 13:10 180 2 SSW
26 17/06/2010 13:30 16:30 0 Dry, sunny 0 cloud, Wind 2 SE
26 17/06/2010 13:30 16:30 30 2 S
26 17/06/2010 13:30 16:30 60 3 S
26 17/06/2010 13:30 16:30 90 2 SE
26 17/06/2010 13:30 16:30 120 1/2 S
26 17/06/2010 13:30 16:30 150 1 S
26 17/06/2010 13:30 16:30 180 2 S
27 25/06/2010 09:50 12:50 0 6/8 cloud, dry, wind 1 N
27 25/06/2010 09:50 12:50 30 1/2 N
27 25/06/2010 09:50 12:50 60 1 N
27 25/06/2010 09:50 12:50 90 1 SSW
27 25/06/2010 09:50 12:50 120 <1 S
27 25/06/2010 09:50 12:50 150 2 S
27 25/06/2010 09:50 12:50 180 2 S
28 25/06/2010 13:05 16:05 0 Dry 7/8 cloud, Wind 1 S
28 25/06/2010 13:05 16:05 30 1 S
28 25/06/2010 13:05 16:05 60 1 SE
28 25/06/2010 13:05 16:05 90 1 SE
28 25/06/2010 13:05 16:05 120 1 S
28 25/06/2010 13:05 16:05 150 1 S
28 25/06/2010 13:05 16:05 180 1 S
29 20/07/2010 10:15 13:15 0 Dry, Sunny, 3/8 cloud, glare, Wind 1 SW
29 20/07/2010 10:15 13:15 30 1 S
29 20/07/2010 10:15 13:15 60 1 S
29 20/07/2010 10:15 13:15 90 1 S
29 20/07/2010 10:15 13:15 120 1 S
29 20/07/2010 10:15 13:15 150 2 S
29 20/07/2010 10:15 13:15 180 2 SE
30 20/07/2010 13:50 16:50 0 Dry, sunny, 3/8 cloud, Wind 1/2 S
30 20/07/2010 13:50 16:50 30 1 SSE
30 20/07/2010 13:50 16:50 60 1 SE
30 20/07/2010 13:50 16:50 90 2 SSE
30 20/07/2010 13:50 16:50 120 2 SSE
30 20/07/2010 13:50 16:50 150 1 SE
30 20/07/2010 13:50 16:50 180 3 SSE
31 26/07/2010 10:00 13:00 0 Dry, 8/8 cloud, Wind 1 W, sea smooth
31 26/07/2010 10:00 13:00 30 1 W Sea smooth
31 26/07/2010 10:00 13:00 60 1 SW Sea smooth
31 26/07/2010 10:00 13:00 90 <1 SW Sea smooth
31 26/07/2010 10:00 13:00 120 1 NW Sea smooth
31 26/07/2010 10:00 13:00 150 1 SW Sea smooth
31 26/07/2010 10:00 13:00 180 1 SW Sea smooth
32 26/07/2010 13:35 16:35 0 Dry, 8/8 cloud, Wind 1 SW, Sea smooth
32 26/07/2010 13:35 16:35 30 1 WSW, Sea smooth
32 26/07/2010 13:35 16:35 60 1 W, Sea smooth
32 26/07/2010 13:35 16:35 90 1 W, Sea smooth
32 26/07/2010 13:35 16:35 120 1 W, Sea smooth
32 26/07/2010 13:35 16:35 150 1 W, Sea smooth
32 26/07/2010 13:35 16:35 180 1 W, Sea smooth
33 16/06/2011 09:40 12:40 0 Dry, 8/8 cloud, Wind 1 E, slight rippple, small
swell
33 16/06/2011 09:40 12:40 30 2 E, sea same
33 16/06/2011 09:40 12:40 60 1/2 E, sea same
33 16/06/2011 09:40 12:40 90 1 E, sea same

Appendices to Technical Appendix A7.1
Forthwind Ltd
Page 6
Survey Date Start Finish Period Weather
33 16/06/2011 09:40 12:40 120 1 SW Sea smooth, slight swell
33 16/06/2011 09:40 12:40 150 1 SW Sea smooth, slight swell
33 16/06/2011 09:40 12:40 180 1 SW Sea ripple slight swell
34 16/06/2011 13:00 16:00 0 Dry, 8/8 cloud, Wind 1 SW, sea slight ripple
34 16/06/2011 13:00 16:00 30 1 SW sea slight ripple
34 16/06/2011 13:00 16:00 60 1 SW sea slight ripple
34 16/06/2011 13:00 16:00 90 1 SW sea slight ripple
34 16/06/2011 13:00 16:00 120 1 SW sea slight ripple
34 16/06/2011 13:00 16:00 150 1 SW sea slight ripple
34 16/06/2011 13:00 16:00 180 1 SW sea slight ripple
35 29/06/2011 09:40 12:40 0 Dry, Cloud 6/8, Wind 2 W, Slight glare, Sea ripple, occasional breaking crests
35 29/06/2011 09:40 12:40 30 2 W, Ripple no breaking crests
35 29/06/2011 09:40 12:40 60 1 W, some glare, sea rippled
35 29/06/2011 09:40 12:40 90 1 W, some glare, sea rippled
35 29/06/2011 09:40 12:40 120 2 W, glare increasing, sea rippled
35 29/06/2011 09:40 12:40 150 2 W, Ripples occasional breaking crests, glare
35 29/06/2011 09:40 12:40 180 2 W, Sea rippled
36 29/06/2011 13:00 16:00 0 Slight rain, 6/8 cloud, Wind 2 W, sea slight swell and ripple
36 29/06/2011 13:00 16:00 30 1 W, Rain, sea slight ripple and swell
36 29/06/2011 13:00 16:00 60 1 W, Heavy rain 13.35-13:47, sea slight ripple and swell
36 29/06/2011 13:00 16:00 90 1 W, sea slight ripple and swell
36 29/06/2011 13:00 16:00 120 1 W, Rain, sea slight ripple
36 29/06/2011 13:00 16:00 150 2-3 W, Sea breaking crests
36 29/06/2011 13:00 16:00 180 3-4 W, Sea no breaking crests only swell
37 13/07/2011 09:48 12:48 0 Dry, sunny, 1/8 cloud, wind 1/2 S, sea rippled
37 13/07/2011 09:48 12:48 30 1/2 S, sea rippled
37 13/07/2011 09:48 12:48 60 1 S, sea rippled
37 13/07/2011 09:48 12:48 90 1 S, sea rippled
37 13/07/2011 09:48 12:48 120 1 SSW, sea rippled
37 13/07/2011 09:48 12:48 150 1 SSW, sea rippled
37 13/07/2011 09:48 12:48 180 2 SSW, sea small wavelets
38 13/07/2011 13:00 16:00 0 Dry, sunny, 0 cloud, wind 2 SE, Sea small wavelets
38 13/07/2011 13:00 16:00 30 2/3 SW, small wavelets occ breaking crests
38 13/07/2011 13:00 16:00 60 3 S, breaking crests
38 13/07/2011 13:00 16:00 90 3+ S, breaking crests
38 13/07/2011 13:00 16:00 120 3+ S, breaking crests
38 13/07/2011 13:00 16:00 150 3 S, breaking crests
38 13/07/2011 13:00 16:00 180 3 S, breaking crests
39 09/08/2011 09:30 12:30 0 Dry, sunny, 3/8 cloud, Wind 3/4 W, some glare, sea breaking crests
39 09/08/2011 09:30 12:30 30 4/5 W, few breaking crests
39 09/08/2011 09:30 12:30 60 3 W, small wavelets, few breaking crests
39 09/08/2011 09:30 12:30 90 4 W, small wavelets
39 09/08/2011 09:30 12:30 120 4 WSW, small wavelets, glare
39 09/08/2011 09:30 12:30 150 4 WSW, small wavelets, bad glare
39 09/08/2011 09:30 12:30 180 3/4 WSW, Strong ripple, glare
40 09/08/2011 13:00 16:00 0 Dry, sunny, 4/8 cloud, wind 3 W, sea heavy ripple
40 09/08/2011 13:00 16:00 30 4+ W, small wavelets, breaking crests
40 09/08/2011 13:00 16:00 60 4 W, sea same
40 09/08/2011 13:00 16:00 90 3/4 W, sea same
40 09/08/2011 13:00 16:00 120 3/4 W, sea same
40 09/08/2011 13:00 16:00 150 3 W, Few breaking crests
40 09/08/2011 13:00 16:00 180 3 W, Few breaking crests
41 26/08/2011 09:15 12:15 0 Dry, 8/8 cloud, some mist, vis OK, Wind 3 SSE, sea rippled

Appendices to Technical Appendix A7.1
Forthwind Demonstration Project
Page 7
Survey Date Start Finish Period Weather
41 26/08/2011 09:15 12:15 30 Dry, 8/8 cloud, some mist, vis OK, Wind 3 SSE, sea rippled
41 26/08/2011 09:15 12:15 60 Dry, 8/8 cloud, some mist, vis OK, Wind 3 SSE, sea rippled
41 26/08/2011 09:15 12:15 90 Dry, 8/8 cloud, some mist, vis OK, Wind 3 SSE, sea rippled
41 26/08/2011 09:15 12:15 120 Dry, 8/8 cloud, some mist, vis OK, Wind 3 SSE, sea rippled
41 26/08/2011 09:15 12:15 150 Dry, 8/8 cloud, some mist, vis OK, Wind 3 SSE, sea rippled, occasional breaks in cloud, glare
41 26/08/2011 09:15 12:15 180 Dry, 8/8 cloud, some mist, vis OK, Wind 3 /4SSE, sea rippled, occasional breaks in cloud, glare, occasional breaking crests
42 26/08/2011 12:30 15:30 0 Dry, 8/8 low cloud, occ sunny, wind 4+SE, sea breaking crests
42 26/08/2011 12:30 15:30 30 Dry, 8/8 low cloud, occ sunny, wind 4+SE, sea breaking crests
42 26/08/2011 12:30 15:30 60 Dry, 8/8 low cloud, occ sunny, wind 4+SE, sea breaking crests
42 26/08/2011 12:30 15:30 90 Wind 3/4 SE, fewer breaking crests
42 26/08/2011 12:30 15:30 120 Wind 3/4 SE, No breaking crests, 8/8 high cloud
42 26/08/2011 12:30 15:30 150 Wind 3 SE, No breaking crests
42 26/08/2011 12:30 15:30 180 Wind 3 SE, No breaking crests
43 31/08/2011 09:30 12:30 0 Dry, 8/8 cloud, very calm, Wind 1 S
43 31/08/2011 09:30 12:30 30 2 S, sea slight ripple
43 31/08/2011 09:30 12:30 60 2 SW, sea slight ripple
43 31/08/2011 09:30 12:30 90 2 SW, sea slight ripple, some glare
43 31/08/2011 09:30 12:30 120 2 SW, sea slight ripple, less glare
43 31/08/2011 09:30 12:30 150 2 SW, sea slight ripple, less glare
43 31/08/2011 09:30 12:30 180 2 SW, sea slight ripple, less glare
44 31/08/2011 12:50 15:50 0 Dry, 8/8 cloud, wind 1/2 SW, sea slight ripple
44 31/08/2011 12:50 15:50 30 Dry, 8/8 cloud, wind 1/2 SW, sea slight ripple
44 31/08/2011 12:50 15:50 60 Dry, 8/8 cloud, wind 1/2 SW, sea slight ripple
44 31/08/2011 12:50 15:50 90 Dry, 8/8 cloud, wind 1/2 SW, sea slight ripple
44 31/08/2011 12:50 15:50 120 Dry, 8/8 cloud, wind 1/2 SW, sea slight ripple
44 31/08/2011 12:50 15:50 150 Dry, 8/8 cloud, wind 1/2 SW, sea slight ripple
44 31/08/2011 12:50 15:50 180 Dry, 8/8 cloud, wind 1/2 SW, sea slight ripple
45 28/09/2011 10:10 13:10 0 Dry, very sunny, 3/8 high cloud, very hazy, wind 2 SE, sea calm slight ripple
45 28/09/2011 10:10 13:10 30 Dry, very sunny, 3/8 high cloud, very hazy, wind 2 SE, sea calm slight ripple
45 28/09/2011 10:10 13:10 60 Dry, very sunny, 3/8 high cloud, very hazy, wind
2 SE, sea calm slight ripple
45 28/09/2011 10:10 13:10 90 Dry, very sunny, 3/8 high cloud, very hazy, wind 2 SE, sea calm slight ripple
45 28/09/2011 10:10 13:10 120 Wind 1 SE, sea slight ripple
45 28/09/2011 10:10 13:10 150 Wind 1/2 SE, sea slight ripple
45 28/09/2011 10:10 13:10 180 Wind 1 SE, sea slight ripple
46 28/09/2011 13:20 16:20 0 Dry, sunny, 2/8 high cloud, very hazy, wind 1/2 SW, strong ripple
46 28/09/2011 13:20 16:20 30 2/3 SW, small wavelets
46 28/09/2011 13:20 16:20 60 2/3 SW, small wavelets
46 28/09/2011 13:20 16:20 90 2+ WSW, small wavelets
46 28/09/2011 13:20 16:20 120 2+ WSW, occ breaking crests
46 28/09/2011 13:20 16:20 150 2 WSW, small wavelets no breaking crests
46 28/09/2011 13:20 16:20 180 2 W, small wavelets
47 04/10/2011 09:20 12:20 0 Dry, 8/8 cloud, wind 4+ W, sea rough, freq white horses
47 04/10/2011 09:20 12:20 30 4 W, no white horses, but rough
47 04/10/2011 09:20 12:20 60 4+ W, white horses
47 04/10/2011 09:20 12:20 90 4 W, no breaking crests
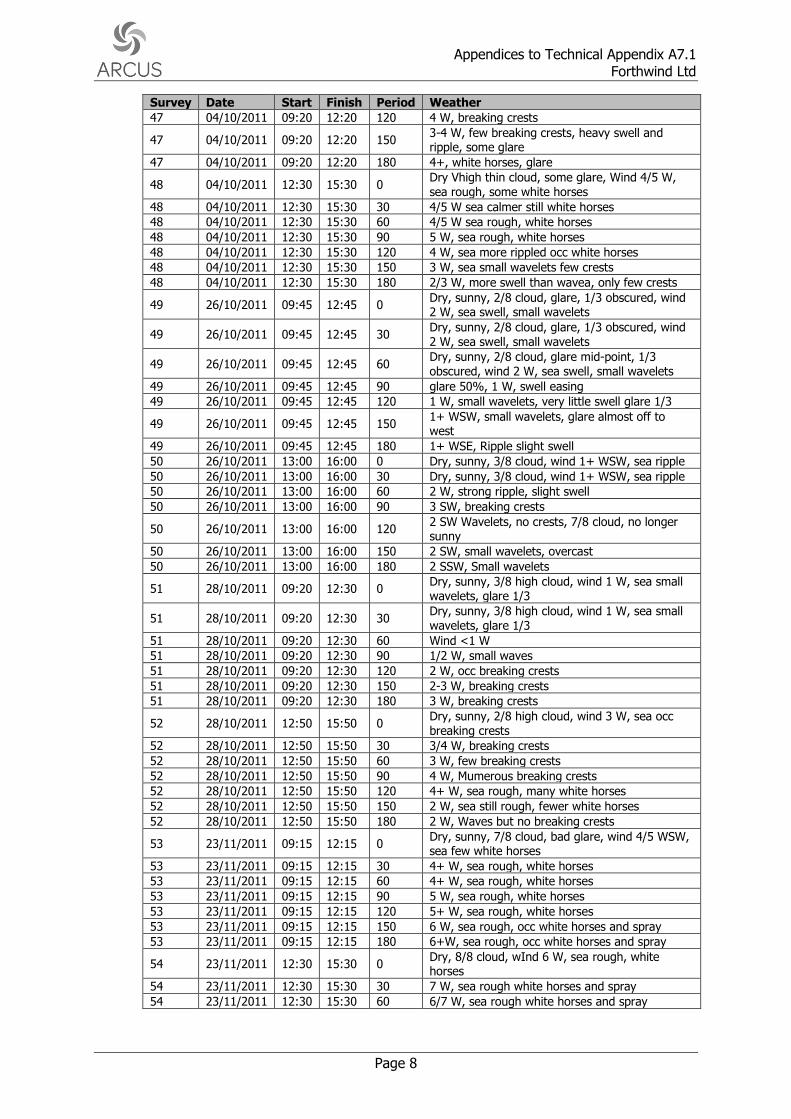
Appendices to Technical Appendix A7.1
Forthwind Ltd
Page 8
Survey Date Start Finish Period Weather
47 04/10/2011 09:20 12:20 120 4 W, breaking crests
47 04/10/2011 09:20 12:20 150 3-4 W, few breaking crests, heavy swell and ripple, some glare
47 04/10/2011 09:20 12:20 180 4+, white horses, glare
48 04/10/2011 12:30 15:30 0 Dry Vhigh thin cloud, some glare, Wind 4/5 W, sea rough, some white horses
48 04/10/2011 12:30 15:30 30 4/5 W sea calmer still white horses
48 04/10/2011 12:30 15:30 60 4/5 W sea rough, white horses
48 04/10/2011 12:30 15:30 90 5 W, sea rough, white horses
48 04/10/2011 12:30 15:30 120 4 W, sea more rippled occ white horses
48 04/10/2011 12:30 15:30 150 3 W, sea small wavelets few crests
48 04/10/2011 12:30 15:30 180 2/3 W, more swell than wavea, only few crests
49 26/10/2011 09:45 12:45 0 Dry, sunny, 2/8 cloud, glare, 1/3 obscured, wind 2 W, sea swell, small wavelets
49 26/10/2011 09:45 12:45 30 Dry, sunny, 2/8 cloud, glare, 1/3 obscured, wind 2 W, sea swell, small wavelets
49 26/10/2011 09:45 12:45 60 Dry, sunny, 2/8 cloud, glare mid-point, 1/3 obscured, wind 2 W, sea swell, small wavelets
49 26/10/2011 09:45 12:45 90 glare 50%, 1 W, swell easing
49 26/10/2011 09:45 12:45 120 1 W, small wavelets, very little swell glare 1/3
49 26/10/2011 09:45 12:45 150 1+ WSW, small wavelets, glare almost off to west
49 26/10/2011 09:45 12:45 180 1+ WSE, Ripple slight swell
50 26/10/2011 13:00 16:00 0 Dry, sunny, 3/8 cloud, wind 1+ WSW, sea ripple
50 26/10/2011 13:00 16:00 30 Dry, sunny, 3/8 cloud, wind 1+ WSW, sea ripple
50 26/10/2011 13:00 16:00 60 2 W, strong ripple, slight swell
50 26/10/2011 13:00 16:00 90 3 SW, breaking crests
50 26/10/2011 13:00 16:00 120 2 SW Wavelets, no crests, 7/8 cloud, no longer sunny
50 26/10/2011 13:00 16:00 150 2 SW, small wavelets, overcast
50 26/10/2011 13:00 16:00 180 2 SSW, Small wavelets
51 28/10/2011 09:20 12:30 0 Dry, sunny, 3/8 high cloud, wind 1 W, sea small wavelets, glare 1/3
51 28/10/2011 09:20 12:30 30 Dry, sunny, 3/8 high cloud, wind 1 W, sea small wavelets, glare 1/3
51 28/10/2011 09:20 12:30 60 Wind <1 W
51 28/10/2011 09:20 12:30 90 1/2 W, small waves
51 28/10/2011 09:20 12:30 120 2 W, occ breaking crests
51 28/10/2011 09:20 12:30 150 2-3 W, breaking crests
51 28/10/2011 09:20 12:30 180 3 W, breaking crests
52 28/10/2011 12:50 15:50 0 Dry, sunny, 2/8 high cloud, wind 3 W, sea occ breaking crests
52 28/10/2011 12:50 15:50 30 3/4 W, breaking crests
52 28/10/2011 12:50 15:50 60 3 W, few breaking crests
52 28/10/2011 12:50 15:50 90 4 W, Mumerous breaking crests
52 28/10/2011 12:50 15:50 120 4+ W, sea rough, many white horses
52 28/10/2011 12:50 15:50 150 2 W, sea still rough, fewer white horses
52 28/10/2011 12:50 15:50 180 2 W, Waves but no breaking crests
53 23/11/2011 09:15 12:15 0 Dry, sunny, 7/8 cloud, bad glare, wind 4/5 WSW, sea few white horses
53 23/11/2011 09:15 12:15 30 4+ W, sea rough, white horses
53 23/11/2011 09:15 12:15 60 4+ W, sea rough, white horses
53 23/11/2011 09:15 12:15 90 5 W, sea rough, white horses
53 23/11/2011 09:15 12:15 120 5+ W, sea rough, white horses
53 23/11/2011 09:15 12:15 150 6 W, sea rough, occ white horses and spray
53 23/11/2011 09:15 12:15 180 6+W, sea rough, occ white horses and spray
54 23/11/2011 12:30 15:30 0 Dry, 8/8 cloud, wInd 6 W, sea rough, white horses
54 23/11/2011 12:30 15:30 30 7 W, sea rough white horses and spray
54 23/11/2011 12:30 15:30 60 6/7 W, sea rough white horses and spray

Appendices to Technical Appendix A7.1
Forthwind Demonstration Project
Page 9
Survey Date Start Finish Period Weather
54 23/11/2011 12:30 15:30 90 6/7 W, sea now little spray
54 23/11/2011 12:30 15:30 120 6 W, sea calmer, white horses, no spray
54 23/11/2011 12:30 15:30 150 5+ gusting sea rough, fewer white horses
54 23/11/2011 12:30 15:30 180 5+ gusting sea rough, fewer white horses
55 25/11/2011 10:15 13:15 0 Slight rain, 6/8 cloud, some glare, Wind 4+ W, gusting 5/6, sea rough, heavy swell, occ white horses
55 25/11/2011 10:15 13:15 30 No rain, 6/8 cloud, some glare, Wind 4+ W, gusting 5/6, sea rough, heavy swell, occ white horses
55 25/11/2011 10:15 13:15 60 7 W, short squall, heavy rain/sleet numerous white horses
55 25/11/2011 10:15 13:15 90 4-6 WSW, sea rough, numerous white horses
55 25/11/2011 10:15 13:15 120 4-6 WSW, sea rough, fewer white horses
55 25/11/2011 10:15 13:15 150 3 W, sea waves with occ crests
55 25/11/2011 10:15 13:15 180 3 W, sea waves with occ crests
56 02/12/2011 10:15 13:15 0 Dry, 8/8 cloud, wind 2 SW, sea rippled
56 02/12/2011 10:15 13:15 30 2/3 W, sea rippled and occ breaking crests
56 02/12/2011 10:15 13:15 60 2/3 W, sea rippled and occ breaking crests
56 02/12/2011 10:15 13:15 90 2/3 W, sea rippled and occ breaking crests
56 02/12/2011 10:15 13:15 120 2/3 W, sea rippled and occ breaking crests
56 02/12/2011 10:15 13:15 150 3 W, sea rippled and occ breaking crests
56 02/12/2011 10:15 13:15 180 4 W, sea rough, some white horses
57 15/12/2011 11:55 14:55 0 Dry sunny, 1/8 cloud, wind 1 WNW, sea rippled
57 15/12/2011 11:55 14:55 30 Dry sunny, 1/8 cloud, wind 1 WNW, sea rippled
57 15/12/2011 11:55 14:55 60 Dry sunny, 1/8 cloud, wind 1 WNW, sea rippled
57 15/12/2011 11:55 14:55 90 2 W, sea wavelets
57 15/12/2011 11:55 14:55 120 1 W, wavelets
57 15/12/2011 11:55 14:55 150 1 WNW, wavelets
57 15/12/2011 11:55 14:55 180 1 WNW, sea rippled
58 20/12/2011 11:35 14:35 0 Dry, 8/8 cloud, cold, wind 2 W, sea rippled
58 20/12/2011 11:35 14:35 30 2+ W, sea wavelets occ crests
58 20/12/2011 11:35 14:35 60 2/3 W, sea wavelets
58 20/12/2011 11:35 14:35 90 2/3 W, sea wavelets
58 20/12/2011 11:35 14:35 120 1/2 W, sea wavelets
58 20/12/2011 11:35 14:35 150 1/2 W, sea wavelets
58 20/12/2011 11:35 14:35 180 1/2 W, sea wavelets
59 22/12/2011 10:50 13:50 0 Dry, 8/8 cloud, wind 3+ W, sea wavelets with some breaking crests
59 22/12/2011 10:50 13:50 30 3/4 W, sea wavelets occ crests
59 22/12/2011 10:50 13:50 60 3/4 W, sea wavelets occ crests
59 22/12/2011 10:50 13:50 90 4 W, sea occ crests
59 22/12/2011 10:50 13:50 120 3+ W, sea wavelets, no crests
59 22/12/2011 10:50 13:50 150 2/3 W, sea wavelets
59 22/12/2011 10:50 13:50 180 2/3 W, sea wavelets
60 05/01/2012 11:30 14:30 0 Dry, 1/8 cloud, wind 4 N, gust 6, sea rippled, sheltered from north, small wavelets further out only
60 05/01/2012 11:30 14:30 30 4/5(6) N, sea as above
60 05/01/2012 11:30 14:30 60 5(6/7) N, sea as above
60 05/01/2012 11:30 14:30 90 4(5) N, sea as above
60 05/01/2012 11:30 14:30 120 4(5) N, sea as above
60 05/01/2012 11:30 14:30 150 5 N, sea as above
60 05/01/2012 11:30 14:30 180 6 N, sea breaking wavelets close inshore
61 27/01/2012 09:45 12:45 0 Dry, sunny, 3/8 cloud, wind 1 NW, sea wavelets, some glare
61 27/01/2012 09:45 12:45 30 Dry, sunny, 3/8 cloud, wind 1 NW, sea wavelets, some glare
61 27/01/2012 09:45 12:45 60 Dry, sunny, 3/8 cloud, wind 1 NW, sea wavelets, some glare

Appendices to Technical Appendix A7.1
Forthwind Ltd
Page 10
Survey Date Start Finish Period Weather
61 27/01/2012 09:45 12:45 90 Dry, sunny, 3/8 cloud, wind 1 NW, sea wavelets, some glare
61 27/01/2012 09:45 12:45 120 Dry, sunny, 3/8 cloud, wind 1 NW, sea wavelets, some glare
61 27/01/2012 09:45 12:45 150 2 W, sea ripples
61 27/01/2012 09:45 12:45 180 2 W, sea ripples
62 27/01/2012 12:45 15:45 0 Dry, sunny, 2/8 cloud, wind 1/2 W, sea ripples
62 27/01/2012 12:45 15:45 30 Dry, sunny, 2/8 cloud, wind 1/2 W, sea ripples
62 27/01/2012 12:45 15:45 60 Dry, sunny, 2/8 cloud, wind 1 NW, sea ripples
62 27/01/2012 12:45 15:45 90 Dry, sunny, 2/8 cloud, wind 1 NW, sea ripples
62 27/01/2012 12:45 15:45 120 Dry, sunny, 2/8 cloud, wind 1 NW, sea ripples
62 27/01/2012 12:45 15:45 150 Dry, sunny, 2/8 cloud, wind 1 NW, sea ripples
62 27/01/2012 12:45 15:45 180 Dry, sunny, 2/8 cloud, wind 1 NW, sea ripples
63 08/02/2012 09:35 12:35 0 Dry, sunny, 5/8 high cloud, hazy, wind 1 SW, glare, sea large ripples/wavelets
63 08/02/2012 09:35 12:35 30 Dry, sunny, 5/8 high cloud, hazy, wind 1 SW, glare, sea large ripples/wavelets
63 08/02/2012 09:35 12:35 60 Dry, sunny, 5/8 high cloud, hazy, wind 1 SW, glare, sea large ripples/wavelets
63 08/02/2012 09:35 12:35 90 1/2 W, Sea wavelets and swell
63 08/02/2012 09:35 12:35 120 2 W, Sea wavelets and swell, no glare
63 08/02/2012 09:35 12:35 150 2 W, Sea wavelets and swell, no glare
63 08/02/2012 09:35 12:35 180 2 W, Sea wavelets and swell, no glare
64 08/02/2012 12:40 15:40 0 Dry, 1/8 high cloud, wind 2 W, sea ripples and swell
64 08/02/2012 12:40 15:40 30 Dry, 1/8 high cloud, wind 2 W, sea ripples and swell
64 08/02/2012 12:40 15:40 60 Dry, 1/8 high cloud, wind 2 W, sea ripples and
swell
64 08/02/2012 12:40 15:40 90 Dry, 1/8 high cloud, wind 2 W, sea ripples, very little swell
64 08/02/2012 12:40 15:40 120 Dry, 1/8 high cloud, wind 2 W, sea ripples, very little swell
64 08/02/2012 12:40 15:40 150 Dry, 1/8 high cloud, wind 2 W, sea ripples, very little swell
64 08/02/2012 12:40 15:40 180 Dry, 1/8 high cloud, wind 2 W, sea ripples, very little swell
65 27/02/2012 09:50 12:50 0 Light rain, 8/8 cloud, wind 3 W, sea wavelets, occ white horses, vix OK but poor
65 27/02/2012 09:50 12:50 30 Light rain, 8/8 cloud, wind 3 W, sea wavelets, occ white horses, vix OK but poor
65 27/02/2012 09:50 12:50 60 Wind 3/4 W, rain heavier, sea occ white horses
65 27/02/2012 09:50 12:50 90 3 W, sea as above
65 27/02/2012 09:50 12:50 120 3 W, sea as above vis improving, sky clearing
65 27/02/2012 09:50 12:50 150 3 W, sea as above vis improving, sky clearing
65 27/02/2012 09:50 12:50 180 3 W, sea as above vis improving, sky clearing
66 27/02/2012 12:50 15:50 0 Dry, 8/8 cloud, wind 2/3 W, sea occ white horses
66 27/02/2012 12:50 15:50 30 Dry, 8/8 cloud, wind 2/3 W, sea occ white horses
66 27/02/2012 12:50 15:50 60 Dry, 8/8 cloud, wind 2/3 W, sea occ white horses
66 27/02/2012 12:50 15:50 90 Dry, 8/8 cloud, wind 2/3 W, sea occ white horses
66 27/02/2012 12:50 15:50 120 4+ W, numerous white horses
66 27/02/2012 12:50 15:50 150 4+ W, numerous white horses
66 27/02/2012 12:50 15:50 180 4+ W, numerous white horses
67 28/02/2012 09:30 12:30 0 Dry, 7/8 cloud, some glare, wind 4+ W, sea wavelets no white horses
67 28/02/2012 09:30 12:30 30 Dry, 7/8 cloud, some glare, wind 4+ W, sea wavelets occ white horses
67 28/02/2012 09:30 12:30 60 3/4 W, wavelets, no white horses
67 28/02/2012 09:30 12:30 90 3/4 W, wavelets, no white horses
67 28/02/2012 09:30 12:30 120 3 W, occ white horses
67 28/02/2012 09:30 12:30 150 3 W, occ white horses

Appendices to Technical Appendix A7.1
Forthwind Demonstration Project
Page 11
Survey Date Start Finish Period Weather
67 28/02/2012 09:30 12:30 180 3 W, occ white horses
68 28/02/2012 12:35 15:35 0 Dry, 8/8 cloud, wind 3 W, sea wavelets, occ white horses
68 28/02/2012 12:35 15:35 30 2 W, no white horses
68 28/02/2012 12:35 15:35 60 3 W, occ white horses
68 28/02/2012 12:35 15:35 90 3 W, occ white horses
68 28/02/2012 12:35 15:35 120 3 W, occ white horses
68 28/02/2012 12:35 15:35 150 3 W, occ white horses
69 28/03/2012 10:00 13:00 0 Dry, hot, very sunny 1/8 cloud but slight haze, 30% glare, wind W1-2, sea small wavelets
69 28/03/2012 10:00 13:00 30 Dry, hot, very sunny 1/8 cloud but slight haze, 30% glare, wind W1-2, sea small wavelets
69 28/03/2012 10:00 13:00 60 Dry, hot, very sunny 1/8 cloud but slight haze, 30% glare, wind W1-2, sea small wavelets
69 28/03/2012 10:00 13:00 90 Cloud 3/8, Occ WH, glare to 50%
69 28/03/2012 10:00 13:00 120 Glare less, cloud 5/8 high, very sunny
69 28/03/2012 10:00 13:00 150 Wind W2-3, wavelets, no WH
69 28/03/2012 10:00 13:00 180 As above, 10% glare
70 28/03/2012 13:10 16:10 0 Dry, sunny, heat haze, very high temp 22-23 degrees, wind W3, sea wavelets
70 28/03/2012 13:10 16:10 30 Dry, sunny, heat haze, very high temp 22-23 degrees, wind W3, sea wavelets, occ WH
70 28/03/2012 13:10 16:10 60 Dry, sunny, heat haze, very high temp 22-23 degrees, wind W3, sea wavelets, occ WH, vis now very good
70 28/03/2012 13:10 16:10 90 Dry, sunny, heat haze, very high temp 22-23 degrees, wind W3, sea wavelets, occ WH, vis now very good
70 28/03/2012 13:10 16:10 120 W2, wavelets only
70 28/03/2012 13:10 16:10 150 W2, wavelets only
70 28/03/2012 13:10 16:10 180 W2, wavelets only, strong ripple
71 11/04/2012 09:10 12:10 0 Dry, 8/8 cloud, wind WSW1, sea slight ripple
71 11/04/2012 09:10 12:10 30 Wind S1
71 11/04/2012 09:10 12:10 60 Wind S1
71 11/04/2012 09:10 12:10 90 Wind S1
71 11/04/2012 09:10 12:10 120 Wind S1
71 11/04/2012 09:10 12:10 150 Wind S1
71 11/04/2012 09:10 12:10 180 Wind S1
72 11/04/2012 12:30 15:30 0 Dry, 7/8 cloud, wind 1-2, sea rippled
72 11/04/2012 12:30 15:30 30 Cloud 5/8
72 11/04/2012 12:30 15:30 60 Cloud 3/8
72 11/04/2012 12:30 15:30 90 Cloud 3/8
72 11/04/2012 12:30 15:30 120 Cloud 3/8
72 11/04/2012 12:30 15:30 150 Cloud 3/8
72 11/04/2012 12:30 15:30 180 Cloud 3/8
73 24/04/2012 10:00 13:00 0 Occasional showers, 8/8 cloud, wind E3, sea rippled
73 24/04/2012 10:00 13:00 30 Stronger ripple
73 24/04/2012 10:00 13:00 60 Stronger ripple
73 24/04/2012 10:00 13:00 90 Wind W2
73 24/04/2012 10:00 13:00 120 Wind W2
73 24/04/2012 10:00 13:00 150 Wind W2
73 24/04/2012 10:00 13:00 180 Wind W2
74 24/04/2012 13:10 16:10 0 Occasional showers, 7/8 cloud, wind SE2, sea wavelets
74 24/04/2012 13:10 16:10 30 Occasional showers, 7/8 cloud, wind SE2, sea
wavelets
74 24/04/2012 13:10 16:10 60 occasional WH
74 24/04/2012 13:10 16:10 90 Showers
74 24/04/2012 13:10 16:10 120 Dry, numerous WH

Appendices to Technical Appendix A7.1
Forthwind Ltd
Page 12
Survey Date Start Finish Period Weather
74 24/04/2012 13:10 16:10 150 Dry, numerous WH
74 24/04/2012 13:10 16:10 180 Dry, numerous WH
75 01/05/2012 09:15 12:15 0 Dry, 4/8 high cloud, sunny, wind E 4, sea wavelets and WH
75 01/05/2012 09:15 12:15 30 Dry, 4/8 high cloud, sunny, wind E 4, sea wavelets and WH
75 01/05/2012 09:15 12:15 60 Dry, 4/8 high cloud, sunny, wind E 4, sea wavelets and WH
75 01/05/2012 09:15 12:15 90 Some glare
75 01/05/2012 09:15 12:15 120 50% dispersed glare, vis poor
75 01/05/2012 09:15 12:15 150 50% dispersed glare, vis poor
75 01/05/2012 09:15 12:15 180 50% dispersed glare, vis poor
76 01/05/2012 12:30 15:30 0 Dry, sunny, 6/8 high cloud, some glare, wind E3, small wavelets no WH
76 01/05/2012 12:30 15:30 30 Glare decreasing
76 01/05/2012 12:30 15:30 60 No glare. Wind 3, sea wavelets
76 01/05/2012 12:30 15:30 90 No glare. Wind 3, sea wavelets
76 01/05/2012 12:30 15:30 120 Wind E4, Wavelets, some WH
76 01/05/2012 12:30 15:30 150 Wind E4, Wavelets, some WH
76 01/05/2012 12:30 15:30 180 Wind E4, Wavelets, some WH
77 01/06/2012 13:40 16:40 0 Dry, 2/8 cloud, wind SE 3, sea wavelets occasional WH
77 01/06/2012 13:40 16:40 30 Dry, 2/8 cloud, wind SE 3, sea wavelets occasional WH
77 01/06/2012 13:40 16:40 60 Dry, 2/8 cloud, wind SE 3, sea wavelets occasional WH
77 01/06/2012 13:40 16:40 90 Numerous white horses
77 01/06/2012 13:40 16:40 120 Wind SE4
77 01/06/2012 13:40 16:40 150 Wind SE4
77 01/06/2012 13:40 16:40 180 Wind SE4
78 01/06/2012 10:00 13:00 0 Dry, 7/8, wind E3, sea wavelets
78 01/06/2012 10:00 13:00 30 Dry, 7/8, wind E3, sea wavelets
78 01/06/2012 10:00 13:00 60 Dry, 7/8, wind E3, sea wavelets
78 01/06/2012 10:00 13:00 90 Dry, 7/8, wind E3, sea wavelets
78 01/06/2012 10:00 13:00 120 Dry, 7/8, wind E3, sea wavelets
78 01/06/2012 10:00 13:00 150 Dry, 7/8, wind E3, sea wavelets
78 01/06/2012 10:00 13:00 180 Dry, 7/8, wind E3, sea wavelets
79 05/06/2012 09:45 12:45 0 Dry, sunny, 6/8 high cloud, wind S1, sea ripples
79 05/06/2012 09:45 12:45 30 Dry, sunny, 6/8 high cloud, wind S1, sea ripples
79 05/06/2012 09:45 12:45 60 Dry, sunny, 6/8 high cloud, wind S1, sea ripples
79 05/06/2012 09:45 12:45 90 Wind 2
79 05/06/2012 09:45 12:45 120 Wind 2
79 05/06/2012 09:45 12:45 150 Wind 2
79 05/06/2012 09:45 12:45 180 Wind 2
80 05/06/2012 13:00 16:00 0 Dry, sunny, 4/8 cloud, wind SSW 2/3, sea small wavelets
80 05/06/2012 13:00 16:00 30 Dry, sunny, 4/8 cloud, wind SSW 2/3, sea small wavelets
80 05/06/2012 13:00 16:00 60 Wind 4 occ WH
80 05/06/2012 13:00 16:00 90 Wind 5 numerous WH
80 05/06/2012 13:00 16:00 120 Wind 5-6, SSE numerous WH
80 05/06/2012 13:00 16:00 150 Wind 5, SSE WH
80 05/06/2012 13:00 16:00 180 Wind 4-5 SSE WH

Appendices to Technical Appendix A7.1
Forthwind Demonstration Project
Page 13
1.2 Vantage Point Surveys
1.2.1 Target Species
Table A1.2 Target Species Flights
Species Date Time Duration Number
Percent in height bands 2 and 3
Arctic skua 26-Oct-11 12:37 50 2 0
Arctic skua 26-Oct-11 12:40 40 1 100
Arctic skua 01-Jun-12 10:47 40 1 0
Auk sp. 29-Jun-11 10:52 35 1 0
Auk sp. 29-Jun-11 11:29 35 1 0
Auk sp. 29-Jun-11 15:00 50 1 0
Auk sp. 29-Jun-11 15:13 30 1 0
Auk sp. 31-Aug-11 10:03 40 2 0
Auk sp. 31-Aug-11 10:42 45 1 0
Auk sp. 28-Oct-11 10:08 35 1 0
Auk sp. 28-Sep-11 14:52 45 1 0
Auk sp. 28-Sep-11 15:57 55 1 0
Auk sp. 27-Feb-12 10:27 50 1 0
Auk sp. 27-Feb-12 12:27 45 1 0
Auk sp. 15-Dec-11 12:13 40 1 0
Auk sp. 04-Oct-11 09:43 35 1 0
Auk sp. 04-Oct-11 09:46 50 2 0
Auk sp. 08-Feb-12 11:42 35 1 0
Auk sp. 16-Jun-10 10:20 38 2 0
Auk sp. 16-Jun-10 10:25 40 2 0
Auk sp. 16-Jun-10 10:37 60 1 0
Auk sp. 16-Jun-10 10:41 35 3 0
Auk sp. 16-Jun-10 10:42 40 3 0
Auk sp. 16-Jun-10 10:48 60 1 0
Auk sp. 16-Jun-10 11:06 45 1 0
Auk sp. 16-Jun-10 11:11 33 1 0
Auk sp. 20-Jul-10 11:01 25 1 0
Auk sp. 20-Jul-10 12:59 60 2 0
Auk sp. 20-Jul-10 14:17 65 7 0
Auk sp. 23-Apr-10 11:28 36 4 0
Auk sp. 25-May-10 09:50 45 1 0
Auk sp. 25-May-10 12:14 45 2 0
Auk sp. 26-Jun-10 09:56 50 2 0
Auk sp. 26-Jun-10 10:46 50 1 0
Auk sp. 26-Jun-10 11:26 30 1 0
Auk sp. 26-Jun-10 11:49 55 3 0
Auk sp. 26-Jun-10 11:51 50 2 0
Auk sp. 25-Jun-10 13:40 40 1 0

Appendices to Technical Appendix A7.1
Forthwind Ltd
Page 14
Species Date Time Duration Number
Percent in height bands 2 and 3
Auk sp. 25-Jun-10 13:56 52 1 0
Auk sp. 25-Jun-10 14:01 55 1 0
Auk sp. 25-Jun-10 14:40 50 1 0
Auk sp. 25-Jun-10 15:16 25 1 0
Auk sp. 16-Jun-11 10:03 30 1 0
Auk sp. 16-Jun-11 10:04 30 1 0
Auk sp. 16-Jun-11 10:08 45 2 0
Auk sp. 16-Jun-11 10:10 40 6 0
Auk sp. 16-Jun-11 10:13 40 5 0
Auk sp. 16-Jun-11 10:23 35 2 0
Auk sp. 16-Jun-11 11:11 55 1 0
Auk sp. 16-Jun-11 11:17 40 1 0
Auk sp. 16-Jun-11 11:41 40 2 0
Auk sp. 16-Jun-11 12:00 40 4 0
Auk sp. 16-Jun-11 12:01 40 2 0
Auk sp. 16-Jun-11 12:20 40 8 0
Auk sp. 28-Mar-12 12:38 40 2 0
Auk sp. 28-Mar-12 13:25 40 2 0
Auk sp. 28-Mar-12 14:45 45 1 0
Auk sp. 28-Mar-12 15:04 45 1 0
Auk sp. 11-Apr-12 09:21 45 3 0
Auk sp. 11-Apr-12 09:23 40 1 0
Auk sp. 24-Apr-12 10:09 40 1 0
Auk sp. 24-Apr-12 13:23 45 1 0
Auk sp. 01-May-12 10:40 40 3 0
Auk sp. 01-May-12 11:18 45 2 0
Auk sp. 01-May-12 11:58 40 1 0
Auk sp. 01-May-12 12:06 40 1 0
Auk sp. 01-May-12 13:02 40 1 0
Auk sp. 01-May-12 13:04 40 1 0
Auk sp. 01-May-12 13:21 40 1 0
Auk sp. 01-May-12 13:32 45 1 0
Auk sp. 01-May-12 14:01 45 1 0
Auk sp. 01-May-12 14:31 45 1 0
Auk sp. 01-May-12 14:48 45 1 0
Auk sp. 01-May-12 14:54 45 1 0
Auk sp. 01-Jun-12 14:00 45 1 0
Auk sp. 01-Jun-12 16:21 45 2 0
Auk sp. 01-Jun-12 16:27 45 6 0
Auk sp. 01-Jun-12 10:10 35 1 0
Auk sp. 01-Jun-12 10:14 40 1 0
Auk sp. 01-Jun-12 10:15 40 2 0

Appendices to Technical Appendix A7.1
Forthwind Demonstration Project
Page 15
Species Date Time Duration Number
Percent in height bands 2 and 3
Auk sp. 01-Jun-12 10:20 40 1 0
Auk sp. 01-Jun-12 10:30 40 2 0
Auk sp. 01-Jun-12 10:37 40 1 0
Auk sp. 01-Jun-12 11:10 40 1 0
Auk sp. 01-Jun-12 11:45 40 1 0
Auk sp. 01-Jun-12 11:59 40 1 0
Auk sp. 01-Jun-12 11:59 40 1 0
Auk sp. 05-Jun-12 13:21 45 1 0
Auk sp. 05-Jun-12 13:29 45 1 0
Auk sp. 05-Jun-12 13:32 45 1 0
Auk sp. 05-Jun-12 13:38 45 1 0
Auk sp. 05-Jun-12 13:44 45 1 0
Auk sp. 05-Jun-12 13:47 45 3 0
Auk sp. 05-Jun-12 13:54 45 1 0
Auk sp. 05-Jun-12 14:04 45 2 0
Auk sp. 05-Jun-12 14:08 45 3 0
Auk sp. 05-Jun-12 14:09 45 1 0
Auk sp. 05-Jun-12 14:14 45 2 0
Auk sp. 05-Jun-12 14:32 45 1 0
Auk sp. 05-Jun-12 14:55 45 3 0
Auk sp. 05-Jun-12 15:49 45 1 0
Cormorant 28-Feb-12 11:38 55 1 0
Cormorant 29-Jun-11 10:30 10 1 0
Cormorant 29-Jun-11 10:58 35 1 0
Cormorant 29-Jun-11 12:14 18 1 0
Cormorant 29-Jun-11 13:08 25 1 0
Cormorant 29-Jun-11 13:18 35 1 0
Cormorant 29-Jun-11 14:10 30 1 0
Cormorant 29-Jun-11 14:37 20 1 0
Cormorant 29-Jun-11 15:10 30 1 0
Cormorant 29-Jun-11 15:29 25 1 0
Cormorant 29-Jun-11 15:48 40 1 0
Cormorant 31-Aug-11 10:02 20 2 0
Cormorant 31-Aug-11 10:17 35 1 0
Cormorant 31-Aug-11 10:39 5 3 100
Cormorant 31-Aug-11 12:17 40 2 0
Cormorant 31-Aug-11 13:05 20 1 0
Cormorant 31-Aug-11 13:31 40 2 0
Cormorant 31-Aug-11 14:06 45 1 0
Cormorant 31-Aug-11 14:12 45 1 0
Cormorant 31-Aug-11 14:59 35 1 0
Cormorant 27-Jan-12 13:31 35 1 0

Appendices to Technical Appendix A7.1
Forthwind Ltd
Page 16
Species Date Time Duration Number
Percent in height bands 2 and 3
Cormorant 27-Jan-12 14:10 35 1 0
Cormorant 27-Jan-12 14:40 40 1 0
Cormorant 27-Jan-12 15:32 35 1 0
Cormorant 27-Jan-12 15:40 35 1 0
Cormorant 28-Oct-11 11:07 10 1 0
Cormorant 28-Oct-11 13:27 40 1 0
Cormorant 28-Oct-11 13:31 15 1 0
Cormorant 28-Oct-11 15:38 35 1 0
Cormorant 27-Jan-12 10:24 20 1 0
Cormorant 27-Jan-12 11:08 20 1 0
Cormorant 27-Jan-12 12:04 25 1 0
Cormorant 27-Jan-12 12:09 45 1 0
Cormorant 25-Nov-11 10:23 25 1 0
Cormorant 25-Nov-11 10:41 40 1 0
Cormorant 25-Nov-11 10:53 25 1 0
Cormorant 25-Nov-11 10:58 25 1 100
Cormorant 26-Aug-11 12:04 42 1 0
Cormorant 26-Aug-11 13:35 30 1 0
Cormorant 26-Oct-11 10:01 40 1 0
Cormorant 26-Oct-11 10:32 40 1 0
Cormorant 26-Oct-11 10:53 50 1 100
Cormorant 26-Oct-11 12:09 40 2 0
Cormorant 26-Oct-11 12:17 40 1 0
Cormorant 26-Oct-11 12:19 35 1 0
Cormorant 26-Oct-11 12:19 45 1 0
Cormorant 26-Oct-11 12:33 45 1 0
Cormorant 26-Oct-11 12:42 45 7 0
Cormorant 26-Oct-11 13:19 35 1 0
Cormorant 26-Oct-11 13:22 25 1 0
Cormorant 26-Oct-11 14:32 35 1 0
Cormorant 26-Oct-11 14:36 40 1 0
Cormorant 26-Oct-11 14:38 40 1 0
Cormorant 26-Oct-11 15:14 40 1 0
Cormorant 26-Oct-11 15:19 45 1 0
Cormorant 26-Oct-11 15:38 45 1 0
Cormorant 26-Oct-11 15:40 40 1 0
Cormorant 27-Feb-12 10:40 30 1 0
Cormorant 27-Feb-12 11:54 20 1 0
Cormorant 15-Dec-11 12:27 20 1 0
Cormorant 16-Jun-11 14:40 30 1 0
Cormorant 20-Dec-11 12:21 50 1 0
Cormorant 20-Dec-11 12:30 40 1 0

Appendices to Technical Appendix A7.1
Forthwind Demonstration Project
Page 17
Species Date Time Duration Number
Percent in height bands 2 and 3
Cormorant 20-Dec-11 12:37 40 1 0
Cormorant 20-Dec-11 12:46 40 1 0
Cormorant 20-Dec-11 12:59 40 1 0
Cormorant 20-Dec-11 13:49 40 1 0
Cormorant 20-Dec-11 14:03 45 1 0
Cormorant 20-Dec-11 14:07 20 1 0
Cormorant 22-Dec-11 11:05 50 1 0
Cormorant 22-Dec-11 11:43 15 1 0
Cormorant 22-Dec-11 12:15 35 1 0
Cormorant 23-Nov-11 10:34 20 1 0
Cormorant 23-Nov-11 10:40 40 1 0
Cormorant 23-Nov-11 13:08 20 1 0
Cormorant 23-Nov-11 13:42 12 1 0
Cormorant 23-Nov-11 13:46 55 1 0
Cormorant 23-Nov-11 14:08 60 1 0
Cormorant 23-Nov-11 14:39 45 1 0
Cormorant 13-Jul-11 10:00 40 1 0
Cormorant 13-Jul-11 10:49 20 1 0
Cormorant 09-Aug-11 09:53 15 1 0
Cormorant 09-Aug-11 11:09 30 1 0
Cormorant 09-Aug-11 12:01 18 1 0
Cormorant 09-Aug-11 12:13 10 1 0
Cormorant 09-Aug-11 12:16 20 1 0
Cormorant 09-Aug-11 13:09 50 1 0
Cormorant 09-Aug-11 13:15 25 1 0
Cormorant 09-Aug-11 13:20 40 1 0
Cormorant 09-Aug-11 14:12 35 1 0
Cormorant 09-Aug-11 14:55 33 1 0
Cormorant 09-Aug-11 15:40 45 1 0
Cormorant 04-Oct-11 10:08 45 2 0
Cormorant 04-Oct-11 10:26 20 1 0
Cormorant 04-Oct-11 11:11 30 1 100
Cormorant 04-Oct-11 11:55 10 1 0
Cormorant 04-Oct-11 12:38 35 1 0
Cormorant 04-Oct-11 13:54 30 1 0
Cormorant 04-Oct-11 15:06 37 1 0
Cormorant 02-Dec-11 10:25 35 1 0
Cormorant 02-Dec-11 12:36 12 1 0
Cormorant 05-Jan-12 12:32 20 1 0
Cormorant 05-Jan-12 13:45 6 1 0
Cormorant 05-Jan-12 14:24 30 1 0
Cormorant 08-Feb-12 10:00 40 1 0

Appendices to Technical Appendix A7.1
Forthwind Ltd
Page 18
Species Date Time Duration Number
Percent in height bands 2 and 3
Cormorant 08-Feb-12 10:21 35 1 0
Cormorant 08-Feb-12 11:30 40 1 100
Cormorant 08-Feb-12 13:04 35 1 0
Cormorant 01-Mar-10 09:31 45 1 0
Cormorant 01-Mar-10 09:32 42 1 0
Cormorant 01-Mar-10 10:49 10 1 0
Cormorant 01-Mar-10 10:51 50 1 0
Cormorant 01-Mar-10 11:05 21 1 0
Cormorant 01-Mar-10 11:07 20 1 0
Cormorant 01-Mar-10 11:32 32 1 0
Cormorant 01-Mar-10 12:24 12 2 0
Cormorant 01-Mar-10 15:04 20 1 0
Cormorant 01-Mar-10 15:15 12 1 0
Cormorant 02-Feb-10 11:21 10 1 0
Cormorant 02-Feb-10 11:27 15 1 0
Cormorant 02-Feb-10 13:03 25 1 0
Cormorant 02-Mar-10 13:12 2 1 0
Cormorant 02-Mar-10 13:45 10 1 0
Cormorant 02-Mar-10 13:49 17 1 0
Cormorant 02-Mar-10 14:06 28 1 0
Cormorant 02-Mar-10 14:24 24 1 0
Cormorant 02-Mar-10 15:21 35 1 0
Cormorant 02-Mar-10 15:52 10 1 0
Cormorant 14-Apr-10 11:14 26 1 0
Cormorant 14-Apr-10 13:14 10 1 0
Cormorant 14-Apr-10 13:30 33 1 0
Cormorant 14-Apr-10 13:43 22 1 0
Cormorant 14-Apr-10 13:49 20 1 0
Cormorant 14-Apr-10 15:58 71 1 0
Cormorant 16-Jun-10 10:23 45 1 0
Cormorant 16-Jun-10 10:33 50 1 0
Cormorant 16-Jun-10 11:09 30 1 0
Cormorant 16-Jun-10 11:53 30 1 0
Cormorant 16-Jun-10 12:38 20 1 0
Cormorant 16-Mar-10 09:51 50 1 0
Cormorant 16-Mar-10 09:52 30 1 0
Cormorant 16-Mar-10 09:54 23 1 0
Cormorant 16-Mar-10 14:28 15 1 0
Cormorant 16-Mar-10 14:33 20 1 0
Cormorant 16-Mar-10 14:53 10 1 0
Cormorant 16-Mar-10 15:11 30 2 0
Cormorant 16-Mar-10 15:24 36 1 0
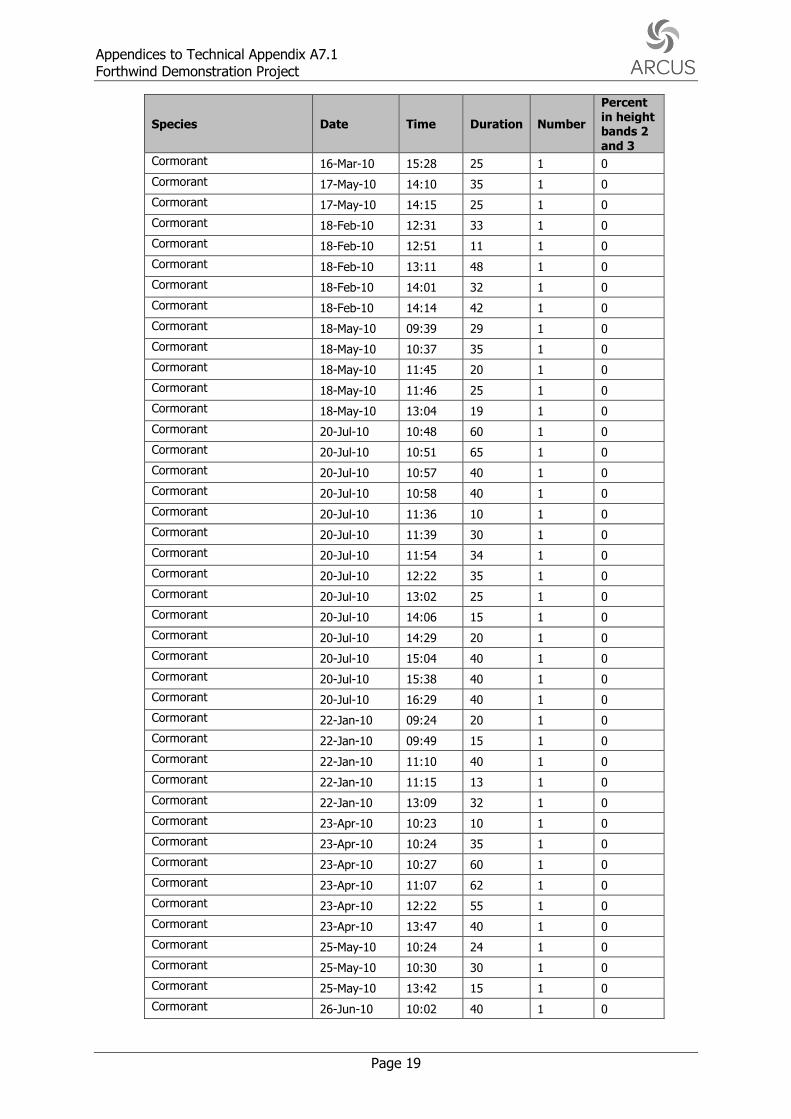
Appendices to Technical Appendix A7.1
Forthwind Demonstration Project
Page 19
Species Date Time Duration Number
Percent in height bands 2 and 3
Cormorant 16-Mar-10 15:28 25 1 0
Cormorant 17-May-10 14:10 35 1 0
Cormorant 17-May-10 14:15 25 1 0
Cormorant 18-Feb-10 12:31 33 1 0
Cormorant 18-Feb-10 12:51 11 1 0
Cormorant 18-Feb-10 13:11 48 1 0
Cormorant 18-Feb-10 14:01 32 1 0
Cormorant 18-Feb-10 14:14 42 1 0
Cormorant 18-May-10 09:39 29 1 0
Cormorant 18-May-10 10:37 35 1 0
Cormorant 18-May-10 11:45 20 1 0
Cormorant 18-May-10 11:46 25 1 0
Cormorant 18-May-10 13:04 19 1 0
Cormorant 20-Jul-10 10:48 60 1 0
Cormorant 20-Jul-10 10:51 65 1 0
Cormorant 20-Jul-10 10:57 40 1 0
Cormorant 20-Jul-10 10:58 40 1 0
Cormorant 20-Jul-10 11:36 10 1 0
Cormorant 20-Jul-10 11:39 30 1 0
Cormorant 20-Jul-10 11:54 34 1 0
Cormorant 20-Jul-10 12:22 35 1 0
Cormorant 20-Jul-10 13:02 25 1 0
Cormorant 20-Jul-10 14:06 15 1 0
Cormorant 20-Jul-10 14:29 20 1 0
Cormorant 20-Jul-10 15:04 40 1 0
Cormorant 20-Jul-10 15:38 40 1 0
Cormorant 20-Jul-10 16:29 40 1 0
Cormorant 22-Jan-10 09:24 20 1 0
Cormorant 22-Jan-10 09:49 15 1 0
Cormorant 22-Jan-10 11:10 40 1 0
Cormorant 22-Jan-10 11:15 13 1 0
Cormorant 22-Jan-10 13:09 32 1 0
Cormorant 23-Apr-10 10:23 10 1 0
Cormorant 23-Apr-10 10:24 35 1 0
Cormorant 23-Apr-10 10:27 60 1 0
Cormorant 23-Apr-10 11:07 62 1 0
Cormorant 23-Apr-10 12:22 55 1 0
Cormorant 23-Apr-10 13:47 40 1 0
Cormorant 25-May-10 10:24 24 1 0
Cormorant 25-May-10 10:30 30 1 0
Cormorant 25-May-10 13:42 15 1 0
Cormorant 26-Jun-10 10:02 40 1 0

Appendices to Technical Appendix A7.1
Forthwind Ltd
Page 20
Species Date Time Duration Number
Percent in height bands 2 and 3
Cormorant 26-Jun-10 10:17 18 1 0
Cormorant 26-Jun-10 11:07 30 1 0
Cormorant 26-Jun-10 11:31 56 1 0
Cormorant 26-Jun-10 12:03 16 1 0
Cormorant 25-Jun-10 13:10 10 1 100
Cormorant 25-Jun-10 15:19 16 1 0
Cormorant 25-Jun-10 15:52 55 1 0
Cormorant 26-Jan-10 12:20 25 1 0
Cormorant 26-Jan-10 13:08 22 2 0
Cormorant 26-Jul-10 10:24 60 1 0
Cormorant 26-Jul-10 10:33 35 1 0
Cormorant 26-Jul-10 10:34 30 1 0
Cormorant 26-Jul-10 10:44 25 1 0
Cormorant 26-Jul-10 11:17 35 1 0
Cormorant 26-Jul-10 11:20 35 1 0
Cormorant 26-Jul-10 11:36 30 1 0
Cormorant 26-Jul-10 11:42 30 1 0
Cormorant 26-Jul-10 12:31 45 1 0
Cormorant 26-Jul-10 12:39 20 1 0
Cormorant 26-Jul-10 12:51 20 1 0
Cormorant 26-Jul-10 14:21 30 1 0
Cormorant 26-Jul-10 14:29 25 1 0
Cormorant 26-Jul-10 14:35 55 1 0
Cormorant 26-Jul-10 14:43 55 1 0
Cormorant 26-Jul-10 15:01 45 1 0
Cormorant 26-Jul-10 15:20 25 1 0
Cormorant 26-Jul-10 15:28 42 1 0
Cormorant 26-Jul-10 15:29 25 1 0
Cormorant 26-Jul-10 16:17 24 1 0
Cormorant 26-Jul-10 16:24 30 1 0
Cormorant 26-Jul-10 16:27 40 1 0
Cormorant 29-Mar-10 10:12 20 1 0
Cormorant 29-Mar-10 10:42 20 1 0
Cormorant 29-Mar-10 10:49 55 1 0
Cormorant 08-Jan-10 11:50 50 1 0
Cormorant 08-Jan-10 12:21 17 1 0
Cormorant 16-Dec-09 11:24 11 1 0
Cormorant 16-Dec-09 12:13 23 1 0
Cormorant 16-Dec-09 12:30 12 1 0
Cormorant 14-Dec-09 13:56 22 1 0
Cormorant 14-Dec-09 14:41 22 1 0
Cormorant 16-Jun-11 09:57 10 1 0

Appendices to Technical Appendix A7.1
Forthwind Demonstration Project
Page 21
Species Date Time Duration Number
Percent in height bands 2 and 3
Cormorant 16-Jun-11 11:30 25 1 0
Cormorant 16-Jun-11 12:16 35 1 0
Cormorant 16-Jun-11 12:33 35 1 0
Cormorant 16-Jun-11 12:35 35 1 0
Cormorant 28-Mar-12 10:27 45 1 0
Cormorant 28-Mar-12 12:49 12 1 0
Cormorant 28-Mar-12 13:32 50 1 0
Cormorant 28-Mar-12 13:59 20 1 0
Cormorant 28-Mar-12 15:14 45 1 0
Cormorant 11-Apr-12 09:30 40 1 0
Cormorant 11-Apr-12 09:54 40 1 0
Cormorant 11-Apr-12 10:49 15 1 0
Cormorant 11-Apr-12 11:02 20 1 0
Cormorant 11-Apr-12 11:23 45 1 0
Cormorant 11-Apr-12 11:44 45 1 0
Cormorant 11-Apr-12 12:39 25 1
Cormorant 11-Apr-12 13:10 40 1
Cormorant 11-Apr-12 13:39 45 1
Cormorant 11-Apr-12 14:08 25 1
Cormorant 24-Apr-12 10:00 45 1 0
Cormorant 24-Apr-12 10:02 45 1 0
Cormorant 24-Apr-12 10:37 60 1 0
Cormorant 24-Apr-12 11:36 55 1 0
Cormorant 24-Apr-12 12:42 35 1 0
Cormorant 24-Apr-12 14:01 55 1 0
Cormorant 24-Apr-12 14:30 30 1 0
Cormorant 24-Apr-12 14:45 55 1 0
Cormorant 01-May-12 09:21 15 1 0
Cormorant 01-May-12 09:30 25 1 0
Cormorant 01-May-12 12:36 21 1 0
Cormorant 01-May-12 13:17 25 1 100
Cormorant 01-May-12 15:28 35 1 0
Cormorant 01-Jun-12 13:52 45 1 0
Cormorant 01-Jun-12 14:02 45 2 0
Cormorant 01-Jun-12 10:43 45 1 0
Cormorant 01-Jun-12 10:47 45 1 0
Cormorant 01-Jun-12 11:37 45 1 0
Cormorant 01-Jun-12 11:40 10 1 0
Cormorant 05-Jun-12 09:49 45 1 0
Cormorant 05-Jun-12 10:21 45 1 0
Cormorant 05-Jun-12 10:46 15 1 0
Cormorant 05-Jun-12 10:52 45 1 0

Appendices to Technical Appendix A7.1
Forthwind Ltd
Page 22
Species Date Time Duration Number
Percent in height bands 2 and 3
Cormorant 05-Jun-12 13:11 50 1 0
Cormorant 05-Jun-12 13:45 40 1 0
Cormorant 05-Jun-12 14:02 45 1 0
Cormorant 05-Jun-12 14:39 45 1 0
Cormorant 05-Jun-12 14:50 50 1 0
Curlew 28-Feb-12 12:40 30 1 0
Curlew 13-Jul-11 14:41 35 2 100
Curlew 13-Jul-11 10:56 45 1 0
Curlew 08-Feb-12 10:06 40 1 0
Curlew 01-Mar-10 10:54 15 1 0
Curlew 16-Mar-10 10:48 15 1 0
Curlew 25-Jun-10 15:14 65 2 0
Curlew 26-Jul-10 15:47 30 3 0
Curlew 08-Jan-10 13:35 15 6 100
Curlew 28-Mar-12 10:41 40 1 100
Curlew 11-Apr-12 11:21 40 1 100
Curlew 01-May-12 11:11 50 1 0
Common Scoter 29-Jun-11 14:02 45 7 0
Common Scoter 27-Feb-12 14:02 70 12 0
Common Scoter 28-Oct-11 10:19 35 1 0
Common Scoter 28-Oct-11 12:03 25 1 0
Common Scoter 28-Oct-11 14:51 35 1 0
Common Scoter 28-Sep-11 11:37 40 1 0
Common Scoter 27-Jan-12 12:09 40 1 0
Common Scoter 26-Oct-11 10:17 40 7 0
Common Scoter 26-Oct-11 11:29 50 3 0
Common Scoter 26-Oct-11 11:51 40 1 100
Common Scoter 26-Oct-11 13:43 35 3 0
Common Scoter 26-Oct-11 13:45 40 1 0
Common Scoter 26-Oct-11 13:53 40 1 0
Common Scoter 26-Oct-11 13:55 40 2 0
Common Scoter 27-Feb-12 10:10 45 6 0
Common Scoter 13-Jul-11 14:07 40 25 0
Common Scoter 15-Dec-11 14:03 40 17 0
Common Scoter 16-Jun-11 13:50 30 6 0
Common Scoter 20-Dec-11 11:48 50 1 0
Common Scoter 20-Dec-11 11:53 45 1 0
Common Scoter 22-Dec-11 11:07 40 1 0
Common Scoter 23-Nov-11 09:31 40 5 0
Common Scoter 23-Nov-11 10:27 75 5 0
Common Scoter 23-Nov-11 11:00 35 3 0
Common Scoter 23-Nov-11 11:47 30 2 100

Appendices to Technical Appendix A7.1
Forthwind Demonstration Project
Page 23
Species Date Time Duration Number
Percent in height bands 2 and 3
Common Scoter 23-Nov-11 11:55 60 5 0
Common Scoter 23-Nov-11 15:06 70 1 0
Common Scoter 02-Dec-11 10:51 45 1 0
Common Scoter 02-Dec-11 11:18 45 15 0
Common Scoter 08-Feb-12 10:54 40 8 0
Common Scoter 01-Mar-10 10:30 20 1 0
Common Scoter 01-Mar-10 13:48 15 1 0
Common Scoter 01-Mar-10 15:30 20 1 0
Common Scoter 02-Feb-10 11:58 22 1 0
Common Scoter 02-Mar-10 14:09 33 1 0
Common Scoter 14-Apr-10 11:08 35 3 0
Common Scoter 14-Apr-10 11:13 45 1 0
Common Scoter 14-Apr-10 11:43 15 1 0
Common Scoter 14-Apr-10 12:25 25 1 0
Common Scoter 14-Apr-10 13:40 27 4 0
Common Scoter 14-Apr-10 14:23 10 5 0
Common Scoter 16-Mar-10 10:58 43 1 0
Common Scoter 16-Mar-10 11:24 40 2 0
Common Scoter 16-Mar-10 11:28 35 1 0
Common Scoter 16-Mar-10 11:51 35 1 0
Common Scoter 16-Mar-10 11:58 30 1 0
Common Scoter 16-Mar-10 13:26 35 3 0
Common Scoter 16-Mar-10 13:32 45 7 0
Common Scoter 16-Mar-10 13:51 40 13 0
Common Scoter 16-Mar-10 14:12 25 4 0
Common Scoter 16-Mar-10 14:16 15 4 0
Common Scoter 16-Mar-10 15:01 5 1 0
Common Scoter 16-Mar-10 15:15 33 6 0
Common Scoter 16-Mar-10 15:46 47 4 0
Common Scoter 18-Feb-10 13:08 38 4 0
Common Scoter 18-May-10 10:29 30 20 0
Common Scoter 22-Jan-10 09:48 20 1 0
Common Scoter 22-Jan-10 14:49 20 5 0
Common Scoter 25-May-10 09:34 45 35 0
Common Scoter 25-Jun-10 13:55 43 1 0
Common Scoter 26-Jan-10 12:53 50 1 0
Common Scoter 29-Mar-10 10:36 48 1 0
Common Scoter 14-Dec-09 13:26 22 1 0
Common Scoter 16-Jun-11 12:26 35 10 0
Common Scoter 28-Mar-12 12:10 45 2 0
Common Scoter 28-Mar-12 14:05 40 1 0
Common Scoter 11-Apr-12 09:45 35 3 0
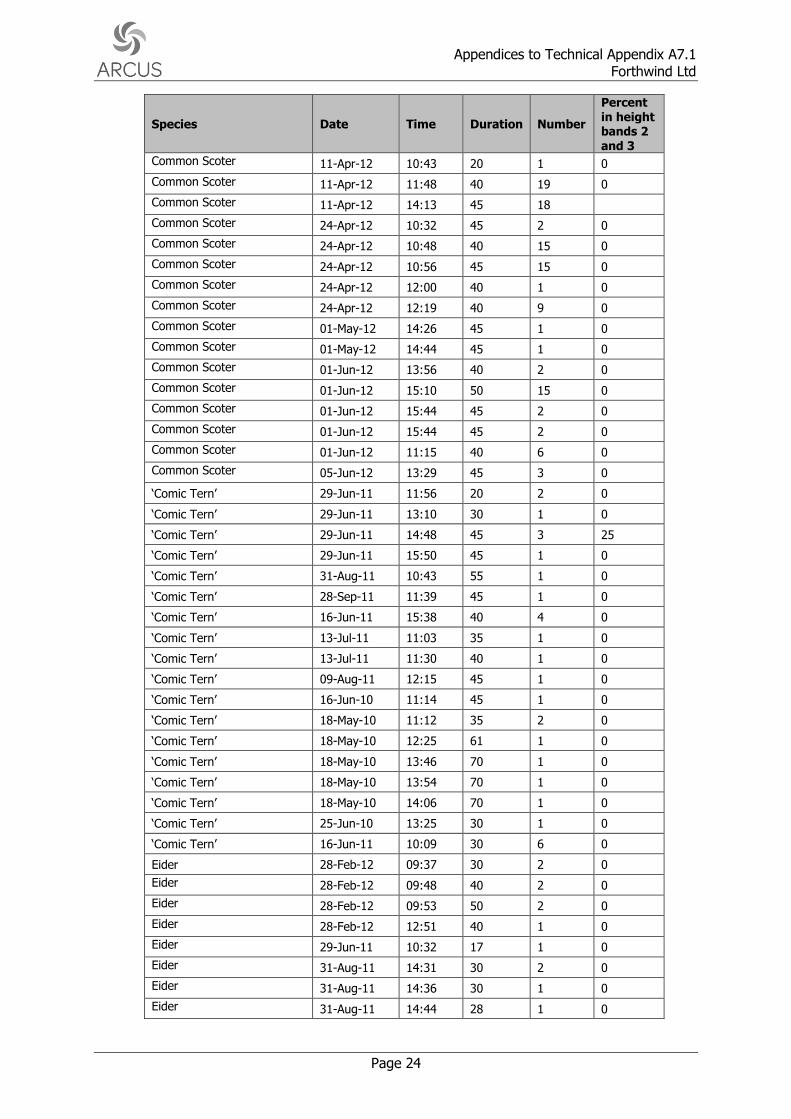
Appendices to Technical Appendix A7.1
Forthwind Ltd
Page 24
Species Date Time Duration Number
Percent in height bands 2 and 3
Common Scoter 11-Apr-12 10:43 20 1 0
Common Scoter 11-Apr-12 11:48 40 19 0
Common Scoter 11-Apr-12 14:13 45 18
Common Scoter 24-Apr-12 10:32 45 2 0
Common Scoter 24-Apr-12 10:48 40 15 0
Common Scoter 24-Apr-12 10:56 45 15 0
Common Scoter 24-Apr-12 12:00 40 1 0
Common Scoter 24-Apr-12 12:19 40 9 0
Common Scoter 01-May-12 14:26 45 1 0
Common Scoter 01-May-12 14:44 45 1 0
Common Scoter 01-Jun-12 13:56 40 2 0
Common Scoter 01-Jun-12 15:10 50 15 0
Common Scoter 01-Jun-12 15:44 45 2 0
Common Scoter 01-Jun-12 15:44 45 2 0
Common Scoter 01-Jun-12 11:15 40 6 0
Common Scoter 05-Jun-12 13:29 45 3 0
‘Comic Tern’ 29-Jun-11 11:56 20 2 0
‘Comic Tern’ 29-Jun-11 13:10 30 1 0
‘Comic Tern’ 29-Jun-11 14:48 45 3 25
‘Comic Tern’ 29-Jun-11 15:50 45 1 0
‘Comic Tern’ 31-Aug-11 10:43 55 1 0
‘Comic Tern’ 28-Sep-11 11:39 45 1 0
‘Comic Tern’ 16-Jun-11 15:38 40 4 0
‘Comic Tern’ 13-Jul-11 11:03 35 1 0
‘Comic Tern’ 13-Jul-11 11:30 40 1 0
‘Comic Tern’ 09-Aug-11 12:15 45 1 0
‘Comic Tern’ 16-Jun-10 11:14 45 1 0
‘Comic Tern’ 18-May-10 11:12 35 2 0
‘Comic Tern’ 18-May-10 12:25 61 1 0
‘Comic Tern’ 18-May-10 13:46 70 1 0
‘Comic Tern’ 18-May-10 13:54 70 1 0
‘Comic Tern’ 18-May-10 14:06 70 1 0
‘Comic Tern’ 25-Jun-10 13:25 30 1 0
‘Comic Tern’ 16-Jun-11 10:09 30 6 0
Eider 28-Feb-12 09:37 30 2 0
Eider 28-Feb-12 09:48 40 2 0
Eider 28-Feb-12 09:53 50 2 0
Eider 28-Feb-12 12:51 40 1 0
Eider 29-Jun-11 10:32 17 1 0
Eider 31-Aug-11 14:31 30 2 0
Eider 31-Aug-11 14:36 30 1 0
Eider 31-Aug-11 14:44 28 1 0

Appendices to Technical Appendix A7.1
Forthwind Demonstration Project
Page 25
Species Date Time Duration Number
Percent in height bands 2 and 3
Eider 27-Feb-12 14:41 35 2 0
Eider 27-Jan-12 13:03 40 1 0
Eider 27-Jan-12 14:25 40 4 0
Eider 27-Jan-12 15:31 35 1 0
Eider 28-Oct-11 10:52 45 2 0
Eider 28-Oct-11 12:04 35 1 0
Eider 27-Jan-12 10:09 45 3 0
Eider 27-Jan-12 10:26 40 1 0
Eider 27-Jan-12 10:51 35 2 0
Eider 27-Jan-12 10:53 30 1 0
Eider 27-Jan-12 11:17 15 1 0
Eider 27-Jan-12 11:51 45 2 0
Eider 27-Jan-12 11:58 50 1 0
Eider 25-Nov-11 11:56 60 1 0
Eider 25-Nov-11 12:05 25 1 0
Eider 26-Oct-11 13:38 50 1 0
Eider 26-Oct-11 14:18 30 1 0
Eider 26-Oct-11 14:27 30 1 0
Eider 26-Oct-11 15:45 50 2 0
Eider 15-Dec-11 14:43 40 1 0
Eider 16-Jun-11 13:24 34 1 0
Eider 20-Dec-11 12:48 35 1 0
Eider 20-Dec-11 12:50 35 2 0
Eider 20-Dec-11 13:13 40 1 0
Eider 20-Dec-11 14:02 40 1 0
Eider 22-Dec-11 11:26 45 2 0
Eider 23-Nov-11 10:35 35 2 0
Eider 23-Nov-11 10:40 50 1 0
Eider 23-Nov-11 10:43 30 1 0
Eider 23-Nov-11 14:41 55 1 0
Eider 04-Oct-11 09:36 40 3 0
Eider 04-Oct-11 12:57 35 1 0
Eider 02-Dec-11 10:30 40 1 0
Eider 02-Dec-11 10:44 35 1 0
Eider 02-Dec-11 10:54 45 1 0
Eider 02-Dec-11 10:55 35 1 0
Eider 02-Dec-11 11:16 40 3 0
Eider 02-Dec-11 11:38 25 2 0
Eider 02-Dec-11 11:53 40 2 0
Eider 02-Dec-11 12:38 35 4 0
Eider 02-Dec-11 12:59 40 1 0
Eider 02-Dec-11 13:02 50 2 0

Appendices to Technical Appendix A7.1
Forthwind Ltd
Page 26
Species Date Time Duration Number
Percent in height bands 2 and 3
Eider 05-Jan-12 12:00 10 3 0
Eider 05-Jan-12 13:06 18 1 0
Eider 08-Feb-12 10:03 40 2 0
Eider 08-Feb-12 10:04 45 1 0
Eider 08-Feb-12 11:31 40 2 0
Eider 08-Feb-12 13:29 20 1 0
Eider 01-Mar-10 14:12 5 2 0
Eider 01-Mar-10 14:43 22 3 0
Eider 01-Mar-10 14:47 47 1 0
Eider 01-Mar-10 14:53 30 1 0
Eider 02-Feb-10 11:18 35 1 0
Eider 02-Feb-10 11:22 16 1 0
Eider 02-Feb-10 11:44 26 1 0
Eider 14-Apr-10 11:04 22 1 0
Eider 14-Apr-10 13:15 30 2 0
Eider 14-Apr-10 13:33 38 2 0
Eider 16-Mar-10 09:48 35 2 0
Eider 16-Mar-10 09:52 85 2 0
Eider 16-Mar-10 10:31 40 2 0
Eider 16-Mar-10 11:45 40 1 0
Eider 16-Mar-10 13:10 40 1 0
Eider 16-Mar-10 15:35 30 1 0
Eider 17-May-10 16:04 28 1 0
Eider 18-Feb-10 11:35 35 1 0
Eider 18-Feb-10 11:52 20 1 0
Eider 18-Feb-10 12:00 15 1 0
Eider 18-May-10 09:37 24 1 0
Eider 18-May-10 10:46 46 1 0
Eider 22-Jan-10 11:12 47 2 0
Eider 22-Jan-10 13:47 50 1 0
Eider 23-Apr-10 10:36 12 1 0
Eider 23-Apr-10 10:39 20 1 0
Eider 23-Apr-10 12:41 30 1 0
Eider 23-Apr-10 14:43 32 2 0
Eider 25-May-10 09:36 55 1 0
Eider 26-Jan-10 11:56 20 2 0
Eider 26-Jan-10 12:48 42 1 0
Eider 26-Jan-10 13:15 75 1 0
Eider 26-Jan-10 13:40 50 1 0
Eider 26-Jan-10 13:49 30 1 0
Eider 26-Jan-10 14:18 20 1 0
Eider 29-Mar-10 09:52 45 2 0

Appendices to Technical Appendix A7.1
Forthwind Demonstration Project
Page 27
Species Date Time Duration Number
Percent in height bands 2 and 3
Eider 29-Mar-10 09:53 48 1 0
Eider 29-Mar-10 10:04 16 1 0
Eider 08-Jan-10 11:56 12 2 0
Eider 08-Jan-10 11:58 25 1 0
Eider 08-Jan-10 12:45 35 2 0
Eider 15-Dec-09 11:32 20 2 0
Eider 15-Dec-09 11:47 23 1 0
Eider 15-Dec-09 12:19 5 1 0
Eider 15-Dec-09 13:42 24 1 0
Eider 15-Dec-09 14:05 27 1 0
Eider 16-Dec-09 11:10 32 1 0
Eider 16-Dec-09 11:55 25 1 0
Eider 16-Dec-09 12:06 44 2 0
Eider 14-Dec-09 13:46 30 2 0
Eider 14-Dec-09 14:51 8 10 0
Eider 28-Mar-12 10:48 10 1 0
Eider 28-Mar-12 13:36 45 2 0
Eider 11-Apr-12 09:32 25 2 0
Eider 11-Apr-12 11:11 40 2 0
Eider 11-Apr-12 11:23 40 2 0
Eider 11-Apr-12 11:39 20 2 0
Eider 11-Apr-12 12:41 35 3
Eider 11-Apr-12 14:34 40 2
Eider 01-May-12 11:53 40 2 0
Eider 01-May-12 13:07 40 1 0
Eider 01-May-12 14:10 40 1 0
Eider 05-Jun-12 10:48 40 1 0
Fulmar 29-Jun-11 14:14 40 1 100
Fulmar 29-Jun-11 15:38 45 1 0
Fulmar 29-Jun-11 15:44 50 1 0
Fulmar 31-Aug-11 12:12 45 1 0
Fulmar 28-Sep-11 11:30 30 1 0
Fulmar 26-Aug-11 14:20 65 1 0
Fulmar 16-Jun-11 15:35 25 1 0
Fulmar 09-Aug-11 09:59 35 1 0
Fulmar 14-Apr-10 11:42 40 1 0
Fulmar 14-Apr-10 12:28 35 1 0
Fulmar 14-Apr-10 14:24 25 1 100
Fulmar 16-Jun-10 12:27 20 1 100
Fulmar 16-Mar-10 10:08 50 1 0
Fulmar 16-Mar-10 13:48 33 1 0
Fulmar 17-Jun-10 15:45 50 1 0

Appendices to Technical Appendix A7.1
Forthwind Ltd
Page 28
Species Date Time Duration Number
Percent in height bands 2 and 3
Fulmar 17-May-10 14:52 45 1 0
Fulmar 17-May-10 15:11 35 1 0
Fulmar 17-May-10 15:59 5 1 0
Fulmar 18-Feb-10 11:39 32 1 0
Fulmar 18-May-10 10:59 30 1 100
Fulmar 18-May-10 11:14 35 1 100
Fulmar 18-May-10 11:50 20 1 100
Fulmar 18-May-10 12:09 40 1 100
Fulmar 18-May-10 14:09 40 2 0
Fulmar 18-May-10 14:50 75 1 0
Fulmar 18-May-10 15:40 55 1 0
Fulmar 20-Jul-10 12:31 40 1 0
Fulmar 23-Apr-10 11:17 36 1 0
Fulmar 23-Apr-10 12:40 35 1 0
Fulmar 23-Apr-10 14:37 35 1 0
Fulmar 23-Apr-10 14:40 40 1 0
Fulmar 25-May-10 09:57 40 1 0
Fulmar 25-May-10 10:00 28 1 0
Fulmar 25-May-10 15:25 50 1 0
Fulmar 25-Jun-10 13:53 55 1 0
Fulmar 26-Jul-10 12:08 45 1 0
Fulmar 16-Jun-11 12:09 35 1 0
Fulmar 11-Apr-12 09:29 40 1 0
Fulmar 01-Jun-12 13:50 40 1 0
Fulmar 01-Jun-12 15:45 45 1 0
Fulmar 01-Jun-12 15:45 45 1 0
Fulmar 01-Jun-12 16:22 45 1 0
Fulmar 01-Jun-12 10:40 45 1 0
Fulmar 01-Jun-12 10:42 45 2 0
Fulmar 01-Jun-12 10:43 45 1 0
Fulmar 01-Jun-12 10:50 40 1 0
Fulmar 01-Jun-12 10:58 45 1 0
Fulmar 01-Jun-12 10:58 45 1 0
Fulmar 01-Jun-12 11:30 45 2 0
Fulmar 01-Jun-12 11:33 45 1 0
Fulmar 01-Jun-12 12:33 40 1 0
Fulmar 01-Jun-12 12:40 45 1 0
Fulmar 01-Jun-12 12:48 45 1 0
Fulmar 05-Jun-12 10:35 45 1 0
Fulmar 05-Jun-12 13:12 45 1 0
Greylag goose 23-Apr-10 11:52 30 27 0
Greylag goose 23-Apr-10 13:49 20 27 100

Appendices to Technical Appendix A7.1
Forthwind Demonstration Project
Page 29
Species Date Time Duration Number
Percent in height bands 2 and 3
Greylag goose 05-Jun-12 10:36 50 20 0
Goldeneye 22-Jan-10 09:54 29 2 0
Goldeneye 22-Jan-10 10:11 25 4 0
Goldeneye 22-Jan-10 13:24 35 1 0
Goldeneye 26-Jul-10 11:52 30 1 100
Guillemot 29-Jun-11 15:27 40 1 0
Guillemot 31-Aug-11 13:17 40 3 0
Guillemot 31-Aug-11 15:35 35 2 0
Guillemot 28-Sep-11 14:02 23 1 0
Guillemot 26-Aug-11 09:54 30 1 0
Guillemot 26-Aug-11 14:58 40 1 0
Guillemot 27-Feb-12 11:51 35 2 0
Guillemot 04-Oct-11 09:31 45 2 0
Guillemot 04-Oct-11 09:38 45 1 0
Guillemot 16-Jun-11 10:55 40 1 0
Guillemot 28-Mar-12 12:51 40 2 0
Guillemot 11-Apr-12 14:50 40 2
Guillemot 01-May-12 09:58 40 2 0
Guillemot 05-Jun-12 12:02 45 1 0
Guillemot 05-Jun-12 12:27 25 1 0
Guillemot 05-Jun-12 13:28 45 1 0
Guillemot 05-Jun-12 13:33 40 2 0
Guillemot 05-Jun-12 13:49 40 5 0
Guillemot 05-Jun-12 15:19 45 3 0
Gannet 01-Mar-10 09:33 35 1 0
Gannet 01-Mar-10 10:08 10 1 0
Gannet 01-Mar-10 10:09 12 1 0
Gannet 01-Mar-10 10:26 44 1 0
Gannet 01-Mar-10 11:20 20 1 0
Gannet 01-Mar-10 11:30 16 1 0
Gannet 01-Mar-10 11:42 25 1 0
Gannet 01-Mar-10 11:49 35 1 0
Gannet 01-Mar-10 11:53 30 1 0
Gannet 01-Mar-10 12:08 21 1 0
Gannet 01-Mar-10 12:14 29 1 0
Gannet 01-Mar-10 12:21 30 2 66.66667
Gannet 01-Mar-10 13:08 31 1 0
Gannet 01-Mar-10 13:11 33 1 0
Gannet 01-Mar-10 13:15 45 2 0
Gannet 01-Mar-10 13:26 15 1 0
Gannet 01-Mar-10 13:34 40 3 0
Gannet 01-Mar-10 13:35 45 10 0

Appendices to Technical Appendix A7.1
Forthwind Ltd
Page 30
Species Date Time Duration Number
Percent in height bands 2 and 3
Gannet 01-Mar-10 13:37 17 2 0
Gannet 01-Mar-10 13:37 17 2 0
Gannet 01-Mar-10 13:38 26 1 0
Gannet 01-Mar-10 13:39 20 1 0
Gannet 01-Mar-10 13:41 32 1 0
Gannet 01-Mar-10 13:41 32 1 0
Gannet 01-Mar-10 14:22 28 1 50
Gannet 01-Mar-10 14:26 35 2 0
Gannet 01-Mar-10 14:39 27 2 0
Gannet 01-Mar-10 14:51 32 1 0
Gannet 01-Mar-10 14:55 23 1 0
Gannet 01-Mar-10 15:42 19 1 0
Gannet 02-Mar-10 13:25 30 1 0
Gannet 02-Mar-10 14:45 36 1 0
Gannet 02-Mar-10 14:52 30 1 0
Gannet 02-Mar-10 14:55 37 1 0
Gannet 14-Apr-10 11:01 45 2 0
Gannet 14-Apr-10 11:01 45 2 100
Gannet 14-Apr-10 11:02 40 1 0
Gannet 14-Apr-10 11:08 40 2 0
Gannet 16-Mar-10 09:46 65 1 0
Gannet 16-Mar-10 09:57 40 3 0
Gannet 16-Mar-10 10:01 35 1 100
Gannet 16-Mar-10 10:03 50 4 0
Gannet 16-Mar-10 10:47 26 2 100
Gannet 16-Mar-10 10:48 30 1 0
Gannet 16-Mar-10 11:00 26 1 0
Gannet 16-Mar-10 11:00 36 2 100
Gannet 16-Mar-10 11:06 30 2 0
Gannet 16-Mar-10 12:02 45 2 0
Gannet 16-Mar-10 12:04 50 1 100
Gannet 16-Mar-10 12:12 45 1 100
Gannet 16-Mar-10 12:18 25 1 100
Gannet 16-Mar-10 12:26 31 1 0
Gannet 16-Mar-10 12:26 31 2 100
Gannet 16-Mar-10 12:27 20 2 100
Gannet 16-Mar-10 12:29 35 1 0
Gannet 16-Mar-10 13:37 45 6 0
Gannet 16-Mar-10 13:45 21 1 0
Gannet 16-Mar-10 14:12 45 8 0
Gannet 16-Mar-10 14:28 40 1 100
Gannet 16-Mar-10 14:33 22 1 0

Appendices to Technical Appendix A7.1
Forthwind Demonstration Project
Page 31
Species Date Time Duration Number
Percent in height bands 2 and 3
Gannet 16-Mar-10 14:58 25 1 100
Gannet 16-Mar-10 15:05 25 1 0
Gannet 16-Mar-10 15:45 42 4 0
Gannet 16-Mar-10 15:56 30 1 0
Gannet 16-Mar-10 15:58 52 1 0
Gannet 18-Feb-10 14:04 30 2 0
Gannet 18-Feb-10 14:04 30 5 0
Gannet 29-Mar-10 10:00 40 1 100
Grey heron 25-Jun-10 15:05 50 1 100
Kittiwake 28-Feb-12 09:43 70 1 0
Kittiwake 29-Jun-11 10:25 10 1 100
Kittiwake 29-Jun-11 11:48 35 1 0
Kittiwake 29-Jun-11 11:50 20 1 0
Kittiwake 29-Jun-11 13:08 50 1 0
Kittiwake 29-Jun-11 13:16 50 1 100
Kittiwake 29-Jun-11 13:55 48 4 0
Kittiwake 29-Jun-11 14:37 50 1 0
Kittiwake 29-Jun-11 15:19 25 1 0
Kittiwake 29-Jun-11 15:34 30 1 100
Kittiwake 31-Aug-11 09:46 25 1 0
Kittiwake 31-Aug-11 10:09 55 1 0
Kittiwake 31-Aug-11 13:08 35 1 0
Kittiwake 31-Aug-11 13:09 35 1 100
Kittiwake 31-Aug-11 14:40 48 1 0
Kittiwake 27-Feb-12 13:39 50 2 0
Kittiwake 27-Feb-12 13:44 50 2 50
Kittiwake 28-Oct-11 11:13 70 1 0
Kittiwake 28-Oct-11 11:24 70 1 0
Kittiwake 28-Oct-11 11:37 70 1 0
Kittiwake 28-Oct-11 11:40 70 2 0
Kittiwake 28-Oct-11 14:04 30 1 100
Kittiwake 28-Oct-11 14:12 30 1 0
Kittiwake 28-Oct-11 14:53 50 1 0
Kittiwake 28-Oct-11 15:09 40 1 100
Kittiwake 28-Sep-11 15:10 1500 15 0
Kittiwake 28-Sep-11 15:52 1200 40 0
Kittiwake 25-Nov-11 10:44 70 1 0
Kittiwake 25-Nov-11 11:06 70 1 0
Kittiwake 25-Nov-11 11:44 70 1 0
Kittiwake 25-Nov-11 12:10 70 1 0

Appendices to Technical Appendix A7.1
Forthwind Ltd
Page 32
Species Date Time Duration Number
Percent in height bands 2 and 3
Kittiwake 25-Nov-11 12:50 70 1 0
Kittiwake 25-Nov-11 12:51 80 3 0
Kittiwake 25-Nov-11 12:56 80 2 0
Kittiwake 26-Aug-11 09:56 25 1 0
Kittiwake 26-Aug-11 10:25 45 1 0
Kittiwake 26-Aug-11 11:19 20 1 0
Kittiwake 26-Aug-11 11:44 44 1 0
Kittiwake 26-Aug-11 12:34 56 1 0
Kittiwake 26-Aug-11 12:43 51 1 0
Kittiwake 26-Aug-11 12:47 37 1 0
Kittiwake 26-Aug-11 13:33 45 1 100
Kittiwake 26-Aug-11 14:07 75 3 0
Kittiwake 26-Oct-11 10:07 65 2 0
Kittiwake 26-Oct-11 10:49 50 1 0
Kittiwake 26-Oct-11 12:31 40 1 0
Kittiwake 26-Oct-11 12:37 50 1 0
Kittiwake 26-Oct-11 12:38 50 5 0
Kittiwake 26-Oct-11 12:40 45 2 0
Kittiwake 26-Oct-11 13:15 40 4 0
Kittiwake 26-Oct-11 13:18 40 2 0
Kittiwake 26-Oct-11 13:51 40 1 0
Kittiwake 26-Oct-11 14:03 70 2 0
Kittiwake 26-Oct-11 14:05 45 1 100
Kittiwake 26-Oct-11 14:20 30 1 0
Kittiwake 26-Oct-11 14:32 31 1 100
Kittiwake 27-Feb-12 12:16 40 1 0
Kittiwake 13-Jul-11 14:19 35 1 0
Kittiwake 13-Jul-11 14:27 40 1 0
Kittiwake 13-Jul-11 14:29 35 1 0
Kittiwake 13-Jul-11 15:40 27 2 0
Kittiwake 15-Dec-11 12:08 70 3 0
Kittiwake 15-Dec-11 12:12 70 1 0
Kittiwake 15-Dec-11 12:15 70 2 0
Kittiwake 15-Dec-11 12:33 70 2 0
Kittiwake 15-Dec-11 12:40 70 1 0
Kittiwake 15-Dec-11 12:56 70 1 0
Kittiwake 15-Dec-11 13:00 95 1 0
Kittiwake 15-Dec-11 13:19 50 1 0
Kittiwake 15-Dec-11 13:22 70 2 0
Kittiwake 15-Dec-11 13:50 70 2 0

Appendices to Technical Appendix A7.1
Forthwind Demonstration Project
Page 33
Species Date Time Duration Number
Percent in height bands 2 and 3
Kittiwake 15-Dec-11 13:55 90 1 0
Kittiwake 16-Jun-11 13:06 45 4 0
Kittiwake 16-Jun-11 13:14 20 3 0
Kittiwake 16-Jun-11 13:15 20 3 0
Kittiwake 16-Jun-11 13:18 40 10 0
Kittiwake 16-Jun-11 13:21 40 3 0
Kittiwake 16-Jun-11 13:25 0 6 0
Kittiwake 16-Jun-11 13:33 40 8 0
Kittiwake 16-Jun-11 13:37 40 2 0
Kittiwake 16-Jun-11 13:39 40 7 0
Kittiwake 16-Jun-11 13:40 50 10 0
Kittiwake 16-Jun-11 14:50 40 1 0
Kittiwake 16-Jun-11 15:06 38 2 0
Kittiwake 16-Jun-11 15:06 40 1 0
Kittiwake 16-Jun-11 15:07 45 1 0
Kittiwake 16-Jun-11 15:10 40 2 0
Kittiwake 16-Jun-11 15:27 40 1 0
Kittiwake 16-Jun-11 15:39 40 4 0
Kittiwake 16-Jun-11 15:40 40 6 0
Kittiwake 16-Jun-11 15:41 40 1 0
Kittiwake 16-Jun-11 15:42 45 1 0
Kittiwake 16-Jun-11 15:48 30 2 0
Kittiwake 16-Jun-11 15:51 40 1 0
Kittiwake 16-Jun-11 15:53 28 2 0
Kittiwake 16-Jun-11 15:57 40 1 0
Kittiwake 20-Dec-11 12:46 130 2 0
Kittiwake 20-Dec-11 14:34 65 2 0
Kittiwake 22-Dec-11 11:38 55 1 0
Kittiwake 22-Dec-11 12:18 40 1 0
Kittiwake 23-Nov-11 10:14 80 5 0
Kittiwake 23-Nov-11 10:43 80 6 0
Kittiwake 13-Jul-11 09:52 35 1 0
Kittiwake 13-Jul-11 10:00 90 1 0
Kittiwake 13-Jul-11 10:05 60 2 0
Kittiwake 13-Jul-11 10:11 50 2 50
Kittiwake 13-Jul-11 10:15 60 3 0
Kittiwake 13-Jul-11 10:21 50 2 0
Kittiwake 13-Jul-11 10:23 60 2 0
Kittiwake 13-Jul-11 10:26 100 2 14.28571
Kittiwake 13-Jul-11 10:27 40 1 0
Kittiwake 13-Jul-11 10:27 60 1 0
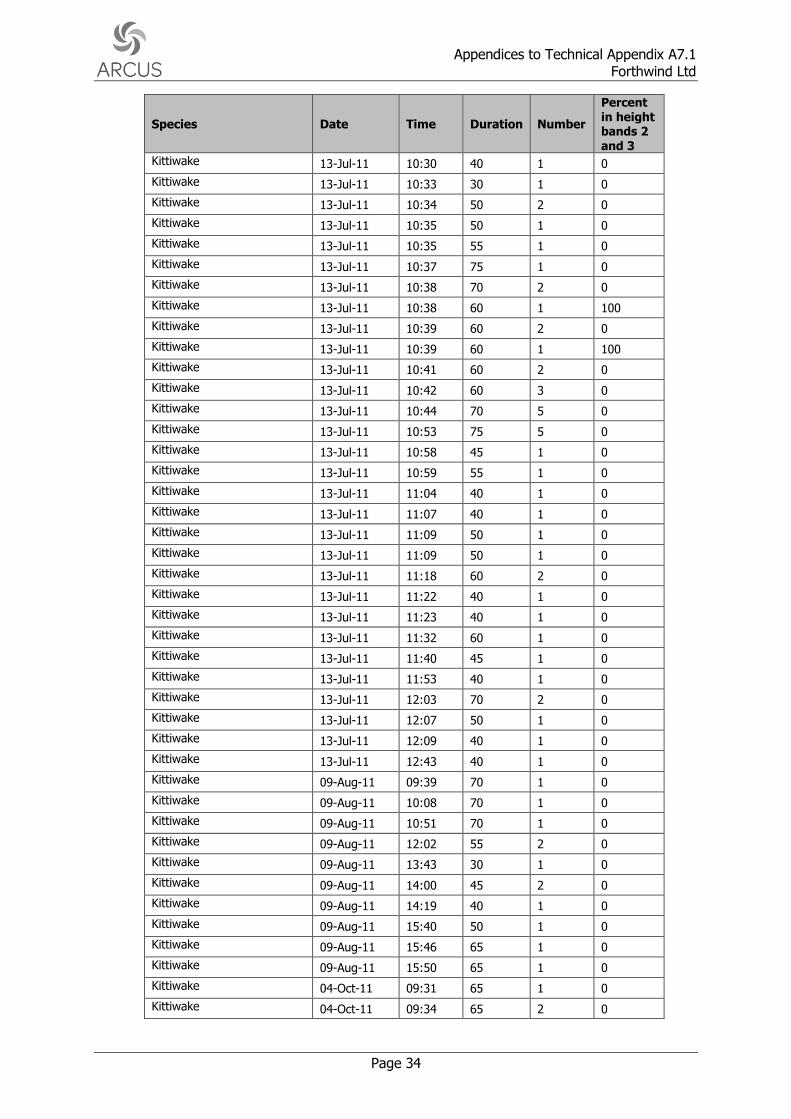
Appendices to Technical Appendix A7.1
Forthwind Ltd
Page 34
Species Date Time Duration Number
Percent in height bands 2 and 3
Kittiwake 13-Jul-11 10:30 40 1 0
Kittiwake 13-Jul-11 10:33 30 1 0
Kittiwake 13-Jul-11 10:34 50 2 0
Kittiwake 13-Jul-11 10:35 50 1 0
Kittiwake 13-Jul-11 10:35 55 1 0
Kittiwake 13-Jul-11 10:37 75 1 0
Kittiwake 13-Jul-11 10:38 70 2 0
Kittiwake 13-Jul-11 10:38 60 1 100
Kittiwake 13-Jul-11 10:39 60 2 0
Kittiwake 13-Jul-11 10:39 60 1 100
Kittiwake 13-Jul-11 10:41 60 2 0
Kittiwake 13-Jul-11 10:42 60 3 0
Kittiwake 13-Jul-11 10:44 70 5 0
Kittiwake 13-Jul-11 10:53 75 5 0
Kittiwake 13-Jul-11 10:58 45 1 0
Kittiwake 13-Jul-11 10:59 55 1 0
Kittiwake 13-Jul-11 11:04 40 1 0
Kittiwake 13-Jul-11 11:07 40 1 0
Kittiwake 13-Jul-11 11:09 50 1 0
Kittiwake 13-Jul-11 11:09 50 1 0
Kittiwake 13-Jul-11 11:18 60 2 0
Kittiwake 13-Jul-11 11:22 40 1 0
Kittiwake 13-Jul-11 11:23 40 1 0
Kittiwake 13-Jul-11 11:32 60 1 0
Kittiwake 13-Jul-11 11:40 45 1 0
Kittiwake 13-Jul-11 11:53 40 1 0
Kittiwake 13-Jul-11 12:03 70 2 0
Kittiwake 13-Jul-11 12:07 50 1 0
Kittiwake 13-Jul-11 12:09 40 1 0
Kittiwake 13-Jul-11 12:43 40 1 0
Kittiwake 09-Aug-11 09:39 70 1 0
Kittiwake 09-Aug-11 10:08 70 1 0
Kittiwake 09-Aug-11 10:51 70 1 0
Kittiwake 09-Aug-11 12:02 55 2 0
Kittiwake 09-Aug-11 13:43 30 1 0
Kittiwake 09-Aug-11 14:00 45 2 0
Kittiwake 09-Aug-11 14:19 40 1 0
Kittiwake 09-Aug-11 15:40 50 1 0
Kittiwake 09-Aug-11 15:46 65 1 0
Kittiwake 09-Aug-11 15:50 65 1 0
Kittiwake 04-Oct-11 09:31 65 1 0
Kittiwake 04-Oct-11 09:34 65 2 0

Appendices to Technical Appendix A7.1
Forthwind Demonstration Project
Page 35
Species Date Time Duration Number
Percent in height bands 2 and 3
Kittiwake 04-Oct-11 09:42 60 1 0
Kittiwake 04-Oct-11 09:46 65 1 0
Kittiwake 04-Oct-11 11:37 60 1 0
Kittiwake 04-Oct-11 12:14 65 1 0
Kittiwake 04-Oct-11 12:40 20 1 0
Kittiwake 04-Oct-11 12:57 60 1 0
Kittiwake 04-Oct-11 13:48 30 1 0
Kittiwake 02-Dec-11 12:59 60 1 0
Kittiwake 16-Jun-10 10:18 40 1 100
Kittiwake 16-Jun-10 10:25 45 1 0
Kittiwake 16-Jun-10 10:25 45 1 100
Kittiwake 16-Jun-10 11:07 40 1 0
Kittiwake 16-Jun-10 12:19 40 1 0
Kittiwake 16-Jun-10 12:32 45 1 0
Kittiwake 17-Jun-10 14:28 45 1 0
Kittiwake 17-Jun-10 15:17 38 1 0
Kittiwake 17-May-10 14:36 45 1 0
Kittiwake 18-May-10 11:40 25 1 0
Kittiwake 18-May-10 14:52 45 1 0
Kittiwake 18-May-10 15:01 66 2 0
Kittiwake 18-May-10 15:10 50 1 0
Kittiwake 18-May-10 15:32 45 2 0
Kittiwake 18-May-10 15:34 46 3 0
Kittiwake 20-Jul-10 10:23 40 1 0
Kittiwake 20-Jul-10 10:42 65 1 100
Kittiwake 20-Jul-10 12:56 45 1 0
Kittiwake 20-Jul-10 13:12 65 1 0
Kittiwake 20-Jul-10 13:57 35 1 0
Kittiwake 20-Jul-10 14:23 20 1 0
Kittiwake 20-Jul-10 14:40 55 2 0
Kittiwake 20-Jul-10 16:16 30 1 0
Kittiwake 20-Jul-10 16:40 55 1 0
Kittiwake 25-May-10 10:34 20 1 0
Kittiwake 25-May-10 10:46 55 1 0
Kittiwake 25-May-10 11:07 77 1 0
Kittiwake 25-May-10 13:23 25 1 0
Kittiwake 25-May-10 13:32 35 1 0
Kittiwake 25-May-10 13:51 45 2 0
Kittiwake 25-May-10 14:14 25 1 100
Kittiwake 25-May-10 14:30 35 2 0
Kittiwake 25-May-10 13:40 45 1 0
Kittiwake 25-May-10 13:41 30 1 0

Appendices to Technical Appendix A7.1
Forthwind Ltd
Page 36
Species Date Time Duration Number
Percent in height bands 2 and 3
Kittiwake 25-May-10 13:45 85 1 0
Kittiwake 25-May-10 15:22 20 1 0
Kittiwake 25-Jun-10 14:07 45 1 0
Kittiwake 25-Jun-10 14:58 26 1 0
Kittiwake 25-Jun-10 15:12 58 1 0
Kittiwake 25-Jun-10 15:25 40 1 0
Kittiwake 25-Jun-10 15:52 70 1 0
Kittiwake 25-Jun-10 15:59 55 1 0
Kittiwake 26-Jul-10 10:10 45 1 0
Kittiwake 26-Jul-10 10:33 70 1 0
Kittiwake 26-Jul-10 14:06 40 1 0
Kittiwake 16-Jun-11 09:59 25 2 0
Kittiwake 16-Jun-11 10:00 20 1 0
Kittiwake 16-Jun-11 10:26 40 1 0
Kittiwake 16-Jun-11 10:47 28 1 0
Kittiwake 16-Jun-11 11:03 30 1 0
Kittiwake 16-Jun-11 11:38 20 1 0
Kittiwake 28-Mar-12 10:44 60 2 0
Kittiwake 24-Apr-12 10:14 45 1 0
Kittiwake 24-Apr-12 13:18 40 1 0
Kittiwake 24-Apr-12 13:28 40 1 0
Kittiwake 01-May-12 09:44 50 2 0
Kittiwake 01-May-12 11:51 60 1 0
Kittiwake 01-May-12 13:09 45 1 0
Kittiwake 01-Jun-12 13:53 600 8 100
Kittiwake 01-Jun-12 13:56 70 1 0
Kittiwake 01-Jun-12 14:04 45 2 0
Kittiwake 01-Jun-12 14:11 70 10 0
Kittiwake 01-Jun-12 14:15 70 12 0
Kittiwake 01-Jun-12 14:19 70 6 0
Kittiwake 01-Jun-12 14:21 70 4 0
Kittiwake 01-Jun-12 14:34 70 6 0
Kittiwake 01-Jun-12 14:41 50 1 0
Kittiwake 01-Jun-12 14:44 45 11 0
Kittiwake 01-Jun-12 14:58 60 3 0
Kittiwake 01-Jun-12 15:03 50 2 0
Kittiwake 01-Jun-12 15:29 45 2 0
Kittiwake 01-Jun-12 15:32 60 1 0
Kittiwake 01-Jun-12 15:47 45 1 0
Kittiwake 01-Jun-12 15:59 50 1 0
Kittiwake 01-Jun-12 15:29 45 2 0
Kittiwake 01-Jun-12 15:32 60 1 0

Appendices to Technical Appendix A7.1
Forthwind Demonstration Project
Page 37
Species Date Time Duration Number
Percent in height bands 2 and 3
Kittiwake 01-Jun-12 15:47 45 1 0
Kittiwake 01-Jun-12 15:59 50 1 0
Kittiwake 01-Jun-12 16:22 45 2 0
Kittiwake 01-Jun-12 10:12 40 1 0
Kittiwake 01-Jun-12 10:23 40 1 0
Kittiwake 01-Jun-12 10:28 45 1 0
Kittiwake 01-Jun-12 10:31 45 2 0
Kittiwake 01-Jun-12 10:34 70 2 0
Kittiwake 01-Jun-12 10:40 45 2 0
Kittiwake 01-Jun-12 10:50 45 1 0
Kittiwake 01-Jun-12 10:52 70 4 100
Kittiwake 01-Jun-12 11:23 50 1 0
Kittiwake 01-Jun-12 11:40 45 1 0
Kittiwake 01-Jun-12 12:39 70 1 0
Kittiwake 01-Jun-12 12:46 300 6 0
Kittiwake 01-Jun-12 12:48 200 10 0
Kittiwake 05-Jun-12 09:55 70 2 0
Kittiwake 05-Jun-12 10:29 45 1 0
Kittiwake 05-Jun-12 11:10 55 1 0
Kittiwake 05-Jun-12 11:25 70 1 0
Kittiwake 05-Jun-12 12:17 50 1 0
Kittiwake 05-Jun-12 12:20 45 1 0
Kittiwake 05-Jun-12 12:24 50 3 0
Kittiwake 05-Jun-12 12:27 45 1 0
Kittiwake 05-Jun-12 12:29 45 2 0
Kittiwake 05-Jun-12 13:11 45 1 0
Kittiwake 05-Jun-12 13:22 45 1 0
Kittiwake 05-Jun-12 13:32 45 2 0
Kittiwake 05-Jun-12 13:43 40 1 0
Kittiwake 05-Jun-12 13:53 45 1 0
Kittiwake 05-Jun-12 14:13 50 1 100
Kittiwake 05-Jun-12 14:22 70 1 0
Kittiwake 05-Jun-12 15:35 50 1 0
Knot 27-Jan-12 13:08 40 3 0
Long-tailed duck 27-Feb-12 14:19 40 1 0
Long-tailed duck 27-Jan-12 12:52 35 2 0
Long-tailed duck 27-Jan-12 13:35 30 1 0
Long-tailed duck 27-Jan-12 14:00 35 1 0
Long-tailed duck 27-Jan-12 14:27 15 7 0
Long-tailed duck 27-Jan-12 15:42 15 1 0
Long-tailed duck 28-Oct-11 13:15 25 1 0
Long-tailed duck 28-Oct-11 13:43 25 1 0

Appendices to Technical Appendix A7.1
Forthwind Ltd
Page 38
Species Date Time Duration Number
Percent in height bands 2 and 3
Long-tailed duck 27-Jan-12 10:00 35 1 0
Long-tailed duck 27-Jan-12 10:06 10 1 0
Long-tailed duck 27-Jan-12 10:54 40 1 0
Long-tailed duck 27-Jan-12 11:49 40 1 0
Long-tailed duck 27-Jan-12 12:02 40 1 0
Long-tailed duck 27-Jan-12 12:12 35 1 0
Long-tailed duck 27-Jan-12 12:31 40 1 0
Long-tailed duck 27-Jan-12 12:38 40 1 0
Long-tailed duck 25-Nov-11 10:35 45 1 0
Long-tailed duck 25-Nov-11 11:44 45 1 0
Long-tailed duck 25-Nov-11 13:03 34 2 0
Long-tailed duck 26-Oct-11 15:54 35 1 0
Long-tailed duck 27-Feb-12 10:21 40 2 0
Long-tailed duck 27-Feb-12 10:25 10 2 0
Long-tailed duck 20-Dec-11 11:39 45 3 0
Long-tailed duck 20-Dec-11 11:43 30 1 0
Long-tailed duck 20-Dec-11 12:16 40 1 0
Long-tailed duck 20-Dec-11 13:06 40 1 0
Long-tailed duck 20-Dec-11 14:12 25 1 0
Long-tailed duck 22-Dec-11 10:57 45 1 0
Long-tailed duck 22-Dec-11 11:38 40 1 0
Long-tailed duck 22-Dec-11 12:07 45 2 0
Long-tailed duck 22-Dec-11 13:20 55 1 0
Long-tailed duck 23-Nov-11 10:09 45 1 0
Long-tailed duck 23-Nov-11 10:32 30 1 0
Long-tailed duck 23-Nov-11 12:50 25 1 0
Long-tailed duck 23-Nov-11 14:28 30 1 0
Long-tailed duck 05-Jan-12 12:15 35 1 0
Long-tailed duck 08-Feb-12 10:57 30 1 0
Long-tailed duck 08-Feb-12 11:13 40 1 0
Long-tailed duck 08-Feb-12 12:55 30 2 0
Long-tailed duck 08-Feb-12 13:35 10 1 0
Long-tailed duck 08-Feb-12 15:10 30 1 0
Long-tailed duck 01-Mar-10 10:30 38 2 0
Long-tailed duck 01-Mar-10 11:10 38 1 0
Long-tailed duck 01-Mar-10 15:38 25 1 0
Long-tailed duck 02-Feb-10 11:52 35 1 0
Long-tailed duck 02-Feb-10 13:58 30 1 0
Long-tailed duck 14-Apr-10 11:47 46 1 0
Long-tailed duck 14-Apr-10 13:14 35 2 0
Long-tailed duck 14-Apr-10 14:23 35 1 0
Long-tailed duck 16-Mar-10 10:26 50 2 0

Appendices to Technical Appendix A7.1
Forthwind Demonstration Project
Page 39
Species Date Time Duration Number
Percent in height bands 2 and 3
Long-tailed duck 16-Mar-10 12:12 40 3 0
Long-tailed duck 16-Mar-10 12:14 36 1 0
Long-tailed duck 16-Mar-10 12:20 55 3 0
Long-tailed duck 16-Mar-10 13:26 40 1 0
Long-tailed duck 16-Mar-10 14:08 35 4 0
Long-tailed duck 16-Mar-10 14:18 10 3 0
Long-tailed duck 16-Mar-10 14:42 20 2 0
Long-tailed duck 16-Mar-10 15:48 12 2 0
Long-tailed duck 18-Feb-10 11:24 40 2 0
Long-tailed duck 18-Feb-10 11:26 35 1 0
Long-tailed duck 18-Feb-10 11:30 35 1 0
Long-tailed duck 18-Feb-10 11:32 30 1 0
Long-tailed duck 18-Feb-10 11:34 35 1 0
Long-tailed duck 18-Feb-10 11:45 38 4 0
Long-tailed duck 18-Feb-10 12:12 12 2 0
Long-tailed duck 18-Feb-10 12:40 20 4 0
Long-tailed duck 18-Feb-10 13:05 43 1 0
Long-tailed duck 18-Feb-10 13:09 24 4 0
Long-tailed duck 18-Feb-10 13:13 48 2 0
Long-tailed duck 18-Feb-10 13:14 45 1 0
Long-tailed duck 18-Feb-10 13:17 45 2 0
Long-tailed duck 18-Feb-10 13:20 45 2 0
Long-tailed duck 18-Feb-10 13:26 34 1 0
Long-tailed duck 18-Feb-10 13:58 46 1 0
Long-tailed duck 22-Jan-10 09:10 15 1 0
Long-tailed duck 22-Jan-10 09:14 38 1 0
Long-tailed duck 22-Jan-10 09:16 36 2 0
Long-tailed duck 22-Jan-10 09:16 15 1 0
Long-tailed duck 22-Jan-10 09:33 20 1 0
Long-tailed duck 22-Jan-10 09:42 40 1 0
Long-tailed duck 22-Jan-10 10:05 35 4 0
Long-tailed duck 22-Jan-10 10:19 36 1 0
Long-tailed duck 22-Jan-10 10:44 23 1 0
Long-tailed duck 22-Jan-10 10:54 12 2 0
Long-tailed duck 22-Jan-10 11:13 35 2 0
Long-tailed duck 22-Jan-10 13:03 35 1 0
Long-tailed duck 22-Jan-10 13:34 35 1 0
Long-tailed duck 22-Jan-10 13:37 29 1 0
Long-tailed duck 22-Jan-10 13:58 47 2 0
Long-tailed duck 22-Jan-10 14:15 8 1 0
Long-tailed duck 22-Jan-10 14:18 35 1 0
Long-tailed duck 22-Jan-10 14:32 38 1 0

Appendices to Technical Appendix A7.1
Forthwind Ltd
Page 40
Species Date Time Duration Number
Percent in height bands 2 and 3
Long-tailed duck 22-Jan-10 14:40 30 1 0
Long-tailed duck 22-Jan-10 15:11 5 1 0
Long-tailed duck 23-Apr-10 14:08 35 2 0
Long-tailed duck 26-Jan-10 13:58 45 1 0
Long-tailed duck 29-Mar-10 09:43 40 3 0
Long-tailed duck 29-Mar-10 10:22 25 1 0
Long-tailed duck 29-Mar-10 10:28 30 1 0
Long-tailed duck 08-Jan-10 11:28 5 1 0
Long-tailed duck 08-Jan-10 11:37 5 2 0
Long-tailed duck 08-Jan-10 11:48 25 1 0
Long-tailed duck 15-Dec-09 11:25 15 9 0
Long-tailed duck 15-Dec-09 11:31 5 2 0
Long-tailed duck 15-Dec-09 11:34 40 1 0
Long-tailed duck 15-Dec-09 11:44 23 2 0
Long-tailed duck 15-Dec-09 12:01 16 1 0
Long-tailed duck 15-Dec-09 12:21 15 1 0
Long-tailed duck 16-Dec-09 12:16 25 1 0
Long-tailed duck 16-Dec-09 12:57 44 1 0
Long-tailed duck 14-Dec-09 12:41 10 1 0
Long-tailed duck 14-Dec-09 12:55 5 1 0
Long-tailed duck 14-Dec-09 13:38 26 1 0
Long-tailed duck 14-Dec-09 13:44 14 1 0
Long-tailed duck 14-Dec-09 15:06 15 1 0
Long-tailed duck 11-Apr-12 09:35 30 2 0
Long-tailed duck 11-Apr-12 10:45 15 2 0
Mallard 26-Oct-11 15:42 15 6 100
Manx Shearwater 20-Jul-10 10:39 60 5 0
Manx Shearwater 20-Jul-10 14:54 60 4 0
Manx Shearwater 20-Jul-10 16:02 45 2 0
Manx Shearwater 16-Jun-11 09:50 10 30 0
Manx Shearwater 16-Jun-11 10:07 40 6 0
Manx Shearwater 16-Jun-11 10:20 15 2 0
Manx Shearwater 16-Jun-11 10:30 35 1 0
Manx Shearwater 01-Jun-12 12:30 45 4 0
Great skua 26-Aug-11 12:59 70 1 0
Great skua 26-Oct-11 14:37 15 1 100
Great skua 04-Oct-11 10:17 25 1 0
Oystercatcher 28-Oct-11 13:32 20 1 100
Oystercatcher 01-Mar-10 12:18 24 1 0
Oystercatcher 18-May-10 09:45 35 6 0
Oystercatcher 11-Apr-12 09:27 40 1 0
Shearwater sp. 25-Jun-10 14:00 35 28 0

Appendices to Technical Appendix A7.1
Forthwind Demonstration Project
Page 41
Species Date Time Duration Number
Percent in height bands 2 and 3
Peregrine falcon 13-Jul-11 15:43 8 1 100
Pink-footed goose 28-Feb-12 13:44 25 28 100
Pink-footed goose 28-Oct-11 11:52 50 110 100
Pink-footed goose 26-Oct-11 15:32 50 90 100
Pink-footed goose 16-Mar-10 09:58 40 27 100
Pink-footed goose 16-Mar-10 12:02 40 9 100
Pink-footed goose 16-Mar-10 13:19 5 19 100
Puffin 17-Jun-10 15:58 60 1 0
Puffin 26-Jun-10 10:39 40 1 0
Puffin 26-Jul-10 11:10 50 1 0
Puffin 16-Jun-11 10:27 25 1 0
Puffin 16-Jun-11 10:44 40 1 0
Puffin 16-Jun-11 11:32 18 1 0
Puffin 16-Jun-11 12:03 25 1 0
Puffin 16-Jun-11 12:11 40 1 0
Puffin 16-Jun-11 12:22 40 20 0
Puffin 28-Mar-12 10:55 45 1 0
Puffin 28-Mar-12 14:09 45 3 0
Puffin 11-Apr-12 11:16 45 2 0
Puffin 01-May-12 12:12 45 2 0
Puffin 01-Jun-12 11:14 40 1 0
Puffin 01-Jun-12 11:27 45 1 0
Puffin 01-Jun-12 11:50 40 1 0
Puffin 05-Jun-12 10:00 40 1 0
Puffin 05-Jun-12 11:05 45 1 0
Razorbill 28-Feb-12 13:23 20 1 0
Razorbill 27-Jan-12 11:13 20 1 0
Razorbill 26-Oct-11 13:11 25 1 0
Razorbill 22-Dec-11 10:54 20 1 0
Razorbill 09-Aug-11 13:15 45 1 0
Razorbill 04-Oct-11 09:21 45 1 0
Razorbill 04-Oct-11 10:09 46 1 0
Razorbill 04-Oct-11 11:42 50 1 0
Razorbill 08-Feb-12 12:23 40 1 0
Razorbill 26-Jul-10 15:41 45 1 0
Razorbill 28-Mar-12 14:29 40 1 0
Razorbill 11-Apr-12 14:58 40 2
Red-throated diver 28-Feb-12 14:01 30 1 0
Red-throated diver 31-Aug-11 11:30 50 1 0
Red-throated diver 27-Feb-12 14:18 35 1 0
Red-throated diver 27-Jan-12 13:10 40 1 0
Red-throated diver 28-Oct-11 09:32 35 1 0

Appendices to Technical Appendix A7.1
Forthwind Ltd
Page 42
Species Date Time Duration Number
Percent in height bands 2 and 3
Red-throated diver 28-Oct-11 10:25 45 1 0
Red-throated diver 28-Oct-11 10:42 45 1 0
Red-throated diver 28-Oct-11 10:45 45 1 0
Red-throated diver 28-Oct-11 10:57 50 2 100
Red-throated diver 28-Oct-11 11:09 50 2 0
Red-throated diver 28-Oct-11 11:59 35 1 0
Red-throated diver 28-Oct-11 14:01 25 1 0
Red-throated diver 28-Oct-11 15:11 30 1 0
Red-throated diver 28-Sep-11 11:44 45 1 0
Red-throated diver 28-Sep-11 15:43 40 1 0
Red-throated diver 27-Jan-12 09:58 45 1 0
Red-throated diver 25-Nov-11 10:29 55 1 0
Red-throated diver 25-Nov-11 12:24 55 1 0
Red-throated diver 26-Oct-11 10:19 40 1 0
Red-throated diver 26-Oct-11 10:38 40 1 0
Red-throated diver 26-Oct-11 11:19 40 1 0
Red-throated diver 26-Oct-11 12:30 35 1 0
Red-throated diver 26-Oct-11 13:24 35 1 0
Red-throated diver 26-Oct-11 14:07 30 1 0
Red-throated diver 15-Dec-11 12:08 45 2 100
Red-throated diver 22-Dec-11 11:23 45 1 0
Red-throated diver 22-Dec-11 12:19 40 1 0
Red-throated diver 22-Dec-11 13:36 40 1 0
Red-throated diver 23-Nov-11 10:11 30 1 0
Red-throated diver 23-Nov-11 11:57 25 1 0
Red-throated diver 04-Oct-11 10:50 45 1 0
Red-throated diver 04-Oct-11 13:22 45 1 0
Red-throated diver 04-Oct-11 14:53 40 2 0
Red-throated diver 02-Dec-11 10:36 35 1 0
Red-throated diver 02-Dec-11 11:04 35 1 0
Red-throated diver 02-Dec-11 12:46 20 1 0
Red-throated diver 05-Jan-12 12:45 35 1 0
Red-throated diver 05-Jan-12 13:40 45 1 0
Red-throated diver 08-Feb-12 10:10 10 1 0
Red-throated diver 02-Feb-10 11:31 12 1 0
Red-throated diver 02-Feb-10 11:33 48 1 0
Red-throated diver 02-Feb-10 12:16 50 1 0
Red-throated diver 14-Apr-10 11:08 40 1 0
Red-throated diver 16-Mar-10 12:37 47 1 0
Red-throated diver 16-Mar-10 13:48 36 1 33.33333
Red-throated diver 16-Mar-10 14:03 40 2 0
Red-throated diver 16-Mar-10 14:30 22 1 100

Appendices to Technical Appendix A7.1
Forthwind Demonstration Project
Page 43
Species Date Time Duration Number
Percent in height bands 2 and 3
Red-throated diver 18-Feb-10 12:49 40 1 0
Red-throated diver 18-Feb-10 14:12 31 1 0
Red-throated diver 20-Jul-10 12:01 40 2 0
Red-throated diver 22-Jan-10 11:00 17 1 0
Red-throated diver 22-Jan-10 11:14 32 1 0
Red-throated diver 22-Jan-10 13:53 42 1 0
Red-throated diver 22-Jan-10 14:49 30 1 0
Red-throated diver 23-Apr-10 10:24 40 1 0
Red-throated diver 23-Apr-10 13:09 44 1 100
Red-throated diver 23-Apr-10 14:12 46 1 0
Red-throated diver 25-Jun-10 15:37 48 1 0
Red-throated diver 26-Jan-10 12:57 57 1 0
Red-throated diver 29-Mar-10 10:24 31 1 0
Red-throated diver 29-Mar-10 11:04 18 1 0
Red-throated diver 08-Jan-10 13:17 5 1 0
Red-throated diver 08-Jan-10 13:25 15 1 0
Red-throated diver 15-Dec-09 11:28 30 1 0
Red-throated diver 16-Dec-09 11:54 33 1 0
Red-throated diver 28-Mar-12 10:16 40 2 0
Red-throated diver 28-Mar-12 11:33 45 1 0
Red-throated diver 11-Apr-12 11:42 45 1 0
Red-throated diver 11-Apr-12 13:05 40 1
Red-throated diver 11-Apr-12 14:52 45 1
Red-throated diver 24-Apr-12 10:31 40 1 0
Red-throated diver 24-Apr-12 11:38 35 1 0
Red-throated diver 24-Apr-12 13:34 40 1 0
Red-throated diver 24-Apr-12 14:49 45 2 0
Red-throated diver 24-Apr-12 15:03 45 1 0
Red-throated diver 24-Apr-12 15:08 40 1 0
Red-throated diver 01-May-12 11:47 35 3 0
Red-throated diver 01-May-12 11:58 35 1 0
Red-throated diver 01-May-12 13:21 45 1 0
Red-throated diver 01-May-12 14:01 50 1 0
Red-throated diver 01-May-12 15:06 40 1 0
Red-throated diver 01-Jun-12 11:18 48 2 0
Red-breasted merganser 29-Jun-11 13:14 40 3 100
Red-breasted merganser 27-Jan-12 14:01 20 2 0
Red-breasted merganser 04-Oct-11 10:24 40 1 0
Red-breasted merganser 14-Apr-10 14:17 43 1 100
Red-breasted merganser 14-Apr-10 14:37 42 1 0
Red-breasted merganser 22-Jan-10 11:51 20 1 0
Red-breasted merganser 25-May-10 09:59 25 2 0

Appendices to Technical Appendix A7.1
Forthwind Ltd
Page 44
Species Date Time Duration Number
Percent in height bands 2 and 3
Red-breasted merganser 26-Jan-10 11:51 22 1 0
Red-breasted merganser 26-Jan-10 13:16 10 1 0
Red-breasted merganser 15-Dec-09 13:36 17 1 0
Red-breasted merganser 14-Dec-09 13:20 10 1 0
Red-breasted merganser 01-May-12 09:56 40 2 0
Red-breasted merganser 01-May-12 13:31 40 1 100
Red-breasted merganser 01-May-12 13:52 45 1 100
Shag 28-Feb-12 10:49 45 2 0
Shag 28-Feb-12 14:01 20 1 0
Shag 28-Feb-12 15:00 40 1 0
Shag 29-Jun-11 09:48 20 1 0
Shag 29-Jun-11 10:07 25 1 0
Shag 29-Jun-11 10:47 50 1 0
Shag 29-Jun-11 10:47 48 1 0
Shag 29-Jun-11 11:06 40 1 0
Shag 29-Jun-11 11:45 30 1 0
Shag 29-Jun-11 12:30 50 1 0
Shag 29-Jun-11 14:20 40 1 0
Shag 29-Jun-11 14:48 50 1 0
Shag 29-Jun-11 15:19 50 1 0
Shag 31-Aug-11 10:25 50 5 0
Shag 31-Aug-11 10:44 45 1 0
Shag 31-Aug-11 10:52 70 2 0
Shag 31-Aug-11 10:55 75 1 0
Shag 31-Aug-11 10:55 40 2 0
Shag 31-Aug-11 11:06 70 1 0
Shag 31-Aug-11 11:06 65 1 0
Shag 31-Aug-11 11:35 25 1 0
Shag 31-Aug-11 11:37 55 1 0
Shag 31-Aug-11 11:47 45 1 0
Shag 31-Aug-11 12:04 50 1 0
Shag 31-Aug-11 12:14 35 1 0
Shag 31-Aug-11 13:56 40 1 0
Shag 31-Aug-11 14:12 45 1 0
Shag 31-Aug-11 14:23 10 1 0
Shag 31-Aug-11 14:25 40 1 0
Shag 31-Aug-11 14:48 20 1 0
Shag 31-Aug-11 15:10 40 2 0
Shag 31-Aug-11 15:24 25 1 0
Shag 27-Feb-12 13:15 40 1 0
Shag 27-Feb-12 13:47 45 1 0
Shag 27-Jan-12 13:26 40 1 0

Appendices to Technical Appendix A7.1
Forthwind Demonstration Project
Page 45
Species Date Time Duration Number
Percent in height bands 2 and 3
Shag 27-Jan-12 13:47 40 1 0
Shag 27-Jan-12 14:19 45 1 0
Shag 27-Jan-12 15:40 40 1 0
Shag 28-Oct-11 09:41 45 3 0
Shag 28-Oct-11 10:24 40 2 0
Shag 28-Sep-11 10:33 41 1 0
Shag 28-Sep-11 11:57 30 1 0
Shag 28-Sep-11 16:09 35 1 0
Shag 27-Jan-12 10:07 45 1 0
Shag 27-Jan-12 10:22 50 2 0
Shag 27-Jan-12 10:27 45 1 0
Shag 27-Jan-12 11:24 40 1 0
Shag 27-Jan-12 11:49 45 1 0
Shag 25-Nov-11 12:48 45 1 0
Shag 26-Aug-11 09:26 40 1 0
Shag 26-Aug-11 10:46 40 2 0
Shag 26-Aug-11 10:56 20 1 0
Shag 26-Aug-11 11:24 28 1 0
Shag 26-Aug-11 11:47 15 1 0
Shag 26-Aug-11 13:12 54 1 0
Shag 26-Aug-11 13:24 28 1 0
Shag 26-Aug-11 13:46 28 1 0
Shag 26-Aug-11 14:20 45 2 0
Shag 26-Oct-11 09:49 15 2 0
Shag 26-Oct-11 09:49 40 2 0
Shag 26-Oct-11 09:53 30 5 0
Shag 26-Oct-11 09:55 45 5 0
Shag 26-Oct-11 09:55 15 2 0
Shag 26-Oct-11 09:57 55 2 0
Shag 26-Oct-11 10:01 50 2 0
Shag 26-Oct-11 10:07 40 2 0
Shag 26-Oct-11 10:01 55 1 0
Shag 26-Oct-11 10:12 45 1 0
Shag 26-Oct-11 10:19 40 2 0
Shag 26-Oct-11 10:20 45 2 0
Shag 26-Oct-11 10:26 50 1 0
Shag 26-Oct-11 10:28 30 1 0
Shag 26-Oct-11 10:33 40 1 0
Shag 26-Oct-11 10:33 40 1 0
Shag 26-Oct-11 10:39 45 1 0
Shag 26-Oct-11 10:56 40 1 0
Shag 26-Oct-11 11:09 45 1 0

Appendices to Technical Appendix A7.1
Forthwind Ltd
Page 46
Species Date Time Duration Number
Percent in height bands 2 and 3
Shag 26-Oct-11 11:09 45 2 0
Shag 26-Oct-11 11:11 45 1 0
Shag 26-Oct-11 11:14 45 1 0
Shag 26-Oct-11 11:22 45 1 0
Shag 26-Oct-11 11:30 40 1 0
Shag 26-Oct-11 12:37 45 1 0
Shag 26-Oct-11 13:08 45 1 0
Shag 26-Oct-11 13:13 35 1 0
Shag 26-Oct-11 13:32 35 3 0
Shag 26-Oct-11 13:40 25 1 0
Shag 26-Oct-11 13:43 40 1 0
Shag 26-Oct-11 14:06 35 1 0
Shag 26-Oct-11 14:16 45 1 0
Shag 26-Oct-11 15:19 40 1 0
Shag 26-Oct-11 15:25 45 1 0
Shag 26-Oct-11 15:56 40 2 0
Shag 27-Feb-12 10:35 25 1 0
Shag 13-Jul-11 13:21 30 1 0
Shag 13-Jul-11 14:04 40 1 0
Shag 13-Jul-11 14:47 26 1 0
Shag 13-Jul-11 15:45 46 2 0
Shag 15-Dec-11 12:31 40 1 0
Shag 15-Dec-11 12:43 40 1 0
Shag 15-Dec-11 12:45 45 1 0
Shag 15-Dec-11 14:38 40 1 0
Shag 16-Jun-11 14:29 40 1 0
Shag 16-Jun-11 15:35 45 1 0
Shag 16-Jun-11 15:44 25 1 0
Shag 22-Dec-11 11:23 50 1 0
Shag 13-Jul-11 10:00 38 1 0
Shag 13-Jul-11 10:15 35 1 0
Shag 13-Jul-11 10:59 40 1 0
Shag 13-Jul-11 11:01 35 1 0
Shag 13-Jul-11 11:19 40 1 0
Shag 13-Jul-11 11:24 35 2 0
Shag 13-Jul-11 11:53 40 1 0
Shag 13-Jul-11 12:18 35 1 0
Shag 13-Jul-11 12:23 25 2 0
Shag 13-Jul-11 12:31 30 1 0
Shag 09-Aug-11 09:46 35 1 0
Shag 09-Aug-11 10:57 20 1 0
Shag 09-Aug-11 11:07 40 1 0

Appendices to Technical Appendix A7.1
Forthwind Demonstration Project
Page 47
Species Date Time Duration Number
Percent in height bands 2 and 3
Shag 09-Aug-11 11:09 15 1 0
Shag 09-Aug-11 12:22 40 1 0
Shag 09-Aug-11 12:26 40 1 0
Shag 09-Aug-11 13:17 30 2 0
Shag 09-Aug-11 13:40 60 1 0
Shag 09-Aug-11 14:07 20 2 0
Shag 09-Aug-11 14:43 50 1 0
Shag 09-Aug-11 14:53 50 1 0
Shag 09-Aug-11 15:37 16 1 0
Shag 02-Dec-11 10:26 45 2 0
Shag 05-Jan-12 12:30 10 1 0
Shag 08-Feb-12 10:44 20 1 0
Shag 08-Feb-12 13:19 64 1 0
Shag 08-Feb-12 13:31 50 1 0
Shag 08-Feb-12 14:33 35 1 0
Shag 01-Mar-10 11:35 20 1 0
Shag 01-Mar-10 13:21 26 1 0
Shag 01-Mar-10 13:42 18 1 0
Shag 02-Feb-10 12:36 30 1 0
Shag 02-Mar-10 15:37 42 1 0
Shag 14-Apr-10 12:16 55 1 0
Shag 14-Apr-10 15:46 45 1 0
Shag 16-Jun-10 10:35 40 1 0
Shag 16-Jun-10 10:46 45 1 0
Shag 16-Jun-10 10:49 60 1 0
Shag 16-Jun-10 11:36 36 1 0
Shag 16-Jun-10 13:03 55 1 0
Shag 16-Mar-10 10:52 15 1 0
Shag 16-Mar-10 10:54 30 1 0
Shag 17-Jun-10 14:01 65 1 0
Shag 17-Jun-10 14:20 65 1 0
Shag 18-May-10 12:12 55 1 0
Shag 18-May-10 13:29 30 1 0
Shag 18-May-10 15:41 49 2 0
Shag 20-Jul-10 10:28 40 1 0
Shag 20-Jul-10 10:35 50 1 0
Shag 20-Jul-10 10:53 75 1 0
Shag 20-Jul-10 11:48 35 1 0
Shag 20-Jul-10 11:55 50 1 0
Shag 20-Jul-10 12:23 65 1 0
Shag 20-Jul-10 12:28 50 2 0
Shag 20-Jul-10 14:02 45 1 0

Appendices to Technical Appendix A7.1
Forthwind Ltd
Page 48
Species Date Time Duration Number
Percent in height bands 2 and 3
Shag 20-Jul-10 14:52 30 1 0
Shag 20-Jul-10 16:11 35 1 0
Shag 22-Jan-10 09:17 15 2 0
Shag 22-Jan-10 09:48 10 1 0
Shag 22-Jan-10 09:52 26 1 0
Shag 22-Jan-10 09:58 20 1 0
Shag 22-Jan-10 13:33 38 1 0
Shag 23-Apr-10 12:31 55 1 0
Shag 23-Apr-10 12:36 15 1 0
Shag 25-May-10 11:19 65 1 0
Shag 26-Jun-10 10:30 40 1 0
Shag 25-Jun-10 15:48 45 1 0
Shag 26-Jul-10 10:12 60 1 0
Shag 26-Jul-10 10:24 45 1 0
Shag 26-Jul-10 10:45 55 1 0
Shag 26-Jul-10 11:03 40 1 0
Shag 26-Jul-10 11:51 45 1 0
Shag 26-Jul-10 12:55 45 1 0
Shag 26-Jul-10 15:59 55 1 0
Shag 29-Mar-10 09:51 73 1 0
Shag 29-Mar-10 09:59 15 1 0
Shag 08-Jan-10 12:00 5 1 0
Shag 08-Jan-10 12:09 6 1 0
Shag 08-Jan-10 12:17 25 1 0
Shag 15-Dec-09 11:35 20 1 0
Shag 15-Dec-09 11:41 50 1 0
Shag 15-Dec-09 11:45 16 1 0
Shag 15-Dec-09 11:48 23 1 0
Shag 15-Dec-09 11:56 12 1 0
Shag 15-Dec-09 11:57 22 1 0
Shag 15-Dec-09 12:42 16 1 0
Shag 15-Dec-09 12:45 14 1 0
Shag 15-Dec-09 14:14 9 1 0
Shag 16-Dec-09 11:06 8 1 0
Shag 16-Dec-09 11:08 9 2 0
Shag 16-Dec-09 11:58 14 1 0
Shag 16-Dec-09 12:45 20 1 0
Shag 14-Dec-09 12:41 15 1 0
Shag 14-Dec-09 12:43 15 1 0
Shag 14-Dec-09 12:55 5 1 0
Shag 14-Dec-09 13:03 30 1 0
Shag 14-Dec-09 13:11 10 1 0

Appendices to Technical Appendix A7.1
Forthwind Demonstration Project
Page 49
Species Date Time Duration Number
Percent in height bands 2 and 3
Shag 14-Dec-09 13:22 25 1 0
Shag 14-Dec-09 14:09 11 1 0
Shag 16-Jun-11 10:40 40 1 0
Shag 16-Jun-11 10:55 50 1 0
Shag 16-Jun-11 11:00 40 1 0
Shag 16-Jun-11 12:24 22 1 0
Shag 16-Jun-11 12:27 40 2 0
Shag 28-Mar-12 12:22 35 1 0
Shag 28-Mar-12 13:54 50 1 0
Shag 28-Mar-12 14:13 50 1 0
Shag 28-Mar-12 14:50 50 1 0
Shag 28-Mar-12 15:31 40 1 0
Shag 28-Mar-12 15:35 40 1 0
Shag 28-Mar-12 15:52 30 1 0
Shag 28-Mar-12 15:52 30 1 0
Shag 11-Apr-12 09:32 40 1 0
Shag 11-Apr-12 11:28 45 1 0
Shag 11-Apr-12 12:46 45 1
Shag 11-Apr-12 12:55 40 1
Shag 11-Apr-12 13:10 40 1
Shag 11-Apr-12 13:52 40 1
Shag 24-Apr-12 10:15 45 1 0
Shag 24-Apr-12 10:23 45 2 0
Shag 24-Apr-12 12:03 45 3 0
Shag 24-Apr-12 12:39 30 1 0
Shag 24-Apr-12 12:59 40 1 0
Shag 24-Apr-12 13:58 10 1 0
Shag 24-Apr-12 14:59 45 1 0
Shag 24-Apr-12 15:00 45 1 0
Shag 24-Apr-12 15:13 45 1 0
Shag 01-May-12 09:25 50 1 0
Shag 01-May-12 09:37 40 1 0
Shag 01-May-12 09:40 45 1 0
Shag 01-May-12 09:59 45 1 0
Shag 01-May-12 10:20 45 1 0
Shag 01-May-12 11:40 30 1 0
Shag 01-May-12 11:54 40 1 0
Shag 01-May-12 12:53 25 1 0
Shag 01-May-12 13:10 45 1 0
Shag 01-May-12 13:26 45 1 0
Shag 01-May-12 13:32 45 1 0
Shag 01-May-12 14:05 25 1 0

Appendices to Technical Appendix A7.1
Forthwind Ltd
Page 50
Species Date Time Duration Number
Percent in height bands 2 and 3
Shag 01-May-12 14:11 40 1 0
Shag 01-May-12 14:14 45 1 0
Shag 01-Jun-12 13:50 45 1 0
Shag 01-Jun-12 14:12 45 1 0
Shag 01-Jun-12 16:10 45 1 0
Shag 01-Jun-12 12:00 45 1 0
Shag 01-Jun-12 12:49 45 1 0
Shag 01-Jun-12 12:57 45 1 0
Shag 05-Jun-12 10:21 45 1 0
Shag 05-Jun-12 10:37 45 1 0
Shag 05-Jun-12 11:03 45 1 0
Shag 05-Jun-12 12:14 50 1 0
Shag 05-Jun-12 13:29 45 1 0
Shag 05-Jun-12 13:48 45 1 0
Shag 05-Jun-12 13:52 45 1 0
Shag 05-Jun-12 15:01 45 1 0
Shag 05-Jun-12 15:01 45 1 0
Shag 05-Jun-12 15:30 45 1 0
Shag 05-Jun-12 15:43 45 1 0
Shag 05-Jun-12 15:47 45 1 0
Scaup 24-Apr-12 12:18 60 16 0
Shelduck 28-Feb-12 10:30 40 2 0
Teal 26-Oct-11 15:42 15 1 100
Sandwich tern 31-Aug-11 10:02 40 1 0
Sandwich tern 31-Aug-11 10:09 40 1 0
Sandwich tern 31-Aug-11 11:18 45 3 0
Sandwich tern 28-Sep-11 10:27 56 1 0
Sandwich tern 28-Sep-11 11:37 56 1 0
Sandwich tern 28-Sep-11 12:25 50 1 0
Sandwich tern 28-Sep-11 12:42 50 3 0
Sandwich tern 28-Sep-11 12:49 50 3 0
Sandwich tern 28-Sep-11 12:57 50 2 0
Sandwich tern 28-Sep-11 13:01 50 2 0
Sandwich tern 28-Sep-11 13:41 40 1 100
Sandwich tern 26-Aug-11 10:29 55 1 0
Sandwich tern 26-Aug-11 11:23 38 2 0
Sandwich tern 26-Aug-11 12:43 47 5 0
Sandwich tern 26-Aug-11 13:06 70 3 0
Sandwich tern 26-Aug-11 13:07 70 3 0
Sandwich tern 26-Aug-11 13:09 70 3 0
Sandwich tern 26-Aug-11 13:12 65 2 0
Sandwich tern 26-Aug-11 13:21 65 2 0

Appendices to Technical Appendix A7.1
Forthwind Demonstration Project
Page 51
Species Date Time Duration Number
Percent in height bands 2 and 3
Sandwich tern 26-Aug-11 13:33 45 1 0
Sandwich tern 26-Aug-11 13:35 45 1 0
Sandwich tern 26-Aug-11 13:39 45 4 0
Sandwich tern 26-Aug-11 13:41 70 1 0
Sandwich tern 26-Aug-11 13:45 30 2 0
Sandwich tern 26-Aug-11 13:50 70 2 0
Sandwich tern 26-Aug-11 13:50 70 1 0
Sandwich tern 26-Aug-11 14:02 70 1 0
Sandwich tern 26-Aug-11 14:21 70 2 0
Sandwich tern 13-Jul-11 14:38 25 2 0
Sandwich tern 13-Jul-11 15:13 40 2 0
Sandwich tern 16-Jun-11 13:32 35 3 100
Sandwich tern 16-Jun-11 14:30 25 1 0
Sandwich tern 13-Jul-11 10:29 35 1 0
Sandwich tern 13-Jul-11 10:51 65 2 0
Sandwich tern 13-Jul-11 10:55 35 1 0
Sandwich tern 09-Aug-11 09:46 30 1 0
Sandwich tern 09-Aug-11 13:29 40 1 0
Sandwich tern 09-Aug-11 15:14 50 2 0
Sandwich tern 09-Aug-11 15:53 40 2 0
Sandwich tern 18-May-10 10:57 20 1 0
Sandwich tern 18-May-10 11:13 90 1 0
Sandwich tern 20-Jul-10 10:18 45 1 0
Sandwich tern 20-Jul-10 10:43 42 1 0
Sandwich tern 20-Jul-10 10:54 70 1 0
Sandwich tern 20-Jul-10 11:15 40 1 0
Sandwich tern 20-Jul-10 14:10 55 7 0
Sandwich tern 20-Jul-10 15:26 60 1 0
Sandwich tern 26-Jul-10 11:20 40 1 0
Sandwich tern 26-Jul-10 12:13 55 2 0
Sandwich tern 26-Jul-10 12:26 45 1 0
Sandwich tern 26-Jul-10 14:59 50 1 0
Sandwich tern 26-Jul-10 15:10 60 1 0
Sandwich tern 24-Apr-12 10:46 40 2 0
Sandwich tern 24-Apr-12 11:45 50 2 0
Sandwich tern 24-Apr-12 12:49 35 2 100
Sandwich tern 24-Apr-12 14:11 40 2 0
Sandwich tern 24-Apr-12 14:18 40 2 0
Sandwich tern 24-Apr-12 15:11 45 2 0
Sandwich tern 24-Apr-12 15:16 45 2 0
Sandwich tern 01-May-12 10:32 45 1 0
Sandwich tern 01-May-12 10:51 40 1 0

Appendices to Technical Appendix A7.1
Forthwind Ltd
Page 52
Species Date Time Duration Number
Percent in height bands 2 and 3
Sandwich tern 01-May-12 12:47 40 1 0
Sandwich tern 01-May-12 15:19 45 1 0
Sandwich tern 01-Jun-12 14:06 45 2 0
Sandwich tern 01-Jun-12 15:15 45 1 0
Sandwich tern 01-Jun-12 15:21 45 1 0
Sandwich tern 01-Jun-12 15:28 45 2 0
Sandwich tern 01-Jun-12 15:41 45 1 0
Sandwich tern 01-Jun-12 15:41 45 1 0
Sandwich tern 01-Jun-12 16:12 45 1 0
Sandwich tern 01-Jun-12 10:29 40 1 0
Sandwich tern 01-Jun-12 10:38 45 1 0
Sandwich tern 01-Jun-12 11:31 45 1 0
Sandwich tern 01-Jun-12 11:33 45 2 0
Sandwich tern 05-Jun-12 10:19 45 1 0
Tern sp. 09-Aug-11 15:52 40 1 0
Tern sp. 16-Jun-10 10:59 55 1 0
Tern sp. 17-Jun-10 13:37 50 1 0
Tern sp. 17-Jun-10 14:44 55 1 0
Tern sp. 17-Jun-10 14:57 60 1 0
Tern sp. 17-May-10 13:33 55 2 0
Tern sp. 17-May-10 13:37 65 1 0
Tern sp. 17-May-10 13:37 70 1 0
Tern sp. 17-May-10 13:53 80 1 0
Tern sp. 17-May-10 13:55 95 1 0
Tern sp. 17-May-10 14:00 100 1 0
Tern sp. 17-May-10 14:06 100 1 0
Tern sp. 17-May-10 14:08 65 1 0
Tern sp. 17-May-10 14:11 70 1 0
Tern sp. 17-May-10 14:26 70 2 0
Tern sp. 17-May-10 14:33 65 1 0
Tern sp. 17-May-10 14:39 30 1 0
Tern sp. 17-May-10 14:54 125 1 0
Tern sp. 17-May-10 15:11 70 1 0
Tern sp. 17-May-10 15:15 75 1 0
Tern sp. 17-May-10 15:24 38 2 0
Tern sp. 17-May-10 16:09 50 1 0
Tern sp. 18-May-10 10:36 23 1 0
Tern sp. 18-May-10 11:25 25 2 0
Tern sp. 18-May-10 11:37 40 1 0
Tern sp. 18-May-10 11:47 70 1 0
Tern sp. 18-May-10 12:08 95 1 0
Tern sp. 18-May-10 13:11 58 1 0

Appendices to Technical Appendix A7.1
Forthwind Demonstration Project
Page 53
Species Date Time Duration Number
Percent in height bands 2 and 3
Tern sp. 18-May-10 13:16 50 1 0
Tern sp. 18-May-10 13:19 75 1 0
Tern sp. 18-May-10 13:22 70 2 0
Tern sp. 18-May-10 13:29 70 4 0
Tern sp. 18-May-10 13:40 70 2 0
Tern sp. 18-May-10 13:41 70 2 0
Tern sp. 18-May-10 13:42 70 1 0
Tern sp. 18-May-10 14:11 40 2 0
Tern sp. 18-May-10 14:17 90 4 0
Tern sp. 18-May-10 14:20 70 1 0
Tern sp. 18-May-10 14:22 70 2 0
Tern sp. 18-May-10 14:26 70 4 0
Tern sp. 18-May-10 14:47 70 1 0
Tern sp. 18-May-10 15:10 70 2 0
Tern sp. 18-May-10 15:23 70 5 0
Tern sp. 18-May-10 15:34 70 2 0
Tern sp. 18-May-10 15:37 40 3 0
Tern sp. 18-May-10 15:54 70 2 0
Tern sp. 20-Jul-10 10:40 70 1 0
Tern sp. 20-Jul-10 11:28 65 2 0
Tern sp. 20-Jul-10 13:07 60 1 0
Tern sp. 20-Jul-10 15:05 70 1 0
Tern sp. 20-Jul-10 15:33 30 1 0
Tern sp. 20-Jul-10 15:46 70 1 0
Tern sp. 20-Jul-10 15:51 70 1 0
Tern sp. 23-Apr-10 11:24 35 2 0
Tern sp. 23-Apr-10 12:31 34 1 0
Tern sp. 25-May-10 09:41 70 1 0
Tern sp. 25-May-10 10:11 70 1 0
Tern sp. 25-May-10 10:55 35 1 0
Tern sp. 25-May-10 11:31 70 1 0
Tern sp. 25-May-10 13:13 70 1 0
Tern sp. 25-May-10 13:20 70 2 0
Tern sp. 25-May-10 13:27 70 1 0
Tern sp. 25-May-10 13:29 70 2 0
Tern sp. 25-May-10 13:32 70 1 0
Tern sp. 25-May-10 13:35 60 1 0
Tern sp. 25-May-10 13:35 60 1 0
Tern sp. 25-May-10 13:44 60 3 0
Tern sp. 25-May-10 13:48 25 2 0
Tern sp. 25-May-10 14:04 30 1 0
Tern sp. 25-May-10 14:09 70 1 0

Appendices to Technical Appendix A7.1
Forthwind Ltd
Page 54
Species Date Time Duration Number
Percent in height bands 2 and 3
Tern sp. 25-May-10 14:13 70 1 0
Tern sp. 25-May-10 14:22 70 1 0
Tern sp. 25-May-10 14:52 70 1 0
Tern sp. 25-May-10 14:58 70 1 0
Tern sp. 25-May-10 15:09 70 2 0
Tern sp. 25-May-10 15:17 70 2 0
Tern sp. 25-May-10 15:20 70 1 0
Tern sp. 25-May-10 15:30 70 1 0
Tern sp. 25-May-10 15:36 70 1 0
Tern sp. 25-May-10 15:44 70 2 0
Tern sp. 26-Jun-10 10:30 60 1 100
Tern sp. 26-Jun-10 11:13 60 1 0
Tern sp. 26-Jun-10 11:19 40 1 0
Tern sp. 26-Jun-10 12:45 40 2 0
Tern sp. 25-Jun-10 14:05 70 1 0
Tern sp. 25-Jun-10 14:48 40 1 0
Tern sp. 01-Jun-12 14:27 70 3 0
Tern sp. 01-Jun-12 14:28 50 4 0
Tern sp. 01-Jun-12 15:04 45 3 0
Tern sp. 01-Jun-12 15:09 45 3 0
Tern sp. 01-Jun-12 15:15 50 3 0
Tern sp. 01-Jun-12 15:29 45 1 0
Tern sp. 01-Jun-12 15:34 50 1 0
Tern sp. 01-Jun-12 15:53 60 1 0
Tern sp. 01-Jun-12 15:56 70 1 0
Tern sp. 01-Jun-12 15:34 50 1 0
Tern sp. 01-Jun-12 15:47 60 1 0
Tern sp. 01-Jun-12 15:53 60 2 0
Tern sp. 01-Jun-12 15:56 70 1 0
Tern sp. 01-Jun-12 16:16 960 10 0
Tern sp. 01-Jun-12 16:30 300 6 0
Tern sp. 01-Jun-12 16:32 50 10 0
Tern sp. 01-Jun-12 10:24 40 1 0
Tern sp. 01-Jun-12 10:28 45 4 0
Tern sp. 01-Jun-12 10:30 45 4 0
Tern sp. 01-Jun-12 10:56 70 4 0
Tern sp. 01-Jun-12 10:58 45 2 0
Tern sp. 01-Jun-12 11:07 150 6 0
Tern sp. 01-Jun-12 11:41 45 2 0
Tern sp. 01-Jun-12 11:45 40 1 0
Tern sp. 01-Jun-12 11:59 45 1 0
Tern sp. 01-Jun-12 12:01 50 1 0

Appendices to Technical Appendix A7.1
Forthwind Demonstration Project
Page 55
Species Date Time Duration Number
Percent in height bands 2 and 3
Tern sp. 01-Jun-12 12:09 45 1 0
Tern sp. 01-Jun-12 12:15 45 1 0
Tern sp. 01-Jun-12 12:25 45 1 0
Tern sp. 01-Jun-12 12:32 45 2 0
Tern sp. 01-Jun-12 12:35 45 2 0
Tern sp. 01-Jun-12 12:37 45 3 0
Tern sp. 01-Jun-12 12:43 45 1 0
Tern sp. 05-Jun-12 09:50 45 1 0
Tern sp. 05-Jun-12 09:56 45 1 0
Tern sp. 05-Jun-12 10:00 50 1 0
Tern sp. 05-Jun-12 10:07 45 1 0
Tern sp. 05-Jun-12 10:08 70 1 0
Tern sp. 05-Jun-12 10:15 45 1 0
Tern sp. 05-Jun-12 10:16 45 1 0
Tern sp. 05-Jun-12 10:24 45 2 0
Tern sp. 05-Jun-12 10:27 45 1 0
Tern sp. 05-Jun-12 10:35 50 1 0
Tern sp. 05-Jun-12 10:46 45 2 0
Tern sp. 05-Jun-12 10:47 45 2 0
Tern sp. 05-Jun-12 10:50 50 2 0
Tern sp. 05-Jun-12 10:53 50 1 0
Tern sp. 05-Jun-12 11:00 40 1 0
Tern sp. 05-Jun-12 11:17 60 2 0
Tern sp. 05-Jun-12 11:41 55 1 0
Tern sp. 05-Jun-12 11:51 60 1 0
Tern sp. 05-Jun-12 12:15 45 1 0
Tern sp. 05-Jun-12 12:33 45 1 0
Tern sp. 05-Jun-12 12:35 45 1
Tern sp. 05-Jun-12 13:37 45 1 0
Tern sp. 05-Jun-12 14:11 45 1 0
Tern sp. 05-Jun-12 14:30 60 2 0
Tern sp. 05-Jun-12 14:31 60 2 0
Tern sp. 05-Jun-12 14:38 60 3 0
Tern sp. 05-Jun-12 14:48 65 1 0
Tern sp. 05-Jun-12 14:58 60 2 0
Tern sp. 05-Jun-12 15:01 45 1 0
Tern sp. 05-Jun-12 15:11 45 1 0
Tern sp. 05-Jun-12 15:20 50 1 0
Tern sp. 05-Jun-12 15:25 45 1 0
Tern sp. 05-Jun-12 15:39 45 1 0
Tern sp. 05-Jun-12 15:42 70 2 0
Tern sp. 05-Jun-12 15:43 45 1 0
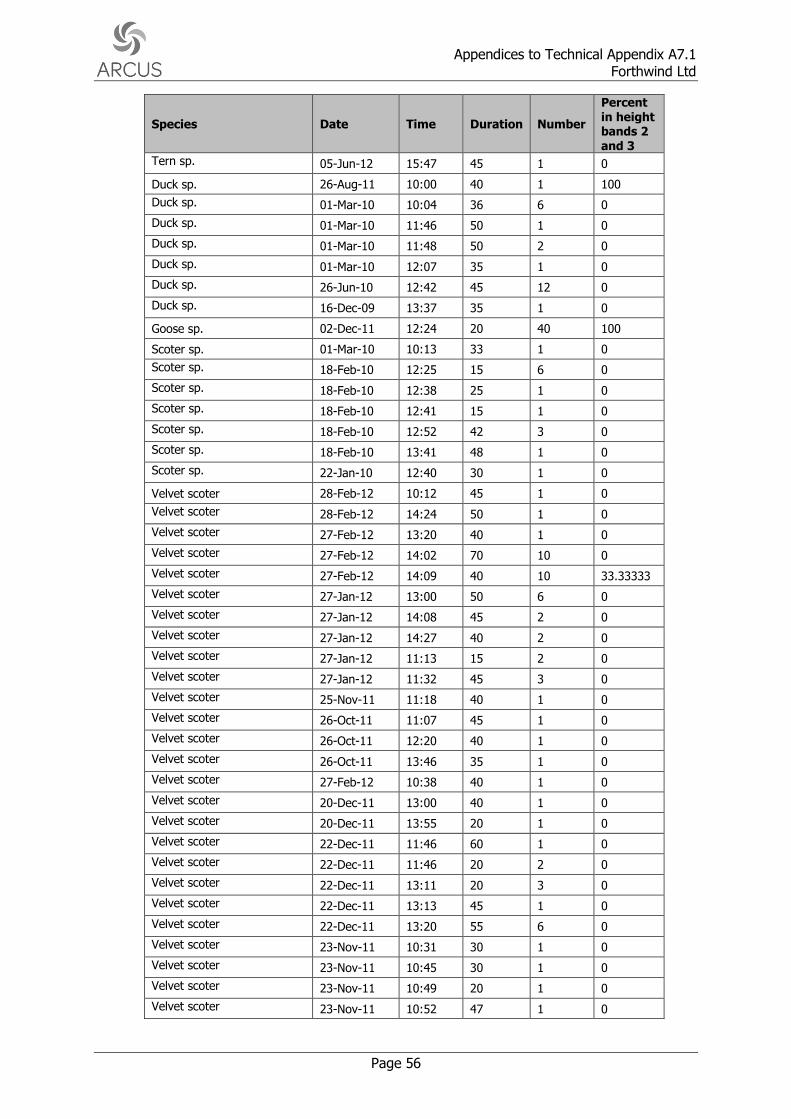
Appendices to Technical Appendix A7.1
Forthwind Ltd
Page 56
Species Date Time Duration Number
Percent in height bands 2 and 3
Tern sp. 05-Jun-12 15:47 45 1 0
Duck sp. 26-Aug-11 10:00 40 1 100
Duck sp. 01-Mar-10 10:04 36 6 0
Duck sp. 01-Mar-10 11:46 50 1 0
Duck sp. 01-Mar-10 11:48 50 2 0
Duck sp. 01-Mar-10 12:07 35 1 0
Duck sp. 26-Jun-10 12:42 45 12 0
Duck sp. 16-Dec-09 13:37 35 1 0
Goose sp. 02-Dec-11 12:24 20 40 100
Scoter sp. 01-Mar-10 10:13 33 1 0
Scoter sp. 18-Feb-10 12:25 15 6 0
Scoter sp. 18-Feb-10 12:38 25 1 0
Scoter sp. 18-Feb-10 12:41 15 1 0
Scoter sp. 18-Feb-10 12:52 42 3 0
Scoter sp. 18-Feb-10 13:41 48 1 0
Scoter sp. 22-Jan-10 12:40 30 1 0
Velvet scoter 28-Feb-12 10:12 45 1 0
Velvet scoter 28-Feb-12 14:24 50 1 0
Velvet scoter 27-Feb-12 13:20 40 1 0
Velvet scoter 27-Feb-12 14:02 70 10 0
Velvet scoter 27-Feb-12 14:09 40 10 33.33333
Velvet scoter 27-Jan-12 13:00 50 6 0
Velvet scoter 27-Jan-12 14:08 45 2 0
Velvet scoter 27-Jan-12 14:27 40 2 0
Velvet scoter 27-Jan-12 11:13 15 2 0
Velvet scoter 27-Jan-12 11:32 45 3 0
Velvet scoter 25-Nov-11 11:18 40 1 0
Velvet scoter 26-Oct-11 11:07 45 1 0
Velvet scoter 26-Oct-11 12:20 40 1 0
Velvet scoter 26-Oct-11 13:46 35 1 0
Velvet scoter 27-Feb-12 10:38 40 1 0
Velvet scoter 20-Dec-11 13:00 40 1 0
Velvet scoter 20-Dec-11 13:55 20 1 0
Velvet scoter 22-Dec-11 11:46 60 1 0
Velvet scoter 22-Dec-11 11:46 20 2 0
Velvet scoter 22-Dec-11 13:11 20 3 0
Velvet scoter 22-Dec-11 13:13 45 1 0
Velvet scoter 22-Dec-11 13:20 55 6 0
Velvet scoter 23-Nov-11 10:31 30 1 0
Velvet scoter 23-Nov-11 10:45 30 1 0
Velvet scoter 23-Nov-11 10:49 20 1 0
Velvet scoter 23-Nov-11 10:52 47 1 0

Appendices to Technical Appendix A7.1
Forthwind Demonstration Project
Page 57
Species Date Time Duration Number
Percent in height bands 2 and 3
Velvet scoter 23-Nov-11 11:08 45 3 0
Velvet scoter 23-Nov-11 13:49 50 1 0
Velvet scoter 23-Nov-11 13:54 25 1 0
Velvet scoter 04-Oct-11 10:21 45 4 0
Velvet scoter 04-Oct-11 14:44 45 1 0
Velvet scoter 08-Feb-12 11:03 45 2 0
Velvet scoter 08-Feb-12 13:15 30 2 0
Velvet scoter 08-Feb-12 14:04 35 1 0
Velvet scoter 01-Mar-10 11:34 30 1 0
Velvet scoter 14-Apr-10 11:51 28 1 0
Velvet scoter 14-Apr-10 15:01 25 12 0
Velvet scoter 14-Apr-10 15:36 10 10 0
Velvet scoter 16-Mar-10 14:14 15 7 0
Velvet scoter 16-Mar-10 14:20 40 1 0
Velvet scoter 18-Feb-10 11:54 18 1 0
Velvet scoter 18-Feb-10 12:45 55 1 0
Velvet scoter 22-Jan-10 09:22 30 1 0
Velvet scoter 22-Jan-10 09:36 16 1 0
Velvet scoter 22-Jan-10 10:15 33 1 0
Velvet scoter 22-Jan-10 10:28 38 1 0
Velvet scoter 22-Jan-10 13:12 40 1 0
Velvet scoter 23-Apr-10 12:51 23 2 0
Velvet scoter 29-Mar-10 10:02 36 3 0
Velvet scoter 29-Mar-10 10:54 30 1 0
Velvet scoter 08-Jan-10 11:45 33 1 0
Velvet scoter 15-Dec-09 13:05 12 1 0
Velvet scoter 16-Dec-09 11:22 9 1 0
Velvet scoter 16-Dec-09 12:15 30 1 0
Velvet scoter 16-Dec-09 13:46 25 1 0
Velvet scoter 14-Dec-09 14:55 24 1 0
Velvet scoter 24-Apr-12 11:28 40 1 0
Velvet scoter 24-Apr-12 15:13 35 1 0
Velvet scoter 24-Apr-12 15:38 40 1 0
Velvet scoter 01-May-12 13:26 10 1 0
Velvet scoter 01-May-12 14:11 40 1 0
Velvet scoter 01-May-12 14:16 25 1 0
Velvet scoter 01-May-12 14:30 40 1 0
Velvet scoter 01-May-12 14:36 50 1 0
Velvet scoter 01-May-12 15:20 45 1 0
Wader sp. 26-Oct-11 12:00 50 1 100
Wader sp. 04-Oct-11 10:54 40 6 100
Auk sp. 28-Feb-12 09:42 40 3 0

Appendices to Technical Appendix A7.1
Forthwind Ltd
Page 58
Species Date Time Duration Number
Percent in height bands 2 and 3
Auk sp. 28-Feb-12 09:51 45 1 0
Auk sp. 28-Feb-12 10:51 50 4 0
Auk sp. 28-Feb-12 15:04 40 1 0
Auk sp. 27-Feb-12 13:07 40 1 0
Auk sp. 27-Feb-12 13:22 32 1 0
Auk sp. 27-Jan-12 12:54 35 1 0
Auk sp. 27-Jan-12 13:07 45 4 0
Auk sp. 28-Oct-11 10:25 40 1 0
Auk sp. 28-Oct-11 10:52 40 1 0
Auk sp. 28-Oct-11 11:00 30 1 0
Auk sp. 28-Oct-11 12:09 40 1 0
Auk sp. 28-Oct-11 13:51 30 1 0
Auk sp. 28-Oct-11 14:07 30 1 0
Auk sp. 27-Jan-12 10:36 50 1 0
Auk sp. 27-Jan-12 10:55 35 2 0
Auk sp. 27-Jan-12 11:04 35 1 0
Auk sp. 27-Jan-12 12:09 35 1 0
Auk sp. 27-Jan-12 12:12 40 1 0
Auk sp. 27-Jan-12 12:27 22 1 0
Auk sp. 26-Aug-11 14:33 45 1 0
Auk sp. 26-Oct-11 10:14 40 1 0
Auk sp. 26-Oct-11 10:19 35 1 0
Auk sp. 26-Oct-11 10:43 40 1 0
Auk sp. 26-Oct-11 13:21 25 1 0
Auk sp. 26-Oct-11 13:34 30 1 0
Auk sp. 26-Oct-11 13:36 30 4 0
Auk sp. 26-Oct-11 13:41 30 1 0
Auk sp. 26-Oct-11 13:43 40 1 0
Auk sp. 26-Oct-11 13:55 45 1 0
Auk sp. 26-Oct-11 13:58 30 1 0
Auk sp. 26-Oct-11 14:10 30 1 0
Auk sp. 26-Oct-11 14:16 30 1 0
Auk sp. 26-Oct-11 14:23 30 1 0
Auk sp. 26-Oct-11 14:27 30 2 0
Auk sp. 26-Oct-11 15:23 40 1 0
Auk sp. 26-Oct-11 15:52 30 1 0
Auk sp. 13-Jul-11 12:30 45 1 0
Auk sp. 04-Oct-11 11:36 50 1 0
Auk sp. 04-Oct-11 11:39 50 1 0
Auk sp. 04-Oct-11 13:43 50 1 0
Auk sp. 08-Feb-12 12:12 35 1 0
Auk sp. 08-Feb-12 13:21 20 1 0

Appendices to Technical Appendix A7.1
Forthwind Demonstration Project
Page 59
Species Date Time Duration Number
Percent in height bands 2 and 3
Auk sp. 16-Jun-10 11:40 40 1 0
Auk sp. 17-Jun-10 13:44 50 1 0
Auk sp. 26-Jun-10 11:34 50 1 0
Auk sp. 26-Jun-10 12:15 50 2 0
Auk sp. 25-Jun-10 14:12 40 1 0
Auk sp. 25-Jun-10 14:13 45 1 0
Auk sp. 26-Jul-10 11:06 55 1 0
Auk sp. 16-Jun-11 10:14 35 1 0
Auk sp. 16-Jun-11 10:16 20 3 0
Auk sp. 16-Jun-11 11:14 30 1 0
Auk sp. 16-Jun-11 12:14 40 1 0
Auk sp. 16-Jun-11 12:16 40 1 0
Auk sp. 16-Jun-11 12:26 40 2 0
1.2.2 Secondary Species
The data in Tables A1.3 and A1.4 show the total number of birds recorded in each height band during each survey session.
Table A1.3: Gannet, Black-headed Gull and Common Gull Summary
Date Start Finish
Gannet (height)
Black-headed gull (height)
Common gull (height)
1 2 3 1 2 3 1 2 3
18/02/2010 11:15 14:15 0 0 0 0 0 0 0 0 0
01/03/2010 09:30 12:30 0 0 0 2 0 0 6 0 0
01/03/2010 13:00 16:00 0 0 0 1 0 0 18 0 0
02/03/2010 13:00 16:00 0 0 0 3 0 0 2 8 0
16/03/2010 09:40 12:40 0 0 0 0 0 0 0 0 0
16/03/2010 13:10 16:10 0 0 0 1 0 0 0 0 0
29/03/2010 09:40 12:40 0 0 0 0 0 0 0 0 0
14/04/2010 11:00 12:30 58 13 0 0 0 0 0 0 0
23/04/2010 10:15 13:15 92 13 0 0 0 0 1 0 0
23/04/2010 13:40 15:10 35 2 0 0 0 0 0 0 0
17/05/2010 13:10 16:10 3 9 1 0 0 0 2 0 0
18/05/2010 09:30 12:30 15 3 0 0 1 0 0 0 0
18/05/2010 13:00 16:00 33 31 0 0 0 0 0 0 0
25/05/2010 09:30 12:30 2 1 3 0 0 0 0 0 0
25/05/2010 13:00 16:00 48 44 6 0 0 0 0 0 0
16/06/2010 10:10 13:10 103 52 4 0 0 0 0 0 0
17/06/2010 13:30 16:30 64 40 16 0 0 0 0 0 0
25/06/2010 09:50 12:50 6 2 1 0 0 0 0 0 0
25/06/2010 13:05 16:05 7 1 2 0 1 0 0 0 0
26/07/2010 10:00 13:00 19 22 5 1 1 0 0 0 0
16/06/2011 09:40 12:40 52 14 0 0 0 0 0 0 0
16/06/2011 13:00 16:00 127 4 0 0 0 0 1 0 0
29/06/2011 09:40 12:40 11 29 26 0 0 0 0 0 0
29/06/2011 13:00 16:00 2 1 4 0 0 0 1 0 0
13/07/2011 09:45 12:45 32 13 1 0 0 0 0 0 0
13/07/2011 13:00 16:00 85 18 4 1 0 0 0 0 0
09/08/2011 09:30 12:30 13 8 3 1 0 0 0 0 0
09/08/2011 13:00 16:00 31 7 0 0 0 0 0 0 0
26/08/2011 09:15 12:15 145 16 0 0 0 0 0 0 0
26/08/2011 12:30 15:30 65 13 0 0 0 0 1 0 0

Appendices to Technical Appendix A7.1
Forthwind Ltd
Page 60
Date Start Finish
Gannet (height)
Black-headed gull (height)
Common gull (height)
1 2 3 1 2 3 1 2 3
31/08/2011 09:30 12:30 25 4 0 0 0 0 1 0 0
31/08/2011 12:50 15:50 13 4 0 0 0 0 0 0 0
28/09/2011 10:10 13:10 89 10 1 98 0 0 0 0 0
28/09/2011 13:20 16:20 67 15 1 50 0 0 0 0 0
04/10/2011 09:20 12:20 55 2 1 0 0 0 0 0 0
04/10/2011 12:30 15:30 104 3 0 2 0 0 0 0 0
26/10/2011 09:45 12:45 0 0 0 22 5 0 3 0 0
26/10/2011 13:00 16:00 1 0 0 4 0 0 6 0 0
28/10/2011 09:20 12:20 1 0 0 6 2 0 10 0 0
28/10/2011 12:50 15:50 1 1 0 0 2 0 4 1 0
23/11/2011 09:15 12:15 19 0 0 0 0 0 1 0 0
23/11/2011 12:30 15:30 0 0 0 1 0 0 0 0 0
25/11/2011 10:15 13:15 0 0 0 0 0 0 0 0 0
02/12/2011 10:15 13:15 0 0 0 1 2 0 1 0 0
15/12/2011 11:55 14:55 0 0 0 2 1 0 3 0 0
20/12/2011 11:35 14:35 0 0 0 4 1 1 1 0 0
22/12/2011 10:50 13:50 1 0 0 3 0 0 9 0 0
05/01/2012 11:30 14:30 0 0 0 1 0 0 9 0 0
27/01/2012 09:45 12:45 0 0 0 2 0 0 5 0 0
27/01/2012 12:45 15:45 0 0 0 5 0 0 4 2 0
08/02/2012 09:35 12:35 0 0 0 0 0 0 1 0 0
08/02/2012 12:40 15:40 0 0 0 0 0 0 0 0 0
27/02/2012 09:50 12:50 1 0 0 1 0 0 3 0 0
27/02/2012 12:50 15:50 1 0 0 0 2 0 0 0 0
28/02/2012 09:30 12:30 0 0 0 3 1 0 0 0 0
28/02/2012 12:35 15:35 3 0 0 2 0 0 2 0 0
28/03/2012 10:00 13:00 28 0 0 0 0 0 4 0 0
28/03/2012 13:10 16:10 42 17 0 0 0 0 3 0 0
11/04/2012 09:10 12:10 1 1 0 1 0 0 3 0 0
11/04/2012 12:30 15:30 8 2 0 0 0 0 0 0 0
24/04/2012 10:00 13:00 26 10 0 0 0 0 3 0 0
24/04/2012 13:10 16:10 19 24 6 0 0 0 0 2 0
01/05/2012 09:15 12:15 24 0 0 0 0 0 6 0 0
01/05/2012 12:30 15:30 46 0 0 2 0 0 0 0 0
01/06/2012 13:40 16:40 64 4 0 0 0 0 0 0 0
01/06/2012 10:00 13:00 186 38 0 0 0 0 0 0 0
05/06/2012 09:45 12:45 77 0 0 2 0 0 1 2 0
05/06/2012 13:00 16:00 182 0 0 0 0 0 1 0 0
Table A1.4: Lesser black-backed Gull, Herring Gull and Great Black-backed Gull Summary
Date Start Finish
Lesser black-backed gull (height)
Herring gull (height)
Great black-backed gull (height)
1 2 3 1 2 3 1 2 3
18/02/2010 11:15 14:15 0 0 0 93 2 0 2 0 0
01/03/2010 09:30 12:30 0 0 0 44 22 0 0 0 0
01/03/2010 13:00 16:00 0 0 0 162 16 0 16 0 0
02/03/2010 13:00 16:00 0 0 0 163 6 0 34 1 0
16/03/2010 09:40 12:40 0 0 0 31 8 1 2 0 0
16/03/2010 13:10 16:10 0 0 0 21 16 5 1 3 0
29/03/2010 09:40 12:40 0 2 0 18 6 0 2 0 0
14/04/2010 11:00 12:30 1 1 0 21 4 0 4 3 0
23/04/2010 10:15 13:15 3 0 0 28 10 1 0 0 0
23/04/2010 13:40 15:10 0 1 0 7 1 0 0 0 0
17/05/2010 13:10 16:10 3 0 0 178 4 0 8 0 0
18/05/2010 09:30 12:30 5 1 0 43 11 2 4 1 0
18/05/2010 13:00 16:00 10 1 0 295 1 0 6 0 0
25/05/2010 09:30 12:30 0 0 0 24 14 1 3 0 0

Appendices to Technical Appendix A7.1
Forthwind Demonstration Project
Page 61
Date Start Finish
Lesser black-backed gull (height)
Herring gull (height)
Great black-backed gull (height)
1 2 3 1 2 3 1 2 3
25/05/2010 13:00 16:00 0 0 0 43 5 0 3 1 0
16/06/2010 10:10 13:10 4 4 0 8 12 2 1 0 0
17/06/2010 13:30 16:30 10 9 0 38 14 0 1 1 0
25/06/2010 09:50 12:50 1 2 0 2 11 6 3 3 0
25/06/2010 13:05 16:05 1 1 0 7 15 4 19 16 4
26/07/2010 10:00 13:00 1 0 0 5 2 0 11 4 0
16/06/2011 09:40 12:40 8 3 0 12 11 3 2 2 0
16/06/2011 13:00 16:00 25 6 0 30 2 0 5 3 0
29/06/2011 09:40 12:40 0 1 0 2 5 14 1 0 0
29/06/2011 13:00 16:00 3 1 0 8 5 2 3 1 0
13/07/2011 09:45 12:45 1 0 0 7 4 5 0 2 0
13/07/2011 13:00 16:00 7 0 0 6 1 1 1 1 1
09/08/2011 09:30 12:30 1 1 0 7 6 4 3 1 0
09/08/2011 13:00 16:00 27 0 0 29 0 1 1 2 0
26/08/2011 09:15 12:15 20 2 0 8 2 0 19 8 1
26/08/2011 12:30 15:30 11 2 0 6 0 0 5 2 0
31/08/2011 09:30 12:30 4 0 0 13 1 1 8 4 0
31/08/2011 12:50 15:50 17 3 0 14 0 2 5 1 0
28/09/2011 10:10 13:10 0 0 0 34 11 3 1 0 2
28/09/2011 13:20 16:20 0 0 0 117 4 3 0 1 0
04/10/2011 09:20 12:20 0 0 0 20 4 3 3 4 1
04/10/2011 12:30 15:30 0 0 0 2 2 0 2 6 0
26/10/2011 09:45 12:45 0 0 0 15 8 2 1 1 0
26/10/2011 13:00 16:00 8 1 0 16 2 5 9 5 0
28/10/2011 09:20 12:20 1 0 0 14 11 4 2 1 1
28/10/2011 12:50 15:50 0 0 0 9 4 1 1 3 0
23/11/2011 09:15 12:15 0 0 0 7 1 0 9 1 0
23/11/2011 12:30 15:30 0 0 0 17 4 0 6 1 0
25/11/2011 10:15 13:15 0 0 0 14 4 1 20 2 1
02/12/2011 10:15 13:15 0 0 0 13 14 7 11 0 1
15/12/2011 11:55 14:55 0 0 0 35 25 26 5 2 0
20/12/2011 11:35 14:35 0 0 0 9 9 2 2 1 0
22/12/2011 10:50 13:50 3 0 0 27 6 2 15 5 0
05/01/2012 11:30 14:30 0 0 0 27 6 8 8 4 0
27/01/2012 09:45 12:45 0 0 0 31 8 1 3 0 0
27/01/2012 12:45 15:45 0 0 0 11 14 4 9 1 1
08/02/2012 09:35 12:35 0 0 0 22 8 3 6 2 0
08/02/2012 12:40 15:40 0 0 0 24 7 5 9 0 0
27/02/2012 09:50 12:50 0 0 0 10 7 1 0 1 1
27/02/2012 12:50 15:50 0 0 0 5 4 5 3 2 1
28/02/2012 09:30 12:30 0 2 0 15 9 2 3 0 0
28/02/2012 12:35 15:35 0 0 0 13 6 1 1 0 0
28/03/2012 10:00 13:00 0 0 0 28 9 2 2 0 0
28/03/2012 13:10 16:10 0 0 0 17 22 2 3 7 0
11/04/2012 09:10 12:10 0 1 0 47 14 1 0 0 0
11/04/2012 12:30 15:30 1 0 0 60 8 4 7 1 0
24/04/2012 10:00 13:00 0 1 0 20 6 2 5 1 0
24/04/2012 13:10 16:10 0 0 0 27 10 1 0 0 0
01/05/2012 09:15 12:15 1 1 0 21 10 0 0 0 0
01/05/2012 12:30 15:30 0 1 0 15 11 3 1 3 0
01/06/2012 13:40 16:40 1 1 0 39 29 5 1 1 0
01/06/2012 10:00 13:00 3 0 0 73 15 2 0 2 0
05/06/2012 09:45 12:45 9 1 0 180 36 1 7 1 0
05/06/2012 13:00 16:00 6 3 0 46 17 3 3 5 3

Appendices to Technical Appendix A7.1
Forthwind Ltd
Page 62
2 APPENDIX 2
2.1 Sea Use Surveys
The data in Tables A2.1 to 2.21 provide the maximum count and average count per month (all sea use surveys combined).
Table A2.1: Sea Use Survey: Red-throated Diver Species Max. count Average count
December 2009 4 0.52
January 2010 1 0.11
February 2010 3 0.43
March 2010 2 0.23
April 2010 1 0.05
May 2010 0 0
June 2010 0 0
July 2010 0 0
June 2011 0 0
July 2011 0 0
August 2011 1 0.02
September 2011 1 0.07
October 2011 2 0.31
November 2011 1 0.1
December 2011 1 0.14
January 2012 1 0.14
February 2012 1 0.1
March 2012 0 0
April 2012 3 0.32
May 2012 1 0.07
June 2012 0 0
Table A2.2: Sea Use Survey: Eider Species Max. count Average count
December 2009 7 3.19
January 2010 30 13.4
February 2010 26 15.4
March 2010 26 8.44
April 2010 0 0
May 2010 0 0
June 2010 0 0
July 2010 16 2.18
June 2011 3 0.14
July 2011 0 0
August 2011 70 5.88
September 2011 0 0
October 2011 5 0.19
November 2011 2 0.1
December 2011 3 0.79
January 2012 6 3.14
February 2012 16 4.19
March 2012 0 0
April 2012 3 0.21
May 2012 0 0
June 2012 1 0.04
Table A2.3: Sea Use Survey: Long-tailed Duck Species Max. count Average count
December 2009 4 0.57
January 2010 32 8.68
February 2010 10 2.57
March 2010 4 0.28
April 2010 4 0.36

Appendices to Technical Appendix A7.1
Forthwind Demonstration Project
Page 63
Species Max. count Average count
May 2010 0 0
June 2010 0 0
July 2010 0 0
June 2011 0 0
July 2011 0 0
August 2011 0 0
September 2011 0 0
October 2011 0 0
November 2011 0 0
December 2011 2 0.11
January 2012 12 3.76
February 2012 5 1.02
March 2012 2 0.28
April 2012 0 0
May 2012 0 0
June 2012 0 0
Table A2.4: Sea Use Survey: Common Scoter Species Max. count Average count
December 2009 0 0
January 2010 0 0
February 2010 22 2.57
March 2010 37 3.21
April 2010 0 0
May 2010 20 0.57
June 2010 0 0
July 2010 0 0
June 2011 0 0
July 2011 0 0
August 2011 0 0
September 2011 0 0
October 2011 0 0
November 2011 6 0.57
December 2011 8 2.07
January 2012 7 1.29
February 2012 13 2.64
March 2012 0 0
April 2012 10 0.79
May 2012 2 0.29
June 2012 0 0
Table A2.5: Sea Use Survey: Velvet Scoter Species Max. count Average count
December 2009 1 0.1
January 2010 2 0.07
February 2010 3 0.21
March 2010 15 0.56
April 2010 12 2.05
May 2010 0 0
June 2010 0 0
July 2010 0 0
June 2011 0 0
July 2011 0 0
August 2011 0 0
September 2011 0 0
October 2011 0 0
November 2011 2 0.1
December 2011 6 0.89
January 2012 3 0.86
February 2012 8 0.93

Appendices to Technical Appendix A7.1
Forthwind Ltd
Page 64
Species Max. count Average count
March 2012 3 0.43
April 2012 10 1.79
May 2012 4 1.29
June 2012 0 0
Table A2.6: Sea Use Survey: Scoter Species Species Max. count Average count
December 2009 3 0.238095
January 2010 13 1.178571
February 2010 15 2.071429
March 2010 52 2.153846
April 2010 30 2.272727
May 2010 0 0
June 2010 0 0
July 2010 0 0
June 2011 0 0
July 2011 0 0
August 2011 0 0
September 2011 0 0
October 2011 0 0
November 2011 0 0
December 2011 0 0
January 2012 0 0
February 2012 0 0
March 2012 0 0
April 2012 0 0
May 2012 0 0
June 2012 0 0
Table A2.7: Sea Use Survey: Red-breasted Merganser Species Max. count Average count
December 2009 0 0
January 2010 2 0.25
February 2010 0 0
March 2010 1 0.05
April 2010 0 0
May 2010 0 0
June 2010 0 0
July 2010 0 0
June 2011 0 0
July 2011 0 0
August 2011 0 0
September 2011 0 0
October 2011 0 0
November 2011 0 0
December 2011 0 0
January 2012 0 0
February 2012 0 0
March 2012 0 0
April 2012 0 0
May 2012 0 0
June 2012 0 0
Table A2.8: Sea Use Survey: Goosander Species Max. count Average count
December 2009 0 0
January 2010 0 0
February 2010 0 0
March 2010 0 0
April 2010 0 0
May 2010 1 0.03

Appendices to Technical Appendix A7.1
Forthwind Demonstration Project
Page 65
Species Max. count Average count
June 2010 0 0
July 2010 0 0
June 2011 0 0
July 2011 0 0
August 2011 0 0
September 2011 0 0
October 2011 0 0
November 2011 0 0
December 2011 0 0
January 2012 0 0
February 2012 0 0
March 2012 0 0
April 2012 0 0
May 2012 0 0
June 2012 0 0
Table A2.9: Sea Use Survey: Gannet Species Max. count Average count
December 2009 0 0
January 2010 0 0
February 2010 0 0
March 2010 0 0
April 2010 3 0.36
May 2010 20 0.63
June 2010 2 0.07
July 2010 1 0.04
June 2011 23 2.21
July 2011 0 0
August 2011 1 0.05
September 2011 5 0.71
October 2011 1 0.02
November 2011 0 0
December 2011 0 0
January 2012 0 0
February 2012 0 0
March 2012 0 0
April 2012 1 0.07
May 2012 1 0.14
June 2012 2 0.18
Table A2.10: Sea Use Survey: Herring Gull Species Max. count Average count
December 2009 3 0.48
January 2010 9 3.5
February 2010 11 4.07
March 2010 58 4.79
April 2010 8 0.59
May 2010 52 4.63
June 2010 0 0
July 2010 1 0.04
June 2011 40 3.54
July 2011 12 1.5
August 2011 11 1.24
September 2011 50 8.21
October 2011 4 0.33
November 2011 0 0
December 2011 0 0
January 2012 0 0
February 2012 0 0
March 2012 0 0
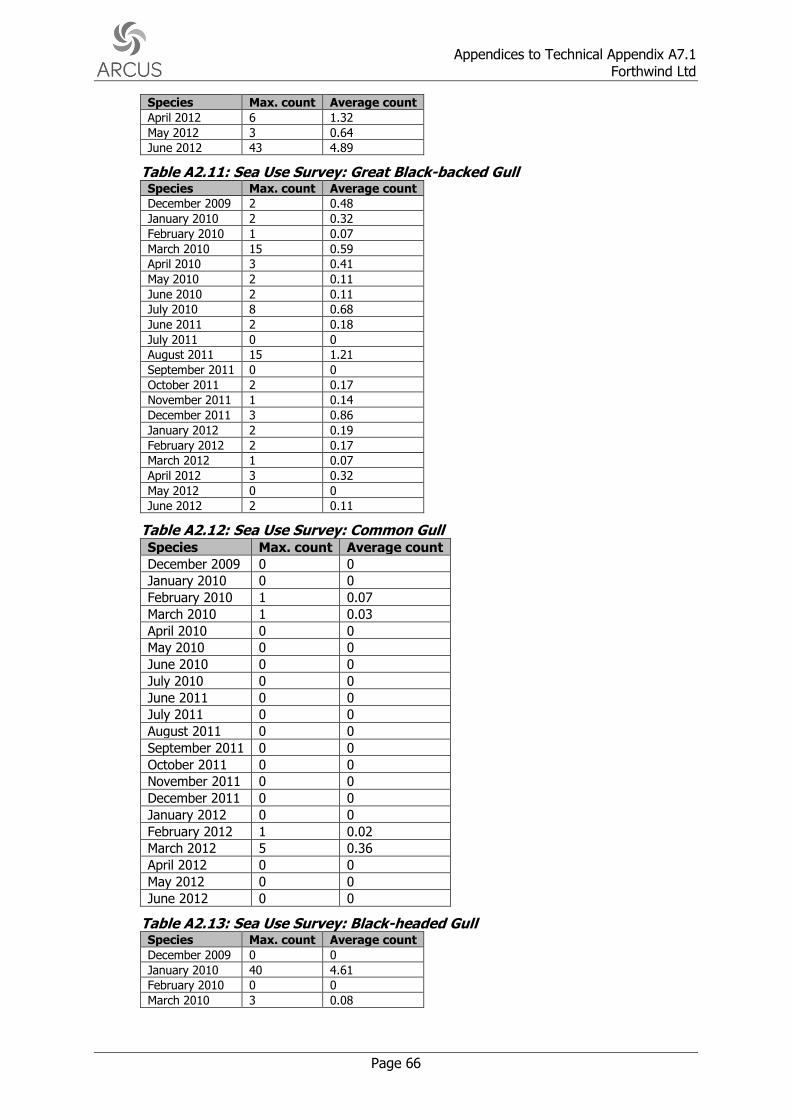
Appendices to Technical Appendix A7.1
Forthwind Ltd
Page 66
Species Max. count Average count
April 2012 6 1.32
May 2012 3 0.64
June 2012 43 4.89
Table A2.11: Sea Use Survey: Great Black-backed Gull Species Max. count Average count
December 2009 2 0.48
January 2010 2 0.32
February 2010 1 0.07
March 2010 15 0.59
April 2010 3 0.41
May 2010 2 0.11
June 2010 2 0.11
July 2010 8 0.68
June 2011 2 0.18
July 2011 0 0
August 2011 15 1.21
September 2011 0 0
October 2011 2 0.17
November 2011 1 0.14
December 2011 3 0.86
January 2012 2 0.19
February 2012 2 0.17
March 2012 1 0.07
April 2012 3 0.32
May 2012 0 0
June 2012 2 0.11
Table A2.12: Sea Use Survey: Common Gull Species Max. count Average count
December 2009 0 0
January 2010 0 0
February 2010 1 0.07
March 2010 1 0.03
April 2010 0 0
May 2010 0 0
June 2010 0 0
July 2010 0 0
June 2011 0 0
July 2011 0 0
August 2011 0 0
September 2011 0 0
October 2011 0 0
November 2011 0 0
December 2011 0 0
January 2012 0 0
February 2012 1 0.02
March 2012 5 0.36
April 2012 0 0
May 2012 0 0
June 2012 0 0
Table A2.13: Sea Use Survey: Black-headed Gull Species Max. count Average count
December 2009 0 0
January 2010 40 4.61
February 2010 0 0
March 2010 3 0.08

Appendices to Technical Appendix A7.1
Forthwind Demonstration Project
Page 67
Species Max. count Average count
April 2010 0 0
May 2010 0 0
June 2010 0 0
July 2010 0 0
June 2011 0 0
July 2011 0 0
August 2011 1 0.05
September 2011 38 10.7
October 2011 20 1.29
November 2011 0 0
December 2011 0 0
January 2012 0 0
February 2012 2 0.12
March 2012 0 0
April 2012 1 0.04
May 2012 0 0
June 2012 0 0
Table A2.14: Sea Use Survey: Kittiwake Species Max. count Average count
December 2009 0 0
January 2010 0 0
February 2010 0 0
March 2010 0 0
April 2010 0 0
May 2010 1 0.03
June 2010 0 0
July 2010 0 0
June 2011 40 3
July 2011 3 0.21
August 2011 1 0.02
September 2011 35 5.14
October 2011 0 0
November 2011 0 0
December 2011 0 0
January 2012 0 0
February 2012 4 0.1
March 2012 0 0
April 2012 0 0
May 2012 0 0
June 2012 5 0.39
Table A2.15: Sea Use Survey: Lesser Black-backed Gull Species Max. count Average count
December 2009 0 0
January 2010 0 0
February 2010 0 0
March 2010 2 0.05
April 2010 0 0
May 2010 5 0.26
June 2010 1 0.04
July 2010 0 0
June 2011 15 1.25
July 2011 0 0
August 2011 22 2.17
September 2011 1 0.07
October 2011 2 0.17
November 2011 0 0
December 2011 0 0
January 2012 1 0.05

Appendices to Technical Appendix A7.1
Forthwind Ltd
Page 68
Species Max. count Average count
February 2012 0 0
March 2012 0 0
April 2012 1 0.04
May 2012 1 0.07
June 2012 1 0.04
Table A2.16: Sea Use Survey: Cormorant Species Max. count Average count
December 2009 4 0.48
January 2010 1 0.07
February 2010 2 0.71
March 2010 7 0.87
April 2010 1 0.36
May 2010 1 0.14
June 2010 1 0.14
July 2010 2 0.29
June 2011 1 0.04
July 2011 0 0
August 2011 2 0.19
September 2011 3 0.64
October 2011 0 0
November 2011 1 0.19
December 2011 5 1.07
January 2012 4 0.57
February 2012 1 0.12
March 2012 1 0.29
April 2012 2 0.18
May 2012 0 0
June 2012 0 0
Table A2.17: Sea Use Survey: Shag Species Max. count Average count
December 2009 7 2.95
January 2010 6 1.36
February 2010 1 0.14
March 2010 4 0.46
April 2010 1 0.14
May 2010 1 0.06
June 2010 0 0
July 2010 2 0.18
June 2011 1 0.11
July 2011 0 0
August 2011 6 1.21
September 2011 2 0.36
October 2011 2 0.24
November 2011 2 0.48
December 2011 4 1
January 2012 4 0.9
February 2012 4 1.48
March 2012 3 0.64
April 2012 6 0.75
May 2012 4 0.50
June 2012 2 0.36
Table A2.18: Sea Use Survey: Guillemot Species Max. count Average count
December 2009 0 0
January 2010 1 0.11
February 2010 4 0.86
March 2010 7 0.54
April 2010 1 0.05

Appendices to Technical Appendix A7.1
Forthwind Demonstration Project
Page 69
Species Max. count Average count
May 2010 5 0.17
June 2010 4 0.18
July 2010 7 0.75
June 2011 25 7.11
July 2011 9 2.5
August 2011 2 0.14
September 2011 65 24.3
October 2011 16 1.26
November 2011 0 0
December 2011 0 0
January 2012 1 0.1
February 2012 2 0.26
March 2012 6 0.93
April 2012 6 1.21
May 2012 6 1.86
June 2012 22 3.82
Table A2.19: Sea Use Survey: Puffin Species Max. count Average count
December 2009 0 0
January 2010 0 0
February 2010 0 0
March 2010 0 0
April 2010 0 0
May 2010 0 0
June 2010 1 0.04
July 2010 0 0
June 2011 8 1.29
July 2011 0 0
August 2011 0 0
September 2011 9 0.64
October 2011 0 0
November 2011 0 0
December 2011 0 0
January 2012 0 0
February 2012 1 0.05
March 2012 0 0
April 2012 2 0.07
May 2012 2 0.14
June 2012 2 2.85
Table A2.20: Sea Use Survey: Razorbill Species Max. count Average count
December 2009 0 0
January 2010 3 0.32
February 2010 4 0.36
March 2010 0 0
April 2010 0 0
May 2010 0 0
June 2010 0 0
July 2010 1 0.04
June 2011 3 0.32
July 2011 0 0
August 2011 0 0
September 2011 0 0
October 2011 3 0.33
November 2011 1 0.05
December 2011 1 0.04
January 2012 1 0.14
February 2012 4 0.29
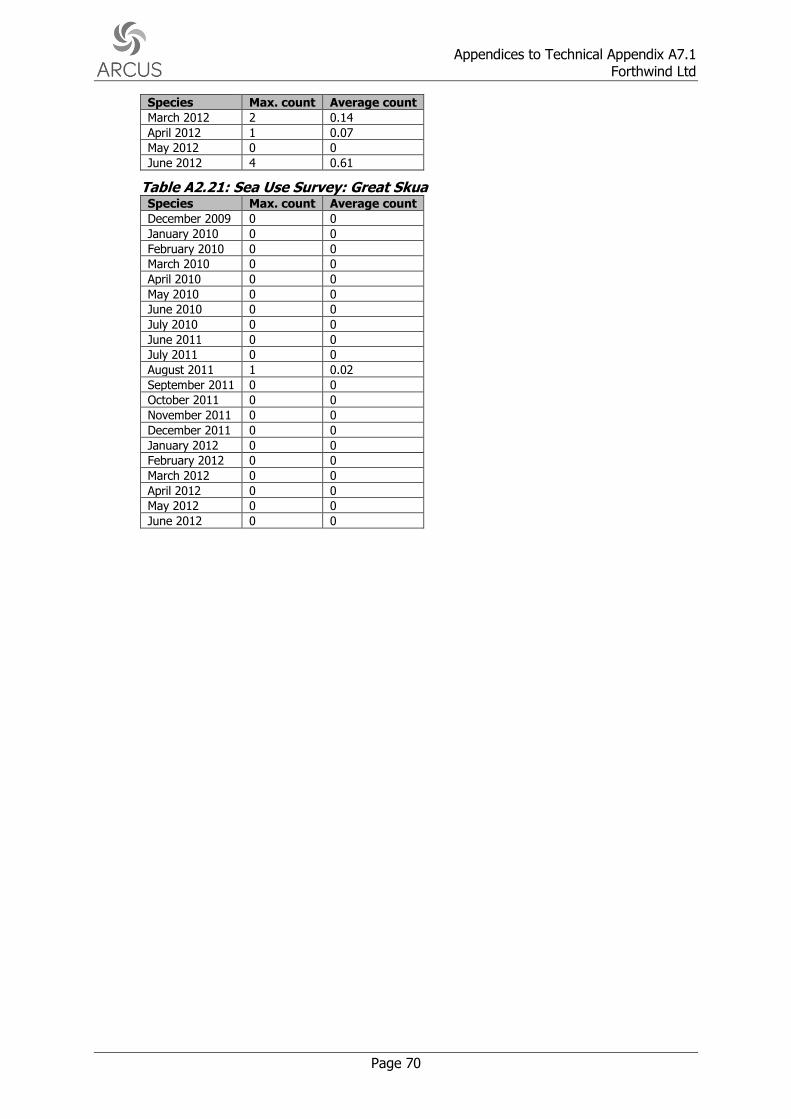
Appendices to Technical Appendix A7.1
Forthwind Ltd
Page 70
Species Max. count Average count
March 2012 2 0.14
April 2012 1 0.07
May 2012 0 0
June 2012 4 0.61
Table A2.21: Sea Use Survey: Great Skua Species Max. count Average count
December 2009 0 0
January 2010 0 0
February 2010 0 0
March 2010 0 0
April 2010 0 0
May 2010 0 0
June 2010 0 0
July 2010 0 0
June 2011 0 0
July 2011 0 0
August 2011 1 0.02
September 2011 0 0
October 2011 0 0
November 2011 0 0
December 2011 0 0
January 2012 0 0
February 2012 0 0
March 2012 0 0
April 2012 0 0
May 2012 0 0
June 2012 0 0

Forthwind Demonstration Project Technical Appendix
Habitat Regulations Appraisal
Page 1-1
1 HABITAT REGULATIONS APPRAISAL
1.1 Introduction
In Scotland, the Conservation of Habitats and Species Regulations 2010, and the Conservation
(Natural Habitats, &c.) Regulations 1994 transpose the requirements of the EC Habitats Directive and EC Birds Directive into national law within Scottish Territorial Waters, (up to the
12 nautical mile (NM) territorial waters limit). The 2010 Regulations consolidate various
amendments to the 1994 Regulations and apply in Scotland to, among other things, Section 36 applications. The regulations which transpose the obligations imposed by both the Birds
and Habitats Directives are commonly abbreviated to the Habitat Regulations.
In order to comply with the Directives the Habitat Regulations require competent authorities
to carry out Appropriate Assessments (AA) in certain circumstances where a project (or plan)
affects a Natura 2000 (European) site, its qualifying features, or its Conservation Objectives. The competent authority must consider whether or not the project or plan is likely to result in
a Likely Significant Effect (LSE). This process is known as a Habitat Regulations Appraisal (HRA).
Consultation with Marine Scotland Licensing Operations Team (MS-LOT), the competent authority for offshore wind farm developments in Scottish Territorial Waters, and Scottish
Natural Heritage (SNH), the Scottish Government’s statutory nature conservation adviser,
have confirmed that an HRA is required for the proposed Forthwind Demonstration Project, with reference to SNH (2014)1.
The potential for significant effects of the proposed Forthwind Demonstration Project on Natura 2000 sites and their qualifying features and nature conservation objectives have been
assessed with information provided in this Chapter, following EC (2002)2 guidance, to help
inform an Appropriate Assessment by the competent authority.
1.2 Background to the Development
The proposed Forthwind Demonstration Project (hereafter referred to as "the Development") is located on the northern side of the Firth of Forth at Methil, Scotland and is approximately
1.5 km seaward from the mean high water springs (MHWS).
The Development Footprint Envelope consists of the following:
Two turbines and sub-structure (foundation and tubular jacket if required) located at
National Grid reference (NGR) 336964, 696677 (turbine 1), and NGR 337812, 697333
(turbine 2). A 100 m micrositing allowance from these centre points for the turbines andassociated infrastructure is required for the final selection of turbine locations.
An electricity export cable corridor of up to 121 ha in area, within which cables will be laid
in up to 2 trenches measuring not more than 3100 m in length. These will contain thecables that transmit the electricity generated by each turbine to the onshore transformer.
Further details of the Development are provided in Chapter 3: Project Description of this ES.
1.3 Methodology
The approach taken within this HRA is as follows:
Details provided on relevant SPAs and Special Areas of Conservation (SAC) and theirrespective Conservation Objectives following SPA screening.
1 SNH (2014) Interim guidance on apportioning impacts from marine renewables developments to breeding seabird populations
in Special Protection Area. 2 EC (European Commission) (2002) Assessment of plans and projects significantly affecting Natura 2000 sites: Methodological
guidance on the provisions of Article 6(3) and (4) of the Habitats Directive 92/43/EEC. Luxembourg: Office for Official Publications of the European Communities.

Technical Appendix Forthwind Demonstration Project
Habitat Regulations Appraisal
Page 1-2
A summary of the baseline condition and screening of SPA qualifying species based on the assessment of impacts for specific receptors provided in Chapter 7: Ornithology , Chapter 8: Marine Mammals and Chapter 13: Fish and Shellfish Ecology of this ES.
The potential effects and Likely Significant Effect Assessment on identified Natura 2000 sites and their qualifying features.
Summary of Likely Significant Effects.
1.4 Special Protection Areas Screening
Consultation has indicated that potential effects on the Firth of Forth SPA and Forth Islands SPA should be considered as part of this HRA. These SPAs were assessed in Chapter 7:
Ornithology of the Environmental Statement. Two other sites designated for ornithological value within the vicinity of the site (Loch Leven SPA and Cameron Reservoir SPA) are not
considered to be close enough to be affected by the Development based on the lack of
meaningful connectivity. There is unlikely to be meaningful connectivity between the Development site and any other designated site that would result in the Development
undermining any of the conservation objectives for the designated sites’ qualifying interests.
With the exception of the Firth of Forth SPA and Forth Islands SPA, there are therefore no
potentially LSEs on any other designated sites and they have been screened out of further
detailed assessment. SNH provided details of a draft Special Protection Area (dSPA), at present referred to as the Outer Firth of Forth and Tay Bay Complex dSPA3. SNH
recommended that this draft designated site is considered in regards to the Development HRA, although at this stage the designation does not hold any legal standing4.
1.4.1 SPA Conservation Objectives
The conservation objectives for the Firth of Forth SPA and the Forth Islands SPA are the
same. There are no conservation objectives set for the Outer Firth of Forth and Tay Bay
Complex dSPA, but it is assumed that they would also be the same as those of the Firth of Forth SPA and Forth Islands SPA if the site was granted SPA status. The conservation
objectives for the SPAs are below (SNH 2015)5:
To avoid deterioration of the habitats of the qualifying species or significant disturbance to the qualifying species, thus ensuring that the integrity of the site is maintained; and
To ensure for the qualifying species that the following are maintained in the long term:
Population of the species as a viable component of the site; Distribution of the species within site; Distribution and extent of habitats supporting the species; Structure, function and supporting processes of habitats supporting the species; and No significant disturbance of the species.
1.5 Special Areas of Conservation Screening
There are three SACs on the east coast of Scotland that relate to marine mammals which could be affected by the Development: Firth of Tay and Eden Estuary SAC, Isle of May SAC,
and Berwickshire and North Northumberland Coast SAC. Other SACs have been screened out in Chapter 8: Marine Mammals of this ES, and other qualifying features for these SACs (e.g.
referring to Annex I habitats) have also been screened out and are not considered further.
One SAC that relates to fish and shellfish that could be affected by the Development was identified in Chapter 13: Fish and Shellfish Ecology of this ES: River Teith SAC. Five other
SACs have been screened out for potential connectivity with the Development during the
3 Release pack for Marine SPAs http://www.snh.gov.uk/docs/A1350044.pdf4 If the dSPA was adopted as a proposed SPA (pSPA) the site would have the full legislative protection afforded to SPAs and
would therefore be subject to HRA. 5 SNH (2015) Site details for Firth of Forth SPA http://gateway.snh.gov.uk/sitelink/siteinfo.jsp?pa_code=8499

Forthwind Demonstration Project Technical Appendix
Habitat Regulations Appraisal
Page 1-3
assessment: River Spey SAC, Ricer Dee SAC, River South Esk SAC, River Tay SAC, River
Tweed SAC. These five SACs are not discussed further.
Firth of Tay and Eden Estuary SAC, Isle of May SAC, Berwickshire and North Northumberland
Coast SAC and River Teith SAC are considered further below.
1.5.1 SAC Conservation Objectives
The conservation objectives for the Firth of Tay and Eden Estuary SAC, Isle of May SAC, and
the Berwickshire and North Northumberland SAC are the same and are provided below (SNH 2015)6:
To avoid deterioration of the qualifying habitats thus ensuring that the integrity of the site is maintained and the site makes an appropriate contribution to achieving favourable conservation status for each of the qualifying features; and
To ensure for the qualifying habitats that the following are maintained in the long-term:
Extent of the habitat on site; Distribution of the habitat within the site; Structure and function of the habitat; Processes supporting the habitat; Distribution of typical species of the habitat; Viability of typical species as components of the habitat; and No significant disturbance of typical species of the habitat.
The conservation objectives for the River Teith SAC are different to those above and are
provided below (SNH 2015)7:
To avoid deterioration of the habitats of the qualifying species or significant disturbance to the qualifying species, thus ensuring that the integrity of the site is maintained and the site makes an appropriate contribution to achieving favourable conservation status for each of the qualifying features; and
To ensure for the qualifying species that the following are maintained in the long-term:
Population of the species, including range of genetic types for salmon, as a viable component of the site;
Distribution of the species within the site; Distribution and extent of habitats supporting the species; Structure, function and supporting processes of habitats supporting the species; and
No significant disturbance of the species.
1.6 Identified European Sites, Potential Effects and Likely Significant Effects Assessment
Table 1.1 lists the European sites considered further: Firth of Forth SPA, Forth Islands SPA,
Outer Firth of Forth and Tay Bay Complex dSPA, Firth of Tay and Eden Estuary SAC, Isle of May SAC, Berwickshire and North Northumberland SAC, and River Teith SAC, and relevant
designated features identified above.
In addition, Table 1.1 identifies the potential effects associated with each site and outlines the
results of the Likely Significant Effect Assessment. This takes any proposed mitigation (during construction, operation and decommissioning) into consideration.
6 SNH (2015) Site details for Firth of Tay and Eden Estuary SAC http://gateway.snh.gov.uk/sitelink/siteinfo.jsp?pa_code=8257
(NB conservation objectives are the same for Isle of May SAC, and the Berwickshire and North Northumberland SAC. 7 SNH (2015) Site details for River Teith SAC http://gateway.snh.gov.uk/sitelink/siteinfo.jsp?pa_code=8367

Technical Appendix Forthwind Demonstration Project
Habitat Regulations Appraisal
Page 1-4
Table 1.1 European sites, potential effects, mitigation and Likely Significant Effects assessment Site Name and Distance
Features Potentially Affected Potential Impacts to Features based on EIA Assessment
Mitigation Measures Proposed
Likely Significant Effects
Firth of Forth SPA
Adjacent to terrestrial parts of Development, 1.2 km from turbine locations
“The Firth of Forth SPA is a complex of estuarine and coastal habitats in south east Scotland stretching east from Alloa to the coasts of Fife and East Lothian. The site includes extensive invertebrate-rich intertidal flats and rocky shores, areas of saltmarsh, lagoons and sand dune”
This site qualifies under Article 4.1 of the Directive (2009/147/EC) by supporting populations of European importance of the following species listed on Annex I of the Directive:
Over winter:
Red-throated diver: 90 birds, 2 % of GB population (5-year peak mean 1993/94–1997/98)
Oystercatcher: 7,846 birds, 2 % of GB population (5-year peak mean 1993/94–1997/98)
Slavonian grebe: 84 birds, 21 % of GB population (5-year peak mean 1993/94–1997/98)
Bar-tailed godwit: 1,974 birds, 4 % of GB population (5-year peak mean 1993/94–1997/98)
Golden plover: 2,949 birds, 2 % of GB population
(5-year peak mean 1993/94–1997/98)
On Passage:
Sandwich tern: 1,617 birds, 6 % of GB population (5-year peak mean 1993/94–1997/98)
This site also qualifies under Article 4.2 of the Directive (2009/147/EC) by supporting populations of European importance of the following migratory species:
Over winter:
Pink-footed goose: 10,852 birds, 6 % of Eastern Greenland/Iceland/UK population (5-year peak mean 1993/94–1997/98)
Qualifying species Slavonian grebe, bar-tailed godwit, golden plover, redshank and turnstone, and assemblage species great crested grebe, wigeon, ringed plover, grey plover, lapwing, dunlin and bar-tailed godwit were not recorded in the Core Survey Area (CSA) during the baseline surveys. There is therefore considered to be no connectivity between the CSA and the SPA for these species and they are not considered further in this HRA.
Qualifying species oystercatcher, pink-footed goose, shelduck, knot, and sandwich tern and other qualifying assemblage species mallard, scaup, goldeneye and curlew were all recorded infrequently and in low numbers. There is therefore considered to be no meaningful connectivity between the CSA and the SPA for these species and they
are not considered further in this HRA.
The remaining seven SPA qualifying/assemblage species were recorded more frequently during the survey period: red-throated diver, cormorant, eider, long-tailed duck, common scoter, velvet scoter and red-breasted merganser. It is considered likely that there is connectivity between the CSA and the SPA for these species and it was considered that there is therefore potential for likely significant
effects as a result of the following potential impacts of the Development during construction/decommissioning, and operation.
1. Disturbance/displacement and indirect habitat loss
A Pollution Prevention Plan will be in place to protect birds from pollution during construction, operation and decommissioning.
No additional mitigation measures are proposed as a result of the EIA.
A Likely Significant Effect on non-breeding red-throated diver is predicted with temporary disturbance/displacement during the construction and decommissioning stage.
A Likely Significant Effect on non-breeding red-throated diver, long-tailed duck, common scoter and velvet scoter is predicted due to disturbance/ displacement during the operational stage.
No Likely Significant
Effects are predicted for the remaining Firth of Forth SPA features as a result of disturbance/ displacement during construction, decommissioning and operation.
No Likely Significant Effects are predicted for the Firth of Forth SPA as a result of barrier effect, collision risk, or indirect effect during construction, decommissioning and operation.

Forthwind Demonstration Project Technical Appendix
Habitat Regulations Appraisal
Page 1-5
Site Name and Distance
Features Potentially Affected Potential Impacts to Features based on EIA Assessment
Mitigation Measures Proposed
Likely Significant Effects
Shelduck: 4,509 birds, 2 % of North-western Europe population (5-year peak mean 1993/94–1997/98) Knot: 9,258 birds, 3 % of North-eastern Canada/Greenland/Iceland/North-western Europe population (5-year peak mean 1991/92–1995/96) Redshank: 4,341 birds, 3 % of Eastern Atlantic – wintering population (5-year peak mean 1993/94–1997/98) Turnstone: 860 individuals, 1 % of Western Palearctic wintering population (5-year peak mean 1993/94–1997/98) Assemblage qualification: An internationally important assemblage of birds. The area qualifies under Article 4.2 of the Directive (2009/147/EC) by regularly supporting at least 20,000 waterfowl: Over winter, the area regularly supports 95,000 individual waterfowl (5-year peak mean 01/08/2000) including: red-throated diver, great crested grebe, Slavonian grebe, cormorant, pink-footed goose, shelduck, wigeon, mallard, scaup, eider, long-tailed duck, common scoter, velvet scoter, goldeneye, red-breasted merganser, oystercatcher, ringed plover, golden plover, grey plover, lapwing, knot, dunlin, bar-tailed godwit, curlew, redshank and turnstone.
to foraging or roosting birds; 2. Barrier effect as a result of turbines
blocking flight paths of foraging and migrating birds;
3. Collision leading to direct mortality; and
4. Indirect effects, e.g. as a result of changes in the abundance/distribution of their fish prey.
The residual effect to the SPA, after mitigation of the Development, as a result of collision risk, barrier effect and indirect effects was considered to be negligible during construction and decommissioning for all SPA features. For disturbance/ displacement during construction and decommissioning, effects were considered as follows:
Low (temporary): eider, red-breasted merganser, cormorant (breeding season);
Medium (temporary): long-tailed duck, common scoter, velvet scoter and cormorant (non-breeding season);
High (temporary): red-throated diver.
The residual effect to the SPAs, after mitigation of the Development, as a result of collision risk, barrier effect and indirect effects was considered to be negligible during operation for all SPA species. For disturbance/displacement during operation
effects were considered as follows:
Low (long term): red-breasted merganser, cormorant (breeding season);
Medium (long term): eider, and cormorant (non-breeding season);

Technical Appendix Forthwind Demonstration Project
Habitat Regulations Appraisal
Page 1-6
Site Name and Distance
Features Potentially Affected Potential Impacts to Features based on EIA Assessment
Mitigation Measures Proposed
Likely Significant Effects
High (long term): long-tailed duck,common scoter, velvet scoter, and red-throated diver.
Forth Islands SPA
17 km to south-east
“Forth Islands SPA consists of a series of islands supporting the main seabird colonies in the Firth of Forth. The islands of Inchmickery, Isle of May, Fidra, The Lamb, Craigleith and Bass Rock were classified on 25 April 1990. The extension to the site, classified on the 13th February 2004 consists of the island of Long Craig, which supports the largest colony of roseate tern in Scotland. It is the most northerly of only six regular British colonies”
This site qualifies under Article 4.1 of the Directive (2009/147/EC) by supporting populations of European importance of the following species listed on Annex I of the Directive:
Breeding Season:
Arctic tern: 540 pairs, 1.2 % of GB population (5-year mean 1992–1996)
Roseate tern: 8 pairs, 13 % of GB population (5-year mean 1997–2001)
Common tern: 334 pairs, 3 % of GB population (5-year mean 1997–2001)
Sandwich tern: 440 pairs, 3 % of GB population (SCRC 1985–1988)
This site also qualifies under Article 4.2 of the Directive (2009/147/EC) by supporting populations of European importance of the following migratory species:
Breeding Season:
Gannet: 21,600 pairs, 8.2 % of world population (SCRC 1985–1988)
Shag: 2,400 pairs, 1.9 % of northern Europe population (SCRC 1985–1988)
Lesser black-backed gull: 1,500 pairs, 1.2 % of graellsii subspecies world breeding population (SCRC 1985–1988)
SPA qualifying and assemblage species Arctic tern, roseate tern and common tern were not recorded during the baseline surveys. There is therefore considered to be no connectivity between the CSA and the SPA for these species and they are not
considered further within this HRA.
SPA qualifying species sandwich tern was recorded infrequently. There is therefore considered to be no meaningful connectivity between the CSA and the SPA for this species and it is not considered further within this HRA.
Qualifying species gannet, shag, lesser black-backed gull and puffin, and other assemblage species razorbill, fulmar, herring gull, cormorant, kittiwake and guillemot were all recorded frequently during the baseline surveys. It is considered likely that there is connectivity between the CSA and the SPA for these species and it was considered that there is therefore potential for likely significant effects as a result of the following potential impacts of the Development during construction/decommissioning, and operation.
1. Disturbance/displacement and indirect habitat lossto foraging or roosting birds;
2. Barrier effect as a result of turbinesblocking flight paths of foraging andmigrating birds;
3. Collision leading to direct mortality;
A Pollution Prevention Plan will be in place to protect birds from pollution during construction, operation and decommissioning.
No additional mitigation measures are proposed as a result of the Environmental Impact Assessment carried out.
No Likely Significant Effects are predicted for the Forth Islands SPA as a result of disturbance/ displacement, barrier effect, collision risk, or
indirect effect during construction, decommissioning and operation.

Forthwind Demonstration Project Technical Appendix
Habitat Regulations Appraisal
Page 1-7
Site Name and Distance
Features Potentially Affected Potential Impacts to Features based on EIA Assessment
Mitigation Measures Proposed
Likely Significant Effects
Puffin: 14,000 pairs, 1.5 % of grabae subspecies world population (SCRC 1985–1988) Assemblage qualification: Assemblage qualification: An internationally important assemblage of birds. The area qualifies under Article 4.2 of the Directive (2009/147/EC) by regularly supporting at least 20,000 waterfowl: During the breeding season, the area regularly supports 90,000 seabirds (SCRC 1985-1988) including: razorbill, puffin, fulmar, herring gull, lesser black-backed gull, gannet, shag, cormorant, kittiwake, roseate tern, common tern, Arctic tern, sandwich tern and guillemot.
and 4. Indirect effects, e.g. as a result of
changes in the abundance/distribution of their fish prey.
The residual effect to the SPA, after mitigation of the Development, as a result of collision risk, barrier effect and indirect effects was considered to be negligible
during construction and decommissioning for all SPA features. For disturbance/ displacement during construction and decommissioning, effects were considered as follows:
Negligible (temporary): fulmar, gannet, kittiwake, and puffin;
Low (temporary): cormorant (breeding season), shag, herring gull, lesser black-backed gull, guillemot, and razorbill;
Medium (temporary): cormorant (non-breeding season).
The residual effect to the SPAs, after mitigation of the Development, as a result of collision risk, barrier effect and indirect effects was considered to be negligible during operation for all SPA species. For disturbance/displacement during operation, effects were considered as follows: Negligible (long term): fulmar, gannet,
kittiwake, and puffin; Low (long term): cormorant (breeding
season), shag, herring gull, lesser black-backed gull, guillemot, and razorbill;
Medium (long term): cormorant (non-breeding season).
Outer Firth of Forth Currently a draft SPA included in this HRA at request dSPA qualifying and assemblage species A Pollution Prevention Plan A Likely Significant

Technical Appendix Forthwind Demonstration Project
Habitat Regulations Appraisal
Page 1-8
Site Name and Distance
Features Potentially Affected Potential Impacts to Features based on EIA Assessment
Mitigation Measures Proposed
Likely Significant Effects
and Tay Bay Complex8 dSPA
Development site is within this Draft SPA (dSPA)
“A large marine area covering 312,982.11 ha”
of SNH. The species listed for dSPAs do not always occur in important numbers throughout the dSPA and throughout the year. Rather, some species have distinct areas of elevated densities or foraging effort within the overall boundary and most exhibit strong seasonal variations in abundance (though this information is not provided within the Release Pack).
Qualifying bird species in the dSPA include:
Annex 1 species (presumably meeting Article 4.1 criteria): red-throated diver, Slavonian grebe, little gull, common tern and Arctic tern.
Migratory species (presumably meeting Article 4.2 criteria): eider, long-tailed duck, common scoter, velvet scoter, goldeneye, red-breasted merganser, gannet, Manx shearwater, shag, kittiwake, guillemot, razorbill, puffin, black-headed gull, common gull, herring gull.
Slavonian grebe, little gull, common tern and Arctic tern were not recorded during the baseline surveys. There is therefore considered to be no connectivity between the CSA and the dSPA for these species and they are not considered further within this HRA.
The dSPA qualifying species goldeneye,
Manx shearwater, black-headed gull and common gull were all recorded infrequently and in low numbers during the baseline surveys. There is therefore considered to be no meaningful connectivity between the CSA and the Outer Firth of Forth and Tay Bay Complex dSPA for the above four species and they are not considered further within this HRA.
The remaining 13 dSPA qualifying species were recorded more frequently during the survey period: red-throated diver, eider,
long-tailed duck, common scoter, velvet scoter, red-breasted merganser, gannet, shag, kittiwake, guillemot, razorbill, puffin and herring gull. It is considered likely that there is connectivity between the CSA and the dSPA for these species and it was considered that there is therefore potential for likely significant effects as a result of the following potential impacts of the Development during construction/decommissioning, and
operation.
1. Disturbance/displacement and indirect habitat lossto foraging or roosting birds;
will be in place to protect birds from pollution during construction, operation and decommissioning.
No additional mitigation measures are proposed as a result of the Environmental Impact Assessment carried out.
Effect on non-breeding red-throated diver is predicted with temporary disturbance/displacement during the construction and decommissioning stage.
A Likely Significant Effect on non-breeding red-throated diver, long-tailed duck, common scoter and velvet scoter is predicted due to disturbance/ displacement during the operational stage.
No Likely Significant Effects are predicted for the remaining Outer Firth of Forth and Tay Bay Complex dSPA features as a result of disturbance/ displacement during construction, decommissioning and operation.
No Likely Significant Effects are predicted for the Outer Firth of Forth and Tay Bay Complex dSPA
as a result of barrier effect, collision risk, or indirect effect during construction, decommissioning and
8 Release pack for Marine SPAs http://www.snh.gov.uk/docs/A1350044.pdf

Forthwind Demonstration Project Technical Appendix
Habitat Regulations Appraisal
Page 1-9
Site Name and Distance
Features Potentially Affected Potential Impacts to Features based on EIA Assessment
Mitigation Measures Proposed
Likely Significant Effects
2. Barrier effect as a result of turbinesblocking flight paths of foraging andmigrating birds;
3. Collision leading to direct mortality;and
4. Indirect effects, e.g. as a result ofchanges in the abundance/distributionof their fish prey.
The residual effect to the SPA, after mitigation of the Development, as a result of collision risk, barrier effect and indirect effects was considered to be negligible during construction and decommissioning for all SPA features. For disturbance/ displacement during construction and decommissioning effects were considered as follows:
Negligible (temporary): gannet,kittiwake, and puffin;
Low (temporary): eider, red-breasted
merganser, shag, herring gull, guillemot,and razorbill;
Medium (temporary): long-tailed duck,common scoter, velvet scoter andcormorant (non-breeding season);
High (temporary): red-throated diver.
The residual effect to the SPAs, after mitigation of the Development, as a result of collision risk, barrier effect and indirect effects was considered to be negligible during operation for all SPA species. For disturbance/displacement during operation effects were considered as follows:
Negligible (long term): gannet, kittiwake,and puffin;
Low (long term): red-breastedmerganser, shag, herring gull, guillemot,
operation.

Technical Appendix Forthwind Demonstration Project
Habitat Regulations Appraisal
Page 1-10
Site Name and Distance
Features Potentially Affected Potential Impacts to Features based on EIA Assessment
Mitigation Measures Proposed
Likely Significant Effects
and razorbill; Medium (long term): eider; High (long term): long-tailed duck,
common scoter, velvet scoter, and red-throated diver.
Firth of Tay and Eden Estuary SAC
15,412.53 ha
Annex II species that are a primary reason for selection of this site: Harbour seal
Annex II species present as a qualifying feature, but not a primary reason for site selection: N/A
The potential effects from the Development on harbour seal will arise from:
Direct habitat loss during construction;
Disturbance during construction,operation and decommissioning; and
Indirect changes to prey availability.
The residual effect to the harbour seal, after mitigation of the Development, as a result of the above effects, was considered to be negligible.
The following measures have been included to reduce potential impacts to marine mammals:
Drilled piles rather thandriven piles if pilingrequired, to reduceunderwater noise levels;
Presence of a MarineMammal Observer duringpre-construction andgeophysical surveys.
No additional mitigation measures are proposed as a result of the EIA.
No Likely Significant Effects are predicted for the Firth of Tay and Eden Estuary SAC during construction, decommissioning and operation.
Isle of May SAC
356.75 ha
Annex II species that are a primary reason for selection of this site: Grey seal
Annex II species present as a qualifying feature, but not a primary reason for site selection: N/A
The potential effects from the Development on grey seal will arise from:
Direct habitat loss during construction; Disturbance during construction,
operation and decommissioning; and Indirect changes to prey availability.
The residual effect to the marine mammals, after mitigation of the Development, as a result of the above effects, was considered to be negligible.
The following measures have been included to reduce potential impacts to marine mammals:
Drilled piles rather thandriven piles if pilingrequired, to reduceunderwater noise levels;
Presence of a MarineMammal Observer duringpre-construction andgeophysical surveys.
No additional mitigation measures are proposed as a result of the Environmental Impact Assessment carried out.
No Likely Significant Effects are predicted for the Isle of May SAC during construction, decommissioning and operation.
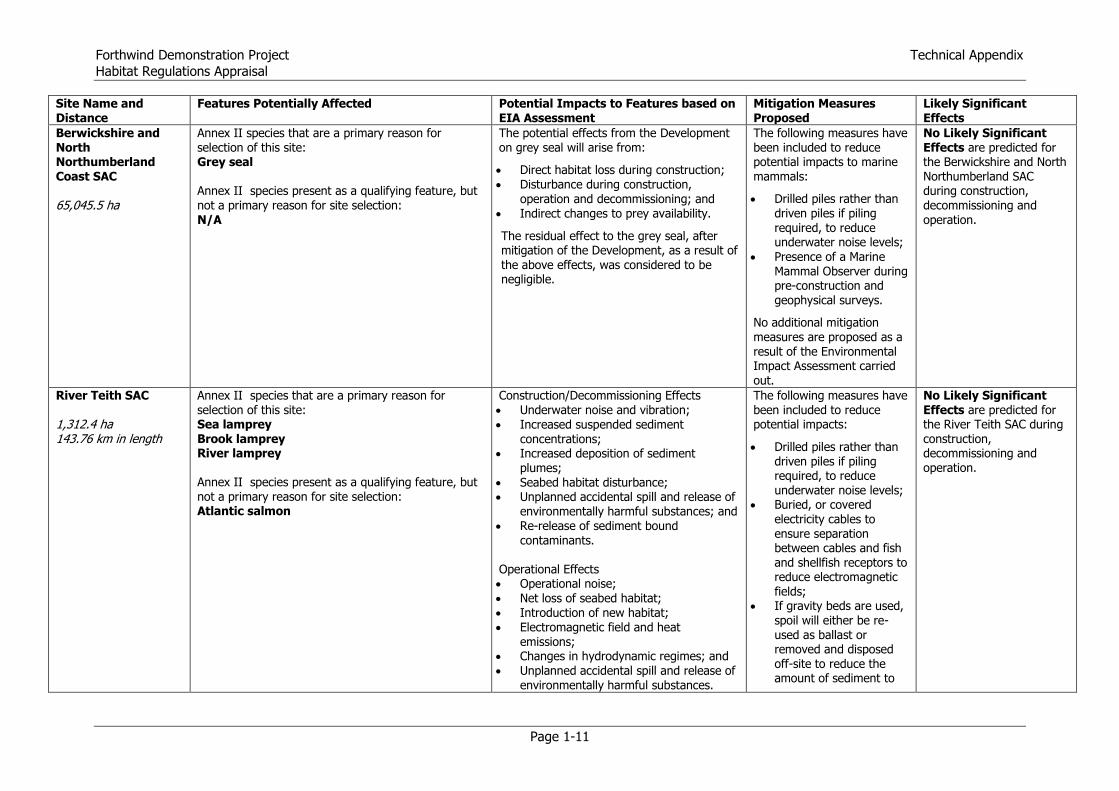
Forthwind Demonstration Project Technical Appendix
Habitat Regulations Appraisal
Page 1-11
Site Name and Distance
Features Potentially Affected Potential Impacts to Features based on EIA Assessment
Mitigation Measures Proposed
Likely Significant Effects
Berwickshire and North Northumberland Coast SAC 65,045.5 ha
Annex II species that are a primary reason for selection of this site: Grey seal Annex II species present as a qualifying feature, but not a primary reason for site selection: N/A
The potential effects from the Development on grey seal will arise from:
Direct habitat loss during construction; Disturbance during construction,
operation and decommissioning; and Indirect changes to prey availability.
The residual effect to the grey seal, after mitigation of the Development, as a result of
the above effects, was considered to be negligible.
The following measures have been included to reduce potential impacts to marine mammals:
Drilled piles rather than driven piles if piling required, to reduce underwater noise levels;
Presence of a Marine Mammal Observer during pre-construction and geophysical surveys.
No additional mitigation measures are proposed as a result of the Environmental Impact Assessment carried out.
No Likely Significant Effects are predicted for the Berwickshire and North Northumberland SAC during construction, decommissioning and operation.
River Teith SAC 1,312.4 ha 143.76 km in length
Annex II species that are a primary reason for selection of this site: Sea lamprey
Brook lamprey River lamprey Annex II species present as a qualifying feature, but not a primary reason for site selection: Atlantic salmon
Construction/Decommissioning Effects Underwater noise and vibration; Increased suspended sediment
concentrations; Increased deposition of sediment
plumes; Seabed habitat disturbance; Unplanned accidental spill and release of
environmentally harmful substances; and Re-release of sediment bound
contaminants. Operational Effects Operational noise;
Net loss of seabed habitat; Introduction of new habitat; Electromagnetic field and heat
emissions; Changes in hydrodynamic regimes; and Unplanned accidental spill and release of
environmentally harmful substances.
The following measures have been included to reduce potential impacts:
Drilled piles rather than driven piles if piling required, to reduce underwater noise levels;
Buried, or covered electricity cables to ensure separation between cables and fish and shellfish receptors to reduce electromagnetic fields;
If gravity beds are used, spoil will either be re-used as ballast or removed and disposed off-site to reduce the amount of sediment to
No Likely Significant Effects are predicted for the River Teith SAC during
construction, decommissioning and operation.

Technical Appendix Forthwind Demonstration Project
Habitat Regulations Appraisal
Page 1-12
Site Name and Distance
Features Potentially Affected Potential Impacts to Features based on EIA Assessment
Mitigation Measures Proposed
Likely Significant Effects
Each of the above effects was assessed in terms of their likely effect on fish and shellfish ecology as a result of the Development. The residual effect to the SAC, after mitigation of the Development during construction, operation and decommissioning, was considered to be negligible for all SAC features.
cause effects relating to increased suspended sediment/smothering;
A pollution/spillprevention plan will beoperated and a MarinePollution ContingencyPlan (MPCP) will be inplace.
No additional mitigation measures are proposed as a result of the Environmental Impact Assessment carried out.

Forthwind Offshore Turbines Technical Appendix
Environmental Statement
Page 1-13
1.7 Likely Significant Effects Summary
The Development has the potential to result in Likely Significant Effects on four species associated with the Firth of Forth SPA and the Outer Firth of Forth and Tay Bay Complex dSPA
during the non-breeding season as a result of predicted disturbance/displacement of foraging/roosting birds:
Red-throated diver (construction/decommissioning and operation);
Long-tailed duck (operation); Common scoter (operation);
Velvet scoter (operation).
There are no Likely Significant Effects predicted on the Forth Islands SPA, Firth of Tay and Eden Estuary SAC, Isle of May SAC, Berwickshire and North Northumberland SAC, and River Teith SAC as a result of the Development. These sites are therefore not considered further.
In order to comply with the Directives the Habitat Regulations require competent authorities to carry out Appropriate Assessments (AA) in certain circumstances where a project (or plan) affects a Natura 2000 (European) site, its qualifying features, or its Conservation Objectives.

FUGRO EMU LIMITED
Fugro EMU Limited Trafalgar Wharf (Unit 16), Hamilton Road, Portchester, Portsmouth, Hampshire, PO6 4PX, United Kingdom Tel: +44 (0)2392 205 500, Fax: +44 (0)2392 205 555, http://www.fugroemu.com
Prepared for: 2-B Energy Limited
Scott Harper
Quayside House
Dock Road
Methil Dock
Methil
KY8 3SR
Client Reference Number:
2 Final Luke Betteridge
Evelina Capasso
Peter Barfield Richard Walters 24th
April 2015
1 Draft Luke Betteridge
Evelina Capasso
Peter Barfield Richard Walters 2nd
March 2015
Rev. Description Prepared Checked Approved Date
METHIL OFFSHORE WIND
DEMONSTRATOR BENTHIC SUB-TIDAL
ECOLOGY SURVEY FINAL REPORT
Report No: 15/J/3/03/2590/1782

METHIL OFFSHORE WIND DEMONSTRATOR BENTHIC SUB-TIDAL ECOLOGY
SURVEY FINAL REPORT
Report No. 15/J/3/03/2590/1782

METHIL OFFSHORE WIND DEMONSTRATOR BENTHIC SUB-TIDAL ECOLOGY
SURVEY FINAL REPORT
Report No. 15/J/3/03/2590/1782 Page i
AMENDMENTS PAGE
This table contains a record of amendments.
Issue
Number
Amendment
Number Section/Paragraph Date
Authoriser’s
Signature

METHIL OFFSHORE WIND DEMONSTRATOR BENTHIC SUB-TIDAL ECOLOGY
SURVEY FINAL REPORT
Report No. 15/J/3/03/2590/1782 Page ii
SIGN OFF PAGE
Document Release and Authorisation Record
Fugro EMU Document No. 15/J/3/03/2590/1782
Issue Number 2
Hard Copy -
Issued To Scott Harper
Date Issued 24 April 2015
This Version
Authorised By Name Date Signature
Author(s)
Luke Betteridge 02/03/15
Evelina Capasso 16/02/15
Technical Checker Peter Barfield 02/03/15
QA Proof Reader Heather Shepherd 02/03/15
Project Manager Tom Morris 02/03/15
Group Manager/Director Richard Walters 24/04/15
Contact Details
Fugro EMU Limited
Trafalgar Wharf (Unit 16)
Hamilton Road
Portchester
Portsmouth
Hampshire
PO6 4PX
United Kingdom
Tel: +44 (0)2392 205 500
Fax: +44 (0)2392 205 555
www.fugroemu.com

METHIL OFFSHORE WIND DEMONSTRATOR BENTHIC SUB-TIDAL ECOLOGY
SURVEY FINAL REPORT
Report No. 15/J/3/03/2590/1782 Page iii
CONTENTS
Page
1. INTRODUCTION 1
1.1 Aims and Objectives 1
2. METHODS 2
2.1 Survey design 2
2.2 Sampling and site positioning 2
2.2.1 Seabed Drop Down Video (DDV) 2
2.2.2 Grab Sampling 3
2.2.3 Sediment Chemistry Sampling 3
2.2.4 Epibenthic Beam Trawling 4
2.3 Video Data Analysis 6
2.3.1 Assessment of Annex I Reef 6
2.4 Grab Data Analysis 8
2.4.1 Particle size distribution (PSD) analysis 8
2.4.2 Macrobenthic analysis 8
2.4.3 Statistical analysis of the data 9
2.4.4 Biotope classification 10
2.4.5 Sediment Chemistry 10
2.4.6 Total Organic Content 11
3. RESULTS 12
3.1 Overview 12
3.2 Seabed video data 12
3.2.1 Assessment of Annex I Reef 15
3.3 Sediment Grab Sample Data 17
3.4 Macrofaunal grab sample data 24
3.4.1 Faunal abundance 24
3.4.2 Biomass 29
3.4.3 Diversity Index 29
3.4.4 Multivariate Analysis 32
3.5 Biotopes 38
3.6 Epibenthic Trawl 43
3.7 Sediment Chemistry 46
4. DISCUSSION 47
4.1 Subtidal benthic ecology 47
4.1.1 Features on conservation importance 49
4.2 Sediment Chemistry 50
4.2.1 PAH 50
4.2.2 Metals 50
4.2.3 Organotins 51
4.2.4 PCBs 51

METHIL OFFSHORE WIND DEMONSTRATOR BENTHIC SUB-TIDAL ECOLOGY
SURVEY FINAL REPORT
Report No. 15/J/3/03/2590/1782 Page iv
4.2.5 Total Petroleum Hydrocarbons 51
5. REFERENCES 52
6. APPENDICES 56
TABLES
Table 1.1: Benthic Sub-tidal Ecology Sampling Techniques 1
Table 2.1: Parameters for Recording the Length of Fish and Shellfish. 4
Table 2.2: Marine Nature Conservation Review (MNCR) SACFOR* Abundance Scale 6
Table 2.3: The Main Characterising Features of a Stony Reef (from Irving 2009) 7
Table 3.1: Total Sites Successfully Sampled 12
Table 3.2: Most Frequent Species Recorded from DDV Survey 12
Table 3.3: Biotopes Assigned at Each Site Following Video Data Analysis 14
Table 3.4: Summary of the Measure of Reefiness of Rocky Substrates Encountered within the Vicinity of the
Methil Benthic Survey Area 16
Table 3.5: The Proportions of Folk Sediment Classification from the Sediment Samples for the Methil Benthic
Survey Area 18
Table 3.6: Top 10 Most Abundant and Most Frequently Recorded Species in the Grab Samples 26
Table 3.7: Diversity Indexes 30
Table 3.8: Species Composition of Each SIMPER Group 34
Table 3.9: Biotopes Described for the Survey Area 38
Table 3.10: Total Abundance and Frequency of the Top Ten Most Abundant Enumerated Taxa, and Frequency
of the Non–enumerated Taxa Recorded from the 2 m Beam Trawl Survey 45
Table 3.11: Total Abundance and Frequency of the Top Ten Fish Taxa Recorded from the 2 m Beam Trawl
Survey 45
Table 3.12: Integrated Assessment Classes Linking TBT Effects in Gastropod Species with Concentrations of
TBT In Water and Sediment 46
Table 4.1: Summary Table 48
FIGURES
Figure 2.1 Actual sample positional data. 5
Figure 3.1 Sediment components with folk classifications 19
Figure 3.2 Dendrogram showing the statistically significant clusters for the sediment in the survey area
(a) and the distribution of the Folk 1954 classification within the clusters (b). 21
Figure 3.3 Sorting categories overlaid on the Folk 1954 classification, indicating the variability of the
sediment composition in the survey area. 22
Figure 3.4 Principal components analysis ordination of percentage fractional weight particle size
distribution data collected from grab samples and their distribution across the survey sites 23
Figure 3.5 Summary of the percentage number of taxa (a) and individuals (b) recorded in the grab
samples and presented per major groups 25
Figure 3.6 Distribution of number of individuals across the survey area 27
Figure 3.7 Distribution of number of taxa across the survey area 28
Figure 3.8 Contribution to biomass by all major groups (AFDW). Epifauna is included in ‘Other’ taxa 29

METHIL OFFSHORE WIND DEMONSTRATOR BENTHIC SUB-TIDAL ECOLOGY
SURVEY FINAL REPORT
Report No. 15/J/3/03/2590/1782 Page v
Figure 3.9 Shannon -Weiner diversity index across the survey area 31
Figure 3.10 Cluster analysis dendrogram and Multidimensional Scaling plot of the multivariate statistical
analysis of the macrofaunal grab data 33
Figure 3.11 Faunal primer groupings 36
Figure 3.12 MDS plots with species highlighted as driving SIMPER group differences 37
Figure 3.13 Biotopes from grab faunal assemblages 41
Figure 3.14 Predicted habitat distribution based on geophysical and grab/trawl data 42
Figure 3.15 Percentage contributions of major taxonomic groups to the total number of taxa recorded (a)
to the total abundance for enumerated only (b) 44

METHIL OFFSHORE WIND DEMONSTRATOR BENTHIC SUB-TIDAL ECOLOGY
SURVEY FINAL REPORT
Report No. 15/J/3/03/2590/1782 Page 1
1. INTRODUCTION
Fugro EMU Limited (Fugro EMU) were commissioned by 2-B Energy to undertake a sub-tidal
ecological survey in the Firth of Forth. The work is in support for the 2-B Energy Offshore Wind
Turbine Demonstrator project at Methil, Fife. The purpose of this survey was to acquire sufficient data
to characterise the seabed habitats and associated communities within and in the vicinity of the
proposed development area to inform the EIA.
1.1 Aims and Objectives
The sub-tidal benthic ecology survey was conducted following Cefas Guidelines (Cefas, 2004) and
based on updated sampling methods described in Ware and Kenny (2011) as well as JNCC
Procedural Guidance No. 3.9 (Davies et al., 2001). Following receipt of advice from Marine Scotland,
the benthic subtidal survey included the techniques and proposed number of samples listed in Table
1.1:
Table 1.1: Benthic Sub-tidal Ecology Sampling Techniques
Sampling Technique No. of Samples Purpose
Drop down seabed video and photographic stills
at each benthic sub-tidal sample station.
19 Assessment of benthic habitat and
epibenthic communities.
Stainless steel grab sample at each soft
sediment benthic sub-tidal sample station.
19 Quantitative sampling of sediment fauna
and particle size distribution (PSD).
Stainless steel grab sampling at selected soft
sediment benthic sub-tidal sample stations.
3 Seabed sediment chemical analyses.
Epibenthic scientific beam trawling at selected
benthic sub-tidal sample stations
5 Assessment of mobile epibenthic
assemblages.

METHIL OFFSHORE WIND DEMONSTRATOR BENTHIC SUB-TIDAL ECOLOGY
SURVEY FINAL REPORT
Report No. 15/J/3/03/2590/1782 Page 2
2. METHODS
2.1 Survey design
19 sites were selected within and around the site boundary in the Firth of Forth with Drop down videos
and Faunal grab samples taken at each. Three of the sites within the site boundaries were also
selected for sediment chemistry samples using a stainless steel grab. Five trawl sites were selected
across the survey array for 2 m scientific beam trawling.
2.2 Sampling and site positioning
All survey work was carried out between the 9th October and 13th October 2014 on board the MV
Conserver. The actual sample locations are presented in Figure 2.1.
Sample positioning was achieved using EMU’s Hemisphere Crescent V110 DGPS which has a stated
horizontal accuracy of <0.6 m (95% confidence). Navigation and position recording was achieved
using Trimble’s HYDROPro software version 2.4.
A list of target site positions was used to guide the vessel to the planned sampling locations. At each
site, the actual position of each sampling event was recorded at the moment the winch wire went
slack, indicating that the sampling device reached the seabed.
2.2.1 Seabed Drop Down Video (DDV)
Drop down video footage was successfully collected at all 19 sites. Five of the sites were of extended
length due to trawl locations present at the same site; these were site numbers 4, 5, 10, 16 and 18. At
these sites the video was extended to cover the full length of the proposed trawl transects.
At site 3 the video was extended due to the substrate observed being deemed to be sufficiently
obstructive that the grab sample was not attempted. The proposed site had contained both grab
samples for benthic fauna and PSD as well as a sediment chemistry sample.
The seabed at each benthic sub-tidal sample station was initially surveyed using a Kongsberg 208
video and stills camera mounted on a drop down frame. Seabed habitat types and epibenthic
communities were recorded for the duration of the seabed video deployment together with any
additional observations of seabed features, such as burrows or tubes. The duration of the seabed
video was a minimum of five minutes, although this was extended up to 15 minutes in areas of high
local substrate complexity or where the substrate was observed to be sufficiently obstructive that a
grab sample was not attempted. The duration of video surveillance was also extended where any
feature of interest was encountered. In addition, a minimum of five photographic stills was taken per
deployment.
All video footage was overlaid with dGPS positions and all stills images geo-referenced. Field
recordings include the time and date of each deployment and the different seabed habitats present
(sediment descriptions), characterising epibenthic species and seabed features at each benthic sub-
tidal sample location.

METHIL OFFSHORE WIND DEMONSTRATOR BENTHIC SUB-TIDAL ECOLOGY
SURVEY FINAL REPORT
Report No. 15/J/3/03/2590/1782 Page 3
The drop down video logs are presented in Appendix B. The video analysis descriptions and
associated images are presented in Appendix F.
2.2.2 Grab Sampling
Grab samples were attempted at 18 of the 19 sites with site 3 not attempted due to the obstructive
sediment observed. Grab samples were successfully collected at 17 sites using a 0.1m2 mini Hamon
grab for determination of particle size distribution and invertebrate faunal content. Up to three attempts
were made to retrieve an acceptable sample. A minimum grab sample size of 5 litres volume was
deemed acceptable with no further attempts required.
At site 2 only indicative benthic fauna and no PSD samples were collected due to repeated small
sample sizes significantly below the acceptable amount.
Upon recovery of each sample, the sediment within the grab bucket was viewed to assess whether the
sample was acceptable (i.e., has not been subject to partial washout during retrieval and is of
sufficient volume relating to the depth of bite). Smaller samples were accepted at sites 6 and 12 where
three attempts were made resulting in three low volume samples. Low volume samples were not
pooled, therefore the benthic fauna and PSD samples were taken from separate attempts at these two
sites.
On receipt of an acceptable sample, the sample was released into a suitable container. An
assessment of the sample volume (in litres) was then made and a visual description recorded
including basic sediment description, quantity of shell, conspicuous fauna and/or flora and evidence of
any anoxia. A photograph of the sediment was taken prior to sample processing which is displayed in
Appendix A.
A sub-sample for PSD analysis was then taken. The volume of the sub-sample was approximately
500 ml, although the exact volume depended on the nature of the sediment. The PSD sub-sample
was then transferred into a pre-labelled heavy duty container and sealed to ensure no loss of fine
material.
The remaining sample was sieved on a 1 mm aperture mesh sieve to remove the finer sediment
fractions. The contents of the sieve were transferred into a pre-labelled bucket with internal label and
fixed on-site using 4% buffered saline formaldehyde solution.
The grab sampling logs are presented in Appendix C.
2.2.3 Sediment Chemistry Sampling
Sediment chemistry samples were attempted at two of the three sites with site 3 not attempted due to
the obstructive sediment. A sediment chemistry sample was successfully collected at site 5, within the
proposed development area, using a stainless steel Day grab. The Day grab was cleaned with
Acetone between stations to prevent cross contamination. At site 12 a successful sample was not
taken due to the grab being prevented from closing fully due to obstructive substrate being trapped in
the jaws of the grab on all attempts.

METHIL OFFSHORE WIND DEMONSTRATOR BENTHIC SUB-TIDAL ECOLOGY
SURVEY FINAL REPORT
Report No. 15/J/3/03/2590/1782 Page 4
Sediment was collected from the top five centimetres of the sample, with a cleaned metal scoop used
for hydrocarbon samples and a plastic scoop for metals. The sample obtained was placed in
appropriate pre-labelled container then frozen and stored at the Edinburgh office.
The sediment chemistry sampling log is presented in Appendix D.
2.2.4 Epibenthic Beam Trawling
Epibenthic beam trawling was attempted at three of the five sites due to obstructive substrate being
observed at T3 and T5. T2 was also shortened to prevent the trawl from being deployed across an
area of obstructive substrate. At all of the sites attempted a successful sample was recovered.
The Epibenthic beam trawling was carried out using an industry standard (Lowestoft design) 2 m
scientific beam trawl fitted with a knotless cod end liner (5 mm mesh). The trawl was fitted with a chain
mesh to prevent cobbles and boulders entering the trawl. A dispensation was given by Marine
Scotland for the use of a 5 mm mesh cod end liner. The length of each trawl tow was approximately
500 m and collected at a speed of 1-2 knots, except for Trawl 2 which was reduced to approximately
250 m. Start and end dGPS positions of each trawl were recorded.
At the end of each trawl, the catch was brought on board the vessel and emptied into a trawl
processing tray. Records of the catch, including species identities and abundance as well as
photographs were taken. The trawl photographs are displayed in Appendix A. This includes notes of
any substrate material and conspicuous sessile epifauna. The catch was processed on-site including
the identification and enumeration of fish, prawns and crabs, prior to its return to the sea. However,
where the field identification was uncertain, a representative of that species was returned to the
laboratory for confirmation. Any sub-sampling of large catches was recorded.
The length of fish was measured to the nearest centimetre (rounded down), with shellfish measured to
the nearest millimetre according to the parameters outlined in Table 2.1. The sex, carapace length and
shell softness of macro-crustaceans was also recorded where possible, including the presence of any
berried females. The sex of elasmobranch species was recorded where possible.
Table 2.1: Parameters for Recording the Length of Fish and Shellfish.
Taxon Measurement
Fish Total length (TL)
Rajids Disk width and TL
Lobster, spider crab, edible crab Carapace length
Squid, cuttlefish Mantle length
Bivalves (scallop) Shell width
Gastropod (whelk) Shell length
The epibenthic beam trawling logs are presented in Appendix E.

METHIL OFFSHORE WIND DEMONSTRATOR BENTHIC SUB-TIDAL ECOLOGY
SURVEY FINAL REPORT
Report No. 15/J/3/03/2590/1782 Page 5
Figure 2.1: Actual sample positional data

METHIL OFFSHORE WIND DEMONSTRATOR BENTHIC SUB-TIDAL ECOLOGY
SURVEY FINAL REPORT
Report No. 15/J/3/03/2590/1782 Page 6
2.3 Video Data Analysis
Seabed video data collected in the field were reviewed upon return to Fugro EMU’s office to identify
and describe the characterising habitat types and associated epifauna for each transect.
Substrate types for each video station were recorded as % cover of the seabed whilst the species
abundance was calculated using the industry standard SACFOR abundance scale (Hiscock, 1996)
which uses the average species size and abundance to classify the population (Table 2.2). In addition,
the digital still images were used to assist identification of species and improve habitat descriptions.
Biotopes were classified based on the Marine Biotope Classification for Britain and Ireland Version
04.05 (Connor et al., 2004) and was aided by the use of the biotope decision support tool BioScribe
(Hooper et al., 2011).
Table 2.2: Marine Nature Conservation Review (MNCR) SACFOR* Abundance Scale
Growth Form Size of Individuals / Colonies
Density %cover
Crust
/Meadow
Massive
/Turf <1 cm 1-3 cm 3-15 cm >15 cm
>80% S S >1/0.001 m2
40-79% A S A S 1-9/0.001 m2
20-39% C A C A S 1-9/0.01 m2
10-19% F C F C A S 1-9/0.1 m2
5-9% O F O F C A 1-9/1 m2
1-5% or
density R O R O F C 1-9/10 m
2
<1% density R R R O F 1-9/100 m2
R O 1-9/1000 m2
R <1/1000 m2
*Key: S=Superabundant, A=Abundant, C=Common, F=Frequent, O=Occasional, R=Rare, P=present
(used when the abundance of an organism could not be estimated accurately)
2.3.1 Assessment of Annex I Reef
Where rocky and stony substrates were encountered they were compared with the existing criteria for
defining geogenic reef for the purposes of Annex I of the EC Habitats Directive.
Clarification of geogenic reef as ‘stony reef’ under the Habitats Directive was attempted during an
inter-agency workshop and subsequent discussions in 2008 (Irving, 2009). Table 2.3 presents several
key parameters of ‘reefiness’ that were proposed to assess the main characterising features of a stony
reef. Using these criteria, a measure of the resemblance of the stony and rocky seabed habitats
observed at Methil with Annex I geogenic reef criteria has been attempted.

METHIL OFFSHORE WIND DEMONSTRATOR BENTHIC SUB-TIDAL ECOLOGY
SURVEY FINAL REPORT
Report No. 15/J/3/03/2590/1782 Page 7
Table 2.3: The Main Characterising Features of a Stony Reef (from Irving 2009)
Measure of ‘reefiness’ NOT a REEF LOW MEDIUM HIGH
Composition Diameter of cobbles
/ boulders being greater than
64 mm.
Percentage cover relates to a
minimum area of 25 m2.
This ‘composition’ characteristic
also includes ‘patchiness’.
<10%
10-40%
Matrix
supported
40-95% >95%
Clast supported
Elevation
Minimum height (64 mm) relates
to minimum size of constituent
cobbles.
This characteristic could also
include ‘distinctness’ from the
surrounding seabed.
Note that two units (mm and m)
are used here.
Flat seabed <64 mm 64 mm-5 m >5 m
Extent <25 m2 >25 m
2
Biota
Dominated by
infaunal
species
>80% of
species present
composed of
epifaunal
species

METHIL OFFSHORE WIND DEMONSTRATOR BENTHIC SUB-TIDAL ECOLOGY
SURVEY FINAL REPORT
Report No. 15/J/3/03/2590/1782 Page 8
2.4 Grab Data Analysis
2.4.1 Particle size distribution (PSD) analysis
PSD analysis was undertaken at Fugro EMU’s sediment laboratory using in house methods based on
BS1377: Parts 1 3: 1990 (dry sieving), and BS 13320:2009 (laser diffraction). The latter method was
used when the fine fraction of sediment (<63 μm) was greater than 5% of the total sample by weight.
Representative sub-samples of each sediment sample were oven dried to constant weight at 105 ±
5°C before routinely wet sieving to remove silt and clay-sized particles of <63 μm (unless there was no
sample cohesion after drying, where dry sieve analysis only is undertaken). The remaining coarser
material was again oven dried to constant weight at 105 ± 5°C followed by dry sieving through a series
of mesh apertures corresponding to units as described by the Wentworth scale. The weight of the
sediment fraction retained on each mesh was subsequently measured and recorded and merged with
the laser diffraction data where appropriate. Sediments were then classified according to the Folk
sediment classification system (Folk, 1954) (Appendix I).
2.4.2 Macrobenthic analysis
Grab and beam trawl samples were returned to Fugro EMU’s benthic laboratory for analysis. Fugro
EMU’s benthic lab are long time participants in the National Marine Biological Analytical Quality
Control (NMBAQC) scheme which provides a source of external Quality Assurance (QA) for
laboratories engaged in the production of marine biological data.
Samples were re-sieved over a 1 mm mesh to remove all remaining fine sediment and fixative. Fauna
were sorted from the sediment by elutriation and subsequent examination under a stereomicroscope.
Macro-invertebrates were identified to the lowest practical level (species level, when possible) and
enumerated. Any colonial, encrusting epifaunal species were recorded as present (P). A reference
collection was prepared with one individual of each species identified retained. Nomenclature used is
consistent with the World Register of Marine Species (WoRMS, 2015).
Fugro EMU undertook quality control (QC) checks on a representative number of whole samples, as
well as the entire reference collection in compliance with internal analytical QC criteria.
Faunal biomass analysis was based on a wet-blot method with estimates of ash-free dry weight
(AFDW) based on conversion factors provided by Eleftheriou and Basford (1989). Mollusc biomass
included the weight of the flesh plus shell. The retained infauna was then separated into the following
phyla and weighed to 0.0001 g:
Polychaeta;
Crustacea;
Echinodermata;
Mollusca; and
Others.

METHIL OFFSHORE WIND DEMONSTRATOR BENTHIC SUB-TIDAL ECOLOGY
SURVEY FINAL REPORT
Report No. 15/J/3/03/2590/1782 Page 9
Specimens caught in the 2 m beam trawls were identified and enumerated on site prior to being
returned to the sea. Specimens returned to the laboratory were identified to species levels, where
possible and enumerated and added to the field list. Sessile epifauna was recorded as P (present).
2.4.3 Statistical analysis of the data
For multivariate statistical analyses the Plymouth Marine Laboratories PRIMER v6 (Plymouth Routines
in Multivariate Ecological Research) suite of programs was used (Clarke and Warwick, 2001; Clarke
and Gorley, 2006). The recorded macro-invertebrate assemblages were also analysed using
univariate measures (Shannon-Wiener diversity index, Pielou’s evenness and Simpson’s dominance
index). Univariate analyses are used to extract features of communities which are not the function of
specific taxa, i.e. these methods are species independent and therefore assemblages with no species
in common can theoretically have equal values.
The Shannon-Wiener diversity index is a measure of biodiversity based on the number of species
present and the number of individuals of each species. If a few species dominate, the index value is
low. A greater number of species and a more even distribution of species both result in an increase in
Shannon's diversity. Pielou’s evenness is a measure of how the numbers of individuals are distributed
across the number of species found in a sample. If the numbers of individuals are equally spread
amongst the species then the community is considered to be even. The closer Pielou’s evenness is to
1, the more even the distribution of abundance is amongst the species. The nearer the value is to 0,
the less even the community is with some species having much higher abundances than others.
Simpson’s dominance index is a measure of the probability that two individuals randomly selected
from a sample will belong to the same species. Simpson's dominance index ranges from 0 (all taxa
are equally present) to 1.0 (one taxon dominates the community completely).
Faunal data for multivariate analysis were imported into PRIMER and initially subjected to a square
root (grab samples) transformation to reduce the influence of any highly abundant taxa allowing less
abundant species a greater role in driving the emergent multivariate patterns. The transformed data
were then subjected to hierarchical clustering to identify sample groupings based on the Bray-Curtis
index of similarity. This process combines samples into groups starting with the highest mutual
similarities and then gradually lowers the similarity level at which groups are formed. The process
ends with a single cluster containing all stations and is best expressed as a dendrogram diagram
showing the sequential clustering of stations against relative similarity. The SIMPROF (similarity profile
analysis) routine was used to identify statistically significant groupings.
The MDS (Multi-dimensional Scaling) procedure uses the same similarity matrix as that used by the
cluster analysis to produce an ordination of stations which is multi-dimensional. This attempts to
satisfy all of the between-samples relationships indicated by the similarity matrix. This multi-
dimensional ordination is then reduced to a two-dimensional representation that is a more accessible
and useable representation. The representativeness of this two-dimensional version, in comparison to
the multi-dimensional array, is indicated by a stress level. The closer this stress level is to zero, the
better, and more useful, is the representation.

METHIL OFFSHORE WIND DEMONSTRATOR BENTHIC SUB-TIDAL ECOLOGY
SURVEY FINAL REPORT
Report No. 15/J/3/03/2590/1782 Page 10
SIMPER analysis was then applied to the data to rank species in terms of their contribution to both the
internal group similarity and “between” group dissimilarity and thereby assist the assessment of the
distinctiveness of each community identified and the identification of the characterising taxa.
Sediment data were also imported into PRIMER and subjected to hierarchical clustering using
Euclidean distance as the similarity measure. In addition, Principal Components Analysis (PCA)
ordination analysis was performed on the sediment data. PCA is a multivariate statistical technique
principally used to investigate variability in environmental data through the ordination of the results of
sediment analyses. The analysis identifies a reduced set of ‘principal components’ that account for
most of the variance of the original variables.
2.4.4 Biotope classification
Biotope code allocations were made using the current UK Marine Classification System v4.05 (Connor
et al., 2004). Biotopes were allocated to faunal composition at individual grab sites.
Biotopes were assigned with the aid of the biotope decision support tool BioScribe (Hooper et al.,
2011). The tool matches the species list from a sample to the biological communities usually recorded
with potential biotope matches. Confidence indicators and direct links to habitat descriptions from the
Marine Habitat Classification for Britain and Ireland are provided to facilitate the process. The tool was
used by an experienced ecologist practised in matching UK biotopes to field survey data with codes
applied through expert judgement informed by outputs from BioScribe and knowledge of the current
biotope classification system. All survey data were used to inform the biotope allocation process
including the PSD analysis results and the video ground truthing data.
2.4.5 Sediment Chemistry
The sediment samples for analysis included the following:
Metals – Aluminium (Al), Arsenic (As), Cadmium (Cd), Chromium (Cr), Copper (Cu), Iron (Fe),
Lithium (Li) Mercury (Hg), Nickel (Ni), Lead (Pb), Zinc (Zn);
Polychlorinated biphenyls (PCB) (ICES 7 and 25);
Organotins (TBT, DBT);
Polycyclic aromatic hydrocarbons (PAHs) – Acenaphthene, Acenaphtylene, Anthracene,
Fluorene, Naphthalene, Phenanthrene, Benzo[a]anthracene, Benzo[b]fluoranthene,
Benzo[k]fluoranthene, Benzo[a]pyrene, Benzo[g, h, i]perylene, Dibenzo[a, h]anthracene,
Chrysene, Fluoranthene, Pyrene, Indeno (1, 2, 3cd) pyrene;
Total PAH;
Total petroleum hydrocarbons (TPH); and
Total organic carbon (loss of ignition).
Polychlorinated biphenyls were analysed at Fugro EMU’s UKAS accredited Sediment Laboratory in
Edinburgh. The rest of the analysis, apart from the Total organic carbon, was subcontracted to the
UKAS accredited National Laboratory Service (NLS).

METHIL OFFSHORE WIND DEMONSTRATOR BENTHIC SUB-TIDAL ECOLOGY
SURVEY FINAL REPORT
Report No. 15/J/3/03/2590/1782 Page 11
NLS use Ekofisk crude oil both for the standards and calibration when analysing total petroleum
hydrocarbon.
The results of the analyses and notes on analysis methods are presented in Appendix J and are
compared against the Scottish Guidelines for Assessment of Disposal of Dredged Sediments and any
elevated concentrations highlighted.
2.4.6 Total Organic Content
The method for the Determination of the Mass Loss on Ignition (Fugro EMU MET/01) is based on
BS1377: 1990 Part 3 Clause 4.1 and describes the procedure for determining the proportion by mass
that is lost from a sediment sample by ignition at a specific temperature. The mass Loss on Ignition
(LOI) can be used as a rough estimate of the organic matter content of certain sediments, such as
sand, provided that the sediment contains little, or none, of the following: clay, chalky material, peats
and organic clays which may contain more that 10% organic matter. It must be recognised that, in
sediments where such components may be present, factors unrelated to the organic content could be
responsible for a proportion of the mass loss on ignition.
A representative sub-sample is oven dried at 50 ±5°C and weighed to constant mass. The sample is
then subjected to ignition in a muffle furnace at 440 ±250 C for 4 hours (or subject to client specific
requirements). The organic matter content is then calculated from the subsequent loss in mass.

METHIL OFFSHORE WIND DEMONSTRATOR BENTHIC SUB-TIDAL ECOLOGY
SURVEY FINAL REPORT
Report No. 15/J/3/03/2590/1782 Page 12
3. RESULTS
3.1 Overview
Table 3.1 presents the total number of sites successfully sampled for each sample type.
Table 3.1: Total Sites Successfully Sampled
Sampling Technique Number of Samples
Successfully Collected
Purpose
Drop down seabed video and photographic stills
at each benthic sub-tidal sample station.
19 Assessment of benthic habitat
and epibenthic communities.
Grab sample at each soft sediment benthic sub-
tidal sample station.
17 Quantitive sampling of
sediment fauna and particle
size distribution (PSD).
Stainless steel grab sampling at selected soft
sediment benthic sub-tidal sample stations.
1 Seabed sediment chemical
analyses.
Epibenthic scientific beam trawling at selected
benthic sub-tidal sample stations
3 Assessment of mobile
epibenthic assemblages.
3.2 Seabed video data
A total of 19 sites were investigated by DDV. These included five extended transects (4, 5, 10, 16 and
18) carried out to assess the full length of a proposed trawl site and one transect (3) extended due to
the nature of the sediment obstructing grab sampling from taking place. Asterias rubens, the common
sea star, was the most frequently occurring species being observed in 18 out of 19 of the videos. This
was closely followed by Gobiidae and Liocarcinus which were observed in 17 out of 19 videos. Table
1.1 presents the species recorded at more than 50% of the sites surveyed.
Table 3.2: Most Frequent Species Recorded from DDV Survey
Conspicuous Species Common Name No. of Sites Frequency (%)
Asterias rubens Common Sea Star 18 out 19 94.7%
Gobiidae Goby 17 out 19 89.5%
Liocarcinus Swimming crab 17 out 19 89.5%
Alcyonium digitatum Dead – man’s fingers 11 out 19 57.9%
Astropecten irregularis Sand star 11 out 19 57.9%
Echinus esculentus Edible sea urchin 11 out 19 57.9%
HYDROZOA/BRYOZOA turf 10 out 19 52.6%
Paguridae Hermit crab 10 out 19 52.6%
PLEURONECTIFORMES Flat fish 10 out 19 52.6%
The highest number of conspicuous species recorded from a single transect was 21 at site 5, in the
centre of the survey array. At this site substrate was observed to be mainly coarse sediment with
boulders, interspersed with some open patches of shelly sand, although this was obscured for about
the last 100 m of the transect by the presence of an Ophiothrix bed.
The lowest number of conspicuous species recorded was eight and this occurred at two sites; Site 9,
the most offshore site in the survey array and one of the sites adjacent to this, site 14. At site 9 the
sediment was observed to consist of slightly shelly sand whilst at site 14 slightly shelly rippled sand
was recorded. The presence of visible holes and burrows at both sites indicated the presence of a
hidden, more infaunal component to the communities at these locations.

METHIL OFFSHORE WIND DEMONSTRATOR BENTHIC SUB-TIDAL ECOLOGY
SURVEY FINAL REPORT
Report No. 15/J/3/03/2590/1782 Page 13
After being analysed and the observed species abundances converted into SACFOR the video data
were used to determine biotopes visible at each site.
Seapens and burrowing megafauna in circalittoral fine mud (SS.SMU.CFiMu.SpnMeg) at 6 out of 19
sites, and circalittoral mixed sediment (SS.SMx.CMx), at 6 out of 19 sites, were the two joint most
commonly occurring biotopes, observed in the survey area. The former encountered from the central
survey area and continued out to the southern offshore sites and the latter spread across the middle to
inshore and northern edge of the survey area.
Ophiothrix fragilis and/or Ophiocomina nigra brittlestar beds on sublittoral mixed sediment
(SS.SMx.CMx.OphMx), characterised by dense brittlestar beds were observed at five sites within the
survey area. The sites were aligned with the coarser substrate described for the area (more details in
the following PSD section) and were located within the proposed development site, extending out to
the most northerly point at site 18.
The Echinoderms and Crustose communities (CR.MCR.EcCr) biotope was observed at three sites
including the two most inshore ones. Due to the rocky nature of the substrate grabbing was not
attempted at one of the sites and was unsuccessful at another. Therefore these two sites, sites 2 and
3, are described by the video data only.
Details and examples of the biotopes described are presented in Table 3.3 whilst full video data
analysis results are presented in Appendix F.

METHIL OFFSHORE WIND DEMONSTRATOR BENTHIC SUB-TIDAL ECOLOGY
SURVEY FINAL REPORT
Report No. 15/J/3/03/2590/1782 Page 14
Table 3.3: Biotopes Assigned at Each Site Following Video Data Analysis
Biotope Image Biotope Description Sites
Observed
SS.SMx.CMx Circalittoral mixed
sediment
5, 10, 15,
16, 18 and
19
SS.SMU.CFiMu.SpnMeg Seapens and
burrowing megafauna
in circalittoral fine
mud
1, 4, 8, 9,
13 and 14
SS.SMx.CMx.OphMx Ophiothrix fragilis
and/or Ophiocomina
nigra brittlestar beds
on sublittoral mixed
sediment
2, 5, 6, 12,
and 18
SS.SSa.CMuSa Circalittoral muddy
sand
2, 7, 11, 15
and 17
CR.MCR.EcCr Echinoderms and
crustose communities
2, 3 and 17

METHIL OFFSHORE WIND DEMONSTRATOR BENTHIC SUB-TIDAL ECOLOGY
SURVEY FINAL REPORT
Report No. 15/J/3/03/2590/1782 Page 15
Biotope Image Biotope Description Sites
Observed
CR.HCR.XFa Mixed faunal turf
communities
15
SS.SMu.CSaMu.VirOphPm
ax.HAs
Virgularia mirabilis
and Ophiura spp. with
Pecten maximus,
hydroids and
ascidians on
circalittoral sandy or
shelly mud with
stones
16
SS.SSa Sublittoral sands and
muddy sands
17
3.2.1 Assessment of Annex I Reef
Table 3.4 presents the results of the measure of reefiness of the rocky substrates encountered within
the survey area. A full assessment of the attributes of these substrates in terms of resemblance to
Annex I criteria is provided in Appendix M.

METHIL OFFSHORE WIND DEMONSTRATOR BENTHIC SUB-TIDAL ECOLOGY
SURVEY FINAL REPORT
Report No. 15/J/3/03/2590/1782 Page 16
Table 3.4: Summary of the Measure of Reefiness of Rocky Substrates Encountered within the
Vicinity of the Methil Benthic Survey Area
Site Seabed description Reef Representative Image Biotope
2 <25°m2
cobbles and/or
boulders/bedrock
Not a Reef
CR.MCR.EcCr
3 50%
cobbles and/or
boulders/bedrock
Medium
CR.MCR.EcCr
6 50%
cobbles and/or boulders
Medium
SS.SMx.CMx.O
phMx
15 30%
bedrock
Low
CR.HCR.XFa
17 40%
cobbles and/or
boulders/bedrock
Low
CR.MCR.EcCr
And
SS.SSa.CMuSa

METHIL OFFSHORE WIND DEMONSTRATOR BENTHIC SUB-TIDAL ECOLOGY
SURVEY FINAL REPORT
Report No. 15/J/3/03/2590/1782 Page 17
As indicated in the Table above, the rocky substrate at site 2 was considered to not have a
resemblance to Annex I geogenic reef. Although this site contained some large boulders the overall
area of rocky substrate was less than the extent required to be given Low to High reef resemblance.
Site 3 and 6 had Medium geogenic reef resemblance. Site 3 consisted of a large area of boulders and
bedrock covered with encrusting and mobile epifauna interspersed with pebbles, cobbles and
occasional patches of sand, thus fulfilling the Medium reef requirements. Site 6 featured brittlestar
beds on slightly shelly sand with cobbles and boulders.
Sites 15 and 17 were given a low measure of reefiness. Site 15 was determined to have patches of
bedrock (including areas of sand/mudstone ledging) mixed with slightly shelly silty sand, resulting in a
30% composition of bedrock. Site 17 was determined to have patches of cobbles and boulders with
mud/sandstone ledging (including areas with relatively large holes bored in the surface) interspersed
with slightly pebbly gravelly sand.
Typical fauna associated with the rocky and stony habitats included encrusting and sessile species
(e.g. Corallinaceae, Spirobranchus, Alcyonium digitatum, Hydroid/Bryozoan turf species), grazers
(Echinus esculentus) and mobile fauna (e.g. Asterias rubens, Liocarcinus, Cancer pagurus). Dense
aggregations of the epifaunal brittlestar Ophiothrix fragilis were observed on cobbles and boulders at
one of the medium reef resembling sites.
The biotopes associated with the potential Annex I habitats included, either on their own or as a
mosaic with another biotope, CR.MCR.EcCr (Echinoderms and crustose
communities)SS.SMx.CMx.OphMx (Ophiothrix fragilis and/or Ophiocomina nigra brittlestar beds on
sublittoral mixed sediment) and CR.HCR.XFa (Mixed faunal turf communities).
3.3 Sediment Grab Sample Data
Results of the sediment particle size analysis of the 17 acquired grab samples, including fractional
weight and percentage data and Folk sediment classifications, are presented in Appendix I.
A total of seven different Folk Classifications have been recorded across the benthic survey area, the
relative proportions of which are presented in Table 3.5. The dominant fraction was slightly gravelly
muddy sand ((g)mS) which accounted for 29% of the results (five sites), followed by slightly gravelly
sand ((g)S) which accounted for 24% of the results (four sites).
Figure 3.1 shows the distribution of the sediment classifications and the distribution of principal
sediment components (%mud, %sand, %gravel).

METHIL OFFSHORE WIND DEMONSTRATOR BENTHIC SUB-TIDAL ECOLOGY
SURVEY FINAL REPORT
Report No. 15/J/3/03/2590/1782 Page 18
Table 3.5: The Proportions of Folk Sediment Classification from the Sediment Samples for the Methil
Benthic Survey Area
Slightly gravelly muddy sand Slightly gravelly sand
Sandy gravel Gravelly sand

METHIL OFFSHORE WIND DEMONSTRATOR BENTHIC SUB-TIDAL ECOLOGY
SURVEY FINAL REPORT
Report No. 15/J/3/03/2590/1782 Page 19
Figure 3.1: Sediment components with folk classifications

METHIL OFFSHORE WIND DEMONSTRATOR BENTHIC SUB-TIDAL ECOLOGY
SURVEY DRAFT REPORT
Report No. 15/J/3/03/2590/1782 Page 20
Data were further analysed using multivariate techniques, presenting the ordinations of percent
fractional weight sediment data based on a Euclidean distance resemblance matrix. Application of the
PRIMER SIMPROF routine, (Figure 3.2a) highlighted seven statistically significant groups. The Folk
1954 classification for the sites is overlaid on the clusters in Figure 3.2b.
Group e is the largest group and encompasses 8 sites out of 17. The sites were characterised by high
percentage of the fine sand fraction. This group was dominated by samples categorised as slightly
gravelly sand ((g)S) according to the Folk 1954 classification’.
Group c includes 3 sites out of 17 and they are characterised by very fine sand. This group is
distinguished by a slightly ‘finer’ nature as captured by the Folk 1954 classification with each of the
three samples categorised as slightly gravelly muddy sand ((g)mS).
Group g includes only 2 sites out of 17 and they are characterised by a higher percentage of gravel.
This coarser component is also highlighted by the Folk 1954 classification for the two sites concerned
as being composed of gravel (G) and sandy gravel (sG) substrates.
Groups a, b, d and f are each formed by a single site. Although the sediments at these sites do not
differ greatly, in overall terms, from the sites in the other groups, the different proportions of gravel,
sand and mud vary enough such that the SIMPROF routine has not grouped them with any of the
other sites. Site 9 (group a) is the most offshore location and has a higher component of ‘fines’
(<63µm fraction); site 19 (group d) is located to the east of the survey array and has higher coarse,
medium and fine gravel fractions; site 15 (group f) is located inshore to the west of the survey array
and has higher coarse sand fraction; and finally, site 8 (group b) is located offshore to the south of the
survey array and has the highest very fine sand fraction.
The degree of variability in the sediment distribution is also indicated by the sorting coefficient (Figure
3.3). Sorting indicates the spread of the grain sizes around the average and it provides a proxy
measure of the energy of the environment (Blott and Pye 2001; Garrison, 2009). Sorting categories for
the sites varied from extremely poorly sorted (eps), with very high sorting coefficients, to moderately
well sorted (mws), with low sorting coefficients. Other sorting categories present were very poorly
sorted (vps), poorly sorted (ps) and moderately sorted (ms). Well sorted sediments can indicate a
consistent input of energy with little fluctuation; on the contrary poorly sorted sediments can indicate
the reverse, i.e. an inconsistent energy input and a consequently wide fluctuation in the sediment
matrix (Garrison, 2009).

METHIL OFFSHORE WIND DEMONSTRATOR BENTHIC SUB-TIDAL ECOLOGY
SURVEY DRAFT REPORT
Report No. 15/J/3/03/2590/1782 Page 21
a)
b)
Figure 3.2: Dendrogram showing the statistically significant clusters for the sediment in the
survey area (a) and the distribution of the Folk 1954 classification within the clusters (b)

METHIL OFFSHORE WIND DEMONSTRATOR BENTHIC SUB-TIDAL ECOLOGY
SURVEY DRAFT REPORT
Report No. 15/J/3/03/2590/1782 Page 22
Figure 3.3: Sorting categories overlaid on the Folk 1954 classification, indicating the variability
of the sediment composition in the survey area
Figure 3.4a below presents a PCA ordination plot for percentage fractional sediment data used to
identify the sediment fractions driving the variability of the sediment composition amongst the sites.
The principal component axis (PC1) is very strongly positively correlated with percentage fine sand
(250 µm) and accounts for 53.4% of the variation. The second principal component axis (PC2) is
strongly correlated with the percentage of very fine sand (125 µm) and accounts for a further 31.8% of
the variation. The 2-dimensional PCA can be considered a good description of the higher multi-
dimensional space with PC1 and PC2 together accounting for 85.3% of the variability. The importance
of the percentage of these fractions in structuring the multivariate patterns observed is visible from the
bubble plots in Figure 3.4b, and c.

METHIL OFFSHORE WIND DEMONSTRATOR BENTHIC SUB-TIDAL ECOLOGY
SURVEY DRAFT REPORT
Report No. 15/J/3/03/2590/1782 Page 23
a)
b)
c)
Figure 3.4: Principal components analysis ordination of percentage fractional weight particle size distribution data collected from grab
samples and their distribution across the survey sites

METHIL OFFSHORE WIND DEMONSTRATOR BENTHIC SUB-TIDAL ECOLOGY
SURVEY FINAL REPORT
Report No. 15/J/3/03/2590/1782 Page 24
3.4 Macrofaunal grab sample data
Seventeen grab samples were successfully collected for macrofaunal analysis. Raw data including
infaunal and epifaunal species abundance generated from the analysis of the faunal samples are
available in Appendix G. The data are presented with the relevant AphiaID included as a reference to
names currently accepted by the World Register of Marine Species (WoRMS) (WoRMS Editorial
Board (2015).
Biomass (as blotted wet weight) per major phyla was also recorded and the results presented in
Appendix H.
3.4.1 Faunal abundance
A total of 233 quantitative taxa (including juveniles) were recorded from the grab samples collected.
As no juveniles were listed in the top 20 most abundant species, they were included in the statistical
analysis as their recorded presence was very unlikely to skew any assessment of the pattern of site
relatedness. An additional 16 non-quantitative taxa were identified from the grab samples and
recorded as present (P). These were not included in the statistical analysis. One fish taxon
(Ammodytes sp. – sand eel) was recorded in the grab sample. It was included in the descriptive
analysis of the grab sample data, but removed for the statistical analysis of the benthic invertebrate
macrofaunal species.
The total number of individuals recorded was 4,320.
Quantitative taxa were split into the five major taxonomic groups:
Annelida, mainly including polychaetes, or bristle worms, but also including some
oligochaetes;
Mollusca;
Crustacea;
Echinodermata; and
‘Others’, which includes a range of minor phyla such as anemones, flatworms, ribbon worms,
acorn worms, horseshoe worms and sipunculids or peanut worms.
The percentage contribution by each of the major taxonomic groups in terms of number of species and
abundance is presented in Figure 3.5a and b respectively. The distribution of these across the survey
area is presented in Figure 3.6 and Figure 3.7.

METHIL OFFSHORE WIND DEMONSTRATOR BENTHIC SUB-TIDAL ECOLOGY
SURVEY FINAL REPORT
Report No. 15/J/3/03/2590/1782 Page 25
a)
b)
Figure 3.5: Summary of the percentage number of taxa (a) and individuals (b) recorded in the
grab samples and presented per major groups
As expected, polychaetes are the most abundant and the most taxonomically diverse group in the
macrobenthic communities sampled in the survey area constituting 45% of the recorded species
(Figure 3.5a) and 34% of the individuals forming the benthic communities (Figure 3.5b). The group
with the second highest number of recorded taxa was molluscs (21%) followed by crustaceans (19%),
Echinodermata (8%) and Others (3%).
The group with the highest abundance was Annelida (34%). This was due to the high abundance of
Magelolona filiformis and Magelona johnstoni particularly at sites 17 and 18 both located close to the
shore to the north of the survey area and described as slightly gravelly sand. The second highest
abundant group was ‘Others’, due to the large abundance of the genus Phoronis with a total number
of 935 individuals across the survey area. These animals are commonly found in soft substrates such
Annelida 45%
Mollusca 21%
Crustacea 19%
Echinodermata 8%
Others 4%
Epifauna (quantitative)
3%
Annelida 34%
Others 25%
Mollusca 21%
Echinodermata 14%
Crustacea 5%
Epifauna (quantitative)
1%
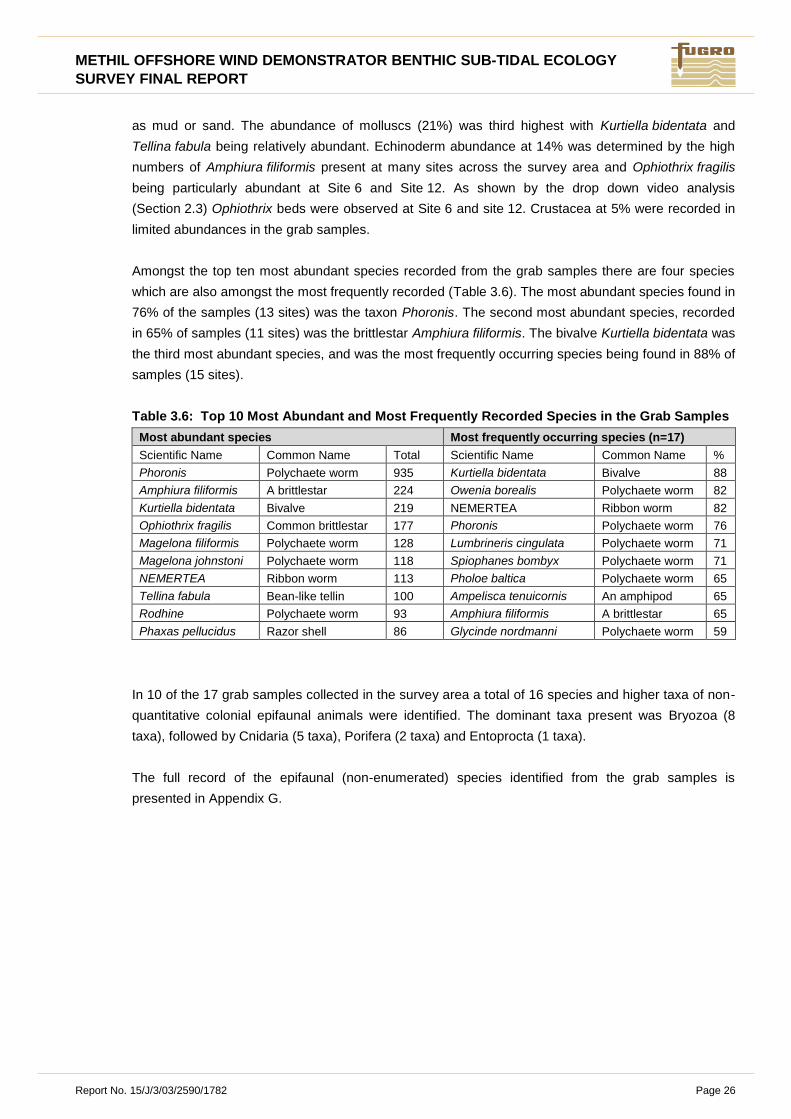
METHIL OFFSHORE WIND DEMONSTRATOR BENTHIC SUB-TIDAL ECOLOGY
SURVEY FINAL REPORT
Report No. 15/J/3/03/2590/1782 Page 26
as mud or sand. The abundance of molluscs (21%) was third highest with Kurtiella bidentata and
Tellina fabula being relatively abundant. Echinoderm abundance at 14% was determined by the high
numbers of Amphiura filiformis present at many sites across the survey area and Ophiothrix fragilis
being particularly abundant at Site 6 and Site 12. As shown by the drop down video analysis
(Section 2.3) Ophiothrix beds were observed at Site 6 and site 12. Crustacea at 5% were recorded in
limited abundances in the grab samples.
Amongst the top ten most abundant species recorded from the grab samples there are four species
which are also amongst the most frequently recorded (Table 3.6). The most abundant species found in
76% of the samples (13 sites) was the taxon Phoronis. The second most abundant species, recorded
in 65% of samples (11 sites) was the brittlestar Amphiura filiformis. The bivalve Kurtiella bidentata was
the third most abundant species, and was the most frequently occurring species being found in 88% of
samples (15 sites).
Table 3.6: Top 10 Most Abundant and Most Frequently Recorded Species in the Grab Samples
Most abundant species Most frequently occurring species (n=17)
Scientific Name Common Name Total Scientific Name Common Name %
Phoronis Polychaete worm 935 Kurtiella bidentata Bivalve 88
Amphiura filiformis A brittlestar 224 Owenia borealis Polychaete worm 82
Kurtiella bidentata Bivalve 219 NEMERTEA Ribbon worm 82
Ophiothrix fragilis Common brittlestar 177 Phoronis Polychaete worm 76
Magelona filiformis Polychaete worm 128 Lumbrineris cingulata Polychaete worm 71
Magelona johnstoni Polychaete worm 118 Spiophanes bombyx Polychaete worm 71
NEMERTEA Ribbon worm 113 Pholoe baltica Polychaete worm 65
Tellina fabula Bean-like tellin 100 Ampelisca tenuicornis An amphipod 65
Rodhine Polychaete worm 93 Amphiura filiformis A brittlestar 65
Phaxas pellucidus Razor shell 86 Glycinde nordmanni Polychaete worm 59
In 10 of the 17 grab samples collected in the survey area a total of 16 species and higher taxa of non-
quantitative colonial epifaunal animals were identified. The dominant taxa present was Bryozoa (8
taxa), followed by Cnidaria (5 taxa), Porifera (2 taxa) and Entoprocta (1 taxa).
The full record of the epifaunal (non-enumerated) species identified from the grab samples is
presented in Appendix G.

METHIL OFFSHORE WIND DEMONSTRATOR BENTHIC SUB-TIDAL ECOLOGY
SURVEY FINAL REPORT
Report No. 15/J/3/03/2590/1782 Page 27
Figure 3.6: Distribution of number of individuals across the survey area

METHIL OFFSHORE WIND DEMONSTRATOR BENTHIC SUB-TIDAL ECOLOGY
SURVEY FINAL REPORT
Report No. 15/J/3/03/2590/1782 Page 28
Figure 3.7: Distribution of number of taxa across the survey area

METHIL OFFSHORE WIND DEMONSTRATOR BENTHIC SUB-TIDAL ECOLOGY
SURVEY FINAL REPORT
Report No. 15/J/3/03/2590/1782 Page 29
3.4.2 Biomass
Biomass weight for Mollusca included shells. The phylum contributing the most (Figure 3.8) was the
Echinodermata which accounted for 40% of the total AFDW. This was mainly due to the presence of
large specimens of the brittlestar O. fragilis with a smaller contribution from A filiformis at sites 6 and
12. The particularly high abundance of these two brittlestars is due to the presence of extensive
brittlestar beds at these sites. Mollusca contributed 38%, Annelida and Other taxa contributed 10%
each and Crustacea accounted for 2% of the total AFRW. Biomass data are presented in Appendix I.
Figure 3.8: Contribution to biomass by all major groups (AFDW). Epifauna is included in
‘Other’ taxa
3.4.3 Diversity Index
The number of species recorded in the survey area ranged from 9 species at Site 9 to 71 species at
Site 19. The site where species richness was less than 10 was characterised by a high percentage of
very fine sand and various fractions of silt. This type of habitat can typically, be species poor. The
video survey also found a paucity of fauna at this location which was the most offshore site in the
survey array. The Shannon-Weiner diversity index combines species richness and their abundances,
giving high values where the numbers of individuals are evenly distributed across the species
recorded. Figure 3.9 shows the distribution of the index across the survey area, reflecting the
variations of species richness and abundance at the sites described.
Table 3.7summarises the diversity indexes for the study area.
Echinodermata 40%
Mollusca 38%
Other taxa 10%
Annelida 10%
Crustacea 2%

METHIL OFFSHORE WIND DEMONSTRATOR BENTHIC SUB-TIDAL ECOLOGY
SURVEY FINAL REPORT
Report No. 15/J/3/03/2590/1782 Page 30
Table 3.7: Diversity Indexes
Site No of Species
(N)
No of
Individuals (N)
Pielou’s
Evenness (J')
Simpsons
Dominance
(1-Lambda')
Shannon-Wiener
(H'(loge))
1 25 137 0.588 0.6955 1.893
4 59 309 0.7576 0.9045 3.089
5 54 205 0.8752 0.959 3.491
6 45 261 0.6374 0.8019 2.426
7 54 168 0.7365 0.8464 2.938
8 23 75 0.7954 0.8771 2.494
9 9 12 0.9206 0.9091 2.023
10 57 385 0.7276 0.8731 2.942
11 65 354 0.7843 0.929 3.274
12 35 134 0.611 0.7101 2.172
13 48 421 0.5782 0.7282 2.238
14 39 258 0.473 0.5472 1.733
15 49 251 0.836 0.9432 3.254
16 68 334 0.7456 0.8911 3.146
17 49 405 0.7554 0.9086 2.94
18 46 351 0.8096 0.9301 3.1
19 71 260 0.8168 0.934 3.482

METHIL OFFSHORE WIND DEMONSTRATOR BENTHIC SUB-TIDAL ECOLOGY
SURVEY FINAL REPORT
Report No. 15/J/3/03/2590/1782 Page 31
Figure 3.9: Shannon -Weiner diversity index across the survey area
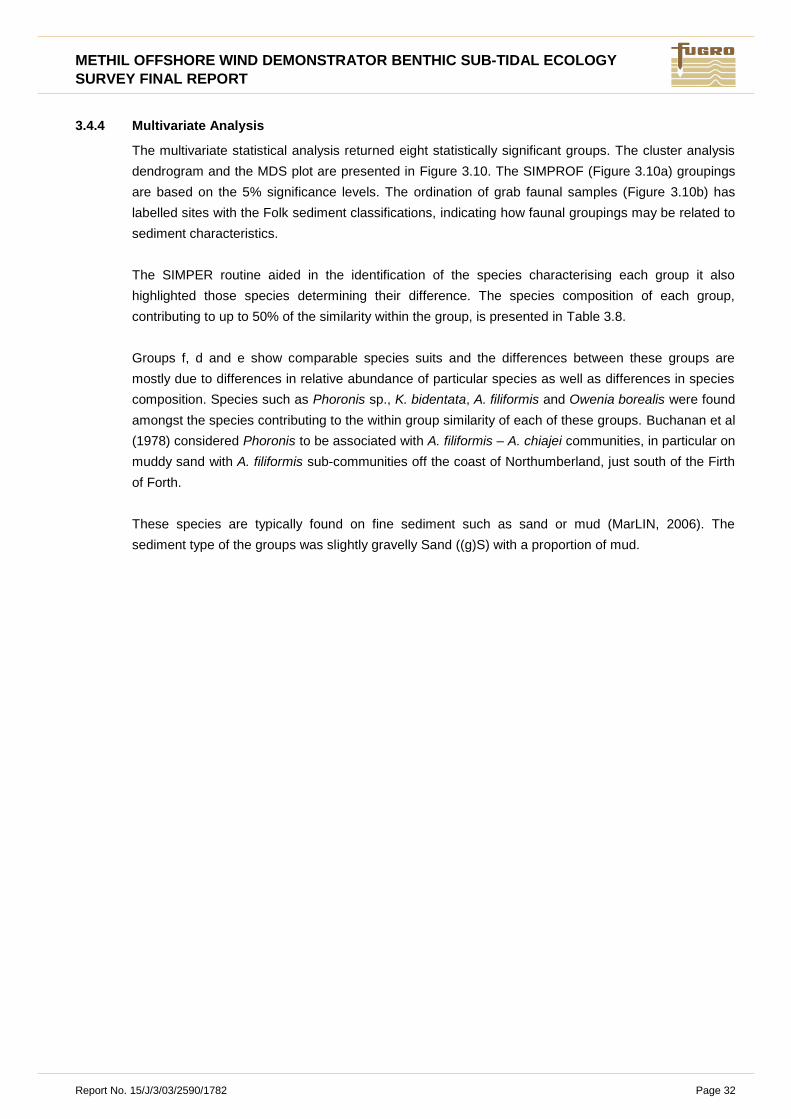
METHIL OFFSHORE WIND DEMONSTRATOR BENTHIC SUB-TIDAL ECOLOGY
SURVEY FINAL REPORT
Report No. 15/J/3/03/2590/1782 Page 32
3.4.4 Multivariate Analysis
The multivariate statistical analysis returned eight statistically significant groups. The cluster analysis
dendrogram and the MDS plot are presented in Figure 3.10. The SIMPROF (Figure 3.10a) groupings
are based on the 5% significance levels. The ordination of grab faunal samples (Figure 3.10b) has
labelled sites with the Folk sediment classifications, indicating how faunal groupings may be related to
sediment characteristics.
The SIMPER routine aided in the identification of the species characterising each group it also
highlighted those species determining their difference. The species composition of each group,
contributing to up to 50% of the similarity within the group, is presented in Table 3.8.
Groups f, d and e show comparable species suits and the differences between these groups are
mostly due to differences in relative abundance of particular species as well as differences in species
composition. Species such as Phoronis sp., K. bidentata, A. filiformis and Owenia borealis were found
amongst the species contributing to the within group similarity of each of these groups. Buchanan et al
(1978) considered Phoronis to be associated with A. filiformis – A. chiajei communities, in particular on
muddy sand with A. filiformis sub-communities off the coast of Northumberland, just south of the Firth
of Forth.
These species are typically found on fine sediment such as sand or mud (MarLIN, 2006). The
sediment type of the groups was slightly gravelly Sand ((g)S) with a proportion of mud.

METHIL OFFSHORE WIND DEMONSTRATOR BENTHIC SUB-TIDAL ECOLOGY
SURVEY FINAL REPORT
Report No. 15/J/3/03/2590/1782 Page 33
a)
b)
Figure 3.10: Cluster analysis dendrogram and Multidimensional Scaling plot of the multivariate
statistical analysis of the macrofaunal grab data
The two species contributing to 50% of the similarity within Group h were the common brittlestar
O. fragilis and the polychaete worm Subadyte pellucida. The former being quite abundant resulting in
brittlestar beds (see video analysis – 3.2), on coarser grounds. These two species have shown to be

METHIL OFFSHORE WIND DEMONSTRATOR BENTHIC SUB-TIDAL ECOLOGY
SURVEY FINAL REPORT
Report No. 15/J/3/03/2590/1782 Page 34
commensal with S. pellucida previously being reported on the discs and arms of O. fragilis (Pettibone,
1969 and 1993).
Group b was characterised by the presence of high abundance of M. filiformis and M. johnstoni as well
as the mollusc bivalve molluscs T. fabula and K. bidentata.
The other groups included single samples only. It is worth mentioning the high abundance of the
bivalve Musculus subpictus at site 19 (group c). This is the only site where the grab samples collected
the taxa Ascidiidae, Ascidiella and Ascidiella aspersa and M. subpictus is known to frequently occur
embedded in the flesh of tunicates (Neal, 2004).
Table 3.8: Species Composition of Each SIMPER Group
Group Sites in Group
and Dominant
Sediment
Characteristics
Species Av. Abundance Cum %
Average similarity:
38.36 %
1, 7, 8 and 14
slightly gravelly
muddy Sand
poorly sorted
Phoronis
Kurtiella bidentata
Owenia borealis
Ampelisca tenuicornis
Glycera unicornis
8.38
2.7
1.49
1.47
1.35
28.02
36.77
43.65
49.59
54.78
Average similarity:
56.61 %
4, 13, and 16
slightly gravelly
muddy Sand
poorly sorted
Phoronis
Amphiura filiformis
Rhodine
NEMERTEA
Melinna palmata
Magelona alleni
Owenia borealis
Anobothrus gracilis
Lucinoma borealis
10.94
5.51
4.34
3.16
3.6
3.64
2.88
2.31
2.2
14.46
21.3
26.64
31.64
36.26
40.49
44.43
48.09
51.22
Average similarity:
54.03%
5, 10 and 11
slightly gravelly
Sand
poorly sorted
Amphiura filiformis
Kurtiella bidentata
Phoronis
Phaxas pellucidus
Acrocnida brachiata
Thracia (juv.)
Cylichna cylindracea
Thracioidea (juv.)
Ophiuridae (juv.)
Pholoe baltica
Owenia borealis
5.52
5.27
7
3.36
3.44
3.22
2.29
2.23
2.39
2.55
2.72
8.33
15.46
21.85
27.26
31.74
35.29
38.78
42.28
45.57
48.86
52.07
Average similarity:
33.87%
6 and 12
Sandy Gravel
Very poorly
sorted
Ophiothrix fragilis
Subadyte pellucida
9.34
2.74
38.39
50.44
Average similarity:
58.67%
17 and 18
slightly gravelly
Sand
moderately (well)
sorted
Magelona filiformis
Magelona johnstoni
Tellina fabula
Kurtiella bidentata
Spio symphyta
NEMERTEA
Thracia phaseolina
7.58
7.51
6.7
4.74
3.97
3.41
3.5
11.6
22.98
30.39
37.62
43.09
47.56
51.73

METHIL OFFSHORE WIND DEMONSTRATOR BENTHIC SUB-TIDAL ECOLOGY
SURVEY FINAL REPORT
Report No. 15/J/3/03/2590/1782 Page 35
Group Sites in Group
and Dominant
Sediment
Characteristics
Species Av. Abundance Cum %
15
gravelly muddy
Sand
very poorly sorted
Scoloplos armiger
Glycera lapidum
Pholoe baltica
NEMERTEA
Mediomastus fragilis
9
slightly gravelly
sandy Mud
Poorly sorted
Nephtys incisa
NEMERTEA
Abra nitida
Aphelochaeta marioni
Crangon allmanni
19
sandy gravel
Very poorly
sorted
Musculus subpictus
Kurtiella bidentata
Amphiura filiformis
NEMERTEA
Phoronis
Note: The single site groups g, a and c do not have species identified by SIMPER which requires a
minimum of two sites within a group. Instead the top five species by abundance have been included in
the Table for comparative purposes.
The distribution of faunal groupings across the survey area is shown in Figure 3.11 and reflects the
natural environment variability of the survey area.

METHIL OFFSHORE WIND DEMONSTRATOR BENTHIC SUB-TIDAL ECOLOGY
SURVEY FINAL REPORT
Report No. 15/J/3/03/2590/1782 Page 36
Figure 3.11: Faunal primer groupings

METHIL OFFSHORE WIND DEMONSTRATOR BENTHIC SUB-TIDAL ECOLOGY
SURVEY FINAL REPORT
Report No. 15/J/3/03/2590/1782 Page 37
As well as describing the species forming each statistical group, SIMPER also returns the list of
species driving the differences between groups. These were mainly related to variation in the density
of Phoronis sp., but in some cases also to the high abundance of species such as O. fragilis,
Turritella communis, Magelona filiformis and Magelona johnstoni at some locations and the lack of
them at other sites. Details are presented in Figure 3.12.
Figure 3.12: MDS plots with species highlighted as driving SIMPER group differences

METHIL OFFSHORE WIND DEMONSTRATOR BENTHIC SUB-TIDAL ECOLOGY
SURVEY FINAL REPORT
Report No. 15/J/3/03/2590/1782 Page 38
3.5 Biotopes
Macrofaunal species abundance data and sediment particle size data were analysed together to
determine the biotopes present in the survey area. Data from the seabed imagery analysis and depth
of the sites were also used to support the defined biotopes. The list of species for each site was run
through BioScribe, the biotope decision support tool, to cross-check whole community data against the
reference samples used by the JNCC to originally describe the habitats in the marine classification
system (Hooper et al., 2010, Connor et al., 2004). Finally, a biotope was allocated to each of the 17
sites included in the analysis. A total of six biotopes were identified in the survey area and they were
consistent with Connor et al. (2004) and the EUNIS habitat Classification 2012. Of these, two were
described as full Level 5 biotopes and four were described as Level 4 biotope complexes. Details
related to these biotopes are presented in Table 3.9.
Table 3.9: Biotopes Described for the Survey Area
Biotope EUNIS
Code
Sites Faunal
Groups
Example Image
SS.SSA.OSa A5.27 1, 4, 5, 10, 11,
13, 14 and 16
d, e, f
SS.SMu.CSaMu A5.35 8 and 9 a, f
SS.SMU.CFiMu A5.36 7 f
SS.SMx.CMx A5.44 15 and 19 g and c

METHIL OFFSHORE WIND DEMONSTRATOR BENTHIC SUB-TIDAL ECOLOGY
SURVEY FINAL REPORT
Report No. 15/J/3/03/2590/1782 Page 39
Biotope EUNIS
Code
Sites Faunal
Groups
Example Image
SS.SSA.IMuSa.FfabMag A5.242 17 and 18 b
SS.SMx.CMx.OphMx A5.445 6 and 12 h
Based on the biotopes described, the survey area can be divided in four blocks following the sediment
gradient from the offshore sites to the inshore ones (Figure 3.13 and Figure 3.14). This confirms the
pattern already noticed in the faunal groupings (Figure 3.11).
As will become clear from the description below, it is considered important to note here that work is
being carried out by the JNCC in order to update the marine classification system. The area of main
concern, due to lack of data, is the offshore coarse sediments, in particular the circalittoral coarse and
mixed sediments (JNCC, 2014). Communities associated with offshore mixed sediments are believed
to be found in the survey area and the biotope allocations described are based on the best available
current evidence. Alternatives that were considered but then discarded are also discussed briefly
within the text.
Biotopes such as SS.SMx.CMx.OphMx indicating the presence of Ophiothrix beds and the biotope
complex SS.SMx.CMx indicating mixed coarse substrate were confirmed by the video analysis and
were located in the inshore part of the survey area. The biotope SS.SSA.IMuSa.FfabMag was also
found at two locations close to shore where the species Tellina fabula1 and two species of Magelona
were abundant and the sediment observed as muddy sand matches the one characteristic for this
biotope.
Careful consideration was given to the selection of the biotopes in the central part of the survey area
particularly with regard to the possible presence of two Level 5 biotopes SS.SMU.AfilMysAnit and
SS.SSA.OSa.OfusAfil. The presence of species such as Amphiura filiformis, Kurtiella bidentata 2,
which characterise this biotope, although in variable abundances at most of the sites, suggested the
1 Please note change of name Fabulina fabula is now called Tellina fabula as per the World Register of Marine
Species (WoRMS) (Appeltans et al., 2012).
2 Please note change of name Mysella bidentata is now called Kurtiella bidentata as per the World Register of
Marine Species (WoRMS) (Appeltans et al., 2012).

METHIL OFFSHORE WIND DEMONSTRATOR BENTHIC SUB-TIDAL ECOLOGY
SURVEY FINAL REPORT
Report No. 15/J/3/03/2590/1782 Page 40
former biotope. However, the low percentage of mud present in no way supported selection of this
biotope. Therefore the second option was considered. This observation was supported by a recent
study carried out in Scottish waters, SNH (2013), highlighting that in areas where burrowed mud
habitat was observed from video footage (SS.SMU.CFiMu.SpnMeg) grab samples collected were
classified as either SS.SSa.OSa.OfusAfil, which comprise coarse sandy sediments or
SS.SMu.CSaMu.AfilMysAnit which comprise sandy mud sediments. The former one was reported as
found in muddier conditions (between 10% and 30%) (Howson et al., 2012). The data behind the
description of SS.SMu.CSaMu.AfilMysAnit provided by Connor et al. (2004) indicates this biotope was
defined from very muddy sediments with a silt/clay (i.e. mud) fraction of over 50%. Moreover, in this
biotope, the brittlestar A. filiformis is expected to be found in large numbers (SNH, 2013) and, although
definitely present in the communities observed in this study, its abundance is not considered to
support this description. SS.SMu.CSaMu.AfilMysAnit was therefore not selected.
Similar consideration was given to those sites (Site 1 and Site 13) where higher abundance of
Phoronis (horseshoe worm) and Rhodine (bamboo worm) where recorded. The high abundance
observed for these species at few sites suggested the biotope SS.SSA.OSa.MalEdef Maldanid
polychaetes and Eudorellopsis deformis in offshore circalittoral sand or muddy sand. Although
sufficient data are not available, and therefore there is high degree of uncertainty (e.g. contribution of
Phoronis spp. is unknown), maldanid polychaetes such as Rhodine contribute significantly to the
classification of this assemblage, but are not considered as important in the alternative biotopes
considered.
It was clear that a definite decision could not be made to describe the habitat to biotope level with
confidence (for the currently described full Level 5 biotopes); therefore the final choice was to attribute
the biotope complex SS.SSA.OSa to the sites in question, as evidence strongly suggests that the type
of biotopes hierarchically below this complex are good candidates in describing the communities and
the environment.
For the offshore area, two biotope complexes were identified: SS.SMu.CSaMu and SS.SMU.CFiMu.
As the species assemblages did not indicate any clear biotope, but rather an impoverished area, these
were left at complex level and derived largely, on the basis of the sediment composition and depth.
However, some observations on the faunal composition were made. The presence of
Turritella communis on this ground is possibly indicative of transitional communities. As highlighted by
the video analysis, the area is characterised by the presence of the biotope SS.SMU.CFiMu.SpnMeg
whose infaunal composition is described as very similar to the one occurring beneath another biotope
called SS.SMU.CFiMu.BlyrAchi Brissopsis lyrifera and Amphiura chiajei in circalittoral mud. Although
described as occurring in deeper and siltier muds, it is worth mentioning this biotope as it is also
similar to the biotope called SS.SMU.AfilMysAnit which was also considered for other sites within the
present study. High numbers of T. communis are found in communities which are considered
transitional between the two (SS.SMU.CFiMu.BlyrAchi and SS.SMU.AfilMysAnit) (Connor et al., 2004).
The biotopes from the video and grab data described above have been viewed in conjunction with the
Geophysical data provided in order to produce a broad indicative habitat map (Figure 3.14).

METHIL OFFSHORE WIND DEMONSTRATOR BENTHIC SUB-TIDAL ECOLOGY
SURVEY FINAL REPORT
Report No. 15/J/3/03/2590/1782 Page 41
Figure 3.13: Biotopes from grab faunal assemblages

METHIL OFFSHORE WIND DEMONSTRATOR BENTHIC SUB-TIDAL ECOLOGY
SURVEY FINAL REPORT
Report No. 15/J/3/03/2590/1782 Page 42
Figure 3.14: Predicted habitat distribution based on geophysical and grab/trawl data

METHIL OFFSHORE WIND DEMONSTRATOR BENTHIC SUB-TIDAL ECOLOGY
SURVEY FINAL REPORT
Report No. 15/J/3/03/2590/1782 Page 43
3.6 Epibenthic Trawl
Large and more mobile epibenthic communities were investigated by a series of 2 m beam trawls (see
Appendix K for raw data).
The most common epibenthic group sampled was that of bony fish in the Class Actinopterygii (21%),
followed by Crustacea and Mollusca (19%), Echinodermata (14%) and Annelida (11%). All the other
major groups accounted for less than 10% each (Figure 3.15a)
The non-enumerated taxa included all of the colonial organisms. The abundance calculations only
included numerable taxa, therefore colonial organisms, such as Porifera, Bryozoa and some Cnidaria
were excluded. A total of 2,636 individuals were recorded. Of these, Echinodermata were the most
abundant group (36%), due mainly to the very high abundance of Astropecten irregularis and the high
abundance of Asterias rubens. Other major taxa contributing to the total abundance included Tunicata
(24%), Crustacea (14%), Mollusca (13%) and Actinopterygii (12%). Annelida counted for 1% of the
total abundance with Cnidaria counting for less than 1% (Figure 3.15b).
The high abundances of sand star Astropecten irregularis present in some trawls and of Acrocnida
brachiata in the grab data indicate the potential presence of SS.SSA.CMuSa.AbrAirr Amphiura
brachiata with Astropecten irregularis and other echinoderms in circalittoral muddy sand as an
epifaunal overlay. Site 10 (T1) and site 11 appear to have SS.SSA.CMuSa.AbrAirr present as an
overlay, as well as at site 4 (T2) and site 5 although more marginally. This fits with the description of
this biotope which states that in some areas it forms an epifaunal overlay which may cover a wide
range of biotopes in years of good recruitment but does not develop into a settled or established
community (Connor et al., 2004). The presence of Kurtiella bidenta, a characteristic species of
SS.SSA.CMuSa.AbrAirr which may have a commensal association with A. brachiata (Southward and
Campbell, 2006) supports this as its highest abundance was found at site 11 and picked out by
SIMPER for group e (sites 5, 10 and 11).
Amongst the enumerated taxa, the most abundant species and their frequency are presented in Table
3.10; the table also presents the most frequent taxa amongst the non-enumerated species. The sea
squirt Ascidiella was the most numerous species overall, being the most abundant in Trawl 4 and the
second most abundant in Trawl 1 and 2. Ascidiella was mainly composed of Ascidiella aspersa
(counting for 509 out of 634 individuals), with Ascidiella (juv.) (96 individuals), Ascidiella scabra (21
individuals) and Ascidiella (8 individuals). The sea star Astropecten irregularis was the second most
abundant species overall, with only nine less individuals than Ascidiella, being the most abundant
species in Trawls 1 and 2 but only seventh most abundant in Trawl 4. All of the ten most abundant
species were recorded at all three trawl sites.
Amongst the non–enumerated colonial sessile taxa the Bryozoan Alcyonidium parasiticum was the
most frequently recorded species found in all three trawls (Table 3.10). The hydroid Hydrallmania
falcata and cnidaria Alcyonium digitatum were present in two of the trawls.

METHIL OFFSHORE WIND DEMONSTRATOR BENTHIC SUB-TIDAL ECOLOGY
SURVEY FINAL REPORT
Report No. 15/J/3/03/2590/1782 Page 44
Figure 3.15: Percentage contributions of major taxonomic groups to the total number of taxa
recorded (a) to the total abundance for enumerated only (b)
At the three trawling sites, a total of 13 fish taxa were recorded. Of these, 11 were identified to species
level with the remaining two identified to a higher level. Abundance and frequency recorded for the top
ten most abundant taxa are presented in
a).
b).
21%
19%
19%
14%
11%
3%
7%
3% 3%
Actinopterygii
Crustacea
Mollusca
Echinodermata
Annelida
Tunicata
Cnidaria
Porifera
Bryoza
36%
24%
14%
13%
12% 1% 0%
Echinodermata
Tunicata
Crustacea
Mollusca
Actinopterygii
Annelida
Cnidaria

METHIL OFFSHORE WIND DEMONSTRATOR BENTHIC SUB-TIDAL ECOLOGY
SURVEY FINAL REPORT
Report No. 15/J/3/03/2590/1782 Page 45
Table 3.11. The flat fish Pleuronectes platessa accounted for 34% of the total abundance of fish taxa
and were recorded at all sites. This was followed by the sand goby Pomatoschistus minutus (27%)
and dab Limanda limanda (15%), both of which were found at all three sites.
Table 3.10: Total Abundance and Frequency of the Top Ten Most Abundant Enumerated Taxa,
and Frequency of the Non–enumerated Taxa Recorded from the 2 m Beam Trawl Survey
Species (enumerated) Total abundance No. of trawls Species (non - enumerated)
No. of
trawls
Ascidiella 634 3 Alcyonidium parasiticum 3 Astropecten irregularis 500 3 Hydrallmania falcata 2
Asterias rubens 229 3 Alcyonium digitatum 2
Philine aperta 181 3 Suberites ficus (agg.) 1
Liocarcinus depurator 176 3 Halichondria 1
Ophiothrix fragilis 167 3 Abietinaria abietina 1
Crangon crangon 136 3 Eucratea loricata 1
Aequipecten opercularis 111 3
Pleuronectes platessa 102 3
Pomatoschistus minutus 81 3
Table 3.11: Total Abundance and Frequency of the Top Ten Fish Taxa Recorded from the 2 m
Beam Trawl Survey
Fish species
Total
abundance Frequency % of total abundance
Pleuronectes platessa 102 3 34
Pomatoschistus minutus 81 3 27
Limanda limanda 46 3 15
Syngnathus acus 22 3 7
Agonus cataphractus 15 3 5
Callionymus lyra 8 3 3
Pomatoschistus 8 1 3
Gadus morhua 6 1 2
Myoxocephalus scorpius 4 3 1
Pholis gunnellus 2 2 1

METHIL OFFSHORE WIND DEMONSTRATOR BENTHIC SUB-TIDAL ECOLOGY
SURVEY FINAL REPORT
Report No. 15/J/3/03/2590/1782 Page 46
3.7 Sediment Chemistry
Contaminant samples for the analysis of total PAH, metals, PCB, organotin (TBT, DBT) compounds,
TPH and total organic carbon (loss of ignition) were successfully sampled at site 5 (within the
application boundary), one of the three sediment chemistry sample locations in the survey area. The
results of these analyses are presented in Appendix J and are compared against the Marine Scotland
pre-dredge guidelines and other criteria where relevant.
PAHs
Total PAH levels at site 5 were 169 µg/kg. All of the single PAH concentrations were below the revised
Marine Scotland Action Levels as described in the Marine Scotland pre-dredge guidelines (Marine
Scotland, 2011).
When compared against the OSPAR assessment criteria all of the individual PAH concentrations are
below the Effects Range Low (ERL). The ERL values used by OSPAR were developed by the United
States Environmental Protection Agency for assessing the ecological significance of sediment
concentrations. Concentrations below the ERL rarely cause adverse effects in marine organisms
(MERMAN, 2015).
Metals
All metal concentrations were below the revised Marine Scotland Action Levels (Marine Scotland,
2011). All of the metal concentrations are also all below the OSPAR ERLs except for Arsenic, which
had a concentration of 9.25 mg / kg against an ERL of 8.2 mg / kg.
A summary of the concentrations is presented in Appendix J.
Organotins
Tributyltin concentration was below the Marine Scotland revised action limit. The level of TBT fell
within class C of the OSPAR reference levels, which is a six class assessment scheme for TBT
specific biological effects in the reproductive capability of sensitive gastropod species (OSPAR,
2009a). Other organotins had similar levels, <4 µg / kg or lower except for Dibutyltin which had a level
of 7.04 µg / kg.
Table 3.12: Integrated Assessment Classes Linking TBT Effects in Gastropod Species with
Concentrations of TBT In Water and Sediment
Assessment Class TBT Sediment (µg TBT / kg dw)
A n.d.
B <2
C 2 - <50
D 50 - <200
E 200 - 500
F >500

METHIL OFFSHORE WIND DEMONSTRATOR BENTHIC SUB-TIDAL ECOLOGY
SURVEY FINAL REPORT
Report No. 15/J/3/03/2590/1782 Page 47
PCB (ICES 7 and 25)
Polychlorinated biphenyls (PCB) concentrations for PCB (ICES 7) was 1.2 µg / kg and the
concentration for PCB (CEN 25) was 2.68 µg / kg. There were no Action Levels in the Marine Scotland
pre-dredge guidelines to compare against; however when compared against the OSPAR
Environmental Assessment Criteria (EAC) all of the individual PCB concentrations analysed were
below the assessment concentration. EACs were developed by OSPAR and the International Council
for the Exploration of the Sea (ICES) for assessing the ecological significance of sediment
concentrations with concentrations below the EAC not expected to cause any chronic effects in marine
organisms (MERMAN, 2015).
Total petroleum hydrocarbons
The TPH concentration was 370 mg / kg, which is above the existing and revised Marine Scotland
Action Levels of 100 mg / kg. Ahmed et al. (2006) reported that the Forties crude oil equivalent
concentrations for Firth of Forth sediments varied between samples from 47.1 to 351.5 mg/kg dry
weight with a mean concentration of 161.8 mg/kg dry weight. The TPH analysis reported here was
carried out using an Ekofisk crude oil standard for calibration.
Total organic content
Total organic content after loss on ignition at site 5 was 2.52 %. The mean background organic matter
content reported for central North Sea sediments by UKOOA (2001) was 1.63% and the 95th percentile
value was 4.48% (UKOOA 2001).
4. DISCUSSION
4.1 Subtidal benthic ecology
The survey area was mainly circalittoral with the offshore part characterised by silty sediments, the
middle part characterised by sandy sediments and the more inshore area characterised by mixed
sediment and an infralittoral sandy element in the most northerly inshore sites. These zonations were
evident from the analysis presented in the results, and were consistent across the sampling
methodologies employed. They also reflected the natural variations of the physical characteristics of
the seabed.
Multivariate analysis of the grab faunal data showed that there were eight statistically different groups
across the survey area, as illustrated in Figure 3.11. Each group was determined by the composition
of the species that each site contained (Table 3.8), which is influenced by the physical characteristics
encountered at each site. The faunal groupings reflected the gradient shown by sediment
characterisation and a summary is presented in Table 4.1.
The analysis of the biotopes also reflected the zonation observed by the sediment analysis and the
faunal groupings derived by the multivariate biological analysis. Biotopes are determined by their
physical habitat conditions together with the community of characteristic benthic species found within
them although these defining attributes, such as what species are present and in what numbers have
a degree of flexibility. The process of assigning biotopes from grab data to some of the locations
investigated was, therefore, not straight forward and a number of considerations were made. Based

METHIL OFFSHORE WIND DEMONSTRATOR BENTHIC SUB-TIDAL ECOLOGY
SURVEY FINAL REPORT
Report No. 15/J/3/03/2590/1782 Page 48
on the grab data the area was then described by two level 5 biotopes, namely SS.SMx.CMx.OphMx
and SS.SSA.IMuSa.FfabMag, and four level 4 biotope complexes, namely SS.SMx.CMx,
SS.SSA.OSa, SS.SMu.CSaMu, SS.SMU.CFiMu. These biotopes are similar to biotopes previously
encountered in the Firth of Forth by Fugro EMU (Fugro EMU, 2013).
The biotopes assigned divided the survey area into an offshore area consisting of circalittoral sandy
mud (SS.SMu.CSaMu) and circalittoral fine mud (SS.SMU.CFiMu), a central offshore area of
circalittoral sand (SS.SSA.OSa), a near shore circalittoral mixed sediment (and with brittlestar beds)
(SS.SMx.CMx and SS.SMx.CMx.OphMx) and a nearshore infralittoral muddy sand area
(SS.SSA.IMuSa.FfabMag).
The analysis suggested that offshore sand sediments are found in the survey area and the biotope
allocations described are based on the best available current evidence. The biotope complex
SS.SSA.OSa was chosen as best describing the habitats for a large part of the survey area. Data
analysis highlighted the need of some careful considerations with respect to assigning biotopes and in
this way SS.SMU.AfilMysAnit, SS.SSA.OSa.OfusAfil, and SS.SSA.OSa.MalEdef were considered
and rejected. The SS.SMU.AfilMysAnit has, with a degree of uncertainty, been recorded further
offshore in deeper water within the Firth of Forth (MESH Atlantic, 2015). Both AfilMysAnit and
OfusAfil have also been found underlying borrowed mud habitats described by video data analysis in
other locations in Scottish waters (SNH, 2013). However this was not considered to appropriately
describe the sites in question as muddier conditions should be present (SNH, 2013; Connor et al.,
2004)
The biotope analysis of the video data highlighted coarser sediment close to shore which were well
described by the biotope complex SS.SMx.CMx and by the biotope SS.SMx.CMx.OphMx. Also
CR.MCR.EcCr and CR.HCR.XFa were described for inshore sites. SS.SSa was a biotope complex
describing the northern part of the inshore area, characterised by finer sediment. Moving offshore,
finer sediments were noticed and described by biotope complexes (such as SS.SSa.CMuSa) with a
prevalence of burrowed mud to which the biotope SS.SMU.CFiMu.SpnMeg was mainly assigned.
This is in accordance with the distribution of the burrowed mud MPA search feature (SNH, 2013 and
documents mentioned within).
Video data is useful for describing broad picture epifaunal biotopes and grab data fills in the detail
describing the infaunal, underlying communities. Table 4.1 summarises the biological communities
described for the area by the sampling methodologies employed.
Table 4.1: Summary Table
Site Faunal
Groupings
Sediment
Groupings
Biotope (Grab Data) Biotope (Video Data)
1 f c SS.SSA.OSa SS.SMU.CFiMu.SpnMeg
2 no data no data not suitable data SS.SMx.CMx.OphMx
SS.SSa.CMuSa
CR.MCR.EcCr

METHIL OFFSHORE WIND DEMONSTRATOR BENTHIC SUB-TIDAL ECOLOGY
SURVEY FINAL REPORT
Report No. 15/J/3/03/2590/1782 Page 49
Site Faunal
Groupings
Sediment
Groupings
Biotope (Grab Data) Biotope (Video Data)
3 no data no data no data CR.MCR.EcCr
4 d e SS.SSA.OSa SS.SMu.CFiMu.SpnMeg
5 e e SS.SSA.OSa SS.SMx.CMx
SS.SMx.CMx.OphMx
6 h g SS.SMx.CMx.OphMx SS.SMx.CMx.OphMx
7 f c SS.SMU.CFiMu SS.SSa.CMuSa
8 f b SS.SMu.CSaMu SS.SMu.CFiMu.SpnMeg
9 a a SS.SMu.CSaMu SS.SMu.CFiMu.SpnMeg
10 e e SS.SSA.OSa SS.SMx.CMx
11 e e SS.SSA.OSa SS.SSa.CMuSa
12 h g SS.SMx.CMx.OphMx SS.SMx.CMx.OphMx
13 d e SS.SSA.OSa SS.SMu.CFiMu.SpnMeg
14 f c SS.SSA.OSa SS.SMu.CFiMu.SpnMeg
15 g f SS.SMx.CMx CR.HCR.XFa
SS.SMx.CMx
SS.SSa.CMuSa
16 d e SS.SSA.OSa SS.SMu.CSaMu.VirOphPmax.
HAs
SS.SMx.CMx
17 b e SS.SSA.IMuSa.FfabMag SS.SSa
CR.MCR.EcCr
SS.SSa.CMuSa
18 b e SS.SSA.IMuSa.FfabMag SS.SMx.CMx.OphMx
SS.SMx.CMx
19 c d SS.SMx.CMx SS.SMx.CMx
4.1.1 Features on conservation importance
Burrowed mud is a Priority Marine Feature (PMF) in Scotland’s seas. One of the component biotopes
identified for this PMF is SS.SMu.CFiMu.SpnMeg Seapens and burrowing megafauna in circalittoral
fine mud’. This biotope was observed within the Methil survey area. This habitat is also on the OSPAR

METHIL OFFSHORE WIND DEMONSTRATOR BENTHIC SUB-TIDAL ECOLOGY
SURVEY FINAL REPORT
Report No. 15/J/3/03/2590/1782 Page 50
list of threatened and declining habitats as ‘Sea-Pen and burrowing megafauna communities’
(OSPAR, 2010).
Both rocky biotopes encountered (CR.MCR.EcCr and CR.HCR.XFa) were only described to level 4
due to the data available as further precision would have been less accurate and therefore not
suitable. It should be noted that some of the level 5 biotopes for these classifications are included on
the Scottish Natural Heritage list of PMFs. However, both require the presence of the Northern sea
fan, Swiftia pallida, the known distribution of which is restricted to the west coast of Scotland (Marine
Scotland 2015).
Rocky features identified in the Video analysis were identified to have medium resemblance to being
classed as stony reef at two sites. These were sites 3 and 6 in the inshore area which were assigned
to CR.MCR.EcCr and SS.SMx.CMx.OphMx respectively. Sites 15 and 17 were identified to have low
resemblance to stony reef and were assigned to CR.HCR.XFa and CR.MCR.EcCr (as a mosaic with
SS.SSA.CMuSa). The rest of the sites were considered to be not reef. Sites 15 and 17 were also
found to have areas of mud/sandstone with the latter site also having relatively large holes bored in
the surface. This would appear to be consistent with the biotope CR.MCR.SfR Soft rock communities
which is illustrative of the UK BAP habitat ‘Peat and Clay Exposures with Piddocks’. However, it is
worth noting that this habitat was not included in the Scottish biodiversity list.
Three fish species listed as SNH PMF’s were identified during this survey, Sandeel Ammodytes, Sand
goby Pomatoschitus minutus and Cod Gadus morhua. A Sandeel was found at site 15 to the
north west inshore survey area. Sand goby were found at all three trawl sites and were the second
most abundant fish species caught. The Firth of Forth is a known nursery ground of Cod (Ellis et al.,
2012). During this survey six juvenile cod were caught in the 2 m beam trawl T1 at site 10 within the
application boundary.
4.2 Sediment Chemistry
4.2.1 PAH
PAHs in the marine environment have both natural and anthropogenic sources. They are natural
components of coal and oil and are also found during the combustion of fossil fuels and organic
material (OSPAR, 2009a and OSPAR, 2010). All PAHs analysed were detected as being below the
Marine Scotland Action Levels (Marine Scotland, 2011). Naphthalene and Anthracene were above the
OSPAR background concentrations although they did not exceed the upper assessment criterion
(ERL) (OSPAR, 2009a).
At the majority of stations around the UK the concentrations of PAHs exceed the ERL suggesting,
where this is the case that there may be some potential for adverse biological effects. However where
two or more are still significantly below the ERL the concentrations of contaminants are at levels
where it can be assumed that little or no risks are posed to the environment (OSPAR, 2009a)
4.2.2 Metals
All metals analysed were below the Marine Scotland revised action limits as well as the OSPAR ERLs
except for Arsenic which had a concentration just above the ERL.

METHIL OFFSHORE WIND DEMONSTRATOR BENTHIC SUB-TIDAL ECOLOGY
SURVEY FINAL REPORT
Report No. 15/J/3/03/2590/1782 Page 51
Arsenic occurs naturally in the environment from natural diffuse sources as well as anthropogenic
point and diffuse sources (UK Marine SACs Project, 2001).
4.2.3 Organotins
The level of TBT in the sediment was below the level of the Marine Scotland Revised Action Limit. It
fell into class C of the OSPAR assessment classes which means that it would not be expected to
affect the reproductive capability of sensitive gastropod species (OSPAR, 2009a).
4.2.4 PCBs
Polychlorinated biphenyls (PCBs) have varied harmful effects on marine organisms. Contamination
from PCBs is widespread and there are a few areas where concentrations are close to zero (OSPAR,
2010). The results show that the concentrations of PCB total ICES 7 was above the BAC, although
when compared against the Environmental Assessment Criteria (EAC) all of the individual PCB
concentrations were lower. The EAC represents the contaminant concentration in the environment
below which no chronic effects are expected to occur in marine species, including the most sensitive
species (OSPAR 2009b).
4.2.5 Total Petroleum Hydrocarbons
Although Ekofisk equivalent concentrations of TPH were above the existing and revised Marine
Scotland Action levels with a value of 370 mg / kg against 100 mg / kg, Forties crude oil equivalent
concentrations as high as 351.5 mg/kg dry weight have been recorded in the Firth of Forth previously
(Ahmed et al., 2006). As there is no absolute measure of fluorescence emission spectrofluorimeters
must first be calibrated with solutions of reference standards (Cefas 2000). Commonly used standards
include both Ekofisk and Forties crude oil. It should be noted that different standards were used for the
above reported values and therefore direct comparison is hampered. Nevertheless, the results from
Ahmed et al. (2006) indicate that similarly high values of total hydrocarbons have been reported from
the Firth of Forth more broadly.
It is also worth noting that multivariate statistical analysis showed the infaunal community sampled at
Site 5 grouping with Sites 10 and 11 (rather than grouping out individually for example). All these sites
had high numbers of the brittlestar Amphiura filiformis compared to the majority of sites sampled
during the survey. A. filiformis is a species known to be highly intolerant of oil pollution (Olsgard and
Gray 1995). On this basis the high value of total hydrocarbons reported at Site 5 would seem not to be
having a negative effect on the biological community sampled. This site also had the highest
Shannon-Wiener diversity index reported from the survey.

METHIL OFFSHORE WIND DEMONSTRATOR BENTHIC SUB-TIDAL ECOLOGY
SURVEY FINAL REPORT
Report No. 15/J/3/03/2590/1782 Page 52
5. REFERENCES
Ahmed, A. S., Webster, L., Pollard, P., Davies, I. M. and Moffat, C. F. (2006). Description and
evaluation of a sampling system for monitoring hydrocarbons in sediments. Fisheries Research
Services Internal Report No 09/06
Blott, S.J. and Pye, K. (2001). GRADISTAT: a grain size distribution and statistics package for the
analysis of unconsolidated sediments. Earth Surface Processes and Landforms, 26, 1237-1248.
Buchanan, J. B., Sheader, M. and Kingston, P. F. (1978). Sources of Variability in the Benthic
Macrofauna off the South Northumberland Coast, 1971–1976 JMBA UK 58 191-209.
Cefas (2000). Methods for the analysis for hydrocarbons and polycyclic aromatic hydrocarbons (PAH)
in marine samples. Sci. Ser. Aquat. Environ. Prot.: Analyt. Meth., CEFAS, Lowestoft, (12), 18pp.
Cefas (2004). Offshore Wind Farms: Guidance note for Environmental Impact Assessment In respect
of FEPA and CPA requirements. Version 2 – June 2004
Clarke, K.R., Gorley, R.N., 2006. PRIMER v6: User Manual/Tutorial. PRIMER-E, Plymouth.
Clarke, K.R., Warwick R.M. (2001). Change in marine communities: an approach to statistical analysis
and interpretation, 2nd edition. PRIMER-E, Plymouth.
Connor, D. W., Allen, J. H., Golding, N., Howell, K. L, Lieberknecht, L. M., Northen, K. O. and Reker,
J. B., (2004) The Marine Habitat Classification for Britain and Ireland Version 04.05 JNCC,
Peterborough ISBN 1 861 07561 8 (internet version)
www.jncc.defra.gov.uk/MarineHabitatClassification
Davies, J., Baxter, J., Bradley, M., Connor, D., Khan, J., Murray, E., Sanderson, W., Turnbull, C. &
Vincent, M. 2001. Marine Monitoring Handbook. Available online: http://jncc.defra.gov.uk/page-
2430#download
Eleftheriou, A. Basford, D.J. 1989. The macrobenthic infauna of the offshore northern North Sea.
Journal of Marine Biological Association 69: 123-143
Ellis, J.R., Milligan, S.P., Readdy, L., Taylor, N. and Brown, M.J. (2012). Spawning and nursery
grounds of selected fish species in UK waters. Sci. Ser. Tech. Rep., Cefas Lowestoft, 147: 56 pp.
EMODnet, 2015. Seabed Habitats. www.searchmesh.net/webGIS
Folk, R.L., 1954. The distinction between grain size and mineral composition in sedimentary rock
nomenclature. Journal of Geology 62 (4), 344-359
Fugro EMU Limited (2013). Report for Inch Cape Offshore Limited. Appendix 12C, Benthic Ecology
Baseline Offshore Export Cable Corridor, Technical Report

METHIL OFFSHORE WIND DEMONSTRATOR BENTHIC SUB-TIDAL ECOLOGY
SURVEY FINAL REPORT
Report No. 15/J/3/03/2590/1782 Page 53
Garrison, T. (2009). Oceanography: An Invitation to Marine Science. Cengage Learning. 582 pages.
Hiscock, K. (ed.) (1996) Marine Nature Conservation Review: rationale and methods. Coasts and seas
of the United Kingdom MNCR Series, Peterborough, Joint Nature Conservation Committee.
Hooper, G.J., Barfield, P.D., Thomas N.S. and Capasso, E (2011). Redefining biotopes at a regional
scale and development of a new MNCR biotope decision support tool. First published 2011. ISBN No.
978 0 907545 58 3. Published by the MALSF. Emu Ltd Report No. 1/J/1/03/1552/1103.
Howson, C.M., Clark, L., Mercer, T.S. and James, B. (2012). Marine biological survey to establish the
distribution and status of fan mussels Atrina fragilis and other Marine Protected Area (MPA) search
features within the Sound of Canna, Inner Hebrides. Scottish Natural Heritage Commissioned Report
No. 438
Irving, R., (2009) The identification of the main characteristics of stony reef habitats under the Habitats
Directive. JNCC Report No. 432. ISSN 0963-8091
JNCC, 2014. The Marine Habitat Classification for Britain & Ireland (v04.05).
http://jncc.defra.gov.uk/MarineHabitatClassification last updated: 23/07/2014; last visited: 23/01/2015
de Kluijver, M.J., Ingalsuo, S.S., and de Bruyne, R.H., – Mollusca of the North Sea http://species-
identification.org/about.php
Marine Scotland (2011), Guidance for the sampling and analysis of sediment and dredged material to
be submitted in support of applications for sea disposal of dredged material. Marine (Scotland) Act
2010, Available at: http://www.scotland.gov.uk/Resource/0044/00443832.pdf. Accessed 14-01-2015
Marine Scotland (2015). National marine plan interactive. Available online at:
http://marinescotland.atkinsgeospatial.com/nmpi/
MarLIN, 2006. BIOTIC - Biological Traits Information Catalogue. Marine Life Information Network.
Plymouth: Marine Biological Association of the United Kingdom. [Cited 21/01/2015] Available from
www.marlin.ac.uk/biotic
MERMAN, (2015). CSEMP — assessment criteria for Polycyclic Aromatic Hydrocarbons (PAH) in
sediments. Available online:
http://www.bodc.ac.uk/projects/uk/merman/assessments_and_data_access/csemp/help/assessment_
criteria/sediment/polycyclic_aromatic_hydrocarbons.html Accessed 10/02/2015
MESH Atlantic (2015). Mapping European Seabed Habitats - Interactive mapping portal. Available
online at: http://www.emodnet-seabedhabitats.eu/default.aspx?page=1974
Neal, K. (2004). Modiolarca tumida. Marbled crenella. Marine Life Information Network: Biology and
Sensitivity Key Information Sub-programme [on-line]. Plymouth: Marine Biological Association of the

METHIL OFFSHORE WIND DEMONSTRATOR BENTHIC SUB-TIDAL ECOLOGY
SURVEY FINAL REPORT
Report No. 15/J/3/03/2590/1782 Page 54
United Kingdom. [cited 12/02/2015]. Available from:
http://www.marlin.ac.uk/speciesinformation.php?speciesID=3814
Olsgard, F. & Gray, J.S., (1995). A comprehensive analysis of the effects of offshore oil and gas
exploration and production on the benthic communities of the Norwegian continental shelf. Marine
Ecology Progress Series, 122, 277-306.
OSPAR (2009a). CEMP assessment report: 2008/2009 Assessment of trends and concentrations of
selected hazardous substances in sediments and biota Monitoring and Assessment Series.
Publication Number: 390/2009. ISBN 978-1-906840-30-3
http://qsr2010.ospar.org/media/assessments/p00390_2009_CEMP_assessment_report.pdf Accessed:
23/01/2015
OSPAR (2009b). Background Document on CEMP assessment criteria for the QSR 2010. OSPAR
Commission Monitoring and Assessment Series. ISBN 978-1-907390-08-1. Publication Number:
461/2009.
OSPAR (2010). OSPAR Recommendation 2010/11 on furthering the protection and restoration of sea-
pen and burrowing megafauna communities in the OSPAR Maritime Area. OSPAR 10/23/1-E, Annex
33.
OSPAR (2013). Levels and trends in marine contaminants and their biological effects – CEMP
Assessment report 2012. Monitoring and Assessment Series. ISBN 978-1-909159-29-7. Publication
Number: 596/2013. Available at:
http://www.ospar.org/documents/dbase/publications/p00596/p00596_assessment_report_2012_cemp.
Pettibone, M. H. (1969) Review of some species referred to Scalisetosus McIntosh (Polychaeta,
Polynoidae). Proceedings of the Biological Society of Washington, 82: 1-30.
Pettibone, M. H. (1993) Scaled Polychaetes (Polynoidae) Associated with Ophiuroids and Other
Invertebrates and Review of Species Referred to Malmgrenia Mclntosh and Replaced by
Malmgreniella Hartman, with Descriptions of New Taxa. Smithsonian Contributions to Zoology
NUMBER 538
Scottish Biodiversity List http://www.biodiversityscotland.gov.uk/advice-and-resources/scottish-
biodiversity-list/
SNH, 2013. Scottish MPA Project. Assessment against the MPA Selection Guidelines. Small isles
possible nature conservation MPA. SNH web publication [B1209026 / 27(#27)].
Southward, E.C.; Campbell, A.C. (2006). [Echinoderms: keys and notes for the identification of British
species]. Synopses of the British fauna (new series), 56. Field Studies Council: Shrewsbury, UK. ISBN
1-85153-269-2. 272 pp.

METHIL OFFSHORE WIND DEMONSTRATOR BENTHIC SUB-TIDAL ECOLOGY
SURVEY FINAL REPORT
Report No. 15/J/3/03/2590/1782 Page 55
UK Marine SACs Project, (2001). Available online: http://www.ukmarinesac.org.uk/activities/water-
quality/wq8_9.htm Accessed 11/02/15
UKOOA, 2001. An analysis of UK Offshore oil and gas environmental surveys 1975 – 1995,
Aberdeen: Heriot-Watt University, UKOOA.
Ware, S. J., and Kenny, A. J. (2011), Guidelines for the Conduct of Benthic Studies at Aggregate
Dredging Sites 2nd edition. Marine Aggregate Levy Sustainability Fund. 80pp
WoRMS Editorial Board (2015). World Register of Marine Species. Available from
http://www.marinespecies.org at VLIZ. Accessed 2015-01-28

METHIL OFFSHORE WIND DEMONSTRATOR BENTHIC SUB-TIDAL ECOLOGY
SURVEY FINAL REPORT
Report No. 15/J/3/03/2590/1782 Page 56
6. APPENDICES

METHIL OFFSHORE WIND DEMONSTRATOR BENTHIC SUB-TIDAL ECOLOGY
SURVEY FINAL REPORT
Report No. 15/J/3/03/2590/1782 Page 57
A. APPENDIX A DECK PHOTOS
Site 1 Site 2
Site 4 Site 5
Site 6 Site 7

METHIL OFFSHORE WIND DEMONSTRATOR BENTHIC SUB-TIDAL ECOLOGY
SURVEY FINAL REPORT
Report No. 15/J/3/03/2590/1782 Page 58
Site 8 Site 9
Site 10 Site 11
Site 12 Site 13

METHIL OFFSHORE WIND DEMONSTRATOR BENTHIC SUB-TIDAL ECOLOGY
SURVEY FINAL REPORT
Report No. 15/J/3/03/2590/1782 Page 59
Site 14 Site 15
Site 16 Site 17
Site 18 Site 19

METHIL OFFSHORE WIND DEMONSTRATOR BENTHIC SUB-TIDAL ECOLOGY
SURVEY FINAL REPORT
Report No. 15/J/3/03/2590/1782 Page 60
T1
T2

METHIL OFFSHORE WIND DEMONSTRATOR BENTHIC SUB-TIDAL ECOLOGY
SURVEY FINAL REPORT
Report No. 15/J/3/03/2590/1782 Page 61
T4

METHIL OFFSHORE WIND DEMONSTRATOR BENTHIC SUB-TIDAL ECOLOGY
SURVEY FINAL REPORT
Report No. 15/J/3/03/2590/1782 Page 62
B. APPENDIX B VIDEO LOGS

METHIL OFFSHORE WIND DEMONSTRATOR BENTHIC SUB-TIDAL ECOLOGY
SURVEY FINAL REPORT
Report No. 15/J/3/03/2590/1782 Page 63
Hyperdigital Log
Site Date Start Time (GMT) Start Depth (m BCD)
WGS84 UTM Z30N
Start Position End Position
Easting [m] Northing [m] Easting [m] Northing [m]
1 11/10/2014 08:10 27.8 499342.9 6221925.8 499220.3 6221928.7
2 10/10/2014 14:20 20 500158.5 6224769.1 500147.3 6224879.0
3 10/10/2014 15:12 11.6 498776.9 6224930.1 498613.1 6224717.6
4 11/10/2014 11:05 19.2 499783.7 6223461.2 499563.6 6223025.7
5 11/10/2014 10:26 18.7 498848.8 6223542.1 499023.9 6223798.6
6 10/10/2014 15:36 15.6 498924.3 6224229.2 498745.9 6224165.2
7 11/10/2014 08:46 28.5 501177.1 6222936.3 501078.1 6222895.2
8 11/10/2014 07:48 27.6 498296.5 6220938.9 498132.8 6220854.7
9 11/10/2014 08:29 32.1 501000.9 6221758.3 500902.5 6221737.6
10 11/10/2014 11:37 21.2 500011.0 6223762.0 500398.3 6224083.7
11 11/10/2014 10:09 17.3 498658.7 6223253.1 498560.6 6223198.3
12 10/10/2014 14:55 18.9 499735.5 6224490.9 499626.1 6224471.1
13 11/10/2014 09:16 22.5 499148.5 6222709.7 499072.7 6222630.7
14 11/10/2014 09:02 28.2 500053.8 6222528.0 499954.3 6222533.3
15 10/10/2014 15:55 14.2 497735.8 6223883.4 497609.9 6223776.3
16 11/10/2014 09:38 18.8 497691.2 6222491.0 498117.0 6222738.9
17 10/10/2014 14:38 13.6 499724.1 6225289.2 499610.6 6225175.5
18 10/10/2014 13:48 18.5 500607.7 6225008.0 500834.7 6225471.3
19 10/10/2014 09:54 24.6 501636.5 6224709.9 501598.2 6224690.5

METHIL OFFSHORE WIND DEMONSTRATOR BENTHIC SUB-TIDAL ECOLOGY
SURVEY FINAL REPORT
Report No. 15/J/3/03/2590/1782 Page 64
Static Image Log
Site Stills PICT No. Date WGS84 UTM Z30N
Easting [m] Northing [m]
1 A128 11/10/2014
1 A129 11/10/2014 499274.6 6221929.9
1 A130 11/10/2014 499267.4 6221931.3
1 A131 11/10/2014 499263.3 6221932.0
1 A132 11/10/2014 499259.4 6221932.4
1 A133 11/10/2014 499256.5 6221932.9
1 A134 11/10/2014 499253.1 6221933.1
1 A135 11/10/2014 499249.7 6221933.1
2 A034 10/10/2014
2 A035 10/10/2014 500158.5 6224769.1
2 A036 10/10/2014 500157.6 6224776.8
2 A037 10/10/2014 500154.8 6224785.1
2 A038 10/10/2014 500150.9 6224791.0
2 A039 10/10/2014 500147.4 6224795.8
2 A040 10/10/2014 500145.4 6224799.1
2 A041 10/10/2014 500140.9 6224818.3
3 A066 10/10/2014
3 A067 10/10/2014 498757.2 6224945.7
3 A068 10/10/2014 498750.5 6224942.4
3 A069 10/10/2014 498741.7 6224940.7
3 A070 10/10/2014 498733.5 6224939.4
3 A071 10/10/2014 498725.0 6224938.1
3 A072 10/10/2014 498717.7 6224932.2
3 A073 10/10/2014 498698.8 6224915.0
3 A074 10/10/2014 498695.3 6224911.6
3 A075 10/10/2014 498669.7 6224886.7
3 A076 10/10/2014 498664.3 6224883.5
3 A077 10/10/2014 498659.3 6224880.3
3 A078 10/10/2014 498654.7 6224876.4
3 A079 10/10/2014 498651.3 6224871.9
3 A080 10/10/2014 498648.9 6224866.9
3 A081 10/10/2014 498632.3 6224848.2
3 A082 10/10/2014 498622.1 6224829.5
3 A083 10/10/2014 498616.0 6224810.8
3 A084 10/10/2014 498619.0 6224794.2
3 A085 10/10/2014 498619.4 6224760.3
3 A086 10/10/2014 498615.4 6224739.6
3 A087 10/10/2014 498614.8 6224730.1
4 A198 11/10/2014
4 A199 11/10/2014 499686.3 6223245.1
4 A200 11/10/2014 499683.5 6223241.0
4 A201 11/10/2014 499681.7 6223238.4
4 A202 11/10/2014 499679.6 6223235.9
4 A203 11/10/2014 499678.3 6223234.3
4 A204 11/10/2014 499675.6 6223231.8
4 A205 11/10/2014 499672.9 6223227.8
4 A206 11/10/2014 499670.8 6223224.6
5 A186 11/10/2014
5 A187 11/10/2014 498880.4 6223590.3
5 A188 11/10/2014 498881.9 6223594.7

METHIL OFFSHORE WIND DEMONSTRATOR BENTHIC SUB-TIDAL ECOLOGY
SURVEY FINAL REPORT
Report No. 15/J/3/03/2590/1782 Page 65
Site Stills PICT No. Date WGS84 UTM Z30N
Easting [m] Northing [m]
5 A189 11/10/2014 498882.8 6223596.9
5 A190 11/10/2014 498883.5 6223598.9
5 A191 11/10/2014 498884.2 6223600.5
5 A192 11/10/2014 498884.9 6223601.8
5 A193 11/10/2014 498885.9 6223602.6
5 A194 11/10/2014 498887.6 6223604.6
5 A195 11/10/2014 498889.7 6223606.6
5 A196 11/10/2014 498891.3 6223608.0
5 A197 11/10/2014 498894.8 6223610.5
6 A088 10/10/2014
6 A089 10/10/2014 498876.0 6224250.3
6 A090 10/10/2014 498843.3 6224263.1
6 A091 10/10/2014 498839.4 6224262.1
6 A092 10/10/2014 498819.7 6224246.2
6 A093 10/10/2014 498804.2 6224235.4
6 A094 10/10/2014 498797.4 6224231.1
6 A095 10/10/2014 498795.1 6224230.1
6 A096 10/10/2014 498792.5 6224229.0
6 A097 10/10/2014 498790.3 6224227.4
6 A098 10/10/2014 498788.6 6224223.6
6 A099 10/10/2014 498784.9 6224220.2
6 A100 10/10/2014 498781.4 6224217.3
6 A101 10/10/2014 498758.2 6224192.9
6 A102 10/10/2014 498751.6 6224180.7
6 A103 10/10/2014 498750.2 6224175.9
7 A144 11/10/2014
7 A145 11/10/2014 501136.0 6222906.3
7 A146 11/10/2014 501132.0 6222905.9
7 A147 11/10/2014 501123.1 6222905.0
7 A148 11/10/2014 501120.1 6222904.7
7 A149 11/10/2014 501117.5 6222904.4
7 A150 11/10/2014 501114.2 6222904.0
7 A151 11/10/2014 501109.5 6222903.4
7 A152 11/10/2014 501104.4 6222902.7
8 A119 11/10/2014
8 A120 11/10/2014 498164.7 6220859.2
8 A121 11/10/2014 498158.2 6220858.4
8 A122 11/10/2014 498153.8 6220858.3
8 A123 11/10/2014 498149.6 6220858.0
8 A124 11/10/2014 498146.2 6220857.7
8 A125 11/10/2014 498143.6 6220857.4
8 A126 11/10/2014 498140.7 6220856.9
8 A127 11/10/2014 498136.6 6220855.8
9 A136 11/10/2014
9 A137 11/10/2014 500939.0 6221744.8
9 A138 11/10/2014 500929.9 6221746.6
9 A139 11/10/2014 500926.1 6221746.9
9 A140 11/10/2014 500923.8 6221746.8
9 A141 11/10/2014 500921.2 6221746.7
9 A142 11/10/2014 500918.5 6221746.4
9 A143 11/10/2014 500914.8 6221745.3

METHIL OFFSHORE WIND DEMONSTRATOR BENTHIC SUB-TIDAL ECOLOGY
SURVEY FINAL REPORT
Report No. 15/J/3/03/2590/1782 Page 66
Site Stills PICT No. Date WGS84 UTM Z30N
Easting [m] Northing [m]
10 A207 11/10/2014
10 A208 11/10/2014 500202.0 6223918.0
10 A209 11/10/2014 500204.9 6223920.4
10 A210 11/10/2014 500207.0 6223922.0
10 A211 11/10/2014 500209.5 6223923.6
10 A212 11/10/2014 500211.3 6223924.9
10 A213 11/10/2014 500213.5 6223926.7
10 A214 11/10/2014 500214.8 6223927.9
11 A178 11/10/2014
11 A179 11/10/2014 498608.5 6223227.1
11 A180 11/10/2014 498605.4 6223225.2
11 A181 11/10/2014 498603.2 6223223.4
11 A182 11/10/2014 498600.3 6223221.0
11 A183 11/10/2014 498598.5 6223219.2
11 A184 11/10/2014 498596.8 6223217.6
11 A185 11/10/2014 498594.1 6223215.1
12 A055 10/10/2014
12 A056 10/10/2014 499667.9 6224520.1
12 A057 10/10/2014 499657.0 6224519.3
12 A058 10/10/2014 499646.2 6224516.1
12 A059 10/10/2014 499636.0 6224515.3
12 A060 10/10/2014 499620.0 6224505.7
12 A061 10/10/2014 499619.5 6224499.5
12 A062 10/10/2014 499619.9 6224496.1
12 A063 10/10/2014 499620.5 6224492.6
12 A064 10/10/2014 499621.0 6224489.4
12 A065 10/10/2014 499621.5 6224485.1
13 A160 11/10/2014
13 A161 11/10/2014 499127.4 6222674.2
13 A162 11/10/2014 499125.8 6222671.1
13 A163 11/10/2014 499124.1 6222668.3
13 A164 11/10/2014 499122.7 6222665.8
13 A165 11/10/2014 499120.8 6222663.2
13 A166 11/10/2014 499118.8 6222660.8
13 A167 11/10/2014 499117.1 6222658.9
14 A153 11/10/2014
14 A154 11/10/2014 500014.9 6222523.9
14 A155 11/10/2014 500010.0 6222527.3
14 A156 11/10/2014 500006.3 6222529.6
14 A157 11/10/2014 500002.5 6222531.9
14 A158 11/10/2014 499998.6 6222532.9
14 A159 11/10/2014 499995.1 6222533.3
15 A104 10/10/2014
15 A105 10/10/2014 497699.8 6223860.2
15 A106 10/10/2014 497695.6 6223858.1
15 A107 10/10/2014 497688.8 6223855.1
15 A108 10/10/2014 497679.3 6223849.5
15 A109 10/10/2014 497662.9 6223834.2
15 A110 10/10/2014 497660.9 6223831.2
15 A111 10/10/2014 497658.5 6223827.3
15 A112 10/10/2014 497656.5 6223823.4

METHIL OFFSHORE WIND DEMONSTRATOR BENTHIC SUB-TIDAL ECOLOGY
SURVEY FINAL REPORT
Report No. 15/J/3/03/2590/1782 Page 67
Site Stills PICT No. Date WGS84 UTM Z30N
Easting [m] Northing [m]
15 A113 10/10/2014 497654.3 6223819.3
15 A114 10/10/2014 497645.8 6223809.9
15 A115 10/10/2014 497642.1 6223807.2
15 A116 10/10/2014 497637.0 6223803.3
15 A117 10/10/2014 497632.2 6223799.6
16 A168 11/10/2014
16 A170 11/10/2014 497893.8 6222610.5
16 A171 11/10/2014 497896.4 6222611.7
16 A172 11/10/2014 497900.4 6222613.7
16 A173 11/10/2014 497904.0 6222615.4
16 A174 11/10/2014 497906.8 6222616.9
16 A175 11/10/2014 497909.4 6222618.0
16 A176 11/10/2014 497912.1 6222619.4
16 A177 11/10/2014 497915.8 6222621.8
17 A042 10/10/2014
17 A043 10/10/2014 499698.3 6225266.5
17 A044 10/10/2014 499695.1 6225258.4
17 A045 10/10/2014 499690.5 6225250.4
17 A046 10/10/2014 499686.6 6225247.9
17 A047 10/10/2014 499662.8 6225238.6
17 A048 10/10/2014 499655.5 6225229.4
17 A049 10/10/2014 499638.3 6225205.1
17 A050 10/10/2014 499630.0 6225192.7
17 A051 10/10/2014 499628.1 6225190.0
17 A052 10/10/2014 499625.6 6225186.5
17 A053 10/10/2014 499622.7 6225182.8
17 A054 10/10/2014 499619.3 6225180.0
18 A022 10/10/2014
18 A023 10/10/2014 500714.2 6225210.2
18 A024 10/10/2014 500721.7 6225230.1
18 A025 10/10/2014 500725.0 6225237.3
18 A026 10/10/2014 500728.5 6225243.3
18 A027 10/10/2014 500730.7 6225246.9
18 A028 10/10/2014 500733.3 6225251.9
18 A029 10/10/2014 500735.4 6225255.4
18 A030 10/10/2014 500826.5 6225433.1
18 A031 10/10/2014 500829.2 6225449.0
18 A032 10/10/2014 500830.4 6225456.8
18 A033 10/10/2014 500831.8 6225463.5
19 A010 10/10/2014
19 A011 10/10/2014 501614.7 6224702.0
19 A012 10/10/2014 501576.3 6224692.2
19 A013 10/10/2014 501571.8 6224688.0
19 A014 10/10/2014 501570.5 6224685.8
19 A015 10/10/2014 501568.9 6224676.0
19 A016 10/10/2014 501568.4 6224672.0
19 A017 10/10/2014 501567.6 6224666.3
19 A018 10/10/2014 501566.4 6224663.7
19 A019 10/10/2014 501591.1 6224680.4
19 A020 10/10/2014 501595.4 6224686.1
19 A021 10/10/2014 501598.2 6224690.5

METHIL OFFSHORE WIND DEMONSTRATOR BENTHIC SUB-TIDAL ECOLOGY
SURVEY FINAL REPORT
Report No. 15/J/3/03/2590/1782 Page 68
C. APPENDIX C GRAB LOGS

METHIL OFFSHORE WIND DEMONSTRATOR BENTHIC SUB-TIDAL ECOLOGY
SURVEY FINAL REPORT
Report No. 15/J/3/03/2590/1782 Page 69
Site
No. Date
Fauna
Lab.
Ref.
No.
PSA
Lab.
Ref.
No.
Depth
(m
BCD)
WGS84 UTM Z30 N Fauna
(volume
L)
PSA
In-situ
Sediment
Description
Sediment
Features
Sediment
Anoxia
Anthropogenic
Features
Conspicuous
Fauna Easting [m]
Northing
[m]
1 12/10/14 13187 13206 27.4 499261.5 6221935.2 15 300 Clay / Mud - Streaks - -
2 11/10/14 13188 - 19.6 500151.7 6224779.2 2 -
Pebbly
gravelly sand
with cobble
(8cm) - Streaks Broken Glass Ophiothrix
3 N/A N/A N/A N/A 498661.8176 6224877.904 N/A N/A N/A N/A N/A N/A N/A
4 12/10/14 13190 13209 19.8 499680.6 6223233.3 12 300 Sand - Patches -
Astropecten
irregularis
5 12/10/14 13191 13210 19.1 498892.3 6223601.2 8 300 Sand - - - Ophiura
6 11/10/14 - 13211 15.1 498794.3 6224222.9 - 300
Shelly pebbly
sand - Streaks -
Ophiothrix,
Ophiura
6 11/10/14 13192 - 15.3 498797.6 6224230.9 3.5 -
Shelly sand
with 2 cobbles
(9 & 7cm) Tubes Streaks - Ophiothrix
7 12/10/14 13193 13212 28.6 501119.9 6222900.7 15 300 Clay / Mud - Patches - -
8 12/10/14 13194 13213 27.5 498153.0 6220858.5 15 300 Clay / Mud - Streaks - -
9 12/10/14 13195 13214 32.5 500929.2 6221746.0 15 300 Clay / Mud - Streaks - -
10 12/10/14 13196 13215 20.6 500218.3 6223918.4 9 300
Slightly shelly
sand Tubes Patches - -
11 12/10/14 13197 13216 17.8 498608.2 6223227.7 14 300 Shelly mud Tubes Patches - Nephtys
12 11/10/14 13198 - 17.6 499617.4 6224500.3 3.5 -
Slightly shelly
slightly pebbly
sand with
cobble (9cm) Tubes Streaks - Ophiothrix
12 11/10/14 - 13217 17.5 499621.8 6224496.4 - 300
Slightly shelly
slightly pebbly
sand with
cobble (8cm) Tubes Streaks - Ophiothrix
13 12/10/14 13199 13218 23.7 499118.6 6222665.6 15 300 Clay / Mud Tubes Streaks - -
14 12/10/14 13200 13219 28.1 499997.7 6222526.6 15 300 Clay / Mud - Streaks - -
15 12/10/14 13201 13220 14.1 497658.6 6223825.2 13 300
Sandy shelly
mud - Patches - -
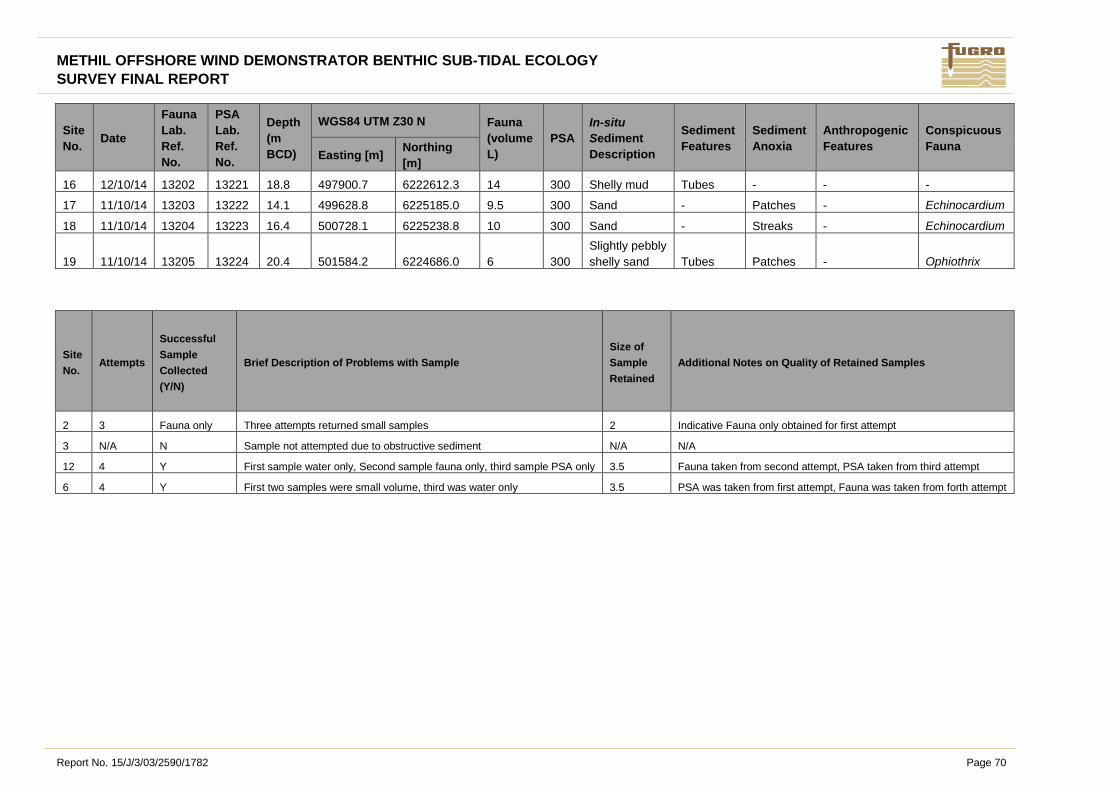
METHIL OFFSHORE WIND DEMONSTRATOR BENTHIC SUB-TIDAL ECOLOGY
SURVEY FINAL REPORT
Report No. 15/J/3/03/2590/1782 Page 70
Site
No. Date
Fauna
Lab.
Ref.
No.
PSA
Lab.
Ref.
No.
Depth
(m
BCD)
WGS84 UTM Z30 N Fauna
(volume
L)
PSA
In-situ
Sediment
Description
Sediment
Features
Sediment
Anoxia
Anthropogenic
Features
Conspicuous
Fauna Easting [m]
Northing
[m]
16 12/10/14 13202 13221 18.8 497900.7 6222612.3 14 300 Shelly mud Tubes - - -
17 11/10/14 13203 13222 14.1 499628.8 6225185.0 9.5 300 Sand - Patches - Echinocardium
18 11/10/14 13204 13223 16.4 500728.1 6225238.8 10 300 Sand - Streaks - Echinocardium
19 11/10/14 13205 13224 20.4 501584.2 6224686.0 6 300
Slightly pebbly
shelly sand Tubes Patches - Ophiothrix
Site
No. Attempts
Successful
Sample
Collected
(Y/N)
Brief Description of Problems with Sample
Size of
Sample
Retained
Additional Notes on Quality of Retained Samples
2 3 Fauna only Three attempts returned small samples 2 Indicative Fauna only obtained for first attempt
3 N/A N Sample not attempted due to obstructive sediment N/A N/A
12 4 Y First sample water only, Second sample fauna only, third sample PSA only 3.5 Fauna taken from second attempt, PSA taken from third attempt
6 4 Y First two samples were small volume, third was water only 3.5 PSA was taken from first attempt, Fauna was taken from forth attempt

METHIL OFFSHORE WIND DEMONSTRATOR BENTHIC SUB-TIDAL ECOLOGY
SURVEY FINAL REPORT
Report No. 15/J/3/03/2590/1782 Page 71
D. APPENDIX D CONTAMINANT LOGS

METHIL OFFSHORE WIND DEMONSTRATOR BENTHIC SUB-TIDAL ECOLOGY
SURVEY FINAL REPORT
Report No. 15/J/3/03/2590/1782 Page 72
Site
No. Date
Depth
(m
BCD)
WGS84 UTM Z30N Sample
Size
Hydro-
carbons Organotins
P
C
B
P
A
H
Metals
In-situ
Sediment
Description
Sediment
features
Sediment
Anoxia
Anthropogenic
Features
Conspicuous
Fauna Easting
[m]
Northing
[m]
3 N/A N/A 498661.8 6224877.9 N/A N/A N/A N/A N/A N/A N/A N/A N/A N/A N/A
5 12/10/2014 19.1 498887.6 6223597.9 3/4 Y Y Y Y - - - - - -
5 12/10/2014 19.1 498884.7 6223595.8 1/2 - - - - Y - - - - -
12 N/A N/A 499620.3 6224495.5 N/A N/A N/A N/A N/A N/A N/A N/A N/A N/A N/A
Site
No. Attempts
Successful Sample
Collected (Y/N) Brief Description of Problems with Sample
Size of Sample
Retained Additional Notes on Quality of Retained Samples
3 N/A N Sample not attempted due to obstructive sediment N/A
12 3 N Cobble in jaw for all 3 attempts -
5 3 Y second attempt grab did not fire 3/4 and 1/2
Hydrocarbons, organotins, PCB and PAH from attempt 1, Metals from
attempt 2

METHIL OFFSHORE WIND DEMONSTRATOR BENTHIC SUB-TIDAL ECOLOGY
SURVEY FINAL REPORT
Report No. 15/J/3/03/2590/1782 Page 73
E. APPENDIX E 2 M BEAM TRAWL LOGS

METHIL OFFSHORE WIND DEMONSTRATOR BENTHIC SUB-TIDAL ECOLOGY
SURVEY FINAL REPORT
Report No. 15/J/3/03/2590/1782 Page 74
Site No Date Point on line WGS84 UTM (Z30N) Time
(GMT)
Depth
(BCD m)
Trawl Speed
(knots)
Distance
(m)
Direction of
Travel Comments
Easting [m] Northing [m]
T1 12/10/14 Start 499956 6223736 14:52 20.4 1.8
517 Into Current
End 500374 6224041 15:01 21.2
T2 13/10/14 Start 499814 6223421 07:58 19.1 1.5
478 Into Current
End 499558 6223016 08:07 21.1
T3 N/A Start 499029 6223803 N/A N/A N/A N/A N/A Not attempted due to
obstructive sediment End 498745 6223392
T4 13/10/14 Start 497911 6222634 08:47 18.5 1.6
276 Into Current
Shortened due to obstructive
sediment End 497679 6222483 08:52 18.8
T5 N/A Start 500614 6225021 N/A N/A N/A N/A N/A Not attempted due to
obstructive sediment End 500846 6225464
Site
Number Date
Total
Volume
(Litres)
Sediment Character (Percentage) % Shell
Material % Algae Other Features
Mud Sand Granules Pebble Cobbles Lge Cobbles Boulders
T1 12/10/14 129 20 80 Twig, fucoid algae
T2 13/10/14 31 85 15 Trawl rubber, fucoid algae, stick, dead
leaves, chaetopterus tube
T4 13/10/14 115.3

METHIL OFFSHORE WIND DEMONSTRATOR BENTHIC SUB-TIDAL ECOLOGY
SURVEY FINAL REPORT
Report No. 15/J/3/03/2590/1782 Page 75
F. APPENDIX F VIDEO ANALYSIS DATA

METHIL OFFSHORE WIND DEMONSTRATOR BENTHIC SUB-TIDAL ECOLOGY
SURVEY FINAL REPORT
Report No. 15/J/3/03/2590/1782 Page 76
Site General Description Detailed Sediment Notes Conspicuous Species
Estimated
Abundance
Representative Image
1 Slightly shelly, slightly
muddy rippled sand
56°08.5427 N,
003°00.6337 W
To
56°08.5441 N,
003°00.7526 W
(123.2m2)
Fine muddy sand with occasional
shells and shelly patches. Ripples
and holes present and occasional
burrows and depressions. Some
tracks from mobile epifauna
observed.
Virgularia mirabilis
Paguridae
Pennatula phosphorea
Asterias rubens
Liocarcinus
Astropecten irregularis
Metridium senile
PISCES
Gobiidae
PLEURONECTIFORMES
?Arctica islandica (?dead)
F
O
O
O
F
O
O
O
P
O
O
2 Ophiothrix beds overlying
rippled sand with cobbles
and boulders
56°10.0750 N,
002°59.8473 W
to
56°10.0951 N,
002°59.8619 W
(40.2m2)
Most detail obscured by Ophiothrix
fragilis.
Ophiothrix fragilis
Asterias rubens
Echinus esculentus
Necora puber
Gadidae
Ophiura albida
P
F
O
O
O
O

METHIL OFFSHORE WIND DEMONSTRATOR BENTHIC SUB-TIDAL ECOLOGY
SURVEY FINAL REPORT
Report No. 15/J/3/03/2590/1782 Page 77
Site General Description Detailed Sediment Notes Conspicuous Species
Estimated
Abundance
Representative Image
Slightly shelly, slightly
gravelly rippled sand.
56°10.0951 N,
002°59.8619 W
To
56°10.1277 N,
002°59.8592 W
(60.5m2)
Slightly shelly slightly gravelly fine
sand. Ripples and holes present,
some tubes visible.
Asterias rubens
DECAPODA
Ophiura
Cancer pagurus
Henricia
Liocarcinus
Gobiidae
ACTINIARIA
F
O
F
O
O
O
O
O
Slightly shelly gravelly,
pebbly, cobbly sand with
boulders
56°10.1277 N,
002°59.85.92 W
To
56°10.1350 N,
002°59.8577 W
(13.6m2)
Large boulders covered with
encrusting and mobile epifauna
overlaying slightly shelly gravelly,
pebbly, cobbly fine sand.
Echinus esculentus
Asterias rubens
Ophiothrix fragilis?
Alcyonium digitatum
Spirobranchus
Corallinaceae
F
F
O
P
P
P

METHIL OFFSHORE WIND DEMONSTRATOR BENTHIC SUB-TIDAL ECOLOGY
SURVEY FINAL REPORT
Report No. 15/J/3/03/2590/1782 Page 78
Site General Description Detailed Sediment Notes Conspicuous Species
Estimated
Abundance
Representative Image
3 Pebbles and cobbles with
large boulders and
bedrock with occasional
patches of sand
56°10.1620 N,
003°01.1821 W
To
56°10.0475 N,
003°01.3401 W
(268m2)
Large boulders and bedrock
covered with encrusting and
mobile epifauna and silt
flocculation, interspersed with
pebbles, cobbles and occasional
sand patches.
Echinus esculentus
Alcyonium digitatum
Asterias rubens
Spirobranchus
Gobiidae
LAMINARIALES
Cancer pagurus
Necora puber
Liocarcinus
Callionymidae
C
P
F
P
O
F
O
O
O
O
4 Slightly gravelly slightly
shelly rippled sand with
occasional pebble and
very occasional boulder
56°09.3706 N,
003°00.2090 W
To
56°09.1356 N,
003°00.4213 W
(488.2m2)
Slightly shelly fine sand. Burrows
and holes present, tubes visible.
Some tracks from mobile epifauna
observed.
Ascidiella aspersa
Asterias rubens
Metridium senile(
Ophiura
Gobiidae
Majidae
Virgularia mirabilis
Psammechinus miliaris
Liocarcinus
Alcyonium digitatum
Astropecten irregularis
PISCES
Pennatula phosphorea
Pagurus bernhardus
Hydractinia echinata
HYDROZOA/BRYOZOA
turf
PLEURONECTIFORMES
Paguridae
R
F
O
F
P
O
F
O
O
P
O
O
F
P
R
R
O
O
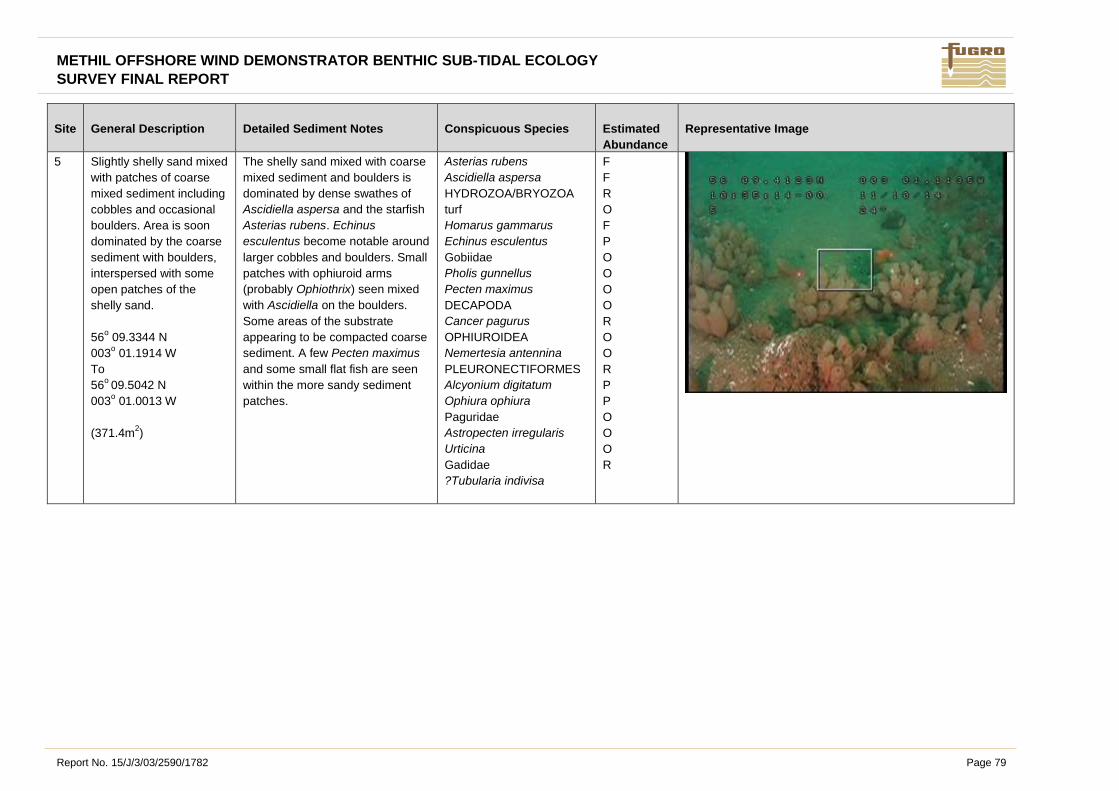
METHIL OFFSHORE WIND DEMONSTRATOR BENTHIC SUB-TIDAL ECOLOGY
SURVEY FINAL REPORT
Report No. 15/J/3/03/2590/1782 Page 79
Site General Description Detailed Sediment Notes Conspicuous Species
Estimated
Abundance
Representative Image
5
Slightly shelly sand mixed
with patches of coarse
mixed sediment including
cobbles and occasional
boulders. Area is soon
dominated by the coarse
sediment with boulders,
interspersed with some
open patches of the
shelly sand.
56o 09.3344 N
003o 01.1914 W
To
56o
09.5042 N
003o 01.0013 W
(371.4m2)
The shelly sand mixed with coarse
mixed sediment and boulders is
dominated by dense swathes of
Ascidiella aspersa and the starfish
Asterias rubens. Echinus
esculentus become notable around
larger cobbles and boulders. Small
patches with ophiuroid arms
(probably Ophiothrix) seen mixed
with Ascidiella on the boulders.
Some areas of the substrate
appearing to be compacted coarse
sediment. A few Pecten maximus
and some small flat fish are seen
within the more sandy sediment
patches.
Asterias rubens
Ascidiella aspersa
HYDROZOA/BRYOZOA
turf
Homarus gammarus
Echinus esculentus
Gobiidae
Pholis gunnellus
Pecten maximus
DECAPODA
Cancer pagurus
OPHIUROIDEA
Nemertesia antennina
PLEURONECTIFORMES
Alcyonium digitatum
Ophiura ophiura
Paguridae
Astropecten irregularis
Urticina
Gadidae
?Tubularia indivisa
F
F
R
O
F
P
O
O
O
O
R
O
O
R
P
P
O
O
O
R

METHIL OFFSHORE WIND DEMONSTRATOR BENTHIC SUB-TIDAL ECOLOGY
SURVEY FINAL REPORT
Report No. 15/J/3/03/2590/1782 Page 80
Site General Description Detailed Sediment Notes Conspicuous Species
Estimated
Abundance
Representative Image
Shelly sand with patches
of coarse sediment and
the occasional boulder.
56o
09.5042 N
003o 01.0013 W
To
56o
09.5520 N
003o
00.9436 W
(106.9m2)
Shelly sand dominates this section
but with some coarse sediment
present and occasional clusters of
boulders.
The brittlestar Ophiothrix fragilis
covers the area, forming a dense
carpet, appearing largely to
exclude Ascidiella aspersa, which
dominates the first section of the
transect. Asterias rubens and
Echinus esculentus are still
present in notable numbers.
Urticina and a few Pecten
maximus are also seen.
Ophiothrix fragilis
Asterias rubens
Ascidiella aspersa
HYDROZOA/BRYOZOA
turf
Echinus esculentus
Pecten maximus
DECAPODA
Urticina
85%
F
O
R
F
O
O
O
6 Patches of slightly shelly
sand with patches of
boulders and cobbles
56°09.7840 N,
003°01.0399 W
To
56°09.7500 N,
003°01.2111 W
(188.1m2)
Most detail obscured by
Ophiothrix. Patches of slightly
shelly rippled sand with patches of
boulders and cobbles. Where there
is a patch of clear shelly sand
burrows are visible.
Echinus esculentus
Corallinaceae
Asterias rubens
ACTINIARIA
PISCES
DECAPODA
Ophiothrix fragilis
Ophiura
Ophiura albida
F
R
F
O
O
O
A
O
O

METHIL OFFSHORE WIND DEMONSTRATOR BENTHIC SUB-TIDAL ECOLOGY
SURVEY FINAL REPORT
Report No. 15/J/3/03/2590/1782 Page 81
Site General Description Detailed Sediment Notes Conspicuous Species
Estimated
Abundance
Representative Image
7 Slightly shelly sand
56o
09.0872 N
002o 58.8629 W
To
56o 09.0652 N
002o 58.9581 W
(106.7m2)
Slightly shelly sand with many
tracks on the surface. Holes
present throughout with a few
burrows.
Pennatula phosphorea scattered
across the area. Lots of small
pagurid crabs in Turritellidae
shells.
Pennatula phosphorea
Asterias rubens
ASTEROIDEA
Gobiidae
Paguridae
Majidae
Astropecten irregularis
Pectinidae
HYDROZOA/BRYOZOA
turf
Lanice conchilega
Chaetopterus tubes
DECAPODA
Liocarcinus
O
O
O
P
P
O
O
O
R
R
O
O
O
8
Slightly shelly rippled
sand
56o 08.0104 N
003o 01.6441 W
To
56o 07.9651 N
003o 01.8016 W
(183.5m2)
Slightly shelly rippled sand. Holes
and burrows present throughout.
Nephrops norvegicus seen in a
couple of burrows. Virgularia
mirabilis visible in patches. Crabs
present throughout.
DECAPODA
Paguridae
Gadidae
Chaetopterus tubes
Metridium senile
Asterias rubens
Nephrops norvegicus
Virgularia mirabilis
Liocarcinus
PLEURONECTIFORMES
Astropecten irregularis
?Sabella tube
O
P
O
P
O
O
O
O
O
O
O
O

METHIL OFFSHORE WIND DEMONSTRATOR BENTHIC SUB-TIDAL ECOLOGY
SURVEY FINAL REPORT
Report No. 15/J/3/03/2590/1782 Page 82
Site General Description Detailed Sediment Notes Conspicuous Species
Estimated
Abundance
Representative Image
9
Slightly shelly sand
56o 08.4522 N
002o 59.0336 W
To
56o 08.4412 N
002o 59.1275 W
(99.4m2)
Slightly shelly sand with holes and
burrows.
Virgularia mirabilis seen across the
site. Nephrops norvegicus seen
within one burrow.
Chaetopterus tubes
Virgularia mirabilis
Gadidae
Gobiidae
Paguridae
Liocarcinus
Metridium senile
Nephrops norvegicus
P
O
P
P
O
O
O
10
Slightly shelly rippled
sand. Few scattered
cobbles. One small
boulder seen.
56o 09.5324 N
002o 59.9894 W
To
56o
09.6790 N
002o 59.6665 W
(430.9m2)
Slightly shelly rippled sand with
small sparse but regular clumps of
Ascidiella aspersa across the area.
Small holes present in the
sediment. One small patch of
dense Ascidiella.
Asterias rubens and Astropecten
irregularis regularly seen. Rare
occurrence of Metridium senile and
very small rare presence of
Alcyonium digitatum.
Ascidiella aspersa
Paguridae
CARIDEA
HYDROZOA/BRYOZOA
turf
Asterias rubens
DECAPODA
Gobiidae
PLEURONECTIFORMES
Astropecten irregularis
Metridium senile
Aequipecten opercularis
Liocarcinus
Alcyonium digitatum
Pecten maximus
Lanice conchilega
R
O
P
R
F
O
P
O
F
O
O
O
R
O
R

METHIL OFFSHORE WIND DEMONSTRATOR BENTHIC SUB-TIDAL ECOLOGY
SURVEY FINAL REPORT
Report No. 15/J/3/03/2590/1782 Page 83
Site General Description Detailed Sediment Notes Conspicuous Species
Estimated
Abundance
Representative Image
Shelly gravelly sand with
pebbles and cobbles with
the occasional small
boulder.
56o 09.6790 N
002o 59.6665 W
To
56o
09.7056 N
002o 59.6152 W
(72.5m2)
The ground becomes coarser with
raised aggregated areas of
sediment, supporting dense
swathes of Ascidiella aspersa.
Where Ascidiella clusters around a
boulder, the arms of ophiuroids
can be seen within the faunal
mass. Starfish are still regularly
seen, and Echinus esculentus is
present.
Echinus esculentus
OPHIUROIDEA
Ascidiella aspersa
HYDROZOA/BRYOZOA
turf
Asterias rubens
Gobiidae
Astropecten irregularis
Alcyonium digitatum
Pecten maximus
Lanice conchilega
O
P
C
R
F
P
F
R
O
R
11
Slightly shelly sand with a
few pebbles.
56o 09.2580 N
003o 01.2955 W
To
56o 09.2285 N
003o 01.3897 W
(111.8m2)
Slightly shelly rippled sand with
small holes evident in places.
Sparse clumps of Ascidiella
aspersa. Small amounts of Lanice
conchilega. Asterias rubens dotted
throughout, with a few Ophiura
ophiura and Astropecten irregularis
also seen. Very little fauna seen
overall.
Lanice conchilega
Paguridae
Asterias rubens
Ascidiella aspersa
Gobiidae
Astropecten irregularis
Syngnathidae
Ophiura ophiura
Liocarcinus
Alcyonium digitatum
HYDROZOA/BRYOZOA
turf
R
R
F
R
P
O
O
O
O
R
R

METHIL OFFSHORE WIND DEMONSTRATOR BENTHIC SUB-TIDAL ECOLOGY
SURVEY FINAL REPORT
Report No. 15/J/3/03/2590/1782 Page 84
Site General Description Detailed Sediment Notes Conspicuous Species
Estimated
Abundance
Representative Image
12 Slightly shelly sand with
occasional boulders
56°09.9252 N,
003°00.2550 W
To
56°09.9142 N,
003°00.3610 W
(111.6m2)
Rippled shelly sand with pebbles
and boulders. Most detail obscured
by Ophiothrix. Camera lifted off
seabed before the end of the
video.
Ophiothrix fragilis
Asterias rubens
PISCES
Echinus esculentus
ACTINIARIA
Liocarcinus
Corallinaceae
Urticina
Gobiidae
A
F
O
F
O
O
R
O
P
13
Very slightly shelly sand
56o 08.9651 N
003o 00.8221 W
To
56o 08.9228 N
003o 00.8947 W
(108.7m2)
Sand with holes and burrows.
Pennatula phosphorea seen
regularly throughout the transect.
Asterias rubens also very frequent,
along with various small starfish
that were not easily identifiable due
to the visibility. Crabs and small
ophiuroids were also regularly
seen.
Asterias rubens
Pennatula phosphorea
Paguridae
Astropecten irregularis
HYDROZOA/BRYOZOA
turf
OPHIUROIDEA
Gobiidae
Chaetopterus tubes
ASTEROIDEA
Gadidae
Liocarcinus
Virgularia mirabilis
?Metridium senile
Ophiura ophiura
F
F
O
O
P
P
P
P
O
O
O
O
O
P

METHIL OFFSHORE WIND DEMONSTRATOR BENTHIC SUB-TIDAL ECOLOGY
SURVEY FINAL REPORT
Report No. 15/J/3/03/2590/1782 Page 85
Site General Description Detailed Sediment Notes Conspicuous Species
Estimated
Abundance
Representative Image
14 Slightly shelly sand
56°08.8671 N
002°59.9480 W
To
56°08.8700 N,
003°00.0434 W
(98.9m2)
Slightly shelly rippled sand. Mobile
epifauna tracks visible. Some
burrows present.
Asterias rubens
Liocarcinus
Pennatula phosphorea
PISCES
HYDROZOA/BRYOZOA
turf Astropecten irregularis
DECAPODA
Gobiidae
F
F
F
O
R
O
O
O

METHIL OFFSHORE WIND DEMONSTRATOR BENTHIC SUB-TIDAL ECOLOGY
SURVEY FINAL REPORT
Report No. 15/J/3/03/2590/1782 Page 86
Site General Description Detailed Sediment Notes Conspicuous Species
Estimated
Abundance
Representative Image
15 Sand/mudstone ledging
and bedrock, mixed with
slightly shelly silty sand.
56°09.5977 N,
003°02.1868 W
To
56°09.5800 N,
003°02.2401 W
(64.2m2)
Slightly shelly silty sand with visible
burrows. Bedrock of mixed
composition emerging from the
sediment and forming flat ledges in
places. Other areas of dropped
edges appearing to be
sand/mudstone, with a thick
covering of shelly silty sand in
some places. Some coarser
sediment within the recesses.
Ophiura
Asterias rubens
Gobiidae
Nemertesia
Alcyonium digitatum
Corallinaceae
Cancer pagurus
Echinus esculentus
HYDROZOA/BRYOZOA
turf
PLEURONECTIFORMES
P
F
P
P
R
R
O
F
R
P

METHIL OFFSHORE WIND DEMONSTRATOR BENTHIC SUB-TIDAL ECOLOGY
SURVEY FINAL REPORT
Report No. 15/J/3/03/2590/1782 Page 87
Site General Description Detailed Sediment Notes Conspicuous Species
Estimated
Abundance
Representative Image
Slightly sandy pebbly
shelly gravel
56°09.5800 N,
003°02.2401 W
To
56°09.5585 N,
003°02.2728 W
(52.3m2)
An area of mixed coarse sediment
of sandy shelly gravel, forming
coarse shallow waves, with larger
pebbles and a few cobbles
aggregating within the recesses.
Cobbles and pebbles appear in
part, to comprise fragmented
mud/clay.
Asterias rubens
HYDROZOA/BRYOZOA
turf Cancer pagurus
Gobiidae
Liocarcinus
ACTINIARIA
F
A
O
O
O
O
Slightly gravelly slightly
shelly silty sand
56°09.5585 N,
003°02.2728 W
To
56°09.5405 N,
003°02.3077 W
(49.2m2)
Slightly gravelly slightly shelly silty
rippled sand. Mobile epifauna
tracks visible.
PLEURONECTIFORMES
Asterias rubens
DECAPODA
Liocarcinus
Gobiidae
O
F
O
O
O

METHIL OFFSHORE WIND DEMONSTRATOR BENTHIC SUB-TIDAL ECOLOGY
SURVEY FINAL REPORT
Report No. 15/J/3/03/2590/1782 Page 88
Site General Description Detailed Sediment Notes Conspicuous Species
Estimated
Abundance
Representative Image
16
Slightly shelly sand with
pebbles and cobbles.
Occasionally dense
aggregations of coarser
substrate within the main
sand matrix. Small holes
evident.
56o 08.8489 N
003o 02.2297 W
To
56o 08.9173 N
003o 02.0132 W
(257.6m2)
Sand with pebbles and cobbles,
with dense aggregations of
Ascidiella aspersa on the coarser
fraction. Substrate varying
between small coarser patches
and slightly open expanses of sand
with sparse pebbles and cobbles.
Very occasional small boulder.
Asterias rubens very common, rare
clumps of Nemertesia antennina,
sparse hydroid/bryozoan turf, A
few Astropecten irregularis and
Liocarcinus crabs. Pecten
maximus occasionally seen within
the sediment. Gastropod tracks
evident.
Ascidiella aspersa
Asterias rubens
Liocarcinus
Nemertesia antennina
Paguridae
Pecten maximus
Astropecten irregularis
Gobiidae
Alcyonium digitatum
HYDROZOA/BRYOZOA
turf Virgularia mirabilis
PLEURONECTIFORMES
Aequipecten opercularis
CARIDEA
Urticina
O
F
O
O
O
O
O
P
R
R
O
O
O
P
O
Shelly sand with coarse
mixed sediment with
cobbles and pebbles and
small boulders.
56o 08.9173 N
003o 02.0132 W
To
56o 08.9806 N
003o 01.8188 W
(233.0m2)
Area coarser than the start of the
transect forming more dense
coarse sediment aggregations with
fewer expanse of sand. Coarse
sediment forming small raised
mounds in places. Small to
medium boulders regularly seen.
Ascidiella aspersa forming dense
aggregations across the site.
Within some patches, ophiuroid
arms seen in large numbers.
Asterias rubens common across
the area. Echinus esculentus now
evident on the coarse areas.
Ascidiella aspersa
Asterias rubens
Liocarcinus
Nemertesia antennina
Pecten maximus
Astropecten irregularis
Gobiidae
Alcyonium digitatum
HYDROZOA/BRYOZOA
turf CARIDEA
Urticina
Echinus esculentus
OPHIUROIDEA
Urticina
F
F
O
O
O
O
P
R
R
P
O
O
P
O

METHIL OFFSHORE WIND DEMONSTRATOR BENTHIC SUB-TIDAL ECOLOGY
SURVEY FINAL REPORT
Report No. 15/J/3/03/2590/1782 Page 89
Site General Description Detailed Sediment Notes Conspicuous Species
Estimated
Abundance
Representative Image
17
Shelly sand with
occasional boulder
56°10.3557 N,
003°00.2668 W
To
56°10.3512 N,
003°00.2700 W
(18.9m2)
Rippled shelly sand with burrows.
Occasional boulder visible.
Asterias rubens
PLEURONECTIFORMES
Ophiura
Liocarcinus
O
O
F
O

METHIL OFFSHORE WIND DEMONSTRATOR BENTHIC SUB-TIDAL ECOLOGY
SURVEY FINAL REPORT
Report No. 15/J/3/03/2590/1782 Page 90
Site General Description Detailed Sediment Notes Conspicuous Species
Estimated
Abundance
Representative Image
Slightly pebbly gravelly
shelly silty sand with
boulders and
sand/mudstone
(compacted sediment)
56°10.3512 N,
033°00.2700 W
To
56°10.3189 N,
003°00.3366 W
(91.3m2)
Slightly pebbly gravelly shelly sand
with cobbles and boulders. Areas
of mud/sand stone ledging, forming
shallow dropped steps in some
areas, and flat topped exposures in
others. Relatively large holes
bored in the surface. The
compacted sediment areas form a
mosaic with the bedrock and
boulders. Patches of rippled sand
fill the recesses between the
various hard substrata. A thin
sediment covering evident across
much of the area.
Large holes bored into the
mud/sand stone, and small holes
visible within the softer sediment.
Length of rope or cable visible and
possible tyre.
Asterias rubens
Echinus esculentus
Corallinaceae
Alcyonium digitatum
Ophiura
Ophiothrix fragilis
Spirobranchus
Liocarcinus
Gobiidae
F
F
R
R
F
F
R
O
P
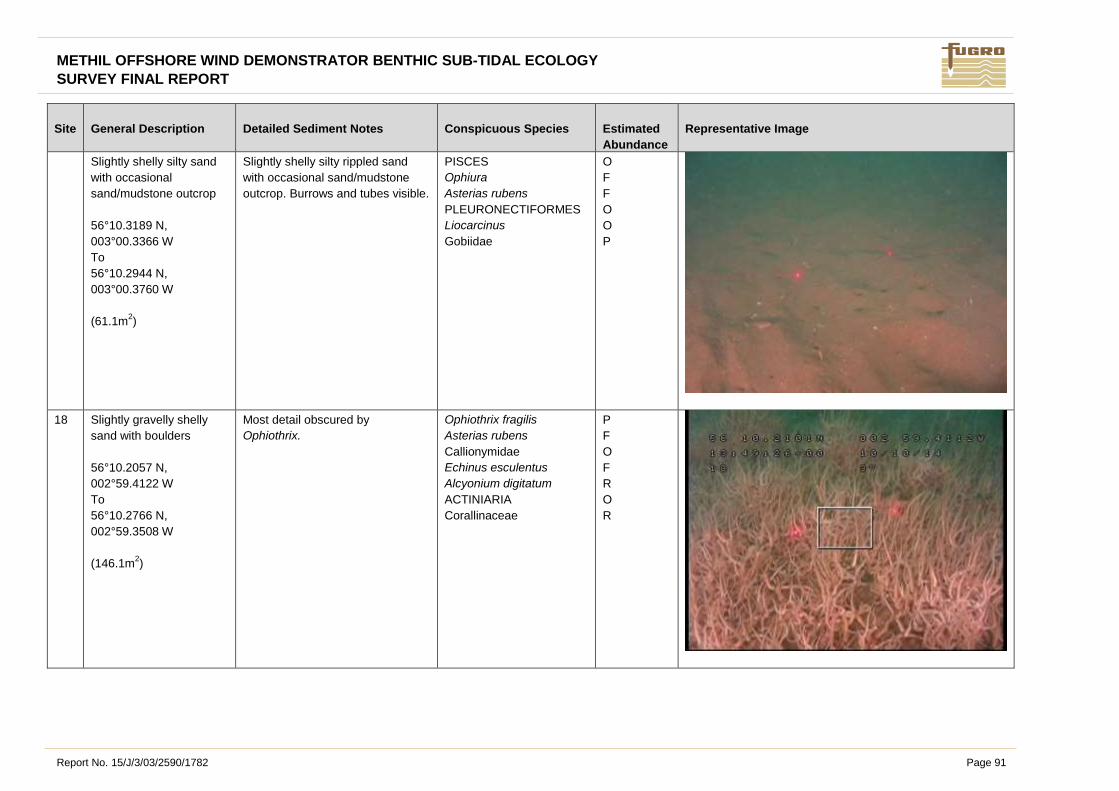
METHIL OFFSHORE WIND DEMONSTRATOR BENTHIC SUB-TIDAL ECOLOGY
SURVEY FINAL REPORT
Report No. 15/J/3/03/2590/1782 Page 91
Site General Description Detailed Sediment Notes Conspicuous Species
Estimated
Abundance
Representative Image
Slightly shelly silty sand
with occasional
sand/mudstone outcrop
56°10.3189 N,
003°00.3366 W
To
56°10.2944 N,
003°00.3760 W
(61.1m2)
Slightly shelly silty rippled sand
with occasional sand/mudstone
outcrop. Burrows and tubes visible.
PISCES
Ophiura
Asterias rubens
PLEURONECTIFORMES
Liocarcinus
Gobiidae
O
F
F
O
O
P
18 Slightly gravelly shelly
sand with boulders
56°10.2057 N,
002°59.4122 W
To
56°10.2766 N,
002°59.3508 W
(146.1m2)
Most detail obscured by
Ophiothrix.
Ophiothrix fragilis
Asterias rubens
Callionymidae
Echinus esculentus
Alcyonium digitatum
ACTINIARIA
Corallinaceae
P
F
O
F
R
O
R
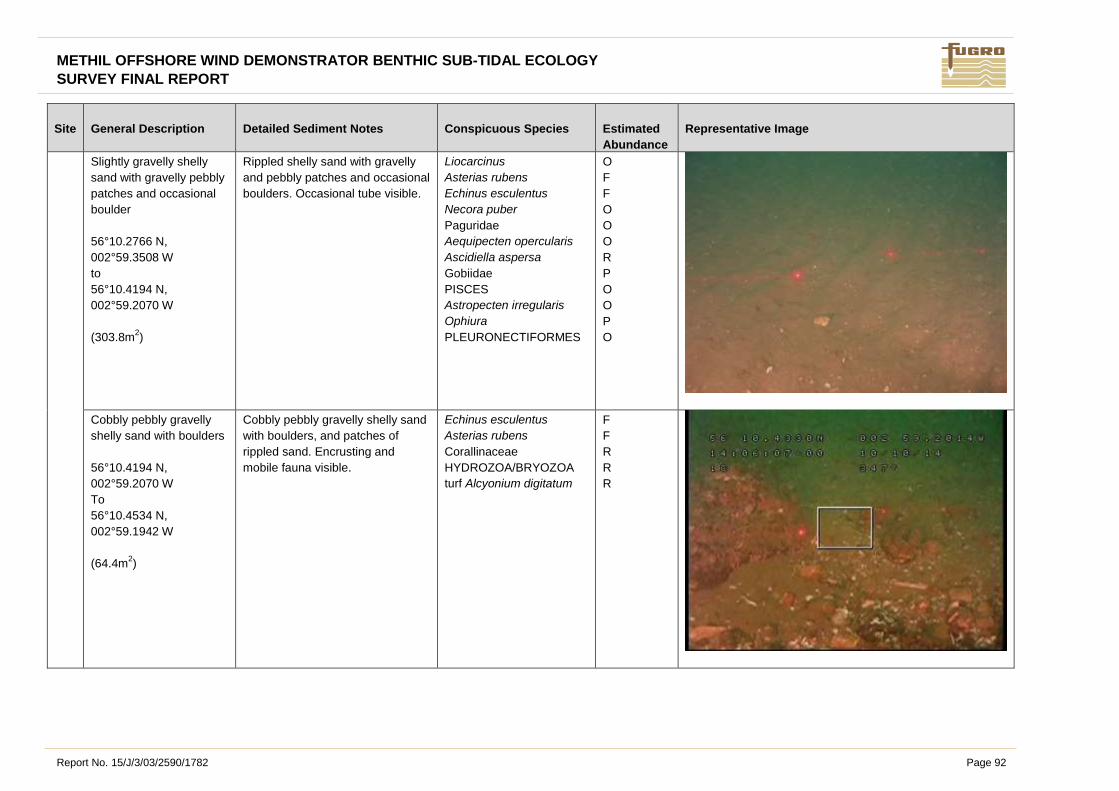
METHIL OFFSHORE WIND DEMONSTRATOR BENTHIC SUB-TIDAL ECOLOGY
SURVEY FINAL REPORT
Report No. 15/J/3/03/2590/1782 Page 92
Site General Description Detailed Sediment Notes Conspicuous Species
Estimated
Abundance
Representative Image
Slightly gravelly shelly
sand with gravelly pebbly
patches and occasional
boulder
56°10.2766 N,
002°59.3508 W
to
56°10.4194 N,
002°59.2070 W
(303.8m2)
Rippled shelly sand with gravelly
and pebbly patches and occasional
boulders. Occasional tube visible.
Liocarcinus
Asterias rubens
Echinus esculentus
Necora puber
Paguridae
Aequipecten opercularis
Ascidiella aspersa
Gobiidae
PISCES
Astropecten irregularis
Ophiura
PLEURONECTIFORMES
O
F
F
O
O
O
R
P
O
O
P
O
Cobbly pebbly gravelly
shelly sand with boulders
56°10.4194 N,
002°59.2070 W
To
56°10.4534 N,
002°59.1942 W
(64.4m2)
Cobbly pebbly gravelly shelly sand
with boulders, and patches of
rippled sand. Encrusting and
mobile fauna visible.
Echinus esculentus
Asterias rubens
Corallinaceae
HYDROZOA/BRYOZOA
turf Alcyonium digitatum
F
F
R
R
R

METHIL OFFSHORE WIND DEMONSTRATOR BENTHIC SUB-TIDAL ECOLOGY
SURVEY FINAL REPORT
Report No. 15/J/3/03/2590/1782 Page 93
Site General Description Detailed Sediment Notes Conspicuous Species
Estimated
Abundance
Representative Image
19 Pebbly shelly gravelly
rippled sand
56°10.0432 N,
002°58.4188 W
To
56°10.0389 N,
002°58.4418 W
(25.1m2)
Pebbly shelly gravelly rippled sand
with clumps of Ascidiella aspersa
associated with the pebbles.
Asterias rubens
Ascidiella aspersa
Liocarcinus
Aequipecten opercularis
Alcyonium digitatum
HYDROZOA/BRYOZOA
turf
F
F
O
O
R
R
Cobbly shelly pebbly
gravelly sand
56°10.0389 N,
002°58.4418 W
To
56°10.0372 N,
002°58.4599 W
(19.0m2)
Cobbly shelly pebbly gravelly sand
with occasional small boulders and
dense clumps of Ascidiella
aspersa. The mixed coarse
sediment becomes more
consolidated in some areas and
forms raised areas and occasional
depressions.
Ascidiella aspersa
Echinus esculentus
Aequipecten opercularis
Corallinaceae
Majidae
Ophiura
Spirobranchus
Asterias rubens
HYDROZOA/BRYOZOA
turf
C
F
O
R
O
P
R
O
C

METHIL OFFSHORE WIND DEMONSTRATOR BENTHIC SUB-TIDAL ECOLOGY
SURVEY FINAL REPORT
Report No. 15/J/3/03/2590/1782 Page 94
Site General Description Detailed Sediment Notes Conspicuous Species
Estimated
Abundance
Representative Image
Slightly pebbly shelly
gravelly rippled sand with
occasional cobbles
56°10.0372 N,
002°58.4599 W
To
56°10.0288 N,
002°58.4834 W
(28.9m2)
Slightly pebbly shelly gravelly
rippled sand with occasional
clumps of Ascidiella aspersa
associated with the pebbles.
Burrows visible.
Asterias rubens
Ascidiella aspersa
Gobiidae
Callionymidae
PLEURONECTIFORMES
Liocarcinus
Spirobranchus
HYDROZOA/BRYOZOA
turf
O
R
P
O
O
O
R
R
Slightly cobbly pebbly
shelly gravelly rippled
sand with occasional
cobbles
56°10.0288 N,
002°58.4834 W
to
56°10.0352 N,
002°58.4533 W
(75.4m2)
Slightly cobbly pebbly shelly
gravelly rippled sand with clumps
of Ascidiella aspersa associated
with the pebbles and occasional
boulders. Burrows visible.
Asterias rubens
Ascidiella aspersa
HYDROZOA/BRYOZOA
turf PISCES
Alcyonium digitatum
Gobiidae
Echinus esculentus
Majidae
Spirobranchus
Ophiothrix fragilis
F
R
O
O
R
P
O
O
R
O

METHIL OFFSHORE WIND DEMONSTRATOR BENTHIC SUB-TIDAL ECOLOGY
SURVEY FINAL REPORT
Report No. 15/J/3/03/2590/1782 Page 95
G. APPENDIX G GRAB FAUNAL ANALYSIS DATA

METHIL OFFSHORE WIND DEMONSTRATOR BENTHIC SUB-TIDAL ECOLOGY
SURVEY FINAL REPORT
Report No. 15/J/3/03/2590/1782 Page 96
Epifauna Abundance Data Site 001 002 004 005 006 007 008 009 010
Species Name MCS Code Aphia ID TOTAL TOTAL TOTAL TOTAL TOTAL TOTAL TOTAL TOTAL TOTAL
PORIFERA C0001 558
Cliona (agg.) C0475 132026
ANTHOATHECATAE D0140 13551 P
CAMPANULINOIDEA D0338 13552 P
Sertularia D0433 117234
Campanulariidae D0491 1606
Alcyonium digitatum D0597 125333 P
ACTINIARIA D0662 1360 1
Pedicellina K0045 111796 P P
Verruca stroemia R0041 106257 1
CTENOSTOMATIDA Y0070 110723 P
Alcyonidium gelatinosum/Alcyonidioides mytili Y0077/Y0080 110783 P
Alcyonidium parasiticum Y0081 111604 P P
Membraniporoidea Y0167 153579
Conopeum reticulum Y0172 111351
Electra monostachys Y0177 111354
Electra pilosa Y0178 111355
Cribrilina punctata/Collarina balzaci Y0310/Y0314 110742 P
ASCIDIACEA (juv.) ZD0002 1839
Ascidiidae ZD0082 103443
Ascidiella ZD0083 103484
Ascidiella aspersa ZD0084 103718

METHIL OFFSHORE WIND DEMONSTRATOR BENTHIC SUB-TIDAL ECOLOGY
SURVEY FINAL REPORT
Report No. 15/J/3/03/2590/1782 Page 97
Epifauna abundance data Site 011 012 013 014 015 016 017 018
Species Name MCS Code Aphia ID TOTAL TOTAL TOTAL TOTAL TOTAL TOTAL TOTAL TOTAL TOTAL
PORIFERA C0001 558 P
Cliona (agg.) C0475 132026 P P
ANTHOATHECATAE D0140 13551 P P
CAMPANULINOIDEA D0338 13552 P P P
Sertularia D0433 117234 P
Campanulariidae D0491 1606 P
Alcyonium digitatum D0597 125333
ACTINIARIA D0662 1360
Pedicellina K0045 111796
Verruca stroemia R0041 106257 4
CTENOSTOMATIDA Y0070 110723 P
Alcyonidium gelatinosum/Alcyonidioides mytili Y0077/Y0080 110783
Alcyonidium parasiticum Y0081 111604 P P
Membraniporoidea Y0167 153579 P P
Conopeum reticulum Y0172 111351 P
Electra monostachys Y0177 111354 P
Electra pilosa Y0178 111355 P
Cribrilina punctata/Collarina balzaci Y0310/Y0314 110742 P P P P
ASCIDIACEA (juv.) ZD0002 1839 4
Ascidiidae ZD0082 103443 3
Ascidiella ZD0083 103484 4
Ascidiella aspersa ZD0084 103718 7

METHIL OFFSHORE WIND DEMONSTRATOR BENTHIC SUB-TIDAL ECOLOGY
SURVEY FINAL REPORT
Report No. 15/J/3/03/2590/1782 Page 98
Taxon
MCS
Code
Aphia
ID
001.1.1318
7
002.1.1318
8
004.1.1319
0
005.1.1319
1
006.1.1319
2
007.1.1319
3
008.1.1319
4
009.1.1319
5
010.1.1319
6
Cerianthus lloydii D0632 283798
2
1
Edwardsiidae D0759 100665
5
1
13
TURBELLARIA F0002 794
1
NEMERTEA G0001 152391
7 11 9 12 1
1 4
Golfingia elongata N0014 175026
Nephasoma minutum N0025 136060
Thysanocardia procera N0028 136063
1
Phascolion strombus N0034 410749 1
2
Pisione remota P0015 130707
Subadyte pellucida P0032 130833
2
7
Enipo kinbergi P0044 130738
Gattyana cirrhosa P0049 130749
Harmothoe P0050 129491
1
Malmgreniella darbouxi P0050 130812
1
1
Malmgrenia andreapolis P0051 147008
1
Harmothoe glabra P0062 571832
1
Pholoe baltica P0092 130599
1 3 2
6
Pholoe inornata P0094 130601
1
Pholoe assimilis P0091 130598
Sigalion mathildae P0104 131072
Sthenelais limicola P0109 131077
2
Eteone longa (agg.) P0118 130616
1
Hypereteone foliosa P0124 152250 1
Phyllodoce groenlandica P0141 334506
1
Phyllodoce rosea P0146 334514
2
Eumida P0163 129446
1
Eumida bahusiensis P0164 130641
1 1
1
Eumida sanguinea (agg.) P0167 130644
1
Glycera P0255 129296 1

METHIL OFFSHORE WIND DEMONSTRATOR BENTHIC SUB-TIDAL ECOLOGY
SURVEY FINAL REPORT
Report No. 15/J/3/03/2590/1782 Page 99
Taxon
MCS
Code
Aphia
ID
001.1.1318
7
002.1.1318
8
004.1.1319
0
005.1.1319
1
006.1.1319
2
007.1.1319
3
008.1.1319
4
009.1.1319
5
010.1.1319
6
Glycera alba P0256 130116
1 1 1
Glycera celtica (?) P0257 130119
Glycera lapidum P0260 130123
Glycera unicornis P0255 130131 4
1 1
Glycinde nordmanni P0268 130136 1
1 1
1
1
Goniada maculata P0271 130140
1 1 2
1 1
Psamathe fusca P0305 152249
1
Oxydromus flexuosus P0313 710680
1
Podarkeopsis capensis P0319 130195
1 1 2
1
1
Syllis cornuta P0349 157583
2
Parexogone hebes P0421 757970
Exogone naidina P0422 131304
1
Eunereis longissima P0475 130375
1
Nephtys assimilis P0495 130353
1
Nephtys caeca P0496 130355
Nephtys hombergii P0499 130359 1
2 2
3
Nephtys incisa P0501 130362
3 4
Nephtys kersivalensis P0502 130363
2 2
2 1
Lumbrineris P0572 129337
1
Lumbrineris cingulata P0572 130240
9 2 19 3 1
1
Protodorvillea kefersteini P0638 130041
1
Orbinia sertulata P0665 130523
Scoloplos armiger P0672 334772
5 4
1
Levinsenia gracilis P0693 130578 1
1
Paradoneis lyra P0699 130585
1
Poecilochaetus serpens P0718 130711
1 3
2
Aonides oxycephala P0722 131106
1
Aonides paucibranchiata P0723 131107
Malacoceros girardi (?) P0736 338471
1

METHIL OFFSHORE WIND DEMONSTRATOR BENTHIC SUB-TIDAL ECOLOGY
SURVEY FINAL REPORT
Report No. 15/J/3/03/2590/1782 Page 100
Taxon
MCS
Code
Aphia
ID
001.1.1318
7
002.1.1318
8
004.1.1319
0
005.1.1319
1
006.1.1319
2
007.1.1319
3
008.1.1319
4
009.1.1319
5
010.1.1319
6
Prionospio cirrifera P0747 131153
1
Dipolydora flava P0754 131118
3 1
Prionospio fallax P0765 131157
2
2
Pseudopolydora
paucibranchiata P0773 131168
1
Pseudopolydora pulchra P0774 131169
1
1
Spio symphyta P0787 596189
1
6
Spiophanes P0793 129626
Spiophanes bombyx P0794 131187
3 2
1
4
Spiophanes kroyeri P0796 131188 2
2
1 1
Magelona P0803 129341
1
Magelona alleni P0804 130266 8
8 2
1
9
Magelona filiformis P0805 130268
2
5
Magelona johnstoni P0803 130269
2
Aphelochaeta marioni P0824 129938
1
Caulleriella alata P0829 129943
Chaetozone christiei P0834 152217
1 1 1
Chaetozone setosa P0834 129955 1
6
Chaetozone zetlandica P0831 336485
2
Cirratulus (juv.) P0835 129243
2
Cirratulus cirratus P0836 129959
2
Cirriformia tentaculata P0839 129964
5
Diplocirrus glaucus P0878 130100
1
2 3
Pherusa plumosa P0885 130113
1
Capitella P0906 129211
Mediomastus fragilis P0919 129892
4
41 2 1
Notomastus P0920 129220 1
1
Peresiella clymenoides P0925 129906
1
Maldanidae P0938 923

METHIL OFFSHORE WIND DEMONSTRATOR BENTHIC SUB-TIDAL ECOLOGY
SURVEY FINAL REPORT
Report No. 15/J/3/03/2590/1782 Page 101
Taxon
MCS
Code
Aphia
ID
001.1.1318
7
002.1.1318
8
004.1.1319
0
005.1.1319
1
006.1.1319
2
007.1.1319
3
008.1.1319
4
009.1.1319
5
010.1.1319
6
Microclymene tricirrata P0955 130309
2
Euclymene oerstedi P0964 130294
5
1
Rhodine P0989 129363 22
10
Ophelina acuminata P1014 130500
1
1
1
Scalibregma inflatum P1027 130980 1 2
1
7
Galathowenia oculata P1093 146950
2
1
Owenia P1097 129427
1
Owenia borealis P1097 329882 2
10 2
3 2
14
Amphictene auricoma P1102 152448
1
Lagis koreni P1107 152367 1
1 1
1
Sabellaria spinulosa P1117 130867
2
1
Melinna palmata P1124 129808
12 7 2
3
10
Ampharete P1133 129155
1
Ampharete lindstroemi (agg.) P1139 129781
1
4
2
Amphicteis gunneri P1142 129784 1
Anobothrus gracilis P1147 129789
5 6
7 2
3
Terebellides stroemii P1175 131573
1
1
Trichobranchus roseus P1178 131575
Terebellinae P1179 322588
Neoamphitrite edwardsi P1183 131503
Eupolymnia nesidensis P1190 131490
1
Lanice conchilega P1195 131495
Pista mediterranea P1216 131519
Lysilla loveni P1233 131500
Polycirrus P1235 129710
1
1 2
Polycirrus denticulatus P1239 131527
1
1
Streblosoma intestinale P1251 131540
Dialychone dunerificta P1257 558752
2
Hydroides norvegicus P1334 131009
2

METHIL OFFSHORE WIND DEMONSTRATOR BENTHIC SUB-TIDAL ECOLOGY
SURVEY FINAL REPORT
Report No. 15/J/3/03/2590/1782 Page 102
Taxon
MCS
Code
Aphia
ID
001.1.1318
7
002.1.1318
8
004.1.1319
0
005.1.1319
1
006.1.1319
2
007.1.1319
3
008.1.1319
4
009.1.1319
5
010.1.1319
6
Spirobranchus (juv.) P1339 129582
Spirobranchus lamarcki P1340 560033
1
Spirobranchus triqueter P1341 555935
1
Tubificoides P1487 137393
1
Tubificoides amplivasatus P1489 137570
3
Tubificoides benedii P1490 137571
Tubificoides pseudogaster
(agg.) P1498 137582
Tubificoides swirencoides P1500 137584
1
Tubificoides galiciensis P1487 137576
25 1
Anoplodactylus petiolatus Q0044 134723
1
CRUSTACEA R0001 1066
1
Perioculodes longimanus S0131 102915
Synchelidium maculatum S0138 102928
1
Leucothoe incisa S0177 102460
Urothoe poseidonis S0250 103235
Harpinia antennaria S0254 102960
1
Acidostoma neglectum S0272 102495
1
Iphimedia obesa S0382 102347
Atylus vedlomensis S0413 102132
Ampelisca S0423 101445
1
Ampelisca brevicornis S0427 101891
2 3
1 2
Ampelisca diadema S0429 101896
1 2
Ampelisca tenuicornis S0440 101930 2
8 1
3 1
4
Ampelisca typica S0442 101933
1
2
Cheirocratus (female) S0503 101669
1
Cheirocratus sundevallii S0506 102798
1
Gammaropsis cornuta S0539 148545
Photis longicaudata S0552 102383
10
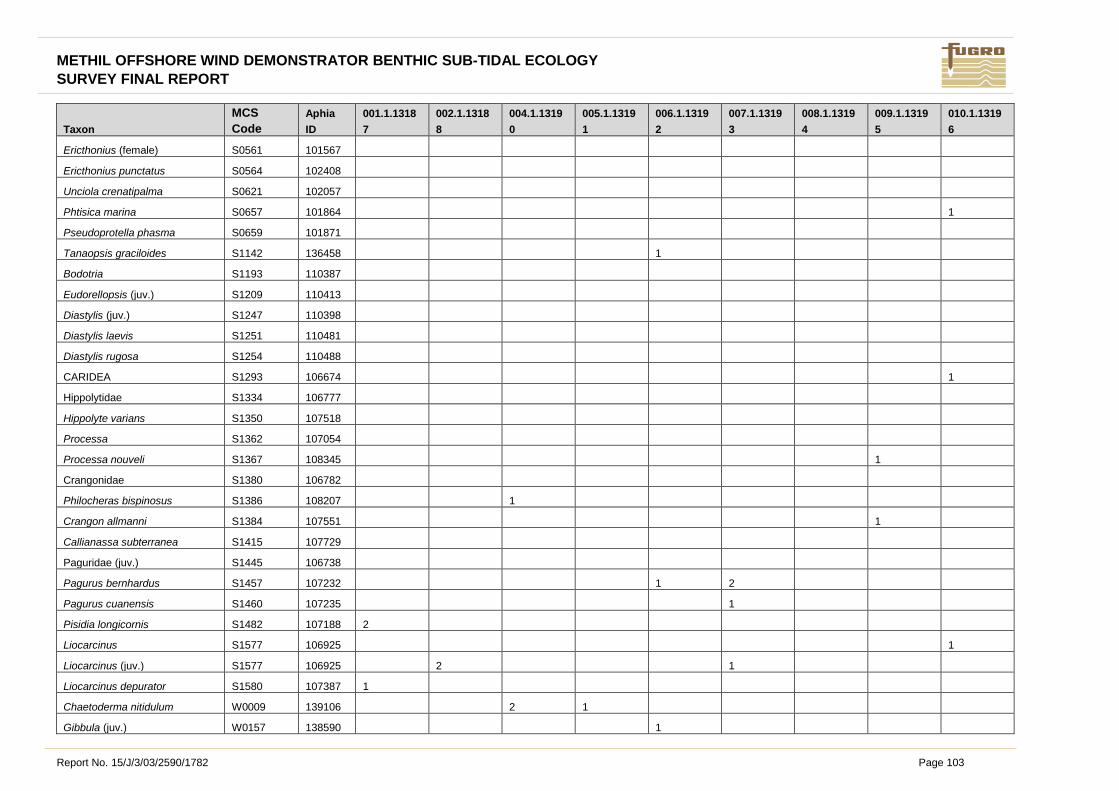
METHIL OFFSHORE WIND DEMONSTRATOR BENTHIC SUB-TIDAL ECOLOGY
SURVEY FINAL REPORT
Report No. 15/J/3/03/2590/1782 Page 103
Taxon
MCS
Code
Aphia
ID
001.1.1318
7
002.1.1318
8
004.1.1319
0
005.1.1319
1
006.1.1319
2
007.1.1319
3
008.1.1319
4
009.1.1319
5
010.1.1319
6
Ericthonius (female) S0561 101567
Ericthonius punctatus S0564 102408
Unciola crenatipalma S0621 102057
Phtisica marina S0657 101864
1
Pseudoprotella phasma S0659 101871
Tanaopsis graciloides S1142 136458
1
Bodotria S1193 110387
Eudorellopsis (juv.) S1209 110413
Diastylis (juv.) S1247 110398
Diastylis laevis S1251 110481
Diastylis rugosa S1254 110488
CARIDEA S1293 106674
1
Hippolytidae S1334 106777
Hippolyte varians S1350 107518
Processa S1362 107054
Processa nouveli S1367 108345
1
Crangonidae S1380 106782
Philocheras bispinosus S1386 108207
1
Crangon allmanni S1384 107551
1
Callianassa subterranea S1415 107729
Paguridae (juv.) S1445 106738
Pagurus bernhardus S1457 107232
1 2
Pagurus cuanensis S1460 107235
1
Pisidia longicornis S1482 107188 2
Liocarcinus S1577 106925
1
Liocarcinus (juv.) S1577 106925
2
1
Liocarcinus depurator S1580 107387 1
Chaetoderma nitidulum W0009 139106
2 1
Gibbula (juv.) W0157 138590
1

METHIL OFFSHORE WIND DEMONSTRATOR BENTHIC SUB-TIDAL ECOLOGY
SURVEY FINAL REPORT
Report No. 15/J/3/03/2590/1782 Page 104
Taxon
MCS
Code
Aphia
ID
001.1.1318
7
002.1.1318
8
004.1.1319
0
005.1.1319
1
006.1.1319
2
007.1.1319
3
008.1.1319
4
009.1.1319
5
010.1.1319
6
Gibbula tumida W0161 141799
Turritella communis W0270 141872
1
10 8
Hyala vitrea W0410 140129
2 3
Euspira nitida W0491 151894
Bela nebula W0801 139217
Philine (juv.) W1036 138339
Philine aperta W1038 140744
1
Cylichna cylindracea W1028 139476
4
4
5
Facelina W1467 137997
BIVALVIA W1560 105
Nucula (juv.) W1565 138262
Nucula nitidosa W1569 140589
1 4
1
5
Mytilidae (juv.) W1691 211
1
Musculus subpictus W1718 506128
Aequipecten opercularis W1773 140687
Anomiidae (juv.) W1805 214
Lucinoma borealis W1829 140283
7
1
Thyasiridae W1833 219
1
Thyasira W1835 138552
1
Thyasira flexuosa W1837 141662
1
Devonia perrieri W1898 140365
Kurtiella bidentata W1906 345281 4
5 17 2 1 20
20
Tellimya ferruginosa W1902 146952
3
Parvicardium W1947 137739
1
Spisula (juv.) W1973 138159
Ensis W1996 138333
1
Ensis (juv.) W1996 138333
1
Ensis magnus W1998 160539
Phaxas pellucidus W2006 140737
21 11
1
10

METHIL OFFSHORE WIND DEMONSTRATOR BENTHIC SUB-TIDAL ECOLOGY
SURVEY FINAL REPORT
Report No. 15/J/3/03/2590/1782 Page 105
Taxon
MCS
Code
Aphia
ID
001.1.1318
7
002.1.1318
8
004.1.1319
0
005.1.1319
1
006.1.1319
2
007.1.1319
3
008.1.1319
4
009.1.1319
5
010.1.1319
6
Tellina fabula W2019 141587
1
Gari fervensis W2051 140870
4
Abra W2058 138474
1
Abra (juv.) W2058 138474
1
3
Abra alba W2059 141433 1
Abra nitida W2061 141435
1
1
Veneridae (juv.) W2086 243
4 5
3
1 7
Dosinia (juv.) W2126 138636
15
1 4
2
Dosinia lupinus W2128 141912 4
1 2
Dosinia exoleta W2130 141911
Polititapes rhomboides W2113 745846
1
Chamelea striatula W2098 141908
3 8
1 1
Mysia undata W2139 140728 1
2
Mya (juv.) W2144 138211
1
Mya truncata W2147 140431
1
Corbula gibba W2157 139410
1
Thracioidea (juv.) W2226 382318
4
6
Thracia (juv.) W2227 138549
8
3
Thracia convexa W2229 141644
Thracia phaseolina W2231 152378
2 3 3
1
Cochlodesma praetenue W2239 181373
2
Phoronis ZA0003 128545 72
68 4
64 15 1 125
Astropecten irregularis ZB0026 123867
3
OPHIUROIDEA (juv.) ZB0105 123084
Ophiothrix fragilis ZB0124 125131
55
105
Amphiuridae ZB0148 123206
1 1
3
Amphiuridae (juv.) ZB0148 123206
2 1 1
3
Acrocnida brachiata ZB0151 236130
6 5
20
Amphiura filiformis ZB0154 125080
59 21
3
39

METHIL OFFSHORE WIND DEMONSTRATOR BENTHIC SUB-TIDAL ECOLOGY
SURVEY FINAL REPORT
Report No. 15/J/3/03/2590/1782 Page 106
Taxon
MCS
Code
Aphia
ID
001.1.1318
7
002.1.1318
8
004.1.1319
0
005.1.1319
1
006.1.1319
2
007.1.1319
3
008.1.1319
4
009.1.1319
5
010.1.1319
6
Amphipholis squamata ZB0161 125064
Ophiuridae (juv.) ZB0165 123200
2 4 3 5
9
Ophiura ZB0166 123574
3
Ophiura (juv.) ZB0166 123574
2
Ophiura albida ZB0168 124913
20
3 4
Ophiura ophiura ZB0170 124929
4
ECHINOIDEA (juv.) ZB0181 123082
SPATANGOIDA ZB0213 123106
Echinocardium ZB0222 123426 1
1
1
Echinocardium cordatum ZB0223 124392
3
1
Leptopentacta elongata ZB0280 124635
Leptosynapta inhaerens ZB0296 124465
1
ENTEROPNEUSTA ZC0012 1820
1
Ammodytes ZG0442 125909

METHIL OFFSHORE WIND DEMONSTRATOR BENTHIC SUB-TIDAL ECOLOGY
SURVEY FINAL REPORT
Report No. 15/J/3/03/2590/1782 Page 107
Taxon MCS Code Aphia ID 011.1.13197 012.1.13198 013.1.13199 014.1.13200 015.1.13201 016.1.13202 017.1.13203 018.1.13204
Cerianthus lloydii D0632 283798
3
Edwardsiidae D0759 100665 4
7
2 1 5
TURBELLARIA F0002 794 1
1
NEMERTEA G0001 152391 3 3 9
16 10 16 8
Golfingia elongata N0014 175026 1
Nephasoma minutum N0025 136060
Thysanocardia procera N0028 136063
1 2
1
Phascolion strombus N0034 410749
1
1
Pisione remota P0015 130707
1
Subadyte pellucida P0032 130833
8
Enipo kinbergi P0044 130738
1
Gattyana cirrhosa P0049 130749
1
Harmothoe P0050 129491
Malmgreniella darbouxi P0050 130812
1
Malmgrenia andreapolis P0051 147008 1
1 3
Harmothoe glabra P0062 571832
1
Pholoe baltica P0092 130599 12
1 18 2 3 3
Pholoe inornata P0094 130601
1
Pholoe assimilis P0091 130598
4
Sigalion mathildae P0104 131072
2 3
Sthenelais limicola P0109 131077
Eteone longa (agg.) P0118 130616
1
Hypereteone foliosa P0124 152250
Phyllodoce groenlandica P0141 334506
Phyllodoce rosea P0146 334514
Eumida P0163 129446
1
Eumida bahusiensis P0164 130641 6
1
3 2 1
Eumida sanguinea (agg.) P0167 130644
1
Glycera P0255 129296

METHIL OFFSHORE WIND DEMONSTRATOR BENTHIC SUB-TIDAL ECOLOGY
SURVEY FINAL REPORT
Report No. 15/J/3/03/2590/1782 Page 108
Taxon MCS Code Aphia ID 011.1.13197 012.1.13198 013.1.13199 014.1.13200 015.1.13201 016.1.13202 017.1.13203 018.1.13204
Glycera alba P0256 130116
1
Glycera celtica (?) P0257 130119 1
Glycera lapidum P0260 130123
1
20
Glycera unicornis P0255 130131 1
2 2
1
Glycinde nordmanni P0268 130136 1 1 1
4
2
Goniada maculata P0271 130140 1
2 3
4
1
Psamathe fusca P0305 152249
2
Oxydromus flexuosus P0313 710680
Podarkeopsis capensis P0319 130195
1 4 1
Syllis cornuta P0349 157583
1 1
Parexogone hebes P0421 757970
Exogone naidina P0422 131304
Eunereis longissima P0475 130375
4
1
Nephtys assimilis P0495 130353 1
1
Nephtys caeca P0496 130355 1
1
1
Nephtys hombergii P0499 130359 3
1
Nephtys incisa P0501 130362
Nephtys kersivalensis P0502 130363 1 1 1
2
Lumbrineris P0572 129337
1
Lumbrineris cingulata P0572 130240 5 10 3
3 19 2
Protodorvillea kefersteini P0638 130041
4
Orbinia sertulata P0665 130523
1
1
Scoloplos armiger P0672 334772
41
11
Levinsenia gracilis P0693 130578
Paradoneis lyra P0699 130585 1
6
Poecilochaetus serpens P0718 130711
Aonides oxycephala P0722 131106
Aonides paucibranchiata P0723 131107
7
Malacoceros girardi (?) P0736 338471
1

METHIL OFFSHORE WIND DEMONSTRATOR BENTHIC SUB-TIDAL ECOLOGY
SURVEY FINAL REPORT
Report No. 15/J/3/03/2590/1782 Page 109
Taxon MCS Code Aphia ID 011.1.13197 012.1.13198 013.1.13199 014.1.13200 015.1.13201 016.1.13202 017.1.13203 018.1.13204
Prionospio cirrifera P0747 131153
Dipolydora flava P0754 131118
1 1
1
Prionospio fallax P0765 131157
2
Pseudopolydora paucibranchiata P0773 131168
1
1 2
Pseudopolydora pulchra P0774 131169
Spio symphyta P0787 596189 2
1 20 12
Spiophanes P0793 129626
1
Spiophanes bombyx P0794 131187 3 1 1 1
1 4 6
Spiophanes kroyeri P0796 131188
1 1
Magelona P0803 129341
Magelona alleni P0804 130266 4
32 7
6
4
Magelona filiformis P0805 130268
6 61 54
Magelona johnstoni P0803 130269 1
2 61 52
Aphelochaeta marioni P0824 129938
1
Caulleriella alata P0829 129943
1
Chaetozone christiei P0834 152217
7 6
Chaetozone setosa P0834 129955 1
1
3
Chaetozone zetlandica P0831 336485
1
Cirratulus (juv.) P0835 129243
Cirratulus cirratus P0836 129959
Cirriformia tentaculata P0839 129964
Diplocirrus glaucus P0878 130100
1
1
Pherusa plumosa P0885 130113
Capitella P0906 129211
1
Mediomastus fragilis P0919 129892 1
15
1
Notomastus P0920 129220
Peresiella clymenoides P0925 129906
2
Maldanidae P0938 923 1
Microclymene tricirrata P0955 130309
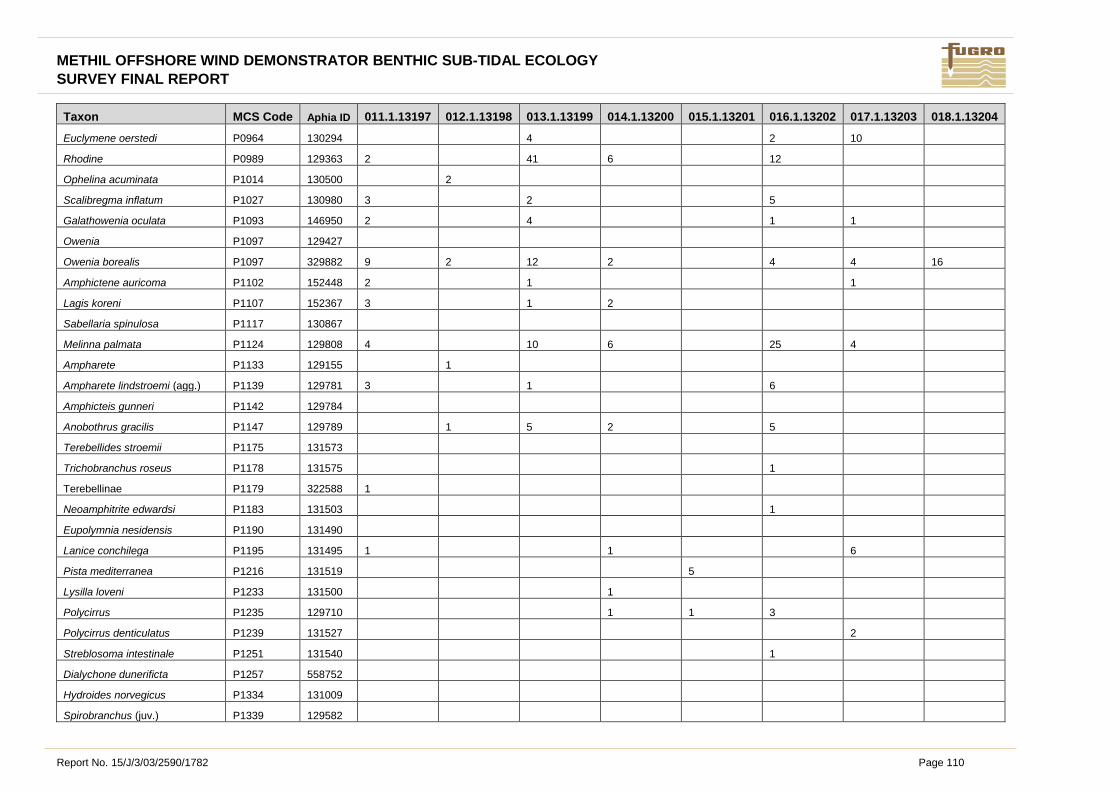
METHIL OFFSHORE WIND DEMONSTRATOR BENTHIC SUB-TIDAL ECOLOGY
SURVEY FINAL REPORT
Report No. 15/J/3/03/2590/1782 Page 110
Taxon MCS Code Aphia ID 011.1.13197 012.1.13198 013.1.13199 014.1.13200 015.1.13201 016.1.13202 017.1.13203 018.1.13204
Euclymene oerstedi P0964 130294
4
2 10
Rhodine P0989 129363 2
41 6
12
Ophelina acuminata P1014 130500
2
Scalibregma inflatum P1027 130980 3
2
5
Galathowenia oculata P1093 146950 2
4
1 1
Owenia P1097 129427
Owenia borealis P1097 329882 9 2 12 2
4 4 16
Amphictene auricoma P1102 152448 2
1
1
Lagis koreni P1107 152367 3
1 2
Sabellaria spinulosa P1117 130867
Melinna palmata P1124 129808 4
10 6
25 4
Ampharete P1133 129155
1
Ampharete lindstroemi (agg.) P1139 129781 3
1
6
Amphicteis gunneri P1142 129784
Anobothrus gracilis P1147 129789
1 5 2
5
Terebellides stroemii P1175 131573
Trichobranchus roseus P1178 131575
1
Terebellinae P1179 322588 1
Neoamphitrite edwardsi P1183 131503
1
Eupolymnia nesidensis P1190 131490
Lanice conchilega P1195 131495 1
1
6
Pista mediterranea P1216 131519
5
Lysilla loveni P1233 131500
1
Polycirrus P1235 129710
1 1 3
Polycirrus denticulatus P1239 131527
2
Streblosoma intestinale P1251 131540
1
Dialychone dunerificta P1257 558752
Hydroides norvegicus P1334 131009
Spirobranchus (juv.) P1339 129582

METHIL OFFSHORE WIND DEMONSTRATOR BENTHIC SUB-TIDAL ECOLOGY
SURVEY FINAL REPORT
Report No. 15/J/3/03/2590/1782 Page 111
Taxon MCS Code Aphia ID 011.1.13197 012.1.13198 013.1.13199 014.1.13200 015.1.13201 016.1.13202 017.1.13203 018.1.13204
Spirobranchus lamarcki P1340 560033
13
Spirobranchus triqueter P1341 555935
1
Tubificoides P1487 137393
Tubificoides amplivasatus P1489 137570
Tubificoides benedii P1490 137571
1
Tubificoides pseudogaster (agg.) P1498 137582
1
Tubificoides swirencoides P1500 137584
Tubificoides galiciensis P1487 137576
3
Anoplodactylus petiolatus Q0044 134723 1
CRUSTACEA R0001 1066
Perioculodes longimanus S0131 102915
1
Synchelidium maculatum S0138 102928 1 1
Leucothoe incisa S0177 102460
1
Urothoe poseidonis S0250 103235
5
Harpinia antennaria S0254 102960 2
3
1
Acidostoma neglectum S0272 102495
Iphimedia obesa S0382 102347
Atylus vedlomensis S0413 102132
1
6
Ampelisca S0423 101445
1
Ampelisca brevicornis S0427 101891 5
8 6
Ampelisca diadema S0429 101896 3
1
1
Ampelisca tenuicornis S0440 101930
6 3
2
2
Ampelisca typica S0442 101933 1 1 2
1
2
Cheirocratus (female) S0503 101669
8
Cheirocratus sundevallii S0506 102798
Gammaropsis cornuta S0539 148545
1
Photis longicaudata S0552 102383
4
Ericthonius (female) S0561 101567
Ericthonius punctatus S0564 102408

METHIL OFFSHORE WIND DEMONSTRATOR BENTHIC SUB-TIDAL ECOLOGY
SURVEY FINAL REPORT
Report No. 15/J/3/03/2590/1782 Page 112
Taxon MCS Code Aphia ID 011.1.13197 012.1.13198 013.1.13199 014.1.13200 015.1.13201 016.1.13202 017.1.13203 018.1.13204
Unciola crenatipalma S0621 102057
1
Phtisica marina S0657 101864
Pseudoprotella phasma S0659 101871
Tanaopsis graciloides S1142 136458 1
1
Bodotria S1193 110387
1
Eudorellopsis (juv.) S1209 110413
1
Diastylis (juv.) S1247 110398
Diastylis laevis S1251 110481
Diastylis rugosa S1254 110488
1
CARIDEA S1293 106674
Hippolytidae S1334 106777
Hippolyte varians S1350 107518
1
1
Processa S1362 107054
1
Processa nouveli S1367 108345
1
Crangonidae S1380 106782
1
Philocheras bispinosus S1386 108207
Crangon allmanni S1384 107551
Callianassa subterranea S1415 107729
1
Paguridae (juv.) S1445 106738
1
Pagurus bernhardus S1457 107232
1 1 1
Pagurus cuanensis S1460 107235
Pisidia longicornis S1482 107188
3
Liocarcinus S1577 106925
Liocarcinus (juv.) S1577 106925
3
1
Liocarcinus depurator S1580 107387
1
Chaetoderma nitidulum W0009 139106 1
1
2
Gibbula (juv.) W0157 138590
Gibbula tumida W0161 141799
2
Turritella communis W0270 141872
4 1

METHIL OFFSHORE WIND DEMONSTRATOR BENTHIC SUB-TIDAL ECOLOGY
SURVEY FINAL REPORT
Report No. 15/J/3/03/2590/1782 Page 113
Taxon MCS Code Aphia ID 011.1.13197 012.1.13198 013.1.13199 014.1.13200 015.1.13201 016.1.13202 017.1.13203 018.1.13204
Hyala vitrea W0410 140129
Euspira nitida W0491 151894
1 1
Bela nebula W0801 139217 2
Philine (juv.) W1036 138339
2
Philine aperta W1038 140744
1 1
4
Cylichna cylindracea W1028 139476 7
2
3 3 8
Facelina W1467 137997
BIVALVIA W1560 105
1
1
Nucula (juv.) W1565 138262 2
Nucula nitidosa W1569 140589 5
1 2 3
Mytilidae (juv.) W1691 211
1
Musculus subpictus W1718 506128
Aequipecten opercularis W1773 140687
Anomiidae (juv.) W1805 214
2
Lucinoma borealis W1829 140283
5
3
Thyasiridae W1833 219
Thyasira W1835 138552
Thyasira flexuosa W1837 141662
Devonia perrieri W1898 140365
1 1
Kurtiella bidentata W1906 345281 52
2 11 14 4 21 24
Tellimya ferruginosa W1902 146952 2
2
2 10
Parvicardium W1947 137739
Spisula (juv.) W1973 138159
3
1 1
Ensis W1996 138333
Ensis (juv.) W1996 138333
Ensis magnus W1998 160539 2
5
2
Phaxas pellucidus W2006 140737 13
2
5 4 13
Tellina fabula W2019 141587 1
76 22
Gari fervensis W2051 140870
1

METHIL OFFSHORE WIND DEMONSTRATOR BENTHIC SUB-TIDAL ECOLOGY
SURVEY FINAL REPORT
Report No. 15/J/3/03/2590/1782 Page 114
Taxon MCS Code Aphia ID 011.1.13197 012.1.13198 013.1.13199 014.1.13200 015.1.13201 016.1.13202 017.1.13203 018.1.13204
Abra W2058 138474
Abra (juv.) W2058 138474
1
Abra alba W2059 141433
1 1
Abra nitida W2061 141435
Veneridae (juv.) W2086 243 2
1
3 1
Dosinia (juv.) W2126 138636
1
2 13 1
Dosinia lupinus W2128 141912
2 1
Dosinia exoleta W2130 141911
1
Polititapes rhomboides W2113 745846
5
Chamelea striatula W2098 141908 1 1
2 4
3
Mysia undata W2139 140728
4
Mya (juv.) W2144 138211
Mya truncata W2147 140431
Corbula gibba W2157 139410 2
Thracioidea (juv.) W2226 382318 5
1 3
Thracia (juv.) W2227 138549 26 1
Thracia convexa W2229 141644
1
Thracia phaseolina W2231 152378 3 1
2 19 7
Cochlodesma praetenue W2239 181373 1
2
Phoronis ZA0003 128545 61
212 173
100
32
Astropecten irregularis ZB0026 123867
OPHIUROIDEA (juv.) ZB0105 123084
6
Ophiothrix fragilis ZB0124 125131
71
Amphiuridae ZB0148 123206 4
10
Amphiuridae (juv.) ZB0148 123206 7
1
1 7 4
Acrocnida brachiata ZB0151 236130 13
3 3 7
Amphiura filiformis ZB0154 125080 33 1 14 3
26
4
Amphipholis squamata ZB0161 125064
5
Ophiuridae (juv.) ZB0165 123200 6 2 1
5 8

METHIL OFFSHORE WIND DEMONSTRATOR BENTHIC SUB-TIDAL ECOLOGY
SURVEY FINAL REPORT
Report No. 15/J/3/03/2590/1782 Page 115
Taxon MCS Code Aphia ID 011.1.13197 012.1.13198 013.1.13199 014.1.13200 015.1.13201 016.1.13202 017.1.13203 018.1.13204
Ophiura ZB0166 123574
Ophiura (juv.) ZB0166 123574
3
1
Ophiura albida ZB0168 124913
6
Ophiura ophiura ZB0170 124929
ECHINOIDEA (juv.) ZB0181 123082
SPATANGOIDA ZB0213 123106
1 1
Echinocardium ZB0222 123426
2
4
Echinocardium cordatum ZB0223 124392
2
2
Leptopentacta elongata ZB0280 124635
1
1
Leptosynapta inhaerens ZB0296 124465
2 4
ENTEROPNEUSTA ZC0012 1820 2
1
Ammodytes ZG0442 125909
1

METHIL OFFSHORE WIND DEMONSTRATOR BENTHIC SUB-TIDAL ECOLOGY
SURVEY FINAL REPORT
Report No. 15/J/3/03/2590/1782 Page 116
H. APPENDIX H BIOMASS DATA

METHIL OFFSHORE WIND DEMONSTRATOR BENTHIC SUB-TIDAL ECOLOGY
SURVEY FINAL REPORT
Report No. 15/J/3/03/2590/1782 Page 117
TaxonName 001.1.13187 002.1.13188 004.1.13190 005.1.13191 006.1.13192 007.1.13193 008.1.13194 009.1.13195 010.1.13196 011.1.13197
Other taxa 0.9106 0.0160 2.8484 0.0910 0.0217 0.5803 0.0532 0.0023 4.9579 2.7158
Cnidaria 0.0000 0.0000 0.1097 0.0000 0.0000 0.0062 0.0000 0.0000 0.3760 0.0233
Polychaetes 1.9147 0.4944 1.5853 1.1929 0.6836 0.8860 0.5388 0.0581 2.1687 4.3280
Oligochaetes 0.0000 0.0003 0.0000 0.0000 0.0066 0.0003 0.0000 0.0000 0.0000 0.0000
Crustaceans 0.1507 0.0174 0.0221 0.0294 0.0143 0.2095 0.0104 0.0712 3.0516 0.0519
Molluscs 20.2117 0.2147 8.0193 5.3705 0.1941 8.0845 4.1104 0.0077 1.2904 3.7522
Echinoderms 0.0651 9.6652 4.1215 2.0459 55.5228 0.1043 0.1256 0.0000 2.9024 2.2131
TaxonName 012.1.13198 013.1.13199 014.1.13200 015.1.13201 016.1.13202 017.1.13203 018.1.13204 019.1.13205
Other taxa 0.0083 11.7360 1.1611 0.0140 4.2769 2.7662 0.4059 0.0635
Cnidaria 0.0000 0.4937 0.0000 0.0000 0.0252 0.0272 0.0826 0.0000
Polychaetes 0.3478 3.7716 2.2650 5.6915 2.9103 1.8863 1.8656 0.5013
Oligochaetes 0.0000 0.0000 0.0000 0.0004 0.0000 0.0000 0.0000 0.0008
Crustaceans 0.2041 0.1385 0.7947 0.0628 0.0291 0.1034 0.0518 0.0396
Molluscs 11.6410 8.7793 1.1506 16.8298 5.7744 6.0732 3.1018 17.5631
Echinoderms 38.5677 0.6365 2.1005 0.0038 0.3123 5.7451 12.6430 1.4473

METHIL OFFSHORE WIND DEMONSTRATOR BENTHIC SUB-TIDAL ECOLOGY
SURVEY FINAL REPORT
Report No. 15/J/3/03/2590/1782 Page 118
I. APPENDIX I PSD ANALYSIS DATA

METHIL OFFSHORE WIND DEMONSTRATOR BENTHIC SUB-TIDAL ECOLOGY
SURVEY FINAL REPORT
Report No. 15/J/3/03/2590/1782 Page 119
SAMPLE ID: 1 4 7 8 9 10 11 13 14 15 16 17
LAB ID: 13206 13209 13212 13213 13214 13215 13216 13218 13219 13220 13221 13222
Aperture [µm] Fractional [%]
Fractional [%]
Fractional [%]
Fractional [%]
Fractional [%]
Fractional [%]
Fractional [%]
Fractional [%]
Fractional [%]
Fractional [%]
Fractional [%]
Fractional [%]
63000 0.00 0.00 0.00 0.00 0.00 0.00 0.00 0.00 0.00 0.00 0.00 0.00
31500 0.00 0.00 0.00 0.00 0.00 0.00 0.00 0.00 0.00 0.00 0.00 0.00
16000 0.00 9.98 0.00 0.00 0.00 0.00 0.00 0.00 0.00 0.00 0.75 0.00
8000 1.29 0.00 1.20 0.00 0.00 0.00 0.00 0.00 0.00 0.00 1.27 0.24
4000 0.42 0.19 1.45 0.40 1.36 0.43 0.00 0.57 0.98 3.79 3.31 0.13
2000 0.42 0.53 1.68 0.46 0.21 0.44 0.22 0.83 0.19 15.12 4.57 0.42
1000 0.55 0.78 0.99 0.32 0.17 0.53 0.35 0.88 0.51 20.95 2.75 0.46
500 1.42 1.47 2.38 0.35 0.10 1.29 0.85 2.16 1.34 14.98 2.57 1.20
250 5.38 8.33 7.63 1.41 0.44 11.84 15.99 7.77 3.19 19.07 10.46 9.80
125 18.08 50.18 21.60 3.57 2.33 59.38 56.91 48.63 23.30 7.85 47.07 67.83
63 42.93 19.73 37.19 47.00 27.85 20.57 16.06 25.54 39.83 2.58 18.01 14.74
31.25 8.15 1.52 6.07 10.79 25.86 1.05 1.59 2.78 8.98 3.00 2.26 0.98
15.63 7.60 2.11 6.73 11.32 16.57 1.27 2.46 3.42 7.87 3.90 2.39 1.13
7.81 5.86 2.10 5.59 10.11 10.25 1.29 2.43 3.18 6.00 3.48 1.95 1.21
3.91 4.19 1.65 3.99 7.58 7.55 1.02 1.75 2.31 4.18 2.61 1.41 0.97
1.95 2.20 0.89 2.10 4.02 4.16 0.54 0.86 1.17 2.16 1.55 0.74 0.53
0.98 0.91 0.35 0.86 1.63 1.89 0.22 0.32 0.46 0.89 0.71 0.30 0.23
0.49 0.55 0.20 0.50 0.95 1.16 0.13 0.19 0.27 0.54 0.39 0.18 0.13
< 0.49 0.05 0.01 0.04 0.08 0.10 0.01 0.01 0.02 0.04 0.03 0.01 0.01
TOTAL: 100.00 100.00 100.00 100.00 100.00 100.00 100.00 100.00 100.00 100.00 100.00 100.00

METHIL OFFSHORE WIND DEMONSTRATOR BENTHIC SUB-TIDAL ECOLOGY
SURVEY FINAL REPORT
Report No. 15/J/3/03/2590/1782 Page 120
SAMPLE ID: 5 6 12 18 19
LAB ID: 13210 13211 13217 13223 13224
Sieve Aperture [µm] Fractional [%]
Fractional [%]
Fractional [%]
Fractional [%]
Fractional [%]
63000 0.00 0.00 0.00 0.00 0.00
31500 0.00 31.66 31.20 0.00 0.00
16000 0.00 35.76 25.21 0.00 14.38
8000 0.88 10.17 2.09 0.00 12.30
4000 3.88 3.38 2.80 0.27 6.93
2000 2.20 1.10 2.60 0.34 3.12
1000 1.99 0.96 2.47 0.24 2.72
500 2.86 1.42 3.09 0.59 4.57
250 18.42 3.44 13.21 2.61 15.14
125 53.98 8.91 13.56 68.03 28.82
63 11.08 1.29 1.92 24.07 9.51
< 63 4.72 1.90 1.85 3.85 2.51
TOTAL: 100.00 100.00 100.00 100.00 100.00

METHIL OFFSHORE WIND DEMONSTRATOR BENTHIC SUB-TIDAL ECOLOGY
SURVEY FINAL REPORT
Report No. 15/J/3/03/2590/1782 Page 121
J. APPENDIX J SEDIMENT CHEMISTRY ANALYSIS

METHIL OFFSHORE WIND DEMONSTRATOR BENTHIC SUB-TIDAL ECOLOGY
SURVEY FINAL REPORT
Report No. 15/J/3/03/2590/1782 Page 122
Analysis of Fife Energy Park Sediment Sample Analytical Report
Marine Scotland
Revised AL OSPAR ERL Client ID
Sample
Description Analysis* Value** Units
STN005 Marine
Sediment
Total hydrocarbons 370 mg/kg 100 mg/kg
Naphthalene 25.2 µg/kg 0.1 mg/kg 160 µg/kg
Acenaphthylene <1 µg/kg 0.1 mg/kg
Acenaphthene 3.03 µg/kg 0.1 mg/kg
Fluorene <5 µg/kg 0.1 mg/kg
Phenanthrene 19.3 µg/kg 0.1 mg/kg 240 µg/kg
Anthracene 6.62 µg/kg 0.1 mg/kg 85 µg/kg
Fluoranthene 21 µg/kg 0.1 mg/kg 600 µg/kg
Pyrene 21.3 µg/kg 0.1 mg/kg 665 µg/kg
Benzo(a)anthracene 11.9 µg/kg 0.1 mg/kg 261 µg/kg
Chrysene 7.66 µg/kg 0.1 mg/kg 384 µg/kg
Benzo(b)fluoranthen
e 13.8 µg/kg 0.1 mg/kg
Benzo(k)fluoranthen
e 5.82 µg/kg 0.1 mg/kg
Benzo(a)pyrene 11.4 µg/kg 0.1 mg/kg 430 µg/kg
Indeno(123cd)pyren
e 8.41 µg/kg 0.1 mg/kg 240 µg/kg
Benzo(ghi)perylene 11.9 µg/kg 0.1 mg/kg 85 µg/kg
Dibenzo(ah)anthrac
ene 1.66 µg/kg 10 mg/kg
Total EPA16 Priority
PAHs 169 µg/kg
Dioctyltin <4 µg/kg
Dibutyltin 7.04 µg/kg
Tributyltin <4 µg/kg 0.1 mg/kg
Tetrabutyltin <3 µg/kg
Diphenyltin <3 µg/kg
Triphenyltin <3 µg/kg
Aluminium 7010 mg/kg
Arsenic 9.25 mg/kg 20 mg/kg 8.2 mg/kg
Cadmium 0.028 mg/kg 0.4 mg/kg 1.2 mg/kg
Chromium 18.6 mg/kg 50 mg/kg 81 mg/kg
Copper 3.48 mg/kg 30 mg/kg 34 mg/kg
Iron 12800 mg/kg
Lithium 9.66 mg/kg
Lead 13 mg/kg 50 mg/kg 47 mg/kg
Mercury 0.0199 mg/kg 0.25 mg/kg 0.15 mg/kg
Nickel 9.54 mg/kg 30 mg/kg 21 mg/kg
Zinc 32.6 mg/kg 130 mg/kg 150 mg/kg
Notes:
* Total hydrocarbons determined by methanol digest, pentane exchange and analysis by UV fluorescence spectrometry.
Polycyclic Aromatic Hydrocarbon (PAH) content determined by solvent extraction and analysis by GC-QQQ. - Organotin
content determined by ultrasonic extraction and derivatisation of extract for GC-MS analysis. - Mercury determined by aqua-
regia digest, addition of stannous chloride and analysis by CV-AFS. - Metals determined by aqua-regia digest with analysis

METHIL OFFSHORE WIND DEMONSTRATOR BENTHIC SUB-TIDAL ECOLOGY
SURVEY FINAL REPORT
Report No. 15/J/3/03/2590/1782 Page 123
by ICP-MS and ICP-OES ** The data presented within this report relate only to the samples as received at the laboratory. All
results reported on a sediment dry weight basis.
Analysis of Fife Energy Park Sediment Sample Analytical Report
OSPAR ERL Client ID
Sample
Description Analysis* Value** Units
STN005 Marine Sediment
PCB 18 0.183 µg/kg
PCB 28 0.284 µg/kg 1.7 µg/kg
PCB 31 0.22 µg/kg
PCB 44 0.11 µg/kg
PCB 47 0.057 µg/kg
PCB 49 0.092 µg/kg
PCB 52 0.263 µg/kg 2.7 µg/kg
PCB 66 0.186 µg/kg
PCB 101 0.216 µg/kg 3 µg/kg
PCB 105 0.049 µg/kg
PCB 110 0.146 µg/kg
PCB 118 0.183 µg/kg 0.6 µg/kg
PCB 128 0.068 µg/kg
PCB 138 0.126 µg/kg 7.9 µg/kg
PCB 141 <0.010 µg/kg
PCB 149 0.045 µg/kg
PCB 151 0.024 µg/kg
PCB 153 0.132 µg/kg 40 µg/kg
PCB 156 0.021 µg/kg
PCB 158 0.059 µg/kg
PCB 170 0.042 µg/kg
PCB 180 0.054 µg/kg 12 µg/kg
PCB 183 0.042 µg/kg
PCB 187 0.036 µg/kg
PCB 194 0.035 µg/kg
Total ICES 7 1.26 µg/kg
Total CEN 25 2.68 µg/kg
Notes:
* Polychlorinated biphenyls (PCB) determined by ultrasonic extraction and clean-up of the extract for analysis by
GC-µECD. ** The data presented within this report relate only to the samples as received at the laboratory. All
results reported on a sediment dry weight basis.

METHIL OFFSHORE WIND DEMONSTRATOR BENTHIC SUB-TIDAL ECOLOGY
SURVEY FINAL REPORT
Report No. 15/J/3/03/2590/1782 Page 124
K. APPENDIX K 2 BEAM TRAWL ANALYSIS DATA

METHIL OFFSHORE WIND DEMONSTRATOR BENTHIC SUB-TIDAL ECOLOGY
SURVEY FINAL REPORT
Report No. 15/J/3/03/2590/1782 Page 125
Taxon MCS Code APHIA ID T1 T2 T4
Total Total Total
Suberites ficus (agg.) C0418 134285 0 P 0
Halichondria C0632 131807 P 0 0
Abietinaria abietina D0409 117870 P 0 0
Hydrallmania falcata D0424 117890 P P 0
Alcyonium digitatum D0596 125333 P P 0
ACTINIARIA D0662 1360 1 2 0
Aphrodita aculeata P0019 129840 2 12 7
Alentia gelatinosa P0034 130722 0 1 0
Gattyana cirrhosa P0049 130749 0 1 0
Lepidonotus squamatus P0082 130801 3 1 0
Chaetopterus variopedatus P0814 129914 0 1 0
Flabelligera affinis P0881 130103 1 0 1
Eupolymnia nesidensis P1190 131490 0 0 1
Balanus crenatus R0077 106215 0 7 0
Crangon allmanni S1384 107551 4 1 0
Crangon crangon S1385 107552 27 79 30
Pagurus bernhardus S1457 107232 2 0 0
Galathea dispersa S1471 107148 0 0 1
Pisidia longicornis S1482 107188 3 1 13
Macropodia parva/rostrata S15??/S1532 205077 1 0 3
Hyas araneus S1518 107322 3 2 0
Hyas coarctatus S1519 107323 5 0 3
Cancer pagurus (female) S1566 107276 0 0 1
Liocarcinus depurator S1580 107387 79 57 40
Liocarcinus holsatus S1581 107388 5 9 0
Leptochiton asellus W0053 140199 2 0 0
Gibbula tumida W0161 141799 1 0 0
Turritella communis W0270 141872 0 1 0
Lamellaria perspicua W0470 140173 3 0 4
Buccinum undatum W0708 138878 2 1 2
Philine aperta W1038 140744 81 25 75
Musculus subpicutus W1718 506128 4 0 21
Pecten maximus W1771 140712 0 1 0
Aequipecten opercularis W1773 140687 17 3 91
Sepiola atlantica W2329 141454 1 0 0

METHIL OFFSHORE WIND DEMONSTRATOR BENTHIC SUB-TIDAL ECOLOGY
SURVEY FINAL REPORT
Report No. 15/J/3/03/2590/1782 Page 126
Taxon MCS Code APHIA ID T1 T2 T4
Total Total Total
Sepietta oweniana W2333 141452 2 1 0
Eledone cirrhosa W2398 140600 0 0 1
Alcyonidium parasiticum Y0081 111604 P P P
Eucratea loricata Y0165 111361 0 P 0
Astropecten irregularis ZB0026 123867 255 213 32
Crossaster papposus ZB0075 124154 1 0 0
Asterias rubens ZB0100 123776 89 70 70
Ophiothrix fragilis ZB0124 125131 66 3 98
Ophiocten affinis ZB0167 124850 0 0 1
Ophiura albida ZB0168 124913 3 0 0
Ophiura ophiura ZB0170 124929 2 36 0
Psammechinus miliaris ZB0193 124319 4 1 9
Echinus esculentus ZB0198 124287 0 0 1
Ascidiidae ZD0082 103443 1 0 0
Ascidiella ZD0083 103484 8 0 0
Ascidiella (juv.) ZD0083 103484 34 32 30
Ascidiella aspersa ZD0084 103718 132 176 201
Ascidiella scabra ZD0085 103719 19 2 0
Gadus morhua ZG0116 126436 6 0 0
Syngnathus acus ZG0245 127387 5 16 1
Myoxocephalus scorpius ZG0281 127203 1 2 1
Agonus cataphractus ZG0291 127190 2 11 2
Zoarces viviparus ZG0437 127123 0 0 1
Pholis gunnellus ZG0440 126996 1 0 1
Callionymus lyra ZG0452 126792 3 3 2
Gobiidae ZG0455 125537 0 0 1
Pomatoschistus ZG0476 125999 0 8 0
Pomatoschistus minutus ZG0479 126928 26 35 20
Limanda limanda ZG0572 127139 14 30 2
Microstomus kitt ZG0574 127140 2 0 0
Pleuronectes platessa ZG0578 127143 36 60 6

METHIL OFFSHORE WIND DEMONSTRATOR BENTHIC SUB-TIDAL ECOLOGY
SURVEY FINAL REPORT
Report No. 15/J/3/03/2590/1782 Page 127
Trawl Fish Species Measurements Total Lengths (cm rounded down) Abundance
T1
Agonus cataphractus 13 6 2
Callionymus lyra 13 7 5 3
Limanda limanda 17 6 5 7 6 7 7 8 7 7 8 8 8 8 14
Microstomus kitt 16 11 2
Pholis gunnelis 13 1
Pleuronectes platessa 11 9 11 9 10 11 13 9 8 10 12 9 9 10 9 8 9 9 10 9
9 9 8 8 8 8 7 5 6 7 7 6 7 8 8 8 36
Myoxocephalus scorpius 8 1
Pomatoschistus minutus 7 8 6 7 8 6 6 6 7 6 6 6 4 5 3 4 5 5 3 6
4 3 3 5 3 3 26
Syngnathus acus 12 9 11 11 12 5
Gadus morhua 10 10 10 9 9 15 6
T2
Agonus cataphractus 12 6 6 6 8 6 6 5 5 6 4 11
Limanda limanda 12 8 7 7 8 8 7 7 8 7 6 6 6 7 6 6 6 6 7 5
7 5 5 7 6 6 5 7 6 6 30
Pleuronectes platessa 14 11 11 11 9 10 8 9 10 9 8 8 9 9 9 9 8 9 8 8
8 8 9 9 8 10 8 9 8 8 7 7 8 8 7 7 8 7 7 6
7 6 6 5 6 5 5 6 6 6 7 8 8 8 7 8 8 8 7 7 60
Myoxocephalus scorpius 13 16 2
Syngnathus acus 12 13 10 10 12 11 12 12 12 13 9 11 11 9 12 10 16
Callionymus lyra 5 5 7 3
Pomatoschistus minutus 8 6 7 8 7 6 6 6 6 7 6 6 6 6 6 6 6 4 4 5
6 3 4 3 4 4 4 3 3 3 3 3 3 3 3 35
Pomatoschistus 3 3 3 3 3 3 3 3 8
T4
Agonus cataphractus 11 5 2
Limanda limanda 14 5 2
Pholis gunnellus 17 1
Pleuronectes platessa 8 7 8 8 12 5 6
Pomatoschistus minutus 6 7 6 5 4 4 5 5 3 3 6 6 6 7 8 5 6 5 5 8 20
Syngnathus acus 11 1
Callionymus lyra 8 8 2
Myoxocephalus scorpius 14 1
Zoarces viviparus 18 1

METHIL OFFSHORE WIND DEMONSTRATOR BENTHIC SUB-TIDAL ECOLOGY
SURVEY FINAL REPORT
Report No. 15/J/3/03/2590/1782 Page 128
Trawl Fish Species Measurements Total Lengths (cm rounded down) Abundance
Gobiidae 2 1
Trawl Shellfish Measurements Total Lengths (mm) Abundance
T1
Aequipecten opercularis 63 75 76 30 31 33 44 78 39 30 35 29 66 40 7 10 10 17
Buccinum undatum 95 25 2
Sepiola atlantica 17 1
Sepietta oweniana 29 30 2
T2
Buccinum undatum 108 1
Aequipecten opercularis 42 34 38 3
Pecten maximus 123 1
Sepietta oweniana 27 1
T4
Buccinum undatum 118 10 2
Cancer pagurus (female) 29 1
Aequipecten opercularis
70 43 48 33 29 33 34 37 31 49 30 47 33 35 40 45 41 36 69 38
91 35 32 39 39 51 36 43 47 41 45 55 47 37 40 50 45 44 33 50 61
36 34 42 39 46 50 41 45 40 38 30 34 45 16 38 17 32 38 35 30
38 32 41 37 33 32 30 36 38 34 32 33 35 46 33 35 35 37 35 35
40 36 35 31 42 31 14 15 37 15 17
Eledone cirrhosa 13 1

METHIL OFFSHORE WIND DEMONSTRATOR BENTHIC SUB-TIDAL ECOLOGY
SURVEY FINAL REPORT
Report No. 15/J/3/03/2590/1782 Page 129
L. APPENDIX L PSD CERTIFICATE OF ANALYSIS

FUGRO EMU LIMITEDCERTIFICATE OF ANALYSIS
Further information on methods of analysis may be obtained from the above address
Opinions and interpretations expressed herein are outside the scope of UKAS accreditation
*Indicates determinand not included in UKAS accreditation
Test results reported relate only to those items tested
Subindicates subcontracted test
A UKASTESTING
LABORATORY
Fugro EMU Limited. Incorporated in England No. 3469947. Reg. Office: Fugro House, Hithercroft Road, Wallingford, Oxfordshire, OX10 9RB
EP/14/4610 T01_Issue 3 Page 1 of 5
Certificate Number: EP/14/4610 Fugro EMU Job Number: J/3/08/2590
Job Reference: Methil Benthic Survey
Prepared For Prepared By
2B-Energy James Hutchinson
Fugro EMU Limited
Trafalgar Wharf (Unit 16)
Hamilton Road
Portchester
Portsmouth
PO6 4PX
United Kingdom
Phone: +44 (0) 2392 205500
Email: [email protected]
Web: www.fugroemu.com
Sampling Undertaken By: Fugro EMU Sampling Date: 11/10/2014 – 12/10/2014
Date of Receipt: 15/10/2014 Date of Analysis: 05/12/2014 – 18/12/2014
Sample Matrix: Marine Sediments
Method Reference:
Particle Size Distribution by Dry Sieving – Fugro EMU MET/01 based on BS1377: 1990:
Parts 1 – 2.
*Particle Size Distribution by Laser Diffraction – Fugro EMU MET/50 based on BS ISO
13320: 2009.
*Organic Content by Loss on Ignition @ 440°C for 4 hours – Fugro EMU MET/01 based on
clause 4 of BS1377: Part 3: 1990.
Test Results: Refer to pages 2-5 of 5
Laboratory Comments:Deviating Codes:
None
Authorised Signature:
Name: James Hutchinson
Position: Sediment Laboratory Manager
Issue Date: 18/12/2014

FUGRO EMU LIMITED
CERTIFICATE OF ANALYSIS
Test Results: Particle Size Distribution by Dry Sieving (63000 - < 63 µm) @ 1 Phi Intervals
Fugro EMU Job Number: J/3/08/2590
Job Reference: Methil Benthic Survey
SAMPLE ID: 5 6 12 18 19
LAB ID: 13210 13211 13217 13223 13224
Sieve Aperture [µm] Fractional [%] Fractional [%] Fractional [%] Fractional [%] Fractional [%]
63000 0.00 0.00 0.00 0.00 0.00
31500 0.00 31.66 31.20 0.00 0.00
16000 0.00 35.76 25.21 0.00 14.38
8000 0.88 10.17 2.09 0.00 12.30
4000 3.88 3.38 2.80 0.27 6.93
2000 2.20 1.10 2.60 0.34 3.12
1000 1.99 0.96 2.47 0.24 2.72
500 2.86 1.42 3.09 0.59 4.57
250 18.42 3.44 13.21 2.61 15.14
125 53.98 8.91 13.56 68.03 28.82
63 11.08 1.29 1.92 24.07 9.51
< 63 4.72 1.90 1.85 3.85 2.51
TOTAL: 100.00 100.00 100.00 100.00 100.00
EP/14/4610 S34_Issue 7 Page 2 of 5

FUGRO EMU LIMITED
CERTIFICATE OF ANALYSIS
Test Results: Particle Size Distribution by Dry Sieving (63000 - 63 µm) and Laser Diffraction (< 63 - < 0.49 µm) @ 1 Phi Intervals
Fugro EMU Job Number: J/3/08/2590
Job Reference: Methil Benthic Survey
SAMPLE ID: 1 4 7 8 9 10 11 13 14
LAB ID: 13206 13209 13212 13213 13214 13215 13216 13218 13219
Aperture [µm] Fractional [%] Fractional [%] Fractional [%] Fractional [%] Fractional [%] Fractional [%] Fractional [%] Fractional [%] Fractional [%]
63000 0.00 0.00 0.00 0.00 0.00 0.00 0.00 0.00 0.00
31500 0.00 0.00 0.00 0.00 0.00 0.00 0.00 0.00 0.00
16000 0.00 9.98 0.00 0.00 0.00 0.00 0.00 0.00 0.00
8000 1.29 0.00 1.20 0.00 0.00 0.00 0.00 0.00 0.00
4000 0.42 0.19 1.45 0.40 1.36 0.43 0.00 0.57 0.98
2000 0.42 0.53 1.68 0.46 0.21 0.44 0.22 0.83 0.19
1000 0.55 0.78 0.99 0.32 0.17 0.53 0.35 0.88 0.51
500 1.42 1.47 2.38 0.35 0.10 1.29 0.85 2.16 1.34
250 5.38 8.33 7.63 1.41 0.44 11.84 15.99 7.77 3.19
125 18.08 50.18 21.60 3.57 2.33 59.38 56.91 48.63 23.30
63 42.93 19.73 37.19 47.00 27.85 20.57 16.06 25.54 39.83
31.25 8.15 1.52 6.07 10.79 25.86 1.05 1.59 2.78 8.98
15.63 7.60 2.11 6.73 11.32 16.57 1.27 2.46 3.42 7.87
7.81 5.86 2.10 5.59 10.11 10.25 1.29 2.43 3.18 6.00
3.91 4.19 1.65 3.99 7.58 7.55 1.02 1.75 2.31 4.18
1.95 2.20 0.89 2.10 4.02 4.16 0.54 0.86 1.17 2.16
0.98 0.91 0.35 0.86 1.63 1.89 0.22 0.32 0.46 0.89
0.49 0.55 0.20 0.50 0.95 1.16 0.13 0.19 0.27 0.54
< 0.49 0.05 0.01 0.04 0.08 0.10 0.01 0.01 0.02 0.04
TOTAL: 100.00 100.00 100.00 100.00 100.00 100.00 100.00 100.00 100.00
EP/14/4610 S33_Issue 7 Page 3 of 5

FUGRO EMU LIMITED
CERTIFICATE OF ANALYSIS
Test Results:
Fugro EMU Job Number:
Job Reference:
SAMPLE ID:
LAB ID:
Aperture [µm]
63000
31500
16000
8000
4000
2000
1000
500
250
125
63
31.25
15.63
7.81
3.91
1.95
0.98
0.49
< 0.49
TOTAL:
Particle Size Distribution by Dry Sieving (63000 - 63 µm) and Laser Diffraction (< 63 - < 0.49 µm) @ 1 Phi Intervals
J/3/08/2590
Methil Benthic Survey
15 16 17
13220 13221 13222
Fractional [%] Fractional [%] Fractional [%]
0.00 0.00 0.00
0.00 0.00 0.00
0.00 0.75 0.00
0.00 1.27 0.24
3.79 3.31 0.13
15.12 4.57 0.42
20.95 2.75 0.46
14.98 2.57 1.20
19.07 10.46 9.80
7.85 47.07 67.83
2.58 18.01 14.74
3.00 2.26 0.98
3.90 2.39 1.13
3.48 1.95 1.21
2.61 1.41 0.97
1.55 0.74 0.53
0.71 0.30 0.23
0.39 0.18 0.13
0.03 0.01 0.01
100.00 100.00 100.00
EP/14/4610 S33_Issue 7 Page 4 of 5

FUGRO EMU LIMITED
CERTIFICATE OF ANALYSIS
Test Results: Organic Content by Loss on Ignition @ 440°C for 4 hours
Fugro EMU Job Number: J/3/08/2590
Job Reference: Methil Benthic Survey
Sample ID Lab ID% Organic Content
[<2mm]
5 13210 2.52
EP/14/4610 S11_Issue 7 Page 5 of 5

METHIL OFFSHORE WIND DEMONSTRATOR BENTHIC SUB-TIDAL ECOLOGY
SURVEY FINAL REPORT
Report No. 15/J/3/03/2590/1782 Page 131
M. APPENDIX M ASSESSMENT OF RESEMBLANCE OF OBSERVED REEF
FEATURES TO ANNEX I REEF CRITERIA

METHIL OFFSHORE WIND DEMONSTRATOR BENTHIC SUB-TIDAL ECOLOGY
SURVEY FINAL REPORT
Report No. 15/J/3/03/2590/1782 Page 132
Site Number
Geogenic Classification
Substrate Description and Associated Species
Biotope and Representative Images % cobbles and /
or boulders / bedrock
Elevation %
Epibiota Cover
Overall Reef Classification
2
<25°m2 cobbles
and/or
boulders/bedrock
64 mm-
5 m
Boulders
not more
than 1.5 to
2 m high at
the most.
>80% of
species
present
composed
of
epifaunal
species
Not a reef
Substrate: Large boulders covered with
encrusting and mobile epifauna overlaying
slightly shelly gravelly, pebbly, cobbly fine
sand. Typical species:
Echinus esculentus Asterias rubens
Ophiothrix fragilis? Alcyonium digitatum
Spirobranchus
Corallinaceae
CR.MCR.EcCr Echinoderms and crustose communities
3
40-95%
50% cobbles
and/or
boulders/bedrock
suggested
64 mm-
5 m
Boulders
not more
than 1.5 to
2 m high at
the most.
>80% of
species
present
composed
of
epifaunal
species
Medium
Substrate: Large boulders and bedrock
covered with encrusting and mobile epifauna and silt flocculation, interspersed
with pebbles, cobbles and occasional sand patches.
Typical species: Echinus esculentus Alcyonium digitatum
Asterias rubens Spirobranchus
Gobiidae LAMINARIALES Cancer pagurus Necora puber Liocarcinus
Callionymidae
CR.MCR.EcCr Echinoderms and crustose communities

METHIL OFFSHORE WIND DEMONSTRATOR BENTHIC SUB-TIDAL ECOLOGY
SURVEY FINAL REPORT
Report No. 15/J/3/03/2590/1782 Page 133
Site Number
Geogenic Classification
Substrate Description and Associated Species
Biotope and Representative Images % cobbles and /
or boulders / bedrock
Elevation %
Epibiota Cover
Overall Reef Classification
6
40-95%
50% cobbles
and/or boulders
suggested
64 mm-
5 m
Boulders
not more
than 1.5 m
high at the
most.
>80% of
species
present
composed
of
epifaunal
species
Medium
Substrate: Most detail obscured by
Ophiothrix. Patches of slightly shelly rippled sand with patches of boulders and cobbles. Where there is a patch of clear
shelly sand burrows are visible.
Typical species: Echinus esculentus
Corallinaceae Asterias rubens
ACTINIARIA PISCES
DECAPODA Ophiothrix fragilis
Ophiura Ophiura albida
SS.SMx.CMx.OphMx
Ophiothrix fragilis and/or Ophiocomina nigra brittlestar beds on sublittoral mixed sediment

METHIL OFFSHORE WIND DEMONSTRATOR BENTHIC SUB-TIDAL ECOLOGY
SURVEY FINAL REPORT
Report No. 15/J/3/03/2590/1782 Page 134
Site Number
Geogenic Classification
Substrate Description and Associated Species
Biotope and Representative Images % cobbles and /
or boulders / bedrock
Elevation %
Epibiota Cover
Overall Reef Classification
15
10-40%
30% bedrock
suggested
64 mm-
5 m
Boulders
not more
than 1 m
high at the
most.
>80% of
species
present
composed
of
epifaunal
species
Low
Substrate: Slightly shelly silty sand with
visible burrows. Bedrock of mixed composition emerging from the sediment and forming flat ledges in places. Other areas of dropped edges appearing to be sand/mudstone, with a thick covering of shelly silty sand in some places. Some coarser sediment within the recesses.
Typical species:
Ophiura Asterias rubens
Gobiidae Nemertesia
Alcyonium digitatum
Corallinaceae Cancer pagurus
Echinus esculentus HYDROZOA/BRYOZOA turf
PLEURONECTIFORMES
CR.HCR.XFa
Mixed faunal turf communities

METHIL OFFSHORE WIND DEMONSTRATOR BENTHIC SUB-TIDAL ECOLOGY
SURVEY FINAL REPORT
Report No. 15/J/3/03/2590/1782 Page 135
Site Number
Geogenic Classification
Substrate Description and Associated Species
Biotope and Representative Images % cobbles and /
or boulders / bedrock
Elevation %
Epibiota Cover
Overall Reef Classification
17
10-40%
40% cobbles
and/or
boulders/bedrock
suggested
64 mm-
5 m
Boulders
not more
than 1 m
high at the
most.
>80% of
species
present
composed
of
epifaunal
species
Low
Substrate: Slightly pebbly gravelly shelly
sand with cobbles and boulders. Areas of mud/sand stone ledging, forming shallow dropped steps in some areas, and flat topped exposures in others. Relatively large holes bored in the surface. The compacted sediment areas form a mosaic with the bedrock and boulders. Patches of rippled sand fill the recesses between the various hard substrata. A thin sediment covering evident across much of the area. Large holes bored into the mud/sand stone, and small holes visible within the softer sediment. Length of rope or cable visible and possible tyre.
Typical species: Asterias rubens
Echinus esculentus Corallinaceae
Alcyonium digitatum Ophiura
Ophiothrix fragilis Spirobranchus
Liocarcinus
Gobiidae
CR.MCR.EcCr
And SS.SSA.CMuSa
Echinoderms and crustose communities

Project Code: MOWT10
Date of report: March 2010
Client: Arcus Renewable Energy Consulting Ltd, on behalf of 2-B Energy
METHIL WIND TURBINE
DEMONSTRATION PROJECT
Fife Energy Park, Methil, Fife
John McCarthy
BA(Hons) MPhil AIFA

Client
National Grid Reference
Address
Parish
Council
Planning Application Ref No
NMRS No
Oasis No
SMR No
HB/SAM No
Listing Category
Project Manager
Text
Illustrations
Typesetting
Fieldwork
Specialists
Schedule
Fieldwork
Report
RENEWABLE ENERGY CONSULTANTSING LTD, ON BEHALF OF ARUP SCOTLAND
LTD 2-B ENERGY
NT 368 984 (CENTRE)
FIFE ENERGY PARK, METHIL, FIFE
WEMYSS
FIFE
N/A
NT39NE 14
N/A
N/A
N/A
N/A
MARK ROBERTS
JOHN MCCARTHY, EIA SPECIALIST
JOHN MCCARTHY, EIA SPECIALIST
THOMAS SMALL, SENIOR ILLUSTRATOR
JOHN MCCARTHY, EIA SPECIALIST
N/A
09/02/2010
12/02/2010
PROJECT SUMMARY SHEET
Signed off by:
Mark Roberts BA(Hons) MIFA, Project Manager
Date:

CONTENTS
1 INTRODUCTION 1
2 SITE DESCRIPTION 1
3 AIMS 1
4 METHODS 1
5 RESULTS 2
5.1 Limitations of data 2
5.2 Historic background and identifi ed cultural heritage assets 2
5.3 Potential for unrecorded archaeological features 8
6 CONCLUSIONS 9
7 REFERENCES 9
7.1 Bibliography 9
7.2 Unpublished Sources 10
7.3 Cartographic Sources 10
7.4 Aerial Photographs 10
7.5 Monuments Records 10
APPENDICES 11
Appendix 1 11
Appendix 2 12

1
Methil Wind Turbine Demonstration Project
MOWT10
METHIL WIND TURBINE
DEMONSTRATION PROJECT
Fife Energy Park, Methil, Fife
by John McCarthy
This report presents the results of an archaeological desk-based assessment of the site of the site of a proposed wind turbine demonstration
project. It has looked at both the on and off -shore areas that may be aff ected by the proposed development.
Within the onshore area six cultural heritage assets have been identifi ed. Two of these are 19th century sites which have been
completely removed. The remaining four sites are 20th century industrial sites of limited interest. As most of the onshore area was in
the intertidal zone until the early 20th century or has been disturbed by mining activity, there is negligible potential for previously
unrecorded archaeological features to be present. Within the onshore study area (i.e. within 500m of the proposed application boundary)
there are no scheduled monuments and 46 listed buildings.
Within the off shore part of the proposed application boundary (2km from the onshore area) there are a total of 34 recorded maritime
losses. Of these only four have approximate co-ordinates derived from SeaZone data, the locations of the remainder are uncertain.
1 INTRODUCTION
This report presents the results of an archaeological
desk-based assessment of land at Methil, Fife. It has been
prepared for Arcus Consulting Ltd, acting on behalf of
2-B Energy who are proposing to build a wind turbine
demonstration site within the Fife Energy Park. The
development will will initially consist of one turbine, an
operations building and an anemometry mast or wind
station. The intial turbine will be located adjacent to
the shore near the operations building (Turbine A). A
subsequent phase will see the erection of a second further
off shore (Turbine B). Within fi ve years of operation,
Turbine A will be relocated to a site further off shore
(Turbine C). Turbines B and C will be subject to a
separate planning application. This report specifi cally
considers the onshore and off shore components of the
initial, Phase 1 application.
2 SITE DESCRIPTION
The proposed development site is 54ha in area and
is situated on the coast of the Firth of Forth, on the
western shore of Largo Bay. This area of the Scottish
coast is characterised by sandy bays interrupted by rocky
headlands (Robertson 1996, 1). The application area is
fl at and low-lying and lies between the towns of Methil
and Buckhaven, in an area of partially reclaimed semi-
derelict industrial land. Most of the site is empty but there
are some large warehouses in the northeast part. The
underlying geology of the site belongs to the Scottish
coal measures with overlying sand and gravel deposits.
3 AIMS
The desk-based assessment has been undertaken in order
to inform the design of the proposed development by
identifying any cultural heritage assets present within the
application area and by providing an indication of the
archaeological potential.
4 METHODS
The following data sources have been used in the
preparation of this report:
Databases of designated cultural heritage features •
maintained by Historic Scotland;
Records held by the National Monuments Record of •
Scotland (NMRS) including aerial photographs;
Records held by the local Historic Environment •
Record;
Maps held by National Library of Scotland;•
UK Hydrographic Offi ce/SeaZone data;•
Other readily available published sources.•
Data has been collected from the above sources for an
area extending 500m from the onshore application area
and up to 2km into the Firth of Forth. These are referred
to as the onshore and off shore study areas respectively.
The potential for cultural heritage assets within the
proposed development area has been discussed below in
terms of the onshore and off shore areas of the existing
landscape. The onshore area is defi ned as the area currently
above the high water mark and the off shore as that area

2
HEADLAND ARCHAEOLOGY (UK) LTD
MOWT10
currently below it. A small number of sites from the
NMRS database within the intertidal zone have not been
included in the assessment as they will not be aff ected in
any way by construction in the off shore area. (these sites are
all modern apart from two fi sh traps at Scoonie, over 3km
from Turbine A)
The site was visited on the 9th February 2010 to verify
the fi ndings of the desk-based element of the study, gather
information regarding current land use and identify any
factors that might aff ect the archaeological potential of the
development site.
5 RESULTS
5.1 Limitations of data
The extension of the shoreline in this area during the
extension of the Wellesley colliery in 1905 has obliterated
the original topography of the site and rendered
identifi cation of previously unrecorded sites highly
unlikely. The identifi cation of cultural heritage assets
must therefore rely entirely on cartographic or other
documentary evidence at this stage. There have been no
previous archaeological excavations in Buckhaven, Methil
or Leven. However, it is considered that these limitations
have not aff ected the reliability of the assessment.
The ability of this study to identify previously
unknown wrecks within the off shore area is limited by
the unavailability of marine geophysical and geotechnical
survey data at this point. Such data should be reviewed as
and when it becomes available – its absence restricts the
reliability of the assessment.
5.2 Historic background and identifi ed
cultural heritage assets
Onshore (Illus 2)
Prehistoric and Roman
There are two sites of prehistoric/Roman date within the
onshore part of the study area. These both lie within the
onshore study area.
A Bronze Age cist cemetery (HA15) was discovered
about 400m east of the application boundary in 1906
(presumably during the clearance of the village at
Buckhaven Links). The cemetery was located on the
summit of a small prominence known as ‘the Sussan Brae’
and has been completely removed. However the location
of this site is uncertain as it is recorded a second time at a
diff erent location under the NMRS entry for the White
Swan Hotel (HA19) a C(S) listed building dating to the
early 20th century. In this entry it is suggested that the
construction of the hotel led to the discovery of the
cemetery. This would place the cemetery 600m to the east
and almost immediately adjacent to the boundary of the
Fife Energy Park. The original sources
referring to the discovery of the cemetery
from The Reliquary and the Proceedings
of the Society of Antiquaries (1948-9,
242-3 and 1949-50, 226) only give the
location of these fi nds as the ‘Sussan Brae’.
As none of the maps consulted appear to
use this name it is diffi cult to be certain
exactly where the cemetery was.
A Roman coin (HA 16 Licinius I –
308-324AD) minted in Alexandria was
discovered in a garden around 500m
west of the application boundary some
time before 1960. Outwith the study
area a similar Roman coin (NT39NE
9) was found in1951 in the playground
of Buckhaven Primary School. The coin
was of Maximian, of AD 305, also minted
at Alexandria. The school is about 160m
to the west of the application boundary. It
is quite possible that this coin is a modern
loss, especially as it was recovered from a
school.
Medieval and Post-Medieval
No medieval or post-medieval assets
have been recorded within the
application boundary. However, there
N
Illus 1 The 1st edition Ordnance Survey 6 map of 1855 shows the extent of land reclamation within
the application boundary since 1855. The proposed construction areas are shown in red. and the
boundary of the Fife Energy Park in black.

!!
!!
!!
!
!
!
!
!
!
!
!
!
!
!
!
!
!
!
!
!
!
!
!
!
!
!
!
!
!
!
!
!
!
!
!
!
!
!
!
!
!
!
!
!
!
!
!
!
!
! !
!
!
!
!
!
!
!
!
!
!
!
!
!
!
!
!
!!
!
!
!
!
!
!
!
!!
!
!
!
!
!
!
!
!
!
!
!
!
!
!
!!
!
!
!
!
!
!
!
!
!
!
!
!!
!
!
!
!
!!
!!
!
!
!
!
!
!
!
!
!
!
!
!
!
!
!
!
!
!
!
!
!
!
!
!
!
!
!
!
!
!
!!
!
!
!
!
!
!
!
!
!
!
!
!!
!
�)
!A
!(
!(
!(
!(
!(
!(!(
!(
D
D
E
E
E
E
E
E
E
E
EEEEEEEEEEEE
EEEEEEEEEEEE
EEEEEEEEEEE E
E
E
7
9
8
5
4
3
2
6
1
13
26
25
23 2221
20
19
1817
16 15
1413
12
1110
A
336000
6980
00
Illus 2: Cultural heritage assets within the onshore study area
±
0 300Metres
Sites and Monuments Record information derived from Fife Council data dated 04/02/2010
Scheduled monument area information derived from Historic Scotland data dated 27/01/2010© Crown Copyright Historic Scotland
Listed Building data provided by Historic Scotland dated 27/01/2010 © Crown Copyright Historic Scotland
Seazone data (derived from UK Hydrographic Office)provided by Arcus Renewable Energy Consulting 28/01/2010
Methil Wind Turbine Demonstration Project
Reproduced using digital 1:25,000 data supplied by 2-B Energy with the permission of the Controller of HMSO. © Crown copyright.
Key
E B-Listed Building
E C(S)-Listed Building
Undesignated cultural heritage asset (polygon)
!( Undesignated cultural heritage asset (point)
D Approximate location of ship loss
!A Proposed turbine location
�) Wind station location
Proposed construction areas
Proposed cable routes
Application boundary
!!!
! ! !
! Onshore study area
Firth of Forth

!
!
!
!
!
!
!
!
!
!
!
!
!
!
!!
!
!
!
!!
!
!
!
!
!
!
!
!
!
!
!
!
!
!
!!
!
!
!
!
!
!
! !
! !
!
!
!
!
!
!
!
!
!
!
!
!
!
!
!!
!!
!
!
!
!
!
!
!
!
!
!
!
!
!
!
!
!
!
!
!
!
!
!
!
!!
!!
!!
!!
!
!
!
!
!
!
!
!
!
!
!
!
!
!
!
!
!
!
!
!
!
!
!
!
!
!
!
!
!
!
!
!
!
!
!
!
!
!
!
!
!
!
!
!
!!
!!!!!
!!
!
!
!
!
!
!
!
!
!
!
!
!
!
!
!
!
!!
!
!
!
!
!
!
!
!
!
!
!
!
!
!
!
!
!
!
! !!
!
!
!
!
!
!!
!
!
!
!
!
!!
!!
!
!
!
!
!
!
!!
!
!
!
!
!
!
!
!
!
!
!
!
!
!
!
!!
�)!A
!A
!A
D
D
DD
E
E
E
E
E
EE
E
EEEEEEEEEEEE
EEEEEEEEEEEEEEEEEEEEEEEE
EE 7
9
54
3
2
6
113
23 2221
20
19
1817
16 15
141312
11
10
2627
25
24
B
C
A
336000 338000 340000
6960
0069
8000
7000
00
Illus 3: Cultural heritage assets within the maritime study area
±
0 750Metres
Sites and Monuments Record information derived from Fife Council data dated 04/02/2010
Scheduled monument area information derived from Historic Scotland data dated 27/01/2010© Crown Copyright Historic Scotland
Listed Building data provided by Historic Scotland dated 27/01/2010 © Crown Copyright Historic Scotland
Seazone data (derived from UK Hydrographic Office)provided by Arcus Renewable Energy Consulting 28/01/2010
Methil Wind Turbine Demonstration Project
Reproduced using digital 1:25,000 data supplied by2-B Energy with the permission of the Controller of HMSO. © Crown copyright.
Key
E B-Listed Building
E C(S)-Listed Building
D Approximate location of ship loss
Areas of Regional Importance
!A Proposed turbine location
�) Wind station location
Proposed construction areas
Proposed cable routes
Application boundary
!!!
! ! !
! Onshore study area
!!!
! ! !
! Offshore study area

7
Methil Wind Turbine Demonstration Project
MOWT10
is extensive evidence of activity of these periods in the
study area.
The town of Methil (HA22) is known to have existed as
early as 1212, although it was originally further inland and
relocated to the coast sometime around the early eighteenth
century. Buckhaven (HA7) was later in date and was fi rst
mapped around 1600. From an early date the production of
salt, coal and fi sh were important to the two towns. These
industries grew and were supplemented in the eighteenth
and nineteenth centuries with net and rope manufacture
and baking. There are few records of medieval sites in the
immediate vicinity of the proposed development. Some
cropmark remains of rig and furrow cultivation (NT39NE
141) have been recorded outwith the onshore study area
670m west of the application boundary. These are likely to
represent medieval or post-medieval agricultural use of the
land in the area.
19th century (Illus 1)
There are three cultural heritage assets dating to the
19th century recorded within the application boundary.
These comprise a short-lived settlement (HA1), a colliery
(HA5) and a bathing house (HA 6). No surface trace of
these survives.
The proposed development lies within a stretch of
beach between the two settlements which was labelled as
Buckhaven Links on the 1st edition Ordnance Survey (1855).
Buckhaven Links (HA1) fi rst appears on Greenwood’s map
of 1828 but the only clear picture of the town is from the
1st edition of the Ordnance Survey of 1855, where a string
of approximately nine detached and semi-detached houses
appears in a row to the immediate west of the coast road. At
the southern end of this row a United Presbyterian church
occupies a large plot of land with an adjacent building
described as a manse to the south of this. Although there
are few cartographic or documentary references to the
settlement, its layout suggests a foundation not later than
the eighteenth or nineteenth century and it is likely that it
was laid out in a single event, possibly to serve as a fi shing
or mining settlement. A reference to a church and manse
built by the United Presbyterian Church in Buckhaven
in 1861 and 1868 respectively is likely to refer to these
buildings (Small 1904, 276).
The extent of development of Buckhaven (HA7),
Buckhaven Links (HA1) and Methil (HA22) at the time
of the 1st edition of the Ordnance Survey in 1855 is
shown on Figures 1 and 2. Also shown on the 1st edition
Ordnance Survey further north along the beach is a small
bathing house (HA6) to the immediate south of the coastal
path. By the time of the second edition of the Ordnance
Survey in 1895 Buckhaven Links had nearly twice as many
buildings as it had in 1855 although new construction
was largely confi ned within the existing footprint of
the town due to the subdivision and redevelopment of
garden plots. By this stage the manse building is labelled
as ‘Old Manse’, suggesting that it was no longer used for
its original purpose of providing accommodation to a
minister.
In the latter half of the 19th century the coal mining
industry in the wider area expanded enormously, with the
establishment of the Pirnie pit (c.1860), the Muiredge pit
(fi rst productive in 1864), the Rosie pit
(1872-75), and the Leven pits (1877-8).
This period also saw the establishment of
railways which served the collieries and
much of the population of Buckhaven
and Methil left the fi sheries to work in
the mines. Denbeath Colliery (HA5) was
built in 1872 to the immediate northeast
of Buckhaven Links and within the site
boundary. Around the same time railway
sidings were put in place to the colliery
and an adjacent creosote works.
20th century
There are three cultural heritage assets
dating to the 20th century within the
application boundary. These comprise a
bing (HA2), a 1970s oil rig construction
yard (HA3) and a brickworks (HA4).
No surface traces of either the bing or
the brickworks have been removed.
In 1905 the Wemyss Coal Company
bought the Denbeath colliery and cleared
away the entire settlement at Buckhaven
links and the creosote works. They
also closed the coastal road between
Buckhaven and Methil at the same time,
Illus 4 The 1948 Ordnance Survey map (1:25.000) shows railway sidings across the area now occupied by
the Fife Energy Park

8
HEADLAND ARCHAEOLOGY (UK) LTD
MOWT10
to make way for a third shaft and a Baum washery (for
cleaning coal). The former site of Buckhaven Links and
Denbeath Colliery was renamed as the Wellesley Colliery
and a number of railway sidings were built to transport the
coal to the washery and on to the harbour at Methil were
added (Illus 4). Methil rapidly developed into Scotland’s
largest coal port by 1913, exporting three million tons of
coal in 1923 (Smith 2001, 131 and 653). The Ordnance
Survey map of 1914 shows Buckhaven Links and the
creosote works entirely cleared with a massive expansion
of the colliery and a new planned town of Denbeath to the
immediate NW of the application boundary.
From some time shortly before this, coal spoil was being
dumped to the east of the application area. This began to
extend the shoreline in this area though initially the change
was slight. At the same time a large bing (HA2) began to
be created which would later be used to actively accelerate
this process of expansion.
The coast of Fife in this area preserves a large number
of cultural heritage assets relating to WWI and WWII
(Robertson 1996, 2). Within the immediate vicinity of the
onshore part of the application boundary there are several
such sites. The Buckhaven and Methil WWI monument
(HA20) unveiled in 1922 stands about 70m west of the
application boundary. A WW2 concrete built Extended
Defence Offi cers Post or XDO post (HA18) is situated
about 30m to the west of the application boundary, by a
road junction on the coast side of the road. The XDO post
has been buried with only the top visible above ground
and trees have been planted round it with the intention of
concealing the structure. The XDO post was the control
position for a submarine mine fi eld which was laid in the
approaches to Methil Docks.
Wellesley Colliery closed in 1964, as did most of the
other collieries in the area during the 1960s. For a period
around the 1960s the eastern edge of the application area
was used as a refuse tip expanding the shoreline further. At
some point between 1967 and 1984 most of the colliery
infrastructure was removed. The site of the colliery was then
developed as an industrial yard (HA3) for the construction
of oil rig structural elements beginning in 1972 (Smith
2001, 653) and has passed through various owners until its
closure in 2001. After its acquisition by Scottish Enterprise
some 300m of repairs to coastal defences at the site have been
completed. A comprehensive programme of earthworks
and site platforming have also been undertaken with the
addition of a series of embankments between the Park and
neighbouring residential properties and an extension of the
reclaimed area of approximately 28 hectares. Burntisland
Fabrications currently operates in buildings in the north-
eastern part of the site producing major fabrications for use
in off shore gas and oil installations.
Off shore (Illus 3)
All known maritime cultural heritage assets within
the off shore study area are wrecks. Of these only four
have had their sites of loss recorded with any accuracy.
These are summarised in Table 1 below and shown on
Illustration 3. These sites are recorded in the SeaZone
data which is derived from UK Hydrographic data.
Although these sites can be mapped their locations are
not precise and it is unknown whether there are any
surviving remains at these locations.
HA No Name Type Date of
build
Date of
loss
24 Cosmo Cabin Cruiser Unknown 1994
25 Number Four Steam Sand
Dredger
Unknown 1898
26 Karen Schooner 1920 1940
27 SS Ashgrove Twin-screw Vessel 1882 1912
Table 1Maritime losses recorded by the UK Hydrographic Offi ce
There are thirty-three further maritime losses recorded
in the NMRS database. However these have been poorly
located and are not mapped on the illustrations in this
report. Table 3 in the appendix summarises all known
maritime losses from the NMRS database.
5.3 Potential for unrecorded archaeological
features
Onshore
Although there are a number of prehistoric, Roman and
medieval sites in the vicinity of the proposed development
the potential for pre-modern sites to be present is
considered to be negligible. The greater part of the
onshore application area is depicted as a predominantly
rocky beach on the First Edition Ordnance Survey
map. In this context there is no potential for traces of
pre-19th century activity to survive. The northwest
part of the site, marked Buckhaven Links on the First
Edition map, may, from its name, be assumed to be part
of a dune system. Based on the heights marked on the
First Edition and sea-change curves (Shennan & Horton
2002) the dunes covered an area that is likely to have
been submerged or in the intertidal zone during the
prehistoric period. Land in the intertidal zone is likely to
see a limited range of human activity and consequently
the potential for prehistoric sites is limited; fi sh-traps
being the most common site type. The dunes could
potentially have masked substantial remains of later date.
However, there is no indication, such as place name
evidence, that this may be the case and the potential for
any such site to survive is negated by development of the
site in the early 20th century. It may be assumed that
the links area saw considerable ground preparation before
the construction of the railway sidings serving Wellesley
Colliery. Geotechnical reports for the application area
have shown thick deposits of made ground within parts
of the application area. These are up to 24m thick eastern
side of the application boundary and around 10-15m

9
Methil Wind Turbine Demonstration Project
MOWT10
thick towards the west of the application area (Scottish
Enterprise Fife 2005 and 2007). Sites created since the
process of land reclamation began, such as sites relating
to WWII in particular, are more likely to have survived
as they may have been built on top of this overburden
but extensive landscaping within the Fife Energy Park as
well as reinforcement of coastal defences is likely to have
destroyed any such sites. Those parts of the application
area not aff ected by the sidings have for the most part
been disturbed by later buildings, some of which still
stand. Again it is highly unlikely that substantial remains
survive undisturbed.
It is considered to be highly unlikely that there will be
any surviving cultural heritage assets within the onshore
part of the proposed development boundary.
Off shore
The potential for off shore cultural heritage assets can
be divided into two broad categories, those shoreline
elements related to sites originally created at inland or
coastal locations, mines and wrecking events.
Submerged archaeology and relict landscapes
The most signifi cant factor which must be taken into
consideration is the relative change in sea level which
has occurred during the period of human occupation of
Scotland. Changes in relative sea level since the end of the
Pleistocene appear to have been complex, with changes
in absolute sea level interacting with changes in land
level due to isostatic rebound. Sea level from around the
beginning of the period of human occupation has fallen
since the fi rst human colonisation of Scotland (Flemming
2004, 12) and in this area of Scotland the relative sea
level was up to 5m higher (Shennan and Horton 2002). It
is therefore probable that the old shoreline prior to land
reclamation was further west for most of the prehistoric
period and it is unlikely that prehistoric remains exist
even within the westernmost part of the site.
Minefi eld
The XDO post to the immediate west of the onshore
part of the Fife Energy Park was used as a control post
for the submarine mine fi eld laid in the approaches to
Methil Docks during WWII. Although this minefi eld
was removed after the war the recovery of an unexploded
mine by a fi shing vessel in 2006 (news.bbc.co.uk
Monday, 25 September 2006) shows that there may
still be remnants of this fi eld. It has not been possible to
establish the extents of the minefi eld in the course of the
current study.
Maritime losses
The topography and location of the Firth of Forth means
that it has been an important transport corridor since
the arrival of humans in Scotland. The coast in this area
would have been extensively used during human history
and the shelter provided by Largo Bay would have been
particularly attractive. A good example of this can be seen
Wemyss caves (Illus 3). This area includes a number of
archaeological sites from several periods of human history
in a dense concentration. A large variety of maritime
activities have taken place along this coast including
military operations, trading, mining and fi shing. Since
medieval times and possibly earlier the port of Methil has
been an important centre for trading and fi shing. The
fi nal resting places of most of the known maritime losses
in the off shore study areas have never been identifi ed.
Detailed records of maritime losses only began during
the 19th century and even this record is incomplete.
As stated above there is a low potential for remains
of off shore sites near the current shore line due to land
reclamation during the 20th century but this will have had
little impact on the potential for preservation of remains
further off shore. As the depth of the Firth increases with
distance from the shore, the action of the waves and
weather upon cultural heritage sites at the bottom of the
Firth decreases and the potential for preservation increases.
In some areas, submerged remains can often be buried in
sediments as part of localised coastal and fl uvial processes.
The construction of off shore turbine bases, wet storage
areas and the laying of submerged cables as well as the
anchoring of vessels involved in construction all have the
potential to directly impact upon unknown sites within the
off shore study area. In addition the disturbance of sediment
has the potential to indirectly damage such sites, either by
covering sites or uncovering those which were previously
covered, although under certain circumstances this can be
a positive eff ect.
It is considered that there is a low potential for unknown
cultural heritage assets within the vicinity of Turbine A.
Any cultural heritage assets would most likely comprise of
ship wrecks and related remains, within the off shore part
of the study area.
6 CONCLUSIONS
Although a number of sites of cultural heritage interest
have been identifi ed within the onshore part of the
application boundary, it is likely that subsequent
industrial operations have removed them entirely. Within
the off shore study area a large number of maritime losses
have been reported, and there are likely to have been
numerous unrecorded losses. Few of these sites have been
identifi ed on the bed of the Firth and there is a moderate
potential for sites within this area. It is recommended
that as and when marine geotechnical and geophysical
survey data becomes available these should be reviewed
in order to allow previously unrecorded maritime losses
to be identifi ed.

10
HEADLAND ARCHAEOLOGY (UK) LTD
MOWT10
7 REFERENCES
7.1 Bibliography
Fife Council 1989 Fife’s Early Archaeological heritage: A Guide
Glenrothes.
Flemming, NC 2004 The Scope of Strategic Environmental Assessment
of North Sea Area SEA5 in regard to prehistoric archaeological remains.
www.off shore-sea.org.uk
Groome, FH (ed.) 1885 ‘Methil’ Ordnance gazetteer of Scotland: a
survey of Scottish topography, statistical, biographical and historical.
Edinburgh 29
Groome, FH (ed.) 1885 ‘Buckhaven.’ Ordnance gazetteer of Scotland:
a survey of Scottish topography, statistical, biographical and historical.
Edinburgh pp. 197-8
NSA 1834-45 ‘Wemyss, County of Fife’ The New Statistical
Account of Scotland, Vol. 9, 390-403
Patrick, J 1907 ‘Long-Hidden Treasures on the East Coast of Fife’
The Reliquary and Illustrated Archaeologist Vol. XIII pp. 189-
193
Robertson, P 1996 Coastal Assessment Survey for Historic Scotland:
Fife - Kincardine to Fife Ness.
http://www.scapetrust.org/html/fi fe2_download.html
Accessed 29/01/2010
Shennan, I & Horton, B 2002 ‘Holocene land- and sea-level
changes in Great Britain’ Journal of Quaternary Science. Vol. 17
(5-6), 511-526.
Sinclair, J 1791-99 ‘Wemyss, County of Fife’ The Statistical Account
of Scotland. Vol. 16, 513-533
Small, R 1904 History of the congregations of the United Presbyterian
Church, from 1733 to 1900. Edinburgh
Smith, R 2001 The Making of Scotland. Edinburgh
Soc Antiq Scot 1948-9 ‘Donations to and Purchases for the
Museum’ Proceedings of the Society of Antiquaries of Scotland. Vol.
LXXXIII pp.242-3
Society of Antiquaries of Scotland 1949-50 ‘Corrigendum’ in
Proceedings of the Society of Antiquaries of Scotland. Vol. LXXXIII
p.226
7.2 Unpublished Sources
Scottish Enterprise Fife 2005 Kvaerner Fabrication Yard, Methil
Geo-Environmental Report.
Scottish Enterprise Fife 2007 Fife Energy park Phase 3 Geo-
Environmental Report.
7.3 Cartographic Sources
The following cartographic sources (listed in
chronological order) held by the National Library of
Scotland were consulted:Gordon, J 1642 Fyfe Shire
Blaeu, J 1654 Fifae Pars Orientalis, [vulgo] Amsterdam
Adair, J 1684 The East Part of Fife
Moll H, 1745 The Shires of Fife and Kinros London
Roy, W 1747-55 Military Survey of Scotland
Ainslie, J 1775 County of Fife London
Greenwood, C 1828 Map of the counties of Fife and Kinross London
Thomson, J 1827 Fife with Kinross Shire Edinburgh
Ordnance Survey 1855 1st Edition Fife Sheet 25 6.” (Surveyed
1854)
Ordnance Survey 1855 1st Edition Fife Sheet 33 6.” (Surveyed
1854)
Ordnance Survey 1895 2nd Edition Sheet XXVII.8 25.” (Surveyed
1893)
Ordnance Survey 1895 2nd Edition Sheet XXVII.12 25.” (Surveyed
1893)
Ordnance Survey 1914 Sheet XXVII.8 25.” (Surveyed 1913)
Ordnance Survey 1914 Sheet XXVII.12 25.” (Surveyed 1913)
Ordnance Survey 1938 Sheet XXVII.12 25.” (Surveyed 1938)
Ordnance Survey 1938 Sheet XXVII NE 6.” (Surveyed 1938)
Ordnance Survey 1952 NT3698 1:25,000. (Surveyed 1948)
Ordnance Survey 1967 NT3698 1:25,000. (Surveyed 1963)
Ordnance Survey 1967 NT3798 1:25,000. (Surveyed 1963)
7.4 Aerial Photographs
The vertical aerial photographs held by the NMRS and
examined in the course of the assessment are summarised
below.
Sortie Frames Date
106G/DY/009 60067 1944
58/6511 0061 1964
ASS/518/88 094 1988
Table 2Aerial Photos
7.5 Monuments Records
Data regarding designated assets was downloaded from
Historic Scotland’s website on 27/01/2010. © Historic
Scotland
NMRS data has been gathered by examination of
the following quarter sheets held in the NMRS Library,
Edinburgh, in conjunction with Pastmap. These were
examined on 5/02/2010.

11
Methil Wind Turbine Demonstration Project
MOWT10
APPENDICES
Appendix 1
Maritime losses recorded in the NMRS in the vicinity of the application boundary
NMRS No Name Type Period NGRE NGRN
NT39NE 8009 Unknown: Methil, Firth of Forth Craft 20th Century 337700 699400
NT39NE 8001 Unknown: Methil Breakwater, Firth of Forth Dredger 20th Century 337410 699100
NT39NE 8003 Thorgny: Buckhaven, Firth of Forth Barque 19th Century 336300 697900
NT39NE 8004 Antelope: Methil Harbour, Firth of Forth Steamship 19th Century 337500 699500
NT39NE 8005 Scio: Methil, Firth of Forth Brig 19th Century 337000 699000
NO30SE 8001 Surprise: Leven, Firth of Forth Paddle steamship 19th Century 338000 700000
NT39NE 8010 Jantje: Buckhaven, Firth of Forth Craft 19th Century 336000 697000
NT39NE 8011 Gripen: Methil, Firth of Forth Craft 19th Century 337500 699500
NT39NE 8012 Industry: Buckhaven, Firth of Forth Craft 19th Century 336000 697000
NT39NE 8013 Euphemia: Buckhaven, Firth of Forth Craft 19th Century 336000 697000
NT39NE 8015 Robert Anderson: Methil, Firth of Forth Schooner 19th Century 337000 699000
NT39NE 8016 Veritas: Methil, Firth of Forth Barque 19th Century 337000 699000
NT39NE 8017 Raleigh: Methil Pier, Firth of Forth Steamship 19th Century 337500 699100
NT39NE 8018 Anna: Buckhaven, Firth of Forth Brigantine 19th Century 336000 697000
NT39NE 8020 Myrtle: Buckhaven, Firth of Forth Lugger 19th Century 336000 697000
NT39NE 8021 Pilot Boat No 2: Buckhaven, Firth of Forth Cutter 19th Century 336000 697000
NT39NE 8022 Onward: Buckhaven, Firth of Forth Lugger 19th Century 336000 697000
NT39NE 8023 Pilot Boat No 2: Buckhaven, Firth of Forth Cutter 19th Century 336000 697000
NT39NE 8024 Thetis: Methil Roads, Firth of Forth Brig 19th Century 336000 698000
NT39NE 8025 Nornen: Methil, Firth of Forth Barque 20th Century 337000 699000
NT39NE 8026 Isafold: Methil Harbour, Firth of Forth Schooner 20th Century 337500 699500
NT39NE 8027 Kitty: Buckhaven, Firth of Forth Sloop 19th Century 336000 697000
NT39NE 8028 Alert: Methil Pier, Largo Bay, Firth of Forth Sloop 19th Century 337000 699000
NT39NE 8031 Dart: Methil, Firth of Forth Ketch 19th Century 337000 699000
NT39NE 8032 Achilles: Methil Harbour, Firth of Forth Galliot 19th Century 337500 699500
NO30SE 8003 Unknown: Leven, Firth of Forth Craft 19th Century 338000 700000
NT39NE 8033 Admiral: Methil, Firth of Forth Schooner 19th Century 337000 699000
NO30SE 8005 Sisters: Leven, Firth of Forth Craft 19th Century 338000 700000
NO30SE 8007 Catharina: Leven, Firth of Forth Schooner 19th Century 338000 700000
NT39NE 8034 Venskabet: Methil Harbour, Firth of Forth Sloop 19th Century 337500 699500

12
HEADLAND ARCHAEOLOGY (UK) LTD
MOWT10
Appendix 2
Concordance of cultural heritage assets
HA
No.
Name Type Description Status LB No NMRS
No
1 Buckhaven Links Village (19th
century)
Buckhaven Links fi rst appears on Greenwood’s map
of 1828 but the only clear picture of the town is from
the 1st edition of the Ordnance Survey of 1855, where
a string of approximately nine detached and semi-
detached houses appears in a row to the immediate
west of the coast road. At the southern end of this row
a United Presbyterian church occupies a larger plot
of land and there is a building described as a manse to
the south of this. Although there are few cartographic
or documentary references to the settlement, its layout
suggests a foundation not later than the eighteenth or
nineteenth century and it is likely that it was laid out in
a single event, possibly to serve as a fi shing or mining
settlement. A reference to a church and manse built by
the United Presbyterian Church in Buckhaven in 1861
and 1868 respectively is likely to refer to these buildings
(Small 1904, 276).
– – –
2 Coal Bing Coal Bing A coal bing derived from 20th century mining at
Dunbeath/Wellesley Colliery.
– – NT39NE 140
3 RGC Construction
Yard
Construction Yard A late 20th century construction yard. – – NT39NE 14
4 Wemyss Brickworks Brickworks A brickworks dating to the late 19th/early 20th century – – NT39NE 54
5 Denbeath/
Wellesley Colliery
Colliery Denbeath Colliery was built in 1872 to the immediate
NE of Buckhaven Links and within the site boundary.
In 1905 the Wemyss Coal Company bought the colliery
and expanded it over the cleared sites of Buckhaven
Links and the creosote works. They also closed the
coastal road between Buckhaven and Methil at the
same time, to make way for a third shaft and a Baum
washery (for cleaning coal). The site of Buckhaven Links
and Denbeath Colliery was renamed as the Wellesley
Colliery and a number of railway sidings were built to
transport the coal to the washery and on to the harbour
at Methil were added. Wellesley Colliery closed in 1964,
as did most of the other collieries in the area during the
1960’s.
– – NT39NE 59
6 Bathing House Bathing House A small bathing house or changing hut which appears
on the 1st edition of the Ordnance Survey.
– – –
7 Buckhaven Town For the purposes of this study all development within
the village of Buckhaven up to 1855 is considered as
one site with the exception of listed buildings which
are listed separately. Buckhaven was still a small fi shing
village by the time of the 1st edition Ordnance Survey
in 1855. The town was laid out in a linear strip along
the coast and ran up to the edge of what is now the Fife
Energy Park.
– – NT39NE 44, 52,
137, 138
8 Buckhaven
Community Centre
Community
Centre
A two-storey former Miners’ Welfare Institute built in
1925.
C (S)
Listed
Building
46070 NT39NE 80
9 St. Andrew’s
Theatre/Church
Church/Theatre Ecclesiastical building no longer in use as such.
Formerly St Andrew’s Church, home of the Buckhaven
Free Church congregation which formed in 1866. In
1870 the Episcopal Church at North Street, St Andrews
was purchased for the sum of £130, it was transported
to Buckhaven in Thomas Walker’s boat ‘The Sea King’,
and re-erected in 1872. In 1972 the congregation united
with nearby St David’s Parish Church (listed separately)
and St Michael’s, and the building closed until 1987
when it was converted and extended to a theatre.
B-Listed
Building
22711 NT39NE 40

13
Methil Wind Turbine Demonstration Project
MOWT10
HA
No.
Name Type Description Status LB No NMRS
No
10 Buckhaven Parish
Church
Church Ecclesiastical building in use as such. Formerly St
David’s Church. In 1972 the congregations of St
Andrews and St Michael’s Churches united with
St David’s to form the Buckhaven Parish Church.
Church interior “upgraded” during the 1980s under a
Community Programme scheme.
C (S)
Listed
Building
46068 NT39NE 77
11 Royal Bank
buildings
Bank A late 19th century two-storey building in use as a bank. C (S)
Listed
Building
46069 NT39NE 79
12 Denbeath Miner’s
Welfare Institute
Welfare Institute A two-storey building dating to 1924. In spite of
unsympathetic extensions, this building retains its
integrity and historic interest, now as a bowling pavilion
with green.
C (S)
Listed
Building
46072 NT39NE 96
13 Denbeath Parish
Church
Church and Hall The former Denbeath Parish Church is prominently
situated on a corner site in an area of Denbeath
developed by the Wemyss Coal Company.
C (S)
Listed
Building
50126 –
14 Randolph Wemyss
Memorial Hospital
Hospital Commissioned by Lady Eva Wemyss as a memorial to
her husband, the Randolph Wemyss Memorial Hospital
was opened on 28 August, 1909. Single storey and attic,
7-bay hospital in Scots Renaissance style.
C (S)
Listed
Building
22716 –
15 Denbeath Cist, Urns, Beaker A Bronze Age cist cemetery was found in 1906, on the
eastern top of a height known locally as ‘the Sussan
Brae’ now named Denbeath. The location of this site is
uncertain. See the entry for the White Swan Hotel and
the text above. Over a dozen cists were found, some
containing urns. Four urns, including portions of a
Beaker, are now in the National Museum of Antiquities
of Scotland. The site of the cemetery, located at NT
3613 9900 from the descripton above, is now part of a
new housing development area. No further fi nds have
been reported.
– – NT39NE 1
16 Denbeath Roman Coin A fairly worn bronze coin of Licinius I, minted at
Alexandria, which was found, perhaps before 1960, in a
Methil garden, was presented to Kirkcaldy Museum by
Inspector D T Donaldson, Fife Constabulary, Kirkcaldy.
The location shown is very approximate and it is likely
that the fi ndspot was actually outwith the study area.
– – NT39NE 2
17 1-51 Cowley Street Cottages A row of cottages erected for workers of Bowman &
Company owners of Denbeath Colliery. The cottages
were leased to the Wemyss Coal Company in 1905, after
which they provided accommodation for employees of
the Wemyss Private Railway.
C (S)
Listed
Building
46071 NT39NE 97-
120
18 Methil XDO Post XDO Post A WW2 concrete built Extended Defence Offi cers
Post (XDO post) is situated on the S side of Methil, by
a road junction on the coast (S) side of the road. The
XDO post has been buried with only the top visible
above ground and trees have been planted round it with
the intention of concealing the structure. The XDO
post was the control position for a submarine mine fi eld
which was laid in the approaches to Methil Docks.
– – NT39NE 15
19 The White Swan
Hotel
Hotel/Bronze Age
Cemetery
An early 20th century 2-storey 9-bay hotel. According
to the listed building report a Bronze Age cemetery was
discovered during the construction of the hotel in 1906.
However this would appear to be the same site recorded
separately as NT39NE 1. It is diffi cult to be certain
exactly where the cemetery was (see text above).
C (S)
Listed
Building
22713 NT39NE 7
20 Buckhaven and
Methil War
Memorial
War Memorial A World War I war memorial with a soldier on a plinth,
with World War II role-of-honour added. The statue was
unveiled in 1922.
C (S)
Listed
Building
46077 NT39NE 56
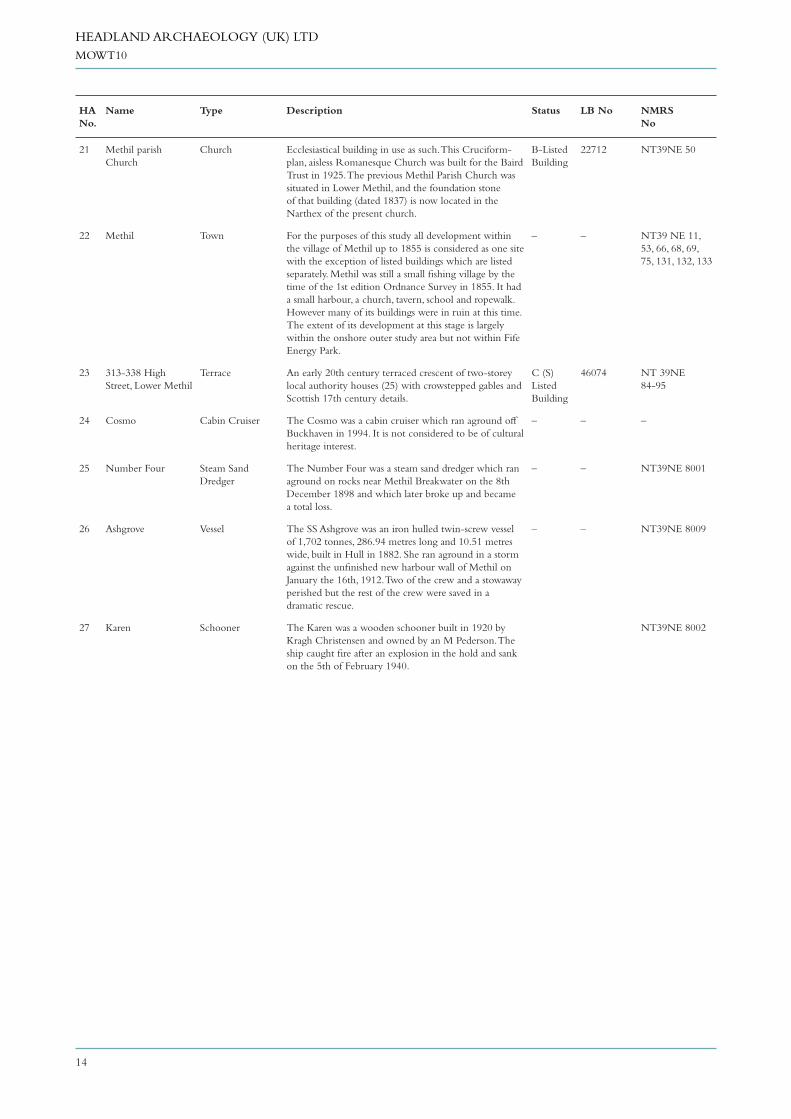
14
HEADLAND ARCHAEOLOGY (UK) LTD
MOWT10
HA
No.
Name Type Description Status LB No NMRS
No
21 Methil parish
Church
Church Ecclesiastical building in use as such. This Cruciform-
plan, aisless Romanesque Church was built for the Baird
Trust in 1925. The previous Methil Parish Church was
situated in Lower Methil, and the foundation stone
of that building (dated 1837) is now located in the
Narthex of the present church.
B-Listed
Building
22712 NT39NE 50
22 Methil Town For the purposes of this study all development within
the village of Methil up to 1855 is considered as one site
with the exception of listed buildings which are listed
separately. Methil was still a small fi shing village by the
time of the 1st edition Ordnance Survey in 1855. It had
a small harbour, a church, tavern, school and ropewalk.
However many of its buildings were in ruin at this time.
The extent of its development at this stage is largely
within the onshore outer study area but not within Fife
Energy Park.
– – NT39 NE 11,
53, 66, 68, 69,
75, 131, 132, 133
23 313-338 High
Street, Lower Methil
Terrace An early 20th century terraced crescent of two-storey
local authority houses (25) with crowstepped gables and
Scottish 17th century details.
C (S)
Listed
Building
46074 NT 39NE
84-95
24 Cosmo Cabin Cruiser The Cosmo was a cabin cruiser which ran aground off
Buckhaven in 1994. It is not considered to be of cultural
heritage interest.
– – –
25 Number Four Steam Sand
Dredger
The Number Four was a steam sand dredger which ran
aground on rocks near Methil Breakwater on the 8th
December 1898 and which later broke up and became
a total loss.
– – NT39NE 8001
26 Ashgrove Vessel The SS Ashgrove was an iron hulled twin-screw vessel
of 1,702 tonnes, 286.94 metres long and 10.51 metres
wide, built in Hull in 1882. She ran aground in a storm
against the unfi nished new harbour wall of Methil on
January the 16th, 1912. Two of the crew and a stowaway
perished but the rest of the crew were saved in a
dramatic rescue.
– – NT39NE 8009
27 Karen Schooner The Karen was a wooden schooner built in 1920 by
Kragh Christensen and owned by an M Pederson. The
ship caught fi re after an explosion in the hold and sank
on the 5th of February 1940.
NT39NE 8002

Forthwind Test Site Appendix A14.1 Environmental Statement Airborne Noise
A14.1 SURVEY RECORD SHEETS AND CALIBRATION CERTIFICATES
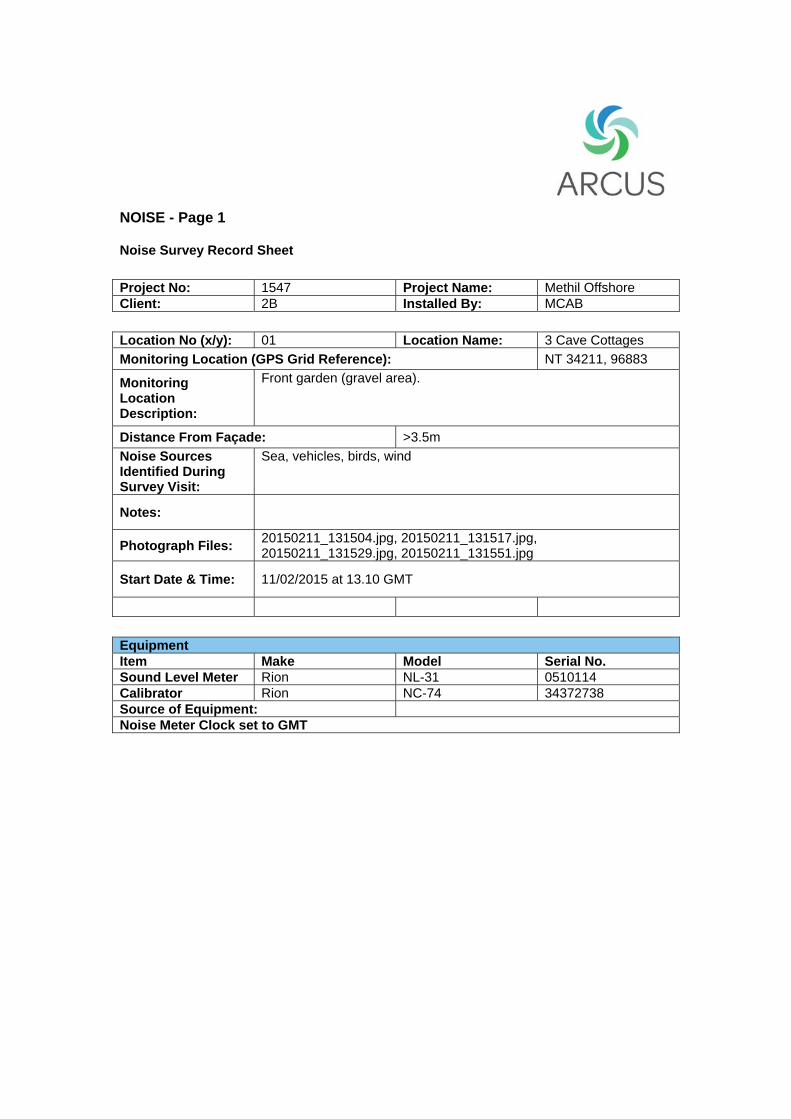
NOISE - Page 1 Noise Survey Record Sheet
Project No: 1547 Project Name: Methil Offshore Client: 2B Installed By: MCAB
Location No (x/y): 01 Location Name: 3 Cave Cottages Monitoring Location (GPS Grid Reference): NT 34211, 96883
Monitoring Location Description:
Front garden (gravel area).
Distance From Façade: >3.5m Noise Sources Identified During Survey Visit:
Sea, vehicles, birds, wind
Notes:
Photograph Files: 20150211_131504.jpg, 20150211_131517.jpg, 20150211_131529.jpg, 20150211_131551.jpg
Start Date & Time: 11/02/2015 at 13.10 GMT
Equipment Item Make Model Serial No. Sound Level Meter Rion NL-31 0510114 Calibrator Rion NC-74 34372738 Source of Equipment: Noise Meter Clock set to GMT

Photo(s) of Monitoring Location:

NOISE - Page 2 Noise Survey Record Sheet – Visit Record
Initial Name: MCAB Date & Time: 11/02/2015 at 13.10 GMT Noise Filename: 0101 Calibration Level (dB(A)): 94.0 Range: 20 - 100 Notes: Rain Gauge Installed
Final Check Name: MCAB Date & Time: 04/03/2015 at 12.10 GMT Calibration Level (dB(A)): 94.0 Level Before Calibration (dB(A)): 93.9 Notes: Rain Gauge Installed


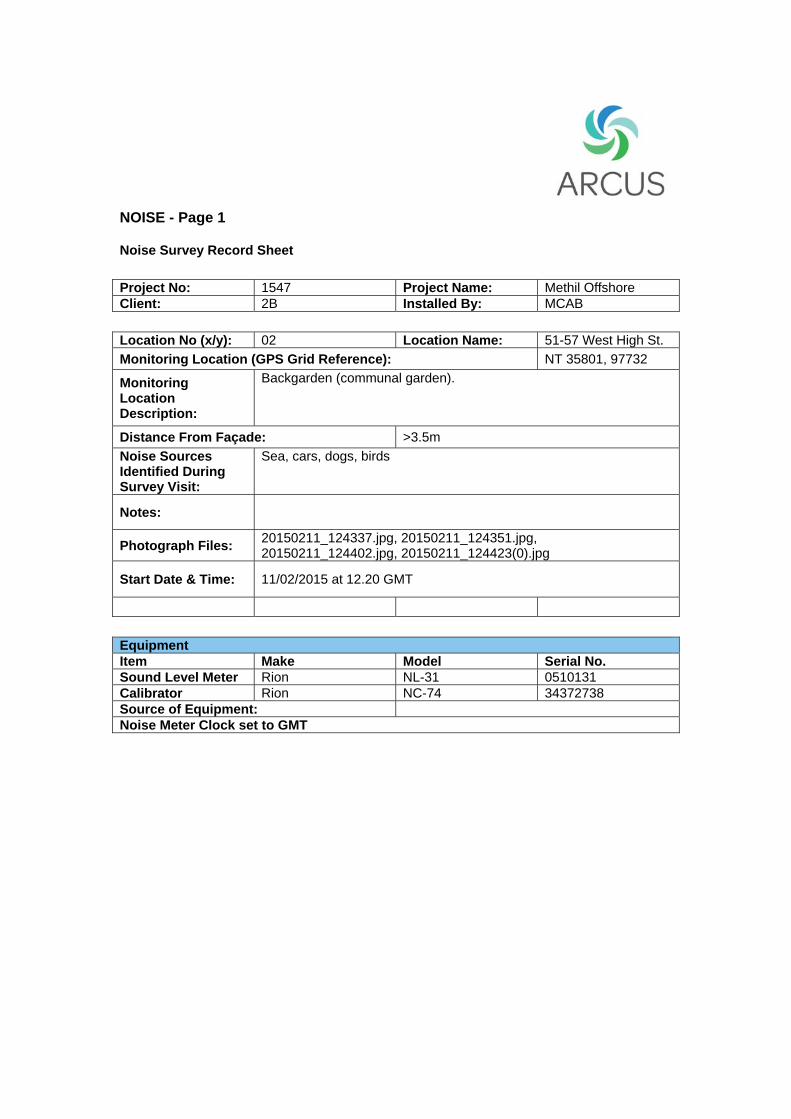
NOISE - Page 1 Noise Survey Record Sheet
Project No: 1547 Project Name: Methil Offshore Client: 2B Installed By: MCAB
Location No (x/y): 02 Location Name: 51-57 West High St. Monitoring Location (GPS Grid Reference): NT 35801, 97732
Monitoring Location Description:
Backgarden (communal garden).
Distance From Façade: >3.5m Noise Sources Identified During Survey Visit:
Sea, cars, dogs, birds
Notes:
Photograph Files: 20150211_124337.jpg, 20150211_124351.jpg, 20150211_124402.jpg, 20150211_124423(0).jpg
Start Date & Time: 11/02/2015 at 12.20 GMT
Equipment Item Make Model Serial No. Sound Level Meter Rion NL-31 0510131 Calibrator Rion NC-74 34372738 Source of Equipment: Noise Meter Clock set to GMT

Photo(s) of Monitoring Location:

NOISE - Page 2 Noise Survey Record Sheet – Visit Record
Initial Name: MCAB Date & Time: 11/02/2015 at 12.20 GMT Noise Filename: 0201 Calibration Level (dB(A)): 94.0 Range: 20 - 100 Notes: Rain Gauge Installed
Final Check Name: MCAB Date & Time: 04/03/2015 at 12.30 GMT Calibration Level (dB(A)): 94.0 Level Before Calibration (dB(A)): 94.1 Notes: Rain Gauge Removed


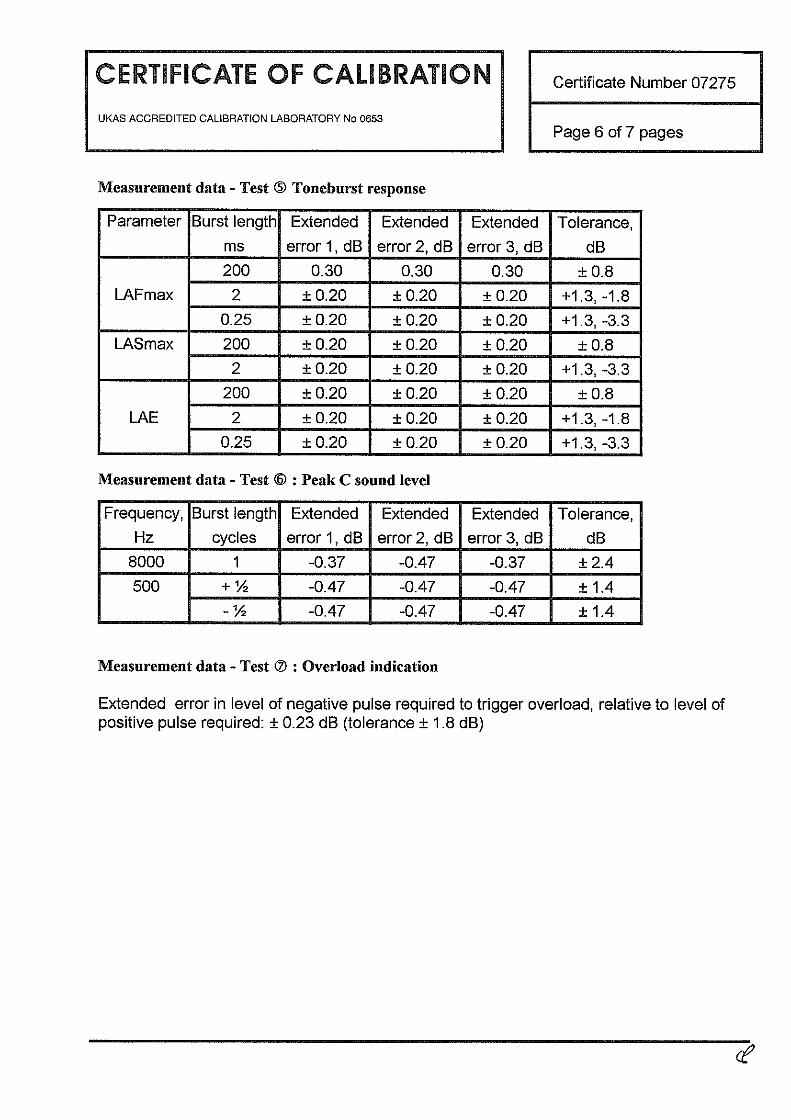
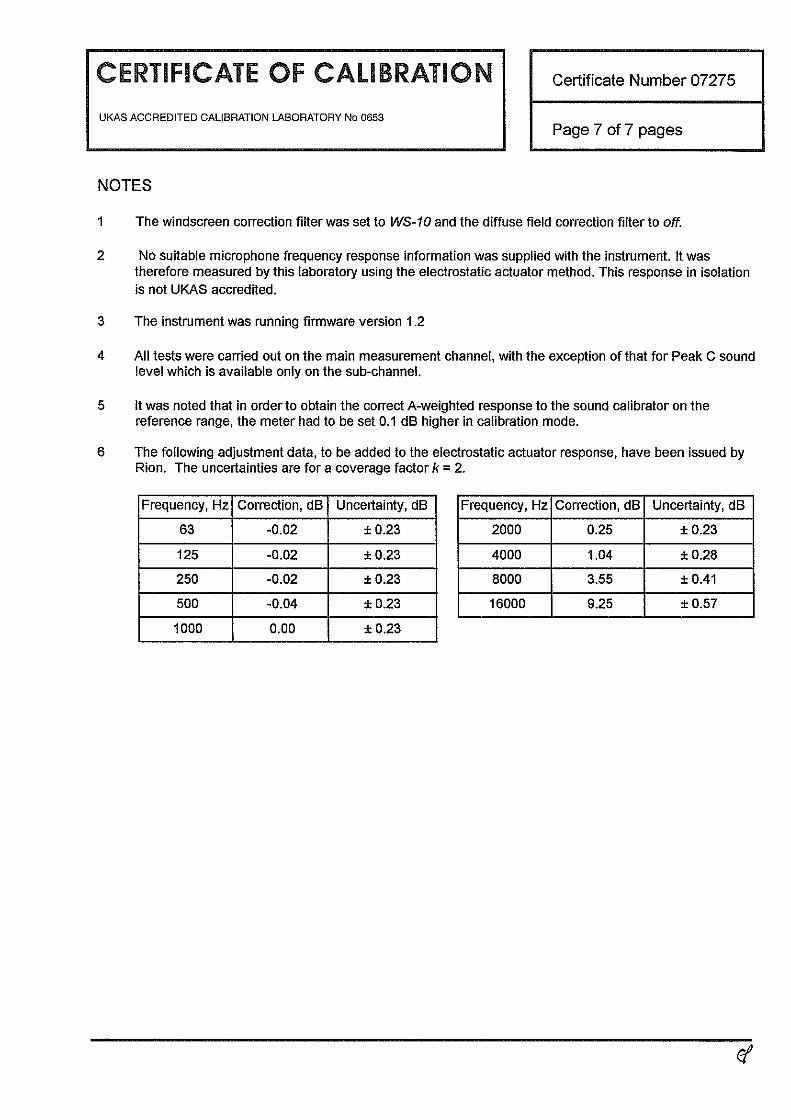


Forthwind Ltd Appendix A14.2 Environmental Statement Airborne Noise
A14.2 CHART DETAILING WIND SPEEDS AND DIRECTIONS DURING SURVEY PERIOD
0123456789
1011121314151617181920
0 45 90 135 180 225 270 315 360
Stan
dard
ised
10
m W
ind
Spee
d, m
s-1
Wind Direction at 72 m, Degrees Relative to North
Chart 14.5: Wind Speeds and Directions During Survey Period
Wind Data

Methil Offshore Wind Turbines Navigational Safety Risk Assessment 2-B Energy February 2015, Commercial in Confidence

© TÜV SÜD PMSS 2015
Methil Offshore Wind Turbines Navigational Safety Risk Assessment 2-B Energy February 2015, Commercial in Confidence
Document Control
Responsible for Job Title Name Date Signature
Content Marine Safety Consultant D CANTELLO 17-02-2015
Checked Director, QHSE Nick Chivers 18-02-2015
Approval Associate Alan Chivers 25/02/2015 Alan Chivers (ELEC)
Copyright: TÜV SÜD PMSS © Document Reference: "Document Reference" 73430866-001
Signatures in this approval box have checked this document in line with the requirements of QP16
This report has been prepared by TÜV SÜD PMSS with all reasonable skill and care, within the terms of the contract with the Client. The report contains information from sources and data which we believe to be reliable but we have not confirmed that reliability and make no representation as to their accuracy or completeness.
The report is confidential to the Client and TÜV SÜD PMSS accepts no responsibility to any third party to whom information in this report may be disclosed. No part of this document may be reproduced without the prior written approval of TÜV SÜD PMSS

Methil Offshore Wind Turbine Development 2-B Energy
1
© TÜV SÜD PMSS 2015
Table of Contents
References 4
Abbreviations 5
1. Introduction 6
1.1. Background 6 1.2. Aim 6 1.3. Scope 6
2. Risk Claim 7
2.1. Safety Requirements 7 2.2. Navigational Risk Claim 7 2.3. Supporting Reasoned Argument and Evidence 7
3. Description of the Marine Environment 8
3.1. Current Marine Environment 8 3.1.1. General 8 3.1.2. Methil Port 8 3.1.3. Anchorages 8 3.1.4. Pilot Boarding Position 8 3.1.5. Spoil Ground 8 3.1.6. Energy Park Fife 8 3.1.7. Burntisland Fabrication Ltd (BiFab) 11 3.1.8. Search and Rescue 11 3.1.9. Wrecks 11 3.1.10. Submarine Cables and Pipelines 11 3.1.11. Tidal Stream 11 3.1.12. Tidal Heights 11 3.1.13. Bathymetry 11
4. Description of the Proposed Installation and the Impact on the Marine Environment 12
4.1. Project Description 12 4.2. Site 12 4.3. Device Description 14 4.3.1. Turbines 14 4.3.2. Sub-Structures 15 4.3.3. Foundations 15 4.3.4. Inter Array Cabling 15 4.3.5. Export Cabling 15 4.4. Lifecycle 15 4.5. Construction and Installation Methodology 15 4.5.1. Mobilisation Port 15 4.5.2. Pre-Installation Activity 16 4.5.3. Sub-sea Cable Installation 16 4.5.4. Foundations 16 4.5.5. Sub-Structure - Scenario 2 Only 17 4.5.6. Turbine Installation 17

Methil Offshore Wind Turbine Development 2-B Energy
2
© TÜV SÜD PMSS 2015
4.5.7. Operations and Maintenance 17 4.5.8. Decommissioning 17
5. Marine Traffic Data 18
5.1. Sources of Data 18 5.1.1. Commercial Traffic 18 5.1.2. Recreational Traffic 18 5.1.3. Commercial Fishing Activity 18 5.2. Accident Data 18
6. Vessel Traffic Analysis 22
6.1. Current Traffic Patterns, Densities and Types 22 6.1.1. Traffic Density 22 6.1.2. Vessel Types 22 6.1.3. Traffic Using BiFab Quay 23 6.1.4. Anchorages 23 6.2. Effect on Future Traffic Patterns and Densities 24 6.2.1. Traffic Increase due to Development Activities 24 6.2.2. Effect of Development on Traffic Patterns 24
7. Risk Assessment 26
7.1. Hazard Identification, Risk Assessment and Controls 26 7.2. Hazard Identification Methodology 26 7.3. Construction and Installation Phases 26 7.3.1. Pre-Installation Activities 26 7.3.2. Collision with Installation Spread 26 7.3.3. Subsea Cable Installation 27 7.3.4. Use of Safety Zones 27 7.3.5. Safety/Guard Vessels 30 7.3.6. Emergency Response Cooperation Plan 30 7.3.7. Risk Assessment and Controls 30 7.4. Operational Phase 31 7.4.1. Collision with Turbine 31 7.4.2. WFSV Collision with other Vessels 31 7.4.3. Collision with Sub-Surface Gravity Base Structure 31 7.4.4. Grounding on Sub-Sea Cable Protection 32 7.4.5. Electromagnetic Interference 32 7.4.6. Effects on Communication, Radar and Positioning Systems 32 7.4.7. Emergency Response Cooperation Plan 32 7.5. Charting, Marking and Lighting 33 7.5.1. Charting 33 7.5.2. Safety Zone - Operational Phase 33 7.5.3. Marking and Lighting 34 7.5.4. AIS 34 7.6. Risk Assessment and Controls 34
8. Conclusions 36
9. Recommendations 36

Methil Offshore Wind Turbine Development 2-B Energy
3
© TÜV SÜD PMSS 2015
10. Statement of Limitations 37
Appendix 1. Hazard and Control Log 38
Appendix 2. – Stakeholder Responses 41
1. Scottish RYA 41
Record of Changes 42
Distribution List 42

Methil Offshore Wind Turbine Development 2-B Energy
4
© TÜV SÜD PMSS 2015
References 1 DECC (DTI) Guidance on the Assessment of the Impact of Offshore
Wind Farms Methodology for Assessing the Marine Navigational Safety Risks of Offshore Wind Farms
2 Maritime and Coastguard Agency’s (MCA) Marine General Notice MGN 371 (M+F)
Offshore Renewable Energy Installations (OREIs) – Guidance on UK Navigational Practice, Safety and Emergency Response Issues
3 Admiralty Sailing Directions NP 54 9th Edition 2013 North Sea(West) Pilot 4 The Admiralty Tidal Stream Atlas NP 252 North Sea, North Western Part 5 IHO Special Publication No 44 - 5th Edition 2008 IHO Standards for Hydrographic Surveys 6 RYA UK Atlas of Recreational Boating Recreational Cruising Routes, Sailing and Racing Areas around the UK
Coast; 2005 7 International Maritime Organisation (IMO) IRPC 1972 International Regulations for Preventing Collisions at Sea 1972 as
amended. The “ColRegs” 8 SI 2007 No 1948 Electricity (Offshore Generating Stations) (Safety Zones) (Application
Procedures and Control of Access) Regulations 2007 9
Report MCA MNA 53/10/366 QinetiQ/03/00297/1.12004 Results of the electromagnetic investigations and assessments of marine radar, communications and positioning systems undertaken at the North Hoyle wind farm by QinetiQ and the Maritime and Coastguard: 15/11/2004
10 BWEA /MCA/DTI/PLA Report Dated April 2007 Investigation of Technical and Operational Effects on Marine Radar Close to Kentish Flats Offshore Wind Farm : April 2007
11 Admiralty Chart 5011 – (INT 1) Edition 3 Symbols and Abbreviations Used on Admiralty Charts 12 IALA Recommendation O-139 The Marking of Man-Made Structures Edition 1 December 2008 13 IALA Recommendation E-108 Edition 2 December 2009 On The Surface Colours used as Visual Signals on Aids to Navigation 14 IALA Recommendation A-126 On the Use of the AIS in Marine Aids to Navigation Edition 1, December
2003

Methil Offshore Wind Turbine Development 2-B Energy
5
© TÜV SÜD PMSS 2015
Abbreviations AIS Automatic Identification System. ALARP As Low As Reasonably Practicable AtN Aid to Navigation AWB All Weather Lifeboat Cable (measure of distance)
1/10th of a nautical mile (approx 185 metres) and a standard measure of distance at sea
CGOC Coast Guard Operations Centre CHA Competent Harbour Authority. A statutory authority responsible for a defined area of water in and around a port or harbour Chart Datum By international agreement, Chart Datum is a level so low that the tide will not frequently fall below it. In the UK, this is normally approximately
the level of LAT ColRegs Collision Regulations DfT Department for Trade DTI Department of Trade and Industry dwt Deadweight tonnage EIA Environmental Impact Assessment ES Environmental Statement FMEA Failure Modes and Effects Analysis FPA Forth Ports Authority GT Gross Tonnage. The total volume of a vessel, expressed in units of 100 cubic feet (gross ton), with certain open structures, deckhouses, tanks,
etc., exempted. Also called Gross Registered Tonnage HAT Highest Astronomical Tide. HAT is the highest level which can be predicted to occur in average meteorological conditions and under any
combination of astronomical conditions. This level will not occur every year. HAT is not the extreme level as storm surges may cause higher levels to occur. Determined by inspection over a period of years
IALA International Association of Lighthouse Authorities IFG Inshore Fisheries Group ILB Inshore Lifeboat IMM International Maritime Mobile IMO International Maritime Organisation kn Knot kW Kilowatt LAT Lowest Astronomical Tide. LAT is the lowest level which can be predicted to occur in average meteorological conditions and under any
combination of astronomical conditions. This level will not occur every year. LAT is not the extreme level as storm surges may cause lower levels to occur. Determined by inspection over a period of years
LOA Length Overall (of a vessel) m Metre MBS Maritime Buoyage System MCA Maritime and Coastguard Agency MGN Marine General Notice MHWN Mean High Water Neaps. MHWS Mean High Water Springs. MLWN Mean Low Water Neaps. MRCC Maritime Rescue Coordination Centre MSL Mean Sea Level. The average level of the sea surface over a period (normally 18.6 years) MV Motor Vessel MW Megawatt NLB Northern Lighthouse Board NM Notice to mariners n mile (International) Nautical Mile (1,852 metres). NSRA Navigational Safety Risk Assessment NUC Not Under Command O&M Operations and Maintenance OREI Offshore Renewable Energy Installation PEXA Practice and Exercise Area PHA Preliminary Hazard Analysis PMSC Pot Marine Safety Code RNLI Royal National Lifeboat Institution RYA Royal Yachting Association ROV Remotely Operated Vehicle SCADA Supervisory, Control and Data Acquisition SFF Scottish Fishermen’s Federation SMS Safety Management System t Tonne (metric) TCE The Crown Estate Tidal Stream A distinction is drawn between tidal streams, which are astronomical in origin, and currents, which are independent of astronomical conditions
and which, in the waters around the British Isles, are mainly of meteorological origin TSS Traffic Separation Scheme VHF Very High Frequency VMS Vessel Monitoring System VTS Vessel Traffic Services WFSV Wind Farm Service Vessel

Methil Offshore Wind Turbine Development 2-B Energy
6
© TÜV SÜD PMSS 2015
1. Introduction 1.1. Background
2-B Energy has been granted a seabed lease off the port of Methil in the Firth of Forth in order to develop a demonstration/proving site for wind turbines. In order to be granted a licence for the proposed development, 2-B Energy is required to make an application for consent for the specific number and types of turbines to be sited in the leased area. This submission is intended to support the consent application for a development consisting of two turbines. As part of the consents process there is a requirement to undertake an assessment of the navigational safety issues arising from the establishment of an Offshore Renewable Energy Installation (OREI). Normally, for a wind farm, this assessment would be considered by the statutory consultees with whom Marine Scotland, as the consenting authority, would normally consult i.e. the Maritime and Coastguard Agency (MCA) and the Northern Lighthouse Board (NLB). In this case, given that the site lies within the Forth Ports Ltd statutory port area for which the latter has responsibility for assessing and managing the risks to navigation and shipping in accordance with the Port Marine Safety Code (PMSC), as well as, to an extent, the lighting and marking of navigational hazards, this submission is required to be submitted for approval to Forth Ports as the primary responsible body for agreement on the tolerability of risks presented by the proposed development. Such assessments of the risks are required to be conducted in accordance with the DTI/DECC publication “Marine Navigational Safety Risks of Offshore Wind Farms - Guidance on the Assessment of the Impact of Offshore Wind Farms” (Reference 1) and the Maritime and Coastguard Agency’s (MCA) Marine General Notice MGN 371(M+F) - Proposed Offshore Renewable Energy Installations (OREI) – Guidance on Navigational Safety Issues (Reference 2). In this case, given both the size of the development as a trial site involving the erection of just two turbines and the methodology, is required, in accordance with the guidance, to be proportionate to the nature and scale of the development and, therefore, employ appropriate tools and techniques for the assessment of the risks involved. The assessment will be taken into account in the preparation of the Environmental Impact Assessment (EIA) study report and the resulting Environmental Statement (ES).
1.2. Aim The aim of this report is to demonstrate that a suitable and sufficient assessment of the risks presented to mariners and the emergency services by the installation and operation of the proposed development has been undertaken. Where appropriate, this report proposes suitable control and risk mitigation measures to ensure that any remaining risks are either tolerable or can be made tolerable by the application of suitable, agreed controls. In support of the Navigational Safety Risk Assessment (NSRA), the following safety management activities were undertaken in compliance with DTi/BERR publication - Guidance on the Assessment of the Impact of Offshore Wind Farms and MGN 371 (M+F) Offshore Renewable Energy Installations (OREIs) – Guidance on UK Navigational Practice, Safety and Emergency Response Issues:
• Hazard Identification and Risk Assessment for device operations; • Development of a Hazard Log including a record of risk control measures.
1.3. Scope
The scope of the NSRA covers the risks to navigation presented by the siting of two wind turbines off the Port of Methil. This report presents the arguments and evidence which aim to demonstrate that, with the application of the controls and risk mitigation measures recommended in this report, the risks are tolerable and As Low As Reasonably Practicable (ALARP).

Methil Offshore Wind Turbine Development 2-B Energy
7
© TÜV SÜD PMSS 2015
2. Risk Claim 2.1. Safety Requirements
The principal Safety Requirements for the proposed development are as follows:
• All significant hazards associated with the installation, operation, maintenance and decommissioning of the turbines shall be identified and the risks assessed as tolerable and ALARP.
• The site will comply with MCA Marine Guidance Note MGN 371 (M+F): Offshore Renewable Energy
Installations (OREIs) - Guidance on UK Navigational Practice, Safety and Emergency Response Issues (Reference 2);
• The installation shall co-exist safely with other marine users with minimum increase to the baseline level
of navigational risk during construction, operation, maintenance and decommissioning. The devices should not cause or contribute to an unacceptable obstruction of, or danger to, navigation or marine emergency services;
• The risks presented by the array devices and their operation will be effectively managed by an
appropriate Safety Management System meeting the requirements of the MCA’s Guidance (Reference 2).
2.2. Navigational Risk Claim The navigational risks from the turbines to marine traffic transiting the area during the installation, operational and decommissioning phases are considered as “Tolerable with Monitoring”1
provided the risk mitigation measures recommended in this report are applied.
Risk controls necessary to achieve the acceptable level of risk for the array are identified in this report and are required to be implemented prior to installation and operation and will require to be checked periodically. The impact of the siting of the turbines will be monitored throughout their installation and operations.
2.3. Supporting Reasoned Argument and Evidence The supporting arguments for the assessment are made in the body of this report and were derived from qualitative analysis based on a number of sources of data including expert opinion (both written and oral) of the marine users of the area and quantitative data regarding vessel movements.
1 Risk Criticality expressions are those used in DTI DTi/BERR publication - Guidance on the Assessment of the Impact of Offshore Wind Farms (Reference 1) and are explained at Appendix 1.

Methil Offshore Wind Turbine Development 2-B Energy
8
© TÜV SÜD PMSS 2015
3. Description of the Marine EnvironmentThe following sources have been consulted:
• Admiralty Charts 741 and 734;• Admiralty Sailing Directions NP 54 – The North Sea (West) Pilot (Reference 3 );• The Admiralty Tidal Stream Atlas NP 252– North Sea, North Western Part (Reference 4);• Admiralty Tide Tables NP 201 – Vol 1 UK and Ireland (Reference 5;• RYA Coastal Atlas of Recreational Boating (Reference 6).• Admiralty Charts 741 and 734.
3.1. Current Marine Environment 3.1.1. General
Forth Ports PLC exercises jurisdiction over all the waters of the Firth of Forth including the area leased to 2-B Energy for the proposed development. The Forth ports handle about 5000 ship movements and over 48 million tonnes of cargo annually with the principle commodities being oil, petro-chemicals and liquefied gases which pass through the port of Grangemouth and the two marine terminals at Hound Point and Braefoot. The port of Grangemouth also handles considerable volumes of container traffic.
A Vessel Traffic Service (VTS) scheme, the Forth and Tay Navigation Service, with full radar and AIS surveillance, covering the whole of the Firth of Forth, is operated from Grangemouth. Vessels of 300GT and over and all vessels carrying dangerous or polluting cargos regardless of size are required to give notice of their arrival at the Firth of Forth area and all vessels of 50GTand over are subject to reporting requirements when in the Firth. Forth Ports PLC is also the Local Lighthouse Authority.
3.1.2. Methil Port
Methil Port is a small commercial port handling wood pulp and timber, aggregate and general bulk cargo. The harbour is administered by Forth Ports PLC. The port has the facilities to accommodate the repair, maintenance and supply of offshore drilling rigs and tankers. These take advantage of the deep, sheltered water of Largo Bay and the specialist services in Methil and its locality. The port can accommodate vessels up to 102m LOA, 14.5m beam, 5.5m draught and 3,000 dwt.
3.1.3. Anchorages Five anchorage berths numbered M1 through M5 are situated south east of Methil whilst nine anchor berths (K1 to K9) are off Kirkcaldy but are directly adjacent to the proposed development area. All these anchorages are allocated by Forth and Tay Navigation Service. The swinging circle of 750 metres radius around the anchor position shows the maximum allowed extent of the vessel position when at the full scope of its anchor or mooring chain and is indicated on the chart. There is also an anchorage for small vessels closer inshore which is indicated by appropriate symbology. (See Figure 1)
3.1.4. Pilot Boarding Position When entering Methil Port, vessels will embark a pilot at the position indicated on the chart approximately 1500m south of the dock entrance and 600m north east of the northernmost proposed turbine position. (See Figure 1)
3.1.5. Spoil Ground A spoil ground with an extant licence is sited some 1200m due west of the development area.
3.1.6. Energy Park Fife An offshore Energy Park area has been established immediately adjacent to the shore based Energy Park and is indicated on the charts accordingly as well as being marked by buoys. The chart note states that “Mariners should avoid entering this area unless involved in operations”. The area does not encompass the proposed 2-B Energy development area. In addition, a wind turbine as been erected just outside and to the south west of the offshore Energy Park area within 20m of the shore (See Figure 1). It constitutes no significant hazard to navigation.

Methil Offshore Wind Turbine Development 2-B Energy
9
© TÜV SÜD PMSS 2015

Methil Offshore Wind Turbine Development 2-B Energy
10
© TÜV SÜD PMSS 2015
Figure 1 2-B Energy – Methil Development Site - Overview

Methil Offshore Wind Turbine Development 2-B Energy
11
© TÜV SÜD PMSS 2015
3.1.7. Burntisland Fabrication Ltd (BiFab) BiFab are involved in construction of structures for offshore use with a large facility within the Energy Park Fife. Large structures of up to 1000 tonnes each are out-loaded from the quay side within their facility using barges and vessels. These vessels may take several such structures up to a total load of 8000te. Barges of up to 400m x 120m have - and will be – moored at the quay using offshore mooring spreads on a weekly basis during currently envisaged work. With a stated frequency of such operations being on a weekly basis there is the potential for conflicts of activities during the construction phase of the proposed development.
3.1.8. Search and Rescue The nearest Royal National Lifeboat Institution (RNLI) stations are at Anstruther (10 n miles), North Berwick (11.5 n miles) and Kinghorn (7.5n miles). Anstruther has a Mersey Class All Weather lifeboat (AWB) and an inshore craft whilst Kinghorn and North Berwick are both equipped with Inshore Lifeboats (ILB) only.
3.1.9. Wrecks There are no charted wrecks within 1 n mile of the development site. The closest wreck lies approximately 2 n miles to the south east where there are a group of four wrecks charted in the area of M2 anchorage.
3.1.10. Submarine Cables and Pipelines There is an outfall pipeline running from the shoreline at Buckhaven to an outlet (diffuser) approximately 750m to the northwest of the south westerly turbine (Turbine 1). The proposed export cable route lies approximately 1000m to the north east of this pipeline.
There is a subsea pipeline running across the Forth 3.5 n miles to the east of the proposed development. There is a corridor of approximately 1 n mile either side of the pipeline in which anchoring is prohibited.
3.1.11. Tidal Stream Tidal streams in the area are generally rectilinear and run parallel to the coast. Spring rates rarely exceed 1kn.
3.1.12. Tidal Heights Tidal height data extracted from the Admiralty Tide Tables (Reference 5). Chart Datum is 2.90m below Ordnance Datum (Newlyn) (i.e. – 2.90 ODN).
LAT MLWS MLWN MSL MHWN MHWS HAT Standard Port – (Leith) -0.1 +0.8 +2.0 +3.2 +4.4 +5.6 +6.3
Secondary Port Differences (Methil)
No Data -0.1 -0.1 No Data -0.1 -0.1 -0.1
Methil Port (Heights relative to Chart Datum)
-0.1 +0.7 +1.9 +4.3 +5.5 +6.2
Mean Range (Neaps) 2.4 metres
Mean Range (Springs) 4.8 metres
Table 1 Tidal Height Data - Methil
3.1.13. Bathymetry The chart source data for Admiralty Chart 741 Ed 4 Oct 2014 indicates that the proposed turbine site is situated in an area which was surveyed by Forth Ports PLC between 1979 and 1986 whilst the export cable route runs through waters surveyed in 1917 using lead-line. Hence, the development area is not currently surveyed to appropriate IHO standards (i.e. IHO Special Publication No 44 -5th Edition 2008 - IHO Standards for Hydrographic Surveys (Reference 5)) as required by MGN 371.

Methil Offshore Wind Turbine Development 2-B Energy
12
© TÜV SÜD PMSS 2015
4. Description of the Proposed Installation and the Impact on the MarineEnvironment
4.1. Project DescriptionThe proposal is for the construction and operation of up to two offshore wind turbines with associated infrastructureincluding foundations, scour protection, transformers, inter-array cables between the turbines, and an export cableconnecting the turbines to the onshore substation. An onshore control building and substation is also part of thedevelopment. Due to the uncertainties associated with offshore construction, it is not possible to define a detailedproject design at this point in the development process. Aspects of the development that cannot be determined atthis stage include:
• Model, dimensions and precise location of turbines;• Turbine foundation and substructure types;• Lengths and layouts of the inter array and export cables.
Due to the uncertainties associated with the built elements of the development, it is not possible to provide detailed construction techniques and vessel numbers at this stage.
However, to ensure that the submissions for consent are sufficiently robust and have taken account of the worst credible case risks arising as a result of the development, design parameters have been developed where flexibility in the final design and implementation is required. These parameters are collectively referred to as a ‘Rochdale Envelope’, which can be defined as a range of parameters within which the final Development must fall. The design parameters which constitute the Rochdale Envelope are described in this Section and are set out in Table 3.
The Rochdale Envelope for the Development broadly comprises two alternate scenarios. These are summarised below:
• Scenario 1 – 2 two bladed turbines of up to 182.1 m above Chart Datum (CD) to blade tip with a latticestructure, connected to each other and to an onshore substation and control building by subsea cables;
• Scenario 2 – 2 three bladed turbines of up to 196.1m above Chart Datum (CD) to blade tip with a tubulartower and jacket substructure, connected to each other and to an onshore substation and control buildingby subsea cables.
Table 3 provides detail on each of the elements of the development within the two development scenarios. The purpose of the development is to generate electricity from a renewable source, the wind, whilst also acting as the first offshore deployment of the 2B turbine to demonstrate and test the technology in the offshore environment. Scenario 1 is, therefore, the preferred option for the development although the option of Scenario 2 has been included to future proof the consent should the situation change regarding the 2B turbine technology and deployment options.
4.2. Site The development site is located off the northern shore of the Firth of Forth at Methil, Scotland and is approximately 1500m from the shoreline as defined by Mean High Water Springs (MHWS).
The development consists of the following:
• Two turbine envelope areas in which the turbines and sub-structures (if required) will be located. Turbinepositions are at Table 2. A 100 m micro-siting allowance from these centre points is required for the finalselection of turbine locations;
Table 2 Turbine Positions Turbine Lat/Long (Deg, Dec Mins) Lat/Long (Dec degrees) OSGB 36 Turbine 1 56° 09’.52N; 3° 00’.90W 56.15866; -3.014994 336964, 696677 Turbine 2 56 09.88N; 3 00.09W 56.164667, -3.001495 337812, 697333

Methil Offshore Wind Turbine Development 2-B Energy
13
© TÜV SÜD PMSS 2015
• Inter-array cable corridor of up to 902 m in length and 106 m wide, in which the cables which connect theturbines will be located;
• Export cable corridor of up to 1648 m in length and 147 m wide, which will contain the cable that transmitsthe electricity generated by the turbines to the onshore sub-station.
The Development Envelope is the area in which the Development may be located and does not reflect the actual footprint of the Development infrastructure. The physical footprint of the Development will be within the parameters detailed in Table 3.

Methil Offshore Wind Turbine Development 2-B Energy
14
© TÜV SÜD PMSS 2015
Table 3 Design Parameters
4.3. Device Description 4.3.1. Turbines
The turbine will comprise the following three main elements:
• Rotor – including the turbine blades and nose cone;• Hub – houses the electrical generator, gearbox, control mechanism and attaches to both the tower and
the rotor;• Tower – attaches to the seabed (or substructure in the case of the Scenario 2 Turbine) and hub and forms
the primary vertical element of the turbine.
The rotational speed of the blades will vary according to the wind speed and the gearing of the turbine, although will be within the speed detailed in Table 3.
A helipad will be located on the hub of each turbine to allow aerial access to the turbine, and a boat mooring and landing system will be located at sea level to allow access from the water.
The wind turbines in Scenario 1 will be the two bladed 2B Energy turbine, with an installed generating capacity of up to 6 MW per turbine. The turbine will consist of a tapering three legged tower, with the legs linked by a steel lattice structure. The legs of the turbine will attach directly to the seabed via the chosen foundation solution, with no requirement for a separate substructure on which the turbine would sit. One of the turbines may have an electrical transformer station incorporated into the tower to convert the electricity generated by the turbines into the correct voltage for export to the substation. This will be a box like structure up to 5 m tall and will result in the turbine in which it is located being 5 m taller than the turbine without this element. When operational, the hub will rotate to orientate the blades to face away from the direction of the prevailing wind, with the blades rotating in an anti-clockwise direction.
The wind turbines in Scenario 2 will be a three bladed wind turbine, with an installed generating capacity of up to 7 MW per turbine. The turbine will consist of a tapering steel tubular tower, which will attach to the substructure, with the hub being attached to the top of the tower. When operational, the hub will rotate to orientate the blades to face into the direction of the prevailing wind, with the blades rotating in a clockwise direction.

Methil Offshore Wind Turbine Development 2-B Energy
15
© TÜV SÜD PMSS 2015
4.3.2. Sub-Structures Scenario 1 does not require a separate sub-structure, with turbines being secured to the seabed via the selected foundation solution. Therefore, only Scenario 2 turbines will require a sub-structure which connects the turbine to the foundations and the latter secure the sub-structure to the seabed. Should a turbine which requires a sub-structure be selected for the Development, further studies will be undertaken as part of the detailed design process to determine the final selection and design of the sub-structure. This is likely, however, to be a tubular jacket structure with up to four legs braced by smaller tubular steel sections to form a frame.
Tubular jackets can be used with a range of foundation types, although in the case of the Development, would be secured to the seabed using either pin piles or gravity based foundations.
4.3.3. Foundations The two options are gravity based structures or drilled pin pile foundations. The foundations will secure either the turbine (scenario 1) or the sub-structure (scenario 2) to the seabed. Gravity base foundations are structures cast from concrete or steel that rely on the weight of the structure to provide stability. These foundations can be used with either a tubular jacket or turbines. The size of the gravity base is directly proportional to both the water depth at the point of installation and the weight of the structure to be mounted on top. It is anticipated that the bases will be hollow and extra weight (or ballast) would need to be contained within the structure in the form of rock, sand or water.
The gravity base foundations will be between 30 m and 60 m in diameter based on a single foundation. Structures will be secured to the seabed by either a single gravity based foundation on which the structure will sit, or by individual gravity based foundations which will be located at the base of each leg of the turbine or sub-structure. However, the maximum footprint of the foundations will not exceed that of a single 60 m diameter foundation at each turbine.
An area of the seabed will be prepared prior to the installation of gravity based foundations. The total volume of material which may need to be removed to achieve a level base will not exceed 15,200 m3. This material will be removed during the sea bed preparation and disposed of at an existing off-site disposal facility under a Marine Licence, or re-used as ballast material within the foundation if suitable.
4.3.4. Inter Array Cabling The inter-array cable will transmit electricity at up to 132 kV and will either be buried or installed on the seabed and protected by a suitable method. If buried, the burial target depth will be 1.5 m. If surface laid they will be protected by mattresses or rock armour to a height of around 1m above the surrounding seabed. The method of installation will be determined when further information regarding ground conditions at the site are available.
4.3.5. Export Cabling A single 132 kV export cable will transmit electricity from both the turbines to the onshore connection point. The cable will originate from Turbine 2 to the sub-station and lead to the onshore control building at Fife Energy Park. The export cable will be a maximum of 1,500 m in length and will be either buried and/or surface laid and protected by appropriate means. Where buried, a target depth of burial will be 1.5m. If surface laid it will be protected by mattresses or rock armour to a height of around 1.5m above the surrounding seabed. The method of installation will be determined when further information regarding ground conditions at the site are available.
4.4. Lifecycle The development has a licence for operation for 20 years.
4.5. Construction and Installation Methodology Construction would take place over approximately a 3-6 month period after which time the turbines would undergo testing and commissioning before becoming operational.
4.5.1. Mobilisation Port A mobilisation port has yet to be decided for this project.

Methil Offshore Wind Turbine Development 2-B Energy
16
© TÜV SÜD PMSS 2015
4.5.2. Pre-Installation Activity Pre-installation activities involve survey work such as geotechnical investigation and seabed preparation work. It may involve small survey vessels, drilling vessels or jack-ups.
4.5.3. Sub-sea Cable Installation Whilst the final installation method for the inter-array and export cables will not be determined until detailed ground investigations have been completed, the method of installation is unlikely to vary between scenarios. The preference will be for all cables to be buried, although where this is not feasible as a result of ground conditions, cables will be surface laid and protected by a suitable method. The cables may be laid by trenching using jetting or ploughing utilising Remotely Operated Vehicles (ROVs) or surface vessels with excavators.
The installation of sub-sea cables is anticipated to require the following vessel types:
• Cable laying vessel;• Trenching, jetting or ploughing vessel;• Service vessel; and• Workboat.
The cable laying vessel is likely to be a vessel in the region of 100 m by 20 m and will install the cables from spools located on the vessel. The trenching vessel is likely to operate or deploy the trenching equipment and will be similar in size to the cable laying vessel. The service vessel, which may be required to support the installation, will be similar in size and specification to the trenching vessel. If required, a workboat will be used to transfer crew from port to the installation vessels. It is anticipated that installation of the inter-array cables will take up to 15 days. The export cable may be laid in a period of 3 days. Should it not be possible to bury the cables, an alternative method of protection will be required, such as mattressing or rock placement on top of the cables. The extent of this protection is not yet known and will be defined once detailed cable specifications are known, although the anticipated maximum dimensions of any protection is anticipated to be up to 1.5m above seabed level and 5m in width. This would be undertaken by a suitable specialist vessel.
4.5.4. Foundations 4.5.4.1. Pin-Pile Foundation Installation
Piles will be transported to the wind farm site from their manufacturing location by vessel, and will either directly to the site for installation, or will be taken to a suitable port or harbour facility prior to transport to the site. The vessel which transports the piles from the manufacturing location may not necessarily be the vessel from which they are installed, and piles may be transferred to another vessel either at sea or via the port or harbour facility. Piles are likely to be transported by a cargo type barge, although final details of the vessel are not yet known. A typical vessel used for this purpose however, would be anticipated to be in the region of 100 m in length and 30 m in width, and would likely use a dynamic positioning system. The following outlines the likely process for installation of the foundations:
• If required, seabed preparation may be undertaken prior to piling operations commencing, and maytypically include clearance of debris or levelling of the piling area;
• Piles are loaded onto the installation vessel, either at the site or at a harbour facility and transported tosite;
• A piling template may be placed on the seabed to assist the piling operation;• Piling vessel drills a pile sleeve into the seabed at the required location for the insertion of the pin pile;• Steel pile is lifted into place by the lifting vessel, inserted into the pile sleeve and grouted in place; and• The process is repeated at each location required (three piles per turbine for Scenario 1 and four piles per
location for Scenario 2).
The process of installing the piled foundations described above is anticipated to take up to 40 days.
Methil Offshore Wind Turbine Development 2-B Energy
17
© TÜV SÜD PMSS 2015
4.5.4.2. Gravity Base Installation The details of the gravity base foundation option are not known at this stage, and will depend on a range of factors including water depth and other characteristics at the final turbine locations. It is possible that gravity based foundations could be deployed as a single foundation on which the sub-structure or turbine sits, or smaller, individual foundations may be located at the leg of each turbine or sub-structure. In the case of a single, larger foundation then this would likely be towed into position by a number of tugs before being sunk in a controlled manner onto the seabed. Individual gravity structures may be lifted into position.
4.5.5. Sub-Structure - Scenario 2 Only Sub-structures are only required for scenario 2, and will likely be installed at the same time as the pin pile foundations, likely being transported to the site at the same time as the pin piles and lifted into place following the installation of the piles. The number of vessels required for this activity is likely to be the same as for the installation of the piles and is expected to take place over 2 days. The sub-structure will provide the base above the level of the water on which the turbines are placed. The size of the sub-structure will be determined by the specific conditions at the final turbine locations. Scenario 1 does not require separate sub-structures to be installed.
4.5.6. Turbine Installation The installation process for turbines is very similar for both scenarios 1 and 2, with the primary difference between the two being that in scenario 1, turbines will be installed directly onto the foundation, whilst in scenario 2, they will be installed onto the substructure. It is likely that a single jack-up vessel will be used to install the turbines. Vessels of this type are in the region of 150 m in length and 50 m wide, although the final vessel selection is not yet known and will be determined prior to construction.
The typical installation process for the turbines is detailed below:
• Loading of wind turbine onto vessel;• Transfer to site;• Positioning/jacking/preparation for lifting;• Installation of wind turbine tower;• Installation of wind turbine nacelle;• Installation of wind turbine blades;• Jack down and relocate;• Repeat at next turbine; and• Leave site.
The installation of turbines is likely to take up to 2 days per turbine, and is anticipated to be completed within 7 days for the Development accounting for de-rigging and moving between turbines.
4.5.7. Operations and Maintenance Operations and maintenance will consist of periodic visits to the turbines using Wind Farm Service Vessels (WFSV) up to 24m in length craft. O&M operations will potentially require daily/weekly visits from the operations base which is likely to be Methil to transport maintenance / inspection teams onto the turbines. Sub-sea inspections of the cable routes using ROVs may also be a requirement. Un-planned interventions to rectify defects may also, potentially include heavy lift vessels for nacelle/rotor removal and replacements.
4.5.8. Decommissioning Decommissioning of the offshore elements will be undertaken in accordance with an approved decommissioning plan. It is likely that the turbines will be removed and foundations removed to the surface of the seabed, with infrastructure beneath the seabed and cables being left in place. The process involved in decommissioning are likely to be similar, but of smaller environmental impact, to those during construction.

Methil Offshore Wind Turbine Development 2-B Energy
18
© TÜV SÜD PMSS 2015
5. Marine Traffic Data5.1. Sources of Data 5.1.1. Commercial Traffic
Commercial marine traffic data has been provided by Forth Ports Authority (FPA). In agreement with the Port Authority, it was deemed that, for the nature and scale of the proposed development, the historical port and anchorage usage data collected by them between 2004 and 2014 would be suitable and sufficient for the purposes of assessing the impact on shipping and navigation. This data has been analysed to assess, amongst other things, the number of commercial vessels entering and leaving Methil Docks and their ports of origin or destination and the numbers of vessels using the Kirkcaldy and Methil anchorage. This data does not include recreational vessels. Discussions were held with Mr John Robertson, Managing Director of BiFab) with regard to present and future levels of activity at the BiFab yard and quay.
5.1.2. Recreational Traffic The RYA UK Coastal Atlas (Reference 6) shows the entire area of the Firth of Forth as a “General Sailing Area” with a “medium”2 use coastal; recreational sailing route passing offshore of Methil and south of the proposed development. The Atlas also highlights the small vessel anchorage for use by recreational craft (indicated on the Admiralty charts, just off Methil breakwater). There is no indication of racing activity shown in the area, neither is the port of Methil shown as having an affiliated RYA Club or marina. RYA Scotland was consulted3 for their opinion on the potential impacts of the development on recreational boating in the area. Their response is at Appendix 2. In summary, the Scottish RYA’s position is that the two turbines are unlikely to have an impact on recreational boating provided any exclusion zone is as small as possible and that recreational craft are permitted to pass between the turbines and the shore.
5.1.3. Commercial Fishing Activity Given the small scale and position close inshore, normal tools for assessing fishing activity levels in the vicinity of the development were not considered appropriate. The East Coast Inshore Fisheries Group (IFG) was therefore contacted in order to establish the nature of their activities in the area. It was stated4 that:
• The area is part of, or adjacent to, (depending on the time of year) fishing grounds for squid, nephrops,lobster and velvet crab.
• The main area of activity is inshore of the yellow (special mark) buoy marking the end of the pipeline &diffuser (Diageo’s) off Buckhaven.
• Squid is fished in the whole area including the development area August to October using trawls.• Creeling takes place in particular around the diffuser off Buckhaven for lobster and in the area of the
export cable route. (I.e. in the rocky/reef areas).• There is some scallop dredging (winter) beyond the buoy and around the area of development.• Nephrops trawling takes place throughout the year on a frequent basis on or close to the southern flank of
the development area.• Vessels involved in fishing this area range from 6m (18ft) creelers up to 15m (50ft) scallopers.• Recreational fishing occurs but mainly inshore of the yellow buoy.• In winter, lobster and velvets move out beyond the yellow buoy into the development area into deeper
water.• Fishing vessels in transit up and down the coast will tend to hug the coast but remain outside the yellow
buoy keeping clear of the known creeling areas i.e. passing through the development area.
5.2. Accident Data Casualty data for the Firth of Forth area has been obtained from the RNLI. Figure 2 shows call-outs (“shouts”) for the stations directly adjacent to the proposed development and Figure 3 shows the casualty types within 5n miles of the proposed development. The data shows that most incidents in the immediate vicinity involve people in distress within metres of the shoreline or in small craft such as dinghies, sailing boats or other recreational craft. Some
2 RYA Definition: Medium Route – Popular routes on which some recreational craft will be seen at most times during summer daylight hours 3 Dr D G Russell FRMetS MCIEEM – Planning and Environment Officer, RYS Scotland 4 John Davison, Chairman IFG East.

Methil Offshore Wind Turbine Development 2-B Energy
19
© TÜV SÜD PMSS 2015
incidents have involved medium / large vessels within the anchorage areas but are relatively infrequent. It is noteworthy that the casualties are attended, in the main by Kinghorn ILB with, less frequently, the Anstruther AWB. The presence of the turbines is not considered to hamper the activities of the RNLI SAR services in either reaching or finding the casualties which have occurred over the survey period. Also, given the types of casualties that have occurred in the vicinity, the likelihood of vessels being not under command (NUC) and drifting into the area containing the turbines is considered low.

Methil Offshore Wind Turbine Development 2-B Energy
20
© TÜV SÜD PMSS 2015
Figure 2 RNLI Casualty Data 2007-2011 – Firth of Forth

Methil Offshore Wind Turbine Development 2-B Energy
21
© TÜV SÜD PMSS 2015
Figure 3 RNLI Casualty Data 2007-2011within 5 n miles of Proposed Development

Methil Offshore Wind Turbine Development 2-B Energy
22
© TÜV SÜD PMSS 2015
6.
6.1. 6.1.1.
6.1.2.
Vessel Traffic AnalysisThe data used in this assessment was provided by FPA and covered the years 2004 to 2014. Over that period, there are some are records of some 660 vessels using the port. These include general cargo vessels, container vessels, barges, tankers, tugs and specialist vessels such as heavy lift vessels.
Current Traffic Patterns, Densities and TypesTraffic DensityThe concentration of commercial traffic in the near vicinity of the proposed development occurs, unsurprisingly, in the vicinity of the pilot boarding station off Methil Port. However, traffic density in this case should not be confused with contemporaneous interactions between vessels but rather the intersection of vessel traffic routes over a period of time where they pass through the same area i.e. the pilot station. The numbers of vessels entering/exiting Methil over the period 2004 to 2014 amounts to 597 vessels. This represents an average of 60 vessels per annum or just over one vessel per week.
Vessel TypesThe breakdown by percentage of the vessel types using the port is shown at Figure 4 whilst the breakdown by year is shown at Figure 5. As can be seen around 84% of traffic consists of general cargo which reflects the known activities of the Port. These vessels are generally less than 100m Length overall (LOA) and have draughts less than 5.5m to allow entry through the lock.
Figure 4 Vessel Types Using Methil for Years 2004 - 2104

Methil Offshore Wind Turbine Development 2-B Energy
23
© TÜV SÜD PMSS 2015
Figure 5 Methil Vessel Traffic by Year and Vessel Type
6.1.3. Traffic Using BiFab Quay The traffic data shows that out of the total of 660 instances of vessels using Methil, 143 were for vessels using the Quay wall, external to the docks and adjacent to BiFab’s facility. This traffic consists mainly of barges and associated tugs involved in structure outloads from BiFab’s yard. Some of these barges and vessels are up to 140m LOA and with draughts up to 8m.
YEAR NUMBER OF VESSEL S
2004 2 2005 7 2006 17 2007 15 2008 3 2009 14 2010 19 2011 7 2012 12 2013 25 2014 22 TOTAL 143
Table 4 Vessel Using BiFab Quay
The trend, according to BiFab, is for a rise in such activity over the next few years to level where such movements may occur weekly. Such activities are not routine operations and would, in general, be subject to appropriate levels of planning and supervision, in addition to Pilotage.
6.1.4. Anchorages The number of times each anchorage has been used over the ten year period 2004 to 2014 is shown in Table 5.
0
20
40
60
80
2004 2005 2006 2007 2008 2009 2010 2011 2012 2013 2014
Tanker
Tug
Barge
Other
Container
Cargo

Methil Offshore Wind Turbine Development 2-B Energy
24
© TÜV SÜD PMSS 2015
Anchorage 2004 2005 2006 2007 2008 2009 2010 2011 2012 2013 2014 TOTAL E limit 0 1 0 0 0 0 0 0 0 0 0 1 JK1 0 0 0 0 1 0 0 0 0 0 0 1 K1 98 119 97 80 119 9 14 9 10 2 5 562 K2 136 181 187 157 135 20 27 12 13 8 18 894 K3 62 83 65 70 97 39 55 25 34 19 30 579 K4 0 0 1 0 0 0 0 0 0 0 0 1 K5 0 1 0 0 0 0 0 0 0 0 0 1 M1 0 0 0 0 0 4 4 6 6 6 4 30 M2 0 7 3 1 4 5 2 2 1 0 2 27 M3 0 0 1 0 1 6 3 0 3 1 2 17 M4 0 0 0 1 3 5 7 0 2 1 2 21 M5 2 0 4 1 6 5 14 5 4 6 4 51 TOTALS 298 392 358 310 366 93 126 59 73 43 67 2185
Table 5 Anchorage Usage – 2004 – 2014
As can be seen, the most used anchorages with over 94% of use are K1, K2 and K3 with K1 being the closest of the anchorages to the turbines as shown in Figure 4. Table 5 shows the distances from the turbines to the edge of the anchor berth swinging circle and the centre of the charted berth.
Turbine Anchor Berth Distance to Edge (m) Distance to Centre (m) Turbine 1 K1 530 1280 Turbine 1 M3 1380 2130 Turbine 1 K2 1930 2680 Turbine 1 K3 3750 4500 Turbine 2 M3 1440 2190 Turbine 2 M4 1250 2000
Table 6 Distances from Turbines to Anchor Berths
6.2. Effect on Future Traffic Patterns and Densities 6.2.1. Traffic Increase due to Development Activities
The establishment of the two turbine development off the Port would lead to an increase in traffic involved in servicing and inspection of the turbines. This would comprise, in the main, small service craft taking small maintenance and inspection teams to and from the turbine. The frequency of these activities may range from several times daily over, for instance, planned maintenance periods to less frequent e.g. weekly visits during a sustained operational period. In all, there could be in the order of 150 transits to/from the turbines per year. Other vessels which may be utilised over the lifecycle of the turbines are heavy lift/cable vessels for major component repair/replacement. Such requirements would generally be for unscheduled interventions but may be in the order of 2-4 times over the planned lifetime (20years) of the development.
6.2.2. Effect of Development on Traffic Patterns The siting of the development has been considered in consultation with FPA. It has been sited to be approximately 250m clear of the charted position of the Pilot station and over 200m clear of the Small Vessel Anchorage. It is also inshore of the charted swing circles associated with anchorages K1, M3 and M4. The turbine positions are, therefore, considered not to unduly interfere or constrain traffic using these facilities and, due to the low levels of traffic associated with the area, the likelihood of increasing the possibility of close quarter interactions between vessels is considered negligible. There is some traffic which takes passage between Methil and Kirkcaldy but this mainly transits outside of the proposed development area and the charted anchorages. Recreational craft may well transit between Kirkcaldy and Methil but will generally have sufficient sea-room to do so whilst remaining clear of the 10m contour and inshore of the development area.

Methil Offshore Wind Turbine Development 2-B Energy
25
© TÜV SÜD PMSS 2015
Figure 6 Inshore Traffic Route between Methil and Kirkcaldy Pilot Stations

Methil Offshore Wind Turbine Development 2-B Energy
26
© TÜV SÜD PMSS 2015
7. Risk Assessment7.1. Hazard Identification, Risk Assessment and Controls
In order to identify the potential impacts of the hazards that may be presented by the proposed development, marine users were contacted and asked to comment on the perceived impacts on their activities. These included:
• Forth Ports Ltd – (Methil)• Inshore Fisheries Group – East• RYA Scotland• BiFab
7.2. Hazard Identification Methodology The hazard identification process was conducted against the key issues identified in MGN 371 (Reference 2) and using the guidance contained in DTI/DECC publication - Guidance on the Assessment of the Impact of Offshore Wind Farms (Reference 1). These issues were used to generate keywords for assessing each activity phase (construction, operations & maintenance and de-commissioning) associated with the array or individual devices. The hazards associated with the array were then assessed for the risk that they presented to other mariners. The outcome of the assessment is tabulated in Appendix 1.
The following sections summarise the findings.
7.3. Construction and Installation Phases The navigational hazards and consequent risks arising from the construction/installation phase are considered below.
7.3.1. Pre-Installation Activities Pre-installation activity may present specific hazards arising from the activities such as geotechnical investigation or seabed levelling using drilling platforms, survey vessels or, possibly, a jack-up platform. Whilst none of these activities would present a novel or permanent hazard to shipping, there is a risk to shipping if such activities do not comply with standard practice for notification of marine activities using the Maritime Safety Information (MSI) system (e.g. Local Port Authority and National Notices to Mariners (NMs), and Radio Navigational Warnings (NavWarns/WZs), Kingfisher etc.). Vessels involved would comply with the International Regulations for Preventing Collisions at Sea, 1972 (COLREGS) (Reference 7) by showing appropriate lights and signals.
7.3.2. Collision with Installation Spread The operations associated with foundation installation (See Sections 4.5.4 & 4.5.5) will involve the presence on site of drilling and lifting platforms/vessels for a period of around 42 days. The turbine nacelle and rotor installation vessel would require to be on site for the duration of each tower and turbine/rotor installation activity with each taking place over a period of three to four days.
It is assumed that the installation spreads for both activities will be secured to the seabed and unable to comply with the ColRegs. During the total installation time it can be expected that around 6 vessels may use Methil port and, according to BiFab regarding, a similar number may be involved in load-out activities at the BiFab Quay for their future levels of operations. This would be a total of 24 movements during the installation period for the foundations. The entry to the port requires vessels to be on track and aligned with the lock entrance at sufficient distance. The nearest turbine site is some 1600m south of the end of the outer breakwater and a similar distance from the BiFab Quay. It is approximately 300m south west of the charted Pilot embarkation point.
When considering the likelihood of collision between vessels and the installation spread, it is considered that the main causes will be either human error or machinery failure. Vessels may be at risk of collision if they either violate, or incorrectly apply, the ColRegs when passing the installation spread. However, the conspicuous nature of the (stationary) vessels involved is considered as being unlikely to lead to any ambiguity about the construction vessels activities which could result in the violation or incorrect application of the manoeuvring rules.
Vessels could also be put at risk if they were to suffer propulsion failure such that they were set down onto the construction vessel. However, for vessels passing the spread, the dwell time in the “window” whereby failure of

Methil Offshore Wind Turbine Development 2-B Energy
27
© TÜV SÜD PMSS 2015
propulsion would cause them to be set down (by wind or tide) onto the spread, is small due to the limited extent of the spread. The traffic density is such that the likelihood of such an occurrence can be considered as remote.
It should be noted that vessels entering or leaving the Port will normally be in a higher state of both machinery and manning preparedness with, in most circumstances, the Pilot embarked and, therefore, better able to cope with any emergency or human error. The vessel will also be provided with information by the VTS who, it would be expected would alert the vessel to the presence of the mooring spread.
As with the pre-installation activities, the presence of installation vessels does not present a novel or permanent hazard to shipping and the risk can be considered acceptable if similar risk mitigation actions are taken. However, the presence of obstructions such as unlit support structures, introduces a hazard which may be there for some period of time before the turbine towers are installed. In some cases, moorings may be required resulting in the introduction of a new hazard from the mooring lines, clump anchors and the any buoys (surface or sub-surface) used to mark or aid recovery of the mooring. Temporary/incomplete structures should be marked and lit appropriately as agreed with the Port Authority.
It would be necessary to ensure that all such hazards presented to marine users are notified through the Maritime Safety Information (MSI) system but, in particular the Kingfisher system for alerting fishermen to the hazard. It is recommended that the area should also be charted as an “Area under construction” before the commencement of any drilling or mooring installation activity.
The application of Safety Zones is considered in Section 7.3.4. The use of Safety/Guard boats is considered in Section 7.3.5.
Given the low traffic density in the area and the fact that the construction and installation operations would be planned to be undertaken in the most favourable conditions of tide and weather, it is considered that with the application of the control measures mentioned above, the risks from the installation activity would remain tolerable with monitoring.
7.3.3. Subsea Cable Installation Subsea cable installation between the site and the adjacent shoreline will be carried out by a suitably equipped cable laying vessel. The vessel would present a hazard to shipping when engaged in cable operations when its ability to manoeuvre would be compromised. However, the vessel would be required to comply with the ColRegs (Reference 7) and would show the appropriate signals and lights for such an activity. The marine contractor responsible for the cable lay activity would notify the Port Authority (Forth Ports) and the UK Hydrographic Office (UKHO) of the activity using the MSI system for promulgation to all vessels by local and national Notices to Mariners (NMs) and radio navigational warnings. This would also include the promulgation of the information regarding the installation activities over the marine VHF radio by the Maritime & Coastguard Agency and Port VTS.
The application of Safety Zones is considered in Section 7.3.4. The use of Safety/Guard boats is considered in Section 7.3.5
Given the low traffic density in the area and the fact that the cable laying operation would be planned to be undertaken in the most favourable conditions of tide and weather, it is considered that with the application of the control measures mentioned above, the risks from the cable installation activity would remain tolerable with monitoring.
7.3.4. Use of Safety Zones The establishment of Safety Zones, in accordance with the Energy Act 2004 and Electricity (Offshore Generating Stations) (Safety Zones) (Application Procedures and Control of Access) Regulations 2007 (Reference 8), has been considered as a potential control for the reduction of such risks as arise from both the construction and operational phases. The regulations allow the application of “standard safety zones” which means:
(a) in the case of the proposed or ongoing construction, extension or decommissioning of a wind turbine, or ofmajor maintenance works in respect of such an installation, a safety zone with a radius of 500 metresmeasured from the outer edge at sea level of the proposed or existing wind turbine tower; or

Methil Offshore Wind Turbine Development 2-B Energy
28
© TÜV SÜD PMSS 2015
(b) In the case of the proposed or ongoing operation of a wind turbine, a safety zone with a radius of 50 metresmeasured from the outer edge at sea level of the proposed or existing wind turbine tower.
They prohibit access to such proscribed areas except and in so far as any provisions are made in the appropriate notices. Such Zones would require monitoring by appropriate means and the use of such means of doing so can include Safety/Guard vessels.
The application of such Zones and the use of Guard/Safety Vessels is considered in the following sections.
7.3.4.1. Safety Zone - Construction Phase A Safety Zone could be applied for the duration of construction and installation activities where it is deemed that the risks to both the construction vessels and the transiting vessels would be reduced by its application. The application of the “standard” zone for construction (500m) would impinge on the charted Pilot station position and overlap the south west corner of the Small Vessel Anchorage. However, given that the area is under VTS control and that vessels arriving at the Port entrance will, in the main, have a Pilot embarked, it is considered that the risks from the overlap can be managed by the construction Marine Coordinator and the Port Authorities/ Pilot on a case-by-case basis. Vessels wishing to use the Small Vessel Anchorage can be advised of the construction activities and recommendations made accordingly.
Small craft using the port may not always be aware of the extent of offshore activities so close to the Port entrance and may possibly be more likely to pass close to hazards than larger vessels. The application of a 500m Safety Zone supported by a Safety/Guard Vessel may reduce the risk to this class of vessels in particular.
It is therefore considered that, despite the relatively low traffic levels, given the duration of the construction and installation activities, a “Standard Safety Zone” of 500m is applied to the construction and installation phases of the development. The extent of such zones for each turbine is shown at Figure 7. Safety Zones during construction are not necessarily geographically fixed but can be applied to the installation spread and, therefore, move with activity e.g. during cable lay.

Methil Offshore Wind Turbine Development 2-B Energy
29
© TÜV SÜD PMSS 2015
Figure 7 Application of Construction Phase Safety Zone (500m)

Methil Offshore Wind Turbine Development 2-B Energy
30
© TÜV SÜD PMSS 2015
7.3.5. Safety/Guard Vessels The requirement for a dedicated safety vessel has also been considered for the installation operations. Such a vessel can, in certain circumstances and if properly manned and briefed, help reduce risk to other vessels by monitoring traffic and providing warning of the activities occurring in the area. The following factors need to be considered:
• The levels of traffic in the area;• The time on task of the installation vessel;• The size, bridge manning levels and capability of the vessel involved in the installation works which
enables it to conduct the duties of safety vessel;• The provision of adequate notice of such activity through the Maritime Safety Information services;• Appropriate compliance with the ColRegs by the installation vessel;• Application of appropriate environmental limits (sea state, visibility) such that installation activities will not
proceed during adverse weather.
Taking the above into account, it is recommended that the use of a Safety/Guard vessel is considered and agreed with FPA for each phase and activity of the construction phase when details of both the process and the vessels involved are fully known.
7.3.6. Emergency Response Cooperation Plan The Developer is required to have an Emergency Response Cooperation Plan (ERCoP) in place, covering the construction and decommissioning phases of the development. It requires to be agreed with the MCA, the Port Authority and the appropriate Maritime Rescue Coordination Centre (MRCC)/Coast Guard Operations Centre (CGOC). The plan is required to address (amongst other things) such issues as:
• Details of companies involved (i.e. marine contractors, client etc)• Details of vessels involved• Responsibilities• Points of contact (e.g. names, posts).• Communication plan (e.g. VHF IMM Channels, MF Radio, mobile phone)
7.3.7. Risk Assessment and Controls The risks from the pre-installation and device installation phases are, therefore, considered to be “tolerable with monitoring” provided the following risk control measures are put in place.
Risk Control Measures for Cable and Turbine Construction Phase:
• Submission of adequate information to the UKHO and other authorities in adequate time toenable promulgation of national and local NMs/Radio Navigational Warnings/Kingfisher alerts.
• Installation vessels shall be marked and lit in accordance with COLREGS.• The development construction area shall be charted as an Area under Construction.• A 500m Safety Zone in accordance with Reference 8 should be implemented for the construction
phase• The use a Safety/Guard boat should be considered in conjunction with FPA when the details of
the installation process and the vessels involved are known.• Temporary and incomplete structures are to be marked and lit as agreed with FPA.• That FPA VTS are notified of daily activity in order to provide information to vessels about the
construction activity.• Emergency Response Cooperation Plan (ERCoP) in place covering construction phase (including
cable laying).

Methil Offshore Wind Turbine Development 2-B Energy
31
© TÜV SÜD PMSS 2015
7.4. Operational Phase The operational phase presents several potential hazards to other marine users. These are discussed in this section.
7.4.1. Allision with Turbine An annual average of around one vessel per week entries into Methil Port and a similar number forecast for the BiFab Quay means that an annual estimated average of 208 movements per year may occur adjacent to the turbines. As with the construction and installation phase, it is considered that the main causes of collision between vessels and the turbine will be either human error or machinery failure.
Vessels may be at risk of collision if they either violate, or incorrectly apply, the ColRegs when passing the turbine.
Vessels could also be put at risk if they were to suffer propulsion failure such that they were set down onto the turbine. However, for vessels passing the turbines, the dwell time in the “window” whereby failure of propulsion would cause them to be set down (by wind or tide) onto it, is small due to the limited physical extent of the turbine tower. The traffic density is such that the likelihood of such an occurrence can be considered as remote.
As stated earlier, vessels entering or leaving the Port will normally be in a higher state of both machinery and manning preparedness with, in most circumstances, the Pilot embarked and, therefore, better able to cope with any emergency or human error. It is considered that, given the numbers of vessels and the likelihood of a human error occurring at the time of entry or exit, the risk from such collision with the turbines is low.
Large vessels using the K and M anchorages would generally approach the anchor berths into wind and/or stemming the tide. Most, if not all would be have a pilot embarked who would be familiar with the area and the presence of the turbines. As shown in Section 6.1.4 the closest anchorage is K1 with the charted centre position approximately 1300m from Turbine 1. Given that an approach from seaward is not hindered by the proposed turbines, it is considered that the risks presented by the turbines to vessels using the anchorages are low. Further reduction in risk can, if considered necessary, be obtained by FPA allocating anchorages with greater distance from the turbines.
The use of risk mitigation measures such as charting, marking, lighting and safety zones are discussed at Section 7.5.
7.4.2. WFSV Collision with other Vessels The frequent use of WFSV will increase the levels of traffic in the area significantly. Given the occurrence of fishing activity adjacent to the development area, there is potential for an increased risk of collision between WFSV and other vessels. This may particularly be the case where such vessels are small creel boats operating with one or two personnel. As the area is under the control of the Forth and Tay VTS, WFSV should be required to report in to VTS when leaving Methil port outbound to the turbines and likewise when departing the immediate vicinity of the turbines. However, given the limits of port radar when small contacts are close to the land, VTS may not always have a clear picture of the presence of small creel boats in that area. Poor visibility would hamper visual lookout and make it difficult to see such small craft. WFSV would be required to exercise due caution and regard to the ColRegs with regard to speed and lookout when transiting the, albeit short distance (approximately 2,500m) between Methil port and the turbines.
7.4.2.1. Fishing Vessel Gear Entanglement The types of fishing activities that occur in the area involve both trawls and static gear. The use of such gear and, in particular, their deployment and recovery, when the vessel may be limited in its ability to manoeuvre, can put the vessels involved at risk of entanglement with seabed cable and structures e.g. foundations and gravity bases. Entanglement in those circumstances could lead to vessel capsize and loss of life. It is therefore recommended that consideration be given to prohibiting fishing within the area. This is discussed further in the context of charting and marking in Section 7.5.
7.4.3. Collision with Sub-Surface Gravity Base Structure If gravity base structures are to be used then the height of above the seabed will be, as stated in Table 3, in the order of 5 metres above the seabed. As the charted water depths in the deployment area are in the order of 15 metres this would mean an effective reduction to 10 metres charted depth within a radius of 30 metres of the

Methil Offshore Wind Turbine Development 2-B Energy
32
© TÜV SÜD PMSS 2015
turbine. Given the vessel types and their draughts such a reduction would not present a significant hazard to shipping particularly when considering their proximity to the tower presents a great risk.
7.4.4. Grounding on Sub-Sea Cable Protection One of the options yet to be determined is whether it will be possible to bury fully the inter-turbine and export cables. If it is not the case then cable protection of up to 1m in height above seabed and 5m in width may be required. This would comprise either concrete mattresses or rock. A consequence of this would be a reduction in charted depth along the cable routes. Give that the inter-turbine cabling will be laid in approximately 15m charted depth it is considered that this will not present a hazard to shipping in the area. However, the export cable presents a different case in that it passes through the inshore area where recreational traffic will, potentially be transiting up and down the coast. Reductions to the charted depth in shallow water areas could present a hazard to recreational craft. It should be noted that the proposed cable route lies parallel to and within 700m of a submarine pipeline leading to a diffuser which, according to charted depth information already reduces the depths by between 1 and 2 metres. Therefore the proposed cable protections should not reduce the minimum depths in the area below that already established. Changes to depth caused by any cable protection measures should be established by survey and the results provided to UKHO in order that they can be promulgated and charted.
7.4.5. Electromagnetic Interference (EMI) The devices generate alternating current and with the nacelle and the cable sited below water or on the seabed, there is not expected to be any adverse EMI effects on navigational equipment (i.e. magnetic compasses from the devices or the cable.
7.4.6. Effects on Communication, Radar and Positioning Systems The potential effects on communication, radar and positioning systems of wind turbines and, in particular, large arrays have been addressed in two studies:
1. MCA/QinetiQ Report - Results of the electromagnetic investigations and assessments of marine radar,communications and positioning systems undertaken at the North Hoyle wind farm by QinetiQ and theMaritime and Coastguard Agency 2004 (Reference 9)
2. BWEA /MCA/DTI/PLA Report - Investigation of Technical and Operational Effects on Marine Radar Closeto Kentish Flats Offshore Wind Farm 2007 (Reference 10)
The general conclusions from the above studies are that there are no significant impacts on communication, radar and positioning systems from wind farms except with regard to radar where the issues associated with identifying small contacts within an array and side-lobe echoes can, when within 1-1.5 n miles of the towers, result in missing (or misidentifying) small contacts and cause significant interference on the radar screen.
Given the fact that this development is not a large array where the effects identified in the reports are at their most severe, it is considered that the impact of the two turbines on communication, radar and positioning systems will not be significant.
7.4.7. Emergency Response Cooperation Plan The Developer is required to have in place an Emergency Response Cooperation Plan (ERCoP), covering the operations & maintenance phase of the development. It requires to be agreed with the MCA, the Port Authority and the appropriate Maritime Rescue Coordination Centre (MRCC)/Coast Guard Operations Centre (CGOC). The plan is required to address (amongst other things) such issues as:
• Details of companies involved (i.e. marine contractors, client etc)• Details of vessels involved• Responsibilities• Points of contact (e.g. names, posts).• Communication plan (e.g. VHF IMM Channels, MF Radio, mobile phone)

Methil Offshore Wind Turbine Development 2-B Energy
33
© TÜV SÜD PMSS 2015
7.5. Charting, Marking and Lighting 7.5.1. Charting
The generally accepted philosophy is that the chart should provide mariners with the appropriate information on the position and nature of the hazards and allow them to make the decision on the appropriate distances and clearances required to ensure the safety of their vessels. The following recommendations are based on that philosophy.
In the case of the two turbines proposed as part of the development which cannot be considered to form an array (or farm) they should be charted in accordance with Admiralty Chart 5011 Symbols and Abbreviations Used on Admiralty Charts (Reference 11) using Symbol L5.1 for individual turbines.
It is also recommended that the turbines and the inter-turbine cabling should be encompassed by a standard international symbol of a black pecked line (International Symbol N1.1) indicating a “Marine limit in general, usually implying physical obstructions”. It should be noted that such an area does not preclude navigation or access to the area but rather indicates that marine users may find surface of sub-surface obstructions e.g. buoys or cables. Given the fact that fishing (both trawling and creeling) does occur in the area, consideration should also be given to making the area prohibited to fishing. Given the fact that the area is within Port limits such a prohibition can be enacted under Harbour byelaws.
The export cable should be charted using standard symbology. (i.e. L30.1)
7.5.2. Safety Zone - Operational Phase The application of a “Standard” 50m Safety Zone Safety Zone during the Operational Phase has also been considered. A Safety Zone established in accordance with Reference 8 is not charted and, whilst its application may be included in the chart Notes section, its use in deterring Masters of medium size vessels from approaching within the proscribed distance of 50m is doubtful as the exercise of good seamanship in a medium size vessel would already preclude approaching such a hazard within a distance even greater than 50m.
The utility of such a Safety Zone may, to a certain extent, be more effective with regard to small craft where the ability to navigate safely within 50m of such a hazard to navigation does not put them at so much risk. In order to deter such craft approaching, accessing or making fast to the turbine (e.g. for fishing) then a 50m Safety Zone may present a deterrent. In this case the proposed clearance height of the rotor will be 25m above MHWS exceeds RYA guidance and ensures that the majority of sailing vessels using UK waters would not be at risk from rotor strike. Hence, a 50m Safety Zone becomes more a tool for controlling access and not so much one for reducing risk to shipping and navigation. In addition, the effectiveness of a Safety Zone depends on the ability to monitor and enforce such a proscribed area. Pro-active monitoring and enforcement would require both radar and AIS monitoring on a real-time basis.
Imposing a larger Safety Zone, e.g. 500m, (i.e. exceeding the “Standard Safety Zone” for operational phases) will, it is considered, present an unacceptable restriction on vessels and Port operations as it would overlap the current charted Pilot embarkation position and a small part of the Small Vessel Anchorage as well as severely restricting the inshore passage area between the development and the outfall Special Mark buoy marking the end of the outfall off Buckhaven unless such a provision is made in the notice allowing such vessels entry. In that case the reasons for such a Safety Zone will have been obviated in the first instance.
The fact that the turbines will be charted, lit and marked appropriately and that larger vessels will generally be piloted in this area, it is considered that the establishment of a Safety Zone in accordance with Reference 8 is not appropriate in that it provides little or no additional reduction in risk to navigation and shipping beyond the normal measures outlined in this Section that will be employed in the circumstances. Therefore, the application of a “Standard Safety Zone” of 50m (or even greater) is not considered appropriate in the operational phase.
It is for note that, due to the development site being within the statutory waters of the FPA, the Port Authority can enact restricted areas in accordance with the powers allocated under the appropriate Harbours Act if it deems that such a development presents a hazard, the risks from which can be mitigated further by the introduction of a such limits on navigation.

Methil Offshore Wind Turbine Development 2-B Energy
34
© TÜV SÜD PMSS 2015
7.5.3. Marking and Lighting The guidance on marking and lighting of offshore wave and tidal energy devices is laid down in the International Association of Lighthouse Authorities Recommendation O-139 “The Marking of Man-Made Offshore Structures” (Reference 12). The IALA recommendation states in Section 2.3 on the marking of offshore Wind farms that, for marking of individual structures (wind turbines):
• The tower of every wind generator should be painted yellow all-round from the level of HighestAstronomical Tide (HAT) to 15 metres or the height of the Aid to Navigation (AtN), if fitted, whichever isgreater. (See IALA Recommendation E-108 Edition 2 December 2009 On The Surface Colours usedas Visual Signals on Aids to Navigation - Reference 13).
• Alternative marking may include horizontal yellow bands of not less than 2 metres in height andseparation.
• Consideration may be given to the use of additional retro reflective material.• Due to the increased danger posed by an isolated structure, it should be lighted with a white light flashing
Morse code “U”.
It further states that the Aids to Navigation (AtN) (e.g. lights):
• Should be mounted below the lowest point of the arc of the rotor blades.• Should be exhibited at a height of at least 6 metres above the level of the HAT.• Should comply with IALA Recommendations and have an availability of not less than 99.0% (IALA
Category 2).
The IALA recommendations regarding the marking of groups of structures (i.e. wind farms) in Section 2.3.3 of that document addresses the issues of arrays of turbines where the peripheral extent of the array is in the order of several miles and are not considered as applicable to the proposed development.
7.5.4. AIS IALA O-139 recommends that consideration is given to the use of AIS as an aid to navigation and IALA Recommendation A-126 - On the Use of the AIS in Marine Aids to Navigation (Reference 14) provides details of the use of AIS in such modes. Given the fact that the two turbines are in close proximity to both the Port entrance and the anchorages, it is considered that the use of AIS on both turbines may reduce confusion and provide clarity to marine users. The effects of “clutter” from other AIS sources as well as land should be taken into account but given the relatively low traffic density in the immediate area, it is recommended that AIS as an AtN is considered by the developer in consultation with the FPA for both turbines.
7.6. Risk Assessment and Controls The risks from the operational phase are, therefore, considered to be “tolerable with monitoring” provided the following risk control measures are put in place.

Methil Offshore Wind Turbine Development 2-B Energy
35
© TÜV SÜD PMSS 2015
Risk Control Measures for the Operational Phase:
• The individual turbines shall be appropriately charted, using appropriate symbology for individual in turbines.
• The extent of the turbines and inter-turbine cabling shall be charted using symbology indicating that a “Marine limit in general, usually implying physical obstructions” exists.
• Consideration should be given to making the area prohibited for fishing. • The export cable should be charted appropriately. • Any changes to depth caused by the use of cable protection (mattresses, rock armour
etc) should be established by survey and the reductions in charted depths provided to the UKHO for promulgation and charting.
• A minimum rotor clearance above MHWS of 22m should be maintained in order to comply with RYA recommendations.
• The individual turbines should be marked and lit in accordance with the IALA Recommendation O-139 and as agreed with FPA as the local Lighthouse Authority.
• The use of AIS as an AtN should be considered for both turbines. • Appropriate information shall be submitted to the UKHO and other authorities such that
the turbines and individual devices would be included in publications e.g. Sailing Directions.
• A protocol/procedure between the development operator and Forth and Tay VTS should be established for WFSV and other vessels providing support to the operations and maintenance activities such that they report their intentions and activities.
• An ERCoP shall be implemented as part of an SMS.

Methil Offshore Wind Turbine Development 2-B Energy
36
© TÜV SÜD PMSS 2015
8. ConclusionsThe following conclusions are drawn from the study:
1. That the risks to navigation from the construction phase are considered to be “Tolerable with monitoring”subject to the application of such risk controls as are identified and recommended in this report.;
2. The risk to navigation arising from the proposed development in its operational phase can be considered as“Tolerable with Monitoring” subject to the application of such risk controls as are identified in this report.
9. RecommendationsThe following recommendations are made:
1. That the risk controls as are identified in this report for both the construction and operation phases areimplemented in order to ensure that the risks from both phases are reduced to a level considered as “Tolerablewith Monitoring”.

Methil Offshore Wind Turbine Development 2-B Energy
37
© TÜV SÜD PMSS 2015
10. Statement of LimitationsThe risks arising from the proposed 2-B Energy wind turbine development off Methil have been assessed as“Tolerable with Monitoring” and ALARP. However, this assessment is only valid under the followingassumptions/limitations:
• Any major deviation in the technologies or installation methodology which differs significantly from thosedescribed in this document must be assessed for risk and the NSRA and Hazard Log must be revisedaccordingly;
• All charts are updated with the proposed symbology and notation recommended within this document inorder to mark hazards adequately and appropriately;
• The position and type of lighting and marking (including buoyage) to be installed are as described in thisdocument. Any proposed deviation to this must be presented to the appropriate marine authorities andreassessed for adequacy of navigational safety.

Methil Offshore Wind Turbine Development 2-B Energy
38
© TÜV SÜD PMSS 2015
Appendix 1. Hazard and Control Log Risk Tolerability and Criticality Matrices used in the Hazard and Control Log
Consequence Insignificant Minor Major Catastrophic
Frequency DefinitionNo significant harm to
people
Injury to vessel crew
Injury to OREI installation
crew
Injury on the shore
Loss of vessel crew
members (1-3)
Loss of OREI installation or
maintenance crew members
(1-3)
Fatalities on shore (1-3)
Total loss of vessel crew
Total loss of OREI
installation or
maintenance crew
Multiple fatalities
onshore
FrequentLikely to happen
annually or more
frequently
Tolerable with
Additional Controls
Tolerable with
ModificationsUnacceptable Unacceptable
Reasonably Probable
Likely to happen
duting the license
period of an OREI
(nominally 20 years)
Tolerable with
monitoring
Tolerable with
Additional Controls
Tolerable with
ModificationsUnacceptable
Remote
Unlikely (but not
exceptional) to happen
during the licence
period
Broadly AcceptableTolerable with
monitoring
Tolerable with
Additional Controls
Tolerable with
Modifications
Extremely RemoteOnly likely to happen
in exceptional
circumstances
Broadly Acceptable Broadly AcceptableTolerable with
monitoring
Tolerable with
Additional Controls
Hazard Identification Risk Assessment (HIRA)
HIRA Risk Matrix
Risk Criticality
Broadly Acceptable
Broadly Acceptable
Tolerable with
monitoring
Tolerable with
Additional Controls
Tolerable with
Modifications
Unacceptable
Unacceptable None
Risk must be mitigated with design modification and/or engineering
control to a Risk Class of 5 or lower before consent
Risk must be mitigated with design modification and/or engineering
control to a Risk Class of 5 or lower before consent
Risk must be mitigated with design modification and/or engineering
control to a Risk Class of 5 or lower before consent
Condition Explanation
With a commitment to further risk
reduction before construction
None
Technical review is required to confirm the risk assessment is
reasonable. No further action is required
Technical review is required to confirm the risk assessment is
reasonable. No further action is required
Risk must be mitigated with engineering and/or administrative
controls. Must verify that procedures and controls cited are in place
and periodically checked
Risk should be mitigated with design modification, engineering and/or
administrative control to a Risk Class of 4 or below before
construction
None
None
With a commitment to risk monitoring
and reduction during operation
With a commitment to further risk
reduction before operation

Methil Offshore Wind Turbine Development 2-B Energy
39
© TÜV SÜD PMSS 2015
2 B Energy –Methil - Hazard & Control Log Element Phase Guide
word Hazard Consequence Initial Risk Controls / Mitigation Residual Risk
Frequency Consequence Risk Frequency Consequence Risk
Subsea Cables
Installation & Commissioning
Shipping routes Cable installation vessel Restricted in Ability to Manoeuvre (RAM).
Vessel approaching /departing Methil collides with cable installation vessel(s).
Remote Major Tolerable with Additional Controls
Installation vessel compliant with COLREGs. Issue NMs/Radio Navigation Warnings. ERCoP SMS – Emergency Response Procedures
Extremely Remote Major Tolerable with monitoring
Operation Vessel engaged in fishing
Cable Vessel capsize due to snagging
Remote Major Tolerable with Additional Controls
Cable to be charted. Cable position to be provided to “Kingfisher” System Cable to be buried 1.5m if possible. Mattress/rock armour protection if cannot be buried. ERCoP SMS – Emergency Response Procedures
Extremely Remote Major Tolerable with monitoring
Shipping routes Cable protection (1m above seabed)
Small craft passing inshore may ground on cable protection where it reduces depth in shallows
Reasonably Probable
Minor Tolerable with Additional Controls
Cable to be charted. Depth reductions to be established by survey and provided to UKHO for charting
Remote Minor Tolerable with monitoring
Anchorage Cable Vessel anchor snags on cable causing small vessel to be held fast or capsize. Damage to cable
Remote Major Tolerable with Additional Controls
Cable route to avoid anchorage areas Cable to be charted. VTS allocates/monitors vessels anchor position ERCoP SMS – Emergency Response Procedures
Extremely Remote Major Tolerable with monitoring
Turbines (Structures and Nacelle)
Installation and Commissioning
Shipping routes Jack-up vessel/barge and vessels (Construction spread) conducting installation
Vessel collision with installation spread
Remote Major Tolerable with Additional Controls
Installation vessels compliant with COLREGs. Issue NMs/Radio Navigation Warnings. VTS broadcasts radio navigation warnings Warn frequent users e.g. / fishermen. ERCoP SMS – Emergency Response Procedures
Extremely Remote Major Tolerable with monitoring
Shipping routes Vessel not under command (NUC)/ construction spread
Collision between NUC vessel and installation vessel(s) leading to damage to vessel damage/injury /loss of life
Remote Major Tolerable with Additional Controls
Notice to Mariners (NTM)/ Navigation Warning(NavWarns) Monitoring of traffic by installation vessel Emergency breakaway procedure Vessel Lighting and marking ERCoP – VTS provides warning of vessel NUC to installation vessel. SMS – Emergency Response Procedures
Extremely remote Major Tolerable with monitoring
Violation/ Mistakes/ Slips/ Lapses
Installation spread conducting installation
Vessel transiting area makes navigational error leading to collision with installation vessels and damage to vessel/injury /loss of life
Remote Major Tolerable with Additional Controls
Installation vessels marked and lit appropriately. Monitoring of traffic by installation vessel Emergency breakaway / evacuation procedure ERCoP SMS – Emergency Response Procedures
Extremely remote Major Tolerable with monitoring
Radio Interference
Use of incorrect IMM VHF channels
Interference with IMM VHF ship/shore and ship/ship communications
Reasonably Probable
Minor Tolerable with Additional Controls
Installation vessel(s) to agree working channels with local operators/MCA
Remote Minor Tolerable with monitoring
Turbines (Structures and Nacelle)
Operation Vessel NUC Vessel not under command (NUC)
Vessel collides with turbine
Remote Major Tolerable with Additional Controls
ERCoP - VTS warns operator of NUC vessel – systems shutdown. Devices/ array area appropriately charted
Remote Minor Tolerable with monitoring

Methil Offshore Wind Turbine Development 2-B Energy
40
© TÜV SÜD PMSS 2015
2 B Energy –Methil - Hazard & Control Log Element Phase Guide
word Hazard Consequence Initial Risk Controls / Mitigation Residual Risk
Frequency Consequence Risk Frequency Consequence Risk
Violation/ Mistakes/ Slips/ Lapses
Vessel enters array area
Vessel allision with turbine
Remote Major Tolerable with Additional Controls
Turbines marked and lit appropriately. Use of AIS as AtN recommended Turbines/ area appropriately charted
Remote Minor Tolerable with monitoring
Violation/ Mistakes/ Slips/ Lapses
Small craft & Vessels fishing etc on transit route between Methil and turbines
WFSV collides with craft/vessel
Remote Major Tolerable with Additional Controls
WFSV call VTS before departing Methil/turbines Adherence to ColRegs with regard to lookout and speed
Extremely remote Major Tolerable with monitoring
Electromagnetic Interference
EMI Interference with navigational equipment from cables/equipment
Potential for navigational error due to effects on navigation equipment e.g. .magnetic compass
Extremely remote
Insignificant Broadly Acceptable
No evidence of EMI effects seen from other similar sub-sea cables in area.
Extremely remote Insignificant Broadly Acceptable
Maintenance Maintenance vessels restricted in their ability to manoeuvre (RAM)
Collision between transiting vessels and vessel conducting maintenance.
Remote Major Tolerable with additional controls
Maintenance vessel marking and lighting. VTS informed of maintenance vessel activities and confliction with other traffic. Compliance with COLREGs ERCoP SMS – Emergency Response Procedures
Extremely remote Major Tolerable with Monitoring
Device Failure Loss of AtN (Lights etc)
Vessel enters area - allision with turbine
Remote Major Tolerable with additional controls
AtN comply with IALA Cat 2availability requirements (99%) Mix of AtN.
Extremely Remote Major Tolerable with Monitoring
Turbine Structures and Nacelle
Operation Anchorage Device moorings/subsea cables
Vessels anchors snagging on device
Reasonably Probable
Minor Tolerable with Additional Controls
Cables routes to avoid anchorages where possible. Cable to be charted
Extremely remote Insignificant Broadly Acceptable
Fishing Cables/ cable protection/subsea structure presents snagging hazard to fishing gear
Fishing vessel enters area by accident or design and fishing gear snags causing vessel to capsize
Remote Major Tolerable with Additional Controls
Devices / area charted. Device positions provided to Kingfisher system. Designation of the area as an area in which obstructions may be present.”
Extremely remote Major Tolerable with Monitoring
De- commissioning
Vessel NUC Vessel not under command
Collision between NUC vessel and de-commissioning vessel(s) leading to damage to vessel damage/injury /loss of life
Remote Major Tolerable with Additional Controls
Notice to Mariners (NTM)/ Navigation Warning(NavWarns) Vessel Lighting and marking ERCoP SMS – Emergency Response Procedures
Extremely remote Major Tolerable with Monitoring
Violation/ Mistakes/ Slips/ Lapses
Vessel collides with decommissioning vessel
Collision between vessel and de-commissioning vessel(s) leading to damage to vessel damage/injury /loss of life
Remote Major Tolerable with Additional Controls
Vessel marked and lit appropriately. Monitoring of traffic by de- commissioning vessels ERCoP SMS – Emergency Response Procedures
Extremely remote Major Tolerable with Monitoring

Methil Offshore Wind Turbine Development 2-B Energy
41
© TÜV SÜD PMSS 2015
Appendix 2. – Stakeholder Responses 1. Scottish RYA

Methil Offshore Wind Turbine Development 2-B Energy
42
© TÜV SÜD PMSS 2015
Record of Changes
Rev # Date Description Approved A 2015-02-18 Draft for Internal Review DJC B 2015-02-18 Internal review NMC C D E F G 0 2015-02-19 Issue to Client NMC 1 2 3 4 5 6
Distribution List
# Function Title Company Name (optional) 1 Commercial Manager 2-B Energy Ltd Scott Harper 2 3 4 5 6 7 8 9 10 11 12 13 14 15 16 17 18 19 20
Notes:

Methil Offshore Wind Turbine Development 2-B Energy
43
© TÜV SÜD PMSS 2015

((((((((((((((((((((((((((((((((((((((((((((((((((((((((((((((((((((((((((((((((((((((((((((((((((((((((((((((((((((((((((((((((((((((((((((((((((((((((((((((((((((((((((((((((((((((((((((((((((((((((((((((((((((((((((((((((((((((((((((((((((((((((((((((((((((((((((((((((((((((((((((((((((((((((((((((((((((((((((((((((((((((((((((((((((((((((((((((((((((((((((((((((((((((((((((((((((((((((((((((((((((((((((((((((((((((((((((((((((((((((((((((((((((((((((((((((((((((((((((((((((((((((((((((((((((((((((((((((((((((((((((((((((((((((((((((((((((((((((((((((((((((((((((((((((((((((((((((((((((((((((((((((((((((((((((((((((((((((((((((((((((((((((((((((((((((((((((((((((((((((((((((((((((((((((((((((((((((((((((((((((((((((((((((((((((((((((((((((((((((((((((((((((((((((((((((((((((((((((((((((((((((((((((((((((((((((((((((((((((((((((((((((((((((((((((((((((((((((((((((((((((((((((((((((((((((((((((((((((((((((((((((((((((((((((((((((((((((((((((((((((((((((((((((((((((((((((((((((((((((((((((((((((((((((((((((((((((((((((((((((((((((((((((((((((((((((((((((((((((((((
G
>
337000
337000
0 50 100 m ¯
> Proposed Turbine LocationArtificial Access Track
G Lighting TowerSurvey Area
((((((((((((Artificial Boulders
Artificial Ephemeral/Short PerennialArtificial SpoilIndicative Sand Over SoftClay 'Natural' Habitat
Repro
duced
from
Ordn
ance
Surve
y digit
al ma
p data
© Cr
own c
opyri
ght 2
012.
All rig
hts re
serve
d. Lic
ense
numb
er 10
0048
606
Revision: ARef: 867/ES/027
Produced: LHuReviewed: SCApproved: JH
Date: 14/06/2012
1:2,500 Scale @ A3
C:\Files for remote working\867 Methill Test Site\MXDs\ES MXDs\Methil_Figure_7.2_Phase1.mxd
Phase 1 Survey ResultsFigure 7.2
Fife Energy ParkOffshore Demonstration Wind Turbine (FEPODWT)
S
Mean Low Water Springs
S


![6(9): 72. Note: [Fife Bay]. 2. Baak, Connie; Bak - PapuaWeb](https://img.pdfslide.net/doc/110x75/631d61305c567f54b4038eed/69-72-note-fife-bay-2-baak-connie-bak-papuaweb.jpg)


