Embed Size (px)
Citation preview
FOUNDRY PRACTICE
| CRUCIBLES
Thermally-efficient crucible technology
| METALLURGICAL AND POURING CONTROL
SMARTT – defined hydrogen levels after aluminium
rotary degassing
| FILTRATION
Best practice filter application techniques
The authoritative magazine for foundry engineers
MARCH 2019
NO. 266
- SINCE 1932 -
SMARTT – DEFINED HYDROGEN LEVELS AFTER ALUMINIUM ROTARY DEGASSING
The SMARTT degassing system is the latest advance in automated aluminium melt quality control. The SMARTT degassing process takes ambient conditions into account when calculating the optimum treatment parameters to facilitate the achievement of constant melt quality. Full data logging provides vital information for quality control.
THERMALLY EFFICIENT CRUCIBLE TECHNOLOGY: FUNDAMENTALS, MODELLING AND APPLICATIONS
FOR ENERGY SAVINGS
Calculating the energy savings from the deployment of thermally efficient crucibles in the foundry is extremely difficult to do due to the number of influencing variables affecting performance and the problems of monitoring the energy consumption of individual melting and holding furnaces. Through the development of mathematical models, the benefits of using thermally efficient crucibles become clear and represent an important and underused source of value for the foundryman.
BEST PRACTICE FILTER APPLICATION TECHNIQUES FOR VERTICALLY PARTED MOLDING MACHINES
The deployment of ceramic foam filters in gating systems of mass produced safety critical parts has become standard practice in the modern foundry. However, the performance of the filter and the benefits achieved in inclusion removal, turbulence control and lower scrap rates are strongly influenced by the correct placement of the filter and the design of the filter print
EDITORIAL
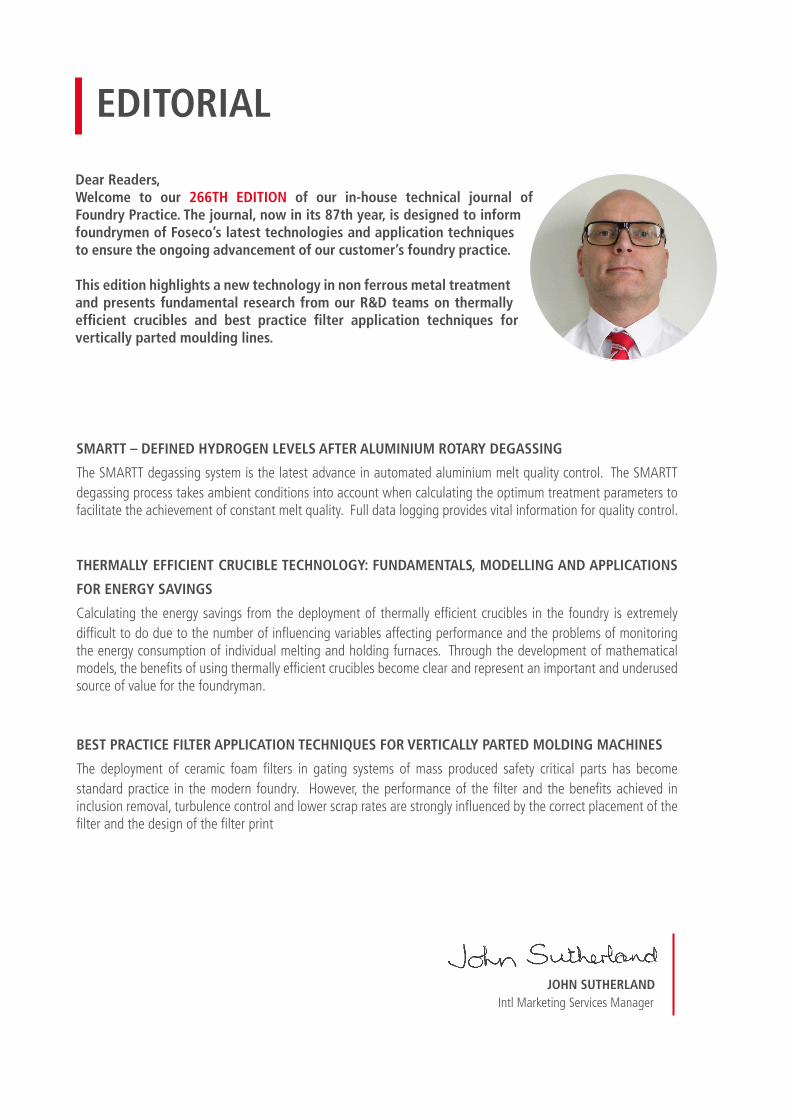
Dear Readers,Welcome to our 266TH EDITION of our in-house technical journal of Foundry Practice. The journal, now in its 87th year, is designed to inform foundrymen of Foseco’s latest technologies and application techniques to ensure the ongoing advancement of our customer’s foundry practice.
This edition highlights a new technology in non ferrous metal treatment and presents fundamental research from our R&D teams on thermally efficient crucibles and best practice filter application techniques for vertically parted moulding lines.
JOHN SUTHERLANDIntl Marketing Services Manager
CONTENTS
Best practice filter application techniques for
vertically parted molding machines
Authors: Tony Midea, Andy Adams & Brian Dickinson
18. FILTRATIONIRON FOUNDRIES
METALLURGICAL AND POURING CONTROLNON FERROUS FOUNDRIES
SMARTT – defined hydrogen levels after
aluminium rotary degassing
Author: Ronny Simon
13.
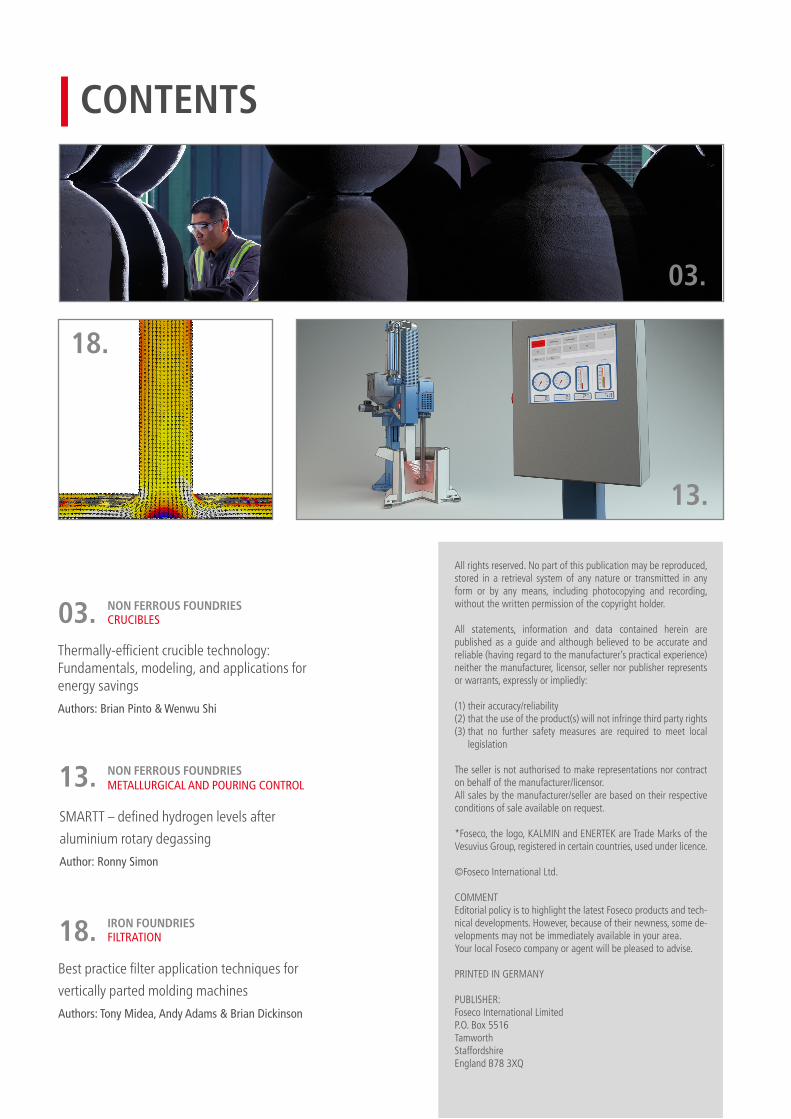
Thermally-efficient crucible technology:Fundamentals, modeling, and applications for energy savings
Authors: Brian Pinto & Wenwu Shi
03. CRUCIBLESNON FERROUS FOUNDRIES
All rights reserved. No part of this publication may be reproduced, stored in a retrieval system of any nature or transmitted in any form or by any means, including photocopying and recording, without the written permission of the copyright holder.
All statements, information and data contained herein are published as a guide and although believed to be accurate and reliable (having regard to the manufacturer’s practical experience) neither the manufacturer, licensor, seller nor publisher represents or warrants, expressly or impliedly:
(1) their accuracy/reliability(2) that the use of the product(s) will not infringe third party rights(3) that no further safety measures are required to meet local
legislation
The seller is not authorised to make representations nor contract on behalf of the manufacturer/licensor. All sales by the manufacturer/seller are based on their respective conditions of sale available on request.
*Foseco, the logo, KALMIN and ENERTEK are Trade Marks of the Vesuvius Group, registered in certain countries, used under licence.
©Foseco International Ltd.
COMMENTEditorial policy is to highlight the latest Foseco products and tech-nical developments. However, because of their newness, some de-velopments may not be immediately available in your area.Your local Foseco company or agent will be pleased to advise.
PRINTED IN GERMANY
PUBLISHER:Foseco International LimitedP.O. Box 5516TamworthStaffordshireEngland B78 3XQ
03.
13.
18.

THERMALLY-EFFICIENT CRUCIBLE TECHNOLOGY: FUNDAMENTALS, MODELLING, AND APPLICATIONS FOR ENERGY SAVINGSAuthors: Brian Pinto & Wenwu Shi, Foseco NAFTA
Multivariate mathematical models were created to simulate crucibles being used in aluminum foundry applications with detailed materials characterization data as inputs. The aim was to investigate the effects of crucible geometry and materials properties changes on the overall energy efficiency of the furnace toward melting and holding metal. Effects of key thermal properties were also studied to understand their influence on energy efficiency and thermal stresses, another key factor in understanding crucible behavior. Problems with evaluating these changes practically in foundries stems from the inability to separate out extrinsic factors that also affect furnace efficiency, such as unique configurations, furnace condition and, in some cases, poor operating practices. Since melting and holding metal in crucibles accounts for a large portion of energy demand in the foundry industry, recent advancements in crucible technologies resulting from these studies could significantly impact cost-efficiency and carbon footprint across the industry. In case studies of applications such as aluminum melting and holding, considerable improvements in field performance have been reported.
Page 03Foundry Practice Issue 266
Page 04Thermally Efficient Crucible Technology
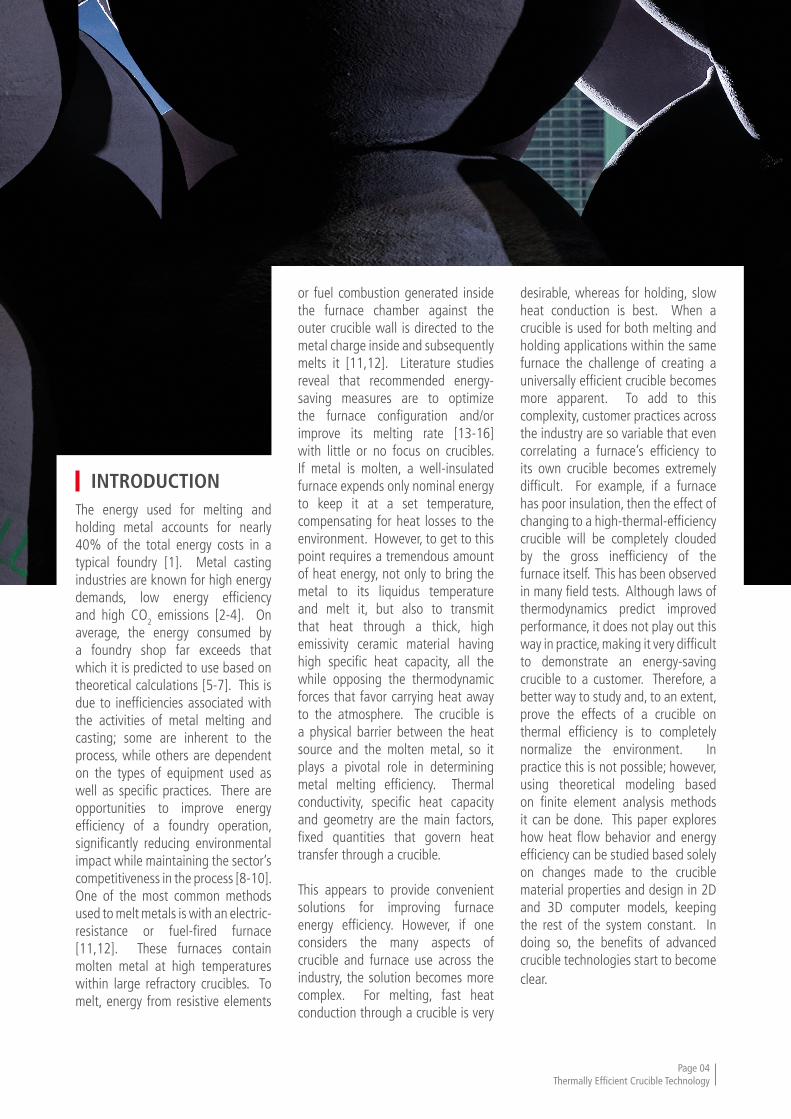
INTRODUCTIONThe energy used for melting and holding metal accounts for nearly 40% of the total energy costs in a typical foundry [1]. Metal casting industries are known for high energy demands, low energy efficiency and high CO2 emissions [2-4]. On average, the energy consumed by a foundry shop far exceeds that which it is predicted to use based on theoretical calculations [5-7]. This is due to inefficiencies associated with the activities of metal melting and casting; some are inherent to the process, while others are dependent on the types of equipment used as well as specific practices. There are opportunities to improve energy efficiency of a foundry operation, significantly reducing environmental impact while maintaining the sector’s competitiveness in the process [8-10]. One of the most common methods used to melt metals is with an electric-resistance or fuel-fired furnace [11,12]. These furnaces contain molten metal at high temperatures within large refractory crucibles. To melt, energy from resistive elements
or fuel combustion generated inside the furnace chamber against the outer crucible wall is directed to the metal charge inside and subsequently melts it [11,12]. Literature studies reveal that recommended energy-saving measures are to optimize the furnace configuration and/or improve its melting rate [13-16] with little or no focus on crucibles. If metal is molten, a well-insulated furnace expends only nominal energy to keep it at a set temperature, compensating for heat losses to the environment. However, to get to this point requires a tremendous amount of heat energy, not only to bring the metal to its liquidus temperature and melt it, but also to transmit that heat through a thick, high emissivity ceramic material having high specific heat capacity, all the while opposing the thermodynamic forces that favor carrying heat away to the atmosphere. The crucible is a physical barrier between the heat source and the molten metal, so it plays a pivotal role in determining metal melting efficiency. Thermal conductivity, specific heat capacity and geometry are the main factors, fixed quantities that govern heat transfer through a crucible.
This appears to provide convenient solutions for improving furnace energy efficiency. However, if one considers the many aspects of crucible and furnace use across the industry, the solution becomes more complex. For melting, fast heat conduction through a crucible is very
desirable, whereas for holding, slow heat conduction is best. When a crucible is used for both melting and holding applications within the same furnace the challenge of creating a universally efficient crucible becomes more apparent. To add to this complexity, customer practices across the industry are so variable that even correlating a furnace’s efficiency to its own crucible becomes extremely difficult. For example, if a furnace has poor insulation, then the effect of changing to a high-thermal-efficiency crucible will be completely clouded by the gross inefficiency of the furnace itself. This has been observed in many field tests. Although laws of thermodynamics predict improved performance, it does not play out this way in practice, making it very difficult to demonstrate an energy-saving crucible to a customer. Therefore, a better way to study and, to an extent, prove the effects of a crucible on thermal efficiency is to completely normalize the environment. In practice this is not possible; however, using theoretical modeling based on finite element analysis methods it can be done. This paper explores how heat flow behavior and energy efficiency can be studied based solely on changes made to the crucible material properties and design in 2D and 3D computer models, keeping the rest of the system constant. In doing so, the benefits of advanced crucible technologies start to become clear.
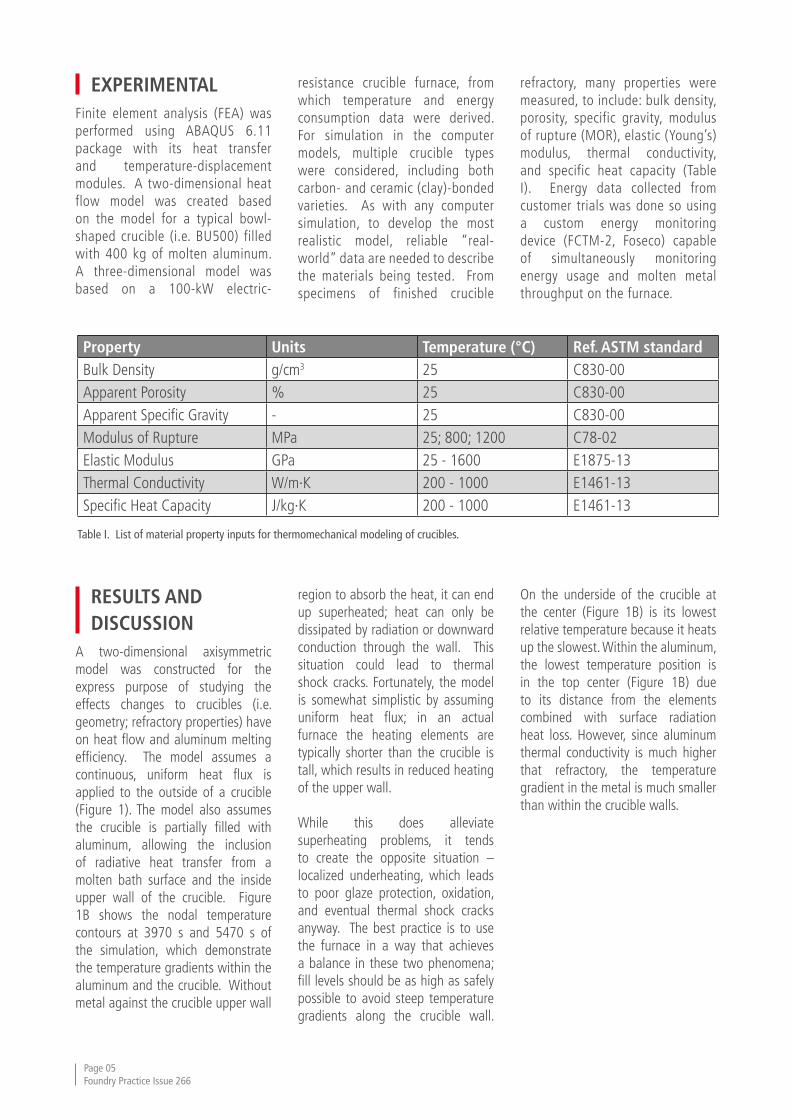
Property Units Temperature (°C) Ref. ASTM standardBulk Density g/cm3 25 C830-00Apparent Porosity % 25 C830-00Apparent Specific Gravity - 25 C830-00Modulus of Rupture MPa 25; 800; 1200 C78-02Elastic Modulus GPa 25 - 1600 E1875-13Thermal Conductivity W/m·K 200 - 1000 E1461-13Specific Heat Capacity J/kg·K 200 - 1000 E1461-13
Table I. List of material property inputs for thermomechanical modeling of crucibles.
EXPERIMENTALFinite element analysis (FEA) was performed using ABAQUS 6.11 package with its heat transfer and temperature-displacement modules. A two-dimensional heat flow model was created based on the model for a typical bowl-shaped crucible (i.e. BU500) filled with 400 kg of molten aluminum. A three-dimensional model was based on a 100-kW electric-
resistance crucible furnace, from which temperature and energy consumption data were derived. For simulation in the computer models, multiple crucible types were considered, including both carbon- and ceramic (clay)-bonded varieties. As with any computer simulation, to develop the most realistic model, reliable “real-world” data are needed to describe the materials being tested. From specimens of finished crucible
refractory, many properties were measured, to include: bulk density, porosity, specific gravity, modulus of rupture (MOR), elastic (Young’s) modulus, thermal conductivity, and specific heat capacity (Table I). Energy data collected from customer trials was done so using a custom energy monitoring device (FCTM-2, Foseco) capable of simultaneously monitoring energy usage and molten metal throughput on the furnace.
RESULTS AND DISCUSSIONA two-dimensional axisymmetric model was constructed for the express purpose of studying the effects changes to crucibles (i.e. geometry; refractory properties) have on heat flow and aluminum melting efficiency. The model assumes a continuous, uniform heat flux is applied to the outside of a crucible (Figure 1). The model also assumes the crucible is partially filled with aluminum, allowing the inclusion of radiative heat transfer from a molten bath surface and the inside upper wall of the crucible. Figure 1B shows the nodal temperature contours at 3970 s and 5470 s of the simulation, which demonstrate the temperature gradients within the aluminum and the crucible. Without metal against the crucible upper wall
region to absorb the heat, it can end up superheated; heat can only be dissipated by radiation or downward conduction through the wall. This situation could lead to thermal shock cracks. Fortunately, the model is somewhat simplistic by assuming uniform heat flux; in an actual furnace the heating elements are typically shorter than the crucible is tall, which results in reduced heating of the upper wall.
While this does alleviate superheating problems, it tends to create the opposite situation – localized underheating, which leads to poor glaze protection, oxidation, and eventual thermal shock cracks anyway. The best practice is to use the furnace in a way that achieves a balance in these two phenomena; fill levels should be as high as safely possible to avoid steep temperature gradients along the crucible wall.
On the underside of the crucible at the center (Figure 1B) is its lowest relative temperature because it heats up the slowest. Within the aluminum, the lowest temperature position is in the top center (Figure 1B) due to its distance from the elements combined with surface radiation heat loss. However, since aluminum thermal conductivity is much higher that refractory, the temperature gradient in the metal is much smaller than within the crucible walls.
Page 05Foundry Practice Issue 266
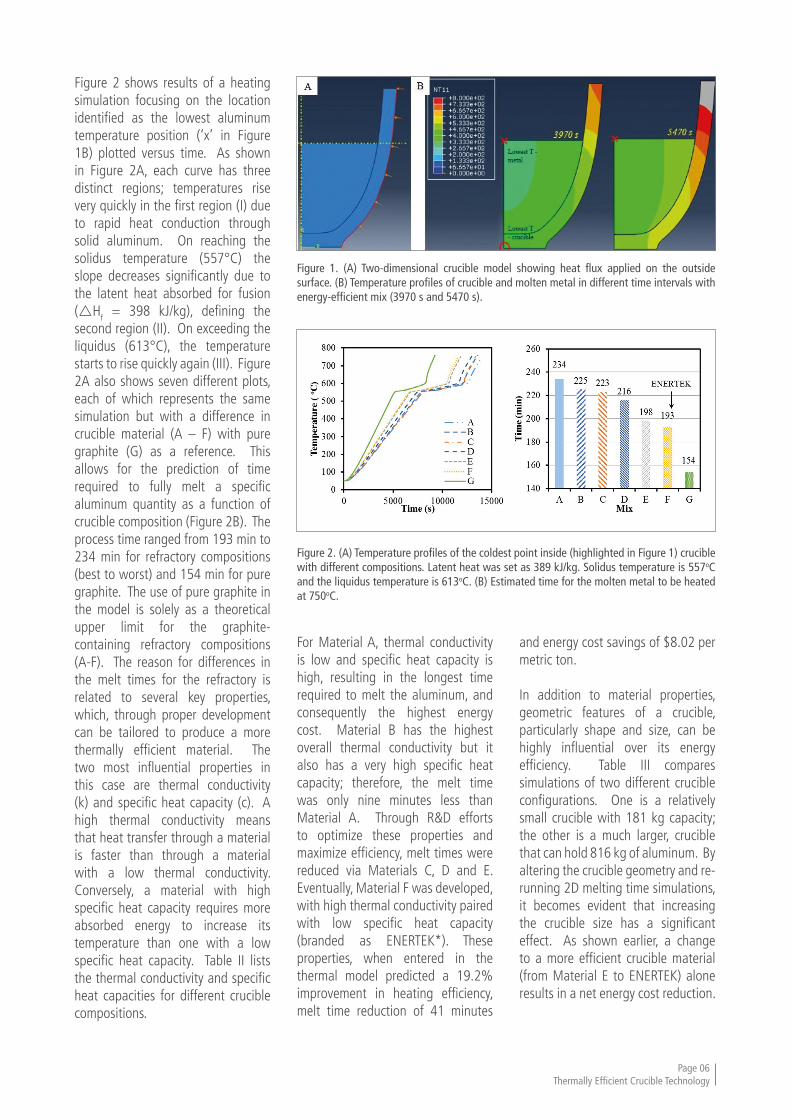
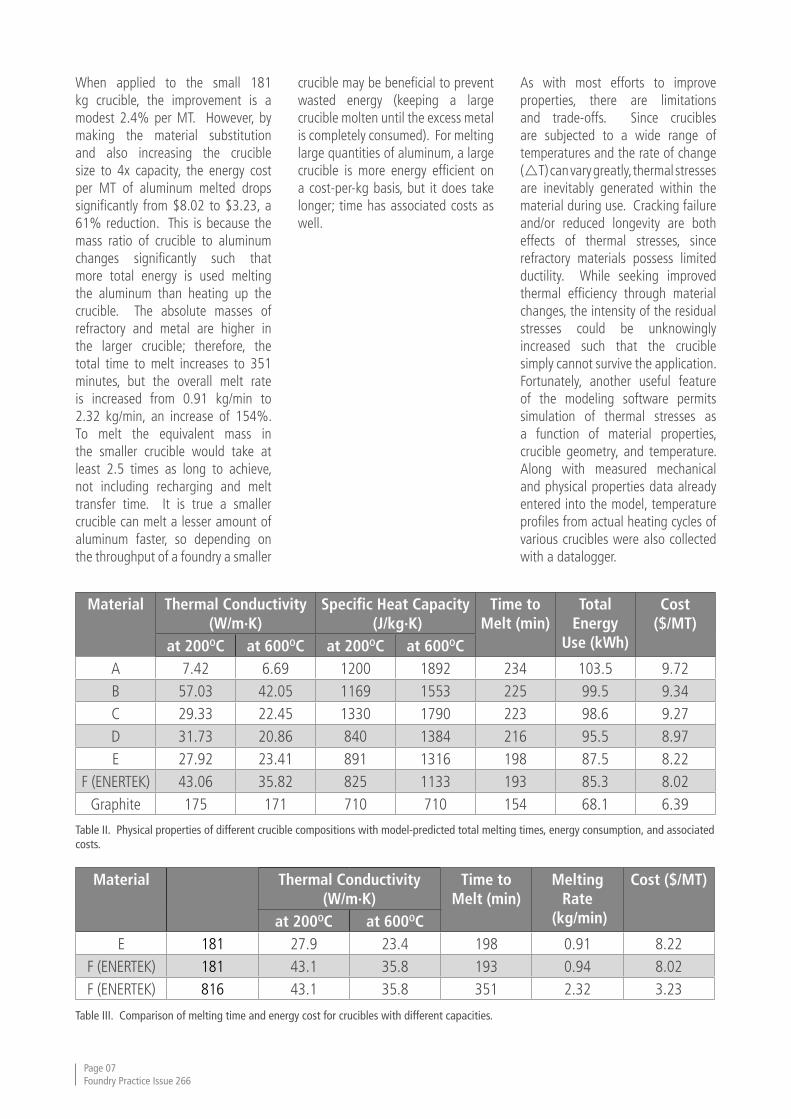
Figure 2 shows results of a heating simulation focusing on the location identified as the lowest aluminum temperature position (‘x’ in Figure 1B) plotted versus time. As shown in Figure 2A, each curve has three distinct regions; temperatures rise very quickly in the first region (I) due to rapid heat conduction through solid aluminum. On reaching the solidus temperature (557°C) the slope decreases significantly due to the latent heat absorbed for fusion (Hf = 398 kJ/kg), defining the second region (II). On exceeding the liquidus (613°C), the temperature starts to rise quickly again (III). Figure 2A also shows seven different plots, each of which represents the same simulation but with a difference in crucible material (A – F) with pure graphite (G) as a reference. This allows for the prediction of time required to fully melt a specific aluminum quantity as a function of crucible composition (Figure 2B). The process time ranged from 193 min to 234 min for refractory compositions (best to worst) and 154 min for pure graphite. The use of pure graphite in the model is solely as a theoretical upper limit for the graphite-containing refractory compositions (A-F). The reason for differences in the melt times for the refractory is related to several key properties, which, through proper development can be tailored to produce a more thermally efficient material. The two most influential properties in this case are thermal conductivity (k) and specific heat capacity (c). A high thermal conductivity means that heat transfer through a material is faster than through a material with a low thermal conductivity. Conversely, a material with high specific heat capacity requires more absorbed energy to increase its temperature than one with a low specific heat capacity. Table II lists the thermal conductivity and specific heat capacities for different crucible compositions.
For Material A, thermal conductivity is low and specific heat capacity is high, resulting in the longest time required to melt the aluminum, and consequently the highest energy cost. Material B has the highest overall thermal conductivity but it also has a very high specific heat capacity; therefore, the melt time was only nine minutes less than Material A. Through R&D efforts to optimize these properties and maximize efficiency, melt times were reduced via Materials C, D and E. Eventually, Material F was developed, with high thermal conductivity paired with low specific heat capacity (branded as ENERTEK*). These properties, when entered in the thermal model predicted a 19.2% improvement in heating efficiency, melt time reduction of 41 minutes
and energy cost savings of $8.02 per metric ton.
In addition to material properties, geometric features of a crucible, particularly shape and size, can be highly influential over its energy efficiency. Table III compares simulations of two different crucible configurations. One is a relatively small crucible with 181 kg capacity; the other is a much larger, crucible that can hold 816 kg of aluminum. By altering the crucible geometry and re-running 2D melting time simulations, it becomes evident that increasing the crucible size has a significant effect. As shown earlier, a change to a more efficient crucible material (from Material E to ENERTEK) alone results in a net energy cost reduction.
Figure 1. (A) Two-dimensional crucible model showing heat flux applied on the outside surface. (B) Temperature profiles of crucible and molten metal in different time intervals with energy-efficient mix (3970 s and 5470 s).
Figure 2. (A) Temperature profiles of the coldest point inside (highlighted in Figure 1) crucible with different compositions. Latent heat was set as 389 kJ/kg. Solidus temperature is 557oC and the liquidus temperature is 613oC. (B) Estimated time for the molten metal to be heated at 750oC.
Page 06Thermally Efficient Crucible Technology
Material Thermal Conductivity (W/m·K)
Specific Heat Capacity (J/kg·K)
Time to Melt (min)
Total Energy
Use (kWh)
Cost ($/MT)
at 200OC at 600OC at 200OC at 600OCA 7.42 6.69 1200 1892 234 103.5 9.72B 57.03 42.05 1169 1553 225 99.5 9.34C 29.33 22.45 1330 1790 223 98.6 9.27D 31.73 20.86 840 1384 216 95.5 8.97E 27.92 23.41 891 1316 198 87.5 8.22
F (ENERTEK) 43.06 35.82 825 1133 193 85.3 8.02Graphite 175 171 710 710 154 68.1 6.39
Table II. Physical properties of different crucible compositions with model-predicted total melting times, energy consumption, and associated costs.
Material Thermal Conductivity (W/m·K)
Time to Melt (min)
Melting Rate
(kg/min)
Cost ($/MT)
at 200OC at 600OCE 181 27.9 23.4 198 0.91 8.22
F (ENERTEK) 181 43.1 35.8 193 0.94 8.02F (ENERTEK) 816 43.1 35.8 351 2.32 3.23
Table III. Comparison of melting time and energy cost for crucibles with different capacities.
When applied to the small 181 kg crucible, the improvement is a modest 2.4% per MT. However, by making the material substitution and also increasing the crucible size to 4x capacity, the energy cost per MT of aluminum melted drops significantly from $8.02 to $3.23, a 61% reduction. This is because the mass ratio of crucible to aluminum changes significantly such that more total energy is used melting the aluminum than heating up the crucible. The absolute masses of refractory and metal are higher in the larger crucible; therefore, the total time to melt increases to 351 minutes, but the overall melt rate is increased from 0.91 kg/min to 2.32 kg/min, an increase of 154%. To melt the equivalent mass in the smaller crucible would take at least 2.5 times as long to achieve, not including recharging and melt transfer time. It is true a smaller crucible can melt a lesser amount of aluminum faster, so depending on the throughput of a foundry a smaller
crucible may be beneficial to prevent wasted energy (keeping a large crucible molten until the excess metal is completely consumed). For melting large quantities of aluminum, a large crucible is more energy efficient on a cost-per-kg basis, but it does take longer; time has associated costs as well.
As with most efforts to improve properties, there are limitations and trade-offs. Since crucibles are subjected to a wide range of temperatures and the rate of change (T) can vary greatly, thermal stresses are inevitably generated within the material during use. Cracking failure and/or reduced longevity are both effects of thermal stresses, since refractory materials possess limited ductility. While seeking improved thermal efficiency through material changes, the intensity of the residual stresses could be unknowingly increased such that the crucible simply cannot survive the application. Fortunately, another useful feature of the modeling software permits simulation of thermal stresses as a function of material properties, crucible geometry, and temperature. Along with measured mechanical and physical properties data already entered into the model, temperature profiles from actual heating cycles of various crucibles were also collected with a datalogger.
Page 07Foundry Practice Issue 266
Using this added information, thermal stress states could be predicted using the temperature-displacement model in ABAQUS.
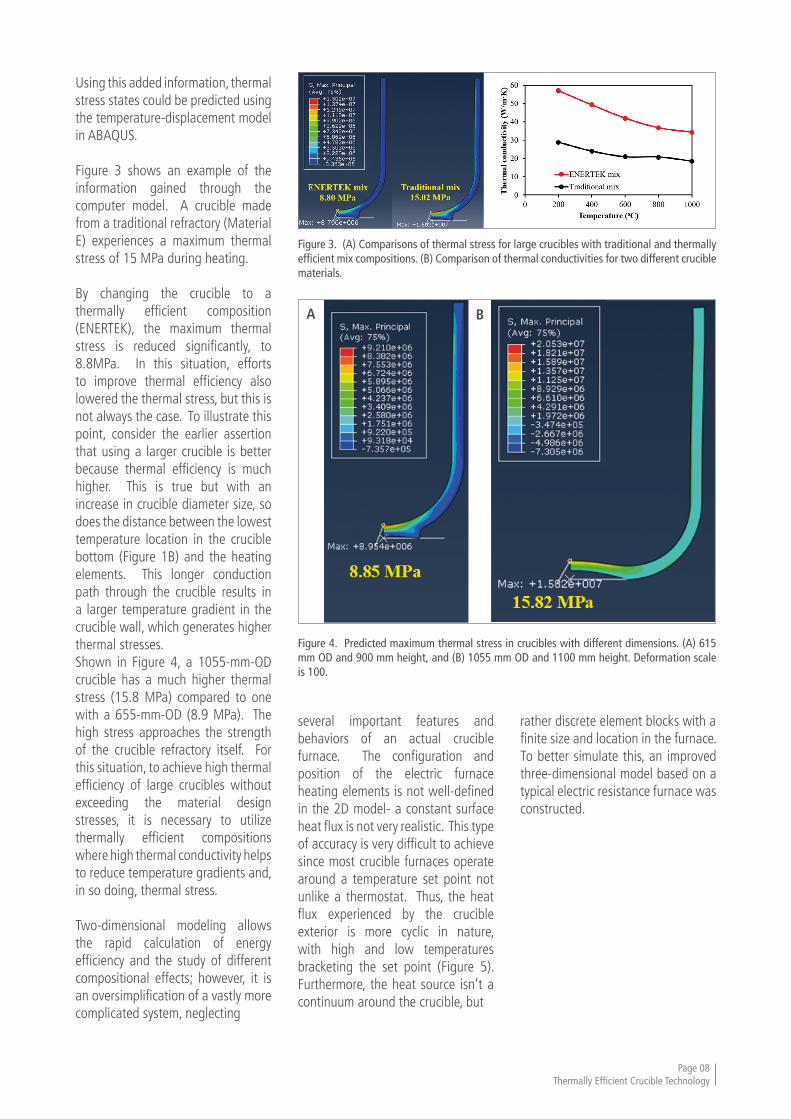
Figure 3 shows an example of the information gained through the computer model. A crucible made from a traditional refractory (Material E) experiences a maximum thermal stress of 15 MPa during heating.
By changing the crucible to a thermally efficient composition (ENERTEK), the maximum thermal stress is reduced significantly, to 8.8MPa. In this situation, efforts to improve thermal efficiency also lowered the thermal stress, but this is not always the case. To illustrate this point, consider the earlier assertion that using a larger crucible is better because thermal efficiency is much higher. This is true but with an increase in crucible diameter size, so does the distance between the lowest temperature location in the crucible bottom (Figure 1B) and the heating elements. This longer conduction path through the crucible results in a larger temperature gradient in the crucible wall, which generates higher thermal stresses. Shown in Figure 4, a 1055-mm-OD crucible has a much higher thermal stress (15.8 MPa) compared to one with a 655-mm-OD (8.9 MPa). The high stress approaches the strength of the crucible refractory itself. For this situation, to achieve high thermal efficiency of large crucibles without exceeding the material design stresses, it is necessary to utilize thermally efficient compositions where high thermal conductivity helps to reduce temperature gradients and, in so doing, thermal stress.
Two-dimensional modeling allows the rapid calculation of energy efficiency and the study of different compositional effects; however, it is an oversimplification of a vastly more complicated system, neglecting
several important features and behaviors of an actual crucible furnace. The configuration and position of the electric furnace heating elements is not well-defined in the 2D model- a constant surface heat flux is not very realistic. This type of accuracy is very difficult to achieve since most crucible furnaces operate around a temperature set point not unlike a thermostat. Thus, the heat flux experienced by the crucible exterior is more cyclic in nature, with high and low temperatures bracketing the set point (Figure 5). Furthermore, the heat source isn’t a continuum around the crucible, but
rather discrete element blocks with a finite size and location in the furnace. To better simulate this, an improved three-dimensional model based on a typical electric resistance furnace was constructed.
Figure 3. (A) Comparisons of thermal stress for large crucibles with traditional and thermally efficient mix compositions. (B) Comparison of thermal conductivities for two different crucible materials.
Figure 4. Predicted maximum thermal stress in crucibles with different dimensions. (A) 615 mm OD and 900 mm height, and (B) 1055 mm OD and 1100 mm height. Deformation scale is 100.
Page 08Thermally Efficient Crucible Technology
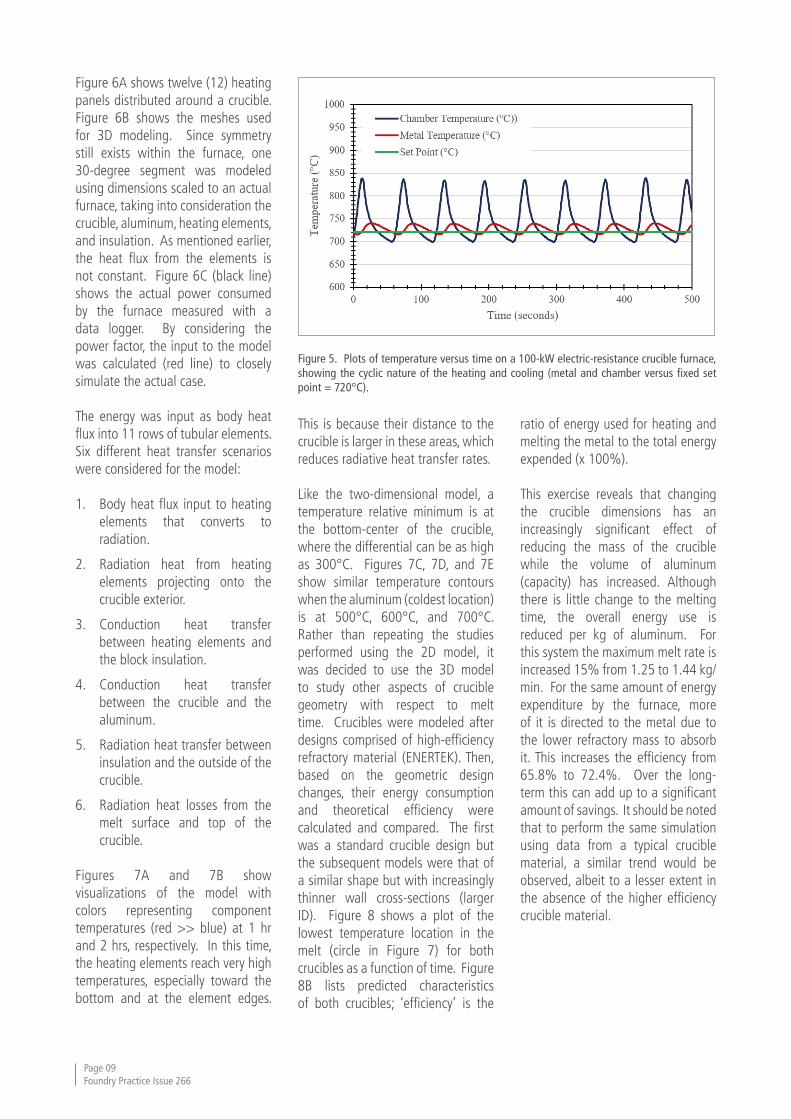
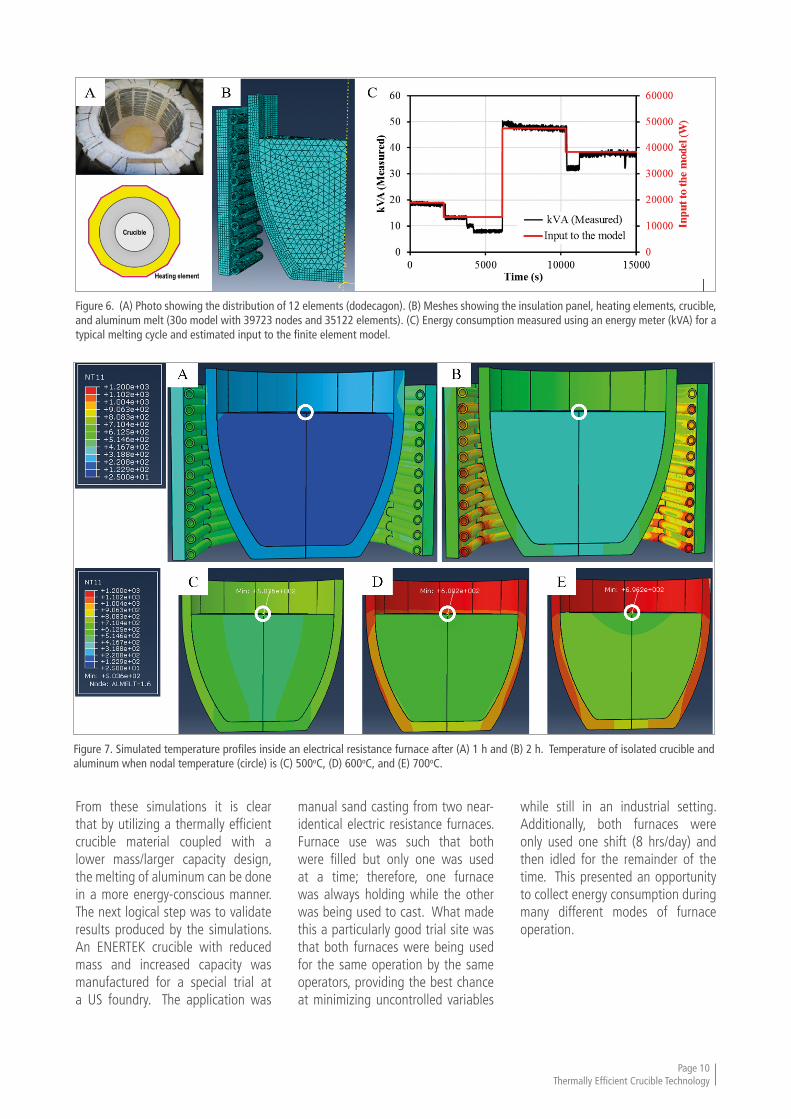
Figure 6A shows twelve (12) heating panels distributed around a crucible. Figure 6B shows the meshes used for 3D modeling. Since symmetry still exists within the furnace, one 30-degree segment was modeled using dimensions scaled to an actual furnace, taking into consideration the crucible, aluminum, heating elements, and insulation. As mentioned earlier, the heat flux from the elements is not constant. Figure 6C (black line) shows the actual power consumed by the furnace measured with a data logger. By considering the power factor, the input to the model was calculated (red line) to closely simulate the actual case.
The energy was input as body heat flux into 11 rows of tubular elements. Six different heat transfer scenarios were considered for the model:
1. Body heat flux input to heating elements that converts to radiation.
2. Radiation heat from heating elements projecting onto the crucible exterior.
3. Conduction heat transfer between heating elements and the block insulation.
4. Conduction heat transfer between the crucible and the aluminum.
5. Radiation heat transfer between insulation and the outside of the crucible.
6. Radiation heat losses from the melt surface and top of the crucible.
Figures 7A and 7B show visualizations of the model with colors representing component temperatures (red >> blue) at 1 hr and 2 hrs, respectively. In this time, the heating elements reach very high temperatures, especially toward the bottom and at the element edges.
This is because their distance to the crucible is larger in these areas, which reduces radiative heat transfer rates.
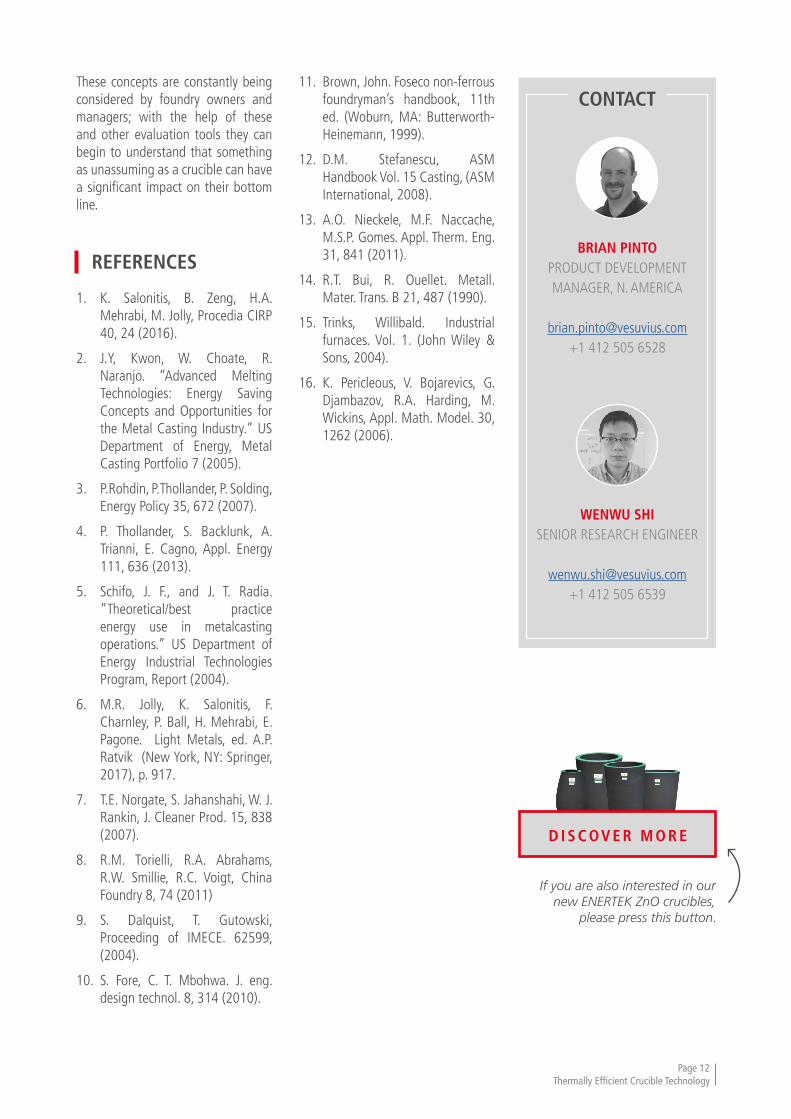
Like the two-dimensional model, a temperature relative minimum is at the bottom-center of the crucible, where the differential can be as high as 300°C. Figures 7C, 7D, and 7E show similar temperature contours when the aluminum (coldest location) is at 500°C, 600°C, and 700°C. Rather than repeating the studies performed using the 2D model, it was decided to use the 3D model to study other aspects of crucible geometry with respect to melt time. Crucibles were modeled after designs comprised of high-efficiency refractory material (ENERTEK). Then, based on the geometric design changes, their energy consumption and theoretical efficiency were calculated and compared. The first was a standard crucible design but the subsequent models were that of a similar shape but with increasingly thinner wall cross-sections (larger ID). Figure 8 shows a plot of the lowest temperature location in the melt (circle in Figure 7) for both crucibles as a function of time. Figure 8B lists predicted characteristics of both crucibles; ‘efficiency’ is the
ratio of energy used for heating and melting the metal to the total energy expended (x 100%).
This exercise reveals that changing the crucible dimensions has an increasingly significant effect of reducing the mass of the crucible while the volume of aluminum (capacity) has increased. Although there is little change to the melting time, the overall energy use is reduced per kg of aluminum. For this system the maximum melt rate is increased 15% from 1.25 to 1.44 kg/min. For the same amount of energy expenditure by the furnace, more of it is directed to the metal due to the lower refractory mass to absorb it. This increases the efficiency from 65.8% to 72.4%. Over the long-term this can add up to a significant amount of savings. It should be noted that to perform the same simulation using data from a typical crucible material, a similar trend would be observed, albeit to a lesser extent in the absence of the higher efficiency crucible material.
Figure 5. Plots of temperature versus time on a 100-kW electric-resistance crucible furnace, showing the cyclic nature of the heating and cooling (metal and chamber versus fixed set point = 720°C).
Page 09Foundry Practice Issue 266
From these simulations it is clear that by utilizing a thermally efficient crucible material coupled with a lower mass/larger capacity design, the melting of aluminum can be done in a more energy-conscious manner. The next logical step was to validate results produced by the simulations. An ENERTEK crucible with reduced mass and increased capacity was manufactured for a special trial at a US foundry. The application was
manual sand casting from two near-identical electric resistance furnaces. Furnace use was such that both were filled but only one was used at a time; therefore, one furnace was always holding while the other was being used to cast. What made this a particularly good trial site was that both furnaces were being used for the same operation by the same operators, providing the best chance at minimizing uncontrolled variables
while still in an industrial setting. Additionally, both furnaces were only used one shift (8 hrs/day) and then idled for the remainder of the time. This presented an opportunity to collect energy consumption during many different modes of furnace operation.
Page 10Thermally Efficient Crucible Technology
Figure 6. (A) Photo showing the distribution of 12 elements (dodecagon). (B) Meshes showing the insulation panel, heating elements, crucible, and aluminum melt (30o model with 39723 nodes and 35122 elements). (C) Energy consumption measured using an energy meter (kVA) for a typical melting cycle and estimated input to the finite element model.
Figure 7. Simulated temperature profiles inside an electrical resistance furnace after (A) 1 h and (B) 2 h. Temperature of isolated crucible and aluminum when nodal temperature (circle) is (C) 500oC, (D) 600oC, and (E) 700oC.
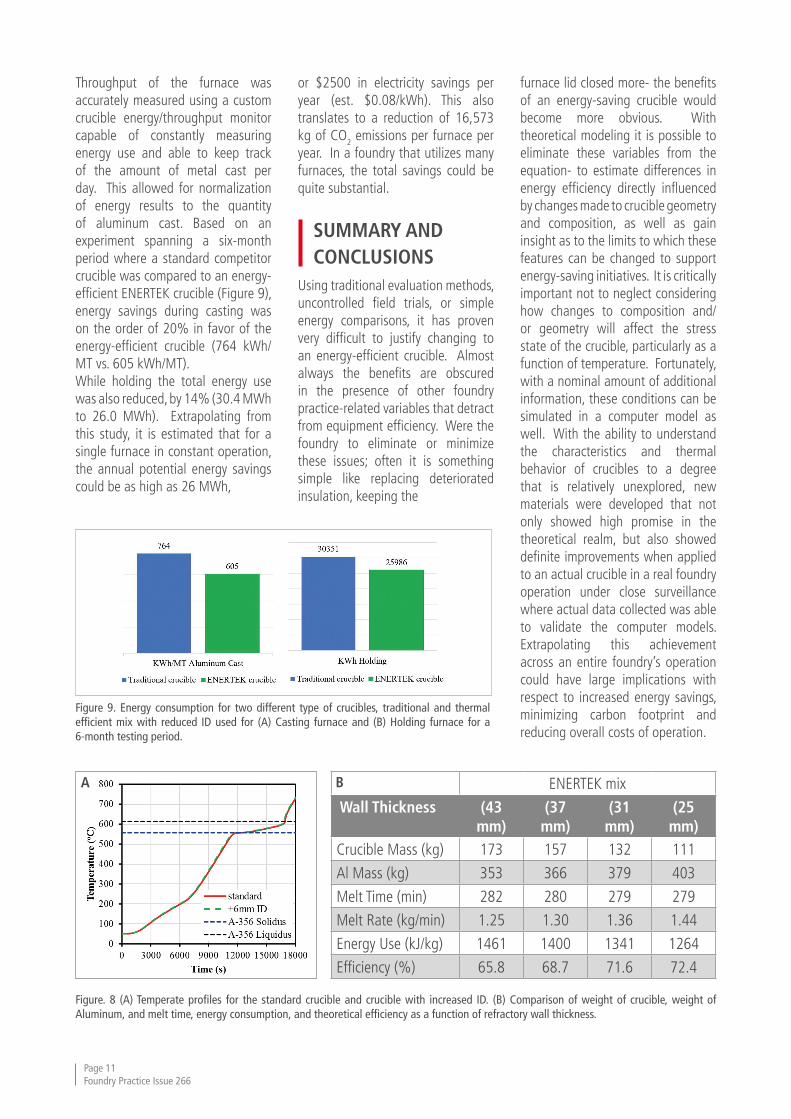
Throughput of the furnace was accurately measured using a custom crucible energy/throughput monitor capable of constantly measuring energy use and able to keep track of the amount of metal cast per day. This allowed for normalization of energy results to the quantity of aluminum cast. Based on an experiment spanning a six-month period where a standard competitor crucible was compared to an energy-efficient ENERTEK crucible (Figure 9), energy savings during casting was on the order of 20% in favor of the energy-efficient crucible (764 kWh/MT vs. 605 kWh/MT). While holding the total energy use was also reduced, by 14% (30.4 MWh to 26.0 MWh). Extrapolating from this study, it is estimated that for a single furnace in constant operation, the annual potential energy savings could be as high as 26 MWh,
or $2500 in electricity savings per year (est. $0.08/kWh). This also translates to a reduction of 16,573 kg of CO2 emissions per furnace per year. In a foundry that utilizes many furnaces, the total savings could be quite substantial.
SUMMARY AND CONCLUSIONS Using traditional evaluation methods, uncontrolled field trials, or simple energy comparisons, it has proven very difficult to justify changing to an energy-efficient crucible. Almost always the benefits are obscured in the presence of other foundry practice-related variables that detract from equipment efficiency. Were the foundry to eliminate or minimize these issues; often it is something simple like replacing deteriorated insulation, keeping the
furnace lid closed more- the benefits of an energy-saving crucible would become more obvious. With theoretical modeling it is possible to eliminate these variables from the equation- to estimate differences in energy efficiency directly influenced by changes made to crucible geometry and composition, as well as gain insight as to the limits to which these features can be changed to support energy-saving initiatives. It is critically important not to neglect considering how changes to composition and/or geometry will affect the stress state of the crucible, particularly as a function of temperature. Fortunately, with a nominal amount of additional information, these conditions can be simulated in a computer model as well. With the ability to understand the characteristics and thermal behavior of crucibles to a degree that is relatively unexplored, new materials were developed that not only showed high promise in the theoretical realm, but also showed definite improvements when applied to an actual crucible in a real foundry operation under close surveillance where actual data collected was able to validate the computer models. Extrapolating this achievement across an entire foundry’s operation could have large implications with respect to increased energy savings, minimizing carbon footprint and reducing overall costs of operation.
Figure. 8 (A) Temperate profiles for the standard crucible and crucible with increased ID. (B) Comparison of weight of crucible, weight of Aluminum, and melt time, energy consumption, and theoretical efficiency as a function of refractory wall thickness.
Figure 9. Energy consumption for two different type of crucibles, traditional and thermal efficient mix with reduced ID used for (A) Casting furnace and (B) Holding furnace for a 6-month testing period.
ENERTEK mix
Wall Thickness (43 mm)
(37 mm)
(31 mm)
(25 mm)
Crucible Mass (kg) 173 157 132 111
Al Mass (kg) 353 366 379 403
Melt Time (min) 282 280 279 279
Melt Rate (kg/min) 1.25 1.30 1.36 1.44
Energy Use (kJ/kg) 1461 1400 1341 1264
Efficiency (%) 65.8 68.7 71.6 72.4
Page 11Foundry Practice Issue 266
These concepts are constantly being considered by foundry owners and managers; with the help of these and other evaluation tools they can begin to understand that something as unassuming as a crucible can have a significant impact on their bottom line.
REFERENCES
1. K. Salonitis, B. Zeng, H.A. Mehrabi, M. Jolly, Procedia CIRP 40, 24 (2016).
2. J.Y, Kwon, W. Choate, R. Naranjo. “Advanced Melting Technologies: Energy Saving Concepts and Opportunities for the Metal Casting Industry.” US Department of Energy, Metal Casting Portfolio 7 (2005).
3. P.Rohdin, P.Thollander, P. Solding, Energy Policy 35, 672 (2007).
4. P. Thollander, S. Backlunk, A. Trianni, E. Cagno, Appl. Energy 111, 636 (2013).
5. Schifo, J. F., and J. T. Radia. “Theoretical/best practice energy use in metalcasting operations.” US Department of Energy Industrial Technologies Program, Report (2004).
6. M.R. Jolly, K. Salonitis, F. Charnley, P. Ball, H. Mehrabi, E. Pagone. Light Metals, ed. A.P. Ratvik (New York, NY: Springer, 2017), p. 917.
7. T.E. Norgate, S. Jahanshahi, W. J. Rankin, J. Cleaner Prod. 15, 838 (2007).
8. R.M. Torielli, R.A. Abrahams, R.W. Smillie, R.C. Voigt, China Foundry 8, 74 (2011)
9. S. Dalquist, T. Gutowski, Proceeding of IMECE. 62599, (2004).
10. S. Fore, C. T. Mbohwa. J. eng. design technol. 8, 314 (2010).
11. Brown, John. Foseco non-ferrous foundryman’s handbook, 11th ed. (Woburn, MA: Butterworth-Heinemann, 1999).
12. D.M. Stefanescu, ASM Handbook Vol. 15 Casting, (ASM International, 2008).
13. A.O. Nieckele, M.F. Naccache, M.S.P. Gomes. Appl. Therm. Eng. 31, 841 (2011).
14. R.T. Bui, R. Ouellet. Metall. Mater. Trans. B 21, 487 (1990).
15. Trinks, Willibald. Industrial furnaces. Vol. 1. (John Wiley & Sons, 2004).
16. K. Pericleous, V. Bojarevics, G. Djambazov, R.A. Harding, M. Wickins, Appl. Math. Model. 30, 1262 (2006).
Page 12Thermally Efficient Crucible Technology
BRIAN PINTOPRODUCT DEVELOPMENT MANAGER, N. AMERICA
[email protected]+1 412 505 6528
WENWU SHISENIOR RESEARCH ENGINEER
[email protected]+1 412 505 6539
CONTACT
If you are also interested in our new ENERTEK ZnO crucibles,
please press this button.
D I S C OV E R M O R E
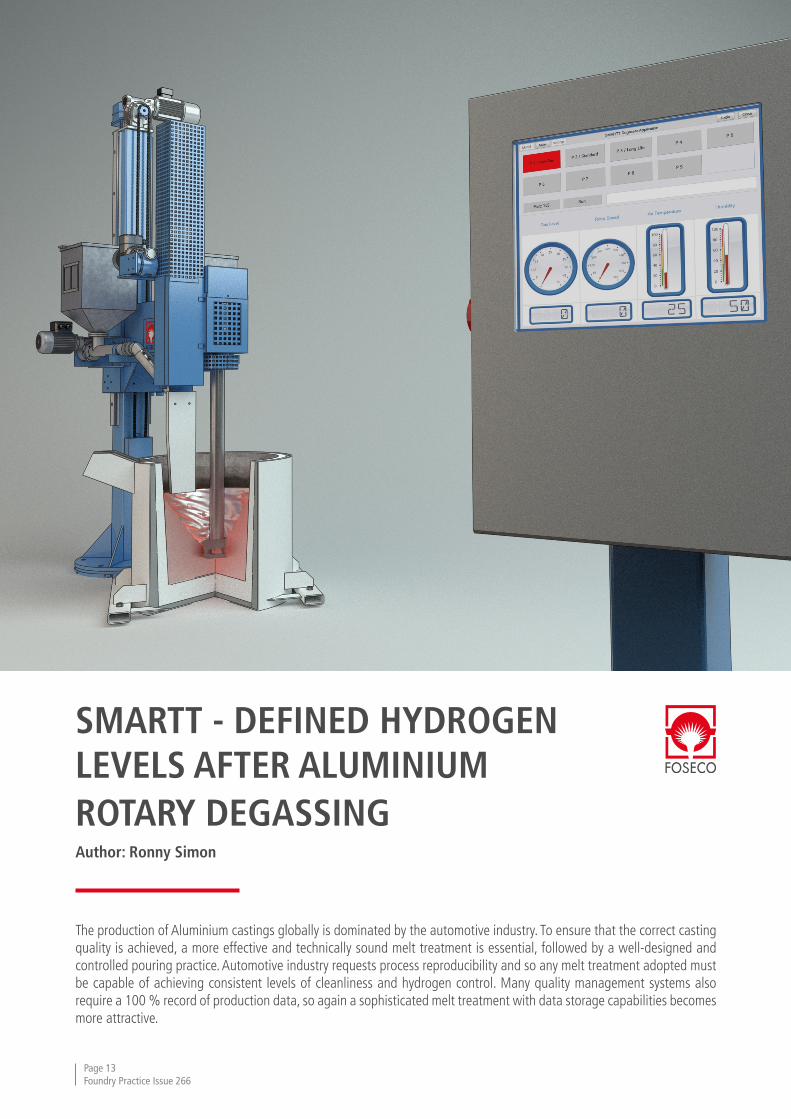
SMARTT - DEFINED HYDROGEN LEVELS AFTER ALUMINIUM ROTARY DEGASSINGAuthor: Ronny Simon
The production of Aluminium castings globally is dominated by the automotive industry. To ensure that the correct casting quality is achieved, a more effective and technically sound melt treatment is essential, followed by a well-designed and controlled pouring practice. Automotive industry requests process reproducibility and so any melt treatment adopted must be capable of achieving consistent levels of cleanliness and hydrogen control. Many quality management systems also require a 100 % record of production data, so again a sophisticated melt treatment with data storage capabilities becomes more attractive.
Page 13Foundry Practice Issue 266
INTRODUCTIONProcess control in general refers to the way in which foundries maintain a tight control over the various components and steps involved in making castings. The importance of process control is derived from the way in which a strict adherence to process control helps a foundry avert potentially costly mistakes. Considering the fact, that process control requires a complete monitoring of the various parameters, any potential problem will be spotted early, before it becomes a significant problem later.
The intelligent use of process control technologies within the manufacturing process has beneficial effects far beyond the traditional aspects of quality assurance:• Increase throughput from existing
assets• Increase automation and reduce
human intervention• Reduce rework, concessions and
scrap• Enhance production capability and
take on more work.
PARAMETERS INFLUENCING ROTARY TREATMENTSIn rotary degassing we differentiate between factors that are almost constant over longer periods of time and variable factors. Alloy composition, vessel geometry and target melt quality are often well known and do not change remarkably. Usually several programs are set in the PLC, defining treatment time, rotor speed and gas flow rate. The operator selects a program following given instructions. The number of programs is limited, the programs need to be changed manually in case of process variations, and the operator might choose the wrong program.
Other factors such as ambient conditions and melt temperatures often vary in much wider ranges. The influence on degassing is usually underestimated or operators change parameters based on their experiences. Variations in these starting conditions may cause inconsistent results.
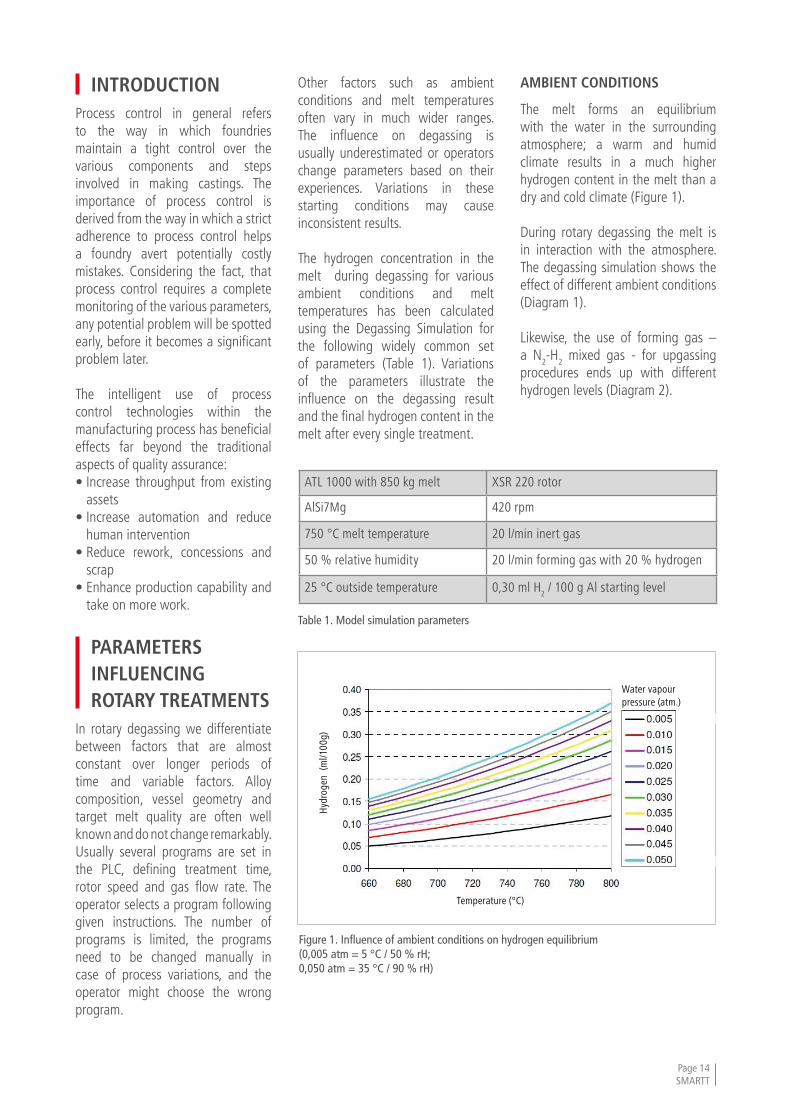
The hydrogen concentration in the melt during degassing for various ambient conditions and melt temperatures has been calculated using the Degassing Simulation for the following widely common set of parameters (Table 1). Variations of the parameters illustrate the influence on the degassing result and the final hydrogen content in the melt after every single treatment.
AMBIENT CONDITIONS
The melt forms an equilibrium with the water in the surrounding atmosphere; a warm and humid climate results in a much higher hydrogen content in the melt than a dry and cold climate (Figure 1).
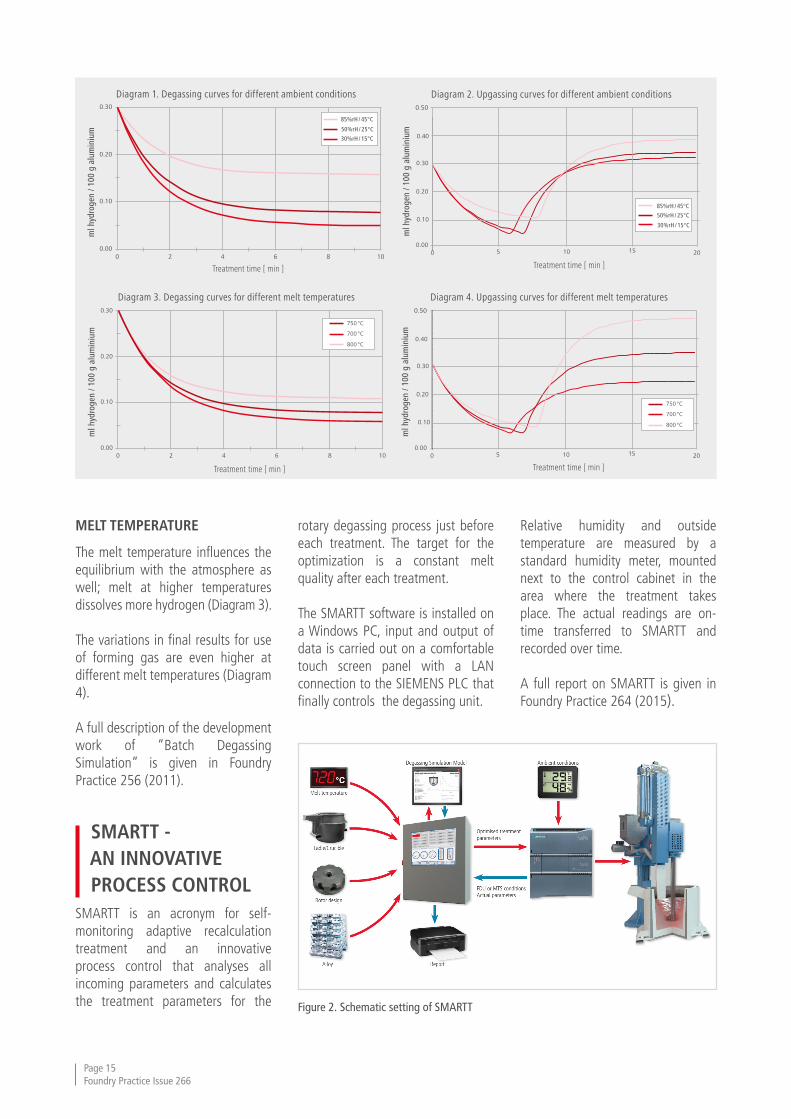
During rotary degassing the melt is in interaction with the atmosphere. The degassing simulation shows the effect of different ambient conditions (Diagram 1).
Likewise, the use of forming gas – a N2-H2 mixed gas - for upgassing procedures ends up with different hydrogen levels (Diagram 2).
Table 1. Model simulation parameters
Figure 1. Influence of ambient conditions on hydrogen equilibrium (0,005 atm = 5 °C / 50 % rH; 0,050 atm = 35 °C / 90 % rH)
Temperature (°C)
Hyd
roge
n (m
l/100
g)
Water vapour pressure (atm.)
ATL 1000 with 850 kg melt XSR 220 rotor
AlSi7Mg 420 rpm
750 °C melt temperature 20 l/min inert gas
50 % relative humidity 20 l/min forming gas with 20 % hydrogen
25 °C outside temperature 0,30 ml H2 / 100 g Al starting level
Page 14SMARTT
MELT TEMPERATURE
The melt temperature influences the equilibrium with the atmosphere as well; melt at higher temperatures dissolves more hydrogen (Diagram 3).
The variations in final results for use of forming gas are even higher at different melt temperatures (Diagram 4).
A full description of the development work of “Batch Degassing Simulation” is given in Foundry Practice 256 (2011).
SMARTT - AN INNOVATIVE PROCESS CONTROLSMARTT is an acronym for self-monitoring adaptive recalculation treatment and an innovative process control that analyses all incoming parameters and calculates the treatment parameters for the
rotary degassing process just before each treatment. The target for the optimization is a constant melt quality after each treatment.
The SMARTT software is installed on a Windows PC, input and output of data is carried out on a comfortable touch screen panel with a LAN connection to the SIEMENS PLC that finally controls the degassing unit.
Relative humidity and outside temperature are measured by a standard humidity meter, mounted next to the control cabinet in the area where the treatment takes place. The actual readings are on-time transferred to SMARTT and recorded over time.
A full report on SMARTT is given in Foundry Practice 264 (2015).
Figure 2. Schematic setting of SMARTT
0.30
0.20
0.10
0.00
Treatment time [ min ]
ml h
ydro
gen
/ 100
g a
lum
iniu
m
0 2 4 6 8 10
50%rH / 25°C
30%rH / 15°C
85%rH / 45°C
Treatment time [ min ]
ml h
ydro
gen
/ 100
g a
lum
iniu
m
Diagram 1. Degassing curves for different ambient conditions Diagram 2. Upgassing curves for different ambient conditions
Treatment time [ min ]
ml h
ydro
gen
/ 100
g a
lum
iniu
m
Diagram 3. Degassing curves for different melt temperatures Diagram 4. Upgassing curves for different melt temperatures0.30
0.20
0.10
0.00
Treatment time [ min ]
ml h
ydro
gen
/ 100
g a
lum
iniu
m
0 2 4 6 8 10
750 °C
700 °C
800 °C
0,00
0,05
0,10
0,15
0,20
0,25
0,30
0,35
0,40
0,45
0,50
0 2 4 6 8 10 12 14 16 18 20
Hydr
ogen
con
tent
[ m
l/100
gAl ]
Times [ min ]
50%rH / 25°C30%rH / 15°C85%rH / 45°C
0.50
0.40
0.30
0.000 5 10 15 20
0.20
0.1050%rH / 25°C
30%rH / 15°C
85%rH / 45°C
0,00
0,05
0,10
0,15
0,20
0,25
0,30
0,35
0,40
0,45
0,50
Hydr
ogen
con
tent
[ m
l/100
gAl ]
Times [ min ]
0.50
0.40
0.30
0.000 5 10 15 20
0.20
0.10
750 °C
700 °C
800 °C
Page 15Foundry Practice Issue 266
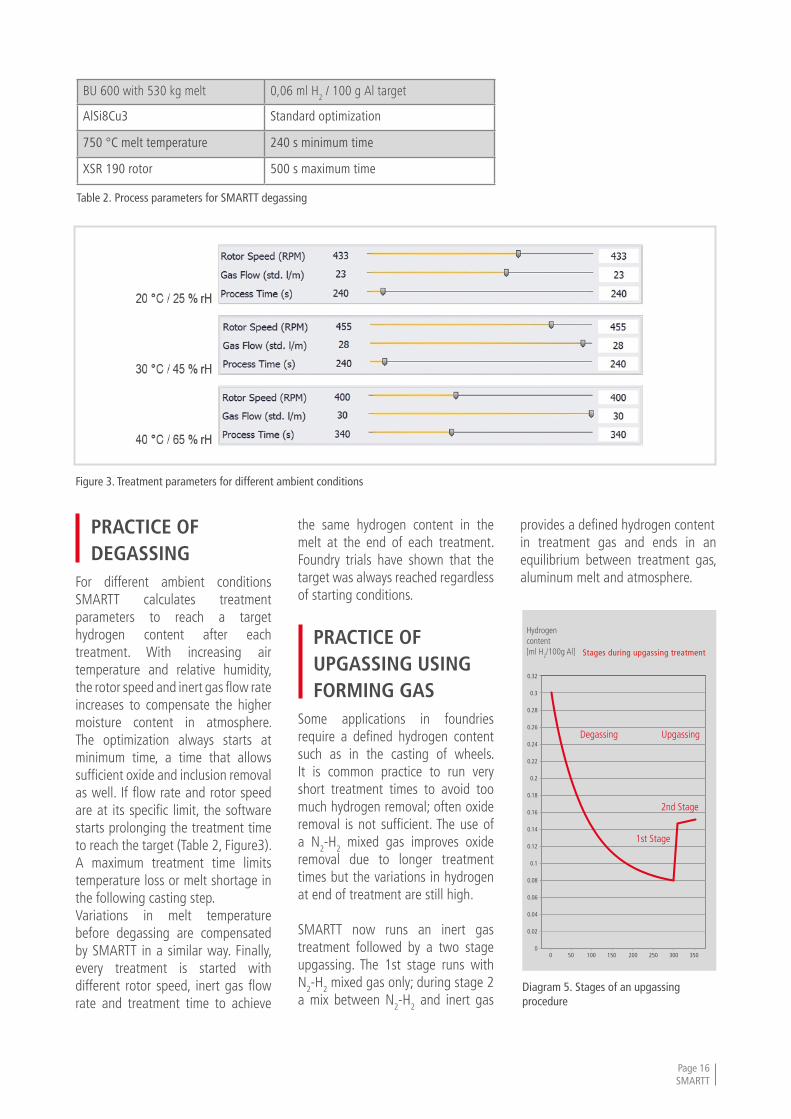
PRACTICE OF DEGASSINGFor different ambient conditions SMARTT calculates treatment parameters to reach a target hydrogen content after each treatment. With increasing air temperature and relative humidity, the rotor speed and inert gas flow rate increases to compensate the higher moisture content in atmosphere. The optimization always starts at minimum time, a time that allows sufficient oxide and inclusion removal as well. If flow rate and rotor speed are at its specific limit, the software starts prolonging the treatment time to reach the target (Table 2, Figure3). A maximum treatment time limits temperature loss or melt shortage in the following casting step.Variations in melt temperature before degassing are compensated by SMARTT in a similar way. Finally, every treatment is started with different rotor speed, inert gas flow rate and treatment time to achieve
the same hydrogen content in the melt at the end of each treatment. Foundry trials have shown that the target was always reached regardless of starting conditions.
PRACTICE OF UPGASSING USING FORMING GASSome applications in foundries require a defined hydrogen content such as in the casting of wheels. It is common practice to run very short treatment times to avoid too much hydrogen removal; often oxide removal is not sufficient. The use of a N2-H2 mixed gas improves oxide removal due to longer treatment times but the variations in hydrogen at end of treatment are still high.
SMARTT now runs an inert gas treatment followed by a two stage upgassing. The 1st stage runs with N2-H2 mixed gas only; during stage 2 a mix between N2-H2 and inert gas
provides a defined hydrogen content in treatment gas and ends in an equilibrium between treatment gas, aluminum melt and atmosphere.
Table 2. Process parameters for SMARTT degassing
Figure 3. Treatment parameters for different ambient conditions
Diagram 5. Stages of an upgassing procedure
BU 600 with 530 kg melt 0,06 ml H2 / 100 g Al target
AlSi8Cu3 Standard optimization
750 °C melt temperature 240 s minimum time
XSR 190 rotor 500 s maximum time
Stages during upgassing treatment
0.32
0.3
0.28
0.26
0.24
0.22
0.2
0.18
0.16
0.14
0.12
0.1
0.08
0.06
0.04
0.02
0 0 50 100 150 200 250 300 350
Degassing Upgassing
2nd Stage
1st Stage
Hydrogen content [ml H2/100g Al]
Page 16SMARTT
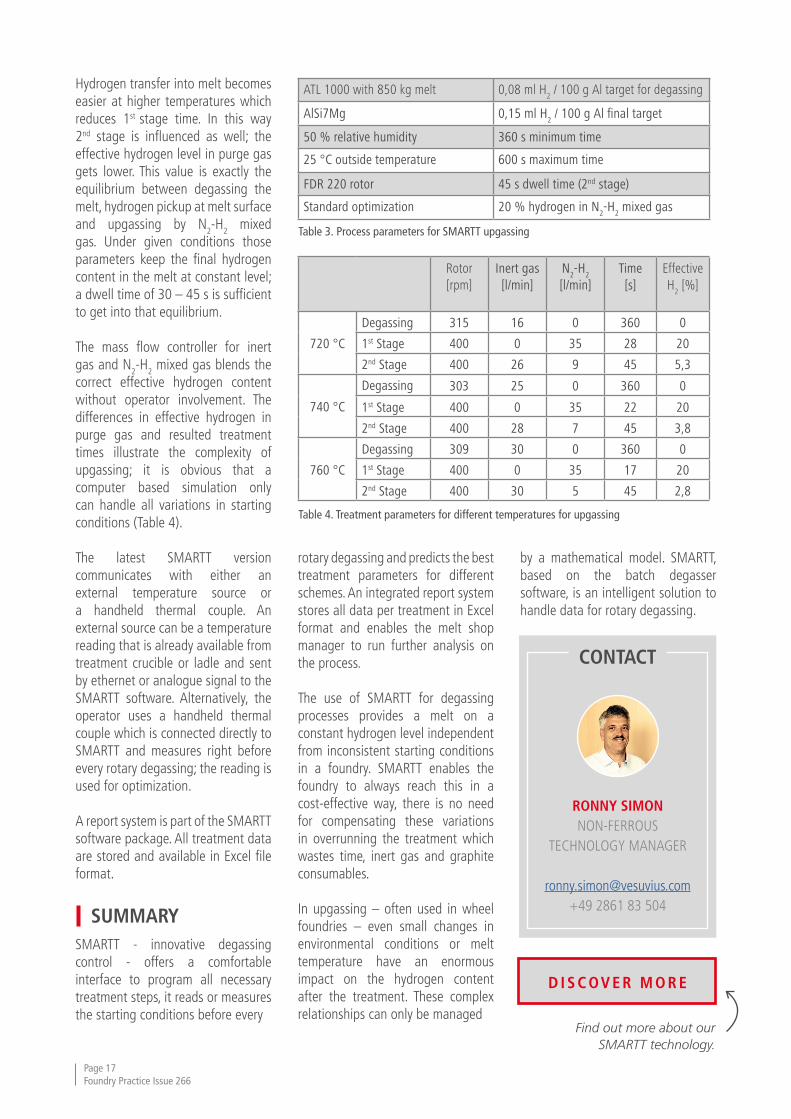
Hydrogen transfer into melt becomes easier at higher temperatures which reduces 1st stage time. In this way 2nd stage is influenced as well; the effective hydrogen level in purge gas gets lower. This value is exactly the equilibrium between degassing the melt, hydrogen pickup at melt surface and upgassing by N2-H2 mixed gas. Under given conditions those parameters keep the final hydrogen content in the melt at constant level; a dwell time of 30 – 45 s is sufficient to get into that equilibrium.
The mass flow controller for inert gas and N2-H2 mixed gas blends the correct effective hydrogen content without operator involvement. The differences in effective hydrogen in purge gas and resulted treatment times illustrate the complexity of upgassing; it is obvious that a computer based simulation only can handle all variations in starting conditions (Table 4).
The latest SMARTT version communicates with either an external temperature source or a handheld thermal couple. An external source can be a temperature reading that is already available from treatment crucible or ladle and sent by ethernet or analogue signal to the SMARTT software. Alternatively, the operator uses a handheld thermal couple which is connected directly to SMARTT and measures right before every rotary degassing; the reading is used for optimization.
A report system is part of the SMARTT software package. All treatment data are stored and available in Excel file format.
SUMMARYSMARTT - innovative degassing control - offers a comfortable interface to program all necessary treatment steps, it reads or measures the starting conditions before every
rotary degassing and predicts the best treatment parameters for different schemes. An integrated report system stores all data per treatment in Excel format and enables the melt shop manager to run further analysis on the process.
The use of SMARTT for degassing processes provides a melt on a constant hydrogen level independent from inconsistent starting conditions in a foundry. SMARTT enables the foundry to always reach this in a cost-effective way, there is no need for compensating these variations in overrunning the treatment which wastes time, inert gas and graphite consumables.
In upgassing – often used in wheel foundries – even small changes in environmental conditions or melt temperature have an enormous impact on the hydrogen content after the treatment. These complex relationships can only be managed
by a mathematical model. SMARTT, based on the batch degasser software, is an intelligent solution to handle data for rotary degassing.
Table 3. Process parameters for SMARTT upgassing
Table 4. Treatment parameters for different temperatures for upgassing
ATL 1000 with 850 kg melt 0,08 ml H2 / 100 g Al target for degassing
AlSi7Mg 0,15 ml H2 / 100 g Al final target
50 % relative humidity 360 s minimum time
25 °C outside temperature 600 s maximum time
FDR 220 rotor 45 s dwell time (2nd stage)
Standard optimization 20 % hydrogen in N2-H
2 mixed gas
Rotor[rpm]
Inert gas[l/min]
N2-H
2
[l/min]Time[s]
EffectiveH
2 [%]
720 °C
Degassing 315 16 0 360 0
1st Stage 400 0 35 28 20
2nd Stage 400 26 9 45 5,3
740 °C
Degassing 303 25 0 360 0
1st Stage 400 0 35 22 20
2nd Stage 400 28 7 45 3,8
760 °C
Degassing 309 30 0 360 0
1st Stage 400 0 35 17 20
2nd Stage 400 30 5 45 2,8
RONNY SIMONNON-FERROUS
TECHNOLOGY MANAGER
[email protected]+49 2861 83 504
CONTACT
Page 17Foundry Practice Issue 266
Find out more about our SMARTT technology.
D I S C OV E R M O R E
BEST PRACTICE FILTER APPLICATION TECHNIQUES FOR VERTICALLY PARTED MOLDING MACHINESAuthor: Tony Midea, A. Adams, B. Dickinson
Vertically parted molding machines were introduced to the foundry industry in the 1960’s, and have since grown to become the highest grossing method of producing iron casting tonnage. Ceramic foam filters were introduced in the 1970’s and have matured to become a consistently performing device that is able to meet the production demands of high speed, vertically parted molding machines, even those with the capability to produce up to 550 molds per hour. Countless filter application methods and techniques have been investigated by foundries, equipment manufacturers and suppliers alike to develop optimum foam filter applications to meet the high speed and precision placement requirements of the equipment. Some approaches have proven to be more successful than others. This initial work focuses on the effect of filter placement in the gating system and the print design itself on metal flow characteristics and casting quality.
Page 18Best Practice Filter Application Techniques
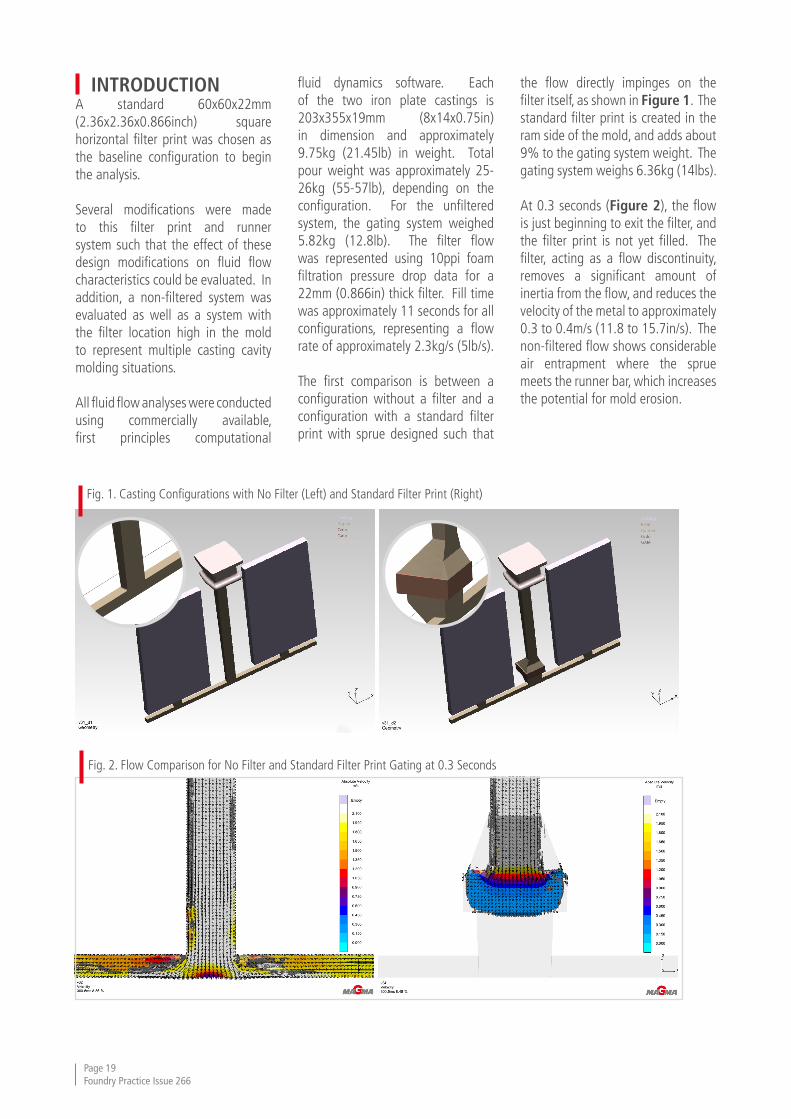
INTRODUCTIONA standard 60x60x22mm (2.36x2.36x0.866inch) square horizontal filter print was chosen as the baseline configuration to begin the analysis.
Several modifications were made to this filter print and runner system such that the effect of these design modifications on fluid flow characteristics could be evaluated. In addition, a non-filtered system was evaluated as well as a system with the filter location high in the mold to represent multiple casting cavity molding situations.
All fluid flow analyses were conducted using commercially available, first principles computational
fluid dynamics software. Each of the two iron plate castings is 203x355x19mm (8x14x0.75in) in dimension and approximately 9.75kg (21.45lb) in weight. Total pour weight was approximately 25-26kg (55-57lb), depending on the configuration. For the unfiltered system, the gating system weighed 5.82kg (12.8lb). The filter flow was represented using 10ppi foam filtration pressure drop data for a 22mm (0.866in) thick filter. Fill time was approximately 11 seconds for all configurations, representing a flow rate of approximately 2.3kg/s (5lb/s).
The first comparison is between a configuration without a filter and a configuration with a standard filter print with sprue designed such that
the flow directly impinges on the filter itself, as shown in Figure 1. The standard filter print is created in the ram side of the mold, and adds about 9% to the gating system weight. The gating system weighs 6.36kg (14lbs).
At 0.3 seconds (Figure 2), the flow is just beginning to exit the filter, and the filter print is not yet filled. The filter, acting as a flow discontinuity, removes a significant amount of inertia from the flow, and reduces the velocity of the metal to approximately 0.3 to 0.4m/s (11.8 to 15.7in/s). The non-filtered flow shows considerable air entrapment where the sprue meets the runner bar, which increases the potential for mold erosion.
Fig. 1. Casting Configurations with No Filter (Left) and Standard Filter Print (Right)
Fig. 2. Flow Comparison for No Filter and Standard Filter Print Gating at 0.3 Seconds
Page 19Foundry Practice Issue 266
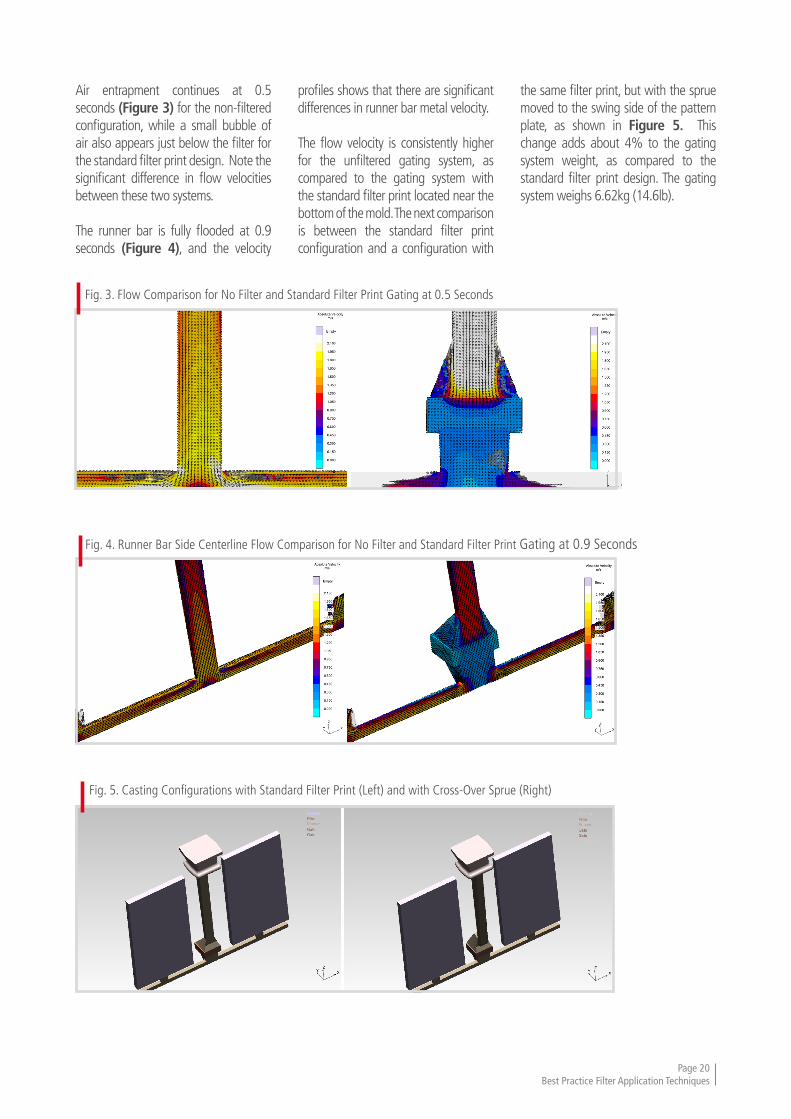
Air entrapment continues at 0.5 seconds (Figure 3) for the non-filtered configuration, while a small bubble of air also appears just below the filter for the standard filter print design. Note the significant difference in flow velocities between these two systems.
The runner bar is fully flooded at 0.9 seconds (Figure 4), and the velocity
profiles shows that there are significant differences in runner bar metal velocity.
The flow velocity is consistently higher for the unfiltered gating system, as compared to the gating system with the standard filter print located near the bottom of the mold. The next comparison is between the standard filter print configuration and a configuration with
the same filter print, but with the sprue moved to the swing side of the pattern plate, as shown in Figure 5. This change adds about 4% to the gating system weight, as compared to the standard filter print design. The gating system weighs 6.62kg (14.6lb).
Fig. 3. Flow Comparison for No Filter and Standard Filter Print Gating at 0.5 Seconds
Fig. 4. Runner Bar Side Centerline Flow Comparison for No Filter and Standard Filter Print Gating at 0.9 Seconds
Fig. 5. Casting Configurations with Standard Filter Print (Left) and with Cross-Over Sprue (Right)
Page 20Best Practice Filter Application Techniques
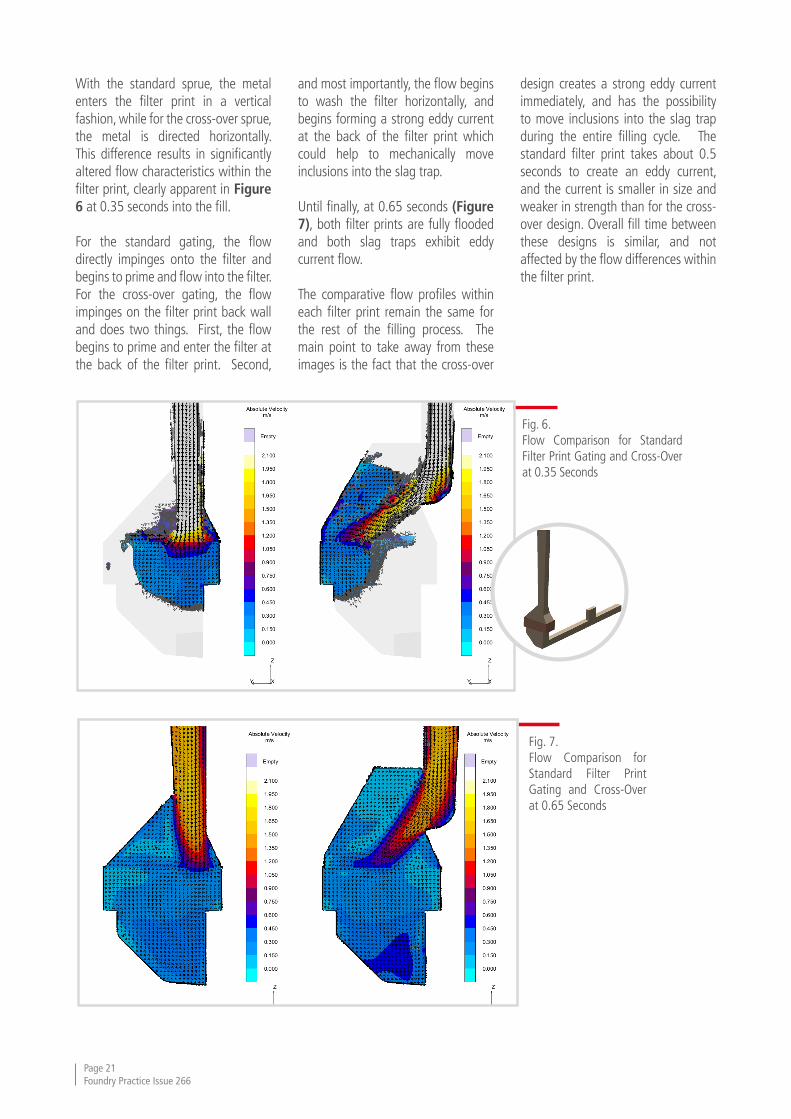
With the standard sprue, the metal enters the filter print in a vertical fashion, while for the cross-over sprue, the metal is directed horizontally. This difference results in significantly altered flow characteristics within the filter print, clearly apparent in Figure 6 at 0.35 seconds into the fill.
For the standard gating, the flow directly impinges onto the filter and begins to prime and flow into the filter. For the cross-over gating, the flow impinges on the filter print back wall and does two things. First, the flow begins to prime and enter the filter at the back of the filter print. Second,
and most importantly, the flow begins to wash the filter horizontally, and begins forming a strong eddy current at the back of the filter print which could help to mechanically move inclusions into the slag trap.
Until finally, at 0.65 seconds (Figure 7), both filter prints are fully flooded and both slag traps exhibit eddy current flow.
The comparative flow profiles within each filter print remain the same for the rest of the filling process. The main point to take away from these images is the fact that the cross-over
design creates a strong eddy current immediately, and has the possibility to move inclusions into the slag trap during the entire filling cycle. The standard filter print takes about 0.5 seconds to create an eddy current, and the current is smaller in size and weaker in strength than for the cross-over design. Overall fill time between these designs is similar, and not affected by the flow differences within the filter print.
Fig. 6. Flow Comparison for Standard Filter Print Gating and Cross-Over at 0.35 Seconds
Fig. 7. Flow Comparison for Standard Filter Print Gating and Cross-Over at 0.65 Seconds
Page 21Foundry Practice Issue 266
Qualitative, comparative analyses, like the ones shown thus far in this paper, can provide powerful, convincing imagery of gating system changes that positively or negatively affect metal flow characteristics.
Historically, comparative analyses between gating systems have provided sufficient evidence to trial and implement concepts and designs that improve metal flow and casting quality. However, an engineer is inclined to evaluate design concepts analytically, and to assign absolute values with visuals. In effect, an engineer desires to combine a quantitative analysis with a qualitative analysis.
This next section details how practical gating knowledge was combined with the software program’s optimization and design of experiments (DOE) features such that all five configurations could be simulated and quantitatively evaluated simultaneously.
The quantitative evaluation is based upon these three main calculated objectives:
1) The air entrapment objective criterion calculates the concentration of gas that has been trapped in the molten metal due to the collapse of air cavities. Higher values indicate unfavorable flow conditions resulting in the formation of small blowholes as well as defects due to chemical reactions. The results are shown as the percentage of gasses that has been dissolved in the molten metal.
2) The smooth filling objective criterion calculates the average amount of metal front free surface area during filling, and is another measure of the potential for gas related inclusions. It is calculated as an area, in millimeters.
3) The mold erosion criterion is calculated and recorded when the metal flow impinging on a mold mesh cell exceeds a certain velocity for a certain amount of time. This calculation is complicated, and is properly explained in the full paper.
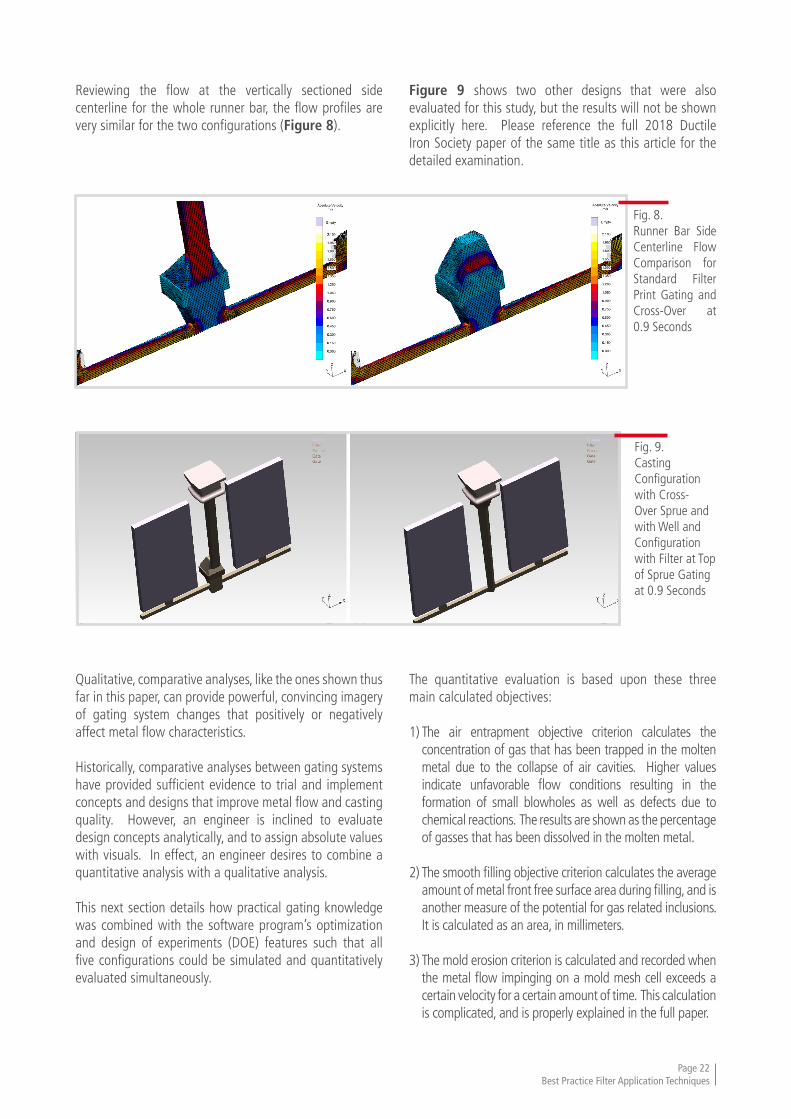
Reviewing the flow at the vertically sectioned side centerline for the whole runner bar, the flow profiles are very similar for the two configurations (Figure 8).
Figure 9 shows two other designs that were also evaluated for this study, but the results will not be shown explicitly here. Please reference the full 2018 Ductile Iron Society paper of the same title as this article for the detailed examination.
Fig. 8. Runner Bar Side Centerline Flow Comparison for Standard Filter Print Gating and Cross-Over at 0.9 Seconds
Fig. 9. Casting Configuration with Cross-Over Sprue and with Well and Configuration with Filter at Top of Sprue Gating at 0.9 Seconds
Page 22Best Practice Filter Application Techniques
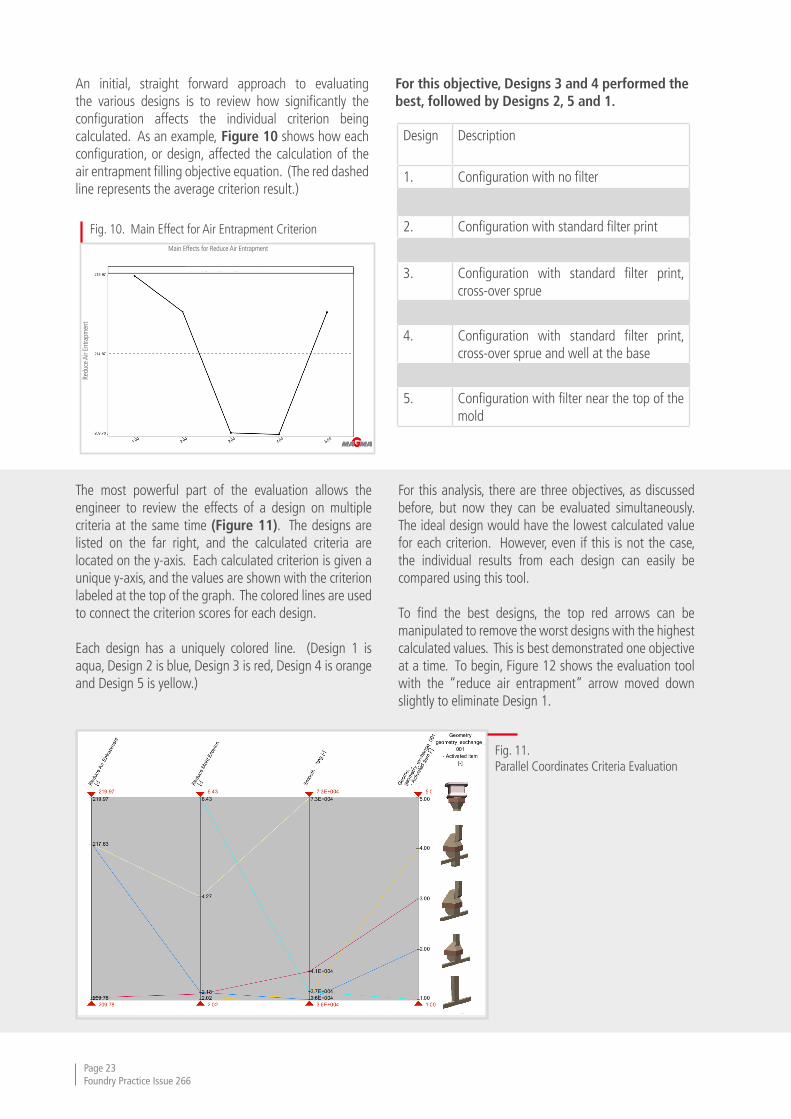
An initial, straight forward approach to evaluating the various designs is to review how significantly the configuration affects the individual criterion being calculated. As an example, Figure 10 shows how each configuration, or design, affected the calculation of the air entrapment filling objective equation. (The red dashed line represents the average criterion result.)
For this objective, Designs 3 and 4 performed the best, followed by Designs 2, 5 and 1.
Fig. 10. Main Effect for Air Entrapment Criterion
Design Description
1. Configuration with no filter
2. Configuration with standard filter print
3. Configuration with standard filter print, cross-over sprue
4. Configuration with standard filter print, cross-over sprue and well at the base
5. Configuration with filter near the top of the mold
Main Effects for Reduce Air Entrapment
Redu
ce A
ir En
trapm
ent
Fig. 11. Parallel Coordinates Criteria Evaluation
The most powerful part of the evaluation allows the engineer to review the effects of a design on multiple criteria at the same time (Figure 11). The designs are listed on the far right, and the calculated criteria are located on the y-axis. Each calculated criterion is given a unique y-axis, and the values are shown with the criterion labeled at the top of the graph. The colored lines are used to connect the criterion scores for each design.
Each design has a uniquely colored line. (Design 1 is aqua, Design 2 is blue, Design 3 is red, Design 4 is orange and Design 5 is yellow.)
For this analysis, there are three objectives, as discussed before, but now they can be evaluated simultaneously. The ideal design would have the lowest calculated value for each criterion. However, even if this is not the case, the individual results from each design can easily be compared using this tool.
To find the best designs, the top red arrows can be manipulated to remove the worst designs with the highest calculated values. This is best demonstrated one objective at a time. To begin, Figure 12 shows the evaluation tool with the “reduce air entrapment” arrow moved down slightly to eliminate Design 1.
Page 23Foundry Practice Issue 266
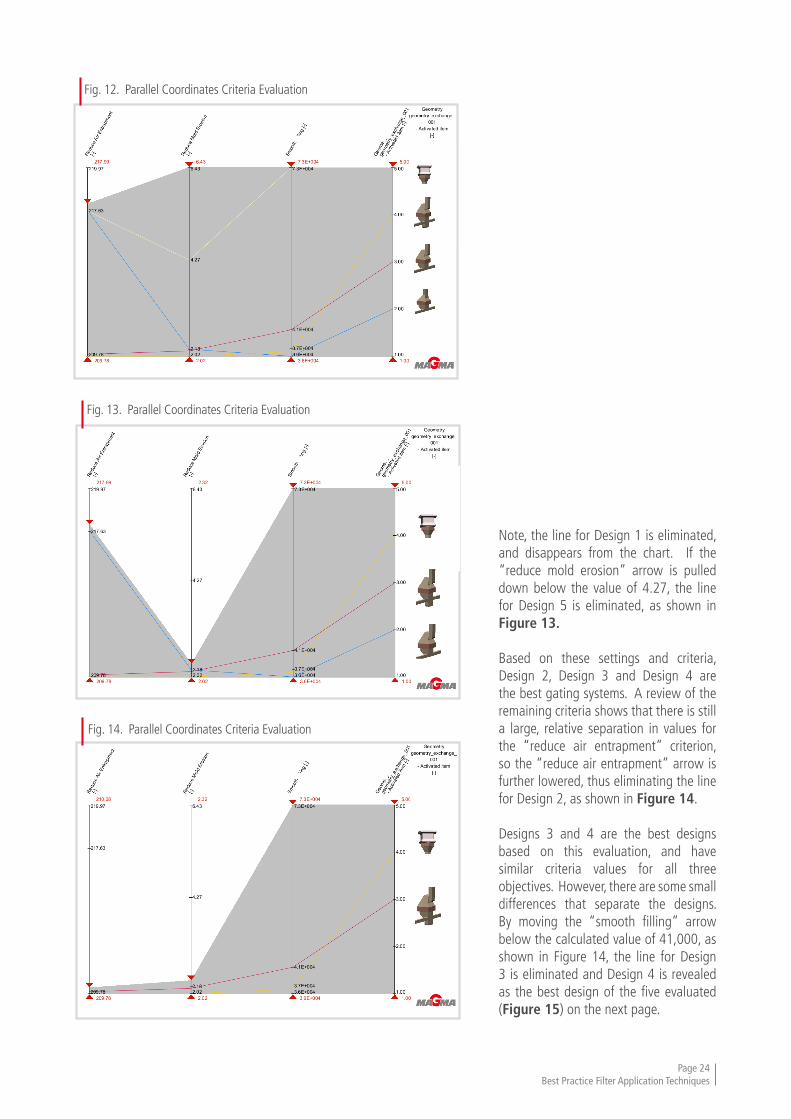
Fig. 12. Parallel Coordinates Criteria Evaluation
Fig. 13. Parallel Coordinates Criteria Evaluation
Note, the line for Design 1 is eliminated, and disappears from the chart. If the “reduce mold erosion” arrow is pulled down below the value of 4.27, the line for Design 5 is eliminated, as shown in Figure 13.
Based on these settings and criteria, Design 2, Design 3 and Design 4 are the best gating systems. A review of the remaining criteria shows that there is still a large, relative separation in values for the “reduce air entrapment” criterion, so the “reduce air entrapment” arrow is further lowered, thus eliminating the line for Design 2, as shown in Figure 14.
Designs 3 and 4 are the best designs based on this evaluation, and have similar criteria values for all three objectives. However, there are some small differences that separate the designs. By moving the “smooth filling” arrow below the calculated value of 41,000, as shown in Figure 14, the line for Design 3 is eliminated and Design 4 is revealed as the best design of the five evaluated (Figure 15) on the next page.
Fig. 14. Parallel Coordinates Criteria Evaluation
Page 24Best Practice Filter Application Techniques
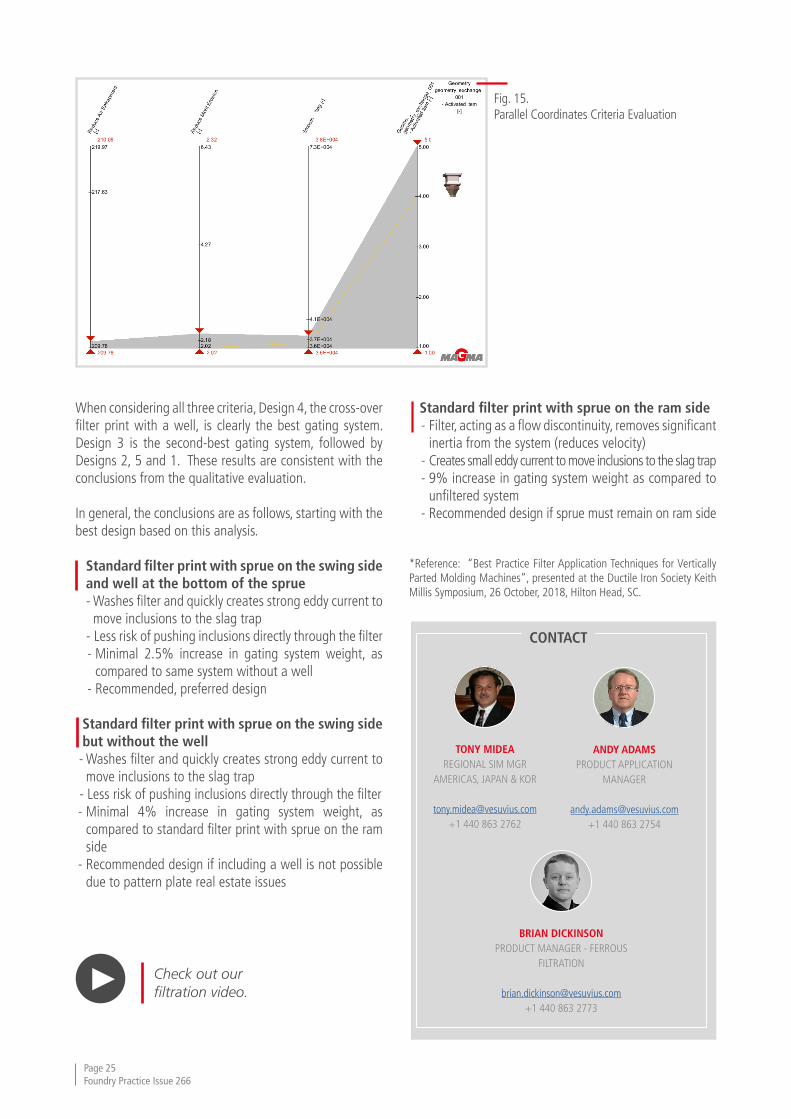
When considering all three criteria, Design 4, the cross-over filter print with a well, is clearly the best gating system. Design 3 is the second-best gating system, followed by Designs 2, 5 and 1. These results are consistent with the conclusions from the qualitative evaluation.
In general, the conclusions are as follows, starting with the best design based on this analysis.
Standard filter print with sprue on the swing side and well at the bottom of the sprue
- Washes filter and quickly creates strong eddy current to move inclusions to the slag trap
- Less risk of pushing inclusions directly through the filter - Minimal 2.5% increase in gating system weight, as
compared to same system without a well - Recommended, preferred design
Standard filter print with sprue on the swing side but without the well
- Washes filter and quickly creates strong eddy current to move inclusions to the slag trap
- Less risk of pushing inclusions directly through the filter - Minimal 4% increase in gating system weight, as
compared to standard filter print with sprue on the ram side
- Recommended design if including a well is not possible due to pattern plate real estate issues
Standard filter print with sprue on the ram side - Filter, acting as a flow discontinuity, removes significant
inertia from the system (reduces velocity) - Creates small eddy current to move inclusions to the slag trap - 9% increase in gating system weight as compared to
unfiltered system - Recommended design if sprue must remain on ram side
*Reference: “Best Practice Filter Application Techniques for Vertically Parted Molding Machines”, presented at the Ductile Iron Society Keith Millis Symposium, 26 October, 2018, Hilton Head, SC.
Fig. 15. Parallel Coordinates Criteria Evaluation
TONY MIDEAREGIONAL SIM MGR
AMERICAS, JAPAN & KOR
[email protected]+1 440 863 2762
ANDY ADAMSPRODUCT APPLICATION
MANAGER
[email protected]+1 440 863 2754
CONTACT
BRIAN DICKINSONPRODUCT MANAGER - FERROUS
FILTRATION
[email protected]+1 440 863 2773
Page 25Foundry Practice Issue 266
Check out our filtration video.

By assisting with the construction of reliable wind turbines -
with the help of our products and experts.
Castings are indispensable in the building of wind turbines, that not only generate large volumes of
energy, but are also able to withstand the strongest of storms.
Foundries have relied on having a strong partner at their side for more than 100 years, with innovative solu-
tions, efficient technologies and products of the highest quality. Together with the expertise of experienced
foundry engineers - worldwide and also directly on your doorstep.
FOLLOW US NOW ON
FOSECO. Your partner to build on.
WE HELP TO SAVE TONNES OF CO2 EVERY DAY.
linkedin.com/company/foseco

HALL 12 STAND A01/A02
OUR HIGHLIGHTS
FEEDING SYSTEMS• New, patented range of FEEDEX K VAK spot feeders• FEEDEX SCK modular feeders• FEEDEX NF1 range of exothermic feeders for Non Ferrous
COATINGS• ICU - Intelligent Coating Unit coating control system• INNER CLEANLINESS - Advances in coating
technology• New range of DYCOTE SAFEGUARD products for Non Ferrous
CRUCIBLES• New crucibles with a THERMACOAT external
coating layer• ENERTEK ZnO highlighting the energy and cost
saving potential
MELT SHOP REFRACTORIES• TRIAD Z range of no cement castables• New generation of multi-life KALTEK cold-start
insulating ladle linings
METALLURGICAL &POURING CONTROL
• Latest generation of SMARTT Melt Treatment Stations and Degassing units for Non Ferrous
• Newly developed FERROLAB V thermal analysis system
FILTRATION• HOLLOTEX Shroud for Steel application
FOSECO. Your partner to build on.
Foseco International LimitedP.O. Box 5516TamworthStaffordshireEngland B78 3XQRegistered in England No. 468147
VESUVIUS: black 85%
VESUVIUS: white
SEE YOU AT
gifa 2019
ISSN 0266 9994Printed in Germany400121428


