Embed Size (px)
Citation preview


Friedrich-Schiller-Universität Jena Biologisch-Pharmazeutische Fakultät
Institut für Ernährungswissenschften
Lehrstuhl für Ernährungsphysiologie
Development of novel methods for separation of trans fatty acids
and other nutritionally relevant or related fatty acids
Dissertation
zur Erlangung des akademischen Grades
doctor rerum naturalium (Dr. rer. nat.)
vorgelegt dem Rat der Biologisch-Pharmazeutischen Fakultät
der Friedrich-Schiller-Universität Jena
von
Ali Reza Fardin-Kia
geboren am 05.13.1973 in Teheran
College Park, 2013

Gutachter
Prof. Dr. Gerhard Jahreis
Friedrich-Schiller-Universität Jena, Institut für Ernährungswissenschaften, LS Ernährungs-
physiologie, Dornburger Str. 24, 07743 Jena
Prof. Dr. Jan Fritsche
Hochschule für Angewandte Wissenschaften Hamburg, Department ökotrophologie / Food
Science, Lohbrügger Kirchstr. 65, 21033 Hamburg
Prof. Dr. Sebastiano Banni
Universita’ Deglistudio di Cagliari, Sezione di Fisiologia, Cittadella Universitaria-SP8, Km
0.700-09042, Monserrato, Cagliari, Italy
Tag der öffentlichen Verteidigung: 24. Februar 2014

INDEX OF CONTENTS
INDEX OF CONTENTS PREAMBLE List of abbreviations …………………….................................... I List of manuscripts ……………………...................................... II CHAPTER 1 Introduction and objectives……………...................................... 1 CHAPTER 2 Preparation, chromatographic separation and relative retention times of cis/trans heptadecaenoic (17:1) fatty acids Pierluigi Delmonte, Qing Hu, Ali Reza Fardin-Kia, Jeanne I. Rader Journal of Chromatography A 1214, 30-36 (2008) ......................................... 29 CHAPTER 3 Review of Methods for Preparation and Gas Chromatographic Separation of trans and cis Reference Fatty Acids Pierluigi Delmonte, Ali Reza Fardin-Kia, Qing Hu, Jeanne I. Rader Journal of AOAC INTERNATIONAL 92, 1310-1326 (2009) ........................... 37 CHAPTER 4 Separation characteristics of fatty acid methyl esters using SLB-IL111, a new ionic liquid coated capillary gas chromatographic column Pierluigi Delmonte, Ali Reza Fardin-Kia, John K.G. Kramer, Magdi M. Mossoba, Len Sidisky, Jeanne I. Rader Journal of Chromatography A 1218, 545-554 (2011) .................................... 55 CHAPTER 5 Evaluation of highly polar ionic liquid gas chromatographic column for the determination of the fatty acids in milk fat Pierluigi Delmonte, Ali Reza Fardin-Kia, John K.G. Kramer, Magdi M. Mossoba, Len Sidisky, Cynthia Tyburczy, Jeanne I. Rader Journal of Chromatography A 1218, 545-554 (2012) ................................... 66 CHAPTER 6 Separation of Fatty Acid Methyl Esters by GC-Online Hydrogenation × GC Pierluigi Delmonte, Ali Reza Fardin-Kia, and Jeanne I. Rader Analytical Chemistry 1218, 545-554 (2013) …………………………………….. 77

INDEX OF CONTENTS
CHAPTER 7 Separation of the fatty acids in menhaden oil as methyl esters with a highly polar
ionic liquid gas chromatographic column, and identification by time of flight mass spectrometry
Ali Reza Fardin-Kia, Pierluigi Delmonte, John K.G. Kramer, Gerhard Jahreis, Katrin Kuhnt, Viviana Santercole, Jeanne I. Rader Lipids, 2013 (just accepted) ………………………………………… 86 CHAPTER 8 Characterization of Pine Nuts in the U.S. Market, Including Those Associated With “Pine Mouth”, by GC-FID Ali Reza Fardin-Kia, Sara M. Handy, and Jeanne I. Rader Journal of Agricultural and Food Chemistry 60, 2701-2711 (2012) ……….. 124 CHAPTER 9 Final discussion …………………………………………………. 136 REFERENCES …………………………………………………………………… 157 SUMMARY English and German …………………………………………… 172 APPENDIX List of publications, oral presentations and posters ……………….. I Curriculum vitae …………………………………………………... IV Acknowledgement ………………………………………………… V SELBSTÄNDIGKEITSERKLÄRUNG …………………………………. VI

List of abbreviations PERMEABLE
I
PERMEAMBLE LIST OF ABBREVIATIONS AOCS American Oil Chemists’ Society Ag+-HPLC silver ion-high performance liquid chromatography c cis CI chemical ionization CLA conjugated linoleic acid CPS cyanopropylsiloxane 1D first dimension 2D second dimension 2D-GC two-dimensional gas chromatography DHA docosahexaenoic acid DMOX 4,4-dimethyloxazoline DMA dimethylacetals ECL equivalent chain length EI electron impact ionization EPA eicosapentaenoic acid FA fatty acid(s) FCL fractional chain length FD furane dimethyl FDA Food and Drug Administration FAME fatty acid methyl ester(s) FFA free fatty acid FID flame ionization detector FM furan mono-methyl FT-IR Fourier transform infrared spectroscopy GC gas chromatography HPLC high performance liquid chromatography IR infrared MDGC Multidimensional gas chromatography MI methylene interrupted MS mass spectrometry MUFA monounsaturated fatty acid NMI non-methylene interrupted PEG polyethylene glycol PUFA polyunsaturated fatty acid RT retention time RTIL room temperature ionic liquid SFA saturated fatty acid SLB Supelco low bleed (commercial name) t trans TMTD tetramethyltridecanoate TOF time of flight TSM Thermal-Sweeper-Modulator US United States c9,t11-18:2 cis9,trans11-18:2

List of manuscripts PERMEABLE
II
LIST OF MANUSCRIPTS
CHAPTER 2
Preparation, chromatographic separation and relative retention times of cis/trans
heptadecaenoic (17:1) fatty acids
Pierluigi Delmonte, Qing Hu, Ali Reza Fardin-Kia, Jeanne I. Rader
Journal of Chromatography A 1214, 30-36 (2008)
Content
In this study, a simple procedure for obtaining, both geometric and positional isomers pure or
in mixtures of a monounsaturated fatty acid was developed. cis 10–17:1 Fatty acid methyl
ester (FAME) was isomerized into its positional/geometrical isomers by repeated
hydrobromination/dehydrobromination of its double bond. Reaction products were
fractionated into cis and trans geometric isomers by silver ion HPLC. Pure cis-17:1 FAME
positional isomers were obtained by reversed-phase HPLC fractionation and identified by gas
chromatography – covalent adduct chemical ionization MS/MS using acetonitrile as the
reacting gas. The isomerization with p-toluenesulfinic acid of the purified FAME yielded the
corresponding trans isomers. These products were analyzed by GC with flame ionization
detection using a Supelco 2560 capillary column in order to determine their elution order and
retention times.
WORK CONTRIBUTION Study accomplishment 70%
Analyses (synthesis; GC; GC/MS; HPLC) 50%
Sample preparation 60%
Preparation of the manuscript 60%

List of manuscripts PERMEABLE
III
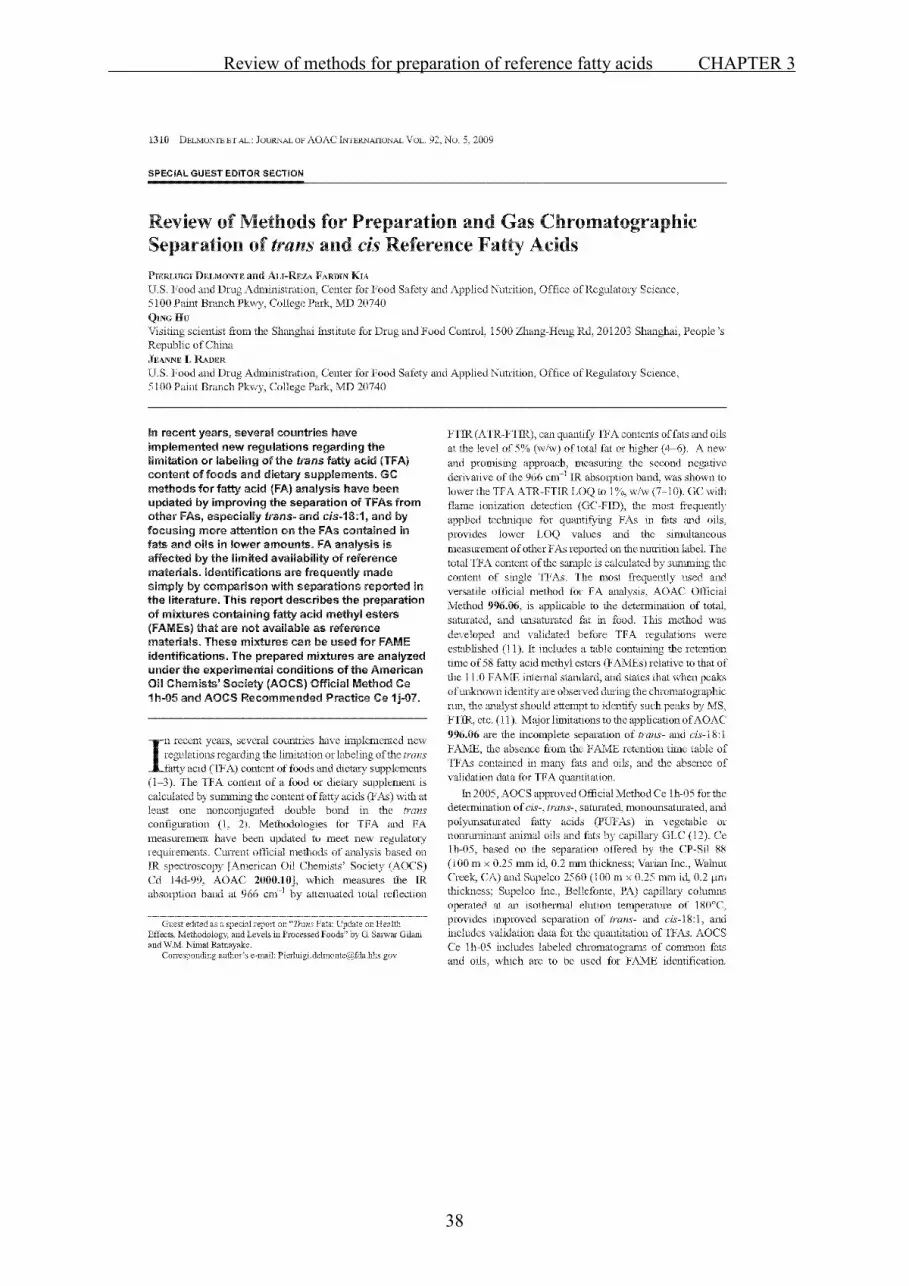
CHAPTER 3
Review of Methods for Preparation and Gas Chromatographic Separation of trans and
cis Reference Fatty Acids
Pierluigi Delmonte, Ali Reza Fardin-Kia, Qing Hu, Jeanne I. Rader
Journal of AOAC INTERNATIONAL 92, 1310-1326 (2009)
Content
Fatty acid (FA) analysis is affected by the limited availability of reference materials.
Identifications are frequently made simply by comparison with separations reported in the
literature. This review described the preparation of mixtures containing fatty acid methyl
esters (FAMEs) that are not available as reference materials. These mixtures were used for
FAMEs identifications. The prepared mixtures were analyzed under the experimental
conditions of the American Oil Chemists’ Society (AOCS) Official Method Ce 1h-05 and
AOCS Recommended Practice Ce 1j-07.
WORK CONTRIBUTION Study accomplishment 80%
Analyses (synthesis; GC; GC/MS; HPLC) 80%
Sample preparation 90%
Preparation of the manuscript 80%

List of manuscripts PERMEABLE
IV
CHAPTER 4
Separation characteristics of fatty acid methyl esters using SLB-IL111, a new ionic
liquid coated capillary gas chromatographic column
Pierluigi Delmonte, Ali Reza Fardin-Kia, John K.G. Kramer, Magdi M. Mossoba,
Len Sidisky, Jeanne I. Rader
Journal of Chromatography A 1218, 545-554 (2011)
Content
In this study, a new gas chromatographic method was developed and a novel highly polar
ionic liquid capillary gas chromatography column (200 m SLB-IL111) was evaluated. This
method, using a 200 m SLB-IL111, provided an improved separation of cis- and trans-18:1
and cis/trans conjugated linoleic acid (CLA) isomers. The isomers c9,t11- from t7,c9-CLA,
and t15-18:1 from c9-18:1 were separated in a single GC run without the need for
complimentary separation techniques such as silver ion HPLC. The SLB-IL111 column also
provided partial resolution of t13/t14-18:1, c8- from c6/c7-18:1, and for several t,t-CLA
isomer pairs. This GC method also contributed elution profiles of the geometric and positional
isomers of the 16:1, 20:1 and 18:3 fatty acid methyl esters that were complementary to those
obtained using the cyanopropyl siloxane columns.
WORK CONTRIBUTION Study accomplishment 90%
Analyses (GC; GC/MS; HPLC) 80%
Sample preparation 90%
Preparation of the manuscript 70%

List of manuscripts PERMEABLE
V
CHAPTER 5
Evaluation of highly polar ionic liquid gas chromatographic column for the
determination of the fatty acids in milk fat
Pierluigi Delmonte, Ali Reza Fardin-Kia, John K.G. Kramer, Magdi M. Mossoba, Len
Sidisky, Cynthia Tyburczy, Jeanne I. Rader
Journal of Chromatography A 1218, 545-554 (2012)
Content
A 200 m SLB-IL111 capillary column, operated under a combined temperature and eluent
flow gradient, was successfully used to resolve most of the fatty acids (FA) contained in milk
fat in a single 80 min chromatographic separation. The selected chromatographic conditions
provided a balanced, simultaneous separation of short-chain (from 4:0), long-chain
polyunsaturated fatty acids (PUFA), and most of the unsaturated FA positional/geometric
isomers contained in milk fat. Among the monounsaturated fatty acids (MUFA), these
conditions separated t11-18:1 and t10-18:1 FA, the two most abundant trans fatty acids (TFA)
contained in most dairy products. The conjugated linoleic acid (CLA) isomers commonly
found in dairy products were separated from each other, including t7,c9-18:2 from c9,t11-
18:2.
WORK CONTRIBUTION Study accomplishment 60%
Analyses (GC; GC/MS; HPLC) 90%
Sample preparation 50%
Preparation of the manuscript 60%
List of manuscripts PERMEABLE
VI
CHAPTER 6
Separation of Fatty Acid Methyl Esters by GC-Online Hydrogenation × GC
Pierluigi Delmonte, Ali Reza Fardin-Kia, and Jeanne I. Rader
Analytical Chemistry 1218, 545-554 (2013)
Content
The separation of fatty acid methyl esters (FAMEs) provided by a 200 m x 0.25 mm SLB-
IL111 capillary column was enhanced by adding a second dimension of separation (2D) in a
GC×GC design. A novel capillary reducer containing palladium was developed and added
between the two dimensions. The two dimensional separation was easily interpreted based on
the principle that all the saturated FAMEs were located on a straight diagonal line bisecting
the separation plane, while the FAMEs with the same carbon skeleton but differing in the
number, geometric configuration or position of double bonds were on lines parallel to the 1D
time axis. This technique allowed the separation of trans fatty acids and polyunsaturated FA
(PUFA) in a single experiment and eliminated the overlap between PUFA with different chain
lengths.
WORK CONTRIBUTION Study accomplishment 70%
Analyses (GCxGC; GC/MS; HPLC) 90%
Sample preparation 100%
Preparation of the manuscript 60%

List of manuscripts PERMEABLE
VII
CHAPTER 7
Separation of the fatty acids in menhaden oil as methyl esters with a highly polar ionic
liquid gas chromatographic column, and identification by time of flight mass
spectrometry
Ali Reza Fardin-Kia, Pierluigi Delmonte, John K.G. Kramer, Gerhard Jahreis, Katrin Kuhnt,
Viviana Santercole, Jeanne I. Rader
Lipids, just accepted (July/27/ 2013)
Content
The identification and separation of poly unsaturated fatty acid methyl esters prepared from
menhaden oil was achieved by GC-FID, GC-TOF/MS and use of a 200 m SLB-IL-111 ionic
liquid gas chromatography capillary column. The presence of furan fatty acids and multi-
branched chain fatty acids was confirmed by high resolution GC-TOF/MS in chemical
ionization mode with isobutane as the mild ionization reagent gas. For the first time, in a
single GC run more than 100 different fatty acids were separated and determined in < 100
min.
WORK CONTRIBUTION Study accomplishment 100%
Analyses (GC-FID; GC-MS) 90%
Sample preparation 100%
Preparation of the manuscript 70%

List of manuscripts PERMEABLE
VIII
CHAPTER 8
Characterization of Pine Nuts in the U.S. Market, Including Those Associated With
“Pine Mouth”, by GC-FID
Ali Reza Fardin-Kia, Sara M. Handy, and Jeanne I. Rader
Journal of Agricultural and Food Chemistry 60, 2701-2711 (2012)
Content
The fatty acid (FA) composition of 15 reference pine nuts, including their Δ5 fatty acid
content, was determined by use of a novel GC capillary ionic liquid column. Furthermore the
applicability of a diagnostic index (DI), a ratio of the Δ5-unsaturated FA relative to that of
their fatty acid precursors, for the identification of different pine species was examined. More
accurate DIs were calculated and the limitation of DI for identification purposes was shown.
WORK CONTRIBUTION Study accomplishment 100%
Analyses (GC-FID/HPLC) 90%
Sample preparation 80%
Preparation of the manuscript 80%
Introduction and objectives CHAPTER 1
1
CHAPTER 1
INTRODUCTION AND OBJECTIVES

Introduction and objectives CHAPTER 1
2
CHAPTER 1
1 INTRODUCTION AND OBJECTIVES Scientific research over the last two decades has demonstrated relationships between dietary
intake of certain fatty acids (FA) with double bonds in the trans configuration in their alkyl
chain (trans fatty acids, TFA), and the development of severe metabolic or cardiovascular
diseases such as arteriosclerosis, hypertension and diabetes mellitus type-2 (Mozaffarian et. al
2006 & 2009). In response to such findings, several countries including Denmark, Canada and
the United States have implemented regulations regarding limitation and labelling of TFA
content of fats, oils, foods and dietary supplements.
Recent studies have shown that intake of TFA with different chemical structures results in
different metabolic and health effects. Dietary intake of c9,t11-18:2 and its biological
precursor t11-18:1 (vaccenic acid) has been credited with positive health effects [Field et al.,
2009]. In contrast, consumption of dietary t10,c12-18:2 has been associated with
hyperinsulinemia and fatty liver in mouse studies [Clément et. al 2002].
However, a critical common limitation of these studies has been the availability of authentic
reference materials and appropriate analytical methods to quantify the subject TFA and their
metabolites. Organic synthesis of the possible FA isomers involved can play a key role in the
correct identification and analysis of these TFA. Misidentification of analytes can lead to an
incorrect evaluation of the health effects associated with specific FA, and therefore pure and
well-characterized reference materials are essential. A classic case was reported when an
overestimation of trans-16:1 isomers due to inadequate separation techniques resulted in an
association of these isomers with coronary heart disease [Precht et al., 2000a]. It is interesting
to note that trans-16:1n-7 has also been associated with lower insulin resistance [Mozaffarian
et al., 2010]. A clear identification of the trans-16:1 isomers is definitely required in order to
understand its biological significance.
Introduction and objectives CHAPTER 1
3
Furthermore, due to rapid developments in the field of food technology, the compositions of
many foods, including infant formulas and adult nutritional products, are becoming
increasingly complex. Improved analyses are necessary to provide accurate results to label
these products. More accurate labelling will contribute to the information available to
consumers for use in choosing healthier diets and reducing the risk of chronic disease.
The main objectives of this dissertation are:
1) Development and Description of novel and powerful analytical methodologies for the
analysis of FA from multiple food sources.
2) The synthesis of numerous FA reference materials for the identification of FA present in
common foods.
This work will provide critical support for future studies in the field of lipid chemistry.
1.1 TRIGLYCEROLES AND FATTY ACIDS
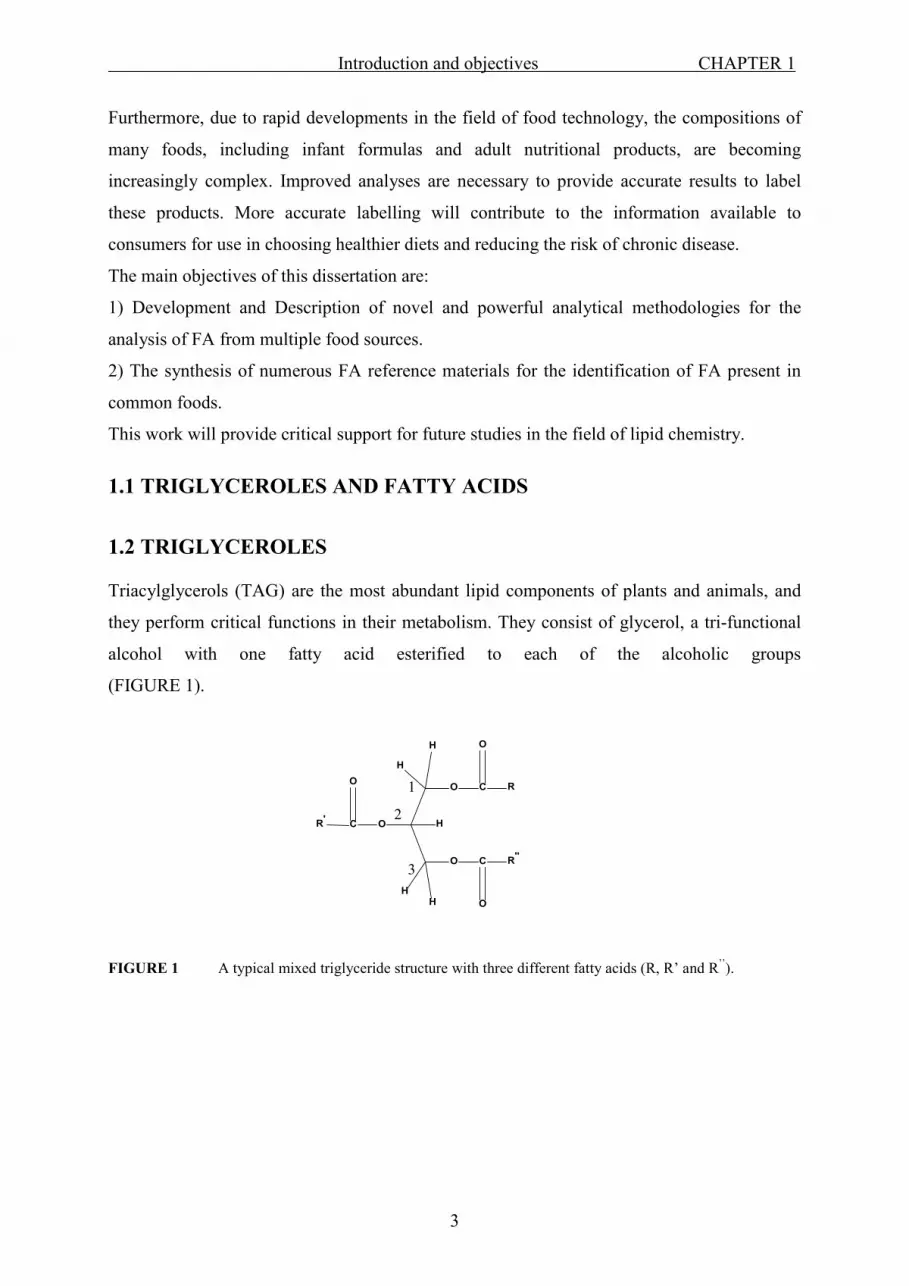
1.2 TRIGLYCEROLES Triacylglycerols (TAG) are the most abundant lipid components of plants and animals, and
they perform critical functions in their metabolism. They consist of glycerol, a tri-functional
alcohol with one fatty acid esterified to each of the alcoholic groups
(FIGURE 1).
FIGURE 1 A typical mixed triglyceride structure with three different fatty acids (R, R’ and R’’).
O
O
O
C
C
C
O
O
O
R
R''
R'
H
H
HH
H
3
2
1

Introduction and objectives CHAPTER 1
4
More than 90% of commercial oils and fats used for human consumption are plant-derived
and are extracted from various seeds. With few exceptions, in order to reach the organoleptic
and stability properties needed for commercialization, crude oils are subjected to various
processing steps including degumming, bleaching and deodorization. The refining of crude
oils increases the TAG content to about 99% [Kodali, 2005].
Triacylglycerols are synthesized by the human body and stored in the cytoplasm of adipocytes
and are then used to produce energy when needed. The oxidation of the fatty acids (FA)
contained in TAG produces a large amount of energy, making the production and storage of
energy the key functionalities of TAG in human metabolism. Furthermore, TAG are
important components of cell membranes and provide the precursors for the synthesis of
eicosanoids, and other biologically active molecules. As FA constitute the building blocks of
TAG, the FA composition of TAG plays an important role in defining their biological,
chemical and physical properties.
If the three FA constituting the TAG are identical, the product is a simple TAG. Otherwise,
the TAG is defined as a mixed TAG. The esterification of only one alcoholic moiety leads to
the formation of mono-acylglycerols (MAG), and the esterification of two alcoholic moieties
leads to the formation of di-acylglycerols (DAG).
1.3 FATTY ACIDS
Fatty acids are defined as carboxylic acids with long straight aliphatic chains. The term “fatty
acids” includes the entire series of straight chain carboxylic acids beginning with formic acid
(C1), acetic acid (C2), propionic acid (C3), butyric acid (C4) and continuing to longer chain
FA such as stearic acid (C18) or arachidic acid (C20). The lower four members of the series
(C1-C4) are hydrophilic substances and are completely miscible with water.
The FA composing TAG may differ in their chain lengths, the presence of double bonds
(unsaturations) on the aliphatic chain, additional functional groups such as hydroxyl, ketones
and branched chains (iso- and anteiso- FA), and occasionally cyclic structures. The double
bonds located on the aliphatic chains of the naturally occurring FA are predominantly in the
cis configuration. With a few exceptions described later, trans double bonds are produced
during processing or handling of fats and oils. The double bond configuration is a flat rigid

Introduction and objectives CHAPTER 1
5
structure. In cis double bonds, the two aliphatic chains lie on the same side of the bond, while
in trans double bonds, the two aliphatic chains are attached across the double bond (FIGURE
2).
FIGURE 2 Cis and trans double bond configurations.
Fatty acids with trans double bonds are characterized by a more linear structure than FA in
which the double bonds occur in the cis configuration, reflecting a greater ability of their
aliphatic chains and a greater ease of crystal formation. Fatty acids with double bonds in the
trans configuration are characterized by higher densities and higher melting points compared
to the same fatty acids with their double bonds in the cis configuration. The lower steric
hindrance of trans double bonds results in higher thermodynamic stability that leads to the
preferential conversion of cis double bonds to trans double bonds. The inter-conversion of
double bonds between the cis and trans configurations requires breaking and rebuilding of the
double bond, a process that requires an activation energy of about 65 kcal/mole. The
activation energy barrier needed for the cis/trans isomerization can be reached by providing
energy in the form of heat, as is the case of the deodorization of oils. When the isomerization
of double bonds from the cis to trans configuration is desired, the introduction of a catalyst
reduces the inter-conversion energy barrier.
HH
H
H
cis configuration trans configuration

Introduction and objectives CHAPTER 1
6
Almost all FA with multiple unsaturation sites (poly-unsaturated FA, PUFA) synthesized by
plants and animals have the double bonds separated by one or more methylene groups. These
FA are defined as methylene-interrupted (MI) FA (FIGURE 3), and the location of double
bonds is commonly indicated using the “Δ” nomenclature, indicating the position of each of
them [Christie, 2003]. Alternatively, the n-x nomenclature is used which indicates the
distance of the last methylene interrupted (MI) double bond from the terminal end of the
aliphatic chain. Linoleic acid is an MI FA with 18 carbons and two cis double bonds between
carbons C9-C10 and C12-C13 that can be labelled as c9,c12-18:2 or 18:2n-6. According to
the “n” nomenclature, naturally occurring polyunsaturated fatty acids (PUFA) are designated
by the chain length followed by a colon and the number of double bond starting from the
methyl end of the molecule. In the most common PUFA, the first double bond occurs
naturally either at the 3rd (i.e., 18:3 n-3 or c9,c12,c15-18:3), 6th or 9th position from the methyl
end of the molecule (FIGURE 3). The term “positional isomers” is commonly used to
indicate FA with the same chain length and number of double bonds, but with the latter are in
different positions. The term “geometric isomers” indicates FA with the same chain length,
same number of double bonds in the same position, but with at least one of the double bonds
is in the opposite geometric configuration. There are additional common FA, known as
conjugated, in which the double bonds are separated by a single C-C bond. This will be
dicussed later.
FIGURE 3 Molecular structures of common fatty acids.
HOOC
cis 9-18:1 18:1 n-9
Oleic acid
COOH
HOOC
cis 9, cis 12-18:2 18:2 n-6
Linoleic acid
trans 9-18:1 trans 18:1 n-9 Eleidic acid
HOOC
cis 9, trans 11-18:2 conjugated linoleic acid (CLA)

Introduction and objectives CHAPTER 1
7
1.4 ESSENTIAL FATTY ACIDS Essential FA are those mammals are unable to synthesize. Mammals are only able to
synthesize saturated and monounsaturated FA from other precursors and are unable to
synthesize linoleic- (c9,c12-18:2, LA) and γ-linolenic (c9,c12,c15-18:3. γ-LA) acids.
Burr et al. demonstrated that when immature rats were fed a fat-free diet, they grew poorly,
lost hair and ultimately died, unless a curative amount of fat was fed [Burr et al. 1929]. Burr
et al. showed in another study that none of the saturated fatty acids occurring in hydrogenated
coconut oil were effective in curing the disease [Burr et al. 1930]. The animals recovered
when pure methyl linolate was administered. The most abundant essential FA in mammals is
LA, which makes up10-20 % of the total FA of their TAG and phosphoglycerols [Lehninger,
1978]. As mentioned above LA and γ-LA cannot be synthesized by mammals and must be
obtained from plant sources, in which they are abundant. LA is a necessary precursor in
mammals for the biosynthesis of arachidonic acid (c5,c8,c11,c14-20:4), which is available in
plants. The essential FA are important precursors in the biosynthesis of a group of bioactive
fatty acid derivatives called prostaglandins [Grish et al. 1972]. These hormonelike compounds
have profound effects on numerous physiological activities.

Introduction and objectives CHAPTER 1
8
1.5 TRANS FATTY ACIDS
Trans fatty acids are defined as FA with at least one non-conjugated double bond in the trans
configuration. Fatty acids with a trans double bond are normally designated using the
systematic “Δ” nomenclature (i.e., t9-18:1). Some examples of PUFA containing trans double
bonds are c9,t12-18:2 and t9,c12,c15-18:3 as shown in Figure 3.
The naturally occurring unsaturated FA in vegetable oils contain double bonds in the cis
configuration. The unsaturated cis FA are relatively asymmetric due to the presence of the
rigid cis “U” shaped double bonds in the middle of the hydrocarbon chain (FIGURE 4). The
presence of the cis double bonds reduces the inter-chain interactions of the FA, causing a
reduction in the melting temperature. Despite their high molecular weights, at room
temperature, triacylglycerols containing “all cis” PUFA are in the liquid state.
In comparison, FA with trans double bonds on the aliphatic chain are more symmetric and the
inter-chain interactions are more consistent. These stronger interactions increase the melting
temperature of FA with trans double bonds and TAG composed of FA with trans double
bonds are likely to be in the solid state at room temperature.
trans conformation cis conformation
FIGURE 4 The molecular conformation and chain packing of lipid molecules containing cis and trans
isomers.
Trans double bonds also occur in conjugated form in certain unsaturated FA. The major
conjugated FA in ruminant fats is c9,t11-18:2 or conjugated linoleic acid (CLA) [Parodi et al.,
1977; Kramer et al., 1998 ]. The CLA structures in natural products can include positions
from 6,8 to 12,14, and most of them with all possible geometric configurations of cis/cis,

Introduction and objectives CHAPTER 1
9
cis/trans, trans/cis, and trans/trans [Sehat et al., 1999]. Ruminant fats can also contain C18:3
structures in which any two adjacent double bonds are conjugated, such as c9,t11,c15-18:3
[Hobson and Stewart, 1997].
Certain vegetable oils contain a relatively high amount of PUFA which can react with oxygen
to form hydroperoxides and other oxidation products [Farmer et. al, 1943; Gardner, 1989]. To
improve their oxidative stability or to obtain specific physical functionalities (i.e., melting
point near human body temperature), these oils are often subjected to partial or full
hydrogenation. The process of hydrogenation reduces some of the double bonds and
isomerizes some of the remaining ones from their cis to trans configurations. The
hydrogenation of oils and fats improves their oxidative stability, extends their shelf life, and
increases their solid fat content, thereby producing the margarines and shortenings used for
baking applications [Singh et al., 2009; Dijkstra, 2006].
1.5.1 INDUSTRIALLY PRODUCED TRANS FATTY ACIDS
The process of partial hydrogenation consists of a three phase reaction in which hydrogen gas
is introduced into an oil in the liquid form, and a catalyst consisting of a slurry of solid
particles is added into the oil [Singh et al. 2009]. Partial hydrogenation is carried out in a
special autoclave by dispersing nickel catalyst into the oil at a temperature of 110 °C or more,
and providing hydrogen at pressures of 30-70 psi. The most commonly used catalysts are
nickel based and are added in the quantities of 0.01-0.15% wt/wt [Veldsink et al. 1997]. The
selection of the specific reaction conditions (e.g., hydrogen pressure, catalyst type, and
processing temperature) can favor or minimize the formation of TFA. Previously, partial
hydrogenation represented the major source of industrially produced TFA (IP-TFA) and
certain fats used for bakery products contained more than 40% TFA (% of total fat).
The deodorization of oils and fats during the refining process is also known to produce up to
3% TFA [Ackman et al. 1974, Wolff, 1992]. The extended heating of oils and fats during
deep frying of foods can also produce TFA, causing predominantly the isomerization of
linoleic acid and linolenic acid present in most frying oils [Sebedio et al. 1996]. Frying of fish
products can result in the formation of trans containing highly unsaturated PUFA present in
fish [Fournier et al., 2006a; Mjos 2006a].

Introduction and objectives CHAPTER 1
10
1.5.2 TRANS FATTY ACIDS PRESENT IN RUMINANT FATS
Other sources of TFA are dairy products and the meat of ruminant animals. The
microorganisms present in the rumen subject PUFA to isomerization/biohydrogenation
[Hobson and Stewart, 1997]. The process, catalyzed by microorganisms, converts linoleic
acid (c9,c12-18:2) to c9,t11-18:2 and vaccenic acid (t11-18:1). Vaccenic acid is the most
abundant TFA present in the meat and milk of pasture fed ruminant animals [Precht and
Molkentin 1996; Kraft et al., 2003; Leheska et al., 2008]. The feeding of concentrates rich in
digestible starch and PUFA causes a shift in the isomerization/biohydrogenation process in
the bacteria to produce more t10-18:1 than t11-18:1 that accumulate in ruminant products
[Grinarri et al., 1998; Cruz-Hernandez et al., 2007]. The supplementation of the animal’s diet
with partially hydrogenated vegetable oils (PHVO) causes the increase in the content of other
TFA such as t9- and t10-18:1 compared to vaccenic acid [Wonsil et al., 1994].
The total trans mono-unsaturated FA content in milk lipids may reach as high as 23% as
percent of total milk fat depending on the diet used for feeding the dairy cows [Cruz-
Hernandez et al., 2007]. These include several trans positional isomers of 16:1, 18:1, 20:1,
22:1 and 24:1 FA [Precht and Molkentin, 1996; Wolff, 1998; Kramer, 2008].
The TFA found in milk of pasture-fed cows consist predominantly of vaccenic acid [Precht,
Molkentin 1997], whereas increasing amounts of t10-18:1 are evident in the milk fat of cows
fed forages rich in nonstructural carbohydrates (e.g. starches, sugars, fructans) [Piperova et
al., 2000], oils rich in PUFA [Griinari et al., 1998; Shingfield et al., 2005] and ionophore
antibiotics, such as monensin [Eifert et al., 2005; Cruz-Hernandez et al., 2006].
The fats derived from ruminants (e.g., milk or meat) are the main source of CLA in human
nutrition. c9,t11-18:2 is the most abundant CLA isomer contained in these fats [Sehat et al.,
1999; Parodi, 2003,], followed by t11,c13-18:2 [Kraft et al., 2003 ; Kramer et al., 2004] when
ruminant are pasture fed. Other CLA isomers found in the milk fat or meat of ruminants
include t7,c9-18:2 [Yurawecz et al.,1998], whose content generally increases when ruminants
are fed forages rich in fiber [Aldai et al., 2008]. The milk fat content in CLA can reach 1.89%
(of total fat) when the diet of the cows is supplemented with sunflower oil and 4% when the
diet is supplemented with safflower oil [Bauman, 2000]. Fritsche et al. showed that the total
CLA content in subcutaneous fat of beef was higher than in the intramuscular fat, and lowest
in the phospholipid fraction [Fritsche et al., 2001] The content of c9,t11-18:2 relative to the
total CLA content was above 80% in lambs, 65-78% in grass-fed and concentrate-fed cattle

Introduction and objectives CHAPTER 1
11
Food TFA (% total fat)
Hamburger 3-5Pizza 4-6French fries 1-13Shortenings 0-30Beef and dairy fat 2-9
Food TFA (% total fat)
Hamburger 3-5Pizza 4-6French fries 1-13Shortenings 0-30Beef and dairy fat 2-9
[Dannenberger et al. 2004], and above 60% in beef commercialized in the Canadian market
[Aldai et al., 2009].
1.6 NUTRITIONAL ASPECTS OF TRANS FATTY ACIDS
In the last two decades, the health impact of TFA in foods has received significant attention in
the scientific literature. Many scientific publications have shown a positive correlation
between coronary heart disease (CHD) and dietary intake in TFA, especially those formed
during the processing of oils and foods [Gebauer et al., 2011; Willett et al., 1993]. Among
others, margarines, cookies and FAt food meals are products that were observed to contain
relatively higher amounts of IP-TFA. Furthermore, IP-TFA have been shown to increase the
risk in cancer and cardiovascular diseases (CVD), increase plasma concentration in lipids and
lipoproteins and LDL-cholesterol. Mozaffarian et al. have shown that if dietary PHVOs are
replaced with alternative fats and oils, the risk of CHD may be reduced by 50% [Gebauer et
al., 2011; Mozaffarian and Clarke, 2009]. Typical contents in TFA in FAt food meals, beef
and dairy products are shown in table 1.
Table 1 Content of trans Fat (% Total Fat) in selected FAt food meals, foods and fats. Source of data [Tyburczy, 2012; Aro 1998,]

Introduction and objectives CHAPTER 1
12
There is also evidence that TFA promote inflammation. In a study using overweight women,
high dietary intake in TFA was associated with increased activity of the tumor necrosis factor
(TNF) system, and increased content of interleukin-6 and C-reactive proteins [Mozaffarian et
al., 2006] In another study utilizing patients with hypercholesterolemia, the production of
interleukin-6 and TNF-α by cultured mononuclear cells increased after one month of diet
supplementation with soybean-margarine compared with a diet supplemented with soybean
oil [Han et al. 2002]. In different studies, the higher dietary intake in TFA was associated with
endothelial dysfunction [De Roos, 2001]. Other possible negative effects of TFA consumption
are the reduction in the activity of certain enzymes, such as serum paraoxonases and insulin
resistance [Christiansen et al., 1997; Lichtenstein et al. 1999].
The functions of FA in metabolism are not limited to energy storage/production. They also
perform other molecular activities such as modulation of cell functions, e.g., fluidity of
membranes [Stubbs and Smith, 1984] and activation of cell membrane receptors [Clandinin et
al., 1991; Feller et al. 2005]. FA may also modulate metabolic and inflammatory responses of
the endoplasmic reticulum [Hotamisligil, 2005]. On the basis of these observations, TFA may
affect the function and responses of many types of cells [Mozaffarian et al., 2006]. In humans,
the consumption of TFA increases the plasma activity of cholesteryl ester transfer protein
[van Tol et al., 1995], the main enzyme that performs the transfer of cholesterol esters from
HDL to LDL and to very low-density lipoprotein (VLDL) cholesterol.
Conjugated trans fatty acids
The major source of TFA in oils and fats commercialized in the US market is partial
hydrogenation of vegetable oils. However, milk fat and meat of ruminants are also dietary
sources of TFA. Several recent studies have shown that different CLA isomers provide unique
and different biological responses in mammalian systems including humans [Pariza et al.
2001]. Some of them have shown negative effects [Belury, 2002]. Vaccenic acid, the most
abundant TFA in most dairy products, was observed to be the main biologic precursor of CLA
[Mozaffarian, 2006]. Studies involving humans regarding the beneficial effects of CLA
consumption have proven inconclusive and apparently dependent upon the specific CLA
isomers used for the feeding study. While c9,t11-18:2 showed possible positive health effects
such as decreasing the LDL:HDL cholesterol ratio and total HDL cholesterol content, by
contrast t10,c12-18:2 showed the opposite effect on the blood lipid profile of

Introduction and objectives CHAPTER 1
13
healthy humans [Tricon et al., 2004]. Rajakangas et al. have shown, in a Min mice model,
that t10,c12-18:2 acts as a cancer promoter in colon carcinogenesis of mice [Rajakangas et al.
2003].
Non-conjugated trans fatty acids Non-conjugated geometric/positional isomers of linoleic acid (LA) (c9,c12-18:2), a dienoic
FA, are often present in processed foods and oils. Mono-trans and di-trans dienoic TFA have
also been discussed in connection with health risks. The t9,t12-18:2 and other non-conjugated
18:2 positional/geometric isomers have been reported to inhibit the conversion of LA into
arachidonic acid (20:4n-6) [Precht, 2003; Beyers, 1991]. Although several non-conjugated
mono-trans 18:2 FA have been reported in foods, especially in dairy products, to date little is
known regarding the biological activities of these FA. A limiting factor for the development
of these studies has been the lack of availability of these FA in pure form. Delmonte et al.
reported the presence of at least 10 non-conjugated 18:2 FA in milk fat [Delmonte et al.,
2012] and Ratnayake reported the presence of 12 non-conjugated 18:2 TFA in PHVOs.
Trans fat dietary intake Several studies investigated the consumption of TFA by the US population from 1990 to date.
In 2003, Doell and co-workers reported that the current dietary intake of IP-TFA in the US
population was 4.6 g/person/day. The same authors estimated in their 2012 publication that
the current dietary IP-TFA intake of the US population is 1.3 and 2.6 g/capita/day as mean
and 90th percentile [Doell et al, 2012]. Fritsche and Steinhart reported in 1997 an estimated
dietary intake in TFA for German women and men between 1.9 - 2.3 g/person/day [Fritsche
and Steinhart, 1997].
1.7 ANALYTICAL METHODS FOR THE DETERMINATION OF
TRANS FATTY ACIDS
1.7.1 INTRODUCTION
The evidence regarding the negative health effects of dietary TFA has prompted
recommendations and regulatory actions in several countries to limit the TFA content.
[Duhem 2009; Mossoba et al. 2009]. Therefore, there is an increased need for more refined

Introduction and objectives CHAPTER 1
14
and accurate analytical methods of analysis for TFA. Several analytical and spectroscopic
methodologies for TFA and FA measurements have been updated to meet the new regulatory
requirements.
The TFA content of a fat or oil can be measured by gas chromatography (GC), Fourier-
Transform Infrared (FT-IR) or FT-NIR spectroscopy. The analysis of the TFA content of a
food requires a prior extraction of the lipid fraction from the matrix for both GC and IR
spectroscopic measurements. However, TFA can be determined directly on neat fats and oils
using spectroscopic techniques. On the other hand, GC analysis requires the preparation and
separation of volatile FA derivatives, most commonly methyl esters (FAME), and the
calculation of the total TFA content by adding the content in all the FA meeting the TFA
definition. To quantify TFA using the GC method requires the addition of an internal
standard to the sample before the extraction of fat. The measurement of the TFA content of a
fat or oil by FT-IR requires the simple measurement of the CH out-of-plane deformation band
observed at 966 cm-1 that is uniquely characteristic of isolated double bonds with trans
configuration [Mossoba et al., 2009]. FT-IR provides only the measurement of the total TFA
content of fats and oils, and not of individual FA or other FA groups. As an example, it does
not provide the measurement of total saturated FA (SFA) content which is also required for
food labelling purposes [Tyburczy et al., 2012]. In contrast, FT-NIR is not affected by this
limitation and it provides the measurement of the most abundant FA contained in fats, oils or
lipid extracts [Mossoba et al., 2013 (in press)].
1.7.2 OFFICIAL METHODS
Recent official methods of analysis based on IR spectroscopy [American Oil Chemists’
Society (AOCS) Cd 14d-99, AOAC 2000.10], which measure the intensity of the IR
absorption band at 966 cm–1 by attenuated total reflection FT-IR (ATR-FT-IR), can measure
the TFA content of fats and oils at the level of 5% (w/w of total fat) or higher [AOCS Official
Method Cd 14d-99; Milosevic, 2004]. The most recent ATR-FTIR official method adopted in
2009 allows the accurate measurement of the height of the negative second derivative of the
IR absorption band at 966 cm–1 (AOCS Official Method Cd 14e-09) at levels as low as 2% of
total fat. The most frequently used and more versatile official GC method for FA analysis
[AOAC Official Method 996.06] is applicable to the determination of total, saturated, and

Introduction and objectives CHAPTER 1
15
unsaturated fat in food. This GC method was developed and validated in 1996 before TFA
regulations were established [AOAC 996.06].
In 2005, the AOCS approved Official Method Ce 1h-05 for the determination of cis-, trans-,
saturated, monounsaturated, and polyunsaturated fatty acids (PUFA) in vegetable or
nonruminant animal oils and fats by capillary GLC [AOCS Ce 1h-05]. Official Method
AOCS Ce 1h-05 includes labelled chromatograms of common fats and oils, which can to be
used for FAME identification. Official Method Ce 1h-05 was designed for the analysis of
only pure fats and oils, and must be coupled with a FAME preparation procedure such as
AOCS Official Method Ce 2-66 or ISO 5509. Ce 1h-05 is generally coupled with the
extraction procedures described in AOAC 996.06 when used for the determination of the TFA
content of foods. Ce 1h-05 is not suitable for the analysis of samples that contains short-chain
and conjugated FAME, such as dairy fats, or that contain long-chain PUFA. This method,
designed for the analysis of hydrogenated and processed vegetable oils which contain mostly
18:1, 18:2 and 18:3 FA, was developed to optimize the separation of 18:1 and 18:2 FAME
positional/geometrical isomers. In 2007, Official Method Ce 1h-05 was supplemented with
the AOCS Recommended Practice Ce 1j-07 for the determination of cis-, trans-, saturated,
monounsaturated, and PUFA in dairy and ruminant fats by capillary gas liquid
chromatography (GLC) [AOCS Ce 1j-07]. AOCS Ce 1j-07 also contains reference
chromatograms for FAME identification, but does not include validation data. AOCS Ce 1j-
07 must also be coupled with a FAME preparation procedure, such as AOCS Official Method
Ce 2-66 or ISO 5509, and if needed, with a fat extraction procedure. Concern has been
expressed that the recommended methods used in the methylation (Ce 2-66 or ISO 5509) may
isomerize conjugated FA during the procedure since acid catalysts are used [Kramer et al.,
1997; Mossoba and Kramer 2009]. The identification of FAME in both methods relies on the
comparison with the FAME separation of selected oils and fats, and with available reference
materials. AOCS Ce 1j-07 also includes a table of FAME retention times, but these values are
not related to the retention time of an internal standard. Unknown samples might contain FA
which are not contained in the oils and fats selected for the reference chromatography and
which are not commercially available as reference materials. Other FAME, not considered in
the reference chromatographic separations, might also elute at the same retention times. The
accurate identification of the FAME contained in unknown samples requires skilled analysts,
careful evaluation of all available information, and complimentary techniques, such as
GC/MS and GCxGC.
Introduction and objectives CHAPTER 1
16
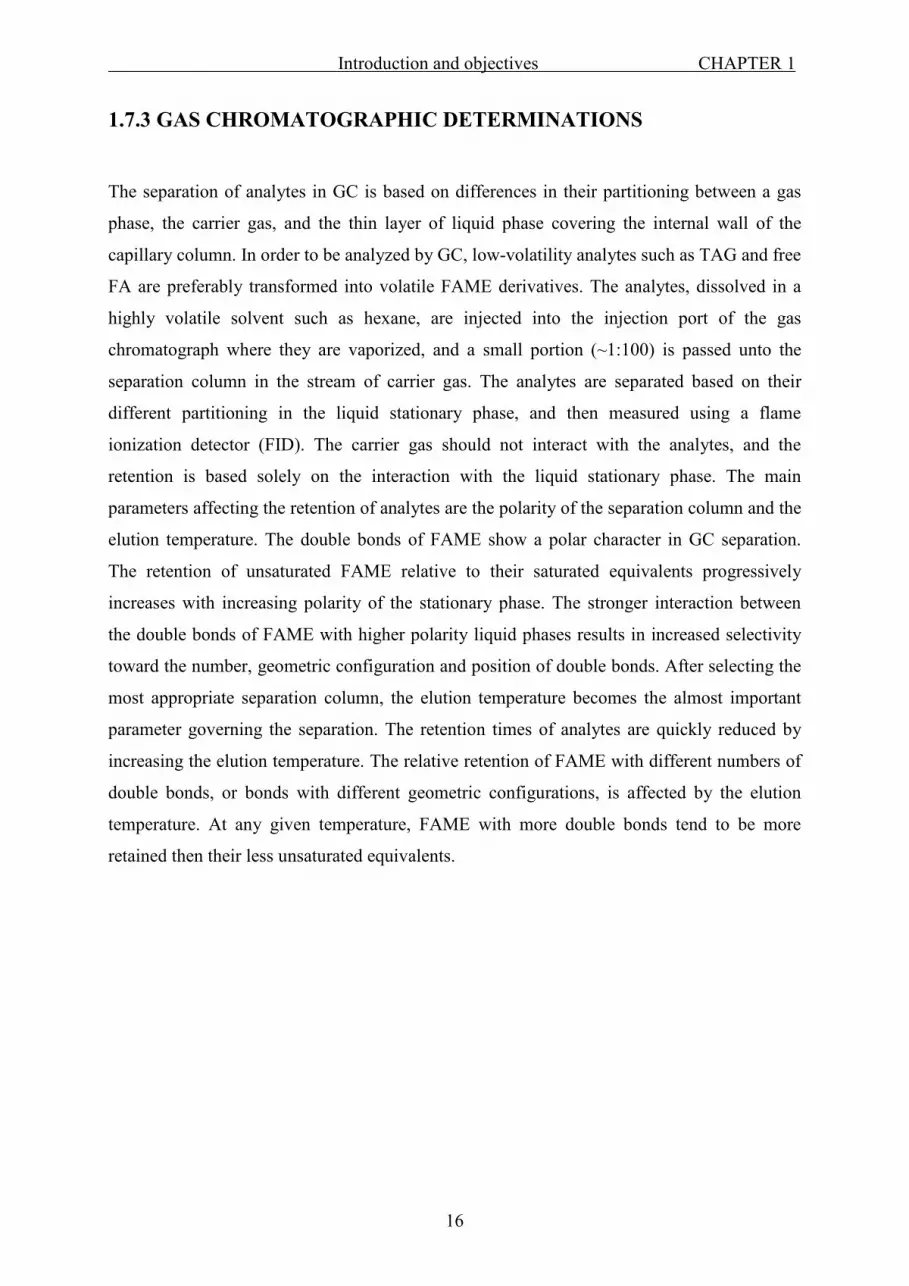
1.7.3 GAS CHROMATOGRAPHIC DETERMINATIONS
The separation of analytes in GC is based on differences in their partitioning between a gas
phase, the carrier gas, and the thin layer of liquid phase covering the internal wall of the
capillary column. In order to be analyzed by GC, low-volatility analytes such as TAG and free
FA are preferably transformed into volatile FAME derivatives. The analytes, dissolved in a
highly volatile solvent such as hexane, are injected into the injection port of the gas
chromatograph where they are vaporized, and a small portion (~1:100) is passed unto the
separation column in the stream of carrier gas. The analytes are separated based on their
different partitioning in the liquid stationary phase, and then measured using a flame
ionization detector (FID). The carrier gas should not interact with the analytes, and the
retention is based solely on the interaction with the liquid stationary phase. The main
parameters affecting the retention of analytes are the polarity of the separation column and the
elution temperature. The double bonds of FAME show a polar character in GC separation.
The retention of unsaturated FAME relative to their saturated equivalents progressively
increases with increasing polarity of the stationary phase. The stronger interaction between
the double bonds of FAME with higher polarity liquid phases results in increased selectivity
toward the number, geometric configuration and position of double bonds. After selecting the
most appropriate separation column, the elution temperature becomes the almost important
parameter governing the separation. The retention times of analytes are quickly reduced by
increasing the elution temperature. The relative retention of FAME with different numbers of
double bonds, or bonds with different geometric configurations, is affected by the elution
temperature. At any given temperature, FAME with more double bonds tend to be more
retained then their less unsaturated equivalents.

Introduction and objectives CHAPTER 1
17
GC COLUMN SELECTION
Selecting the right stationary phase and column length are the most important steps in
selecting a column for GC separations. The stationary phase should be selected based on the
application to be performed. The analyses of the FA contained in foods and biological
samples are commonly achieved by gas chromatography of their FAME derivatives.
Capillary columns commonly used for FAME analysis are coated with stationary phases with
polar attributes. Non-polar phases provide the separation of saturated FAME from unsaturated
FAME, and the order of elution is the reverse of that achieved using polar columns. Columns
coated with polyethylene glycol (PEG) separate FAME according to their carbon number, and
secondarily on the number of unsaturations. Columns of higher polarities such as BPX 90
(poly (biscyanopropylsiloxane) type phase), SP-2560, HP-88 (cyanopropyl moiety content
about 90%), CP-Sil 88, SLB-IL100 or SLB-IL111 are usually utilized to increase the
selectivity toward the number, geometric configuration and position of the FAME double
bonds. Very long (100 m) and highly polar capillary columns that provide the separation of
cis and trans unsaturated FA isomers and, with some limitations, of their positional isomers,
are generally recommended
Figure 6 Capillary columns. (source, Minnesota State University, http://web.mnstate.edu)

Introduction and objectives CHAPTER 1
18
Ionic Liquid Columns About a decade ago, Armstrong and co-workers showed that at room temperature ionic
liquids (RTIL) possess the volatility, viscosity, solubility and polarity characteristics suitable
for use as stationary phases in capillary GC [Anderson and Armstrong, 2003]. As stationary
phases in GC, they showed the dual nature of retention selectivity of these columns,
separating polar molecules as a polar stationary phase and non-polar molecules as a non-polar
stationary phase. The development of dicationic, trigonal tricationic, and cross-linked RTILs
led to the novel IL capillary columns currently used for the separation of FAME. Capillary
columns coated with RTILs are increasingly used for GC×GC separations due to their unique
selectivity and thermal stability. The use of a column coated with an RTIL
(trihexyl(tetradecyl) phosphonium bis (trifluoromethane)sulfonamide) for GC×GC
separations was first tested by Seeley et al. using standard mixtures of organic compounds
with a wide range of functional groups [Seeley et al., 2008].
1.7.4 CAPILLARY GC OF FATTY ACID DERIVATIVES
PREPARATION OF FAME, AND OTHER DERIVATIVES FOR GC/MS ANALYSIS.
Methyl esters are the most common derivatives used in the analysis of the FA prepared from
different lipid classes. They are prepared by reaction with an excess of methanol in the
presence of an acid or base acting as a catalyst. FAME are preferred because of their high
volatility and good GC separations [Ulbert 1999]. The expected products from the O-acyl and
N-acyl chains are fatty acid methyl esters, while alk-1-enyl ethers yield dimethylacetals
(DMA) [Cruz-Hernandez et al., 2006; Mossoba and Kramer, 2009]. Because of the high
volatility of short chain FAME (4:0-8:0), which are present in milk fat and ruminant fats,
derivatives other than methyl esters have been evaluated (e.g. isopropyl esters) [Wolff et al.,
1995].
The chemical nature and the composition of a lipid sample can be very complex. The lipid
may include free fatty acids (FFA), neutral lipids, phospholipids, glycolipids and
sphingolipids [Kramer and Zhou, 2001]. The catalyst should quantitatively convert the acyl
moieties contained in all these compounds to FAME, and not react with any functional group
present on the FA alkyl chains.

Introduction and objectives CHAPTER 1
19
Methylation using base catalysts such as sodium methoxide is preferred for the determination
of ruminant-derived fats that contain CLA because of the mild conditions of reaction, causing
negligible degradation of labile FA [Kramer et al 1997]. However, base catalysts are
selective, and do not convert all FA into FAME. Free fatty acids (FFA), N-acyl lipids and alk-
1-enyl ethers are not trans-esterified by basic catalysis [Cruz-Hernandez et al. 2006; Mossoba
and Kramer 2009].
Acid catalyzed preparation of FAME is applicable to the derivatization of all common lipid
classes except ethers. The most commonly used acid reagents for the preparation of FAME
are methanolic solutions of H2SO4, BF3, or HCl [Christie, 2003; Mossoba and Kramer, 2009].
The application of acid catalyzed methylation requires stronger conditions of reaction
compared to basic catalysis, and might result in the isomerization of CLAs [Kramer et al.
1997].
In the simplest cases, the GC separation of FAME allows their identification based on their
elution pattern or relative retention times (RRT). In some instances, e.g. unknown
components, the use of a mass selective detector is essential. In these cases, it is preferable to
prepare derivatives other than methyl esters such as pyrrolidides, dimethyloxazoline (DMOX)
or picolinyl derivatives. These derivatives provide MS characteristic fragmentation spectra
that allow unambiguous localization of functional groups such as double bonds and methyl
branches. [Christie, 1989].
EQUIVALENT CHAIN LENGTH OF FAME
The retention of FA derivatives on polar GC-columns is generally determined by their boiling
points, and the number and position of double bonds on the aliphatic chain. In isothermal GC
separations, the logarithm of the retention time of the saturated FAME and the number of
carbons in their carbon chain show a linear relationship [Mjos 2006b; James 1956]. Retention
times of FAME are often analyzed using equivalent chain length values (ECL). ECL values
for the different fatty acids are principally dependent on the stationary phase selection, and are
therefore used to compare retention data where the other chromatographic parameters
(temperature program, column length, column flow) might vary.

Introduction and objectives CHAPTER 1
20
Generally, for FAME with the same chain length, the retention times increase when the
double bond(s) move from the carbonyl group toward the methyl end of the molecule. This
observation was confirmed for mono-unsaturated FAME [Gunstone et al. 1967; Christie
1988] and poly-unsaturated FAME [Christie 1968, Christie 1988], with some deviations when
double bonds are located close to the carbonyl group, i.e. positions Δ2 to Δ4. The n-2 and
Δ3/2 positions deviate from the regular pattern by having significantly higher ECL values
than isomers with double bonds in nearby positions. Investigations regarding the ECL values
of dienes have mainly been carried out using their methylene-interrupted isomers [Christie,
1989].
1.7.5 GC-MASS SPECTROMETRY OF FATTY ACIDS
The coupling of gas chromatography with mass spectrometry (MS) using highly polar
capillary columns has become an important analytical tool for identification and detection of
FA. In order to be detected by a mass spectrometer, the targeted molecule (M) in the gas
phase must be ionized. The ionization is carried out either by bombarding the molecule with
high-energy electrons (EI) (e.g. 70 eV), or by chemical ionization (CI). The CI process can be
divided in two reaction steps. In the first step, a stable cluster of reagent ions is produced from
the reagent gas (e.g. acetonitrile, butane or methane) by electron bombardment. In the second
step, the M eluting from the GC column reacts with the ions contained in the reagent gas
cluster [Hübschmann, 2008].
If the chain length and number of unsaturations of FAME are the only required information,
an EI-MS spectra containing an abundant [M+H]+ ion is generally sufficient to achieve
identification. Since the EI fragmentation of unsaturated FAME does not provide any
diagnostic fragment, the location of the double bond is challenging. In addition, it is known
that double bonds of FAME migrate during electron impact ionization, presumably driven by
charges localized on the double bonds [Lawrence and Brenna, 2006]. Use of FA derivatives
such as DMOX (4,4-dimethyloxazoline) or picolinyl esters is an effective approach for
localization of the double bonds. However, variations in the chromatographic separation of
these derivatives compared to that of FAME make the translation of those identifications a
challenging process. Thus, utilizing a technique that determines the position of the double
bond using FAME is highly preferred.
Introduction and objectives CHAPTER 1
21
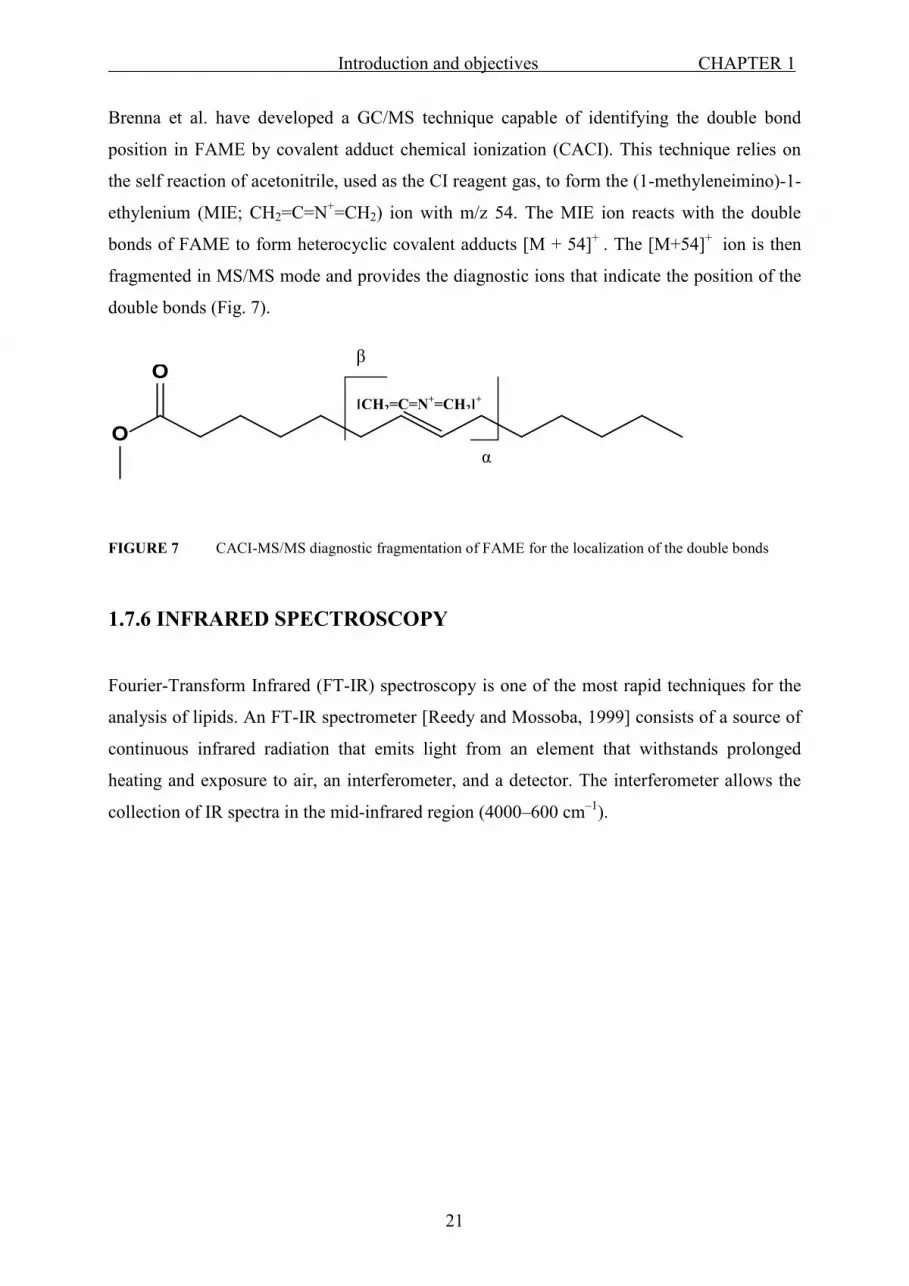
Brenna et al. have developed a GC/MS technique capable of identifying the double bond
position in FAME by covalent adduct chemical ionization (CACI). This technique relies on
the self reaction of acetonitrile, used as the CI reagent gas, to form the (1-methyleneimino)-1-
ethylenium (MIE; CH2=C=N+=CH2) ion with m/z 54. The MIE ion reacts with the double
bonds of FAME to form heterocyclic covalent adducts [M + 54]+ . The [M+54]+ ion is then
fragmented in MS/MS mode and provides the diagnostic ions that indicate the position of the
double bonds (Fig. 7).
FIGURE 7 CACI-MS/MS diagnostic fragmentation of FAME for the localization of the double bonds
1.7.6 INFRARED SPECTROSCOPY
Fourier-Transform Infrared (FT-IR) spectroscopy is one of the most rapid techniques for the
analysis of lipids. An FT-IR spectrometer [Reedy and Mossoba, 1999] consists of a source of
continuous infrared radiation that emits light from an element that withstands prolonged
heating and exposure to air, an interferometer, and a detector. The interferometer allows the
collection of IR spectra in the mid-infrared region (4000–600 cm–1).
O
O[CH2=C=N+=CH2]+
β
α

Introduction and objectives CHAPTER 1
22
When a test sample such as an oil containing TFA is placed between the beam splitter and the
detector, it absorbs selected infrared wavelengths. Changes in the IR radiation intensity
reaching the detector as a function of time yield an interferogram, the raw infrared spectrum.
The interferogram is successively converted by the mathematical Fourier transformation into
the FT-IR spectrum of absorbance vs. wavelength. Trans double bonds in oils and fats can be
quantified by FT-IR by measuring the absorption at approximately 966 cm-1 [e.g. AOCS
Official Method Cd 14-95]. However, samples consisting of free fatty acids must first be
esterified particularly when low levels of trans of TFA are investigated (less than 15%)
[Firestone and Sheppard, 1993]. The absorption band near 935 cm–1, due to the O-H out-of
plane deformation in the –C(O)OH moieties, can interfere with the determination of the TFA
band at 966 cm–1. Table 2 shows the diagnostic IR absorption bands of unsaturated FAME.
Table 2. Diagnostic IR absorption bands for FAME [Mjos and Petersen, 2001].
Frequency (cm-1) Group Mode of vibration
3025 =C-H (trans) Stretching (very weak)
3010 =C-H (cis) Stretching
2955 -C-H (CH3) Stretching, asym
2926 -C-H (CH2) Stretching, asym
2855 -C-H (CH2) Stretching, sym
1746 -C=O Stretching
1654/1658 -C=C- (cis) Stretching (very weak)
1465 -C-H (CH2, CH3) Bending, scissoring
1418 =C-H (cis) Bending, rocking
1377 -C-H (CH3) Bending, sym
1238 -C-O, -CH2- Stretching, bending
1163 -C-O, -CH2- Stretching, bending
1033 -C-O Stretching
968 -HC=CH- (trans) Bending out of plane
914 -HC=CH- (cis) Bending out of plane (very weak)
723 -(CH2)n-, -HC=CH- (cis) Bending, rocking

Introduction and objectives CHAPTER 1
23
1.8 LIQUID CHROMATOGRAPHY IN FATTY ACID SEPARATION
1.8.1 SILVER ION CHROMATOGRAPHY
Silver ion–HPLC (Ag+-HPLC) has been widely applied to the separation and quantitation of
FAME. The FAME are separated based on their number, geometric configuration, and
position of double bonds. This technique does not provide relevant selectivity based on the
chain length of FAME. Ag+-HPLC is based on the formation of complexes between the d
orbitals of the silver ions and the π electrons of the FAME double bonds.
FIGURE 8 Model of interaction between silver ions and FAME double bonds.
The strength and the stability of these quasi-complexes are determined by the following rules:
• The stability decreases with increasing chain-length
• The stability decreases with an increasing number of substituents at the double bond
in the order R.CH=CH2 > R2C=CH2 > cis R.CH=CH.R > trans R.CH=CH.R >
R2.C=CH.R > R2C=CR2
• Conjugated polyenes form less stable complexes than methylene-interrupted
equivalents with the same number of double bonds. The stability also increases with
increasing distance between the double bonds.
Earlier Ag+-HPLC methods relied on self-prepared Ag+ columns, prepared by loading silver
nitrate on strong cation exchange HPLC columns. The current most common application of
Ag+–HPLC is the fractionation of saturated, trans-monounsaturated FA (MUFA),
cis-MUFA, and polyunsaturated FAME prior to GC analysis to aid in the identification of

Introduction and objectives CHAPTER 1
24
complex FAME mixtures. Trans- and cis-MUFA are well separated into two distinctive
groups by using a single analytical size Ag+–HPLC column and 0.1–0.2% acetonitrile in
hexane as the elution solvent. The separation of the positional isomers of MUFA and CLAs is
generally achieved using multiple columns (usually three) in series [Sehat et al., 1999]. For
TFA quantitation, Christie et al. (1989b) suggest collecting saturated and trans-
monounsaturated FAME together, and then using the content of saturated FAME as the
reference for GC quantitation of TFA. An alternative approach, based on the same principle,
is the fractionation of FAME by Ag+-SPE using strong cation exchange cartridges loaded with
silver ions (Discovery_ Ag-Ion SPE; Sigma-Aldrich, St. Louis, MO). FAME can be separated
based on the double-bond number/geometric configuration by applying the simple procedure
developed by the SPE tube manufacturer (Kramer et al., 2008).
1.8.2 REVERSED-PHASE HPLC
Reversed-phase HPLC is an alternate separation technique to Ag+-HPLC chromatography for
the separation of FAME. It was successfully used in the separation of conjugated FA from
biological matrices [Banni et al., 2001]. Juaneda and Destaillats [2002 & 2007] described a
procedure for separating trans monounsaturated FAME as a single peak prior to GC
quantitation. Tsuzuki and Uchida [2009], focusing on the separation of MUFA, evaluated the
separation offered by different chromatographic columns, mobile phase compositions, and
elution temperatures. Delmonte and co-workers [2008], using one or three Vyndac 201TP54
(250 x 4.6 mm, 5µm particle size; Grace Davison, Deerfield, IL) HPLC columns in series,
maintained at 15 °C, and 5% hexane in MeCN as the elution solvent at 1 mL/min, separated
positional isomers of cis-17:1 FAME with double bond positions 6 to 14.

Introduction and objectives CHAPTER 1
25
1.9 MULTI DIMESIONAL GAS CHROMATOGRAPHY
1.9.1 MULTI DIMENSIONAL GAS CHROMATOGRAPHY
Multidimensional gas chromatography (MDGC) requires two columns, ideally of different
selectivity, to enable multidimensional separations. MDGC has been widely reported in many
areas of industrial and environmental analysis [Lewis, 2002]. The direct coupling of two GC
columns is a multichromatography and is basically a combination of two stationary phases in
series in order to enhance the selectivity in the separation. For analyzing complex samples,
MDGC can provide considerable improvements in the separation of individual compounds.
The focus of MDGC has been in two major areas: (I) increasing peak capacity of the system,
and (II) increasing the speed of the separation system [Luke et al., 1968].
The general approach to improving resolution is to modify the column physical parameters
such as increasing column length, decreasing the column internal diameter, or a combination
of both. However, in many cases, changing these parameters may only offer minor
improvements in resolving the target compounds. It is well-known that doubling the length of
a column results in only a √2N (N for theoretical plates) increase in the number of theoretical
plates on the column.
Two-dimensional GC (2D-GC) has a requirement that target analytes be subjected to two or
more mutually independent separation steps and that the components remain separated until
completion of the overall steps. Technically, the effluent from first column/first dimension
(1D) is isolated, passed to the second column/second dimension (2D) and analyzed. Thus, the
simplest MDGC setup is to use a valve pressure switching system that is able to pass zones of
effluent from 1D to 2D.
In 1968, Deans introduced a basic principle of pressure switching which has been used to date
for “heart-cutting” [Deans, 1968]. FIGURE 9 shows the basic layout of the Deans switching
system (Agilent Technologies). The sample is injected onto the primary column. The effluent
from this column goes to the primary detector via the restrictor (deactivated tubing). When the
solenoid valve is activated, gas pressure from the pressure control module (PCM) switches to
the other side of the pneumatic coupler, transferring the effluent to the secondary column.

Introduction and objectives CHAPTER 1
26
FIGURE 9 Agilent Deans Switch
1.9.2 COMPREHENSIVE GC X GC
In the analysis of complex samples such as milk fat and marine oils, the primary goal is to
increase the peak capacity of the system by one or two orders of magnitude. The peak
capacity (nc) is the maximum number of components that can be placed, side by side, into the
available separation space at a given resolution. Ideally, in a comprehensive system, a 2D
column should be available for each transfer of the effluent from the 1D. Effluent from the 1D
can be focused at the end of the column or in an interface and rapidly “injected” into the 2D in
the form of very narrow pulses. This is normally done by a valve (switching valve) or with a
modulator. The theoretical nc of a coupled system, such as a “Deans switch”, is the sum of the
nc of each individual column [Bertsch, 1999]. In a comprehensive system, it is the product of
the nc of the 1D and 2D column.
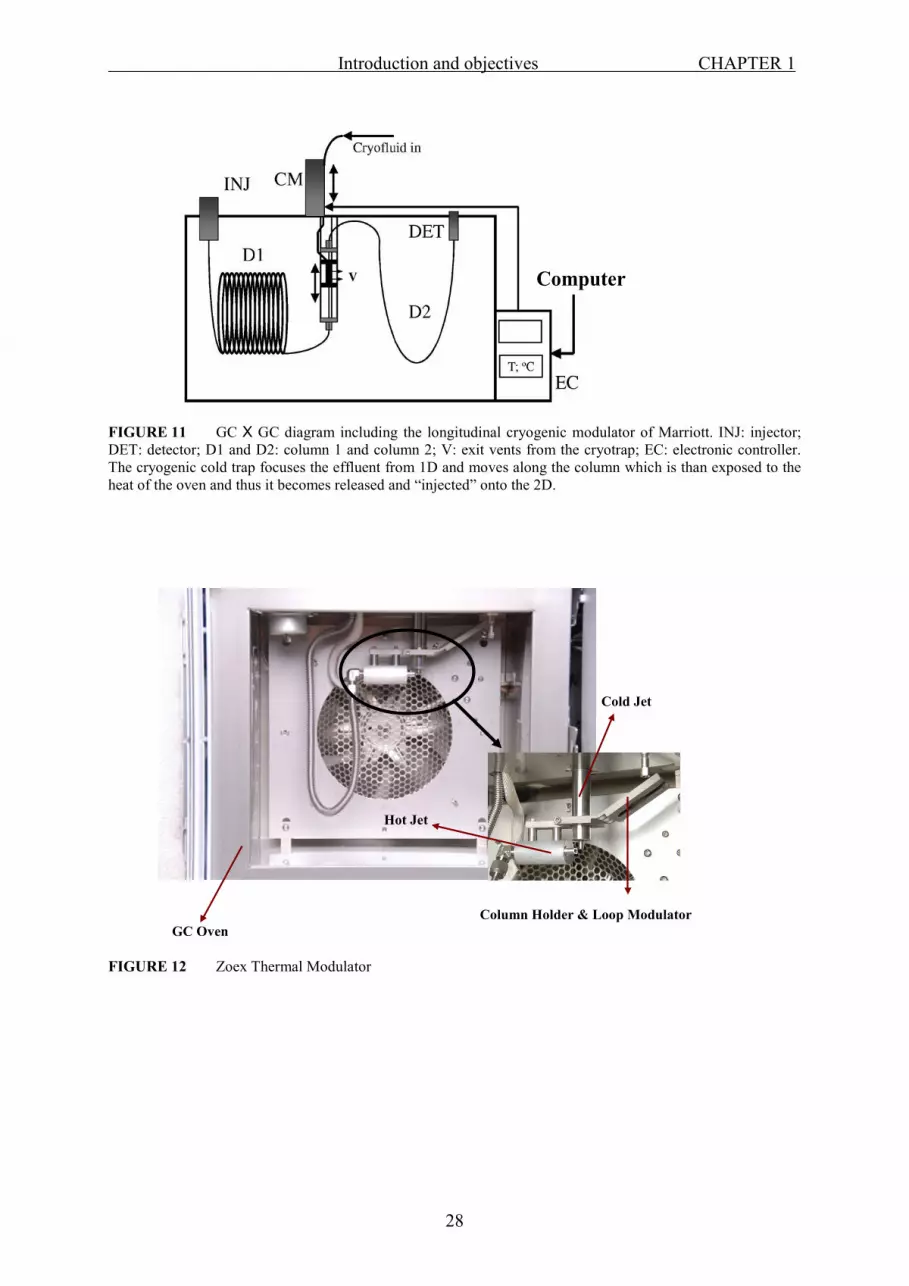
The most common modulators are the “Thermal-Sweeper-Modulator” (TSM) of Phillips
[FIGURE 10] and the “cryogenic-modulator” of Marriott [FIGURE 11]. In our studies, we
have used the “Loop-Modulator” system of Zoex Corporation [FIGURE 12]. The Zoex
system is a modification of the TSM in which the “Loop-Modulator” consists of a length of
column looped through the paths of intersecting hot and cold jets. The cooling (trapping) and

Introduction and objectives CHAPTER 1
27
heating (releasing), modulation cycle, of the analytes happens every few seconds on the loop.
Two cold spots are used for producing very sharp “injections” onto the 2D column
FIGURE 10 Thermal-Sweeper-Modulator of Phillips. C1, C2 and C3 are column connections; A: accumulator consisting of an uncoated capillary column as well P (called a pigtail); S: slotted heater. The heater moves over the accumulator and releases the accumulated effluent from the 1D
S in the heating position
Introduction and objectives CHAPTER 1
28
Cold Jet
Hot Jet
GC OvenColumn Holder & Loop Modulator
Cold Jet
Hot Jet
GC OvenColumn Holder & Loop Modulator
FIGURE 11 GC X GC diagram including the longitudinal cryogenic modulator of Marriott. INJ: injector; DET: detector; D1 and D2: column 1 and column 2; V: exit vents from the cryotrap; EC: electronic controller. The cryogenic cold trap focuses the effluent from 1D and moves along the column which is than exposed to the heat of the oven and thus it becomes released and “injected” onto the 2D.
FIGURE 12 Zoex Thermal Modulator
ComputerComputer

Preparation of heptadecaenoic (17:1) fatty acids CHAPTER 2
29
CHAPTER 2
Preparation, chromatographic separation and relative retention times of cis/trans
heptadecaenoic (17:1) fatty acids.
Pierluigi Delmonte, Qing Hu, Ali Reza Fardin-Kia, Jeanne I. Rader
Journal of Chromatography A; 1214, 30-36 (2008)

Preparation of heptadecaenoic (17:1) fatty acids CHAPTER 2
30

Preparation of heptadecaenoic (17:1) fatty acids CHAPTER 2
31

Preparation of heptadecaenoic (17:1) fatty acids CHAPTER 2
32

Preparation of heptadecaenoic (17:1) fatty acids CHAPTER 2
33

Preparation of heptadecaenoic (17:1) fatty acids CHAPTER 2
34

Preparation of heptadecaenoic (17:1) fatty acids CHAPTER 2
35

Preparation of heptadecaenoic (17:1) fatty acids CHAPTER 2
36

Review of methods for preparation of reference fatty acids CHAPTER 3
37
CHAPTER 3
Review of Methods for Preparation and Gas Chromatographic Separation of trans and
cis Reference Fatty Acids.
Pierluigi Delmonte, Ali Reza Fardin-Kia; Qing Hu; Jeanne I. Rader
Journal of AOAC International; 92, 1310-1326 (2009)
Review of methods for preparation of reference fatty acids CHAPTER 3
38

Review of methods for preparation of reference fatty acids CHAPTER 3
39

Review of methods for preparation of reference fatty acids CHAPTER 3
40

Review of methods for preparation of reference fatty acids CHAPTER 3
41

Review of methods for preparation of reference fatty acids CHAPTER 3
42

Review of methods for preparation of reference fatty acids CHAPTER 3
43

Review of methods for preparation of reference fatty acids CHAPTER 3
44

Review of methods for preparation of reference fatty acids CHAPTER 3
45

Review of methods for preparation of reference fatty acids CHAPTER 3
46

Review of methods for preparation of reference fatty acids CHAPTER 3
47

Review of methods for preparation of reference fatty acids CHAPTER 3
48

Review of methods for preparation of reference fatty acids CHAPTER 3
49

Review of methods for preparation of reference fatty acids CHAPTER 3
50

Review of methods for preparation of reference fatty acids CHAPTER 3
51

Review of methods for preparation of reference fatty acids CHAPTER 3
52

Review of methods for preparation of reference fatty acids CHAPTER 3
53
Review of methods for preparation of reference fatty acids CHAPTER 3
54
GC separation of fatty acids using ionic liquid column CHAPTER 4
55
CHAPTER 4
Separation characteristics of fatty acid methyl esters using SLB-IL111, a new ionic
liquid coated capillary gas chromatographic column.
Pierluigi Delmonte; Ali-Reza Fardin Kia; John K.G. Kramer; Magdi M. Mossoba; Len
Sidisky; Jeanne I. Rader
Journal of Chromatography A; 1218, 545-554 (2011)

GC separation of fatty acids using ionic liquid column CHAPTER 4
56

GC separation of fatty acids using ionic liquid column CHAPTER 4
57

GC separation of fatty acids using ionic liquid column CHAPTER 4
58

GC separation of fatty acids using ionic liquid column CHAPTER 4
59

GC separation of fatty acids using ionic liquid column CHAPTER 4
60

GC separation of fatty acids using ionic liquid column CHAPTER 4
61

GC separation of fatty acids using ionic liquid column CHAPTER 4
62

GC separation of fatty acids using ionic liquid column CHAPTER 4
63

GC separation of fatty acids using ionic liquid column CHAPTER 4
64

GC separation of fatty acids using ionic liquid column CHAPTER 4
65

GC separation of fatty acids in milk fat using ionic liquid column CHAPTER 5
66
CHAPTER 5
Evaluation of highly polar ionic liquid gas chromatographic column for the
determination of fatty acids in milk fat.
Pierluigi Delmonte; Ali Reza Fardin-Kia; John K.G. Kramer; Magdi M. Mossoba; Len
Sidisky; Cynthia Tyburczy; Jeanne I. Rader
Journal of Chromatography A; 1233, 137-146 (2012)

GC separation of fatty acids in milk fat using ionic liquid column CHAPTER 5
67

GC separation of fatty acids in milk fat using ionic liquid column CHAPTER 5
68

GC separation of fatty acids in milk fat using ionic liquid column CHAPTER 5
69

GC separation of fatty acids in milk fat using ionic liquid column CHAPTER 5
70

GC separation of fatty acids in milk fat using ionic liquid column CHAPTER 5
71

GC separation of fatty acids in milk fat using ionic liquid column CHAPTER 5
72

GC separation of fatty acids in milk fat using ionic liquid column CHAPTER 5
73

GC separation of fatty acids in milk fat using ionic liquid column CHAPTER 5
74

GC separation of fatty acids in milk fat using ionic liquid column CHAPTER 5
75

GC separation of fatty acids in milk fat using ionic liquid column CHAPTER 5
76

GC-Online-Hydrogenation × GC CHAPTER 6
77
CHAPTER 6
Separation of Fatty Acid Methyl Esters by GC-Online Hydrogenation × GC.
Pierluigi Delmonte; Ali-Reza Fardin-Kia, Jeanne I. Rader
Analytical Chemistry; 85, 1517-1524 (2013)

GC-Online-Hydrogenation × GC CHAPTER 6
78

GC-Online-Hydrogenation × GC CHAPTER 6
79

GC-Online-Hydrogenation × GC CHAPTER 6
80

GC-Online-Hydrogenation × GC CHAPTER 6
81

GC-Online-Hydrogenation × GC CHAPTER 6
82

GC-Online-Hydrogenation × GC CHAPTER 6
83

GC-Online-Hydrogenation × GC CHAPTER 6
84

GC-Online-Hydrogenation × GC CHAPTER 6
85

GC Separation of menhaden oil fatty acids CHAPTER 7
86
CHAPTER 7
Separation of menhaden oil fatty acid methyl esters using highly polar gas liquid
chromatography coupled with identification using time of flight mass spectrometry.
Ali Reza Fardin-Kia; Pierluigi Delmonte; John K.G. Kramer; Gerhard Jahreis; Katrin Kuhnt;
Viviana Santercole; Jeanne I. Rader
Lipids; just accepted (July 27, 2013)

GC Separation of menhaden oil fatty acids CHAPTER 7
87

GC Separation of menhaden oil fatty acids CHAPTER 7
88
Separation of the fatty acids in menhaden oil as methyl esters with a highly polar
ionic liquid gas chromatographic column, and identification by time of flight
mass spectrometry.
Ali Reza Fardin-Kia1, Pierluigi Delmonte1, John K.G. Kramer2, Gerhard Jahreis3,
Katrin Kuhnt3, Viviana Santercole4, Jeanne I. Rader1
1Office of Regulatory Science, Center for Food Safety and Applied Nutrition, Food and Drug
Administration, College Park, MD, USA. 2 Retired from Guelph Food Research Center, Agriculture and Agri-Food Canada, Guelph,
ON, Canada. 3 Institute of Nutrition, Friedrich Schiller University Jena, Jena, Germany. 4 University of Sassari, Faculty of Veterinary Medicine, I-07100 Sassari, Italy.
Running title: Separation of marine oil FA using ionic liquid GC columns.
Key words: ionic liquid, SLB-IL111, GC, gas chromatography, menhaden oil, marine oil,
PUFA, GC-TOF/MS.
*Corresponding author:
Fardin-Kia Ali Reza
HFS-717
US Food and Drug Administration
5100 Paint Branch Pkwy
College Park, MD, 20740

GC Separation of menhaden oil fatty acids CHAPTER 7
89
ABBREVIATIONS:
AOCS American Oil Chemists’ Society
CI chemical ionization
CLA conjugated linoleic acid CPS cyanopropylsiloxane DHA docosahexaenoic acid DMOX 4,4-dimethyloxazoline ECL equivalent chain length EI electron impact ionization EPA eicosapentaenoic acid FA fatty acid FCL fractional chain length FD furane dimethyl FAME fatty acid methyl ester FID flame ionization detector FM furane mono-methyl GC gas chromatography HPLC high performance liquid chromatography MI methylene interrupted MS mass spectrometry MUFA monounsaturated fatty acid NMI non-methylene interrupted PEG polyethylene glycol PUFA polyunsaturated fatty acid RT retention time SFA saturated fatty acid TMTD tetramethyltridecanoate TOF time of flight

GC Separation of menhaden oil fatty acids CHAPTER 7
90
ABSTRACT The fatty acids contained in marine oils or products are traditionally analyzed by gas
chromatography using capillary columns coated with polyethylene glycol phases. Recent
reports indicate that 100% cyanopropyl siloxane phases should also be used when the
analyzed samples contain trans fatty acids. We investigated the separation of the fatty acid
methyl esters prepared from menhaden oil using the more polar SLB-IL111 (200m x 0.25mm)
ionic liquid capillary column and the chromatographic conditions previously optimized for the
separation of the complex mixture of fatty acid methyl esters prepared from milk fat.
Identifications of fatty acids were achieved by applying Ag+-HPLC fractionation and GC-
TOF/MS analysis in CI+ mode with isobutane as the ionization reagent. Calculation of
equivalent chain lengths confirmed the assignment of double bond positions. This
methodology allowed the identification of 125 fatty acids in menhaden oil, including
isoprenoid and furanoid fatty acids, and the novel 7-methyl-6-hexadecenoic and 7-methyl-6-
octadecenoic fatty acids. The chromatographic conditions applied in this study showed the
potential of separating in a single 90 min analysis, among others, the short chain and trans
fatty acids contained in dairy products, and the polyunsaturated fatty acids contained in
marine products.
INTRODUCTION The oils and fats extracted from marine products, including fish and algae, are known to
contain over 100 different fatty acids (FA) with a wide range of chain lengths and
unsaturations [1-3]. Their determination is most commonly achieved by gas chromatography
(GC) after derivatization to their corresponding FA methyl esters (FAME). For ease of
identification and to avoid overlap, Ackman [4] proposed the use of polyethylene glycol
(PEG) phases with medium polarity that minimized the overlap of unsaturated FAME with
different chain lengths. These GC columns have subsequently been recommended in the
American Oil Chemists’ Society (AOCS) Official Method Ce 1i-07 [2] for the analysis of
saturated FA, cis-monounsaturated FA (MUFA), and cis-polyunsaturated FA (PUFA) in
marine and other oils. The selectivity for FAME of these capillary columns is based primarily
on the FAME chain length, secondarily on the number of double bonds, and also on the
double bond positions [4,5,6]. Capillary columns coated with PEG show little selectivity
based on

GC Separation of menhaden oil fatty acids CHAPTER 7
91
the geometric configuration of FAME unsaturations and are not suitable for the quantification
of trans FA [3]. Trans FA in fish and fish products may occur as a result of heating or
processing [7-9] or when the product is combined with other ingredients that may contain
trans FA [10]. Dietary supplements of fish oil may also contain trans FA [11,12]. Current
efforts to enrich ruminant products with docosahexaenoic acid (DHA) will require the
separation of many natural trans FA [13] and trans FA metabolites formed from DHA and
other PUFA in the rumen [14,15].
The selectivity toward the number, geometric configuration and position of double bonds of
FAME can be increased by selecting capillary columns coated with phases of higher polarity.
Use of capillary columns coated with 100% cyanopropyl siloxane (CPS) is the current
preferred approach for the separation of positional and geometric isomers of unsaturated
FAME, specifically for trans FA [3,16-20]. However, it is evident that isothermal elutions
[17,19,21], single temperature programs [18,19], combinations of temperature programs [18]
or use of a combination of results achieved using different GC columns [16,21] are unable to
resolve all the FA present in marine [3,21] or ruminant lipids [16,18].
The recent availability of capillary columns coated with ionic liquids of higher polarity than
100% CPS phases provided new selectivities for the analysis of FAME. Delmonte et al. [22]
demonstrated that the coating of the SLB-IL111 capillary column is characterized by a
significantly higher selectivity toward the number, geometric configuration and position of
the FAME double bonds as shown using synthetic mixtures of FAME positional/geometric
isomers. The authors used the same capillary column to resolve the FAME prepared from
milk fat and further increased the separation potential by doubling its length from 100 m to
200 m, still retaining the 0.25 mm internal diameter. This methodology provided an improved
resolution of all the trans-18:1 FAME including the separation between t10- and t11-18:1, the
elution of all trans-18:1 FAME up to t15-18:1 prior to oleic acid, an improved separation of
the cis-18:1 isomers, including of c6- and c7- from c8-18:1, the separation of a higher number
of c/t-18:2 FAME isomers, the resolution of the conjugated linoleic acid (CLA) isomers t7,c9-
and c9,t11-18:2, and the identification of the n-1 MUFA series [23]. The improved resolution
among the cis-18:1 positional isomers using this ionic liquid column also allowed the
identification of the Δ6-MUFA series in human hair and nail samples [24].

GC Separation of menhaden oil fatty acids CHAPTER 7
92
In our previous publication [3] using a 100 m x 25 mm 100% CPS capillary GC column
operated with two different temperature programs, we were able to resolve most, but not all of
the FAME prepared from menhaden oil. In that study [3], we could not confirm the identity of
the FAME for which reference materials were not available.
In the current study, we apply the methodology successfully developed using a 200 m x 25
mm SLB-IL111 capillary column for the analysis of milk fat [23] to the analysis of a sample
of marine origin, specifically menhaden oil. We evaluate whether these chromatographic
conditions allow for the simultaneous separation of short-chain FA, trans FA present in
partially hydrogenated oils and ruminant fats, CLAs, long-chain PUFA, and
geometric/positional isomers of PUFA. In addition, we establish the structures of most of the
FAME by combining information provided by Ag+-HPLC fractionation followed by GC
analysis, high resolution GC-TOF/MS, and calculation of equivalent chain lengths.
MATERIALS AND METHODS
The GLC 463 reference mixture and other FAME reference materials used in this study were
purchased from Nu-Chek Prep, Inc. (Elysian, MN, USA). Methyl phytanate and methyl
pristanate were purchased from Larodan (Malmo, Sweden). Menhaden oil was purchased
from Sigma Aldrich (St. Louis, MO). The CLA mixture UC-59M purchased from Nu-Chek
Prep, Inc. was isomerized using iodine [19,25], and individual CLA isomers were prepared as
previously described [26,27]. α-linolenic (18:3n-3) and γ-linolenic (18:3n-6) acids were
purchased from Nu-Chek Prep, Inc. and isomerized using p-toluene sulfinic acid as previously
described [16,19,28]. The synthetic mixtures containing the positional isomers of cis and
trans monounsaturated FAME were prepared by hydrobromination/dehydrobromination of
reference materials purchased from Nu-Chek Prep, Inc. [19,28]. 4,4-dimethyloxazoline
(DMOX) derivatives were prepared as described previously [27] to identify unsaturated
branched-chain FAME.

GC Separation of menhaden oil fatty acids CHAPTER 7
93
GC-FID analysis of FAME. Gas chromatographic separations were achieved by applying
previously described conditions [23] using an Agilent 7890N gas chromatograph (Agilent
Tech., Wilmington, DE, USA) equipped with a flame ionization detector. The separation
column was prepared by coupling two SLB-IL111 columns (100 m x 0.25 mm, 0.2 µm
thickness, Supelco Inc., Bellefonte, PA, USA) with an Agilent Ultimate Union (Agilent Tech.,
Wilmington, DE). The oven was maintained at 170 °C for 50 min, then the temperature was
raised 6 °C/min to 185 °C and maintained constant for 35 min. Hydrogen was used as carrier
gas with the following flow program: 1.6 mL/min for 35 min, then increased 0.3 mL/min/min
to 3.0 mL/min which was then maintained until the end of the separation. During the
separation the column head pressure increased from 51 to 74 psi. The separation time was
87.5 min, with 5 min post injection re-equilibration time. The detector was maintained at 250
°C and the injection port at 300 °C. Detector constant make up gas plus column flow was set
to 30 mL/min, hydrogen to 30 mL/min, and air to 400 mL/min. Injector split ratio was set to
1:100, which was changed to 1:50 (gas saver mode) 2 min after injection. The injection
volume was 1 µL.
Ag+-HPLC fractionation. Fatty acid methyl esters prepared from menhaden oil were
fractionated as previously described [23] using an Alliance 2695 separation module (Waters,
Milford, USA) equipped with a Waters 2996 PDA detector, a Waters Fraction Collector II,
and a semi-preparative Chromspher 5 Lipids column (10 x 250 mm, 5 µm particle size,
Varian Inc. Walnut Creek, CA). The HPLC system and the fraction collector were operated as
previously described with no modifications, including the same collection timing [23].
GC-MS identification of FAME. Identities of FAME were confirmed using a Micromass
GCT TOF mass spectrometer (Manchester, UK) coupled with an Agilent 6890N gas
chromatograph. The separation was achieved using an SLB-IL111 capillary column (100 m x
0.25 mm, 0.20 mm film thickness) maintained at 170 °C with H2 as the carrier gas at the
pressure of 80 kPa. The mass spectrometer was operated in the CI+ or EI mode. When CI+
mode was selected, isobutane was used as the ionization gas. The source was maintained at
150 °C, the electron energy was 70 eV, the emission current was 250 µA, and the CI gas flow
was set to 10%. When the mass spectrometer was operated in EI mode, the ionization energy
was also set to 70 eV.

GC Separation of menhaden oil fatty acids CHAPTER 7
94
RESULTS
The Ag+-HPLC separation of FAME prepared from menhaden oil provided an elution profile
similar to the profile reported previously for milk fat FAME [23]. The application of the same
experimental conditions and collection parameters provided 4 fractions containing the FAME
of saturated FA (SFA, fraction I); trans-MUFA and t,t-CLAs (fraction II); cis-MUFA plus c,t-
/t,c-CLAs and non-conjugated t,t dienoic FA such as t9,t12-18:2 (fraction III); the non-
conjugated c,t / t,c / c,c dienoic FA and the FA with more than 2 double bonds (fraction IV).
Each of the Figures 1 through 5 shows, from the bottom, the GC separation of the FAME
prepared from menhaden oil, the 4 Ag+-HPLC fractions in order of collection (SFA, trans-
MUFA, cis-MUFA, PUFA), and reference mixture GLC 463. The inserts show the separation
of reference mixtures that facilitate identifications of selected FAME or demonstrates their
absence. With the exception of the FAME reported in Figure 1, which were easily identified
using reference materials and elution principles, identification of the remaining FAME in
Figures 2-5 was achieved or verified using a high resolution TOF/MS operated in CI+ mode.
Isobutane, used as the CI reagent gas, provided mild ionization and the molecular ion [M+H]+
as the most abundant ion for all FAME including PUFA, which indicated the chain length
and the number of unsaturations of FAME. The presence of the [M-MeOH+H]+ ion was used
to verify that the investigated compound was a FAME, which was further confirmed by
comparison with the elution of authentic FAME standards, or previously reported FAME
separations [2,3].
Figures 6 to 9 show the partial GC-TOF/MS regions corresponding to Figures 2 to 5. There
were slight differences in the separation patterns shown in Figures 6-9 compared to those in
Figures 2-5. These differences are attributed to the use of a 100 m rather than a 200 m SLB-
IL111 column for the GC/MS analysis, and the former was operated at 170 °C with no
thermal or flow gradient. Each separation segment shows, at the bottom, the total ion current
(TIC) chromatogram, followed by single ion traces of the molecular ion [M+H]+ of the FAME
eluting in the selected region.

GC Separation of menhaden oil fatty acids CHAPTER 7
95
Figure 1 shows the separation of the short- and mid-chain FAME up to 16:0 present in
menhaden oil. Most of the FAME contained in this section were saturated and were identified
by comparison with the FAME contained in GLC 463. The branched-chain iso- (i) and
anteiso- (ai) FAME eluted at the equivalent chain lengths (ECL) X.47 and X.72, respectively,
consistent with previous observations [3] and their retention times matched the values
previously observed for milk fat FAME [22,23]. In this segment are eluted two isoprenoid
FAME, methyl 4,8,12-trimethyl tridecanoate (4,8,12-TMTD) and methyl 2,6,10,14-
tetramethyl pentadecanoate (methyl pristanate). Both isoprenoid FAME eluted in the SFA
HPLC fraction. These FAME were previously reported in menhaden oil [29], and in this study
were identified by GC-TOF/MS in CI+ mode based on their molecular ions m/z 271.33 and
313.40. The identification of methyl pristanate was also confirmed by comparison with the
elution of its reference material. The only unsaturated FAME observed in this separation
segment (Figure 1, menhaden oil) were c7- and c9-14:1, which were present in trace amounts
and identified by comparison with the cis-14:1 synthetic mixture.
Figure 2 shows the separation of FAME from 16:0 to 18:0 acquired by GC-FID, while Figure
6 shows the same separation segment acquired by GC-TOF/MS. Inserts show the separation
of cis- and trans- 15:1, 16:1 and 17:1 FAME positional isomers and are included in Figure 2
to facilitate identifications. All of the most abundant FAME eluting in this area are separated,
with the exception of the coeluting of c7-16:1 and 17:0. Methyl 7-methyl-6-hexadecenoate (7-
Me-6-16:1 FAME) eluted among the cis-16:1 FAME and showed a molecular ion of m/z
283.34 corresponding to a FAME with 17 carbons and one unsaturation (Figure 6). The GC-
TOF/MS spectrum of 7-Me-6-16:1 FAME acquired in EI mode is reported in Figure 10
(upper panel). This spectrum was identical to the one originally reported by Sano [30] with
m/z 282, 138, 155 and 115 as the diagnostic ions. The elution of this FAME in the trans FA
Ag+-HPLC fraction (II) would suggest that its double bond is in the trans configuration.
However further investigation is needed to establish its geometry. The EI spectrum of 7-Me-
6-16:1 as DMOX derivative showed the same fragmentation pattern reported by Christie [31],
with m/z 126, 113, 55, 208 and 166 (in order of relative abundance) as the predominant
fragmentation ions, and m/z 321 as the molecular ion. As in the case of the spectrum of its
FAME equivalent, the interpretation of the fragmentation pattern is rather complex.

GC Separation of menhaden oil fatty acids CHAPTER 7
96
The isoprenoid FA phytanic acid reported in menhaden oil by Ratnayake et al. [29] was
identified in Figure 6 based on its molecular ion m/z 327.41. Trans 6-16:1 is the main trans
fatty acid present in this fish oil sample and was well separated from other FAME, while t6-,
t10-, and t12/t13-17:1 were found in trace amounts. The n-, i- and ai- 17:0 and the i-18:0
were identified based on their elution in the Ag+-HPLC SFA fraction (Figure 2), and by GC-
TOF/MS based on their molecular weight (Figure 6). Trans- and cis-MUFA were identified
based on the comparison with the separation of synthetic mixtures (inserts), their elution in
the trans- or cis- MUFA Ag+-HPLC fraction, and their corresponding molecular weights.
Figure 3 shows the separation of FAME from 18:0 to linoleic acid (c9,c12-18:2). Inserts
showing the separation of cis- and trans- 17:1, 18:1 and 19:1 FAME positional isomers and
the geometric isomers of 9,12-18:2 are included as references. Figure 7 shows the same
FAME separation segment investigated by GC-TOF/MS. This partial GC region includes the
simultaneous elution of several SFA, MUFA and PUFA. The 16:2, 16:3 and 18:2 positional
isomers eluted in the PUFA HPLC fraction (IV) and were identified by GC-MS based on their
molecular ions. The X:2 FAME (i.e. 16:2, 18:2, 20:2) provided [M]+ as the most abundant ion
instead of [M+H]+. The 16:2 FAME, in particular, were identified based on their [M-
MeOH+H]+ ion instead of [M]+ to avoid the interference with the isotopes of the [M-
MeOH+H]+ ions of 18:1 FAME. The identities of all FAME were consistent with the results
obtained from the GC-online hydrogenation × GC separation of the same menhaden oil
sample [32]. However, the locations of the double bonds could not be determined in either
study and were therefore assigned based on comparison with previously published separations
[2,3]. Several cis-MUFA were found eluting in the cis-MUFA Ag+-HPLC fraction, of which
c9- and c11-18:1 were the most abundant. The trans-MUFA fraction contained only trace
amounts of t8-11-18:1 FAME. Methyl 7-methyl-6-octadecenoate (7-Me-6-18:1) to our
knowledge has not been reported in menhaden oil, and it showed a molecular ion of m/z 310
corresponding to a FAME with 19 carbons and one unsaturation. This FAME eluted in the
trans-MUFA Ag+-HPLC fraction (II) as its homologous 7-Me-6-16:1 FAME. Figure 10
(lower panel) shows the GC-TOF/MS spectrum of 7-Me-6-18:1 FAME acquired in EI mode.
This FAME was identified by Caballeira et al. [33] in the phospholipids fraction of
Holothuria mexicana using a synthetic reference material, and in this study was characterized
by the occurrence of the same diagnostic ions m/z 310, 195, 155, 138 and 115 (Figure 10,
lower panel).
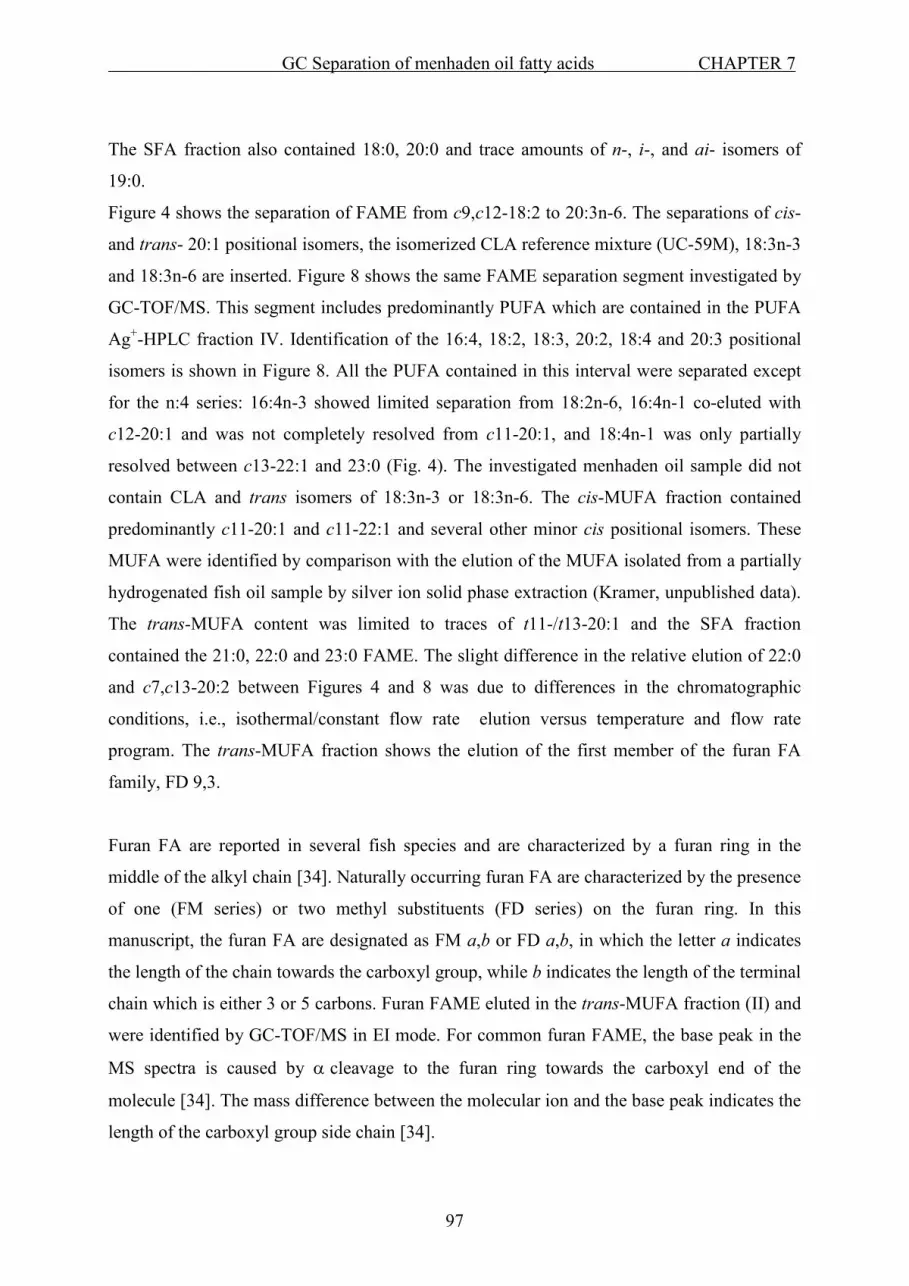
GC Separation of menhaden oil fatty acids CHAPTER 7
97
The SFA fraction also contained 18:0, 20:0 and trace amounts of n-, i-, and ai- isomers of
19:0.
Figure 4 shows the separation of FAME from c9,c12-18:2 to 20:3n-6. The separations of cis-
and trans- 20:1 positional isomers, the isomerized CLA reference mixture (UC-59M), 18:3n-3
and 18:3n-6 are inserted. Figure 8 shows the same FAME separation segment investigated by
GC-TOF/MS. This segment includes predominantly PUFA which are contained in the PUFA
Ag+-HPLC fraction IV. Identification of the 16:4, 18:2, 18:3, 20:2, 18:4 and 20:3 positional
isomers is shown in Figure 8. All the PUFA contained in this interval were separated except
for the n:4 series: 16:4n-3 showed limited separation from 18:2n-6, 16:4n-1 co-eluted with
c12-20:1 and was not completely resolved from c11-20:1, and 18:4n-1 was only partially
resolved between c13-22:1 and 23:0 (Fig. 4). The investigated menhaden oil sample did not
contain CLA and trans isomers of 18:3n-3 or 18:3n-6. The cis-MUFA fraction contained
predominantly c11-20:1 and c11-22:1 and several other minor cis positional isomers. These
MUFA were identified by comparison with the elution of the MUFA isolated from a partially
hydrogenated fish oil sample by silver ion solid phase extraction (Kramer, unpublished data).
The trans-MUFA content was limited to traces of t11-/t13-20:1 and the SFA fraction
contained the 21:0, 22:0 and 23:0 FAME. The slight difference in the relative elution of 22:0
and c7,c13-20:2 between Figures 4 and 8 was due to differences in the chromatographic
conditions, i.e., isothermal/constant flow rate elution versus temperature and flow rate
program. The trans-MUFA fraction shows the elution of the first member of the furan FA
family, FD 9,3.
Furan FA are reported in several fish species and are characterized by a furan ring in the
middle of the alkyl chain [34]. Naturally occurring furan FA are characterized by the presence
of one (FM series) or two methyl substituents (FD series) on the furan ring. In this
manuscript, the furan FA are designated as FM a,b or FD a,b, in which the letter a indicates
the length of the chain towards the carboxyl group, while b indicates the length of the terminal
chain which is either 3 or 5 carbons. Furan FAME eluted in the trans-MUFA fraction (II) and
were identified by GC-TOF/MS in EI mode. For common furan FAME, the base peak in the
MS spectra is caused by α cleavage to the furan ring towards the carboxyl end of the
molecule [34]. The mass difference between the molecular ion and the base peak indicates the
length of the carboxyl group side chain [34].

GC Separation of menhaden oil fatty acids CHAPTER 7
98
The presence of the ions m/z 123 and m/z 109 (lower intensity) indicates an FD structure,
while the presence of the ions m/z 109 and m/z 95 (lower intensity) indicates an FM structure.
Figure 5 shows the separation of FAME from 20:3n-6 to 22:6n-3 and Figure 9 shows the
separation of the FAME present in the same partial GC chromatogram investigated by GC-
TOF/MS. This segment also contained predominantly PUFA with the exception of the 24:0
and 26:0 FAME contained in the SFA fraction and of c13-/c15-/c17-24:1 which were present
in the cis-MUFA fraction along with a cis-23:1 FAME. The identifications of the PUFA
contained in this segment are shown in Figure 8 and are based on the [M+H]+ ion of these
FAME. Most of these PUFA are also components of the GLC 463 reference mixture (top
chromatogram). Six furan FAME were identified in the trans-MUFA Ag+-HPLC fraction II.
Identification of these compounds was achieved by GC-TOF/MS in EI mode applying the
principles described in the section for Figure 4. Under the experimental conditions selected
for this study (injecting 1 µl of 20 mg/ml FAME solution with 1:100 split ratio), the reported
furan FAME were observed in quantities slightly above the limit of detection of the
instrument, and occasionally co-eluted with other FAME. The elution order of 22:5n-6, 21:5n-
3 and 22:4n-3 was established by GC-TOF/MS and was not affected by changes in the
temperature program (Figure 9). All the FAME identified in this segment were well separated
from each other and 22:6n-3, the last FAME considered in this separation, eluted at 81.08
min.
DISCUSSION
The main aim of the study was to evaluate whether a 200 m x 0.25 mm SLB-IL111 capillary
column, operated under the previously optimized conditions, could be used to improve the
separations of the FAME prepared from menhaden oil that are provided by the 100% CPS
columns. Despite its marginal economic significance, menhaden oil has served as a valuable
reference material in many studies and in the establishment of the AOCS current official
method for marine lipids analysis [2] because it contains most of the FA occurring in common
marine fats and oils. It is also commercially available in pure form. A previous attempt to
analyze menhaden oil using a 100 m x 0.25 mm CPS capillary column (SP-2560) and a
temperature program with a plateau at 175 °C provided the resolution of 70 peaks, the
coelution of 13 peaks, and 9 small peaks that could not be identified [3].

GC Separation of menhaden oil fatty acids CHAPTER 7
99
Of the 13 co-eluting FAME, 7 were resolved by conducting an additional separation with the
same GC column but using a temperature program that had a plateau at 150 °C [3]. Two sets
of FAME clusters (t6/t7/t8-18:1 and c6/c7/c8-18:1) could not be separated unless the elution
temperature was further reduced to 120 °C [13,16,18]. However, five FAME could not be
resolved as individual peaks using either temperature program and they included 18:2n-6,
16:4n-1, 18:3n-3, t9-19:1 and 23:0 [3]. A similar conclusion was reached after combining the
results of marine oil analyses using a BPX-70 column (bonded cyanopropyl polysilphenylene
siloxane polymer phase equivalent to 70% CPS) and an SP-2560 column [21].
In the present study, as shown in Figures 1 to 5, we were able to identify 125 FAME prepared
from menhaden oil. The applied methodology, using a 200 m x 0.25 mm SLB-IL111 capillary
column operated with a temperature and flow rate program, could separate these FAME in
107 peaks. About 10 coelutions are caused by FAME present in amounts near their limit of
detection, and only 8 were caused by FAME present in amounts near or above their limit of
quantification. The 8 co-elutions were: 17:0 with c7-16:1 plus t13-16:1 (Figure. 2); 19:0 with
c9-18:1 and 18:2n-6 with 16:4n-3 (Figure 3); 16:4n-1 with 21:0 and 20:2n-6 with a 18:4 (RT
46.88 min, Figure 4); c13-24:1 with FD 11,3; c17-24:1 with 20:5n-4; and 26:0 with FD 11,5
(Figure 5). Based on the results of the Ag+-HPLC fractionation, only minor amounts of t13-
16:1, c11-17:1, a 18:4 (RT 46.88 min) and 20:5n-4 were observed, which reduces to 5 the
quantitatively significant co-elutions. More coeluting and unidentified FAME might be
present in menhaden oil in quantities below the limit of detection of the methodology applied
in this study. These FAME can be resolved and identified by applying extensive
complementary fractionation and concentration procedures [35], followed by multiple GC
analyses. We previously reported the difficulty in separating SFA from major cis-MUFA
using highly polar ionic liquid columns [22,23], and this was also the case here with the co-
elution of 17:0 with c7-16:1 and 19:0 with c9-18:1. Specific pairs of FAME can be better
resolved by fine tuning the elution temperature program, but that would likely lead to the co-
elution of other FAME as previously shown [22,23]. Despite a few limitations observed in
this investigation using a 200 m x 0.25 mm SLB-IL111 capillary column, this separation of
the menhaden oil FAME was a marked improvement over that obtained using a 100 m x 0.25
mm SP-2560. More FAME were resolved in a single analysis than occurred with use of an
SP-2560 operated using two different temperature programs and then combining the results
from the two analyses [3].

GC Separation of menhaden oil fatty acids CHAPTER 7
100
In addition, the latter method was more time consuming, involved two separate analyses, and
required combining the results of two chromatograms [3]. Furthermore, the methodology
developed using the 200 m ionic liquid column provided the means of resolving more PUFA,
branched-chain FA, furanoid FA, and particularly geometric FA isomers, which could not be
separated using 30 m x 0.25 mm PEG columns as recommended in the AOCS Official
Method for marine lipid analysis [2].
The identification of all the FAME prepared from menhaden oil continues to be challenging.
In our previous publication [3], we based the identification of the FAME on authentic FAME
standards, principles of Ag+-HPLC fractionation, and published reports [1,2,4,5,7]. However,
published separations had mainly been conducted using GC columns other than the 100 m x
0.25 mm highly polar CPS phases. In this study, we established the FAME structures by
utilizing the available FAME reference materials and standard mixtures, Ag+-HPLC
fractionation followed by GC analysis, and by conducting complementary GC-TOF/MS
analysis. The high resolution TOF/MS provided reliable and reproducible identifications even
for PUFA present at low concentrations. Chemical ionization using CH4 as the ionization
reagent gas was shown to provide a less marked fragmentation of unsaturated FAME
compared to EI [36]. and the MS spectra might be used to obtain structural information based
on the fragmentation pattern. Still, the fragmentation caused by CH4 as CI reagent did not
allow the observation of the molecular ion of PUFA present in small amounts [36]. Chemical
ionization using isobutane as the reagent gas provided soft ionization that produced an
abundant molecular ion [M+H]+ including for highly unsaturated PUFA contained in small
amounts. As shown in Figures 6 to 9, extracting the expected [M+H]+ ion from the TIC
chromatogram was sufficient to identify the chain-length and the number of double bonds of
most FAME. The presence of the [M-MeOH+H]+ ion was used to verify that the investigated
peaks were FAME. We further compared our results to those obtained applying GC-online
hydrogenation × GC. In this novel application, the FAME are separated using a 200 m x 0.25
mm SLB-IL111 capillary column, then are fully hydrogenated by passage through a capillary
tube coated with Pd, and re-separated in their reduced forms [32]. The elution of the FAME
prepared from menhaden oil on the two dimensional separation plane confirmed the
identifications of both their chain lengths and number of double bonds.

GC Separation of menhaden oil fatty acids CHAPTER 7
101
While the current GC-TOF/MS method provided definitive information regarding the chain
length and number of double bonds of the FAME prepared from menhaden oil, it did not
establish the positions of double bond. Preparation and analysis of the DMOX derivatives or
other suitable derivatives (picolinyl esters, pyrrolidide) or adducts (4-methyl-1,2,4-triazoline-
3-5-dione) could provide this information [37-39]. However, investigation of minor and
partially overlapping peaks would still present a challenge because their signals fall below the
sensitivity of the instrumentation or because mass spectra provide limited information. The
ECL calculations based on the elution times on GC columns have been used and are
commonly recommended to serve as a guide in the assignment of the double bond positions of
highly unsaturated methylene-interrupted (MI) PUFA [37,39]. It is well known that the ECL
of MI PUFA having the same number of double bonds, in the same geometric configuration,
and in the same position relative to the terminal carbon of the FAME have similar fractional
chain length (FCL) values when analyzed using the same GC column under
isothermal/isobaric conditions [40,41]. Since most of the PUFA in fish oils have MI
structures, the ECL and FCL calculations are helpful in the identification of homologous
PUFA. Table 1 presents the ECL and FCL values calculated based on the retention times of
the menhaden oil PUFA separated using the described chromatographic conditions, and
applying the formulas reported by Bannon et al [41]. The PUFA with similar structure
reported in Figures 1 to 5 were characterized by similar FCL values (Table 1). Menhaden oil
contains several MI PUFA with chain lengths ranging from 16 to 22 carbon atoms that can be
identified using the n-6, n-4, n-3 and n-1 nomenclature. The Δ- nomenclature of PUFA is also
provided in Table 1. It should be noted that ECL and FCL calculations strictly apply when
using isothermal/isometric GC conditions. This observation explains why the calculated
ECL/FCL values are more consistent for FAME eluting during the isothermal portion of the
separation, i.e., the first 50 min. After the beginning of the temperature gradient at 50 min the
retention times of the FAME are shortened, causing the deviation of the corresponding
ECL/FCL values from their expected counterparts calculated under constant temperature and
flow conditions. Increasing the flow rate of the carrier gas from 1.6 to 3.0 ml/min after the
elution of the 18:1 and 18:2 FAME (35 min) provided a minor effect on the ECL and FCL
values (Table 1). Increasing the elution temperature from 170 to 185°C after the elution of
18:1, 18:2 and 18:3 FAME (50 min.) allowed the separation of these FAME at their optimal
separation temperature, and then reduced the time of elution of the highly retained PUFA.
Menhaden oil also contained several non-methylene interrupted (NMI) FAME listed in
Table 1.

GC Separation of menhaden oil fatty acids CHAPTER 7
102
Two of the FAME had the same terminal structure and a similar FCL, with the double bonds
separated by 6 methylene (CH2) units (c5,c11-18:2 and c7,c13-20:2). There were two
additional NMI FAME with unknown structures (16:2NMI, 17:2) which FCL values did not
match those of the NMI FAME stated above. Additional studies are needed to establish the
structures of these NMI FAME.
In this study, we were able to confirm the presence of t6-16:1 in menhaden oil. This FAME
was clearly resolved on the 200 m SLB-IL111 column from the other trans-16:1 FAME
contained in the trans-16:1 synthetic mixture (Fig. 2). The occurrence of t6-16:1 FAME was
previously reported by Ackman in a number of marine species [1]. We could only tentatively
identify this FAME in menhaden oil using a 100% CPS column [3], since that phase did not
allow for the separation of t6-, t7- and t8-16:1 [19], while the use of an SLB-IL111 allowed
the separation of t6- from other trans-16:1 FAME (Figure 2). It is of interest to note that small
amounts of t6-17:1 (Figure 2) and t8-18:1 (Figure 3) were also observed, suggesting that t6-
18:1 may be chain elongated in fish.
The occurrence of furan FA in fish lipids was first reported by Glass et al. [42] and further
studies indicated that unsaturations can be present in their alkyl chains. Ishii et al. [34]
reported the presence at least 30 unusual furan FA in the hepatopancreas of crayfish. Furan
FA were isolated (along with some branched-chain FA) by applying hydrogenation followed
by urea fractionation. This procedure provided the comprehensive content in furan FA with a
given carbon skeleton. The current study reports only the elution pattern of fully saturated
furan FAME that are present at concentrations above the limit of detection of this
methodology. The low concentration of the furan FA in menhaden oil and their coelution (as
MEs) with other FAME indicates the need of a prior isolation/concentration of these
compounds before their quantification by GC-FID, or the application of a more
selective/sensitive detection. The chromatographic conditions used for Ag+-HPLC
fractionation eluted furan FAME in the trans-MUFA fraction (II). A more precise evaluation
of the furan FAME elution by Ag+-HPLC indicated that these FAME elute after the SFA and
slightly ahead of the trans-MUFA.
Isoprenoid FA are derived from the metabolism of phytol [43] and were identified in
menhaden oil by Ratnayake et al. [29]. Methyl 4,8,12-TMTD, methyl pristanate and methyl
phytanate are present in fish oils as two diastereoisomers [43,44] and they were eluted as

GC Separation of menhaden oil fatty acids CHAPTER 7
103
partially separated doublets in both the unfractionated sample and the SFA Ag+-HPLC
fraction (I). These isoprenoid FA, which unlikely are de novo synthesized in fish [43], were
all separated from other FAME occurring in menhaden oil and might be used as dietary
markers.
We also wished to settle the question of whether menhaden oil contains naturally occurring
trace amounts of CLA isomers. This occurrence was suspected since in a previous study,
using a SP-2560 column for FAME separation, small amounts of c9,t11-18:2 and t9,t11-18:2
were observed [3]. In this study no peaks were observed in the cis-MUFA fraction (III) where
the c,t-/t,c-CLA are expected to elute (Figure 4), and no peaks were observed in the trans-
MUFA fraction (II) where t,t-CLA are expected to elute based on Ag+-HPLC elution
principles [13]. These obbervations were confirmed by comparison with the separation of the
isomerized CLA mixture inserted in Figure 4, and the separation of previously synthetized
CLA isomers from 6,8- to 13,15-18:2 FAME [26,27]. Ackman previously reported the
absence of CLA in fish oil unless there was a contamination [45] and we can now support this
conclusion. However, it should be noted that partially or fully conjugated FA are also formed
from PUFA during heating of vegetable oils [46] and fish oils [8,9], and therefore, partially or
fully conjugated FA (including CLAs) might occur in refined menhaden oil. If mixtures of
fish and ruminant products containing CLAs were to be investigated using the current GC
conditions, rumenic acid (c9,t11-18:2) would co-elute with a18:4 FAME (RT 46.88 min), and
t,t-CLA positional isomers would coelute with 18:4n-1, 23:0, or c13- and c15-22:1 (Figure 4).
While the occurrence of 7-Me-6-16:1 FA in marine fish oil has already been reported [30,47],
the one of methyl 7-Me-6-18:1 has not. In our previous work, separating the same matrix by
GC - online reduction × GC [32], we observed the presence of their two corresponding FAME
but could not provide their identification. The GC - online reduction × GC results showed two
peaks eluting slightly above the C16 and C18 lines, which would be consistent with the
presence of a double bond (reduced by the Pd catalyst) and a methyl substituent in the central
part of the alkyl chain. The interpretation of their mass spectra as ME or DMOX derivatives is
rather complex [31,47] and likely requires the evaluation of more than one rearrangement.
However, the mass spectra of both compounds show unique fragmentation patterns that could
allow for their identification by comparison with spectra of the same compounds published
elsewhere [30,31,33,47,48,49]. Even though methyl 7-Me-7-16:1 was reported in marine fish

GC Separation of menhaden oil fatty acids CHAPTER 7
104
oils [29,48,49], we observed the occurrence of only methyl 7-Me-6-16:1 FAME as shown by
the single peak contained in the trans-MUFA fraction (II) in Figure 2.
We also considered whether the use of a 100 m x 0.25 mm SLB-IL111 column would be
suitable for routine analysis of fish oil FAME rather than its 200 m x 0.25 mm version. The
results indicate that most of the PUFA (Table 1) can be well separated from each other using
either column versions with the exception of few overlaps as 16:4n-3 with 18:2n-6, and 18:4
(RT46.88 min) with 20:2n-6 FAME. However, the real difference between the separations
provided by these two columns differing in lengths is the lower resolution for the 100 m
column of the positional isomers of unsaturated FAME, such as the separation of t10- from
t11-18:1 [23], and the more extensive overlap of the PUFA with the SFA and MUFA [22,23].
The lower resolution provided by the 100 m column would be of particular concern for the
analysis of marine oils mixed with other fat products, such as ruminant fats, milk fats,
vegetable oils, or partially hydrogenated fats. By contrast, the methodology developed using
the 200 m SLB-IL111 column was shown to successfully separate (as FAME) the complex
mixtures of SFA, MUFA, di-unsaturated FA, CLAs and short-chain FA constituting plant
lipids and ruminant fats [22,23].
CONCLUSIONS
The set of chromatographic conditions described in this study provided the separation of over
100 FAME prepared from menhaden oil, including the positional and geometric isomers of
MUFA, n-6, n-4, n-3 and n-1 MI PUFA with chain lengths from C16 to C22, several NMI
PUFA, saturated and branched-chain FAME. Silver ion chromatography provided a very
useful simplification of the complex elution pattern of the menhaden oil FAME. High
resolution GC-TOF/MS, operated in CI+ mode using isobutane as the ionization gas, provided
unambiguous identifications of the molecular ions of all FAME, including most of the co-
eluting FAME. The identifications of methylene interrupted PUFA were verified by
evaluating their ECL and FCL values. In a previous publication, we demonstrated that the
chromatographic conditions applied in this study provide superior separations of FAME
prepared from partially hydrogenated fats [22] and dairy products [23] compared to other
available methodologies. In this study, we demonstrated that the same methodology can also
be applied to the separation of FAME prepared from fats and oils of marine origin.

GC Separation of menhaden oil fatty acids CHAPTER 7
105
REFERENCES
1. Ackman RG (1989) Fatty acids. In: Ackman RG, (ed) Marine Biogenic Lipids, Fats,
and Oils, Vol. 1, CRC Press, Boca Raton, Fl, pp 103-137.
2. AOCS Official Method Ce 1i-07 (2007). Determination of saturated, cis-
monounsaturated and cis-polyunsaturated fatty acids in marine and other oils containing long-
chain polyunsaturated fatty acids (PUFA) by capillary GLC, AOCS, Urbana, IL.
3. Santercole V, Delmonte P, Kramer JKG (2012) Comparison of separations of fatty
acids from fish products using a 30-m Supelcowax-10 and a 100-m SP-2560 column. Lipids
47:329-344.
4. Ackman RG (1986) WCOT (capillary) gas-liquid chromatography. In: Hamilton RJ,
Rossell JB, (eds) Analysis of oils and fats, Elsevier Applied Science Publishers, New York,
pp 137-206.
5. Ackman RG (1967) The chain-length overlap problem in gas-liquid chromatography
with polyester liquid phases. Lipids 2:502-505.
6. Kramer JKG, Fouchard RC, Jenkins KJ (1985) Differences in chromatographic
properties of fused silica capillary columns, coated, crosslinked, bonded, or crosslinked and
bonded with polyethylene glycols (CARBOWAX 20M) using complex fatty acid methyl ester
mixtures. J Chromatogr Sci 23:54-56.
7. Sébédio J-L, Ratanayake WWN, Ackman RG, Prevost J (1993) Stability of
polyunsaturated omega-3 fatty acids during deep fat frying of Atlantic mackerel (Scomber
scombrus L.). Food Res Int 26:163-172.
8. Fournier V, Juaneda P, Destaillats F, Dionisi F, Lambelet P, Sebedio J-L, Berdeaux O
(2006). Analysis of eicosapentaenoic and docosahexaenoic acid geometrical isomers formed
during fish oil deodorization. J Chromatogr A 1129:21-28.

GC Separation of menhaden oil fatty acids CHAPTER 7
106
9. Fournier V, Destaillats F, Juanéda P, Dionisi F, Lambelet P, Sébédio J-L, Berdeaux O
(2006). Thermal degradation of long-chain polyunsaturated fatty acids during deodorization
of fish oil. Eur J Lipid Sci Technol 108:33-42.
10. Kolanowski W, Laufenberg G (2006) Enrichment of food products with
polyunsaturated fatty acids by fish oil addition. Eur Food Res Technol 222:472- 477.
11. Azizian H, Kramer JKG, Ehler S, Curtis JM (2010) Rapid quantitation of fish oil fatty
acids and their ethyl esters by FT-NIR models. Eur J Lipid Sci Technol 112:452–462.
12. Sciotto C, Mjøs SA (2012) Trans isomers of EPA and DHA in omega-3 products on
the European market. Lipids 47:659-667.
13. Cruz-Hernandez C, Deng Z, Zhou J, Hill AR, Yurawecz MP, Delmonte P, Mossoba
MM, Dugan MER, Kramer JKG (2004) Methods for analysis of conjugated linoleic acid and
trans-18:1 isomers in dairy fats by using a combination of gas chromatography, silver-ion
thin-layer chromatography/gas chromatography, and silver-ion liquid chromatography. J
AOAC Int 87:545-562.
14. Kairenius P, Toivonen V, Shingfield KJ (2011) Identification and ruminal outflow of
long-chain fatty acid biohydrogenation intermediates in cows fed diets containing fish oil.
Lipids 46:587-606.
15. Aldai N, Hervás G, Belenguer Á, Frutos P, Mantecóm AR, Kramer JKG (2012)
Evaluating the in vitro metabolism of docosahexaenoic acid in sheep rumen fluid. Lipids
47:821-825.
16. Kramer JKG, Blackadar CB, Zhou J (2002). Evaluation of two GC columns (60-m
SUPELCOWAX 10 and 100-m CP Sil 88) for analysis of milkfat with emphasis on CLA,
18:1, 18:2 and 18:3 isomers, and short- and long-chain FA. Lipids 37:823B835.
17. Ratnayake WMN, Hansen SL, Kennedy MP (2006) Evaluation of the CP-Sil 88 and
SP-2560 GC columns used in the recently approved AOCS Official Method Ce 1h-05:
Determination of cis-, trans-, saturated, monounsaturated, and polyunsaturated fatty acids in

GC Separation of menhaden oil fatty acids CHAPTER 7
107
vegetable or non- ruminant animal oils and fats by capillary GLC method. J Am Oil Chem
Soc 83:475-488
18. Kramer JKG, Hernandez M, Cruz-Hernandez C, Kraft J, Dugan MER (2008)
Combining results of two GC separations partly achieves determination of all cis and trans
16:1, 18:1, 18:2 and 18:3 except CLA isomers of milk fat as demonstrated using Ag ion SPE
fractionation. Lipids 43:259–273
19. Delmonte P, Fardin Kia A-R, Hu Q, Rader JI (2009) Review of methods for
preparation and gas chromatographic separation of trans and cis reference fatty acids. J.
AOAC Internat. 92:1310-1326.
20. Mossoba MM, Moss J, Kramer JKG (2009) Trans fat labeling and levels in US foods:
assessment of gas chromatographic and infrared spectroscopic techniques for regulatory
compliance. J AOAC Int 92:1284–1300.
21. Mjøs SA, Haugsgjerd BO (2011) Trans fatty acid analyses in samples of marine
origin: The risk of false positives. J Agr Food Chem 59:3520-3531.
22. Delmonte P, Fardin Kia A-R, Kramer JKG, Mossoba MM, Sidisky L, Rader JI (2011)
Separation characteristics of fatty acid methyl esters using SLB-1L111, a new ionic liquid
coated capillary gas chromatographic column. J Chromatogr 1218:545-554.
23. Delmonte P, Fardin Kia A-R, Kramer JKG, Mossoba MM, Sidisky L, Tyburczy C,
Rader JI (2012) Evaluation of highly polar ionic liquid gas chromatographic column for the
determination of the fatty acids in milk fat. J Chromatogr A 1233:137-146.
24. Destaillats F, Guitard M, Cruz-Hernandez C (2011) Identification of Δ6-
monounsaturated fatty acids in human hair and nail samples by gas-chromatography mass-
spectrometry using ionic-liquid based capillary column. J Chromatogr A 1218:9384-9389.
25. Eulitz K, Yurawecz MP, Sehat N, Fritsche J, Roach JAG, Mossoba MM, Kramer JKG,
Adlof RO, Ku Y (1999) Preparation, separation, and confirmation of the eight geometrical
cis/trans conjugated linoleic acid isomers 8,10- through 11,13-18:2. Lipids 34:873-877.

GC Separation of menhaden oil fatty acids CHAPTER 7
108
26. Delmonte P, Roach JAG, Mossoba MM, Morehouse KM, Lehmann L, Yurawecz MP
(2003) Synthesis and isolation of trans-7,cis-9 octadecadienoic acid and other CLA isomers
by base conjugation of partially hydrogenated gamma-linolenic acid. Lipids 38:579-583.
27. Delmonte P, Roach JAG, Mossoba MM, Losi G, Yurawecz MP (2004) Synthesis,
isolation, and GC analysis of all the 6,8-to 13,15-cis/trans conjugated linoleic acid isomers.
Lipids 39:185-191.
28. Delmonte P, Qing H, Fardin Kia A-R, Rader JI (2008) Preparation, chromatographic
separation and relative retention times of cis/trans heptadecaenoic (17:1) fatty acids. J
Chromatogr A 1214:30-36.
29. Ratnayake MWN, Olsson B, Ackman RG (1989) Novel Branched-Chain Fatty Acids
in Certain Fish Oils. Lipids 24, 630-637.
30. Sano Y (1967) Studies on the Antarctic whale oils by gas-liquid chromatography using
a hydrogen flame ionization detector-VIII. Identification of 7-methyl-6-hexadecenoic acid in
whale blubber oil. Yukagaku 16: 605-610
31. The AOCS Lipid Library [http://lipidlibrary.aocs.org/ms/ms12/index.htm; accessed on
05/20/2013]
32. Delmonte P, Fardin Kia A-R, Rader JI (2013) Separation of fatty acid methyl esters by
GC- online hydrogenation × GC. Anal Chem DOI: 10.1021/ac302707z.
33. Caballeira NM, Maldonado ME (1988) 7-Methyl-8-hexadecenoic acid: A novel fatty
acid from the marine sponge Desmapsama anchorata. Lipids 23:690-693
34. Ishii K, Okajima H, Koyamatsu T, Okada Y, Watanabe H (1988) The composition of
furan fatty acids in the crayfish. Lipids 23:694-700.
35. Schröder M, Vetter W (2013) Detection of 430 fatty acid methyl esters from a
transesterified butter sample. J Am Oil Chem Soc 90: 771-790.
36. Dayhuff LE, Wells MJ (2005) Identification of fatty acids in fishes collected from the

GC Separation of menhaden oil fatty acids CHAPTER 7
109
Ohio River using gas chromatography-mass spectrometry in chemical ionization and electron
impact modes. J Chromatogr A 1098:144-149.
37. Spitzer V (1997) Structure analysis of fatty acids by gas chromatography – low
resolution electron impact mass spectrometry of their 4,4 –dimethyloxazoline derivatives – a
review. Prog Lipid Res 35:387-408.
38. Spitzer V (1999) Gas Chromatography/(Electron Impact) Mass Spectrometry Analysis
of Conjugated Linoleic Acid (CLA) Using Different Derivatization Techniques. In: Yurawecz
MP, Mossoba MM, Kramer JKG, Pariza MW, Nelson GJ (eds) Advances in Conjugated
Linoleic Acid Research, Volume 1. AOCS Press, Champaign, IL, pp 110-125.
39. Yu QT, Liu BN, Zhang JY, Huang ZH (1989) Location of double bonds in fatty acids
of fish oil and rat testis lipids. Gas chromatography-mass spectrometry of the oxazoline
derivatives. Lipids 24:79-83.
40. Christie WW (2003) Lipid analysis, isolation, separation, identification and structural
analysis of lipids (3rd Ed), The Oily Press, Bridgwater, England.
41. Bannon CD, Craske JD, Norman LM (1988) Effect of overload of capillary gas-
chromatographic columns on the equivalent chain length of C18 unsaturated fatty acid methyl
esters. J Chromatogr 447:43-52.
42. Glass RL, Krick TP, Sand DM, Rahn CH,, Schlenk H (1975) Furnaoid fatty acids from
fish lipids. Lipids 10:695-702
43. Ackman RG, Hooper SN (1967) Examination of isoprenoid fatty acids as
distinguishing chatactheristics of specific marine oils with particular reference to whale oils
Comp. Biochem. Physiol. 24, 549-565.
44. Ackman RG, Hansen RP (1967). The occurrence of diastereomers of phytanic and
pristanic acids and their determination by gas-liquid chromatography. Lipids 2:357-362.
45. Ackman RG (1999) Conjugated linoleic acid (CLA) in lipids of fish tissue. In:
Yurawecz MP, Mossoba MM, Kramer JKG, Pariza MW, Nelson GJ (eds) Advances in
conjugated linoleic acid research, vol 1. AOCS Press, Champaign, pp 283-295.

GC Separation of menhaden oil fatty acids CHAPTER 7
110
46. Juanéda P, de la Pérrière SB, Sébédio J-L, Grégoire S (2003) Influence of heat and
refining on formation of CLA isomers in sunflower oil. J Am Oil Chem Soc 80:937-940.
47. The AOCS Lipid Library [http://lipidlibrary.aocs.org/ms/ms03b/index.htm; accessed
on 05/20/2013]
48. Ackman RG, Safe L, Hooper SN, Paradis M (1972) 7-Methyl-7-hexadecenoic acid:
Isolation from lipids of the ocean sunfish Mola mola (Linnaeus) 1758. Lipids 8:21-24
Pascal JC, Ackman RG (1975) Occurrence of 7-methyl-7-hexadecenoic acid, the
corresponding alcohol, 7-methyl-6-hexadenoic acid, and 5-methyl-4-hexadecenoic acid in
sperm whale oils. Lipids 10:478-482 LEGENDS TO FIGURES
Fig. 1. Partial GC chromatogram of the 4:0 to 16:0 elution segment. From the bottom: FAME
prepared from menhaden oil before fractionation, Ag+-HPLC fractions containing
SFA (I), trans-MUFA (II), cis-MUFA (III), PUFA (IV), and reference mixture GLC
463. Conditions: Supelco SLB-IL111 capillary column (200 m x 0.25 mm, 0.2 µm
thickness), temperature/flow gradients as described in the experimental section.
Colored inserts show the synthetic cis (blue) and trans (red) 14:1 and 15:1 positional
isomer mixtures. Abbreviations: i- = iso; ai- = anteiso. 4,8,12-TMTD = 4,8,12-
trimethyl-tridecanoate ME.
Fig. 2. Partial GC chromatogram of the 16:0 to 18:0 elution segment. From the bottom:
FAME prepared from menhaden oil before fractionation, Ag+-HPLC fractions
containing SFA (I), trans-MUFA (II), cis-MUFA (III), PUFA (IV), and reference
mixture GLC 463. Conditions: SLB-IL111 capillary column (200 m x 0.25 mm, 0.2
µm thickness), temperature/flow gradients as described in the experimental section.
Abbreviations: i- = iso; ai- = anteiso; Phy-1 = methyl 3S,7R,11R phytanate; Phy-2 =
methyl 3R,7R,11R phytanate, NMI= non methylene interrupted. Colored inserts show
the synthetic cis (blue) and trans (red) 15:1, 16:1 and 17:1 positional isomers
mixtures. 7-Me-6-16:1 = methyl 7-methyl 6-hexadecenoate

GC Separation of menhaden oil fatty acids CHAPTER 7
111
Fig. 3. Partial GC chromatogram of the 18:0 to c9,c12-18:2 elution segment. From the
bottom: FAME prepared from menhaden oil before fractionation, Ag+-HPLC fractions
containing SFA (I), trans-MUFA (II), cis-MUFA (III), PUFA (IV), and reference
mixture GLC 463. Conditions: SLB-IL111 capillary column (200 m x 0.25 mm, 0.2
µm thickness), temperature/flow gradients as described in the experimental section.
Colored inserts show the synthetic cis (blue) and trans (red) 17:1, 18:1 and 19:1
positional isomer mixtures, and isomerized linoleic acid (c9,c12-18:2, pink). 7-Me-6-
18:1 = methyl 7-methyl-6-octadecenoate.
Fig. 4. Partial GC chromatogram of the c9,c12-18:2 to 20:3 elution segment. From the
bottom: FAME prepared from menhaden oil before fractionation, Ag+-HPLC fractions
containing SFA (I), trans-MUFA (II), cis-MUFA (III), PUFA (IV), and reference
mixture GLC 463. Conditions: SLB-IL111 capillary column (200 m x 0.25 mm, 0.2
µm thickness), temperature/flow gradients as described in the experimental section.
CLA = conjugated linoleic acid. Colored inserts show the synthetic cis (blue) and
trans (red) 20:1 positional isomer mixtures, isomerized CLA (green), γ-linolenic acid
(18:3n-6, pink), and α-linolenic acid (18:3n-3, violet).
Fig. 5. Partial GC chromatogram of the 20:3 to 22:6 elution segment. From the bottom:
FAME prepared from menhaden oil before fractionation, Ag+-HPLC fractions
containing SFA (I), trans-MUFA (II), cis-MUFA (III), PUFA (IV), and reference
mixture GLC 463. Conditions: SLB-IL111 capillary column (200 m x 0.25 mm, 0.2
µm thickness), temperature/flow gradients as described in the experimental section.
FM a,b = furan FA with a one methyl substituent on the furanoid ring, a indicates the
length of the alkyl chain containing the carboxyl group, b the length of the terminal
alkyl chain; FD a,b: furan FA with two methyl substituents on the furanoid ring.
Fig. 6. Partial GC-MS chromatogram of the 16:0 to 18:0 elution segment. From the bottom:
TIC chromatogram, selected ion m/z 271.330 [M+H]+ ion of 16:0, m/z 285.350
[M+H]+ ion of 17:0, m/z 269.317 [M+H]+ ion of 16:1, m/z 327.406 [M+H]+ ion of
phytanate, m/z 283.336 [M+H]+ ion of 17:1, m/z 299.370 [M+H]+ ion of 18:0.
Conditions: SLB-IL111 capillary column (100 m x 0.25 mm, 0.2 µm thickness),

GC Separation of menhaden oil fatty acids CHAPTER 7
112
constant elution temperature 170°C, constant elution pressure 80 kPa, TOF mass
spectrometer operated in CI+ mode with isobutane as the CI reagent gas.
Fig. 7. Partial GC-MS chromatogram of the 18:0 to c9,c12-18:2 elution segment. From the
bottom: TIC chromatogram, selected ion m/z 299.372 [M+H]+ ion of 18:0, m/z
283.339 [M+H]+ ion of 17:1, m/z 235.261 [M-MeOH+H]+ ion of 16:2, m/z 297.354
[M+H]+ ion of 18:1, m/z 313.391 [M+H]+ ion of 19:0, m/z 265.284 [M+H]+ ion of
16:3, m/z 294.330 [M]+ ion of 18:2. Conditions as described in Figure 6.
Fig. 8. Partial GC-MS chromatogram of the c9,c12-18:2 to 20:3 elution segment. From the
bottom: TIC chromatogram, selected ion m/z 294.334 [M]+ ion of 18:2, m/z 325.393
[M+H]+ ion of 20:1, m/z 263.271 [M+H]+ ion of 16:4, m/z 341.428 [M+H]+ ion of
21:0, m/z 293.320 [M+H]+ ion of 18:3, m/z 322.373 [M]+ ion of 20:2, m/z 291.306
[M+H]+ ion of 18:4, m/z 353.434 [M+H]+ ion of 22:1, m/z 321.369 [M+H]+ ion of
20:3. Conditions as in described Figure 6.
Fig. 9. Partial GC-MS chromatogram of the 20:3 to 22:6 elution segment. From the bottom:
TIC chromatogram, selected ion m/z 321.369 [M+H]+ ion of 20:3, m/z 319.346
[M+H]+ ion of 20:4, m/z 381.461 [M+H]+ ion of 24:1, m/z 317.332 [M+H]+ ion of
20:5, m/z 331.319 [M+H]+ ion of 21:5, m/z 347.407 [M+H]+ ion of 22:4, m/z 345.358
[M+H]+ ion of 22:5, m/z 343.343 [M+H]+ ion of 22:6. Conditions as described in
Figure 6.
Fig. 10. GC-EI-TOF/MS spectra of methyl 7-methyl-6-hexadecenoate (upper), and methyl 7-
methyl-6-octadecenoate (lower).

GC Separation of menhaden oil fatty acids CHAPTER 7
113
Table 1

GC Separation of menhaden oil fatty acids CHAPTER 7
114
Fig. 1

GC Separation of menhaden oil fatty acids CHAPTER 7
115
Fig. 2
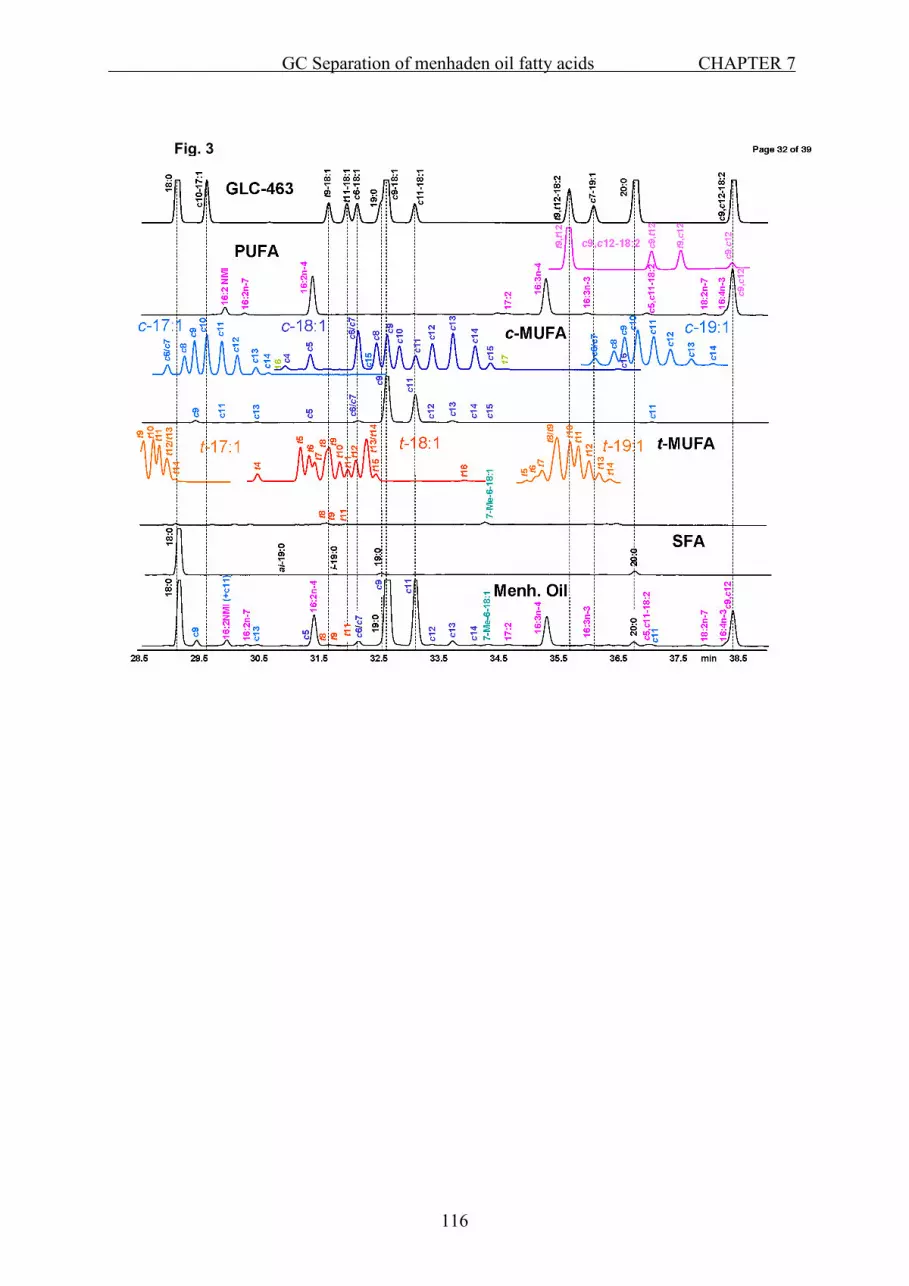
GC Separation of menhaden oil fatty acids CHAPTER 7
116
Fig. 3

GC Separation of menhaden oil fatty acids CHAPTER 7
117
Fig. 4

GC Separation of menhaden oil fatty acids CHAPTER 7
118
Fig. 5

GC Separation of menhaden oil fatty acids CHAPTER 7
119

GC Separation of menhaden oil fatty acids CHAPTER 7
120

GC Separation of menhaden oil fatty acids CHAPTER 7
121

GC Separation of menhaden oil fatty acids CHAPTER 7
122

GC Separation of menhaden oil fatty acids CHAPTER 7
123
Figure 10

Characterization of pine nuts by GC-FID CHAPTER 8
124
CHAPTER 8
Characterization of Pine Nuts in the U.S. Market, Including Those Associated with
“Pine Mouth”, by GC-FID.
Ali Reza Fardin-Kia; Sarah M. Handy; Jeanne I. Rader
Journal of Agricultural and Food Chemistry; 60, 2701-2711 (2012)
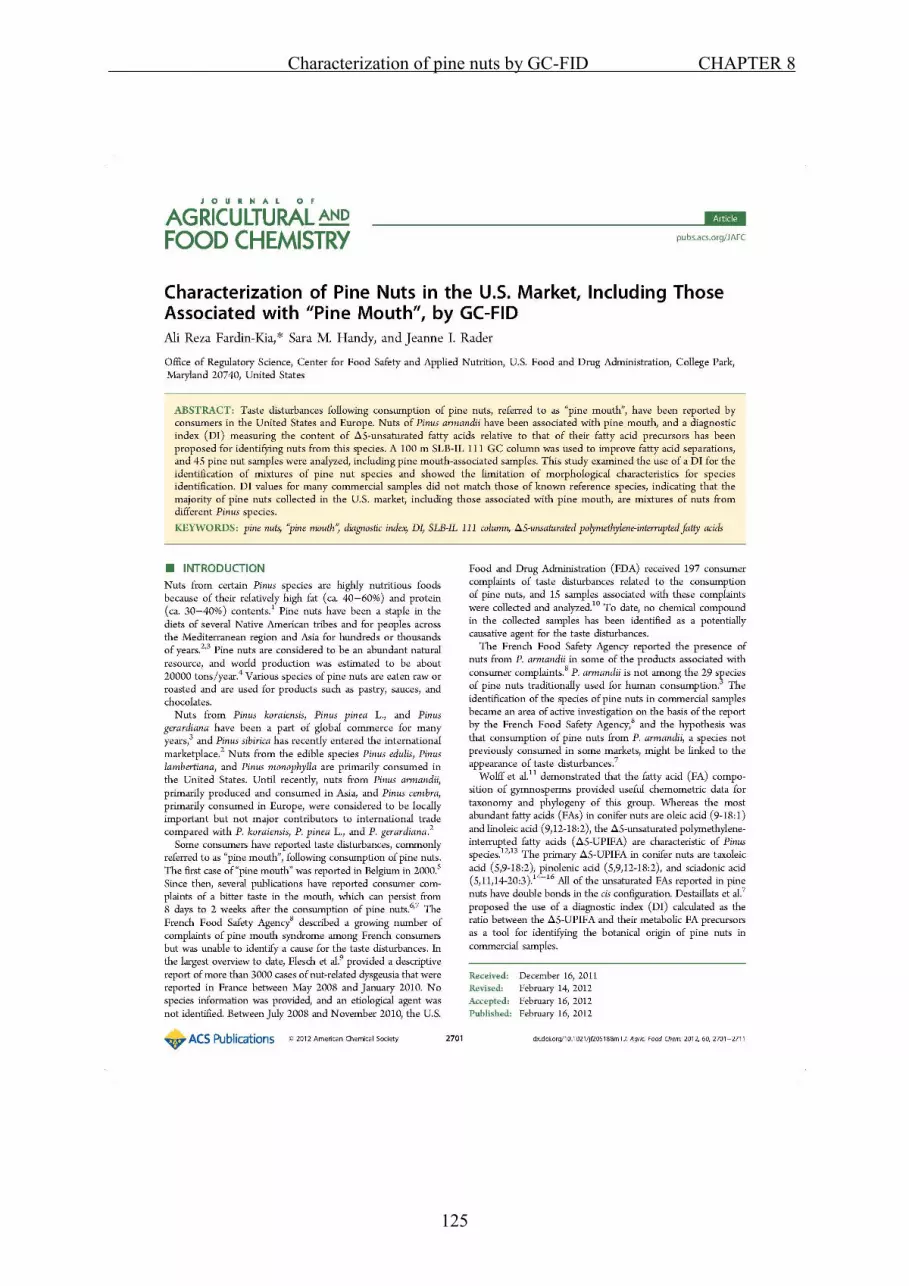
Characterization of pine nuts by GC-FID CHAPTER 8
125

Characterization of pine nuts by GC-FID CHAPTER 8
126

Characterization of pine nuts by GC-FID CHAPTER 8
127

Characterization of pine nuts by GC-FID CHAPTER 8
128

Characterization of pine nuts by GC-FID CHAPTER 8
129
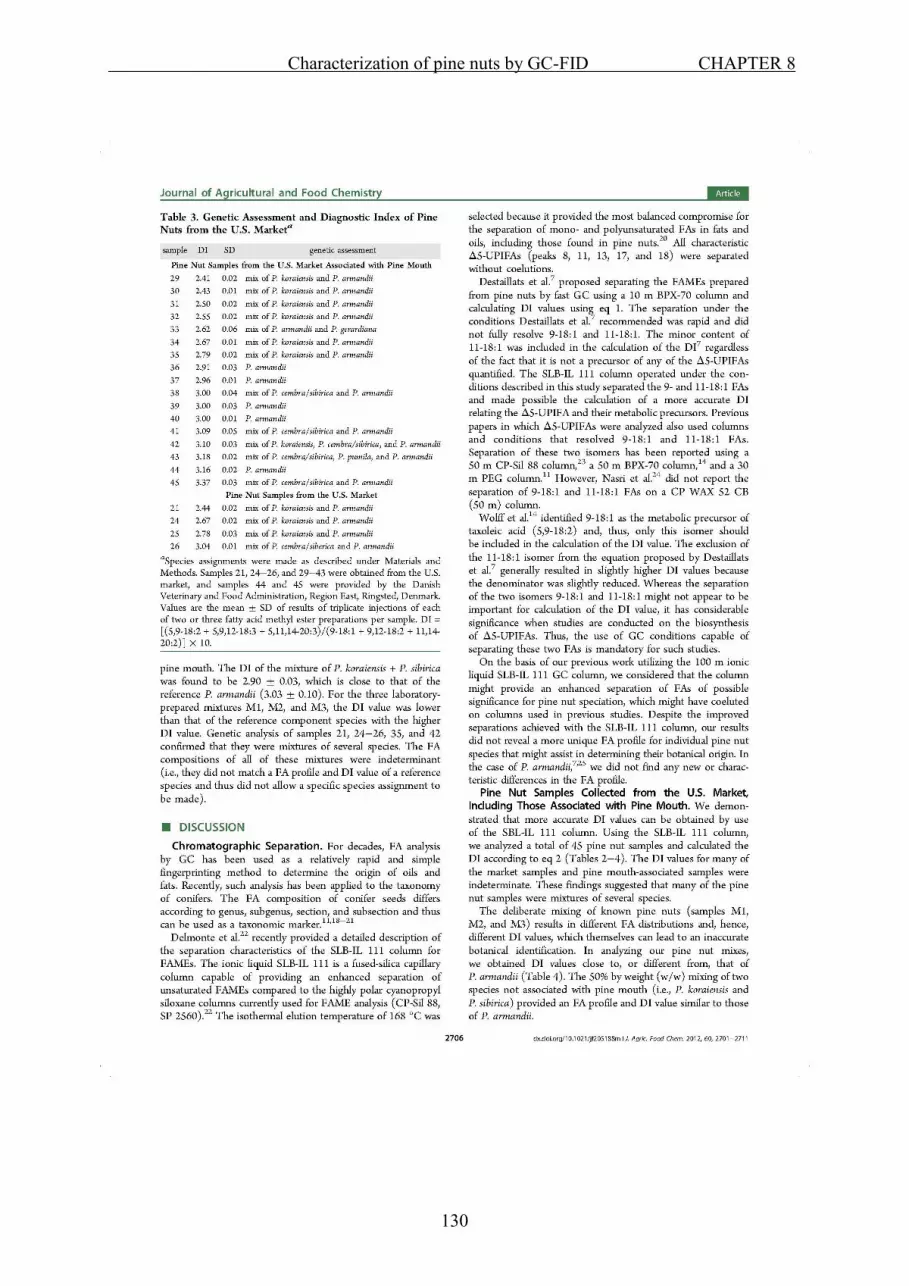
Characterization of pine nuts by GC-FID CHAPTER 8
130

Characterization of pine nuts by GC-FID CHAPTER 8
131

Characterization of pine nuts by GC-FID CHAPTER 8
132

Characterization of pine nuts by GC-FID CHAPTER 8
133

Characterization of pine nuts by GC-FID CHAPTER 8
134

Characterization of pine nuts by GC-FID CHAPTER 8
135

Final Discussion CHAPTER 9
136
CHAPTER 9
FINAL DISCUSSION

Final Discussion CHAPTER 9
137
Chapter 9
FINAL DISCUSSION Separation and quantification of trans fatty acids using ionic liquid capillary GC column Room temperature ionic liquids (RTIL) are generally composed of a cation (e.g., alkyl
imidazolium, alkyl phosphonium, alkyl pyrrolidium, etc.) compensated by an anion of organic
(e.g., NTf2-, TfO-, etc.) or inorganic (e.g., X-, PF6
-, BF4-, etc.) nature (FIGURE 13) [Qiao et
al., 2013]. Their low volatility, relative high thermal stability and high polarity make them
attractive stationary phases for GC. The development of dicationic, trigonal tricationic, and
cross-linked RTILs led to the novel IL capillary columns currently being developed for the
separation of FAME. The unique separation capabilities of SLB-IL111 columns that are novel
capillary columns commercialized by Supelco were evaluated and coated with the most polar
liquid phase currently available for the gas chromatographic separation of FAME.
FIGURE 13 Structure of the ionic liquid phase of the SLB-IL100 capillary column. Methodologies for FAME separations evolved with the availability of columns with
increasing polarity of the stationary phases and number of theoretical plates. For more than
two decades, 100% cyanopropyl siloxane (CPS) have been the most polar and thermally
stable phase available. CPS columns, in the commercial format of 100 m length (0.25 mm
ID), provide the greatest number of theoretical plates and have been used to develop methods
requiring the most refined separation of geometric and positional isomers of FAME. The
AOCS Official Methods Ce-1h 05 and Ce-1j 07 were developed using these columns to
measure the trans FA content of fats and oils from non-marine origin [Mossoba et al., 2009 (J
1,9-di(3-vinylimidazolium) nonane bis(trifluoromethyl) sulfonyl imidate)

Final Discussion CHAPTER 9
138
AOAC Int. 92, 1284-1300)]. The 100 m x 0.25 mm CPS columns SP-2560 (from Supelco
Inc.) and CP-Sil 88 (from Varian Inc.) operated isothermally at 175-180 ◦C maximized the
separation of geometric and positional isomers of unsaturated FAME contained in PHVOs
and ruminant fats [Chapter 3].
Despite the high number of FAME separated by SP-2560 and CP-Sil 88 columns, there are
still several FAME of interest co-eluting in the 16:1, 18:1, 18:2, 20:1/18:3, and CLA isomers
chromatographic regions. Some of these co-elutions can be overcome by applying Ag+ ion
fractionation (Ag+-HPLC, Ag+-TLC or Ag+-SPE) prior to GC quantification, such as the
separation of t9-16:1 that co-elutes with iso-17:0 [Precht and Molkentin, 2000; Cruz-
Hernandez et al., 2006], or by applying two temperature programs to resolve many of the
trans-and cis-16:1, 18:1 and 20:1 isomers [Kramer et al., 2008].
The recent availability of the SLB-IL111, a novel capillary column coated with a proprietary
phase that is markedly more polar than 100% CPS, provided a separation tool characterized
by significantly higher selectivity toward the position and geometric configuration of FA
double bonds. A 100 m SLB-IL111 column operated at 169 °C showed the ability of separate
a greater number of FAME compared to 100% CPS column of the same length, including the
separation of the main two naturally occurring CLA isomers t7,c9- and c9,t11-18:2. Among
other benefits, the SLB-IL111 operated at 169 °C provides the elution of all trans-18:1 FAME
before oleic acid (c9-18:1) and t16-18:1 between c13- and c14-18:1. While these
chromatographic conditions provided the separation of t10-, t11-, and t12-18:1 when they
were present in similar amounts, as in the case of most PHVOs, this resolution did not occur
for samples such as milk fat in which these FAME were present in unequal quantities. The
separation of these FAME isomers can be significantly improved by doubling the length of
the separation column to 200 m, thus taking advantage of the gain in resolution that is
proportional to the square root of the number of theoretical plates.
A 200 m SLB-IL111 column was used in this study to develop a GC method that would
provide a significantly improved separation of the FAME prepared from vegetable fats and
oils and dairy products [Chapter 4], and marine oils [Chapter 7] in a single operation in about
100 min. The time of analysis was similar to that of most other established GC procedures.
The method, which aimed to maximize the separation of the 18:1, 18:2 and 18:3 FAME,
relied on a combined flow and temperature gradient: the flow rate was increased from 1.6 to

Final Discussion CHAPTER 9
139
38 40 42 44 46 48 50 52
min
21:0
t7,c
9
t9,c
11
t10,
c12
t11,
c1318
:3n-
3
c,c,
t
t15/
t16
23:0
c9c1
1
c9,c
12-1
8:2
c13-
22:1
c9,t1
1
19:0
-cyc
lo
t8-t9
t10
t12
t13 t1
4
c11-
22:1
20:2
n-6
c9,t1
1,t1
5-18
:3
c9,c
15-1
8:2
c12,
c15-
18:2
/t11
22:0 20
:3n-
6
18:3
n-6
51.5 55.5 59.5 63.5 67.5 71.5 75.5 79.5
20:5
n-3
24:0
25:0 26
:0
min
23:1
23:1
20:3
n-320
:3 n
-6
20:4
n-6
20:4
n-3
22:4
n-6
c15-
24:1
c13-
24:1
?
c9,t1
1,c1
5-18
:3
22:5
n-3
22:6
n-3
28.5 29.5 30.5 31.5 32.5 33.5 34.5 35.5 36.5 37.5 38.5min
t5t4
t11
t7t6/c
5 t12/
c6/c
7t1
3/t1
4
t8t9
t10
c10
c9/1
9:0
c11
c9
18:0
t16
c13
c14
+ N
IDc1
5
c12
17:0
-cyc
lo
20:0
c9,c
12
NIDNID
+ c
6/c7
NID
NIDt9
,c12
c9,t1
2 +
c11
c9+N
IDc1
6
c11
16:2
t15/
c8
17 NID
24 25 26 27 28 29 min 30
16:0
i-18:
0
18:0
17:0
ai-1
7:0
i-17:
0Ph
y-1
Phy-
2 c9
c6/c
7
15
c10
c11
c12
c13
t14
c9
c6/c
7/t1
3
t10t9 t11/
t12
c9 t5t7
t6 c11c8
t4
t815.5 16.5 17.5 18.5 19.5 20.5 21.5 22.5 23.5 24.5min
6:0
4:0
8:0
7:0
9:0
11:0
12:0
13:0
14:0
16:0
15:0
c9-1
4:1
9-10
:1
i-14:
0c9
-12:
1
ai-1
3:0
i-13:
0 i-16:
0ai-1
5:0
i-15:
010:0
t9 Pris
tana
te
13-1
4:1
11-1
2:1
? 7-
8:1
38 40 42 44 46 48 50 52
min
21:0
t7,c
9
t9,c
11
t10,
c12
t11,
c1318
:3n-
3
c,c,
t
t15/
t16
23:0
c9c1
1
c9,c
12-1
8:2
c13-
22:1
c9,t1
1
19:0
-cyc
lo
t8-t9
t10
t12
t13 t1
4
c11-
22:1
20:2
n-6
c9,t1
1,t1
5-18
:3
c9,c
15-1
8:2
c12,
c15-
18:2
/t11
22:0 20
:3n-
6
18:3
n-6
38 40 42 44 46 48 50 52
min38 40 42 44 46 48 50 52
min
21:0
t7,c
9
t9,c
11
t10,
c12
t11,
c1318
:3n-
3
c,c,
t
t15/
t16
23:0
c9c1
1
c9,c
12-1
8:2
c13-
22:1
c9,t1
1
19:0
-cyc
lo
t8-t9
t10
t12
t13 t1
4
c11-
22:1
20:2
n-6
c9,t1
1,t1
5-18
:3
c9,c
15-1
8:2
c12,
c15-
18:2
/t11
22:0 20
:3n-
6
18:3
n-6
51.5 55.5 59.5 63.5 67.5 71.5 75.5 79.5
20:5
n-3
24:0
25:0 26
:0
min
23:1
23:1
20:3
n-320
:3 n
-6
20:4
n-6
20:4
n-3
22:4
n-6
c15-
24:1
c13-
24:1
?
c9,t1
1,c1
5-18
:3
22:5
n-3
22:6
n-3
51.5 55.5 59.5 63.5 67.5 71.5 75.5 79.5
20:5
n-3
24:0
25:0 26
:0
min
23:1
23:1
20:3
n-320
:3 n
-6
20:4
n-6
20:4
n-3
22:4
n-6
c15-
24:1
c13-
24:1
?
c9,t1
1,c1
5-18
:3
22:5
n-3
22:6
n-3
28.5 29.5 30.5 31.5 32.5 33.5 34.5 35.5 36.5 37.5 38.5min
t5t4
t11
t7t6/c
5 t12/
c6/c
7t1
3/t1
4
t8t9
t10
c10
c9/1
9:0
c11
c9
18:0
t16
c13
c14
+ N
IDc1
5
c12
17:0
-cyc
lo
20:0
c9,c
12
NIDNID
+ c
6/c7
NID
NIDt9
,c12
c9,t1
2 +
c11
c9+N
IDc1
6
c11
16:2
t15/
c8
17 NID
28.5 29.5 30.5 31.5 32.5 33.5 34.5 35.5 36.5 37.5 38.5min28.5 29.5 30.5 31.5 32.5 33.5 34.5 35.5 36.5 37.5 38.5min
t5t4
t11
t7t6/c
5 t12/
c6/c
7t1
3/t1
4
t8t9
t10
c10
c9/1
9:0
c11
c9
18:0
t16
c13
c14
+ N
IDc1
5
c12
17:0
-cyc
lo
20:0
c9,c
12
NIDNID
+ c
6/c7
NID
NIDt9
,c12
c9,t1
2 +
c11
c9+N
IDc1
6
c11
16:2
t15/
c8
17 NID
24 25 26 27 28 29 min 30
16:0
i-18:
0
18:0
17:0
ai-1
7:0
i-17:
0Ph
y-1
Phy-
2 c9
c6/c
7
15
c10
c11
c12
c13
t14
c9
c6/c
7/t1
3
t10t9 t11/
t12
c9 t5t7
t6 c11c8
t4
t8
24 25 26 27 28 29 min 3024 25 26 27 28 29 min 30
16:0
i-18:
0
18:0
17:0
ai-1
7:0
i-17:
0Ph
y-1
Phy-
2 c9
c6/c
7
15
c10
c11
c12
c13
t14
c9
c6/c
7/t1
3
t10t9 t11/
t12
c9 t5t7
t6 c11c8
t4
t815.5 16.5 17.5 18.5 19.5 20.5 21.5 22.5 23.5 24.5min
6:0
4:0
8:0
7:0
9:0
11:0
12:0
13:0
14:0
16:0
15:0
c9-1
4:1
9-10
:1
i-14:
0c9
-12:
1
ai-1
3:0
i-13:
0 i-16:
0ai-1
5:0
i-15:
010:0
t9 Pris
tana
te
13-1
4:1
11-1
2:1
? 7-
8:1
15.5 16.5 17.5 18.5 19.5 20.5 21.5 22.5 23.5 24.5min15.5 16.5 17.5 18.5 19.5 20.5 21.5 22.5 23.5 24.5min15.5 16.5 17.5 18.5 19.5 20.5 21.5 22.5 23.5 24.5min
6:0
4:0
8:0
7:0
9:0
11:0
12:0
13:0
14:0
16:0
15:0
c9-1
4:1
9-10
:1
i-14:
0c9
-12:
1
ai-1
3:0
i-13:
0 i-16:
0ai-1
5:0
i-15:
010:0
t9 Pris
tana
te
13-1
4:1
11-1
2:1
? 7-
8:1
3.0 ml/min after the elution of the 18:2 FAME, while the temperature was raised from 170 °C
to 185 °C after the elution of the 18:3 FAME. Figure 14 shows the separation of FAME
prepared from milk fat that can be achieved by this method in 90 min.
FIGURE 14 Separation of milk fat FAME using a 200 m SLB-IL 111
In addition to separating the C18 FAME which are the primary constituents of most vegetable
fats and oils, the selected conditions provided the separation of the short chain FAME
including C4:0 contained in milk fat and the long chain PUFA up to docosahexaenoic acid
(DHA) contained in marine products such as menhaden oil (FIGURE 15). The separations of
all CLA isomers occurring in ruminant fats, including c9,t11- from t7,c9-18:2, and of the
most geometric and positional isomers from 6,8 - 13,15-18:2 were among the most relevant
improvements provided by this separation method. The separation of many of these FAME
was not possible using 100 m CPS columns at any isothermal temperature or temperature
program conditions [Cruz-Hernandez et al.,2006; Yurawecz et al., 1998]. Thus, the use of this
method eliminated the need for a complimentary Ag+-HPLC technique to resolve these two
major CLA isomers [Cruz-Hernandez et al., 2004]. The c9,t11-18:2 content in ruminant fats
was overestimated using 100% CPS columns, unless an additional Ag+-HPLC step was
included to measure these two CLA isomers. The novel methodology described here for
FAME separation and quantification will significantly reduce the time and expertise required

Final Discussion CHAPTER 9
140
28.5 29.5 30.5 31.5 32.5 33.5 34.5 35.5 36.5 37.5 38.5
c5 c 7t8 t9
c 9 c 11
c9
18:0
c13
c14
c12 20:0
c9, c
12
c13
16:2
NM
I (+c
11)
19:0
t11
c7,c
10-1
6:2
16:2
n-4
16:3
n -4
16:3
n-3
16:4
n-3
c8,c
11-1
8:2
c5,c
11-1
8:2
c11
17:2
x2
38 40 42 44 46 48 50 52
18:3
n-3
23:0c9
c11
c 9,c
12-1
8:2
c13 -
22:1
t13
c11 -
22:1
20:2
n-6
t11
22:0
20:3
n-6
18:3
n-6
c13
c6
18:2
n-4
c14 c15 -
22:116
:4n-
1
16:4
n-3
18:3
n-4
18:4
n-3
18:4
n-1
18:4
n-6
c7, c
13-2
0:2
20:2
n -4
24 25 26 27 28 29 30
16:0
i- 18:
0
18:0
17:0
ai-1
7:0
i-17:
0
c9c10 c1
1
c 13
c9
( c7/
t 13)
t10
t9 t11/
t12
c9 t5t6
16:2
n -4
t12/
t 13
t 6 t10Ph
y-2
Phy-
1
x1
15.5 16.5 17.5 18.5 19.5 20.5 21.5 22.5 24.5min
12:0
13:0
14:0
16:0
15:0
c9-1
4:1
i-14:
0
i-13:
0
i -16:
0
ai-1
5:0
i -15:
0
Pris
tana
tec7
-14:
1
51.5 55.5 59.5 63.5 67.5 71.5 75.5 79.5
20:5
n-3
24:0
c17 -
24:1
min
23:1
23:1
20:3
n-3
20:3
n-6
20:4
n-6
20:4
n-3
22:4
n -6
c15-
24:1
c13-
24:1
22:5
n-3
22:6
n-3
22:5
n-6
26:0 21
:5n-
3
22:2
n-6
20:3
n-4
22:4
n -3
16:1
18:1
20:1
28.5 29.5 30.5 31.5 32.5 33.5 34.5 35.5 36.5 37.5 38.528.5 29.5 30.5 31.5 32.5 33.5 34.5 35.5 36.5 37.5 38.5
c5 c 7t8 t9
c 9 c 11
c9
18:0
c13
c14
c12 20:0
c9, c
12
c13
16:2
NM
I (+c
11)
19:0
t11
c7,c
10-1
6:2
16:2
n-4
16:3
n -4
16:3
n-3
16:4
n-3
c8,c
11-1
8:2
c5,c
11-1
8:2
c11
17:2
x2
38 40 42 44 46 48 50 52
38 40 42 44 46 48 50 52
18:3
n-3
23:0c9
c11
c 9,c
12-1
8:2
c 13-
22:1
t13
c11 -
22:1
20:2
n-6
t11
22:0
20:3
n-6
18:3
n-6
c13
c6
18:2
n-4
c14 c15 -
22:116
:4n-
1
16:4
n-3
18:3
n-4
18:4
n-3
18:4
n-1
18:4
n-6
c7, c
13-2
0:2
20:2
n -4
24 25 26 27 28 29 3024 25 26 27 28 29 30
16:0
i- 18:
0
18:0
17:0
ai-1
7:0
i-17:
0
c9c10 c1
1
c 13
c9
( c7/
t 13)
t10
t9 t11/
t12
c9 t5t6
16:2
n -4
t12/
t 13
t 6 t10Ph
y-2
Phy-
1
x1
15.5 16.5 17.5 18.5 19.5 20.5 21.5 22.5 24.5min15.5 16.5 17.5 18.5 19.5 20.5 21.5 22.5 24.5min15.5 16.5 17.5 18.5 19.5 20.5 21.5 22.5 24.5min
12:0
13:0
14:0
16:0
15:0
c 9-1
4:1
i-14:
0
i-13:
0
i -16:
0
ai-1
5:0
i -15:
0
Pris
tana
tec7
-14:
1
51.5 55.5 59.5 63.5 67.5 71.5 75.5 79.5
20:5
n-3
24:0
c17 -
24:1
min
23:1
23:1
20:3
n-3
20:3
n-6
20:4
n-6
20:4
n-3
22:4
n -6
c15-
24:1
c13-
24:1
22:5
n-3
22:6
n-3
22:5
n-6
26:0 21
:5n-
3
22:2
n-6
20:3
n-4
22:4
n -3
16:1
18:1
20:1
to obtain this information, since it is capable of resolving these two CLA isomers directly in a
single GC analysis.
FIGURE 15 Separation of menhaden oil FAME using a 200 m SLB-IL 111
Figure 16 shows the comparison between a 100 m SP-2560 operated at 180 °C isothermal and
a 200 m SLB-IL111 operated under the flow and temperature gradient conditions described
above for the separation of 14:0–16:0 milk fat FAME. The higher polarity of SLB-IL111
results in a higher retention of FAME with double bonds, which was evident by the observed
reversal of the elution order of c9-16:1 and 17:0, or c9-17:1 and 18:0. The experimental
conditions selected for the separation using the SLB-IL111 provided a major improvement in
the separation of FAME present in the chromatographic region from 16:0 to 18:0, allowing
the quantification of most of the 16:1 FA.

Final Discussion CHAPTER 9
141
FIGURE 16 Comparison of the 16:0 to 18:0 FAME region of a pizza sample analyzed according to AOCS Official Method Ce 1j-07 (top chromatogram) and the new developed GC method (bottom chromatogram)
Figure 17 shows the same comparison of the two GC columns (SP-2560 and SLB-IL111), but
of the separation of milk fat FAME from 18:0 to linoleic acid (c9,c12-18:2). The new method
provided separation of most trans-18:1 contained in milk fat including vaccenic acid, and
several 18:2 FAME that co-eluted when using the AOCS Official Method with a SP-2560.
Milk fat contains among others both the t10-18:1 and the t11-18:1 (vaccenic acid) isomers.
Unlike t11-18:1, t10-18:1 is not known to provide any beneficial health effects in animals or
humans (Field et al., 2009). Several reports have shown that high amounts on t10-18:1 are an
indicator of ruminants fed diets containing high levels of digestible carbohydrates or high in
PUFA [Griinari et al., 1998; Cruz-Hernandez et al., 2007].
13.7 14.7 15.7 16.7 17.7
23.0 24.0 25.0 26.0 27.0 28.0 min
min
c9-1
5:1
16:0
(14-
15:1
)
18:0
c9-1
6:1
(Phy
1)
ai-1
7:0
(c6/
c7-1
6:1)
i-17:
0 (t
6-t8
-16:
1)t9
-16:
1t1
0-16
:1t1
1/t 1
2-16
:1
c10-
16:1
(Phy
2)
c11-
16:1
17:0
(t12
-16:
1)15
-16:
1 (c
13-1
6:1)
c9-1
7:1
16:2
(c7-
17:1
)
i-18:
0
c9-1
7:1
c11-
16:1
t-17
:1
c10-
16:1
c9-1
6:1
18:0
(c8 -
17:1
)
16:0
i- 17:
0 ai-1
7:0
(t7/
t8-1
6:1)
14-1
5:1
(Phy
1)
t6-1
6:1
t9-1
6:1
t 10-
16:1
t 11/
t12-
16:1
17:0
(c6/
c7-1
6:1)
c12-
16:1
i-18:
0
c6/ c
7-17
:1
t14-
16:1
c9-1
5:1
c5/c
6-17
:1
15-1
6:1/
c13-
16:1
(Phy
2)
Method Ce 1j-07100 m SP 2560 column
200 m SLB-IL111 column
t-17
:1
New method 200 m SLB-IL 111 column

Final Discussion CHAPTER 9
142
FIGURE 17 Comparison of the 18:0 to cis9,cis12-18:2 FAME region of a pizza sample analyzed according to AOCS Official Method Ce 1j-07 (top chromatogram) and the new developed GC method (bottom chromatogram). The lower chromatogram contains several unknown trans containing 18:2 isomers.
The major advantage of the new method, compared to the AOCS methods Ce 1j-07 and Ce
1h-05, was to enable the resolution of t10- and t11-18:1 and to identify samples containing
significant amounts of t10-18:1. In addition, the method made it possible to resolve a number
of trans containing 18:2 isomers.
18.1 19.1 20.1 21.1 22.1 23.1 24.1
27.8 28.8 29.8 30.8 31.8 32.8 33.8 34.8 35.8 36.8 min
min
18:0
c9 (t
15)-1
8:1
18:0
c9-1
8:1
(19:
0)
c9-1
7:1
t13/
t14
(c6/
c7/c
8)-1
8:1
t12-
18:1
t11-
18:1
t9 (c
4/c5
)-18:
1t6
/t7/t8
-18:
1t5
-18:
1
t4-1
8:1
c11-
18:1
c10-
18:1
c12-
18:1
c13-
18:1
t16-
18:1
c14-
18:1
19:0
+ c
15-1
8:1
t8/t9
-18:
1
t6/t7
-18:
1 (c
5-18
:1)
t5-1
8:1
t10-
18:1
t11-
18:1
t12-
18:1
(c6/
c7-1
8:1)
t13/
t14
t15-
18:1
(c8-
18:1
)
c10-
18:1
c11-
18:1
c12-
18:1
c13-
18:1
t16-
18:1
c14-
18:1
c15-
18:1
t4-1
8:1
16:2
t10-
18:1
20:0
18:2
tran
s-1
(c9-
19:1
)
17:0
-cyc
lo
c9,t1
3/t8
,c12
-18:
2 (c
6/c7
-19:
1)
t9,t1
2-18
:2
t9,c
12-1
8:2
t9,c
12-1
8:2/
18:2
tran
s-2/
18:2
tran
s-3
c9,c
12-1
8:2
c9,c
12-1
8:2
18:2
tran
s-2
c9,t1
2-18
:2 (c
11-1
9:1)
c9,t1
2-18
:2
c9,t1
3/t8
,c12
-18:
2
18:2
tran
s-1
t9,t1
2-18
:2
c9-1
9:1
18:2
tran
s-4/
18:2
tran
s-5
(c6/
c7-1
9:1)
c16-
18:1
c16-
18:1
18:2
tran
s-4
18:2
tran
s-5
18:2
tran
s-3
Method Ce 1j-07100 m SP 2560 column
200 m SLB-IL111 column
17:0
-cyc
lo
New method 200 m SLB-IL 111 column

Final Discussion CHAPTER 9
143
Based on the improved chromatographic separation of FAME provided by the SLB-IL111
column, we speculated that the quantitation of total trans fat would be more accurate than that
provided by the Official Methods Ce 1h-05 or Ce 1j-07 using 100% CPS columns. However,
a comparison of selected samples investigated showed that the quantitative analysis of total
trans fat was similar using the 200 m SLB-IL111 column compared to the 100 m SP-2560
column according to Method Ce 1j-07 [Tyburczy et al., 2012].
The chromatographic separation of mono-trans 18:2 and mono-trans 18:3 FAME is a critical
factor affecting the measurement of the total trans FA content of oils, foods and fats. The
deodorization step during processing of vegetable oils has been shown to cause isomerization
of double bonds of all-cis PUFA, the natural form of most PUFA in vegetable oils. This
process results in the formation of mono-trans and di-trans PUFA. The oil content in these
trans PUFA may reach up to 3.5% of total FA in vegetable oils [Wolff, 1992]. In a current
study of 30 commercial vegetable oils we found that the total trans content ranged from
0.03% to 2.18% [Mossoba et al., 2013].
The content of total trans fat of 32 representative fast food samples was determined in another
study. The primary objective of the study was to analyze the current levels of trans fat,
including the content of trans PUFA, in representative fast food samples from U.S.-based
restaurants using the AOAC 996.06 extraction and transmethylation procedure with AOCS
Official Method Ce 1j-07 for the quantitation of FAME [Tyburczy et al., 2012]. The content
of trans MUFA, mono-trans 18:2 and mono-trans 18:3 FAME differed by food category. For
ruminant-derived foods, trans MUFA consisted primarily of trans 18:1 FAME, which were
the predominant trans FA class (4.4% of total FA). In contrast, the combined content of trans
18:2 and trans 18:3 FAME was observed to be relatively minor (<1% of total FA). For many
of the chicken tenders/nuggets, French fries and apple pie/turnover samples considered in the
study, the ratio of trans MUFA to the sum of trans 18:2 plus trans 18:3 FA was less than 1.0,
reflecting the typical content of trans PUFA and low levels of trans MUFA in oils that have
undergone deodorization but not partial hydrogenation [Wolff, 1992]. In other samples, the
ratio of trans MUFA to the sum of trans 18:2 plus trans 18:3 FA was greater than 1.0, and
could be explained by the use of partially hydrogenated oil in the preparation of these foods.
Therefore, these results reveal the importance of the ratio of trans MUFA to trans 18:2 plus
trans 18:3 FA for identifying the presence of partially hydrogenated oils in

Final Discussion CHAPTER 9
144
non-ruminant-derived foods. They also emphasize the advantage of use of an SLB-IL111
column in making these determinations.
Preparation of Reference Materials to Support Identification of Fatty Acids
The first step in the development of a chromatographic method, including quantification, is
the correct identification of the analytes whose separations were observed. Among other
available techniques for identification (e.g. mass spectrometry) of separated compounds pure
reference materials are needed to compare with separated compounds. Reference materials
are also needed for the process of method validation. Analysis of the FA composition of fats
and oils requires the quantification of a large number of FA, many of which are not available
as reference materials. Jensen [2002] reported the presence of at least 400 FA in milk fat. In
this study (Chapter 5) more than 150 FA in milk fat, and over 100 FA in menhaden oil
(Chapter 7) using the 200 m SLB-IL111 column were separated and identified
The limited availability of commercial trans fatty acid reference materials for use in the
development of gas chromatographic separation methods played a critical role in this research
project. Trans monounsaturated FA (tMUFA), the primary source of TFA in food, are of
limited availability as reference materials from commercial suppliers. With the exception of
data regarding the separation of 16:1 FAME positional/geometrical isomers [Kramer et al.
2008; Precht and Molkentin, 2000], identification of the GC elution profile of MUFA, other
than 18:1 FAME, is limited to that of the available reference materials. Data regarding non-
conjugated mono-trans dienes (present in milk fat) or mono-trans PUFA isomers are also
rarely available.

Final Discussion CHAPTER 9
145
To overcome this limitation, a project was undertaken to synthesize most of the geometric and
positional isomers from C14 to C20. Saturated straight-chain FA are most commonly
synthesized from olefins isolated from petroleum by applying:
A) Continuous air oxidation of aliphatic hydrocarbons catalyzed by permanganate;
B) Oxidation of straight-chain terminal olefins;
C) Oxidation of straight-chain alcohols;
The unsaturated FA are usually synthesized by applying a coupling reaction of alkynes
according to a general method that contains three distinctive steps:
1) Construction of the alkynes;
2) Introduction of acid functionality;
3) Partial reduction of the acetylenes;
These processes can produce large quantities of FA at low cost but are not practical as
reference materials for GC analyses because they lack purity. Therefore, many synthetic
procedures from the literature for the preparation of the reference materials were reviewed
and needed for the quantification of FA (including trans FA) in fats and oils of non marine
origin. The reactions were adapted for small scale application using glassware and equipments
available in most laboratories (Chapter 3).
Mixtures containing geometric and positional isomers of MUFA were obtained by repeated
addition and elimination of HBr to commercially available cis-MUFA. Subsequent
fractionation of the synthetic geometric mixture into cis- and trans-MUFA by Ag+SPE or
Ag+-HPLC produces reference mixtures that were used “as is” for the identification of these
FAME in fats and oils. If pure MUFA were needed, they were obtained by a combination of
RP- and Ag+-HPLC fractionation.

Final Discussion CHAPTER 9
146
O
HO
Br O
HOBr
~25% : ~50% : ~25%
10-Bromo-octadecanoic acid9-Bromo-octadecanoic acid
1M t-BuONa in t-BuOH, 24 hours at +100°C.
O
HO
O
HO
O
HO
Octadec-8-enoic acid
Octadec-9-enoic acid
Octadec-10-enoic acid
O
HO
BrO
HO
Br O
HOBr
~25% : ~50% : ~25%
10-Bromo-octadecanoic acid9-Bromo-octadecanoic acid
1M t-BuONa in t-BuOH, 24 hours at +100°C.
O
HO
O
HO
O
HO
O
HO
O
HO
Octadec-8-enoic acid
Octadec-9-enoic acid
Octadec-10-enoic acid
The entire preparation can be summarized in 5 steps:
1) Addition of HBr to a commercially available carboxylic acid with at least one
double bond;
2) Elimination of HBr using hot alkali;
3) Methylation using BF3/Methanol;
4) Purification (e.g. HPLC);
5) Isomerization with para-toluene sulfinic acid (PTSA);
Using this preparation scheme (FIGURE 18), it was possible to prepare and purify the
positional and geometric isomers of MUFA from 14:1 to 20:1.
The addition/elimination of HBr to monoenoic FA was repeated until the targeted
isomerization was reached. After obtaining the desired MUFA isomerization, the products of
reaction were re-converted to methyl esters before being used as reference materials for GC
analysis or fractionation by HPLC.
FIGURE 18 Scheme for the preparation of MUFA positional isomers. In each case the geometric isomers were subsequently resolved using Ag+-HPLC.

Final Discussion CHAPTER 9
147
26.5 27.7 28.9 30.1 31.3 32.5 33.7 34.9 min
c-19:1
c10-
17:1
c11-
18:1
19:0
20:0
c9,c
12-1
8:2
c-18:1
c5
c4
c6/c
7 c8c9
c10
c11 c1
2
c13
c14
c15
17
t6 t12
t13/
t14t-18:1 t5
t4
t8 t9t1
0t1
1
t15t7
t16
t11
t-19:1
t5 t6
t8/t9 t1
0
t12
t13
t7 t14
c6/c
7
c8c9 c1
1
c12
c13
c14
c10
18:0
t9-1
8:1
t11-
18:1
c6-1
8:1
c9-1
8:1
t9,t1
2-18
:2
c7-1
9:1
GLC-463
26.5 27.7 28.9 30.1 31.3 32.5 33.7 34.9 min26.5 27.7 28.9 30.1 31.3 32.5 33.7 34.9 min
c-19:1
c10-
17:1
c11-
18:1
19:0
20:0
c9,c
12-1
8:2
c-18:1
c5
c4
c6/c
7 c8c9
c10
c11 c1
2
c13
c14
c15
17
c-18:1
c5
c4
c6/c
7 c8c9
c10
c11 c1
2
c13
c14
c15
17
t6 t12
t13/
t14t-18:1 t5
t4
t8 t9t1
0t1
1
t15t7
t16
t6 t12
t13/
t14t-18:1 t5
t4
t8 t9t1
0t1
1
t15t7
t16
t-18:1 t5
t4
t8 t9t1
0t1
1
t15t7
t16
t11
t-19:1
t5 t6
t8/t9 t1
0
t12
t13
t7 t14
t11
t-19:1
t5 t6
t8/t9 t1
0
t12
t13
t7 t14
t-19:1
t5 t6
t8/t9 t1
0
t12
t13
t7 t14
c6/c
7
c8c9 c1
1
c12
c13
c14
c10
c6/c
7
c8c9 c1
1
c12
c13
c14
c10
18:0
t9-1
8:1
t11-
18:1
c6-1
8:1
c9-1
8:1
t9,t1
2-18
:2
c7-1
9:1
GLC-46318:0
t9-1
8:1
t11-
18:1
c6-1
8:1
c9-1
8:1
t9,t1
2-18
:2
c7-1
9:1
GLC-463
FIGURE 19 GC-FID chromatogram of 18:1 and 19:1 positional and geometric FAME mixture, prepared according to presented procedure. Ag+-HPLC provided selectivity toward the cis and trans double bonds of FAME, and allowed
the fractionation of geometrical isomers of MUFA. The thermodynamically favored trans
isomers were produced by the de-hydrobromination reaction in about twice the amount as the
cis isomers. Figure 19 shows the GC-FID separation of the reaction products of 18:1 and 19:1
isomers using a 200 m SLB-IL111 capillary column. The fractionation of the mixtures into
the cis and trans groups of positional isomers was obtained by applying Ag+-HPLC.
In this study, positional/geometrical and non-conjugated isomers of linoleic acid were also
prepared (FIGURE 20). These FAME were prepared by conducting a single
addition/elimination with HBr to linoleic acid. A second repetition of the addition/elimination
process could have led to a more interesting set of linoleic acid isomers, but significant side
reactions, which reduced the yield of the expected FAME, were observed. The
positional/geometrical isomers of linoleic acids are of special interest, due to their presence in
milk fat and dairy products, as well as IP-TFA. The co-elution of mono trans-18:2 with cis-
18:1 and 19:1 FAME isomers makes their identification very challenging and there is an
urgent need for additional reference materials.

Final Discussion CHAPTER 9
148
non-conjugated 18:2 isomers
PTSA isomerized
8,12-18:2
PTSA isomerized
9,13-18:2
PTSA isomerized
8,13-18:2
PTSA isomerized
9,12-18:2
t,t
t,c c,t c,c
t,t
t,t
t,t
t,c
t,c
t,c
c,t
c,t
c,t
c,c
c,c
c,c
non-conjugated 18:2 isomers
PTSA isomerized
8,12-18:2
PTSA isomerized
9,13-18:2
PTSA isomerized
8,13-18:2
PTSA isomerized
9,12-18:2
t,t
t,c c,t c,c
t,t
t,t
t,t
t,c
t,c
t,c
c,t
c,t
c,t
c,c
c,c
c,c
min.
FIGURE 20 GC-FID chromatogram of positional and geometric isomers FAME mixture (bottom chromatogram) prepared after a single addition and bromination of HBr according to the presented procedure. PTSA, para-toluene sulfonic acid. The preparation of isolated non-conjugated 18:2 isomers relied on well known chemical
principles and low-cost supplies available in most laboratories. It allowed the preparation of
the reference materials needed for the quantification of the trans-FA in dairy products and
vegetable oils. The starting material can be either commercially available FAME such as
linoleic acid, or an FA isolated from a natural source (e.g. seed oils). The synthesis of FAME
using addition/elimination reactions, mentioned above, was used to produce larger quantities
of relatively pure unsaturated FAME such as 8,13-, 9,13-, and 8,12-18:2 (FIGURE 20).
However, the equipment and skills needed to carry out these reactions make them unsuitable
for laboratories not dedicated to synthetic organic chemistry.
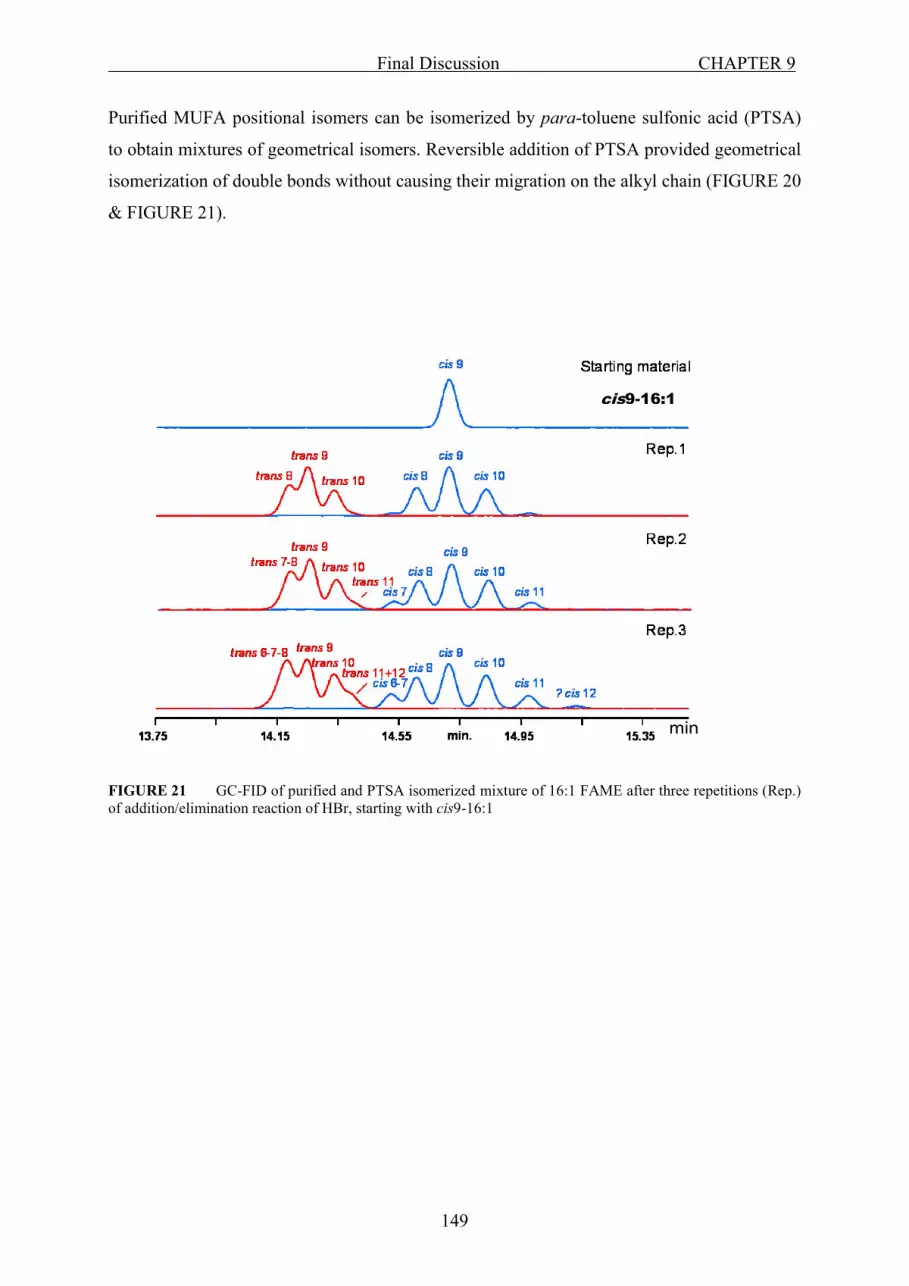
Final Discussion CHAPTER 9
149
Purified MUFA positional isomers can be isomerized by para-toluene sulfonic acid (PTSA)
to obtain mixtures of geometrical isomers. Reversible addition of PTSA provided geometrical
isomerization of double bonds without causing their migration on the alkyl chain (FIGURE 20
& FIGURE 21).
FIGURE 21 GC-FID of purified and PTSA isomerized mixture of 16:1 FAME after three repetitions (Rep.) of addition/elimination reaction of HBr, starting with cis9-16:1
min
cis9-16:1

Final Discussion CHAPTER 9
150
Multidimensional Gas Chromatography
For several decades, capillary GC has been the most frequently used technique for the
separation of compounds having the volatility needed to repartition between a gas and a liquid
phase. Fatty acids are generally derivatized to their FAME prior to GC analysis. To evaluate
the new ionic liquid capillary column (SLB-IL111), a 200 m x 0.25 mm column was selected
to resolve complex mixtures of FAME prepared from milk fat and fish oil (menhaden oil).
These two matrices represent the most complex FA profiles of natural fats that challenges the
current GC technology to separate these FAME. Compared to other available methodologies,
this method significantly improved the separation of several closely eluting FAME in
complex lipid mixtures that include geometrical and positional isomers. For example, a total
of more than 150 FAME prepared from milk fat [Chapter 5] and 109 FAME prepared from
menhaden oil [Chapter 7] were separated in a single GC analysis.
The official AOCS methodologies optimized for the separation of FAME prepared from
vegetable oils and animal fats employs long (100 m) 100% CSP capillary columns to
maximize the separation of unsaturated FA positional/geometric isomers. In contrast, the
official AOCS methodology developed for the separation of marine oil FAME employ a much
shorter CARBOWAX type capillary column of lower polarity that focused on the separation
of unsaturated FAME within different chain lengths. Columns coated with CARBOWAX
phases are preferred for the separation of marine oil FAME based on the principle that all the
PUFA with an n carbon alkyl chain elute before the saturated n+2 FAME. This approach
avoids the overlap of PUFA differing in their chain lengths but jeopardizes the separation of
the geometric isomers of unsaturated FAME.
These two different separation strategies applied to the analysis of vegetable, animal and
marine oil FAME can be combined in a comprehensive two dimensional GC separation (GC
X GC). FAME can be separated first using a highly polar GC column that provides high
selectivity toward the position and geometric configuration of double bonds, followed by a
separation using a lower polarity short column (1-3 m) that primarily serves to resolve the
FAME based on their chain lengths. However, for practical reasons, most of the GC X GC
applications reported in the literature for FAME used a low polarity column for the first
dimension separation (1D) and a short polar column for the second dimension separation (2D)
Despite the higher theoretical peak capacity of these GC X GC systems compared to those of

Final Discussion CHAPTER 9
151
classic mono-dimensional GC (1D-GC) systems, the selected conditions resulted in a lower
number of separated FAME compared to well optimized 1D-GC.
In the current study, a novel approach for GC X GC analysis of FAME was developed that
allowed the use of a highly polar column for 1D, and followed by a 2D separation based
uniquely on the carbon skeleton of FAME. In some cases, a catalyzer or a reducer was added
between the two dimensions of separation before the thermal modulator. The reducer,
consisting of a capillary tube coated with palladium on its inner surface, catalyzed the
reduction of double bonds, in the presence of hydrogen carrier gas, to their corresponding
saturated FAME. The concept of online hydrogenation has been applied in an earlier stage of
lipid research primarily to assist in the identification of FAME, including mass spectrometry
[Ackman 1989]. The same chromatographic conditions were selected for the 1D separation as
were used
for the 1D-GC analyses,
FIGURE 22 Scheme of GC × GC apparatus which insured the same resolution previously established (Chapter 5). The highly polar 200 m
SLB-IL111 column was maintained at 170 °C. After separation on the 1D column, the U-
FAME were reduced to their carbon skeleton by the capillary reactor, and the reaction
products were subsequently separated using a 2.5 m × 0.10 mm SLB-IL111 maintained at the
same temperature as 1D. The preparation of the capillary reactor is described in chapter 6.
The scheme of the described GC X GC apparatus is shown in Figure 22.
The GC X GC system used for these separations required joining two capillary columns on
each end of the catalytic reducer and the whole system was maintained in the same oven.
Figure 23 shows the separation of FAME prepared from menhaden oil, which consists of a

Final Discussion CHAPTER 9
152
complex mixture of FA. The results of the two dimensional separation shows the elution of all
the saturated FAME on a straight diagonal line bisecting the separation plane, while the
FAME with the same carbon skeleton but differing in number, geometric configuration or
position of double bonds lie on lines parallel to the 1D time axis. The separation of FAME on
2D with different carbon skeletons (i.e. chain length, branches) appear on different lines and
avoids the coelution of PUFA with different chain lengths, which presents a challenge when
peaks co-elute even when using high polarity GC columns. In the marine oil sample, the 16:1
FAME were separated from 17:0 (n-, i- and ai-) and from methyl phytanate. The 16:2, 16:3
and 16:4 FAME were separated from the C17, C18, C19 and C20 FAME. However, the 17:1
and 19:1 FAME, which are often ignored because of their co-elution and low abundance,
were clearly identified and quantified. A particular challenge for trans fat quantitation has
been the resolution and identification of the 18:3 and 20:1 FAME. Now there was no
interference of the two sets of FA isomers and all the individual isomers were well resolved
on different lines. The current GC-online reduction X GC system described took advantage of
the far superior separation reported using a 200 m SLB-IL111 by 1D-GC [Chapter 7], and
made use of the GC X GC technique [Chapter 6] provided a means to resolve FAME based on
differences in chain length, thus avoiding several inescapable overlaps.
FIGURE 23 GC × GC separation of the FAME prepared from menhaden fish oil sample

Final Discussion CHAPTER 9
153
While the 170 °C isothermal GC-online reduction X GC elution of FAME using a 200 m x
0.25 mm SLB-IL111 for 1D allowed for direct comparison of elution patterns and quantitative
results, the experimental conditions were further optimized to take greater advance of the GC
X GC capabilities. The convenience of a single oven design was maintained, but a 100 m
column was selected in the 1D separation and an elution temperature program [Chapter 6]
was carried out. Figure 24 shows the separation of the FAME of menhaden oil utilizing the
modified system. The separation time of the second dimension was shortened to 2 s, which
resulted in the late eluting long chain PUFA eluting as sharper 1D peaks that lowered the
limits of quantification. The saturated FAME with at least 14 carbons now eluted in an almost
straight line parallel to the 1D time axis, and FAME with the same chain lengths eluted on
crescent curves. The separation space was now better utilized, and the analytes (FAME) were
distributed over most of the plane. The short 1D separation time of ~90 min made this set of
experimental conditions more suitable for routine analysis. This is the first reported
application of GC – online reduction X GC, but further optimization is expected. The unique
FAME separations reported in this study provided confidence that this technique will become
the new standard in the analysis of complex lipid mixtures.
FIGURE 24 GC × GC separation of the FAME prepared from menhaden fish oil sample. Instrument configuration as in Figure 23, with modifications: 1D column 100 m x 0.25 mm SLB-IL111, and temperature program (130 ˚C per 23 min, then increased 1.3 ˚C to 220 ˚C)

Final Discussion CHAPTER 9
154
Pine Nut Species in the U.S. Market
The nutritious nature of nuts from certain Pinus species and their use as a dietary staple has
been recognized for hundreds or thousands of years [Evaristo et al., 2010]. However, lately
some consumers report taste disturbances (i.e., dysguesia) following the consumption of pine
nuts. Pine nut dysguesia, often referred to as “pine mouth” or “pine nut syndrome (PNS)”,
was first described in 2001 [Mostin, 2001]. Consumer complaints include a bitter or metallic
taste in the mouth which is often intensified by the ingestion with certain foods. These
symptoms appear 1-2 days after ingestion and may persist from 8 days to 2 weeks after
consumption of the pine nuts [Mostin, 2001]. To date, no specific chemical compound in
consumer complaint samples has been identified as a potentially causative agent for the taste
disturbances. The identification of the species of pine nuts in commercial samples became an area of
intense investigation on the basis of a report by the French Food Safety Agency that nuts from
the species P. armandii were associated with consumer complaints [AFSAA, 2009]. They
hypothesized that consumption of pine nuts from P. armandii, a species not previously
consumed in some markets, might be linked to the taste disturbances.
Use of gas chromatographic analysis of the FA in pine nuts was a possible strategy for
identification of pine nut species. A review of the FA content of 144 Pinus species [Flesch et
al., 2011] showed species-specific FA profiles. These species-specific differences in
individual FA made it possible to establish a “diagnostic index” (DI) capable of
differentiating among different Pinus species [Destaillats et al., 2010]. However, the DI
values and the content of some of the individual FA were shown to overlap in several species
[Chapter 8]. These overlaps occurred in part because of differences in the content of
individual FA within species, genetic variations, the choice of the chromatographic method
(including GC column) and the problems with identification of individual FA. It was
fundamental to use gas chromatographic techniques to correctly identify specific FA in
species identification. This proved challenging since standards for some of the unique FA
were not commercially available.
In this study, the FA composition of a series of reference pine nuts and samples from the US
market, including samples associated with pine mouth were evaluated, including the DI
calculations used to differentiate among pine nut species. For example, the content of

Final Discussion CHAPTER 9
155
5,9,12,15-18:4 in several species were: P. armandii, 0.08-0.12%; P.tabuliformis, 0.40%; P.
wallichiana, 0.15-0.18%; P. yunnanensis, 0.50%. Another study reported the following
contents of 5,9,12,15-18:4: P. armandii, 0.0-0.04%; P. tabuliformis, 0.06%; P. wallichiana,
0.09 %; P. yunnanensis, 0.0-0.1% [Chapter 8],.
These observations indicate that the DI is strongly dependent on the chromatographic method
used and the authentification of the pine species. An DI value of a mixed sample of pine nuts
is insufficient for certain identification. However, it was found out that the DIs of
homogeneous samples (samples containing only one pine species) were reproducible and a
valuable indicator.
The genetic variation in P. armandii within a limited geographic area in China [Chen and
Chen, 2011] suggests that different subspecies or varieties might be included in commodities
for international trade. According to The International Plant Names Index [IPNI.org, 2012],
the recognized subspecies and varieties of interest in this regard include P. armandii var.
amamiana, P.armandii Franch (P. armandii var. armandii), P. armandii var. dabeshanensis,
P.armandii var. farjonii, P. armandii var. fenzeliana, P. armandii var. mastersiana,
P.armandii subsp. mastersiana, and P. armandii subsp. yuana.
Currently, pine nuts in international trade are not required to be identified at the species or
varietal level. It is also difficult to obtain authentic reference pine nut samples from the
varieties of interest. In spite of such difficulties, DNA analysis proved to be a potentially
powerful method for identifying species and subspecies of P. armandii.
Because of the complexities associated with identifying pine nut mixtures based on DI values
alone, a DNA-based method was developed that more clearly identified the presence of
different Pinus species in samples associated with “pine mouth” and other commercially
available pine nuts samples [Handy et al., 2011 & Chapter 8]. The genetic assessment of 17
samples associated with pine mouth confirmed that 70% of these samples were a mixture of
P. armandii and other pine species such as P. koraiensis.
Previous attempts to differentiate among pine nuts prior to their analysis were based on their
morphological attributes (e.g., length of nuts, diameter, color, etc.). It was found that pre-
selection of pine nuts based on their morphological characteristics may be neither efficient nor

Final Discussion CHAPTER 9
156
accurate. Based on overall length and shape, it was observed that seeds of P. gerardiana and
P. pinea L. were difficult to distinguish, as were seeds of P. sibirica and P. armandii
[Chapter 8].
As a result of these studies, it was possible to calculate more accurate DI values that were
based on the separation of the two 18:1 isomers (c9-18:1 and c11-18:1) that were not resolved
in a previous report [Destaillats et al., 2010]. According to Wolff et al., [1997], the isomer c9-
18:1 is the precursor of c5,c9-18:2 (taxoleic acid) and only this isomer should be, and was,
included in the present DI calculations. It was demonstrated that a combination of DNA
analysis and proper GC analysis was a very useful approach for identification and
characterization of Pinus species. This work also clearly demonstrated that the majority of
pine nuts available in the U.S. market, including those associated with pine mouth, were
mixtures of nuts from different Pinus species.

REFERENCES
157
REFERENCES Ackman, R. G. (1967). "Calculation of ECL values in the gas-liquid chromatography of multiple-branched fatty acids." J Chromatogr 28(2): 225-231. Ackman, R. G. (1967). "The chain-length overlap problem in gas-liquid chromatography with polyester liquid phases." Lipids 2(6): 502-505. Ackman, R. G. and R. P. Hansen (1967). "The occurrence of diastereomers of phytanic and pristanic acids and their determination by gas-liquid chromatography." Lipids 2(5): 357-362. Ackman, R. G. and S. N. Hooper (1968). Examination of Isoprenoid Fatty Acids as Distinguishing Characteristics of Specific Marine Oils with Particular Reference to Whale Oils, Pergamon Press. Ackman, R. G., S. N. Hooper and D. L. Hooper (1974). "Linolenic acid artifacts from the deodorization of oils." Journal of the American Oil Chemists Society 51(3): 42-49. Ackman, R. G., L. Safe, S. N. Hooper, M. Paradis and S. Safe (1973). "7-Methyl-7-hexadecenoic acid: Isolation from lipids of the ocean sunfishMola mola (Linnaeus) 1758." Lipids 8(1): 21-24. Adahchour, M., J. Beens, R. J. J. Vreuls and U. A. T. Brinkman (2006). "Recent developments in comprehensive two-dimensional gas chromatography (GC × GC): I. Introduction and instrumental set-up." TrAC Trends in Analytical Chemistry 25(5): 438-454. Adahchour, M., E. Jover, J. Beens, R. J. Vreuls and U. A. Brinkman (2005). "Twin comprehensive two-dimensional gas chromatographic system: concept and applications." J Chromatogr A 1086(1-2): 128-134. Adam, F., F. Bertoncini, V. Coupard, N. Charon, D. Thiebaut, D. Espinat and M. C. Hennion (2008). "Using comprehensive two-dimensional gas chromatography for the analysis of oxygenates in middle distillates I. Determination of the nature of biodiesels blend in diesel fuel." J Chromatogr A 1186(1-2): 236-244. Adlof, R. O., L. C. Copes and E. A. Emken (1995). "Analysis of the monoenoic fatty acid distribution in hydrogenated vegetable oils by silver-ion high-performance liquid chromatography." Journal of the American Oil Chemists’ Society 72(5): 571-574. Aldai, N., M. E. Dugan, J. K. Kramer, P. S. Mir and T. A. McAllister (2008). "Nonionophore antibiotics do not affect the trans-18:1 and conjugated linoleic acid composition in beef adipose tissue." J Anim Sci 86(12): 3522-3532. Aldai, N., M. E. R. Dugan, D. C. Rolland and J. K. G. Kramer (2009). "Survey of the fatty acid composition of Canadian beef: Backfat and longissimus lumborum muscle." Canadian Journal of Animal Science 89(3): 315-329. Aldai, N., G. Hervas, A. Belenguer, P. Frutos, A. R. Mantecon and J. K. Kramer (2012). "Evaluating the in vitro metabolism of docosahexaenoic acid in sheep rumen fluid." Lipids 47(8): 821-825. Alves, S. P. and R. J. Bessa (2009). "Comparison of two gas-liquid chromatograph columns for the analysis of fatty acids in ruminant meat." J Chromatogr A 1216(26): 5130-5139. Anderson, J. L. and D. W. Armstrong (2003). "High-Stability Ionic Liquids. A New Class of Stationary Phases for Gas Chromatography." Analytical Chemistry 75(18): 4851-4858. Anderson, J. L. and D. W. Armstrong (2003). "High-stability ionic liquids. A new class of stationary phases for gas chromatography." Anal Chem 75(18): 4851-4858. Anderson, J. L. and D. W. Armstrong (2005). "Immobilized ionic liquids as high-selectivity/high-temperature/high-stability gas chromatography stationary phases." Anal Chem 77(19): 6453-6462.

REFERENCES
158
Anderson, J. L. and D. W. Armstrong (2005). "Immobilized Ionic Liquids as High-Selectivity/High-Temperature/High-Stability Gas Chromatography Stationary Phases." Analytical Chemistry 77(19): 6453-6462. Anderson, J. L., J. Ding, T. Welton and D. W. Armstrong (2002). "Characterizing Ionic Liquids On the Basis of Multiple Solvation Interactions." Journal of the American Chemical Society 124(47): 14247-14254. Anderson, J. L., J. Ding, T. Welton and D. W. Armstrong (2002). "Characterizing ionic liquids on the basis of multiple solvation interactions." J Am Chem Soc 124(47): 14247-14254. Anderson, J. L., R. Ding, A. Ellern and D. W. Armstrong (2004). "Structure and Properties of High Stability Geminal Dicationic Ionic Liquids." Journal of the American Chemical Society 127(2): 593-604. Anderson, J. L., R. Ding, A. Ellern and D. W. Armstrong (2005). "Structure and properties of high stability geminal dicationic ionic liquids." J Am Chem Soc 127(2): 593-604. Armstrong, D. W., L. He and Y. S. Liu (1999). "Examination of ionic liquids and their interaction with molecules, when used as stationary phases in gas chromatography." Anal Chem 71(17): 3873-3876. Aro, A., W. Becker and J. I. Pederssen (2006). Trans fatty acids in the Nordic countries. Azizian, H., J. K. G. Kramer, S. Ehler and J. M. Curtis (2010). "Rapid quantitation of fish oil fatty acids and their ethyl esters by FT-NIR models." European Journal of Lipid Science and Technology 112(4): 452-462. Banni, S., G. Carta, E. Angioni, E. Murru, P. Scanu, M. P. Melis, D. E. Bauman, S. M. Fischer and C. Ip (2001). "Distribution of conjugated linoleic acid and metabolites in different lipid fractions in the rat liver." Journal of Lipid Research 42(7): 1056-1061. Bannon, C. D., J. D. Craske and L. M. Norman (1988). "Effect of overload of capillary gas-liquid chromatographic columns on the equivalent chain lengths of C18 unsaturated fatty acid methyl esters." Journal of Chromatography A 447(0): 43-52. Bauman, D. E., D. M. Barbano, D. A. Dwyer and J. M. Griinari (2000). "Technical note: production of butter with enhanced conjugated linoleic acid for use in biomedical studies with animal models." J Dairy Sci 83(11): 2422-2425. Belury, M. A. (2002). "Dietary conjugated linoleic acid in health: physiological effects and mechanisms of action." Annu Rev Nutr 22: 505-531. Bertsch, W. (1999). "Two-Dimensional Gas Chromatography. Concepts, Instrumentation, and Applications – Part 1: Fundamentals, Conventional Two-Dimensional Gas Chromatography, Selected Applications." Journal of High Resolution Chromatography 22(12): 647-665. Beyers, E. C. and E. A. Emken (1991). "Metabolites of cis,trans, and trans,cis isomers of linoleic acid in mice and incorporation into tissue lipids." Biochim Biophys Acta 1082(3): 275-284. Bousquet, O. and F. Le Goffic (1995). "Counter-current chromatographic separation of polyunsaturated fatty acids." Journal of Chromatography A 704(1): 211-216. Breitbach, Z. and D. Armstrong (2008). "Characterization of phosphonium ionic liquids through a linear solvation energy relationship and their use as GLC stationary phases." Analytical and Bioanalytical Chemistry 390(6): 1605-1617. Breitbach, Z. S. and D. W. Armstrong (2008). "Characterization of phosphonium ionic liquids through a linear solvation energy relationship and their use as GLC stationary phases." Anal Bioanal Chem 390(6): 1605-1617. Burr, G. O. and M. M. Burr (1929). "A NEW DEFICIENCY DISEASE PRODUCED BY THE RIGID EXCLUSION OF FAT FROM THE DIET." Journal of Biological Chemistry 82(2): 345-367. Burr, G. O. and M. M. Burr (1930). "ON THE NATURE AND RÔLE OF THE FATTY ACIDS ESSENTIAL IN NUTRITION." Journal of Biological Chemistry 86(2): 587-621.

REFERENCES
159
Burr, G. O., M. M. Burr and E. S. Miller (1932). "ON THE FATTY ACIDS ESSENTIAL IN NUTRITION. III." Journal of Biological Chemistry 97(1): 1-9. Cao, X. and Y. Ito (2003). "Supercritical fluid extraction of grape seed oil and subsequent separation of free fatty acids by high-speed counter-current chromatography." J Chromatogr A 1021(1-2): 117-124. Carballeira, N. and M. Maldonado (1988). "6-methyl-8-hexadecenoic acid: A novel fatty acid from the marine spongeDesmapsama anchorata." Lipids 23(7): 690-693. Castello, G., S. Vezzani and G. D'Amato (1997). "Effect of temperature on the polarity of some stationary phases for gas chromatography." Journal of Chromatography A 779(1–2): 275-286. Christiansen, E., S. Schnider, B. Palmvig, E. Tauber-Lassen and O. Pedersen (1997). "Intake of a diet high in trans monounsaturated fatty acids or saturated fatty acids. Effects on postprandial insulinemia and glycemia in obese patients with NIDDM." Diabetes Care 20(5): 881-887. Christie, W. W. (1988). "Separation of molecular species of triacylglycerols by high-performance liquid chromatography with a silver ion column." Journal of Chromatography A 454(0): 273-284. Christie, W. W. (1993). Advances in Lipid Methodology, 2nd edition, The Oily Press. Christie, W. W. (2003). Lipid Analysis: Isolation, Separation, Identification, and Structural Analysis of Lipids, Amer Oil Chemists Society. Christie, W. W., E. Y. Brechany and V. K. Shukla (1989). "Analysis of seed oils containing cyclopentenyl fatty acids by combined chromatographic procedures." Lipids 24(2): 116-120. Christie, W. W. and G. H. M. Breckenridge (1989b). "Separation of cis and trans isomers of unsaturated fatty acids by high-performance liquid chromatography in the silver ion mode." Journal of Chromatography A 469(0): 261-269. Christie, W. W., F. D. Gunstone, I. A. Ismail and L. Wade (1968). "Fatty acids. 17 The synthesis and chromatographic and spectroscopic properties of the cyclopropane esters derived from all the methyl octadecenoates (delta 2-delta 17)." Chem Phys Lipids 2(2): 196-202. Clandinin, M. T., S. Cheema, C. J. Field, M. L. Garg, J. Venkatraman and T. R. Clandinin (1991). "Dietary fat: exogenous determination of membrane structure and cell function." The FAEB Journal 5(13): 2761-2769. Clement, L., H. Poirier, I. Niot, V. Bocher, M. Guerre-Millo, S. Krief, B. Staels and P. Besnard (2002). "Dietary trans-10,cis-12 conjugated linoleic acid induces hyperinsulinemia and fatty liver in the mouse." J Lipid Res 43(9): 1400-1409. Cruz-Hernandez, C., Z. Deng, J. Zhou, A. R. Hill, M. P. Yurawecz, P. Delmonte, M. M. Mossoba, M. E. Dugan and J. K. Kramer (2004). "Methods for analysis of conjugated linoleic acids and trans-18:1 isomers in dairy fats by using a combination of gas chromatography, silver-ion thin-layer chromatography/gas chromatography, and silver-ion liquid chromatography." J AOAC Int 87(2): 545-562. Cruz-Hernandez, C., J. K. G., Kramer, J. J. Kennelly, D. R. Glimm, B. M. Sorensen, E. K. Okine, L. A. Goonewardene and R. J. Weselake (2007). "Evaluating the conjugated linoleic acid and trans 18:1 isomers in milk fat of dairy cows fed increasing amounts of sunflower oil and a constant level of fish oil." J Dairy Sci 90(8): 3786-3801. Cruz-Hernandez, C., J. K. G., Kramer, J. Kraft, V. Santercole, Or-Rashid, Z. Deng, M. E. R. Dugan, P. Delmonte, M. P. Yurawecz (2006). “ Systematic analysis of trans and conjugated linoleic acids in milk and meat of ruminants. In: Yurawecz, M. P., J. K. G., Kramer, O., Gudmundsen, M. W., Pariza, S., Banni (eds). Advances in Conjugated Linoleic Acid Research, Volume 3. AOCS Press, Champaign, IL, 2006; pp 45-93. Dannenberger, D., G. Nuernberg, N. Scollan, W. Schabbel, H. Steinhart, K. Ender and K. Nuernberg (2004). "Effect of diet on the deposition of n-3 fatty acids, conjugated linoleic and

REFERENCES
160
C18:1trans fatty acid isomers in muscle lipids of German Holstein bulls." J Agric Food Chem 52(21): 6607-6615. De Geus, H. J., I. Aidos, J. de Boer, J. B. Luten and U. A. Brinkman (2001). "Characterisation of fatty acids in biological oil samples using comprehensive multidimensional gas chromatography." J Chromatogr A 910(1): 95-103. De Roos, N. M., M. L. Bots and M. B. Katan (2001). "Replacement of Dietary Saturated Fatty Acids by Trans Fatty Acids Lowers Serum HDL Cholesterol and Impairs Endothelial Function in Healthy Men and Women." Arteriosclerosis, Thrombosis, and Vascular Biology 21(7): 1233-1237. Deans, D. R. (1968). "A new technique for heart cutting in gas chromatography [1]." Chromatographia 1(1-2): 18-22. Degen, C., J. Ecker, S. Piegholdt, G. Liebisch, G. Schmitz and G. Jahreis (2011). "Metabolic and growth inhibitory effects of conjugated fatty acids in the cell line HT-29 with special regard to the conversion of t11,t13-CLA." Biochimica et Biophysica Acta (BBA) - Molecular and Cell Biology of Lipids 1811(12): 1070-1080. Delmonte, P., A. R. Fardin-Kia, J. K. Kramer, M. M. Mossoba, L. Sidisky, C. Tyburczy and J. I. Rader (2012). "Evaluation of highly polar ionic liquid gas chromatographic column for the determination of the fatty acids in milk fat." J Chromatogr A 1233: 137-146. Delmonte, P., A. R. Fardin-Kia and J. I. Rader (2013). "Separation of fatty acid methyl esters by GC-online hydrogenation x GC." Anal Chem 85(3): 1517-1524. Delmonte, P., A. R. Fardin Kia, J. K. Kramer, M. M. Mossoba, L. Sidisky and J. I. Rader (2011). "Separation characteristics of fatty acid methyl esters using SLB-IL111, a new ionic liquid coated capillary gas chromatographic column." J Chromatogr A 1218(3): 545-554. Delmonte, P., Q. Hu, A. R. Kia and J. I. Rader (2008). "Preparation, chromatographic separation and relative retention times of cis/trans heptadecaenoic (17:1) fatty acids." J Chromatogr A 1214(1-2): 30-36. Delmonte, P., A. Kataok, B. A. Corl, D. E. Bauman and M. P. Yurawecz (2005). "Relative retention order of all isomers of cis/trans conjugated linoleic acid FAME from the 6,8- to 13,15-positions using silver ion HPLC with two elution systems." Lipids 40(5): 509-514. Delmonte, P., A. Kataoka, B. A. Corl, D. E. Bauman and M. Yurawecz (2005). "Relative retention order of all isomers of cis/trans conjugated linoleic acid FAME from the 6,8- to 13,15-positions using silver ion HPLC with two elution systems." Lipids 40(5): 509-514. Delmonte, P., A. R. Kia, Q. Hu and J. I. Rader (2009). "Review of methods for preparation and gas chromatographic separation of trans and cis reference fatty acids." J AOAC Int 92(5): 1310-1326. Delmonte, P. and J. I. Rader (2007). "Evaluation of gas chromatographic methods for the determination of trans fat." Anal Bioanal Chem 389(1): 77-85. Delmonte, P., J. A. Roach, M. M. Mossoba, K. M. Morehouse, L. Lehmann and M. P. Yurawecz (2003). "Synthesis and isolation of trans-7,cis-9 octadecadienoic acid and other CLA isomers by base conjugation of partially hydrogenated gamma-linolenic acid." Lipids 38(5): 579-583. Delmonte, P., M. P. Yurawecz, M. M. Mossoba, C. Cruz-Hernandez and J. K. Kramer (2004). "Improved identification of conjugated linoleic acid isomers using silver-ion HPLC separations." J AOAC Int 87(2): 563-568. Destaillats, F., C. Cruz-Hernandez, F. Giuffrida and F. Dionisi (2010). "Identification of the botanical origin of pine nuts found in food products by gas-liquid chromatography analysis of fatty acid profile." J Agric Food Chem 58(4): 2082-2087. Destaillats, F., C. Cruz-Hernandez, F. Giuffrida, F. Dionisi, M. Mostin and G. Verstegen (2011). "Identification of the Botanical Origin of Commercial Pine Nuts Responsible for Dysgeusia by Gas-Liquid Chromatography Analysis of Fatty Acid Profile." Journal of Toxicology 2011.

REFERENCES
161
Destaillats, F., P. A. Golay, F. Joffre, M. de Wispelaere, B. Hug, F. Giuffrida, L. Fauconnot and F. Dionisi (2007). "Comparison of available analytical methods to measure trans-octadecenoic acid isomeric profile and content by gas-liquid chromatography in milk fat." J Chromatogr A 1145(1-2): 222-228. Destaillats, F., M. Guitard and C. Cruz-Hernandez (2011). "Identification of Delta6-monounsaturated fatty acids in human hair and nail samples by gas-chromatography-mass-spectrometry using ionic-liquid coated capillary column." J Chromatogr A 1218(52): 9384-9389. Destaillats, F., R. L. Wolff, D. Precht and J. Molkentin (2000). "Study of individual trans- and cis-16:1 isomers in cow, goat, and ewe cheese fats by gas-liquid chromatography with emphasis on the trans-delta3 isomer." Lipids 35(9): 1027-1032. Destaillats, F. d. r., C. Cruz-Hernandez, F. Giuffrida and F. Dionisi (2010). "Identification of the Botanical Origin of Pine Nuts Found in Food Products by Gas−Liquid Chromatography Analysis of Fatty Acid Profile." Journal of Agricultural and Food Chemistry 58(4): 2082-2087. Dijkstra, A. J. (2006). "Revisiting the formation of trans isomers during partial hydrogenation of triacylglycerol oils." European Journal of Lipid Science and Technology 108(3): 249-264. Doell, D., D. Folmer, H. Lee, M. Honigfort and S. Carberry (2012). "Updated estimate of trans fat intake by the US population." Food Addit Contam Part A Chem Anal Control Expo Risk Assess 29(6): 861-874. Dole, V. P., A. T. James, J. P. Webb, M. A. Rizack and M. F. Sturman (1959). "The fatty acid patterns of plasma lipids during alimentary lipemia." J Clin Invest 38: 1544-1554. Duhem, K. (2009). “Legislation relating to trans fatty acids”. In: Destaillats, F. (ed), Sebedio, J. L., Dionisi, F., Chardigny J. M., Trans fatty acids in human nutrition, second edition, The Oily Press, Bridgwater, England (2009), pp 381-393 Dutriez, T., J. Borras, M. Courtiade, D. Thiebaut, H. Dulot, F. Bertoncini and M. C. Hennion (2011). "Challenge in the speciation of nitrogen-containing compounds in heavy petroleum fractions by high temperature comprehensive two-dimensional gas chromatography." J Chromatogr A 1218(21): 3190-3199. Eifert, E. d. C., R. d. P. Lana, D. P. D. Lanna, P. B. Arcuri, M. I. Leão, S. d. C. Valadares Filho, W. M. Leopoldino and J. H. S. d. Silva (2005). "Efeitos do fornecimento de monensina e óleo de soja na dieta sobre o desempenho de vacas leiteiras na FAe inicial da lactação." Revista Brasileira de Zootecnia 34: 2123-2132. Eulitz, K., M. P. Yurawecz, N. Sehat, J. Fritsche, J. A. Roach, M. M. Mossoba, J. K. Kramer, R. O. Adlof and Y. Ku (1999). "Preparation, separation, and confirmation of the eight geometrical cis/trans conjugated linoleic acid isomers 8,10- through 11,13-18:2." Lipids 34(8): 873-877. Evaristo, I., D. Batista, I. Correia, P. Correia and R. Costa (2010). "Chemical profiling of Portuguese Pinus pinea L. nuts." J Sci Food Agric 90(6): 1041-1049. Fardin-Kia, A. R., S. M. Handy and J. I. Rader (2012). "Characterization of pine nuts in the U.S. market, including those associated with "pine mouth", by GC-FID." J Agric Food Chem 60(10): 2701-2711. Farmer, E. H. and D. A. Sutton (1943). "37. The course of autoxidation reactions in polyisoprenes and allied compounds. Part IV. The isolation and constitution of photochemically-formed methyl oleate peroxide." Journal of the Chemical Society (Resumed) 0(0): 119-122. Fazekas, A. J., K. S. Burgess, P. R. Kesanakurti, S. W. Graham, S. G. Newmaster, B. C. Husband, D. M. Percy, M. Hajibabaei and S. C. Barrett (2008). "Multiple multilocus DNA barcodes from the plastid genome discriminate plant species equally well." PLoS One 3(7): e2802.

REFERENCES
162
Feller, S. E. and K. Gawrisch (2005). "Properties of docosahexaenoic-acid-containing lipids and their influence on the function of rhodopsin." Curr Opin Struct Biol 15(4): 416-422. Ferdinandusse, S., H. Rusch, A. E. M. van Lint, G. Dacremont, R. J. A. Wanders and P. Vreken (2002). "Stereochemistry of the peroxisomal branched-chain fatty acid α- and β-oxidation systems in patients suffering from different peroxisomal disorders." Journal of Lipid Research 43(3): 438-444. Field, C. J., H. H. Blewett, S. Proctor and D. Vine (2009). "Human health benefits of vaccenic acid." Applied Physiology, Nutrition, and Metabolism 34(5): 979-991. Firestone, S., A. Sheppard (1992). “Determination of trans fatty acids. In: Christie WW 9ed), Advances in Lipid Methodology-One, The Oily Press, Ayr, UK, 1992; pp 273-256 Flesch, F., F. Rigaux-Barry, P. Saviuc, R. Garnier, J. Daoudi, I. Blanc, S. S. Tellier and L. Lasbeur (2011). "Dysgeusia following consumption of pine nuts: More than 3000 cases in France." Clinical Toxicology 49(7): 668-670. Fournier, V., F. Destaillats, P. Juanéda, F. Dionisi, P. Lambelet, J.-L. Sébédio and O. Berdeaux (2006a). "Thermal degradation of long-chain polyunsaturated fatty acids during deodorization of fish oil." European Journal of Lipid Science and Technology 108(1): 33-42. Fournier, V., P. Juaneda, F. Destaillats, F. Dionisi, P. Lambelet, J. L. Sebedio and O. Berdeaux (2006). "Analysis of eicosapentaenoic and docosahexaenoic acid geometrical isomers formed during fish oil deodorization." J Chromatogr A 1129(1): 21-28. Freeman Allen, C., P. Good, H. Davis, P. Chisum and S. Fowler (1966). "Methodology for the separation o plant lipids and application to spinach leaf and chloroplast lamellae." Journal of the American Oil Chemists’ Society 43(4): 223-231. Fritsche, J. and H. Steinhart (1997). "Contents of trans fatty acids (TFA) in German foods and estimation of daily intake." Lipid / Fett 99(9): 314-318. Fritsche, S., T. Rumsey, M. Yurawecz, Y. Ku and J. Fritsche (2001). "Influence of growth promoting implants on fatty acid composition including conjugated linoleic acid isomers in beef fat." European Food Research and Technology 212(6): 621-629. Gardner, H. W. (1989). "Oxygen radical chemistry of polyunsaturated fatty acids." Free Radic Biol Med 7(1): 65-86. Gebauer, S. K., J. M. Chardigny, M. U. Jakobsen, B. Lamarche, A. L. Lock, S. D. Proctor and D. J. Baer (2011). "Effects of ruminant trans fatty acids on cardiovascular disease and cancer: a comprehensive review of epidemiological, clinical, and mechanistic studies." Adv Nutr 2(4): 332-354. Giddings, J. C. (1995). "Sample dimensionality: a predictor of order-disorder in component peak distribution in multidimensional separation." J Chromatogr A 703(1-2): 3-15. Glass, R. L., T. P. Krick, D. M. Sand, C. H. Rahn and H. Schlenk (1975). "Furanoid fatty acids from fish lipids." Lipids 10(11): 695-702. Golay, P. A., F. Giuffrida, F. Dionisi and F. Destaillats (2009). "Streamlined methods for the resolution and quantification of fatty acids including trans fatty acid isomers in food products by gas chromatography." J AOAC Int 92(5): 1301-1309. Gómez-Cortés, P., C. Tyburczy, J. T. Brenna, M. Juárez and M. A. de la Fuente (2009). "Characterization of cis-9 trans-11 trans-15 C18:3 in milk fat by GC and covalent adduct chemical ionization tandem MS." Journal of Lipid Research 50(12): 2412-2420. Griinari, J. M., D. A. Dwyer, M. A. McGuire, D. E. Bauman, D. L. Palmquist and K. V. Nurmela (1998). "Trans-octadecenoic acids and milk fat depression in lactating dairy cows." J Dairy Sci 81(5): 1251-1261. Gu, Q., F. David, F. Lynen, P. Vanormelingen, W. Vyverman, K. Rumpel, G. Xu and P. Sandra (2011). "Evaluation of ionic liquid stationary phases for one dimensional gas chromatography-mass spectrometry and comprehensive two dimensional gas chromatographic analyses of fatty acids in marine biota." J Chromatogr A 1218(20): 3056-3063.
REFERENCES
163
Gunstone, F. D., I. A. Ismail and M. Lie ken jie (1967). "Fatty acids, part 16. Thin layer and gas—liquid chromatographic properties of the cis and trans methyl octadecenoates and of some acetylenic esters." Chemistry and Physics of Lipids 1(4): 376-385. Han, S. N., L. S. Leka, A. H. Lichtenstein, L. M. Ausman, E. J. Schaefer and S. N. Meydani (2002). "Effect of hydrogenated and saturated, relative to polyunsaturated, fat on immune and inflammatory responses of adults with moderate hypercholesterolemia." J Lipid Res 43(3): 445-452. Handy, S. M., M. B. Parks, J. R. Deeds, A. Liston, L. S. de Jager, S. Luccioli, E. Kwegyir-Afful, A. R. Fardin-Kia, T. H. Begley, J. I. Rader and G. W. Diachenko (2011). "Use of the chloroplast gene ycf1 for the genetic differentiation of pine nuts obtained from consumers experiencing dysgeusia." J Agric Food Chem 59(20): 10995-11002. Harfoot, C. G. and G. P. Hazlewood (1997). Lipid metabolism in the rumen. The Rumen Microbial Ecosystem. P. N. Hobson and C. S. Stewart, Springer Netherlands: 382-426. Harynuk, J., B. Vlaeminck, P. Zaher and P. J. Marriott (2006). "Projection of multidimensional GC data into alternative dimensions-exploiting sample dimensionality and structured retention patterns." Anal Bioanal Chem 386(3): 602-613. Henneberg, D., U. Henrichs and G. Schomburg (1975). "Special techniques in the combination of gas chromatography and mass spectrometry." Journal of Chromatography A 112(0): 343-352. Herb, S. F., P. Magidman, F. Luddy and R. W. Riemenschneider (1962). "Fatty acids of cows' milk. B. Composition by gas-liquid chromatography aided by other methods of fractionation." Journal of the American Oil Chemists Society 39(3): 142-146. Hobson, P. N. and C. S. Stewart (1997). Rumen Microbial Ecosystem, Springer. Hotamisligil, G. S. (2005). "Role of endoplasmic reticulum stress and c-Jun NH2-terminal kinase pathways in inflammation and origin of obesity and diabetes." Diabetes 54 Suppl 2: S73-78. Huang, K., X. Han, X. Zhang and D. Armstrong (2007). "PEG-linked geminal dicationic ionic liquids as selective, high-stability gas chromatographic stationary phases." Analytical and Bioanalytical Chemistry 389(7-8): 2265-2275. Huang, K., X. Han, X. Zhang and D. W. Armstrong (2007). "PEG-linked geminal dicationic ionic liquids as selective, high-stability gas chromatographic stationary phases." Anal Bioanal Chem 389(7-8): 2265-2275. Huebschmann, H. J. (2008). Handbook of GC/MS, Wiley. Hulshof, K. F., M. A. van Erp-Baart, M. Anttolainen, W. Becker, S. M. Church, C. Couet, E. Hermann-Kunz, H. Kesteloot, T. Leth, I. Martins, O. Moreiras, J. Moschandreas, L. Pizzoferrato, A. H. Rimestad, H. Thorgeirsdottir, J. M. van Amelsvoort, A. Aro, A. G. Kafatos, D. Lanzmann-Petithory and G. van Poppel (1999). "Intake of fatty acids in western Europe with emphasis on trans fatty acids: the TRANSFAIR Study." Eur J Clin Nutr 53(2): 143-157. Ishii, K., H. Okajima, T. Koyamatsu, Y. Okada and H. Watanabe (1988). "The composition of furan fatty acids in the crayfish." Lipids 23(7): 694-700. Ito, Y. (2005). "Golden rules and pitfalls in selecting optimum conditions for high-speed counter-current chromatography." J Chromatogr A 1065(2): 145-168. James, A. T. and A. J. Martin (1956). "Gas-liquid chromatography: the separation and identification of the methyl esters of saturated and unsaturated acids from formic acid to n-octadecanoic acid." Biochem J 63(1): 144-152. Jensen, R. G. (2002). "The Composition of Bovine Milk Lipids: January 1995 to December 2000." Journal of Dairy Science 85(2): 295-350. Juaneda, P. (2002). "Utilisation of reversed-phase high-performance liquid chromatography as an alternative to silver-ion chromatography for the separation of cis- and trans-C18:1 fatty acid isomers." J Chromatogr A 954(1-2): 285-289.

REFERENCES
164
Kairenius, P., V. Toivonen and K. Shingfield (2011). "Identification and Ruminal Outflow of Long-Chain Fatty Acid Biohydrogenation Intermediates in Cows Fed Diets Containing Fish Oil." Lipids 46(7): 587-606. Kairenius, P., V. Toivonen and K. J. Shingfield (2011). "Identification and ruminal outflow of long-chain fatty acid biohydrogenation intermediates in cows fed diets containing fish oil." Lipids 46(7): 587-606. Köbler, H., Y. B. Monakhova, T. Kuballa, C. Tschiersch, J. Vancutsem, G. Thielert, A. Mohring and D. W. Lachenmeier (2011). "Nuclear Magnetic Resonance Spectroscopy and Chemometrics to Identify Pine Nuts That Cause Taste Disturbance." Journal of Agricultural and Food Chemistry 59(13): 6877-6881. Kodali, D. R. and G. R. List (2005). Trans fats alternatives, AOCS Press [Imprint]. Kolanowski, W. and G. Laufenberg (2006). "Enrichment of food products with polyunsaturated fatty acids by fish oil addition." European Food Research and Technology 222(3-4): 472-477. Kraft, J., M. Collomb, P. Möckel, R. Sieber and G. Jahreis (2003). "Differences in CLA isomer distribution of cow's milk lipids." Lipids 38(6): 657-664. Kramer, J. G., C. B. Blackadar and J. Zhou (2002). "Evaluation of two GC columns (60-m SUPELCOWAX 10 and 100-m CP sil 88) for analysis of milkfat with emphasis on CLA, 18 ∶1, 18∶2 and 18∶3 isom ers, and short- and long-chain FA." Lipids 37(8): 823-835. Kramer, J. G., C. Cruz-Hernandez, M. Or-Rashid and M. R. Dugan (2004). "The use of total trans-11 containing FA, rather than total “n−7” FA, Is recommended to assess the content of FA with a positive health image in ruminant fats." Lipids 39(7): 693-695. Kramer, J. G., V. Fellner, M. R. Dugan, F. Sauer, M. Mossoba and M. Yurawecz (1997). "Evaluating acid and base catalysts in the methylation of milk and rumen fatty acids with special emphasis on conjugated dienes and total trans fatty acids." Lipids 32(11): 1219-1228. Kramer, J. G., M. Hernandez, C. Cruz-Hernandez, J. Kraft and M. R. Dugan (2008). "Combining Results of Two GC Separations Partly Achieves Determination of All cis and trans 16:1, 18:1, 18:2 and 18:3 Except CLA Isomers of Milk Fat as Demonstrated Using Ag-Ion SPE Fractionation." Lipids 43(3): 259-273. Kramer, J. G., P. Parodi, R. Jensen, M. Mossoba, M. Yurawecz and R. Adlof (1998). "Rumenic acid: A proposed common name for the major conjugated linoleic acid isomer found in natural products." Lipids 33(8): 835-835. Kramer, J. K., M. Hernandez, C. Cruz-Hernandez, J. Kraft and M. E. Dugan (2008). "Combining results of two GC separations partly achieves determination of all cis and trans 16:1, 18:1, 18:2 and 18:3 except CLA isomers of milk fat as demonstrated using Ag-ion SPE fractionation." Lipids 43(3): 259-273. Kramer, J. K. G., C. Cruz-Hernandez and J. Zhou (2001). "Conjugated linoleic acids and octadecenoic acids: Analysis by GC." European Journal of Lipid Science and Technology 103(9): 600-609. Kramer, J. K. G., R. C. Fouchard and K. J. Jenkins (1985). "Differences in Chromatographic Properties of Fused Silica Capillary Columns, Coated, Crosslinked, Bonded, or Crosslinked and Bonded with Polyethylene Glycols (Carbowax 20M) Using Complex Fatty Acid Methyl Ester Mixtures." Journal of Chromatographic Science 23(2): 54-56. Kramer, J. K. G. and J. Zhou (2001). "Conjugated linoleic acid and octadecenoic acids: Extraction and isolation of lipids." European Journal of Lipid Science and Technology 103(9): 594-600. Kramer, J. K. G., M. M., Mossoba (eds) (2009). “Official Methods for the Determination of Trans Fat.” 2nd edition, AOCS Press, Urbana, IL, USA. Kuhnt, K., M. Baehr, C. Rohrer and G. Jahreis (2011). "Trans fatty acid isomers and the trans-9/trans-11 index in fat containing foods." Eur J Lipid Sci Technol 113(10): 1281-1292.

REFERENCES
165
Kwegyir-Afful, E., L. DeJager, T. Begley and S. Luccioli (2011). "Pine mouth syndrome - an emerging food hypersensitivity?" Clinical and Translational Allergy 1(Suppl 1): P25. Lawrence, P. and J. T. Brenna (2006). "Acetonitrile covalent adduct chemical ionization mass spectrometry for double bond localization in non-methylene-interrupted polyene fatty acid methyl esters." Anal Chem 78(4): 1312-1317. Lee, J.-W., K.-W. Lee, S.-W. Lee, I.-H. Kim and C. Rhee (2004). "Selective increase in pinolenic acid (all-cis-5,9,12–18 ∶3) in K orean LDL-receptor activity." Lipids 39(4): 383-387. Leheska, J. M., L. D. Thompson, J. C. Howe, E. Hentges, J. Boyce, J. C. Brooks, B. Shriver, L. Hoover and M. F. Miller (2008). "Effects of conventional and grass-feeding systems on the nutrient composition of beef." J Anim Sci 86(12): 3575-3585. Lichtenstein, A. H., L. M. Ausman, S. M. Jalbert and E. J. Schaefer (1999). "Effects of Different Forms of Dietary Hydrogenated Fats on Serum Lipoprotein Cholesterol Levels." New England Journal of Medicine 340(25): 1933-1940. Luke, L. L. and J. V. Brunnock (1968). “Separation of naphtenic and parafinic hydrocarbons up to C11 from hydrocarbon mixtures by gas chromatography on faujasite molecular sieves.” Ger. Offen., 1, 908418 Mahe, L., T. Dutriez, M. Courtiade, D. Thiebaut, H. Dulot and F. Bertoncini (2011). "Global approach for the selection of high temperature comprehensive two-dimensional gas chromatography experimental conditions and quantitative analysis in regards to sulfur-containing compounds in heavy petroleum cuts." J Chromatogr A 1218(3): 534-544. Mathur, G. P. and V. M. Gandhi (1972). "PROSTAGLANDIN IN HUMAN AND ALBINO RAT SKIN." J Investig Dermatol 58(5): 291-295. Michaud, A. L., P. Lawrence, R. Adlof and J. T. Brenna (2005). "On the formation of conjugated linoleic acid diagnostic ions with acetonitrile chemical ionization tandem mass spectrometry." Rapid Commun Mass Spectrom 19(3): 363-368. Michaud, A. L., M. P. Yurawecz, P. Delmonte, B. A. Corl, D. E. Bauman and J. T. Brenna (2003). "Identification and characterization of conjugated fatty acid methyl esters of mixed double bond geometry by acetonitrile chemical ionization tandem mass spectrometry." Anal Chem 75(18): 4925-4930. Milosevic, M., V. Milosevic, J. K.G., Kramer, H., Azizian, M. M., Mossoba. (2004). “Determining low levels of trans fatty acids in foods by an improved ATR-FTIR procedure.” Lipid Technol., 16, 229-231 Mjos, S. A. (2003). "Identification of fatty acids in gas chromatography by application of different temperature and pressure programs on a single capillary column." J Chromatogr A 1015(1-2): 151-161. Mjøs, S. A. (2006b). "Prediction of equivalent chain lengths from two-dimensional fatty acid retention indices." Journal of Chromatography A 1122(1–2): 249-254. Mjøs, S. A. and M. Solvang (2006a). "Geometrical isomerisation of eicosapentaenoic and docosahexaenoic acid at high temperatures." European Journal of Lipid Science and Technology 108(7): 589-597. Molkentin, J. and D. Precht (1995). "Optimized analysis oftrans-octadecenoic acids in edible fats." Chromatographia 41(5-6): 267-272. Momchilova, S., B. Nikolova-Damyanova and W. W. Christie (1998). "Silver ion high-performance liquid chromatography of isomeric cis- and trans-octadecenoic acids: Effect of the ester moiety and mobile phase composition." Journal of Chromatography A 793(2): 275-282. Mondello, L., A. Casilli, P. Q. Tranchida, P. Dugo and G. Dugo (2003). "Detailed analysis and group-type separation of natural fats and oils using comprehensive two-dimensional gas chromatography." J Chromatogr A 1019(1-2): 187-196.

REFERENCES
166
Mondello, L., A. C. Lewis and K. D. Bartle (2002). Multidimensional Chromatography, Wiley. Mossoba, M., A. Seiler, J. K. G. Kramer, V. Milosevic, M. Milosevic, H. Azizian and H. Steinhart (2009). "Nutrition Labeling: Rapid Determination of Total trans Fats by Using Internal Reflection Infrared Spectroscopy and a Second Derivative Procedure." Journal of the American Oil Chemists' Society 86(11): 1037-1045. Mossoba, M. M., R. E. McDonald, J. A. G. Roach, D. D. Fingerhut, M. P. Yurawecz and N. Sehat (1997). "Spectral confirmation of trans monounsaturated C18 fatty acid positional isomers." Journal of the American Oil Chemists' Society 74(2): 125-130. Mossoba, M. M., J. Moss and J. K. Kramer (2009). "Trans fat labeling and levels in U.S. foods: assessment of gas chromatographic and infrared spectroscopic techniques for regulatory compliance." J AOAC Int 92(5): 1284-1300. Mozaffarian, D. (2006). "Trans fatty acids - effects on systemic inflammation and endothelial function." Atheroscler Suppl 7(2): 29-32. Mozaffarian, D., A. Aro and W. C. Willett (2009). "Health effects of trans-fatty acids: experimental and observational evidence." Eur J Clin Nutr 63 Suppl 2: S5-21. Mozaffarian, D., H. Cao, I. B. King, R. N. Lemaitre, X. Song, D. S. Siscovick and G. S. Hotamisligil (2010). "Trans-palmitoleic acid, metabolic risk factors, and new-onset diabetes in U.S. adults: a cohort study." Ann Intern Med 153(12): 790-799. Mozaffarian, D. and R. Clarke (2009). "Quantitative effects on cardiovascular risk factors and coronary heart disease risk of replacing partially hydrogenated vegetable oils with other fats and oils." Eur J Clin Nutr 63 Suppl 2: S22-33. Munk, M.-D. (2010). "“Pine Mouth” Syndrome: Cacogeusia Following Ingestion of Pine Nuts (Genus: Pinus). An Emerging Problem?" Journal of Medical Toxicology 6(2): 158-159. Nasri, N., A. Khaldi, B. Fady and S. Triki (2005). "Fatty acids from seeds of Pinus pinea L.: composition and population profiling." Phytochemistry 66(14): 1729-1735. Nergiz, C. and İ. Dönmez (2004). "Chemical composition and nutritive value of Pinus pinea L. seeds." Food Chemistry 86(3): 365-368. Nimal Ratnayake, W. M., S. Hansen and M. Kennedy (2006). "Evaluation of the CP-Sil 88 and SP-2560 GC columns used in the recently approved AOCS official method Ce 1h-05: Determination of cis-, trans-, saturated, monounsaturated, and polyunsaturated fatty acids in vegetable or non-ruminant animal oils and fats by capillary GLC method." Journal of the American Oil Chemists' Society 83(6): 475-488. Pariza, M. W., Y. Park and M. E. Cook (2001). "The biologically active isomers of conjugated linoleic acid." Prog Lipid Res 40(4): 283-298. Parodi, P. W. (1977). "Conjugated Octadecadienoic Acids of Milk Fat." Journal of dairy science 60(10): 1550-1553. Pascal, J. C. and R. G. Ackman (1975). "Occurrence of 7-methyl-7-hexadecenoic acid, the corresponding alcohol, 7-methyl-6-hexadecenoic acid, and 5-methyl-4hexadecenoic acid in sperm whale oils." Lipids 10(8): 478-482. Payagala, T., Y. Zhang, E. Wanigasekara, K. Huang, Z. S. Breitbach, P. S. Sharma, L. M. Sidisky and D. W. Armstrong (2008). "Trigonal Tricationic Ionic Liquids: A Generation of Gas Chromatographic Stationary Phases." Analytical Chemistry 81(1): 160-173. Payagala, T., Y. Zhang, E. Wanigasekara, K. Huang, Z. S. Breitbach, P. S. Sharma, L. M. Sidisky and D. W. Armstrong (2009). "Trigonal tricationic ionic liquids: a generation of gas chromatographic stationary phases." Anal Chem 81(1): 160-173. Piperova, L. S., B. B. Teter, I. Bruckental, J. Sampugna, S. E. Mills, M. P. Yurawecz, J. Fritsche, K. Ku and R. A. Erdman (2000). "Mammary lipogenic enzyme activity, trans fatty acids and conjugated linoleic acids are altered in lactating dairy cows fed a milk fat-depressing diet." J Nutr 130(10): 2568-2574.

REFERENCES
167
PRECHT, #160, D., MOLKENTIN, #160 and J. (2003). Overestimation of linoleic acid and trans-C18 :2 isomers in milk fats with emphasis on trans Δ9,trans Δ12-octadecadienoic acid. Kempten, ALLEMAGNE, Agrar-Verlag Allgaü. Precht, D. and J. Molkentin (1996). "Rapid analysis of the isomers of trans-octadecenoic acid in milk fat." International Dairy Journal 6(8–9): 791-809. Precht, D. and J. Molkentin (1997). "Trans-geometrical and positional isomers of linoleic acid including conjugated linoleic acid (CLA) in German milk and vegetable fats." Lipid / Fett 99(9): 319-326. Precht, D. and J. Molkentin (1999). "C18:1, C18:2 and C18:3 trans and cis fatty acid isomers including conjugated cis delta 9, trans delta 11 linoleic acid (CLA) as well as total fat composition of German human milk lipids." Nahrung 43(4): 233-244. Precht, D. and J. Molkentin (2000). "Recent trends in the fatty acid composition of German sunflower margarines, shortenings and cooking fats with emphasis on individual C16 : 1, C18 : 1, C18 : 2, C18 : 3 and C20 : 1trans isomers." Food / Nahrung 44(4): 222-228. Precht, D. and J. Molkentin (2000). "Trans fatty acids in human milk." European Journal of Lipid Science and Technology 102(10): 635-640. Precht, D. and J. Molkentin (2000a). "Identification and quantitation of cis/trans C16:1 and C17:1 fatty acid positional isomers in German human milk lipids by thin-layer chromatography and gas chromatography/mass spectrometry." European Journal of Lipid Science and Technology 102(2): 102-113. Precht, D. and J. Molkentin (2003). "Overestimation of linoleic acid and trans-C18 :2 isomers in milk fats with emphasis on trans ?9,trans ?12-octadecadienoic acid." Milchwissenschaft 58(1-2): 30-34. Precht, D., J. Molkentin, F. Destaillats and R. Wolff (2001). "Comparative studies on individual isomeric 18∶1 acids in cow , goat, and ew e m ilk fats by low-temperature high-resolution capillary gas-liquid chromatography." Lipids 36(8): 827-832. Purcaro, G., P. Quinto Tranchida, L. Conte, A. Obiedzinska, P. Dugo, G. Dugo and L. Mondello (2011). "Performance evaluation of a rapid-scanning quadrupole mass spectrometer in the comprehensive two-dimensional gas chromatography analysis of pesticides in water." J Sep Sci 34(18): 2411-2417. Purcaro, G., P. Q. Tranchida, C. Ragonese, L. Conte, P. Dugo, G. Dugo and L. Mondello (2010). "Evaluation of a rapid-scanning quadrupole mass spectrometer in an apolar x ionic-liquid comprehensive two-dimensional gas chromatography system." Anal Chem 82(20): 8583-8590. Qiao, L., K. Lu, M. Qi and R. Fu (2013). "Separation performance of guanidinium-based ionic liquids as stationary phases for gas chromatography." J Chromatogr A 1276: 112-119. Ragonese, C., D. Sciarrone, P. Q. Tranchida, P. Dugo and L. Mondello (2012). "Use of ionic liquids as stationary phases in hyphenated gas chromatography techniques." J Chromatogr A 1255: 130-144. Ragonese, C., P. Q. Tranchida, P. Dugo, G. Dugo, L. M. Sidisky, M. V. Robillard and L. Mondello (2009). "Evaluation of use of a dicationic liquid stationary phase in the FAt and conventional gas chromatographic analysis of health-hazardous C18 cis/trans fatty acids." Anal Chem 81(13): 5561-5568. Ragonese, C., P. Q. Tranchida, P. Dugo, G. Dugo, L. M. Sidisky, M. V. Robillard and L. Mondello (2009). "Evaluation of Use of a Dicationic Liquid Stationary Phase in the FAt and Conventional Gas Chromatographic Analysis of Health-Hazardous C18 Cis/Trans Fatty Acids." Analytical Chemistry 81(13): 5561-5568. Rajakangas, J., S. Basu, I. Salminen and M. Mutanen (2003). "Adenoma growth stimulation by the trans-10, cis-12 isomer of conjugated linoleic acid (CLA) is associated with changes in mucosal NF-kappaB and cyclin D1 protein levels in the Min mouse." J Nutr 133(6): 1943-1948.

REFERENCES
168
Ratnayake, N., #160, W. M., Hansen, #160, S. L., Kennedy, #160 and M. P. (2006). Evaluation of the CP-Sil 88 and SP-2560 GC columns used in the recently approved AOCS official method Ce 1h-05: Determination of cis-, trans-, saturated, monounsaturated, and polyunsaturated fatty acids in vegetable or non-ruminant animal oils and fats by capillary GLC method. Heidelberg, ALLEMAGNE, Springer. Ratnayake, W. M. (2004). "Overview of methods for the determination of trans fatty acids by gas chromatography, silver-ion thin-layer chromatography, silver-ion liquid chromatography, and gas chromatography/mass spectrometry." J AOAC Int 87(2): 523-539. Ratnayake, W. M., B. Olsson and R. G. Ackman (1989). "Novel branched-chain fatty acids in certain fish oils." Lipids 24(7): 630-637. Ratnayake, W. M., L. J. Plouffe, E. Pasquier and C. Gagnon (2002). "Temperature-sensitive resolution of cis- and trans-fatty acid isomers of partially hydrogenated vegetable oils on SP-2560 and CP-Sil 88 capillary columns." J AOAC Int 85(5): 1112-1118. Reedy, G. and Mossoba, M.M. (1999). “ Matrix isolation GC-FTIR”. In: Mossoba MM (ed), Spectral Methods in Food Analysis, Marcel Dekker Inc., New York, NY, 1999; pp 325-396 Reid, V. R., J. A. Crank, D. W. Armstrong and R. E. Synovec (2008). "Characterization and utilization of a novel triflate ionic liquid stationary phase for use in comprehensive two-dimensional gas chromatography." J Sep Sci 31(19): 3429-3436. Roach, J. G., M. Yurawecz, J. G. Kramer, M. Mossoba, K. Eulitz and Y. Ku (2000). "Gas chromatography—High resolution selected-ion mass spectrometric identification of trace 21 ∶0 and 20∶2 fatty acids eluting with conjugated linoleic acid isomers." Lipids 35(7): 797-802. Santercole, V., P. Delmonte and J. K. Kramer (2012). "Comparison of separations of fatty acids from fish products using a 30-m Supelcowax-10 and a 100-m SP-2560 column." Lipids 47(3): 329-344. Scholfield, C. R., R. O. Butterfield and H. J. Dutton (1966). "Preparation of pure methyl esters by counter double current distribution." Lipids 1(3): 163-165. Schomburg, G., E. Hübinger, H. Husmann and F. Weeke (1982). "On-line hydrogenation of unsaturated and saturated sample components in capillary reactors coupled to either inlet or outlet of capillary columns." Chromatographia 16(1): 228-232. Sciotto, C. and S. A. Mjos (2012). "Trans isomers of EPA and DHA in omega-3 products on the European market." Lipids 47(7): 659-667. Sebedio, J. L., M. Catte, M. A. Boudier, J. Prevost and A. Grandgirard (1996). "Formation of fatty acid geometrical isomers and of cyclic fatty acid monomers during the finish frying of frozen prefried potatoes." Food Research International 29(2): 109-116. Sebedio, J. L., W. W. Christie and R. O. Adlof (2003). Advances in conjugated linoleic acid research, Amer Oil Chemists Society. Sebedio, J. L., W. M. N. Ratnayake, R. G. Ackman and J. Prevost (1993). "Stability of polyunsaturated omega-3 fatty acids during deep fat frying of Atlantic mackerel (Scomber scombrus L.)." Food Research International 26(3): 163-172. Seeley, J. V., S. K. Seeley, E. K. Libby, Z. S. Breitbach and D. W. Armstrong (2008). "Comprehensive two-dimensional gas chromatography using a high-temperature phosphonium ionic liquid column." Anal Bioanal Chem 390(1): 323-332. Seeley, J. V., S. K. Seeley, E. K. Libby and J. D. McCurry (2007). "Analysis of biodiesel/petroleum diesel blends with comprehensive two-dimensional gas chromatography." J Chromatogr Sci 45(10): 650-656. Sehat, N., R. Rickert, M. Mossoba, J. G. Kramer, M. Yurawecz, J. G. Roach, R. Adlof, K. Morehouse, J. Fritsche, K. Eulitz, H. Steinhart and Y. Ku (1999). "Improved separation of conjugated fatty acid methyl esters by silver ion-high-performance liquid chromatography." Lipids 34(4): 407-413.

REFERENCES
169
Sen Gupta, A. K. and H. Peters (1966). "Isolierung und Strukturaufklärung polyverzweigter Fettsäuren aus Fischöl." Fette, Seifen, Anstrichmittel 68(5): 349-360. Shingfield, K. J., C. K. Reynolds, B. Lupoli, V. Toivonen, M. P. Yurawecz, P. Delmonte, J. M. Griinari, A. S. Grandison and D. E. Beever (2005). "Effect of forage type and proportion of concentrate in the diet on milk fatty acid composition in cows given sunflower oil and fish oil." Animal Science 80(02): 225-238. Siegler, W. C., J. A. Crank, D. W. Armstrong and R. E. Synovec (2010). "Increasing selectivity in comprehensive three-dimensional gas chromatography via an ionic liquid stationary phase column in one dimension." J Chromatogr A 1217(18): 3144-3149. Singh, D., M. E. Rezac and P. H. Pfromm (2009). "Partial Hydrogenation of Soybean Oil with Minimal Trans Fat Production Using a Pt-Decorated Polymeric Membrane Reactor." Journal of the American Oil Chemists' Society 86(1): 93-101. Spitzer, V. (1996). "Structure analysis of fatty acids by gas chromatography--low resolution electron impact mass spectrometry of their 4,4-dimethyloxazoline derivatives--a review." Prog Lipid Res 35(4): 387-408. Stubbs, C. D. and A. D. Smith (1984). "The modification of mammalian membrane polyunsaturated fatty acid composition in relation to membrane fluidity and function." Biochim Biophys Acta 779(1): 89-137. Thompson, R. H. (1997). "Direct Measurement of Total trans- and cis-Octadecenoic Fatty Acids Based on a Gas—Liquid Chromatographic Class Separation of trans-18:1 and cis-18:1 Fatty Acid Methyl Esters." Journal of Chromatographic Science 35(11): 536-544. Tiyapongpattana, W., P. Wilairat and P. J. Marriott (2008). "Characterization of biodiesel and biodiesel blends using comprehensive two-dimensional gas chromatography." J Sep Sci 31(14): 2640-2649. Tranchida, P. Q., F. A. Franchina, P. Dugo and L. Mondello (2012). "A flow-modulated comprehensive gas chromatography-mass spectrometry method for the analysis of fatty acid profiles in marine and biological samples." J Chromatogr A 1255: 171-176. Tricon, S., G. C. Burdge, E. L. Jones, J. J. Russell, S. El-Khazen, E. Moretti, W. L. Hall, A. B. Gerry, D. S. Leake, R. F. Grimble, C. M. Williams, P. C. Calder and P. Yaqoob (2006). "Effects of dairy products naturally enriched with cis-9,trans-11 conjugated linoleic acid on the blood lipid profile in healthy middle-aged men." The American Journal of Clinical Nutrition 83(4): 744-753. Tsuzuki, W. and K. Ushida (2009). "Preparative separation of cis- and trans-isomers of unsaturated fatty acid methyl esters contained in edible oils by reversed-phase high-performance liquid chromatography." Lipids 44(4): 373-379. Tyburczy, C., P. Delmonte, A. R. Fardin-Kia, M. M. Mossoba, J. K. Kramer and J. I. Rader (2012). "Profile of trans fatty acids (FA) including trans polyunsaturated FA in representative FAt food samples." J Agric Food Chem 60(18): 4567-4577. Tyburczy, C., M. M. Mossoba, A. R. Fardin-Kia and J. I. Rader (2012). "Evaluation of low trans fat edible oils by attenuated total reflection-Fourier transform infrared spectroscopy and gas chromatography: a comparison of analytical approaches." Anal Bioanal Chem 404(3): 809-819. Ulberth, F., R. Gabernig and F. Schrammel (1999). "Flame-ionization detector response to methyl, ethyl, propyl, and butyl esters of fatty acids." Journal of the American Oil Chemists' Society 76(2): 263-266. Van Pelt, C. K. and J. T. Brenna (1999). "Acetonitrile chemical ionization tandem mass spectrometry to locate double bonds in polyunsaturated fatty acid methyl esters." Anal Chem 71(10): 1981-1989. Van Tol, A., P. L. Zock, T. van Gent, L. M. Scheek and M. B. Katan (1995). "Dietary trans fatty acids increase serum cholesterylester transfer protein activity in man." Atherosclerosis 115(1): 129-134.

REFERENCES
170
Veldsink, J. W., M. J. Bouma, N. H. Schön and A. A. C. M. Beenackers (1997). "Heterogeneous Hydrogenation of Vegetable Oils: A Literature Review." Catalysis Reviews 39(3): 253-318. Villegas, C., Y. Zhao and J. M. Curtis (2010). "Two methods for the separation of monounsaturated octadecenoic acid isomers." J Chromatogr A 1217(5): 775-784. Western, R. J., S. S. Lau, P. J. Marriott and P. D. Nichols (2002). "Positional and geometric isomer separation of FAME by comprehensive 2-D GC." Lipids 37(7): 715-724. Willett, W. C., M. J. Stampfer, J. E. Manson, G. A. Colditz, F. E. Speizer, B. A. Rosner, L. A. Sampson and C. H. Hennekens (1993). "Intake of trans fatty acids and risk of coronary heart disease among women." Lancet 341(8845): 581-585. Wolff, R. (1992). "trans-Polyunsaturated fatty acids in French edible rapeseed and soybean oils." Journal of the American Oil Chemists’ Society 69(2): 106-110. Wolff, R. (1997). "Discussion of the term “unusual” when discussing Δ5-olefinic acids in plant lipids." Journal of the American Oil Chemists' Society 74(5): 619-619. Wolff, R. (1999). "The phylogenetic significance of sciadonic (all-cis 5,11,14–20:3) acid in gymnosperms and its quantitative significance in land plants." Journal of the American Oil Chemists' Society 76(12): 1515-1516. Wolff, R. and C. Bayard (1995). "Fatty acid composition of some pine seed oils." Journal of the American Oil Chemists’ Society 72(9): 1043-1046. Wolff, R., W. Christie, F. Pédrono and A. Marpeau (1999). "Arachidonic, eicosapentaenoic, and biosynthetically related fatty acids in the seed lipids from a primitive gymnosperm, Agathis robusta." Lipids 34(10): 1083-1097. Wolff, R., E. Dareville and J.-C. Martin (1997). "Positional distribution of Δ5-olefinic acids in triacylglycerols from conifer seed oils: General and specific enrichment in the sn-3 position." Journal of the American Oil Chemists' Society 74(5): 515-523. Wolff, R., L. Deluc and A. Marpeau (1996). "Conifer seeds: Oil content and fatty acid composition." Journal of the American Oil Chemists’ Society 73(6): 765-771. Wolff, R., O. Lavialle, F. Pédrono, E. Pasquier, L. Deluc, A. Marpeau and K. Aitzetmüller (2001). "Fatty acid composition of pinaceae as taxonomic markers." Lipids 36(5): 439-451. Wolff, R., F. Pédrono, E. Pasquier and A. Marpeau (2000). "General characteristics of Pinus spp. Seed fatty acid compositions, and importance of Δ5-olefinic acids in the taxonomy and phylogeny of the genus." Lipids 35(1): 1-22. Wolff, R. and D. Precht (1998). "Comments on the resolution of individual trans-18:1 isomers by gas-liquid chromatography." Journal of the American Oil Chemists' Society 75(3): 421-422. Wolff, R. L., W. W. Christie, F. Pedrono, A. M. Marpeau, N. Tsevegsuren, K. Aitzetmuller and F. D. Gunstone (1999). "Delta5-olefinic acids in the seed lipids from four Ephedra species and their distribution between the alpha and beta positions of triacylglycerols. Characteristics common to coniferophytes and cycadophytes." Lipids 34(8): 855-864. Wolff, R. L., O. Lavialle, F. Pedrono, E. Pasquier, F. Destaillats, A. M. Marpeau, P. Angers and K. Aitzetmuller (2002). "Abietoid seed fatty acid compositions--a review of the genera Abies, Cedrus, Hesperopeuce, Keteleeria, Pseudolarix, and Tsuga and preliminary inferences on the taxonomy of Pinaceae." Lipids 37(1): 17-26. Wolff, R.L., D. Precht, J. Molkentin (1998). “Occurance and distribution profiles of trans-18:1 acids in edible fats of natural origin”. In: Sebedio J-L, Christie WW (eds), Trans Fatty Acids in Human Nutrition, The Oily Press, Dundee, Scotland, 1998; pp 1-34 Wonsil, B. J., J. H. Herbein and B. A. Watkins (1994). "Dietary and ruminally derived trans-18:1 fatty acids alter bovine milk lipids." J Nutr 124(4): 556-565. Yu, Q. T., B. N. Liu, J. Y. Zhang and Z. H. Huang (1989). "Location of double bonds in fatty acids of fish oil and rat testis lipids. Gas chromatography-mass spectrometry of the oxazoline derivatives." Lipids 24(1): 79-83.
REFERENCES
171
Yurawecz, M., J. G. Roach, N. Sehat, M. Mossoba, J. G. Kramer, J. Fritsche, H. Steinhart and Y. Ku (1998). "A new conjugated linoleic acid isomer, 7 trans, 9 cis-octadecadienoic acid, in cow milk, cheese, beef and human milk and adipose tissue." Lipids 33(8): 803-809. Yurawecz, M. P. and J. K. G. Kramer (2006). Advances in conjugated linoleic acid research, American Oil Chemists' Society. Zapadlo, M., J. Krupcik, T. Kovalczuk, P. Majek, I. Spanik, D. W. Armstrong and P. Sandra (2011). "Enhanced comprehensive two-dimensional gas chromatographic resolution of polychlorinated biphenyls on a non-polar polysiloxane and an ionic liquid column series." J Chromatogr A 1218(5): 746-751. Zapadlo, M., J. Krupcik, P. Majek, D. W. Armstrong and P. Sandra (2010). "Use of a polar ionic liquid as second column for the comprehensive two-dimensional GC separation of PCBs." J Chromatogr A 1217(37): 5859-5867.

SUMMURY
172
SUMMARY
The negative health impacts of dietary trans fatty acids have been documented in many
scientific publications in the last decade. Numerous studies have also examined the
relationship between different positional and geometric isomers of unsaturated fatty acids
with double bonds in the trans configuration and coronary heart disease. The analysis of and
accurate chromatographic separation of, various fatty acid isomers are critical factors in all
these studies.
The objectives of this work were to develop and improve analytical methods, including
synthesis of reference FA, for the identification and quantification of positional/geometric
isomers of trans fatty acids.
1) A new gas chromatographic method was developed by utilizing a novel ionic liquid
capillary GC column (200 m SLB-IL111). This method has several advantages compared to
methods using cyanopropyl siloxane columns, which are currently recommended for the
challenging analysis of mixtures containing geometric and positional isomers of FAME. The
new GC method when operated isothermally at 168 °C, improved the separation of c/t-CLA
isomers and the separation of c9,t11- from t7,c9-CLA. This was not possible using
cyanopropyl siloxane columns. The selected chromatographic conditions provided the
separation of co-eluting fatty acid isomeric pairs. It eliminated the concern raised in most
reports that c9,t11-18:2 is overestimated by the contribution of t7,c9-CLA. It provided for the
separation of t15-18:1, which generally co-elutes with c9-18:1, and provided a partial
resolution of several isomer pairs such as t13/t14-18:1, c8- from c6/c7-18:1, and several t,t-
CLA isomers. This new method was then successfully applied to the analysis of milk fat
[Chapter 5] and fish oil [Chapter 7].
2) Significant improvements in the analysis of FAME were achieved by preparing small
amounts of reference materials using simple synthetic procedures.
Positional/geometric isomers of C14:1 – C20:1 FAME, positional/geometric isomers of
linoleic acid (c9,c12-18:2), positional/geometric isomers of alpha-linolenic, gamma-linolenic
acid methyl esters and conjugated linoleic acid methyl esters were prepared, isolated and
purified.

SUMMURY
173
3) Multi dimensional chromatography is one of the most rapidly growing techniques in
separation science. A new GC-online reduction × GC chromatographic system was developed
that provided a significant enhancement of previously developed single dimensional GC
methods for FAME separation. Using this new methodology, the FAME could be easily
identified based on a simple interpretation model: under isothermal conditions, saturated
FAME lay on a diagonal line bisecting the separation plane and FAME with the same carbon
skeleton lay on lines parallel to the 1D time axis. The chromatographic conditions described
have been shown to allow the separation of the FAME prepared from the most complex
samples, including fish oil and biological extracts. The introduction of a palladium reducer
between the two dimensions of separation, thus reducing the unsaturated FAME to their
saturated form, provided an enhanced separation compared to GC × GC systems based solely
on the orthogonality of the two separations. By separating FAME with different chain lengths
on different lines, this method allowed the analysis of samples containing complex mixtures
of polyunsaturated fatty acid methyl esters with various chain lengths.

SUMMURY
174
Zusammenfassung
Die negativen Auswirkungen der erhöhten Aufnahme von trans-Fettsäuren (tFA) und deren
Positionsisomeren wurden in zahlreichen wissenschaftlichen Studien mit einer
Risikoerhöhung für koronare Herzerkrankungen dokumentiert und bestätigt. Die korrekte,
chromatografische Trennung der verschiedenen Fettsäuren (FS) und deren chemischen
Analyse sind in allen durchgeführten Studien von großer Bedeutung. Die Ziele der
vorliegenden Arbeit lagen in der Neuentwicklung und Verbesserung von analytischen
Methoden für die Identifizierung und Quantifizierung der Positionsisomeren der tFA und
betreffen die Synthese von Standards für tFS.
1) Es wurde eine gaschromatografische Methode unter Verwendung einer neuartigen
„ionic liquid“ GC-Kapillarsäule (200 m SLB-IL111) entwickelt. Im Vergleich zu den
existierenden GC-Methoden, die Cyanopropyl-Kapillarsäulen (CPS) für die Trennung der
Fettsäurenisomere empfehlen, erwies sich die neu entwickelte Methode, speziell für die
Trennung des Isomerenpaares c9,t11-CLA/t7,c9-CLA, sehr vorteilhaft. Die in der
Vergangenheit angewendeten GC-Methoden (GC mit CPS) waren nicht in der Lage das
obengenannte Isomerenpaar ausreichend zu trennen und des öfteren wurde der Gehalt an
c9/t11-18:2 überschätzt. Gleichzeitig wurde auch die chromatografische Trennung von t15-
18:1 und c9-18:1 und partiell des Isomerenpaares t13/t14-18:1, c8/c6/c7-18:1, sowie
mehreren t,t-CLA Isomeren verbessert. Für die Trennung der FS im Milchfett [Chapter 5] und
Fischöl [Chapter 7] wurde die neu entwickelte Methode erfolgreich eingesetzt.
2) Die synthetische Herstellung von ungesättigten Fettsäuremethylestern (FSME) im
Labormaßstab verbesserte erheblich die gaschromatografische Bestimmung und
Identifizierung der Fettsäureisomeren. Positions- und geometrische Isomere von C14:1-
C20:1, Linolsäure, alpha-Linolensäure, gamma-Linolensäure und CLAs wurden synthetisch
hergestellt und in reiner Form isoliert.

SUMMURY
175
3) Der Bereich der multidimensionalen Chromatografie gehört zu den am schnellsten
wachsenden Bereichen der chromatografischen Trennungstechniken. Ein innovatives,
chromatografisches GC-System (GC-online Reduktion × GC) wurde entwickelt, welches im
Vergleich zu allen vorherigen monodimensionalen Methoden eine erhebliche Verbesserung
der chromatografischen Trennung von FSME lieferte. Die neue Methodik machte die
Identifizierung und die Bestimmung von FSME gemäß den folgenden Prinzipien erheblich
einfacher. Unter isothermen Bedingungen lagen die gesättigten FSME auf einer Diagonalen
im zweidimensionalen chromatografischen Trennungsraum, wobei die FSME mit gleicher
Anzahl an Kohlenstoffatomen parallel zur 1D Zeitachse angeordnet waren. Die neuen
chromatografischen Bedingungen verbesserten die Trennung von komplexen FSME in
Milchfett und Fischöl. Der Einsatz von einem Kapillar-Katalysator zwischen den zwei
Dimensionen (1D und 2D), der mit metallischem Palladium beladen war und alle
vorhandenen Doppelbindungen der ungesättigten FSME reduzierte, lieferte sogar eine
erweiterte chromatografische Trennung im Vergleich zu konventionellem GC×GC, welches
nur auf Orthogonalität der 1D und 2D basiert. Das neu entwickelte System erlaubte die
Trennung von komplexen und oft co-eluierenden, mehrfach ungesättigten FSME mit
unterschiedlichen Kohlenstoffkettenlängen.

LIST OF PUBLICATIONS APPENDIX
I
LIST OF PUBLICATIONS Delmonte, P.; Hu, Qing.; Fardin-Kia, Ali R. and Rader, Jeanne I., “Preparation, chromatographic separation and relative retention times of cis/trans heptadecaenoic (17:1) fatty acids”. J. Chrom. A.; 1214(1-2), 30-36 (2008) Delmonte, P.; Fardin-Kia, Ali R.; Hu, Qing and Rader, Jeanne I., “Review of Methods for Preparation and Gas Chromatographic Separation of trans and cis Reference Fatty Acids”. J. AOAC Int., 92 (5), 1310-1325 (2009) Delmonte, P.; Fardin-Kia Ali R.; Kramer, John K.G.; Mossoba, Magdi M.; Sidisky, Len and Rader, Jeanne I., “Separation characteristics of fatty acid methyl esters using SLB-IL111, a new ionic liquid coated capillary gas chromatographic column”. J. Chrom. A.; 1218, 545-554 (2011)
Handy, Sara M.; Parks, Matthew B.; Deeds, Jonathan R.; Liston, Aaron; Lowri S. de Jager, Luccioli, Stefano; Kwegyir-Afful, Ernest; Fardin-Kia Ali R., Begley, Timothy H.; Rader, Jeanne I. and Diachenko, Gregory W., “Use of the Chloroplast Gene ycf1 for the Genetic Differentiation of Pine Nuts Obtained from Consumers Experiencing Dysgeusia”. J. Agric. Food Chem.; 59, 10995-11002 (2011) Fardin-Kia, Ali R.; Handy Sara M. and Rader, Jeanne I., “Characterization of Pine Nuts in the U.S. Market, Including Those Associated with “Pine Mouth”, by GC-FID”. J. Agric. Food Chem.; 60, 2701-2711 (2012) Tyburczy, C.; Delmonte, P.; Fardin-Kia, Ali R.; Mossoba, Magdi M; Kramer, JK.; Rader, Jeanne I., “Profile of trans fatty acids (FA) including trans polyunsaturated FA in representative FAt food samples”. J. Agric. Food. Chem.; 60(18), 4567-77 (2012) Tyburczy, C.; Mossoba, Magdi M; Fardin-Kia, Ali R; Rader, Jeanne I., “Evaluation of low trans fat edible oils by attenuated total reflection-Fourier transform infrared spectroscopy and gas chromatography: a comparison of analytical approaches”, Anal. Bioanal. Chem.; 404, 809-819 (2012) Mossoba, Magdi M.; Kramer, John K. G.; Azizian, Hormoz; Kraft, Jana; Delmonte, Pierluigi; Fardin-Kia Ali R.; Bueso, Francisco J.; Rader, Jeanne I. and Lee, Jung K., “Application of a Novel, Heated, Nine-Reflection ATR Crystal and a Portable FTIR Spectrometer to the Rapid Determination of Total Trans Fat”. J. Am. Oil Chem.; 89, 419-429 (2012) Delmonte, P.; Fardin-Kia Ali R.; Kramer, John K.G.; Mossoba, Magdi M.; Sidisky, Len; Tyburczy, C. and Rader, Jeanne I., “Evaluation of highly polar ionic liquid gas chromatographic column for the determination of the fatty acids in milk fat”. J. Chrom. A.; 1233, 137-146 (2012) Delmonte, P; Fardin-Kia, Ali R.; Rader, Jeanne I., “Separation of Fatty Acid Methyl Esters by GC-Online Hydrogenation × GC”. Anal. Chem. 85(3), 1517-1524 (2013)

LIST OF PUBLICATIONS APPENDIX
II
Vyas, D.; Moallem, U.; Teter, B.B.; Fardin-Kia, A.R.; Erdman, R.A., “Milk fat responses to butterfat infusion during conjugated linoleic acid-induced milk fat depression in lactating dairy cows”. Journal of Dairy Science, 96, 2387-2399 (2013) Mosoba, Magdi M.; Azizian, Hormoz; Tyburczy, Cynthia; Kramer, John K. G.; Delmonte, Pierluigi; Fardin-Kia, Ali R.; Rader, Jeanne I., “ Rapid FT-NIR Analysis of Edible Oils for Total SFA, MUFA, PUFA, and Trans FA with Comparison to GC”. J. Am. Oil Chem., DOI 10.1007/s11746-013-2234-z (2013) Fadin-Kia, Ali R.; Delmonte, P.; Kramer, John K.G; Jahreis, G.; Kuhnt, K.; Santercole, V.; Rader, Jeanne I., “Separation of fatty acids in menhaden oil using highly polar ionic liquid gas chromatographic column and confirmation of their identities using silver ion fraction and mass spectrometry”;, Lipids (2013) (just accepted)
List of lectures, posters and abstracts APPENDIX
III
LIST OF LECTURES, POSTERS AND ABSTRACS Fardin-Kia, Ali R., “Preparation, Isolation and Determination of Non-conjugated Geometric/positional Isomers of Linoleic Acid”. AOCS, Phoenix, AZ, May 17th, 2010 Fardin-Kia, Ali R., “Separation of Fatty Acids in Marine Oils With Highly PolarIonic Liquid gas Chromatographic Columns”. AOCS, Montreal, Canada, April 30th, 2013 Fardin-Kia, Ali R.; Delmonte, Pierluigi. and Rader, Jeanne. I., “Preparation and relative retention times of non-conjugated 18:2 Fatty acid isomers” , AOAC, Orlando, FL, May (2009) Mossoba, Magdi. M.; Azizian, Hormuz; Kramer, John K.G.; Delmonte, Pierluigi; Fardin-Kia, Ali R., “Rapid Determination of Total Saturated Fat and Total trans Fat Contents by FT-NIR for Regulatory Compliance”, AOCS, Cincinnati, OH, May, (2011) Delmonte, Pierluigi; Fardin-Kia, Ali R.; Kramer John K.G.; Mossoba, Magdi M.; Rader, Jeanne I., ”Separation of fatty acid methyl esters utilizing the novel ionic Liquid SLB-111”, AOCS, Cincinnati, OH, May, (2011) Mossoba, Magdi. M.; Azizian, Hormuz; Kramer, John K.G.; J. Kraft; Delmonte, Pierluigi; Fardin-Kia, Ali R., F.J. Bueso; J.I. Rader, “Performance Evaluation of a Heated 9-Bounce Internal Reflection Portable Mid-FTIR Spectrometer for the Rapid Determination of Total trans Fat”, AOCS, Cincinnati, OH, May, (2011) Delmonte, P.; Fardin-Kia, Ali R.; Rahul, P.; Tyburczy, C.; Rader, Jeanne I., “A Comprehensive LCxLC Approach to Separation of Phytochemicals in Dietary Supplements”, Abstract #2220-4, PITTCON, Orlando, FL, (2012) Ledford, Edward B.; Spear, William; Wu, Zhanpin; Delmonte, Pierluigi; Fardin-Kia Ali R.; Rader, Jeanne I., “GCxGC Separation of Fatty Acid Methyl-Esters: Using Giddings Dimensionality to Aid the Interpretation of Comprehensive Two-Dimensional Gas Chromatograms”, Abstract #490-2, PITTCON, Philadelphia, PA, (2013) Delmonte, Pierluigi; Fardin-Kia, Ali R.; Ledford, Edward B; Wu, Zhanpin; Rader, Jeanne I., “ Separation of Fatty Acid Methyl Esters by Comprehensive GC-Online Hydrogenation x GC”, Abstract #1120-4, PITTCON, Philadelphia, PA, (2013) Pawar, Rahul.; Grundel, Erich.; Rader, Jeanne I.; Krynitsky, Alex.; Fardin-Kia, Ali R.; Knolhoff, Ann M.; Croleyl, Timothy R.; Eason, Michael, “Determination of biogenic amines in Acacia rigidula and its dietary supplements”, Abstract #AGFD107, ACS, New Orleans, LA, (2013)

Acknowledgment APPENDIX
IV
ACKNOWLEDGEMENTS
My thesis could not have been accomplished without the involvement of my mentors,
colleagues, friends and my family whom I would like to thank.
I gratefully thank Prof. Gerhard Jahreis for giving me the opportunity to develop my
own individuality and self-sufficiency and allowing me work with great
independence. He has been an outstanding mentor and his thoughtful suggestions and
advice made this work possible.
I would also like to gratefully and sincerely thank my supervisor Dr. Jeanne I. Rader,
the Director of the Division of Bioanalytical Chemistry at U.S. FDA, for her
guidance, suggestions and professional advice. Dr. Rader provided me with the
opportunity to work independently in her Division with top-ranking scientists.
I would like to thank Dr. Pierluigi Delmonte for his assistance and guidance in getting
my graduate career started on a strong footing and providing me with the foundation
for becoming an analytical chemist. I specially thank him for many stimulating
scientific discussions during this time.
I would like to thank the U.S. FDA for providing state of the art laboratory facilities
and financial support and encouraging me to attend international meetings and
trainings.
I would like to thank Dr. John K.G. Kramer for his thoughtful suggestions and advice.
I would also like to thank Prof. Dr. Dr. Steinhart, Dr. Magdi M. Mossoba, Dr. Katrin
Kuhnt and Dr. Christian Degen.
For supporting me in every situation of my life, I would like to thank my parents,
Nader and Azam. I also thank my sister Sommayeh, Tanja Siedenburg, Mike Toth,
Jonas Elbers and Maria Rospide for their patience with me.

SELBSTÄNDIGKEITSERKLÄRUNG
V
SELBSTÄNDIGKEITSERKLÄRUNG
Hiermit erkläre ich, dass mir die Promotionsordnung der Biologisch-
Pharmazeutischen Fakultät der Friedrich-Schiller-Universität Jena bekannt ist. Die
vorliegende Arbeit wurde von mir selbstständig angefertigt. Es wurden keine
Textabschnitte eines Dritten ohne entsprechende Kennzeichnung übernommen.
Weiterhin erkläre ich, dass alle von mir benutzten Hilfsmittel, persönliche
Mitteilungen und Quellen in der Arbeit angegeben sind und mich keine weiteren als
die angegebenen Personen bei der Auswahl und Auswertung des Materials sowie bei
der Erstellung des Manuskriptes unterstützt haben. Die Hilfe eines Promotionsberaters
wurde nicht in Anspruch genommen. Dritte erhielten von mir keine unmittelbaren
oder mittelbaren geldwerten Leistungen für die Arbeit, die im Zusammenhang mit
dem Inhalt der vorgelegten Dissertation stehen. Zudem erkläre ich, dass ich diese
Arbeit weder gegenwärtig noch zu einem früheren Zeitpunkt an einer anderen
Hochschule zur Begutachtung vorgelegt oder die Eröffnung eines
Promotionsverfahrens an einer anderen Hochschule beantragt habe.
College Park, 19. August 2013 .................................
Ali Reza Fardin-Kia


