Embed Size (px)
Citation preview
Fruit and Soil Quality of Organic and ConventionalStrawberry AgroecosystemsJohn P. Reganold1*, Preston K. Andrews2, Jennifer R. Reeve3, Lynne Carpenter-Boggs4, Christopher W.
Schadt5, J. Richard Alldredge6, Carolyn F. Ross7, Neal M. Davies8, Jizhong Zhou9
1 Department of Crop and Soil Sciences, Washington State University, Pullman, Washington, United States of America, 2 Department of Horticulture and Landscape
Architecture, Washington State University, Pullman, Washington, United States of America, 3 Department of Plants, Soils and Climate, Utah State University, Logan, Utah,
United States of America, 4 Center for Sustaining Agriculture and Natural Resources, Washington State University, Pullman, Washington, United States of America,
5 Biosciences Division, Oak Ridge National Laboratory, Oak Ridge, Tennessee, United States of America, 6 Department of Statistics, Washington State University, Pullman,
Washington, United States of America, 7 School of Food Science, Washington State University, Pullman, Washington, United States of America, 8 Department of
Pharmaceutical Sciences, Washington State University, Pullman, Washington, United States of America, 9 Department of Botany and Microbiology, Institute for
Environmental Genomics, University of Oklahoma, Norman, Oklahoma, United States of America
Abstract
Background: Sale of organic foods is one of the fastest growing market segments within the global food industry. Peopleoften buy organic food because they believe organic farms produce more nutritious and better tasting food from healthiersoils. Here we tested if there are significant differences in fruit and soil quality from 13 pairs of commercial organic andconventional strawberry agroecosystems in California.
Methodology/Principal Findings: At multiple sampling times for two years, we evaluated three varieties of strawberries formineral elements, shelf life, phytochemical composition, and organoleptic properties. We also analyzed traditional soilproperties and soil DNA using microarray technology. We found that the organic farms had strawberries with longer shelflife, greater dry matter, and higher antioxidant activity and concentrations of ascorbic acid and phenolic compounds, butlower concentrations of phosphorus and potassium. In one variety, sensory panels judged organic strawberries to besweeter and have better flavor, overall acceptance, and appearance than their conventional counterparts. We also found theorganically farmed soils to have more total carbon and nitrogen, greater microbial biomass and activity, and higherconcentrations of micronutrients. Organically farmed soils also exhibited greater numbers of endemic genes and greaterfunctional gene abundance and diversity for several biogeochemical processes, such as nitrogen fixation and pesticidedegradation.
Conclusions/Significance: Our findings show that the organic strawberry farms produced higher quality fruit and that theirhigher quality soils may have greater microbial functional capability and resilience to stress. These findings justify additionalinvestigations aimed at detecting and quantifying such effects and their interactions.
Citation: Reganold JP, Andrews PK, Reeve JR, Carpenter-Boggs L, Schadt CW, et al. (2010) Fruit and Soil Quality of Organic and Conventional StrawberryAgroecosystems. PLoS ONE 5(9): e12346. doi:10.1371/journal.pone.0012346
Editor: Hany A. El-Shemy, Cairo University, Egypt
Received November 28, 2009; Accepted July 23, 2010; Published September 1, 2010
Copyright: � 2010 Reganold et al. This is an open-access article distributed under the terms of the Creative Commons Attribution License, which permitsunrestricted use, distribution, and reproduction in any medium, provided the original author and source are credited.
Funding: The project was supported by the United States Department of Agriculture through the National Science Foundation/U.S. Department of AgricultureMicrobial Observatories Program, the Department of Energy Office of Biological and Environmental Research, and The Organic Center. The funders had no role instudy design, data collection and analysis, decision to publish, or preparation of the manuscript.
Competing Interests: The authors have declared that no competing interests exist.
* E-mail: [email protected]
Introduction
Although global demand for organic products remains robust,
consumer demand for these products is concentrated in North
America and Europe [1]. For example, in the United States, which
ranks fourth in organically farmed land globally [1], organic food
sales have increased by almost a factor of six, from $3.6 billion in
1997 to $21.1 billion in 2008 (or more than 3 percent of total U.S.
food sales) [2]. More than two-thirds of U.S. consumers buy organic
products at least occasionally, and 28 percent buy organic products
weekly [2]. Three of the most important reasons consumers
purchase organic foods are health benefits (i.e., less pesticide
residues and greater nutrition), taste, and environmentally friendly
farming practices, such as those that promote soil health [3].
While there is strong evidence that organic foods have
significantly less pesticide residues [4–6], this is not the case for
organic foods being more nutritious. Although there is no
universally accepted definition of what constitutes a nutritious
food, recent scientific opinion has stressed that more nutritious
foods are those that are more nutrient dense relative to their
energy contents [7]. Although carbohydrates and fats are
considered essential nutrients, the current concept of nutrient
dense foods, and hence more nutritious foods, places the emphasis
on foods that contain more protein, fiber, vitamins, or minerals, as
well as specific phytochemicals, such as the polyphenolic
antioxidants found in fruits and vegetables [8].
In the past 10 years, ten review studies of the scientific litera-
ture comparing the nutrition of organic and conventional foods
PLoS ONE | www.plosone.org 1 September 2010 | Volume 5 | Issue 9 | e12346
have been published. Eight of these review studies [9,10,
11,12,13,14,15,16] found some evidence of organic food being
more nutritious, whereas two review articles [17,18] concluded
that there were no consistent nutritional differences between
organic and conventional foods. Comparisons of foods from
organic and conventional systems are often complicated by the
interactive effects of farming practices, soil quality, plant varieties,
and the time of harvest on nutritional quality. Hence, many of the
comparative studies cited in some of the earlier reviews were not
experimentally well designed to draw valid conclusions [13,17]; for
example, soils or crop varieties were not the same on each
organic/conventional field pair. The few studies that have
compared organic and conventional foods for their organoleptic
(sensory) properties have shown mixed results or used unreliable
experimental designs [14,17].
A widely accepted definition of soil quality is the capacity of a
soil to sustain biological productivity, maintain environmental
quality, and promote plant and animal health [19]. Soil quality
may be inferred from measurable soil properties termed soil
quality indicators [20]. Organic farming practices compared to
conventional farming practices have been shown to improve soil
quality indicators based on traditional measures of biological,
chemical, and physical properties [21,22,23], with few studies
showing no advantages [24]. However, traditional measures
inadequately assess the roles of microbial community structure
and genetic diversity in soil ecosystem processes that directly
impact soil quality [25]. Examples of important soil ecosystem
processes facilitated by microorganisms include nitrogen fixation,
denitrification, pesticide degradation, and other organic xenobiotic
degradation. Soil DNA analysis using microarray technology can
target those microbial genes involved in specific soil ecosystem
processes and measure their abundance and diversity [26,27],
allowing a more complete investigation of soil quality.
The majority of previous organic/conventional studies have
focused on either comparing fruit quality or soil quality. The few
studies that have compared both facets have limited their analyses
to selected properties. Currently, no published study has integrated
interdisciplinary knowledge and robust methodologies in a systems
approach to quantitatively compare a comprehensive range of
both fruit and soil quality indices using multiple organic and
conventional farms, multiple varieties, and multiple sampling
times. Here, we assembled an interdisciplinary team of scientists
representing agroecology, soil science, microbial ecology, genetics,
pomology, food chemistry, sensory science, and statistics to address
the following question: Are there significant differences in
nutritional and organoleptic fruit properties and in soil quality,
including soil ecosystem functional genes, between commercial
organic and conventional strawberry agroecosystems?
Although some farm production conditions can be simulated at
research stations, farming systems research that measures multiple
variables can often only be properly studied under actual farming
or agroecosystem conditions [28]. Thus, our study’s experimental
units are real commercial organic and conventional strawberry
farms, located in California. We chose to study strawberries
(Fragaria x ananassa Duch.) as the food of choice because of their
high economic value as a fruit crop, documented nutritional
benefits, popularity in the consumer diet, and suitability for
sensory evaluation. California is an appropriate location for the
commercial strawberry farms in our study because it is the leading
producer, accounting for more than 25% of the world’s strawberry
production [29,30], with nearly 5% of its total strawberry acreage
in organic production [29].
To determine if differences in food and soil quality exist, we
sampled repeatedly harvested strawberry varieties (‘Diamante’,
‘San Juan’, and ‘Lanai’) and soils at multiple sampling times in
2004 and 2005 from 13 pairs of adjacent organic and conventional
fields from commercial farms. Each organic/conventional field
pair had the same soil type and the same strawberry variety
planted at similar times. Because strawberries go through different
growth cycles during the 7-month harvest season, we analyzed 42
fruit, 11 leaf, and 6 organoleptic properties multiple times during
the two years of our study. Strawberries in each field pair were
analyzed at the same time and stage of harvest maturity, and
under identical storage conditions and transportation methods so
that the strawberries were as close to retail consumption as
possible. In addition to measuring 31 traditional soil chemical and
biological properties, we analyzed soil DNA using microarray
technology to target those microbial genes involved in 11 specific
ecosystem processes.
Results and Discussion
Strawberry QualityStrawberry leaves were analyzed for plant nutrients and fruit
were analyzed for plant nutrients, fruit quality, nutritional value,
and organoleptic properties. Leaf P and fruit P and K concentra-
tions were significantly higher in conventionally grown strawberry
plants than in organically grown plants (Table 1); leaf Mg and fruit
N were also notably higher (P,0.10) in conventionally grown
strawberry plants. All other strawberry and leaf nutrient concen-
trations were similar. While there are no published recommenda-
tions for optimum levels of foliar concentrations of mineral nutrients
for strawberries grown in California, all farm fields were fertilized
according to local industry standards, as recommended by
professional horticulturists. No nutrient deficiency or toxicity
symptoms were observed on organically or conventionally grown
strawberry plants during the two growing seasons.
When susceptibility to fungal post-harvest rots was evaluated,
organic strawberries had significantly longer survival times (less gray
mold incidence) than conventional strawberries (Figure 1). When
strawberries were exposed to a two-day shelf-life interval, the
percent loss in fresh weight was significantly less for the organic
berries than for the conventional berries (Table 2). These results
indicate that the organic strawberries would have a longer shelf life
than the conventional strawberries because of slower rotting and
dehydration, perhaps due to augmentation of cuticle and epidermal
cell walls. There were no fungicides applied to the organic
strawberry fields for post-harvest control of gray mold (Botrytis
cinerea), in contrast to multiple fungicide applications to the
conventional fields. Although sulfur was applied to the organic
fields to control powdery mildew (Sphaerotheca macularis), sulfur sprays
are ineffective against gray mold [31]. This suggests that the organic
strawberries may have been more resistant or avoided infection by
means other than fungicides (e.g., systemic-acquired resistance).
Strawberries from organic farms were significantly smaller (by
13.4%) than those from conventional farms, but had significantly
greater dry matter content (by 8.3%) (Table 2). Fruit firmness and
external color intensity (C*) were similar between conventional
and organic berries, but organic berries were darker red
(significantly lower L* and hab) than conventional berries.
Although their darker red color did not result in a preference
for the appearance of organic over conventional ‘Lanai’ and ‘San
Juan’ strawberries by consumer-sensory panels, these panels did
prefer the appearance of organic ‘Diamante’ berries to their
conventional counterparts (Table 3).
Organic strawberries had significantly higher total antioxidant
activity (8.5% more), ascorbic acid (9.7% more), and total
phenolics (10.5% more) than conventional berries (Table 2), but
Fruit and Soil Quality
PLoS ONE | www.plosone.org 2 September 2010 | Volume 5 | Issue 9 | e12346
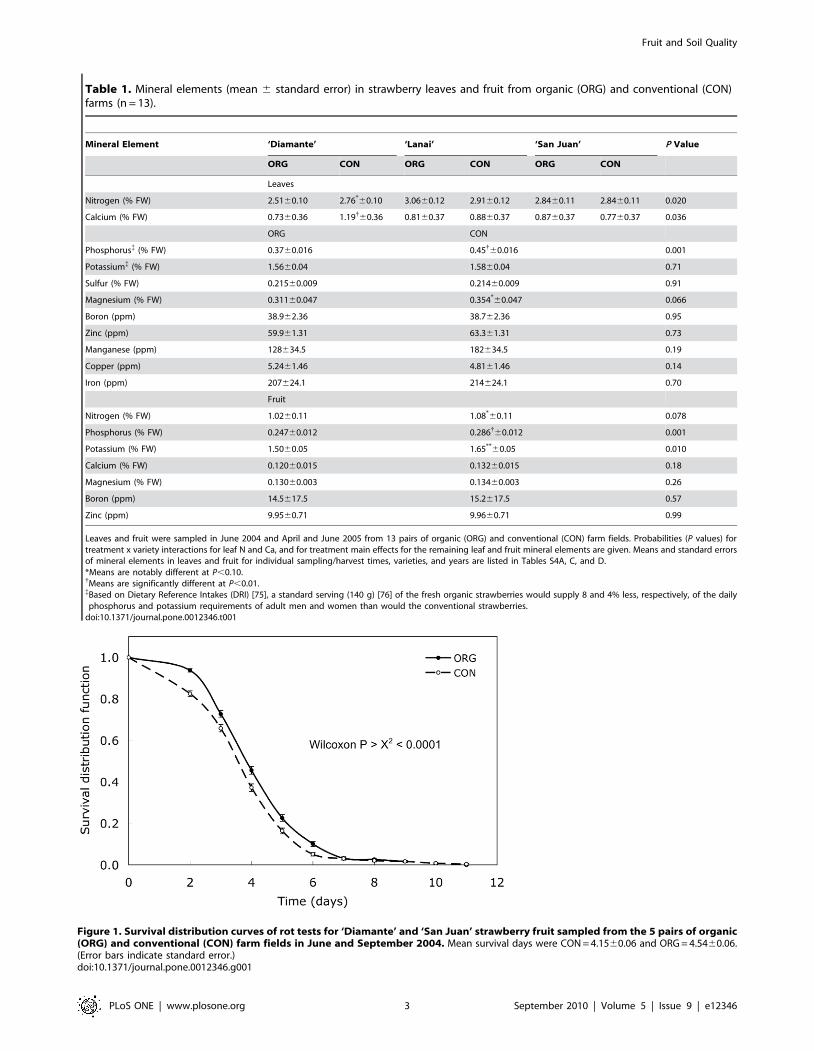
Table 1. Mineral elements (mean 6 standard error) in strawberry leaves and fruit from organic (ORG) and conventional (CON)farms (n = 13).
Mineral Element ‘Diamante’ ‘Lanai’ ‘San Juan’ P Value
ORG CON ORG CON ORG CON
Leaves
Nitrogen (% FW) 2.5160.10 2.76*60.10 3.0660.12 2.9160.12 2.8460.11 2.8460.11 0.020
Calcium (% FW) 0.7360.36 1.19{60.36 0.8160.37 0.8860.37 0.8760.37 0.7760.37 0.036
ORG CON
Phosphorus{ (% FW) 0.3760.016 0.45{60.016 0.001
Potassium{ (% FW) 1.5660.04 1.5860.04 0.71
Sulfur (% FW) 0.21560.009 0.21460.009 0.91
Magnesium (% FW) 0.31160.047 0.354*60.047 0.066
Boron (ppm) 38.962.36 38.762.36 0.95
Zinc (ppm) 59.961.31 63.361.31 0.73
Manganese (ppm) 128634.5 182634.5 0.19
Copper (ppm) 5.2461.46 4.8161.46 0.14
Iron (ppm) 207624.1 214624.1 0.70
Fruit
Nitrogen (% FW) 1.0260.11 1.08*60.11 0.078
Phosphorus (% FW) 0.24760.012 0.286{60.012 0.001
Potassium (% FW) 1.5060.05 1.65**60.05 0.010
Calcium (% FW) 0.12060.015 0.13260.015 0.18
Magnesium (% FW) 0.13060.003 0.13460.003 0.26
Boron (ppm) 14.5617.5 15.2617.5 0.57
Zinc (ppm) 9.9560.71 9.9660.71 0.99
Leaves and fruit were sampled in June 2004 and April and June 2005 from 13 pairs of organic (ORG) and conventional (CON) farm fields. Probabilities (P values) fortreatment x variety interactions for leaf N and Ca, and for treatment main effects for the remaining leaf and fruit mineral elements are given. Means and standard errorsof mineral elements in leaves and fruit for individual sampling/harvest times, varieties, and years are listed in Tables S4A, C, and D.*Means are notably different at P,0.10.{Means are significantly different at P,0.01.{Based on Dietary Reference Intakes (DRI) [75], a standard serving (140 g) [76] of the fresh organic strawberries would supply 8 and 4% less, respectively, of the dailyphosphorus and potassium requirements of adult men and women than would the conventional strawberries.
doi:10.1371/journal.pone.0012346.t001
Figure 1. Survival distribution curves of rot tests for ‘Diamante’ and ‘San Juan’ strawberry fruit sampled from the 5 pairs of organic(ORG) and conventional (CON) farm fields in June and September 2004. Mean survival days were CON = 4.1560.06 and ORG = 4.5460.06.(Error bars indicate standard error.)doi:10.1371/journal.pone.0012346.g001
Fruit and Soil Quality
PLoS ONE | www.plosone.org 3 September 2010 | Volume 5 | Issue 9 | e12346
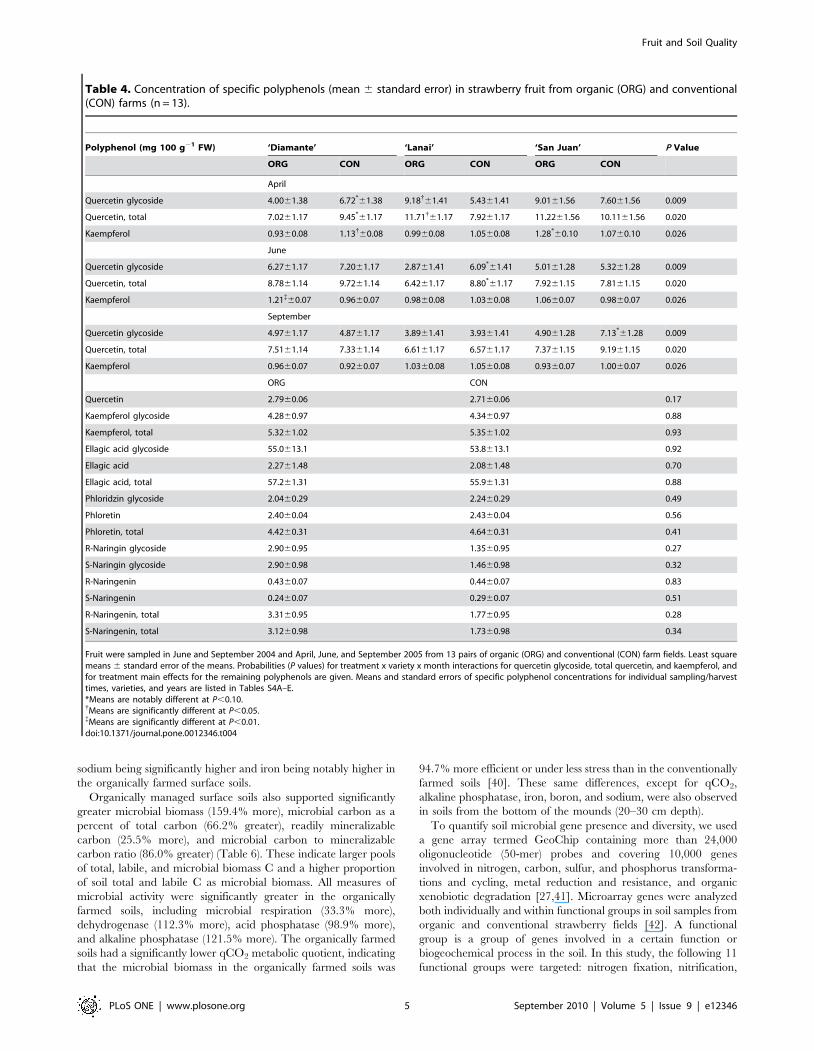
significantly less phosphorus (13.6% less) and potassium (9.1% less)
(Table 1). Specific polyphenols, such as quercetin and ellagic acid,
showed mixed or no differences (Table 4). Strawberries are among
the most concentrated sources of vitamin C and other antioxi-
dant compounds in the human diet [32]. Dietary antioxidants,
including ascorbic acid (i.e., vitamin C) and phenolic compounds
offer significant potential human health benefits for protection
against diseases [33,34]. For example, Olsson et al. [35] reported
decreased proliferation of breast and colon cancer cells by extracts
of organically grown strawberries compared to conventional
berries, with ascorbic acid concentrations correlated negatively
with cancer cell proliferation. Although the greater potassium
concentration in the conventional strawberries is a plus, straw-
berries are not among the richest sources of potassium or even
phosphorus [36]. Interestingly, less phosphorus in the diet may be
considered desirable, given the negative effects of the increasing
U.S. consumption of phosphorus [37] on vitamin D and calcium
metabolism [38], and the resulting potential risk to bone health.
Using hedonic/intensity ratings, consumer-sensory panels found
organic ‘Diamante’ strawberries to be sweeter and have preferable
flavor, appearance, and overall acceptance compared to conven-
tional ‘Diamante’ berries (Table 3). Organic and conventional
‘Lanai’ and ‘San Juan’ berries were rated similarly. Sensory results
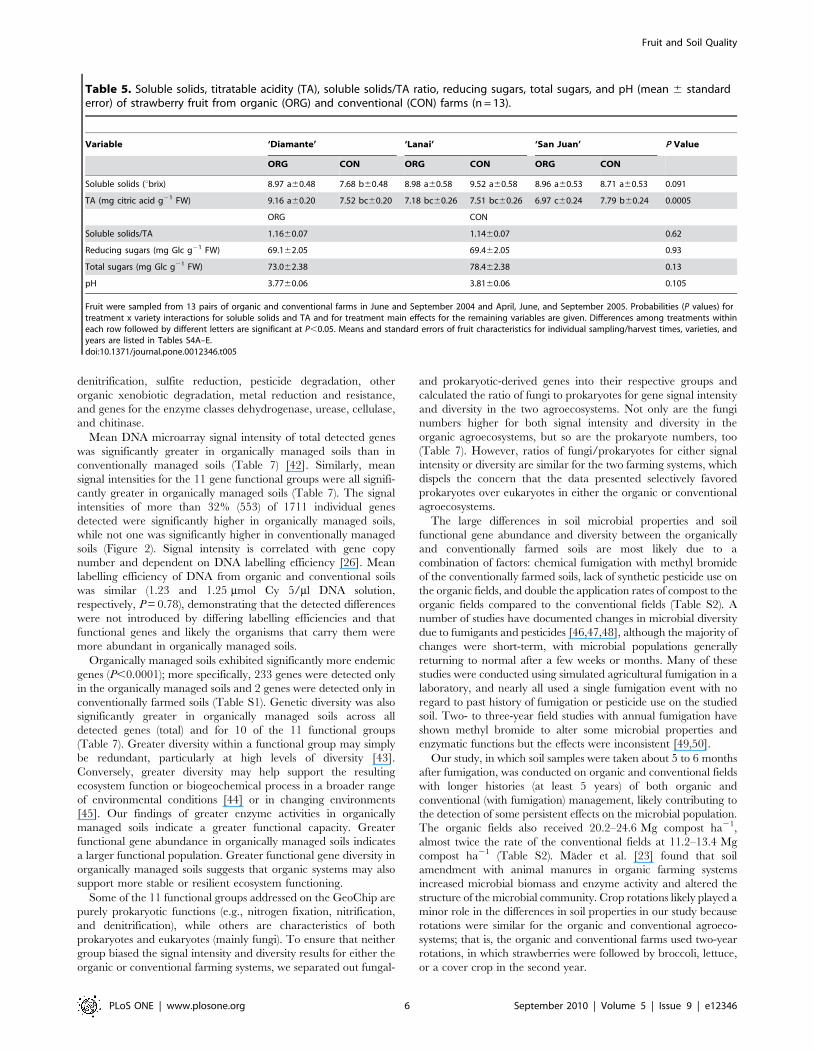
of sweeter tasting ‘Diamante’ strawberries were confirmed by
higher soluble solids content measured in the laboratory (Table 5).
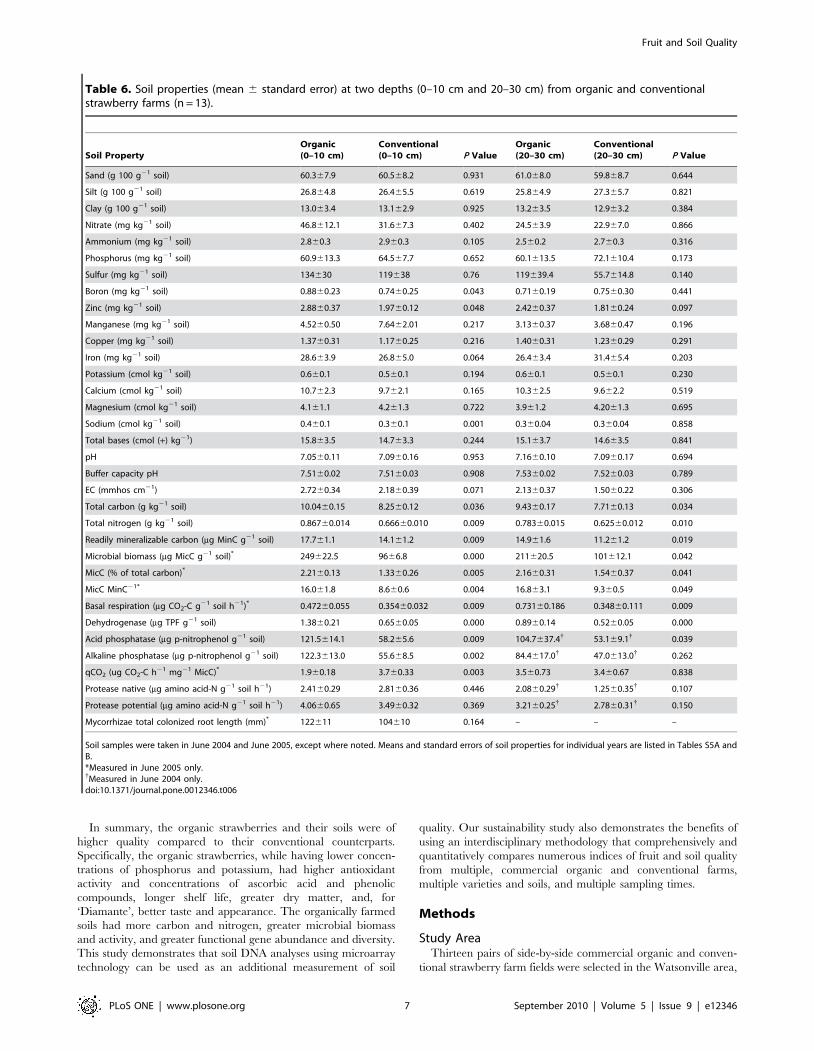
Soil QualitySoils were sampled and analyzed from the top (0–10 cm) and
bottom (20–30 cm) of the raised mounds in June 2004 and 2005.
The organically managed surface soils compared to their
conventional counterparts contained significantly greater total
carbon (21.6% more) and nitrogen (30.2% more) (Table 6).
Organic matter (total carbon) can have a beneficial impact on soil
quality, enhancing soil structure and fertility and increasing water
infiltration and storage [39]. Levels of extractable nutrients were
similar in the two systems, with the exception of zinc, boron, and
Table 2. Fruit characteristics (mean 6 standard error) of strawberries from organic and conventional farms (n = 13).
Fruit Quality Variable (units) Organic Conventional P Value
Fruit fresh weight (g) 24.0760.68 27.7860.68 0.001
Dry matter (%) 10.0360.20 9.2660.20 0.006
Fruit weight loss (%) 25.4065.16 27.5265.16 0.048
Fruit firmness (N) 4.3661.90 4.1761.90 0.30
External L* (+60 to 260) 37.6660.76 38.6560.76 0.030
External C* (+60 to 260) 42.2160.37 41.7660.37 0.25
External hab (u) 31.2660.63 32.1460.63 0.048
Total antioxidant activity (mmol Trolox equivalents/g FW) 11.8860.35 10.9560.35 0.019
Total phenolics (mg gallic acid equivalents/g FW) 1.3760.13 1.2460.13 0.0003
Total ascorbic acid* (mg/g FW) 0.62160.015 0.56660.015 0.009
Total anthocyanins (mg P-3-Glc{ equivalents/g FW) 205619.4 192619.4 0.103
Strawberries (‘Diamante’, ‘Lanai’, and ‘San Juan’) were sampled from 13 pairs of organic and conventional farm fields in June and September 2004 and April, June, andSeptember 2005. Means and standard errors of fruit characteristics for individual sampling/harvest times, varieties, and years are listed in Tables S4A–E.*Based on Dietary Reference Intakes (DRI) [75], a standard serving (140 g) [76] of the fresh organic strawberries would supply 9–10% more of the daily vitamin C(ascorbic acid) requirement of adult men and women than would the conventional strawberries.{Pelargonidyn-3-glucoside.doi:10.1371/journal.pone.0012346.t002
Table 3. Consumer sensory evaluations (mean6standard error) of strawberries on a nine-point hedonic/intensity scale fromorganic (ORG) and conventional (CON) farms (n = 13).
Sensory Property ‘Diamante’ ‘Lanai’ ‘San Juan’ P Value
ORG CON ORG CON ORG CON
Hedonic/intensity ratings
Overall acceptance 6.09 a60.23 5.35 b60.23 6.24 a60.29 6.24 a60.29 6.09 a60.27 6.36 a60.27 0.029
Flavor 5.95 a60.16 5.17 b60.16 6.08 a60.17 5.92 a60.17 5.86 a60.19 6.07 a60.19 0.044
Sweetness 5.56a60.22 4.73 b60.22 5.69 a60.24 5.56 a60.24 5.52 a60.25 5.74 a60.25 0.029
Appearance 6.73 a60.37 5.97 b60.37 6.78 a60.39 6.97 a60.39 7.09 a60.39 7.03 a60.39 0.067
ORG CON
Juiciness 6.2160.09 6.3560.09 0.11
Tartness 4.6160.27 4.7560.27 0.38
Strawberry fruit (‘Diamante’, ‘Lanai’, and ‘San Juan’) were sampled from 13 pairs of organic and conventional farm fields in September 2004 and April, June, andSeptember 2005. Differences between values within rows followed by different letters are significant at P,0.05. Means and standard errors of consumer sensoryevaluations for individual sampling/harvest times, varieties, and years are listed in Tables S4B-E.doi:10.1371/journal.pone.0012346.t003
Fruit and Soil Quality
PLoS ONE | www.plosone.org 4 September 2010 | Volume 5 | Issue 9 | e12346
sodium being significantly higher and iron being notably higher in
the organically farmed surface soils.
Organically managed surface soils also supported significantly
greater microbial biomass (159.4% more), microbial carbon as a
percent of total carbon (66.2% greater), readily mineralizable
carbon (25.5% more), and microbial carbon to mineralizable
carbon ratio (86.0% greater) (Table 6). These indicate larger pools
of total, labile, and microbial biomass C and a higher proportion
of soil total and labile C as microbial biomass. All measures of
microbial activity were significantly greater in the organically
farmed soils, including microbial respiration (33.3% more),
dehydrogenase (112.3% more), acid phosphatase (98.9% more),
and alkaline phosphatase (121.5% more). The organically farmed
soils had a significantly lower qCO2 metabolic quotient, indicating
that the microbial biomass in the organically farmed soils was
94.7% more efficient or under less stress than in the conventionally
farmed soils [40]. These same differences, except for qCO2,
alkaline phosphatase, iron, boron, and sodium, were also observed
in soils from the bottom of the mounds (20–30 cm depth).
To quantify soil microbial gene presence and diversity, we used
a gene array termed GeoChip containing more than 24,000
oligonucleotide (50-mer) probes and covering 10,000 genes
involved in nitrogen, carbon, sulfur, and phosphorus transforma-
tions and cycling, metal reduction and resistance, and organic
xenobiotic degradation [27,41]. Microarray genes were analyzed
both individually and within functional groups in soil samples from
organic and conventional strawberry fields [42]. A functional
group is a group of genes involved in a certain function or
biogeochemical process in the soil. In this study, the following 11
functional groups were targeted: nitrogen fixation, nitrification,
Table 4. Concentration of specific polyphenols (mean 6 standard error) in strawberry fruit from organic (ORG) and conventional(CON) farms (n = 13).
Polyphenol (mg 100 g21 FW) ‘Diamante’ ‘Lanai’ ‘San Juan’ P Value
ORG CON ORG CON ORG CON
April
Quercetin glycoside 4.0061.38 6.72*61.38 9.18{61.41 5.4361.41 9.0161.56 7.6061.56 0.009
Quercetin, total 7.0261.17 9.45*61.17 11.71{61.17 7.9261.17 11.2261.56 10.1161.56 0.020
Kaempferol 0.9360.08 1.13{60.08 0.9960.08 1.0560.08 1.28*60.10 1.0760.10 0.026
June
Quercetin glycoside 6.2761.17 7.2061.17 2.8761.41 6.09*61.41 5.0161.28 5.3261.28 0.009
Quercetin, total 8.7861.14 9.7261.14 6.4261.17 8.80*61.17 7.9261.15 7.8161.15 0.020
Kaempferol 1.21{60.07 0.9660.07 0.9860.08 1.0360.08 1.0660.07 0.9860.07 0.026
September
Quercetin glycoside 4.9761.17 4.8761.17 3.8961.41 3.9361.41 4.9061.28 7.13*61.28 0.009
Quercetin, total 7.5161.14 7.3361.14 6.6161.17 6.5761.17 7.3761.15 9.1961.15 0.020
Kaempferol 0.9660.07 0.9260.07 1.0360.08 1.0560.08 0.9360.07 1.0060.07 0.026
ORG CON
Quercetin 2.7960.06 2.7160.06 0.17
Kaempferol glycoside 4.2860.97 4.3460.97 0.88
Kaempferol, total 5.3261.02 5.3561.02 0.93
Ellagic acid glycoside 55.0613.1 53.8613.1 0.92
Ellagic acid 2.2761.48 2.0861.48 0.70
Ellagic acid, total 57.261.31 55.961.31 0.88
Phloridzin glycoside 2.0460.29 2.2460.29 0.49
Phloretin 2.4060.04 2.4360.04 0.56
Phloretin, total 4.4260.31 4.6460.31 0.41
R-Naringin glycoside 2.9060.95 1.3560.95 0.27
S-Naringin glycoside 2.9060.98 1.4660.98 0.32
R-Naringenin 0.4360.07 0.4460.07 0.83
S-Naringenin 0.2460.07 0.2960.07 0.51
R-Naringenin, total 3.3160.95 1.7760.95 0.28
S-Naringenin, total 3.1260.98 1.7360.98 0.34
Fruit were sampled in June and September 2004 and April, June, and September 2005 from 13 pairs of organic (ORG) and conventional (CON) farm fields. Least squaremeans 6 standard error of the means. Probabilities (P values) for treatment x variety x month interactions for quercetin glycoside, total quercetin, and kaempferol, andfor treatment main effects for the remaining polyphenols are given. Means and standard errors of specific polyphenol concentrations for individual sampling/harvesttimes, varieties, and years are listed in Tables S4A–E.*Means are notably different at P,0.10.{Means are significantly different at P,0.05.{Means are significantly different at P,0.01.doi:10.1371/journal.pone.0012346.t004
Fruit and Soil Quality
PLoS ONE | www.plosone.org 5 September 2010 | Volume 5 | Issue 9 | e12346
denitrification, sulfite reduction, pesticide degradation, other
organic xenobiotic degradation, metal reduction and resistance,
and genes for the enzyme classes dehydrogenase, urease, cellulase,
and chitinase.
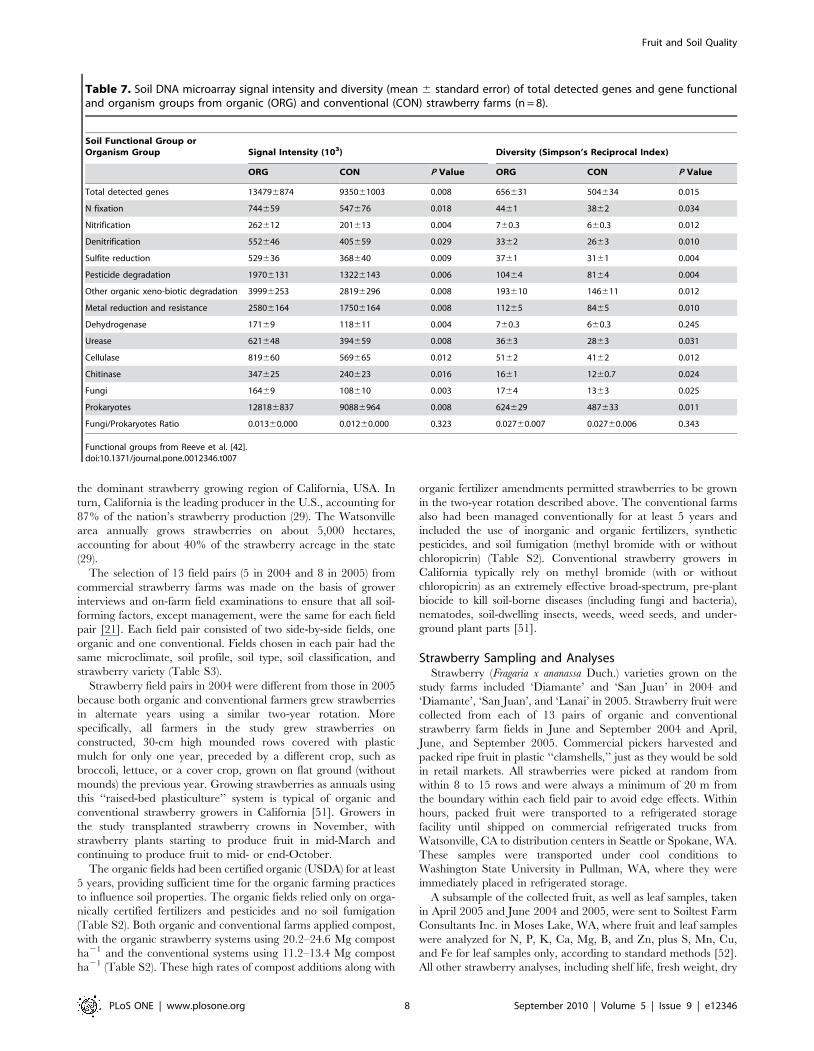
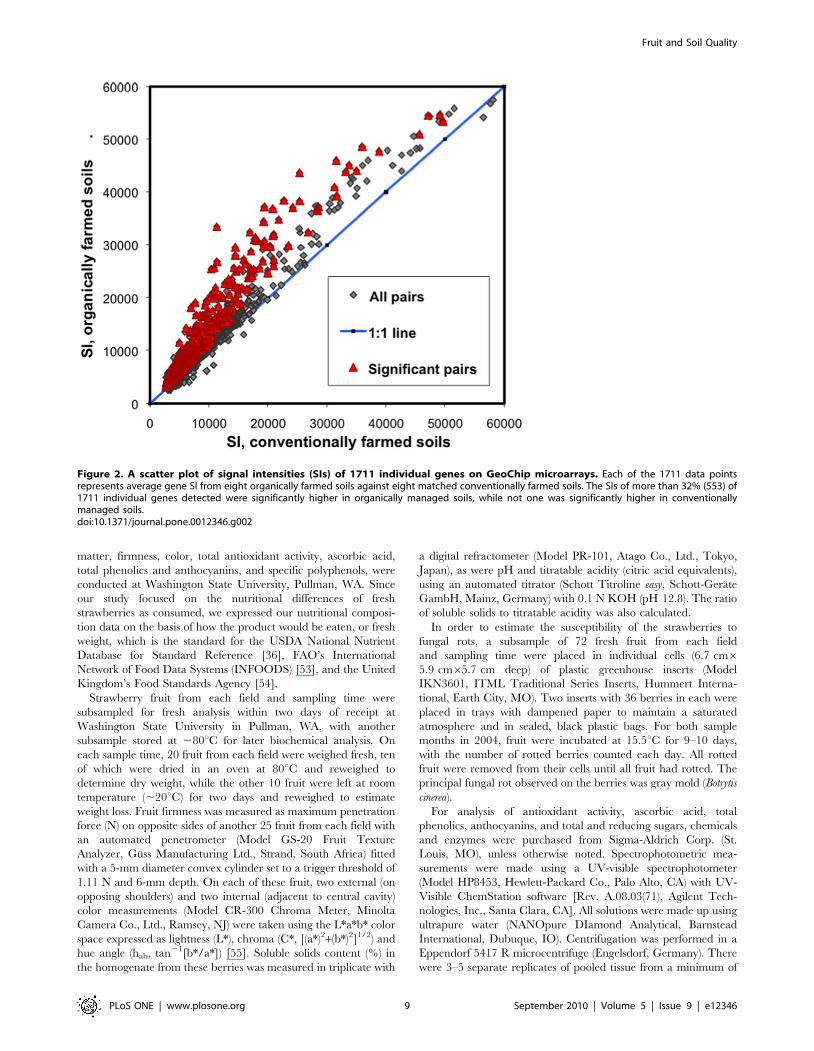
Mean DNA microarray signal intensity of total detected genes
was significantly greater in organically managed soils than in
conventionally managed soils (Table 7) [42]. Similarly, mean
signal intensities for the 11 gene functional groups were all signifi-
cantly greater in organically managed soils (Table 7). The signal
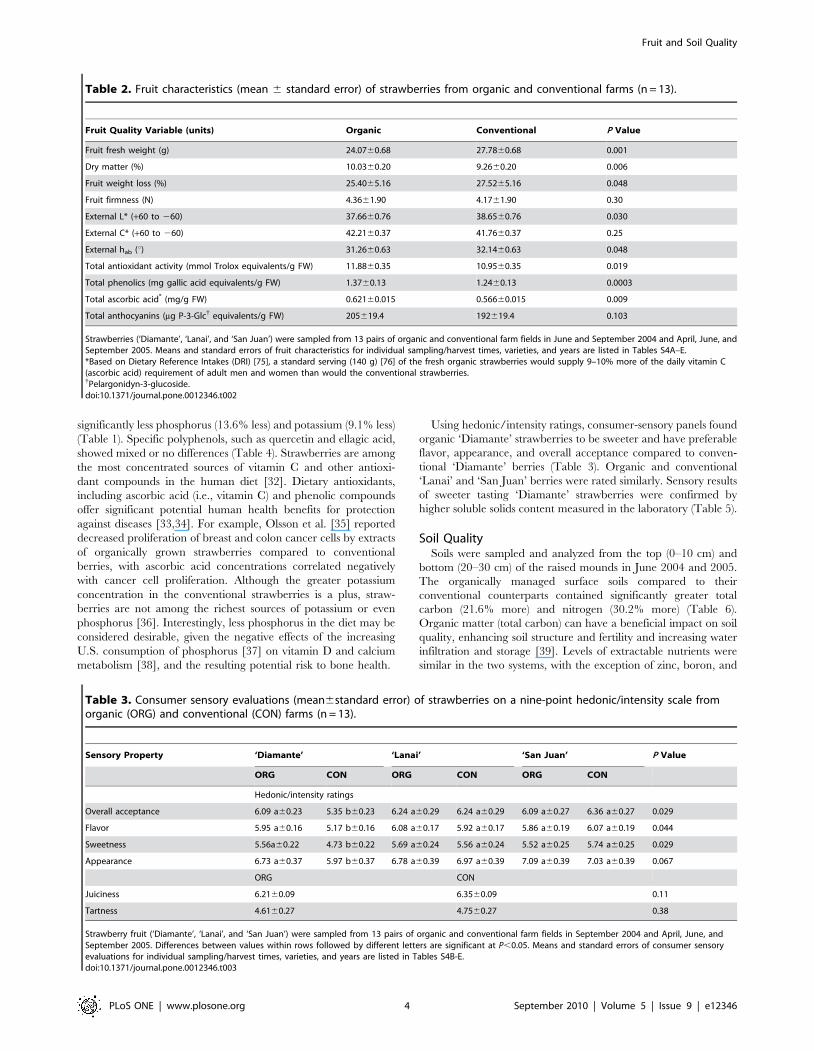
intensities of more than 32% (553) of 1711 individual genes
detected were significantly higher in organically managed soils,
while not one was significantly higher in conventionally managed
soils (Figure 2). Signal intensity is correlated with gene copy
number and dependent on DNA labelling efficiency [26]. Mean
labelling efficiency of DNA from organic and conventional soils
was similar (1.23 and 1.25 mmol Cy 5/ml DNA solution,
respectively, P = 0.78), demonstrating that the detected differences
were not introduced by differing labelling efficiencies and that
functional genes and likely the organisms that carry them were
more abundant in organically managed soils.
Organically managed soils exhibited significantly more endemic
genes (P,0.0001); more specifically, 233 genes were detected only
in the organically managed soils and 2 genes were detected only in
conventionally farmed soils (Table S1). Genetic diversity was also
significantly greater in organically managed soils across all
detected genes (total) and for 10 of the 11 functional groups
(Table 7). Greater diversity within a functional group may simply
be redundant, particularly at high levels of diversity [43].
Conversely, greater diversity may help support the resulting
ecosystem function or biogeochemical process in a broader range
of environmental conditions [44] or in changing environments
[45]. Our findings of greater enzyme activities in organically
managed soils indicate a greater functional capacity. Greater
functional gene abundance in organically managed soils indicates
a larger functional population. Greater functional gene diversity in
organically managed soils suggests that organic systems may also
support more stable or resilient ecosystem functioning.
Some of the 11 functional groups addressed on the GeoChip are
purely prokaryotic functions (e.g., nitrogen fixation, nitrification,
and denitrification), while others are characteristics of both
prokaryotes and eukaryotes (mainly fungi). To ensure that neither
group biased the signal intensity and diversity results for either the
organic or conventional farming systems, we separated out fungal-
and prokaryotic-derived genes into their respective groups and
calculated the ratio of fungi to prokaryotes for gene signal intensity
and diversity in the two agroecosystems. Not only are the fungi
numbers higher for both signal intensity and diversity in the
organic agroecosystems, but so are the prokaryote numbers, too
(Table 7). However, ratios of fungi/prokaryotes for either signal
intensity or diversity are similar for the two farming systems, which
dispels the concern that the data presented selectively favored
prokaryotes over eukaryotes in either the organic or conventional
agroecosystems.
The large differences in soil microbial properties and soil
functional gene abundance and diversity between the organically
and conventionally farmed soils are most likely due to a
combination of factors: chemical fumigation with methyl bromide
of the conventionally farmed soils, lack of synthetic pesticide use on
the organic fields, and double the application rates of compost to the
organic fields compared to the conventional fields (Table S2). A
number of studies have documented changes in microbial diversity
due to fumigants and pesticides [46,47,48], although the majority of
changes were short-term, with microbial populations generally
returning to normal after a few weeks or months. Many of these
studies were conducted using simulated agricultural fumigation in a
laboratory, and nearly all used a single fumigation event with no
regard to past history of fumigation or pesticide use on the studied
soil. Two- to three-year field studies with annual fumigation have
shown methyl bromide to alter some microbial properties and
enzymatic functions but the effects were inconsistent [49,50].
Our study, in which soil samples were taken about 5 to 6 months
after fumigation, was conducted on organic and conventional fields
with longer histories (at least 5 years) of both organic and
conventional (with fumigation) management, likely contributing to
the detection of some persistent effects on the microbial population.
The organic fields also received 20.2–24.6 Mg compost ha21,
almost twice the rate of the conventional fields at 11.2–13.4 Mg
compost ha21 (Table S2). Mader et al. [23] found that soil
amendment with animal manures in organic farming systems
increased microbial biomass and enzyme activity and altered the
structure of the microbial community. Crop rotations likely played a
minor role in the differences in soil properties in our study because
rotations were similar for the organic and conventional agroeco-
systems; that is, the organic and conventional farms used two-year
rotations, in which strawberries were followed by broccoli, lettuce,
or a cover crop in the second year.
Table 5. Soluble solids, titratable acidity (TA), soluble solids/TA ratio, reducing sugars, total sugars, and pH (mean 6 standarderror) of strawberry fruit from organic (ORG) and conventional (CON) farms (n = 13).
Variable ‘Diamante’ ‘Lanai’ ‘San Juan’ P Value
ORG CON ORG CON ORG CON
Soluble solids (ubrix) 8.97 a60.48 7.68 b60.48 8.98 a60.58 9.52 a60.58 8.96 a60.53 8.71 a60.53 0.091
TA (mg citric acid g21 FW) 9.16 a60.20 7.52 bc60.20 7.18 bc60.26 7.51 bc60.26 6.97 c60.24 7.79 b60.24 0.0005
ORG CON
Soluble solids/TA 1.1660.07 1.1460.07 0.62
Reducing sugars (mg Glc g21 FW) 69.162.05 69.462.05 0.93
Total sugars (mg Glc g21 FW) 73.062.38 78.462.38 0.13
pH 3.7760.06 3.8160.06 0.105
Fruit were sampled from 13 pairs of organic and conventional farms in June and September 2004 and April, June, and September 2005. Probabilities (P values) fortreatment x variety interactions for soluble solids and TA and for treatment main effects for the remaining variables are given. Differences among treatments withineach row followed by different letters are significant at P,0.05. Means and standard errors of fruit characteristics for individual sampling/harvest times, varieties, andyears are listed in Tables S4A–E.doi:10.1371/journal.pone.0012346.t005
Fruit and Soil Quality
PLoS ONE | www.plosone.org 6 September 2010 | Volume 5 | Issue 9 | e12346
In summary, the organic strawberries and their soils were of
higher quality compared to their conventional counterparts.
Specifically, the organic strawberries, while having lower concen-
trations of phosphorus and potassium, had higher antioxidant
activity and concentrations of ascorbic acid and phenolic
compounds, longer shelf life, greater dry matter, and, for
‘Diamante’, better taste and appearance. The organically farmed
soils had more carbon and nitrogen, greater microbial biomass
and activity, and greater functional gene abundance and diversity.
This study demonstrates that soil DNA analyses using microarray
technology can be used as an additional measurement of soil
quality. Our sustainability study also demonstrates the benefits of
using an interdisciplinary methodology that comprehensively and
quantitatively compares numerous indices of fruit and soil quality
from multiple, commercial organic and conventional farms,
multiple varieties and soils, and multiple sampling times.
Methods
Study AreaThirteen pairs of side-by-side commercial organic and conven-
tional strawberry farm fields were selected in the Watsonville area,
Table 6. Soil properties (mean 6 standard error) at two depths (0–10 cm and 20–30 cm) from organic and conventionalstrawberry farms (n = 13).
Soil PropertyOrganic(0–10 cm)
Conventional(0–10 cm) P Value
Organic(20–30 cm)
Conventional(20–30 cm) P Value
Sand (g 100 g21 soil) 60.367.9 60.568.2 0.931 61.068.0 59.868.7 0.644
Silt (g 100 g21 soil) 26.864.8 26.465.5 0.619 25.864.9 27.365.7 0.821
Clay (g 100 g21 soil) 13.063.4 13.162.9 0.925 13.263.5 12.963.2 0.384
Nitrate (mg kg21 soil) 46.8612.1 31.667.3 0.402 24.563.9 22.967.0 0.866
Ammonium (mg kg21 soil) 2.860.3 2.960.3 0.105 2.560.2 2.760.3 0.316
Phosphorus (mg kg21 soil) 60.9613.3 64.567.7 0.652 60.1613.5 72.1610.4 0.173
Sulfur (mg kg21 soil) 134630 119638 0.76 119639.4 55.7614.8 0.140
Boron (mg kg21 soil) 0.8860.23 0.7460.25 0.043 0.7160.19 0.7560.30 0.441
Zinc (mg kg21 soil) 2.8860.37 1.9760.12 0.048 2.4260.37 1.8160.24 0.097
Manganese (mg kg21 soil) 4.5260.50 7.6462.01 0.217 3.1360.37 3.6860.47 0.196
Copper (mg kg21 soil) 1.3760.31 1.1760.25 0.216 1.4060.31 1.2360.29 0.291
Iron (mg kg21 soil) 28.663.9 26.865.0 0.064 26.463.4 31.465.4 0.203
Potassium (cmol kg21 soil) 0.660.1 0.560.1 0.194 0.660.1 0.560.1 0.230
Calcium (cmol kg21 soil) 10.762.3 9.762.1 0.165 10.362.5 9.662.2 0.519
Magnesium (cmol kg21 soil) 4.161.1 4.261.3 0.722 3.961.2 4.2061.3 0.695
Sodium (cmol kg21 soil) 0.460.1 0.360.1 0.001 0.360.04 0.360.04 0.858
Total bases (cmol (+) kg21) 15.863.5 14.763.3 0.244 15.163.7 14.663.5 0.841
pH 7.0560.11 7.0960.16 0.953 7.1660.10 7.0960.17 0.694
Buffer capacity pH 7.5160.02 7.5160.03 0.908 7.5360.02 7.5260.03 0.789
EC (mmhos cm21) 2.7260.34 2.1860.39 0.071 2.1360.37 1.5060.22 0.306
Total carbon (g kg21 soil) 10.0460.15 8.2560.12 0.036 9.4360.17 7.7160.13 0.034
Total nitrogen (g kg21 soil) 0.86760.014 0.66660.010 0.009 0.78360.015 0.62560.012 0.010
Readily mineralizable carbon (mg MinC g21 soil) 17.761.1 14.161.2 0.009 14.961.6 11.261.2 0.019
Microbial biomass (mg MicC g21 soil)* 249622.5 9666.8 0.000 211620.5 101612.1 0.042
MicC (% of total carbon)* 2.2160.13 1.3360.26 0.005 2.1660.31 1.5460.37 0.041
MicC MinC21* 16.061.8 8.660.6 0.004 16.863.1 9.360.5 0.049
Basal respiration (mg CO2-C g21 soil h21)* 0.47260.055 0.35460.032 0.009 0.73160.186 0.34860.111 0.009
Dehydrogenase (mg TPF g21 soil) 1.3860.21 0.6560.05 0.000 0.8960.14 0.5260.05 0.000
Acid phosphatase (mg p-nitrophenol g21 soil) 121.5614.1 58.265.6 0.009 104.7637.4{ 53.169.1{ 0.039
Alkaline phosphatase (mg p-nitrophenol g21 soil) 122.3613.0 55.668.5 0.002 84.4617.0{ 47.0613.0{ 0.262
qCO2 (ug CO2-C h21 mg21 MicC)* 1.960.18 3.760.33 0.003 3.560.73 3.460.67 0.838
Protease native (mg amino acid-N g21 soil h21) 2.4160.29 2.8160.36 0.446 2.0860.29{ 1.2560.35{ 0.107
Protease potential (mg amino acid-N g21 soil h21) 4.0660.65 3.4960.32 0.369 3.2160.25{ 2.7860.31{ 0.150
Mycorrhizae total colonized root length (mm)* 122611 104610 0.164 – – –
Soil samples were taken in June 2004 and June 2005, except where noted. Means and standard errors of soil properties for individual years are listed in Tables S5A andB.*Measured in June 2005 only.{Measured in June 2004 only.doi:10.1371/journal.pone.0012346.t006
Fruit and Soil Quality
PLoS ONE | www.plosone.org 7 September 2010 | Volume 5 | Issue 9 | e12346
the dominant strawberry growing region of California, USA. In
turn, California is the leading producer in the U.S., accounting for
87% of the nation’s strawberry production (29). The Watsonville
area annually grows strawberries on about 5,000 hectares,
accounting for about 40% of the strawberry acreage in the state
(29).
The selection of 13 field pairs (5 in 2004 and 8 in 2005) from
commercial strawberry farms was made on the basis of grower
interviews and on-farm field examinations to ensure that all soil-
forming factors, except management, were the same for each field
pair [21]. Each field pair consisted of two side-by-side fields, one
organic and one conventional. Fields chosen in each pair had the
same microclimate, soil profile, soil type, soil classification, and
strawberry variety (Table S3).
Strawberry field pairs in 2004 were different from those in 2005
because both organic and conventional farmers grew strawberries
in alternate years using a similar two-year rotation. More
specifically, all farmers in the study grew strawberries on
constructed, 30-cm high mounded rows covered with plastic
mulch for only one year, preceded by a different crop, such as
broccoli, lettuce, or a cover crop, grown on flat ground (without
mounds) the previous year. Growing strawberries as annuals using
this ‘‘raised-bed plasticulture’’ system is typical of organic and
conventional strawberry growers in California [51]. Growers in
the study transplanted strawberry crowns in November, with
strawberry plants starting to produce fruit in mid-March and
continuing to produce fruit to mid- or end-October.
The organic fields had been certified organic (USDA) for at least
5 years, providing sufficient time for the organic farming practices
to influence soil properties. The organic fields relied only on orga-
nically certified fertilizers and pesticides and no soil fumigation
(Table S2). Both organic and conventional farms applied compost,
with the organic strawberry systems using 20.2–24.6 Mg compost
ha21 and the conventional systems using 11.2–13.4 Mg compost
ha21 (Table S2). These high rates of compost additions along with
organic fertilizer amendments permitted strawberries to be grown
in the two-year rotation described above. The conventional farms
also had been managed conventionally for at least 5 years and
included the use of inorganic and organic fertilizers, synthetic
pesticides, and soil fumigation (methyl bromide with or without
chloropicrin) (Table S2). Conventional strawberry growers in
California typically rely on methyl bromide (with or without
chloropicrin) as an extremely effective broad-spectrum, pre-plant
biocide to kill soil-borne diseases (including fungi and bacteria),
nematodes, soil-dwelling insects, weeds, weed seeds, and under-
ground plant parts [51].
Strawberry Sampling and AnalysesStrawberry (Fragaria x ananassa Duch.) varieties grown on the
study farms included ‘Diamante’ and ‘San Juan’ in 2004 and
‘Diamante’, ‘San Juan’, and ‘Lanai’ in 2005. Strawberry fruit were
collected from each of 13 pairs of organic and conventional
strawberry farm fields in June and September 2004 and April,
June, and September 2005. Commercial pickers harvested and
packed ripe fruit in plastic ‘‘clamshells,’’ just as they would be sold
in retail markets. All strawberries were picked at random from
within 8 to 15 rows and were always a minimum of 20 m from
the boundary within each field pair to avoid edge effects. Within
hours, packed fruit were transported to a refrigerated storage
facility until shipped on commercial refrigerated trucks from
Watsonville, CA to distribution centers in Seattle or Spokane, WA.
These samples were transported under cool conditions to
Washington State University in Pullman, WA, where they were
immediately placed in refrigerated storage.
A subsample of the collected fruit, as well as leaf samples, taken
in April 2005 and June 2004 and 2005, were sent to Soiltest Farm
Consultants Inc. in Moses Lake, WA, where fruit and leaf samples
were analyzed for N, P, K, Ca, Mg, B, and Zn, plus S, Mn, Cu,
and Fe for leaf samples only, according to standard methods [52].
All other strawberry analyses, including shelf life, fresh weight, dry
Table 7. Soil DNA microarray signal intensity and diversity (mean 6 standard error) of total detected genes and gene functionaland organism groups from organic (ORG) and conventional (CON) strawberry farms (n = 8).
Soil Functional Group orOrganism Group Signal Intensity (103) Diversity (Simpson’s Reciprocal Index)
ORG CON P Value ORG CON P Value
Total detected genes 134796874 935061003 0.008 656631 504634 0.015
N fixation 744659 547676 0.018 4461 3862 0.034
Nitrification 262612 201613 0.004 760.3 660.3 0.012
Denitrification 552646 405659 0.029 3362 2663 0.010
Sulfite reduction 529636 368640 0.009 3761 3161 0.004
Pesticide degradation 19706131 13226143 0.006 10464 8164 0.004
Other organic xeno-biotic degradation 39996253 28196296 0.008 193610 146611 0.012
Metal reduction and resistance 25806164 17506164 0.008 11265 8465 0.010
Dehydrogenase 17169 118611 0.004 760.3 660.3 0.245
Urease 621648 394659 0.008 3663 2863 0.031
Cellulase 819660 569665 0.012 5162 4162 0.012
Chitinase 347625 240623 0.016 1661 1260.7 0.024
Fungi 16469 108610 0.003 1764 1363 0.025
Prokaryotes 128186837 90886964 0.008 624629 487633 0.011
Fungi/Prokaryotes Ratio 0.01360.000 0.01260.000 0.323 0.02760.007 0.02760.006 0.343
Functional groups from Reeve et al. [42].doi:10.1371/journal.pone.0012346.t007
Fruit and Soil Quality
PLoS ONE | www.plosone.org 8 September 2010 | Volume 5 | Issue 9 | e12346
matter, firmness, color, total antioxidant activity, ascorbic acid,
total phenolics and anthocyanins, and specific polyphenols, were
conducted at Washington State University, Pullman, WA. Since
our study focused on the nutritional differences of fresh
strawberries as consumed, we expressed our nutritional composi-
tion data on the basis of how the product would be eaten, or fresh
weight, which is the standard for the USDA National Nutrient
Database for Standard Reference [36], FAO’s International
Network of Food Data Systems (INFOODS) [53], and the United
Kingdom’s Food Standards Agency [54].
Strawberry fruit from each field and sampling time were
subsampled for fresh analysis within two days of receipt at
Washington State University in Pullman, WA, with another
subsample stored at 280uC for later biochemical analysis. On
each sample time, 20 fruit from each field were weighed fresh, ten
of which were dried in an oven at 80uC and reweighed to
determine dry weight, while the other 10 fruit were left at room
temperature (,20uC) for two days and reweighed to estimate
weight loss. Fruit firmness was measured as maximum penetration
force (N) on opposite sides of another 25 fruit from each field with
an automated penetrometer (Model GS-20 Fruit Texture
Analyzer, Guss Manufacturing Ltd., Strand, South Africa) fitted
with a 5-mm diameter convex cylinder set to a trigger threshold of
1.11 N and 6-mm depth. On each of these fruit, two external (on
opposing shoulders) and two internal (adjacent to central cavity)
color measurements (Model CR-300 Chroma Meter, Minolta
Camera Co., Ltd., Ramsey, NJ) were taken using the L*a*b* color
space expressed as lightness (L*), chroma (C*, [(a*)2+(b*)2]1/2) and
hue angle (hab, tan21[b*/a*]) [55]. Soluble solids content (%) in
the homogenate from these berries was measured in triplicate with
a digital refractometer (Model PR-101, Atago Co., Ltd., Tokyo,
Japan), as were pH and titratable acidity (citric acid equivalents),
using an automated titrator (Schott Titroline easy, Schott-Gerate
GambH, Mainz, Germany) with 0.1 N KOH (pH 12.8). The ratio
of soluble solids to titratable acidity was also calculated.
In order to estimate the susceptibility of the strawberries to
fungal rots, a subsample of 72 fresh fruit from each field
and sampling time were placed in individual cells (6.7 cm65.9 cm65.7 cm deep) of plastic greenhouse inserts (Model
IKN3601, ITML Traditional Series Inserts, Hummert Interna-
tional, Earth City, MO). Two inserts with 36 berries in each were
placed in trays with dampened paper to maintain a saturated
atmosphere and in sealed, black plastic bags. For both sample
months in 2004, fruit were incubated at 15.5uC for 9–10 days,
with the number of rotted berries counted each day. All rotted
fruit were removed from their cells until all fruit had rotted. The
principal fungal rot observed on the berries was gray mold (Botrytis
cinerea).
For analysis of antioxidant activity, ascorbic acid, total
phenolics, anthocyanins, and total and reducing sugars, chemicals
and enzymes were purchased from Sigma-Aldrich Corp. (St.
Louis, MO), unless otherwise noted. Spectrophotometric mea-
surements were made using a UV-visible spectrophotometer
(Model HP8453, Hewlett-Packard Co., Palo Alto, CA) with UV-
Visible ChemStation software [Rev. A.08.03(71), Agilent Tech-
nologies, Inc., Santa Clara, CA]. All solutions were made up using
ultrapure water (NANOpure DIamond Analytical, Barnstead
International, Dubuque, IO). Centrifugation was performed in a
Eppendorf 5417 R microcentrifuge (Engelsdorf, Germany). There
were 3–5 separate replicates of pooled tissue from a minimum of
Figure 2. A scatter plot of signal intensities (SIs) of 1711 individual genes on GeoChip microarrays. Each of the 1711 data pointsrepresents average gene SI from eight organically farmed soils against eight matched conventionally farmed soils. The SIs of more than 32% (553) of1711 individual genes detected were significantly higher in organically managed soils, while not one was significantly higher in conventionallymanaged soils.doi:10.1371/journal.pone.0012346.g002
Fruit and Soil Quality
PLoS ONE | www.plosone.org 9 September 2010 | Volume 5 | Issue 9 | e12346
five fruit analyzed in each biochemical assay, with duplicate
instrument measurements made on each replicate. Outlying data
were discarded and the tissue reanalyzed.
Antioxidant activity of hydrophilic and lipophilic fractions [56]
in the berries was measured by the end-point 2,29-azino-bis-(3-
ethylbenzthiazoline-6-sulfonic acid) (ABTS)/hydrogen peroxide/
peroxidase (Horseradish peroxidase, HRP, Type VI-A) method of
Cano et al. [57], with modifications. Specifically, 100 mg
powdered, frozen berry tissue was extracted in 700 mL 50 mM
MES (pH 6.0) and 700 mL ethyl acetate, vortexed for 30 sec, and
centrifuged at 13 K rpm for 10 min at 4uC. The organic (top) and
aqueous (bottom) phases were separated with a pipette for
measurement of lipophilic and hydrophilic antioxidant activities
(LAA and HAA, respectively). For both fractions, 40 mL 1 mM
H2O2, 100 mL 15 mM ABTS, and 10 mL 3.3 U mL21 HRP
were placed in 1 mL quartz cuvettes and gently shaken for 10 sec,
after which 830 mL 50 mM phosphate buffer (pH 7.4) was added
and mixed with a stir paddle. Absorbance was monitored at
734 nm on a UV-visible spectrophotometer until stable (,10 sec),
and then 20 mL (for HAA) or 40 mL (for LAA) extract was added,
mixed with a stir paddle, and monitored at 734 nm until
absorbance reached a minimum. HAA and LAA were calculated
from the absorbance difference and expressed on the basis of
Trolox equivalents from standard curves of 5 mM Trolox diluted
in 50 mM MES buffer (pH 6.0) or 100% (v/v) ethyl acetate,
respectively, and measured as described for the samples. HAA and
LAA were summed to estimate total antioxidant activity (TAA).
Total ascorbic acid (reduced AsA plus dehydroascorbic acid,
DHA) in the berries was measured as originally described by Foyer
et al. [58] and modified by Andrews et al. [59]. Specifically, 200 mg
powdered, frozen berry tissue was extracted in 1.5 mL ice-cold
5 M HClO4 by grinding with liquid nitrogen in a mortar and
pestle. Samples were transferred into 2 mL brown, microcentri-
fuge tubes, vortexed for 30 sec, and centrifuged at 13 K rpm for
10 min at 4uC. Into two, 400 mL aliquots of supernatant from
each extract, 200 mL 0.1 M HEPES-KOH buffer (pH 7.0) were
added and mixed, followed by 20–30 mL 5 M K2CO3 to reach
pH 4–5. Following centrifugation, 200 mL supernatant was
reduced by adding 31.8 mL 1 M DL-dithiothreitol (DTT) in
400 mL 100 mM phosphate buffer (pH 5.6), gently shaking and
incubating on ice for 5 min. Absorbance of 100 mL of reduced
extract in 396 mL 100 mM phosphate buffer (pH 5.6) in a
blackened, 0.5 mL quartz cuvette was monitored at 265 nm on a
UV-visible spectrophotometer until stable (,10 sec), and then
4 mL 1 U mL21 ascorbate oxidase (from Cucurbita) was added,
mixed with a stir paddle, and monitored at 265 nm until
absorbance reached a minimum. Concentration of total ascorbic
acid was calculated from the absorbance difference and standard
curves of 5.25 mM dehydro-L-(+)-ascorbic acid dimer reduced
with 265 mL 1 M DTT in 400 mL 100 mM phosphate buffer
(pH 5.6) and monitored at 265 nm as described for the samples.
Total phenolic compounds in the berries were measured with
the Folin-Ciocalteu (F–C) phenol reagent (2 N) according to
revised methods of Singleton et al. [60]. Specifically, to 200 mg
powdered, frozen berry tissue, 1 mL 80% (v/v) methanol was
added in microcentrifuge tubes. Samples were vortexed, allowed
to extract 1 h at room temperature and then overnight at 220uC,
followed by centrifugation at 14 K rpm for 20 min at 4uC. The
supernatants were removed and extraction of the pellet was
repeated 26 as described, with supernatants combined after each
extraction and then made up to 4 mL with 80% (v/v) methanol
after the final extraction. Total phenolic compounds were assayed
by adding 400 mL sample extract into two 15-mL tubes
containing 600 mL 80% (v/v) methanol, 5 mL 10% (v/v) F-C
reagent, and either 4 mL saturated Na2CO3 (75 g L21) or 4 mL
water. Tubes were thoroughly mixed and incubated at room
temperature for 2 h. One-milliliter aliquots from the sample tubes
containing Na2CO3 or water were added to 1.5 mL plastic
cuvettes and the absorbance of each was measured at 760 nm in a
UV-visible spectrophotometer. Concentration of phenolic com-
pounds was determined by subtracting absorbance of samples
containing Na2CO3 from those not containing Na2CO3, quanti-
fied as gallic acid (3,4,5-trihydroxybenzoic acid) equivalents from
standard curves.
For anthocyanins, 0.5 g of powdered, frozen berry tissue was
extracted in 1 mL 1% (v/v) HCl-methanol. After storage for 24 h
at 220uC, sample tubes were centrifuged at 14 K rpm for 10 min
at 4uC. Extraction with HCl-methanol was repeated 26.
Following centrifugation on day four, supernatants were decanted
into 15 mL plastic tubes and made up to 3-mL volumes with HCl-
methanol. Anthocyanin concentrations were determined by
measuring absorbance of 250 mL extract in 750 mL 1% (v/v)
HCl-methanol in 1.4 mL quartz cuvettes at 515 nm with a UV-
visible spectrophotometer [61], expressed as pelargonidyn-3-
glucoside equivalents using Emolar = 3.66106 M21 m21.
Specific polyphenolic compounds were extracted by grinding
0.1 g frozen, powdered fruit tissue in 1.5 mL pure methanol.
Concentrations of aglycones of ellagic acid, quercetin, kaempferol,
phloretin, and naringenin enantiomers were determined, as well as
the total aglycone plus glycoside polyphenols, following enzymatic
hydrolysis with b-glucuronidasefrom Helix pomatia (Type HP-2)
[62,63]. Extracts (150 mL), with daidzein as internal standard (IS),
were injected into a HPLC system (Shimadzu, Kyoto, Japan),
consisting of LC-10AT VP pump, SIL-10AF auto injector, SCL-
10A system controller. Polyphenols were separated isocratically
with a mobile phase of acetonitrile:water:phosphoric acid (v/v/v
42:58:0.01 at 0.6 mL min21 for ellagic acid, quercetin, kaemp-
ferol, and phloretin; 30:70:0.04 at 0.4 mL min21 for naringenin
enantiomers) at 25uC on chiral stationary phase amylose- or
cellulose-coated columns (Chiralcel AD-RH for ellagic acid,
quercetin, kaempferol, and phloretin and Chiralcel OD-RH for
naringenin enantiomers, with 5 mm particle size and
150 mm64.5 mm ID; Chiral Technologies Inc., Exton, PA,
USA), and detected at 370 nm (for ellagic acid, quercetin,
kaempferol, and phloretin) and 292 nm (for naringenin enantio-
mers) on a Shimadzu SPD-M10A VP diode array spectropho-
tometer. Data collection and peak integration were carried out
using Shimadzu EZStart 7.1.1 SP1 software. Individual polyphe-
nols were quantified based on standard curves constructed using
peak area ratio (PAR = PApolyphenol/PAIS) against the concentra-
tion of the standards. Best laboratory practices during sample
analysis followed guidance, based upon the International Confer-
ence on Harmonisation (http://www.ich.org/), for the quantita-
tive analysis of polyphenolic compounds using a validated assay
and commercially available standards, with all samples run in
duplicate with appropriate quality controls [64,65].
Reducing and total sugars were measured by the Nelson-
Somogyi micro-colorimetric method [66], with modifications.
Specifically, 0.1 g frozen berry homogenate was extracted in
1.5 mL pure methanol for 30 min at room temperature, after
vortexing for 30 sec. Total sugars were obtained by adding
150 mL 0.1 M HCl to duplicate tissue samples and allowing
hydrolysis of sugars for 10 min prior to methanol extraction.
Samples were then centrifuged at 14 K rpm for 10 min.
Supernatants (0.2 mL), diluted with 0.8 mL water, were mixed
with 1 mL copper-sulfate reagent in glass tubes with stoppers and
incubated for 10 min in a boiling water bath. After cooling for
5 min, 1 mL arsenomolybdate reagent was added and mixed.
Fruit and Soil Quality
PLoS ONE | www.plosone.org 10 September 2010 | Volume 5 | Issue 9 | e12346
Volumes were adjusted to 10 or 25 mL with deionized water,
depending on color density. Concentrations of reducing and total
sugars were determined by measuring absorbance at 520 nm with
a UV-visible spectrophotometer and quantified by standard curves
of glucose made from stock 1% (w/v) glucose solution in saturated
benzoic acid.
Sensory AnalysesWe also conducted consumer-sensory analyses of strawberries,
including flavor, sweetness, appearance, juiciness, tartness, and
overall acceptance. Strawberries were evaluated by consumer-
sensory panels at four different sampling dates (20 panelists per
field pair in Sept 2004 and 25 panelists per field pair in April,
June, and Sept 2005) at WSU’s Food Science and Human
Nutrition Sensory Laboratory. Panelists were recruited using
advertising from the Washington State University community
based on their availability. A minimum amount of information on
the nature of the study was provided in order to reduce potential
bias. All participants signed an Informed Consent Form per
project approval by the WSU Institutional Review Board.
Each panelist completed a demographic questionnaire prior to
the start of the panel. Fifty-eight percent of the panelists were
females. The age distribution of the panelists was 31% 18–25 years
old, 41% 26–35 years old, 10% 36–45 years old, 13% 46–55 years
old, and ,5% over 55 years old. Over 70% of the panelists ate
fresh strawberries every two weeks to every month, with 19%
eating fresh strawberries every week. The majority of panelists
(59%) preferred fresh strawberries that tasted more sweet than tart
and another 36% preferred them at least equally sweet and tart.
Less than 5% of the panelists preferred them more tart than sweet
or had no preference.
Each consumer received organic and conventional berries from
two, matched field pairs. Consumers were presented with two
strawberry halves from two individual strawberries. Each sample
was presented in a monadic, randomized serving order with
assigned three-digit codes. Each panelist was also provided with
deionized, filtered water and unsalted crackers for cleansing the
palate between samples.
Consumers evaluated each strawberry sample for overall
acceptance, as well as perceived intensity of flavor, juiciness,
sweetness, and sourness using a discrete 9-point, bipolar hedonic/
intensity scale, where 1 = dislike extremely/extremely low intensity
and 9 = like extremely/extremely high intensity, according to ISO
standards for quantitative response scales [67]. These evaluations
were completed under red lights to disguise color differences
between the samples. Following the taste/flavor evaluations, the
lights were changed to white lights and panelists evaluated the
strawberries for acceptance of appearance using the same 9-point
scale.
Statistical Analyses of Strawberry DataMixed model analyses of variance were used to test for
differences in response variable means, except where noted, due
to varieties (‘Diamante’, ‘Lanai’, and ‘San Juan’), treatments
(organic and conventional), and months (April, June, and
September). A split plot model pooled over two years was selected
with variety as the whole plot factor, treatment as the subplot
factor, and month as a repeated measure (SAS Proc Mixed, SAS
Institute, 1999). Transformations were used to improve normality
and homogeneity of variances where necessary. When data were
transformed, LS means were reported in original units. When
significant interactions were identified, differences in simple effect
means were identified using Fisher’s least significant differences.
The same mixed model analysis of variance was applied to
examine sensory data by using the average panel score for each
attribute. The Kaplan-Meier (Product Limit) method was used to
model the survival function and estimate mean survival time, that
is, days to rotting (SAS Proc Lifetest, SAS Institute, 1999). The
generalized Savage (Log-Rank) test for equality of survival
functions was used to test for differences in time to rotting for
organic versus conventional conditions [68].
Soil Sampling and AnalysesSoils were sampled from 30-cm raised mounds at 0–10 cm and
20–30 cm depths in June 2004 and June 2005 and at 0–10 cm in
April 2005. All samples were a composite of 10–15 subsamples
taken at random from within 8 to 15 rows and were always a
minimum of 20 m from the boundary within each field pair to
avoid edge effects. Samples from the June sampling dates were
shipped for chemical analyses to Soiltest Farm Consultants and for
biological analyses to Washington State University by overnight
mail. Samples from the April 2005 sampling were shipped to Oak
Ridge National Lab for microarray analyses and stored at 220uC.
Raw microarray data are in Data S1, S2, S3, and S4 and can also
be found at ,http://www.ornl.gov/cys/MMEresearch.html..
At Soiltest Farm Consultants, soil samples were passed through
a 2-mm sieve, stored at 4uC, and then analyzed for the following
properties according to recommended soil-testing methods by
Gavlak et al. [52]: Nitrate-nitrogen (N) was measured with the
chromotropic acid method; ammonium-N was measured with the
salicylate method; Olsen phosphorus was measured; DTPA-
Sorpitol extractable sulfur, boron, zinc, manganese, copper, and
iron were measured; Soil pH and electrical conductivity were
measured in a 1:1 w/v water saturated paste; SMP soil buffer pH
was measured; NH4OAc extractable potassium, calcium, magne-
sium, and sodium were measured; total bases were calculated by
summation of extractable bases; and particle size (percentage sand,
silt, and clay) was analyzed by the hydrometer method.
At Washington State University, we analyzed total C and N by
combustion using a Leco CNS 2000 (Leco Corporation, St.
Joseph, MI). Readily mineralizable carbon (MinC), basal micro-
bial respiration, and active microbial biomass (MicC) by substrate-
induced respiration were measured according to Anderson and
Domsch [69]. Ten grams of wet weight soil were brought to 12,
18, and 26% moisture content (20.033 MPa), depending on soil
type, and incubated at 24uC for 10 days. Total CO2 released after
10 days was considered MinC. Vials were recapped for 2 h and
the hourly rate measured for microbial respiration. For MicC,
0.5 mL of 12 g L21 aqueous solution of glucose was added to the
same soil samples and rested for 1 h before being recapped for 2 h.
Carbon dioxide was measured in the headspace using a Shimadzu
GC model GC -17A (Shimadzu Scientific Instruments, Columbia,
MD), with a thermal conductivity detector and a 168 mm HaySep
100/120 column. From these microbial properties, we calculated
the metabolic quotient, qCO2 (basal respiration/MicC), and the
two ratios, MicC/MinC and MicC as a percent of total C.
Dehydrogenase enzyme activity was measured using 2.5 g dry
weight soil and acid and alkaline phosphatase enzyme activities
were measured using 1 g dry weight soil as described by Tabatabai
[70]. These enzyme reactions were measured using a Bio-Tek
microplate reader model EL311s (Bio-Tek Instruments, Winooski,
VT). Both native and potential protease enzyme activities were
measured using 1 g dry weight soil according to Ladd and Butler
[71] and measured on a Perkin Elmer Lambda 2 UV/VIS
spectrometer (PerkinElmer Life And Analytical Sciences, Inc,
Waltham, MA) at 700 nm with tyrosine standards. Native protease
represents activity without the addition of casein substrate and
potential protease represents the activity with the addition of
Fruit and Soil Quality
PLoS ONE | www.plosone.org 11 September 2010 | Volume 5 | Issue 9 | e12346
substrate. Arbuscular mycorrhizae were stained with trypan blue
and total and colonized roots estimated using the gridline
intersection method [72].
Statistical Analyses of Soils DataJune comparisons of soil under organic and conventional
management were analyzed as a randomized complete block design
with split plot. Year served as whole plot and treatment as subplot.
The two depth intervals were analyzed separately. All statistics were
analyzed using the SAS system for Windows version 9.1 ANOVA
and LS means (SAS Institute, 1999). Data were checked for model
assumptions and transformed as necessary. When data were
transformed, LS means were reported in original units.
Microarray AnalysesSoil community DNA was extracted using an SDS-based method
[73]. A total of 10 g soil from each organic field and 20 g soil from
each conventional field (due to low yields of DNA) were used. DNA
was purified using a Wizard PCR cleanup system (Promega,
Madison, WI). The cleaned pellet was washed in 500 ml ethanol
(70%) before being resuspended in 20 ml 10 mM Tris (pH 8.0).
Microarray slides were constructed according to methods described
previously [26]. We used a comprehensive functional gene array,
termed GeoChip, containing more than 24,000 oligonucleotide (50-
mer) probes and covering 10,000 genes involved in nitrogen,
carbon, sulfur, and phosphorus transformations and cycling, metal
reduction and resistance, and organic xenobiotic degradation [41].
Microarray genes were analyzed both individually and as 11
functional groups: nitrification, denitrification, nitrogen fixation,
sulfite reduction, pesticide degradation, other organic xenobiotic
degradation, metal reduction and resistance, dehydrogenase,
urease, cellulase, and chitinase.
Thirty to 150 ng purified DNA from each soil was randomly
amplified using rolling circle PCR with a GenomiPhi DNA
amplification kit (GE Healthcare, Piscataway, NJ) [74]. The
amplification product was fluorescently labeled with Cy5 dye with
an extended 6 h incubation time and applied directly to the
microarray. Mean labeling efficiency per treatment was calculated
to ensure no overall bias. Slides and all solutions were kept at 60uCduring assembly to minimize cross contamination. Hybridizations
were carried out at 50uC with 50% formamide [26]. After
hybridization, the slides were immediately placed in wash solution
1 (16SSC and 0.1% SDS) to remove the cover slip and washed by
gentle shaking in solution 1, 2 times for 5 min each; then washed
in solution 2 (0.16SSC and 0.1% SDS), 2 times for 10 min each;
and finally in solution 3 (0.16SSC), 4 times for 1 min each. Arrays
were then dried using compressed air. All arrays were run in
triplicate. The microarrays were scanned using a ScanArray 5000
analysis system (Perkin-Elmer, Wellesley, MA) [26].
Microarray Data Processing and AnalysesMicroarray slide images were converted to TIFF files and
hybridized DNA quantified using ImaGene software 6.0 (Biodis-
covery Inc., Los Angeles, CA) [26]. The signal-to-noise ratio
(SNR) of each probe on each slide was calculated as follows:
SNR = (signal intensity – local background) (standard deviation of
slide background)21. Background refers to the local background
intensity, while the standard deviation was calculated across the
whole slide. Signal intensity data for any gene was removed unless
it appeared with SNR.2 on at least two of three replicate array
hybridizations. When this condition was met, individual SNR
values,2 were retained in order to maintain a continuous data set
for statistical analysis. The array included multiple probes for some
genes; here the strongest signal was retained and weaker ones
deleted. After screening for adequate SNR, signal intensity values
were then used as the data for sample comparison. Signal intensity
values were normalized by averaging across technical replicates
and imported into SAS system for Windows version 9.1 ANOVA
(SAS Institute, Cary, NC) for analysis.
Data were analyzed using a randomized complete block design,
with field pair as block. Average signal intensity for each of the
1711 detected genes, sum of signal intensities for all 1711 detected
genes, and sum of signal intensities for each of the 11 functional
groups from the eight organically farmed soils and the eight
matched conventionally farmed soils were analyzed by paired t-
tests. Gene diversity was calculated overall and for each functional
group using a modified version of Simpson’s Reciprocal Index
[D = 1/[gn(n21)/N(N21)], where n = signal intensity of a single
gene with an SNR.2 and N = sum of all signal intensities with an
SNR.2 on the entire slide]. Diversity values were then analyzed
by a paired t-test. Detected endemic genes were counted based on
treatment means. Proportion comparison z tests were used to
compare proportion of detected endemic genes in each manage-
ment system.
Supporting Information
Table S1 Two gene sequences endemic to conventionally
managed field soils and 233 sequences endemic to organically
managed field soils, and the organisms from which probes were
designed.
Found at: doi:10.1371/journal.pone.0012346.s001 (0.15 MB
DOC)
Table S2 Agrichemical inputs (insecticides, fungicides, herbi-
cides, molluscides, adjuvants, fumigants, and fertilizers) applied to
26 strawberry fields during the 2004 and 2005 growing seasons.
Found at: doi:10.1371/journal.pone.0012346.s002 (0.05 MB
DOC)
Table S3 Strawberry varieties, soil sampling dates, soil types,
and soil classification for field pairs in the study.
Found at: doi:10.1371/journal.pone.0012346.s003 (0.05 MB
DOC)
Table S4 Fruit, leaf, and sensory properties (mean 6 standard
error) for ‘Diamante’ and ‘San Juan’ strawberry cultivars from
organic (ORG) and conventional (CON) farms in June and
September 2004 and April, June, and September 2005.
Found at: doi:10.1371/journal.pone.0012346.s004 (0.32 MB
DOC)
Table S5 Soil properties (mean 6 standard error) at two depths
(0–10 cm and 20–30 cm) from organic and conventional straw-
berry farms in June 2004 and June 2005.
Found at: doi:10.1371/journal.pone.0012346.s005 (0.09 MB
DOC)
Data S1 Raw data for all slides.
Found at: doi:10.1371/journal.pone.0012346.s006 (2.98 MB
CSV)
Data S2 Data by functional groups (SNR.2.0).
Found at: doi:10.1371/journal.pone.0012346.s007 (1.14 MB
CSV)
Data S3 Normalized data by functional groups.
Found at: doi:10.1371/journal.pone.0012346.s008 (0.00 MB
CSV)
Data S4 Normalized data for diversity analysis.
Found at: doi:10.1371/journal.pone.0012346.s009 (0.00 MB
CSV)
Fruit and Soil Quality
PLoS ONE | www.plosone.org 12 September 2010 | Volume 5 | Issue 9 | e12346
Acknowledgments
We thank Tom Sjulin of Driscoll’s Strawberry Associates and Larry
Eddings of Pacific Gold Farms for assistance with farm selection and fruit
processing. We thank Linda Klein, Amit Dhingra, Patricia Ericsson, David
Huggins, Jeff Smith, and two anonymous reviewers for comments on drafts
of this manuscript. We thank Jan Dasgupta, Marc Evans, Gregory Peck,
Sean Swezey, Carolina Torres, Canming Xiao, and Jaime Yanez for
technical assistance.
Author Contributions
Conceived and designed the experiments: JPR PA JR LCB. Performed the
experiments: JPR PA JR LCB CS CR ND. Analyzed the data: JPR PA JR
LCB JRA. Contributed reagents/materials/analysis tools: JPR PA CS CR
ND JZ. Wrote the paper: JPR PA JR LCB. Set up and managed the overall
study: JPR.
References
1. Willer H, Rohwedder M, Wynen E (2009) Current statistics. In: Willer H,
Kilcher L, eds. The World of Organic Agriculture—Statistics and EmergingTrends 2009. Bonn: IFOAM. pp 25–58.
2. Greene C, Dimitri C, Lin B-H, McBride W, Oberholtzer L, et al. (2009)Emerging Issues in the U.S. Organic Industry. Washington, D.C.: USDA
Economic Research Service.
3. Lockie S, Halpin D, Pearson D (2006) Understanding the market for organic
food. In: Kristiansen P, Taji A, Reganold J, eds. Organic Agriculture: A GlobalPerspective. Collingwood: CSIRO Publishing. pp 245–258.
4. Baker BP, Benbrook CM, Groth E, III, Benbrook KL (2002) Pesticide residues
in conventional, integrated pest management (IPM)-grown and organic foods:
insights from three US data sets. Food Addit Contam 19: 427–446.
5. Curl CL, Fenske RA, Elgethun K (2003) Organophosphorus pesticide exposureof urban and suburban preschool children with organic and conventional diets.
Environ Health Persp 111: 377–382.
6. Lu C, Toepel K, Irish R, Fenske RA, Barr DB, Bravo R (2006) Organic diets
significantly lower children’s dietary exposure to organophosphorus pesticides.Environ Health Persp 114: 260–263.
7. Drewnowski A (2005) Concept of a nutritious food: toward a nutrient densityscore. Am J Clin Nutr 82: 721–32.
8. Scalbert A, Johnson IT, Saltmarsh M (2005) Polyphenols: antioxidants and
beyond. Am J Clin Nutr 81(suppl): 215S–217S.
9. Soil Association (2000) Organic Farming, Food Quality and Human Health: A
Review of the Evidence. Bristol: Soil Associatioin.
10. Brandt K, Molgaard JP (2001) Organic agriculture: does it enhance or reduce
the nutritional value of plant foods? J Sci Food Agr 81: 924–931.
11. Worthington V (2001) Nutritional quality of organic versus conventional fruits,
vegetables, and grains. J Altern Complem Med 7: 161–173.
12. Williams CM (2002) Nutritional quality of organic food: shades of grey or shadesof green? Proc Nutrition Soc 61: 19–24.
13. Magkos F, Arvaniti F, Zampelas A (2003) Organic food: Nutritious food or foodfor thought? A review of the evidence. Int J Food Sci Nutr 54: 357–371.
14. Rembialkowska E (2007) Quality of plant products from organic agriculture. J SciFood Agric 87: 2757–2762.
15. Benbrook C, Zhao X, Yanez J, Davies N, Andrews P (2008) New Evidence
Confirms the Nutritional Superiority of Plant-Based Organic Foods. Boulder:
The Organic Center, Available: www.organiccenter.org. Accessed on 2009 Oct29.
16. Lairon D (2010) Nutritional quality and safety of organic food. A review. Agron
Sustain Dev 30: 33–41.
17. Bourn D, Prescott J (2002) A comparison of the nutritional value, sensory
qualities, and food safety of organically and conventionally produced foods. CritRev Food Sci 42: 1–34.
18. Dangour AD, Dodhia SK, Hayter A, Allen E, Lock K, et al. (2009) Nutrionalquality of organic foods: a systematic review. Am J Clin Nutr 90: 680–685.
19. Doran JW, Parkin TB (1994) Defining and assessing soil quality. In: Doran JW,
Coleman DC, Bezdicek DF, Stewart BA, eds. Defining Soil Quality for a
Sustainable Environment. Madison: Soil Sci Soc Stet Am. pp 3–21.
20. Granatstein D, Bezdicek DF (1992) The need for a soil quality index: local andregional perspectives. Am J Alt Agric 7: 12–16.
21. Reganold JP, Palmer AS, Lockhart JC, Macgregor AN (1993) Soil quality andfinancial performance of biodynamic and conventional farms in New Zealand.
Science 260: 344–349.
22. Reganold JP, Glover JD, Andrews PK, Hinman HR (2001) Sustainability of
three apple production systems. Nature 410: 926–930.
23. Mader P, Fleissbach A, Dubois D, Gunst L, Fried P, et al. (2002) Soil fertility and
biodiversity in organic farming. Science 296: 1694–1697.
24. Trewavas A (2004) A critical assessment of organic farming-and-food assertionswith particular respect to the UK and the potential environmental benefits of no-
till agriculture. Crop Prot 23: 757–781.
25. Ibekwe AM (2004) Effects of fumigants on non-target organisms in soils. Adv
Agron 83: 1–35.
26. Rhee S-K, Liu X, Wu L, Chong SC, Wan X, et al. (2004) Detection of genes
involved in biodegradation and biotransformation in microbial communities byusing 50-mer oligonucleotide microarrays. Appl Environ Microb 70: 4303–4317.
27. He Z, Gentry TJ, Schadt CW, Wu L, Liebich J, et al. (2007) GeoChip: Acomprehensive microarray for investigating biogeochemical, ecological and
environmental processes. ISME J 1: 67–77.
28. van Eijk T (2000) Holism and FSR. In: Collinson M, ed. A History of Farming
Systems Research. Wallingford: CABI Publishing. pp 323–334.
29. California Strawberry Commission (2009) California Strawberry Commision
Website. Available: www.calstrawberry.com/. Accessed on 2009 Nov 27.
30. Food and Agriculture Organization (2009) FAOSTAT. Rome: United Nations.
Available: http://faostat.fao.org/site/567/default.aspx#ancor. Accessed on
2009 Nov 11.
31. Adaskaveg JD, Gubler D, Michailides T, Holtz B (2009) Efficacy and Timing of
Fungicides, Bactericides, and Biologicals for Deciduous Tree Fruit, Nut,
Strawberry, and Vine Crops 2009. University of California Online Statewide
IPM Program. Available: http://cemadera.ucdavis.edu/files/63413.pdf). Ac-
cessed on 2009 Oct 24.
32. Chun OK, Kim D-O, Smith N, Schroeder D, Han JT, et al. (2005) Daily
consumption of phenolics and total antioxidant capacity from fruit and
vegetables in the American diet. J Sci Food Agric 85: 1715–1724.
33. World Health Organization and Food and Agriculture Organization (2004)
Vitamin and Mineral Requirements in Human Nutrition, 2nd ed. Bangkok:
WHO/FAO Publication.
34. Halliwell B, Rafter J, Jenner A (2005) Health promotion by flavonoids,
tocopherols, tocotrienols, and other phenols: Direct or indirect effects?
Antioxidant or not? Am J Clin Nutr 81: 268S–276S.
35. Olsson ME, Andersson CS, Oredsson S, Berglund RH, Gustavsson K-E (2006)
Antioxidant levels and inhibition of cancer cell proliferation in vitro by extracts
from organically and conventionally cultivated strawberries. J Agric Food Chem
54: 1248–1255.
36. USDA Agricultural Research Service (2009) USDA National Nutrient Database
for Standard Reference, Release 22. Nutrient Data Laboratory Online.
Available: http://www.ars.usda.gov/ba/bhnrc/ndl. Accessed on 2010 June 2.
37. Standing Committee on the Scientific Evaluation of Dietary Reference Intakes,
Food and Nutrition Board, Institute of Medicine (1997) Dietary Reference
Intakes for Calcium, Phosphorus, Magnesium, Vitamin D, and Fluoride.
Washington, D.C.: National Academies Press.
38. Bringhurst FR, Demay MB, Kronenberg HM (1998) Hormones and disorders of
mineral metabolism. In: Wilson JD, Foster DW, Kronenberg HM, Larsen PR,
eds. Williams Textbook of Endocrinology. 9th edn. Philadelphia: W.B. Saunders
Company. pp 1155–1210.
39. Weil RR, Magdoff F (2004) Significance of soil organic matter to soil quality and
health. In: Magdoff F, Weil RR, eds. Soil Organic Matter in Sustainable
Agriculture. Boca Raton: CRC Press. pp 1–43.
40. Smith JL (2002) Soil quality: The role of microorganisms. In: Bitton G, ed.
Encyclopedia of Environmental Microbiology. New York: Wiley. pp 2944–2957.
41. Zhou J, Kang S, Schadt CW, Garten CT, Jr. (2008) Spatial scaling of functional
gene diversity across various microbial taxa. Proc Natl Acad Sci U S A 105:
7768–7773.
42. Reeve JR, Schadt CW, Carpenter-Boggs L, Kang S, Zhou J, et al. (2010) Effects
of soil type and farm management on soil ecological functional genes and
microbial activities. ISME J doi:10.1038/ismej.2010.42.
43. Andren O, Bengtsson J, Clarholm M (1995) Biodiversity and species redundancy
among litter decomposers. In: Collins HP, Robertson GP, Klug MJ, eds. The
Significance and Regulation of Soil Biodiversity. Dordrecht: Kluwer. pp
141–151.
44. Zak DR, Blackwood CB, Waldrop MP (2006) A molecular dawn for
biogeochemistry. Trends Ecol Evol 21: 288–295.
45. Loreau M, Naeem S, Inchausti P, Bengtsson J, Grime JP, et al. (2001)
Biodiversity and ecosystem functioning: Current knowledge and future
challenges. Science 294: 804–808.
46. Zelles L, Palojarvi A, Kandeler E, von Lutzow M, Winter K, et al. (1997)
Changes in soil microbial properties and phospholipid fatty acid fractions after
chloroform fumigation. Soil Biol Biochem 29: 1325–1336.
47. Engelen B, Meinken K, von Wintzingerode F, Heuer H, Malkomes H-P, et al.
(1998) Monitoring impact of a pesticide treatment on bacterial soil communities
by metabolic and genetic fingerprinting in addition to conventional testing
procedures. Appl Environ Microbiol 64: 2814–2821.
48. Ibekwe AM, Papiernik SK, Gan J, Yates SR, Yang C-H, et al. (2001) Impact of
fumigants on soil microbial communities. Appl Environ Microbiol 67:
3245–3257.
49. Klose S, Ajwa HA (2004) Enzyme activities in agricultural soils fumigated with
methyl bromide alternatives. Soil Biol Biochem 36: 1625–1635.
50. Stromberger ME, Klose S, Ajwa H, Trout T, Fennimore S (2005) Microbial
populations and enzyme activities in soils fumigated with methyl bromide
alternatives. Soil Sci Soc Am J 69: 1987–1999.
Fruit and Soil Quality
PLoS ONE | www.plosone.org 13 September 2010 | Volume 5 | Issue 9 | e12346
51. Guerena M, Born H (2007) Strawberries: Organic Production. Fayetteville:
ATTRA, Available: www.attra.ncat.org/attra-pub/PDF/strawberry.pdf. Ac-cessed on 2009 November 25.
52. Gavlak R, Horneck D, Miller RO, Kotuby-Amacher J (2003) Soil, Plant and
Water Reference Methods for the Western Region, 2nd edn. (WCC-103Publication). Ft. Collins: Colorado State University.
53. Truswell AS, Bateson DJ, Madafiglio KC, Pennington JAT, Rand WM, et al.(1991) INFOODS guidelines for describing foods: A systematic approach to
describing foods to facilitate international exchange of food composition data.
J Food Comp Anal 4: 18–38.54. McCance RA, Widdowson EM (2002) The Composition of Foods, 6th Summary
Edn. Cambridge: Royal Society of Chemistry.55. McGuire R (1992) Reporting of objective color measurements. HortScience 27:
1254–1255.56. Arnao MB, Cano A, Acosta M (2001) The hydrophilic and lipophilic
contribution to total antioxidant activity. Food Chem 73: 239–244.
57. Cano A, Hernandez-Ruız J, Garcıa-Canovas F, Acosta M, Arnao MB (1998) Anend-point method for estimation of the total antioxidant activity in plant
material. Phytochem Analysis 9: 196–202.58. Foyer CH, Rowell J, Walker D (1983) Measurements of the ascorbate content of
spinach leaf protoplasts and chloroplasts during illumination. Planta 157:
239–244.59. Andrews PK, Fahy DA, Foyer CH (2004) Relationships between fruit exocarp
antioxidants in the tomato (Lycopersicon esculentum) high pigment-1 mutantduring development. Physiol Plantarum 120: 519–528.
60. Singleton VL, Orthofer R, Lameula-Raventos RM (1999) Analysis of totalphenols and other oxidation substrates and antioxidants by means of Folin-
Ciocalteu reagant. Method Enzymol 299: 152–179.
61. Woodward JR (1972) Physical and chemical changes in developing strawberryfruits. J Sci Food Agric 23: 465–473.
62. Torres CA, Davies NM, Yanez JA, Andrews PK (2005) Disposition of selectedflavonoids in fruit tissues of various tomato (Lycopersicon esculentum Mill.)
genotypes. J Agric Food Chem 53: 9536–9543.
63. Yanez JA, Davies NM (2005) Stereospecific high-performance liquid chromato-graphic analysis of naringenin in urine. J Pharm Biomed Anal 39: 164–169.
64. Branch SK (2005) Guidelines from the International Conference on Harmo-nisation (ICH). J Pharm Biomed Anal 38: 798–805.
65. Boulanger B, Rozet E, Moonen F, Rudaz S, Hubert P (2009) A risk-based
analysis of the AAPS conference report on quantitative bioanalytical methodsvalidation and implementation. J Chromatog B 877: 2235–2243.
66. Southgate DAT (1976) Determination of Food Carbohydrates. London: Applied
Science Publishers.67. International Organization for Standardization (ISO) (2003) Sensory Analysis—
Guidelines for the Use of Quantitative Response Scales, 2nd edn. (Reference No.ISO 4121:2003). Geneva: ISO.
68. Kalbfleisch JD, Prentice RL (1980) The Statistical Analysis of Failure Time
Data. New York: Wiley.69. Anderson JPE, Domsch KH (1978) A physiological method for the quantitative
measurement of microbial biomass in soil. Soil Biol Biochem 10: 215–221.70. Tabatabai MA (1994) Soil enzymes. In: Weaver RW, Angle S, Bottomley P,
Bezdicek D, Smith S, et al. (1994) Methods of Soil Analysis. Part 2,Microbiological and Biochemical Properties. Madison: Soil Sci Soc Am. pp
775–833.
71. Ladd JN, Butler JHA (1972) Short-term assays of soil proteolytic enzymeactivities using proteins and dipeptide derivatives as substrates. Soil Biol
Biochem 4: 19–30.72. Sylvia DM (1994) Vesicular-arbuscular mycorrhizal fungi. In: Weaver RW,
Angle S, Bottomley P, Bezdicek D, Smith S, et al. (1994) Methods of Soil
Analysis. Part 2, Microbiological and Biochemical Properties. Madison: Soil SciSoc Am. pp 351–378.
73. Zhou J, Bruns MA, Tiedje JM (1996) DNA recovery from soils of diversecomposition. Appl Environ Microbiol 62: 316–322.
74. Wu L, Liu X, Schadt CW, Zhou J (2006) Microarray-based analysis ofsubnanogram quantities of microbial community DNAs by using whole-
community genome amplification. Appl Environ Microbiol 72: 4931–4941.
75. Otten JJ, Hellwig JP, Meyers LD, eds. (2006) Dietary Reference Intakes: TheEssential Guide to Nutrient Requirements. Washington, D.C: National
Academies Press.76. U.S. Food and Drug Administration (1994) Reference amounts customarily
consumed per eating occasion, Title 21 CFR Section 101.12(b). In: Nutritional
Labeling and Education Act (NLEA) Requirements, Serving Size [21 CFR101.9(b)(1)]. Available: http://ecfr.gpoaccess.gov/cgi/t/text/text-idx?
c=ecfr&rgn=div8&view=text&node=21:2.0.1.1.2.1.1.8&idno=21. Accessed2010 May 18.
Fruit and Soil Quality
PLoS ONE | www.plosone.org 14 September 2010 | Volume 5 | Issue 9 | e12346


