Embed Size (px)
Citation preview

Plants 2021, 10, 1148. https://doi.org/10.3390/plants10061148 www.mdpi.com/journal/plants
Article
Fruit Characteristics, Peel Nutritional Compositions, and Their
Relationships with Mango Peel Pectin Quality
Malaiporn Wongkaew 1,2,3, Sila Kittiwachana 4, Nutthatida Phuangsaijai 4, Bow Tinpovong 2, Chantalak Tiyayon 5,
Tonapha Pusadee 5, Bajaree Chuttong 6,7, Korawan Sringarm 8, Farhan M. Bhat 9, Sarana Rose Sommano 3,5,* and
Ratchadawan Cheewangkoon 6,8,*
1 Interdisciplinary Program in Biotechnology, Graduate School, Chiang Mai University, Chiang Mai 50200,
Thailand; [email protected] 2 Program of Food Production and Innovation, Faculty of Integrated Science and Technology, Rajamangala
University of Technology Lanna, Chiang Mai 50300, Thailand; [email protected] 3 Plant Bioactive Compound Laboratory, Faculty of Agriculture, Chiang Mai University, Chiang Mai 50200,
Thailand 4 Department of Chemistry, Faculty of Science, Chiang Mai University, Chiang Mai 50200, Thailand;
[email protected] (S.K.); [email protected] (N.P.)�5 Department of Plant and Soil Sciences, Faculty of Agriculture, Chiang Mai University, Chiang Mai 50200,
Thailand; [email protected] (C.T.); [email protected] (T.P.) 6 Department of Entomology and Plant Pathology, Faculty of Agriculture, Chiang Mai University,
Chiang Mai 50200, Thailand; [email protected] 7 Innovative Agriculture Research Center, Faculty of Agriculture, Chiang Mai University, Chiang Mai 50200,
Thailand 8 Department of Animal and Aquatic Science, Facuslty of Agriculture, Chiang Mai University,
Chiang Mai 50200, Thailand; [email protected] 9 Department of Food Engineering and Technology, Sant Longowal Institute of Engineering and Technology,
Longowal, Punjab 148106, India; [email protected]
* Correspondence: [email protected] (S.R.S.); [email protected] (R.C.); Tel.: +66‐5394‐4040 (S.R.S.)
Abstract: Mango peel, a byproduct from the mango processing industry, is a potential source of
food‐grade mango peel pectin (MPP). Nonetheless, the influence of fruit physical characteristics and
phytochemicals of peels on their correspondent pectin level has never been examined, particularly
when high‐quality food additives are of commercial need. Subsequently, the ultimate aim of the
present study was to comprehend their relationship using chemometric data analyses as part of raw
material sourcing criteria. Principal component analysis (PCA) advised that mangoes of ‘maha‐
chanok’ and ‘nam dok mai’ could be distinguished from ‘chok anan’ and ‘kaew’ on the basis of
physiology, peel morphology, and phytochemical characteristics. Only pectin extracted from
mango var. ‘chok anan’ was classified as low‐methoxyl type (Mox value ~4%). Using the partial
least‐squares (PLS) regression, the multivariate correlation between the fruit and peel properties
and the degree of esterification (DE) value was reported at R2 > 0.9 and Q2 > 0.8. The coefficient
factors illustrated that yields of byproducts such as seed and total biomass negatively influenced
DE values, while they were positively correlated with crude fiber and xylose contents of the peels.
Overall, it is interesting to highlight that, regardless of the differences in fruit varieties, the amount
of biomass and peel proximate properties can be proficiently applied to establish classification of
desirable properties of the industrial MPP.�
Keywords: biomass valorization; fruit physiology; fruit peel pectin; microwave‐assisted extraction;
partial least‐squares regression
1. Introduction
Mango, the king of fruits with high nutritive value, is extensively cultivated in the
tropical and subtropical regions [1]. It is one of the most important commercial fruit crops
Citation: Wongkaew, M.;
Kittiwachana, S.; Phuangsaijai, N.;
Tinpovong, B.; Tiyayon, C.;
Pusadee, T.; Chuttong, B.;
Sringarm, K.; Bhat, F.M.;
Sommano, S.R.; et al. Fruit
Characteristics, Peel Nutritional
Compositions and Their
Relationships with Mango Peel
Pectin�Quality. Plants 2021, 10, 1148. https://doi.org/10.3390/
plants10061148
Academic Editor: Enrico Doria
Received: 10 May 2021
Accepted: 31 May 2021
Published: 4 June 2021
Publisher’s Note: MDPI stays neu‐
tral with regard to jurisdictional
claims in published maps and institu‐
tional affiliations.
Copyright: © 2021 by the authors. Li‐
censee MDPI, Basel, Switzerland.
This article is an open access article
distributed under the terms and con‐
ditions of the Creative Commons At‐
tribution (CC BY) license (http://crea‐
tivecommons.org/licenses/by/4.0/).

Plants 2021, 10, 1148 2 of 19
worldwide in terms of production, processing, and consumption [2,3]. In Thailand, ap‐
proximately 300,000 tons of local varieties such as ‘mahachanok’, ‘chok anan’, ‘nam dok
mai’, and ‘kaew’ mangoes, especially those of ripe fruits, are used for food processing [4].
The commercially processed products include preserved canned fruits, frozen slices, pu‐
rée, juices, nectar, and various dehydrated products [5,6]. During processing, it is esti‐
mated that almost 200,000 tons of food loss is generated, and mango peels account for as
much as 24% of those volumes [7]. More importantly, poor management of this industrial
loss could have a great impact on the environment; therefore, attempts have been made
in order to add value to these byproducts such as biomass from mango processing [8–11].
Mango peel is a potential source of dietary fiber, and it contains 5–11% pectin de‐
pending on fruit varieties and the extraction methods [12–15]. Additionally, it comprises
various classes of polyphenols, carotenoids, and vitamins with excellent antioxidative and
functional properties [16,17]. Therefore, this byproduct is a promising target for commer‐
cial valorization [18,19]. Previous reports indicated that the peel contains high contents of
carbohydrates (80%), crude fiber (8%), and pectin (13%), as well as reasonable quantities
of proteins (4%) and fats (2%) [20,21]. Pectin is a structural heteropolysaccharide found in the primary cell walls that pro‐
vides mechanical strength and flexibility via interaction with other cell‐wall components
[22]. High contents of pectin can be found in almost all parts of fruits depending on the
varieties and maturity stages [23–27]. The major constituent of pectin is poly (1,4)‐α‐D‐
galacturonan as a backbone with the carboxyl groups presenting in either free acid or me‐
thyl ester forms [28]. Pectin can be categorized into two classes according to the propor‐
tion of the esterified groups into low‐methoxyl pectin (LMP) (DE < 50%) and high‐meth‐
oxyl pectin (HMP) (DE > 50%). The latter is an excellent emulsifier and stabilizer which
can be used as a gelling agent and thickening agent [29–31]. It is also used as a fat replacer
and health‐promoting functional food ingredient [10,32]. Additionally, pectin can be
added to pharmaceutical products such as bioactive components, drug and gene delivery
compounds, tissue engineering products, and wound healing patches [33].
To recover pectin from plant resources, microwave‐assisted extraction (MAE) is more
effective for the extraction of high‐quality pectin than conventional heating [34–37]. Such
a technique has been implemented in the recovery of pectin from dietary‐rich biomasses
such as banana peels [38] and orange peels [39], and it has shown greater success when
applied to mango peels [11,12,40]. It is believed that the quality of raw materials is fore‐
most responsible for the extractable quality of the pectin. Nevertheless, the relationship
between the physicochemical properties of fruit and peel along and the chemical qualities
of the pectin has never been reported, especially to develop an index for raw material
sourcing. With this rationale, the objectives of the present study were first to evaluate the
physiological and physicochemical characteristics along with the proximate values of
mango peels from commercially available mango varieties. Then, their relationships with
the chemical qualities of the MAE‐extracted mango peel pectin (MPP) were evaluated.
The research outcomes will be beneficial for setting up the selection criteria of the biolog‐
ical materials for MPP production on a substantial scale.
2. Results and Discussion
2.1. Physical Characteristics of Mango Fruit Varieties
The physical characteristics of the mango fruits are illustrated in Table 1, including
color (L*, a*, b*), arithmetic mean diameter (Da), geometric mean diameter (Dg), aspect
ratio (Ra), sphericity (Φ), surface area (S), peel‐to‐fruit ratio, and the percentage of peel,
flesh, and seed.
Plants 2021, 10, 1148 3 of 19
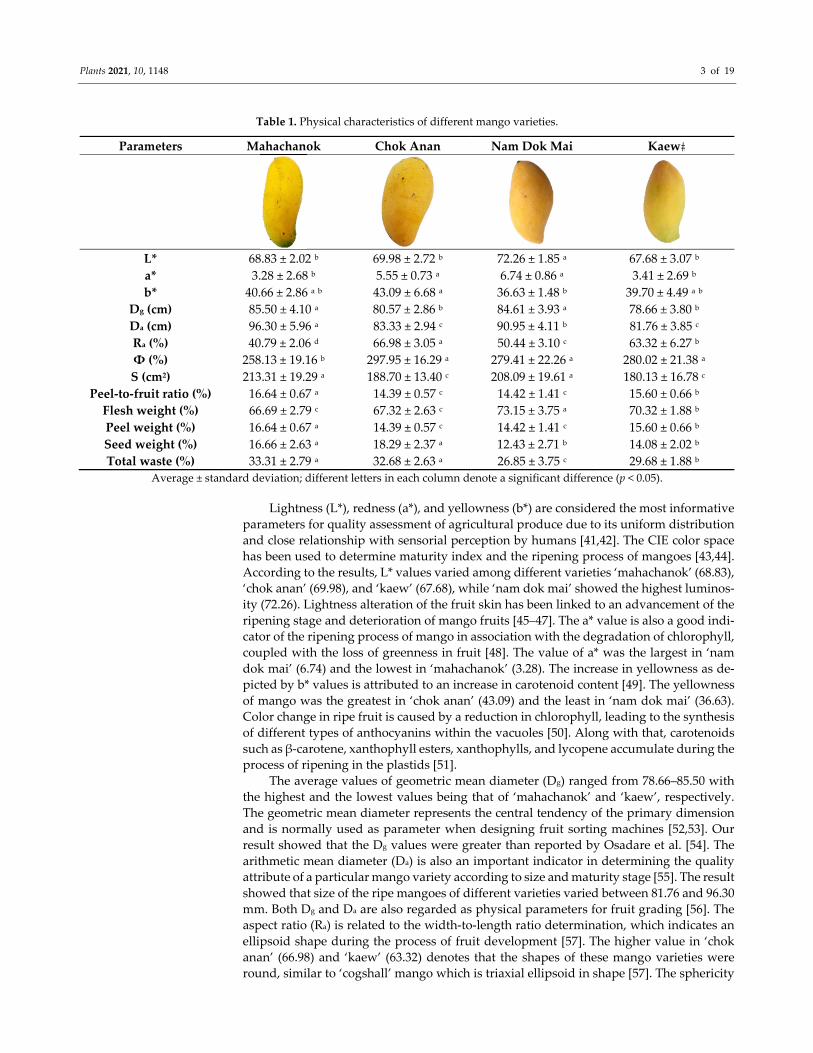
Table 1. Physical characteristics of different mango varieties.
Parameters Mahachanok Chok Anan Nam Dok Mai Kaew�
L* 68.83 ± 2.02 b 69.98 ± 2.72 b 72.26 ± 1.85 a 67.68 ± 3.07 b
a* 3.28 ± 2.68 b 5.55 ± 0.73 a 6.74 ± 0.86 a 3.41 ± 2.69 b
b* 40.66 ± 2.86 a b 43.09 ± 6.68 a 36.63 ± 1.48 b 39.70 ± 4.49 a b
Dg (cm) 85.50 ± 4.10 a 80.57 ± 2.86 b 84.61 ± 3.93 a 78.66 ± 3.80 b
Da (cm) 96.30 ± 5.96 a 83.33 ± 2.94 c 90.95 ± 4.11 b 81.76 ± 3.85 c
Ra (%) 40.79 ± 2.06 d 66.98 ± 3.05 a 50.44 ± 3.10 c 63.32 ± 6.27 b
Φ (%) 258.13 ± 19.16 b 297.95 ± 16.29 a 279.41 ± 22.26 a 280.02 ± 21.38 a
S (cm2) 213.31 ± 19.29 a 188.70 ± 13.40 c 208.09 ± 19.61 a 180.13 ± 16.78 c
Peel‐to‐fruit ratio (%) 16.64 ± 0.67 a 14.39 ± 0.57 c 14.42 ± 1.41 c 15.60 ± 0.66 b
Flesh weight (%) 66.69 ± 2.79 c 67.32 ± 2.63 c 73.15 ± 3.75 a 70.32 ± 1.88 b
Peel weight (%) 16.64 ± 0.67 a 14.39 ± 0.57 c 14.42 ± 1.41 c 15.60 ± 0.66 b
Seed weight (%) 16.66 ± 2.63 a 18.29 ± 2.37 a 12.43 ± 2.71 b 14.08 ± 2.02 b
Total waste (%) 33.31 ± 2.79 a 32.68 ± 2.63 a 26.85 ± 3.75 c 29.68 ± 1.88 b
Average ± standard deviation; different letters in each column denote a significant difference (p < 0.05).
Lightness (L*), redness (a*), and yellowness (b*) are considered the most informative
parameters for quality assessment of agricultural produce due to its uniform distribution
and close relationship with sensorial perception by humans [41,42]. The CIE color space
has been used to determine maturity index and the ripening process of mangoes [43,44].
According to the results, L* values varied among different varieties ‘mahachanok’ (68.83),
‘chok anan’ (69.98), and ‘kaew’ (67.68), while ‘nam dok mai’ showed the highest luminos‐
ity (72.26). Lightness alteration of the fruit skin has been linked to an advancement of the
ripening stage and deterioration of mango fruits [45–47]. The a* value is also a good indi‐
cator of the ripening process of mango in association with the degradation of chlorophyll,
coupled with the loss of greenness in fruit [48]. The value of a* was the largest in ‘nam
dok mai’ (6.74) and the lowest in ‘mahachanok’ (3.28). The increase in yellowness as de‐
picted by b* values is attributed to an increase in carotenoid content [49]. The yellowness
of mango was the greatest in ‘chok anan’ (43.09) and the least in ‘nam dok mai’ (36.63).
Color change in ripe fruit is caused by a reduction in chlorophyll, leading to the synthesis
of different types of anthocyanins within the vacuoles [50]. Along with that, carotenoids
such as β‐carotene, xanthophyll esters, xanthophylls, and lycopene accumulate during the
process of ripening in the plastids [51].
The average values of geometric mean diameter (Dg) ranged from 78.66–85.50 with
the highest and the lowest values being that of ‘mahachanok’ and ‘kaew’, respectively.
The geometric mean diameter represents the central tendency of the primary dimension
and is normally used as parameter when designing fruit sorting machines [52,53]. Our
result showed that the Dg values were greater than reported by Osadare et al. [54]. The
arithmetic mean diameter (Da) is also an important indicator in determining the quality
attribute of a particular mango variety according to size and maturity stage [55]. The result
showed that size of the ripe mangoes of different varieties varied between 81.76 and 96.30
mm. Both Dg and Da are also regarded as physical parameters for fruit grading [56]. The
aspect ratio (Ra) is related to the width‐to‐length ratio determination, which indicates an
ellipsoid shape during the process of fruit development [57]. The higher value in ‘chok
anan’ (66.98) and ‘kaew’ (63.32) denotes that the shapes of these mango varieties were
round, similar to ‘cogshall’ mango which is triaxial ellipsoid in shape [57]. The sphericity

Plants 2021, 10, 1148 4 of 19
that provides an indication of the tendency of shape varied from 258.13–297.95. The high
sphericity of ‘chok anan’ showed its tendency of the morphology toward a sphere. The
lowest aspect ratio and sphericity in ‘mahachanok’ indicated its inclination toward an
elongated oblong shape. It is worth highlighting that both parameters intercorrelate with
each other, and greater values of Ra and sphericity denote more advanced ripening stages
of the fruits [58]. Additionally, a higher fruit ripeness leads to a greater content of pectin
from fruit peel [59].
The surface areas (S) of mango fruits varied from 180.13–213.31 cm2. The highest area
was obtained from ‘mahachanok’ (213.31 cm2), followed by ‘nam dok mai’ (208.09 cm2),
‘chok anan’ (188.70 cm2), and ‘kaew’ (180.13 cm2). Meanwhile, ‘mahachanok’ also illus‐
trated the highest ratio of peel to total fruit weight (16.64%), whereas ‘chok anan’ and
‘nam dok mai’ had the lowest ratio at approximately 14%. Both surface area and peel‐to‐
fruit ratio may be associated with pectin content due to the naturally heterogeneous pol‐
ysaccharide present in plant cell walls, especially between the middle lamella [60]. How‐
ever, the composition of pectin in plant cell walls varies as a function of the type and the
variety [61]. In term of processing, ‘nam dok mai’ gave the largest yield of flesh (73%) and
the least biomass (~26%), followed by ‘kaew’, while ‘mahachanok’ and ‘chok anan’ were
much less economical for processing. The most frequently used varieties for processing
are ‘sampee’ and ‘kaew’ for candies, ‘mahachanok’ for juice, and ‘chok anan’ for rehy‐
drated mango products, in which heat treatment is commonly incorporated [12]. In com‐
parison with yield compositions in other varieties, Abdualrahm [62] and Anila and Radha
[63] reported that peel, seed, and flesh weights of different mango varieties in India were
in the ranges of 10–22%, 7–20%, and 58–81%, respectively. On the other hand, nine His‐
panic mango varieties consisted of 6–12% peel weight, 4–12% seed weight, and 75–86%
flesh weight [64]. We were particularly interested in the valorization of mango peel, and
it seems that ‘mahachanok’ is a preferred variety with the highest peel‐to‐fruit ratio and
total biomass. A similar study of Sommano et al. [11] also found that ‘mahachanok’ gave
the maximum yield of 6.0% of peel‐to‐fruit ratio, and a substantial amount of pectin could
be obtained.
Additionally, to analyze the overall influence of fruit physical properties and mango
varieties, we used a chemometric PCA as presented in Figure 1. All physical properties
were combined to reduce the size of the analyzed samples. The first two dimensions of
the PCA accounted for a total of 71.54% across the PCA score plot (PC1 = 40.43% and PC2
= 31.11% of the variance). The PCA plot illustrated that ‘chok anan’ and ‘kaew’ were some‐
what identical in terms of their physiology, whereas ‘nam dok mai’ and ‘mahachanok’
were highly distinctive from others.
Figure 1. The chemometric PCA score plot based on the physiological characteristics and mango
varieties (‘mahachanok’; M, ‘chok anan’; C, ‘nam dok mai’; N, ‘kaew’; K).
-4 -3 -2 -1 0 1 2 3 4 5-3
-2
-1
0
1
2
3
4
PC1 (40.43%)
PC
2 (3
1.11
%)
MCNK

Plants 2021, 10, 1148 5 of 19
2.2. Physicochemical Characteristics of Mango Peel
2.2.1. FT‐IR
FT‐IR was used to identify the functional groups of the phytochemical compositions
of mango peel (Figure 2). The FT‐IR region ranged from 600 to 4000 cm−1. This demon‐
strates the similarity of the absorbance patterns in peel from different varieties. The broad
and intense peak at around 3400 cm−1 represents stretching of O–H group due to inter‐
and intramolecular hydrogen bonding of polymeric compounds such as alcohols, phe‐
nols, and carboxylic acids, as in pectin, cellulose, and lignin [65]. The small peak at 2900
cm−1 indicates C–H stretching of the CH2 groups [66,67]. The small absorption at around
1730 cm−1 shows the characteristic of esterified pectin, arising from the ester carbonyl
stretching band [68]. The region at wavenumbers between 1500 and 1800 cm−1 is associated
with the assessment of the degree of methylation [69]. The region between 900 and 1200
cm−1 is accordingly referred to as the ‘fingerprint’ for carbohydrates, especially in terms
of sugar composition [70]. The peaks relate to the characteristics of pectin polysaccharides
(polygalacturonic acid) identified at 962, 1024, 1099, 1156, and 1223 cm−1, which were as‐
signed to C–O bending, C–C stretching, C–O stretching, C–H stretching, and C–O stretch‐
ing, respectively [71]. The peaks at 1370 cm−1 could be the symmetric stretching of –COO−
of pectin [72]. The FT‐IR patterns consequently verify that the mango peel was composed
of pectin.
Figure 2. The FT‐IR spectra of mango peels var. ‘mahachanok’ (―), ‘chok anan’ (―), ‘nam dok mai’
(―), and ‘kaew’ (―) from 600 to 4000 cm−1 (x‐axis) in terms of absorbance units (y‐axis).
2.2.2. Scanning Electron Microscopy (SEM) and Light Microscopy (LM)
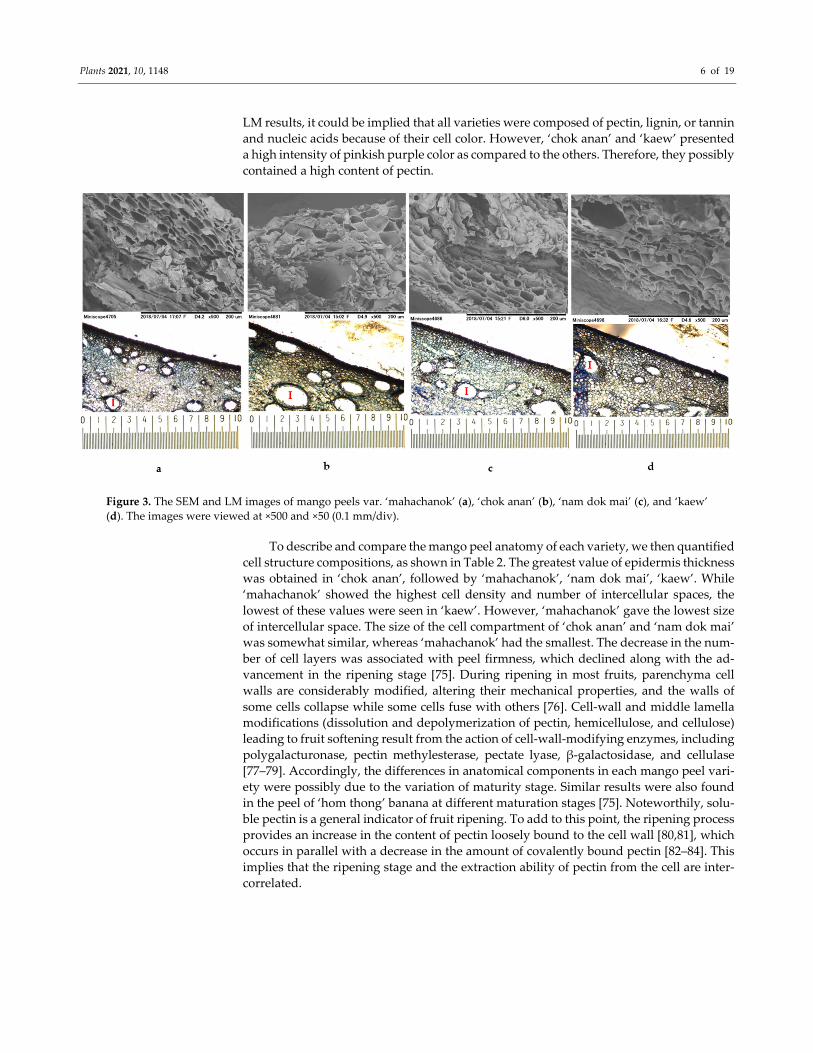
The mango peel structure was characterized using SEM and LM as illustrated in Fig‐
ure 3. SEM images showed that cell packings of ‘mahachanok’ (a) and ‘nam dok mai’ (c)
were similar, and cells had an angular polyhedral shape with a flat cell compartment, as
well as great intercellular space. On the other hand, ‘chok anan’ (b) cells were spherical,
with a large compartment and less intercellular space. The cellular profile of ‘kaew’(d)
was slightly irregular, with a flat compartment and no obvious intercellular space. Ac‐
cording to LM observations, the intercellular space characteristics (I) of all mango varieties
were associated with the SEM visualization. The variety of ‘chok anan’ exhibited a larger
size and more space, while ‘kaew’ showed a small space and fewer cells. In addition, the
color of cell components stained with toluidine blue O could define the different chemical
compositions of each peel variety. Toluidine blue O is a cationic dye that binds to nega‐
tively charged groups and provides different colors, including a pinkish purple color
when reacting with carboxylated polysaccharides such as pectin, a green, greenish blue,
or bright blue color when reacting with aromatic substances such as lignin and tannins,
and a purplish or greenish blue color when reacting with nucleic acids [73,74]. From the
Plants 2021, 10, 1148 6 of 19
LM results, it could be implied that all varieties were composed of pectin, lignin, or tannin
and nucleic acids because of their cell color. However, ‘chok anan’ and ‘kaew’ presented
a high intensity of pinkish purple color as compared to the others. Therefore, they possibly
contained a high content of pectin.
Figure 3. The SEM and LM images of mango peels var. ‘mahachanok’ (a), ‘chok anan’ (b), ‘nam dok mai’ (c), and ‘kaew’
(d). The images were viewed at ×500 and ×50 (0.1 mm/div).
To describe and compare the mango peel anatomy of each variety, we then quantified
cell structure compositions, as shown in Table 2. The greatest value of epidermis thickness
was obtained in ‘chok anan’, followed by ‘mahachanok’, ‘nam dok mai’, ‘kaew’. While
‘mahachanok’ showed the highest cell density and number of intercellular spaces, the
lowest of these values were seen in ‘kaew’. However, ‘mahachanok’ gave the lowest size
of intercellular space. The size of the cell compartment of ‘chok anan’ and ‘nam dok mai’
was somewhat similar, whereas ‘mahachanok’ had the smallest. The decrease in the num‐
ber of cell layers was associated with peel firmness, which declined along with the ad‐
vancement in the ripening stage [75]. During ripening in most fruits, parenchyma cell
walls are considerably modified, altering their mechanical properties, and the walls of
some cells collapse while some cells fuse with others [76]. Cell‐wall and middle lamella
modifications (dissolution and depolymerization of pectin, hemicellulose, and cellulose)
leading to fruit softening result from the action of cell‐wall‐modifying enzymes, including
polygalacturonase, pectin methylesterase, pectate lyase, β‐galactosidase, and cellulase
[77–79]. Accordingly, the differences in anatomical components in each mango peel vari‐
ety were possibly due to the variation of maturity stage. Similar results were also found
in the peel of ‘hom thong’ banana at different maturation stages [75]. Noteworthily, solu‐
ble pectin is a general indicator of fruit ripening. To add to this point, the ripening process
provides an increase in the content of pectin loosely bound to the cell wall [80,81], which
occurs in parallel with a decrease in the amount of covalently bound pectin [82–84]. This
implies that the ripening stage and the extraction ability of pectin from the cell are inter‐
correlated.

Plants 2021, 10, 1148 7 of 19
Table 2. Anatomical components of mango peels from different varieties using SEM and LM.
Anatomical Components Mango Varieties
Mahachanok Chok Anan Nam Dok Mai Kaew
1. Epidermis thickness +++ ++++ ++ ++
2. Cell density (0.01 mm2) ++++ ++ +++ +
3. Number of intercellular space ++++ +++ ++ ++
4. Size of intercellular space + ++++ +++ ++
5. Cell compartment size (μm) 200–400 400–500 300–400 400–500
Plus signs indicate the level from the highest (++++) to the lowest (+) of each anatomical component.
2.2.3. Proximate and Sugar Compositions
The proximate analysis and sugar types of dried mango peels are shown in Table 3.
Peels of all mango varieties contained ~59–69% moisture content, >9% carbohydrate, mod‐
erate contents of crude fiber, crude protein, and crude fat, and a low content of ash. The
moisture content of fruit peel is an indicator of fruit ripeness, and ripe fruit typically con‐
sists of higher moisture content than raw fruit [85]. The moisture content values in previ‐
ous reports were higher than those observed in this study, which might be due to the
different ripening stages [86,87].
Table 3. Proximate and sugar analyses of different varieties of mango peels.
Mango Varie‐
ties
Proximate Composition (% w/w) Sugar Types (% w/w)
Moisture in
Fresh
Carbohy‐
drate 1,2,3
Crude Protein 1,2
Crude Fat 1,2 Crude Fiber
1,2 Ash 1,2 Fructose 1,2 Xylose 1,2 Glucose Sucrose
Mahachanok 66.51 ± 0.06 b 10.53 ± 0.45 b 7.50 ± 0.01 b 2.48 ± 0.02 a 12.44 ± 0.59 b 0.54 ± 0.03 a 31.23 ± 0.02 a 29.88 ± 0.02 b n/d n/d
Chok anan 68.88 ± 0.33 a 11.23 ± 0.43 a b 7.18 ± 0.02 c 1.51 ± 0.02 d 10.92 ± 0.37 c 0.27 ± 0.01 b 31.57 ± 0.03 a 29.44 ± 0.06 b n/d n/d
Nam dok mai 59.50 ± 0.06 d 11.45 ± 0.28 a 7.03 ± 0.41 d 1.86 ± 0.02 b 19.90 ± 0.28 a 0.25 ± 0.04 b 31.41 ± 0.07 a 30.03 ± 0.03 a n/d n/d
Kaew 60.54 ± 0.44 c 8.93 ± 0.43 c 8.06 ± 0.04 a 1.68 ± 0.03 c 20.53 ± 0.10 a 0.24 ± 0.03 b 31.35 ± 0.03 a 29.73 ± 0.05 b n/d n/d 1 Values are on a dry weight basis (d.w.). n/d: not detectable. 2 Average ± standard deviation; different letters in each row
denote a significant difference (p < 0.05). 3 Calculated by difference with the other components of proximate content.
Carbohydrate contents of all samples were slightly variable. The contents of ‘nam
dok mai’, ‘chok anan’, ‘mahachanok’, and ‘kaew’ were 11.45%, 11.23%, 10.53%, and 8.93%,
respectively. Carbohydrate was the most abundant macronutrient in mango peel. This
was in conformity with other studies (15–30%) [62–64]. Major carbohydrate compositions
in ripened mango fruit are sugars (glucose, fructose, and sucrose) and others such as
starch and pectin [88]. Pectin is a structural carbohydrate abundant in mango fruit and is
considered as an important gelling sugar. When fruit is unripe, pectin is accumulated,
whereas, during ripening, the pectin molecular weight decreases [88,89]. This is attributed
to the hydrolysis activity of pectin enzymes at this stage [90].
There was a significant difference in crude protein content in peels of all varieties,
ranging from 7.03–8.06%. The highest yield was seen in ‘kaew’, while ‘nam dok mai’ gave
the lowest yield. When compared with other studies, the protein content in our research
was much higher [62,63,91]. The content of protein in the peel may be correlated with
pectin modification during the maturity stage [84]. The reason is that pectin is naturally
solubilized and sequentially disassembled because of the loss of neutral sugars from the
side‐chain via depolymerization during the ripening stage [92–95]. The incidence involves
pectolytic enzymes such as polygalacturonase, pectin methylesterase, and galactosidase.
As a consequence, the pectin molecular weight decreases, which is in line with the con‐
comitant loss of neutral sugars (arabinose and galactose), associated with the softening of
mango [96–98]. Nevertheless, the extension of these changes varies greatly among differ‐
ent species [80,81].
Crude fat contents of ‘mahachanok’, ‘nam dok mai’, ‘kaew’, and ‘chok anan’ were
2.48%, 1.86%, 1.68%, and 1.51%, respectively. The content of crude fat was rather low

Plants 2021, 10, 1148 8 of 19
when compared to other components. Studies on different varieties of mango peel re‐
ported values of fat content between 4% and 5% [99,100]. The fat content in mango peel
was analyzed and reported in the form of fatty acid by Maldonado‐Celis et al. [98] and
Saleem Dar et al. [89]. They observed that the fatty‐acid content increased during the rip‐
ening stage. Bandyopadhyay and Gholap [101] also found that the ratio of palmitic–pal‐
mitoleic acid in ripe mango could be applied as an index of aroma and flavor of mangoes.
The contents of crude fiber in ‘kaew’, ‘nam dok mai’, ‘mahachanok’, and ‘chok anan’ were
20.53%, 19.90%, 12.44%, and 10.92%, respectively. It is worth noting that the contents of
crude fiber in var. ‘kaew’ and ‘nam dok mai’ accounted for about one‐fifth of the total
dried sample weight. Therefore, both varieties could be used as an ingredient in food
products with supplemented dietary fiber in order to achieve higher profitable utilization.
Nonetheless, the fiber contents of mango peel in this study were greater than the quantity
reported in ‘amarpali’ (8.4%) and ‘dasheri’ (6.7%) by Tokas et al. [87], as well as in ‘nyala’
(4.5%), ‘edelfursan’ (4.2%), and ‘kaboom’ (4.4%) by Abdualrahm [62]. The ash content of
the mango variety ‘mahachanok’ was greatest (0.54%), while others were not statistically
different (0.24–0.27%). Ash consists of the important nutritional ingredients, especially
minerals, as well as both micro and macronutrients, which are very important for the nor‐
mal physiological functions of the human system [102].
The major sugar compositions of all mango peels were fructose and xylose. The con‐
tents of both sugars in each variety were not apparently distinct. Meanwhile, glucose and
sucrose were not detected (Table 3). Fructose is the main monosaccharide during the pre‐
climacteric phase, while xylose, derived from hemicellulose, is the second most common
sugar in nature and accounts for 18–30% of lignocellulose hydrolysate sugars [103]. It
comes as no surprise that we detected a large quantity of xylose from peel byproduct. In
general, mango flesh is predominantly composed of sucrose, fructose, and glucose in the
order of highest to lowest content [88]. Kumar et al. [104] also found that the extracted
sugars obtained from mango peel were mostly glucose, sucrose, and fructose. Neverthe‐
less, the sugar types in mango peels are probably correlated with the neutral sugars at‐
tached on the side‐chain of the pectin structure [96–98].
The relationship of proximate compositions of peel and the mango varieties was de‐
termined using PCA, whereby the first two dimensions of the PCA accounted for a total
of 65.56% of variance across the PCA score plot (PC1 = 37.27% and PC2 = 28.29% of the
variance). As presented in Figure 4a, the four varieties could be evidently classified on the
basis of their chemical components since the score values of each variety were signifi‐
cantly different. Accordingly, the chemometric PCA of the phytochemical was appropri‐
ate for variety classification of the mango.
We were also interested in the relationship of the combinations of fruit physiology
and peel characteristics and the mango varieties (Figure 4b). The first two dimensions of
the PCA described a total of 63.81% of the variance across the PCA score plot (PC1 =
35.01% and PC2 = 28.80% of the variance). The PCA pattern was greatly analogous to Fig‐
ure 1, describing that ‘chok anan’ and ‘kaew’ could not be remarkably separated because
of the slight difference in their score values, whereas ‘nam dok mai’ and ‘mahachanok’
were clearly clustered from other varieties. From these results, it can be assumed that
chemical properties hold greater potential for the categorization of mango varieties when
compared with physiological characteristics. Therefore, the different varieties of mango
were composed of distinctive proximate compositions in their peels.

Plants 2021, 10, 1148 9 of 19
Figure 4. The chemometric PCA score plots of proximate compositions (a) and of physiological char‐
acteristics and proximate compositions (b) (‘mahachanok’; M, ‘chok anan’; C, ‘nam dok mai’; N,
‘kaew’; K). The representative points of each variety that are far apart indicate that the characteristics
of fruit and peel of the mangoes are significantly different.
2.3. Chemical Characteristics of Mango Peel Pectin
The Eq.W is an index of free galacturonic acid content in the pectin. Absolute pectic
acid is composed entirely of polygalacturonic acid [105]. without any methyl ester groups
[106]. The Eq.W of pectin from these mango varieties could be categorized into two levels.
The highest level was 1000–2000 mg/mol from peels of ‘mahachanok’, ‘chok anan’, and
‘kaew’, while the peel of ‘nam dok mai’ showed the lowest level at about 600 mg/mol
(Table 4). The values are comparable with citrus pectin, which illustrated ranges of Eq.W
between 635.63 and 2219.39 mg/mol depending on the extraction method [71]. The larger
Eq.W could be due to higher partial degradation of pectin side‐chain leading to pectin
purification and free acid being obtained [106,107]. The partial degradation of pectin is
probably due to pectolytic enzymes (polygalacturonase, pectin methylesterase and galac‐
tosidase), leading to a decrease in pectin molecular weight with attendant loss of neutral
sugars, together correlated with more ripeness in several mango varieties [96,97,108]. Sub‐
sequently, it is possible that a greater ripeness of mango fruit leads to higher values of
Eq.W.
Table 4. Chemical characteristics of mango peel from different varieties.
Mango Varieties Pectin Yield (%) Eq.W (mg/mol) Mox (%) DE (%)
Mahachanok 13.67 ± 0.08 b 1423.81 ± 41.24 a 23.95 ± 16.55 a b 89.85 ± 3.08 a
Chok anan 15.07 ± 0.29 a 1037.30 ± 4.96 b 3.99 ± 0.02 b 56.88 ± 0.78 c
Nam dok mai 12.76 ± 0.71 b 605.26 ± 9.12 c 13.90 ± 2.57 b 68.91 ± 6.38 b
Kaew 7.65 ± 0.84 c 1041.67 ± 38.19 b 41.00 ± 14.74 a 92.93 ± 1.76 a
Data are expressed as mean ± standard deviation, n = 3. Eq.W = equivalent weight; Mox = meth‐
oxyl content; DE = degree of esterification. Average ± standard deviation; different letters in each
row denote a significant difference (p < 0.05).
Meanwhile, the Mox could be categorized into 3 levels: the high level (Mox 20.0–
40.0%) including ‘mahachanok’ and ‘keaw’, the moderate level (Mox 10.0–20.0%) includ‐
ing ‘nam dok mai’, and the low level (Mox <10.0%) including ‘chok anan’. Mox content is
an essential indicator of pectin setting time, related to its distribution ability in water and
gel formation ability [109–111]. Commercially, a high‐Mox pectin (generally at 8–11%
Mox) can form gels at a high sugar content (>65% sugar), while a low‐methoxyl pectin
(LMP) with less than 7% Mox can form gels at a lower sugar content [112]. Depending on
the DE, pectin can be divided into two groups: pectin with DE higher than 50%, known
as high‐methoxyl pectin (HMP), and DE lower than 50%, known as low‐methoxyl pectin
[113]. The DE of extracted pectin from various mango varieties ranged between 56.88%
and 92.93%, indicating that all mango peel pectin was of HMP type. Although, the pectin
obtained from mango peel var. ‘chok anan’ was composed of a DE content higher than

Plants 2021, 10, 1148 10 of 19
50%, the Mox value was fairly low (3.99%). Therefore, the pectin extracted from ‘chok
anan’ could be classified as an LMP, which can be used to supplement a low‐sugar diet.
2.4. Chemometric Studies of Fruit Physiological and Peel Proximate Compositions with Pectin
Qualities
To examine the relationship of fruit physiological and peel physicochemical proper‐
ties with the qualities of pectin, PLS models were established. It should be noted here that
the data were standardized prior to the PLS modeling to ensure that each parameter
equally influenced the estimation of the models. The correlation graphs between the ob‐
served parameters and the predicted pectin quality are presented in Table S1 (Supplemen‐
tary Materials). The values of R2, Q2, and their standard errors are summarized in Table 5.
The PLS models were of inordinate predictive performance (R2 > 0.7), while the Q2 values
of the trained samples were low in all cases. Tandee et al. [114] described that predictive
errors using the test sampling mode should be slightly greater than those of the auto‐
predictive mode, which is in line with our analysis. As shown in Table 5, the relationship
between the physiological properties and Eq.W depicted high Q2 scores, while the others
performed poorly. The relationship between the proximate properties and the DE value
showed the lowest score of Q2, whereas the combined properties with all parameters were
considerably acceptable with the exception of the Mox value. This could be due to the
variation of the mango varieties (Figure 4b); however, our study did not determine the
influence of the variety variation. Looking at the predictive models based on the highest
Q2 scores presented, we were able to pick up a strong relationship of the physiological
and phytochemical properties with the DE value. To comprehend the influence of the an‐
alyzed parameters in each model of interest; we used PLS regression coefficients and se‐
lected the top three parameters illustrating the highest coefficient values (Figure 5).
Table 5. R2 and Q2 values with their error scores obtained from the correlation graph of the expected and predicted pectin
quality values with fruit physiological properties and nutritional compositions of peel using the PLS model.
Properties Pectin Qualities R2 Q2 RMSEC RMSECV
Physiological properties
Eq.W 0.9782 0.4171 42.93 160.81
Mox 0.6882 −0.2376 9.17 18.15
DE 0.7682 −0.3614 7.32 22.57
%Pectin 0.7823 −0.1145 1.33 3.08
Proximate compositions of peel
Eq.W 0.9841 0.5867 36.7 74.01
Mox 0.9148 0.418 4.8 14.73
DE 0.9617 −0.5432 2.98 4.18
%Pectin 0.9849 0.7695 0.35 1.04
Physiological and proximate com‐
positions of peel
Eq.W 0.9958 0.5534 18.84 116.28
Mox 0.7456 −0.2376 8.29 18.26
DE 0.9839 0.8323 1.93 5.26
%Pectin 0.9826 0.4262 0.37 1.24
Based on the coefficient values, the biomass yield parameters such as flesh (No. 2),
seed (No. 3), total biomass (No. 4) (Figure 5b), crude fiber (No. 14), moisture content (No.
17), and xylose (No. 21) among the proximate properties (Figure 5c) had a strong influence
on the model prediction of DE. It could be described that a higher flesh yield of mango
fruit led to a greater DE value of the extracted pectin. On the other hand, fruit with high
percentage of seed and total biomass had a tendency to give pectin of low‐methoxyl type.
Fruit biomass is an indicator used to determine the ripening stage of fruit. Peter et al. [115]
reported that the ripening stages of ‘dodo’ mango fruit had a positive correlation to the
flesh yield, whereas the seed and peel volumes were slightly changed. Therefore, it is
likely that the quality of the extractable pectin depends upon fruit maturity. According to

Plants 2021, 10, 1148 11 of 19
the phytochemical properties, the contents of crude fiber and xylose in mango peel re‐
sulted in a larger value of DE, whereas moisture content had the inverse effect. Mostly
during ripening, the decrease in moisture content of mango peel happens during the dif‐
fusion of moisture from the flesh to the peel, along with carbohydrate hydrolyzation and
alteration of crude fiber. These incidents are associated with an increase in the amount of
the soluble pectin [115–117].
Figure 5. The corresponding PLS values of the impact of physiological and proximate characteristics on DE (a); the corre‐
sponding PLS values of the impact of physiological properties on DE (b); the corresponding PLS values of the impact of
proximate compositions on DE (c). Physiological properties of mango fruit were %peel (1), %flesh (2), %seed (3), %total
biomass (4), L* (5), a* (6), b*(7), Dg (8), Da (9), Ra (10), Φ (11), surface area (12), and peel‐to‐fruit ratio (13); the proximate
compositions were crude fiber (14), crude protein (15), crude lipid (16), moisture content (17), ash (18), carbohydrate (19),
fructose (20), and xylose (21). The bar graphs of each parameter indicate positive and negative impacts on DE value.
3. Materials and Methods
3.1. Physical Characteristics of Mango Fruit Varieties
3.1.1. Collection of Mango Samples
Four mangoes varieties (‘mahachanok’, ‘chok anan’, ‘nam dok mai’, and ‘kaew’) were
harvested at a commercial ripening stage with their specific gravities in the range of 1.01–
1.02, as described by Wongkaew et al. [6]. The mangoes were obtained from the orchard
of Maejo University located in Sansai district, Chiang Mai, Thailand.
3.1.2. CIE Color Spacing
The color measurement was repeated six times at different positions over the fruit
surface using a handheld color spectrophotometer (NS800, 3nh, China). Before each meas‐
urement, the instrument was calibrated using a white ceramic tile. The measurement was
assessed using the CIE Lab system, where L* denotes lightness on a 0–100 scale from black
to white, a∗ denotes (+) red or (−) green, and b∗ denotes (+) yellow or (−) blue.
3.1.3. Physical Properties
Linear dimensions, including length (L), width (W), and thickness (T), were meas‐
ured using a digital vernier caliper with an accuracy of 0.01 mm. The physical properties
were calculated according to the following equations:
Arithmetic mean diameter (Da) [118]: D = (L + W + T)3
, (1)
Geometric mean diameter (Dg) [118]: D = (LWT)1/3, (2)
Aspect ratio (Ra) [119]: Ra= W
L × 100, (3)
Sphericity (Φ) [118]: Φ = LWT1/3
L, (4)
Surface area (S) [118–120]: S = πBL2
2L - B ; where B = (WT)0.5, S = π(Dg)
2. (5)
Plants 2021, 10, 1148 12 of 19
3.2. Physicochemical Characteristics of Mango Peel
3.2.1. Preparation of Mango Peel Powder
Peel was removed from the ripe mangoes prior to cutting into small pieces, washing
with tap water, blanching with hot water at 95 °C for 10 min, draining, and leaving to cool
at room temperature. It was then dried at 60 ± 1 °C until a moisture content of 4–6% was
reached [10,121]. The dried peel was ground to fine powder using the high‐speed mode
of a food processor and passed through a sieve, resulting in a final mass of particles
smaller than 0.6 mm in diameter [122,123].
3.2.2. Fourier‐Transform Infrared Spectrophotometry (FT‐IR)
The FT‐IR spectra were acquired using a compact infrared spectrometer (Alpha II
Bruker, Bruker Corporation, Billerica, MA, USA) equipped with a deuterated triglycine
sulfate (DTGS) detector. Each powder sample was scanned by placing the sample on the
platinum ATR with a durable magnetic diamond interface. The spectrum was verified in
transparent mode from 500 to 4000 cm−1, with a resolution of 4.0 cm−1 [12]. Each IR spec‐
trum was validated with reference standards.
3.2.3. Scanning Electron Microscopy (SEM)
Fresh mango peel was cut into 1 × 1 × 0.2 cm pieces and fixed with a mixed solution
of formaldehyde and glacial acetic acid in a ratio of 1:1 at a temperature of 4 °C for 12 h.
Subsequently, the fragments were dehydrated in an ethanol series and dried using a
freeze‐dryer. Mango peel was attached onto a specimen stub with a double‐sided tape
and sputter‐coated with platinum [12,66]. The images were viewed at magnifications of
×500 using SEM (JELO JSM‐5910, JEOL Ltd., Japan) with an accelerating voltage of 10 kV.
3.2.4. Light Microscopy (LM)�Similarly sized mango peels were fixed and dehydrated according to the protocol of
SEM preparation. Afterward, the materials were fixed and embedded in paraffin at 60 °C
for 12 h. Sections (about 1 mm thick) were cut with a ultramicrotome and fixed to micro‐
scope slides. Sections were stained with toluidine blue O solution in 0.1 M phosphate
buffer (pH 6.8). The samples were observed using an inverted light microscope according
to the modified method of Rongkaumpan et al. [124].
3.2.5. Proximate Compositions
Air‐dried mango peel samples were used for proximate analyses with the exception
of the moisture content, which was analyzed from fresh mango peels. The proximate com‐
position analyses were carried out according to the methods of Association of Official An‐
alytical Chemists (2000) [125]. Total carbohydrate contents were calculated using the fol‐
lowing equation:
% Carbohydrate = 100 − (% moisture content + % crude protein + % ash + % crude fat + % crude fiber). (6)
3.2.6. Sugar Compositions
Two grams of the peel powder samples were extracted with 20 mL of 80% methanol
for 30 min in a shaker at room temperature. The extracts were filtered through filter paper
(Whatman No. 1), and the residue was re‐extracted under the same condition. The com‐
bined filtrate was evaporated in a rotary evaporator at a temperature below 45 °C. The
extracts obtained after evaporation of methanol were used for the analyses of sugar con‐
tent via HPLC. The mixture was separated in Shimadzu® Prominence™ LC‐20A System,
Japan, with a reversed‐phase HPLC column on RezexTM RHM Monosaccharide H+ (8%)
(Phenomenex Inc., Torrance, CA, USA), LC column 300 × 7.8 mm column, using degassed
water as mobile phase at flow rate of 0.6 mL/min. Pure samples of D‐(+)‐arabinose, D‐(+)‐
xylose, D‐(+)‐glucose, D‐(+)‐fructose, and D‐(+)‐sucrose were used as standards [126].

Plants 2021, 10, 1148 13 of 19
3.3. Chemical Characteristics of Mango Peel Pectin
3.3.1. Extraction of Pectin from Mango Peel Using Microwave Technique
Twenty grams of mango peel powder was suspended in 600 mL of diluted acidic
solution (distilled H2O adjusted to pH 1.5 with 2 M HCl) and soaked for 20 min at room
temperature. The slurry was heated in a microwave oven (ME711K‐XST, Samsung, Thai‐
land) with an optimal output power (700 watts for 3 min) followed by cooling to room
temperature [12]. The solution was filtered and pressed manually using a nylon cloth. The
filtrates were centrifuged at 5000× g for 20 min to eliminate any remaining coarse particles.
Pectin was precipitated from the supernatant by adding the same volumes of ethanol
(95%), before being mixed and stored in a refrigerator at 4 °C for 30 min. The separation
was achieved by vacuum filtration. The obtained pectin was dried in a hot‐air oven at 40
°C until constant weight was reached [127]. The yield of pectin was calculated from the
following equation [123]:
Yield % = M0
M100, (7)
where M0 (g) is the weight of dried pectin, and M (g) is the weight of dried mango peel
powder.
3.3.2. Mango Peel Pectin Characterizations Equivalent Weight (Eq.W)
The equivalent weight (Eq.W) was determined using the method of Sommano et al.
[11]. Briefly, 0.5 g of dried pectin was dissolved in 100 mL of distilled water at 25 °C and
stirred for 2 h until completely dissolved. One gram of sodium chloride was added and
titrated with 0.1 M of sodium hydroxide (NaOH) using five drops of phenol red as an
indicator. Eq.W was calculated using the following equation:
Eq.W = 1000 × pectin powder (g)
NaOH concentration N × NaOH volume (mL). (8)
Methoxyl Content (Mox) and Degree of Esterification (DE)
The methods of Pinheiro et al. [128] were followed. Dried pectin (0.2 g) was stirred
in CO2‐free distilled water (20 mL) until fully dissolved. One gram of NaCl was added to
the solution, prior to titrating with 0.1 N NaOH in the presence of phenolphthalein. The
volume was recorded as the initial titer (V1). Then, 0.1 N NaOH solution (10 mL) was
added to a neutralized polygalacturonic acid sample after determination of the free car‐
boxyl groups. The solution was mixed thoroughly until the color of the solution became
purple. A few drops of the indicator (0.25 N HCl) were added, and the mixture was ti‐
trated with 0.1 N NaOH until the color turned from yellow to pink. The volume was noted
as V2. Mox and DE were then calculated using the following equations:
Mox = (N)(V
2)(E)
1000 (S), (9)
DE = V2 × 100
V1 + V2, (10)
where S is the mass of dried pectin (g), Nis the NaOH concentration (N), V1 is the volume
of NaOH used (mL), V2 is the volume of NaOH used (mL), and E is equivalent weight of
methoxyl = 31.

Plants 2021, 10, 1148 14 of 19
3.4. Statistical Analysis
The analyses of physical and chemical properties in this experiment were carried out
at least in biological and technical triplicates. Data was analyzed using one‐way analysis
of variance and Duncan’s test. Differences in values were considered significantly differ‐
ent when the p‐value was <0.05. All statistical analysis was performed using IBM SPSS
program v. 23.0 (Armonk, New York, NY, USA). Principal component analysis (PCA),
partial least‐squares regression (PLS), and PLS coefficient evaluations was conducted to
comprehend the influence of mango varieties on the physiological and physicochemical
characteristics using in‐house MATLAB scripts (MATLAB V10.0, The Math Works Inc.,
Natick). Relationships between the parameters of interest and chemical qualities of pectin
were fitted using PLS models, where fruit and peel characteristics were used as predictive
parameters, while pectin qualities were used as responses. Standardization (STD) was
used for data preprocessing to equalize the effect of each variable’s contribution to the
model evaluation [129].
4. Conclusions
Chemometric analysis is able to elucidate the differences in mango varieties accord‐
ing to their physiological attributes and peel proximate compositions. In terms of MPP
recovery, the percentages of flesh, peel, and total biomass, as well as contents of crude
fiber, moisture, and xylose in the peels, can be used to justify the pectin type and its asso‐
ciated DE value. Future directions from our study can target the development of a nonde‐
structive tool for biomass sourcing in the recovery process of high‐quality pectin produc‐
tion.
Supplementary Materials: The following are available online at www.mdpi.com/arti‐
cle/10.3390/plants10061148/s1: Table S1: Correlation graph of PLS model.
Author Contributions: Conceptualization, S.R.S.; methodology, M.W. and S.R.S.; validation, M.W.
and B.T.; formal analysis, M.W., S.K., N.P., C.T., and F.M.B.; investigation, M.W., S.K., and N.P.;
data curation, M.W. and S.R.S.; writing—original draft preparation, M.W., B.T., F.M.B., and S.R.S.;
writing—review and editing, S.R.S., M.W., B.T., and R.C.; visualization, K.S., R.C., and S.R.S.; su‐
pervision, S.R.S., K.S., and R.C.; funding acquisition, T.P., B.C., and R.C. All authors have read and
agreed to the published version of the manuscript.
Funding: This research work was partially supported by Chiang Mai University.
Institutional Review Board Statement: Not applicable.
Informed Consent Statement: Not applicable.
Data Availability Statement: Not applicable.
Conflicts of Interest: The authors declare no conflict of interest.
References
1. Dick, E.; N’DaAdopo, A.; Camara, B.; Moudioh, E. Influence of maturity stage of mango at harvest on its ripening quality. Fruits
2009, 64, 13–18, doi:10.1051/fruits/2008045.
2. Evans, E.; Ballen, F.; Siddiq, M. Mango Production, Global Trade, Consumption Trends, and Postharvest Processing and Nutrition; John
Wiley & Sons: Chichester, UK, 2017; pp. 1–16.
3. Tharanathan, R.N.; Hosakote, Y.; Prabha, T.N. Mango (Mangifera indica L.), “The King of Fruits”—An Overview. Food Rev. Int.
2006, 22, 95–123, doi:10.1080/87559120600574493.
4. Maneenpun, S.; Yunchalad, M. Developing processed mango products for international markets. Acta Hortic. 2004, 645, 93–105,
doi:10.17660/ActaHortic.2004.645.6.
5. Siafunda, M. Study of marketing and processing of mango enterprise with a view toreduce wastage among local mango pro‐
ducers in Zambia. Texila Int. J. Manag. 2019, 1–7, doi:10.21522/TIJMG.2015.SE.19.01.Art022.
6. Wongkaew, M.; Sangta, J.; Chansakaow, S.; Jantanasakulwong, K.; Rachtanapun, P.; Sommano, S.R. Volatile profiles from over‐
ripe purée of Thai mango varieties and their physiochemical properties during heat processing. PLoS ONE 2021, 16, e0248657,
doi:10.1371/journal.pone.0248657.

Plants 2021, 10, 1148 15 of 19
7. Rojas, R.; Alvarez‐Pérez, O.B.; Contreras‐Esquivel, J.C.; Vicente, A.; Flores, A.; Sandoval, J.; Aguilar, C.N. Valorisation of mango
peels: Extraction of pectin and antioxidant and antifungal polyphenols. Waste Biomass Valoriz. 2020, 11, 89–98,
doi.org/10.1007/s12649‐018‐0433‐4.
8. Chaiwarit, T.; Masavang, S.; Mahe, J.; Sommano, S.; Ruksiriwanich, W.; Brachais, C.‐H.; Chambin, O.; Jantrawut, P. Mango (cv.
Nam Dokmai) peel as a source of pectin and its potential use as a film‐forming polymer. Food Hydrocoll. 2020, 102, 105611,
doi:10.1016/j.foodhyd.2019.105611.
9. Min, B.; Lim, J.; Ko, S.; Lee, K.‐G.; Lee, S.H.; Lee, S. Environmentally friendly preparation of pectins from agricultural byproducts
and their structural/rheological characterization. Bioresour. Technol. 2011, 102, 3855–3860, doi:10.1016/j.biortech.2010.12.019.
10. Vieira, W.A.; Michereff, S.; Morais, M.; Hyde, K.; Câmara, M. Endophytic species of Colletotrichum associated with mango in
northeastern Brazil. Fungal Divers. 2014, 67, doi:10.1007/s13225‐014‐0293‐6.
11. Sommano, S.; Ounamornmas, P.; Nisoa, M.; Sriwattana, S. Bioactive functionality of pectin from peels of seven Thai mango
cultivars. Acta Hortic. 2018, 423–428, doi:10.17660/ActaHortic.2018.1213.62.
12. Sommano, S.; Ounamornmas, P.; Nisoa, M.; Sriwattana, S.; Page, P.; Colelli, G. Characterisation and physiochemical properties
of mango peel pectin extracted by conventional and phase control microwave‐assisted extractions. Int. Food Res. J. 2018, 25,
2657–2665.
13. Wongkaew, M.; Sommano, S.; Tangpao, T.; Rachtanapun, P.; Jantanasakulwong, K. Mango peel pectin by microwave‐assisted
extraction and its use as fat replacement in dried Chinese sausage. Foods 2020, 9, 450, doi:10.3390/foods9040450.
14. Ajila, C.M.; Prasada Rao, U.J.S. Mango peel dietary fibre: Composition and associated bound phenolics. J. Funct. Foods 2013, 5,
444–450, doi:10.1016/j.jff.2012.11.017.
15. De Lourdes Garcia‐Magana, M.; Garcia, H.S.; Bello‐Perez, L.A.; Sayago‐Ayerdi, S.G.; de Oca, M.M. Functional properties and
dietary fiber characterization of mango processing by‐products (Mangifera indica L., cv Ataulfo and Tommy Atkins). Plant Foods
Hum. Nutr. 2013, 68, 254–258, doi:10.1007/s11130‐013‐0364‐y.
16. Manthey, J.A.; Perkins‐Veazie, P. Influences of harvest date and location on the levels of beta‐carotene, ascorbic acid, total phe‐
nols, the in vitro antioxidant capacity, and phenolic profiles of five commercial varieties of mango (Mangifera indica L.). J. Agric.
Food Chem. 2009, 57, 10825–10830, doi:10.1021/jf902606h.
17. Schieber, A.; Berardini, N.; Carle, R. Identification of flavonol and xanthone glycosides from mango (Mangifera indica L. Cv.
“Tommy Atkins”) peels by high‐performance liquid chromatography‐electrospray ionization mass spectrometry. J. Agric. Food
Chem. 2003, 51, 5006–5011, doi:10.1021/jf030218f.
18. Nagel, A.; Sirisakulwat, S.; Carle, R.; Neidhart, S. An acetate‐hydroxide gradient for the quantitation of the neutral sugar and
uronic acid profile of pectins by HPAEC‐PAD without postcolumn pH adjustment. J. Agric. Food Chem. 2014, 62, 2037–2048,
doi:10.1021/jf404626d.
19. Panouillé, M.; Ralet, M.C.; Bonnin, E.; Thibault, J.F. 16—Recovery and reuse of trimmings and pulps from fruit and vegetable
processing. In Handbook of Waste Management and Co‐Product Recovery in Food Processing; Waldron, K., Ed.; Woodhead Publish‐
ing: Cambridge, UK, 2007; pp. 417–447.
20. Ajila, C.M.; Bhat, S.G.; Prasada Rao, U.J.S. Valuable components of raw and ripe peels from two Indian mango varieties. Food
Chem. 2007, 102, 1006–1011, doi:10.1016/j.foodchem.2006.06.036.
21. Beerh, O.P.; Raghuramaiah, B.; Krishnamurthy, G.; Giridhar, N. Utilization of mango waste: Recovery of juice from waste pulp
and peel. J. Food Sci. Technol. 1976, 13, 138–141.
22. Singthong, J.; Cui, S.; Ningsanond, S.; Goff, H. Structural characterization, degree of esterification and some gelling properties
of Krueo Ma Noy (Cissampelos pareira) pectin. Carbohydr. Polym. 2004, 58, 391–400, doi:10.1016/j.carbpol.2004.07.018.
23. Al‐Sheraji, S.H.; Ismail, A.; Manap, M.Y.; Mustafa, S.; Yusof, R.M.; Hassan, F.A. Functional properties and characterization of
dietary fiber from Mangifera pajang Kort. fruit pulp. J. Agric. Food Chem. 2011, 59, 3980–3985, doi:10.1021/jf103956g.
24. Nguyễn, H.; Savage, G. The effects of temperature and pH on the extraction of oxalate and pectin from green kiwifruit (Actinidia
deliciosa L.), golden kiwifruit (Actinidia chinensis L.), kiwiberry (Actinidia arguta) and persimmon (Diospyros kaki). Int. J. Food Sci.
Technol. 2012, 48, 794–800.
25. Sogi, D.S.; Siddiq, M.; Greiby, I.; Dolan, K.D. Total phenolics, antioxidant activity, and functional properties of ‘Tommy Atkins’
mango peel and kernel as affected by drying methods. Food Chem. 2013, 141, 2649–2655, doi:10.1016/j.foodchem.2013.05.053.
26. El Bulk, R.E.; Babiker, E.F.E.; El Tinay, A.H. Changes in chemical composition of guava fruits during development and ripening.
Food Chem. 1997, 59, 395–399, doi:10.1016/S0308‐8146(96)00271‐3.
27. Zhou, H.C.; Li, G.; Zhao, X.; Li, L.J. Comparative analysis of polygalacturonase in the fruit of strawberry cultivars. Genet. Mol.
Res. 2015, 14, 12776–12787, doi:10.4238/2015.October.19.21.
28. Willats, W.G.T.; Knox, J.P.; Mikkelsen, J.D. Pectin: New insights into an old polymer are starting to gel. Trends Food Sci. Technol.
2006, 17, 97–104, doi:10.1016/j.tifs.2005.10.008.
29. Schols, H.A.; Voragen, A.G.J. Complex Pectins: Structure elucidation using enzymes. In Progress in Biotechnology; Visser, J., Vor‐
agen, A.G.J., Eds.; Elsevier: Amsterdam, The Netherlands, 1996; Volume 14, pp. 3–19.
30. Thakur, B.R.; Singh, R.K.; Handa, A.K. Chemistry and uses of pectin—A review. Crit. Rev. Food Sci. Nutr. 1997, 37, 47–73,
doi:10.1080/10408399709527767.
31. May, C.D. Industrial pectins: Sources, production and applications. Carbohydr. Polym. 1990, 12, 79–99, doi:10.1016/0144‐
8617(90)90105‐2.

Plants 2021, 10, 1148 16 of 19
32. Güzel, M.; Akpınar, Ö. Valorisation of fruit by‐products: Production characterization of pectins from fruit peels. Food Bioprod.
Process. 2019, 115, 126–133, doi:10.1016/j.fbp.2019.03.009.
33. Robledo, V.R.; Vázquez, L.I.C. Pectin—Extraction, Purification, Characterization and Applications; IntechOpen: London, UK, 2020;
pp. 1–19, doi:10.5772/intechopen.85588.
34. Fishman, M.L.; Chau, H.K.; Hoagland, P.D.; Hotchkiss, A.T. Microwave‐assisted extraction of lime pectin. Food Hydrocoll. 2006,
20, 1170–1177, doi:10.1016/j.foodhyd.2006.01.002.
35. Adetunji, L.R.; Adekunle, A.; Orsat, V.; Raghavan, V. Advances in the pectin production process using novel extraction tech‐
niques: A review. Food Hydrocoll. 2017, 62, 239–250, doi:10.1016/j.foodhyd.2016.08.015.
36. Guolin, H.; Jeffrey, S.; Kai, Z.; Xiaolan, H. Application of ionic liquids in the microwave‐assisted extraction of pectin from lemon
peels. J. Anal. Methods Chem. 2012, 2012, 302059, doi:10.1155/2012/302059.
37. Wang, S.; Chen, F.; Wu, J.; Wang, Z.; Liao, X.; Hu, X. Optimization of pectin extraction assisted by microwave from apple
pomace using response surface methodology. J. Food Eng. 2007, 78, 693–700, doi:10.1016/j.jfoodeng.2005.11.008.
38. Swamy, G.J.; Muthukumarappan, K. Optimization of continuous and intermittent microwave extraction of pectin from banana
peels. Food Chem. 2017, 220, 108–114, doi:10.1016/j.foodchem.2016.09.197.
39. Hosseini, S.S.; Khodaiyan, F.; Yarmand, M.S. Optimization of microwave assisted extraction of pectin from sour orange peel
and its physicochemical properties. Carbohydr. Polym. 2016, 140, 59–65, doi:10.1016/j.carbpol.2015.12.051.
40. Matharu, A.; Houghton, J.; Lucas‐Torres, C.; Moreno, A. Acid‐free microwave‐assisted hydrothermal extraction of pectin and
porous cellulose from mango peel waste—Towards a zero waste mango biorefinery. Green Chem. 2016, 18,
doi:10.1039/C6GC01178K.
41. Sarıçoban, C.; Özalp, B.; Yılmaz, M.T.; Özen, G.; Karakaya, M.; Akbulut, M. Characteristics of meat emulsion systems as influ‐
enced by different levels of lemon albedo. Meat Sci. 2008, 80, 599–606, doi:10.1016/j.meatsci.2008.02.008.
42. León, K.; Mery, D.; Pedreschi, F.; León, J. Color measurement in L∗a∗b∗ units from RGB digital images. Food Res. Int. 2006, 39,
1084–1091, doi:10.1016/j.foodres.2006.03.006.
43. Jha, S.N.; Chopra, S.; Kingsly, A.R.P. Modeling of color values for nondestructive evaluation of maturity of mango. J. Food Eng.
2007, 78, 22–26, doi:10.1016/j.jfoodeng.2005.08.048.
44. Malevski, Y.; Brito, L.; Peleg, M.; Silberg, M. External color as maturity index of mango. J. Food Sci. 2006, 42, 1316–1318,
doi:10.1111/j.1365‐2621.1977.tb14486.x.
45. Nambi, E.; Kulandasamy, T.; Jesudas, M. Scientific classification of ripening period and development of colourgrade chart for
Indian mangoes (Mangifera indica L.) using multivariate cluster analysis. Sci. Hortic. 2015, doi:10.1016/j.scienta.2015.05.031.
46. Liang, D.; Lin, F.; Yang, G.; Yue, X.; Zhang, Q.; Zhang, Z.; Chen, H. Advantages of immersion freezing for quality preservation
of litchi fruit during frozen storage. LWT Food Sci. Technol. 2015, 60, 948–956, doi:10.1016/j.lwt.2014.10.034.
47. Zhang, Y.; Zhao, J.‐H.; Ding, Y.; Nie, Y.; Xiao, H.‐W.; Zhu, Z.; Tang, X.‐M. Effects of state/phase transitions on the quality attrib‐
utes of mango (Mangifera indica L.) during frozen storage. Int. J. Food Sci. Technol. 2017, 52, 239–246, doi:10.1111/ijfs.13275.
48. Ribeiro, S.; Queiroz, J.; Queiroz, M.; Campos, F.; Pinheiro‐Sant’Ana, H. Antioxidant in mango (Mangifera indica L.) pulp. Plant
Foods Hum. Nutr. 2007, 62, 13–17, doi:10.1007/s11130‐006‐0035‐3.
49. Ornelas‐Paz, J.D.J.; Yahia, E.M.; Gardea, A.A. Changes in external and internal color during postharvest ripening of ‘Manila’
and ‘Ataulfo’ mango fruit and relationship with carotenoid content determined by liquid chromatography–APcI+‐time‐of‐flight
mass spectrometry. Postharvest Biol. Technol. 2008, 50, 145–152, doi:10.1016/j.postharvbio.2008.05.001.
50. Medlicott, A.; Sigrist, J.; Reynolds, S.; Thompson, A. Effect of ethylene and acetylene on mango fruit ripening. Ann. Appl. Biol.
2008, 111, 439–444, doi:10.1111/j.1744‐7348.1987.tb01472.x.
51. Su, L.; Diretto, G.; Purgatto, E.; Danoun, S.; Zouine, M.; Li, Z.; Roustan, J.‐P.; Bouzayen, M.; Giuliano, G.; Chervin, C. Carotenoid
accumulation during tomato fruit ripening is modulated by the auxin‐ethylene balance. BMC Plant Biol. 2015, 15, 114,
doi:10.1186/s12870‐015‐0495‐4.
52. Gorial, B.Y.; O’Callaghan, J.R. Aerodynamic properties of grain/straw materials. J. Agric. Eng. Res. 1990, 46, 275–290,
doi:10.1016/S0021‐8634(05)80132‐5.
53. Sunmonu, M.O.; Iyanda, M.O.; Odewole, M.; Ajala, O.; Aduba, J. Determination of physical properties of almond seed related
to the design of food processing machines. Niger. J. Pure Appl. Sci. 2016, 29, 2730–2740.
54. Osadare, T.; Koyenikan, O.; Akinola, F. Physical and mechanical properties of three varieties of mango. Asian Food Sci. J. 2019,
1–8, doi:10.9734/afsj/2019/v10i230033.
55. Spreer, W.; Müller, J. Estimating the mass of mango fruit (Mangifera indica, cv. ChokAnan) from its geometric dimensions by
optical measurement. Comput. Electron. Agric. 2011, 75, 125–131, doi:10.1016/j.compag.2010.10.007.
56. Navaphattra, N.; Suesut, T. Measuring geometric mean diameter of fruits and vegetables using light sectioning method.
Songklanakarin J. Sci. Technol. 2010, 31, 629–633.
57. Nordey, T.; Mathieu, L.; Saudreau, M.; Joas, J.; Genard, M. Model‐assisted analysis of spatial and temporal variations in fruit
temperature and transpiration highlighting the role of fruit development. PLoS ONE 2014, 9, e92532, doi:10.1371/jour‐
nal.pone.0092532.
58. Athmaselvi, K.; Jenney, P.; Pavithra, C.; Roy, I. Physical and biochemical properties of selected tropical fruits. Int. Agrophys.
2014, 28, doi:10.2478/intag‐2014‐0028.
59. Nguyen, H.D.H.; Nguyen, H.V.H.; Savage, G.P. Properties of pectin extracted from Vietnamese mango peels. Foods 2019, 8, 629.

Plants 2021, 10, 1148 17 of 19
60. Sista Kameshwar, A.; Qin, W. Structural and functional properties of pectin and lignin–carbohydrate complexes de‐esterases:
A review. Bioresour. Bioprocess. 2018, 5, doi:10.1186/s40643‐018‐0230‐8.
61. Voragen, A.; Coenen, G.‐J.; Verhoef, R.; Schols, H.A. Pectin, a versatile polysaccharide present in plant cell walls. Struct. Chem.
2009, 20, 263–275, doi:10.1007/s11224‐009‐9442‐z.
62. Abdualrahm, M. Physico‐chemical characteristics of different types of mango (Mangifera indica L.) fruits grown in drafur regions
and its use in jam processing. Sci. Int. 2013, 1, 144–147, doi:10.5567/sciintl.2013.144.147.
63. Anila, R.; Radha, T. Physico‐chemical analysis of mango varieties under Kerala conditions. J. Trop. Agric. 2006, 41, 20–22.
64. Rodriguez, C.; Durán Zuazo, V.; Fernández, J.; Tarifa, D. Physico‐chemical quality parameters of mango (Mangifera indica L.)
fruits grown in a mediterranean subtropical climate (SE Spain). J. Agric. Sci. Technol. 2012, 14, 365–374.
65. Tesfaye, T. Valorisation of mango fruit by‐products: Physicochemical characterisation and future prospect. Chem. Process Eng.
Res. 2017, 50, 22–34.
66. Jiang, Y.; Du, Y.; Zhu, X.; Xiong, H.; Woo, M.W.; Hu, J. Physicochemical and comparative properties of pectins extracted from
Akebia trifoliata var. australis peel. Carbohydr. Polym. 2012, 87, 1663–1669, doi:10.1016/j.carbpol.2011.09.064.
67. Khaskheli, M.I.; Memon, S.Q.; Siyal, A.N.; Khuhawar, M.Y. Use of orange peel waste for arsenic remediation of drinking water.
Waste Biomass Valoriz. 2011, 2, 423, doi:10.1007/s12649‐011‐9081‐7.
68. Posé, S.; Kirby, A.; Mercado, J.; Morris, V.; Quesada, M. Structural characterization of cell wall pectin fractions in ripe strawberry
fruits using AFM. Carbohydr. Polym. 2012, 88, 882–890, doi:10.1016/j.carbpol.2012.01.029.
69. Abid, M.; Cheikhrouhou, S.; Renard, C.; Sylvie, B.; Cuvelier, G.; Attia, H.; Ayadi, M. Characterization of pectins extracted from
pomegranate peel and their gelling properties. Food Chem. 2016, 215, doi:10.1016/j.foodchem.2016.07.181.
70. Černá, M.; Barros, A.S.; Nunes, A.; Rocha, S.l.M.; Delgadillo, I.; Čopı́ková, J.; Coimbra, M.A. Use of FT‐IR spectroscopy as a tool
for the analysis of polysaccharide food additives. Carbohydr. Polym. 2003, 51, 383–389, doi:10.1016/S0144‐8617(02)00259‐X.
71. Rodsamran, P.; Sothornvit, R. Microwave heating extraction of pectin from lime peel: Characterization and properties compared
with the conventional heating method. Food Chem. 2019, 278, 364–372, doi:10.1016/j.foodchem.2018.11.067.
72. Devi, S.; Nand, K. Microbiological pretreatment of mango peel for biogas production. J. Microb. Biotechnol. 1989, 4, 110–115.
73. O’Brien, T.P.; Feder, N.; McCully, M.E. Polychromatic staining of plant cell walls by toluidine blue O. Protoplasma 1964, 59, 368–
373, doi:10.1007/BF01248568.
74. Mori, B.; Bellani, L.M. Differential staining for cellulosic and modified plant cell walls. Biotech. Histochem. 1996, 71, 71–72,
doi:10.3109/10520299609117136.
75. Amnuaysin, N.; Seraypheap, K.; Kidyoo, M. Anatomical changes in peel structure of ‘Hom Thong’ banana during fruit devel‐
opment and ripening. Trop. Nat. Hist. 2012, 12, 127–136.
76. Harker, F.R.; Redgwell, R.J.; Hallett, I.C.; Murray, S.H.; Carter, G. Texture of fresh fruit. Hortic. Rev. 1997, 20, 121–224.
77. Ratule, M.; Osman, A.; Saari, N.; Ahmad, H.S. Microstructure of peel cell wall and selected physico‐chemical characteristics of
‘Berangan’ banana (Musa cv. Berangan (AAA)) ripened at high temperature. Asia Pac. J. Mol. Biol. Biotechnol. 2007, 15, 8–13.
78. Brummell, D.; Harpster, M. Cell wall metabolism in fruit softening and quality and its manipulation in transgenic plants. Plant
Mol. Biol. 2001, 47, 311–340, doi:10.1023/A:1010656104304.
79. Goulao, L.F.; Oliveira, C.M. Cell wall modifications during fruit ripening: When a fruit is not the fruit. Trends Food Sci. Technol.
2008, 19, 4–25, doi:10.1016/j.tifs.2007.07.002.
80. Mercado, J.; Pliego‐Alfaro, F.; Quesada, M. Fruit shelf life and potential for its genetic improvement. In Breeding for Fruit Quality;
John Wiley & Sons: Hoboken, NJ, USA, 2011; pp. 81–104.
81. Lohani, S.; Trivedi, P.K.; Nath, P. Changes in activities of cell wall hydrolases during ethylene‐induced ripening in banana:
Effect of 1‐MCP, ABA and IAA. Postharvest Biol. Technol. 2004, 31, 119–126, doi:10.1016/j.postharvbio.2003.08.001.
82. Paniagua, C.; Posé, S.; Morris, V.J.; Kirby, A.R.; Quesada, M.A.; Mercado, J.A. Fruit softening and pectin disassembly: An over‐
view of nanostructural pectin modifications assessed by atomic force microscopy. Ann. Bot. 2014, 114, 1375–1383,
doi:10.1093/aob/mcu149.
83. Wakabayashi, K.; Chun, J.‐P.; Huber, D.J. Extensive solubilization and depolymerization of cell wall polysaccharides during
avocado (Perseaamericana) ripening involves concerted action of polygalacturonase and pectinmethylesterase. Physiol. Plant.
2000, 108, 345–352, doi:10.1034/j.1399‐3054.2000.t01‐1‐100402.x.
84. Brummell, D.A. Cell wall disassembly in ripening fruit. Funct. Plant Biol. 2006, 33, 103–119, doi:10.1071/fp05234.
85. Offem, J.O.; Thomas, O.O. Chemical changes in relation to mode and degree of maturation of plantain (Musa paradisiaca) and
banana (Musa sapientum) fruits. Food Res. Int. 1993, 26, 187–193, doi:10.1016/0963‐9969(93)90052‐K.
86. John, K.S.; Bhat, S.G.; Prasada Rao, U.J. Biochemical characterization of sap (latex) of a few Indian mango varieties. Phytochem‐
istry 2003, 62, 13–19, doi:10.1016/s0031‐9422(02)00441‐7.
87. Tokas, J.; Punia, H.; Baloda, S.; Sheokand, R.N. Mango peel: A potential source of bioactive compounds. Austin Food Sci. 2020,
5, 1–7.
88. Bello‐Pérez, L.A.; Garcia‐Suarez, F.; Agama‐Acevedo, E. Mango Carbohydrates. Food 2009, 1, 36–40.
89. Saleem Dar, M.; Oak, P.; Chidley, H.; Deshpande, A.; Giri, A.; Gupta, V. Chapter 19—Nutrient and flavor content of mango
(Mangifera indica L.) cultivars: An appurtenance to the list of staple foods. In Nutritional Composition of Fruit Cultivars; Simmonds,
M.S.J., Preedy, V.R., Eds.; Academic Press: San Diego, CA, USA, 2016; pp. 445–467.
90. Prasanna, V.; Prabha, T.N.; Tharanathan, R.N. Pectic polysaccharides of mango (Mangifera indica L): Structural studies. J. Sci.
Food Agric. 2004, 84, 1731–1735, doi:10.1002/jsfa.1874.

Plants 2021, 10, 1148 18 of 19
91. Sánchez‐Camargo, A.D.P.; Gutiérrez, L.‐F.; Vargas, S.M.; Martinez‐Correa, H.A.; Parada‐Alfonso, F.; Narváez‐Cuenca, C.‐E.
Valorisation of mango peel: Proximate composition, supercritical fluid extraction of carotenoids, and application as an antioxi‐
dant additive for an edible oil. J. Supercrit. Fluids 2019, 152, 104574, doi:10.1016/j.supflu.2019.104574.
92. Redgwell, R.J.; Melton, L.D.; Brasch, D.J. Cell wall dissolution in ripening kiwifruit (Actinidia deliciosa): Solubilization of the
pectic polymers. Plant Physiol. 1992, 98, 71–81, doi:10.1104/pp.98.1.71.
93. Carrington, C.M.S.; Greve, L.C.; Labavitch, J.M. Cell wall metabolism in ripening fruit (vi. effect of the antisense polygalac‐
turonase gene on cell wall changes accompanying ripening in transgenic tomatoes). Plant Physiol. 1993, 103, 429–434,
doi:10.1104/pp.103.2.429.
94. Cheng, G.W.; Huber, D.J. Alterations in structural polysaccharides during liquefaction of tomato locule tissue. Plant Physiol.
1996, 111, 447–457, doi:10.1104/pp.111.2.447.
95. Rose, J.K.; Hadfield, K.A.; Labavitch, J.M.; Bennett, A.B. Temporal sequence of cell wall disassembly in rapidly ripening melon
fruit. Plant Physiol. 1998, 117, 345–361, doi:10.1104/pp.117.2.345.
96. Muda, P.; Seymour, G.B.; Errington, N.; Tucker, G.A. Compositional changes in cell wall polymers during mango fruit ripening.
Carbohydr. Polym. 1995, 26, 255–260, doi:10.1016/0144‐8617(95)00028‐6.
97. Roe, B.; Bruemmer, J.H. Changes in pectic substances and enzymes during ripening and storage of “Keitt” mangos. J. Food Sci.
1981, 46, 186–189, doi:10.1111/j.1365‐2621.1981.tb14560.x.
98. Maldonado‐Celis, M.E.; Yahia, E.M.; Bedoya, R.; Landázuri, P.; Loango, N.; Aguillón, J.; Restrepo, B.; Guerrero Ospina, J.C.
Chemical composition of mango (Mangifera indica L.) fruit: Nutritional and phytochemical compounds. Front. Plant Sci. 2019,
10, doi:10.3389/fpls.2019.01073.
99. Romelle, F.D.; Rani, A.; Manohar, R.S. Chemical composition of some selected fruit peels. Eur. J. Food Sci. Technol. 2016, 4, 12–
21.
100. Giraldo, L.M.; Correa, H.M.; Gutiérrez, J.B.; Castano, C.C. Aprovechamiento del residuo agroindustrial del mango común (Man‐
gifera indica L.) en la obtención de azúcares fermentables. Ingeniería Ciencia 2007, 3, 41–62.
101. Bandyopadhyay, C.; Gholap, A.S. Changes in fatty acids in ripening mango pulp (var Alphonso). J. Agric. Food Chem. 1973, 21,
496–497, doi:10.1021/jf60187a027.
102. Khan, D.N.; Ruqia, B.; Hussain, J.; Jamila, D.N.; Rehman, N.; Hussain, S. Nutritional assessment and proximate analysis of
selected vegetables from parachinar kurram agency. Am. J. Res. Commun. 2013, 1, 184–198.
103. Van Dyk, J.S.; Pletschke, B.I. A review of lignocellulose bioconversion using enzymatic hydrolysis and synergistic cooperation
between enzymes—Factors affecting enzymes, conversion and synergy. Biotechnol. Adv. 2012, 30, 1458–1480.
104. Kumar, C.S.C.; Mythily, R.; Chandraju, S. Utilization of mango peels (Mangifera indica) for the extraction of sugars. Der Pharma
Chem. 2012, 4, 2422–2426.
105. Taylor, K.A.C.C. A colorimetric method for the quantitation of galacturonic acid. Appl. Biochem. Biotechnol. 1993, 43, 51–54,
doi:10.1007/BF02916430.
106. Wathoni, N.; Shan, C.Y.; Shan, W.Y.; Rostinawati, T.; Indradi, R.B.; Pratiwi, R.; Muchtaridi, M. Characterization and antioxidant
activity of pectin from Indonesian mangosteen (Garcinia mangostana L.) rind. Heliyon 2019, 5, e02299, doi:10.1016/j.heli‐
yon.2019.e02299.
107. Azad, M.A.K.; Ali, M.; Akter, M.; Rahman, M.J.; Ahmed, M. Isolation and characterization of pectin extracted from lemon pom‐
ace during ripening. J. Food Nutr. Sci. 2014, 2, 30–35, doi:10.11648/j.jfns.20140202.12.
108. Selvaraj, Y.; Kumar, R. Studies on fruit softening enzymes and polyphenol oxidase activity in ripening mango (Mangifera indica
L.) fruit. J. Food Sci. Technol. 1989, 26, 218–222.
109. Shaha, R.K.; Nayagi, Y.; Punichelvana, A.; Afandi, A. Optimized extraction condition and characterization of pectin from kaffir
lime (Citrus hystrix). Res. J. Agric. For. Sci. 2013, 1, 1–11.
110. Israel, K.A.; Baguio, S.F.; Diasanta, M.D.B.; Lizardo, R.C.; Dizon, E.; Mejico, M.I.F. Extraction and characterization of pectin from
Saba banana [Musa ‘saba’ (Musa acuminata × Musa balbisiana)] peel wastes: A preliminary study. Int. Food Res. J. 2015, 22, 202–
207.
111. Constenla, D.; Lozano, J. Kinetic model of pectin demethylation. Lat. Am. Appl. Res. 2003, 33, 91–95.
112. Rouse, A.H.; Atkins, C.D.; Moore, E.L. The occurrence and evaluation of pectin in component parts of valencia oranges during
maturation. Proc. Fla. State Hortic. Soc. 2007, 75, 307–311.
113. Mesbahi, G.; Jamalian, J.; Farahnaky, A. A comparative study on functional properties of beet and citrus pectins in food systems.
Food Hydrocoll. 2005, 19, 731–738, doi:10.1016/j.foodhyd.2004.08.002.
114. Tandee, K.; Kittiwachana, S.; Mahatheeranont, S. Antioxidant activities and volatile compounds in longan (Dimocarpus longan
Lour.) wine produced by incorporating longan seeds. Food Chem. 2021, 348, 128921, doi:10.1016/j.foodchem.2020.128921.
115. Mamiro, P.; Fweja, L.; Chove, B.; Kinabo, J.; George, V.; Mtebe, K. Physical and chemical characteristics of off vine ripened
mango (Mangifera indica L.) fruit (Dodo). Afr. J. Biotechnol. 2007, 6, doi:10.5897/AJB2007.000‐2392, ISSN 1684‐5315.
116. Appiah, F.; Patrick, K.; Idun, I. Effect of ripening stage on composition, sensory qualities and acceptability of keitt mango (Man‐
gifera indica L.) chips. Afr. J. Food Agric. Nutr. Dev. 2011, 11, 5096–5109, doi:10.4314/ajfand.v11i5.70439.
117. Othman, O.; Mbogo, G. Physico‐chemical characteristics of storage‐ripened mango (Mangifera indica L.) fruits varieties of East‐
ern Tanzania. Tanzan. J. Sci. 2009, 35, 57–66.

Plants 2021, 10, 1148 19 of 19
118. Tscheuschner, H.‐D.N.N. Mohsenin: Physical properties of plant and animal materials: Structure, physical characteristics and
mechanical properties. 2. Aufl. 891 Seiten, zahlr. Abb. und Table Gordon and Breach Science Publishers, New York u. a. 1986.
Preis: 140—£. Food Nahrung 1987, 31, 702, doi:10.1002/food.19870310724.
119. Razavi, S.; Bahram‐Parvar, M. Some physical and mechanical properties of kiwifruit. Int. J. Food Eng. 2007, 3, 1–16,
doi:10.2202/1556‐3758.1276.
120. Tabar, F.J.; Lorestani, A.N.; Gholami, R.; Behzadi, A.; Fereidoni, M. Physical and mechanical properties of Oak (Quercus Persica)
fruits. Agric. Eng. Int. CIGR J. 2012, 13, 1–4.
121. Pandit, S.G.; Vijayanand, P.; Kulkarni, S.G. Pectic principles of mango peel from mango processing waste as influenced by
microwave energy. LWT Food Sci. Technol. 2015, 64, 1010–1014, doi:10.1016/j.lwt.2015.06.070.
122. Bagherian, H.; Zokaee Ashtiani, F.; Fouladitajar, A.; Mohtashamy, M. Comparisons between conventional, microwave‐ and
ultrasound‐assisted methods for extraction of pectin from grapefruit. Chem. Eng. Process. Process Intensif. 2011, 50, 1237–1243,
doi:10.1016/j.cep.2011.08.002.
123. Maran, J.P.; Swathi, K.; Jeevitha, P.; Jayalakshmi, J.; Ashvini, G. Microwave‐assisted extraction of pectic polysaccharide from
waste mango peel. Carbohydr. Polym. 2015, 123, 67–71, doi:10.1016/j.carbpol.2014.11.072.
124. Rongkaumpan, G.; Amsbury, S.; Andablo‐Reyes, E.; Linford, H.; Connell, S.; Knox, J.P.; Sarkar, A.; Benitez‐Alfonso, Y.; Orfila,
C. Cell wall polymer composition and spatial distribution in ripe banana and mango fruit: Implications for cell adhesion and
texture perception. Front. Plant Sci. 2019, 10, doi:10.3389/fpls.2019.00858.
125. Horwitz, W. Official Methods of Analysis of AOAC International; AOAC International: Gaithersburg, MD, USA, 2000.
126. Kumar, C.S.C.; Mythily, R.; Chandraju, S. A rapid and sensitive extraction of sugars from papaya peels (Carica Papaya). Der
Pharma Chem. 2012, 4, 1631–1636.
127. Guandalini, B.B.V.; Rodrigues, N.P.; Marczak, L.D.F. Sequential extraction of phenolics and pectin from mango peel assisted by
ultrasound. Food Res. Int. 2019, 119, 455–461, doi:10.1016/j.foodres.2018.12.011.
128. Pinheiro, E.S.R.; Silva, I.M.D.A.; Gonzaga, L.V.; Amante, E.R.; Teófilo, R.F.; Ferreira, M.M.C.; Amboni, R.D.M.C. Optimization
of extraction of high‐ester pectin from passion fruit peel (Passiflora edulis flavicarpa) with citric acid by using response surface
methodology. Bioresour. Technol. 2008, 99, 5561–5566, doi:10.1016/j.biortech.2007.10.058.
129. Funsueb, S.; Krongchai, C.; Mahatheeranont, S.; Kittiwachana, S. Prediction of 2‐acetyl‐1‐pyrroline content in grains of Thai
Jasmine rice based on planting condition, plant growth and yield component data using chemometrics. Chemom. Intell. Lab. Syst.
2016, 156, 203–210, doi:10.1016/j.chemolab.2016.06.008.


