Embed Size (px)
Citation preview

The
Jour
nal o
f G
ener
al P
hysi
olo
gy
J. Gen. Physiol. © The Rockefeller University Press $15.00Volume 129 Number 1 January 2007 1–16http://www.jgp.org/cgi/doi/10.1085/jgp.200609652
1
A RT I C L E
Functional Characterization and Molecular Cloning of the K+-dependent Na+/Ca2+ Exchanger in Intact Retinal Cone Photoreceptors
Christophe Paillart,1 Robert J. Winkfein,2 Paul P.M. Schnetkamp,2 and Juan I. Korenbrot1
1Department of Physiology, School of Medicine, University of California San Francisco, San Francisco, CA 941432Department of Physiology and Biophysics, Hotchkiss Brain Institute, Faculty of Medicine, University of Calgary, Calgary, Alberta, T2N 4N1, Canada
Light-dependent changes in cytoplasmic free Ca2+ are much faster in the outer segment of cone than rod photo-receptors in the vertebrate retina. In the limit, this rate is determined by the activity of an electrogenic Na+/Ca2+ exchanger located in the outer segment plasma membrane. We investigate the functional properties of the ex-changer activity in intact, single cone photoreceptors isolated from striped bass retina. Exchanger function is characterized through analysis both of the electrogenic exchanger current and cytoplasmic free Ca2+ measured with optical probes. The exchanger in cones is K+ dependent and operates both in forward and reverse modes. In the reverse mode, the K+ dependence of the exchanger is described by binding to a single site with K1/2 about 3.6 mM. From the retina of the fi sh we cloned exchanger molecules bassNCKX1 and bassNCKX2. BassNCKX1 is a single class of molecules, homologous to exchangers previously cloned from mammalian rods. BassNCKX2 ex-ists in four splice variants that differ from each other by small sequence differences in the single, large cytoplasmic loop characteristic of these molecules. We used RT-PCR (reverse transcriptase polymerase chain reaction) of individual cells to identify the exchanger molecule specifi cally expressed in bass single and twin cone photo-receptors. Each and every one of the four bassNCKX2 splice variants is expressed in both single and twin cones indistinguishably. BassNCKX1 is not expressed in cones and, by exclusion, it is likely to be an exchanger expressed in rods.
I N T R O D U C T I O N
In retinal rod and cone photoreceptors, the free con-
centration of cGMP and Ca2+ in the outer segment
cytoplasm is high in the dark and decreases upon illu-
mination to an extent and at a rate dependent on light
intensity. The decrease in cGMP is caused by light-
dependent activation of phophodiesterase, an enzyme
that hydrolyzes the cyclic nucleotide and is the last
in a cascade of successive biochemical reactions initi-
ated by photoexcitation of the visual pigment (for re-
views see Burns and Baylor, 2001; Ebrey and Koutalos,
2001; Burns and Arshavsky, 2005). The decrease in
Ca2+ is caused by active transport of the cation out of
the outer segment by a Na+/Ca2+ exchanger (for re-
view see Schnetkamp, 2004). In the dark, Ca2+ continu-
ously enters rod and cone outer segment through open
cyclic GMP-gated ion channels (CNG channels) and
exits via the Na+/Ca2+ exchanger. Illumination causes
a decrease in cytoplasmic cGMP, CNG channels close
and Ca2+ infl ux declines. The decrease in infl ux, in
the presence of continuing active Ca2+ effl ux via the
exchanger (Yau and Nakatani, 1985; Hodgkin et al.,
1987; Miller and Korenbrot, 1987), results in a light-
dependent fall in cytoplasmic free Ca2+ (Gray-Keller
and Detwiler, 1994; McCarthy et al., 1996; Sampath
et al., 1999). Under experimental conditions designed
to block both Ca2+ infl ux and effl ux in the outer seg-
ment, illumination suffi ciently bright to bleach visual
pigment also causes a slow increase in cytoplasmic
Ca2+ of unknown function and possibly associated with
release from intracellular buffers (Fain et al., 2001;
Cilluffo et al., 2004).
The time course of the light-dependent decrease in
cytoplasmic Ca2+ is remarkably different in rod and
cone outer segments. In rods, the Ca2+ decline upon in-
stantaneous closure of all active CNG channels is well
described by the weighted sum of two exponential pro-
cesses (gecko, Gray-Keller and Detwiler, 1994; toad,
Miller and Korenbrot, 1987; frog, McCarthy et al.,
1996). In nonmammalian species at room temperature,
the fast process has a time constant in the range of 0.67
to 1.35 s, while the slow one has a time constant in the
range 5.3 to 6.7 s. In cones, the decrease in Ca2+ under
comparable conditions is also well described by the
weighted sum of fast and slow exponential processes,
each of which is faster than those in rods; the fast expo-
nential process has a time constant 0.14 to 0.16 s, while
the time constant of the slow one is in the range of 1.5
to 3.5 s (tiger salamander, Sampath et al., 1999; zebrafi sh,
Cilluffo et al., 2004). This difference in the rate of outer
Correspondence to Juan I. Korenbrot: [email protected]
Abbreviations used in this paper: CNG, cyclic GMP-gated ion;
RT-PCR, reverse transcriptase polymerase chain reaction.

2 Cloning and Function of NCKX Exchanger in Cone Photoreceptors
segment Ca2+ clearance contributes to explain the
known difference in photoresponse kinetics and sensi-
tivity between the two receptor types (Korenbrot, 1995;
Rebrik and Korenbrot, 2004).
It is fi rmly established that active Ca2+ effl ux from rod
outer segments in various species is mediated exclu-
sively by the activity of a K+-dependent Na+/Ca2+ ex-
changer (Cervetto et al., 1989; Schnetkamp et al., 1989).
Under physiological solutions, the transporter is elec-
trogenic, one net inward positive charge per turnover,
with a stoichiometry of 4 Na+ (in) for 1 Ca2+ plus 1 K+
(out) (Schnetkamp, 1989; Lagnado and McNaughton,
1991). It may operate in its normal forward mode (passive
Na+ infl ux, active Ca2+ effl ux, net inward current) or
a reverse mode (passive Na+ effl ux, active Ca2+ infl ux,
net outward current) depending on the ionic gradients
(for review see Schnetkamp, 2004). In cones, on the
other hand, the active Ca2+ extrusion is Na+ dependent
(Nakatani and Yau, 1989), but whether it is also K+
dependent has not been demonstrated in intact photo-
receptors, although it has long been assumed to be
the case (Hestrin and Korenbrot, 1990; Perry and
McNaughton, 1991; Sampath et al., 1999). It is conceiv-
able that rods and cones differ because the Na+/Ca2+
exchanger in cones is K+ independent. We demon-
strate here that the Na+/Ca2+ exchanger in cones is
K+ dependent and we characterize some of its physio-
logical features.
While both rod and cone outer segments express
K+-dependent Na+/Ca2+ exchangers, the molecular
mechanisms that explain the difference in Ca2+ clear-
ance rates between rods and cones are not known. Two
simple alternatives are (1) that the same Ca2+ trans-
porter molecule is expressed in both cell types at differ-
ent surface densities, and (2) that different molecules
are expressed in the two cell types. To resolve the query
we must fi rst know the molecular identity and func-
tional features of the exchanger molecule in rods and
cones. K+-dependent Na+/Ca2+ exchangers have been
cloned and recognized to constitute a unique gene fam-
ily named NCKX (human gene SLC24) that, to date, in-
cludes fi ve isoforms (for review see Schnetkamp, 2004).
NCKX1 protein was fi rst purifi ed from bovine retina
(Cook and Kaupp, 1988) where it is expressed in rod
outer segments, but not in those of cones (Kim et al.,
1998). NCKX1 cDNA has been cloned from various
mammalian retinas or eyes (human, Tucker et al., 1998;
dolphin, Cooper et al., 1999; rat, Poon et al., 2000).
NCKX1 mRNA is expressed in human and chicken rods
(Prinsen et al., 2000). The Na+/Ca2+ exchanger pro-
tein has not been purifi ed from any cone photoreceptor.
However, a retinal cDNA clone identifi ed as NCKX2 is
expressed (as mRNA) in ganglion cells and cone photo-
receptors (human, Prinsen et al., 2002; chicken, Prinsen
et al., 2000). Uncertainty on the molecular identity
of the transporter in cones has been introduced by the
recent fi nding that knocking out NCKX2 in mice (Li
et al., 2006) seriously impairs neuronal function in the
hippocampus, but does not appear to suppress cone
transduction signals, at least not as detected in the fl ash
response of the photopic electroretinogram, although
a fi ner analysis of cone transduction in these animals is
yet to be completed.
We report here the cloning and molecular character-
ization of NCKX1 and NCKX2 molecules in the striped
bass retina. We use single cell reverse transcriptase poly-
merase chain reaction (RT-PCR) to determine the cel-
lular origin of the cloned NCKX molecules. We fi nd
bassNCKX2 (in four splice variant forms) is specifi cally
expressed in both single and twin cones and bassNCKX1
is not. BassNCKX1 is likely an exchanger in rods.
M AT E R I A L S A N D M E T H O D S
MaterialsStriped bass (Morone saxatilis) were received from a commercial supplier (Professional Aquaculture Services), maintained in an aquaculture facility under 14:10 L:D cycles and fed ad lib. The UCSF Committee on Animal Research approved protocols for the upkeep and sacrifi ce of the animals. Nifendipine was obtained from CalBiochem and bis-Fura2 from Molecular Probes.
Retinal Cell DissociationFish were dark adapted for 50 min, killed in darkness, and their eyes enucleated under infrared illumination with the aid of an IR-sensitive TV camera and video monitor. Under bass Ringer’s (Table I), the retina was separated from a hemissected eye and subjected to gentle proteolysis (collagenase and hyal-uronidase 1 mg/ml each) for 5 min at room temperature. Enzymes and glucose were washed away by repeated exchange with enzyme-free Ringer’s in which glucose was replaced by pyruvate (5 mM). Photoreceptors were isolated by mechanical trituration of the retina in the pyruvate-Ringer and collected by gentle aspiration of the resulting cell suspension (Miller and Korenbrot, 1993).
SolutionsThe composition of extracellular and electrode-fi lling solu-tions is listed in Table I. The intracellular composition was taken to be the same as the electrode fi lling solutions. In general, electrode-fi lling solutions were of two classes: (1) SBIS (striped bass internal solution), designed to mimic the normal intracel-lular ionic composition and used to characterize the cone’s pho-tocurrents, and (2) NCKX-IS, designed to study the Na+/Ca2+, K+ exchanger operating in reverse mode. These solutions were modifi ed to include either 0.1 mM bis-Fura2 or 2 mM BAPTA titrated with CaCl2 to yield 400 nM free Ca2+. Ca2+-buffered so-lutions were designed using WinMaxC software (www.stanford.edu/~cpatton).
Electrical RecordingThe retinal cell suspension was transferred to an electrophysio-logical recording chamber held on an inverted microscope equipped with DIC contrast enhancement. The bottom of the chamber was a glass coverslip covalently coated with wheat germ agglutinin to which photoreceptors fi rmly adhered. After 10 min, the bathing solution in the chamber was exchanged with glucose-Ringer’s containing 0.1 mg/ml BSA. The bath solution was inter-mittently exchanged throughout the experimental sessions.

Paillart et al. 3
We measured membrane current at room temperature under voltage-clamp using tight-seal electrodes in the whole-cell mode. Electrodes were produced from aluminosilicate glass (Corning 1724, 1.5 × 1.1 mm od x id). Current were recorded with a patch clamp amplifi er (Axopatch 1D; Axon Instruments). Analogue sig-nals were low pass fi ltered through 8-pole Bessel fi lters (Frequency Devices) and digitized on line at twice the analogue rate (Digi-data1322A and pClamp software; Axon Instruments). Analogue recording bandpass in photocurrent studies was 0–500 Hz, while it was 0–20 Hz when measuring reverse NCKX currents.
Light StimulationStimuli were delivered through an epi-illumination system that used the microscope objective as its fi nal lens (Nikon Fluor 40×/1.3 NA oil). The focused image of an adjustable aperture placed on the optical path limited illumination to a 50 μm diame-ter circle centered on the cell under study. Light was generated by a DC operated Tungsten source. Narrow band interference (10 nm bandwidth) and calibrated neutral density fi lters con-trolled light color and intensity, while stimulus duration was controlled with an electronically triggered electromechanical shutter (Vincent and Associates). The cross section of absorption of the bass single cone outer segment on its side is 1.91 μm2. To generate 1-ms half-bandwidth light fl ashes, two shutters were placed in series and electronically controlled as needed. Light in-tensity was measured with a calibrated photodiode placed on the microscope stage at the same position as the cells (UDT Sensors, to measure monochromatic light intensity, or Industrial Fiber Optics photometer, to measure white light power).
Single Cell SuperfusionThe electrophysiological recording chamber was free to rotate on the microscope stage. This allowed us to align the cone under investigation such that superfusing solutions fl owed along its long axis and reduced the possibility that the fl owing solution dislodged the cell. Superfusing solutions fl owed from a 1 cm long, 300 μm ID polyimide capillary (PT Technologies, Vista, CA)
placed with its tip 300 μm from the cell under study and in the same vertical plane. The capillary was the exit port of a 6 input port micromanifold (Model MM-6, Warner Instruments, Hamden, CT). The identity and duration of the solutions super-fusing cells under study were selected with electronic control valves (The Lee Company, Westbrook, CT) controlled with a programmable processor (Model MPS-2, WPI Instruments, Sarasota, FL).
Cytoplasmic Free Ca2+ in Single Cone Outer SegmentsIndividual cells were fi lled with bis-Fura2 (0.1 mM) by exchange/diffusion from the electrode fi lling solution. Single cell current and fl uorescence intensity were measured simultaneously using an instrument previously described in detail (Ohyama et al., 2000). Fluorescence excitation at 380 nm (5 nm half-bandwidth) was limited to a 15-μm diameter circle centered on the cell under study by an aperture placed in the epi-illumination pathway. Emitted fl uorescence was captured with a custom-designed water immersion miniature lens system (5 mm diameter, 0.6 NA, and 2.8 mm working distance) that focused the captured light onto the end of a single fi ber optic. The fi ber optic guided light onto a cooled photomultiplier tube (−20°C, Model R943; Hamamatsu) operated in photon counting mode (model SR400; Stanford Research Systems).
Data AnalysisErrors are presented as standard deviation. Selected mathemati-cal functions were fi t to experimental data with computer-aided nonlinear least square minimization algorithms (Origin Software, Origin Labs, Northampton, MA).
Screen of Bass Retinal cDNA Phagemid LibraryRNA was purifi ed from retinas isolated from light-adapted bass eyes. Freshly isolated tissue was immediately frozen under liquid nitrogen and total RNA recovered using guanidium isothiocyanate (Chomczynski and Sacchi, 1987). mRNA was separated using oligo-dT cellulose chromatography and a cDNA library was constructed
TA B L E I
Composition of Ionic Solutions
Extracellular solutions Electrode-fi lling solutions
Photocurrent data NCKX data Photocurrent data NCKX data
Na+ Ringer’sa Li+/HEDTA-Ringer’s Li+-Ringer’s SBISe NCKX-ISe
NaCl 143 K gluconate 115 gluconic acid 100
NaHCO3 5 K aspartate 20 aspartic acid 20
NaHPO4 5 KCl 20 KOH 10
KCl 2 2.5 Various in isoosmotic exchange for Li+ MgCl2 0.5c NaOH 25
LiCl 157.5 160 ATPNa2 3 TEAClf 35
TEACl 5 5 GTPNa3 1 TMAOHf 92d
MgCl2 1 0.5b 1
CaCl2 1 0.001b 0.1
HEPES 10 10 10 MOPS 10 MOPS 10
Glucose 10
pH 7.5 7.5 7.5 7.25 7.25
mOsM 310 310 310 305 305
Concentrations are all in mM.aRinger’s also contained 1× minimum essential medium (MEM) vitamins and amino acids and 0.1 mg/ml BSA.bTo obtain the free concentrations listed, the solution contained total: HEDTA (2.5 mM), Mg2+ (2.5 mM), and Ca2+ (0.1 mM).cTotal Mg2+ (4 mM).dAs needed to attain fi nal pH.eSolutions were made free of multivalent cations by passing them over Chelex-100 resin before adding Mg2+ or nucleotides.f Tetraethylammoniun (TEA), tetramethylammonium (TMA).

4 Cloning and Function of NCKX Exchanger in Cone Photoreceptors
in Lambda ZapII phagemid using standard protocols (Stratagene). The library consisted of 5 × 10⁷ independent pfu.
The library was screened by low stringency hybridization to a probe consisting of the transmembrane regions of a double dele-tion bovine NCKX1 clone (ddNCKX1), as detailed elsewhere (Prinsen et al., 2000). Positive clones were excised into pBlue-script and sequenced. Analysis of these sequences identifi ed two distinct NCKX molecules, tentatively identifi ed as bass NCKX1 and NCKX2 by sequence homology to known sequences. We cloned four distinct splice variants of the bassNCKX2 clone (2.1, 2.2, 2.3, and 2.6). Full-length bass NCKX1 and NCKX2 clones were recovered by RACE amplifi cation using retinal mRNA as substrate (Cooper et al., 1999). In bass NCKX1 we introduced a myc epitope tag between amino acid residues 95 and 96. In bass NCKX2 we introduced the same epitope tag between amino acid residues 98 and 99.
Single Cell RT-PCRSuspensions of isolated photoreceptors in bass Ringer’s were produced as described above. In light, 50–200 μl of the cell sus-pension was deposited onto a small volume chamber held on an upright microscope equipped with DIC contrast enhancement. The bottom of the chamber was a glass coverslip. The solution in the chamber was thoroughly perfused with Ringer’s to remove cellular debris, and, in addition, individual cells were locally superfused with Ringer’s immediately before their collection. Local superfusion was achieved with a polyimide-coated quartz capillary (ID 150 μm) positioned with its tip 300 μm away from the cell. Under microscopic observation, individual single and twin photoreceptor cells were collected using suction micro-pipettes maneuvered with a micromanipulator. The micro-pipettes were fabricated from Corning 7052 glass capillary tubing (1.5/1.0 mm od/id) with a tip diameter only slightly larger than the width of solitary cells (8 μm for single and 14 μm for twin cones).
Individual cone photoreceptors were collected in the least pos-sible volume (tens of picoliters). The suction micropipette was withdrawn from the chamber and its contents expelled under positive pressure into a 0.6-ml plastic tube containing reagents for immediate synthesis of cDNA using Sensiscript reverse transcrip-tase (QIAGEN) and Oligo (dT)12–18 as primer (Invitrogen), as described elsewhere (Paillart et al., 2006). After 1 h at 37°C, cDNA
synthesis was terminated by 5 min incubation at 93°C. Samples were then stored at −80°C.
We performed two rounds of PCR amplifi cation using Hot-Star Taq DNA polymerase (QIAGEN) in a fi nal 50-μl volume. 4 or 5 μl of cell cDNA was used as template in the fi rst round PCR, and 1 μl of the resulting product was used in the second round. The HotStar Taq DNA polymerase was initially activated at 95°C for 15 min. Typically, we used 30 PCR cycles, each con-sisting of 30-s periods at 94°C, 30 s at the appropriate annealing temperatures (Ta), and 1 min at 72°C. In the fi nal cycle, the 72°C step was sustained for 11 min. PCR products were size sepa-rated by horizontal electrophoresis in 2% agarose gels. Discrete bands were excised, DNA recovered (QIAquick kit; QIAGEN) and sequenced.
The sequence and melting temperature (Ta) of primers used to specifi cally identify the expression of bass NCKX1 and the various slice variants of bass NCKX2 are listed in Table II. As positive control for the effi ciency of the RT-PCR process, we assayed each cell sample for the expression of β subunits of the cone CNG channel (bass CNGB3) using the SB3/SB2 primers (Table II) in both PCR rounds, as detailed elsewhere (Paillart et al., 2006).
R E S U LT S
Previous research has demonstrated that active Ca2+ re-
moval from the cone photoreceptor outer segments
depends on the activity of a Na+/Ca2+ exchanger
(Nakatani and Yau, 1989). To investigate the properties
of this active transporter, its potential dependence
on K+ ions, and its molecular structure we character-
ized Na+/Ca2+ exchange in intact single cones isolated
from striped bass retina. These are relatively large cells
amenable to both physiological (Miller and Korenbrot,
1993) and molecular biology investigation (Paillart
et al., 2006).
Na+/Ca2+ Exchanger Activity (NCKX) in Bass Single Cone PhotoreceptorsWe measured membrane currents under voltage clamp
using tight-seal electrodes fi lled with a solution designed
to mimic normal intracellular ionic composition (Table I,
SBIS). In thorough darkness, single cones bathed in
normal Ringer’s solution (Table I) exhibit a mean hold-
ing current at −40 mV of −3.6 ± 5.8 pA (n = 20). Illu-
mination suppresses an outer segment inward current
that fl ows through cGMP-gated ion channels; following
convention, we defi ne this light-dependent suppression
in inward current as an outward photocurrent. As typi-
cal of all vertebrate photoreceptors, fl ash illumination
of bass single cones causes a transient photocurrent
whose peak amplitude increased with light intensity up
to a saturating value (Fig. 1) (Miller and Korenbrot,
1993). Brighter fl ashes sustain the saturated photocur-
rent amplitude for ever longer periods of time. The ini-
tial time course of saturated photocurrents is well fi t by
the sum of two, fi rst order exponential processes (Cobbs
and Pugh, 1987; Hestrin and Korenbrot, 1990; Perry
and McNaughton, 1991). The faster process, time con-
stant of 2.5–5 ms, is light dependent and refl ects the
TA B L E I I
Sequence and Melting Temperature (Ta) of Primers Used in Single-Cell RT-PCR of Cone Photoreceptors To Determine the Cellular Expression of
NCKX Homologues
Name Sense Sequence
bassNCKX2-specifi c primers
SBX1 Forward 5′-G C A C C C A A A G A T G A T G A G A A C -3′SBX2 Reverse 5′-A G A G C C A C A G A G G A A G G A T G -3′SBX3 Forward 5′-G A C G A A G G T A T G G G A C G T T T C -3′SBX3M Forward 5′-C T C A G T G A C G A A G G T A T G G G -3′SBX4 Reverse 5′-G C T T T T C T T G G T T G T G T C T G G -3′SBX5 Forward 5′-G T G A C G A A G G A C G T T T C A A A G A G -3′SBX7 Forward 5′-C A A T G C C A A T G G T G T A G C T G -3′SBX7M Forward 5′-T G C C A A T G G T G T A G C T G A T A A A -3′bassNCKX1-specifi c primers
SBX13 Forward 5′-T G A G G A G C A C C A T C T T C C A -3′SBX14 Reverse 5′-C T C C T C C T C C T C T T C T T C T T C T T C -3′
The annealing temperature, Ta, was 55°C for each and every one of
the primers.

Paillart et al. 5
limiting rate of activation of the enzymes in the photo-
transduction cascade (Cobbs and Pugh, 1987; Hestrin
and Korenbrot, 1990). This fast component, we now
know, is more properly described by a Gaussian func-
tion (Lamb and Pugh, 1992; Smith and Lamb, 1997).
The slower process is insensitive to light and is well fi t by
the following function (Fig. 1, inset):
= + − − τ( ) (1 exp( / )),photo init NCKX NCKXI t I I t (1)
where Iinit is the amplitude of the photocurrent exclud-
ing the exponential component, INCKX is the maximum
amplitude of the exponential component, and τNCKX is
its time constant. The saturated photocurrent ampli-
tude is Isat = Iinit + INCKX. The mean (±SD) values of
these constants were: Iinit = 27.8 ± 8.6 pA, INCKX = 2.9 ±
1 pA, and τNCKX = 62.8 ± 13.5 ms (n = 20 cells). The
maximum amplitude of the exponential component is
9.8 ± 2.4% of the maximum photocurrent amplitude.
The slow exponential component in the initial time
course of the saturated photocurrents in bass single
cones (Fig. 1) is similar to signals previously observed
in cones of the tiger salamander retina, and under-
stood to arise from the electrogenic activity of a Na+/
Ca2+ exchanger (Nakatani and Yau, 1988; Hestrin and
Korenbrot, 1990; Perry and McNaughton, 1991). A di-
agnostic tool to confi rm the functional origin of this
exponential component is to characterize the kinetics
of the saturated photocurrent in the presence and ab-
sence of extracellular Na+ and Ca2+ (Yau and Nakatani,
1985; Hodgkin et al., 1987). If the exponential com-
ponent arises from Na+-dependent active Ca2+ extru-
sion, it should disappear when Na+ is removed from
solution because Na+/Ca2+ exchanger activity is abso-
lutely dependent on the presence of Na+. It is impor-
tant to replace Na+ with a cation that permeates
through the CNG channels in order to preserve the
light-sensitive current. Moreover, extracellular Ca2+
must also be removed alongside Na+ to avoid loading
the cytoplasm with Ca2+ and, hence, blocking photo-
transduction (Yau and Nakatani, 1985; Hodgkin et al.,
1987). We replaced Na+ with Li+ because the perme-
ation properties of both cations through cone CNG
channels are nearly the same (Picones and Korenbrot,
1992; Haynes, 1995). Results of such ion substitution
test in bass single cones are illustrated in Fig. 2. In nor-
mal Ringer’s, a bright fl ash caused a photocurrent that
approaches its saturated amplitude with an exponen-
tial time course (Fig. 2, A and B), remained saturated
for nearly 1 s, and then slowly recovered to its starting
value. When Na+ in the Ringer’s was isoosmotically re-
placed with Li+ and Ca2+ reduced to 1 μM concentra-
tion (using the chelator HEDTA), the same fl ash in the
same cell generated a photocurrent that lacked the ex-
ponential component at its onset, yet remained satu-
rated and recovered with nearly unchanging features
(Fig. 2, C and D). The change in photocurrent kinetics
was reversed upon returning to Na+ Ringer. We made
the same observation in every cell tested (n = 6). The
reversible loss of the slow exponential component in
the saturated photocurrent when extracellular Na+
and Ca2+ are removed demonstrates this component
arises from the electrogenic activity of the Na+/Ca2+
exchanger.
Data in Fig. 2 also show that the recovery from photo-
current saturation in cone photoreceptors is generally
similar in normal and Li+, low Ca2+ Ringer’s. This be-
havior in bass cones is similar to that reported for tiger
Figure 1. Photocurrents in striped bass isolated single cones. Shown are voltage-clamped cur-rents measured at −40 mV at room temperature. 10-ms fl ashes of 540-nm light were delivered at time zero. Intensity of the fl ashes tested was (in photons/μm2) 0.3, 1.7, 7.8, 44.6, 177.8, 1,071, 4,897, 19,496, and 112,190, respectively. At inten-sities suffi cient to saturate photocurrent amplitude, the current approached saturation along a time course well described by a single fi rst order expo-nential process (inset, photocurrents generated by the last four fl ashes). The exponential time course was the same at all intensities tested and was well fi t by Eq. 1 with the adjustable values: Iinit = 32.3 pA, INCKX = 3.8 pA, and τNCKX = 46.1 ms.

6 Cloning and Function of NCKX Exchanger in Cone Photoreceptors
salamander rods tested under a similar experimental
design (Nikonov et al., 1998).
K+ Dependence of NCKX CurrentTo determine whether the exchanger in cone photore-
ceptors is K+ dependent we examined the ionic proper-
ties of the current generated by the exchanger. To better
resolve the features of currents generated by the Na+/
Ca2+ exchanger (NCKX) we lessened the contribution
of other current sources through pharmacological
block of several of the voltage- and ligand-gated ion
channels expressed in cone photoreceptors (Maricq and
Korenbrot, 1988, 1990; Barnes and Hille, 1989). L-type
voltage-gated Ca2+ channels were blocked with nifendipine
(10 μM), and delayed rectifi er voltage-gated K+ chan-
nels (IKv) were blocked with intra- and extracellular
quaternary amines, TEA and TMA (Table I). We did not
block the inward rectifi er channels (Ih) to make avail-
able an electrical assay of cell integrity but conducted all
studies at 0 mV, a voltage at which these channels are
inactive. Finally, cells were under constant illumination
and the tight seal electrode-fi lling solution lacked ATP
and GTP. These conditions prevent the accumulation
of intracellular cGMP and assured that the cell’s CNG
ion channels were inactive. Currents were measured
commencing 3.5–4 min after fi rst attaining whole-cell
mode, time suffi cient for cell cytoplasm and electrode
fi lling solution to come to equilibrium (Holcman and
Korenbrot, 2004).
To characterize the K+ dependence of the Na+/
Ca2+ exchanger, we fi lled cones with an ionic solution,
NCKX-IS (Table I) designed to maintain normal, for-
ward operation of the transporter, except during brief
experimental trials when changes in extracellular so-
lutions forced the exchanger to operate in its reverse
mode. If the cell-fi lling solutions did not sustain nor-
mal exchanger function, cones fi lled with Ca2+ and did
not survive. While loading NCKX-IS, membrane volt-
age was held at zero; membrane current was initially
outward (15–40 pA in amplitude) due to outward K+
fl ux through voltage-gated K+ channels. As contents
exchanged/diffused between cell and electrode lumen,
these channels were blocked and the current slowly de-
clined to a stationary value reached in 3 min. For 41
cells, the mean value of this stationary current at 0 mV
was 3.4 ± 7.6 pA (range −10 to 20 pA).
Fig. 3 illustrates typical currents measured in individ-
ual single cones starting 3 min after fi rst attaining whole
cell mode. Statistical data for the universe of cells stud-
ied is detailed in Table III. Switching the extracellular
solution from normal Ringer’s to a Na+-free solution
containing 0.1 mM Ca2+ and Li+, but no K+, caused
small changes in current that likely arise from changes
in junction and tip potentials due to the difference in
ionic mobilities of Na+ and Li+. The current amplitude
in Li+, absent K+, was measured in each and every cell
studied, and we used this value as a benchmark to de-
fi ne the health of the cells and to compare among them.
For 41 cells, this benchmark current at 0 mV holding
voltage had a mean value of 5.9 ± 8.3 pA (range −11 to
25 pA). Cell superfusing solution was next switched to a
Li+ solution now containing only 1 μM free Ca2+, 1 mM
free Mg2+, and varying test K+ concentrations. When
the K+ concentration was small (≤10 mM), this solu-
tion change caused almost no change in current (Fig.
3 A). At higher extracellular K+ concentrations, the
solution change caused an inward current (Fig. 3 B).
This is almost certainly due to inward K+ fl ux through
Figure 2. Effects of isoosmotic replacement of ex-tracellular Na+ with Li+ on the time course along which bright fl ash photocurrent approaches ampli-tude saturation. Shown are voltage-clamped photo-currents measured at −40 mV and elicited by a 1-ms fl ash of bright white light (intensity: 0.26 nW/μm2). Currents were measured in the same dark-adapted cone both in normal Ringer’s solution and in Na+-free Li+-Ringer’s containing 1 μM free Ca2+. Flashes were delivered 20 s after switching solutions. A and B show the data measured in normal Ringer’s dis-played at two different temporal resolutions. The photocurrent approaches saturation with an expo-nential time course well described by Eq. 1 with the adjustable values: Iinit = 33.1 pA, INCKX = 5.9 pA, and τNCKX = 84.4 ms (open circles). C and D show the data measured in Li+ Ringer’s displayed at two tem-poral resolutions. The photocurrent approached saturation nearly instantaneously without evidence of the slow exponential component. Open circles depict a line optimally fi t to the data with slope 0.0002 pA/s.
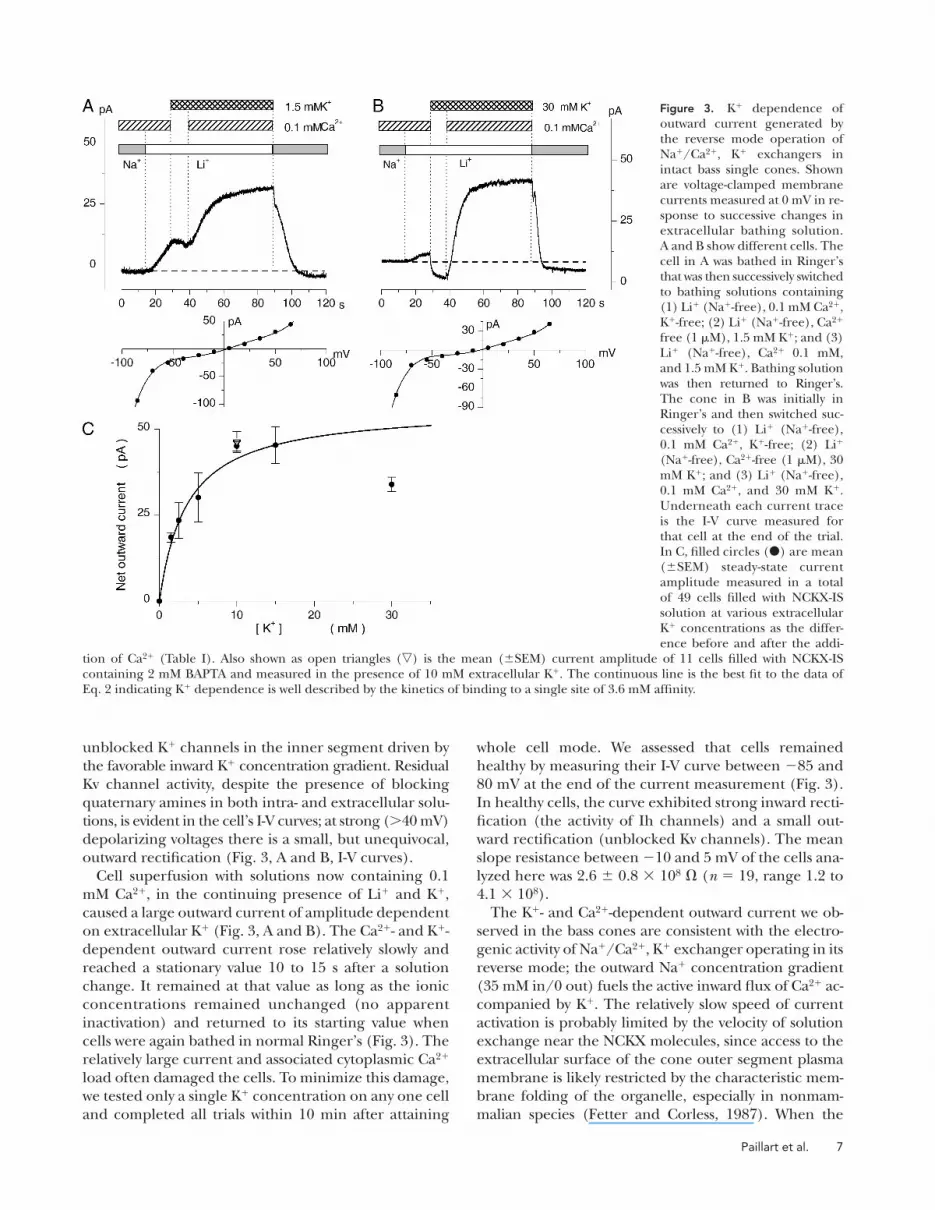
Paillart et al. 7
unblocked K+ channels in the inner segment driven by
the favorable inward K+ concentration gradient. Residual
Kv channel activity, despite the presence of blocking
quaternary amines in both intra- and extracellular solu-
tions, is evident in the cell’s I-V curves; at strong (>40 mV)
depolarizing voltages there is a small, but unequivocal,
outward rectifi cation (Fig. 3, A and B, I-V curves).
Cell superfusion with solutions now containing 0.1
mM Ca2+, in the continuing presence of Li+ and K+,
caused a large outward current of amplitude dependent
on extracellular K+ (Fig. 3, A and B). The Ca2+- and K+-
dependent outward current rose relatively slowly and
reached a stationary value 10 to 15 s after a solution
change. It remained at that value as long as the ionic
concentrations remained unchanged (no apparent
inactivation) and returned to its starting value when
cells were again bathed in normal Ringer’s (Fig. 3). The
relatively large current and associated cytoplasmic Ca2+
load often damaged the cells. To minimize this damage,
we tested only a single K+ concentration on any one cell
and completed all trials within 10 min after attaining
whole cell mode. We assessed that cells remained
healthy by measuring their I-V curve between −85 and
80 mV at the end of the current measurement (Fig. 3).
In healthy cells, the curve exhibited strong inward recti-
fi cation (the activity of Ih channels) and a small out-
ward rectifi cation (unblocked Kv channels). The mean
slope resistance between −10 and 5 mV of the cells ana-
lyzed here was 2.6 ± 0.8 × 10⁸ Ω (n = 19, range 1.2 to
4.1 × 10⁸).
The K+- and Ca2+-dependent outward current we ob-
served in the bass cones are consistent with the electro-
genic activity of Na+/Ca2+, K+ exchanger operating in its
reverse mode; the outward Na+ concentration gradient
(35 mM in/0 out) fuels the active inward fl ux of Ca2+ ac-
companied by K+. The relatively slow speed of current
activation is probably limited by the velocity of solution
exchange near the NCKX molecules, since access to the
extracellular surface of the cone outer segment plasma
membrane is likely restricted by the characteristic mem-
brane folding of the organelle, especially in nonmam-
malian species (Fetter and Corless, 1987). When the
Figure 3. K+ dependence of outward current generated by the reverse mode operation of Na+/Ca2+, K+ exchangers in intact bass single cones. Shown are voltage-clamped membrane currents measured at 0 mV in re-sponse to successive changes in extracellular bathing solution. A and B show different cells. The cell in A was bathed in Ringer’s that was then successively switched to bathing solutions containing (1) Li+ (Na+-free), 0.1 mM Ca2+, K+-free; (2) Li+ (Na+-free), Ca2+ free (1 μM), 1.5 mM K+; and (3) Li+ (Na+-free), Ca2+ 0.1 mM, and 1.5 mM K+. Bathing solution was then returned to Ringer’s. The cone in B was initially in Ringer’s and then switched suc-cessively to (1) Li+ (Na+-free), 0.1 mM Ca2+, K+-free; (2) Li+ (Na+-free), Ca2+-free (1 μM), 30 mM K+; and (3) Li+ (Na+-free), 0.1 mM Ca2+, and 30 mM K+. Underneath each current trace is the I-V curve measured for that cell at the end of the trial. In C, fi lled circles () are mean (±SEM) steady-state current amplitude measured in a total of 49 cells fi lled with NCKX-IS solution at various extracellular K+ concentrations as the differ-ence before and after the addi-
tion of Ca2+ (Table I). Also shown as open triangles () is the mean (±SEM) current amplitude of 11 cells fi lled with NCKX-IS containing 2 mM BAPTA and measured in the presence of 10 mM extracellular K+. The continuous line is the best fi t to the data of Eq. 2 indicating K+ dependence is well described by the kinetics of binding to a single site of 3.6 mM affi nity.

8 Cloning and Function of NCKX Exchanger in Cone Photoreceptors
solution is switched back to Ringer’s, the exchanger re-
turns to its normal, forward operation. The outward go-
ing current is replaced by an inward going current, and
Ca2+ is transported out from the outer segment (next
section), until the cell returns to the initial ionic gradi-
ents and its initial Ca2+ concentration. We affi rmed the
K+- and Ca2+-dependent outward current activated by
superfusion and the inward current observed upon re-
turning to Ringer’s arises from the electrogenic activity
of the NCKX exchanger by demonstrating that the cur-
rents are specifi cally associated with loading and unload-
ing free Ca2+ in the cone outer segment (see below).
The amplitude of the NCKX reverse current de-
pended strictly on the presence of extracellular K+. The
mean current amplitude measured in the presence of
various K+ concentrations as the difference before and
after the addition of 0.1 mM Ca2+ is presented in Table III
and Fig. 3. The current amplitude depends on extracel-
lular K+ in a manner well described by the kinetics of
binding to a single site on the exchanger:
=+
I [ ],
[ ]
maxm K
m
o
o
KI
K K (2)
where Imax is the maximum possible current, [K+]o is the
extracellular K+ concentration, and KmK is the binding
constant of the single binding site. The adjustable pa-
rameters that best fi t the mean data of a total of 54 cells
(Fig. 3) were Imax = 57 pA and KmK = 3.6 mM.
Changes in Cytoplasmic Free Ca2+ Caused by NCKX ActivityTo test the relationship between the K+- and Ca2+-
dependent NCKX current and cytoplasmic free Ca2+
levels, we simultaneously measured membrane current
and cell fl uorescence in bass cone loaded with the indi-
cator dye bis-Fura2 dye (0.1 mM) by diffusion from the
tight seal electrode (Table I, solution NCKX-IS with dye).
Cell fl uorescence was excited at 380 nm and fl uores-
cence emission intensity measured in the 480–560 nm
range. We did not carry out thorough in situ dye calibra-
tion and can only report relative, not absolute, changes
in Ca2+ concentration.
Activation of the reverse mode NCKX transport ac-
tivity caused simultaneous changes in current and cyto-
plasmic free Ca2+, as illustrated in Fig. 4. While single
cones were bathed in normal Ringer’s, the cytoplasmic
free Ca2+ was fi xed and fl uorescence emission intensity
TA B L E I I I
Mean Current Amplitude of Reverse Mode NCKX Current in Bass Single Cones
K+ concentration Steady-state current amplitude n
mM pA
0 0
1.5 18.6 ± 4 9
2.5 23.5 ± 9 4
5 30.2 ± 14.4 5
10 45.1 ± 3.1 6
10a 46.3 ± 9.7 11
10b 45.9 ± 7.6 6
15 45.4 ± 10.7 5
30 34 ± 5.9 9
aElectrode-fi lling solution contained 2 mM BAPTA titrated to yield 400 nM
free Ca2+.bElectrode-fi lling solution contained 0.1 mM bis-Fura2.
Figure 4. Simultaneous changes in membrane current and cytoplasmic free Ca2+ in a single bass cone upon activation of reverse mode Na+/Ca2+, K+ transport activity. Shown are voltage-clamped membrane current measured at 0 mV and fl uorescence emission intensity of 0.1 mM bis-Fura2 loaded into the isolated cell. Fluorescence was excited at 380 nm and light intensity emit-ted in the 480–560 nm range measured using photon counting technology (counts/100 ms bin). The solution superfusing the cell was switched from normal Ringer’s fi rst to a Na+-free (Li+) solution containing 10 mM K+ and 1 μM Ca2+ and then to the same solution now containing 0.1 mM Ca2+. The simultaneous presence of K+ and Ca2+ activated the NCKX transporter in its reverse mode and caused both activation of an outward current and a rise in cytoplasmic free Ca2+. Both current and free Ca2+ returned to their starting values after return of the cell to normal Ringer’s. The fl uorescence emission intensity of bis-Fura2 was not absolutely calibrated in situ, nonetheless, free Ca2+ reaches a value of near 1 μM, as revealed by the minimum emission in-tensity of the dye (the continuous trace), which is attained at 1 μM free Ca2+.

Paillart et al. 9
constant. Superfusing the cells with a Na+-free (Li+)
solution with 10 mM K+ and 1 μM Ca2+ caused an in-
ward current with a small change in cytoplasmic Ca2+
level. The inward current, as discussed above, refl ects
inward K+ fl ux through unblocked Kv channels. Acti-
vation of the reverse mode of NCKX activity by the ad-
dition of 0.1 mM Ca2+ caused an outward current and
a large rise in cytoplasmic Ca2+. Upon returning the
cell to normal Ringer’s solution, both current and
cytoplasmic Ca2+ returned to their starting values. We
made the same observation in every one of the cells
thus tested (n = 7). That is, engaging the NCKX
exchanger in its reverse mode caused an outward cur-
rent and cytoplasmic Ca2+ loading, returning the ex-
changer to its normal, forward mode promptly caused
an inward current and emptied Ca2+ out of the cone
outer segment.
The quantitative features of the NCKX reverse mode
current in bisFura2-loaded cones were indistinguish-
able from those observed in the absence of dye and re-
ported above. The benchmark current measured in
the Li+, K+-free solution had a mean value of 2.3 ± 10.6 pA (six cells), compared with 5.9 ± 8.3 pA in the
absence of dye (see above). The maximum outward
current, measured as the difference in amplitude in
the absence and presence of Ca2+ while in the continu-
ous presence of 10 mM K+, had a mean value of 45.9 ±
7.6 pA (six cells, Table III), again indistinguishable
from Fura2-free cells. Indeed, buffering with up to 2 mM
intracellular BAPTA did not affect the maximum out-
ward NCKX current in 10 mM K+ (mean 46.3 ± 9.7, 11
cells, Table III).
The time course of the reverse mode NCKX current
is a true measurement of the exchanger activity since
one net charge is transported per molecular turnover
of NCKX. The change in bis-Fura2 fl uorescence, on the
other hand, is only an indirect measurement of the ex-
changer transport because (1) fl uorescence emission
intensity of bis-Fura2 excited at a single wavelength is
not a linear function of Ca2+ concentration, and (2) the
rate of changes in free Ca2+ is affected by intracellular
Ca2+ buffers of unknown kinetics.
A thorough quantitative examination of the kinetic
relationship between NCKX current and cytoplasmic
Ca2+ is beyond the scope of the work reported here,
nonetheless, it is evident that free Ca2+ is not simply
the integral of the current (as would be expected for
passive fl ux mechanisms, ion channels for example).
Rather, both current and Ca2+ slowly reach a new steady
state after activation of the transporter by the change
in superfusing solution (Fig. 4). In the new stationary
condition, Ca2+ infl ux (through the active NCKX ex-
changer) and its effl ux from the outer segment (by dif-
fusion into the inner segment and equilibration with
the electrode lumen) come to a dynamic balance. At
this balance point, Ca2+ infl ux and effl ux are the same
in magnitude; the net Ca2+ fl ux is zero and the Ca2+
concentration is fi xed (the fl uorescence is constant).
Cloning of Retinal Bass NCKX Exchangers and RT-PCR–based Assignment of Cell of OriginA bass retinal cDNA phagemid library was screened by
hybridization with probes derived from known NCKX
mammalian sequences. RACE extension yielded com-
plete, open reading frames of sequences tentatively
designated as NCKX1 or NCKX2 by homology with pre-
viously known mammalian and avian sequences. NCKX2
exists in four spliced variants NCKX2.1, NCKX2.3,
NCKX2.4, and NCKX2.6. Sequences are deposited in
GenBank/EMBL/DDBJ under the following accession
nos.: bassNCKX1, EF076649; bassNCKX2.1, EF076650;
bassNCKX2.2, EF076652; bassNCKX2.3, EF076651; and
bassNCKX2.6, EF076653.
To determine the specifi c cellular origin of the vari-
ous bass NCKX retinal sequences, we conducted single
cell RT-PCR assays of single and twin cones. We collected
individual cells and produced cDNA from each one us-
ing oligo-dT primers. We followed with two sequential
rounds of PCR using primer pairs designed to yield
an amplicon if, and only if, a specifi c NCKX sequence
was expressed in the cell under investigation. Table IV
lists the primers we used in the fi rst and second round
PCR to identify each of the fi ve possible sequences. The
cDNA generated from each cell was assayed to assess the
expression of every one of the fi ve NCKX sequences in
the same cell. PCR products were separated by gel elec-
trophoresis, and detected amplicons were sequenced in
both directions using the same primers as in the second
round PCR.
For quality control, alongside each cell’s reaction we
performed positive and negative controls. Positive con-
trol, to ensure the cone’s mRNA was intact and viable,
was to assess the expression of the β subunit of the
cGMP-gated ion channel (CNGB3) using protocols and
primers described elsewhere (Paillart et al., 2006). Neg-
ative control, to ensure only cone specifi c material was
TA B L E I V
Primers Designed To Identify Specifi c NCKX Molecular Species as Reaction Products of Two Sequential Nested PCR Reactions
NCKX2.1 NCKX2.2 NCKX2.3 NCKX2.6 NCKX1
PCR1 SBX3M/SBX2 SBX1/SBX4 SBX5/SBX2 SBX1/SBX4 SBX13/SBX14
PCR2 SBX7M/SBX2 SBX3M/SBX4 SBX7M/SBX2 SBX5/SBX4 SBX13/SBX14
Size amplicon 209 bp 149 bp 209 bp 139 bp 404 bp

10 Cloning and Function of NCKX Exchanger in Cone Photoreceptors
amplifi ed, was to assess the expression of the designated
NCKX in the cell bathing solution collected in the same
volume and in the space where individual cells were
gathered. We call this test volume a sham-cell.
Typical electrophoretic analysis of the products gen-
erated by two nested, consecutive RT-PCR reactions in
individual single and twin cones are illustrated in Figs.
5 and 6. We obtained identical results in the analysis of
10 other single and 8 other twin cones. Fig. 5 A shows
an image of a gel used to characterize the reaction prod-
ucts from a single cone using primer pairs designed to
assess expression of the four splice variants of NCKX2
(Table IV), alongside positive and negative controls.
The controls yielded the required results, indicating
that the cell’s mRNA was intact and there were no
Figure 5. Single and twin cones express each of four splice variants of NCKX2. Images of agarose gel used to characterize reaction products obtained by PCR amplifi cation of single photo-receptor mRNA. Panel SC5 shows the results obtained in one sin-gle cone. Panel TC2 shows results in one twin cone pair. cDNA synthesized from individual cells was subjected to two rounds of nested PCR amplifi cation with primer pairs designed to specifi -cally identify the different bassNCKX2 splice variants. Two ampli-cons were detected with every one of the primer pairs tested. The low abundance amplicon (faint) one is the product of the fi rst round PCR and the abundant one (bright) is produced in the second PCR round. The size and nucleotide sequence of the am-plicons indicate that both single and twin cones express each and every one of the four possible splice variants. The primers tested and the expected amplicon sizes were as follows (Tables II and IV): lane 1, 100–1,000-bp standard DNA size markers; lane 2, the photoreceptor tested with primers SBX3M/SBX4, 149-bp ampli-con expected for NCKX2.2; lane 3, the photoreceptor tested with primers SBX7M/SBX2, 209-bp amplicon expected for NCKX2.3; lane 4, the photoreceptor tested with primers SBX7M/SBX2, 209-bp amplicon expected for NCKX2.1; lane 5, the photoreceptor tested with primers SBX5/SBX4, 139-bp amplicon expected for NCKX2.6; lane 6, negative control, a sham cell reacted with prim-ers SBX1/SBX2, affi rms the absence of relevant DNA contami-nants in the bathing solution collected alongside the individual photoreceptor cells; lane 7, negative control, distilled water tested with the same primers as in lane 6, affi rms absence of DNA con-taminants throughout the sequence of chemical reactions; lane 8, positive control, the photoreceptor tested with primers SB3/SB2 (from Paillart et al., 2006), 457-bp amplicon confi rms expression of CNGB3 in the cone.
Figure 6. Single and twin cones do not express NCKX1. Agarose gel electrophoresis of reaction products obtained by PCR ampli-fi cation of single photoreceptor mRNA. Panel SC3 shows results obtained in one single cone. Panel TC5 shows results in one twin cone pair. cDNA synthesized from individual cells was subjected to two PCR rounds of amplifi cation with primer pairs designed to specifi cally identify bassNCKX1. An NCKX1 ampli-con was not detected in either single or twin cones, indicating that cones do not express this molecule. The primers tested and the expected amplicon size were as follows (Tables II and IV): lane 1, 100–1,000-bp standard DNA size markers; lane 2, the photoreceptor tested with NCKX1-specifi c primers SBX13/SBX14, 457-bp amplicon expected; lane 3, negative control, a sham cell reacted with the same primers as in lane 2, affi rms the absence of relevant DNA contaminants in the bathing solution collected alongside the individual photoreceptor cells; lane 4, positive control, the photoreceptor tested with primers SB3/SB2 (from Paillart et al., 2006), 457-bp amplicon, confi rms expres-sion of CNGB3 in the cone; lane 5, positive control, cloned bassNCKX1 tested with the same primers as in lane 2, 404-bp amplicon confi rms the effectiveness of the PCR reaction to report the existence of NCKX1; lane 6, negative control, distilled water tested with the same primers as in lane 2, affi rms the ab-sence of DNA contaminants throughout the sequence of chemi-cal reactions.
Paillart et al. 11
re action products in the medium bathing the cell. Two
amplicons were identifi ed as the products of the two
rounds of nested PCR: a low abundance one (the rather
faint band) at 300 bp in size and an abundant one
(intense band) of different size depending on the prim-
ers used (lanes 2–6). The low abundance amplicon at
300 bp is of the size expected as the product of the
fi rst PCR round. The abundant amplicon is of the size
expected as the product of the second PCR round, one
that uses the 300-bp amplicon as its substrate. We sequenced
the abundant amplicon and found the sequence to be
exactly that anticipated from the ORF cDNA retinal
clone. Identical results were obtained in the analysis of
the PCR products obtained from individual twin cones
(Fig. 5 B). These results demonstrate that both single
and twin cones express NCKX2 in all its splice variants.
NCKX2, hence, is the K+-dependent Na+ for Ca2+ ex-
changer in bass cones and it is the same in single and
twin cells.
Fig. 6 shows images of gels used to analyze the RT-PCR
reaction products from a single cone or a twin cone ana-
lyzed to assess the expression of NCKX1. Also shown are
positive and negative control reactions run alongside
the cell samples. In both cell types we failed to observe
reaction products using specifi c primer pairs. Positive
and negative controls yielded the required reaction
products, indicating that mRNA was intact in the cells
tested, yet the NCKX1-specifi c primers did not yield
products in either single or twin cones. We obtained
the same data in the analysis of two single and two twin
cones. The data indicate, then, that bass NCKX1 is not
expressed in cone photoreceptors. Given this fact, and
the homology of bass NCKX1 to the rod-specifi c NCKX1
molecules expressed in mammals, we suggest that bass
NCKX1 is the K+-dependent Na+/Ca2+ exchanger in
bass rods.
BassNCKX1 and BassNCKX2 ProteinThe deduced amino acid sequence of the bass cone
NCKX2 exchanger and the bass NCKX1 exchanger are
presented in Figs. 7 and 8. The sequences are aligned
and compared with those from human and chicken,
two species from which both rod and cone exchang-
ers have been cloned and the respective transcripts
shown to be present in rod and cone photoreceptors.
The conserved, general features of the sequences are
annotated in the fi gure. (1) H0 is present in all se-
quences as a strongly hydrophobic segment, although
its specifi c amino acid sequence varies. H0 is a cleav-
able signal peptide important for plasma membrane
targeting (Kang and Schnetkamp, 2003). (2) An N-
terminal hydrophilic loop follows the H0 hydropho-
bic segment. This N-terminal loop is poorly conserved
among the three species, although all sequences have
a cluster of positively charged residues. (3) Two clus-
ters of putative transmembrane segments (H1–H5 and
H6–H11) that include residues important for Ca2+
binding and K+ dependence of the exchanger func-
tion (Kang et al., 2005a,b). (4) The two clusters are
separated by a large hydrophilic loop, likely located
in the cytoplasm. This loop in mammalian NCKX1 is
larger than that in chicken or bass NCXK1, and larger
than the corresponding loop in all NCKX2 molecules
cloned to date. Thus, mammalian NCKX1 proteins are
larger by 500 amino acids than all other NCKX1 and
NCKX2. The sequence of the cytosolic loop is poorly
conserved among species, but all contain a stretch of
acidic residues, immediately preceding H6. (5) The
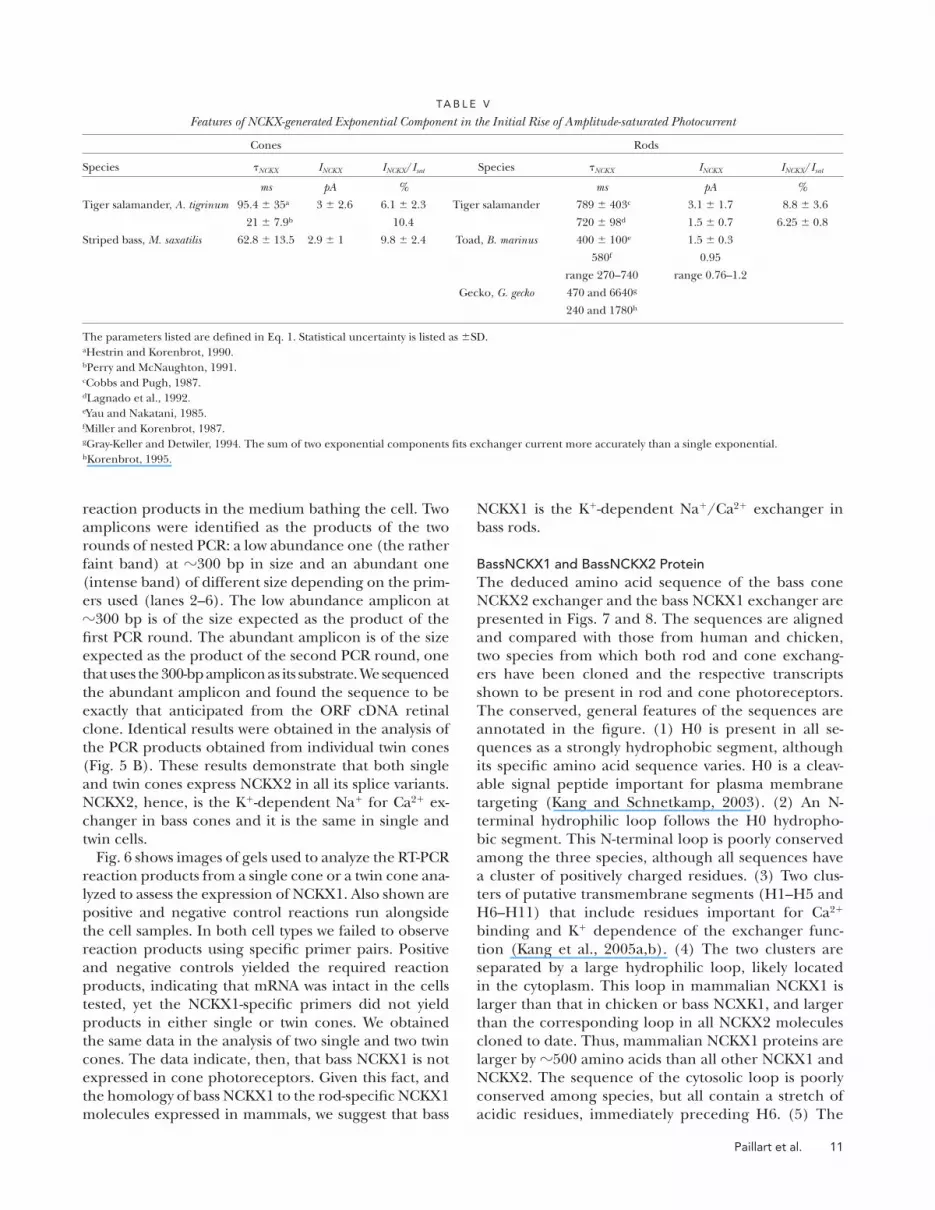
TA B L E V
Features of NCKX-generated Exponential Component in the Initial Rise of Amplitude-saturated Photocurrent
Cones Rods
Species τNCKX INCKX INCKX/Isat Species τNCKX INCKX INCKX/Isat
ms pA % ms pA %
Tiger salamander, A. tigrinum 95.4 ± 35a 3 ± 2.6 6.1 ± 2.3 Tiger salamander 789 ± 403c 3.1 ± 1.7 8.8 ± 3.6
21 ± 7.9b 10.4 720 ± 98d 1.5 ± 0.7 6.25 ± 0.8
Striped bass, M. saxatilis 62.8 ± 13.5 2.9 ± 1 9.8 ± 2.4 Toad, B. marinus 400 ± 100e 1.5 ± 0.3
580f 0.95
range 270–740 range 0.76–1.2
Gecko, G. gecko 470 and 6640g
240 and 1780h
The parameters listed are defi ned in Eq. 1. Statistical uncertainty is listed as ±SD.aHestrin and Korenbrot, 1990.bPerry and McNaughton, 1991.cCobbs and Pugh, 1987.dLagnado et al., 1992.eYau and Nakatani, 1985.fMiller and Korenbrot, 1987.gGray-Keller and Detwiler, 1994. The sum of two exponential components fi ts exchanger current more accurately than a single exponential.hKorenbrot, 1995.

12 Cloning and Function of NCKX Exchanger in Cone Photoreceptors
cytosolic loops of NCKX2 exhibit alternate splicing. Two
splice variants have been observed for both chicken
and human NCKX2 with the shorter variants lacking
the same stretch of 17 residues in the middle of the
cytosolic loop. Here, we cloned four distinct splice
variants of bass NCKX2 and found transcripts for each
variant by single cell RT-PCR. The bass NCKX2 vari-
ants all lack the 17-residue stretch found in chicken or
human long variants. (6) A short C-terminal loop that
is hydrophilic.
D I S C U S S I O N
Active Ca2+ effl ux from the outer segment of intact bass
cone photoreceptors is mediated by a K+-dependent
Na+/Ca2+ exchanger identifi ed here as NCKX2, a
member of the NCKX gene family. In darkness, Ca2+
is transported out from the outer segment by this ex-
changer at a rate that balances the passive Ca2+ infl ux
through cGMP-gated ion channels, the only ion chan-
nels in the outer segment plasma membrane (Yau and
Nakatani, 1985; Hodgkin et al., 1987; Miller and Korenbrot,
1987). Bright illumination entirely suppresses the pas-
sive Ca2+ fl ux and Ca2+ is cleared from the outer seg-
ment at a rate determined by the exchanger activity.
This clearance rate is controlled by the number and
transport rates of NCKX2 molecules, the cytoplasmic
free Ca2+ concentration, the intracellular K+ concen-
tration, and the Na+ ionic gradient. The velocity of
Ca2+ clearance can be inferred from the slow exponen-
tial component observed as the photocurrent reaches
amplitude saturation when cones are illuminated with
bright light fl ashes.
Although the time course of this exponential com-
ponent is frequently taken to be the same as the time
course of the light-dependent decline in cytoplasmic
free Ca2+, it is not. The actual light-dependent decline
in Ca2+ concentration is best described by the sum of
two exponential components of approximately equal
power (in rods, Miller and Korenbrot, 1987; Gray-Keller
and Detwiler, 1994; McCarthy et al., 1996; in cones,
Sampath et al., 1999). Because of experimental limits
imposed by signal to noise ratio, the electrically detectable
rate of Ca2+ clearance refl ects only the faster of the two
components. Despite this limitation, electrical measure-
ments in rods and cones of different species (Table V)
demonstrate the rate of Ca2+ clearance in cones is some
5–10 times faster in cones than in rods, independently
of the absolute size of the outer segment or of their
membrane surface to outer segment volume ratio.
Figure 7. Deduced amino acid se-quence of cone-specifi c bassNCKX2. Aligned are the sequences of the four splice variants of bassNCKX2, along-side the sequences of NCKX2 clones from human and chicken retinas. The major topological features of the pro-teins’ primary structure are identifi ed. H0, a hydrophobic, cleavable signal se-quence, a short extracellular loop fol-lowed by a cluster of fi ve transmembrane helices (H1–H5). This cluster is sepa-rated from a second, similar cluster (H6-H11) by a cytoplasmic loop of vari-able length and where all the sequence variations are localized (double line).

Paillart et al. 13
The difference in outer segment Ca2+ clearance rate
between cones and rods contributes to their differences
in phototransduction signaling (Rebrik and Korenbrot,
2004), but the mechanism of this difference remains to
be understood. Future experiments will address whether
the rod/cone difference arises from differences in the
packing density and/or transport turnover rates of
NCKX1 and NCKX2. While both molecules can be ex-
pressed in heterologous cell lines and many of their
transport properties have been characterized (Prinsen
et al., 2000; Sheng et al., 2000; Dong et al., 2001;
Szerencsei et al., 2001), molecular turnover rates are yet
to be measured.
The K+ dependence of NCKX1 and NCKX2 is of great
functional signifi cance. Under bright light, Ca2+ is trans-
ported out of the photoreceptor outer segment by the
exchanger molecules until thermodynamic equilibrium
is attained. Equilibrium, the condition under which net
ion transport by the exchanger stops and, presumably,
the condition attained when photocurrent amplitude is
saturated is given by (Cervetto et al., 1989)
=
4
4exp( / ),oi
i o mio
KNaCa Ca V F RT
KNa (3)
where Nai and Nao are the cytoplasmic and extracellular
Na+ concentrations, Cai and Cao are the cytoplasmic
and extracellular Ca2+ concentrations, Ki and Ko are the
cytoplasmic and extracellular K+ concentrations, Vm is
membrane voltage, and F, R, and T have their usual
thermodynamic meanings. Hence, in a single bass cone,
at equilibrium and in normal Ringer’s (Table I), cyto-
plasmic free [Cai] can be expected to be 0.04 nM when
photocurrent amplitude is saturated at −40 mV. Under
identical conditions, a K+-independent Na+/Ca2+ ex-
changer can be expected to bring cytoplasmic free Ca2+
to only 50 nM. Under comparable ionic conditions, free
Ca2+ in the outer segment of a tiger salamander cone
when photocurrent is saturated is reported to be 5 nM
(Sampath et al., 1999).
The amplitude of the NCKX current is at its largest
value in complete darkness, when Ca2+ infl ux (via
CNG channels) is also at its maximum. Under normal
ionic gradients, this amplitude is not signifi cantly dif-
ferent in rods and cones, neither in absolute value
nor as a fraction of the ionic dark current (Table V).
This is not surprising, since the dark current ampli-
tude is also not that different in the two receptor types.
Under ionic gradients that engage the reverse mode,
Figure 8. Deduced amino acid se-quence of putative rod-specifi c bassNCKX1. Aligned are the sequences of the bassNCKX1, and NCKX1 clones from human and chicken retinas. The major topological features of the pro-teins’ primary structure are identifi ed. H0, a hydrophobic, cleavable signal sequence, a short extracellular loop followed by a cluster of fi ve transmem-brane helices (H1–H5). This cluster is separated from a second, similar clus-ter (H6–H11) by a cytoplasmic loop of variable length.

14 Cloning and Function of NCKX Exchanger in Cone Photoreceptors
the largest NCKX current amplitude in the bass cones
was on average, 55 pA (Fig. 3). This, again, is not
very different than the maximum exchanger current
measured in tiger salamander rods (80 pA, Lagnado
and McNaughton, 1991). Finally, the K1/2 for K+ acti-
vation in intact bass cones is 3–4 mM, a value well
within the range of values of between 1 and 10 mM
reported for rods in native membranes (Schnetkamp
et al., 1989; Perry and McNaughton, 1993; Rispoli
et al., 1995).
Every bass cone we analyzed, whether single or twin,
expressed the same four splice variants of bassNCKX2
and did not express bassNCKX1. The unambiguous
and simultaneous identifi cation of the four variants re-
quired careful design of PCR primers and their use in
nested, sequential reactions. The defi nite identifi cation
of the expressed mRNA in individual photoreceptors
demanded the synthesis of amplicons of the expected
size and a perfect match between their nucleotide se-
quence and that of the cloned retinal cDNA. Our pre-
sumption that bassNCKX1 is an exchanger in bass rods
follows from the fact that we only discovered bassNCKX1
and bassNCKX2 in the retina; bassNCKX1 is not in the
cones and the nucleotide sequence of bass NCKX1 is
homologous to that of other NCKX1 molecules that
have been unequivocally shown to be expressed in rods
of humans, mice, and chicken. Our inability to do sin-
gle cell RT-PCR in bass rods does, in a very strict sense,
leave the question open as to whether rods in the bass
retina may also express NCKX2.
The possibility that more than one molecular isoform
is expressed in the same photoreceptor cell is under-
scored by recent fi ndings on the expression of the visual
pigment kinase, identifi ed as GRK1 and GRK7. GRK1
is exclusively found in rods. GRK7 is exclusively ex-
pressed in cones of dog and pig retinas (Weiss et al.,
2001). However, cones in fi sh, primates, and humans
express both GRK1 and GRK7 (Hisatomi et al., 1998;
Weiss et al., 1998; Rinner et al., 2005). A similarly impre-
cise specifi city of expression in rods vs. cones has been
described for the family of GCAP proteins, the Ca2+-
dependent activators of guanylate cyclase (Imanishi
et al., 2004; Palczewski et al., 2004). It might be that
the surprising lack of effect on cone transduction sig-
nal by knocking out NCKX2 in mice (Li et al., 2006)
arises from a lack of evolutionary selection pressure
in cones of mice, since mice are a rod-dominated, noc-
turnal species.
The existence of splice variants of NCKX has been re-
ported before for the rat NCKX1 (Poon et al., 2000) as
well as for rat, human, and chicken NCKX2 (Tsoi et al.,
1998; Prinsen et al., 2000). The human and chicken
splice variants differ in the presence or absence of a 17–
amino acid deletion in the cytosolic loop that connects
the two sets of transmembrane helices. This 17–amino
acid stretch is missing in bass NCKX2, yet splice variants
in bass NCKX2 also differ from each other by the amino
acid composition of the same cytosolic loop. The func-
tional consequence of the expression of more than one
splice variant in bass cones, if any, is to be determined.
However, it is unlikely that the function of proteins
coded by any one of the four variants differs in their
function because the structural differences among them
are in a region not known to affect ion transport.
We thank S. Durdam, T. Rebrik, B. Pendergrass, and I. Botchkova
for their valuable comments and suggestions.
Olaf S. Andersen served as editor.
Submitted: 17 August 2006
Accepted: 27 November 2006
R E F E R E N C E S Barnes, S., and B. Hille. 1989. Ionic channels of the inner segment of
tiger salamander cone photoreceptors. J. Gen. Physiol. 94:719–743.
Burns, M.E., and V.Y. Arshavsky. 2005. Beyond counting photons: trials
and trends in vertebrate visual transduction. Neuron. 48:387–401.
Burns, M.E., and D.A. Baylor. 2001. Activation, deactivation, and
adaptation in vertebrate photoreceptor cells. Annu. Rev. Neurosci. 24:779–805.
Cervetto, L., L. Lagnado, R.J. Perry, D.W. Robinson, and P.A.
McNaughton. 1989. Extrusion of calcium from rod outer seg-
ments is driven by both sodium and potassium gradients. Nature. 337:740–743.
Chomczynski, P., and N. Sacchi. 1987. Single-step method of RNA
isolation by acid guanidinium thiocyanate-phenol-chloroform
extraction. Anal. Biochem. 162:156–159.
Cilluffo, M.C., H.R. Matthews, S.E. Brockerhoff, and G.L. Fain.
2004. Light-induced Ca2+ release in the visible cones of the ze-
brafi sh. Vis. Neurosci. 21:599–609.
Cobbs, W.H., and E.N. Pugh Jr. 1987. Kinetics and components of
the fl ash photocurrent of isolated retinal rods of the larval sala-
mander, Ambystoma tigrinum. J. Physiol. 394:529–572.
Cook, N.J., and U.B. Kaupp. 1988. Solubilization, purifi cation, and
reconstitution of the sodium-calcium exchanger from bovine
retinal rod outer segments. J. Biol. Chem. 263:11382–11388.
Cooper, C.B., R.J. Winkfein, R.T. Szerencsei, and P.P. Schnetkamp.
1999. cDNA cloning and functional expression of the dolphin
retinal rod Na-Ca+K exchanger NCKX1: comparison with the
functionally silent bovine NCKX1. Biochemistry. 38:6276–6283.
Dong, H., P.E. Light, R.J. French, and J. Lytton. 2001.
Electrophysiological characterization and ionic stoichiometry
of the rat brain K+-dependent Na+/Ca2+ exchanger, NCKX2.
J. Biol. Chem. 276:25919–25928.
Ebrey, T., and Y. Koutalos. 2001. Vertebrate photoreceptors. Prog. Retin. Eye Res. 20:49–94.
Fain, G.L., H.R. Matthews, M.C. Cornwall, and Y. Koutalos. 2001.
Adaptation in vertebrate photoreceptors. Physiol. Rev. 81:117– 151.
Fetter, R.D., and J.M. Corless. 1987. Morphological components
associated with frog cone outer segment disc margins. Invest. Ophthalmol. Vis. Sci. 28:646–657.
Gray-Keller, M.P., and P.B. Detwiler. 1994. The calcium feedback
signal in the phototransduction cascade of vertebrate rods.
Neuron. 13:849–861.
Haynes, L.W. 1995. Permeation and block by internal and external
divalent cations of the catfi sh cone photoreceptor cGMP-gated
channel. J. Gen. Physiol. 106:507–523.
Paillart et al. 15
Hestrin, S., and J.I. Korenbrot. 1990. Activation kinetics of retinal
cones and rods: response to intense fl ashes of light. J. Neurosci. 10:1967–1973.
Hisatomi, O., S. Matsuda, T. Satoh, S. Kotaka, Y. Imanishi, and F.
Tokunaga. 1998. A novel subtype of G-protein-coupled recep-
tor kinase, GRK7, in teleost cone photoreceptors. FEBS Lett. 424:159–164.
Hodgkin, A.L., P.A. McNaughton, and B.J. Nunn. 1987.
Measurement of sodium-calcium exchange in salamander rods.
J. Physiol. 391:347–370.
Holcman, D., and J.I. Korenbrot. 2004. Longitudinal diffusion in
retinal rod and cone outer segment cytoplasm: the consequence
of cell structure. Biophys. J. 86:2566–2582.
Imanishi, Y., L. Yang, I. Sokal, S. Filipek, K. Palczewski, and W. Baehr.
2004. Diversity of guanylate cyclase-activating proteins (GCAPs)
in teleost fi sh: characterization of three novel GCAPs (GCAP4,
GCAP5, GCAP7) from zebrafi sh (Danio rerio) and prediction of
eight GCAPs (GCAP1-8) in pufferfi sh (Fugu rubripes). J. Mol. Evol. 59:204–217.
Kang, K., and P.P. Schnetkamp. 2003. Signal sequence cleavage and
plasma membrane targeting of the retinal rod NCKX1 and cone
NCKX2 Na+/Ca2+-K+ exchangers. Biochemistry. 42:9438–9445.
Kang, K.J., T.G. Kinjo, R.T. Szerencsei, and P.P. Schnetkamp. 2005a.
Residues contributing to the Ca2+ and K+ binding pocket of the
NCKX2 Na+/Ca2+-K+ exchanger. J. Biol. Chem. 280:6823–6833.
Kang, K.J., Y. Shibukawa, R.T. Szerencsei, and P.P. Schnetkamp.
2005b. Substitution of a single residue, Asp575, renders the
NCKX2 K+-dependent Na+/Ca2+ exchanger independent of K+.
J. Biol. Chem. 280:6834–6839.
Kim, T.S., D.M. Reid, and R.S. Molday. 1998. Structure-function
relationships and localization of the Na/Ca-K exchanger in rod
photoreceptors. J. Biol. Chem. 273:16561–16567.
Korenbrot, J.I. 1995. Ca2+ fl ux in retinal rod and cone outer seg-
ments: differences in Ca2+ selectivity of the cGMP-gated ion chan-
nels and Ca2+ clearance rates. Cell Calcium. 18:285–300.
Lagnado, L., and P.A. McNaughton. 1991. Net charge transport dur-
ing sodium-dependent calcium extrusion in isolated salamander
rod outer segments. J. Gen. Physiol. 98:479–495.
Lamb, T.D., and E.N. Pugh Jr. 1992. A quantitative account of
the activation steps involved in phototransduction in amphibian
photoreceptors. J. Physiol. 449:719–758.
Li, X.F., L. Kiedrowski, F. Tremblay, F.R. Fernandez, M. Perizzolo,
R.J. Winkfein, R.W. Turner, J.S. Bains, D.E. Rancourt, and
J. Lytton. 2006. Importance of K+-dependent Na+/Ca2+-ex-
changer 2, NCKX2, in motor learning and memory. J. Biol. Chem. 281:6273–6282.
Maricq, A.V., and J.I. Korenbrot. 1988. Calcium and calcium-depen-
dent chloride currents generate action potentials in solitary cone
photoreceptors. Neuron. 1:503–515.
Maricq, A.V., and J.I. Korenbrot. 1990. Potassium currents in the in-
ner segment of single retinal cone photoreceptors. J. Neurophysiol. 64:1929–1940.
McCarthy, S.T., J.P. Younger, and W.G. Owen. 1996. Dynamic, spa-
tially nonuniform calcium regulation in frog rods exposed to
light. J. Neurophysiol. 76:1991–2004.
Miller, D.L., and J.I. Korenbrot. 1987. Kinetics of light-dependent
Ca fl uxes across the plasma membrane of rod outer segments.
A dynamic model of the regulation of the cytoplasmic Ca
concentration. J. Gen. Physiol. 90:397–425.
Miller, J.L., and J.I. Korenbrot. 1993. Phototransduction and adap-
tation in rods, single cones, and twin cones of the striped bass
retina: a comparative study. Vis. Neurosci. 10:653–667.
Nakatani, K., and K.W. Yau. 1988. Calcium and magnesium fl uxes
across the plasma membrane of the toad rod outer segment.
J. Physiol. 395:695–729.
Nakatani, K., and K.W. Yau. 1989. Sodium-dependent calcium ex-
trusion and sensitivity regulation in retinal cones of the salaman-
der. J. Physiol. 409:525–548.
Nikonov, S., N. Engheta, and E.N. Pugh Jr. 1998. Kinetics of recov-
ery of the dark-adapted salamander rod photoresponse. J. Gen. Physiol. 111:7–37.
Ohyama, T., D.H. Hackos, S. Frings, V. Hagen, U.B. Kaupp, and J.I.
Korenbrot. 2000. Fraction of the dark current carried by Ca2+
through cGMP-gated ion channels of intact rod and cone photo-
receptors. J. Gen. Physiol. 116:735–754.
Paillart, C., K. Zhang, T.I. Rebrik, W. Baehr, and J.I. Korenbrot.
2006. Cloning and molecular characterization of cGMP-gated
ion channels from rod and cone photoreceptors of striped bass
(M. saxatilis) retina. Vis. Neurosci. 23:99–113.
Palczewski, K., I. Sokal, and W. Baehr. 2004. Guanylate cyclase-
activating proteins: structure, function, and diversity. Biochem. Biophys. Res. Commun. 322:1123–1130.
Perry, R.J., and P.A. McNaughton. 1991. Response properties
of cones from the retina of the tiger salamander JT. J. Physiol. 433:561–587.
Perry, R.J., and P.A. McNaughton. 1993. The mechanism of ion
transport by the Na+-Ca2+,K+ exchange in rods isolated from the
salamander retina. J. Physiol. 466:443–480.
Picones, A., and J.I. Korenbrot. 1992. Permeation and interaction
of monovalent cations with the cgmp-gated channel of cone
photoreceptors. J. Gen. Physiol. 100:647–673.
Poon, S., S. Leach, X.F. Li, J.E. Tucker, P.P. Schnetkamp, and
J. Lytton. 2000. Alternatively spliced isoforms of the rat eye
sodium/calcium+potassium exchanger NCKX1. Am. J. Physiol. Cell Physiol. 278:C651–C660.
Prinsen, C.F., C.B. Cooper, R.T. Szerencsei, S.K. Murthy, D.J.
Demetrick, and P.P. Schnetkamp. 2002. The retinal rod and cone
Na+/Ca2+-K+ exchangers. Adv. Exp. Med. Biol. 514:237–251.
Prinsen, C.F., R.T. Szerencsei, and P.P. Schnetkamp. 2000. Molecular
cloning and functional expression of the potassium-dependent
sodium-calcium exchanger from human and chicken retinal
cone photoreceptors. J. Neurosci. 20:1424–1434.
Rebrik, T.I., and J.I. Korenbrot. 2004. In intact mammalian photo-
receptors, Ca2+-dependent modulation of cGMP-gated ion channels
is detectable in cones but not in rods. J. Gen. Physiol. 123:63–76.
Rinner, O., Y.V. Makhankov, O. Biehlmaier, and S.C. Neuhauss.
2005. Knockdown of cone-specifi c kinase GRK7 in larval zebraf-
ish leads to impaired cone response recovery and delayed dark
adaptation. Neuron. 47:231–242.
Rispoli, G., A. Navangione, and V. Vellani. 1995. Transport of K+ by
Na+-Ca2+, K+ exchanger in isolated rods of lizard retina. Biophys. J. 69:74–83.
Sampath, A.P., H.R. Matthews, M.C. Cornwall, J. Bandarchi, and
G.L. Fain. 1999. Light-dependent changes in outer segment free-
Ca2+ concentration in salamander cone photoreceptors. J. Gen. Physiol. 113:267–277.
Schnetkamp, P.P. 2004. The SLC24 Na+/Ca2+-K+ exchanger family:
vision and beyond. Pfl ugers Arch. 447:683–688.
Schnetkamp, P.P., D.K. Basu, and R.T. Szerencsei. 1989. Na+-Ca2+
exchange in bovine rod outer segments requires and transports
K+. Am. J. Physiol. 257:C153–C157.
Schnetkamp, P.P.M. 1989. Na-Ca or Na-Ca-K exchange in rod
photoreceptors. Prog. Biophys. Mol. Biol. 54:1–29.
Sheng, J.Z., C.F. Prinsen, R.B. Clark, W.R. Giles, and P.P. Schnetkamp.
2000. Na+-Ca2+-K+ currents measured in insect cells transfected
with the retinal cone or rod Na+-Ca2+-K+ exchanger cDNA.
Biophys. J. 79:1945–1953.
Smith, N.P., and T.D. Lamb. 1997. The a-wave of the human electro-
retinogram recorded with a minimally invasive technique. Vision Res. 37:2943–2952.

16 Cloning and Function of NCKX Exchanger in Cone Photoreceptors
Szerencsei, R.T., C.F. Prinsen, and P.P. Schnetkamp. 2001.
Stoichiometry of the retinal cone Na/Ca-K exchanger heterolo-
gously expressed in insect cells: comparison with the bovine heart
Na/Ca exchanger. Biochemistry. 40:6009–6015.
Tsoi, M., K.H. Rhee, D. Bungard, X.F. Li, S.L. Lee, R.N. Auer, and
J. Lytton. 1998. Molecular cloning of a novel potassium-depen-
dent sodium-calcium exchanger from rat brain. J. Biol. Chem. 273:4155–4162.
Tucker, J.E., R.J. Winkfein, C.B. Cooper, and P.P. Schnetkamp. 1998.
cDNA cloning of the human retinal rod Na-Ca + K exchanger:
comparison with a revised bovine sequence. Invest. Ophthalmol. Vis. Sci. 39:435–440.
Weiss, E.R., M.H. Ducceschi, T.J. Horner, A. Li, C.M. Craft, and
S. Osawa. 2001. Species-specifi c differences in expression of
G- protein-coupled receptor kinase (GRK) 7 and GRK1 in mam-
malian cone photoreceptor cells: implications for cone cell
phototransduction. J. Neurosci. 21:9175–9184.
Weiss, E.R., D. Raman, S. Shirakawa, M.H. Ducceschi, P.T. Bertram,
F. Wong, T.W. Kraft, and S. Osawa. 1998. The cloning of GRK7, a
candidate cone opsin kinase, from cone- and rod-dominant mam-
malian retinas. Mol. Vis. 4:27.
Yau, K.W., and K. Nakatani. 1985. Light-induced reduction of
cytoplasmic free calcium in retinal rod outer segment. Nature. 313:579–582.


