Embed Size (px)
Citation preview

Atmos. Chem. Phys., 13, 327–346, 2013www.atmos-chem-phys.net/13/327/2013/doi:10.5194/acp-13-327-2013© Author(s) 2013. CC Attribution 3.0 License.
AtmosphericChemistry
and Physics
Further examination of the thermodynamic modification of theinflow layer of tropical cyclones by vertical wind shear
M. Riemer1, M. T. Montgomery2,3, and M. E. Nicholls4
1Institut fur Physik der Atmosphare, Johannes Gutenberg-Universitat, Mainz, Germany2Department of Meteorology, Naval Postgraduate School, Monterey, CA, USA3NOAA’s Hurricane Research Division, Miami, FL, USA4University of Colorado, Cooperative Institute for Research in Environmental Sciences, Boulder, CO, USA
Correspondence to:M. Riemer ([email protected])
Received: 15 October 2011 – Published in Atmos. Chem. Phys. Discuss.: 7 March 2012Revised: 20 November 2012 – Accepted: 1 January 2013 – Published: 11 January 2013
Abstract. Recent work has developed a new framework forthe impact of vertical wind shear on the intensity evolutionof tropical cyclones. A focus of this framework is on thefrustration of the tropical cyclone’s power machine by shear-induced, persistent downdrafts that flush relatively cool anddry (lower equivalent potential temperature,θe) air into thestorm’s inflow layer. These previous results have been basedon idealised numerical experiments for which we have de-liberately chosen a simple set of physical parameterisations.Before efforts are undertaken to test the proposed frameworkwith real atmospheric data, we assess here the robustness ofour previous results in a more realistic and representative ex-perimental setup by surveying and diagnosing five additionalnumerical experiments. The modifications of the experimen-tal setup comprise the values of the exchange coefficientsof surface heat and momentum fluxes, the inclusion of ex-periments with ice microphysics, and the consideration ofweaker, but still mature tropical cyclones.
In all experiments, the depression of the inflow layerθevalues is significant and all tropical cyclones exhibit the samegeneral structural changes when interacting with the imposedvertical wind shear. Tropical cyclones in which strong down-drafts occur more frequently exhibit a more pronounced de-pression of inflow layerθe outsideof the eyewall in our ex-periments. The magnitude of theθe depressionunderneaththe eyewall early after shear is imposed in our experimentscorrelates well with the magnitude of the ensuing weakeningof the respective tropical cyclone. Based on the evidence pre-sented, it is concluded that the newly proposed framework isa robust description of intensity modification in our suite ofexperiments.
1 Introduction
1.1 A new framework for intensity modification oftropical cyclones in vertical wind shear
The intensity evolution of tropical cyclones (TCs) embeddedin an environmental flow with vertical wind shear poses animportant forecast problem. To date, the physical processesthat govern this intensity evolution are not well understood.In a recent publication (Riemer et al., 2010, referred to asRMN10 hereafter) a new framework for the intensity modi-fication of TCs in vertical wind shear was proposed. Whileprevious hypotheses have focused almost exclusively on pro-cesses above the boundary layer, RMN10 showed that ver-tical wind shear has a significant impact on the thermody-namic properties of the TC’s inflow layer1. Strong and per-sistent, shear-induced downdrafts flush the inflow layer withlow moist-entropy (or equivalent potential temperature,θe)air – “anti-fuel” for the TC power machine. The replenish-ment of this air by surface heat fluxes is not complete whilethe air spirals towards the storm centre leading to a reductionof θe values within the inner-core updrafts in theazimuthalmean. When viewed from the simplified perspective of anidealised Carnot cycle, a decrease in the potential intensityof the TC can be expected (Tang and Emanuel, 2010).
1In the current study, the term “inflow layer” will refer to thelayer of strong inflow associated with surface friction in the lowest1–1.5 km where the departure from gradient wind balance in theradial direction is generally a maximum (e.g.,Bui et al.(2009), theirFigs. 5 and 6 and accompanying discussion).
Published by Copernicus Publications on behalf of the European Geosciences Union.
328 M. Riemer et al.: Thermodynamic impact of vertical wind shear on the inflow layer
The downdrafts that flush the inflow layer with low-θeair are associated with a quasi-stationary, azimuthal wave-number 1, convective asymmetryoutsideof the eyewall. Thisconvective asymmetry is reminiscent of the “stationary bandcomplex” (Willoughby et al., 1984) and for this reason willbe referred to as the SBC hereafter. The SBC and the asso-ciated downdraft pattern extends outwards to approximately150–180 km. On account of the swirling winds, the updraftswithin the SBC rise along a helical path. A simple kinematicmodel (Riemer and Montgomery, 2011) suggests that, at lowlevels above the inflow layer, environmental low-θe air ap-proaches the storm closely underneath the helical updrafts inthe downshear and downshear-left quadrants2. Evaporativecooling of precipitation falling out of the SBC, and into thisunsaturated air, most likely drives the strong and persistent,vortex-scale downdrafts that cool and dry the TC’s inflowlayer.
In RMN10, evidence was presented that the formation ofthe SBC is connected to the tilt3 of the TC vortex. Whensubject to vertical wind shear, the tilt evolution of the TC vor-tex was shown to be governed to zero order by asymmetric-balance dynamics. Vortex tilt can thus be described in termsof a standing vortex-Rossby-wave (VRW) pattern with az-imuthal and vertical wave-number 1 structure. Even thoughthe tilt of the inner core is only 10–20 km, the VRW pat-tern associated with the tilt of the outer vortex extends out-wards to radii of 150–200 km (Fig. 15a in RMN10)4. Af-ter vertical wind shear is suddenly imposed, the TC settlesquickly (approx. within 3 h) into a quasi-equilibrium tilt di-rection that is to the downshear-left. Thus, the positive vor-ticity anomaly associated with the standing wave-number 1VRW pattern is found downshear-left at upper levels anddownshear-right at low levels (Fig. 16 in RMN10). Frictionalconvergence associated with this positive low-level vorticityanomaly then contributes to the forcing of the asymmetricconvection within the SBC. The foregoing results suggest animportant connection between the asymmetric-balance dy-namics governing the tilt evolution of the vortex subject tovertical shear and the thermodynamic impact on the inflowlayer.
The findings of RMN10 were derived from idealised nu-merical experiments following the setup ofBender(1997)and Frank and Ritchie(2001). In this experimental setup,a uni-directional vertical wind shear profile is imposedsuddenly on a mature model TC. In an attempt to min-
2In Riemer and Montgomery(2011), the distribution ofθe wasanalysed at 2 km height.
3In RMN10, as well as in the current study, the tilt is defined asthe vector difference between the location of the vorticity centroidsat 10 km and 1 km height.
4A considerable tilt of the outer parts of TC-like vortices withsmall tilt of the inner core has been noted previously by other au-thors also (see e.g. Fig. 6a inJones, 1995; Fig. 10 inReasor et al.,2004).
imise complexity and to understand the fundamental pro-cesses, RMN10 deliberately chose a simple set of modelparameterisations. As is the nature of results derived fromsuch an idealised approach, uncertainties exist whether thenewly proposed pathway operates in the real atmosphere. Al-though some preliminary observational support was offeredin RMN10 a more comprehensive test of the new hypothesiswith atmospheric data awaits future studies. Before undertak-ing such efforts we survey and diagnose here five additionalnumerical experiments with some modifications of the exper-imental setup to assess the robustness of RMN10’s results.
1.2 Purpose of additional experiments
The experimental setup in RMN10 features a simplifiedcloud microphysics scheme, a likely overestimation of thesurface exchange coefficients of momentum and enthalpy athigh wind speed, and a very high TC intensity at the timewhen shear is imposed, representative for a minority of TCsin the real atmosphere only. The particular relevance of thesefeatures for RMN10’s framework is discussed in more detailbelow. One goal of this study is to assess the robustness ofRMN10’s results in a more realistic and representative ex-perimental setup.
Several environmental factors likely play a role for theevolution of TCs in vertical wind shear also. Besides theobvious importance of the shear magnitude, such factors in-clude the vertical profiles of environmental wind speed anddirection (Zeng et al., 2010; Wang, 2012), and the environ-mental moisture and temperature profiles (cf. discussion inRiemer and Montgomery(2011)). Careful examination ofthe importance of these environmental profiles is beyond thescope of this study but constitutes an important topic for fu-ture research5.
The numerical experiments in RMN10 employed a micro-physics scheme that considers “warm cloud” processes asso-ciated with the collision-coalescence process only (hereaftertermed “warm rain”). The current study considers experi-ments with ice microphysics also. Adding ice processes in-troduces the latent heat of fusion/ sublimation, new classes ofhydrometeors with various fall speeds, and additional path-ways to form precipitation. Details of the ice microphysicsscheme employed in this study are given in Sect.2.2. Ar-guably, the most significant of the above processes is the ad-ditional conversion of latent heat associated with the freezingand melting of ice. Ice microphysics produce stronger up-drafts than a warm-rain scheme due to the additional latentheat release associated with freezing. In addition, the inclu-sion of precipitation in the form of ice may significantly en-hance the formation and intensity of downdrafts (Srivastava,1987).
5A brief discussion of the potential consequences of the envi-ronmental wind profile can be found in the authors’ response to theanonymous reviewer (item 1 and 2) on the ACPD webpage.
Atmos. Chem. Phys., 13, 327–346, 2013 www.atmos-chem-phys.net/13/327/2013/

M. Riemer et al.: Thermodynamic impact of vertical wind shear on the inflow layer 329
Previous studies have shown that the inclusion of ice mi-crophysics in numerical models may alter the radial profile ofthe swirling winds of TCs as compared to a warm-rain exper-iment (e.g.,Lord et al., 1984; Fovell et al., 2009). In general,it is not well understood how these differences arise6. Lordet al. have noted, albeit in an axisymmetric model frame-work, that their experiment with ice microphysics exhibitsmore mesoscale convective features than their experimentwith warm rain.Fovell et al.have proposed a mechanism forthe change in the radial profile of the swirling winds that isbased on the sedimentation of ice particles from the outflowanvil, the subsequent sublimentation of these ice particles,and radiative feedback. In our suite of experiments, however,radiative processes are neglected. Nevertheless, potentiallysignificant differences in the TC-vortex structure between thewarm-rain and the ice microphysics experiments do arise, in-dicating that the mechanism suggested byFovell et al.is notof primary importance. The potentially important differencesin the TC-vortex structure and their implication for the in-teraction with vertical wind shear will be discussed in somedetail in Sect.3.1.
Recent studies have highlighted the importance of therepresentation of the planetary boundary layer in numeri-cal models for vortex intensification and structure changesof simulated storms (Braun and Tao, 2000; Smith and Thom-sen, 2010; Montgomery et al., 2010; Smith et al., 2012). Theexchange coefficients for enthalpy,CK , and momentum,CD,play a most prominent role. They govern the energy extrac-tion from the ocean surface and the dissipation of kineticenergy in the frictional boundary layer, respectively. In theframework of RMN10, the values ofCK andCD can be ex-pected to play an important role in the replenishment of thedepressed boundary layerθe air while spiralling towards theinner-core updrafts. The replenishment rate is proportional7
to CK . The strength of the inflow within the frictional bound-ary layer is determined in part byCD. Smaller values ofCD
may lead to less radial inflow and thus to anincreaseof thetime that the air parcels spend under the influence of sur-face fluxes while spiralling inwards. Assuming thatCK isnot changed, and that the wind dependence of the fluxes isdominated by the tangential wind speed, the replenishmentof depressed inflow layerθe values is thenmore completethan for larger values ofCD. Based on these considerations,one would expect that the shear-induced flushing of the in-flow layer with low-θe air has a more pronounced impact onTC intensity for smaller values ofCK and larger values of
6In his review of this study, Roger Smith has proposed that afirst-order explanation of how these differences arise could be givenin terms of the conventional (balanced) model of vortex spin-up,noting that the inclusion of ice microphysics substantially modifiesthe diabatic heating rate. We are not aware, however, of publishedstudies that elaborate on this idea.
7The replenishment rate is proportional to the air-sea thermody-namic disequilibrium also.
CD. The interpretation of the importance ofCK andCD inan axisymmetric theory for a TC in vertical wind shear byTang and Emanuel(2010) is consistent with the foregoingconsiderations.
Considerable uncertainties exist about the values ofCK
and CD at the high wind speeds occurring in TCs. Dea-con’s formula forCD was employed in RMN10 and the ra-tio of CK/CD was set to unity. Recent results derived fromobservational data (Black et al., 2007; Zhang et al., 2008)strongly indicate that Deacon’s formula overestimatesCD athigh wind speeds and thatCK/CD is considerably less thanunity. The observational data exhibit considerable scatter andare limited to wind speeds of marginal hurricane strength8.To address the likely overestimation ofCK andCK /CD inRMN10, we employ in this study values ofCK andCK /CD
that are consistent with, but rather on the lower end of therange of values observed byBlack et al.and Zhang et al.Further details are provided in Sect.2.3.
The TCs considered in RMN10 were intense and rapidlyintensifying at the time when the vertical wind shear pro-file was imposed. In the current study we will consider, in-ter alia, weaker, but still mature TCs. Finally, our additionalexperiments now exhibit various rates of intensification justbefore vertical wind shear is imposed. We did not, however,find a sensitivity of the subsequent TC evolution in verti-cal shear to this preceding intensification rate in our exper-iments. Thus, the various rates of intensification just beforevertical wind shear is imposed will not be considered here-after.
The next section provides an overview of the numericalmodel employed and the additional experiments performed,an expanded description of the ice microphysics scheme, andthe values for the surface exchange coefficients. In Sect.3we compare the evolution of the quintessential ingredientsof RMN10’s newly proposed framework in the different nu-merical experiments. One experiment with ice microphysicsis examined in further detail in Sect.4, including an estimateof the spindown timescale of the simulated TC-vortex basedon simple axisymmetric theory. Section5 contains our con-clusions.
2 Model setup and additional experiments
2.1 A brief model description
For the numerical experiments we employ the RegionalAtmospheric Modeling System (RAMS), developed atColorado State University (Pielke et al., 1992; Cottonet al., 2003). The RAMS is a three-dimensional, non-hydrostatic numerical modeling system comprising time-dependent equations for velocity, non-dimensional pressure
8Some significant strides towards determining these coefficientsat major hurricane wind conditions have been made recently byBellet al. (2012).
www.atmos-chem-phys.net/13/327/2013/ Atmos. Chem. Phys., 13, 327–346, 2013
330 M. Riemer et al.: Thermodynamic impact of vertical wind shear on the inflow layer
perturbation, ice-liquid water potential temperature (Tripoliand Cotton, 1981), and mixing ratios of total water and hy-drometeors.
The experiments are carried out on an f-plane at 15◦ N andwith a horizontal grid spacing of 5 km. The model does notinclude ocean feedback. The time-invariant sea surface tem-perature is set to 28.5◦ C. A standard first-order turbulencescheme developed bySmagorinsky(1963) is used for sub-grid-scale mixing, with modifications byLilly (1962) andHill (1974) that enhance diffusion in unstable conditions andreduce diffusion in stable conditions. For simplicity, radiativeprocesses are neglected. The bulk aerodynamic formulas areused to calculate momentum fluxes and sensible and latentheat fluxes from the sea surface. The values of the exchangecoefficients are given in Sect.2.3. We employ either a warm-rain microphysics scheme based on that ofKessler(1969)or the RAMS standard ice microphysics scheme (Sect.2.2).The mixing ratio equations for all prognosed hydrometeorsinclude advection by the three-dimensional flow. A morecomprehensive description of RAMS, the surface interac-tion parameterisation, and the warm-rain scheme is given inRMN10.
2.2 Ice microphysics in RAMS
The RAMS ice microphysics scheme has eight water cate-gories: vapour, cloud droplets, rain, pristine ice, snow, ag-gregates, graupel and hail (Walko et al., 1995; Meyers et al.,1997). The liquid phase categories, cloud droplets and rain,may be supercooled. Pristine ice, snow and aggregates areassumed to be completely frozen, whereas graupel and hailare mixed phase categories, capable of consisting of ice only,or a mixture of ice and liquid. All hydrometeor categories ex-cept cloud droplets are assumed large enough to fall. Clouddroplets and pristine ice are the only categories to nucleatefrom vapour. All other categories form from existing hy-drometeors, but once formed may grow further by vapourdeposition. Pristine ice crystals form from heterogeneous nu-cleation, homogeneous nucleation, and secondary produc-tion that involves splintering of riming crystals. The snowcategory is defined in RAMS as relatively large ice crys-tals, which have grown from the pristine ice category dueto vapour deposition and may continue to grow by riming.Aggregates are defined as ice particles that have formed bycollision and coalescence of pristine ice, snow and/or aggre-gates. Snow and aggregates retain their identity with moder-ate amounts of riming, but convert to graupel if the amount ofriming is large. In addition to forming by heavy riming, grau-pel can also form by partial melting of snow or aggregates.Graupel is allowed to carry up to half its mass in liquid. Ifthe percentage becomes larger, by either melting, riming orcollection by rain, a graupel particle is re-categorised as hail.Hail is formed by freezing of rain drops or by riming or par-tial melting of graupel. Hail is allowed to be a large fractionliquid and converts to rain when completely liquid.
The hydrometeor size distribution in RAMS is representedby a generalised Gamma function. A user specified shape pa-rameter controls the width of the distribution. Also, a scalingdiameter is often specified for a one-moment scheme that isrelated to the mean diameter of the distribution, with the par-ticular relation depending on the chosen spectral parameters.For this study a one-moment scheme is employed for all cate-gories except cloud droplets and pristine ice. A scaling diam-eter is specified and the number concentration is diagnosedusing the predicted mixing ratio of the hydrometeor scheme.
A heat budget equation is formulated for rain, graupel, andhail hydrometeors. This allows the temperature of a hydrom-eteor to differ from that of the surrounding ambient air tem-perature due to latent heat release or absorption in the hy-drometeor, and sensible heating by collisions with other hy-drometeors. The temperature of a hydrometeor often differssubstantially from that of the air, which can significantly in-fluence the rates of heat and vapour diffusion, as well as theamount of sensible heat transfer that occurs in coalescenceof hydrometeors. Collision and coalescence of hydrometeorsis governed by the stochastic equation derived byVerlindeet al.(1990).
Gravitational settling of hydrometeors causes them to fallrelative to air. Terminal velocities increase as a power of thedroplet diameter, and are based on empirical data. Pristineice has very small fall speeds. Snow crystals fall faster thanpristine ice, but still relatively slowly. Aggregates are largecrystals that have moderate fall speeds. Graupel and hail havehigh fall speeds. Sedimentation in RAMS uses a Lagrangianscheme to transport the mixing ratio from any given grid cellto a lower height in the vertical column, so that a proportionis transferred to the lower adjacent grid cell.
2.3 Modification of surface exchange coefficients
Deacon’s formula for the dependence of the drag exchangecoefficientCD on wind speed is given by
CD = 1.1× 10⁻³+ 4× 10⁻⁵
|V |1, (1)
with |V |1 being the wind speed in m s−1 at the lowest modellevel (here: 49 m). In RMN10 we used Deacon’s formula to-gether withCK = CD. For reference, this formula furnishesvalues of the exchange coefficients of 1.5×10⁻³, 2.1×10⁻³,and 3.1×10⁻³ for 10 m s−1, 25 m s−1, and 50 m s−1, respec-tively.
Zhang et al.(2008) found that “The exchange coefficient ofenthalpy flux shows no significant dependence on wind speedup to hurricane force with a value of 1.16× 10⁻³.” and that“The average ratio of theCK/CD values is 0.63, . . .”. Wetherefore use these values and set
CK = 1.16× 10−3= constant (2)
and
CK/CD = 0.63. (3)
Atmos. Chem. Phys., 13, 327–346, 2013 www.atmos-chem-phys.net/13/327/2013/

M. Riemer et al.: Thermodynamic impact of vertical wind shear on the inflow layer 331
Table 1. Overview of the experiments that are considered in this study. The experiments RMN68 and10RMN68 are described in detail inRMN10. In columnCK , “Deacon” denotes that Deacon’s formula (see Sect.2.3) is used to determine the exchange coefficients. The lastcolumn gives the TC’s intensification rate just before vertical shear is imposed.
Experiment “initial” CK CK/CD microphysics shear preceding int.intensity [m s−1] [m s−1/12 km] rate [m s−1/h]
RMN68 68 Deacon 1 warm 15 1.8
10RMN68 68 Deacon 1 warm 10 1.8RMN54 54 Deacon 1 warm 15 0.0CBLAST68 68 1.16× 10⁻³ 0.65 warm 15 1.1CBLAST54 54 1.16× 10⁻³ 0.65 warm 15 0.0ICE68 68 Deacon 1 ice 15 2.5
10ICE68 68 Deacon 1 ice 10 2.5
Experiments that employ these values are referred to asCBLAST below. Note that Deacon’s formula andCK/CD =
1 furnishes values ofCK andCD that, for |V |1 = 50 m s−1,are approx. 2.7 and 4.2 times higher, respectively, than thecorresponding CBLAST values.
2.4 Summary of experiments
A summary of the experiments examined in this study isgiven in Table 1. We refer to experiments that employthe same parameterisations as in RMN10, i.e. warm rainand Deacon’s formula for the exchange coefficients (withCK/CD = 1), as RMN. The CBLAST experiments employwarm rain also. Experiments that include ice microphysicsare referred to as ICE. ICE experiments use Deacon’s for-mula with CK/CD = 1. Besides the modifications that arementioned explicitly, the experimental setup is the same asin RMN10.
The shear profile employed in this study has a sine struc-ture in the vertical with zero winds at the surface and max-imum easterly winds at 12 km and above. We will followthe convention of the TC community to define vertical windshear as the vector difference between the winds at upperand lower levels. Here, we use the vector difference between12 km and the surface. The shear magnitude is thus givenin m s−1. Unless otherwise noted, we will consider TCs invertical wind shear with a magnitude of 15 m s−1. The shearprofile is imposed at a high intensity9 of 68 m s−1, after theTCs have spun up in quiescent environment. These experi-ments are referred to as RMN68, CBLAST68, and ICE68, re-spectively. The intensity at the time when shear is imposedwill be referred to as “initial intensity” below. The conven-tions used in this study follow those in RMN10. ExperimentRMN68 is the “15mps” case of RMN10 and constitutes ourreference experiment.
We have performed experiments with a weaker ini-tial intensity of 54 m s−1 also, referred to as RMN54 and
9Our storm intensity metric is the maximum azimuthally-averaged tangential wind speed at 1 km height.
CBLAST54. These experiments use the same spinup runs asthe respective experiments with initial intensity of 68 m s−1,but with vertical shear imposed earlier during the inten-sification. Furthermore, an ICE experiment has been per-formed with 10 m s−1 vertical shear (10ICE68) which willbe compared briefly to the “10mps” case of RMN10 (here:10RMN68).
3 Assessing the robustness of the new framework
We shall focus on the key features of RMN10’s new frame-work for intensity modification in vertical wind shear: thevortex tilt, the occurrence and location of the SBC, the flush-ing of the inflow layer with low-θe air, the ensuing depres-sion of inflow layerθe, and the associated weakening of theTC. The general characteristics of these key features will befound to be common in all experiments.
As can be expected, differences arise in the specific char-acteristics of these key features. For some of these differ-ences it is very difficult to establish the causal link to thechanges in the experimental setup. Most prominently, differ-ences between the evolution of the TCs in RMN68 and ICE68are partly due to the enhancement of downdrafts by ice mi-crophysics (Sect.3.7), but very likely due also to changes inthe radial profile of the swirling winds at the time when verti-cal wind shear is imposed. Disentangling the individual con-tributions requires a more complete understanding of the pro-cesses at work, and extended numerical experimentation anddiagnostic analyses, preferably in an ensemble-based frame-work. A more comprehensive examination of such differ-ences is thus deferred to future research.
3.1 Importance of the radial profile of the swirlingwinds
3.1.1 Impact on the resiliency of TC-like vortices
It is generally believed that the presence of vertical windshear increases the interaction between a TC and dry environ-mental air (Riemer and Montgomery, 2011, and references
www.atmos-chem-phys.net/13/327/2013/ Atmos. Chem. Phys., 13, 327–346, 2013

332 M. Riemer et al.: Thermodynamic impact of vertical wind shear on the inflow layer
therein). Based on a simple kinematic model,Riemer andMontgomery(2011) argue that a TC with a broad radial pro-file of the swirling winds should have a stronger ability toisolate itself from the detrimental interaction with dry envi-ronmental air than a smaller-scale TC. Furthermore, the ra-dial profile of the swirling winds has a profound impact onthedynamicresiliency of TC-like vortices, i.e. the ability tomaintain vertical coherence in the presence of differential ad-vection by the vertical shear flow (e.g.,Jones, 1995; Reasoret al., 2004). These studies investigated the resiliency of ini-tially barotropic, dry vortices and are reviewed briefly below.
Jones(1995) examined vortex evolution in terms of theformation and subsequent interaction of potential vorticity(PV) anomalies. PV anomalies were defined as deviationsfrom the azimuthal mean. Due to the differential advectionby the vertical shear flow, PV anomalies representing the tiltof the vortex form at lower and upper levels. These anoma-lies mutually interact through the vertical penetration of their“induced” quasi-horizontal circulations, causing the vortexto precess. This precession helps the vortex to counteract thedifferential advection by the vertical wind shear. The verti-cal interaction of these PV anomalies depends on the Rossbypenetration depth. The penetration depth increases with thestrength of the background rotation and with the horizontalscale of the interacting anomalies10. Jonesnoted that it isnot entirely clear how to quantify the penetration depth fora tilted TC-like vortex but concluded that intense and broadvortices are more resilient than their weaker, smaller-scalecounterparts.
Reasor et al.(2004) re-visited the problem of vortex re-siliency and re-alignment using VRW concepts and models.Their results are in qualitative agreement withJones’s find-ing that vortex (and environment) parameters that increasethe penetration depth improve the resistence of a vortex totilting by an imposed vertical shear flow. In addition,Reasoret al.demonstrated that vortex precession is not the only ele-ment in the resiliency of TC-like vortices. An inviscid damp-ing mechanism of the vortex-tilt mode exists, associated withPV mixing at the critical radius of the near-discrete VRWthat represents the vortex tilt. The critical radius is typicallylocated in the “skirt” region of the vortex, i.e. in the regionof small PV values outside of the high PV values in the in-ner core (approx. outside 50–70 km in Fig.1a). The invis-cid damping mechanism depends on the radial gradient ofthe skirt PV at the critical radius (Schecter and Montgomery,2003). Inviscid damping, and thus re-alignment of the vortex,occurs when the radial PV gradient in this region is negative.The damping rate increases with the magnitude of the gra-dient. For a positive skirt-PV gradient, a tilt instability mayoccur. The results ofReasor et al.clearly demonstrate thatvortex resiliency may crucially depend on the radial profileof the swirling winds.
10The penetration depth increases also with a decrease in staticstability.
radius [km]
CBLAST68CBLAST54ICE
a)
vo
rtic
ity
[1
0
s ]
, w
ind
sp
ee
d [
ms
]-4
-1-1
vo
rtic
ity
in 1
0
s-4
-1
radius [km]
CBLAST68CBLAST54ICE
b)
Fig. 1. (a) Radial profiles of azimuthal mean vorticity at 2 km (thin) and azimuthalmean tangential wind at the
radius of maximum winds at 1 km height (thick) at the time when vertical windshear is imposed in RMN54
(red), CBLAST68 (blue), and ICE68 (grey), respectively. (b) Radial vorticity profiles as in (a) but zoomed in on
the “skirt” region between 50 km and 100 km.
27
Fig. 1. (a) Radial profiles of azimuthal mean vorticity at 2 km (thin) and azimuthal mean tangential wind at the
radius of maximum winds at 1 km height (thick) at the time when vertical wind shear is imposed in CBLAST54
(red), CBLAST68 (blue), and ICE68 (grey), respectively. (b) Radial vorticity profiles as in (a) but zoomed in
on the “skirt” region between 50 km and 100 km.
29
Fig. 1. (a)Radial profiles of azimuthal mean vorticity at 2 km (thin)and azimuthal mean tangential wind at the radius of maximumwinds at 1 km height (thick) at the time when vertical wind shear isimposed in CBLAST54 (red), CBLAST68 (blue), and ICE68 (grey),respectively.(b) Radial vorticity profiles as in(a) but zoomed in onthe “skirt” region between 50 km and 100 km.
The radial profile of the swirling winds has been confirmedto play a role in the intensity evolution of vertically shearedTCs in idealised,moist numerical experiments (Wong andChan, 2004). In these experiments the weakening of smaller-scale TCs is found to be more pronounced than that of theirbroader-scale counterparts.Wong and Chanbased their inter-pretation of this difference in the intensity evolution on theresults ofJones(1995) derived from dry TC-like vortices. Tous, however, it is not clear what the underlying processes arethat govern the intensity evolution inWong and Chan’s ex-periments. In particular, the role ofmoist processes and/orthe associated secondary circulation remains unclear.
In the real atmosphere, an indication of a higher suscepti-bility of smaller-scale TCs to vertical shear has been foundby DeMaria(1996) based on a regression analysis.
3.1.2 Diagnosed radial vortex structure in ourexperiments
Because the radial profile of the swirling winds may playa prominent role in the evolution of TCs in vertical windshear, we begin the examination of our experiments with the
Atmos. Chem. Phys., 13, 327–346, 2013 www.atmos-chem-phys.net/13/327/2013/

M. Riemer et al.: Thermodynamic impact of vertical wind shear on the inflow layer 333
inte
nsi
ty [
ms
]-1
time [h]
RMN68
RMN54
CBLAST68
CBLAST54
a)
RMN68
10RMN68
ICE68
10ICE68
b)
inte
nsi
ty [
ms
]-1
time [h]
RMN68
RMN54
CBLAST68
CBLAST54 c)
inte
nsi
ty [
ms
]-1
time [h]
inte
nsi
ty [
ms
]-1
RMN68
10RMN68
ICE68
10ICE68 d)
time [h]
Fig. 2. a) Intensity time series for the RMN no-shear experiment (red), RMN54 (light red), RMN68 (dark red),
the CBLAST no-shear experiment (blue), CBLAST54 (light blue), and CBLAST68 (dark blue). The colour-
coded arrows denote the time when vertical wind shear is imposed in the respective experiment. b) As in
a), but for the RMN no-shear experiment (red), RMN68 (dark red),10RMN68 (light red), the ICE no-shear
experiment (black), ICE68 (dark grey), and10ICE68 (light grey). c) Time series of the difference between the
intensity in RMN54 (light red), RMN68 (dark red), CBLAST54 (light blue), and CBLAST68 (dark blue) and
the respective no-shear experiment. Time 0 h denotes the time when vertical wind shear is imposed in the
respective experiment. d) As in c), but for RMN68 (dark red),10RMN68 (red), ICE68 (dark grey), and10ICE68
(light grey).
28
Fig. 2. (a) Intensity time series for the RMN no-shear experiment (red), RMN54 (light red), RMN68 (dark red),
the CBLAST no-shear experiment (blue), CBLAST54 (light blue), and CBLAST68 (dark blue). The colour-
coded arrows denote the time when vertical wind shear is imposed in the respective experiment. (b) As in
(a), but for the RMN no-shear experiment (red), RMN68 (dark red), 10RMN68 (light red), the ICE no-shear
experiment (black), ICE68 (dark grey), and 10ICE68 (light grey). (c) Time series of the difference between the
intensity in RMN54 (light red), RMN68 (dark red), CBLAST54 (light blue), and CBLAST68 (dark blue) and the
respective no-shear experiment. Time 0 h denotes the time when vertical wind shear is imposed in the respective
experiment. (d) As in (c), but for RMN68 (dark red), 10RMN68 (red), ICE68 (dark grey), and 10ICE68 (light
grey).
30
Fig. 2. (a) Intensity time series for the RMN no-shear experiment (red), RMN54 (light red), RMN68 (dark red), the CBLAST no-shearexperiment (blue), CBLAST54 (light blue), and CBLAST68 (dark blue). The colour-coded arrows denote the time when vertical wind shearis imposed in the respective experiment.(b) As in (a), but for the RMN no-shear experiment (red), RMN68 (dark red),10RMN68 (light red),the ICE no-shear experiment (black), ICE68 (dark grey), and10ICE68 (light grey).(c) Time series of the difference between the intensity inRMN54 (light red), RMN68 (dark red), CBLAST54 (light blue), and CBLAST68 (dark blue) and the respective no-shear experiment. Time0 h denotes the time when vertical wind shear is imposed in the respective experiment.(d) As in (c), but for RMN68 (dark red),10RMN68(red), ICE68 (dark grey), and10ICE68 (light grey).
comparison of the vortex structure at the time when verticalwind shear is imposed. The radial, azimuthal-mean profilesof the swirling winds at this time are illustrated in Fig.1. InCBLAST68, the radius of maximum winds (RMW) is foundat 40 km (Fig.1a). The vorticity maximum is 35× 10−4 s−1
at a radius of 20 km. This vortex structure is very similar as inRMN68 (shown in Fig. 4 in RMN10)11. For the weaker TC inCBLAST54, the vorticity structure outside a radius of 35 kmis almost identical to CBLAST68. Inside this radius, vortic-ity is virtually constant with a value of approx. 20×10−4 s−1.The corresponding RMW is found at 48 km. The initial radialstructure of the TC in RMN54 is very similar (not shown).
The vorticity structure of the TC in ICE68 exhibits somenotable differences as compared to the warm-rain experi-ments CBLAST68 and RMN68. The vorticity maximum isfound inside a radius of 10 km with values of 55× 10−4 s−1,i.e. approx. 60 % higher than in CBLAST68. Radially outsideof this maximum, the high vorticity values decrease rapidly.
11A potential impact of barotropic instability associated with thereversal of the radial vorticity gradient in the inner core on the in-tensity evolution of the sheared TCs in our experiments is arguablynegligible (see Sect. 3.1 in RMN10).
Corresponding to the smaller radius of maximum vorticity,the RMW is smaller (located at 30 km) than in CBLAST68and RMN68 also.
As discussed above, the resiliency of the TC vortex maycrucially depend on the gradient of (potential) vorticity at thecritical radius of the (near-discrete) VRW mode that repre-sents the vortex tilt. The critical radius is found where theazimuthal propagation of this VRW, i.e. the vortex preces-sion, equals the speed of the swirling winds. The precessionrate, and thus the critical radius, in our experiments is diffi-cult to determine. After the vortices have re-aligned, a shortprecession period of 2–3 h is indicated in all experiments(see Fig.4 below12). Using the values of the axisymmetricswirling winds at 1 km, as depicted in Fig.1a, our rough es-timate of the critical radius is then 50–90 km.
In ICE, the vorticity gradient is near-zero between 50 kmand 65 km while in CBLAST68 and RMN54 the gradient isnegative and of large magnitude (Fig.1b). Between 65 kmand 100 km the radial vorticity profiles are broadly similar.At larger radii (not shown) the average vorticity gradient is
12Note that the temporal resolution of the data in Fig.4 is 1 h. Itis thus most likely that the vortex precession is undersampled.
www.atmos-chem-phys.net/13/327/2013/ Atmos. Chem. Phys., 13, 327–346, 2013

334 M. Riemer et al.: Thermodynamic impact of vertical wind shear on the inflow layer
positive in RMN54 (between 120 km and 200 km) and ICE(between 150–200 km). In contrast, in CBLAST, vorticitydecreases monotonically out to 200 km radius. It is question-able, however, whether these differences at a radius consider-ably larger than our estimate for the critical radius play a rolefor the TC-vortex evolution in our experiments.
From the discussion in this subsection it is clear that dif-ferences in the evolution of the TCs when interacting withthe vertical shear flow in the various experiments potentiallyarise due to differences in the radial vorticity profiles that ex-ist beforeshear is imposed. The weaker vortices in RMN54and CBLAST54, as well as the smaller-scale vortex in ICE68,can be expected to be more susceptible to tilting than theirstronger, respectively broader-scale counterparts in RMN68and CBLAST68. In ICE68, the susceptibility to tilting is po-tentially enhanced by the near-zero gradient of the skirt vor-ticity inside of 65 km. In Sect.3.3 it will be shown that thetilt evolution is broadly consistent with these expectations.Furthermore, based on the results ofWong and Chan(2004),summarized at the end of Sect.3.1.1, a more pronounced in-tensity decrease in ICE68 can be expected due to the smallerradial scale of the vortex alone. The latter point needs to beborne in mind when attempting to attribute differences be-tween ICE68 and RMN68 to their different representation ofcloud microphysical processes.
3.2 Intensity evolution
An overview of the intensity evolution in our experimentsis presented in Fig.2. First, a brief account of the intensityevolution in the quiescent environment, i.e. without verti-cal shear, is given. The intensity evolution in RMN is de-scribed in some detail in RMN10. In CBLAST (Fig.2a),the incipient TC slowly intensifies to 25 m s−1 in the first20 h. A period of rapid intensification ensues during whichthe TC reaches an intensity of 53 m s−1 at 33 h. In the sub-sequent 20 h, the TC consolidates and slightly intensifies to56 m s−1. Then, the TC continues to intensify at a moderaterate until it reaches a quasi-steady intensity of 80–85 m s−1 at80 h. In ICE (Fig.2b), the TC intensifies to approx. 40 m s−1
at 30 h after a short gestation period. Very rapid intensifica-tion ensues and the intensity reaches 90 m s−1 at 50 h. Themaximum, quasi-steady intensity of 95–100 m s−1 is reachedaround 72 h.
In all experiments, intensity decreases after vertical windshear is imposed. As in RMN10, all TCs are resilient tothe detrimental impact of vertical wind shear. After a periodof weakening the TCs re-intensify; particularly rapidly inRMN54
13. The re-intensification process in this experimen-tal configuration is discussed in some detail in RMN10 (theirSect. 6).
13Because the focus of this study is on the structural changes ofthe TCs during the weakening phase, this experiment was discon-tinued at 84 h.
To facilitate the intercomparison of the intensity evolu-tion in the various experiments, the intensity difference fromthe respective no-shear experiment is presented in Fig.2c, d.Time 0 h in these figures denotes the time when vertical windshear is imposed in the respective experiment. In all warm-rain experiments (Fig.2c), the characteristics of thisrelativeweakening are similar in the first 20 h. The only exception be-ing that the weakening in CBLAST54 is delayed by 4 h. Thisdetail will be examined in Sect.3.6.2. After 20 h, the exper-iments with weaker TCs (RMN54 and CBLAST54) continueto weaken. In contrast, CBLAST68 maintains its intensitydifference for the next 20 h and RMN68 re-intensifies. Basedon these plots alone it might therefore be concluded that theweaker storms are more susceptible to shear. However, thisis not necessarily the case here. Note that 20 h after shear isimposed in RMN54 and CBLAST54 the respective referenceTCs in a quiescent environment are still rapidly intensifying.In contrast, the reference TCs in RMN68 and CBLAST68 in-tensify only slowly 20 h after vertical wind shear is imposed.Thus, the differences in therelativeintensity evolution partlyarise due to the differences in the contemporaneous evolutionof the reference TC. This brief discussion illustrates one ofthe inevitable challenges to interpreting different TC simula-tions in vertical wind shear.
The comparison of the RMN and ICE shear experimentsis less complicated because the intensity evolution of thereference runs in quiescent environment is similar (Fig.2b,d). A comparison of the intensity evolution in10ICE68 andICE68, respectively, clearly shows that the TCs in the ICEexperiments are more susceptible to shear than their counter-parts in the warm-rain experiments. The differences betweenthe relative weakening in10ICE68 and 10RMN68, i.e. theexperiments with imposed vertical shear of 10 m s−1, is onaverage approx. 10 m s−1 before 16 h, and on average ap-prox. 5 m s−1 between 16 h and 36 h (Fig.2d). After thistime, it is no longer evident that the weakening in10ICE68is more pronounced than in10RMN68.
For 15 m s−1 shear, the difference in the intensity evolu-tion between the ice and warm-rain experiments is striking.The maximum relative weakening in ICE68 is −60 m s−1
(Fig. 2d). The TC reaches a minimum intensity of 35 m s−1
(Fig. 2b). For RMN68, the respective values are−25 m s−1
and 63 m s−1. Notwithstanding this distinct intensity evolu-tion, it will be shown below that the structural changes inICE68 and RMN68 are very similar. In particular, the pro-nounced weakening in ICE68 is associated with by far themost significant depression of inflow layerθe (Sects.3.6and4.1). The evolution in ICE68 is thus consistent with theresults of RMN10, i.e. the shear-induced frustration of in-flow layerθe plays a crucial role in the intensity evolution inICE68. Furthermore, it will be argued in Sect.4.2 that thisrapid weakening is consistent with the frictional spindown ofan axisymmetric vortex due to divergence above the inflowlayer associated with a significant reduction of the inner-coreconvective mass flux.
Atmos. Chem. Phys., 13, 327–346, 2013 www.atmos-chem-phys.net/13/327/2013/

M. Riemer et al.: Thermodynamic impact of vertical wind shear on the inflow layer 335
RMN68
RMN54
CBLAST68
CBLAST54
a)
tilt
[k
m]
time [h]
RMN68
10RMN68
ICE68
10ICE68
b)
tilt
[k
m]
time [h]
Fig. 3. a) Time series of the tilt magnitude for RMN54 (light red), RMN68 (dark red), CBLAST54 (light blue),
and CBLAST68 (dark blue). Time 0 h denotes the time when vertical wind shear is imposed inthe respective
experiment. Vortex tilt is defined as the vector difference between the vorticity centroids at 10 km and 1 km
height. For visual clarity, the 3 h running mean of the time series is shown. b) As in a) but for RMN68 (dark
red),10RMN68 (light red), ICE68 (dark grey), and10ICE68 (light grey). Note that the tilt magnitude for ICE68
goes off the scale between 33 h and 38 h reaching a maximum value of 195km (not shown).
29
Fig. 3. (a) Time series of the tilt magnitude for RMN54 (light red), RMN68 (dark red), CBLAST54 (light blue),
and CBLAST68 (dark blue). Time 0 h denotes the time when vertical wind shear is imposed in the respective
experiment. Vortex tilt is defined as the vector difference between the vorticity centroids at 10 km and 1 km
height. For visual clarity, the 3 h running mean of the time series is shown. (b) As in (a) but for RMN68 (dark
red), 10RMN68 (light red), ICE68 (dark grey), and 10ICE68 (light grey). Note that the tilt magnitude for ICE68
goes off the scale between 33 h and 38 h reaching a maximum value of 195 km (not shown).
31
Fig. 3. (a)Time series of the tilt magnitude for RMN54 (light red), RMN68 (dark red), CBLAST54 (light blue), and CBLAST68 (dark blue).Time 0 h denotes the time when vertical wind shear is imposed in the respective experiment. Vortex tilt is defined as the vector differencebetween the vorticity centroids at 10 km and 1 km height. For visual clarity, the 3 h running mean of the time series is shown.(b) As in (a)but for RMN68 (dark red),10RMN68 (light red), ICE68 (dark grey), and10ICE68 (light grey). Note that the tilt magnitude for ICE68 goesoff the scale between 33 h and 38 h reaching a maximum value of 195 km (not shown).
a)
time [h]
tilt
dir
ect
ion
[d
eg
ree
]
RMN68
b)
time [h]
tilt
dir
ect
ion
[d
eg
ree
]
CBLAST68
c)
time [h]
tilt
dir
ect
ion
[d
eg
ree
]
RMN54
d)
time [h]
tilt
dir
ect
ion
[d
eg
ree
]
CBLAST54
e)
time [h]
tilt
dir
ect
ion
[d
eg
ree
]
ICE68
f )
time [h]
tilt
dir
ect
ion
[d
eg
ree
]
10ICE68
Fig. 4. Time series of the tilt direction for RMN68 (a), CBLAST68 (b), RMN54 (c), CBLAST54 (d), ICE68 (e),
and10ICE68 (f). Time 0 h denotes the time when vertical wind shear is imposed in the respective experiment.
Vortex tilt is defined as the vector difference between the vorticity centroidsat 10 km and 1 km height. Dashed
line denotes the 3 h running mean. Note that the temporal resolution (1 h) ofthe data is too coarse to resolve a
putative high-frequency precession of the TC vortex.
30
Fig. 4. Time series of the tilt direction for RMN68 (a), CBLAST68 (b), RMN54 (c), CBLAST54 (d), ICE68 (e),
and 10ICE68 (f). Time 0 h denotes the time when vertical wind shear is imposed in the respective experiment.
Vortex tilt is defined as the vector difference between the vorticity centroids at 10 km and 1 km height. Dashed
line denotes the 3 h running mean. Note that the temporal resolution (1 h) of the data is too coarse to resolve
a putative high-frequency precession of the TC vortex.
32
Fig. 4. Time series of the tilt direction for RMN68 (a), CBLAST68 (b), RMN54 (c), CBLAST54 (d), ICE68 (e), and10ICE68 (f). Time 0 hdenotes the time when vertical wind shear is imposed in the respective experiment. Vortex tilt is defined as the vector difference between thevorticity centroids at 10 km and 1 km height. Dashed line denotes the 3 h running mean. Note that the temporal resolution (1 h) of the data istoo coarse to resolve a putative high-frequency precession of the TC vortex.
3.3 Evolution of vortex tilt
Following RMN10, the tilt of the vortex is defined here asthe vector difference between the vorticity centroids at 10 kmand 1 km height. Details on the calculation of the vorticitycentroids are given in RMN10. Here, the tilt magnitude and
the tilt direction in our experiments are depicted in Figs.3and4, respectively.
A detailed examination of the tilt evolution in RMN68was given in Sect. 5.1 of RMN10. There, evidence was pre-sented that the tilt evolution is governed to zero order byasymmetric-balance dynamics. The TC in RMN68 settles
www.atmos-chem-phys.net/13/327/2013/ Atmos. Chem. Phys., 13, 327–346, 2013

336 M. Riemer et al.: Thermodynamic impact of vertical wind shear on the inflow layer
into a quasi-equilibrium tilt direction to the downshear-left(south) shortly after shear is imposed (approx. within 3 h).A quasi-equilibrium tilt direction may be achieved whenthe cyclonic precession of the tilted vortex cancels the dif-ferential advection by the vertical shear flow. This quasi-equilibrium vortex tilt can be described in a first approxi-mation by the balanced dynamics of an initially barotropic,dry TC-like vortex (Jones, 1995; Reasor et al., 2004). InRMN68, the tilt amplitude decreases while maintaining thequasi-equilibrium tilt direction. The TC virtually re-alignswithin approx. 24 h, i.e. after this time the tilt amplitude iscomparable to the tilt amplitude of the TC in the no-shearbenchmark experiment (see Fig. 5 in RMN10). Once the tiltamplitude has decreased considerably, a high variability inthe tilt direction ensues, indicative of a high-frequency pre-cession of the vortex (Fig.4a).
Figures3 and4 demonstrate that the general characteris-tics of the tilt evolution are similar in all of our experiments inthe first 24–30 h after vertical wind shear is imposed. All TCsare resilient during this time and the tilt direction is predom-inantly to the South (180◦). In CBLAST68, the maximum tiltmagnitude, as well as the temporal tilt evolution, is very sim-ilar to that of RMN68. The only exception being that the localmaximum at 23 h is more pronounced and, thereafter, the tiltmagnitude remains 3–5 km larger. As can be expected fromthe discussion in Sect.3.1, the weaker TCs in RMN54 andCBLAST54 clearly exhibit a larger tilt magnitude in the first24 h than the more intense TCs in RMN68, CBLAST68, andICE68. Maximum tilt amplitudes reach 40 km in RMN54 and30 km in CBLAST54. Both TCs eventually re-align.
The most striking feature in the tilt evolution is the dis-ruption of the TC vortex after 30 h in ICE68 (Fig. 3). Untilthis time the TC tends to re-align slowly: the local tilt maxi-mum and minimum at 25 h and 30 h, respectively, are smallerthan their respective predecessors at 9 h and 15 h. At 30 h,intensity has decreased by over 30 m s−1 as compared to thetime when vertical wind shear is imposed and has reached thesmallest absolute value in all experiments (approx. 35 m s−1,Fig. 2). Based on the discussion in Sect.3.1, it is plausiblethat the significantly weakened TC can no longer withstandthe differential advection associated with the vertical windshear. Note that the distinct weakening in the first 20 h pre-cedes the disruption of the TC by more than 10 h. After 30 h,the TC remains as a coherent entity with smaller vertical ex-tent: the tilt as inferred from the vorticity centroid at 9 kmheight instead of 10 km height does not exceed 35 km (notshown). Arguably, the survival as a vertically less extensivesystem allows for the rapid re-intensification of the TC afterthe inflow layerθe values have recovered (Sect.4.1).
The tilt magnitude in10ICE68 remains below 10 km andquickly reduces to values smaller than 6 km after 12 h. De-spite this small tilt magnitude a southerly tilt direction is pre-ferred until late in the experiment. Although the evolution ofthe tilt magnitude is similar in10RMN68, the tilt direction
in 10RMN68 exhibits more variability after 30 h when the tiltmagnitude is small (not shown).
3.4 SBC formation and downward flux of low-θe air intothe inflow layer
A metric for the downward flux of low-θe air into the inflowlayer (DFX) has been defined in RMN10 (their Sect. 4.2.1)as14
DFX ≡ w−θ ′e, (4)
wherew− denotes downward vertical motion andθ ′e the per-
turbation from the azimuthal mean ofθe. The quantity DFXis evaluated at 1.5 km, the approximate top of the axisym-metric inflow layer.
The time-averaged structure of the SBC, represented bylow-level upward motion, and the distribution of DFX shortlyafter the time when vertical wind shear is imposed is depictedin Fig. 5. In this early stage of the evolution, the generalstructure of the SBC and the distribution of DFX is consis-tent in all experiments. The SBC forms in the downshear-right quadrant15 extending radially outwards to 150–200 km.Small to moderate DFX values occur over a broad, bandedregion downwind of the SBC, from the downshear quadrantthrough downshear-left, and into the upshear quadrant. In allexperiments, azimuthal vertical cross-sections (as Fig. 18 inRMN10, not shown here) indicate that the associated down-drafts form underneath the helical updrafts of the SBC.
It is of interest to note that the SBCs in RMN54, ICE68,and 10ICE68, respectively, extendazimuthally further intothe upshear quadrant than their counterparts in RMN68,CBLAST68, and CBLAST54. In the former experiments, thetilt direction at early times exhibits a greater downshear(westward) component than in the latter experiments (Fig.4).Thus, the low-level vorticity anomaly associated with thetilted vortex can be expected to extend into the upshear quad-rant. RMN10 have shown evidence that frictional conver-gence due to the low-level vorticity anomaly associated withthe tilted vortex contributes to the forcing of the SBC. Thecorrelation of the location of SBC formation with the tilt di-rection in our experiments presented here provides furthersupport for RMN10’s interpretation.
14Our downward-flux metric DFX is virtually identical to thatpart of the flux termθ ′
ew′ for which w′ is negative (see RMN10,
their Sect. 4.2.1, for details).15To describe the azimuthal location of relevant features in this
study the following convention is used: First, the centerline of theazimuthal location is given with respect to the shear vector. Then,the azimuthal extent is given, e.g. quadrant or semicircle. For ex-ample, let 0◦ denote north and let the shear vector point to the west(270◦). Then, “downshear-right” is at 0◦ and the “downshear-rightquadrant” denotes the region between 315◦ and 45◦. Note that thisconvention differs somewhat from the one that is frequently used inthe TC community.
Atmos. Chem. Phys., 13, 327–346, 2013 www.atmos-chem-phys.net/13/327/2013/

M. Riemer et al.: Thermodynamic impact of vertical wind shear on the inflow layer 337
a)
RMN68 shear
b)
CBLAST68 shear
c)
RMN54 shear
d)
CBLAST54 shear
e)
ICE68 shear
f )
10ICE68 shear
Fig. 5. Downward flux ofθ′e, DFX (colour, in 0.1 Kms−1, see text for definition), at the top of the axisymmetric
inflow layer, defined as 1.5 km, and low-level upward motion (thin contour: 0.25 ms−1, thick contour: 1 ms−1,
averaged from 1.25 km - 2 km height) both averaged from 1 h - 6 h aftervertical shear is imposed for a) RMN68,
b) CBLAST68, c) RMN54, d) CBLAST54, e) ICE68, and f)10ICE68. The arrow indicates the direction of the
deep-layer shear. The horizontal scale is in km
31
a)
RMN68 shear
b)
CBLAST68 shear
c)
RMN54 shear
d)
CBLAST54 shear
e)
ICE68 shear
f )
10ICE68 shear
Fig. 5. Downward flux ofθ′e, DFX (colour, in 0.1 Kms−1, see text for definition), at the top of the axisymmetric
inflow layer, defined as 1.5 km, and low-level upward motion (thin contour: 0.25 ms−1, thick contour: 1 ms−1,
averaged from 1.25 km - 2 km height) both averaged from 1 h - 6 h aftervertical shear is imposed for a) RMN68,
b) CBLAST68, c) RMN54, d) CBLAST54, e) ICE68, and f)10ICE68. The arrow indicates the direction of the
deep-layer shear. The horizontal scale is in km
31Fig. 5. Downward flux of θ′e, DFX (colour, in 0.1 K m s−1, see text for definition), at the top of the axisymmetric
inflow layer, defined as 1.5 km, and low-level upward motion (thin contour: 0.25 m s−1, thick contour: 1 m s−1,
averaged from 1.25–2 km height) both averaged from 1–6 h after vertical shear is imposed for (a) RMN68, (b)
CBLAST68, (c) RMN54, (d) CBLAST54, (e) ICE68, and (f) 10ICE68. The arrow indicates the direction of the
deep-layer shear. The horizontal scale is in km.
33
Fig. 5. Downward flux ofθ ′e, DFX (colour, in 0.1 K m s−1, see text for definition), at the top of the axisymmetric inflow layer, defined as
1.5 km, and low-level upward motion (thin contour: 0.25 m s−1, thick contour: 1 m s−1, averaged from 1.25–2 km height) both averaged from1–6 h after vertical shear is imposed for(a) RMN68, (b) CBLAST68, (c) RMN54, (d) CBLAST54, (e) ICE68, and(f) 10ICE68. The arrowindicates the direction of the deep-layer shear. The horizontal scale is in km.
A distinct maximum of DFX is found in the upshear quad-rant close to the eyewall. This maximum is most pronouncedin the ICE experiments (Fig.5e, f). In RMN10, this DFXmaximum was not given special attention. A pronouncedmaximum in the upshear quadrant occured in the “20mps”case of RMN10 (their Fig. 10d). RMN10 further noted a lo-calized region of downdrafts in the upshear region close tothe eyewall after the TCs in the “10mps” and “15mps” caseshave re-aligned (their Fig. 11a and associated discussion).
The DFX maximum is located at the downwind end of thebanded region of positive DFX values. A pronouncedθe de-pression is found at the top of the inflow layer in this region(not shown). Therefore, large negative values ofθ ′
e contributeto high values of DFX (Eq.4). However, downward motioninto the inflow layer is particularly strong in this region also(not shown). A preliminary examination of the distributionsof vertical motion, hydrometeors, andθe suggests that thedowndrafts close to the eyewall may form by evaporation ofprecipitation falling out of the tilted eyewall. To us, however,it is not clear whether the more pronounced localized max-imum in the ICE experiments is solely due to the inclusionof ice microphysics or to what extent the differences in theradial structure of the TC vortex contribute. Clearly, more re-
search is needed to clarify the formation mechanism of thesedowndrafts, as well as the relative importance of the confinedDFX maximum and the broad region of moderate DFX forTC intensity evolution.
3.5 Vortex-tilt induced dynamic instability?
A non-linear, Kelvin-Helmholtz type instability in the innercore of a tilted, dry TC-like vortex has been found in a nu-merical experiment byReasor et al.(2004, their Sect. 5a). Intheir experiment, this instability contributed to enhanced lo-calized, three-dimensional mixing. Such mixing is one path-way to dissipate kinetic energy in the TC’s inner core. Therole of this mixing for the intensity evolution of TCs in ver-tical wind shear is hitherto unexplored.
The necessary condition for such an instability is that thegradient Richardson number,R, drops below unity (Abar-banel et al., 1986). Here,R is calculated as
R= N2/((du/dz)2+ (dv/dz)2), (5)
www.atmos-chem-phys.net/13/327/2013/ Atmos. Chem. Phys., 13, 327–346, 2013

338 M. Riemer et al.: Thermodynamic impact of vertical wind shear on the inflow layer
a)
RMN68 shear
b)
ICE68 shear
Fig. 6. Snapshots of the gradient Richardson number at 3 h after vertical shear is imposed (shaded for values
below 1) in (a) RMN68 and (b) ICE68. Upward motion is depicted in black contours (thin for 0.25 ms−1, thick
for 1 ms−1). The cyan contour denotes regions of strong downward flux of low-θe air into the inflow layer
(DFX at 1.5 km height, the contour depicts the 4.5 Kms−1 isoline). The horizontal scale is in km.
32
Fig. 6. Snapshots of the gradient Richardson number at 1625 m height and 3 h after vertical shear is imposed
(shaded for values below 1) in (a) RMN68 and (b) ICE68. Upward motion is depicted in black contours (thin
for 0.25 m s−1, thick for 1 m s−1). The cyan contour denotes regions of strong downward flux of low-θe air into
the inflow layer (DFX at 1.5 km height, the contour depicts the 4.5 K m s−1 isoline). The horizontal scale is in
km.
34
Fig. 6. Snapshots of the gradient Richardson number at 1625 m height and 3 h after vertical shear is imposed (shaded for values below 1) in(a) RMN68 and(b) ICE68. Upward motion is depicted in black contours (thin for 0.25 m s−1, thick for 1 m s−1). The cyan contour denotesregions of strong downward flux of low-θe air into the inflow layer (DFX at 1.5 km height, the contour depicts the 4.5 K m s−1 isoline). Thehorizontal scale is in km.
whereN is the (dry) vertical static stability, andu andv arethe radial and tangential wind components16, respectively.The tilt of the vortex may lead to a highlocal vertical shearof the swirling winds in the inner core. Thus, in such regions,the gradient Richardson number may reach small values.
In all of our (moist) TC experiments, the potential fora Kelvin-Helmholtz type instability and the associated three-dimensional, turbulent mixing in the inner core is an ele-ment of vertical-shear interaction. Underneath the eyewalland the SBC,R< 1 is an ubiquitous feature within the layerof strong, frictionally-driven inflow (not shown). Above thisinflow layer, localized regions ofR< 1 occur, at least tem-porarily, in all experiments presented in this study within thefirst 6 h after shear is imposed. These regions are locatedwithin the eyewall in the downshear-left to upshear quad-rant (exemplified in Fig.6 for RMN68 and ICE68). This fea-ture is most pronounced in RMN68 and least pronouncedin RMN54, as might be expected for the weaker vortex inRMN54. The regions ofR< 1 are frequently located radi-ally inwards (within 20–30 km) of regions of high DFX (ex-emplified in Fig.6). Due to this proximity, it seems justi-fied to hypothesize that enhanced mixing associated with thetilt-induced instability locally modifies the downward flux oflow-θe air into the inflow layer. A quantitative diagnostic ofthis mixing process is deferred to future work.
3.6 Inflow layer θe depression
3.6.1 θe depression outside of the eyewall
A notable depression ofθe values in the inflow layer outsideof the eyewall occurs in all experiments 2–3 h after shear isimposed. A snapshot of the height-averaged inflow layerθedistribution representative of the early part of the shear ex-
16Normally, the definition ofR involves the zonal and merid-ional wind components. Our calculation ofR is equivalent to thisdefinition.
periments (at 5 h) is presented in Fig.7. As can be expectedfrom the DFX patterns discussed above, the inflow layerθedistribution is similar in all experiments at this time: Low-θe air wraps from the downshear quadrant into the upshearquadrant cyclonically inward17. Also evident in all cases isthe pronounced wave-number 1 signature of the SBC in thevertical motion field at low levels above the inflow layer.
To facilitate the intercomparison of the experiments weconsider now the deviation of the horizontal distribution ofθe relative to its initial azimuthal average at the time whenshear is imposed in the respective experiment (Fig.8). Thisfigure depicts time-averaged values from 4–9 h after shear isimposed. In all cases, the inflow layerθe values outside of theinner-core updrafts are significantly depressed. A depressionof up to 15 K can be found in RMN68, RMN54, and ICE68.Minimum θe values are generally found to the southeast ofthe centre (upshear to downshear-left). This location is con-sistent with the DFX maximum in this region and the contin-uous depression ofθe values along the spiralling inflow leg,as hypothesised by RMN10 (their Fig. 11a). The inflow layerθe depression extends into the downshear-right quadrant also,outwards to a radius of 100–150 km. In the absence of down-ward flux of lowθe in this region (cf. Fig.5) the inflow layerθe values gradually recover while air parcels circle from theupshear quadrant to the upshear-right quadrant.
The inflow layerθe depression outside of the eyewall inthe CBLAST experiments is less pronounced than in thecomparable RMN experiments. While the minima in RMNexceed−13 K, the minima in CBLAST have values of ap-prox. −10 K. This less pronouncedθe depression is consis-tent with smaller average DFX values in CBLAST68 and
17Approximately, thisθe depression is associated with a depres-sion in the water vapor mixing ratio by 4–5 g kg−1 and a depres-sion in the potential temperature by 2–3 K. The spatial distributionof these fields for ICE68 and RMN68 at the time shown in Fig.7can be found on the ACPD webpage in the authors’ response to theanonymous reviewer (item 3).
Atmos. Chem. Phys., 13, 327–346, 2013 www.atmos-chem-phys.net/13/327/2013/

M. Riemer et al.: Thermodynamic impact of vertical wind shear on the inflow layer 339
a)
RMN68 shear
b)
CBLAST68 shear
c)
RMN54 shear
d)
CBLAST54 shear
e)
ICE68 shear
f )
10ICE68 shear
Fig. 7. As Fig. 5, but for a snapshot of inflow layerθe (colour, averaged over lowest 1 km) and low-level
updrafts at 5 h after vertical shear is imposed for a) RMN68, b) CBLAST68, c) RMN54, d) CBLAST54, e)
ICE68, and f)10ICE68. The depicted time is representative for the early part of the experiments.
33
a)
RMN68 shear
b)
CBLAST68 shear
c)
RMN54 shear
d)
CBLAST54 shear
e)
ICE68 shear
f )
10ICE68 shear
Fig. 7. As Fig. 5, but for a snapshot of inflow layerθe (colour, averaged over lowest 1 km) and low-level
updrafts at 5 h after vertical shear is imposed for a) RMN68, b) CBLAST68, c) RMN54, d) CBLAST54, e)
ICE68, and f)10ICE68. The depicted time is representative for the early part of the experiments.
33Fig. 7. As Fig. 5, but for a snapshot of inflow layer θe (colour, averaged over lowest 1 km) and low-level
updrafts at 5 h after vertical shear is imposed for (a) RMN68, (b) CBLAST68, (c) RMN54, (d) CBLAST54, (e)
ICE68, and (f) 10ICE68. The depicted time is representative for the early part of the experiments.
35
Fig. 7. As Fig. 5, but for a snapshot of inflow layerθe (colour, averaged over lowest 1 km) and low-level updrafts at 5 h after vertical shearis imposed for(a) RMN68, (b) CBLAST68, (c) RMN54, (d) CBLAST54, (e) ICE68, and(f) 10ICE68. The depicted time is representative forthe early part of the experiments.
CBLAST54 as compared to RMN68 and RMN54, respec-tively (Fig.5). The smaller DFX values in CBLAST are asso-ciated with a weaker general downdraft activity (see Sect.3.7and Fig.10 for supporting evidence).
In the ICE experiments, the spatial pattern of theθe de-pression is radially more confined than in the warm-rain ex-periments. This is consistent with the DFX pattern. As dis-cussed at the end of Sect.3.4, it is not evident to us to whatextent this greater radial confinement can be attributed to dif-ferences in the cloud microphysics or to differences in theradial structure of the TC vortices.
3.6.2 θe depression underneath the inner-core updrafts
An axisymmetric view of the inflow layer and eyewallθe dis-tribution is presented in RMN10. In this axisymmetric viewa tongue of low-θe air effectively intrudes into the inflowlayer from above and radially inwards towards the eyewall.Theθe values of air rising in the eyewall of the sheared TCsare several degrees smaller than in the experiment withoutvertical shear (Fig. 9 in RMN10). The same general charac-teristics of the axisymmetric inflow layer and adjacent eye-wall structure are found in the additional experiments consid-ered in this study (not shown). When viewed from the sim-
plified perspective of an idealised Carnot-cycle, a weakeningof the sheared TCs can be expected. As noted in RMN10,however, it is an open question whether an axisymmetricviewpoint is sufficient in the presence of pronounced wave-number 1 asymmetries in the inflow layerθe distribution andthe eyewall updrafts of a TC in vertical wind shear.
In the present study we complement the axisymmetricview by the examination of the horizontal distribution of in-flow layerθe and low-level eyewall updrafts. For the follow-ing discussion the eyewall updrafts are defined as the con-tiguous region within the 1 m s−1 vertical velocity isotachnear the centre in Fig.8. We consider theθe values withinthis region to be a good approximation for theθe values of airrising out of the boundary/ sub-cloud layer into the eyewallupdrafts. Upon examining the results, it is obvious that inall cases, the inner-core updrafts exhibit a pronounced wave-number 1 asymmetry and that the eyewall is not closed.
By visual inspection we estimate the averageθe depres-sion underneath the eyewall (averaged from 4–9 h) to be 0 Kfor CBLAST54, 2–3 K for RMN68 and CBLAST68, 3–5 K forRMN54 and10ICE68, and 6–7 K for ICE68. These values cor-relate well with the intensity evolution of the respective TCs.The TC in CBLAST54 does not weaken until 7 h after shearis imposed (Fig.2c). The TCs in RMN68 and CBLAST68
www.atmos-chem-phys.net/13/327/2013/ Atmos. Chem. Phys., 13, 327–346, 2013

340 M. Riemer et al.: Thermodynamic impact of vertical wind shear on the inflow layer
a)
RMN68 shear
b)
CBLAST68 shear
c)
RMN54 shear
d)
CBLAST54 shear
e)
ICE68 shear
f )
10ICE68 shear
Fig. 8. Depression of inflow layerθe (averaged over the lowest 1 km and from 4 h - 9 h) relative to the
axisymmetric mean at the time when vertical wind shear is imposed (colours). Thin contours depict the radial
flow averaged over the lowest 1 km (every 4 ms−1, starting at 2 ms−1, dashed for negative values (outflow)).
Thick contour denotes low-level updrafts (1 ms−1, averaged from 1.25 km - 2 km height). a) RMN68, b)
CBLAST68, c) RMN54, d) CBLAST54, e) ICE68, and f)10ICE68
.
34
a)
RMN68 shear
b)
CBLAST68 shear
c)
RMN54 shear
d)
CBLAST54 shear
e)
ICE68 shear
f )
10ICE68 shear
Fig. 8. Depression of inflow layerθe (averaged over the lowest 1 km and from 4 h - 9 h) relative to the
axisymmetric mean at the time when vertical wind shear is imposed (colours). Thin contours depict the radial
flow averaged over the lowest 1 km (every 4 ms−1, starting at 2 ms−1, dashed for negative values (outflow)).
Thick contour denotes low-level updrafts (1 ms−1, averaged from 1.25 km - 2 km height). a) RMN68, b)
CBLAST68, c) RMN54, d) CBLAST54, e) ICE68, and f)10ICE68
.
34Fig. 8. Depression of inflow layer θe (averaged over the lowest 1 km and from 4–9 h) relative to the axisym-
metric mean at the time when vertical wind shear is imposed (colours). Thin contours depict the radial flow
averaged over the lowest 1 km (every 4 m s−1, starting at 2 m s−1, dashed for negative values (outflow)). Thick
contour denotes low-level updrafts (1 m s−1, averaged from 1.25–2 km height). (a) RMN68, (b) CBLAST68,
(c) RMN54, (d) CBLAST54, (e) ICE68, and (f) 10ICE68.
36
Fig. 8. Depression of inflow layerθe (averaged over the lowest 1 km and from 4–9 h) relative to the axisymmetric mean at the time whenvertical wind shear is imposed (colours). Thin contours depict the radial flow averaged over the lowest 1 km (every 4 m s−1, starting at2 m s−1, dashed for negative values (outflow)). Thick contour denotes low-level updrafts (1 m s−1, averaged from 1.25–2 km height).(a)RMN68, (b) CBLAST68, (c) RMN54, (d) CBLAST54, (e) ICE68, and(f) 10ICE68.
show a very similar weakening in the first 12 h while RMN54and10ICE68 exhibit slightly faster weakening rates. The pro-nounced and rapid weakening of the TC in ICE68 is associ-ated with the most pronounced depression ofθe underneaththe eyewall. This correlation supports RMN10’s result thatthe intensity evolution of resilient TCs in vertical shear isgoverned to first order by the systematic depression ofθe inthe inflow layer.
The inflow layerθe depressionoutsideof the eyewall inCBLAST68 is less pronounced than in RMN68. However, theθe depressionunderneaththe eyewall is very similar in bothexperiments. Consistently, the intensity decrease is very sim-ilar in CBLAST68 and RMN68 in the first 12 h. Therefore,it can be inferred that the replenishment of inflow air spi-ralling towards the eyewall is more complete in RMN than inCBLAST. As discussed in the Introduction, the smaller valueof CD in CBLAST may lead to weaker frictional inflow ascompared to RMN and thus to a longer replenishment time.Here, this effect of a smallerCD value is apparently over-ruled by the reduced extraction of heat from the ocean sur-face due to a smaller value ofCK . It is difficult to examinethis aspect in RMN54 and CBLAST54 because theθe depres-
sion underneath the eyewall is different at this early time inthe experiment.
The replenishment time of air with depressedθe val-ues may depend considerably on theazimuthal location.The radial velocity averaged over the lowest 1 km exhibitsa pronounced wave-number 1 asymmetry in all experiments(Fig. 8). In the downshear semicircle, the maximum height-averaged radial inflow is approx. 20 m s−1 while in the up-shear semicircle the height-averaged radial velocity is verysmall or is even directedoutwards(e.g. in RMN54 (Fig.8c)).Figure8 indicates that the bulk of the depressed inflow layerθe spirals around the centre before entering the inner coreupdrafts in the downshear-right quadrant (e.g. Fig.8a, f). Incontrast, in RMN54 and ICE68, an additional, much more di-rect pathway for low-θe air from the downshear quadrant toenter the eyewall updrafts in the downshear to downshear-leftquadrant is indicated (Fig.8c, e). The replenishment of in-flow layerθe along this more direct pathway can be expectedto be less complete than along the longer inflow spiral. Inthe presence of a pronounced wave-number 1 asymmetry ofthe inflow, it stands to reason that the (azimuthal)locationof the flushing of the inflow layer with low-θe air may be of
Atmos. Chem. Phys., 13, 327–346, 2013 www.atmos-chem-phys.net/13/327/2013/

M. Riemer et al.: Thermodynamic impact of vertical wind shear on the inflow layer 341
he
igh
t [k
m]
vertical velocity [ms ]-1
a)
RMN
no shear
he
igh
t [k
m]
vertical velocity [ms ]-1
b)
ICE
no shear
he
igh
t [k
m]
vertical velocity [ms ]-1
c)
RMN68
he
igh
t [k
m]
vertical velocity [ms ]-1
d)
ICE68
Fig. 9. Contoured frequency by altitude diagrams of vertical motion within 160 km radius of the centre. Vertical
motion is binned into intervals of 0.5 ms−1, centred on the values given on the x-axis. The colour-coded value
denotes the logarithm of the frequency. With each contour the frequencydecreases by a factor of1/e. Before
taking the logarithm of the frequency a small positive value (10−5≈ e−11.5) has been added to ensure that the
logarithm is well defined everywhere. For the no-shear cases of RMN (a) and ICE (b) the 6 h time period after
vertical wind shear is imposed in the respective shear runs is considered. For RMN68 (c) and ICE68 (d) the
times 4 h - 9 h are considered.
35
Fig. 9. Contoured frequency by altitude diagrams of vertical motion within 160 km radius of the centre. Vertical
motion is binned into intervals of 0.5 m s−1, centred on the values given on the x-axis. The colour-coded value
denotes the logarithm of the frequency. With each contour the frequency decreases by a factor of 1/e. Before
taking the logarithm of the frequency a small positive value (10−5 ≈ e−11.5) has been added to ensure that the
logarithm is well defined everywhere. For the no-shear cases of RMN (a) and ICE (b) the 6 h time period after
vertical wind shear is imposed in the respective shear runs is considered. For RMN68 (c) and ICE68 (d) the
times 4–9 h are considered.
37
Fig. 9. Contoured frequency by altitude diagrams of vertical motion within 160 km radius of the centre. Vertical motion is binned intointervals of 0.5 m s−1, centred on the values given on thex-axis. The colour-coded value denotes the logarithm of the frequency. With eachcontour the frequency decreases by a factor of 1/e. Before taking the logarithm of the frequency a small positive value (10−5
≈ e−11.5) hasbeen added to ensure that the logarithm is well defined everywhere. For the no-shear cases of RMN(a) and ICE(b) the 6 h time period aftervertical wind shear is imposed in the respective shear runs is considered. For RMN68 (c) and ICE68 (d) the times 4–9 h are considered.
importance for the intensity evolution also, and not only themagnitude of theθe depression in the azimuthal mean.
3.7 Vertical motion characteristics
The formation of the SBC and the associated downdraftsthat flush low-θe air into the inflow layer are two central as-pects of RMN10’s framework. Here, we examine the gen-eral characteristics of vertical motion in our suite of exper-iments using so-called contoured frequency by altitude di-agrams (CFADs,Yuter and Houze, 1995). These diagramsdepict the frequency of the occurrence of vertical motion ofa given magnitude, here binned in 0.5 m s−1 intervals, withina given region and at a given altitude. It is very difficult tofocus specifically on the SBC and on regions where shear-induced downdrafts form. Therefore, we consider all verticalmotion within a radius of 160 km.
A comparison of the RMN and ICE experiments is pre-sented in Fig.9. Without vertical wind shear (Fig.9a, b),strong up- and downdrafts occur more frequently in the ICEexperiment. Under the influence of vertical shear (Fig.9c,d), the frequency distribution broadens considerably below5–6 km as compared to the respective no-shear experiment.For both the warm rain and ice microphysics configurations,vertical wind shear increases the frequency of the strongestup- and downdrafts at midlevels and below. At upper lev-
els the increase of downdraft frequency is less pronouncedand the frequency of strong updrafts tends to decrease, ex-cept for the strongest updrafts in ICE68. It is evident alsothat strong downdrafts below 5 km occur considerably morefrequently in ICE68 than in RMN68 (cf. Fig. 9c, d). Themore pronounced downdraft activity in the ICE experimentsis consistent with the tenet that the cooling associated withthe melting of ice particles may initiate or strengthen exist-ing downdrafts (Srivastava, 1987).
Whithout imposed vertical shear, the results in CBLASTare very similar to those in RMN (not shown). The im-posed vertical wind shear leads to a broadening of the fre-quency distribution in CBLAST also (not shown). The dif-ferences between the CBLAST and RMN shear experimentsare less pronounced than between ICE and RMN. The dif-ferences are depicted in Fig.10 as the ratio of the fre-quencies in RMN68 and CBLAST68 (Fig. 10a) and RMN54and CBLAST54 (Fig. 10b). Apparently, the frequency of thestrongest downdrafts is more than 275 % greater in RMNthan in CBLAST. Strong updrafts tend to be more frequentin RMN also, in particular so in RMN54 as compared toCBLAST54.
Differences in the thermodynamic properties of the am-bient air in which downdrafts occur may contribute to theobserved differences in downdraft activity. The strength of
www.atmos-chem-phys.net/13/327/2013/ Atmos. Chem. Phys., 13, 327–346, 2013

342 M. Riemer et al.: Thermodynamic impact of vertical wind shear on the inflow layer
he
igh
t [k
m]
vertical velocity [ms ]-1
a)
RMN68/
CBLAST68
he
igh
t [k
m]
vertical velocity [ms ]-1
b)
RMN54/
CBLAST54
Fig. 10. As Fig. 9, but for the ratio of vertical motion frequency of RMN68/CBLAST68 (a) and
RMN54/CBLAST54 (b).
36
Fig. 10. As Fig. 9, but for the ratio of vertical motion frequency of RMN68/CBLAST68 (a) and
RMN54/CBLAST54 (b).
38
Fig. 10.As Fig.9, but for the ratio of vertical motion frequency of RMN68/CBLAST68 (a) and RMN54/CBLAST54 (b).
a downdraft depends, inter alia, on the buoyancy differencebetween the descending air parcel and the ambient air alongthe parcel’s downward path. A vertically integrated mea-sure of this buoyancy difference is the downdraft convec-tive available potential energy (DCAPE,Emanuel, 1994, hisSect. 6.3). The derivation of DCAPE assumes the followingtwo-stage process. First, evaporation of precipitation cools anair parcel isobarically until saturation is reached. Then, theparcel descends pseudo-adiabatically with just enough evap-oration to keep the parcel saturated.
We have calculated DCAPE using the azimuthal meansoundings at the time when shear is imposed. Because it isnot entirely clear which radius is most appropriate to ex-amine the downdrafts underneath the SBC we considereda number of different radii and radial averages between60 km and 150 km (not shown). For none of these regions,could we find a clear relationship between the DCAPE val-ues and the downdraft activity, or between the DCAPE valuesand the downward flux of low-θe air into the inflow layer. Inparticular, DCAPE values below 500 hPa in CBLAST54 arehigher than in RMN54, in contrastto the more pronounceddowndraft activity in RMN54.
Apparently, consideration of solely thermodynamic prop-erties of the air in which the downdrafts occur is insufficientto explain the observed differences in downdraft activity. Wepropose the following alternative explanation that focuses onthe dynamic coupling of the convection with the frictionalboundary layer. First, we note that the weaker downdraftsin CBLAST68 and CBLAST54 are associated with weakerupdraft activity. This may be expected because a prominentdowndraft formation mechanism is the evaporation of pre-cipitation that is formed in the updrafts and falls into unsatu-rated air. Both the smaller value ofCD andCK in CBLASTmay contribute to weaker updrafts. Ascent out of the bound-ary layer forced by frictional convergence, either underneaththe eyewall or underneath the vorticity anomaly associatedwith the tilt of the outer vortex (RMN10, their Fig. 17), canbe expected to decrease for decreasingCD. For example, insimple Ekman pumping theory the vertical motion at the topof the boundary layer is proportional to
√CD (e.g.,Holton,
2004, his Eq. 5.38). The smaller value ofCK in CBLASTdecreases the rate by which heat is extracted from the oceansurface. These reduced surface fluxes destabilise the bound-ary layer in CBLAST to a lesser extent than in RMN. Lessvigorous updrafts can be expected to occur in such a morestable stratification. Our foregoing argument is supported bythe results of the CBLAST and RMN no-shear experiments(not shown). Without vertical shear, the activity oftransientrain bands and the associated localized downward flux of lowθe into the inflow layer in CBLAST are less pronounced thanin the no-shear RMN experiment also.
In all experiments, vertical wind shear increases the fre-quency of moderate to strong downdrafts. It is clear thatCBLAST has the lowest frequency of strong downdrafts andthat ICE has the highest frequency. The downdraft activity asseen in the CFADs is consistent with the magnitude of theinflow layerθe depression outside of the eyewall (cf. Fig.8).Therefore, the examination of the CFADs provides additionalsupport for the hypothesis that the distinct depression of theinflow layer θe values are caused by downdrafts induced bythe imposed vertical wind shear.
4 A closer look at the ICE68 experiment
The weakening of the TC in ICE68 is much more pronouncedthan in the comparable warm-rain experiments RMN68 andCBLAST68. Nevertheless, in the previous sections it hasbeen shown that the general structural changes in the first20 h are very similar in all experiments. We now take a closerlook at ICE68 to further confirm that the intensity evolutionin this case is consistent with the shear-induced thermody-namic modification of the inflow layer. First, the inflow layerθe distribution is examined during periods of distinct inten-sity changes. Then, we will provide evidence based on ax-isymmetric spindown theory that the rapid weakening in thefirst 20 h is consistent with the spindown of the TC vortex dueto divergence above the inflow layer associated with a signif-icant decrease of the inner-core convective mass flux.
Atmos. Chem. Phys., 13, 327–346, 2013 www.atmos-chem-phys.net/13/327/2013/
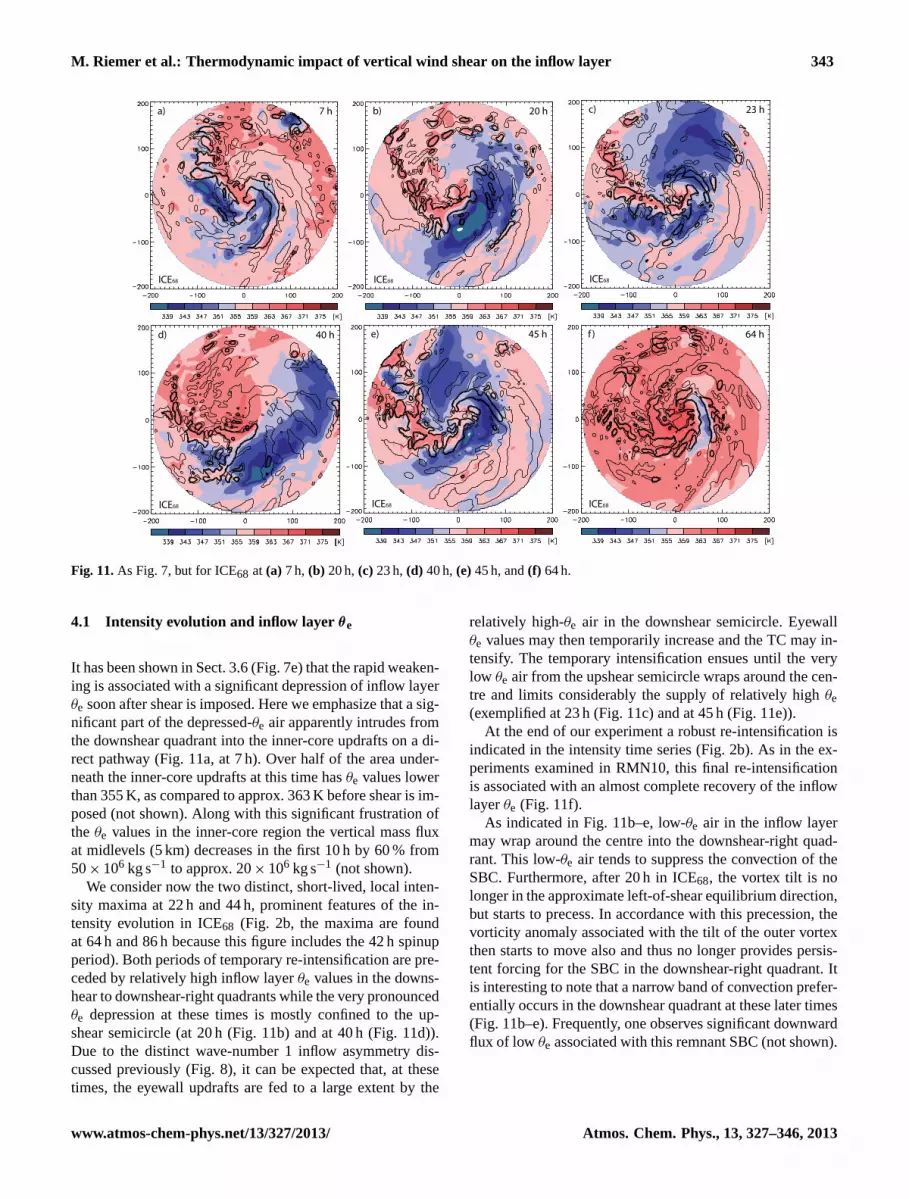
M. Riemer et al.: Thermodynamic impact of vertical wind shear on the inflow layer 343
a)
ICE68
7 h b)
ICE68
20 h
c)
ICE68
23 h d)
ICE68
40 h
e)
ICE68
45 h f )
ICE68
64 h
Fig. 11. As Fig. 7, but for ICE68 at a) 7 h, b) 20 h, c) 23 h, d) 40 h, e) 45 h, and f) 64 h.37
a)
ICE68
7 h b)
ICE68
20 h
c)
ICE68
23 h d)
ICE68
40 h
e)
ICE68
45 h f )
ICE68
64 h
Fig. 11. As Fig. 7, but for ICE68 at a) 7 h, b) 20 h, c) 23 h, d) 40 h, e) 45 h, and f) 64 h.37
a)
ICE68
7 h b)
ICE68
20 h
c)
ICE68
23 h d)
ICE68
40 h
e)
ICE68
45 h f )
ICE68
64 h
Fig. 11. As Fig. 7, but for ICE68 at a) 7 h, b) 20 h, c) 23 h, d) 40 h, e) 45 h, and f) 64 h.37
a)
ICE68
7 h b)
ICE68
20 h
c)
ICE68
23 h d)
ICE68
40 h
e)
ICE68
45 h f )
ICE68
64 h
Fig. 11. As Fig. 7, but for ICE68 at a) 7 h, b) 20 h, c) 23 h, d) 40 h, e) 45 h, and f) 64 h.37Fig. 11. As Fig. 7, but for ICE68 at (a) 7 h, (b) 20 h, (c) 23 h, (d) 40 h, (e) 45 h, and (f) 64 h.
39
Fig. 11.As Fig.7, but for ICE68 at (a) 7 h, (b) 20 h,(c) 23 h,(d) 40 h,(e)45 h, and(f) 64 h.
4.1 Intensity evolution and inflow layerθe
It has been shown in Sect.3.6(Fig.7e) that the rapid weaken-ing is associated with a significant depression of inflow layerθe soon after shear is imposed. Here we emphasize that a sig-nificant part of the depressed-θe air apparently intrudes fromthe downshear quadrant into the inner-core updrafts on a di-rect pathway (Fig.11a, at 7 h). Over half of the area under-neath the inner-core updrafts at this time hasθe values lowerthan 355 K, as compared to approx. 363 K before shear is im-posed (not shown). Along with this significant frustration ofthe θe values in the inner-core region the vertical mass fluxat midlevels (5 km) decreases in the first 10 h by 60 % from50× 106 kg s−1 to approx. 20× 106 kg s−1 (not shown).
We consider now the two distinct, short-lived, local inten-sity maxima at 22 h and 44 h, prominent features of the in-tensity evolution in ICE68 (Fig. 2b, the maxima are foundat 64 h and 86 h because this figure includes the 42 h spinupperiod). Both periods of temporary re-intensification are pre-ceded by relatively high inflow layerθe values in the downs-hear to downshear-right quadrants while the very pronouncedθe depression at these times is mostly confined to the up-shear semicircle (at 20 h (Fig.11b) and at 40 h (Fig.11d)).Due to the distinct wave-number 1 inflow asymmetry dis-cussed previously (Fig.8), it can be expected that, at thesetimes, the eyewall updrafts are fed to a large extent by the
relatively high-θe air in the downshear semicircle. Eyewallθe values may then temporarily increase and the TC may in-tensify. The temporary intensification ensues until the verylow θe air from the upshear semicircle wraps around the cen-tre and limits considerably the supply of relatively highθe(exemplified at 23 h (Fig.11c) and at 45 h (Fig.11e)).
At the end of our experiment a robust re-intensification isindicated in the intensity time series (Fig.2b). As in the ex-periments examined in RMN10, this final re-intensificationis associated with an almost complete recovery of the inflowlayerθe (Fig. 11f).
As indicated in Fig.11b–e, low-θe air in the inflow layermay wrap around the centre into the downshear-right quad-rant. This low-θe air tends to suppress the convection of theSBC. Furthermore, after 20 h in ICE68, the vortex tilt is nolonger in the approximate left-of-shear equilibrium direction,but starts to precess. In accordance with this precession, thevorticity anomaly associated with the tilt of the outer vortexthen starts to move also and thus no longer provides persis-tent forcing for the SBC in the downshear-right quadrant. Itis interesting to note that a narrow band of convection prefer-entially occurs in the downshear quadrant at these later times(Fig. 11b–e). Frequently, one observes significant downwardflux of low θe associated with this remnant SBC (not shown).
www.atmos-chem-phys.net/13/327/2013/ Atmos. Chem. Phys., 13, 327–346, 2013

344 M. Riemer et al.: Thermodynamic impact of vertical wind shear on the inflow layer
4.2 A timescale for vortex spindown
Within the simplified framework of an idealised Carnot cy-cle, and based on the idea that environmental vertical windshear leads to the frustration of such a thermodynamic cy-cle, Tang and Emanuel(2010) have derived a theory for thestorm’s reducedsteady-stateintensity. Such a theory, how-ever, does not provide information about thetemporal evo-lution of storm intensity, i.e. how rapidly a TC weakens.A well-known concept for the weakening of a TC is the ax-isymmetric, frictionally-induced spindown of the TC vortex.Frictional convergence forces ascent out of the inflow layer.When the vertical convective mass flux is smaller than thefrictionally forced vertical mass flux, some of the air hasto diverge above the inflow layer due to mass continuity(Willoughby, 1979). Under the assumption that air parcelsapproximately conserve their angular momentum above thefrictional inflow layer, this divergence implies a decay of thetangential winds, i.e. the TC weakens.
A timescale for the frictional spindown of anaxisymmet-ric vortexwithoutconvective mass flux has been derived byElliassen and Lystad(1977). Their model assumes a neutralstratification above the layer of strong frictional inflow whichis a reasonable assumption in the inner core of a TC becauseisosurfaces ofθe and angular momentum are approximatelycongruent in this region.Montgomery et al.(2001) have ver-ified by numerical experiments that the theory gives reason-able results for the spindown of TC-like vortices, even be-yond the formal validity of the theory. The half-timethalf,i.e. the time that is required to reduce the initial tangentialvelocityv by a factor of 2, is given byElliassen and Lystad’stheory as
thalf =H − h
χ2CDv. (6)
Here,H is the fluid depth,h the height of the boundary layer,andχ a reduction factor defined byElliassen and Lystadasthe ratio of the tangential winds at the top of the surface layerto the tangential winds at the top of the Ekman layer. Esti-matingH −h = 104 m,χ = 0.8, and usingCD = 3.8×10⁻³
from Deacon’s formula withv = 68 m s−1 yields a half-timethalf = 16.8 h.
The weakening of the TC in ICE68 is remarkable: intensitydecreases from 68 m s−1 at 42 h to 33 m s−1 at 68 h (Fig.2b),corresponding to a weakening rate of 35 m s−1 in 26 h; ora half-time of approx. 25 h. This value is consistent witha partial shutdown of the convective mass flux. As notedabove, concurrently with the frustration of the inflow layerθe and the rapid weakening, the vertical mass flux at 5 kmheight decreases by approx. 60 %. Consequently, it can beargued that the significant reduction of the convective verti-cal mass flux by the severe depression of the inflow layerθevalues broadly governs the rapid weakening in ICE68.
5 Conclusions
In the light of a new framework developed in a recent study(RMN10), the current study examines further the evolutionof TCs exposed to environmental vertical wind shear. Thenew framework has been developed on the basis of idealizednumerical experiments for which we have deliberately cho-sen a simple set of physical parameterisations to minimizethe complexity of the problem. In the current study, we as-sess the robustness of our previous results in a more realisticand representative experimental setup by surveying and di-agnosing five additional numerical experiments.
The modifications of the experimental setup focus on pa-rameters that are important for structure change and inten-sity evolution of numerically simulated TCs and the storms’evolution in vertical wind shear, discussed in some detail inthe Introduction in Sect.1.2. Specifically, in comparison toRMN10, we here consider weaker, but still mature TCs; em-ploy values for the exchange coefficients of surface heat andmomentum fluxes that are in better agreement with recentobservational results; and complement our previous warm-rain experiments with experiments that employ an ice micro-physics scheme.
Several environmental factors, such as the vertical profilesof moist entropy and the environmental winds, likely play arole for the evolution of TCs in vertical wind shear also. Fur-thermore, the motion vector of the TCs in all of our experi-ments is approx. 30◦–45◦ left of the shear vector (not shown)while TCs in the real atmosphere generally feature a morepronounced and more variable angle. The role of the envi-ronmental factors and of storm motion constitutes an impor-tant topic for future research. It is hoped that the frameworkpresented in RMN10,Riemer and Montgomery(2011) andin the current study provides a helpful conceptual basis forsuch research.
The ability of TC-like vortices to withstand the differentialadvection by vertical wind shear and to eventually re-aligndepends on the radial profile of the swirling winds (discussedin detail in Sect.3.1). Some differences in this radial struc-ture arise in the individual experimentsbeforevertical windshear is imposed. The most notable differences are found inthe experiment with ice microphysics in which the TC, interalia, features a radius of maximum winds that is approx. 25 %smaller than in the warm-rain experiments. Differences in theradial vortex structure complicate the attribution of differ-ences in the TC evolution to the inclusion of ice microphysicsalone.
The differences in the vortex structure notwithstanding, inall experiments the TCs exhibit the same general structuralchanges when exposed to vertical wind shear. The structuralchanges are consistent with RMN10’s new framework andcomprise a vortex tilt predominantly to the downshear-leftfor 20–24 h, the formation of a pronounced wave-number 1convective asymmetryoutsideof the eyewall (reminiscent ofa stationary band complex), and downward flux of low-θe air
Atmos. Chem. Phys., 13, 327–346, 2013 www.atmos-chem-phys.net/13/327/2013/

M. Riemer et al.: Thermodynamic impact of vertical wind shear on the inflow layer 345
into the inflow layer in the downshear-left semicircle. A sig-nificant depression of the inflow layerθe values (O (10 K))occurs in all experiments.
Furthermore, for all experiments the potential for a non-linear, Kelvin-Helmholtz type instability in the inner core ofthe tilted TC-vortex is diagnosed. Such an instability wouldcontribute to enhanced dissipation of kinetic energy and maymodify the flux of low-θe air into the inflow layer. However,a quantitative analysis of the mixing process associated withthe potential instability is deferred to future work.
Two additional diagnostics are considered in the currentstudy that have not been considered in RMN10, namely theθe values underneath theasymmetricinner-core updrafts, andso-called contoured frequency by altitude diagrams to exam-ine the general characteristics of vertical motion. The mag-nitude of theθe depression underneath theasymmetricinner-core updrafts early in the respective shear experiment corre-lates well with the ensuing weakening of the TC, supportingthe idea that it is the depression of the inflow layerθe thatgoverns the intensity evolution to first order. For all experi-ments, vertical wind shear increases the frequency of strongdowndrafts as compared to the no-shear experiments. Themagnitude of theθe depressionoutsideof the eyewall is con-sistent with the frequency of strong downdrafts, supportingthe idea that it is the shear-induced downdrafts that flush low-θe air into the inflow layer. Consequently, both additional di-agnostics corroborate RMN10’s framework.
In one of our experiments employing ice microphysics,a very rapid weakening of the TC occurs. This intensityevolution is distinct from the intensity evolution in ourwarm-rain experiments. Therefore, a question may natu-rally arise whether ice microphysics, as represented in theRAMS model, introduce an important mechanism for inten-sity change that is not considered in RMN10’s framework.As noted above, the structural changes caused by the verticalwind shear in the experiment with ice microphysics are verysimilar to those in the warm-rain experiments. In our suite ofexperiments, the general downdraft activity, the flux of low-θe air into the inflow layer, and theθe depression underneaththe inner-core updrafts are all the most pronounced in theice experiment. The inner-coreθe depression that accompa-nies the initial rapid weakening is more than twice as highas that in the comparable experiments employing warm-rainmicrophysics (6–7 K as compared to 2–3 K). Axisymmetricspindown theory (Elliassen and Lystad, 1977; Montgomeryet al., 2001) further supports the hypothesis that the rapidinitial weakening is due to a substantial decrease of the con-vective mass flux associated with the significant depressionof the inflow layerθe by shear-induced downdrafts. In addi-tion, we have documented a close relationship between theevolution of the inflow layerθe values and two transient in-tensity maxima that occur at 22 h and 44 h after vertical windshear is imposed. The final re-intensification of the TC in thisexperiment, as in RMN10, is associated with a near-completereplenishment of the inflow layerθe values also.
Based on the evidence presented here, we conclude thatRMN10’s framework for the intensity modification of TCsin vertical wind shear is robust to the presented changes inthe setup of the numerical experiment. We advocate furtherstudy and tests of this framework with case studies and realatmospheric data.
Acknowledgements.John Molinari’s comments during the reviewprocess of RMN10 (available online through the ACPD web-site at http://www.atmos-chem-phys-discuss.net/9/10711/2009/acpd-9-10711-2009.html) were very helpful for the current study.The thoughtful comments by Roger Smith and an anonymousreviewer have helped to improve the presentation of our results.Most of this research was performed while the first author helda National Research Council Research Associateship Award atthe Naval Postgraduate School in Monterey, CA, USA. Thiswork was supported by NSF grant ATM-0715426, the ONR grantN0001411WX20095 and NOAA’s Hurricane Research Division.
Edited by: T. J. Dunkerton
References
Abarbanel, H. D. I., Holm, D. D., Marsden, J. E., and Ratiu, T.:Nonlinear stability of incompressible stratified flow, Philos. T.Roy. Soc. A, 318, 349–409, 1986.
Bell, M. M., Montgomery, M. T., and Emanuel, K. A.: Air–sea en-thalpy and momentum exchange at major hurricane wind speedsobserved during CBLAST, J. Atmos. Sci., 69, 3197–3222, 2012.
Bender, M. A.: The effect of relative flow on the asymmetric struc-ture in the interior of hurricanes, J. Atmos. Sci., 54, 703–724,1997.
Black, P. G., D’Asaro, E. A., Drennan, W. M., French, J. R.,Niiler, P. P., Sanford, T. B., Terrill, E. J., Walsh, E. J., andZhang, J. A.: Air-sea exchange in hurricanes: synthesis of ob-servations from the Coupled Boundary Layer Air-Sea Transferexperiment, B. Am. Meteorol. Soc., 88, 357–374, 2007.
Braun, S. A. and Tao, W. K.: Sensitivity of high-resolution sim-ulations of Hurricane Bob (1991) to planetary boundary layerparameterizations, Mon. Weather Rev., 128, 3941–3961, 2000.
Bui, H. H., Smith, R. K., Montgomery, M. T., and Peng, J.: Bal-anced and unbalanced aspects of tropical-cyclone intensifica-tion, Q. J. Roy. Meteor. Soc., 135, 715–1731, 2009.
Cotton, W. R., Pielke Sr., R. A., Walko, R. L., Liston, G. E.,Tremback, C. J., Jiang, H., McAnelly, R. L., Harrington, J. Y.,Nicholls, M. E., Carrio, G. G., and McFadden, J. P.: RAMS 2001:current status and future directions, Meteorol. Atmos. Phys., 82,5–29, 2003.
DeMaria, M.: The effect of vertical shear on tropical cyclone inten-sity change, J. Atmos. Sci., 53, 2076–2088, 1996.
Eliassen, A. and Lystad, M.: On the Ekman layer in a circular vor-tex: a numerical and theoretical study, Geophys. Norv., 31, 1–16,1977.
Emanuel, K. A.: Atmospheric convection, Oxford University Press,New York, USA, 172 pp., 1994.
Fovell, R. G., Corbosiero, K. L., and Kuo, H.-C.: Cloud micro-physics impact on hurricane track as revealed in idealized ex-periments, J. Atmos. Sci., 66, 1764–1778, 2009.
www.atmos-chem-phys.net/13/327/2013/ Atmos. Chem. Phys., 13, 327–346, 2013

346 M. Riemer et al.: Thermodynamic impact of vertical wind shear on the inflow layer
Frank, W. M. and Ritchie, E. A.: Effects of vertical wind shear onthe intensity and structure of numerically simulated hurricanes,Mon. Weather Rev., 129, 2249–2269, 2001.
Hill, G. E.: Factors controlling the size and spacing of cumulusclouds as revealed by numerical experiments, J. Atmos. Sci., 31,646–673, 1974.
Holton, J.: An introduction to dynamic meteorology, Academic-Press, London, 132 pp., 2004.
Jones, S. C.: The evolution of vortices in vertical shear. I: Initiallybarotropic vortices, Q. J. Roy. Meteor. Soc., 121, 821–851, 1995.
Kessler, E.: On the distribution and continuity of water substance inatmospheric circulations, Meteor. Mon., 32, 84 pp., 1969.
Lilly, D. K.: On the numerical simulation of buoyant convection,Tellus, 14, 148–172, 1962.
Lord, S. J., Willoughby, H. E., and Piotrowicz, J. M.: Role of a pa-rameterized ice-phase microphysics in an axisymmetric, nonhy-drostatic tropical cyclone model, J. Atmos. Sci., 41, 2836–2848,1984.
Meyers, M., Walko, R., Harrington, J., and Cotton, W.: New RAMScloud microphysics prameterization. Part II: The two-momentscheme., Atmos. Res., 45, 3–39, 1997.
Montgomery, M. T., Snell, H. D., and Yang, Z.: Axisymmetric spin-down dynamics of hurricane-like vortices, J. Atmos. Sci., 58,421–435, 2001.
Montgomery, M. T., Smith, R. K., and Nguyen, S. V.: Sensitivity oftropical cyclone models to the surface drag coefficient, Q. J. Roy.Meteor. Soc., 136, 1945–1953, 2010.
Pielke, R. A., Cotton, W. R., Walko, R. L., Tremback, C. J., Lyons,W. A., Grasso, L. D., Nicholls, M. E., Moran, M. D., Wesley, D.A., Lee, T. J., and Copeland, J. H.: A comprehensive meteoro-logical modeling system – RAMS, Meteorol. Atmos. Phys., 49,69–91, 1992.
Reasor, P. D., Montgomery, M. T., and Grasso, L. D.: A new lookat the problem of tropical cyclones in vertical shear flow: vortexresiliency, J. Atmos. Sci., 61, 3–22, 2004.
Riemer, M. and Montgomery, M. T.: Simple kinematic mod-els for the environmental interaction of tropical cyclones invertical wind shear, Atmos. Chem. Phys., 11, 9395–9414,doi:10.5194/acp-11-9395-2011, 2011.
Riemer, M., Montgomery, M. T., and Nicholls, M. E.: A newparadigm for intensity modification of tropical cyclones: ther-modynamic impact of vertical wind shear on the inflow layer,Atmos. Chem. Phys., 10, 3163–3188,doi:10.5194/acp-10-3163-2010, 2010.
Schecter, D. A. and Montgomery, M. T.: On the symmetrizationrate of an intense geophysical vortex, Dynam. Atmos. Oceans,37, 55–88, 2003.
Smagorinsky, J.: General circulation experiments with the primitiveequations, Mon. Weather Rev., 91, 99–164, 1963.
Smith, R. K. and Thomsen, G. L.: Dependence of tropical-cycloneintensification on the boundary-layer representation in a numeri-cal model, Q. J. Roy. Meteor. Soc., 136, 1671–1685, 2010.
Smith, R. K., Montgomery, M. T., and Thomsen, G.: Sensitivity oftropical cyclone models to the surface drag coefficient in differ-ent boundary-layer schemes, Q. J. Roy. Meteor. Soc., in review,2012.
Srivastava, R. C.: A model of intense downdrafts driven by the melt-ing and evaporation of precipitation, J. Atmos. Sci., 44, 1752–1774, 1987.
Tang, B. and Emanuel, K. A.: Midlevel ventilation’s constraint ontropical cyclone intensity, J. Atmos. Sci., 67, 1817–1830, 2010.
Tripoli, G. J. and Cotton, W. R.: The use of ice-liquid water potentialtemperature as a thermodynamic variable in deep atmosphericmodels, Mon. Weather Rev., 109, 1094–1102, 1981.
Verlinde, J., Flatau, P., and Cotton, W.: Analytical solutions tothe collection growth equation: comparison with approximatemethods and application to cloud microphysics parameterizationschemes, J. Atmos. Sci., 47, 2871–2880, 1990.
Walko, R., Cotton, W., Harrington, J., and Meyers, M.: New RAMScloud microphysics parameterization. Part I: The single-momentscheme, Atmos. Res., 38, 29–62, 1995.
Wang, J.: Does the vertical wind shear profile matter to trop-ical cyclone intensity change?, 30th Conf. on Hurricanesand Tropical Meteorology, Ponte Verde, FL, Amer. Me-teor. Soc.,https://ams.confex.com/ams/30Hurricane/flvgateway.cgi/id/20692?recordingid=20692, 2012.
Willoughby, H. E.: Forced secondary circulations in hurricanes, J.Geophys. Res., 84, 3173–3183, 1979.
Willoughby, H. E., Marks, F. D., and Feinberg, R. J.: Stationary andmoving convective bands in hurricanes, J. Atmos. Sci., 41, 3189–3211, 1984.
Wong, M. L. M. and Chan, J. C. L.: Tropical cyclone intensity invertical wind shear, J. Atmos. Sci., 61, 1859–1876, 2004.
Yuter, S. E. and Houze, R. A.: Three-dimensional kinematic andmicrophysical evolution of Florida cumulonimbus. Part II: Fre-quency distributions of vertical velocity, reflectivity, and differ-ential reflectivity, Mon. Weather Rev., 123, 1941–1963, 1995.
Zeng, Z., Wang, Y., and Chen, L.: A statistical analysis ofvertical shear effect on tropical cyclone intensity changein the North Atlantic, Geophys. Res. Lett., 37, L02802,doi:10.1029/2009GL041788, 2010.
Zhang, J. A., Black, P. G., French, J. R., and Drennan, W. M.: Firstdirect measurements of enthalpy flux in the hurricane boundarylayer: the CBLAST results, Geophys. Res. Lett., 35, L14813,doi:10.1029/2008GL034374, 2008.
Atmos. Chem. Phys., 13, 327–346, 2013 www.atmos-chem-phys.net/13/327/2013/


