Embed Size (px)
Citation preview
Relationship between orography and thewind-cloud systems of tropical cyclones
Fuyi TanHwee San LimKhiruddin Abdullah
Relationship between orography and the wind-cloudsystems of tropical cyclones
Fuyi TanHwee San LimKhiruddin AbdullahUniversiti Sains MalaysiaSchool of Physics11800 Penang, MalaysiaE-mail: [email protected]
Abstract. We investigate the effect of orography on the relationship ofwind-cloud systems with tropical cyclones (TC). The impact of orographyis important for the cloud distribution and wind flow patterns of TC activity.Furthermore, the influence of orography on TCs remains unclear and is anactive area of scientific research because of the complexity of orographyeffects caused by the presence of mountains. We focus on typhoons in theopen sea, near coastal regions, and in the mountains. The atmosphericcirculation of the level between the troposphere and the stratosphere(TS level) varies when disturbances, such as a high mountain range,occur in the surrounding edges or outflow of a typhoon. Orographic effectscan influence the types of clouds (e.g., nimbus and cirrus) that form in dif-ferent altitudes (high, middle, and low levels of the troposphere). Ourresults imply that the interaction between TCs and high-altitude topogra-phy (e.g., mountains) leads to changes in the features of TCs. © 2012 Societyof Photo-Optical Instrumentation Engineers (SPIE). [DOI: 10.1117/1.OE.51.10.101712]
Subject terms: tropical cyclone; mountains; wind; cloud; troposphere; FY-2D.
Paper 120174SS received Feb. 8, 2012; revisedmanuscript received Jun. 28, 2012;accepted for publication Jul. 27, 2012; published online Oct. 26, 2012.
1 IntroductionMost natural disasters are caused by variations in theweather. A tropical cyclone (TC) is a type of natural disastercommon in Southeast Asia (SEA). TCs are constant threatsto islands and coastal regions because they can cause strongwind damage and flooding due to heavy rains, especially inmountainous regions, in addition to high tides and strongwaves that sweep the shores. The Philippines is the most fre-quently hit country by TCs among SEA countries, followedby Vietnam, and occasionally Thailand, Laos, and Cambodiawhen TCs form in the Northwest Pacific (NWP) Ocean or inthe South China Sea (refer to U.S. Naval Maritime ForecastCenter/Joint Typhoon Warning Center Pearl Harbor reportsfrom 1959 to 2009). Valuable TC information can beobtained using a number of methods, such as satellite, radar,dropwindsondes or radiosondes, instrumental aircrafts, andnumerical models in various spatial resolutions. To investi-gate how cloud and wind characteristics vary when typhoonspass through mountainous regions, we used data obtainedfrom a geostationary satellite, which can take imagesevery 15 min at a fixed region. Using the satellite, wewere able to investigate cloud and wind changes causedby orographic effects within specific regions.
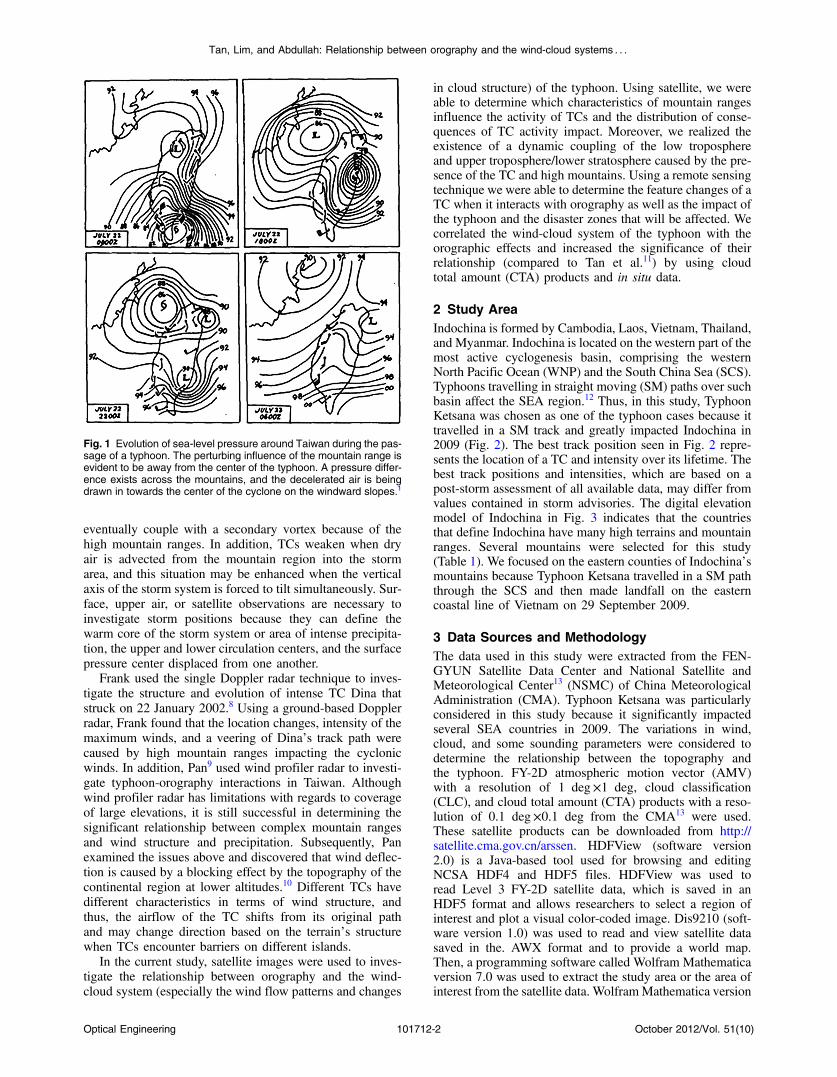
Li1 discussed several typhoon cases and stated that sur-face pressure varied with the mountain range when a typhoonpassed through (Fig. 1). At 0900 UTC on 22 July 1962,Typhoon Kate was located at the southern tip of Taiwan,while the northern part experienced easterly winds, andthe pressure differed across different regions of the moun-tains. Afterwards, Typhoon Kate moved northwards andshifted to the northwest region of Taiwan at 2200 UTCon 22 July. At 0600 UTC on 23 July, the entire island wasexposed to westerly winds. A distinct pressure difference
was found at both times. Li believed that the orographicallyinduced high pressure and decreased Coriolis force sloweddown the westerly wind on the island, allowing the wind toaccelerate in or towards the center of the lower part of themountain. Aside from the study of Li1 in Taiwan, manyother examples of orographic pressure disturbances occurredin daily sea-level charts that are constructed and archived byvarious national weather services. Several significant studiesin specific regions that are constant with orographic distur-bances to the pressure, especially at Mt. Pico Duarte(3087 m), Hispaniola; Mt. Maromokotro (2876 m), Mada-gascar; Mt. Galdhøpiggen (2469 m), Scandinavia; theSnowy Mountains of Australia (2228 m); Mt. Pico Turquino(2005 m), Cuba; and Mt. Cerro de Punta (1328 m), PuertoRico, have been conducted.
Furthermore, Taiwan extended its studies on topographicor orographic effects to TC cases, in which a close relation-ship between mountainous terrains and TC activities in termsof pressure, wind, track path, and precipitation was observed.For example, previous studies showed significant changes inintensity, structure, and track when typhoons are close to anisland or continental region.2–7 The terrain-typhoon interac-tion deflected and sometimes discontinued the track of thetyphoon, and the magnitude of the wind decreased whenthe typhoon approached any related mountain range becauseof the friction effect and restriction of wind movement. Thecomplexity of mountain ranges may also affect landfall loca-tion. Bender et al.5 investigated the relationship of topogra-phy and typhoon features in certain regions, such as Taiwan,the northern Philippine island of Luzon, and a few regions inthe Caribbean, including the islands of Cuba, Hispaniola,and Puerto Rico. Their observations show that storm fea-tures, such as track, deviation, and decay, are affected bymountainous areas. After making landfall, surface pressurecan decrease rapidly, and an upper level vortex might detachfrom the original low surface pressure of the storm and0091-3286/2012/$25.00 © 2012 SPIE
Optical Engineering 101712-1 October 2012/Vol. 51(10)
Optical Engineering 51(10), 101712 (October 2012)
eventually couple with a secondary vortex because of thehigh mountain ranges. In addition, TCs weaken when dryair is advected from the mountain region into the stormarea, and this situation may be enhanced when the verticalaxis of the storm system is forced to tilt simultaneously. Sur-face, upper air, or satellite observations are necessary toinvestigate storm positions because they can define thewarm core of the storm system or area of intense precipita-tion, the upper and lower circulation centers, and the surfacepressure center displaced from one another.
Frank used the single Doppler radar technique to inves-tigate the structure and evolution of intense TC Dina thatstruck on 22 January 2002.8 Using a ground-based Dopplerradar, Frank found that the location changes, intensity of themaximum winds, and a veering of Dina’s track path werecaused by high mountain ranges impacting the cyclonicwinds. In addition, Pan9 used wind profiler radar to investi-gate typhoon-orography interactions in Taiwan. Althoughwind profiler radar has limitations with regards to coverageof large elevations, it is still successful in determining thesignificant relationship between complex mountain rangesand wind structure and precipitation. Subsequently, Panexamined the issues above and discovered that wind deflec-tion is caused by a blocking effect by the topography of thecontinental region at lower altitudes.10 Different TCs havedifferent characteristics in terms of wind structure, andthus, the airflow of the TC shifts from its original pathand may change direction based on the terrain’s structurewhen TCs encounter barriers on different islands.
In the current study, satellite images were used to inves-tigate the relationship between orography and the wind-cloud system (especially the wind flow patterns and changes
in cloud structure) of the typhoon. Using satellite, we wereable to determine which characteristics of mountain rangesinfluence the activity of TCs and the distribution of conse-quences of TC activity impact. Moreover, we realized theexistence of a dynamic coupling of the low troposphereand upper troposphere/lower stratosphere caused by the pre-sence of the TC and high mountains. Using a remote sensingtechnique we were able to determine the feature changes of aTC when it interacts with orography as well as the impact ofthe typhoon and the disaster zones that will be affected. Wecorrelated the wind-cloud system of the typhoon with theorographic effects and increased the significance of theirrelationship (compared to Tan et al.11) by using cloudtotal amount (CTA) products and in situ data.
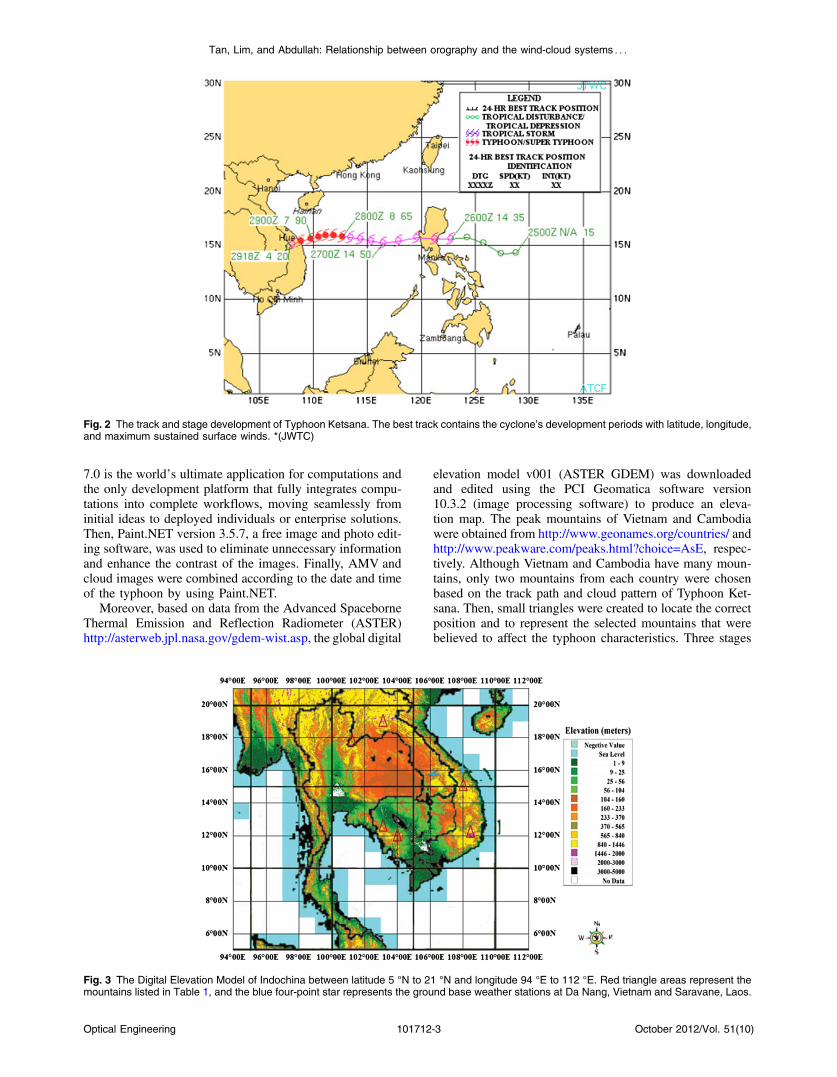
2 Study AreaIndochina is formed by Cambodia, Laos, Vietnam, Thailand,and Myanmar. Indochina is located on the western part of themost active cyclogenesis basin, comprising the westernNorth Pacific Ocean (WNP) and the South China Sea (SCS).Typhoons travelling in straight moving (SM) paths over suchbasin affect the SEA region.12 Thus, in this study, TyphoonKetsana was chosen as one of the typhoon cases because ittravelled in a SM track and greatly impacted Indochina in2009 (Fig. 2). The best track position seen in Fig. 2 repre-sents the location of a TC and intensity over its lifetime. Thebest track positions and intensities, which are based on apost-storm assessment of all available data, may differ fromvalues contained in storm advisories. The digital elevationmodel of Indochina in Fig. 3 indicates that the countriesthat define Indochina have many high terrains and mountainranges. Several mountains were selected for this study(Table 1). We focused on the eastern counties of Indochina’smountains because Typhoon Ketsana travelled in a SM paththrough the SCS and then made landfall on the easterncoastal line of Vietnam on 29 September 2009.
3 Data Sources and MethodologyThe data used in this study were extracted from the FEN-GYUN Satellite Data Center and National Satellite andMeteorological Center13 (NSMC) of China MeteorologicalAdministration (CMA). Typhoon Ketsana was particularlyconsidered in this study because it significantly impactedseveral SEA countries in 2009. The variations in wind,cloud, and some sounding parameters were considered todetermine the relationship between the topography andthe typhoon. FY-2D atmospheric motion vector (AMV)with a resolution of 1 deg×1 deg, cloud classification(CLC), and cloud total amount (CTA) products with a reso-lution of 0.1 deg×0.1 deg from the CMA13 were used.These satellite products can be downloaded from http://satellite.cma.gov.cn/arssen. HDFView (software version2.0) is a Java-based tool used for browsing and editingNCSA HDF4 and HDF5 files. HDFView was used toread Level 3 FY-2D satellite data, which is saved in anHDF5 format and allows researchers to select a region ofinterest and plot a visual color-coded image. Dis9210 (soft-ware version 1.0) was used to read and view satellite datasaved in the. AWX format and to provide a world map.Then, a programming software called Wolfram Mathematicaversion 7.0 was used to extract the study area or the area ofinterest from the satellite data. WolframMathematica version
Fig. 1 Evolution of sea-level pressure around Taiwan during the pas-sage of a typhoon. The perturbing influence of the mountain range isevident to be away from the center of the typhoon. A pressure differ-ence exists across the mountains, and the decelerated air is beingdrawn in towards the center of the cyclone on the windward slopes.1
Optical Engineering 101712-2 October 2012/Vol. 51(10)
Tan, Lim, and Abdullah: Relationship between orography and the wind-cloud systems : : :
7.0 is the world’s ultimate application for computations andthe only development platform that fully integrates compu-tations into complete workflows, moving seamlessly frominitial ideas to deployed individuals or enterprise solutions.Then, Paint.NET version 3.5.7, a free image and photo edit-ing software, was used to eliminate unnecessary informationand enhance the contrast of the images. Finally, AMV andcloud images were combined according to the date and timeof the typhoon by using Paint.NET.
Moreover, based on data from the Advanced SpaceborneThermal Emission and Reflection Radiometer (ASTER)http://asterweb.jpl.nasa.gov/gdem-wist.asp, the global digital
elevation model v001 (ASTER GDEM) was downloadedand edited using the PCI Geomatica software version10.3.2 (image processing software) to produce an eleva-tion map. The peak mountains of Vietnam and Cambodiawere obtained from http://www.geonames.org/countries/ andhttp://www.peakware.com/peaks.html?choice=AsE, respec-tively. Although Vietnam and Cambodia have many moun-tains, only two mountains from each country were chosenbased on the track path and cloud pattern of Typhoon Ket-sana. Then, small triangles were created to locate the correctposition and to represent the selected mountains that werebelieved to affect the typhoon characteristics. Three stages
Fig. 2 The track and stage development of Typhoon Ketsana. The best track contains the cyclone’s development periods with latitude, longitude,and maximum sustained surface winds. *(JWTC)
Fig. 3 The Digital Elevation Model of Indochina between latitude 5 °N to 21 °N and longitude 94 °E to 112 °E. Red triangle areas represent themountains listed in Table 1, and the blue four-point star represents the ground base weather stations at Da Nang, Vietnam and Saravane, Laos.
Optical Engineering 101712-3 October 2012/Vol. 51(10)
Tan, Lim, and Abdullah: Relationship between orography and the wind-cloud systems : : :
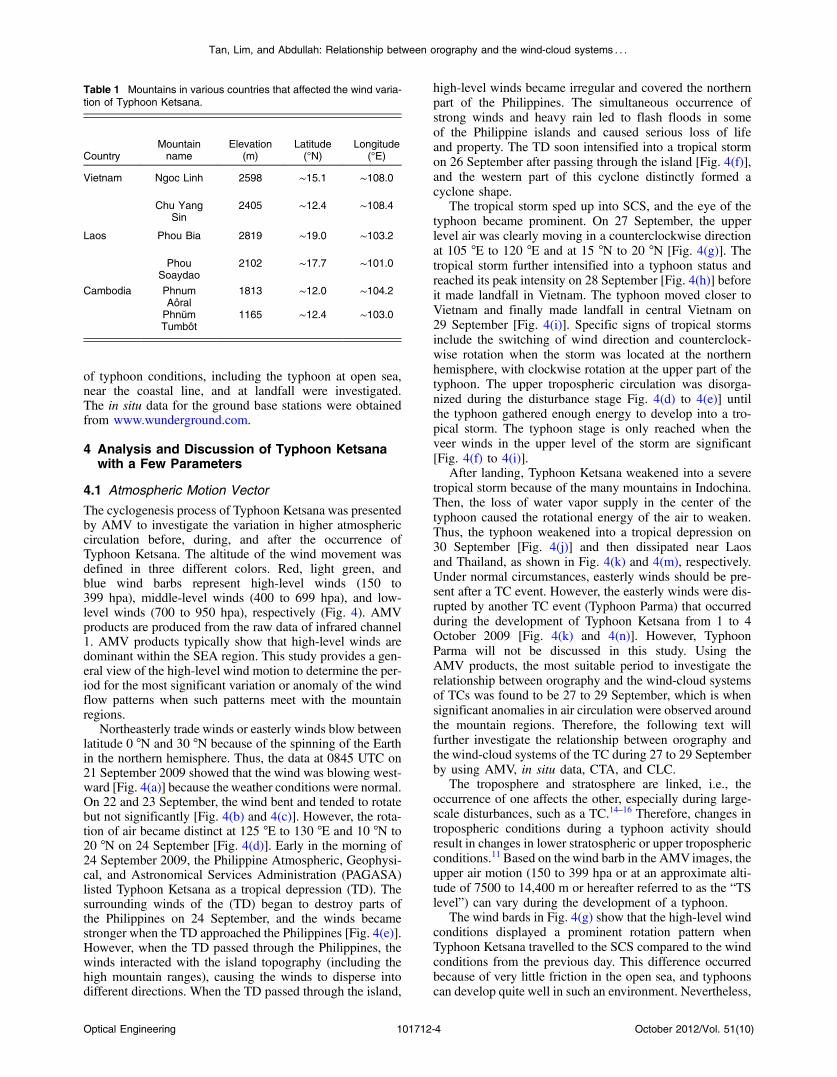
of typhoon conditions, including the typhoon at open sea,near the coastal line, and at landfall were investigated.The in situ data for the ground base stations were obtainedfrom www.wunderground.com.
4 Analysis and Discussion of Typhoon Ketsanawith a Few Parameters
4.1 Atmospheric Motion Vector
The cyclogenesis process of Typhoon Ketsana was presentedby AMV to investigate the variation in higher atmosphericcirculation before, during, and after the occurrence ofTyphoon Ketsana. The altitude of the wind movement wasdefined in three different colors. Red, light green, andblue wind barbs represent high-level winds (150 to399 hpa), middle-level winds (400 to 699 hpa), and low-level winds (700 to 950 hpa), respectively (Fig. 4). AMVproducts are produced from the raw data of infrared channel1. AMV products typically show that high-level winds aredominant within the SEA region. This study provides a gen-eral view of the high-level wind motion to determine the per-iod for the most significant variation or anomaly of the windflow patterns when such patterns meet with the mountainregions.
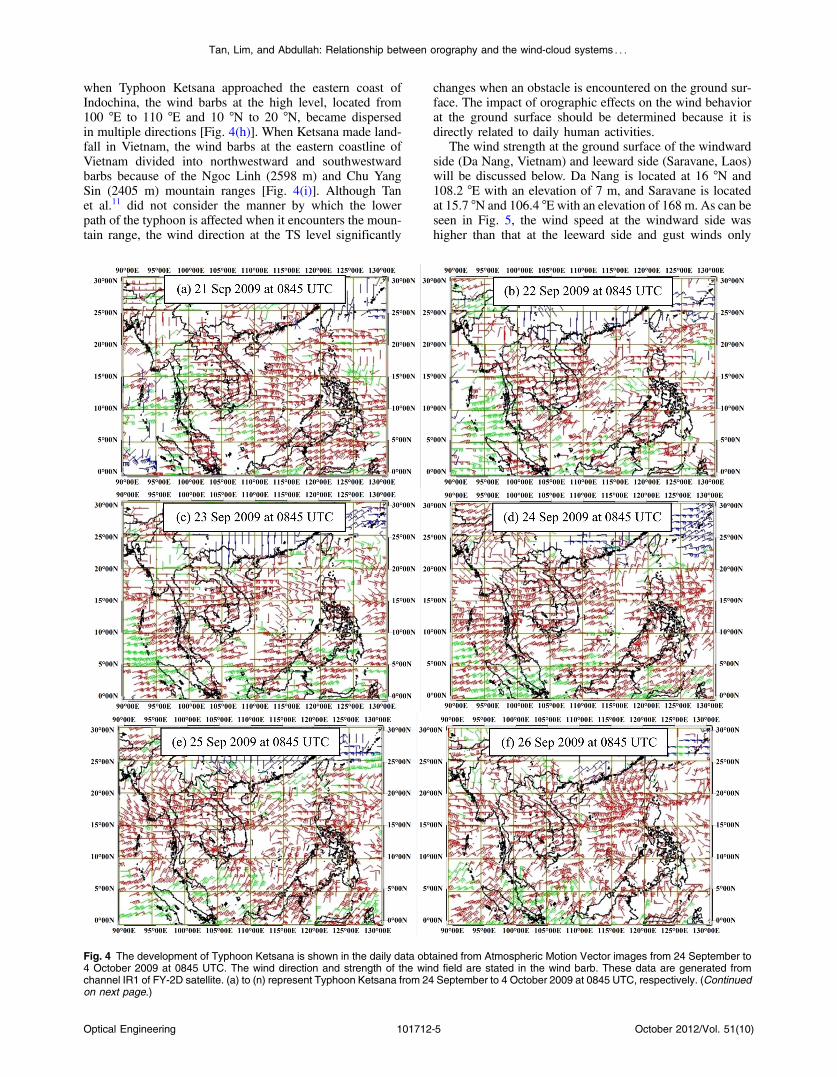
Northeasterly trade winds or easterly winds blow betweenlatitude 0 °N and 30 °N because of the spinning of the Earthin the northern hemisphere. Thus, the data at 0845 UTC on21 September 2009 showed that the wind was blowing west-ward [Fig. 4(a)] because the weather conditions were normal.On 22 and 23 September, the wind bent and tended to rotatebut not significantly [Fig. 4(b) and 4(c)]. However, the rota-tion of air became distinct at 125 °E to 130 °E and 10 °N to20 °N on 24 September [Fig. 4(d)]. Early in the morning of24 September 2009, the Philippine Atmospheric, Geophysi-cal, and Astronomical Services Administration (PAGASA)listed Typhoon Ketsana as a tropical depression (TD). Thesurrounding winds of the (TD) began to destroy parts ofthe Philippines on 24 September, and the winds becamestronger when the TD approached the Philippines [Fig. 4(e)].However, when the TD passed through the Philippines, thewinds interacted with the island topography (including thehigh mountain ranges), causing the winds to disperse intodifferent directions. When the TD passed through the island,
high-level winds became irregular and covered the northernpart of the Philippines. The simultaneous occurrence ofstrong winds and heavy rain led to flash floods in someof the Philippine islands and caused serious loss of lifeand property. The TD soon intensified into a tropical stormon 26 September after passing through the island [Fig. 4(f)],and the western part of this cyclone distinctly formed acyclone shape.
The tropical storm sped up into SCS, and the eye of thetyphoon became prominent. On 27 September, the upperlevel air was clearly moving in a counterclockwise directionat 105 °E to 120 °E and at 15 °N to 20 °N [Fig. 4(g)]. Thetropical storm further intensified into a typhoon status andreached its peak intensity on 28 September [Fig. 4(h)] beforeit made landfall in Vietnam. The typhoon moved closer toVietnam and finally made landfall in central Vietnam on29 September [Fig. 4(i)]. Specific signs of tropical stormsinclude the switching of wind direction and counterclock-wise rotation when the storm was located at the northernhemisphere, with clockwise rotation at the upper part of thetyphoon. The upper tropospheric circulation was disorga-nized during the disturbance stage Fig. 4(d) to 4(e)] untilthe typhoon gathered enough energy to develop into a tro-pical storm. The typhoon stage is only reached when theveer winds in the upper level of the storm are significant[Fig. 4(f) to 4(i)].
After landing, Typhoon Ketsana weakened into a severetropical storm because of the many mountains in Indochina.Then, the loss of water vapor supply in the center of thetyphoon caused the rotational energy of the air to weaken.Thus, the typhoon weakened into a tropical depression on30 September [Fig. 4(j)] and then dissipated near Laosand Thailand, as shown in Fig. 4(k) and 4(m), respectively.Under normal circumstances, easterly winds should be pre-sent after a TC event. However, the easterly winds were dis-rupted by another TC event (Typhoon Parma) that occurredduring the development of Typhoon Ketsana from 1 to 4October 2009 [Fig. 4(k) and 4(n)]. However, TyphoonParma will not be discussed in this study. Using theAMV products, the most suitable period to investigate therelationship between orography and the wind-cloud systemsof TCs was found to be 27 to 29 September, which is whensignificant anomalies in air circulation were observed aroundthe mountain regions. Therefore, the following text willfurther investigate the relationship between orography andthe wind-cloud systems of the TC during 27 to 29 Septemberby using AMV, in situ data, CTA, and CLC.
The troposphere and stratosphere are linked, i.e., theoccurrence of one affects the other, especially during large-scale disturbances, such as a TC.14–16 Therefore, changes intropospheric conditions during a typhoon activity shouldresult in changes in lower stratospheric or upper troposphericconditions.11 Based on the wind barb in the AMV images, theupper air motion (150 to 399 hpa or at an approximate alti-tude of 7500 to 14,400 m or hereafter referred to as the “TSlevel”) can vary during the development of a typhoon.
The wind bards in Fig. 4(g) show that the high-level windconditions displayed a prominent rotation pattern whenTyphoon Ketsana travelled to the SCS compared to the windconditions from the previous day. This difference occurredbecause of very little friction in the open sea, and typhoonscan develop quite well in such an environment. Nevertheless,
Table 1 Mountains in various countries that affected the wind varia-tion of Typhoon Ketsana.
CountryMountainname
Elevation(m)
Latitude(°N)
Longitude(°E)
Vietnam Ngoc Linh 2598 ∼15.1 ∼108.0
Chu YangSin
2405 ∼12.4 ∼108.4
Laos Phou Bia 2819 ∼19.0 ∼103.2
PhouSoaydao
2102 ∼17.7 ∼101.0
Cambodia PhnumAôral
1813 ∼12.0 ∼104.2
PhnŭmTumbôt
1165 ∼12.4 ∼103.0
Optical Engineering 101712-4 October 2012/Vol. 51(10)
Tan, Lim, and Abdullah: Relationship between orography and the wind-cloud systems : : :
when Typhoon Ketsana approached the eastern coast ofIndochina, the wind barbs at the high level, located from100 °E to 110 °E and 10 °N to 20 °N, became dispersedin multiple directions [Fig. 4(h)]. When Ketsana made land-fall in Vietnam, the wind barbs at the eastern coastline ofVietnam divided into northwestward and southwestwardbarbs because of the Ngoc Linh (2598 m) and Chu YangSin (2405 m) mountain ranges [Fig. 4(i)]. Although Tanet al.11 did not consider the manner by which the lowerpath of the typhoon is affected when it encounters the moun-tain range, the wind direction at the TS level significantly
changes when an obstacle is encountered on the ground sur-face. The impact of orographic effects on the wind behaviorat the ground surface should be determined because it isdirectly related to daily human activities.
The wind strength at the ground surface of the windwardside (Da Nang, Vietnam) and leeward side (Saravane, Laos)will be discussed below. Da Nang is located at 16 °N and108.2 °E with an elevation of 7 m, and Saravane is locatedat 15.7 °N and 106.4 °E with an elevation of 168 m. As can beseen in Fig. 5, the wind speed at the windward side washigher than that at the leeward side and gust winds only
Fig. 4 The development of Typhoon Ketsana is shown in the daily data obtained from Atmospheric Motion Vector images from 24 September to4 October 2009 at 0845 UTC. The wind direction and strength of the wind field are stated in the wind barb. These data are generated fromchannel IR1 of FY-2D satellite. (a) to (n) represent Typhoon Ketsana from 24 September to 4 October 2009 at 0845 UTC, respectively. (Continuedon next page.)
Optical Engineering 101712-5 October 2012/Vol. 51(10)
Tan, Lim, and Abdullah: Relationship between orography and the wind-cloud systems : : :
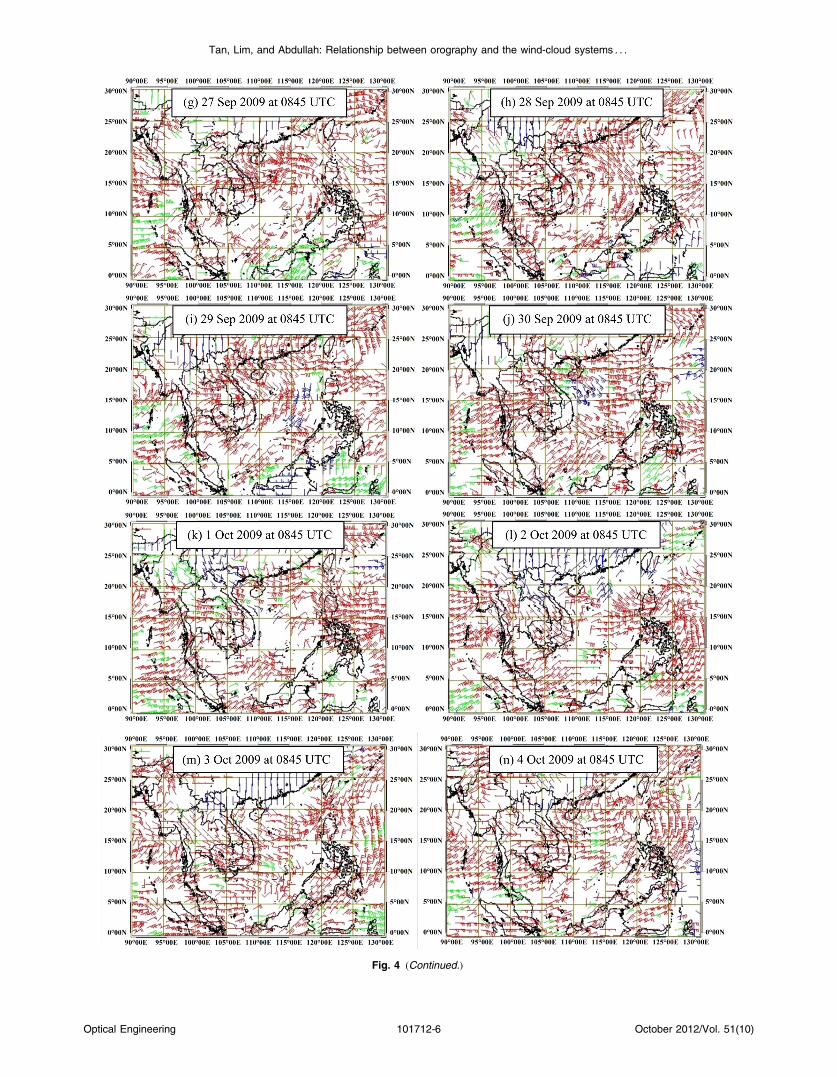
Fig. 4 (Continued.)
Optical Engineering 101712-6 October 2012/Vol. 51(10)
Tan, Lim, and Abdullah: Relationship between orography and the wind-cloud systems : : :
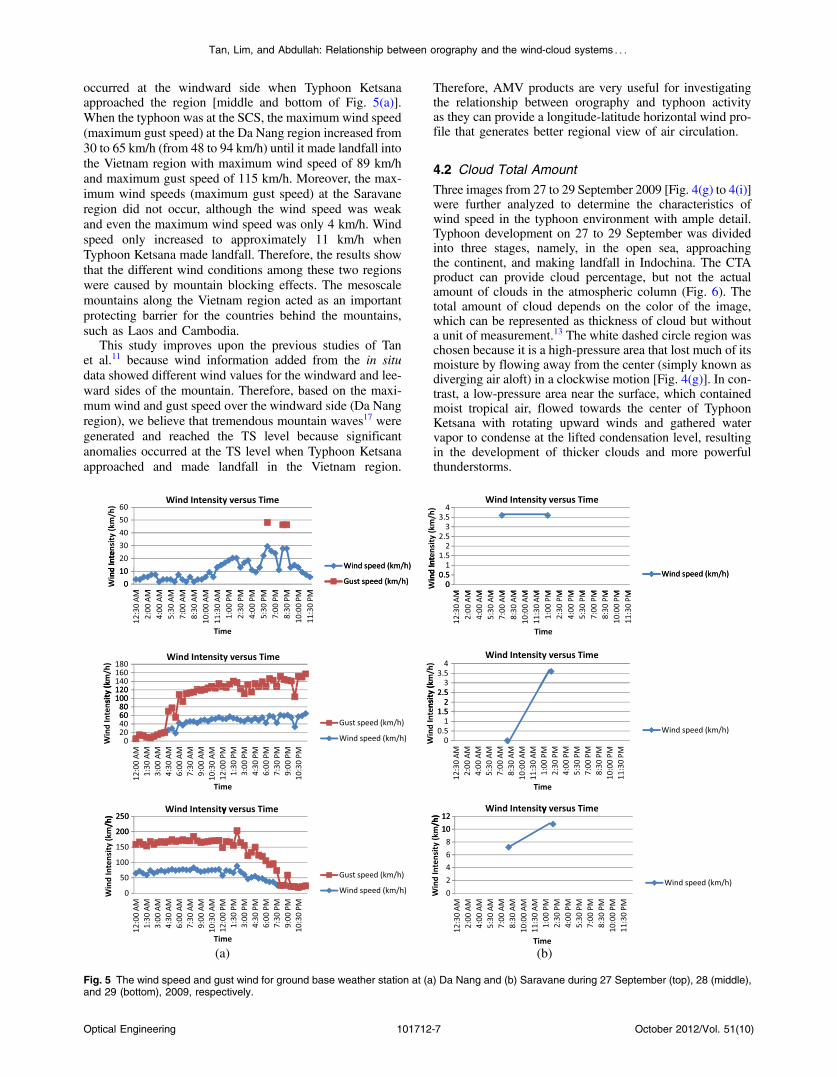
occurred at the windward side when Typhoon Ketsanaapproached the region [middle and bottom of Fig. 5(a)].When the typhoon was at the SCS, the maximum wind speed(maximum gust speed) at the Da Nang region increased from30 to 65 km/h (from 48 to 94 km/h) until it made landfall intothe Vietnam region with maximum wind speed of 89 km/hand maximum gust speed of 115 km/h. Moreover, the max-imum wind speeds (maximum gust speed) at the Saravaneregion did not occur, although the wind speed was weakand even the maximum wind speed was only 4 km/h. Windspeed only increased to approximately 11 km/h whenTyphoon Ketsana made landfall. Therefore, the results showthat the different wind conditions among these two regionswere caused by mountain blocking effects. The mesoscalemountains along the Vietnam region acted as an importantprotecting barrier for the countries behind the mountains,such as Laos and Cambodia.
This study improves upon the previous studies of Tanet al.11 because wind information added from the in situdata showed different wind values for the windward and lee-ward sides of the mountain. Therefore, based on the maxi-mum wind and gust speed over the windward side (Da Nangregion), we believe that tremendous mountain waves17 weregenerated and reached the TS level because significantanomalies occurred at the TS level when Typhoon Ketsanaapproached and made landfall in the Vietnam region.
Therefore, AMV products are very useful for investigatingthe relationship between orography and typhoon activityas they can provide a longitude-latitude horizontal wind pro-file that generates better regional view of air circulation.
4.2 Cloud Total Amount
Three images from 27 to 29 September 2009 [Fig. 4(g) to 4(i)]were further analyzed to determine the characteristics ofwind speed in the typhoon environment with ample detail.Typhoon development on 27 to 29 September was dividedinto three stages, namely, in the open sea, approachingthe continent, and making landfall in Indochina. The CTAproduct can provide cloud percentage, but not the actualamount of clouds in the atmospheric column (Fig. 6). Thetotal amount of cloud depends on the color of the image,which can be represented as thickness of cloud but withouta unit of measurement.13 The white dashed circle region waschosen because it is a high-pressure area that lost much of itsmoisture by flowing away from the center (simply known asdiverging air aloft) in a clockwise motion [Fig. 4(g)]. In con-trast, a low-pressure area near the surface, which containedmoist tropical air, flowed towards the center of TyphoonKetsana with rotating upward winds and gathered watervapor to condense at the lifted condensation level, resultingin the development of thicker clouds and more powerfulthunderstorms.
(a) (b)
Fig. 5 The wind speed and gust wind for ground base weather station at (a) Da Nang and (b) Saravane during 27 September (top), 28 (middle),and 29 (bottom), 2009, respectively.
Optical Engineering 101712-7 October 2012/Vol. 51(10)
Tan, Lim, and Abdullah: Relationship between orography and the wind-cloud systems : : :
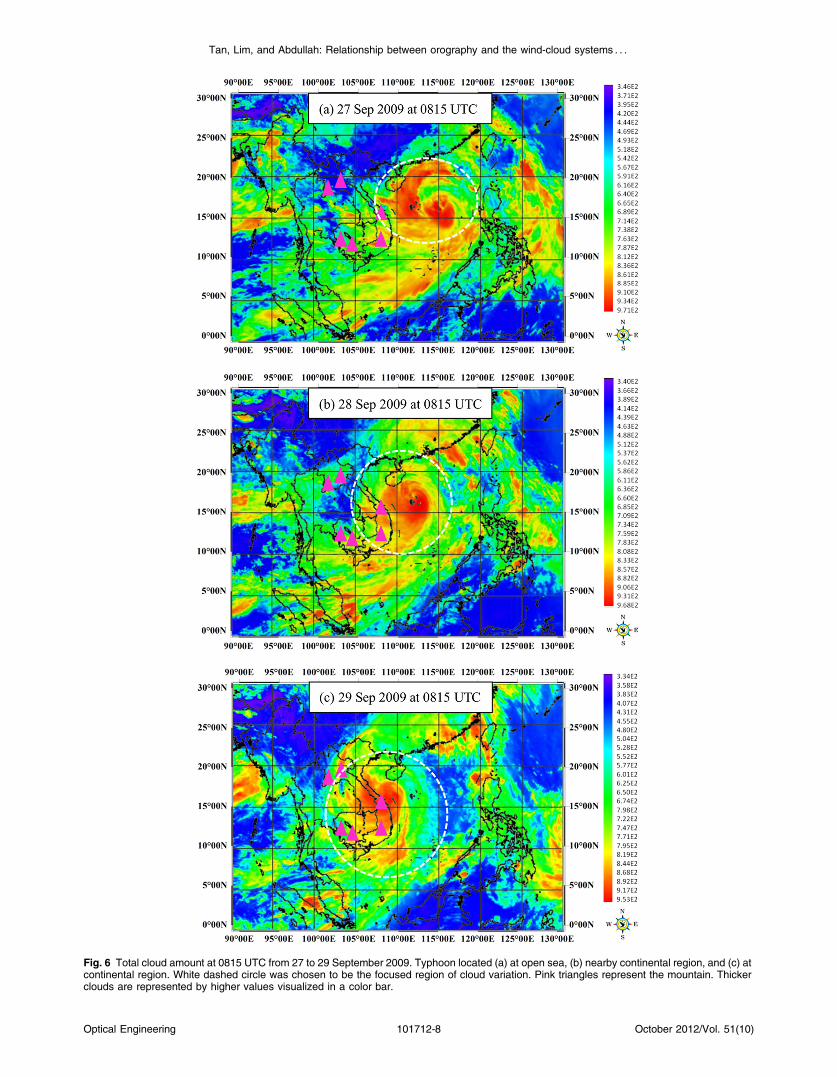
Fig. 6 Total cloud amount at 0815 UTC from 27 to 29 September 2009. Typhoon located (a) at open sea, (b) nearby continental region, and (c) atcontinental region. White dashed circle was chosen to be the focused region of cloud variation. Pink triangles represent the mountain. Thickerclouds are represented by higher values visualized in a color bar.
Optical Engineering 101712-8 October 2012/Vol. 51(10)
Tan, Lim, and Abdullah: Relationship between orography and the wind-cloud systems : : :
When Typhoon Ketsana travelled through the SCS on27 September 2009 [Fig. 6(a)], the clouds nearly coveredthe entire central part of the SCS, which is located betweenVietnam and the Philippines. The size of the cloud coverindicated that the cloud formation rate was high over theopen sea when Typhoon Ketsana over the open sea hadenough water vapor to simulate the development of thetyphoon. In addition, approximately 85% to 95% of CTAwithin the white circle region accumulated at the left sideof Typhoon Ketsana. Moreover, wind aloft also showedhigh-speed winds flowing away from the center where thecirculation of the wind led to cloud distribution patterns.Without complicated high terrain or rough sea surfaceover the open sea, the cloud distribution patterns tendedto rotate with the storm motion. When Typhoon Ketsananeared the eastern coast of Vietnam, parts of the typhoonwind were disturbed by the land surface and the mountainsof Ngoc Linh and Chu Yang Sin [Fig. 6(b)], which trappedparts of the clouds. We found the clouds over Ngoc Linh andChu Yang Sin to be deformed, and wind aloft also dispersedfrom its original path because of the obstacles of complexmountain structures.
At that moment (0815 UTC on 28 September), the highpercentage of CTA accumulated over the high mountainregion at Vietnam, and the CTA shrunk and condensed toapproximately 99% of the CTA around the mesoscale moun-tain along central Vietnam. Moreover, CTA increased fromapproximately 45% to 90% around the Ngoc Linh mountainbecause the mountain blocked the effects of the CTA. Inaddition, the pressure in Da Nang region decreased from1006 to 999 hPa between 27 and 28 September 2009(Fig. 7). The decrease in pressure in the Da Nang region indi-cated that the low pressure area deepened at that region andled to the formation of the cloud with high evaporation rate.However, the gradual decrease in pressure in the Saravaneregion was not greatly affected at that moment because themountain’s blocking effect interrupted the typhoon system.
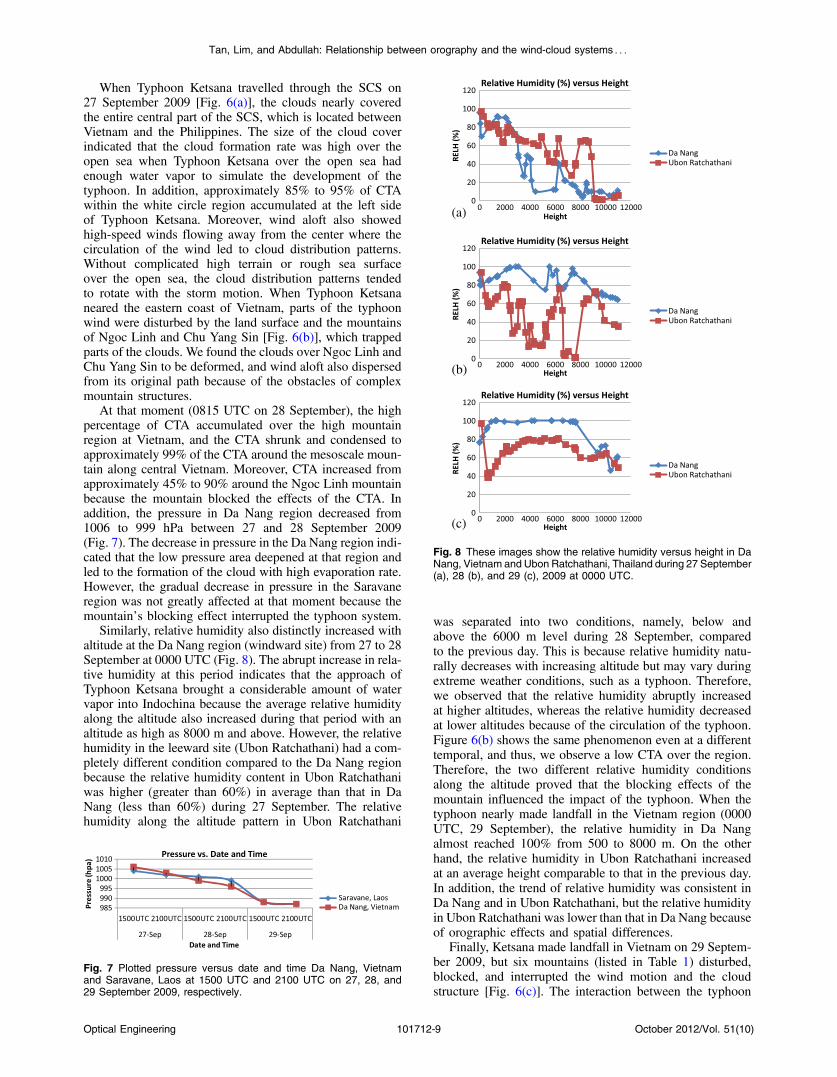
Similarly, relative humidity also distinctly increased withaltitude at the Da Nang region (windward site) from 27 to 28September at 0000 UTC (Fig. 8). The abrupt increase in rela-tive humidity at this period indicates that the approach ofTyphoon Ketsana brought a considerable amount of watervapor into Indochina because the average relative humidityalong the altitude also increased during that period with analtitude as high as 8000 m and above. However, the relativehumidity in the leeward site (Ubon Ratchathani) had a com-pletely different condition compared to the Da Nang regionbecause the relative humidity content in Ubon Ratchathaniwas higher (greater than 60%) in average than that in DaNang (less than 60%) during 27 September. The relativehumidity along the altitude pattern in Ubon Ratchathani
was separated into two conditions, namely, below andabove the 6000 m level during 28 September, comparedto the previous day. This is because relative humidity natu-rally decreases with increasing altitude but may vary duringextreme weather conditions, such as a typhoon. Therefore,we observed that the relative humidity abruptly increasedat higher altitudes, whereas the relative humidity decreasedat lower altitudes because of the circulation of the typhoon.Figure 6(b) shows the same phenomenon even at a differenttemporal, and thus, we observe a low CTA over the region.Therefore, the two different relative humidity conditionsalong the altitude proved that the blocking effects of themountain influenced the impact of the typhoon. When thetyphoon nearly made landfall in the Vietnam region (0000UTC, 29 September), the relative humidity in Da Nangalmost reached 100% from 500 to 8000 m. On the otherhand, the relative humidity in Ubon Ratchathani increasedat an average height comparable to that in the previous day.In addition, the trend of relative humidity was consistent inDa Nang and in Ubon Ratchathani, but the relative humidityin Ubon Ratchathani was lower than that in Da Nang becauseof orographic effects and spatial differences.
Finally, Ketsana made landfall in Vietnam on 29 Septem-ber 2009, but six mountains (listed in Table 1) disturbed,blocked, and interrupted the wind motion and the cloudstructure [Fig. 6(c)]. The interaction between the typhoon
Fig. 7 Plotted pressure versus date and time Da Nang, Vietnamand Saravane, Laos at 1500 UTC and 2100 UTC on 27, 28, and29 September 2009, respectively.
(a)
(b)
(c)
Fig. 8 These images show the relative humidity versus height in DaNang, Vietnam and Ubon Ratchathani, Thailand during 27 September(a), 28 (b), and 29 (c), 2009 at 0000 UTC.
Optical Engineering 101712-9 October 2012/Vol. 51(10)
Tan, Lim, and Abdullah: Relationship between orography and the wind-cloud systems : : :
and the terrain of Indochina reduced the strength of the windand the intensity of the typhoon. The wind barbs on the east-ern coastline of Vietnam were divided into northwestwardand southwestward barbs because of the Ngoc Linh andChu Yang Sin mountain ranges. In addition, high-level windbarbs accumulated in the regions of the terrain with high ele-vation [compare Figs. 6(c) and 4(i) with 3]. Through thecomparison, we were able to establish the relationshipbetween the wind and the clouds. When Typhoon Ketsanamade landfall in Vietnam, the cloud obviously accumulatedaround the mesoscale mountain, and the CTA reached 90%and above around the Ngoc Linh mountain regions. Further-more, the cloud was trapped and tended to accumulate at thehigh-terrain region (the CTA increased from approximately50% to 85% on 28 and 29 September) because the Chu YangSin mountain blocked the cloud and delayed the cloud fromtravelling through the other side of the mountain, therebyallowing the clouds more time to accumulate to largerclouds. The pressure in the Da Nang region abruptlydecreased from 999 hPa to 987 hPa at this moment becauseof the landfall of Typhoon Ketsana (Fig. 7). The further dee-pening of the low pressure area in the region caused deepconvection and increased the cloud formation and develop-ment rate. Moreover, the pressure abruptly decreased overthe Saravane region because the typhoon was nearby andcaused deep convection over the region and led to clouddevelopment. Therefore, the increase in the CTA value atthe leeward side of the Vietnam mountain was proven.
Another interesting phenomenon that indicated that thecloud accumulated more in the higher terrain region (outsideregion of the red triangle in Fig. 6) than in the interior lowland region occurred. Therefore, the region in 102 °E to 106 °E and 14 °N to 17 °N in Indochina is unlikely to have cloudformation, and the least cloud will be trapped within thisregion (CTA is always less than 50%), except for thelandfall of TC [refer to 100 °E to 110 °E and 10 °N to20 °N in Fig. 6(a) to 6(c)]. As can be seen in Fig. 6, thecloud deformed and slowed down when the typhoonapproached and made landfall at the continental region ofIndochina. Obstacles at the ground surface caused the cloudstructure to change at the high level or upper portion of thestorm, indicating that the typhoon’s behavior affected the TSlevel in terms of changes in the wind and clouds when obsta-cles exist at the ground surface. Relative humidity is wellknown as one of the factors of cloud formation.18 Thereforebased on the relative humidity value, we can analyse andinterpret more confidently in the CTA results, evenFigs. 6 and 8 discussion was not in the same time, butthe tendency of the relative humidity distribution patternmatches the CTA result in Fig. 6.
4.3 Cloud Classification
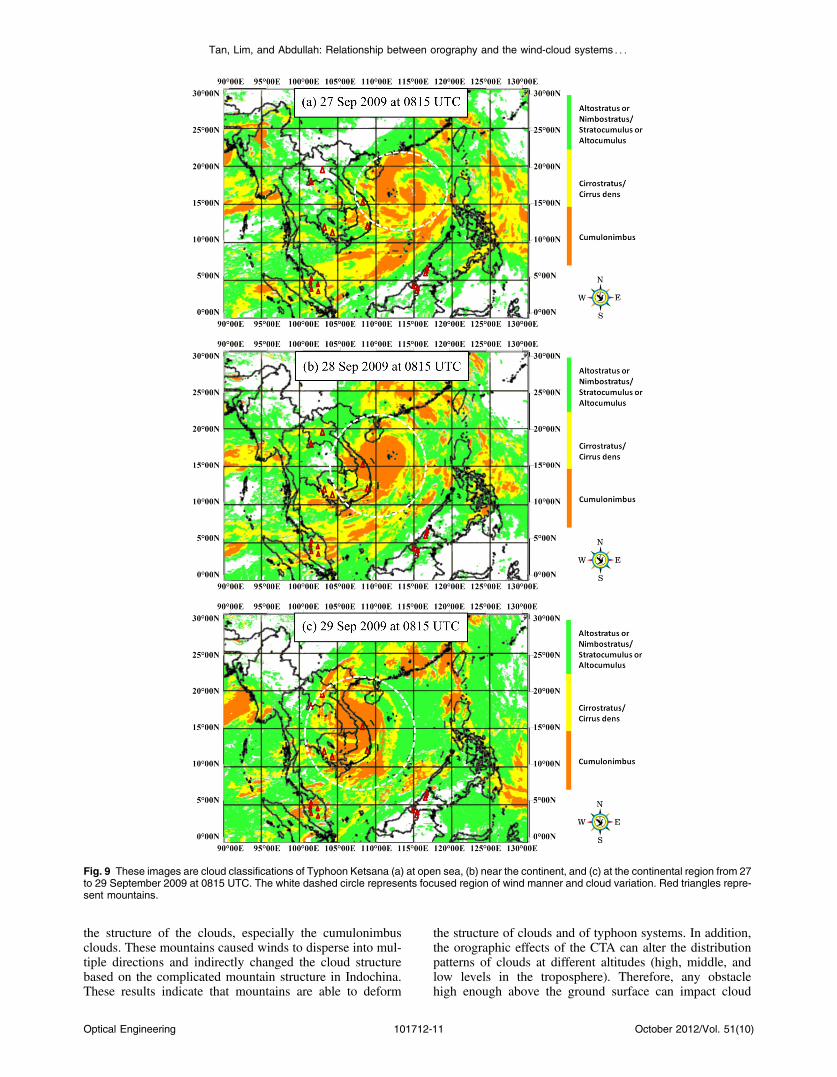
Three major colors were used in the CLC process (Fig. 9). Inthe images, the cumulonimbus clouds (clouds with verticaldevelopment) were represented in orange, the cirrostratusand cirrus dense clouds (high clouds) were represented inyellow, and the stratocumulus or altocumulus, nimbostratus,or altostratus (low and middle clouds) clouds were repre-sented in dark green. The previous study by Tan et al.11
only provided information about the cloud type distributionpatterns that interacted with the orography. Therefore, thecurrent study discusses the possibility of the cloud type
distribution pattern caused by orographic effects. The cirrusand cumulonimbus clouds were observed between the NgocLinh and Chu Yang Sin mountains in Vietnam [Fig. 9(a)].Comparing Figs. 9(a) and 6(a), the percentage of cloudwas found to be high between the Ngoc Linh and theChu Yang Sin mountains at 70% to 85%. On the otherhand, low and middle clouds were limited at the northernparts of the Phou Bia (2819 m) and Phou Soaydao(2102 m) mountains in Laos (refer to Table 1). Figure 6(a)also shows that approximately 40% to 55% of the cloud cov-ered the central part of Indochina, but showed limited cloudsin the Indochina topography because the Phou Bia and PhouSoaydao mountains in Laos and Phnum Aôral and PhnŭmTumbôt in Cambodia disturbed and blocked the windflow movement. Therefore, only less than 20% of the cloudsexisted over the two mountain regions.
Based on the CLC images, the cloud movementwas observed to be affected by the mountain’s topographyon 28 and 29 September 2009, as shown in Fig. 8(b) and8(c), respectively. When Typhoon Ketsana approachedIndochina, parts of the typhoon’s clouds were trapped bythe Ngoc Linh and Chu Yang Sin mountains [Fig. 9(b)]because the amount of cloud increased from 45% to 90%,and the maximum value reached 99% at Ngoc Linh moun-tain, as shown in the CTA value in Fig. 6(b). The cumulo-nimbus clouds were able to pass over the Ngoc LinhMountain because Typhoon Ketsana had enough energyto pass over the mountain, while the center of TyphoonKetsana was near Ngoc Linh. Nearby clouds, especiallycumulonimbus clouds, formed around the Chu Yang Sinmountain, over which Typhoon Ketsana did not center. Inaddition, clear cloud areas [CTA value less than 10% inFig. 6(b)] formed between the mountains of Laos andCambodia at approximately 15 °N to 19 °N latitude and101 °E to 104 °E longitude [Fig. 9(b)]. This region has anelevation of approximately 100 to 200 m (Fig. 3). This phe-nomenon further enhanced the significance of the topogra-phy in Indochina, especially in the six mountains listed inTable 1, which directly affected the cloud distribution pat-terns because the interior of Indochina is surrounded andcovered by high mountains. Moreover, when TyphoonKetsana approached the continental region, we found anincrease in the amount of low clouds and middle clouds(dark green regions) and a decrease in the number of highclouds (yellow regions). On the other hand, cumulonimbusclouds accumulated at the typhoon’s center when TyphoonKetsana neared the coastline of Vietnam. After making land-fall, the amount of high clouds [yellow regions in Fig. 9(c)]decreased compared with the previous day [Fig. 9(b)].
When Typhoon Ketsana moved further to the west, andbefore passing through the mountains in northern Laos andsouthern Cambodia, most of the lower part of the typhoon,which consisted of cumulonimbus clouds, was disturbed andblocked by the mountain ranges along the eastern coast ofVietnam [Fig. 9(c)] because these mountains are highenough and long enough to block the clouds (Fig. 3).Thus, the number of cumulonimbus clouds increased overthe regions with high-elevated terrain, where the CTA valuereached more than 90%. The cumulonimbus clouds weredistinctly deformed based on the high mountainous regionsof Laos and Cambodia. The mountains served as obstaclesthat blocked the motion of Typhoon Ketsana and deformed
Optical Engineering 101712-10 October 2012/Vol. 51(10)
Tan, Lim, and Abdullah: Relationship between orography and the wind-cloud systems : : :
the structure of the clouds, especially the cumulonimbusclouds. These mountains caused winds to disperse into mul-tiple directions and indirectly changed the cloud structurebased on the complicated mountain structure in Indochina.These results indicate that mountains are able to deform
the structure of clouds and of typhoon systems. In addition,the orographic effects of the CTA can alter the distributionpatterns of clouds at different altitudes (high, middle, andlow levels in the troposphere). Therefore, any obstaclehigh enough above the ground surface can impact cloud
Fig. 9 These images are cloud classifications of Typhoon Ketsana (a) at open sea, (b) near the continent, and (c) at the continental region from 27to 29 September 2009 at 0815 UTC. The white dashed circle represents focused region of wind manner and cloud variation. Red triangles repre-sent mountains.
Optical Engineering 101712-11 October 2012/Vol. 51(10)
Tan, Lim, and Abdullah: Relationship between orography and the wind-cloud systems : : :
distribution patterns at the TS level. The present resultsexpand our findings in the previous research and showthat any obstacle that is high enough above the ground sur-face can impact cloud distribution patterns at the TS level.
5 ConclusionBy studying geostationary satellite (FY-2D) data, weexplored the relationship between the wind-cloud systemof TCs at three different positions, namely, open sea, nearthe continental region, and over mainland mountain ranges.The different values were observed in the windward andleeward ground surface winds. A similar tendency of theincrease in the wind strength indicated that the orographiceffects influence the features of a typhoon. Describing therelationship of orography with the typhoon system is betterthan only using the longitude-latitude horizontal wind profileby Tan et al.11 because the in situ data provided the actualvalue changes in the wind. The orographic effects causedthe tremendous wind and gust speed of Typhoon Ketsanathat generated a greater mountain wave and reached theTS level. Furthermore, the CTA products were used asgood estimation tools to describe the cloud behavior becausethe increase in the cloud percentage showed us the possibilityof cloud formation, development, or cloud trapping. There-fore, the pressure variation in the windward and leewardsides can provide information about convective activity.The CTA and in situ data for wind and pressure can providea better understanding of the relationship between the oro-graphy and the wind-cloud system of a typhoon. TheCTA products enhanced the CLC results because thestudy of Tan et al.11 only indicated the cloud typedistribution patterns caused by the orographic effects butdid not provide further information. However, the under-standing of the cloud development and the convectiveactivity could be done better using the CTA products andpressure value. Therefore, this study successfully enhancedthe understanding of orography and the wind and cloudsystems of Typhoon Ketsana. The use of the FY-2D geosta-tionary satellite data does not provide the same detail as thatgiven by radar, stimulation, or numerical studies that on alocal view, but this technique can still be used to discovertyphoon-terrain effects in terms of wind structure andcloud variation at the synoptic scale.
AcknowledgmentsThe authors gratefully acknowledge the financial supportprovided by the RU grant (Relationship between heavyrain, flash floods and central pressure in Malaysia, accountnumber: 1001/PFIZIK/811152 and short term USM grant,account number: 304/PFIZIK/6310057 as well as UniversitiSains Malaysia (USM) fellowship). We would like to thankthe technical staff who participated in this project. We alsoextend our thanks to USM for their support and encourage-ment. Another contribution that cannot be forgotten is theNational Satellite Meteorological Center (NSMC) fromChina Meteorological Administration (CMA), who providedthe free satellite data for this study.
References
1. P. C. Li, “Terrain effects on typhoons approaching Taiwan,” in Proc.Asian U. S. Military Weather Symp., Taiwan, Vol. 3 (1963).
2. S. J. Brand and J. W. Blelloch, “Changes in the characteristics oftyphoons crossing the island of Taiwan,” Mon. Wea. Rev. 102(10),708–713 (1974).
3. S. W. Chang and R. V. Madala, “The orographic effects induced by anisland mountain range on propagating tropical cyclones,” Mon. Wea.Rev. 110(9), 1255–1270 (1982).
4. M. A. Bender, R. E. Tuleya, and Y. Kurihara, “A numerical study of theeffect of a mountain range on a landfalling tropical cyclone,”Mon. Wea.Rev. 113(4), 567–582 (1985).
5. M. A. Bender, R. E. Tuleya, and Y. Kurihara, “A numerical study ofthe effect of island terrain on tropical cyclones,” Mon. Wea. Rev.115(1), 130–155 (1987).
6. T. C. Yeh and R. L. Elsberry, “Interaction of typhoons with the taiwanorography. part i: upstream track deflections,”Mon. Wea. Rev. 121(12),3193–3212 (1993).
7. T. C. Yeh and R. L. Elsberry, “Interaction of typhoons with the Taiwanorography. part ii: continuous and discontinuous tracks across theisland,” Mon. Wea. Rev. 121(12), 3213–3233 (1993).
8. R. C. Frank et al., “Structure and evolution of intense tropical cyclonedina near la re·union on 22 January 2002: gb-evtd analysis of singledoppler radar observations,” J. Atmos. Oceanic Technol. 21(10),1501–1518 (2004).
9. C. J. Pan et al., “Wind profiler radar investigation on typhoon-orographyinteraction,” Geophys. Res. Lett. 35(22), L24812 (2008).
10. C. J. Pan et al., “Wind profiler observations on orographic effects oftyphoon wind structure modification over Taiwan (120.38°E, 22.6°N),”Ann. Geophys. 28(1), 141–147 (2010).
11. F. Tan, H. S. Lim, and K. Abdullah, “The effects of orography in Indo-china on wind, cloud, and rainfall patterns during typhoon ketsana(2009),” Asia—Pacific J. Atmos Sci. 48(3), 295–314 (2012).
12. J. B. Elsner and K. B. Liu, “Examining the enso-typhoon hypothesis,”Climate Res. 25(1), 43–54 (2003).
13. NSMC, “FengYun 2C satellite service products (application manual inchinese version): china meteorological administration (cma),” http://www.06climate.com/view/1396.html#edown (2009).
14. A. J. Charlton et al., “Sensitivity of tropospheric forecasts to strato-spheric initial conditions,” Quart. J. Roy. Meteor. Soc. 130(600),1771–1792 (2004).
15. L. M. Polvani and P. J. Kushner, “Tropospheric response to stratosphericperturbations in a relatively simple general circulation model,”Geophys.Res. Lett. 29(7), 18–1–18–4 (2002).
16. Y. Song and W. A. Robinson, “Dynamical mechanisms for stratosphericinfluences on the troposphere,” J. Atmos. Sci. 61(14), 1711–1725(2004).
17. P. Inness, “Weather,” Hodder Educat., pp. 83–97, McGraw-HillCompanies, Inc (2008).
18. C. C. van Heerwaarden and J. V. G. de Arellano, “Relative humidityas an indicator for cloud formation over heterogeneous land surfaces,”J. Atmos. Sci. 65(10), 3263–3277 (2008).
Fuyi Tan: biography and photograph not available.
Hwee San Lim is a lecturer at the school ofphysics, Universiti Sains Malaysia. Heobtained his BSc in geophysics from USMat 2001 and MSc in remote sensing fromUSM at 2003. He obtained his PhD in envir-onmental remote sensing from USM in 2006.His research interests are remote sensingapplications for water quality monitoring, airquality monitoring, land surface properties,and digital image classification. He is amember of the International Society for
Optical Engineering, US.
Khiruddin Abdullah received his BSc (phy-sics) in 1982 from Bedford College, Univer-sity of London, an MSc (geophysics) fromImperial College, London, in 1984, and aPhD in remote sensing from the Universityof Dundee, Scotland, in 1994. He is currentlya faculty member of the School of Physics,Universiti Sains Malaysia, teaching coursesin geophysics and remote sensing. Hisresearch interests include remote sensingapplications in marine and coastal environ-
ments. Presently, he is working on remote sensing algorithms forthe retrieval of water quality parameters and sea surface temperature.
Optical Engineering 101712-12 October 2012/Vol. 51(10)
Tan, Lim, and Abdullah: Relationship between orography and the wind-cloud systems : : :


