Embed Size (px)
Citation preview

ORIGINAL ARTICLE
Gabapentin-induced pharmacodynamic effects in the spinalnerve ligation model of neuropathic painB.A. Hooker1, G. Tobon2, S.J. Baker1, C. Zhu3, J. Hesterman2, K. Schmidt2, R. Rajagovindan1, P. Chandran1,S.K. Joshi3, A.W. Bannon3, J. Hoppin2, J. Beaver1, G.B. Fox1, M. Day1*, J. Upadhyay1
1 Integrated Science and Technology, Abbvie Inc., North Chicago, USA
2 inviCRO LLC, Boston, USA
3 Neuroscience Discovery, Abbvie Inc., North Chicago, USA
CorrespondenceJaymin Upadhyay
E-mail: [email protected]
*Current Address: Bristol-Myers Squibb,
Wallingford, CT, USA.
Funding SourceThis work was supported by Abbvie, Inc.
Conflict of InterestB.A.H., S.J.B., C.Z., R.R., P.C., S.K.J., A.W.B.,
G.B.F., J.B. and J.U. are full-time employees of
Abbvie, Inc., and may own Abbvie, Inc. stock.
M.D. is currently a full-time employee of
Bristol-Myers Squibb. G.T., J. Hesterman and
J. Hoppin are full-time employees of inviCRO
LLC. K.S. is a consultant at inviCRO LLC. J.
Hoppin has ownership interest in inviCRO
LLC. inviCRO LLC received financial support
from Abbvie, Inc. during the execution of this
study. The study design and study conduct
were provided by Abbvie, Inc. Abbvie, Inc.
participated in the interpretation of data,
review and approval of the manuscript.
Accepted for publication19 June 2013
doi:10.1002/j.1532-2149.2013.00364.x
Abstract
Background: The function of brain networks can be changed in amaladaptive manner in response to chronic neuropathic pain. Analgesicscan reduce pain by acting on such networks via direct or indirect(peripheral or spinal) mechanisms. This investigation aimed to mapgabapentin’s pharmacodynamics (PD) in the rodent brain followinginduction of neuropathic pain in order to further understand its PD profile.Methods: Pharmacological magnetic resonance imaging (phMRI) and anovel functional connectivity analysis procedure were performedfollowing vehicle or gabapentin treatment in the rat spinal nerve ligation(SNL) model of neuropathic pain as well as sham animals.Results: phMRI performed in SNL animals revealed robust gabapentin-induced responses throughout the hippocampal formation, yet significant(p < 0.05, corrected for multiple comparisons) responses were alsomeasured in other limbic structures and the sensorimotor system. Incomparison, sham animals displayed weaker and less widespread phMRIsignal changes subsequent to gabapentin treatment. Next, communities ofnetworks possessing strong functional connectivity were elucidated invehicle-treated SNL and sham animals. We observed that SNL and shamanimals possessed distinct functional connectivity signatures. Whenmeasuring how gabapentin altered the behaviour of the discoverednetworks, a decrease in functional connectivity driven by gabapentin wasnot only observed, but the magnitude of this PD effect was greater in SNLanimals.Conclusions Using phMRI and functional connectivity analysisapproaches, the PD effects of gabapentin in a preclinical neuropathic painstate were characterized. Furthermore, the current results offer insights onwhich brain systems gabapentin directly or indirectly acts upon.
1. Introduction
Recent clinical studies have shown that the function ofcentral nervous system (CNS) networks can bechanged in a maladaptive manner in response tochronic neuropathic pain (Gracely et al., 2002;Becerra et al., 2006; Friebel et al., 2011; Tseng et al.,2012). Analgesic drugs can reduce a patient’s per-
ceived pain by either directly acting upon these centralnetworks or non-supraspinal events via pharmaco-logical mechanisms occurring at spinal or peripheralsites. Gabapentin is an alkylated γ-aminobutyric acidthat has active pharmacology throughout the nervoussystem (Carlton and Zhou, 1998; Sutton et al., 2002;Iannetti et al., 2005; Governo et al., 2008; Takemuraet al., 2011). Despite its common use for alleviating
1Eur J Pain •• (2013) ••–•• © 2013 European Federation of International Association for the Study of Pain Chapters

multiple types of neuropathic pain, how gabapentinexerts its analgesic effects, specifically the brain circuitsit acts upon, remains ambiguous.
Gabapentin mediates voltage-gated calcium channelactivity by binding to the α2δ subunits (Field et al.,2000), regulates neurotransmitter function (Partridgeet al., 1998; Dooley et al., 2007) and inhibits excit-atory synapse formation (Eroglu et al., 2009). In neu-ropathic pain, α2δ1 subunit expression and calciumchannel activity are each increased in the dorsal horn(Matthews and Dickenson, 2001; Li et al., 2004).Moreover, high concentrations of α2δ subunits arecentrally distributed in structures such as the fore-brain, hippocampal formation, and periaqueductalgrey (Cole et al., 2005), and such structures areknown to play a role in how a neuropathic pain statemay persist well after the initial nerve injury. Gaba-pentin may alter the communication among theseCNS structures and this may in part underlie its anal-gesic effects. Thus, the main objective of this work wasto determine which CNS structures or networks, ifany, are affected by gabapentin in a neuropathic painstate.
Here, we aimed to measure and compare gabapen-tin’s de novo drug effect on CNS function in the spinalnerve ligation (SNL) model of neuropathic pain. Inthis vehicle-controlled study, the blood oxygenatedlevel-dependent (BOLD) signal was measuredcontinuously before, during and after an acute i.p.administration of 75 mg/kg gabapentin, a known
analgesic dose of the drug, in anaesthetized SNL andsham animals. Moreover, functional connectivity1
signatures across experimental cohorts were alsoelucidated.
Considering earlier clinical and preclinical evokedpain functional magnetic resonance imaging (fMRI)studies (Iannetti et al., 2005; Takemura et al., 2011)and pharmacological MRI (phMRI) work in naïve rats(Governo et al., 2008), we anticipated that in a neu-ropathic pain state, gabapentin would primarilydisrupt communication among supraspinal structureswithin the ascending sensory network. In SNLanimals, while gabapentin did, in fact, induce func-tional properties of ascending sensory network struc-tures to change, this was not the sole or dominantpharmacodynamics (PD) effect measured. Instead,mapping of phMRI activity and assessing functionalconnectivity across experimental conditions stronglypoint to structures of the limbic system2 (i.e., hip-pocampal formation) and basal ganglia as key centralsites whose function was impacted by gabapentin.These results offer new insights on gabapentin’smechanism of action at a brain system level.
2. Methods
2.1 Animals
All studies were conducted at Abbvie, Inc., in accordancewith Institutional Animal Care and Use Committee guide-lines and the National Institutes of Health Guide for Care andUse of Laboratory Animals. Abbvie, Inc., facilities are accred-ited by the Association for the Assessment and Accreditationof Laboratory Animal Care.
2.2 SNL and sham surgical procedures
Adult male Sprague-Dawley rats (Charles River, Portage, MI,USA) were used (n = 24; 225–250 g at the start of study). Thecurrent study contained two sham cohorts and two SNLmodel cohorts: (1) sham (vehicle; n = 6); (2) SNL (vehicle;n = 6); (3) sham (gabapentin; n = 6); and (4) SNL (gabapen-tin; n = 6).
To establish the rat SNL model, procedures previouslydescribed by Kim and Chung (1992) were utilized. Briefly,rats were anaesthetized with 3% isoflurane, the left lumbar5 (L5) and lumbar 6 (L6) spinal nerves of the rat were
1Functional connectivity is defined as the correlation of slowwave (0.01–0.1 Hz) BOLD signals between spatially distinctbrain regions.2The limbic system refers to a network of structures consist-ing of cingulate cortex, retrosplenial cortex, amygdala, hip-pocampal formation, anterior thalamus and septum.
What’s already known about this topic?• The function of central nervous system networks
can be changed in a maladaptive manner inresponse to chronic neuropathic pain.
• Analgesic drugs (i.e., gabapentin) can reducepain by either directly acting upon these centralnetworks or indirectly via pharmacologicalmechanisms occurring at spinal or peripheralsites.
What does this study add?• Pharmacological magnetic resonance imaging
and functional connectivity analysis can beimplemented to evaluate brain function follow-ing acute administration of gabapentin, an anal-gesic with pharmacology occurring in both theperipheral and the central nervous systems.
• Mechanistic effects of gabapentin on specificbrain networks (i.e., hippocampal network) inthe neuropathic pain state are elucidated.
Gabapentin-induced pharmacodynamic effects in brain B.A. Hooker et al.
2 Eur J Pain •• (2013) ••–•• © 2013 European Federation of International Association for the Study of Pain Chapters

isolated adjacent to the vertebral column and tightly ligatedwith a 5-0 silk suture distal to the dorsal root ganglia; carewas taken to avoid injury to the lumbar 4 (L4) spinal nerve.Sham rats underwent the same procedure, but withoutnerve ligation. The incision sites were sterilized using a 10%povidone-iodine solution prior to and post-surgeries. Fol-lowing the SNL and sham surgeries, rats were allowed torecover for a 3-week period, at which point behaviouraltesting for mechanical allodynia and functional imagingwere both performed.
2.3 Behavioural testing
Prior to isoflurane administration and subsequent phMRIprocedures, mechanical hypersensitivity was assessed withSemmes-Weinstein monofilaments (Stoelting Co., WoodDale, IL, USA) using the Dixon up-down method (Chaplanet al., 1994). The individual performing the behavioural testwas blinded to which experimental cohort each animalbelonged to. Specifically, mechanical hypersensitivities weremeasured using von Frey filaments of varying force. Twotrials per time point on the paw were analysed and averagedto give the stimulus at which there was a 50% probability ofa withdrawal. Filaments were applied in and around thecentre (±10 mm) of the hindpaw plantar surface. Mechanicalhypersensitivity was assessed on the paw ipsilateral (left) andcontralateral (right) to the SNL or sham surgical procedures.
2.4 Intraperitoneal administration of 75 mg/kggabapentin and vehicle
The effects of 75 mg/kg i/p. gabapentin relative to vehicle(water) were investigated with phMRI and functional con-nectivity analysis. Gabapentin was purchased from SigmaAldridge (St. Louis, MO, USA). We chose an i.p. dose ofgabapentin (75 mg/kg) that was in the range of previousbehavioural pain studies (Hunter et al., 1997; Hulseboschet al., 2000; Van Elstraete et al., 2008). Previous preclinicalbehavioural investigations have also reported gabapentin-induced inhibition of mechanical hypersensitivity in the SNLmodel (Urban et al., 2005; Joshi et al., 2006). Higher doses ofgabapentin were excluded to limit potential sedative effects(Lo et al., 2010). Moreover, i.p. administration of gabapentinat doses between 10 and 300 mg/kg in conscious rat do notdose-dependently affect physiological endpoints (heart rateand blood pressure; Yoon and Choi, 2003). Governo et al.(2008) also found no significant effects (compared withvehicle) on blood gas values, breathing rates or mean arterialpressure following multiple intravenous administration ofgabapentin during an anaesthetized state. In this investiga-tion, global physiological signals were not monitored. Duringthe phMRI scan, a 5-min baseline was collected prior to theinfusion of gabapentin + vehicle or vehicle alone. Gabapen-tin was administered via a 24-gauge i.p. catheter over a2-min period at a rate of 0.8 mL/min (see also SupportingInformation Fig. S1 for further detail on experimental para-digm). The i.p. line insertion was performed by the sameindividual throughout the study.
2.5 PhMRI data acquisition
All phMRI data were collected on a 4.7-T Bruker Pharmas-can (Karlsruhe, Germany) MRI magnet, with a 72-mm-diameter transmit volume coil and a quadrature surfacereceiver coil. For MRI data collection, animals were placedunder light isoflurane (2%) anaesthesia using room air as acarrier gas. A small bite loop was used to position and holdthe head in a nose cone used for delivery of the gas.
Animals were placed in a prone position on a bed, whichwas heated by an embedded circulating water bath to main-tain a physiologically normal body temperature (∼38 °C),negating any anaesthetic effect on thermal auto-regulation.High-resolution anatomical MRI data were collected using aT2-weighed RARE sequence. Anatomical MRI parameters:echo time = 14 ms, time of repetition = 5000 ms, flipangle = 180, spatial resolution = 0.25 × 0.25 × 1.25 mm3 andnumber of slices = 14 coronal slices. phMRI data were col-lected with a single-shot gradient echo planar imaging pulsesequence sensitive to blood oxygenated level-dependent(BOLD) signal. PhMRI parameters: echo time (TE) = 11.78ms, time of repetition = 2000 ms, flip angle = 90, repeti-tions = 1200 (40 min), spatial resolution = 0.5 × 0.5 × 1.25mm3 and number of slices = 14 coronal slices. The use of theshort TE of 11.78 ms to acquire phMRI data was based on theneed to achieve an optimal balance between BOLD sensitiv-ity and minimal spatial distortion. Recent preclinical neuro-imaging studies performed at 4.7 T have also utilized a shortTE and have been able to elucidate meaningful spatial-temporal networks in the rodent brain during a resting orpharmacologically evoked state (Becerra et al., 2011; vanMeer et al., 2012; Upadhyay et al., 2013).
2.6 Anaesthetized neuroimaging
Isoflurane was used as an anaesthetic based on previouswork demonstrating the preservation of pain signal propa-gation from peripheral to central sites. In isoflurane-anaesthetized rodents, Bosshard et al. (2010) and Hess et al.(2007) have independently shown robust BOLD signals insupraspinal circuitry elicited by noxious electrical andthermal stimulation, respectively. Given that gabapentin wasadministered via an i.p. route, administration of an anaes-thetic via an inhalation route was preferred. Moreover, theuse of isoflurane anaesthesia enabled natural respiration bythe animal rather than the mechanical ventilation often nec-essary for anaesthetics such as alpha-chloralose.
The use of anaesthesia in the present study could modu-late or blunt the PD effects of gabapentin in some brainregions or networks as previously shown (Hodkinson et al.,2012). However, recent investigations have also demon-strated that despite the presence of anaesthesia (e.g., 0.5–2%isoflurane), functional connectivity and the characterizationof drug action on the brain can be measured. Wang et al.(2011a) showed that the spontaneous BOLD signals thatdefine functional connectivity are preserved at isofluranelevels of 2.9% and below, yet functional connectivity can be
B.A. Hooker et al. Gabapentin-induced pharmacodynamic effects in brain
3Eur J Pain •• (2013) ••–•• © 2013 European Federation of International Association for the Study of Pain Chapters

reduced even at lower levels. There are also a number ofanaesthetized preclinical neuroimaging studies, where themeasured functional impact of a drug on specific brain struc-tures is in good accord with how the drug is known to affectbehaviour (Gozzi et al., 2012). Nonetheless, the use of iso-flurane introduces some limitation to functional brainimaging studies.
2.7 phMRI data analysis
All subject-level phMRI as well as functional connectivity(see below) data analyses procedures were performed usingVivoQuant 1.20 (Invicro LLC, Boston, MA, USA), whichpossess built-in functional capabilities for image processingand analysis using the Insight Toolkit (http://www.itk.org)and Matlab (MathWorks, Natick, MA, USA) compiled tools.Group-level analyses were primarily implemented and runin Matlab, with the exception of the Louvain method, whichdepended upon a python implementation for finding com-munities (perso.crans.org/aynaud/communities). The multi-step phMRI analysis pipeline consisted of the followingprocedures.
2.7.1 Preprocessing
Initial preprocessing of the single-subject phMRI dataincluded (1) identifying the brain from the entire volume;(2) correcting for motion-related artefacts; (3) segmentingthe brain in the motion corrected 4D-phMRI dataset; and (4)co-registration of each phMRI dataset to a standard templateatlas. For each subject, the mean functional volume was firstcomputed from the raw EPI data and used to create a maskof the brain, slice-by-slice. Using the non-brain masked data,motion correction was carried out using rigid, slice-by-sliceregistration of each time point to the mean volume. A ratatlas (54 regions) based on the Paxinos and Watson atlas(Paxinos and Watson, 2009) was then down-sampled to theresolution of the phMRI data and slices from the down-sampled atlas were heuristically selected to match slices fromthe mean EPI volume and overlap across datasets. Each timepoint was registered to a binarized version of the atlas usingan affine slice-by-slice registration. Smoothing of each timepoint was carried out using a two-dimensional Gaussiankernel with a 1 mm full width at half maximum.
2.7.2 Single-subject general linear model(GLM) analysis
The GLM analysis was implemented to identify at the single-subject, which voxels in the brain possessed a phMRIresponse (activation, deactivation) as well as no response todrug or vehicle infusion. The implemented GLM analysismethodology builds upon previous work where localizedphMRI responses were elucidated following acute adminis-tration of a pharmacological compound (Gozzi et al., 2008;Upadhyay et al., 2013). Specifically, each voxel and region of
interest (ROI) time series was modelled using an ideal rampas the effect of interest in addition to other regressors(Pendse et al., 2010). The ideal ramp was selected based onthe infusion paradigm, which was consistent across all acqui-sitions. The onset and stabilizing point of the ramp wasvaried locally and the difference between the set of idealramps was used to compute three eigen-regressors. A lineardrift term was also used as a nuisance regressor in the designmatrix. The average white matter time series obtained fromthe corpus callosum was computed from the preprocessedphMRI data and used as input to the GLM design matrix asa nuisance regressor. Estimates of the effect coefficients fromthe GLM were then used to generate a fit, y, to the averagewhite matter time series:
ˆ ˆy X= β
For each dataset, plots of the region time series, fits andresiduals were obtained for QA/QC procedures. Based on aninitial qualitative assessment of the raw phMRI data, threedatasets were excluded from group-level and functional con-nectivity analysis [two sham (vehicle) and one sham (gaba-pentin)]. While two subjects had strong baseline artefactsand spikes, one subject had a comparatively large linear driftartefact. Voxelwise maps of effect coefficients, percentchanges in BOLD signal, error variances and correspondingt-statistics were also obtained. The t-statistic maps were alsothresholded for highly significant values under the appropri-ate t-statistic distribution.
2.7.3 Group-level analysis
Subsequent statistical analyses and comparisons [i.e., SNL(vehicle) vs. SNL (gabapentin)] enabled a determination ofwhich phMRI activation and deactivation patterns observedat the single-subject leve, were significantly present at thegroup level. group mixed-effects analysis was carried out atthe second level of the GLM hierarchical model to generategroup-level estimates of the ideal ramp coefficient and vari-ance. A Bayesian inference method was implemented andused for these estimates (Neumann and Lohmann, 2003).The group level coefficients and variances at each voxel wereused to compute group difference t-statistic maps forunpaired designs, respectively. These t-statistics were thresh-olded for significance. The method by which multiplicity wascorrected for follows the procedures previously described byKiebel et al. (1999). Here, the residuals from group-levelGLM analysis were used for cluster-based correction for mul-tiple comparisons of the thresholded t-statistic maps as speci-fied in Kiebel et al. This method was implemented in Matlab(MathWorks). The covariance matrix of an underlyingGaussian random field, or otherwise the inherent spatialsmoothness of the data, was estimated in closed form fromthe residuals. GRF theory provides a probability distributionfor t-statistic cluster sizes under the null hypothesis basedgiven this smoothness matrix. This null hypothesis is essen-tially a distribution of expected false positives. Selection forsignificantly large clusters corrected for multiple compari-
Gabapentin-induced pharmacodynamic effects in brain B.A. Hooker et al.
4 Eur J Pain •• (2013) ••–•• © 2013 European Federation of International Association for the Study of Pain Chapters

sons. The resulting activation maps were converted to abinary mask, where each voxel received a value of 1 if itst-statistic remained non-zero after thresholding for signifi-cance and correction for multiple comparisons; otherwise, itreceived a value of zero. The number of active voxels in eachregion of the brain was used to quantify the percentage ofactive voxels in each atlas-defined brain region.
2.8 Functional connectivity data analysis
Functional connectivity analysis was performed to deter-mine if the correlation of time courses among distinct brainregions is altered between SNL and sham conditions as wellas between vehicle and gabapentin conditions. Here, a func-tional connectivity analysis procedure involving a novel nullhypothesis transformation approach was utilized. Within thismethod, an underlying assumption of a net global correla-tion of noise between the CSF and other brain regions wasmade. In the functional connectivity analysis, a more tradi-tional Fisher’s Z-transform approach exhibited strong trendsin most networks, but little statistical significance. Additionalresults were generated, utilizing a novel null hypothesistransformation approach based on an underlying assump-tion of a net global correlation of noise between the cere-brospinal fluid (CSF) and other brain regions. Theregistration and preconditioning protocol for this analysispipeline is identical to that of phMRI analysis with the addi-tion of a bandpass filter from 0.01 to 0.1 Hz to remove lowfrequency effects of non-interest and reduce high frequencynoise. Bandpass filtering was implemented using Butter-worth filters.
After registration and bandpass filtering, the mean whitematter (corpus callosum) time series was computed. Thistime series was used as a regressor in a design matrix alsocontaining bias and linear drift terms. GLM regression wasused with each voxel time series as input to compute effectcoefficients, error variances and model residuals. Theseresiduals were expected to be minimally correlated with themean white matter time series and became the input forcorrelation-based analysis. To expose any lateralizationeffects in functional connectivity analysis, the 54-region atlas(Supporting Information Table S1) was divided hemispheri-cally to map each region into left and right pairs, producinga 108-region atlas to be used in subsequent functional con-nectivity analysis. Since this operation did not transform theatlas, the same slice selection was used with the 108-regionatlas as with the 54-region atlas. The Pearson correlationcoefficient was computed between residual average signalsfrom each atlas region and arranged in a symmetric matrixfor each subject. The median coefficient across subjects ineach group was selected for each region pair to constructgroup level correlation matrices. Analysis was run on the last5 min (150 volumes) of the scan. The row of correlationcoefficients for the CSF region (ventricles) was extractedfrom each group matrix and was assumed to be samples froma null hypothesis distribution of correlation coefficients. Asthe mean and variance can differ across groups, this has the
effect of normalizing correlation values for each group totheir respective baseline correlations of non-interest. Thisstatistical method benefits the analysis and can be justifiedover the traditional assumption that these correlation valuescan be directly compared across cohorts. Although correla-tions of the CSF to other brain regions are expected to bezero mean, we did not find this to be the case. In all groups,the mean was greater than zero, varying with a standarddeviation of 0.04 with a mean of 0.22. This suggests thepresence of a net global spatial correlation of noise that couldnot be completely removed by the standard pre-processingroutines used. The method presented here goes one stepfurther by compensating for this effect that could potentiallyconfound the results by ignoring remaining spatial correla-tion in noise. Moreover, robustness of the implementedmethod was assessed by comparing the conventional Fisher’sZ transformation and null hypothesis transformation analy-ses approach. While the same trends were observed betweenthe two methods, the null hypothesis distribution estimationapproach proved to be more sensitive (data not shown). Themean and standard deviation across multiple CSF ROIs werealso computed and compared for each of the four experi-mental groups given that the CSF signal was used as theinput into the null hypothesis distribution estimation. Here,consistency was observed across the groups for each indi-vidual CSF ROI and also the average over all CSF regionscombined (data not shown). Subsequently, a normal distri-bution was fit to each vector and plots of the distributionoverlaid on the histogram of correlation values were made.The estimated normal distribution, fully defined by its meanand variance, was used to compute p-values for each corre-lation coefficient in the matrix. Each matrix was then thresh-olded (p < 0.05) for significance according to its estimatednull hypothesis distribution.
The discovery of functionally correlated networks wasbased on the algorithm previously described by Blondel et al.(2008). In the current study, a similar graph theory approachas that described by Liang et al. (2011) was used, wheremodularity, the optimization parameter used in the currentwork, was shown to select robust topological characteristicsin the rodent brain. A graph was constructed for each thresh-olded matrix, where each node represented an atlas region,and an undirected edge existed between two nodes if thecorresponding correlation had been significant (p < 0.05).This graph was analysed with the Louvain method, a hier-archical clustering algorithm normally used for unsuperviseddiscovery of communities within networks. Using theLouvain, unsupervised network discovery method, commu-nities of networks consisting of highly connected brainregions were identified. A python implementation of theLouvain method was used (perso.crans.org/aynaud/communities) to discover the networks of strong functionalconnectivity (correlation). The software uses the Greedyalgorithm to take the input connectivity graph implied by anadjacency matrix and group nodes into networks such thatgraph modularity is maximized. The adjacency matrix wasconstructed as an R × R matrix, with R being the number of
B.A. Hooker et al. Gabapentin-induced pharmacodynamic effects in brain
5Eur J Pain •• (2013) ••–•• © 2013 European Federation of International Association for the Study of Pain Chapters
segmented regions, and having a value of zero where nostatistically significant connection existed and one wherethere was. The output of this method was networks of atlasregions assumed to be highly connected. Any networksgreater than size 2 were grouped together in a rearrange-ment of the correlation matrices for the sake of visualization.For group comparison, reference networks were chosenfrom the VEH group analysis for the last 5 min of the phMRIscan (35–40 min). A measure of connectivity (Ci) for eachnetwork i was defined. The measure of comparison betweennetworks of different groups was the network ‘connectivity’measured by Ci for each subject and each network i:
CN
zii
j
z Tj
=>
∑1
where Ni is the number of statistically significant cor-relations found in the reference network, zj is thez-score of correlation j in the network, and T is thez-score threshold for statistical significance underthe normal distribution, 1.65. This measure aims toquantify how well connected a network is. A highvalue of Ci indicates that all statistically significantconnections exhibit high correlations. A lower valueindicates that the internal connections are not asstrong. Each reference network was assigned an Ci
value averaged over their respective VEH cohorts andranked according to that measure of connectivity.
Those networks consisting of only the left–right com-ponent of a single structure, e.g., the left and rightprimary visual cortex, were not considered as refer-ence networks and pursued for further analysis. Usingthis inclusion-exclusion criterion, seven referencenetworks were identified in the SNL (vehicle) andsham (vehicle) condition. The Ci value was computedfor the exact reference network on the correspondinggabapentin group matrix. Plots of these values weregenerated with matching vehicle and gabapentingroups for side-by-side for comparison.
2.8.1 Group-level analysis
For group-level analysis for functional connectivity data,initially, the Jarque–Bera test was implemented to assessnormality and a two-sample F-test was used to test for equalvariance. If either the normality or variance equality condi-tion was not met, an unpaired two-sided, non-parametrictest (Mann–Whitney U-test) was used as the standard t-testwas deemed inappropriate. If conditions of normality andequal variance were met, a standard, unpaired t-test wasused.
3. Results
3.1 Behavioural testing
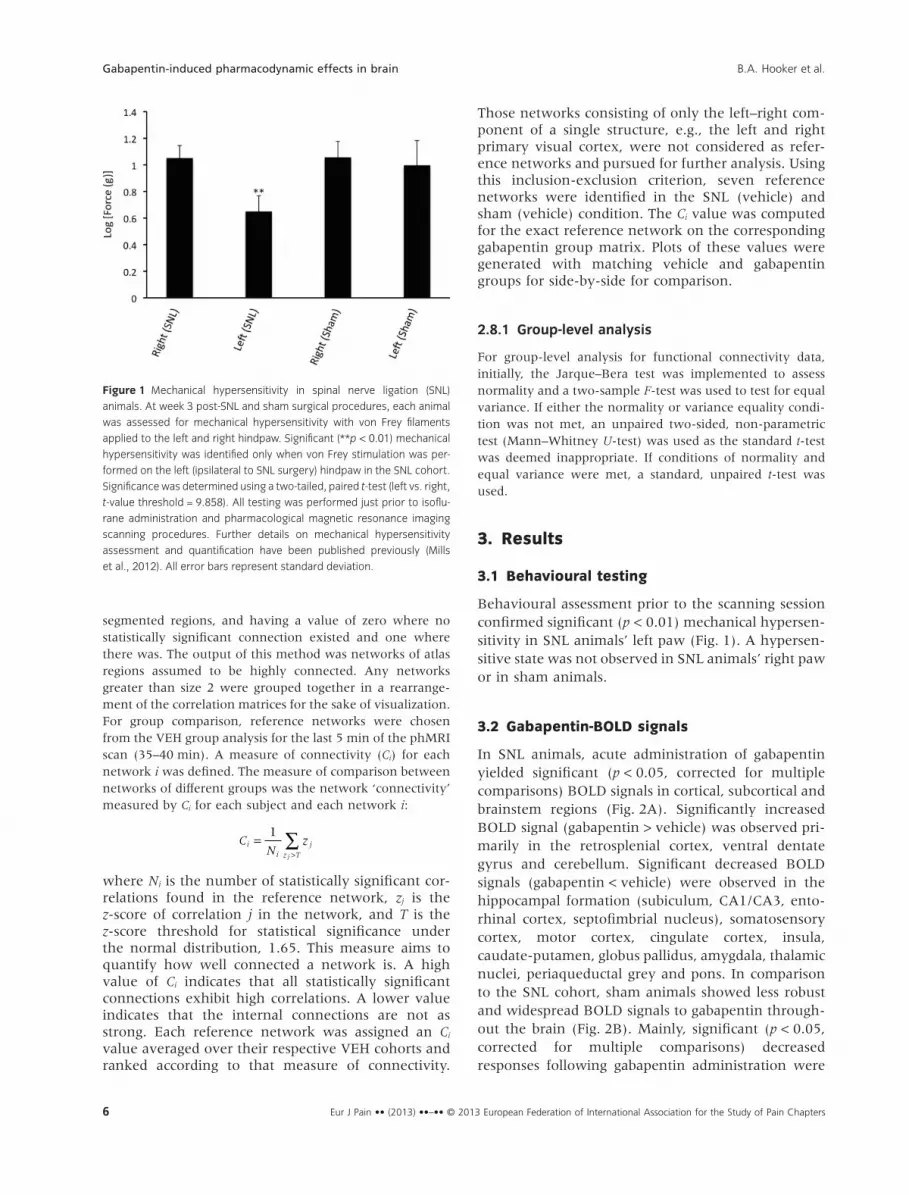
Behavioural assessment prior to the scanning sessionconfirmed significant (p < 0.01) mechanical hypersen-sitivity in SNL animals’ left paw (Fig. 1). A hypersen-sitive state was not observed in SNL animals’ right pawor in sham animals.
3.2 Gabapentin-BOLD signals
In SNL animals, acute administration of gabapentinyielded significant (p < 0.05, corrected for multiplecomparisons) BOLD signals in cortical, subcortical andbrainstem regions (Fig. 2A). Significantly increasedBOLD signal (gabapentin > vehicle) was observed pri-marily in the retrosplenial cortex, ventral dentategyrus and cerebellum. Significant decreased BOLDsignals (gabapentin < vehicle) were observed in thehippocampal formation (subiculum, CA1/CA3, ento-rhinal cortex, septofimbrial nucleus), somatosensorycortex, motor cortex, cingulate cortex, insula,caudate-putamen, globus pallidus, amygdala, thalamicnuclei, periaqueductal grey and pons. In comparisonto the SNL cohort, sham animals showed less robustand widespread BOLD signals to gabapentin through-out the brain (Fig. 2B). Mainly, significant (p < 0.05,corrected for multiple comparisons) decreasedresponses following gabapentin administration were
Figure 1 Mechanical hypersensitivity in spinal nerve ligation (SNL)
animals. At week 3 post-SNL and sham surgical procedures, each animal
was assessed for mechanical hypersensitivity with von Frey filaments
applied to the left and right hindpaw. Significant (**p < 0.01) mechanical
hypersensitivity was identified only when von Frey stimulation was per-
formed on the left (ipsilateral to SNL surgery) hindpaw in the SNL cohort.
Significance was determined using a two-tailed, paired t-test (left vs. right,
t-value threshold = 9.858). All testing was performed just prior to isoflu-
rane administration and pharmacological magnetic resonance imaging
scanning procedures. Further details on mechanical hypersensitivity
assessment and quantification have been published previously (Mills
et al., 2012). All error bars represent standard deviation.
Gabapentin-induced pharmacodynamic effects in brain B.A. Hooker et al.
6 Eur J Pain •• (2013) ••–•• © 2013 European Federation of International Association for the Study of Pain Chapters
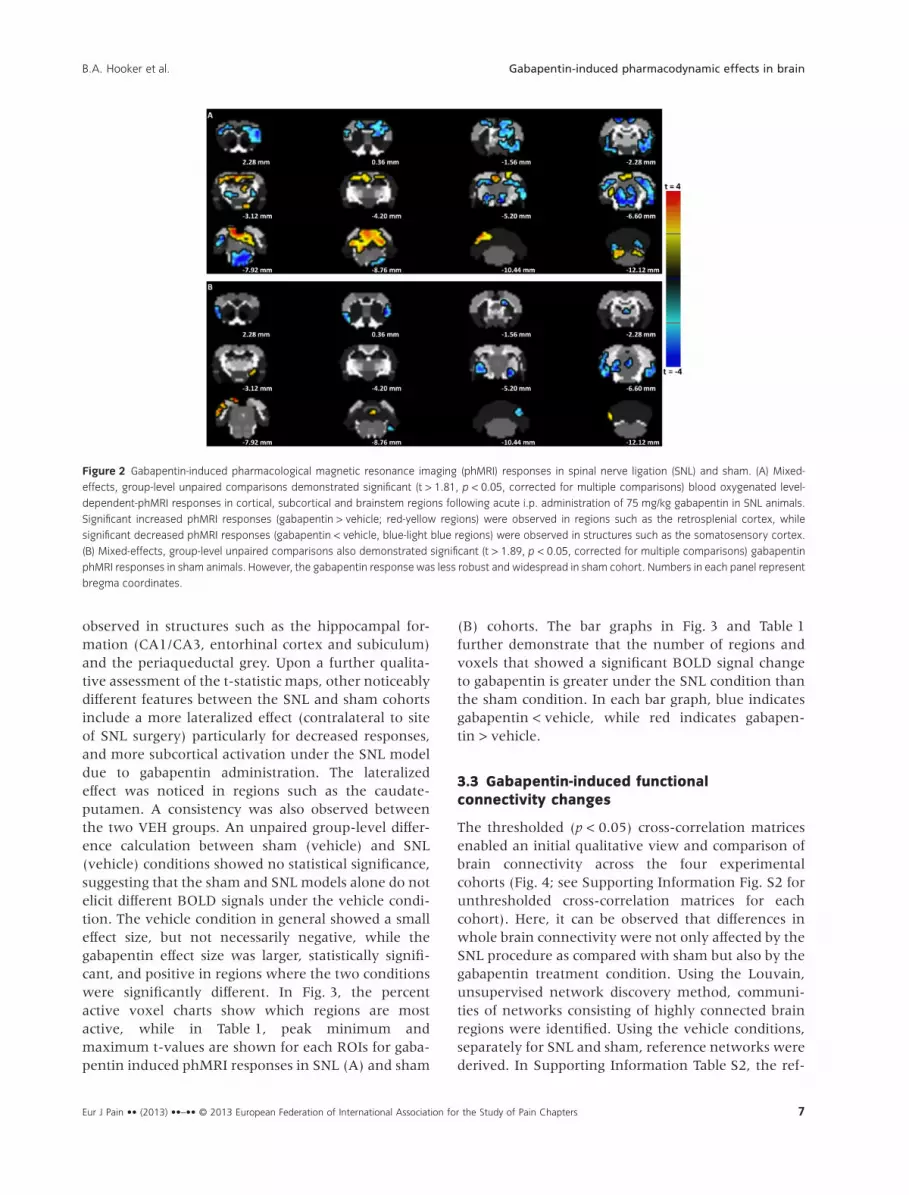
observed in structures such as the hippocampal for-mation (CA1/CA3, entorhinal cortex and subiculum)and the periaqueductal grey. Upon a further qualita-tive assessment of the t-statistic maps, other noticeablydifferent features between the SNL and sham cohortsinclude a more lateralized effect (contralateral to siteof SNL surgery) particularly for decreased responses,and more subcortical activation under the SNL modeldue to gabapentin administration. The lateralizedeffect was noticed in regions such as the caudate-putamen. A consistency was also observed betweenthe two VEH groups. An unpaired group-level differ-ence calculation between sham (vehicle) and SNL(vehicle) conditions showed no statistical significance,suggesting that the sham and SNL models alone do notelicit different BOLD signals under the vehicle condi-tion. The vehicle condition in general showed a smalleffect size, but not necessarily negative, while thegabapentin effect size was larger, statistically signifi-cant, and positive in regions where the two conditionswere significantly different. In Fig. 3, the percentactive voxel charts show which regions are mostactive, while in Table 1, peak minimum andmaximum t-values are shown for each ROIs for gaba-pentin induced phMRI responses in SNL (A) and sham
(B) cohorts. The bar graphs in Fig. 3 and Table 1further demonstrate that the number of regions andvoxels that showed a significant BOLD signal changeto gabapentin is greater under the SNL condition thanthe sham condition. In each bar graph, blue indicatesgabapentin < vehicle, while red indicates gabapen-tin > vehicle.
3.3 Gabapentin-induced functionalconnectivity changes
The thresholded (p < 0.05) cross-correlation matricesenabled an initial qualitative view and comparison ofbrain connectivity across the four experimentalcohorts (Fig. 4; see Supporting Information Fig. S2 forunthresholded cross-correlation matrices for eachcohort). Here, it can be observed that differences inwhole brain connectivity were not only affected by theSNL procedure as compared with sham but also by thegabapentin treatment condition. Using the Louvain,unsupervised network discovery method, communi-ties of networks consisting of highly connected brainregions were identified. Using the vehicle conditions,separately for SNL and sham, reference networks werederived. In Supporting Information Table S2, the ref-
Figure 2 Gabapentin-induced pharmacological magnetic resonance imaging (phMRI) responses in spinal nerve ligation (SNL) and sham. (A) Mixed-
effects, group-level unpaired comparisons demonstrated significant (t > 1.81, p < 0.05, corrected for multiple comparisons) blood oxygenated level-
dependent-phMRI responses in cortical, subcortical and brainstem regions following acute i.p. administration of 75 mg/kg gabapentin in SNL animals.
Significant increased phMRI responses (gabapentin > vehicle; red-yellow regions) were observed in regions such as the retrosplenial cortex, while
significant decreased phMRI responses (gabapentin < vehicle, blue-light blue regions) were observed in structures such as the somatosensory cortex.
(B) Mixed-effects, group-level unpaired comparisons also demonstrated significant (t > 1.89, p < 0.05, corrected for multiple comparisons) gabapentin
phMRI responses in sham animals. However, the gabapentin response was less robust and widespread in sham cohort. Numbers in each panel represent
bregma coordinates.
B.A. Hooker et al. Gabapentin-induced pharmacodynamic effects in brain
7Eur J Pain •• (2013) ••–•• © 2013 European Federation of International Association for the Study of Pain Chapters

erence networks from the SNL (vehicle) condition arenoted, while networks in Supporting InformationTable S3 correspond to the sham (vehicle) condition.Ranking of the networks was based on average con-nection z-score. A comparison of the reference net-works further demonstrates changes in brainconnectivity due to the SNL surgical procedure. Whilea claustrum–prelimbic–cingulate–motor (primary andsecondary motor cortex) network was the first rankedbrain network in the SNL cohort, the first-rankedbrain network in the sham cohort consisted ofbrain structures consisting of the nucleus accumbens,olfactory cortex, medial septum and diagonal band.[The latter network was also detected in the sham(vehicle) condition]. Moreover, robust functional net-works were detected in the SNL cohort between the
Figure 3 Region specific, percent active voxel following gabapentin
administration in spinal nerve ligation (SNL) and sham. Utilizing the thresh-
olded and corrected statistical maps displayed in Fig. 2, the percent active
voxel charts demonstrate which regions possessed significant pharmaco-
logical magnetic resonance imaging (phMRI) response to gabapentin in
SNL (A) or sham (B) animals. The bar graphs further demonstrate the more
pronounced phMRI response to gabapentin under the SNL condition in
comparison to the sham condition.
Table 1 Peak minimum and maximum t-values in region of interests for
gabapentin induced phMRI responses in SNL (a) and sham (b). t-Values
correspond to statistical maps depicted in Fig. 2.
Region of interest Minimum Maximum
(a) SNL (gabapentin) versus SNL (vehicle)Amygdala (other) −2.88 2.16Basolateral amygdaloid nucleus −3.68 0CA1 field of the hippocampus −2.53 2.4Cingulate cortex −2.83 0Caudate-putamen (striatum) −3.39 0Cerebellum −3.15 3.54Claustrum −1.94 0Cortex (other) −3.42 2.32Dentate gyrus −2.54 0Entorhinal cortex −3.84 2.12Globus pallidus −2.3 0Hypothalamus −2.52 3Laterodorsal thalamic nucleus 0 2.12Lateral septum −2.54 0Primary motor cortex −4.4 2.73Secondary motor cortex −3.53 2.94Midbrain −5.12 3.76Medial septum 0 0Periaqueductal grey −3.28 2.14Perirhinal cortex −2.37 0Pons −3.8 0Retrosplenial cortex −1.99 4.19Subiculum −3.27 2.25Primary somatosensory cortex −3.65 3.14Secondary somatosensory cortex −2.65 1.84Septofimbrial nucleus −1.98 −1.98Substantia innominata −3.08 0Substantia nigra −4.22 0Bed nucleus of the stria terminalis −2.21 0Thalamus (other) −2.8 2.83Primary visual cortex −2.73 2.7Secondary visual cortex −3.2 1.98Ventral CA1 −2.72 0Ventral CA3 −2.25 0Ventral dentate gyrus −2.37 2.13Ventrolateral thalamic nucleus −2.4 0Ventromedial thalamic nucleus −2.8 0Ventral subiculum −3.54 0
(b) Sham (gabapentin) versus sham (vehicle)Amygdala −2.55 0CA1 field of the hippocampus 0 2.56Caudoputamen (striatum) 0 3.46Cerebellum −2.65 2.79Cortex (other) −3.84 3.6Entorhinal cortex 0 3.56Midbrain 0 3.63Periaqueductal grey 0 3.63Perirhinal cortex 0 2.98Retrosplenial cortex −2.92 0Primary somatosensory cortex 0 3.29Secondary somatosensory cortex 0 4.08Substantia nigra 0 3.33Thalamus (other) 0 2.94Primary visual cortex −3.61 0Secondary visual cortex −4.67 3Ventral CA1 0 2.77Ventral CA3 0 3.98Ventral dentate gyrus 0 3.3Ventral subiculum 0 2.48
Gabapentin-induced pharmacodynamic effects in brain B.A. Hooker et al.
8 Eur J Pain •• (2013) ••–•• © 2013 European Federation of International Association for the Study of Pain Chapters

hippocampal formation and somatosensory cortices aswell as within the basal ganglia.
Treatment effects of gabapentin on the distinct ref-erence networks were subsequently quantified(Fig. 5). Unpaired comparisons (gabapentin vs.vehicle) performed over network connections indi-cated that gabapentin driven changes in networks 1, 2,4 and 7 from the SNL condition were significant.However, only changes in network 2 functional con-nectivity were significantly different between sham(vehicle) and sham (gabapentin) conditions. Thus,compared to the sham condition, gabapentin yielded amore robust PD effect on reference network connec-tivity in the SNL cohort. To further elucidate theeffects of gabapentin in the SNL and sham states, cor-relation matrices from a subset of reference networksare displayed (Fig. 6). In the SNL condition, the matri-ces further demonstrate robust gabapentin-driveneffects on BOLD signal correlations in networks con-sisting of limbic cortex structures (network 1) as wellas hippocampal formation structures (network 4).Lastly, in Supporting Information Fig. S3, single-subject, BOLD signal time courses from the ventralsubiculum, ventral CA1 and ventral dentate gyrus are
plotted across the four experimental cohorts. The cor-relation trends noted in Supporting InformationFig. S3 are in accord with the trends depicted in Figs. 5and 6.
4. Discussion
The presence of neuropathic pain is not only an expe-rience where sensation is altered but also one that isco-morbid with stress, anxiety or depression. Thus, aneuropathic pain state can induce or sustain alteredfunction of brain structures within sensory and affec-tive networks. Moreover, the phMRI and functionalconnectivity findings of this study jointly inform onhow an analgesic (i.e., gabapentin) pharmacologicallyimpacts the function of such affected supraspinal net-works either directly or indirectly via its peripheral orspinal action.
4.1 The hippocampal formation and pain
The current set of phMRI and functional connectivityresults involving hippocampal function are in accordwith what has been previously reported in earlier neu-
Figure 4 Functional connectivity signatures.
Cross-correlation matrices were initially gener-
ated and then thresholded for each of the four
experimental conditions. Correlation values
were mapped after thresholding according to
statistical significance. From a qualitative
sense, a functional connectivity signature
could be obtained for each condition. By
implementing the Louvain method, communi-
ties within the entire network could be identi-
fied in an unsupervised manner. This
procedure was separately performed to iden-
tify reference networks in the spinal nerve liga-
tion (SNL) (vehicle) and sham (vehicle)
conditions. The impact of acute gabapentin
administration on the reference networks was
then performed. All functional connectivity
analysis was performed on the last 5 min of
the phMRI scan. Each brain region demarcated
in the atlas (Supporting Information Table S1) is
plotted along the x and y axes. The axes were
kept constant between vehicle and gabapentin
conditions (rows of matrices), but not between
SNL versus sham conditions (columns of matri-
ces). Such a matrix organization was kept to
determine the effects of gabapentin on the
reference networks. In each matrix, left hemi-
spherical regions are ordered before right
hemispherical regions.
B.A. Hooker et al. Gabapentin-induced pharmacodynamic effects in brain
9Eur J Pain •• (2013) ••–•• © 2013 European Federation of International Association for the Study of Pain Chapters

robiological and behavioural work. When pain per-sists, the levels of stress and anxiety can be heightenedand other psychiatric co-morbidities often exist duringchronic pain (Sullivan et al., 1992; Elman et al.,2011). The presence of an abnormal mental state (e.g.,major depressive disorder) can likewise be accompa-nied by altered responses to pain itself (Lopez-Solaet al., 2010). Interestingly, the SNL model particularlyhas been characterized as showing anxiety anddepression-like behaviours (Suzuki et al., 2007). Thistight coupling between pain and psychiatric conditionscan even be traced to enzyme expression levels in the
hippocampus (Kim et al., 2012). Also, levels ofneurokinin-1 receptors and brain-derived neuro-trophic factor mRNAs were each down-regulated inthe CA1/CA3 fields of the hippocampus as a directresult of pain or stress (Duric and McCarson, 2006).These and other findings at the molecular level (Sonet al., 2012) may very well underlie and relate to whathas been observed macroscopically in the hippocam-pus during clinical conditions of pain, stress, anxietyor depression (Ploghaus et al., 2001; Zimmermanet al., 2009; Howard et al., 2011; Mutso et al., 2012;Maleki et al., 2013).
4.2 Gabapentin-induced PD effects in aneuropathic pain state
In SNL animals, gabapentin increased phMRI activityrelative to vehicle notably in the retrosplenial cortex,ventral aspect of dentate gyrus and cerebellum. TheBOLD signal in the retrosplenial cortex is particularlyinteresting given its role in a range of functions thatencompass, but are not limited to memory, learning,planning and emotional behaviours (Vann et al.,2009). It cannot be stated whether the robust responsein the retrosplenial cortex is a direct effect of gabapen-tin on this structure. Given the structural connectivitybetween the retrosplenial cortex and hippocampal for-mation structures (subiculum, entorhinal cortex andCA1) as well as the periaqueductal grey, thalamus andpons (Wyss and Van Groen, 1992), the increasedphMRI activity may very well result from downstreameffects of gabapentin.
In SNL animals, the decreased gabapentin BOLDsignals were much more prominent in the brain. Suchresponses were primarily detected in the hippocampalformation outside the ventral dentate gyrus, otherlimbic/paralimbic structures (septal nuclei andamygdala), sensorimotor system, midbrain and pons.Within the hippocampal formation, amygdala, septalnuclei and midbrain, a high density of the α2δ sub-units (α2δ1 or α2δ2) exists (Cole et al., 2005) andthese structures are well known to play an importantrole in memory as well as stress responses (Wanget al., 2011b; Qin et al., 2012; Rouwette et al., 2012;Maleki et al., 2013). Thus, the robust phMRI activitymay have well arose from gabapentin’s direct effect onthese structures. Given the allodynic state in the SNLcohort, determined by sensory-reflex responses, it canbe considered that the supraspinal sensorimotorsystem is in a hyperactive state and gabapentin down-regulates such activity. However, given that the α2δsubunit distribution is low in sensorimotor structuressuch as the lateral thalamus and sensorimotor cortex,
Figure 5 Gabapentin-induced functional connectivity changes in spinal
nerve ligation (SNL) and sham. The average z-score over the reference
networks under vehicle and gabapentin treatment conditions were com-
pared (unpaired t-tests). (A) Change in SNL (vehicle) discovered net-
works’ connectivity. (B) Change in sham (vehicle) discovered networks’
connectivity (see also Supporting Information Tables S2 and S3). While
gabapentin predominantly yielded decreased z-scores for both SNL (A)
and sham (B), the impact on functional connectivity driven by gabapen-
tin occurred to a greater degree in the SNL cohort. Statistical tests were
performed using two-tailed unpaired comparisons (vehicle vs. gabapen-
tin). For networks 2, 4 and 7, a two-sided, non-parametric statistical test
(Mann–Whitney U-test) was utilized. All error bars represent standard
deviation. In Supporting Information Tables S2 (SNL cohorts) and S3
(sham cohorts), total connections, modularity as well as mean degree
and connections are provided for each reference network and across
conditions.
Gabapentin-induced pharmacodynamic effects in brain B.A. Hooker et al.
10 Eur J Pain •• (2013) ••–•• © 2013 European Federation of International Association for the Study of Pain Chapters

it is possible that BOLD signals to gabapentin in theseregions result from changes in activity originatingfrom the dorsal horn or dorsal root ganglia (Luo et al.,2002) as well as other supraspinal structures (i.e., hip-pocampal formation). This latter viewpoint is sup-ported by the fact that strong functional connectivityin the neuropathic pain state was observed within thehippocampus (network 4; Supporting InformationTable S2), between limbic, motor system and sensoryintegration structures (cingulate and claustrum)(network 1; Supporting Information Table S2) as wellas hippocampal and somatosensory systems (network3; Supporting Information Table S2), and connectivityis these networks were significantly disrupted in thepresence of gabapentin. In the SNL cohort, other net-works involving the basal ganglia (nucleus accumbensand caudate-putamen) also showed strong functionalconnectivity and were pharmacologically modulatedby gabapentin (networks 2 and 3; Supporting Infor-mation Table S2). The initial strong connectivityamongst these structures likely relates the role of thebasal ganglia in the reward-aversion aspects of pain ordefensive behaviour associated with pain (Gustinet al., 2011; Imai et al., 2011; Tambeli et al., 2012).Moreover, there is much overlap between thediscovered networks specific to the SNL cohort withthose networks previously implicated in spontaneousneuropathic pain (Borsook et al., 2007; Geha et al.,2007).
4.3 Gabapentin-induced PD effects insham animals
In the sham cohort, the overall PD effect of gabapentinwas less robust and widespread compared with theSNL cohort. phMRI activity in sham can be comparedto past work of Governo et al. (2008), where the gaba-pentin infusion response was measured in anesthe-tized naïve rats. In sham and naïve rats, gabapentincommonly induced decreased phMRI activity in hip-pocampal formation structures, periaqueductal greyand thalamus. A distinction between the results of thetwo studies was in periaqueductal grey, wheredecreased BOLD signals in the current study wereobserved, while those responses were increased innaïve rats. Such a discrepancy may stem from differ-ences in analysis procedures, e.g., current implemen-tation of white matter time course regression. Thispossibility is made all the more likely considering mostof the other experimental parameters were constantbetween both studies. Further, functional networksobserved to have the strongest connectivity in shamanimals were detected in visual, mesolimbic, hip-pocampal, cortical-striatal and thalamic networks. Thedetection of such functional networks is consistentwith earlier studies where functional connectivity wasassessed in healthy animals (Becerra et al., 2011;Liang et al., 2011), suggesting further similaritiesbetween sham and naïve animals.
Figure 6 Reference network correlation
z-score matrices. Correlation z-score matrices
from a subset of reference networks from
spinal nerve ligation (SNL) and sham animals
and the effects of gabapentin on those net-
works are displayed. In the SNL condition, the
matrices further demonstrate robust
gabapentin-driven effects on blood oxygen-
ated level-dependent signal correlations in net-
works such as those including hippocampal
formation structures (network 4). Moreover,
the more modest effect in the sham compared
with the SNL condition can also be elucidated.
B.A. Hooker et al. Gabapentin-induced pharmacodynamic effects in brain
11Eur J Pain •• (2013) ••–•• © 2013 European Federation of International Association for the Study of Pain Chapters

Nonetheless, the observation of phMRI activity inthe sham condition and naïve animals was somewhatunexpected considering that gabapentin’s pharmaco-logical action is believed to be state-dependent accord-ing to previous preclinical work (Narita et al., 2007).Considering that functional changes in the hippocam-pal structures were observed in both gabapentinphMRI studies, the infusion responses may simplystem from gabapentin-α2δ subunit binding, but at avery low level. A dual-treatment study, where the α2δsubunit binding sites are blocked prior to gabapentinadministration, would help to understand ifgabapentin-α2δ subunit binding is driving the BOLDsignals detected in either sham or naïve animal con-ditions as well as determining gabapentin’s state-dependent functionality.
4.4 CNS function in neuropathic pain patients
Previous functional imaging studies have character-ized central processing in neuropathic pain patients.For example, trigeminal neuralgia (Becerra et al.,2006) and complex regional pain syndrome(Maihofner et al., 2006; Lebel et al., 2008) patientsprimarily show enhanced responses to mechanicaland thermal stimulation within sensory pathways(e.g., trigeminal sensory pathways) in conjunctionwith enhanced or suppressed responses withinsystems closely mediating affective components ofpain (e.g., limbic system and basal ganglia). CNS net-works involving the cingulate, insula, cuneus orfrontal cortex show altered resting state, functionalconnectivity when evaluated in neuropathic painpopulations (Cauda et al., 2009, 2010; Malinen et al.,2010). In musculoskeletal diseases (e.g., fibromyalgiaor chronic back pain), where neuropathic pain can bepresent, central pain processing and functional con-nectivity are distinct from healthy controls (Gracelyet al., 2002; Napadow et al., 2010; Apkarian et al.,2011; Baliki et al., 2012). The earlier clinical findingsstrongly suggest that neuropathic pain profoundlymodulates CNS function, and these maladaptivecentral changes likely contribute in part to sustainingthe pathological state (von Hehn et al., 2012).
4.5 Non-supraspinal versus supraspinalpharmacological action
Analgesics such as gabapentin or other pharmacologi-cal compounds (e.g., pregabalin and ziconotide) thatalso act upon the α2δ subunit, calcium channel activ-ity and other overlapping mechanisms may in partinduce their analgesic effect by direct or indirect
impact on the function of CNS structures and net-works. When considering previous work by Wanget al. (2012) where the PD of pregabalin in an uncon-ditioned fear state were evaluated, it can be statedthat relevant pharmacology is directly active withinsupraspinal sites, and it is this direct action the yieldsa behavioural or clinical effect. However, in thecurrent study, it cannot be stated that functionalbrain changes arise solely as a result of supraspinalmechanisms, as the pharmacology in the peripheryand spinal level could indirectly affect the functionof central networks. In future work, the non-supraspinal versus supraspinal mechanisms of gaba-pentin and similar pharmacological compounds mightbe teased apart by evaluating both acute and chronicdosing regimens as well as measuring function andstructure in multiple sites within the same subject.Such preclinical or clinical studies may enable adetermination if changes in function and structurebetween non-supraspinal and supraspinal sites arecorrelative or causative.
4.6 Functional connectivity analysis
The phMRI results of this study yielded robust find-ings, which were augmented by observations in func-tional connectivity. The functional connectivityanalyses generated significant functional changeswithin previously reported neurobiologically relevantpain system in the brain in addition to brain structuresand systems that have high densities of N-type calciumchannels or α2δ subunits. Nonetheless, the ensuingresults should be interpreted with care given thenovelty of the implemented methodology, particularlywith respect to the assumption of a net global corre-lation of noise between the CSF and other brainregions. Future studies involving this exploratoryfunctional connectivity analysis approach will offerfurther insights into its utility and limitations.
In conclusion, this investigation identified how thefunctionality of brain networks is modulated by a neu-ropathic pain state, and how systemic gabapentinadministration pharmacodynamically modulates theseaffected networks. The observed BOLD signals andfunctional connectivity changes particularly measuredacross the hippocampal formation point to networksin the brain affected by neuropathic pain and gaba-pentin treatment. In future work, the use of a func-tional imaging paradigm may enable furthercomprehension of a neuropathic pain state as well asaid in evaluating analgesics for this specific paincondition.
Gabapentin-induced pharmacodynamic effects in brain B.A. Hooker et al.
12 Eur J Pain •• (2013) ••–•• © 2013 European Federation of International Association for the Study of Pain Chapters

Author Contributions
B.A.H., S.J.B., P.C., S.K.J., A.B., G.B., M.D. and J.U. designedthe study. B.A.H., S.J.B., P.C., S.K.J., C.Z., S.J. and J.U.performed the study. G.T., K.S., J. Hesterman, J. Hoppin andJ.U. performed data analysis. B.A.H., S.J.B., G.T., C.Z., R.R.,K.S., J. Hesterman, J.B., G.B.F., M.D. and J.U. wrote thepaper. All authors critically reviewed the publication forimportant intellectual content and approved the finalversion of the publication.
References
Apkarian, A.V., Hashmi, J.A., Baliki, M.N. (2011). Pain and the brain:Specificity and plasticity of the brain in clinical chronic pain. Pain 152,S49–S64.
Baliki, M.N., Petre, B., Torbey, S., Herrmann, K.M., Huang, L., Schnitzer,T.J., Fields, H.L., Apkarian, A.V. (2012). Corticostriatal functional con-nectivity predicts transition to chronic back pain. Nat Neurosci 15, 1117–1119.
Becerra, L., Morris, S., Bazes, S., Gostic, R., Sherman, S., Gostic, J. (2006).Trigeminal neuropathic pain alters responses in CNS circuits tomechanical (brush) and thermal (cold and heat) stimuli. J Neurosci 26,10646–10657.
Becerra, L., Pendse, G., Chang, P.C., Bishop, J., Borsook, D. (2011).Robust reproducible resting state networks in the awake rodent brain.PLoS ONE 6(10), e25701.
Blondel, V.D., Guillaume, J.L., Lambiotte, R., Lefebvre, E. (2008). Fastunfolding of communities in large networks. J Stat Mech. doi:10.1088/1742-5468/2008/10/P10008
Borsook, D., Moulton, E.A., Pendse, G., Morris, S., Cole, S.H.,Aiello-Lammens, M. (2007). Comparison of evoked vs. spontaneoustics in a patient with trigeminal neuralgia (tic doloureux). Mol Pain 3,34.
Bosshard, S.C., Baltes, C., Wyss, M.T., Mueggler, T., Weber, B., Rudin, M.(2010). Assessment of brain responses to innocuous and noxious elec-trical forepaw stimulation in mice using BOLD fMRI. Pain 151, 655–663.
Carlton, S.M., Zhou, S. (1998). Attenuation of formalin-induced nocice-ptive behaviors following local peripheral injection of gabapentin. Pain76, 201–207.
Cauda, F., D’Agata, F., Sacco, K., Duca, S., Cocito, D., Paolasso, I. (2010).Altered resting state attentional networks in diabetic neuropathic pain.J Neurol Neurosurg Psychiatry 81, 806–811.
Cauda, F., Sacco, K., D’Agata, F., Duca, S., Cocito, D., Geminiani, G.(2009). Low-frequency BOLD fluctuations demonstrate altered thal-amocortical connectivity in diabetic neuropathic pain. BMC Neurosci 10,138.
Chaplan, S.R., Bach, F.W., Pogrel, J.W., Chung, J.M., Yaksh, T.L. (1994).Quantitative assessment of tactile allodynia in the rat paw. J NeurosciMethods 53, 55–63.
Cole, R.L., Lechner, S.M., Williams, M.E., Prodanovich, P., Bleicher, L.,Varney, M.A. (2005). Differential distribution of voltage-gated calciumchannel alpha-2 delta (alpha2delta) subunit mRNA-containing cells inthe rat central nervous system and the dorsal root ganglia. J Comp Neurol491, 246–269.
Dooley, D.J., Taylor, C.P., Donevan, S., Feltner, D. (2007). Ca2+ channelalpha2delta ligands: Novel modulators of neurotransmission. TrendsPharmacol Sci 28, 75–82.
Duric, V., McCarson, K.E. (2006). Persistent pain produces stress-likealterations in hippocampal neurogenesis and gene expression. J Pain 7,544–555.
Elman, I., Zubieta, J.K., Borsook, D. (2011). The missing p in psychiatrictraining: Why it is important to teach pain to psychiatrists. Arch GenPsychiatry 68, 12–20.
Eroglu, C., Allen, N.J., Susman, M.W., O’Rourke, N.A., Park, C.Y., Ozkan,E. (2009). Gabapentin receptor alpha2delta-1 is a neuronal thrombos-
pondin receptor responsible for excitatory CNS synaptogenesis. Cell139, 380–392.
Field, M.J., Hughes, J., Singh, L. (2000). Further evidence for therole of the alpha(2)delta subunit of voltage dependent calciumchannels in models of neuropathic pain. Br J Pharmacol 131, 282–286.
Friebel, U., Eickhoff, S.B., Lotze, M. (2011). Coordinate-based meta-analysis of experimentally induced and chronic persistent neuropathicpain. Neuroimage 58, 1070–1080.
Geha, P.Y., Baliki, M.N., Chialvo, D.R., Harden, R.N., Paice, J.A.,Apkarian, A.V. (2007). Brain activity for spontaneous pain of posther-petic neuralgia and its modulation by lidocaine patch therapy. Pain 128,88–100.
Governo, R.J., Morris, P.G., Marsden, C.A., Chapman, V. (2008). Gaba-pentin evoked changes in functional activity in nociceptive regions inthe brain of the anaesthetized rat: An fMRI study. Br J Pharmacol 153,1558–1567.
Gozzi, A., Colavito, V., Seke Etet, P.F., Montanari, D., Fiorini, S., Tambalo,S. (2012). Modulation of fronto-cortical activity by modafinil: A func-tional imaging and fos study in the rat. Neuropsychopharmacology 37,822–837.
Gozzi, A., Large, C.H., Schwarz, A.J., Bertani, S., Crestan, V., Bifone, A.(2008). Differential effects of antipsychotic and glutamatergic agents onthe phMRI response to phencyclidine. Neuropsychopharmacology 33,1690–1703.
Gracely, R.H., Petzke, F., Wolf, J.M., Clauw, D.J. (2002). Functional mag-netic resonance imaging evidence of augmented pain processing infibromyalgia. Arthritis Rheum 46, 1333–1343.
Gustin, S.M., Peck, C.C., Wilcox, S.L., Nash, P.G., Murray, G.M.,Henderson, L.A. (2011). Different pain, different brain: Thalamicanatomy in neuropathic and non-neuropathic chronic pain syndromes.J Neurosci 31, 5956–5964.
von Hehn, C.A., Baron, R., Woolf, C.J. (2012). Deconstructing the neu-ropathic pain phenotype to reveal neural mechanisms. Neuron 73, 638–652.
Hess, A., Sergejeva, M., Budinsky, L., Zeilhofer, H.U., Brune, K. (2007).Imaging of hyperalgesia in rats by functional MRI. Eur J Pain 11,109–119.
Hodkinson, D.J., de Groote, C., McKie, S., Deakin, J.F., Williams, S.R.(2012). Differential effects of anaesthesia on the phMRI response toacute ketamine challenge. Br J Med Med Res 2, 373–385.
Howard, M.A., Krause, K., Khawaja, N., Massat, N., Zelaya, F., Schumann,G. (2011). Beyond patient reported pain: Perfusion magnetic resonanceimaging demonstrates reproducible cerebral representation of ongoingpost-surgical pain. PLoS One 6(2), e17096.
Hulsebosch, C.E., Xu, G.Y., Perez-Polo, J.R., Westlund, K.N., Taylor, C.P.,McAdoo, D.J. (2000). Rodent model of chronic central pain after spinalcord contusion injury and effects of gabapentin. J Neurotrauma 17,1205–1217.
Hunter, J.C., Gogas, K.R., Hedley, L.R., Jacobson, L.O., Kassotakis, L.,Thompson, J. (1997). The effect of novel anti-epileptic drugs in ratexperimental models of acute and chronic pain. Eur J Pharmacol 324,153–160.
Iannetti, G.D., Zambreanu, L., Wise, R.G., Buchanan, T.J., Huggins, J.P.,Smart, T.S. (2005). Pharmacological modulation of pain-related brainactivity during normal and central sensitization states in humans. ProcNatl Acad Sci U S A 102, 18195–18200.
Imai, S., Saeki, M., Yanase, M., Horiuchi, H., Abe, M., Narita, M. (2011).Change in microRNAs associated with neuronal adaptive responses inthe nucleus accumbens under neuropathic pain. J Neurosci 31, 15294–15299.
Joshi, S.K., Hernandez, G., Mikusa, J.P., Zhu, C.Z., Zhong, C., Salyers, A.,Wismer, C.T., Chandran, P., Decker, M.W., Honore, P. (2006). Compari-son of antinociceptive actions of standard analgesics in attenuatingcapsaicin and nerve-injury-induced mechanical hypersensitivity. Neu-roscience 143, 587–596.
Kiebel, S.J., Poline, J.B., Friston, K.J., Holmes, A.P., Worsley, K.J. (1999).Robust smoothness estimation in statistical parametric maps using stan-dardized residuals from the general linear model. Neuroimage 10, 756–766.
B.A. Hooker et al. Gabapentin-induced pharmacodynamic effects in brain
13Eur J Pain •• (2013) ••–•• © 2013 European Federation of International Association for the Study of Pain Chapters

Kim, H., Chen, L., Lim, G., Sung, B., Wang, S., McCabe, M.F. (2012).Brain indoleamine 2,3-dioxygenase contributes to the comorbidity ofpain and depression. J Clin Invest 122, 2940–2954.
Kim, S.H., Chung, J.M. (1992). An experimental model for peripheralneuropathy produced by segmental spinal nerve ligation in the rat. Pain50, 355–363.
Lebel, A., Becerra, L., Wallin, D., Moulton, E.A., Morris, S., Pendse, G.(2008). fMRI reveals distinct CNS processing during symptomatic andrecovered complex regional pain syndrome in children. Brain 131,1854–1879.
Li, C.Y., Song, Y.H., Higuera, E.S., Luo, Z.D. (2004). Spinal dorsal horncalcium channel alpha2delta-1 subunit upregulation contributes toperipheral nerve injury-induced tactile allodynia. J Neurosci 24, 8494–8499.
Liang, Z., King, J., Zhang, N. (2011). Uncovering intrinsic connectionalarchitecture of functional networks in awake rat brain. J Neurosci 31,3776–3783.
Lo, H.S., Yang, C.M., Lo, H.G., Lee, C.Y., Ting, H., Tzang, B.S. (2010).Treatment effects of gabapentin for primary insomnia. Clin Neurophar-macol 33, 84–90.
Lopez-Sola, M., Pujol, J., Hernandez-Ribas, R., Harrison, B.J.,Contreras-Rodriguez, O., Soriano-Mas, C. (2010). Effects of duloxetinetreatment on brain response to painful stimulation in major depressivedisorder. Neuropsychopharmacology 35, 2305–2317.
Luo, Z.D., Calcutt, N.A., Higuera, E.S., Valder, C.R., Song, Y.H., Svensson,C.I. (2002). Injury type-specific calcium channel alpha 2 delta-1subunit up-regulation in rat neuropathic pain models correlates withantiallodynic effects of gabapentin. J Pharmacol Exp Ther 303, 1199–1205.
Maihofner, C., Handwerker, H.O., Birklein, F. (2006). Functional imagingof allodynia in complex regional pain syndrome. Neurology 66, 711–717.
Maleki, N., Becerra, L., Brawn, J., McEwen, B., Burstein, R., Borsook, D.(2013). Common hippocampal structural and functional changes inmigraine. Brain Struct Funct 218, 903–912.
Malinen, S., Vartiainen, N., Hlushchuk, Y., Koskinen, M., Ramkumar, P.,Forss, N. (2010). Aberrant temporal and spatial brain activity duringrest in patients with chronic pain. Proc Natl Acad Sci U S A 107, 6493–6497.
Matthews, E.A., Dickenson, A.H. (2001). Effects of spinally delivered N-and P-type voltage-dependent calcium channel antagonists on dorsalhorn neuronal responses in a rat model of neuropathy. Pain 92, 235–246.
van Meer, M.P., Otte, W.M., van der Marel, K., Nijboer, C.H., Kavelaars,A., van der Sprenkel, J.W. (2012). Extent of bilateral neuronal networkreorganization and functional recovery in relation to stroke severity. JNeurosci 32, 4495–4507.
Mills, C., LeBlond, D., Joshi, S.K., Zhu, C., Hsieh, G., Jacobson, P., Meyer,M., Decker, M. (2012). Estimating efficacy and drug ED50’s using vonfrey thresholds: Impact of Weber’s law and log transformation. J Pain13, 519–523.
Mutso, A.A., Radzicki, D., Baliki, M.N., Huang, L., Banisadr, G., Centeno,M.V. (2012). Abnormalities in hippocampal functioning with persistentpain. J Neurosci 32, 5747–5756.
Napadow, V., LaCount, L., Park, K., As-Sanie, S., Clauw, D.J., Harris, R.E.(2010). Intrinsic brain connectivity in fibromyalgia is associated withchronic pain intensity. Arthritis Rheum 62, 2545–2555.
Narita, M., Nakajima, M., Miyoshi, K., Nagumo, Y., Miyatake, M., Yajima,Y. (2007). Role of spinal voltage-dependent calcium channel alpha 2delta-1 subunit in the expression of a neuropathic pain-like state inmice. Life Sci 80, 2015–2024.
Neumann, J., Lohmann, G. (2003). Bayesian second-level analysis offunctional magnetic resonance images. Neuroimage 20, 1346–1355.
Partridge, B.J., Chaplan, S.R., Sakamoto, E., Yaksh, T.L. (1998). Charac-terization of the effects of gabapentin and 3-isobutyl-gamma-aminobutyric acid on substance P-induced thermal hyperalgesia.Anesthesiology 88, 196–205.
Paxinos, G., Watson, C. (2009). The Rat Brain in Stereotaxic Coordinates (SanDiego, CA: Academic Press).
Pendse, G.V., Schwarz, A.J., Baumgartner, R., Coimbra, A., Upadhyay, J.,Borsook, D. (2010). Robust, unbiased general linear model estimation
of phMRI signal amplitude in the presence of variation in the temporalresponse profile. J Magn Reson Imaging 31, 1445–1457.
Ploghaus, A., Narain, C., Beckmann, C.F., Clare, S., Bantick, S., Wise, R.(2001). Exacerbation of pain by anxiety is associated with activity in ahippocampal network. J Neurosci 21, 9896–9903.
Qin, S., Hermans, E.J., van Marle, H.J., Fernandez, G. (2012). Under-standing low reliability of memories for neutral information encodedunder stress: Alterations in memory-related activation in the hippocam-pus and midbrain. J Neurosci 32, 4032–4041.
Rouwette, T., Vanelderen, P., de Reus, M., Loohuis, N.O., Giele, J., vanEgmond, J. (2012). Experimental neuropathy increases limbic forebrainCRF. Eur J Pain 16, 61–71.
Son, H., Banasr, M., Choi, M., Chae, S.Y., Licznerski, P., Lee, B. (2012).Neuritin produces antidepressant actions and blocks the neuronal andbehavioral deficits caused by chronic stress. Proc Natl Acad Sci U S A 109,11378–11383.
Sullivan, M.J., Reesor, K., Mikail, S., Fisher, R. (1992). The treatment ofdepression in chronic low back pain: Review and recommendations.Pain 50, 5–13.
Sutton, K.G., Martin, D.J., Pinnock, R.D., Lee, K., Scott, R.H. (2002).Gabapentin inhibits high-threshold calcium channel currents in cul-tured rat dorsal root ganglion neurones. Br J Pharmacol 135, 257–265.
Suzuki, T., Amata, M., Sakaue, G., Nishimura, S., Inoue, T., Shibata, M.(2007). Experimental neuropathy in mice is associated with delayedbehavioral changes related to anxiety and depression. Anesth Analg 104,1570–1577.
Takemura, Y., Yamashita, A., Horiuchi, H., Furuya, M., Yanase, M.,Niikura, K. (2011). Effects of gabapentin on brain hyperactivity relatedto pain and sleep disturbance under a neuropathic pain-like state usingfMRI and brain wave analysis. Synapse 65, 668–676.
Tambeli, C.H., Fischer, L., Monaliza, S.L., Menescal-De-Oliveira, L.,Parada, C.A. (2012). The functional role of ascending nociceptivecontrol in defensive behavior. Brain Res 1464, 24–29.
Tseng, M.T., Chiang, M.C., Chao, C.C., Tseng, W.Y., Hsieh, S.T. (2012).fMRI evidence of degeneration-induced neuropathic pain in diabetes:Enhanced limbic and striatal activations. Hum Brain Mapp. doi: 10.1002/hbm.22105.
Upadhyay, J., Baker, S.J., Rajagovindan, R., Hart, M., Chandran, P.,Hooker, B.A., Cassar, S., Mikusa, J.P., Tovcimak, A., Wald, M.J., Joshi,S.K., Bannon, A., Medema, J.K., Beaver, J., Honore, P., Kamath, R.V.,Fox, G.B., Day, M. (2013). Pharmacological modulation of brain activityin a preclinical model of osteoarthritis. Neuroimage 64, 341–355.
Urban, M.O., Ren, K., Park, K.T., Cambell, B., Anker, N., Stearns, B.(2005). Comparison of the antinociceptive profiles of gabapentin and3-methylgabapentin in rat models of acute and persistent pain:Implications for mechanism of action. J Pharmacol Exp Ther 313, 1209–1216.
Van Elstraete, A.C., Sitbon, P., Mazoit, J.X., Benhamou, D. (2008). Gaba-pentin prevents delayed and long-lasting hyperalgesia induced byfentanyl in rats. Anesthesiology 108, 484–494.
Vann, S.D., Aggleton, J.P., Maguire, E.A. (2009). What does the retrosple-nial cortex do? Nat Rev Neurosci 10, 792–802.
Wang, K., van Meer, M.P., van der Marel, K., van der Toorn, A., Xu, L.,Liu, Y. (2011a). Temporal scaling properties and spatial synchronizationof spontaneous blood oxygenation level-dependent (BOLD) signal fluc-tuations in rat sensorimotor network at different levels of isofluraneanesthesia. NMR Biomed 24, 61–67.
Wang, Z., Bradesi, S., Charles, J.R., Pang, R.D., Maarek, J.M., Mayer, E.A.(2011b). Functional brain activation during retrieval of visceral pain-conditioned passive avoidance in the rat. Pain 152, 2746–2756.
Wang, Z., Pang, R.D., Hernandez, M., Ocampo, M.A., Holschneider, D.P.(2012). Anxiolytic-like effect of pregabalin on unconditioned fear in therat: An autoradiographic brain perfusion mapping and functional con-nectivity study. Neuroimage 59, 4168–4188.
Wyss, J.M., Van Groen, T. (1992). Connections between the retrosplenialcortex and the hippocampal formation in the rat: A review. Hippocampus2, 1–11.
Yoon, M.H., Choi, I.I. (2003). Hemodynamic effects of gabapentin in rats.J Korean Med Sci 18, 478–482.
Gabapentin-induced pharmacodynamic effects in brain B.A. Hooker et al.
14 Eur J Pain •• (2013) ••–•• © 2013 European Federation of International Association for the Study of Pain Chapters

Zimmerman, M.E., Pan, J.W., Hetherington, H.P., Lipton, M.L., Baigi, K.,Lipton, R.B. (2009). Hippocampal correlates of pain in healthy elderlyadults: A pilot study. Neurology 73, 1567–1570.
Supporting Information
Additional Supporting Information may be found in theonline version of this article at the publisher’s web-site:
Figure S1. PhMRI experimental paradigm. Following a15-min setup period (behavioural test performed before-hand), each animal underwent a 40-min phMRI scan. 5 minof baseline was collected followed by infusion of vehicle or75 mg/kg gabapentin. To model the phMRI signal a GLManalysis was carried out, where the main explanatory vari-able consisted of a ramp function. Further details of phMRIsignal modelling can be found in the main text and in Pendseet al., J Magn Reson Imaging, 2010. Lastly, functional connec-tivity (inter-brain region correlation analysis) was assessed atminutes 35–40 using the bandpass-filtered phMRI dataset.Figure S2. Unthresholded and ungrouped cross-correlationmatrices. Four cross-correlation matrices from each of thefour cohorts with the same axes are presented. Here ROIsfrom the left hemisphere are plotted first followed by ROIsfrom the right hemisphere. The order of the brain regionsfollows that which is presented in Supporting InformationTable S1. The two shorter diagonal lines in each matrix rep-resent left-right region pairs.
Figure S3. Functional connectivity-BOLD signal timecourses. Time courses from single subjects from each of thefour experimental conditions are plotted. Correlation (r)values between the hippocampal formation structures andacross the 4 experimental conditions are in accord with thetrends shown in the correlation matrices (Fig. 6). BOLDsignal time courses from these specific structures residing inthe hippocampal formation are displayed to further indicatehow the neuropathic pain state and gabapentin affect thefunction of this supraspinal system.Table S1. List of 54 brain ROIs that make up the imple-mented rat atlas used in phMRI and functional connectivity(correlation) analyses.Table S2. (a) Reference networks from the SNL (vehicle)condition. Networks of grey matter structures were rankedbased on average connection z-score. (b) Total connections,modularity, reference network mean degree and referencenetwork connections are provided for SNL (vehicle) and SNL(gabapentin) conditions.Table S3. (a) Reference networks from Sham (vehicle) con-dition. Networks of grey matter structures are ranked basedon average connection z-score. (b) Total connections, modu-larity, reference network mean degree and referencenetwork connections are provided for SNL (vehicle) and SNL(gabapentin) conditions.
B.A. Hooker et al. Gabapentin-induced pharmacodynamic effects in brain
15Eur J Pain •• (2013) ••–•• © 2013 European Federation of International Association for the Study of Pain Chapters

Supplemental Table 2a: Reference networks from the SNL (vehicle) condition. Networks of gray matter structures were ranked based on average connection z‐score.
Network 1 (Z‐score = 2.75) Left cingulate cortex Left claustrum Left infralimbic cortex Left primary motor cortex Left secondary motor cortex Left prelimbic cortex Right cingulate cortex Right claustrum Right infralimbic cortex Right primary motor cortex Right secondary motor cortex Right prelimbic cortex Network 2 (Z‐score = 2.48) Left nucleus accumbens Left diagonal band Left medial septum Left olfactory Right nucleus accumbens Right diagonal band Right medial septum Right olfactory Network 3 (Z‐score = 2.46) Left CA1 field of the Hippocampus Left CA3 field of the Hippocampus Left dentate gyrus Left primary somatosensory cortex Left secondary somatosensory cortex Right CA1 field of the Hippocampus Right CA3 field of the Hippocampus Right dentate gyrus Right primary somatosensory cortex Right secondary somatosensory cortex Right septofimbrial nucleus Network 4 (Z‐score = 2.36) Left ventral CA1 Left ventral dentate gyrus Left ventral subiculum Right cerebellum Right entorhinal cortex Right perirhinal cortex Right ventral CA1 Right ventral dentate gyrus Right ventral subiculum Network 5 (Z‐score = 2.35) Left caudate‐putamen Left globus pallidus Left lateral septum Left substantia innominata Right caudate‐putamen Right globus pallidus Right lateral septum Right substantia innominata Right stria terminalis
1

Network 6 (Z‐score = 2.25) Left anteroventral thalamic nucleus Left hypothalamus Left laterodorsal thalamic nucleus Left lateral habenula Left thalamus Left ventrolateral thalamic nucleus Left ventromedial hypothalamic nucleus Right ventromedial thalamic nucleus Right anteroventral thalamic nucleus Right hypothalamus Right laterodorsal thalamic nucleus Right lateral habenula Right thalamus Right ventrolateral thalamic nucleus Right ventromedial hypothalamic nucleus Right ventromedial thalamic nucleus Network 7 (Z‐score = 2.06) Left cerebellum Left cortex (other) Left entorhinal cortex Left perirhinal cortex Left retrosplenial cortex Left subiculum Left primary visual cortex Left secondary visual cortex Right cortex Right retrosplenial cortex Right subiculum Right primary visual cortex Right secondary visual cortex
2

3
Supplemental Table 2b: Total connections, modularity, reference network mean degree and reference network connections are provided for SNL (vehicle) and SNL (gabapentin) conditions.
SNL (Vehicle)
Total Connections: 1264
Modularity: 0.183554
Reference Network Mean Degree Connections
1 5.5 66
2 2.5 20
3 6.4 96
4 3.666667 33
5 3.222222 29
6 6 108
7 5.153846 67 SNL (Gabapentin)
Total Connections: 1064
Modularity: 0.181698
Reference Network Mean Degree Connections
1 3.75 45
2 2 16
3 6.2 93
4 2 18
5 3.888889 35
6 6.388889 115
7 4.076923 53

Supplemental Table 1: List of 54 brain ROIs that make up the implemented rat atlas used in phMRI and functional connectivity (correlation) analyses.
nucleus accumbens
anteroventral thalamic nucleus
amygdala
basolateral amygdaloid nucleus
CA1 field of the Hippocampus
CA3 field of the Hippocampus
cingulate cortex
caudoputamen (striatum)
cerebellum
claustrum
cortex
diagonal band
dentate gyrus
entorhinal cortex
frontal association cortex
globus pallidus
hypothalamus
infralimbic cortex
laterodorsal thalamic nucleus
lateral habenula
lacunosum moleculare layer of the hippocampus
lateral septum
primary motor cortex
secondary motor cortex
midbrain
medial septum
periaqueductal gray
perirhinal cortex
pons
prelimbic cortex
retrosplenial cortex
subiculum
primary somatosensory cortex
secondary somatosensory cortex
septofimbrial nucleus
substantia innominata
substantia nigra
Bed nucleus of the stria terminalis
thalamus
triangular septum
primary visual cortex
secondary visual cortex
ventral CA1
ventral CA3
ventral dentate gyrus
ventrolateral thalamic nucleus
ventromedial hypothalamic nucleus

ventromedial thalamic nucleus
ventral subiculum
ventral tegmental area
corpus callosum
olfactory
ventricles
white matter

Supplemental Fig. 2. Unthresholded and Ungrouped Cross‐Correlation Matrices. 4 cross‐correlation matrices from each of the 4 cohorts with the same axes are presented. Here ROIs from the left hemisphere are plotted first followed by ROIs from the right hemisphere. The rder of the brain regions follows that which is presented in Supplemental Table 1. The two horter diagonal lines in each matrix represent left‐right region pairs. os

Supplemental Fig. 1. PhMRI Experimental Paradigm. Following a 15‐minute setup period (behavioral test performed beforehand), each animal underwent a 40‐minute phMRI scan. 5 minutes of baseline were collected followed by infusion of vehicle or 75 mg/kg gabapentin. To model the phMRI signal a GLM analysis was carried out, where the main explanatory variable consisted of a ramp function. Further details of phMRI signal modeling can be found in the main text and in Pendse et al., J Magn Reson Imaging, 2010. Lastly, functional connectivity (inter‐rain region correlation analysis) was assessed at minutes 35‐40 using the bandpass‐filtered hMRI dataset.
bp

Supplemental Table 3a: Reference networks from Sham (vehicle) condition. Networks of gray matter structures are ranked based on average connection z‐score.
Network 1 (Z‐score = 2.22) Left nucleus accumbens Left diagonal band Left medial septum Left olfactory Right nucleus accumbens Right diagonal band Right medial septum Right olfactory Network 2 (Z‐score = 2.18) Left cerebellum Left cortex (other) Left entorhinal cortex Left midbrain Left perirhinal cortex Left subiculum Left primary visual cortex Left secondary visual cortex Right cerebellum Right midbrain Right primary visual cortex Right secondary visual cortex Network 3 (Z‐score = 1.94) Left ventral CA1 Left ventral dentate gyrus Left ventral subiculum Right cortex (other) Right entorhinal cortex Right perirhinal cortex Network 4 (Z‐score = 1.91) Left globus pallidus Left hypothalamus Left substantia innominata Left stria terminalis Right globus pallidus Right hypothalamus Right substantia innominata Right stria terminalis Network 5 (Z‐score = 1.90) Left anteroventral thalamic nucleus Left amygdala Left basolateral amygdaloid nucleus Left laterodorsal thalamic nucleus Left lateral habenula Left thalamus Left ventrolateral thalamic nucleus Left ventromedial thalamic nucleus Right anteroventral thalamic nucleus Right laterodorsal thalamic nucleus Right lateral habenula Right thalamus Right ventrolateral thalamic nucleus Right ventromedial thalamic nucleus Network 6 (Z‐score = 1.84) Left caudoputamen (striatum) Left lateral septum Left primary motor cortex Left retrosplenial cortex

Left primary somatosensory cortex Left secondary somatosensory cortex Right caudoputamen (striatum) Right lateral septum Right primary motor cortex Right retrosplenial cortex Right subiculum Right primary somatosensory cortex Right secondary somatosensory cortex Right septofimbrial nucleus Network 7 (Z‐score = 1.79) Left CA1 field of the Hippocampus Left CA3 field of the Hippocampus Left dentate gyrus Right CA1 field of the Hippocampus Right CA3 field of the Hippocampus Right dentate gyrus
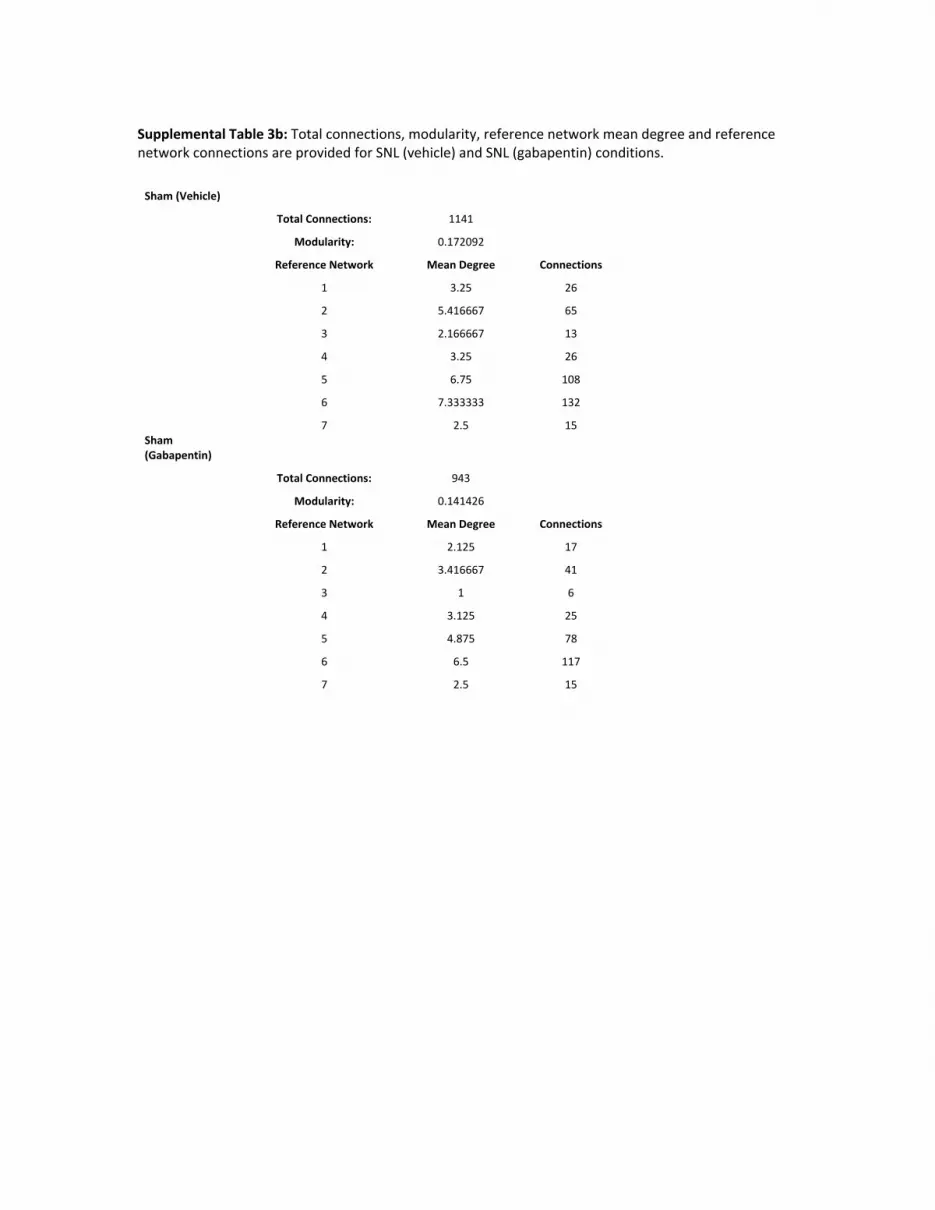
Supplemental Table 3b: Total connections, modularity, reference network mean degree and reference network connections are provided for SNL (vehicle) and SNL (gabapentin) conditions.
Sham (Vehicle)
Total Connections: 1141
Modularity: 0.172092
Reference Network Mean Degree Connections
1 3.25 26
2 5.416667 65
3 2.166667 13
4 3.25 26
5 6.75 108
6 7.333333 132
7 2.5 15 Sham (Gabapentin)
Total Connections: 943
Modularity: 0.141426
Reference Network Mean Degree Connections
1 2.125 17
2 3.416667 41
3 1 6
4 3.125 25
5 4.875 78
6 6.5 117
7 2.5 15


