Embed Size (px)
Citation preview
arX
iv:1
002.
4626
v2 [
astr
o-ph
.CO
] 2
Jul 2
010
Mon. Not. R. Astron. Soc.000, (2010) Printed 5 July 2010 (MN LATEX style file v2.2)
Galaxy Counterparts of metal-rich Damped Lyman-α Absorbers - I:The case of thez = 2.35 DLA towards Q 2222−0946⋆⋆
J. P. U. Fynbo1†, P. Laursen1, C. Ledoux2, P. Møller3, A. K. Durgapal4, P. Goldoni5,6,B. Gullberg1, L. Kaper7, J. Maund1, P. Noterdaeme8, G. Ostlin9,10, M. L. Strandet1,S. Toft1, P. M. Vreeswijk1, T. Zafar11Dark Cosmology Centre, Niels Bohr Institute, Copenhagen University, Juliane Maries Vej 30, 2100 Copenhagen O, Denmark2European Southern Observatory, Alonso de Cordova 3107, Casilla 19001, Vitacura, Santiago 19, Chile3European Southern Observatory, Karl-Schwarzschildstrasse 2, D-85748 Garching, Germany4Department of Physics, DSB Campus, Kumaun University, Nainital, Uttarakhand, India5Laboratoire Astroparticule et Cosmologie, 10 rue A. Domon et L. Duquet, F-75205 Paris Cedex 13, France6Service d’Astrophysique, DSM/DAPNIA/SAp, CEA-Saclay, F-91191 Gif-sur-Yvette, France7Astronomical Institute ”Anton Pannekoek”, University of Amsterdam, Kruislaan 403, 1098 SJ Amsterdam, The Netherlands8Departamento de Astronomıa, Universidad de Chile, Casilla 36-D, Santiago, Chile9Department of Astronomy, Stockholm University, AlbaNova University Center, 10691 Stockholm, Sweden10Oscar Klein Centre for Cosmoparticle Physics, Department of Astronomy, Stockholm University, Stockholm, Sweden
Accepted . Received ; in original form
ABSTRACTWe have initiated a survey using the newly commissioned X-shooter spectrograph to tar-get candidate relatively metal-rich damped Lyman-α absorbers (DLAs). Our rationale is thathigh-metallicity DLAs due to the luminosity-metallicity relation likely will have the mostluminous galaxy counterparts. In addition, the spectral coverage of X-shooter allows us tosearch for not only Lyman-α (Lyα) emission, but also rest-frame optical emission lines. Wehave chosen DLAs where the strongest rest-frame optical lines ([OII], [OIII], Hβ and Hα)fall in the NIR atmospheric transmission bands. In this firstpaper resulting from the survey,we report on the discovery of the galaxy counterpart of thezabs = 2.354 DLA towards thez = 2.926 quasar Q 2222−0946. This DLA is amongst the most metal-richz > 2 DLAsstudied so far at comparable redshifts and there is evidencefor substantial depletion of re-fractory elements onto dust grains. We measure metallicities from ZnII, SiII, NiII, MnII andFeII of −0.46 ± 0.07, −0.51 ± 0.06, −0.85 ± 0.06, −1.23 ± 0.06, and−0.99 ± 0.06, re-spectively. The galaxy is detected in the Lyα, [OIII] λ4959,λ5007 and Hα emission lines atan impact parameter of about 0.8 arcsec (6 kpc atzabs = 2.354). Based on the Hα line, weinfer a star-formation rate of 10M⊙ yr−1, which is a lower limit due to the possibility of slit-loss. Compared to the recently determined Hα luminosity function forz = 2.2 galaxies theDLA-galaxy counterpart has a luminosity ofL ∼ 0.1L∗
Hα. The emission-line ratios are 4.0
(Lyα/Hα) and 1.2 ([OIII]/Hα). In particular, the Lyα line shows clear evidence for resonantscattering effects, namely an asymmetric, redshifted (relative to the systemic redshift) com-ponent and a much weaker blueshifted component. The fact that the blueshifted component isrelatively weak indicates the presence of a galactic wind.
The properties of the galaxy counterpart of this DLA is consistent with the prediction thatmetal-rich DLAs are associated with the most luminous of theDLA-galaxy counterparts.
Key words: galaxies: formation, galaxies: high-redshift, galaxies:ISM, quasars: absorptionlines, cosmology: observations
⋆ Based on observations carried out at the European Organisation for As-tronomical Research in the Southern Hemisphere, Chile, under ESO pro-gram 084.A-0303(A).† E-mail: [email protected]
1 INTRODUCTION
A central aspect of the history of the Universe is the formation andevolution of galaxies, and in particular their gradual build-up ofmetallicity (Pei & Fall 1995; Cen & Ostriker 1999; Pettini 2006;Sommer-Larsen & Fynbo 2008). While the study of galaxies in the
2 J. P. U. Fynbo et al.
early universe has seen great progress through the identification oflarge samples ofz & 3 Lyman-Break Galaxies (LBGs) and otheremission-selected galaxies (e.g., Steidel et al. 1996, 2004; Bouwenset al. 2009), the study of the metals at the same cosmic epoch hasseen equally large progress but mostly based on the study ofz & 2DLAs in the sightlines towards bright quasars (e.g., Wolfe et al.2005; Pontzen & Pettini 2009). Thanks to the SDSS the sample ofhigh-redshift DLAs is now larger than 1000 (Prochaska et al.2005;Noterdaeme et al. 2009). In order to be able to form a completepicture of galaxy evolution one must find a way to combine the in-formation inferred from high-redshift galaxies studied inemissionand absorption, and it is a perplexing fact that there is almost noobservationaloverlap between the two samples (e.g., Fynbo et al.1999; Møller et al. 2002).
It is not obvious how one may combine the two samples be-cause they have very different selection biases. LBG samples areall flux-limited, and therefore they carry information onlyabout ob-jects at the bright end of the luminosity function. DLAs are selectedbased on the probability that a random sightline passes through it,and they are therefore selected with a weight proportional to theabsorption cross-section (area) they span on the sky. This area isknown, locally, to scale with the luminosity to a given power(theso-called Holmberg and Bosma relations; Wolfe et al. 1986 andreferences therein; see also Zwaan et al. 2005). On the reasonableassumption that similar relations were in place atz = 3, and com-bining this with the slope of the faint end of the UV luminosityfunction, one finds that most DLAs are selected from the faintendof the luminosity function (Fynbo et al. 1999, 2008; Haehnelt etal. 2000; Schaye 2001; Pontzen et al. 2008). Hence, the plausibleconnection between DLAs and LBGs is that they are drawn fromthe same overall population of high-z galaxies but that in the meanthey are picked from two opposite ends of the high-z galaxy UVluminosity function.
To better establish the validity of this picture, more detec-tions of DLAs in emission are required. Detection of emission fromDLAs has been vigorously pursued for more than 20 years (e.g.,Smith et al. 1989), but with limited success. Since 1993 onlytwobona-fide high-redshift DLA galaxies have been detected in emis-sion (Møller et al. 2002, 2004; Heinmuller et al. 2006). In addition,counterparts of eitherzabs ≈ zem DLAs or sub-DLAs have beenpublished (Møller & Warren 1993, 1998; Warren & Møller 1996;Djorgovski et al. 1996; Leibundgut & Robertson 1999; Fynbo etal. 1999; Adelberger et al. 2006). At least ten times more systemshave been searched for in emission with no detection (e.g., Charlot& Fall 1991 and references therein; Lowenthal et al. 1995; Colbert& Malkan 2002; Kulkarni et al. 2006). In addition to published non-detections many non-detections have not been published, e.g., non-detections in the survey conducted with FORS 1 at the VLT 1999–2000 (PI Møller), and the FLAMES/IFU survey also conducted atthe VLT 2003–2005 (PIs Leibundgut and Zwaan)). More recently,tentative detections based on integral-field unit spectrographs havebeen reported (Christensen et al. 2007) and one of these has beenconfirmed with long-slit spectroscopy (Christensen, private com-munication). The low success rate has been thought to be the resultof attenuation of Lyα photons by dust grains (Charlot & Fall 1991),but as discussed above it is also plausibly explained in terms of theprediction that DLA galaxies must in the mean be drawn from thefaint end of the luminosity function.
Møller et al. (2004) and Ledoux et al. (2006) provide evi-dence that DLA galaxies obey luminosity-metallicity and velocity-metallicity relations with similar slopes as in the local Universe.Moreover, the DLA galaxies that have been detected in emission
(both Lyα, broad band, and for those with redshifts in a range al-lowing observations in NIR atmospheric windows, also in [OIII]emission) are amongst the most metal-rich DLAs (Møller et al.2004; Weatherley et al. 2005). Fynbo et al. (2008) describe amodelthat reconciles the known properties of DLAs, LBGs and alsoGamma-Ray Burst host galaxies based on scaling relations knownfrom the local Universe (Luminosity Function, Holmberg/Bosmarelation, luminosity-metallicity relation and metallicity gradients).There is no doubt that reality is more complex than this simplepicture (see, e.g., Zwaan et al. 2008 and Tescari et al. 2009 for adiscussion of the likely importance of galactic winds for the kine-matical properties of DLAs). Nevertheless, the basic ingredients inthis picture have been found also in hydrodynamical simulations ofDLAs at z ≈ 3 (Pontzen et al. 2008).
To test this picture, we have embarked on a survey target-ing high-metallicity DLAs in order to search for the galaxy coun-terparts. The project is carried out using our guaranteed time onthe newly commissioned X-shooter spectrograph on the EuropeanSouthern Observatory (ESO) Very Large Telescope (VLT) on CerroParanal in Chile. X-shooter is an echelle spectrograph withthreearms covering the full spectral range from the atmospheric cut-offaround 2950A to the K-band. From the SDSS DLA sample of No-terdaeme et al. (2009), we have selected DLAs with a rest-frameequivalent width (EW) of the SiIIλ1526 line larger than 1A. Thisis a good indication that the metallicity is high, i.e. likely largerthan 0.1 solar (e.g., Prochaska et al. 2008, their figure 6; Kaplanet al. 2010). Among these DLAs, we selected the subsample withwell-detected FeIIλ2344,λ2374, andλ2382 lines. For local star-burst galaxies, the strength of the Lyα emission line is controlledby a complex interplay between geometry, kinematical propertiesof the gas and dust content (see, e.g., Atek et al. 2009 and refer-ences therein). For this reason, we only include DLAs with red-shifts close to 2.4 which places the Hβ, [OII], [OIII] and/or Hαemission lines from the intervening DLA in the NIR transmis-sion windows. At these redshifts, the spectral range covered by X-shooter extends from the Lyman-limit to Hα and we are not relyingon Lyα alone for detecting the galaxy counterpart. In this paper, wereport on the first target observed in the program, namely SDSSJ 222256.11−094636.2 (Q 2222−0946 in the following), whichhas an intervening DLA at a redshift ofzabs = 2.354 (Noterdaemeet al. 2009).
Throughout this paper, we assume a flat cosmology withΩΛ = 0.70, Ωm = 0.30, and a Hubble constant ofH0 = 70km s−1 Mpc−1.
2 STRATEGY AND OBSERVATIONS
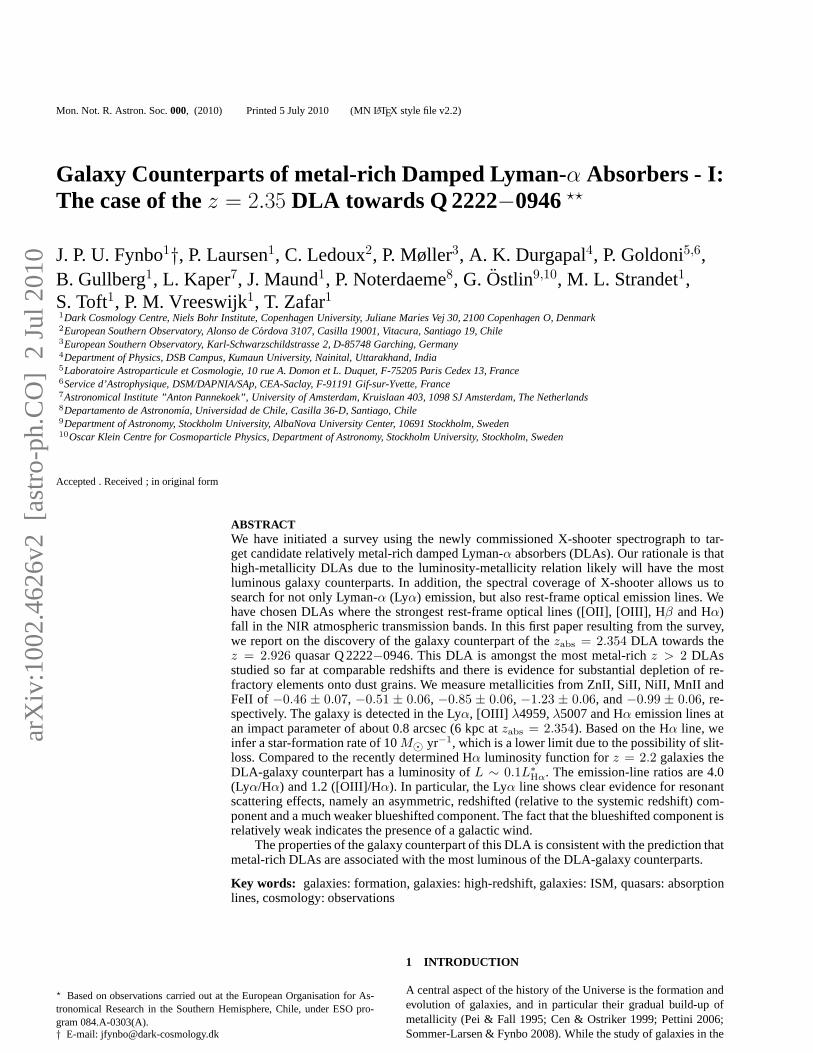
Q 2222−0946 was observed on October 21 2009 with X-shooter.Our strategy was to observe the QSO at the position angles (PAs)60o, −60o, and 0o (all East of North), 1 hr each, using a 1.3 arcsecslit in the UVB arm and 1.2 arcsec slits in the VIS and NIR arms.The resulting resolving powers are 4700 (UVB), 6700 (VIS), and4400 (NIR) respectively (as measured from sky lines in the spec-tra). With this strategy, we cover the field of view close to the QSOand will be able to determine the impact parameter and positionangle of galaxy counterparts using triangulation (see Møller et al.2004 for an example of such a triangulation). Based on the modelby Fynbo et al. (2008) mentioned above, we predict that less than10% of the galaxy counterparts will fall outside all three slits (seeFig. 1). With a full-drawn rectangle, we illustrate the fieldcoveredby the X-shooter IFU. With a single IFU pointing centred on the
Galaxy Counterparts of metal-rich DLAs 3
QSO, 30% of the DLA-galaxy centres will be lost. We prefer to uselong slits as this strategy provides superior data for the QSO itselfand the data analysis is more robust.
Due to an error in the execution of our Observing Blocks atthe telescope, the object was observed twice at PA= 0o and onceat PA= −60o. Hence, we did not get a spectrum at PA= 60o. Theobserving conditions were variable with a seeing degradingfrom0.8 to 1.6 arcsec (as measured in the B-band). The airmass rangedfrom 1.0 to 1.2 and there were no clouds.
We processed the spectra using a preliminary version of the X-shooter data reduction pipeline (Goldoni et al. 2006). The pipelineperforms the following actions. First, the raw frames are correctedfor the bias level (UVB and VIS) and dark current (NIR). Then,after background subtraction, cosmic ray hits are detectedand cor-rected using the method developed by van Dokkum (2001) and skyemission lines are subtracted using the Kelson (2003) method. Af-ter division by the flat field, the orders are extracted and rectifiedin wavelength space using a wavelength solution previouslyob-tained from calibration frames. The orders are then merged andin the overlapping regions the merging is weighted by the errorswhich are being propagated in the process. From the resulting 2Dmerged spectrum, a one-dimensional spectrum is extracted at thesource’s position. The one-dimensional spectrum with the corre-sponding error file and bad-pixel map is the final product of thereduction. Intermediate products such as the sky spectrum and in-dividual echelle orders (with errors and bad-pixel maps) are alsoproduced.
To perform flux calibration, we extracted with the same pro-cedures a spectrum of the flux standard BD +17o 4708 (Bohlin &Gilliland 2004). This spectrum was divided by the flux table ofthe same star from the CALSPEC HST database (Bohlin 20071) toproduce the response function. The response was then interpolatedwhere needed in the atmospheric absorption bands in the VIS andNIR spectra and applied to the spectrum of the source. No telluriccorrection was applied. We compare our flux calibration to the fluxcalibrated spectrum from the Sloan survey (Adelman-McCarthy etal. 2009) and find that our calibration gives 30% larger fluxescom-pared to the Sloan calibration, but the shapes of the two spectramatch very well. We have chosen to rescale our spectrum so that ismatches the Sloan spectrum.
3 RESULTS
3.1 Emission properties of the DLA-galaxy counterpart
We clearly detect Lyα emission in the DLA trough in all three in-dividual spectra. The strongest component of the Lyα emission inthe twoPA = 0o spectra is clearly asymmetric and redshifted by∼200 km s−1 relative to the redshift of low-ionisation absorptionlines (see below). There is also a weak, but significantly detected,component blueshifted by a similar amount (see Fig. 7 below). Theimpact parameter in these spectra is0.57 ± 0.03 arcsec. From thePA = −60o spectrum, which has been taken under the worst see-ing, we measure a redshift which is consistent with the measure-ment from thePA = 0o spectra. The maximum velocity shift wecan expect with a dispersion of 0.25A per pixel and a slit width of9 pixels is about 2.3A, which at the wavelength of Lyα would cor-respond to 170 km s−1. The impact parameter in thePA = −60o
spectrum is−0.20 ± 0.10 arcsec. From just two position angles
1 http://www.stsci.edu/hst/observatory/cdbs/calspec.html
-6 -4 -2 0 2 4 6RA [arcsec]
-6
-4
-2
0
2
4
6
Dec
l [ar
csec
]
-2 -1 0 1 2RA [arcsec]
-2
-1
0
1
2
Dec
l [ar
csec
]
Figure 1.Left panel:A simulation based on the model in Fynbo et al. (2008)on how many DLA-galaxy counterparts with metallicities above 0.1 solarwill be missed by our three X-shooter slit positions. In thiscoordinate sys-tem, the background QSO is located in the origo. The three slits are markedwith dashed lines and the centres of 5000 simulated DLA-galaxy counter-parts are marked with blue (if inside one of the slits) or red (if they falloutside all three slits). Slightly above 90% of the galaxy centres are cov-ered by at least one slit. In the upper right corner, we show the size ofthe seeing disk for a seeing of 0.8 arcsec. Due to seeing, substantial fluxwill be detected even for some galaxies with centres outsideof our slits.The full-drawn rectangle illustrates the field-of-view of the X-shooter IFU.Right panel:Here we show the triangulation of the DLA-galaxy counter-part towards Q 2222−0946. The dashed lines again show thePA = 0o
andPA = −60o slits. The position of the QSO is marked with a starand the seeing (in the B-band) for the three spectra are illustrated with bluecircles. The dotted lines mark the 1σ regions for the measured impact pa-rameter in the two slits. The overlapping region lies close to the edge ofboth slits (formally outside thePA = −60o slit) at a position angle of 40o
and with an impact parameter of 0.8 arcsec.
PA=0o 2 arcsec
PA=−60o
4020 4040 4060 4080 4100 4120Wavelength [Å]
0.0
0.2
0.4
0.6
0.8
1.0
Nor
mal
ised
flux
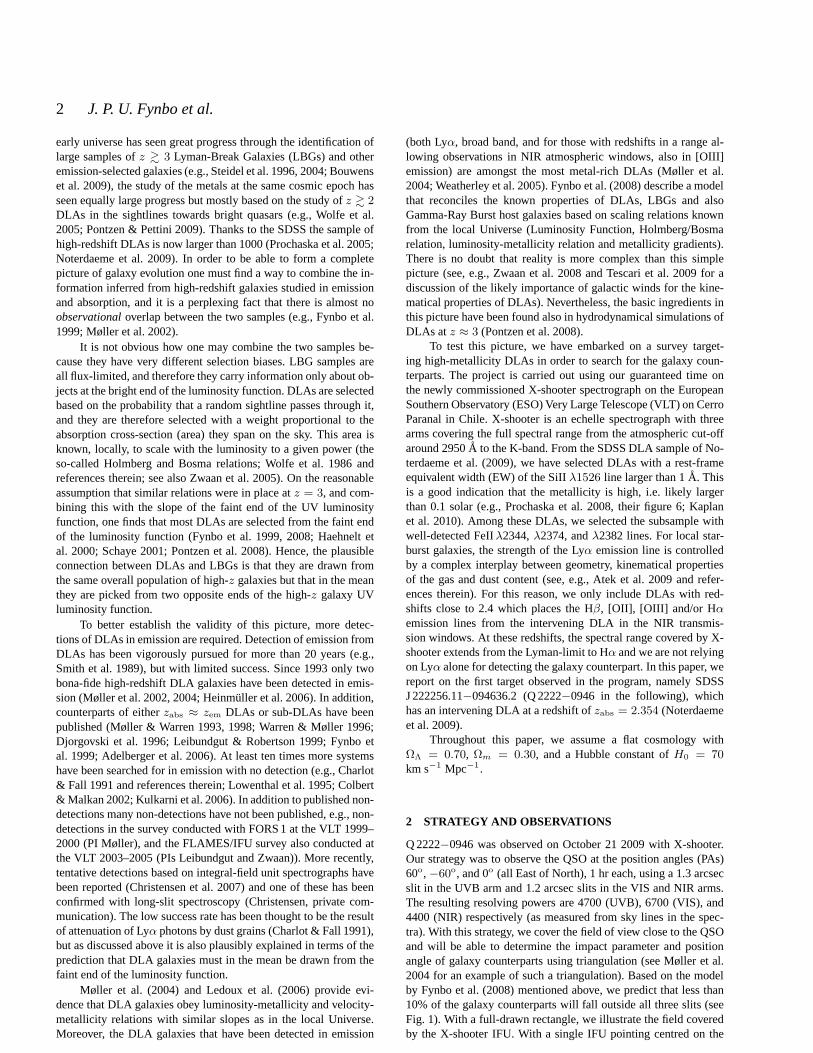
Figure 2.The damped Lyman-α absorption line in one and two dimensions.The upper two plots show the two-dimensional spectra from the PA =
0o spectrum taken under the best seeing and thePA = −60o spectrum.The Lyα emission from the DLA-galaxy counterpart is seen close to thered wing of the DLA line offset by 0.57 arcsec above the QSO trace inthe PA = 0o spectrum and 0.20 arcsec below the trace in thePA =
−60o spectrum. In the lower plot, we show the one-dimensional spectrumcombining all three spectra. The noise spectrum is plotted as a dotted line.The dashed line shows the result of a Voigt-profile fit to the DLA line fromwhich a column density oflogN = 20.65 ± 0.05 is inferred. The Lyαemission in the trough is indicated with an arrow. Note that in this one-dimensional spectrum the Lyα emission is not entirely recovered as thespectrum is extracted from the combined QSO spectrum along the QSOtrace and the Lyα emission is spatially offset from the QSO trace.
4 J. P. U. Fynbo et al.
PA=0o
1.677 1.678 1.679 1.680 1.681 1.682Wavelength [µm]
PA=0o
PA=0o
PA=−60o
PA=0o
PA=−60o
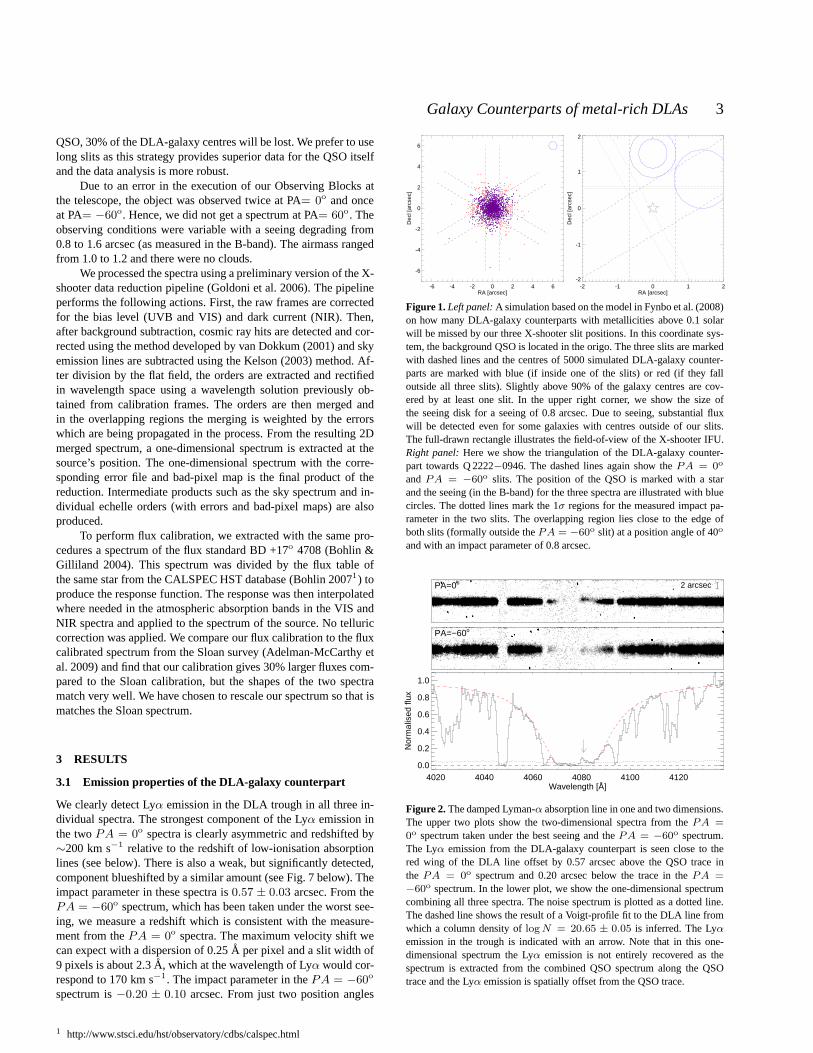
Figure 3. The [OIII] λ5007 emission line from the DLA-galaxy counter-part. The upper three figures show the two-dimensional spectra after SPSFsubtraction of the QSO continuum. The position of the QSO trace (whichhas been subtracted) is marked by a horizontal dashed line. In the bottompanel, we plot the one-dimensional spectrum from each of theabove threespectra with dotted, full-drawn and dot-dashed lines. The vertical dashedline shows the predicted position of the [OIII] line from theredshift de-termined from low-ionisation absorption lines. The horizontal dashed lineindicates the zero-flux level. The spectra have been rescaled to have thesame peak count-level.
PA=0o
PA=0o
PA=−60o
2.199 2.200 2.201 2.202 2.203 2.204Wavelength [µm]
PA=0o
PA=0o
PA=−60o
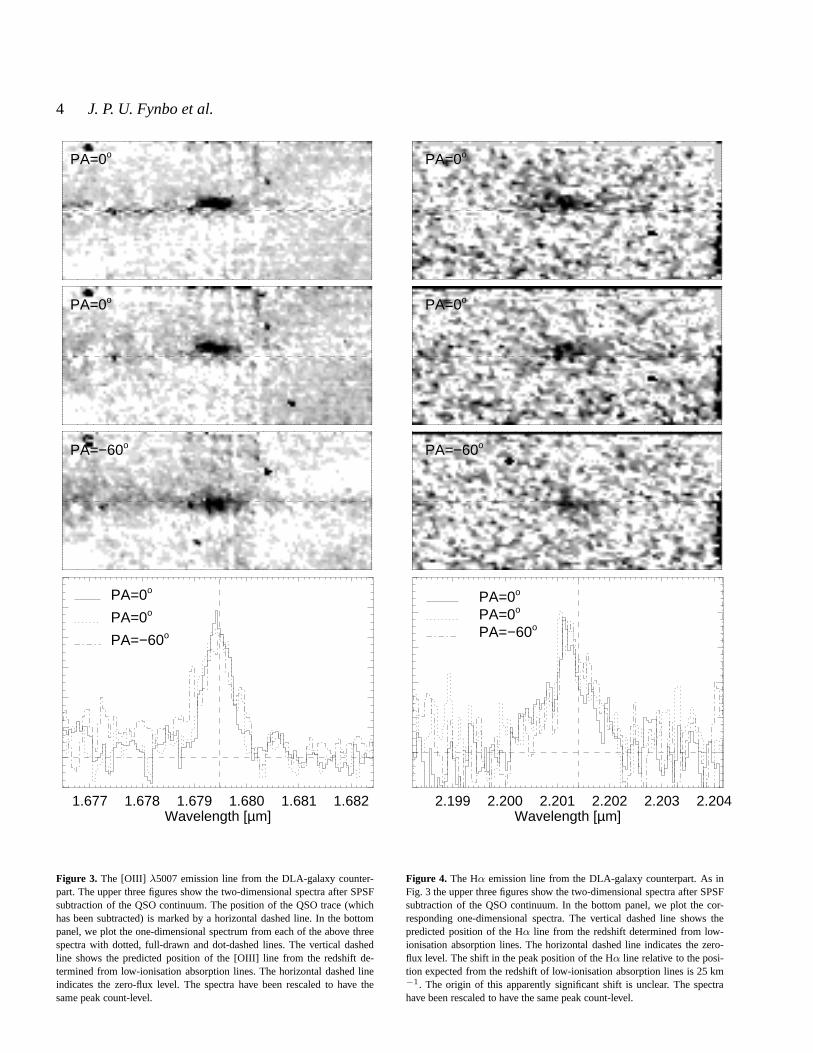
Figure 4. The Hα emission line from the DLA-galaxy counterpart. As inFig. 3 the upper three figures show the two-dimensional spectra after SPSFsubtraction of the QSO continuum. In the bottom panel, we plot the cor-responding one-dimensional spectra. The vertical dashed line shows thepredicted position of the Hα line from the redshift determined from low-ionisation absorption lines. The horizontal dashed line indicates the zero-flux level. The shift in the peak position of the Hα line relative to the posi-tion expected from the redshift of low-ionisation absorption lines is 25 km−1. The origin of this apparently significant shift is unclear.The spectrahave been rescaled to have the same peak count-level.
Galaxy Counterparts of metal-rich DLAs 5
it is not always possible to uniquely triangulate the position of thegalaxy counterpart. However, in this case we can obtain a fairly se-cure position (see right panel of Fig. 1). The DLA galaxy mustbelocated at an impact parameter of∼0.8 arcsec and at a position an-gle of ∼ 40o. As the seeing (as measured around the wavelengthof the redshift Lyα line) degraded substantially from the first (0.8arcsec) to the last spectrum (1.6 arcsec) we cannot get an additionalconstraint from comparing the counts in the line to the QSO con-tinuum (this ratio is close to constant in all three spectra).
Integrating over the line profile, we derive a flux off =10.0 × 10⁻¹⁷ erg s−1 cm−2 in the best of our three spectra (seeTable 1). This constitutes a lower limit to the total flux due to slit-loss. The corresponding Lyα luminosity isL = 4.3×1042 erg s−1.Converting this to a star-formation rate (SFR) using standard case-B recombination theory and the relation between Hα luminosityand SFR from Kennicutt (1998) gives SFR= 4M⊙ yr−1.
To search for rest-frame optical emission lines, we carriedoutSpectral Point Spread Function (SPSF) subtraction of the QSO light(see Møller 2000). We do this by locating spectral regions free ofsky emission lines on each side of the expected positions of the rest-frame optical emission lines. Over these regions, we calculate theaverage SPSF. We then subtract the SPSF over the spectral regioncovering the emission line by assuming that the QSO spectrumcanbe fitted by a linear function across the position of the emissionline. The [OIII] λ4959,λ5007, and Hα emission lines are locatedin regions free of sky lines in the H- and K-bands. After SPSF sub-traction, we clearly detect the [OIII]λ5007 line in bothPA = 0o
spectra and in thePA = −60o spectrum (see Fig. 3). The redshiftof the [OIII] λ5007 line iszabs = 2.35406. This is consistent withthe redshift of low-ionisation absorption lines (see below) withinthe error, which is. 5 km s−1. The Full Width at Half Maximum(FWHM) of the [OIII] emission line is 105 km s−1, which meansthat the line is reasonably well resolved. Correcting for the instru-mental resolution, the intrinsic width of the line is∼80 km s−1.The impact parameters measured from the [OIII] lines are consis-tent within about 10% with what is measured from the Lyα line.
For the flux of the [OIII]λ5007 line, we measuref = 3.1 ×
10−17 erg s−1 cm−2 in the best of our three spectra (see Table 1),which corresponds to a luminosity ofL = 1.3 × 1042 erg s−1
similar to the luminosities of the other two DLAs detected in[OIII](Weatherley et al. 2005). We also clearly detect the [OIII]λ4959emission line, but as expected at lower significance.
The Hα line is detected in the K-band in all three spectra, butat significantly lower S/N ratio than the [OIII] line. In Fig.4, weshow the line in each of our three spectra. For the Hα line, wemeasure a flux off = 2.5 × 10⁻¹⁷ erg s−1 cm−2, which corre-sponds to a luminosity ofL = 1.1 × 1042 erg s−1 and SFR= 10M⊙ yr−1 again using the relation between SFR and Hα luminos-ity from Kennicutt (1998). The ratio between the [OIII] and Hαluminosities is 1.2, in good agreement with the estimate of Weath-erley et al. (2005) based on the models of Kewley & Dopita (2002).The ratio between the Lyα and Hα luminosities is 4.0 whilst a ratioof about 8.7 is expected from case-B recombination. This suggeststhat about 55% of the Lyα photons are either destroyed by dust orthat most of the Lyα emission is emitted in other directions due toradiative transfer effects. In general, scattering effects cause a quiteanisotropic escape of Lyα; Laursen et al. (2009b) find that Lyαemitters on average will be 2–4 times more luminous when viewedfrom the brightest direction compared to when viewed from theleast luminous direction.
Unfortunately, one of the components of the [OII] doublet andthe Hβ line are located on top of bright sky emission lines. We place
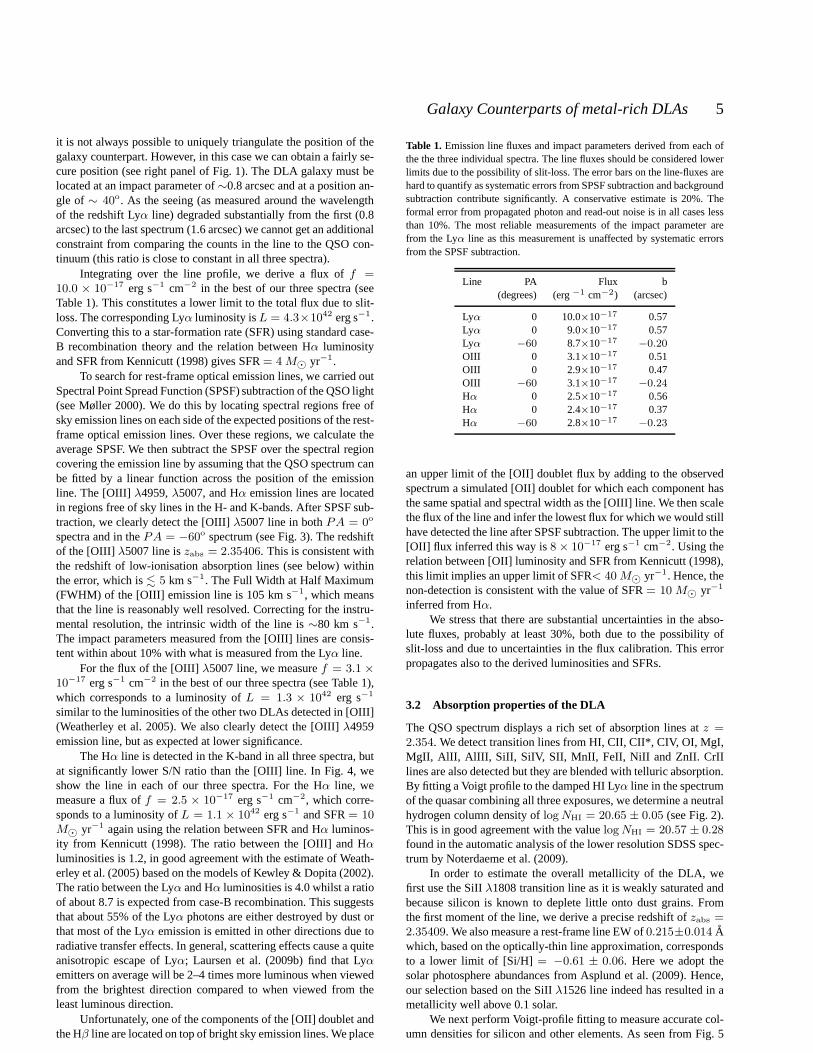
Table 1. Emission line fluxes and impact parameters derived from eachofthe the three individual spectra. The line fluxes should be considered lowerlimits due to the possibility of slit-loss. The error bars onthe line-fluxes arehard to quantify as systematic errors from SPSF subtractionand backgroundsubtraction contribute significantly. A conservative estimate is 20%. Theformal error from propagated photon and read-out noise is inall cases lessthan 10%. The most reliable measurements of the impact parameter arefrom the Lyα line as this measurement is unaffected by systematic errorsfrom the SPSF subtraction.
Line PA Flux b(degrees) (erg−1 cm−2) (arcsec)
Lyα 0 10.0×10⁻¹⁷ 0.57Lyα 0 9.0×10⁻¹⁷ 0.57Lyα −60 8.7×10⁻¹⁷ −0.20
OIII 0 3.1×10⁻¹⁷ 0.51OIII 0 2.9×10⁻¹⁷ 0.47OIII −60 3.1×10⁻¹⁷ −0.24
Hα 0 2.5×10⁻¹⁷ 0.56Hα 0 2.4×10⁻¹⁷ 0.37Hα −60 2.8×10⁻¹⁷ −0.23
an upper limit of the [OII] doublet flux by adding to the observedspectrum a simulated [OII] doublet for which each componenthasthe same spatial and spectral width as the [OIII] line. We then scalethe flux of the line and infer the lowest flux for which we would stillhave detected the line after SPSF subtraction. The upper limit to the[OII] flux inferred this way is8× 10−17 erg s−1 cm−2. Using therelation between [OII] luminosity and SFR from Kennicutt (1998),this limit implies an upper limit of SFR< 40M⊙ yr−1. Hence, thenon-detection is consistent with the value of SFR= 10 M⊙ yr−1
inferred from Hα.We stress that there are substantial uncertainties in the abso-
lute fluxes, probably at least 30%, both due to the possibility ofslit-loss and due to uncertainties in the flux calibration. This errorpropagates also to the derived luminosities and SFRs.
3.2 Absorption properties of the DLA
The QSO spectrum displays a rich set of absorption lines atz =2.354. We detect transition lines from HI, CII, CII*, CIV, OI, MgI,MgII, AlII, AlIII, SiII, SiIV, SII, MnII, FeII, NiII and ZnII . CrIIlines are also detected but they are blended with telluric absorption.By fitting a Voigt profile to the damped HI Lyα line in the spectrumof the quasar combining all three exposures, we determine a neutralhydrogen column density oflogNHI = 20.65 ± 0.05 (see Fig. 2).This is in good agreement with the valuelogNHI = 20.57 ± 0.28found in the automatic analysis of the lower resolution SDSSspec-trum by Noterdaeme et al. (2009).
In order to estimate the overall metallicity of the DLA, wefirst use the SiIIλ1808 transition line as it is weakly saturated andbecause silicon is known to deplete little onto dust grains.Fromthe first moment of the line, we derive a precise redshift ofzabs =2.35409. We also measure a rest-frame line EW of0.215±0.014 Awhich, based on the optically-thin line approximation, correspondsto a lower limit of [Si/H] = −0.61 ± 0.06. Here we adopt thesolar photosphere abundances from Asplund et al. (2009). Hence,our selection based on the SiIIλ1526 line indeed has resulted in ametallicity well above 0.1 solar.
We next perform Voigt-profile fitting to measure accurate col-umn densities for silicon and other elements. As seen from Fig. 5
6 J. P. U. Fynbo et al.
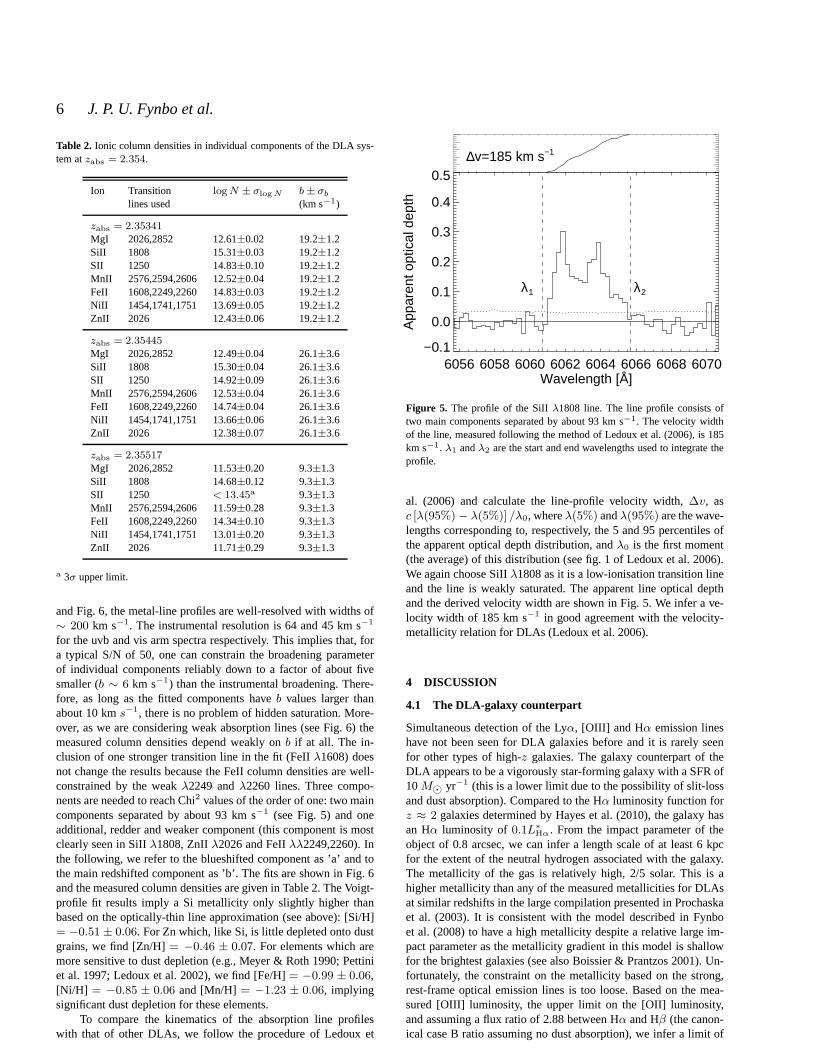
Table 2. Ionic column densities in individual components of the DLA sys-tem atzabs = 2.354.
Ion Transition logN ± σlogN b± σb
lines used (km s−1)
zabs = 2.35341
MgI 2026,2852 12.61±0.02 19.2±1.2SiII 1808 15.31±0.03 19.2±1.2SII 1250 14.83±0.10 19.2±1.2MnII 2576,2594,2606 12.52±0.04 19.2±1.2FeII 1608,2249,2260 14.83±0.03 19.2±1.2NiII 1454,1741,1751 13.69±0.05 19.2±1.2ZnII 2026 12.43±0.06 19.2±1.2
zabs = 2.35445
MgI 2026,2852 12.49±0.04 26.1±3.6SiII 1808 15.30±0.04 26.1±3.6SII 1250 14.92±0.09 26.1±3.6MnII 2576,2594,2606 12.53±0.04 26.1±3.6FeII 1608,2249,2260 14.74±0.04 26.1±3.6NiII 1454,1741,1751 13.66±0.06 26.1±3.6ZnII 2026 12.38±0.07 26.1±3.6
zabs = 2.35517
MgI 2026,2852 11.53±0.20 9.3±1.3SiII 1808 14.68±0.12 9.3±1.3SII 1250 < 13.45a 9.3±1.3MnII 2576,2594,2606 11.59±0.28 9.3±1.3FeII 1608,2249,2260 14.34±0.10 9.3±1.3NiII 1454,1741,1751 13.01±0.20 9.3±1.3ZnII 2026 11.71±0.29 9.3±1.3
a 3σ upper limit.
and Fig. 6, the metal-line profiles are well-resolved with widths of∼ 200 km s−1. The instrumental resolution is 64 and 45 km s−1
for the uvb and vis arm spectra respectively. This implies that, fora typical S/N of 50, one can constrain the broadening parameterof individual components reliably down to a factor of about fivesmaller (b ∼ 6 km s−1) than the instrumental broadening. There-fore, as long as the fitted components haveb values larger thanabout 10 kms−1, there is no problem of hidden saturation. More-over, as we are considering weak absorption lines (see Fig. 6) themeasured column densities depend weakly onb if at all. The in-clusion of one stronger transition line in the fit (FeIIλ1608) doesnot change the results because the FeII column densities arewell-constrained by the weakλ2249 andλ2260 lines. Three compo-nents are needed to reach Chi2 values of the order of one: two maincomponents separated by about 93 km s−1 (see Fig. 5) and oneadditional, redder and weaker component (this component ismostclearly seen in SiIIλ1808, ZnIIλ2026 and FeIIλλ2249,2260). Inthe following, we refer to the blueshifted component as ’a’ and tothe main redshifted component as ’b’. The fits are shown in Fig. 6and the measured column densities are given in Table 2. The Voigt-profile fit results imply a Si metallicity only slightly higher thanbased on the optically-thin line approximation (see above): [Si/H]= −0.51 ± 0.06. For Zn which, like Si, is little depleted onto dustgrains, we find [Zn/H]= −0.46 ± 0.07. For elements which aremore sensitive to dust depletion (e.g., Meyer & Roth 1990; Pettiniet al. 1997; Ledoux et al. 2002), we find [Fe/H]= −0.99 ± 0.06,[Ni/H] = −0.85 ± 0.06 and [Mn/H] = −1.23 ± 0.06, implyingsignificant dust depletion for these elements.
To compare the kinematics of the absorption line profileswith that of other DLAs, we follow the procedure of Ledoux et
6056 6058 6060 6062 6064 6066 6068 6070Wavelength [Å]
−0.1
0.0
0.1
0.2
0.3
0.4
0.5
App
aren
t opt
ical
dep
th
λ1 λ2
∆v=185 km s−1
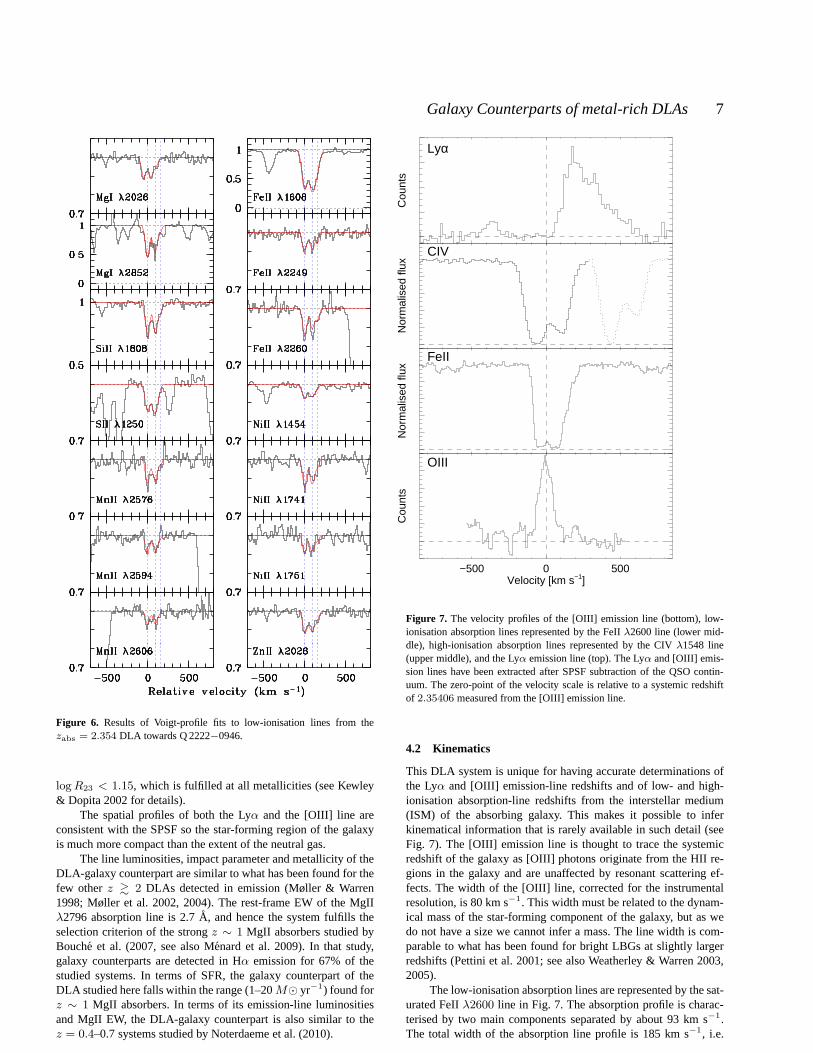
Figure 5. The profile of the SiIIλ1808 line. The line profile consists oftwo main components separated by about 93 km s−1. The velocity widthof the line, measured following the method of Ledoux et al. (2006), is 185km s−1. λ1 andλ2 are the start and end wavelengths used to integrate theprofile.
al. (2006) and calculate the line-profile velocity width,∆v, asc [λ(95%)− λ(5%)] /λ0, whereλ(5%) andλ(95%) are the wave-lengths corresponding to, respectively, the 5 and 95 percentiles ofthe apparent optical depth distribution, andλ0 is the first moment(the average) of this distribution (see fig. 1 of Ledoux et al.2006).We again choose SiIIλ1808 as it is a low-ionisation transition lineand the line is weakly saturated. The apparent line optical depthand the derived velocity width are shown in Fig. 5. We infer a ve-locity width of 185 km s−1 in good agreement with the velocity-metallicity relation for DLAs (Ledoux et al. 2006).
4 DISCUSSION
4.1 The DLA-galaxy counterpart
Simultaneous detection of the Lyα, [OIII] and Hα emission lineshave not been seen for DLA galaxies before and it is rarely seenfor other types of high-z galaxies. The galaxy counterpart of theDLA appears to be a vigorously star-forming galaxy with a SFRof10M⊙ yr−1 (this is a lower limit due to the possibility of slit-lossand dust absorption). Compared to the Hα luminosity function forz ≈ 2 galaxies determined by Hayes et al. (2010), the galaxy hasan Hα luminosity of 0.1L∗
Hα. From the impact parameter of theobject of 0.8 arcsec, we can infer a length scale of at least 6 kpcfor the extent of the neutral hydrogen associated with the galaxy.The metallicity of the gas is relatively high, 2/5 solar. This is ahigher metallicity than any of the measured metallicities for DLAsat similar redshifts in the large compilation presented in Prochaskaet al. (2003). It is consistent with the model described in Fynboet al. (2008) to have a high metallicity despite a relative large im-pact parameter as the metallicity gradient in this model is shallowfor the brightest galaxies (see also Boissier & Prantzos 2001). Un-fortunately, the constraint on the metallicity based on thestrong,rest-frame optical emission lines is too loose. Based on themea-sured [OIII] luminosity, the upper limit on the [OII] luminosity,and assuming a flux ratio of 2.88 between Hα and Hβ (the canon-ical case B ratio assuming no dust absorption), we infer a limit of
Galaxy Counterparts of metal-rich DLAs 7
Figure 6. Results of Voigt-profile fits to low-ionisation lines from thezabs = 2.354 DLA towards Q 2222−0946.
logR23 < 1.15, which is fulfilled at all metallicities (see Kewley& Dopita 2002 for details).
The spatial profiles of both the Lyα and the [OIII] line areconsistent with the SPSF so the star-forming region of the galaxyis much more compact than the extent of the neutral gas.
The line luminosities, impact parameter and metallicity oftheDLA-galaxy counterpart are similar to what has been found for thefew otherz & 2 DLAs detected in emission (Møller & Warren1998; Møller et al. 2002, 2004). The rest-frame EW of the MgIIλ2796 absorption line is 2.7A, and hence the system fulfills theselection criterion of the strongz ∼ 1 MgII absorbers studied byBouche et al. (2007, see also Menard et al. 2009). In that study,galaxy counterparts are detected in Hα emission for 67% of thestudied systems. In terms of SFR, the galaxy counterpart of theDLA studied here falls within the range (1–20M⊙ yr−1) found forz ∼ 1 MgII absorbers. In terms of its emission-line luminositiesand MgII EW, the DLA-galaxy counterpart is also similar to thez = 0.4–0.7 systems studied by Noterdaeme et al. (2010).
−500 0 500Velocity [km s−1]
Cou
nts
OIII
Nor
mal
ised
flux
FeII
Nor
mal
ised
flux
CIV
Cou
nts
Lyα
Figure 7. The velocity profiles of the [OIII] emission line (bottom), low-ionisation absorption lines represented by the FeIIλ2600 line (lower mid-dle), high-ionisation absorption lines represented by theCIV λ1548 line(upper middle), and the Lyα emission line (top). The Lyα and [OIII] emis-sion lines have been extracted after SPSF subtraction of theQSO contin-uum. The zero-point of the velocity scale is relative to a systemic redshiftof 2.35406 measured from the [OIII] emission line.
4.2 Kinematics
This DLA system is unique for having accurate determinations ofthe Lyα and [OIII] emission-line redshifts and of low- and high-ionisation absorption-line redshifts from the interstellar medium(ISM) of the absorbing galaxy. This makes it possible to inferkinematical information that is rarely available in such detail (seeFig. 7). The [OIII] emission line is thought to trace the systemicredshift of the galaxy as [OIII] photons originate from the HII re-gions in the galaxy and are unaffected by resonant scattering ef-fects. The width of the [OIII] line, corrected for the instrumentalresolution, is 80 km s−1. This width must be related to the dynam-ical mass of the star-forming component of the galaxy, but aswedo not have a size we cannot infer a mass. The line width is com-parable to what has been found for bright LBGs at slightly largerredshifts (Pettini et al. 2001; see also Weatherley & Warren2003,2005).
The low-ionisation absorption lines are represented by thesat-urated FeIIλ2600 line in Fig. 7. The absorption profile is charac-terised by two main components separated by about 93 km s−1.The total width of the absorption line profile is 185 km s−1, i.e.
8 J. P. U. Fynbo et al.
substantially wider than the [OIII] emission line. The differencemay possibly be interpreted as the effect of a galactic wind,but thetwo velocity widths also probe quite different scales in thegalaxy (asightline through the neutral gas vs. the star-forming component ofthe galaxy). The absorption redshift is very similar to the systemicredshift, which is remarkable given the impact parameter of∼6kpc. We note that, due to the offset within the slit between the QSOand the DLA galaxy (see Fig. 1), we expect a velocity shift. Assum-ing a roughly quarter slit width offset, we expect a shift of 20 kms−1, so this is a small effect. In the few previous DLAs for whichthis information is available, blueshifts of several 100 kms−1 havebeen found between systemic and low-ionisation absorptionlines(Weatherley et al. 2005). For LBGs, low-ionisation ISM absorptionlines are also typically blueshifted (Pettini et al. 2001).The smallvelocity shift observed in the present case may be an indication thatwe observe a disk-like system with a line-of-sight that is close toparallel with the rotation axis. The profile of the high-ionisationCIV line follows that of the low-ionisation lines, althoughcompo-nent a is stronger than component b which is opposite to the relativestrength of the two components for the low-ionisation lines.
4.3 The Lyα emission-line profile
The Lyα line is a resonant line, and the physical processes govern-ing its formation are quite different from the metal lines. Due to theeffects of scattering, Lyα photons have a complex path out of galax-ies (Laursen & Sommer-Larsen 2007, and references therein). Theprofile of the line shown in the top panel of Fig. 7 is clearly asym-metric and remarkably the blue edge of the profile is close to theposition of Lyα at the systemic redshift. Even more striking is thepresence of a small peak on the blue side of the systemic redshift.This can be understood as a result of resonant scattering. Ingeneral,due to the high opacity of neutral hydrogen for a photon in thelinecentre, Lyα photons have to diffuse in frequency to either the blueor the red side. Thus, to first order the line should be characterisedby two symmetric peaks with the central minimum indicating theredshift (Harrington 1973; Urbaniak & Wolfe 1981). Although thishas been observed on several occasions (e.g. Venemans et al.2005;Tapken et al. 2007), typically observations show that the blue peakis missing, leaving only the asymmetric red part with the distinctsteep rise in intensity close to the line centre and more shallow de-crease farthest from the centre.
Various scenarios may explain the weakness of the blue peak.In particular, if large outflows of gas are present, as may be ex-pected in the presence of a starburst, in the reference frameof theoutflowing hydrogen atoms blue photons are shifted towards theline centre, while red photons are shifted away from resonance.Thus, the photons will escape more easily after having drifted tothe red side. While no analytical solution exists for this scenario2,it has been investigated numerically, both in the case of a homol-ogous expansion (Dijkstra et al. 2006) and that of a thin, circum-galactic shell of gas (Verhamme et al. 2006). Even if outflowsarenot present, after the photons escape the galaxy, the redshift due tothe Hubble expansion of the intergalactic medium may removepartof the blue peak. Atz ≃ 2.4, the average transmission bluewardsof the Lyα line is 80–85% (Songaila 2004). However, since in thevicinity of the galaxy the expansion is slower due to the gravita-tional potential of the galaxy, more absorption may occur close to
2 Except in the academic case ofT = 0 (Loeb & Rybicki 1999).
the line centre. In the case of infalling gas, even the red peak of thespectrum may be affected (Dijkstra et al. 2007).
Considering the relatively high metallicity inferred for the sys-tem and the apparent depletion of refractory elements, the presenceof dust is anticipated. Due to the path length of the Lyα radiationbeing increased by resonant scattering, dust may suppress the Lyαline more than other lines. Even for “grey” dust, the line is not af-fected uniformly, the wings being influenced more than the centre(Laursen et al. 2009b). The reason is that the wings are comprisedof photons originating in the very dense regions that have todiffusefar from the line centre in order to escape, while photons near theline centre must come from low-density regions. Since the denseregions are where also most of the stars are, and hence most ofthedust, these photons have a higher probability of being absorbed.
If we wish to understand the physical conditions responsiblefor the formation of the observed Lyα line, we must take all ofthese effects into account. An exact fit to the Lyα emission-lineprofile requires careful numerical modeling, varying a multitude ofphysical, and often degenerate, parameters. Verhamme et al. (2008)successfully modeled a number of Lyα profiles by varying the tem-perature, column density, expansion velocity and dust contents of athin shell. Analytical solutions exist only for homogeneous, isother-mal, and static configurations of gas, with either a central or evenlydistributed source of light. In the case of a homogeneous gas, eachof the two peaks are fairly symmetric about their maxima, buttak-ing into account the full range of densities, and the correlation ofLyα emission with these densities, often results in significantlymore skewed peaks. This is the result of different parts of the spec-trum originating in physically distinct regions. A realistic scenarioof galactic outflows probably lies somewhere in between thatofthe homologously expanding sphere and that of a thin shell. FromFig. 8 of Laursen et al. (2009a), one sees that in the case of theexpanding sphere with a maximum velocityV of 20 km s−1, thered peak maximum is approximately twice as high as the blue peakmaximum, while forV = 200 km s−1 the blue peak is missingcompletely. In the case of a shell, from Fig. 14 of Verhamme etal.(2006) slightly larger expansion velocities can occur while still al-lowing the blue peak to be seen.
Considering the above discussion on the radiative transferofLyα radiation, we find that the observed emission is consistent withoriginating at the same redshift as the systemic redshift, havingscattered its way out of an inhomogeneous ISM of gas tempera-tureT ∼ 104 K, neutral hydrogen column density comparable tothat inferred from the DLA absorption, as well as a fair amount ofdust absorbing∼1/2 of the photons, expanding at a typical velocityof several tens to∼100 km s−1, and further having reduced its blueside somewhat by the surrounding IGM.
5 CONCLUSIONS: THE RELATION BETWEENEMISSION- AND ABSORPTION-SELECTEDGALAXIES
The progress on understanding the relation between emission- andabsorption-selected galaxies at high redshift has been slow. Today,more than 20 years after the onset of systematic studies of DLAs(Wolfe et al. 1986; Smith et al. 1989) and 15 years after the dis-covery of LBGs we still have very little empirical basis for es-tablishing the relation between the two. Here we have presentedthe results from the first DLA observed in an X-shooter surveytargeting metal-rich DLAs, namely thezabs = 2.354 DLA to-wards Q 2222−0946. We confirm that our pre-selection of metal-
Galaxy Counterparts of metal-rich DLAs 9
rich DLAs based on the strength of the SiIIλ1526 line works: theinferred metallicity of the system is [Zn/H] =−0.46±0.07. We alsoclearly detect the galaxy counterpart of the DLA absorber inLyα,[OIII] and Hα emission. The DLA-galaxy counterpart is a vigor-ously star-forming galaxy with a SFR of at least 10M⊙ yr−1. Theline-of-sight probes the neutral gas associated with this galaxy atan impact parameter of about 6 kpc. The kinematical informationinferred from emission and absorption suggests that we observe thegalaxy with a line-of-sight that is close to parallel with its rotationaxis. From the profile of Lyα, we can infer that there most likelyis a galactic wind causing the blueshifted part of the line tobe ab-sorbed.
The implication of this is that we now have both the strategy(selection of metal-rich DLAs) and the tool (the X-shooter spec-trograph) that will allow us to attack the question of the nature ofDLA-galaxy counterparts.
It would also be interesting to further explore the inverse ex-periment, namely to characterise the HI absorption due to LBGsclose to the sightlines to background QSOs (or other LBGs). Adel-berger et al. (2005) address this issue, but mainly focusingonmetal-line absorption and at impact parameters of several hundredkpc. In a few cases, candidate LBGs have been found within afew arcsec from the background QSOs (Steidel & Hamilton 1992;Steidel et al. 1995), but only for one of these has confirming spec-troscopy been published (Djorgovski et al. 1996; Weatherley et al.2005). In the spectrum of the background QSO, this galaxy is de-tected as a sub-DLA.
We need a larger sample before firm conclusions can bedrawn, but the detection of the galaxy counterpart of the DLAto-wards Q 2222−0946 with properties such as impact parameter andSFR within the predictions does give us hope that the basic picturepresented in the works of Fynbo et al. (2008) and in the hydrody-namical simulations of Pontzen et al. (2008) are correct. Wearehence within reach of firmly establishing the connection betweenhigh-z galaxies detected in emission and absorption.
ACKNOWLEDGMENTS
The Dark cosmology centre is funded by the DNRF. We thankChristina Thone, Max Pettini, Regina Jorgenson and AndrewPontzen and our anonymous referee for helpful comments.
REFERENCES
Adelberger, K., Shapley, A. C., Steidel, C. C., et al. 2005, ApJ,629, 636
Adelberger, K., Steidel, C. C., Kollmeier, J. A., & Reddy, N.A.2006, ApJ, 637, 74
Adelman-McCarthy, J. K., Agueros, M. A., Allam, S. S. et al.2009, ApJS, 175, 297
Asplund, M., Grevesse, N., Sauval, A. J., & Scott, P. 2009,ARA&A, 47, 481
Atek, H., Kunth, D., Schaerer, D., et al. 2009, A&A, 506, L1Bohlin, R. C. & Gilliland, R. L. 2004, AJ, 128, 3053Bohlin, R. C. 2007, ASPC, 364, 315Boissier, S. & Prantzos, N. 2001, MNRAS, 325, 321Bouche, N., Murphy, M. T., Peroux, C., et al. 2007, ApJ, 669, L5Bouwens, R. J., Illingworth, G. D., Oesch, P. A., et al. 2009,ApJL,in press (arXiv:0909.1803B)
Cen, R. & Ostriker, J. P. 1999, ApJL, 519, L109
Charlot, S. & Fall, S. M. 1991, ApJ, 378, 471Christensen, L., Wisotzki, L., Roth, M. M., et al. 2007, A&A,468,487
Colbert, J. W. & Malkan, M. A. 2002, ApJ, 566, 51Dijkstra, M., Haiman, Z., & Spaans, M. 2006, ApJ, 649, 14Dijkstra, M., Lidz, A., & Wyithe, J. S. B. 2007, MNRAS, 377,1175
Djorgovski, S. G., Pahre, M. A., Bechtold, J., & Elston, R. 1996,Nature, 382, 234
Fynbo, J. P. U., Møller, P., & Warren, S. J. 1999, MNRAS, 305,849
Fynbo, J. P. U., Prochaska, J. X., Sommer-Larsen, J., Dessauges-Zavadsky, M. & Møller, P. 2008, ApJ, 683, 321
Goldoni, P., Royer, F., Francois, P., et al. 2006, SPIE, 6269, 80Haehnelt, M. et al. 2000, ApJ, 534, 594Harrington, J. P. 1973, MNRAS, 162, 43Hayes, M., Schaerer, D., &Ostlin, G. 2010, A&A, 509, L5Heinmuller, J., Petitjean, P., Ledoux, C., Caucci, S. & Srianand,R. 2006, A&A, 449, 33
Kaplan, K. F., Prochaska, J. X., Herbert-Fort, S., Elisson,S. L., &Dessauges-Zavadsky, M. 2010, PASP, 122, 619
Kelson, D. D. 2003, PASP, 115, 688Kennicutt, R. C. 1998, ARA&A, 36, 189Kewley, L. J. & Dopita, M. 2002, ApJS, 142, 35Kulkarni, V. P., Woodgate, B. E., York, D. G., et al. 2006, ApJ,636, 30
Laursen, P. & Sommer-Larsen, J. 2007, ApJL, 657, L69Laursen, P., Razoumov, A. O., & Sommer-Larsen, J. 2009a, ApJ,696, 853
Laursen, P., Sommer-Larsen, J., & Andersen, A. C. 2009b, ApJ,704, 1640
Ledoux, C., Bergeron, J., & Petitjean, P. 2002, A&A, 385, 802Ledoux, C., Petitjean, P., Fynbo, J. P. U., Møller, P., & Srianand,R., 2006, A&A, 457, 71
Leibundgut, B., & Robertson, J. G. 1999, MNRAS, 303, 711Loeb, R. & Rybicki, G. B. 1999, ApJ, 524, 527Lowenthal, J., Hogan, C. J., Green, R. F., et al. 1995, ApJ, 451,484
Menard, B., Wild, V., Nestor, D., Quider, A., & Zibetti, S. 2009,MNRAS, submitted (arXiv:0912.3263)
Meyer, D. M. & Roth, K. C. 1990, ApJ, 363, 57Møller, P. 2000,The Messenger, 99, 31Møller, P. & Warren, S. J. 1993, A&A, 270, 43Møller, P. & Warren, S. J. 1998, MNRAS, 299, 661Møller, P., Warren, S. J., Fall, Fynbo, J. P. U, & Jakobsen, P.2002,ApJ, 574, 51
Møller, P., Fynbo, J. P. U., & Fall, S. M. 2004, A&AL, 422, L33Noterdaeme, P., Petitjean, P., Ledoux, C., & Srianand, R. 2009,A&A, 505, 1087
Noterdaeme, P., Srianand, R., & Mohan, V. 2010, MNRAS, 403,906
Pei, Y. C., & Fall, S. M. 1995, ApJ, 454, 69Pettini, M., King, D. L., Wmith, L. J., & Hunstead, R. W. 1997,ApJ, 478, 536
Pettini, M., Shapley, A. E., Steidel, C. C., et al. 2001, ApJ,554,981
Pettini, M. 2006, In: Proceedings of the Vth Marseille Interna-tional Cosmology conference (Edited by V. LeBrun, A. Mazure,S. Arnouts and D. Burgarella), p. 319
Pontzen, A., Governato, F., Pettini, M., et al. 2008, MNRAS,390,1349
Pontzen, A, & Pettini, M. 2009, MNRAS, 393, 557
10 J. P. U. Fynbo et al.
Prochaska, J. X., Gawiser, E., Wolfe, A.M., Castro, S., & Djor-govski, S. G. 2003, ApJL, 595, L9
Prochaska, J. X., Herbert-Fort, S., & Wolfe, A. M. 2005, ApJ,635,123
Prochaska, J. X., Chen, H.-W., Wolfe, A., et al. 2008, ApJ, 672,59
Schaye, J. 2001, ApJL, 559, L1Smith, H. E., Cohen, R. D., Burns, J. E., Moore, D. J., Uchida,B.A. 1989, ApJ, 347, 87
Sommer-Larsen, J., & Fynbo, J. P. U. 2008, MNRAS, 385, 3Songaila, A. 2004, ApJ, 127, 2598Steidel, C. C., & Hamilton, D. 1992, AJ, 104, 941Steidel, C. C., Pettini, M., & Hamilton, D. 1995, AJ, 110, 2519Steidel, C. C., Giavalisco, M., Pettini, M., Dickinson, M.,& Adel-berger, K. L., 1996, ApJL, 462, L17
Steidel, C. C., Shapley, A., Pettini, M., et al. 2004, ApJ, 604, 534Tapken, C, Appenzeller, I., Noll, S., et al. 2007, A&A, 467, 63Tescari, E., Viel, M., Tornatore, L., & Borgani, S. 2009, MNRAS,397, 411
Urbaniak, J. J & Wolfe, A. M. 1981, ApJ, 244, 406van Dokkum, P. G. 2001, PASP, 113, 1420Venemans, B., Rottgering, H. J. A., Miley, G. K., et al. 2005,A&A, 431, 793
Verhamme, A., Schaerer, D., & Maselli, A. 2006, A&A, 460, 397Verhamme, A., Schaerer, D., Atek, H., & Tapken, C. 2008, A&A,491, 89
Warren, S. J. & Møller, P. 1996, A&A, 311, 25Weatherley, S. J. & Warren, S. J. 2005, MNRAS, 345, L29Weatherley, S. J. & Warren, S. J. 2005, MNRAS, 363, L6Weatherley, S. J., Warren, S. J., Møller, P, et al. 2005, MNRAS,358, 985
Wolfe, A. M., Turnshek, D. A., Smith, H. E., & Cohen, R. D.1986, ApJS, 61, 249
Wolfe, A. M., Gawiser, E., & Prochaska, J. X. 2005, ARA&A, 43,861
Zwaan, M., van der Hulst, J. M., Briggs, F. H., Verheijen, M. A.W., & Ryan-Weber, E. 2005, MNRAS, 364, 1467
Zwaan, M., Walter, F., Ryan-Weber, E., et al. 2008, AJ, 136, 2886


![Triuracils – 1,3-Bis[ω-(N-methyluracil-1-yl)alkyl]thymines and Their 5,5′-Cyclic Counterparts](https://img.pdfslide.net/doc/110x75/635433cb9ef77da53804974d/triuracils-13-biso-n-methyluracil-1-ylalkylthymines-and-their-55-cyclic.jpg)


