Embed Size (px)
Citation preview

THE SEEP NETWORK
BY ASSESSING CLIENTS’ NEEDS
Gary WollerPRINCIPAL AUTHOR
BU
ILD
ING
SU
CC
ES
SFU
L M
ICR
OFIN
AN
CE
INS
TIT
UTIO
NS
The
SE
EP
Ne
twork
THE SEEP NETWORK
1825 Connecticut Avenue NW Washington, DC 20009
Phone 202.884.8392 Fax 202.884.8479
E-mail [email protected]
Web site & Bookstore www.seepnetwork.org

James CopestakeImp-Act
Kenan CrnkicPrizma
Patrick CromptonFINCA International
Amy Davis-KruizeIndependent
Dana de KanterSEEP
S. DevarajActivists for Social
Alternatives
Laura FooseAlternative Credit Technologies
Gaamaa HishigsurenIDEAS
Sean KlineFreedom from Hunger
Bierka KljaicDEMOS
Olga KostukovaFORA Fund
Gulbahor MahkamovaNational Association of
Business Women
Regina NakayengaFOCCAS
Veera NathanActivists for Social Alternatives
Daniela OlejarovaIntegra Foundation
Lydia OpokuSinapi Aba Savings and Loan
Suzy Salib-BauerOpportunity Internacional
Manizha SharifovaNational Association of
Business Women
Anton SimanowitzImp-Act
Marina YovevaWorld Vision
Gary WollerWoller & AssociatesPrincipal Author
Contributing Authors
Building Successful Microfinance Institutions
by Assessing Clients’ Needs
National Organization of Business
Women

Copyright © 2005
Th e SEEP Network
Sections of this book may be copied or adapted to meet local needs without permission from Th e SEEP Network, provided the parts copied are distributed for free or at cost—not for profi t. Please credit Building Successful Microfi nance Institutions by Addressing Clients’ Needs and SEEP for those sections excerpted. For any commercial reproduction, please Institutions by Addressing Clients’ Needs and SEEP for those sections excerpted. For any commercial reproduction, please Institutions by Addressing Clients’ Needsobtain permission from Th e SEEP Network, 1825 Connecticut Avenue NW, Washington, DC 20009-5721, USA.
ISBN 0-9722582-8-0
Building Successful Microfi nance Institutions by Addressing Clients’ NeedsPrinted in the United States of America
Copyediting, graphic design, and layout: Communication Visual, LLPPrinting: Copy General
Support for this publication provided by Th e Microenterprise Development Division of the United States Agency for International Development (USAID), through Th e SEEP Network’s Practitioner Learning Program.
Th e SEEP Network is an organization of more than 50 North American private and voluntary organizations that support micro and small business and microfi nance institutions in the developing world. Its mission is to advance the practice of micro and small enterprise development among its members, their international partners, and other practitioners. Th e SEEP Network provides collective examination from which emerges learning that advances professional development, increases program impact, fosters continuing innovation, and informs the policy arena.
Th e opinions expressed herein are those of the authors and do not necessarily represent the views of Th e SEEP Network, USAID, or the institutions listed.

Table of Contents iii
Foreword . . . . . . . . . . . . . . . . . . . . . . . . . . . . . . . . . . . . . . . . . . . . . . . . . . . . . . . . . . . . . . . v
Introduction . . . . . . . . . . . . . . . . . . . . . . . . . . . . . . . . . . . . . . . . . . . . . . . . . . . . . . . . . . . . . 1
Chapter 1: Lessons Learned . . . . . . . . . . . . . . . . . . . . . . . . . . . . . . . . . . . . . . . . . . . . . . . . . . . . 7
Chapter 2: Indicators . . . . . . . . . . . . . . . . . . . . . . . . . . . . . . . . . . . . . . . . . . . . . . . . . . . . . . . 15
Chapter 3: Client Assessment Tools . . . . . . . . . . . . . . . . . . . . . . . . . . . . . . . . . . . . . . . . . . . . . . 25
Chapter 4: Data Analysis . . . . . . . . . . . . . . . . . . . . . . . . . . . . . . . . . . . . . . . . . . . . . . . . . . . . . 35
Chapter 5: Th e Benefi ts of Client Assessment . . . . . . . . . . . . . . . . . . . . . . . . . . . . . . . . . . . . . . . . Chapter 5: Th e Benefi ts of Client Assessment . . . . . . . . . . . . . . . . . . . . . . . . . . . . . . . . . . . . . . . . Chapter 5: Th e Benefi ts of Client Assessment 45
Chapter 6: Conclusion . . . . . . . . . . . . . . . . . . . . . . . . . . . . . . . . . . . . . . . . . . . . . . . . . . . . . . 57
Appendix . . . . . . . . . . . . . . . . . . . . . . . . . . . . . . . . . . . . . . . . . . . . . . . . . . . . . . . . . . . . . . Appendix . . . . . . . . . . . . . . . . . . . . . . . . . . . . . . . . . . . . . . . . . . . . . . . . . . . . . . . . . . . . . . Appendix 61
Table of Contents


Th is book had its origins back in the fall of 2000 when the Client Assessment Working Group (formerly the Cli-ent Impact Working Group) of SEEP was invited to submit a proposal for an action research project to the Imp-Act Programme. At that time, the concept of “client assessment” was just beginning to appear on the agenda of the micro-fi nance industry and among SEEP members.
In the ensuing fi ve years, however, client assessment has assumed a prominent position on the microfi nance agenda, partly as a result of the types of eff orts undertaken by Imp-Act, the CAWG, the CAWG action research partners, and many others. Th is outcome was not unexpected. As the microfi nance industry matures and increasingly adopts the values and practices of the commercial sector (while holding fast to its social roots), the industry is coming to appreciate the importance of talking to clients, of understanding their needs, wants, perceptions, and experiences. Th ose of us who work in microfi nance now better understand (as our colleagues who work in the commercial sector have understood for a long time) that long-term success, whether defi ned in social or fi nancial terms, ultimately depends on creating value for clients. It is diffi cult to imagine a scenario in which the microfi nance industry can consistently create value for clients without actively assessing what clients’ needs are.
We also understand, however, that assessing clients’ needs is diffi cult and fraught with any number of pitfalls. Not everyone who attempts it succeeds. Th e prospect of undertaking client assessment can thus be daunting, particularly for small, resource-scarce MFIs. Moreover, it is tempting for some to see client assessment as a burden; as a line item on the expense statement and not a core business activity. Th is is an understandable point of view in the context of resource-scarce MFIs. But it is also a mistaken point of view.
Th e experiences of the 17 CAWG action research partners documented in this book demonstrate the range of expe-rience when it comes to client assessment. Th e book documents the experiences of large, resource-rich MFIs attempt-ing sophisticated client assessment activities to small, resource-constrained MFIs attempting simple client assessment activities. It documents the obstacles and pitfalls that await MFIs who attempt client assessment as well as strategies for circumventing the obstacles and avoiding the pitfalls. It documents examples of good planning and implementation, and it documents examples of poor planning and implementation. It documents successes, and it documents failures. But in the end it also documents that the benefi ts of undertaking client assessment, as hazardous as it might be, can far exceed its costs. Th e proposition that client assessment is a core business activity is reinforced by the experiences of the MFIs documented in this book.
A long list of people contributed to this book and deserve heartfelt thanks. Th is list includes all of the people cred-ited on the title page of this book as a contributing author. Notable among them are Anton Simanowitz and James Copestake at Imp-Act and Dana de Kanter at SEEP. Of course the contribution of the 17 CAWG research partners was instrumental to this book. A sincere thank you goes out to Avance Chalco, CRECER, FOCCAS, First Allied Sav-ings and Loan, Sinapi Aba Trust, CRS/Benin, K-Rep, Asian Credit Fund, National Association of Business Women, Activists for Social Alternatives, Nirdhan, CARD, FORA Fund, DEMOS, Integra, Partner, and Prizma. Finally, the support and contribution of the CAWG members was also instrumental to completion of this book. Th e membership of CAWG continuously evolved over the course of the research and writing, but it never ceased to provide moral or material support to the eff ort. Th e members of CAWG past and present are too numerous to mention here. You know who you are. Th ank you.
BUILDING SUCCESSFUL MICROFINANCE INSTITUTIONS
BY ASSESSING CLIENTS NEEDS
Foreword


BUILDING SUCCESSFUL MICROFINANCE INSTITUTIONS
BY ASSESSING CLIENTS NEEDS
Introduction
In 2000, the Client Assessment Working Group (CAWG) of Th e SEEP Network received a grant from the Imp-Act Action Research Program to conduct a longitudinal study of the client assessment process at 17 microfi nance insti-tutions (MFIs). Th e Imp-Act Action Research Program is a three-year initiative funded by the Ford Foundation to improve the quality of microfi nance services and their impact on poverty through strengthening the develop-ment of client assessment systems.
CAWG administered three in-depth questionnaires (including a baseline) to the 17 MFIs (hereafter referred to as CAWG research partners) at one-year intervals over a two-year period. Baseline questionnaires were completed during October 2001 at the CAWG Client Imp-Act Workshop in Washington, D.C. Th e second and third rounds of data collection took place during October and November of 2002 and 2003. Th e questionnaires covered the following topics:
• Client assessment objectives,• Primary audiences for client assessment information,• Manager(s) responsible for client assessment, • Level of importance given to client assessment, • Feasible approaches to client assessment, • Client assessment indicators used,• Client assessment tools used, • Eff ectiveness of client assessment tools,
• Analysis of client assessment data,• Uses of client assessment information, • Obstacles and challenges to client assessment,• Lessons learned,• Recommendations,• Technical assistance needed,• Training received, and• Client assessment plans.
Th e 17 CAWG research partners included two from Latin America, fi ve from Africa, two from Central Asia, three from Asia, and fi ve from Central and Eastern Eu-rope. Th e fi ve research partners from Central and Eastern Europe were members of the MicroFinance Centre for Central and Eastern Europe and the New Indepen-dent States, based in Warsaw, Poland. Table I.1 lists the CAWG research partners by region, country, and, where relevant, North American SEEP partner.
Responses to the three questionnaires were summarized by the CAWG facilitator and sent to CAWG members and research partners for comment and follow-up. In May 2004, representatives from SEEP, CAWG member organizations, and CAWG research partners attended a workshop in Warsaw, Poland, to review the questionnaire summaries and draft the outline of a book based on the summaries. Th eir eff orts led to this book.
What Is Client Assessment?
Client assessment is the term that refers to the process Client assessment is the term that refers to the process Client assessmentof gathering information about clients, analyzing the information, and acting on the information. At least three generic approaches to client assessment are available: im-pact assessment, market research, and client monitoring. Although distinct in many respects, the three approaches share many elements, as described below:
• Impact assessment. Th e process of collecting information about clients’ well-being and experience with the program for the purpose of attributing (or proving) the impact of program participation on clients, clients’ enterprises, clients’ households, or the communities where clients live.
• Market research. Th e process of gathering infor-

mation on clients’ needs and wants, behaviors, and perceptions for the purpose of improving market off erings and targeting eff ectiveness.
• Client monitoring. Th e process of tracking changes in clients’ profi les, well-being, and behavior for the purposes of monitoring changes in clients’ socio economic status and trends in market-related information.
As the above defi nitions suggest, client assessment is a process that involves many steps that build on each other in a sequential and continuous process. CAWG research partner FOCCAS learned this lesson:
We learned that client assessment is a con-tinuous process—that is, one learning point
and innovation lead[s] to another[,] and the process continues in a continuous cycle. For example, when we began the process with the client satisfaction tool, we did not know that we could end up with a Credit Association Management Meeting (CAMM) tool. Th e fi rst client assessment activity, however, led to the diffi cult times and coping strategies analysis, which led to the loan product features analysis, and then to a continuous client feedback loop process through the CAMM. Th e options taken to resolve problems also needed to be evalu-ated with time, and the evaluation generated new but related problems for further study and responsive action.
Table I.1 CAWG Research Partners
Research Partner Abbreviated Name Country SEEP Partner
LATIN AMERICA
Avance Chalco — Mexico Enterprise Development International
Crédito con Educación Rural CRECER Bolivia Freedom from Hunger
AFRICA
Foundation for Credit Community Assistance
FOCCAS Uganda Freedom from Hunger
First Allied Savings and Loan FASL Ghana —
Sinapi Aba Trust SAT Ghana Opportunity International
CRS/Benin — Benin Catholic Relief Services
Kenyan Rural Enterprise Programme
K-Rep Kenya Plan
CENTRAL ASIA
Asian Credit Fund ACF Kazakhstan Mercy Corps
National Association of Business Women
NABW Tajikistan Mercy Corps
ASIA
The Activists for Social Alternatives ASA India —
Nirdhan Utthan Bank Limited Nirdhan Nepal Plan
Center for Rural and Agricultural Development
CARD Philippines Plan, Freedom from Hunger
CENTRAL AND EASTERN EUROPE
Fund for Support of Microentrepreneurship
FORA Russia Opportunity International
International Catholic Migration Commission Demos Savings and Loan Cooperative
DEMOS Croatia —
The Integra Foundation Integra Slovakia —
Prizma — Bosnia-Herzegovina —
Partner — Bosnia-Herzegovina —
2 Introduction

Th e client assessment process has the following nine steps, as Figure I.1 illustrates:
1. Articulating the MFI’s information needs in the context of its mission and strategic objectives;
2. Assessing the MFI’s resources and technical capacity;
3. Developing the research design, including the selec-tion of indicators and assessment tools;
4. Collecting data and instituting quality control;5. Analyzing data;6. Reporting;7. Decision-making; 8. Communicating action plans to relevant stakehold-
ers; and 9. Implementing action plans, including pilot testing.
Th e adjustment and communication arrows in Figure I.1 imply that client assessment is an iterative process that involves communication to and from stakeholders at every step or iteration. At all steps in the process, those responsible for client assessment need to communicate with relevant stakeholders and, where appropriate, make adjustments to the process based on stakeholder feedback. Experience and learning at each step are communicated to stakeholders and fed back into the process, leading to a new iteration in which past experience and learning shape and drive the ongoing assessment process.1
No single best approach exists for client assessment. Th e best approach is the one that makes sense for the MFI given its information needs, resources, and technical capacity. Sound principles to client assessment, however, can be identifi ed. Th is book reviews a number of these sound principles drawing on the experiences of the CAWG research partners. In particular, the book reviews sound principles regarding each step of the client assess-ment process shown in Figure I.1.
AssessResources and
TechnicalCapacity
ResearchDesign
(Indicator &Tool Selection)
Data Collection &Quality Control
Data AnalysisReporting
Articulate Information Needs GivenMission and Strategic Objectives
Implementation ofAction Plans
Decision-Making
Communicationof Action Plans
ADJUSTMENT
Communication
Figure I.1 Steps in the Client Assessment Process
Why Client Assessment Is Important
Microfi nance institutions are service organizations that provide formal fi nancial (and in some cases non-fi nancial) services to customers belonging to defi ned market seg-ments. Th ese market segments include principally micro- and small-business owners and low-income households that have not traditionally enjoyed access to formal fi nancial services. In delivering fi nancial services to these markets, MFIs have distinct objectives, which broadly fall under the categories of fi nancial return and social return.
Th e microfi nance industry has put more than two de-cades of experience behind client assessment. One of the most important lessons learned is that achieving fi nancial and social return requires knowledge about customers. Replication, product standardization, infl exible terms and conditions, joint liability, and forced savings may reduce
the cost and complexity of delivering fi nancial services to low-income entrepreneurs and households, but they have not necessarily proven eff ective in optimizing either fi nancial or social return. In fact, in many cases, such ele-ments may actually reduce fi nancial or social return.
Th e market for microfi nancial services consists of mul-tiple and distinct market segments, each with a diff erent set of needs and wants. A consensus is forming around the proposition that the MFIs that can best determine and serve the needs and wants of the market will be those that succeed over the long term, whether success is defi ned by fi nancial return, social return, or both.
Th e path that the microfi nance industry has taken to arrive at this point is unique, but the broader maturation process the industry is undergoing is not. In 1960, Robert
1. Figure I.1 is a version of the “feedback loop.” Initial drafts of this book included discussions of the feedback loop. Th is topic, howev-er, is covered at length in several other publications. Th us, in the interest of space and forging new ground, discussions on the feed-back loop were edited from the fi nal version of the book. Readers interested in learning more about the feedback loop are encour-aged to read the following Imp-Act publications: Michael J. McCord, 2002, Enhancing Responsiveness to Clients through the Feedback Loop (http://www.ids.ac.uk/impact/publications/joint_publications/Th e%20FeedBack%20Loop%20-%20Michael%20McCord.pdf ); Monique Cohen and Katie Wright, 2003, Feedback Loop Lessons from Latin America (http://www.ids.ac.uk/impact/Feedback Loop Lessons from Latin America (http://www.ids.ac.uk/impact/Feedback Loop Lessons from Latin Americapublications/occasional_papers/OP2FBL.doc).
Introduction 3

Keith, Executive Vice President of the Pillsbury Corpora-tion, wrote about a similar transition then taking place in the business world:
Our attention has shifted from problems of production to problems of marketing, from the product we can make to the product the customer wants us to make, from the company itself to the market place . . . . Every activity of the corporation—from fi nance to sales to production—is aimed at satisfying the needs and desires of the consumer . . . . Today the customer is at the center.2
Satisfying the needs and desires of customers presup-poses knowledge about their needs and desires, which requires in turn a process such as client assessment to gather information about them. Picturing a truly cus-tomer-oriented institution that does not invest time and money in client assessment is diffi cult.
In fact, market researchers defi ne a customer orienta-tion as the “organization-wide generation of market intelligence pertaining to current and future customer needs, dissemination of intelligence across departments, and organization-wide responsiveness to it.”3 Researchers have also found a strong causal link between customer orientation and long-term organizational performance in areas such as profi tability, sales, market share, innovation success, customer service, job satisfaction, staff morale, and staff turnover.4
Th e weight of empirical evidence points to the unam-biguous conclusion that client assessment is a core activity of successful businesses. Client assessment is not something to be done only if time and resources allow; this process is integral to how the organization operates. Client as-sessment is not simply another line item on the expense ledger but an investment in knowledge that, on balance, yields returns that far exceed its costs.
Overview
Th is book summarizes the key fi ndings of the CAWG Imp-Act project.5 Given the volume of responses to the Imp-Act questionnaires, neither summarizing all the responses nor discussing in detail all the topics covered in the questionnaires is possible. Instead, CAWG members and research partners selected the topics of greatest inter-est and relevance to them. Th e last iteration in this process occurred at the May 2004 workshop in Warsaw, Poland, at which selected CAWG members and research partners outlined the topics and content for this book.
Th e topics of greatest interest and relevance identifi ed through this process were (1) obstacles, (2) lessons learned and recommendations, (3) indicator selection and imple-mentation, (4) tool selection and implementation, (5) data analysis, and (6) benefi ts of client assessment.
Chapter 1 summarizes the primary obstacles to client assessment cited by the CAWG research partners, as well as the primary lessons learned and recommendations. Th e CAWG research partners cited the following three primary obstacles to client assessment:
1. Lack of technical capacity,2. Lack of staff resources and time, and3. Lack of funding.
Th ey developed the following seven principal lessons learned and recommendations:
1. Implement client assessment,2. Integrate client assessment into organizational plan-
ning and strategy,3. Use client assessment to improve impact rather than
prove impact,4. Build internal staff capacity,5. Start small and simple,6. Institutionalize client assessment, and7. Create management and staff buy-in for client as-
sessment.
Chapter 2 discusses sound principles in selecting client assessment indicators. It emphasizes the importance of context and trade-off s in weighing 12 recommended selection criteria, which include (1) link to mission, (2) link to use, (3) reliability, (4) sensitivity, (5) simplicity, (6) scope, (7) comparability, (8) context specifi city, (9) practicality, (10) cost-eff ectiveness, (11) function, and (12) ability to be operationalized. Th e chapter concludes with in-depth case studies of Integra and Prizma showing the unique process each went through to select the indicators they now use to measure and monitor client outcomes.
2. Robert J. Keith, “Th e Marketing Revolution,” Journal of Marketing 24, no. 1 (1960): 35, 38.Journal of Marketing 24, no. 1 (1960): 35, 38.Journal of Marketing3. A.K. Kohli and B.J. Jaworski, “Market Orientation: Th e Construct, Research Propositions, and Managerial Implications,” Journal of
Marketing 54, no. 2 (1990): 6.Marketing 54, no. 2 (1990): 6.Marketing4. For more information on this causal link, including citations, see Chapter 5, Th e Benefi ts of Client Assessment.5. Th e book also includes selected case studies of other MFIs that did not participate in the CAWG Imp-Act project. Th ese include
MFIs that participated in the SEEP Practitioner Learning Program (e.g., Pro Mujer and URWEGO) and the Imp-Act Program (e.g., Lift Above Poverty Organisation [LAPO] and Small Enterprise Foundation [SEF]). In some cases, MFIs requested that their names be withheld from case studies to preserve anonymity.
4 Introduction
Chapter 3 reviews sound principles in client assessment tool selection and implementation. Th e chapter describes the distinction between diff erent tools and reviews the common mistakes made when selecting tools. Common mistakes include the failure to match tools to the MFI’s fi nancial and human resources and its technical capacity, inadequate training, failure to acquire knowledge about potential tools, implementing too many tools at once, implementing tools off the shelf, poor tool implementa-tion, and overreliance on external entities. Th e chapter next discusses the importance of adapting tools to the lo-cal context, drawing on examples of tool adaptations and innovations made by CAWG research partners. Finally, the chapter describes diff erent rationales for selecting client assessment tools with examples taken from CAWG research partners.
Chapter 4 reviews sound principles in data analysis. Th e chapter describes how data analysis is linked to the other steps in the client assessment process, including establishing research objectives, determining informa-tion needs, assessing organizational capacity, selecting and implementing the research design, and reporting. Th e chapter discusses in detail the distinction between quantitative and qualitative data and its implications for
data analysis. It reviews common statistical procedures for analyzing quantitative data and summarizes the methods CAWG research partners used to analyze qualitative data. Because data analysis is only as good as the data itself, the chapter also summarizes important concepts and com-mon approaches in data quality control and training.
Chapter 5 summarizes the evidence demonstrating the benefi ts of client assessment. Evidence cited includes cost-eff ectiveness studies of MFIs in Honduras, South Africa, and Bosnia-Herzegovina that demonstrate monetary benefi ts of client assessment that far exceed costs. Th e chapter also presents dozens of ways the CAWG research partners have used client information to make program changes and includes empirical research from outside the microfi nance fi eld that shows a robust, unambiguous causal link between client assessment and multiple dimensions of organizational performance. Th e chapter concludes with a discussion of the criteria for making client information useful.
Finally, Chapter 6 concludes with a case study of Sinapi Aba Trust that demonstrates how strategy and context can work hand-in-hand to drive the client assessment process.
Introduction 5


CHAPTER 01
When we recommend that microfi nance institutions (MFIs) do client assessment, we do not diminish the many signifi cant obstacles they face. Th e Client As-sessment Working Group (CAWG) research partners reported a large number and wide variety of obstacles in their eff orts to do client assessment. Much of the learn-ing that took place among research partners focused on overcoming these obstacles. Principal obstacles reported
by CAWG research partners fell into one of three broad categories: lack of technical capacity, lack of staff re-sources and time, and lack of funding. Th ese obstacles are discussed at length in Section 1.1. Section 1.2 summa-rizes the principal lessons learned by the CAWG research partners. Section 1.3 reviews the key recommendations made by research partners. Section 1.4 concludes with a summary and fi nal comments.
BUILDING SUCCESSFUL MICROFINANCE INSTITUTIONS
BY ASSESSING CLIENTS NEEDS
Lessons Learned
Lack of Technical Capacity
CAWG research partners cited the lack of technical capacity as the most signifi cant obstacle to client assess-ment. In this category, the research partners cited the lack of data-analysis skills as the greatest capacity defi cit, followed by selecting/developing client assessment meth-odologies, learning and integrating qualitative research methods, identifying and selecting assessment indicators, designing sample methodologies, collecting and manag-ing data, and planning and managing assessment logistics.
Doing good client assessment requires training and experience; more complex assessment methodologies require greater training and experience. Client assessment, however, need not be complicated. In practice, client assessment ranges from the very simple (for example, cus-tomer suggestion boxes) to the very complex (for example, longitudinal impact studies). Any MFI can do client as-sessment, and many probably already do it but just do not think of it as such.
Th e objection that client assessment is too diffi cult for the “typical” MFI is often based on stereotyped beliefs about client assessment. A common misperception, for example, is that client assessment involves expensive and complicated large-scale studies. Client assessment, how-ever, can be long or short. It can also be complicated or simple, theoretical or practical, expensive or inexpensive,
one-off or routine. In short, client assessment can take any number of forms depending on the needs, resources, capacity, and imagination of the MFI.
Citing the lack of technical capacity for not doing client assessment can also be a statement of organiza-tional priorities. MFIs routinely train credit offi cers, a clear statement of the importance attached to excelling at the lending function. Th e extent to which management allocates resources to capacity development in client as-sessment is likewise a clear statement of the importance it attaches to it.
Lack of Staff Resources and Time
According to CAWG research partners, the opportunity cost of staff time is often the largest cost in client assess-ment. MFI staff are already stretched thin with barely enough time to perform daily tasks, let alone take on client assessment duties.
MFIs often assign client assessment responsibilities to loan offi cers who collect data at the loan application or during other routine interaction with clients. Graft-ing data collection onto loan offi cers’ duties is a prag-matic and cost-eff ective approach to client assessment. Nonetheless, tasking loan offi cers with data collection can add signifi cant additional demands on their time. It may only add a minute or two per client, but a minute or two
1.1 Obstacles to Client Assessment

times hundreds of clients adds up quickly, and it can be substantial in the aggregate.
Because loan offi cers are already busy, they are under-standably resistant to additional demands on their time, particularly when (1) they are not rewarded for doing cli-ent assessment work and (2) client assessment work takes time away from other duties for which they are rewarded. (See Box 1.1 for an exception to these general principles.) Th e perception that client assessment is an uncompen-sated burden is likely to create resistance among staff . Re-sistance in turn manifests itself through noncompliance or half-hearted compliance and loss of staff morale.
Solutions to this problem include integrating client assessment into staff incentive systems, more and better training, involving management and staff earlier in the cli-ent assessment process (increasing their ownership of the process), or outsourcing. Unfortunately, while the solu-tions to this problem are reasonably straightforward, many MFIs stumble on the diffi cult step of implementation.
Lack of Funding
MFIs typically operate with limited resources, and many struggle to achieve fi nancial sustainability. Many do not have substantial fi nancial resources to invest in client assessment.
Client assessment costs money at every step in the process. Many of the CAWG research partners benefi ted from generous grants from donors in developing their assessment processes, but most MFIs do not have access to technical capacity or development grants earmarked for client assessment. Th ey must fend for themselves us-ing operational subsidies granted by donors or fi nancial surpluses created through operations.
Th e lack of funding for client assessment might also be a statement of organizational priorities. If management does not perceive client assessment as a core function, it will not allocate money to it. Th e lack of funding might also be explained in part by stereotyped perceptions of cli-ent assessment as costly, long, and impractical. Although wrong, this perception implies a fundamental and justifi ed criterion for client assessment: that it produce informa-tion that leads to management action and improved organizational performance. (See Box 1.2.)
Box 1.2 Overcoming Stereotypes of Client Assessment at ASOMIF
The experience of the Asociación Nicaragüense de Instituciones de Microfinanzas (ASOMIF) network in Nicaragua demonstrates how lingering stereotypes of client assessment can hinder assessment activity. Funded in part through Imp-Act funds (through the CAWG), ASOMIF carried out several client assess-ment tools trainings for its member institutions. After the trainings, a number of the participant MFIs did not follow up with a field implementation of the tools. An inquiry into the reasons found that the lack of follow-up stemmed, among other reasons, from the negative perception of client assessment held by senior MFI managers. The managers equated client assessment with “academic” research that had little practical value. To encourage member MFIs to implement the tools, ASOMIF senior staff organized a special half-day workshop with the executive direc-tors of ASOMIF members to discuss post-training tool implementation. On hearing the many ways in which other member MFIs had used client informa-tion to make changes in their organizations, a number of executive directors attending were surprised that the tools could produce such useful information. They subsequently committed to follow up the training with field implementation.
Box 1.1 Failure of Client Assessment Incentives at URWEGO in Rwanda
URWEGO, a Rwandan MFI, attempted to implement client surveys using field staff in the early stages of its client assessment work. To incentivize staff to collect the surveys, management offered them 100 Rwandan francs for each survey collected. Feedback from field staff, however, suggested that the incen-tive system was not well received and failed to elicit the desired response. The field staff thought that if client assessment was important enough to do, it was important enough to include in their regular job duties. Field staff believed that management was, in effect, bribing them to do their job. This perception, and the time burden of survey collection, led to re-sistance toward client assessment among URWEGO field staff.
1.2 Lessons Learned
Despite signifi cant obstacles to client assessment, the CAWG research partners forged ahead as best they could, learning as they went. Like those in other endeavors who have moved up the learning curve and gained wisdom through experience, research partners can look back and refl ect, “If I had to do it all over again . . .”
In refl ecting on their experience, the CAWG research partners cited dozens of lessons learned, falling into the following categories:
1. Implement client assessment,2. Integrate client assessment into organizational plan-
8 Lessons Learned

ning and strategy,3. Use client assessment to improve impact rather than
prove impact, 4. Build internal staff capacity, 5. Start small and simple, 6. Institutionalize client assessment, and 7. Create management and staff buy-in for client as-
sessment.
Client Assessment Has Many Uses
A major lesson learned by the CAWG research partners is that client assessment is an eff ective means to improved management decision-making and action. Overall, the 17 research partners made nearly 60 program changes over three years based directly or indirectly on client assess-ment information. Th ese changes fall into one of three broad categories: (1) product and service innovations, (2) modifi cations to the terms and conditions of products and services, and (3) modifi cations to institutional policies and practices. Research partners also cited client assessment’s use for fundraising and public relations as yet another benefi t. Client assessment is useful for informing both small and major program changes. (See Box 1.3 for an example of the latter.)
Integrate Client Assessment Into Organizational Planning and Strategy
One of the key lessons learned by the CAWG research partners is that the usefulness of client assessment depends on the extent to which the assessment is an extension of institutional strategy. Done properly, client assessment is a tool to carry out institutional strategy because its design and purpose are to answer specifi c, pertinent questions to inform management decision-making and action.
Th e National Association of Business Women (NABW) and the Asian Credit Fund (ACF) are two examples of CAWG partners that consciously integrate client assessment into institutional strategy. Before implementing a client assessment tool, NABW convenes an orientation meeting with management and the board of directors to discuss the proposed tool, the purpose for implementing it, the specifi c questions to be addressed, and the strategy for implementation.
ACF conducts a thorough analysis of its institutional strategy and its business and marketing plans before embarking on client assessment. It then plans client as-sessment activities to answer key questions raised during this vetting process.
Figure 1.1 lays out in grid form some of the issues MFIs need to consider when integrating client assess-ment in strategic planning. According to Figure 1.1, broader strategic rationales for client assessment lie along two continua: a fi nancial performance/social performance continuum and a proving impact/improving impact continuum. Th e fi nancial performance/social performance continuum implies that client assessment serves two basic functions: improving fi nancial performance and
improving social performance. Management must decide whether to direct client assessment to achieve one of these goals or some combination of both.
Th e proving impact/improving impact continuum implies that client assessment directed toward social performance can either aim to prove impact through scientifi cally valid methods or improve impact through improvement in market off erings and institutional policies. Figure 1.1 includes anecdotes describing how diff erent CAWG research partners have approached these strategic choices.
Integrating client assessment into strategic planning is the ideal, but the reality is that MFIs embark on client assessment for a variety of reasons. One reason is not necessarily more valid than another. Over time, moreover, the reasons for doing client assessment will change, as demonstrated by the CAWG research partners.
In the fi rst Imp-Act Questionnaire, research partners rated demonstrating the impact of their programs as the most important client assessment objective. By the second and third questionnaires, however, proving impact had receded in importance, replaced by a number of objec-tives falling broadly under the category “market research.” In fact, by the second questionnaire, all research partners cited one or more strategic objective for client assessment related to market research. Most frequently cited objec-tives in this category were assessing and serving clients’ needs and wants, tracking and reducing client dropout, and assessing and improving client satisfaction. (See Box 1.4 for a mini case study of ASA India.)
Box 1.3 Client Assessment Informs a Major Program Change at CARD
The Center for Rural and Agricultural Development (CARD) seeks to expand its program and services to poor women in the Philippines using a modified Grameen Bank methodology. To achieve this goal, CARD continually examines its systems, policies, and procedures to identify and redress bottlenecks that hinder the efficient and effective delivery of its financial services. On observing the methodology of the Association for Social Advancement (ASA) in Bangladesh, CARD management and staff were so impressed with its simplicity and cost-effectiveness that management began a process to investigate ways to integrate the ASA methodology into CARD’s lending program. Toward this end, CARD has imple-mented a number of assessment activities, including staff workshops, focus group discussions assessing clients’ perceptions of CARD and satisfaction with CARD’s current policies, client participatory discus-sions assessing CARD’s market positioning relative to competitors, and a staff satisfaction survey. Basing its decision on assessment findings, CARD pilot-tested the ASA methodology in new branches and started a process of adopting ASA principles in existing branch-es where appropriate, with the eventual objective of implementing the changes organization-wide.
Lessons Learned 9

Th e CAWG research partners off ered numerous ratio-nales for embarking on client assessment, including the following:
• Th e need to attract donor support, even as the institution is being weaned away from traditional funding sources;
• Th e need to demonstrate program success to donors;• Th e need to respond to pressure from internal and
external stakeholders;• Th e need to respond to problems with existing prod-
ucts, services, and policies;• Th e need to increase focus on social performance
when fi nancial goals have been met; • Th e need to understand the needs and wants of
clients; and• Th e need to assess fulfi llment of social mission.
Improving Impact versus Proving Impact
Several CAWG research partners underwent an evolu-tion from a proving approach to client assessment to an improving approach. Th is change occurred as a result of lessons learned at diff erent points during the assessment process. Driven by the need to deliver better market off erings and staunch the exodus of clients, MFIs are increasingly demanding cost-eff ective client assessment tools that yield timely and useful information. For the same reasons, the demand for complex impact assess-ments has fallen.
Th e purpose of the proving approach is to attribute observed outcomes to program participation. (Attribu-tion refers to proving cause and eff ect with high levels of statistical signifi cance.) Th e proving paradigm adopts the language, methodology, and worldview of the social sciences. Its audience is primarily external, such as donors, policymakers, and academics. Th e purpose of the improv-ing approach is to improve the impact of fi nancial services on program participants through improving products and policies. Th e improving paradigm adopts the language, methodologies, and worldview of management. Its audi-ence is primarily internal, including the board, manage-ment, staff , and clients.
Client assessment activity in microfi nance initially refl ected a proving agenda driven for the most part by donors and academics. Th is period of activity produced a wealth of studies (of varying quality) demonstrating a number of positive impacts of program participation on clients, their enterprises, and their households.
ProvingImpact
ImprovingImpact
SocialPerformance
FinancialPerformance
1) FORA–Wants to provide better services in a competitive environment.
2) Prizma–Trying to meet target social objectives while improving its financial performance
3) CRECER–Very concerned about impact on poor women, but using very informal tools and simple analysis process.
4) ASA–Concerned about development progress of members, especially women's empowerment objectives, using a formal database and regular monitoring system
1
2
3
4
Figure 1.1 Client Assessment Compass
Box 1.4 Evolution of Client Assessment Objectives at ASA India
In the first Imp-Act Questionnaire, ASA said its primary client assessment objective was to measure program impact using the Internal Learning System (ILS). The ILS is a participatory impact assessment and planning system that uses pictorial diaries to record changes in participants’ lives over time. ASA management was initially very enthusiastic about the ILS and saw it as a principal tool to advance ASA’s financial and social objectives.
By the time ASA responded to the second Imp-Act Questionnaire, management’s enthusiasm for the ILS had ebbed substantially. The ILS had already taken several years to develop and fine-tune, and it would be more years still until it produced meaningful find-ings. In the meantime, management had concluded that it needed to be more responsive to market demand and changing market conditions, which required timely client and market information useful for management decision-making that the ILS could not deliver. Because of the long lag time required to develop the ILS and the complexity and time intensity of collecting and analyzing ILS data, ASA manage-ment concluded that the ILS was not well suited for integration into the management information gather-ing and decision-making process.
10 Lessons Learned

Practitioners have diff erent informational needs from academics or donors. Th ey need information that is timely and useful, and they are willing to live with a lower threshold of statistical validity. None of the 17 CAWG research partners cited statistical validity as a client as-sessment objective, while all 17 expressed a preference for feasibility over scientifi c validity. Th e response of Crédito con Educación Rural (CRECER) was typical: “Manage-ment is willing to sacrifi ce scientifi c validity for lower cost and is much less interested in the precision of the information than in whether it’s useful.”
Th is particular need by the CAWG research partners is not to suggest that impact assessments are of no use. Impact assessments will continue to be relevant to those MFIs, donors, and investors for whom understanding and demonstrating the impact of microfi nance programs remains a key strategic objective. Even then, however, to the extent impact assessments are led by practitioners, the standards of statistical validity are likely to fall, commen-surate with the needs and outlook of management. (Th e evolution of NABW’s client assessment goals is described in Box 1.5.)
Build Internal Staff Capacity
Th e CAWG research partners consistently cited the need to build internal client assessment capacity as one of the main lessons learned. Responses related to staff capacity generally fell into one of two categories: technical capac-ity (research design, data collection, data management, data analysis) or resource capacity (staff time).
Th e lack of staff capacity can pose seemingly insur-mountable obstacles to client assessment, but these obstacles can be overcome. Keys to overcoming capacity constraints include strategic planning, a realistic assessment
of staff resources and technical capacity, adequate training, and hiring of staff with the appropriate technical skills.
A few simple questions can help the MFI address staff capacity issues:
1. What technical skills, resources, and time are re-quired to collect, manage, analyze, and use the client data?
2. What is the current level of staff technical skills and resources?
3. Is it possible to train staff to acquire the appropriate skills? If so, how, where, and at what cost?
4. Can the client assessment processes be integrated into staff job descriptions and routines without unreasonably burdening staff ?
For some MFIs, the preferred approach to staff -capacity issues is to assign client assessment duties to a core group of staff . A better solution is creating a separate assessment unit within the MFI. Generally, as MFIs move along the learning curve the expectation is that they will seek to cre-ate specialized resources responsible for client assessment.
Such approaches, however, are not always feasible, particularly among smaller and inexperienced MFIs. Nor is it necessarily a good idea to cut loan offi cers or other line staff out of the client assessment process. Line staff has continuous contact with clients. Th us, for many MFIs using line staff as the focal point for data gathering makes practical and strategic sense. It can also be an important component of a strategy to create a customer-oriented organizational culture.
Outsourcing
Bringing all client assessment functions in-house is one way to manage the process. In areas in which MFIs do not have the requisite skills or resources, they may want to consider outsourcing one or more assessment tasks.
Outsourcing, however, carries its own set of challenges and risks. Maintaining regular communication with ex-ternal entities is important to ensure that the mission and goals of the MFI guide assessment activities. Th e MFI also needs to ensure that the client information is timely and is fed into the organizational feedback loop and internalized. Th e risk remains that the external entities may not deliver.
Th e experiences of Sinapi Aba Trust (SAT) and Avance Chalco illustrate these risks. SAT outsourced data analysis and reporting of its SEEP/AIMS (Assessing the Impact of Microenterprise Services) impact assessment to external consultants.1 Th e consultants failed to provide timely reports. As a result, the client information was not integrated into SAT’s feedback loop and used to inform management decision-making. Avance Chalco outsourced
Box 1.5 From Proving Impact to Improving Impact at NABW
NABW is a CAWG research partner whose client assessment objectives evolved over time. In the first Imp-Act Questionnaire, NABW said its primary client assessment objective was “to assess the nature and extent of change in clients’ households and enterpris-es as a result of program participation.” By the final questionnaire, it cited the same objectives, but with an important qualifier: “What has changed is that NABW now explicitly recognizes an ‘improving’ role for client assessment, where its original response suggested only a ‘proving’ role. That is, it is now interested in understanding how impact is related to specific program attributes, such as loan size and terms and types of services offered. This is a subtle, but significant, shift.”
1. Th e impact survey is a SEEP/AIMS tool. Th e SEEP/AIMS tools are fi ve “practitioner-friendly” client assessment tools developed jointly between SEEP and the AIMS project at the U.S. Agency for International Development. In addition to the impact survey, the SEEP/AIMS tools include exit surveys; client satisfaction focus group discussions; empowerment interviews; and loans, savings, and profi ts use over time interviews. For more information, visit www.microlinks.org.
Lessons Learned 11

the pilot test of its assessment tools to students from a lo-cal university. In the middle of the pilot test, the students pulled out, and Avance Chalco was unable to complete the pilot test because of pressing operational demands. Learning from these experiences, MFIs contracting with external entities should clearly defi ne up front all deliver-ables and deadlines and the persons responsible for them.
Training
Th e CAWG research partners rated the need for client assessment training as the single most important lesson
learned over the three years of the project. According to the partners, training is needed in all areas of client as-all areas of client as-allsessment, even the seemingly simplest tasks, but particu-larly in data collection and data analysis.
With only one exception (Avance Chalco), each of the CAWG research partners received some form of client training focused overwhelmingly on market research tools. Overall, the research partners found the trainings very useful in gaining necessary skills to conduct client assessment, jump-start the client assessment process at their institutions, or convince management of the value of client assessment.
Start Small and Simple
Th e CAWG research partners repeatedly recommended starting small and simple. Identify a small set of questions of strategic importance and design a simple methodology to answer the questions based on a realistic assessment of organizational resources and capacities. (See the example of the Foundation for Credit Community Assistance (FOCCAS) in Box 1.6.)
In contrast, MFIs tend to take on too much at the start, making overly complicated assessment plans or trying to collect too much information at once. In such cases, the MFIs are either quickly overwhelmed by the complexity and resource demands of their overly ambitious assess-ment plans, or they end up with too much information that they cannot process, analyze, or use.
Th e tendency to take on too much initially is a function of several factors: lack of experience, underestimating the marginal costs of additional data collection, failure to focus on questions of strategic importance, failure to prioritize information needs, or the imposition of external mandates.
To avoid taking on too much at once, it helps to ask the following questions:
1. What are the most important issues facing the orga-nization?
2. Of the important issues, which are the most crucial?3. What key decisions are to be made using the assess-
ment results?4. What information will help management make the
best decisions?5. Is the information already available from an internal
source?6. What skills and resources does the organization have
at its disposal?7. Using available skills and resources, what methods
are best suited to gather the information needed to answer the crucial questions?
Questions 1 through 4 focus the assessment activity on a small set of questions of strategic importance to the or-ganization, perhaps the most important step in the assess-ment process. Th ese questions will in turn drive the rest of the assessment process, including the choice of indicators and assessment tools, the data analysis, the reporting, and the decision-making.
Another important initial step in the process is to take a careful look at the client information already being col-lected by the organization. All MFIs collect information on clients in the regular course of operations, including information on client demographics (e.g., gender, loca-tion, household size), households (e.g., income, expendi-tures), enterprises (e.g., sales, profi ts, employment, sector), and program participation (e.g., loan cycles, repayment re-cord, loan products). Much of this information is valuable for client assessment purposes. (See the example of ASA in Box 1.7.) MFIs also might already have established formal or informal procedures for generating information from staff or clients, such as regular or periodic meetings with staff or clients, suggestion boxes, or ombudsmen.
Questions 6 and 7 remind the MFI to take a hard, realistic look at its resources and skills and formulate its assessment plans accordingly. Th e cost and complexity of the assessment process can be increased in the future as the MFI’s skills and resources increase with time and experience. Starting small initially will increase the prob-ability of success, and success will increase the organiza-tion’s commitment to the process and its willingness to invest time, resources, and training in it.
Box 1.6 Small and Simple Client Assessment at FOCCAS
To assess the impact of its revised group lend-ing program, FOCCAS placed client issues on the agenda at all monthly branch meetings so that field officers could raise and discuss client concerns and feedback about loan products. FOCCAS accountants next developed a chart for tracking and monitoring clients’ borrowing trends to assess whether clients were receiving adequate levels of financing. Findings suggested that the improved group lending product has allowed women to secure reasonable amounts of funding for their enterprises.
1.3 Recommendations
12 Lessons Learned

Institutionalize Client Assessment
Many CAWG research partners reported the need to in-stitutionalize client assessment. Institutionalization refers to the integration of client assessment into organizational routines and operations and to the creation of a customer-oriented culture. According to the customer-orientation literature (see Chapter 6), creating a customer-oriented culture is the distinct responsibility of senior manage-ment. Creating a learning culture requires that senior management perform the following actions:
1. Communicate a clear commitment to market orien-tation,
2. Defi ne clearly what such a commitment means in terms of behavior by organizational members,
3. Link behaviors to specifi c desired outcomes,4. Prioritize critical areas for change,5. Behave in a manner visibly consistent with rhetoric,
and6. Create appropriate incentive systems that reward
customer-oriented behavior.
Th e institutionalization of client assessment often en-tails its integration into the MIS. When asked what their client assessment objectives were for the coming years, the CAWG research partners most frequently cited integrat-ing client assessment into their MIS. Integrating client assessment into the MIS helps to institutionalize it by embedding it into organizational systems and procedures and by making possible routine and timely collection, analysis, and use of client data. As Nirdhan Utthan Bank Limited noted, “embedding client assessment into the MIS is part of incorporating it into core operations. We see the need to adapt the MIS to collect more informa-tion. Th us computerizing information collection is a priority—it has to be part of the management system.”
Th e challenges involved in integrating client assess-ment into the MIS are considerable. MIS development is itself a diffi cult, time-consuming, and expensive process. Integrating client assessment into the MIS can only make it more so. Successful integration also requires cor-responding capacity and systems to collect, manage, and analyze the data and to report and act on fi ndings. If the MFI lacks capacity in any of these steps, the process will break down. (See Box 1.8 for an example.)
Importance of Management and Staff Buy-In
CAWG research partners repeatedly cited the need for management and staff to buy into the client assessment process. To create buy-in among management, involving them from the beginning of the client assessment process is imperative. Staff should be involved early on in the pro-cess as well. Because staff is closer to the clients than man-agement, the staff is in a position to provide unique insight on client assessment design, planning, and implementa-tion. Th e opportune time to involve staff and its degree of involvement will vary depending on the circumstances.
Buy-in requires that management and staff see a direct connection between client assessment and organizational performance. If they do not, they are likely to perceive client assessment as an expense line item or a burden. On the other hand, involving management and staff in the client assessment development and planning process in-
creases the likelihood that they come to see client assess-ment as a core activity. Timely feedback on data collection activities, timely reporting of fi ndings, and evidence that the MFI uses client information are also important.
A risk in involving management and staff in the dif-ferent stages of the client assessment process is burnout. At Prizma and the International Catholic Migration Commission Demos Savings and Loan Cooperative (DEMOS), for example, client assessment work con-sumed excessive amounts of management and staff time, leading Prizma to suspend certain assessment activities for a time, while at DEMOS it became increasingly dif-fi cult to motivate staff to take on the additional workload. Th eir experiences serve as a reminder that balancing client assessment activities with organizational needs and priorities is always necessary. (Th e approaches used by DEMOS, Prizma, and Integra are described in Box 1.9.)
Box 1.7 ASA Uses its Existing MIS to Conduct Client Assessment
ASA segments clients in its management information system (MIS) according to the number of loans taken. At the end of each month, ASA can determine the number of borrowers for that month, which it uses to estimate the absorption capacity of clients for a particular time period. Using its analysis of the MIS data, ASA concluded that many clients have a low loan-absorption capacity. Management consequently decided to reduce the initial loan size from 5,000 to 2,500 rupees.
Box 1.8 Mismatch Between Client Assessment Tool and MIS Capability at URWEGO
URWEGO wanted to monitor client exits. Its original approach was to survey two exiting clients per loan group each loan cycle (an average of five clients ex-ited in each loan group each loan cycle) and store the survey results in a separate data set. It later decided that it wanted to integrate the exit monitoring into the MIS. On taking a closer look at the MIS, however, the research manager found that the MIS was designed to track group variables and could not attribute any outcomes, including program exit, to individual cli-ents, forcing URWEGO to abandon plans to create an exit-monitoring system.
URWEGO eventually developed a new MIS that would allow it to track individual client outcomes. The staff person who helped design the MIS left the program, however, which left no one at URWEGO who understood how the MIS operated or who could modify the MIS to meet changing information needs. Thus, URWEGO learned the hard way of the need to develop institutional knowledge of MIS operation.
Lessons Learned 13

Th e experience of the CAWG research partners provides valuable insights into the client assessment process. Th ey learned that client assessment is not easy. Many obstacles must be overcome, particularly related to lack of staff capacity, lack of staff resources and time, and lack of funding. But they also learned that these obstacles are not insurmountable, and that the key to overcoming them was careful planning.
Planning for client assessment includes fi rst and fore-most integrating it into the MFI’s strategic planning pro-cess. It requires asking a few simple questions early in the process about the MFI’s information needs, its technical capacity, and its available human and fi nancial resources.
Technical capacity should not be taken as a given. Building the MFI’s capacity to do client assessment is important—so important that it was the lesson cited most often by CAWG research partners.
CAWG research partners also learned about the virtues of starting small and simple and succeeding, rather than starting large and in a complicated manner and failing. Th ey learned that client assessment includes a wide range of approaches, that diff erent approaches are appropriate for diff erent organizations, and that approaches change over time in an MFI, commensurate to the MFI’s experi-ence and resources. Th ey learned about the importance of institutionalizing client assessment through creating a supporting organizational culture and through integrat-ing assessment into organizational systems and processes. Th ey further learned that creating a successful client as-sessment process requires that management and staff buy into the process.
CAWG research partners learned to refi ne their client assessment priorities and their information needs. Th ey learned, fi rst and foremost, that client information needed to be useful; proving impact, although important in itself, was less important than improving impact. Th ey learned,
moreover, that improving impact in turn required creation and maintenance of functioning feedback loops. Perhaps most importantly, however, the CAWG research partners learned that client information does inform manage-ment decision-making, that it does lead to organizational change, and that it does improve fi nancial and social performance.
In conclusion, the experience of the CAWG research partners demonstrates that while microfi nance is unique in many aspects, its unique qualities do not make client assessment any less important than in other industries. Th eir experiences also show that client assessment is not just a line item in the expense ledger. Client assessment is an investment in improved fi nancial and social return. Because client assessment is a core business activity, the process is appropriate for all MFIs, regardless of their size, level of sophistication, or resources.
Th is last point was perhaps best articulated by Avance Chalco, one of the smallest and most resource-constrained research partners. Its client assessment process has been anything but smooth, being characterized by starts and stops as it has tried to move along the assessment learning curve. After a few years of trial and error, Avance Chalco is beginning to fi nd its way, although many obstacles remain. It summarized its experience in the following way:
It is not necessary to have lots of experience in client assessment before beginning the process. One can learn as one goes, if one is committed to the process long-term, and if one has some good advisors. . . . If the organization can begin to do client assessment when it is small (when major systems are still being developed and more are easily implemented), it will be able to manage its growth much more intelligently.
Box 1.9 Creating Management and Staff Buy-In: The Experiences of DEMOS, Prizma, and Integra
DEMOS involved management and staff in all steps of the client assessment process, including setting research objectives, designing client-monitoring forms, conducting research, and analyzing data. This approach proved critical in creating enthusiasm for client assessment, helped make the research more consistent, and meant that the find-ings were immediately applied to a range of products and services.
Prizma’s senior managers and branch managers participated in all planning/strategy meetings for client assess-ment and in tool trainings. Branch managers also played the key role in organizing and implementing customer satisfaction focus group discussions. Field staff was not involved in the planning/strategy stage to the same extent. They were brought into the process later during the implementation phase and are now responsible for implement-ing client exit monitoring and collecting information for the poverty scorecard through the loan application.
To overcome management and staff resistance to its Client Monitoring System (CMS), the Integra Foundation (Integra) research team involved mid-level and senior management in a variety of assessment-related activities. It organized meetings with management to discuss client assessment strategy, put discussion of CMS on the agenda of regular management meetings, provided management with regular reports on the progress of CMS develop-ment, and recruited mid-level managers to participate in data collection activities.
Realizing that senior loan officers were the key to creating enthusiasm for CMS, the research team involved them in planning meetings and data collection activities. Securing the support of the senior loan officers proved to be the breakthrough in CMS development. CMS is now a regular part of management and staff meetings, and staff is fully integrated into the process. To reinforce the institutionalization process, Integra gives staff multiple opportu-nities to implement the assessment tools and makes a point to take immediate action on client information.
1.4 Summary and Conclusions
14 Lessons Learned

CHAPTER 02
BUILDING SUCCESSFUL MICROFINANCE INSTITUTIONS
BY ASSESSING CLIENTS NEEDS
Indicators
For all its complexity, the human mind can only pro-cess so much information. To get around our cognitive limitations, we have devised a number of shortcuts to measure and report complex phenomena. Th ese cognitive shortcuts are inevitably a simplifi cation of reality, but we accept them as valid because we trust that they adequately capture what we want to measure.
Th e term commonly used to describe these cognitive shortcuts is “indicator.” An indicator is a piece of infor-mation coded in a way that reduces complex phenomena into understandable, measurable, and comparable metrics. Indicators may be numerical (e.g., loan size, loan cycles, business revenues, household income or expenditures) or categorical (e.g., gender, marital status, geographic location). In either case, the codifi cation of information enables us to express complex information in understand-able and comparable formats and to perform statistical manipulation of the information for aggregation, com-parison, or benchmarking.
Substantial eff ort in client assessment has been devoted to the issue of indicators. Given the context, however, practitioners’ preoccupation with indicators is warranted. Microfi nance involves the transformation of fi nancial,
physical, and human resources into complex fi nancial and social outcomes. Some set of reasonably simple and straightforward indicators is necessary to help MFIs un-derstand and manage this process.
Th is chapter reviews important issues involved in the selection and use of client assessment indicators. Section 2.1 briefl y reviews client indicators used by a sample of MFIs. Th ese include indicators the MFIs found to be useful and not useful. Th e examples illustrate that the choice of indicators in isolation is meaningless; what matters in indicator selection is the context. Ultimately, the choice of indicators should follow from the MFI’s mission and objectives and should be appropriate to the context in which the MFI operates.
Section 2.2 describes the criteria that determine the usefulness of an indicator. Many usefulness criteria abound, some of which confl ict with each other. Choosing the best combination of indicators involves a balancing act between diff erent considerations. Section 2.3 provides in-depth case studies of the processes Integra and Prizma went through to select the indicators they now use to measure and monitor client outcomes. Finally, Section 2.4 provides concluding remarks.
2.1 Range of Possible Indicators
Th e selection of indicators is a statement of MFI priori-ties. Indicators direct attention and resources to certain outcomes rather than others, explicitly stating what the MFI values. As such, the choice of indicators is an impor-tant step toward setting quantitative targets and incentive systems that drive the MFI in a particular direction.
Th e choice of indicators also infl uences what the MFI values. A common phenomenon in organizations is for members to internalize (that is, come to accept as inher-ently valuable) the importance of indicators used to mea-sure organizational and staff performance. Th e selection of indicators thus has the potential to exert a profound impact on what MFI management and staff value and how they behave. For this reason, getting indicators right is critically important.
Table A.1 in this book’s Appendix provides a compre-hensive list of the client indicators used by the CAWG research partners. Although such lists are useful, they do not tell us anything about the usefulness of the indicators. To address this question, CAWG researchers asked 12 MFIs, some CAWG members and some not, the follow-ing questions:
1. Which is the single most important client indicator used in your organization?
2. Why is this indicator so important? 3. What other factors make this indicator useful?
Table 2.1 shows the MFIs’ responses.

MFI Most Important Indicator Why Important Factors that Make the Indicator Useful
DEMOS—Croatia Number of livestock • Measures depth of outreach.• Measures changes in livelihood.• Reflects internal agenda.
Relatively easy to collect and monitor.
FINCA International—Washington, D.C.
Daily per capita expen-diture (proxy for income poverty)
Critical indicator of social mis-sion, both for internal and external purposes.
• Global challenge for MFIs to demonstrate that they are not guilty of mission drift.• Promotes comparability between country programs.
EKI—Bosnia Whether clients are return-ees, refugees, or minority groups
• Highly correlated with vulner-ability.• Strong donor support.
Relatively easy to track.
SEF—South Africa Client dropout Research shows that dropout is strongly correlated with other client-level indicators.
• Transparent and easily understood by staff.• Easily collected, monitored, segmented, and used in staff incentive systems.
ASA—India Respondents self-classify as a healthy or unhealthy household through use of pictorial diaries
• Poor hygiene and health practices are important determinants of child-hood diseases. • Household income is drained by health-related problems.
Pictorial diaries are a valuable resource for clients and field officers to understand program impact.
FOCCAS—Uganda Initial interest in a “basic loan” of US$50
Self-targeting indicator of socio-economic status and whether group loan is appropriate.
• People can lie about other things, but loan amount is something they have to reveal. • Loan size was a key issue revealed in client-satisfaction studies.
NABW—Tajikistan Income per capita Central to institutional mission; poverty is a function of how many people have to share one salary or livelihood.
Influences decisions about how rapidly the client can repay.
ACF—Kazakhstan Number of employees • Links back to mission to focus on small- and medium-enterprise cli-ents and poverty reduction through job creation.• Program operates in areas with high unemployment.
Can be collected using standard loan applica-tion form (every 14 months) and managed in management information system (MIS).
FORA—Russia Beginning loan size and repeat business
• Beginning loan size indicates size of business and capacity of client. • Repeat business indicates stabil-ity of business. • Organizational survival is the overwhelming goal.
In a competitive environment, repeat busi-ness is a key indicator of success.
SAT—Ghana Client satisfaction • Easily digested and integrated into decisions, even at loan-officer level. • Responsive indicator that can lead to quick specific changes.
• Can be collected from individuals and tested through focus groups.• Easier for staff to see the relevance of this type of information. • Need indicators that are sensitive to rapidly changing environment.
Integra—Slovakia Client savings, life insur-ance, pension policies, and new financial investments
• Proxy of success in reducing vulnerability.• Proxy for strategic household risk management.
• Part of a complex and comprehensive data collection and analysis system.• Linked to training and credit.
Prizma—Bosnia Client poverty status Measures outreach relative to mis-sion.
• Can be integrated into the loan applica-tion process. • Very flexible for analysis. • Easy to collect; avoids complex questions.• Transparent in the organization at all levels.
Table 2.1 Most Influential Client Indicators for 12 MFIs
16 Indicators

As seen in Table 2.1, each MFI identifi ed a diff erent indicator as being the most important to the organization. Some indicators focus on client outcomes (e.g., number of livestock, expenditures, income), while others focus on service quality (e.g., client satisfaction, dropout). Th e in-formation in Table 2.1 reinforces the point that the choice of appropriate indicators is peculiar to the context, history, mission, and objectives of the particular MFI.
By way of contrast, Table 2.2 lists a number of indica-tors that some of the same MFIs reported they had abandoned. Note that some of the important indicators listed in Table 2.1 have also been abandoned by other MFIs (e.g., household income or jobs created). Th is aban-donment does not mean one MFI is wrong and the other right. It simply means that the indicator is appropriate in the one context but not in the other.
Problem Indicator Why A Problem
Jobs created and sustained
• Very difficult to establish.• Easily misunderstood (for example, does it refer to sustainable jobs?).
Household income • Too difficult to measure.• Response bias; people do not want to reveal household income.
Food, housing, children’s education, income, and expenditures
Useful to provoke discussion with staff, but dangerous to use for management purposes because changes fluctuate so widely and for so many purposes.
Children of school age not in school
Although education is an important indicator, it suffers from a lack of clarity about whose children belong to whom in context of extended family, orphans, and frequent changes in family composition.
Gender empowerment Too costly and time-consuming. Sufficient now just to monitor number of women in database.
Number of dependents • Difficult to define and interpret.• Less relevant for larger businesses.
Business income • Too complex and requires too much work. • Answers were quite arbitrary and inaccurate.
Household unemployment
Too difficult to define precisely (e.g., students, those working part-time, the elderly).
Table 2.2 Examples of Indicators Rejected by MFIs and Reasons for Rejection
In the end, MFIs must use their own judgment in select-ing the indicators most useful to them, and diff erent MFIs will consider diff erent criteria in making this selec-tion. Th is section recommends 12 selection criteria that MFIs may want to consider: (1) link to mission, (2) link to use, (3) reliability, (4) sensitivity, (5) scope, (6) simplic-ity, (7) comparability, (8) context specifi city, (9) practical-ity, (10) cost-eff ectiveness, (11) function, and (12) ability to operationalize. Each criterion is discussed below.
Link to Mission
Link to mission means that the indicator is linked directly or indirectly to the MFI’s institutional mission. Indicators that satisfy external accountability requirements are also important but should not distract the MFI from its own mission. Th e MFI’s mission should in turn refl ect what it can achieve in a particular environment and how. Some-times, the diffi culty of choosing appropriate indicators may refl ect a deeper problem—that the MFI’s mission itself is unclear or unrealistic.
Link to Use
Link to use requires that the MFI think carefully ahead of time about how the indicator will be used. Linking an in-dicator to specifi c uses is necessary to create relevance and legitimacy for the indicator in the organization. Th e range of indicators, the frequency of collection, and the level of disaggregation should be tailored to serve diff erent information and decision-making needs, ranging from immediate operations to long-term strategic planning.
Linking indicators to institutional mission and use is an essential element of integrating indicators and client assessment into strategic planning. Linking indicators to mission and use in turn links the MFI’s values to its activities, thereby helping it manage its progress toward its fi nancial and social objectives.
Reliability
Reliability means that the indicator measures what it is Reliability means that the indicator measures what it is Reliabilityintended to measure. In the case of social performance
2.2 Criteria for Indicator Selection
Indicators 17

indicators, the reliability criterion requires the MFI to conceptualize a plausible causal chain between indicators and expected social changes.
Th e impact causal chain includes four links, each of which represents a diff erent level of understanding organizational performance: inputs, outputs, outcomes, and impacts. Inputs are the resources to run the program, including the money, people, time, facilities, and equip-ment. Outputs are the direct and measurable products of program activity, such as the number of clients, number of loans, outstanding loan portfolio, repayment rate, reten-tion rate, number of clients trained, or number of lessons given.
Outcomes are observed changes in clients’ behavior or well-being and include such indicators as enter-prise profi ts; household income, expenditures, or asset ownership; empowerment; educational opportunities for children; participation in the community; or intrahouse-hold decision-making. Finally, impacts are the outcomes attributable to the program that exceed what would have happened anyway.
Inputs are useful indicators for understanding organi-zational performance in terms of level of eff ort, level of commitment, or compliance with contractual mandates. Outputs are useful indicators for understanding organi-zation performance in terms of factors such as program growth, level and quality of service, or outreach. Where no information exists on outcomes or impacts, inputs and outputs may be used as proxies. Th e legitimacy of this approach depends on the extent to which the outcomes or impacts can reasonably be inferred from the inputs or outputs. Cases in which such inferences can be made from inputs are relatively rare, making inputs a generally unreliable indicator of program performance.
In contrast, a stronger theoretical link exists between outputs and outcomes and impacts. An example of an output with a strong theoretical link is vaccinations. Chil-dren inoculated against a disease are very likely to avoid contracting the disease. In contrast, taking a loan does not guarantee larger enterprise profi ts. Many other factors related to the organization, the client, and the environ-ment may intervene and sever the causal link between the loan and enterprise profi ts. Th us, although outputs are generally more reliable than inputs as indicators of orga-nizational performance, they are often far from reliable indicators themselves.
Impacts are the most reliable indicators of organi-zational performance. Ideally, client assessment would focus on impacts, but such a focus is unrealistic given the resource and technical demands of demonstrating causal-ity. Th e second-best solution from a reliability perspective is for client assessment to focus on outcomes. Outcomes do not necessarily imply causality, but they are the next best thing.1do not necessarily imply causality, but they are the next
1do not necessarily imply causality, but they are the next
MFIs can take many actions to validate the reliabil-ity of outcome indicators. If resources permit, a direct comparison can be made to the underlying variable or to some other known proxy. Th is approach requires advanced sampling and statistical methodological know-how, which limits its applicability. Other ways to validate the reliability of indicators include comparison to statistical studies done elsewhere, borrowing of indicators that have already been tried and tested in similar contexts, triangu-lation from other data sources, or comparison to staff and clients’ experience.
Reliability also means that the data collected is free from signifi cant measurement error, biases, coding errors (errors in completing data collection forms), and data entry errors. Ensuring the quality of data requires good training, data collection monitoring, data validity checks, and other forms of quality control. (For more informa-tion, see Chapter 4, Data Analysis.)
Sensitivity
Sensitivity has two components: sensitivity of the un-Sensitivity has two components: sensitivity of the un-Sensitivityderlying variable the indicator is trying to measure and sensitivity of the indicator itself. Sensitivity of the under-lying variable refers to how much the variable is expected to vary over time. Useful indicators measure underlying variables that are expected to show reasonable variation over time, particularly as a result of program participation. Th e education level of clients, for example, is not expected to vary much over time and is thus not a useful indica-tor of program eff ectiveness. Household asset ownership, on the other hand, varies considerably over time and can theoretically be linked to program participation, thus making it a potentially useful indicator.
Sensitivity of the indicator itself refers to whether the indicator changes roughly in proportion and in the same direction as the underlying variable. For example, researchers generally prefer not to use household income to measure changes in poverty because income can fl uctu-ate widely over the short term depending on seasonality, shocks, and other factors not necessarily refl ective of ac-tual changes in household well-being. Instead, household expenditures are generally considered a superior indicator of household well-being because they tend to be more stable in the short-term, while still sensitive over time to actual changes in household well-being.
Scope
Scope refers to comprehensiveness, or range, of out-Scope refers to comprehensiveness, or range, of out-Scopecomes being measured. Client indicators measure client outcomes at one of four levels: individual, household, enterprise, and community. Of the more than 100 unique indicators collected by CAWG research partners, most
1. Outcomes may be direct or indirect. Direct outcomes follow from the outputs, while indirect outcomes follow from direct out-comes. In the case of loans or training, examples of direct outcomes are money invested in the business or behaviors adopted. Th ese outcomes lead to other indirect outcomes, such as increased enterprise profi ts, household income, or household expenditures. Most outcome indicators used by MFIs measure indirect rather than direct outcomes.
18 Indicators

were at the household or enterprise levels, followed by indicators at the individual level. Community-level indi-cators were rare.2 Table A.1 in the Appendix illustrates the range of indicators at each level.
Ideally, scope would include enough indicators to answer all the MFI’s research questions, but this might not be practical, particularly for MFIs at early stages of the client assessment process. No ideal number of indica-tors exists. Th e appropriate scope will be a function of the MFI’s information needs, time, resources, and technical capacity. Notwithstanding, a common mistake made by MFIs early in the assessment process is to try to collect too many indicators.
Th erefore, a general recommendation is that MFIs focus initially on only a small handful of key performance indicators and then only increase the number of indica-tors, commensurate with changes in need, resources, time, and technical capacity. Focusing initially on a small set of indicators is recommended for the following reasons:
1. It forces the MFI to be explicit about and concen-trate on its mission and operational objectives.
2. It avoids imposing excessive data collection duties on fi eld staff , while still giving management valuable information on program eff ectiveness.
3. It is easier to manage and analyze. Using a large number of impact indicators often unnecessar-ily complicates the data management and analysis process.
4. Management is likely to end up focusing on certain indicators and ignoring others anyway, either because it deems them less important or because they yield less useful information.
Erring on the side of too few indicators rather than on the side of too many indicators is a better tactic.
Simplicity
Simplicity means the indicator should be simple to collect Simplicity means the indicator should be simple to collect Simplicityand simple to understand. More specifi cally, simplicity requires that (1) data collection take only a minimum amount of time, (2) data collection not require detailed computations by clients or staff , and (3) staff can easily explain, and clients can easily understand, the indicator.
Simplicity also means keeping the process itself simple and avoiding doing too much, given available resources. Th is criterion confl icts with that of scope. One way to resolve this confl ict, as suggested above, is to start small and adjust the number of indicators collected over time as appropriate.
Another way to simplify the process is to convert several indicators into a single composite indicator that is easier to use, analyze, and interpret. (See Box 2.1 for examples.)
Collecting indicators on a sample of clients rather than a census of clients may also simplify the process. Several CAWG research partners began collecting indicators from a census of clients only to fi nd that it unduly taxed their fi eld staff , stressed their data management capabili-ties, and overly complicated data analysis. Collecting indicators from a sample of clients also enables the MFI
to collect a wider variety of indicators, because it can now either collect more indicators from fewer clients, while still keeping the workload manageable, or collect diff erent indicators from diff erent samples of clients. Of course, a danger of sampling is that it can compromise reliability if the samples are not suffi ciently representative.
For MFIs that can manage collecting indicators from all clients, they should consider doing so, particularly if the purpose is client monitoring. A general fi nding of the Imp-Act project is that operational monitoring of clients’ impact and detailed analysis are done better with a client census than with a client sample, particularly after the analysis is broken down to the level of individual loan offi cers or administrative units.
Box 2.1 Poverty Indexes at ASA and CARD
ASA and the Center for Rural and Agricultural Devel-opment (CARD) use household indicators to construct poverty indexes, composite indicators that serve as a proxy for household poverty status. ASA uses a housing index that consists of four indicators: the size, structural condition, roofing material, and wall material of the applicant’s house.
CARD uses a much more complex index of 12 indicators: size, structural condition, and roof material of the house; the age, educational attainment, and civil status of the client; the number of household members, number of income earners, and sources of income; household income and productive assets; and whether the applicant is endorsed by the local program center.
2. Serious attempts to measure community-level impacts are rare due in part to the inherent diffi culties of measuring community-level impacts with household-level survey data, but also because community-level impacts do not appear to be as high a priority among MFIs.
A common mistake made by MFIs early in the process is to
try to collect too many indicators.
Indicators 19

Another issue related to simplicity (and also to reli-ability) is the degree of precision required of the indicator. Categorical indicators that measure, for example, direc-tion of change (such as decreased, no change, increased) or attitudes (such as disagree, no opinion, agree) are typically easier for clients to answer than indicators that require precise numerical estimates. Categorical questions, common in public-opinion surveys done by professional survey fi rms, are a legitimate and reasonably accurate way to capture information about experience, beliefs, and attitudes. Th e downside of categorical indicators is that they are bounded (can only change so much either up or down) and only change in discrete jumps from one category to another. Categorical indicators may or may not be more accurate than numerical indicators.3
Comparability
Comparability means that the indicator is comparable Comparability means that the indicator is comparable Comparabilityacross MFIs, contexts, countries, and other entities. Com-parability is a necessary condition to compare fi nancial or social performance to other institutions or to performance benchmarks.
In some respects, fi nding comparable social perfor-mance indicators is the Holy Grail of client assessment. So far, however, fi nding this Holy Grail has proved elusive, owing to the multitude of social-performance objectives and the practical diffi culties in measuring social outcomes. Th e practical diffi culties may conceivably be solved someday, but the diffi culties owing to diff erent so-cial-performance objectives will always exist. Th us, if the Holy Grail of client assessment is ever discovered, it will likely consist of a relatively small number of comparable, general indicators.
Context Specificity
Context specifi city refers to how relevant the indicator is Context specifi city refers to how relevant the indicator is Context specifi cityto the specifi c context of the MFI. Th e obvious danger of generally comparable indicators is that indicators developed for one purpose and in one context will not be helpful in another.
Th e tension between comparability and context specifi city in choosing indicators refl ects also a tension between organizational and social objectives. To the ex-tent that indicators refl ect an MFI’s mission and drive its operation, they are an important statement of the MFI’s autonomy and independence. Consenting to use com-mon indicators, on the other hand, is a way of expressing solidarity with other organizations and promoting the broader social objectives of microfi nance.
Practicality and Cost-Effectiveness
Practicality refers to the feasibility of collecting an indica-Practicality refers to the feasibility of collecting an indica-Practicalitytor given the MFI’s resources and capacity. Cost-eff ective-
ness compares the usefulness of an indicator with the costs ness compares the usefulness of an indicator with the costs nessof collection. Often, practicality and cost-eff ectiveness converge, but not all the time. An indicator that is feasible and inexpensive to collect may or may not provide useful information to the MFI.
Th e feasibility and cost-eff ectiveness of collecting and analyzing indicators can be improved by integrating these tasks into routine activities, such as loan appraisal and re-porting of portfolio information. Th e MFI may also face a tradeoff in having to choose between indicators that most accurately refl ect organizational goals and proxy indica-tors of these goals that are easier to collect reliably.
Th e MFI also needs to take into account the demands data collection places on clients’ time. Clients should not be treated as if their time is free. Ethical issues that arise when questions become intrusive by asking for divulgence of embarrassing, private, or sensitive information should also be considered. A good rule is to be able to explain to any client why the information requested is needed.
Th e practicality and cost-eff ectiveness of indicators should be determined before pilot-testing. (Pilot-test-ing also helps determine the sensitivity of the indicator and improves its reliability.) As a general rule, conduct-ing pilot tests of all indicators is necessary to determine whether (1) questions are worded appropriately, (2) clients understand and can answer the questions with a reason-able degree of accuracy, (3) those responsible for data collection can ask the questions and code the answers appropriately, (4) the process does not place unreasonable burdens on fi eld staff or clients, and (5) the indicators yield useful information, both in isolation and combined with segmentation variables (see below). Th e MFI needs to be prepared to make midstream adjustments based on the results of the pilot test. Pilot tests should involve only a sample of clients and last long enough that the MFI is confi dent in the results.
Function
Function refers to how the indicators are used. Outcome and segmentation are two general types of indicators that serve two distinct purposes. Outcome indicators (dis-cussed above) measure the outcomes the MFI hopes to achieve. Th ese are the crucial indicators of interest linked to the MFI’s strategic objectives.
Segmentation indicators are not of strategic interest to the MFI but rather are used to segment clients into diff erent groups for analysis. Segmentation indicators include, for example, client demographics (e.g., gender, age, household size, education status, location) and client program participation (e.g., time in program, number of loans, repayment rate, loan products received).
Discussion about client indicators in microfi nance typically focuses almost solely on outcome indicators, probably because these indicators tell the MFI whether and to what extent the institution is achieving its orga-
3. In theory, numerical estimates are more accurate than categorical responses. Th is assumes, however, that the numerical estimates are accurately measured. In practice, numerical estimates often have signifi cant measurement errors. Depending on the degree of mea-surement error built into the point estimates, categorical responses may actually be more accurate. Of course, categorical responses have their own sources of measurement errors.
20 Indicators

nizational objectives. Nonetheless, successful MFIs are quite often those that learn how to address the needs of diff erent market segments. Combining outcome indica-tors with segmentation indicators for analysis is a useful tool to help the MFI identify the needs, wants, behaviors, and attitudes of diff erent market segments. It can also help the MFI target specifi c market segments on the basis of perceived or actual benefi t, degree of satisfaction, or retention rate.
Ability to Operationalize
Ability to operationalize refers to the ease of taking an Ability to operationalize refers to the ease of taking an Ability to operationalizeindicator from the abstract to the concrete. For example,
many MFIs include female empowerment as part of their institutional mission and objectives. Empower-ment is an abstract concept that can be operationalized using a variety of indicators, such as contraceptive usage, participation in household decisions, or the frequency of spousal abuse.
Th e best indicators are those that can be operational-ized without too much diffi culty and operationalized in a way that they meet the other criteria for indicators described above.
Th e previous sections highlighted the issues and challeng-es in selecting client assessment indicators. At some point, MFIs will need to deal with these issues. Th e experience of the CAWG research partners demonstrates that select-ing indicators “off the shelf ” is not a viable alternative. Selecting a set of appropriate indicators is a challenging process that requires a signifi cant investment of an MFI’s time and attention to do it right.
No single path leads to identifying an appropriate set of indicators. Just as appropriate indicators diff er from MFI to MFI, so will the process to identify them. Th e 12 criteria discussed above give some guidance to this process, but inevitably the process must be experienced by each MFI in its own unique way. Although the learn-ing curve can be steep, it can also be worthwhile, both in terms of what the MFI learns about itself and the client information generated.
Th is section presents detailed case studies of CAWG research partners Integra and Prizma. Both institutions confronted the issues discussed in this chapter, and each found its own unique approaches to dealing with them.
Integra
Th e process of developing client assessment indicators at Integra has been a long one. After more than three years of eff ort, Integra has yet to fi nalize the indicators to be included in its Client Monitoring System (CMS). In its response to Imp-Act Questionnaire 1, Integra wrote that the MFI was “in the process of collecting information about clients using our own questionnaire designed by loan offi cers, which is very complex and contains quanti-tative as well as qualitative indicators.” By the next year, Integra had abandoned this questionnaire because it
. . . was more academic in nature and did not draw on previous experience and existing
processes and systems of the organization. . . . As a result, loan offi cers found out shortly after starting using it that it was too costly (with regard to clients’ and loan offi cers’ time) for the information it provided. Th is resulted in high inconsistency in data collection and low quality of information collected. Th e main problem was the fact that the questionnaire was imple-mented without adapting it to our context and adjusting to our needs.
Unsuccessful in its fi rst attempt, Integra changed directions and initiated a process to focus client assess-ment on the information needs of its stakeholders. Th e initial impetus for the CMS came from donors who wanted regular reports containing impact information. At the same time, Integra realized that its current MIS did not provide the necessary operational and fi nancial information, lacked capacity to incorporate client assess-ment indicators, and was not integrated into Integra’s decision-making process. Th e confl uence of these factors led to Integra’s decision to develop the CMS. Th ey also helped ensure that the CMS was viewed as a top man-agement priority and not as a stand-alone project. Th e CMS project, moreover, became a trigger in Integra for reviewing and redesigning operations, loan tracking, and reporting.4
To begin the process of identifying indicators for the CMS, Integra consulted several sources, including its existing questionnaire, the SEEP/AIMS tools, and the Wider Impact Survey.5 Integra’s research director also conducted a review of the impact literature in micro-fi nance, the assessment literature outside of micro fi nance, and social indicators for Slovakia and Central and Eastern Europe. Key stakeholders also participated in a series of brainstorming sessions to identify potential social performance indicators.
2.3 Detailed Case Studies of Integra and Prizma
4. Slovakia is the central offi ce for several Integra affi liates throughout Central and Eastern Europe. Th e initial decision made was that the CMS would be piloted only in Slovakia and later replicated in other countries.
5. Th e Wider Impact Survey was a one-off survey of clients from three MFIs: FORA, Integra, and Help Integra Romania. Th e pur-pose of the survey, sponsored by Imp-Act, was to study the relationship between microfi nance and social capital.
Indicators 21

Th e brainstorming sessions used an iterative process to arrive at a set of indicators for the CMS. Th e fi rst itera-tion took place during a brainstorming session attended by board members, management, and staff to identify and refi ne a list of indicators to be included in the CMS. Management and staff met again to refi ne the list of indicators. A fi nal iteration followed when the research coordinator and senior loan offi cer narrowed the list to a fi nal set of indicators to be piloted over the com-ing months. Th e main criteria used to narrow down the indicators included the following:
1. Whether the indicator was relevant to the “reality” of Slovakia and other post-transition countries in Central and Eastern Europe,
2. Th e extent to which an indicator overlapped with other indicators on the list,
3. Th e ease of collecting and analyzing the indicator, and
4. Th e ease of fi nding suitable questions to operational-ize the indicator.
Underlying the indicator selection process at Integra was a clear sense of the MFI’s institutional framework. At the conclusion of the selection process, Integra settled on a set of indicators falling under the four impact domains of business impact/loan use, household impact, individual impact, and community-level impact. Th e in-dicators will be included in one or more of six question-naires Integra has developed for clients in diff erent stages of project participation. Th e six questionnaires include forms for intake, intake impact monitoring, intake busi-ness activity, impact monitoring, business activity, and exit. Table 2.3 shows the indicators selected by Integra through this process.
Currently, Integra is still in the process of pilot-testing the CMS. Already it has identifi ed some questionable indicators such as frequency of eating out and time spent with family. Final determination of which indicators will remain in the CMS will take place after the second round of data collection.
Prizma
Prizma considers measurement and monitoring of clients’ poverty status integral to assessing its social performance in fulfi llment of its institutional mission. Accordingly, Prizma has developed a poverty scorecard to measure the poverty status of its clients on program entry and to monitor their change in poverty status over time.
Th e poverty scorecard is a seven-indicator composite measure of household poverty integrated into Prizma’s loan application form (see Table 2.4). Based on cli-ents’ scores, clients are assigned to one of three poverty categories: poor and very poor, vulnerable non-poor, and non-poor.
Development of the poverty scorecard benefi ted from two activities during the spring and summer of 2002. First, focus group discussions (FGDs) were implemented dur-ing March. Second, the CGAP Poverty Assessment Tool (PAT) was implemented during the summer. Th e FGDs gave Prizma important initial information to begin think-ing about how to develop the poverty scorecard using indi-cators identifi ed by poor people themselves, and the PAT helped to triangulate the FGDs and to identify a range of indicators that might be incorporated in a scorecard.
Business Impact/Loan Use Household Impact Individual Impact Community Impact
• Proportion of loans re-paid with business income• Source of money to repay loan• Purpose for loan• Jobs created• Sales turnover• Assets• Stock• Receivables• Liabilities• Investment in premises• Increase in debt• Use of profit
• Household size and composition• Number of unemployed members of household• Source of income• Monthly expenditures• Savings• Investments• Purchase of household assets• Time spent with family and children• Holidays taken• Frequency of eating out• Frequency of having guests
• General trust• Trust in (1) family, (2) friends, (3) local govern-ment, (4) central govern-ment, and (5) strangers• Level of hope• Perception of control• Money-borrowing habits • Time spent with friends• Time spent watching television
• Number of organizations joined• Level of voluntary involvement • Local community in-volvement as entrepreneur• Local community in-volvement as individual
Table 2.3 CMS Indicators at Integra
Prizma considers measurement and monitoring of clients’ poverty status integral to assessing its social performance in fulfillment of its institutional mission.
22 Indicators
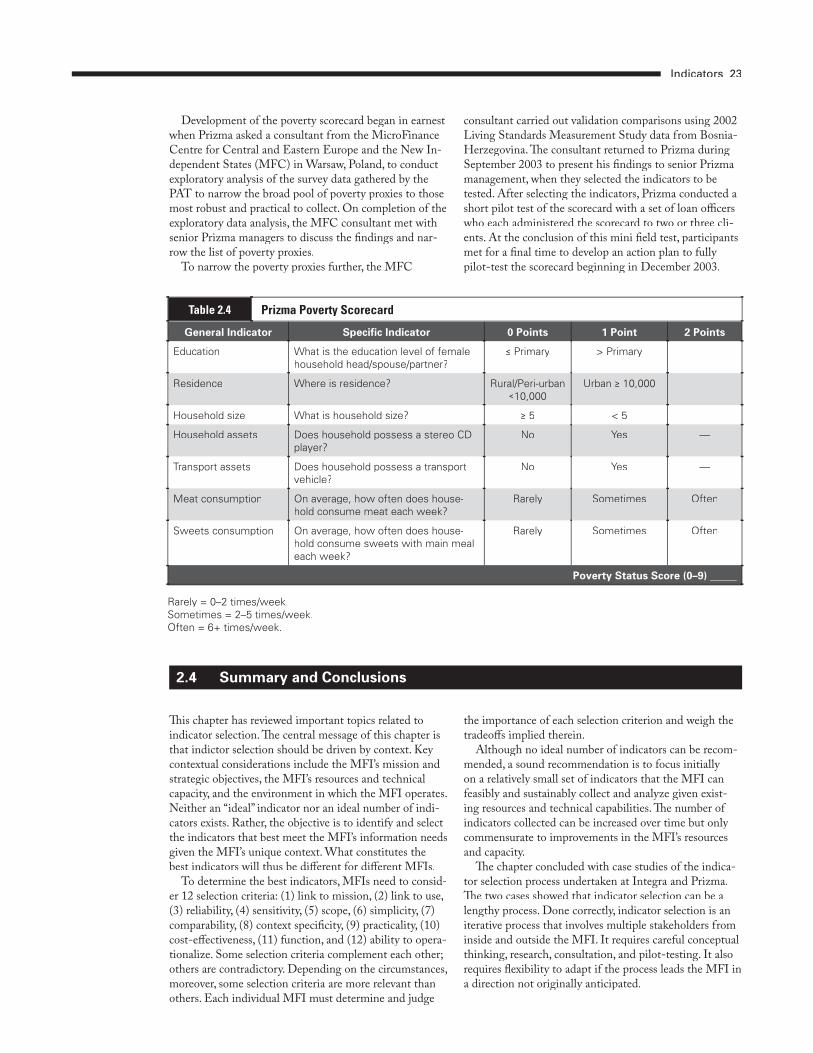
Development of the poverty scorecard began in earnest when Prizma asked a consultant from the MicroFinance Centre for Central and Eastern Europe and the New In-dependent States (MFC) in Warsaw, Poland, to conduct exploratory analysis of the survey data gathered by the PAT to narrow the broad pool of poverty proxies to those most robust and practical to collect. On completion of the exploratory data analysis, the MFC consultant met with senior Prizma managers to discuss the fi ndings and nar-row the list of poverty proxies.
To narrow the poverty proxies further, the MFC
consultant carried out validation comparisons using 2002 Living Standards Measurement Study data from Bosnia-Herzegovina. Th e consultant returned to Prizma during September 2003 to present his fi ndings to senior Prizma management, when they selected the indicators to be tested. After selecting the indicators, Prizma conducted a short pilot test of the scorecard with a set of loan offi cers who each administered the scorecard to two or three cli-ents. At the conclusion of this mini fi eld test, participants met for a fi nal time to develop an action plan to fully pilot-test the scorecard beginning in December 2003.
General Indicator Specific Indicator 0 Points 1 Point 2 Points
Education What is the education level of female household head/spouse/partner?
≤ Primary > Primary —
Residence Where is residence? Rural/Peri-urban ≤10,000
Urban ≥ 10,000 —
Household size What is household size? ≥ 5 < 5 —
Household assets Does household possess a stereo CD player?
No Yes —
Transport assets Does household possess a transport vehicle?
No Yes —
Meat consumption On average, how often does house-hold consume meat each week?
Rarely Sometimes Often
Sweets consumption On average, how often does house-hold consume sweets with main meal each week?
Rarely Sometimes Often
Poverty Status Score (0–9) _____
Rarely = 0–2 times/week.Sometimes = 2–5 times/week.Often = 6+ times/week.
Table 2.4 Prizma Poverty Scorecard
Th is chapter has reviewed important topics related to indicator selection. Th e central message of this chapter is that indictor selection should be driven by context. Key contextual considerations include the MFI’s mission and strategic objectives, the MFI’s resources and technical capacity, and the environment in which the MFI operates. Neither an “ideal” indicator nor an ideal number of indi-cators exists. Rather, the objective is to identify and select the indicators that best meet the MFI’s information needs given the MFI’s unique context. What constitutes the best indicators will thus be diff erent for diff erent MFIs.
To determine the best indicators, MFIs need to consid-er 12 selection criteria: (1) link to mission, (2) link to use, (3) reliability, (4) sensitivity, (5) scope, (6) simplicity, (7) comparability, (8) context specifi city, (9) practicality, (10) cost-eff ectiveness, (11) function, and (12) ability to opera-tionalize. Some selection criteria complement each other; others are contradictory. Depending on the circumstances, moreover, some selection criteria are more relevant than others. Each individual MFI must determine and judge
the importance of each selection criterion and weigh the tradeoff s implied therein.
Although no ideal number of indicators can be recom-mended, a sound recommendation is to focus initially on a relatively small set of indicators that the MFI can feasibly and sustainably collect and analyze given exist-ing resources and technical capabilities. Th e number of indicators collected can be increased over time but only commensurate to improvements in the MFI’s resources and capacity.
Th e chapter concluded with case studies of the indica-tor selection process undertaken at Integra and Prizma. Th e two cases showed that indicator selection can be a lengthy process. Done correctly, indicator selection is an iterative process that involves multiple stakeholders from inside and outside the MFI. It requires careful conceptual thinking, research, consultation, and pilot-testing. It also requires fl exibility to adapt if the process leads the MFI in a direction not originally anticipated.
2.4 Summary and Conclusions
Indicators 23


BUILDING SUCCESSFUL MICROFINANCE INSTITUTIONS
BY ASSESSING CLIENTS NEEDS
Client Assessment Tools
Client assessment is a means to an end. It has no inherent value; only to the extent that it leads to improved fi nancial and social return is it valuable.
Freedom from Hunger (FFH), a SEEP partner, has compared client assessment to a road trip. According to this analogy, the road trip begins at Point A, Input City, and ends at Point Z, Impact City. Th e vehicle is the pro-gram, and the passengers in the vehicle are program staff and benefi ciaries. Initially, the road to Impact City is clear and easy to follow. Further up the road, however, the pas-sengers encounter intersections and side roads, all leading to unknown destinations. Th ey are uncertain which way to go. Th ey also encounter obstructions on the road that make their trip diffi cult, slow, and hazardous. To arrive at Impact City, the passengers need a road map that will tell them whether they are on the right road and that will help them navigate around road obstructions. Th at road map is client information.
Client information, however, does not occur by itself. It requires an assessment tool and someone to apply that tool. Not just any tool can be used; the tool applied must have specifi c questions yielding specifi c answers, just as the passengers in the vehicle need specifi c answers to specifi c questions to keep them on the right road and help
them navigate around obstructions.Th e road trip analogy highlights the importance
of client assessment tools in guiding the MFI toward fulfi llment of its fi nancial and social objectives. Given the centrality of tools to the assessment process, MFIs must select the appropriate tools. In this light, this chapter reviews important issues regarding tool selection with special emphasis on the experiences and lessons learned by the CAWG research partners.
Section 3.1 describes the diff erent types of client as-sessment tools, including the key distinctions between quantitative and qualitative tools, the assessment tools implemented by the CAWG research partners, and the usefulness of fi nancial assessment tools in understand-ing social performance. Section 3.2 describes the steps in the tool selection process followed in Section 3.3 by a discussion of the common mistakes made by MFIs in tool selection. Section 3.4 provides examples of client as-sessment tools that were adapted or developed by CAWG research partners, while Section 3.5 describes some of the diff erent reasons underlying tool selection using examples from CAWG research partners. Finally, Section 3.6 sum-marizes and off ers concluding remarks.
Quantitative Versus Qualitative Assessment Tools
Th e most basic distinction in assessment tools is that between quantitative and qualitative tools. Quantitative tools aim for breadth of information that can be general-ized to all clients or to selected client groups. Quantita-tive data is used to compute central tendencies, frequen-cies, or distributions and to demonstrate relationships among variables. Th e most common quantitative tools are precoded surveys and checklists.
Qualitative tools aim for depth of information. Unlike quantitative data, qualitative data is nonrepresentative by
nature and thus not meant to be generalized to the client population. Qualitative data includes narrative expressions of beliefs, attitudes, experiences, perceptions, feelings, and emotions. Broadly, quantitative data tells us what clients do and qualitative data tells us why they do it and what they think or feel about it. Common qualitative tools include focus group discussions (FGDs), in-depth indi-vidual interviews, participatory rapid assessment (PRA) tools, or any kind of formal or informal group meeting.
Diff erent MFIs will have diff erent preferences for quantitative versus qualitative tools, depending on their information needs, resources, and technical capaci-ties. Many, however (including most CAWG research
3.1 Types of Client Assessment Tools
CHAPTER 03

partners), use both. Sometimes breadth of information is important, but sometimes depth is important. MFIs are generally advised to use both kinds of tools.
Th e client assessment tools used by the CAWG re-search partners fell generally under one of three catego-ries: market research, impact assessment, and client moni-toring. (See the introduction to this book for defi nitions.)
Market Research Tools
Market research tools make up the overwhelming major-ity of assessment tools used by the CAWG research partners. Each of the research partners implemented one or more market research tools. Th e market research tools used most frequently were client satisfaction FGDs and exit surveys. In nearly every case, the client satisfaction FGDs were based on the MicroSave market research tools or (less frequently) the SEEP/AIMS tool, while most client exit surveys were based on the SEEP/AIMS tool. Research partners also implemented several varia-tions to the client satisfaction FGD and exit survey, such as client satisfaction surveys, staff satisfaction FGDs, exit FGDs, and exit interviews.
A number of research partners also carried out market research using PRA tools. PRA tools include methodolo-gies such as seasonal calendars, historical timelines, Venn diagrams, relative preference ranking, and semistructured interviews. PRA tools were originally developed as a participatory social-research tool for rural or indigenous communities, but they have since been adapted to a vari-ety of circumstances for a variety of purposes, including market research.1
Research partners developed and implemented a number of other tools that were used primarily for market research purposes. Th ese tools included suggestion boxes, tape-recorded feedback, education learning checklists, credit association management committee meetings, cli-ent workshops, public interaction meetings, case studies, and site visits.
Most of the client assessment tools implemented by research partners were used at least in part for market research, even if they were not designed specifi cally for this purpose. Th is fi nding refl ects the fact that most client assessment tools have market research applications. For example, impact surveys yield useful information about clients’ perceptions, experiences, and behaviors, as do formal or informal meetings with clients, staff , or com-munity members.
Likewise, tools designed more narrowly for market research can yield valuable information on other topics, such as social performance. A case in point is the experi-ence of market researchers implementing the MicroSave tools among the clients of a Kenyan commercial bank. Multiple iterations of the MicroSave tools yielded a clear and consistent picture that loans from the bank played a key role in its clients’ livelihood and coping strategies.
Th e experience of the Lift Above Poverty Organisation (LAPO) Nigeria is another example. (See Box 3.1.) Client exit surveys yielded information that had potentially con-fl icting implications for fi nancial and social performance. Focusing on the fi nancial implications of the information suggested the need to refocus the targeting strategy toward the upper end of the market, while focusing on the social implications suggested the need to refocus the targeting strategy toward the lower end of the market on those who stood to benefi t most from the products off ered. Th ere are, of course, options between these two. Th e point is that because of the client exit information, LAPO was in the position to make an informed strategic decision. (Th e ex-ample also demonstrates the dangers of basing important decisions on unsubstantiated assumptions).
Impact Assessment Tools
Impact assessment tools include the set of tools used to attribute social impact to program participation. Attribu-tion typically entails a large-scale survey with statistically valid treatment and control groups. Early on, the focus of client assessment in microfi nance was disproportion-ately focused on proving impact. For reasons discussed
Box 3.1 Financial and Social Implications of High Client Exit Rates at LAPO
The Lift Above Poverty Organisation (LAPO) in Nigeria had been experiencing a high rate of client exit that was affecting its financial sustainability. LAPO implemented exit surveys to determine the causes. To the surprise of management and staff, the surveys showed that exit was disproportionately concentrated among the better-off clients. Management and staff had originally assumed that exit was primarily concen-trated among the poorer clients, making loan officers in turn reluctant to lend to poorer clients.
In hindsight, this finding was not surprising. LAPO had designed its loan product to appeal to poor wom-en living in rural or peri-urban areas. As LAPO grew, it began to move into urban areas and to target rela-tively well-off urban clients, although without adapting the loan product to this market segment. Finding the loan product unsuited to their needs, relatively well-off clients were electing to leave the program, a fact LAPO discovered by talking to ex-clients. In contrast, poorer clients generally found the product suited to their needs and were largely satisfied with it.
From a financial perspective, the relatively high rate of exit among well-off clients was a problem that threatened LAPO’s long-term financial viability. But from a social perspective, the relatively high rate of retention among poorer clients was a positive finding confirming that LAPO was successfully reaching its target market with products reasonably well suited to their needs.
1. Although designed originally for rural communities, participatory rapid assessment (PRA) tools are used in multiple settings. Th e MicroSave tools are, for the most part, adaptations of the PRA tools. A good deal of crossover probably occurs between the Micro-Save client satisfaction tools and the PRA tools. Several research partners referred to MicroSave tools or PRA tools without clearly specifying which particular tool they used.
26 Client Assessment Tools

in Chapter 1, however, proving impact has fallen out of favor among microfi nance practitioners, and the trend is moving toward more practical, managerially oriented assessment tools.
Nonetheless, demand continues to exist for impact assessments among practitioners, donors, social inves-tors, and policymakers. Most CAWG research partners conducted one or more impact assessment, although the number implementing impact assessments fell in each year to no more than a couple by the end of the project. Th e impact surveys implemented by the CAWG research part-ners can be divided into practitioner-led surveys (surveys designed and/or administered by program staff ) and exter-nal surveys (surveys designed and administered by outside researchers). Most of the impact surveys implemented by the CAWG research partners were practitioner-led.
One strategy to reduce the costs and eff ort of the im-pact assessment is to piggyback impact-related questions on broader national or regional surveys. Th is strategy was adopted by Crédito con Educación Rural (CRECER), which collaborated with USAID on the Girls’ and Women’s Educational Policy Research Activity longitudi-nal survey, and Prizma, which piggybacked questions on a nationwide omnibus survey of 1,500 households.
Client Monitoring
Client monitoring typically involves quantitative data, although it may also include qualitative data. It empha-sizes the generation of timely information about client behavior, client well-being, or institutional performance that informs management decision-making. Client moni-toring makes no pretense about attribution.
Approximately half of the CAWG research partners were in the process of designing and implementing a client monitoring system. Some of the partners took the less complicated route of adding a few questions to the existing MIS, while others elected to design a substan-tially revised MIS or create a completely new MIS that included client assessment information.
Most CAWG research partners designed the monitor-
ing systems to track market or impact-related variables related to participation in lending programs. Monitoring systems, however, do not have to be limited to fi nancial services. Monitoring systems can also be used to track indicators related to non-fi nancial services. (See Box 3.2.)
Th e routine collection of data in a client monitoring system requires an MIS capable of storing large volumes of data, performing data analysis (or exporting data to a data analysis program), and generating reports. Some MFIs overlook MIS development, only to bog down on fi nding they are not capable of managing the data collected. Th e MIS may be simple or it may be complex. It can be a sepa-rate MIS or it can be integrated into the principal MIS. Th e characteristics depend on the needs of the system and on the MFI’s resources for MIS development.
MFIs must carefully consider their data management capacities and resources for MIS development in plan-ning the client monitoring system. Th e expense and time of MIS development must be factored into the plans. Absence of a good MIS need not dissuade MFIs from implementing a client monitoring system, but it does require that they simplify their monitoring system com-mensurate with their MIS capabilities. As they develop their MIS over time, they can develop their monitoring system accordingly.
Box 3.2 Monitoring the Quality of Education Services at CRECER
CRECER (which integrates education sessions into its regular village bank meetings) has instituted a monitoring system to track key variables related to its education services. Its monitoring system captures data each month or each loan cycle (depending on the data) on the effectiveness of education service delivery by tracking indicators such as the number of persons referred to health centers, the number of persons receiving health consultations, or the quality of education sessions.
3.2 The Tool Selection Process
Tool selection is a process that includes several steps, including (but not necessarily limited to) the following:
1. Appraisal of information needs,2. Appraisal of organizational capacity and resources,3. Establishment of criteria for tool selection,4. Identifi cation of potential tools,5. Comparison of potential tools to selection criteria,
and6. Selection of tool or tools.
Th e diffi culty involved in taking steps 1 through 5 should not be underestimated. Take step 1, for example. Identifying the MFI’s information needs appears relative-ly straightforward, but it can be complex. Diff erent levels
of information address the same question (see Chapter 4), and diff erent tools perform better at getting diff erent levels of information.
Information needs also tend to be more complex than they appear on the surface. Client exit, for example, is a complex phenomenon. In exit surveys, the reasons clients give for dropping out often mask other underlying reasons, which are best discovered using more probing assessment tools, such as FGDs or in-depth interviews.
MFIs can approach the tool selection process in both good and bad ways. Th e CAWG research partners cited several successful examples of tool selection, although they also reported a number of unsuccessful examples. A list of common mistakes that MFIs make in tool selec-tion, based on the partners’ experiences, follows.
Client Assessment Tools 27

Failure to Plan
Road maps need reference points so that passengers can determine their location on the map relative to their des-tination. Two reference points at a minimum are required: the starting point and the ending point. To get to Impact City, the MFI needs to know its starting point and its ending point. In other words, planning is required.
Determining where the MFI is and where it wants to go are necessary to determining the MFI’s information needs, which in turn are necessary to select the appro-priate assessment tool. Without clarity about mission, strategic objectives, and information needs, the MFI has no reference points for tool selection. In the absence of such reference points, the odds are good that the MFI will make a wrong turn on the road to Impact City.
Failure to Match Tools to Financial and Human Resources
An important part of any client assessment plan is assess-ing the human, fi nancial, and other resources available to carry out the plan. Th e assessment tools selected should match the resources available.
In planning for complex tasks, the human tendency is to underestimate the cost and time needed to com-plete the task. Experience shows this tendency also to be prevalent in planning for client assessment. Sinapi Aba Trust (SAT) learned this lesson the hard way. In contrast, First Allied Savings and Loan (FASL) took account of its limited resources and planned accordingly. (See Box 3.3.)
Failure to Match Tools to Technical Capacity
Planning for client assessment also requires an evaluation of the MFI’s technical capacity to implement assess-ment tools. Th e technical capacity needed to implement the tool, like the tools themselves, ranges from relatively simple (e.g., suggestion box or periodic debriefi ng of loan offi cers) to relatively diffi cult (e.g., impact assessment). Not just anyone can administer a survey, facilitate an FGD, conduct an in-depth individual interview, or design an eff ective client monitoring system. Each requires tech-nical skill. In the case of qualitative tools, it also requires a way with people that puts them at ease and encourages frank and detailed responses.
Failure to Provide Adequate Training
To save money on tool implementation and compensate for the lack of technical skills, MFIs often resort to train-
ing fi eld staff or volunteers (e.g., local university students) in tool implementation. Sometimes the training is good but not always. Poor training occurs for several reasons, including inadequate time, unskilled or unknowledgeable trainers, poor screening of participants, or lack of fi eld practice.2
Turning fi eld staff or volunteers loose to gather client information without suffi cient training is a common mistake. Using inadequately trained researchers creates numerous problems (e.g., measurement error, low rates of client participation, superfi cial answers, or less-than-forthcoming responses) that can seriously compromise the validity of the data.
Th e optimum level of training is a function of the trade-off between cost and eff ectiveness. More cost translates into greater eff ectiveness (up to a point) and vice versa. Th e reality, however, is that MFIs with fewer resources are more likely to opt for less training than MFIs with more resources, with predictable results.
3.3 Common Mistakes in Tool Selection and Implementation
Box 3.3Matching Client Assessment Plans to Resources: The Experience of SAT and FASL
SAT’s initial foray into client assessment was to implement the full suite of five SEEP/AIMS tools. In its enthusiasm to implement all five SEEP/AIMS tools at one time, SAT underestimated what it would take to get the job done. The process imposed a significant logistical burden that taxed SAT’s internal resources and left staff and management burnt out at the end. In hindsight, SAT concluded that it was “bet-ter to select and implement only those tools based on the institution’s needs at a particular time.”
In contrast to SAT, FASL strategically matched its client assessment goals to its resource constraints. Unlike many other CAWG research partners, FASL did not receive external funding for client assess-ment. With only a small budget for client assess-ment, FASL decided to implement its impact survey on a piecemeal basis using selected client represen-tatives whom FASL trained in survey administration. FASL management was content to implement the survey when it could over a period of months without imposing tight deadlines. This approach was a prag-matic compromise that produced highly satisfactory results.
2. An essential part of any training is actual fi eldwork. Classroom training is rarely suffi cient by itself. Most of the real learning comes in the doing.
28 Client Assessment Tools

Failure to Acquire Knowledge of Dif-ferent Assessment Tools
To match assessment tools to the MFI’s information needs, resources, and technical capacity requires knowl-edge about available assessment tools, including the information they produce, their resource and technical demands, and their relative strengths and weaknesses. MFIs commonly perform only a cursory review of avail-able tools, preferring instead to select tools with which they are already familiar or which other MFIs are already using.
Fortunately, for MFIs that want to take the time, resources are available that describe diff erent assessment tools in reasonable depth. For some tools, this informa-tion is readily available on the Internet, including the SEEP/AIMS tools (www.microlinks.org) and the Micro-Save tools (www.microsave.org).
Almost no client assessment tool is unique to micro-fi nance. Most are contextual adaptations of tools that have long been in use in the private, public, and nongov-ernmental organization sectors. Books, how-to guidelines, Web sites, and other resources related to these tools exist in abundance and many are no more than a Google search away. Admittedly, diving too deeply into the existing re-source pool is not always an option for busy practitioners, but even the busiest of practitioners are well advised to dip their toes in the pool or to wade in as deep as they can without getting in over their heads.
Implementing Too Many Tools at Once
Another common mistake is to try to implement too many tools at once, which is a principal manifestation of poor planning. If the MFI cannot identify or prioritize its information needs, then it makes a certain amount of sense to collect lots of data, perhaps hoping to sift through it later to fi nd the useful nuggets of information. More typically, however, the MFI is soon swamped with resource and technical demands from implementing so many tools or is overwhelmed with volumes of data, most of which never gets analyzed. (See Box 3.4.)
Implementing Tools off the Shelf
Years of tool development in microfi nance have produced a number of client assessment tools. Th e ready availability of tools makes it easy to take tools and implement them “off the shelf ” without adapting them to local circum-stances. Notwithstanding, tools need to be adapted to the local context to make them optimally useful. Th e extent to which tools need to be adapted to the local context depends on the situation. Th rough planning, consultation, and experimentation, the MFI must determine if these adaptations will be minimal or signifi cant.
Poor Tool Implementation
Th e discussion to this point has focused on tool selection. Nonetheless, the fact remains that once a tool is selected someone must implement it. Numerous problems can
arise during tool implementation. Most implementation problems result from poor planning or preparation of one sort or another, including poor training, inadequate monitoring/quality control, fl aws in tool design, or poor logistical planning. (For more information on quality control, see Chapter 4, Data Analysis.) Box 3.5 provides an example of how poor tool implementation can thwart client assessment.
Overreliance on External Entities
External entities often play an integral role in tool selection. External participation can lead to constructive
Box 3.4 URWEGO Implements Too Many Tools at One Time
When URWEGO started client assessment, it had four research objectives and four corresponding assessment tools: (1) determine who clients were and whether URWEGO was reaching its poor target market (impact survey), (2) assess its strengths (entry surveys), (3) assess its weaknesses (exit surveys), and (4) assess its opportunities and threats (client satisfaction surveys). URWEGO also wanted different staff at different levels of the organization to imple-ment client assessment: loan officers to implement the entry surveys, loan officers and supervisors to implement the exit surveys, and the research and marketing department to implement the client satisfaction surveys. The impact survey was to be outsourced. After further consideration, however, management decided to drop the impact survey but retain the other three tools.
After several months of data collection, URWEGO found itself inundated with data and unable to complete the integrated data analysis it had hoped to perform. Management consequently decided instead to analyze the data separately and to focus the analysis on what clients liked and did not like and what products they wanted. This too proved to be too difficult, and management concluded that the entire assessment process was unsustainable.
On rethinking its client assessment objectives, management decided to concentrate the assessment process on generating information that would enable it to modify and create products that met clients’ de-fined needs. Management further concluded that the focus group discussion was the best tool to generate this information and decided to limit tool implementa-tion to client satisfaction FGDs. Because URWEGO already had exit survey data, management elected to analyze the existing data without undertaking ad-ditional surveys.
Management also concluded that trying to involve so many staff members in client assessment cre-ated unnecessary confusion and imposed an undue burden on staff time. Management therefore decided that loan officers and supervisors would no longer be involved in client assessment, and it turned the entire assessment process over to the research and market-ing department.
Client Assessment Tools 29

outcomes, but it also frequently produces counterproduc-tive results.
MFIs encounter a common problem when they turn the research design over to external consultants; they face the risk that a consultant will produce a research design inappropriate to the needs and constraints of the MFI, particularly if the consultant is trained and knowledge-able in advanced research methodologies. Lacking the technical know-how to critique the plan or propose valid alternatives, unsure of the resource implications of the re-search design, and perhaps intimidated by the consultant’s credentials (consultants are, after all, the “experts”), the MFI fails to exert suffi cient counterweight. As a result, it erroneously undertakes a costly, complicated, and unsus-tainable research design. (See Box 3.6 for an example.)
Box 3.5 Poor Tool Implementation in the Philippines
A Philippines MFI hired an external consultant to implement a survey to be used in constructing a poverty assessment tool. The consultant arranged for field staff to work as survey enumerators, but did not provide training or implement quality control measures.
During data analysis, analysts uncovered several problems that severely compromised the quality of the data. Staff had coded responses inconsistently, routinely skipped questions, and plugged in other an-swers. Finally, extreme variations among responses pointed to significant measurement error. The MFI was forced to abandon the survey at a cost of several thousand dollars.
Box 3.6External Research Design Proves Unsustainable at Pro Mujer Bolivia and Peru
Pro Mujer’s strategic objective for client assess-ment is to develop a more client-focused program by instituting a regular process for assessing client satisfaction, demand, and impact. Pro Mujer turned to a North American consultant to create a research design consistent with its assessment objective. The consultant created a complex cross-sectional, longitudinal research design that required observa-tions at specific, predetermined moments of time among comparison groups using a combination of assessment tools, such as surveys, focus groups, exit interviews, and in-depth interviews.
The research design proved overly ambitious. Although Pro Mujer managed to implement the first phase of the design at its program in Bolivia and Peru, it sorely taxed institutional resources at both programs and produced volumes of data that Pro Mujer did not have the time or capacity to analyze. Moreover, the research design was inflexible and did not contribute effectively to institutional learning. Not surprisingly, Pro Mujer decided to abandon the external research design while maintaining, simplify-ing, and institutionalizing some of its component tools, such as client satisfaction FGDs and short exit surveys.
According to Pro Mujer, “Now the tools respond more to satisfaction and dissatisfaction clients have regarding the program. Each tool is interconnected. Previously, they each had an independent role and their objectives were geared more toward knowing the client as opposed to the client’s actions, which is the main reason behind these new instruments.”
MFIs are by no means limited to using existing as-sessment tools. Many existing tools do not meet MFIs’ information needs or fail to satisfy other selection criteria. Th e potential variety of assessment tools is limited only by one’s imagination.
CAWG research partners implemented a number of tool innovations by adapting existing assessment tools or developing new ones. Some partner MFIs developed the tools on their own, while others developed the tools in conjunction with their North American partner or other technical service providers. Some tool innovations were complex, but many were simple, demonstrating that even simple tools or tool modifi cations can be useful.
Examples of Tool Adaptations Made by CAWG Research Partners
FOCCAS adapted the vulnerability and risk tool de-signed by Freedom from Hunger (FFH). Th e tool was
originally designed to assess client vulnerability and risk, but after pilot-testing the tool FOCCAS fi eld staff felt that it was not relevant to their clients. Consequently, the FOCCAS research manager redesigned and pretested an adaptation of the tool, now called the “client diffi cult times and coping strategies” tool, in conjunction with FFH and the FOCCAS board member in charge of education.
NABW and Partner adapted the SEEP/AIMS exit tool by conducting exit FGDs instead of the recom-mended short, individual surveys. Partner fi rst attempted to implement the exit surveys by telephone rather than with face-to-face interviews. Reaching the ex-clients by telephone, however, proved to be too diffi cult. In addition, the telephone interviews were too impersonal to obtain the depth of information needed. Partner consequently abandoned the exit survey in favor of exit FGDs.
Realizing that keeping existing clients was far less costly and more profi table than attracting new clients,
3.4 Tool Innovations
30 Client Assessment Tools

NABW further adapted the exit survey to conduct inter-views with so-called “passive clients,” defi ned as clients who have not taken a follow-on loan for up to six months. Th e passive client interview had three purposes: (1) to determine why the client had not taken a follow-on loan, (2) to assess the client’s needs, wants, and perceptions of the program, and (3) to give loan offi cers the opportunity to explain changes to program products and policies that might be of interest to the client, given his or her needs, wants, and perceptions.
Th e Kenyan Rural Enterprise Programme (K-Rep), NABW, and ASA adapted the SEEP/AIMS client satisfaction tool to conduct research with staff , boards of directors, and community leaders. K-Rep instituted a process of biannual FGDs with directors of its fi nancial service associations (FSAs) and members of communities in which the FSAs operated. Th e purpose of the FGDs was to identify diff erences of opinion and areas of consen-sus among FGD participants and encourage a collective response to the issues identifi ed. NABW had originally planned to conduct FGDs with non-clients but decided instead to conduct the FGDs with loan offi cers. Th e loan offi cer FGDs covered loan product attributes, clients’ likes and dislikes, recommendations for change, and reasons for client dropout.
Basing its conclusions on its experience, ASA deter-mined that conducting FGDs with clients only was not suffi cient. Clients’ responses were often confusing, or they confl icted with each other. To clarify the clients’ FGD responses and gain a deeper understanding of the issues, the ASA research team conducted FGDs with middle management at the branch level and senior management at the head-offi ce level. Th ese discussions have proved to be a good way for ASA to cross-check and validate the fi ndings from the client FGDs.
Box 3.7 describes the tool adaptations used by CARD.
Examples of New Tools Developed by CAWG Research Partners
FFH developed a new assessment tool called the “credit association and education learning checklist,” which as-sesses the quality of education services delivered by MFIs. FFH pilot-tested the checklist tool with its partner insti-tutions CARD, CRECER, and FOCCAS. Th e checklists are pre- and post-minisurveys of client knowledge and practice conducted with small samples of clients (typically 19) using the Lot Quality Assurance Sampling approach. Th e specifi c objectives of the checklist are to clarify standards for village bank meetings and group facilitation, provide feedback to fi eld agents, appraise staff perfor-mance, and identify areas for further in-service training and discussion. Th e results of the surveys can also be used to compare client knowledge and practices between branches off ering and not off ering education services.
FOCCAS also created its own tool to gather client feedback, as described in Box 3.8.
Th e Asian Credit Fund (ACF) and K-Rep developed a tool that uses in-depth client case studies to assess
Box 3.7 Tool Adaptations at CARD
The CARD has made several adaptations to the SEEP/AIMS tools. It adapted the SEEP/AIMS client satisfac-tion tool into a staff satisfaction tool in which CARD assessment specialists facilitate discussions among managers and technical officers about satisfaction with CARD business practices, policies, and market offerings and elicit recommendations for change. The findings from the original staff satisfaction exercise formed the basis for a simplification workshop in which CARD staff streamlined the forms, procedures, and policies deemed as hindrances to its operational efficiency.
Before implementing the exit tool, CARD used participatory wealth ranking to stratify dropouts by poverty status and integrated loan utilization check-lists into the exit survey to discern whether and how exit was related to poverty status and loan utiliza-tion. It then integrated the exit survey into its regular audit function and eliminated questions it did not find useful.
To increase the cost-effectiveness of the empow-erment tool, CARD administered the tool to small groups of women rather than to individuals as recom-mended. CARD also modified the impact survey by including additional questions regarding household poverty.
Box 3.8 Credit Association Management Committee Meeting at FOCCAS
FOCCAS developed a new tool called the Credit Association Management Committee Meeting. The purpose of the tool is to meet with members of the Credit Association Management Committee and the local community to obtain feedback on concerns raised in past research and share experiences and problems in managing credit associations. The FOCCAS operations staff conducts the meetings using this tool, which the training manager, branch managers, and field officers developed. Field officers organize the meetings with their own credit associa-tions but generally keep a low profile at the meetings. After the meetings, credit officers report the results back to their credit associations.
FOCCAS created this tool because (1) it was deemed an inexpensive, quick, and effective way to get client feedback on the market offerings and program changes; and (2) it involved large numbers of people and was participatory, interactive, and iterative. The meetings meshed well with FOCCAS’ desire for clients, staff, management, and community members to address issues of common concern, share experiences, and discuss recommendations in a friendly and open environment. So far, FOCCAS has held more than 58 credit association management committee meetings with 2,720 clients and influential local leaders.
Client Assessment Tools 31

program impact. At ACF, business development special-ists prepare case studies at least four times a month that describe the changes in clients’ lives and businesses and ACF’s role in these changes. At K-Rep, the research team conducts case studies across a range of locations to obtain a qualitative portrait of how the program is working at the grassroots level, what people perceive about the pro-gram, and what the impacts, or lack of impacts, have been.
Nirdhan Utthan Bank Limited (Nirdhan) has devel-oped two qualitative assessment tools: the client work-shop and the public interaction meeting. Client work-shops are day-long participatory workshops attended by
Nirdhan center chiefs, branch managers, and central offi ce representatives. Public interaction meetings are organized by branch offi ces when and where needed. Th e meetings are attended by local leaders, teachers, other prominent community members, and local Nirdhan managers. Th e purpose of client workshops is to review programs, policies, and products and discuss areas for change and improvement. Th e purpose of the public interaction meet-ings is to disseminate information on Nirdhan programs and policies and to get feedback on the program from community members.
Th e experience of the CAWG research partners dem-onstrates fi ve reasons an MFI might choose one assess-ment tool over another: familiarity, external pressure, and opportunistic, reactive, and strategic reasons. Th ese reasons are by no means exhaustive or mutually exclusive, and none are wrong or right. Th e correct reason for selecting a tool depends on the circumstances at the time, although the presumption is that over time MFIs will become more strategic in tool selection.
Th e remainder of this section presents case studies demonstrating each of the fi ve reasons in practice. Th e examples also demonstrate how MFIs embark on client assessment for one reason but transition to other reasons mid-process.
Familiarity
As noted above, the tool selection process can be compli-cated. To simplify the process, it makes sense for MFIs to stick with tools that are familiar, particularly when the MFI is in the early stages of the assessment learning curve or the tools enjoy reasonable credibility. Both fac-tors help explain the CAWG research partners’ preference for the MicroSave and SEEP/AIMS tools.
Within the universe of client assessment tools, prob-ably none are as well-known as the MicroSave and SEEP/AIMS tools. Th e SEEP/AIMS tools gained popularity as the fi rst “practitioner-friendly” client assess-ment tools. Th e MicroSave tools arrived on the scene a bit later and have since become the most widely used tools in the industry. Both sets of tools are adaptations of well-established research tools outside of microfi nance. Yet, for microfi nance practitioners hungry for practical assessment tools, the SEEP/AIMS and MicroSave tools represented breakthrough developments. Th e need, combined with heavy investment in publicity and the hard work of a core of dedicated trainers, has helped propel the tools to the forefront of the industry.
External Pressure
External pressure comes from a variety of sources, such as donors, investors, North American partners, or networks,
and it can be positive or negative. It ranges from a North American partner leveraging its infl uence to collabo-rate on tool development or implementation to a donor compelling implementation of a tool as a condition for funding. Th e experience of FOCCAS is an example in which external pressure from a North American partner led to a benefi cial outcome.
At the behest of its partner FFH, FOCCAS pilot-test-ed a highly conceptualized set of monitoring tools called “Progress Tracking.” Progress Tracking included several components, such as various participatory market research tools, minisurveys, credit association FGDs, a vulnerabil-ity tool, spot checks of credit association learning sessions, and a portfolio monitoring system.
During Progress Tracking’s pilot test, FOCCAS de-termined that most components of this set of tools were not relevant to its clients’ experience or its information needs. FOCCAS decided, therefore, to abandon Progress Tracking but to retain some of the simpler elements that served management’s information needs, including those pertaining to market research and spot checks on staff performance. Basing its action on its experience with Progress Tracking, FOCCAS developed the Credit Asso-ciation Management Committee Meeting. (See Box 3.8.)
Th rough the process of trial and error in piloting the externally designed and motivated assessment tool, FOC-CAS clarifi ed its assessment objectives and transitioned from an externally initiated comprehensive impact moni-toring and assessment system with detailed conceptual-ization to the ongoing use of participatory assessment and market research.
Opportunistic Reasons
An opportunistic MFI takes advantage of off ers to imple-ment assessment tools in exchange for technical assistance or funding. Among the CAWG research partners, CARD is one of the better examples of an opportunistic MFI. CARD is a large, rapidly growing, and innovative MFI that has been able to attract relatively large amounts of donor funding and technical assistance to learn about or implement a variety of client assessment tools.
3.5 Reasons for Selecting Client Assessment Tools
32 Client Assessment Tools

CARD was initially invited by CASHPOR3 to partici-pate in the customization of the SEEP/AIMS empower-ment tool among Philippine Grameen Bank replicators. During this process, CARD also learned to use the SEEP/AIMS exit survey. It was later invited to partici-pate in an evaluation of a peer Grameen Bank replicator at which staff were trained in all fi ve SEEP/AIMS tools. CARD has also taken advantage of opportunities to send staff to receive training in the MicroSave tools and has received substantial technical assistance from FFH in developing and testing the Progress Tracking tool.4
Reactive Reasons
A reactive MFI initiates client assessment in response to adverse fi nancial or other outcomes, such as an increase in client exits, a drop in portfolio growth rates, or an increase in portfolio-at-risk. DEMOS is an example of a reactive MFI. Th e low demand for its services instigated its foray into client assessment.
In contrast to CARD, DEMOS is a small MFI with little visibility and little access to resources. Absent similar opportunities to experiment with client assess-ment, DEMOS has taken a decidedly diff erent path from CARD. After years of low growth and slow progress toward fi nancial sustainability, management concluded that the major impediments to growth were the low demand for services and a rise in repayment delinquency. It decided to invest in client assessment to determine the causes and cures.
DEMOS was familiar with the SEEP/AIMS tools but considered them to be too complicated, too expensive, and inappropriate for its information needs. It chose instead the MicroSave tools, which it later implemented with the fi nancial and technical assistance of the MFC.
Although DEMOS’ original motivation to undertake client assessment was reactive, it has since taken signifi -cant steps to institutionalize its client assessment system. It continues to implement the MicroSave tools, albeit on a strategic basis depending on its information needs at the time, such as before entering new areas or to introduce new products. Currently DEMOS is reviewing the extent to which its information systems need to be refi ned and the kind of capacity building still required, and it is in the process of integrating information from its market research into its MIS. For another example of reactive client assessment, see Box 3.9.
Strategic Reasons
Strategic client assessment occurs when the assessment tools selected follow from careful consideration of the MFI’s mission and strategic objectives. Prizma is an example of strategic client assessment.
Prizma’s involvement in client assessment was driven early on by two strategic objectives: (1) to demonstrate that it was fulfi lling its mission and serving poor women and their families, as well as improving their well-being over time; and (2) to better segment its market, thereby enabling it to target and reach low-income female micro-entrepreneurs with enterprise loans and other fi nancial services.5
In line with these two strategic objectives, Prizma initially established fi ve client assessment objectives and selected fi ve corresponding client assessment tools (in parentheses): (1) assessing who is poor in the Bosnian context and how Prizma can serve them better (entry and exit interviews, short client surveys, FGDs), (2) assessing whether clients’ well-being is improving (exit interviews, FGDs), (3) assessing whether client dropout is signifi -cant and why (exit interviews, FGDs, impact survey), (4) assessing the individual-level impact of program participation (impact survey, FGDs, exit interviews), and (5) assessing the household-level impact of program participation (impact survey, FGDs, exit interviews).
Prizma later determined that its list of client assess-ment objectives was too ambitious, so it decided to set some issues aside temporarily and fold the remaining issues together under the project “Profi ling Poverty and Deepening Outreach,” incorporating a new set of strate-gic assessment objectives and corresponding assessment tools. Th e new strategic objectives were to (1) measure and deepen outreach, (2) improve service quality and institutional performance, and (3) measure and improve social impact.
Th e corresponding assessment tools included the poverty scorecard, an exit monitoring system, and client FGDs. Th e exit monitoring system is a nine-question, semistructured interview integrated into Prizma’s MIS. Focus group discussions are used to answer questions related to Prizma’s mission of reaching, serving, and impacting poor female microentrepreneurs.
Box 3.9 Reactive Client Assessment at FASL
External forces or other institutional factors can bring about a change in the motivations to undertake client assessment. FASL began the client assessment process with the primary objective to assess its im-pact on clients. But then things changed. Within the second year after joining the Imp-Act project, FASL recorded a client dropout rate of 40 percent among clients of its principal loan product. As a result, management decided to implement an exit survey to assess the primary reasons for the high dropout rate.
3. CASHPOR is a network of Asian Grameen Bank replicators.4. Of all the CAWG research partners, CARD has probably engaged in the most aggressive and wide-ranging client assessment ac-
tivities. To say that all of CARD’s client assessment activities have been opportunistic would be a gross oversimplifi cation. Strategy has also played a key role in the process.
5. Concerning the second strategic objective, Prizma had strategically positioned itself in the low end of the competitive Bosnian microfi nance market. Most other Bosnian MFIs target clientele near or above the poverty line.
Client Assessment Tools 33
Th is chapter has reviewed important issues related to tool selection. MFIs can choose from several assessment tools (most being contextual adaptations of assessment tools used by researchers in other sectors), or MFIs can devise their own assessment tools. Th e number and variety of assessment tools are limited only by one’s imagination.
At the most basic level, assessment tools are designed to extract quantitative or qualitative data. Quantitative tools aim for breadth of information, while qualitative tools aim for depth of information. In practical terms, quantitative data tells us what clients do, and qualitative data tells us why they do it and what they think or feel about it. Quantitative tools and qualitative tools require diff erent skill sets. MFIs need to determine early in the process whether they want quantitative or qualitative data, although a general recommendation is to collect both kinds of data if feasible.
Assessment tools can be further divided into mar-ket research tools, impact assessment tools, and client monitoring tools. Although each category of tool serves a distinct purpose, substantial crossover exists in terms of both tools and uses. In particular, all assessment tools can yield important information on marketing-related issues and on program eff ectiveness (that is, impact).
Tool selection is a process involving several steps, in-cluding appraisal of information needs and organizational capacity and resources, establishment of selection criteria, identifi cation of potential tools, comparison of tools to selection criteria, and actual selection of tools. Regarding organizational capacity, matching assessment tools to the MFI’s MIS, particularly in the case of client monitoring, is important.
MFIs make many mistakes in the tool selection process. Common mistakes include the failure to match tools to the MFI’s fi nancial and human resources and its technical capacity, inadequate training, failure to acquire knowledge about potential tools, implementing too many tools at one time, implementing tools off the shelf, poor tool implementation, and overreliance on external entities.
MFIs weigh several criteria when selecting tools. Broad criteria include familiarization with a tool or tools, reaction to internal or external events, opportunism, and strategic considerations. Tool selection should be driven by need and context, although the assumption is that as MFIs move up the assessment learning curve they will show an increased tendency toward strategic selection criteria.
Despite the diffi culties related to tool selection and the numerous mistakes made, the CAWG research partners managed to implement a wide variety of tools, including a number of new and innovative ones. Research partners also made several adaptations to existing tools, which made them more relevant to their unique context.
Th e experience of the CAWG research partners demonstrates that tool selection is a challenging yet surmountable hurdle that even small and neophytic MFIs can surmount with planning and eff ort. Th eir experience also shows that tool selection is likely to be an iterative process, with the fi nal choice of tools determined only through trial and error—none of the CAWG research partners settled on the fi rst tool they fi rst implemented. Th us, fear of making mistakes should not be a deterrent but rather embraced as a natural and instructive part of the tool selection process.
3.6 Summary and Conclusions
34 Client Assessment Tools

BUILDING SUCCESSFUL MICROFINANCE INSTITUTIONS
BY ASSESSING CLIENTS NEEDS
Data Analysis
CHAPTER 04
Client data is a raw material. Like all raw materials, it has minimal value by itself but achieves its maximum value through transformation into a fi nished product. Th e transformation process begins with planning for client assessment and ends when decision-makers act on the basis of client information. In between these two steps are important steps in the transformation process, notably data collection (raw material extraction), data analysis, and reporting. Each step in the transformation process is linked to the others through a client assessment value-added chain.
A weak link at any point in this value-added chain can disrupt or cause the breakdown of the transforma-tion process. Th e preceding chapters of this book have discussed planning, indicators, and tools, all important links in a client assessment value-added chain. Yet, the steps that follow—in particular, data analysis—are also important. Client data by itself has little value for decision-makers. Transforming data into information that management can understand and use requires data analysis.
Despite the importance of data analysis in the client assessment value-added chain, it has received relatively
little attention. MFIs will often invest substantial time and resources in earlier steps in the process (e.g., indicator and tool selection and implementation) but invest com-paratively little time and few resources in data analysis.
Th us, it is not surprising that the CAWG research partners cited lack of data-analysis capacity as one of the two most signifi cant obstacles to client assessment. Anecdotal evidence from other MFIs suggests that the research partners’ experience is not unique. Th e result is that many MFIs are struggling to transform client data into useful information that not only benefi ts the MFI but also demonstrates the usefulness of client assessment to skeptical industry stakeholders.
Th is chapter reviews key issues in data analysis. Sec-tions 4.1 through 4.5 describe at length how data analysis is linked to the other steps in the client assessment pro-cess, including establishing research objectives, determin-ing information needs, assessing organizational capacity, and creating the research design. Section 4.6 discusses segmenting clients into groups for analysis, while Section 4.7 reviews the importance of data quality control to data analysis. Section 4.8 summarizes the chapter and off ers concluding remarks.
Th e diffi culties inherent to data collection (which in-clude indicator and tool selection and implementation) contribute indirectly to the industry’s diffi culties with data analysis. Because data collection is one of the initial obstructions the MFI must confront, MFIs focus their at-tention on navigating around this obstruction. In contrast, data analysis is a later step in the assessment process. By the time MFIs consider or attempt addressing this step, they fi nd themselves unprepared for the challenge.
An appropriate analogy might be that of a traveler who must cross high mountains and traverse a hot desert to reach her planned destination. Th e mountains are the fi rst obstacle encountered. Many people have tried to cross them and returned to tell about it, so the traveler is well
informed of the diffi culties they pose. In contrast, the desert lies beyond the mountains, and many fewer people have reached that point and returned to tell about it, so the traveler is less informed about what awaits her in the desert. Because the mountains pose the most immediate and known need, the traveler focuses her time and energy on crossing them. Consideration of the desert is put off until later.
Th e traveler manages to cross the mountains only to fi nd, on reaching the desert, that she is unprepared to cross it. She has several options. She can turn back and concede defeat. She can press on and risk getting lost. She might pause to reformulate her plans before pressing on, hoping for the best. Or, she can turn back and try again later.
4.1 Linking Data Analysis to the Client Assessment Process

A better approach would have been to have planned in advance to cross the desert. Advance planning would not guarantee that the traveler would reach her destina-tion, but it would signifi cantly increase her chances. As with the traveler in this analogy, the primary source of diffi culty MFIs encounter in data analysis is the lack of advance planning.
Th e lack of advance planning for data analysis is in part also a function of how practitioners think about data analysis. To think of data analysis as a discrete task that occupies a relatively small slice of the client assessment process is tempting. In practice, however, data analysis
is an integral step in the assessment process linked to all other steps in the process, both before and after.
Data analysis does not begin with analysis of the data itself but with the commencement of the client assess-ment process and is both infl uenced by and infl uencing other steps in the process. Integrating data analysis into the client assessment process requires that it be con-sidered with other steps in the process, most notably in establishing research objectives, defi ning information needs, assessing organizational capacity, selecting and implementing the research design (data collection), and reporting the assessment fi ndings.
Research objectives establish what information the what information the whatorganization wants and why it wants the information. why it wants the information. whyInformation needs in turn determine the research design and the method of data analysis.
For example, a research objective of in-depth infor-mation on clients’ needs and wants implies the need for qualitative market information and the use of focus group discussions or in-depth individual interviews. A research objective of attributing impact to program participation implies the need for representative quantitative informa-
tion and the use of an impact survey. A research objective of tracking trends in client behavior or well-being to identify opportunities or need for intervention implies the need for routine information and the use of client monitoring.
Th is process of logically linking data analysis require-ments to research objectives through the research design and information needs determination should be under-taken to ensure that the MFI is prepared, when the time comes, to cross the data analysis desert.
4.2 Linking Data Analysis to Research Objectives
4.3 Linking Data Analysis to Information Needs
In articulating what information the MFI wants and why it wants the information, the research objectives should make explicit the level of understanding needed to answer the research questions. Th e following four levels of under-standing have important implications for data analysis:
1. Descriptive understanding. At the most basic level, the research objective is to describe (or profi le) client characteristics using basic demographics (e.g., gen-der, age, marital status, location, or poverty status) or indicators of program participation (e.g., number of loan cycles, length of time with the program, client status, or repayment record).
2. Understanding of association. At this level, the research objective is to determine which client behaviors or characteristics are associated with other behaviors or characteristics. For example, the MFI may want to know whether default rates are associ-ated with being poor.
3. Understanding of causation. At this level, the research objective is to determine whether a causal relationship exists between observed associations and, if so, its direction and strength. For example, the MFI may want to know if being poor causes higher default rates. Information about causation is particu-larly useful if the cause is a factor under the MFI’s control.
4. Ability to explain causation. At the most advanced level, the research seeks to explain causation. It may not be enough to know that being poor is a causal factor of low repayment rates. Th e MFI may also want to know why being poor causes low repayment why being poor causes low repayment whyrates. No statistical methods can tell the MFI why A causes B; it must formulate hypotheses based on its own knowledge and experience. Obviously, the action the MFI takes to address low repayment rates among poor clients depends on which hypotheses the MFI determines to be most valid.
36 Data Analysis

Mismatch between Data Analysis Needs and Data Analysis Capacity
MFIs frequently fail to consider the data analysis require-ments implied by their information needs or assessment tools, resulting in a mismatch between data analysis needs and capacity. Reasons for this mismatch vary but include lack of time, perceived lack of immediacy, implementing tools off the shelf, failure to understand the importance of data analysis, lack of knowledge about analysis methods, misestimation of the MFI’s data analysis capacity, or “bandwagon” eff ects. (For an example of bandwagon ef-fects, see Box 4.1.)
Notwithstanding, many MFIs embark on client as-sessment activities as if they possessed the requisite data analysis capacity, resulting in wasted time and money. Th e mismatch between assessment tools and data analysis capacity has impacts beyond wasted time and money. It also aff ects the credibility of the entire client assessment process. (See Box 4.2.)
In-House Data Analysis Versus Outsourcing
An alternative to performing data analysis in house is to outsource the eff ort, raising the question of when out-sourcing data analysis is appropriate. Cost is an important factor. If the MFI can aff ord to outsource data analysis, it should consider doing so. Otherwise, it may be performed in house.
In some cases, it may actually cost more for the MFI to develop and fund its own internal data analysis capacity than to outsource. Cost is not the only factor to consider. Timing is also a factor. Th e MFI might have the need for continuous or otherwise timely client information,
in which case it might make more sense to keep data analysis in house.
MFIs should also consider their overall assessment objectives. Many CAWG research partners expressed a desire to integrate client assessment into organizational processes and staff routines. If institutionalization of client assessment is an objective, it might prove diffi cult to achieve full integration of client assessment if such an integral step in the process is outsourced. In contrast, it makes less sense for an MFI to develop or bring the tech-nical capacity in house for a one-off assessment activity. As a general rule, the more routine or integrated the data collection cycle, the more sense it makes to bring data analysis capacity in house.
Th e experiences of FOCCAS and Prizma in making this decision are described in Boxes 4.3 and 4.4.
4.4 Linking Data Analysis to Organizational Capacity
Box 4.1 Data Analysis of Bandwagon Effects in Rwanda
The marketing department at a Rwandan MFI wanted information on client satisfaction, so it chose to imple-ment a client satisfaction survey because, “other MFIs were doing it, so we thought we should too.” But when the marketing staff met with the opera-tions staff to work out the analysis of the satisfaction surveys, they jointly realized that quantitative data analysis was beyond the MFI’s capacity and resourc-es. What they really wanted was qualitative informa-tion about customer satisfaction and market demand. Moreover, the MFI’s staff had received training in qualitative tools, and the MFI could support qualitative research in its existing budget. The MFI subsequently opted to abandon the satisfaction survey and conduct focus group discussions instead.
Box 4.2Failure to Match Data Analysis Capacity to Assessment Tools Threatens Client Assessment at Integra
The Integra Foundation learned the hard way about the importance of matching data analysis to assess-ment tools. It invested considerable resources in an organization-wide impact assessment only to find later that it lacked the capacity to do the analysis, and the impact survey data went unanalyzed. For this reason, when the research team proposed a client monitoring system, management and staff were highly skeptical. It took the research team consider-able time and effort to convince management and staff to support the client monitoring system. The research team at Integra succeeded because it was committed to client assessment. At another MFI lack-ing equal commitment to client assessment, a similar misstep might have put a premature end to client assessment activities.
Box 4.3 Outsourcing Versus In-House Data Analysis: The Experience of FOCCAS
FOCCAS learned firsthand about the strategic value of bringing data analysis in house. Rather than use staff to analyze focus group notes and data input forms, FOCCAS decided to experiment and hire a stu-dent intern for the work. The experiment turned out poorly. The student lacked the contextual understand-ing to discern the key insights from the data, and the resulting analysis was shallow and of little use. More-over, FOCCAS determined that it had squandered an opportunity to teach its staff data analysis skills and help staff learn about key issues that affected clients. FOCCAS has since decided to use local staff to analyze all focus group data to improve staff skills and encourage staff to internalize assessment findings.
Data Analysis 37
Th e research design determines the type, quantity, and timing of information, each of which has a direct impact on data analysis. One of the fi rst questions to be ad-dressed in the research design is whether the MFI needs quantitative or qualitative information.
Quantitative Data Analysis
Quantitative information requires data analysis methods capable of, at the minimum, summarizing frequencies (number and percentage of clients belonging to certain groups), central tendencies (mean, median, and mode), and cross-tabulations (tables summarizing information by segmentation category) among clients. At a more sophis-ticated level of descriptive understanding, the MFI may want to conduct tests to determine whether diff erences in mean values are statistically signifi cant across groups. Th e standard methods to test diff erences in means are the t-test and analysis of variance (ANOVA).
Th e t-test determines whether the diff erence in the observed means between two groups is statistically sig-nifi cant. Say, for example, the average monthly enterprise profi t for trade clients is $100 compared to an average monthly profi t of $120 for service clients. Th e t-test de-termines whether this diff erence is statistically signifi cant or is the product of random chance.
ANOVA determines whether the diff erence in the observed means among three or more independent groups is statistically signifi cant. If the average monthly profi t of manufacturing clients is $95, ANOVA tests whether the diff erence in average monthly profi ts for trade, service, and manufacturing clients is statistically signifi cant or the product of random chance.
If the analysis objective is to determine associations among variables, correlation or chi-square analysis is ap-propriate. Correlation analysis is useful for determining whether, in what direction, and to what degree two con-tinuous variables are related. Th e most common measure
of correlation is the Pearson correlation, which refl ects the degree of linear relationship between two variables. It ranges from + 1 to – 1, where a correlation of – 1 means a perfect negative linear relationship between the variables, and a correlation of + 1 means a perfect positive linear relationship between variables.
Th e chi-square test is a test of association between two categorical variables that is performed on cross-tabulations. It compares cell frequencies in rows and columns to determine whether the frequency distribution between the two variables is dependent or independent. A chi-square test would be appropriate, for example, to determine whether outcomes such as dropout, poverty status, client risk rating, or change in enterprise profi ts (e.g., increase, same, decrease) are associated with factors such as loan cycle, client status, enterprise sector, geo-graphic location, gender, or client education level.
Although tests of association determine whether variables are associated with each other, they cannot determine whether one is causing the other. Such a task requires more sophisticated statistical techniques such as multiple regression analysis. Relatively few MFIs, however, are expected to acquire the capacity to conduct multiple regression analysis or other advanced methods of statistical analysis.
Even if MFIs were able to acquire the skills to conduct sophisticated statistical analysis, it is not clear that demand for this type of analysis exists. More than a few decision-makers are not going to understand or care about the fi ner points of multiple regression analysis. To the untrained, methods of statistical analysis are akin to a black box: data goes into the box and information comes out of the box, although the process by which the former is transformed into the latter is a mystery. Decision-makers are instead more likely to rely on information they can understand, both in terms of how it was produced and what it means. (See Box 4.5.)
Box 4.4 Outsourcing Versus In-House Data Analysis: The Experience of Prizma
Prizma has dealt with the outsourcing question in a unique way. Until recently, Prizma relied on MFC to analyze its client exit data. Prizma loan officers collected the data, which was then entered into a Microsoft Excel file at the branch level by an administrative assistant under close supervision of branch managers. The Excel file was then consolidated and merged with the central MIS at Prizma headquarters by the MIS manager, who then sent it to MFC for analysis.
Prizma has since begun to wean itself from MFC technical assistance, and management is currently developing plans to carry out analysis of the exit data absent MFC assistance. The current plan is to report basic frequencies and descriptive statistics in the automated report sent to headquarters and the branch offices. More sophisticated data mining will be outsourced to a local statistician who will perform detailed segmentation and association analy-sis with accompanying tests for statistical significance.
Furthermore, Prizma will integrate discussion of the exit monitoring findings at regular branch meetings during the monitoring data collection period. These meetings will be devoted to discussing general findings and impres-sions of staff involved in the exit monitoring interviews. Prizma hopes that this process will stimulate learning at the branch level, help local staff internalize lessons learned, and produce operational changes.
4.5 Linking Data Analysis to Research Design
38 Data Analysis

Qualitative Data Analysis
In contrast to quantitative analysis, the methods of qualitative data analysis are less established. No standard-ized methods can analyze qualitative data in a manner comparable to a t-test, ANOVA, or chi-square. Analysis of qualitative data requires the analyst to look past the superfi cial and glean information from what is said both explicitly and implicitly. It requires the analyst to organize, categorize, rank, prioritize, judge intensity of feelings, tease out trends, draw inferences, manage group interaction, and interpret nonverbal cues.
Qualitative data analysis also diff ers from quantitative data analysis in the inseparability of data collection and data analysis. Generally, only those who participate in qualitative data collection should perform the data analy-sis. Almost any qualifi ed analyst can do an adequate job analyzing quantitative data. Th e same is not true, however, for qualitative data. Th ose who do not participate in the data collection lack the context to analyze and interpret the responses. In particular, they have no basis on which to draw inferences based on group interaction, nonverbal cues, or intensity of feelings. Analysts from outside the organization also lack the context to understand and
interpret the responses in light of organizational policies, practices, and culture.
Th e approaches to qualitative data analysis taken by the CAWG research partners were broadly similar and roughly followed the grid/matrix approach recommended
in the SEEP/AIMS tool manual or by MicroSave. Over-all, the research partners tended to follow some combina-tion of the following steps:
1. Transcribe the responses on completion of the group discussion or interview.
2. List and organize responses on a tally sheet accord-ing to recurrent themes.
3. Enter responses into analytic matrixes for compari-son across client groups and themes and for identifi -cation of trends.
4. Combine analytic matrixes into a summary matrix to identify overarching themes and broad trends.
5. Make note of salient quotes or insights off ered by group participants or interviewees for inserting into the report narrative to provide relevant context or highlight key fi ndings.
A concern noted in the analytical approaches used by the CAWG research partners was a tendency to con-vert qualitative data into numeric or categorical data through tally sheets and analytical matrixes. Although such grid/matrix approaches are appropriate methods for analyzing qualitative data, if applied too mechanistically these methods may dilute the richness of information embedded in qualitative data. If the main objective is to compute frequencies with which clients identify certain issues, surveying a representative sample of clients is the preferred method.
Client Monitoring Versus One-Off Assessments
In the research design stage, MFIs must decide if their in-formation needs are best met through a one-off , periodic, or routine client assessment. Th e answer to this question will determine not only the research design but also the type of analysis.
One-off assessments typically imply more detailed data analysis. Given that the information is collected only once, it makes cost-eff ective sense to analyze the data to the fullest extent possible, and the time frame often allows for more in-depth analysis spread over a longer period of time. In contrast, periodic data collection and routine data collection have shorter data collection cycles and thus tend to lend themselves less to long lag times. In particular, client monitoring involves a quicker turn-around time, which requires in turn simpler and routin-ized approaches to data analysis.
To routinize the data analysis and facilitate quicker turnaround time, client monitoring systems should incorporate a “data analysis protocol.” A data analysis protocol is a written document that specifi es the types of data analysis routinely performed on the data, demon-strates how the data analysis is performed, and describes how the analysis is reported. A data analysis protocol is also important to maintain continuity in the data analysis process given staff turnover or modifi cations in the data analysis methods or routines.
Box 4.5 Matching Data Analysis to the Primary Audience at K-Rep
The Kenyan Rural Enterprise Programme (K-Rep) research team was forced to scale back its data analysis methods in line with the technical under-standing of the primary audience for client informa-tion. The team’s original intention was to carry out multiple regression analysis of impact survey data, but after assessing the technical understanding of its management and board, it concluded that they would neither understand nor appreciate such a high level of analysis. Consequently, the research team decided to focus on simple correlations and cross-tabulations.
Analysis of qualitative data requires the analyst to look
past the superficial and glean information from what is said both explicitly and implicitly.
Data Analysis 39

Segmenting clients refers to dividing clients into diff erent groups for analysis. Implicit in any segmentation category is the assumption that outcomes or behaviors of interest are associated with or caused by membership in a particu-lar group. Examples of possible segmentation categories include gender, location, client status, socioeconomic sta-tus, ethnicity/tribe, caste, or enterprise sector. Segmenting clients for analysis is recommended for quantitative and qualitative data.
Most of the CAWG research partners opted to use only a few broad segmentation categories. Th e most common were client location and enterprise sector. Other segmentation categories used included client versus non-client, age, education, literacy, number of loans, loan size, enterprise size, migrant status, loan product, client status, poverty status, loan purpose, caste, group function, and living status.1
4.6 Segmenting Clients for Data Analysis
4.7 Quality Control and Data Analysis
Sources of Data Errors
Th e data collection and entry process determines the quality of data available for analysis and thus the informa-tion the MFI can extract from the data and the useful-ness of the information in answering the MFI’s research questions.
Errors can creep in at multiple points during data col-lection and entry. For quantitative data, common sources of error include nonrepresentative sampling; poorly worded surveys; poor survey administration; inappropriate leading of survey respondents; inconsistent, erroneous, or fraudulent data coding; and erroneous or fraudulent data entry.2 For qualitative data, common sources of error in-clude poorly written or structured interview guides; poor group facilitation; poor note-taking; inappropriate leading of interviewees or group members; use of inappropriate or unskilled probing techniques; and incomplete or biased transcription of discussion or interview notes.
Th e CAWG research partners grappled with a variety of quality control issues. ACF, for example, did not pay enough attention to how its loan offi cers completed the loan application form. Substantial misunderstand-ing about how to complete the loan application existed among loan offi cers, which produced substantial incon-sistency in the data entered. In response, ACF appointed a staff member to work with loan offi cers and adminis-trative staff to clarify the wording and meaning of the questions on the loan application.
In another example, CARD did not determine ahead of time whether monitoring the use of observation check-lists should be the responsibility of the research trainer or operations unit. Only after monitoring reports fell behind did CARD realize that most branch managers were not completing the checklists, and those who were complet-ing the checklists were not completing all the questions or were making a variety of other errors.
SAT’s success in improving data quality is described in Box 4.6.
Box 4.6 SAT Demonstrates the Importance of Process Monitoring and Training
Sinapi Aba Trust’s (SAT) experience demonstrates the importance of process monitoring, even in situations where staff has been trained and closely involved in the assessment process. Despite extensive training and expressions of enthusiasm and commitment by branch management and staff, few loan officers at SAT’s Kumasi branch completed the client impact monitoring system (CIMS) forms during a pilot test.
The SAT research team alerted the loan supervi-sors who were assigned to monitor the CIMS imple-mentation, but the situation did not improve. The research team next notified the operations and credit managers, who issued the policy that all loans made without the completed CIMS form attached would not be approved. From that time on, loan officers completed all the CIMS forms.
SAT elected to train only the loan officers and assistant loan officers in CIMS implementation in the hope that they would pass on their training to the clerks who sometimes helped them in the field. A spot check early in the pilot test found that clerks were not filling in the correct information. The research officer subsequently organized a half-day training workshop for all clerks and other staff who did not attend the original training. The research team followed up this workshop by meeting frequently with field staff to monitor the CIMS implementation, learn what problems staff was having implementing CIMS, and jointly work out solutions to the problems. This process was effective in solving the problem.
1. ASA developed a scoring system to distinguish between weak and strong loan groups for the group function category. Partner used living status to distinguish between majority returnee and domiciled clients in Bosnia-Herzegovina. A domiciled person is one who lived and worked in her prewar home both during the war and currently. A majority returnee is a person who is or would be a member of the current ethnic majority group at her place of former habitual residence.
2. Examples of fraudulent data coding and data entry include entering responses for missing values, intentionally entering incorrect values, making up or imputing values, intentionally keying in the wrong values, or creating fi ctitious respondents.
40 Data Analysis

Quality Control Mechanisms
Most data errors stem from two primary sources: lack of quality control and lack of adequate training. An essential part of any research plan, therefore, is to build in training and quality control mechanisms. Th is approach applies for both practitioner-led research and outsourced research.
A good quality control system has many components, including vetting of research instruments, pilot-testing, quality monitoring, data cleaning, data processing proto-cols, and incentive systems. Th e quality control system at FOCCAS is described in Box 4.7.
Vetting the Research Instrument. Th e research instru-ment should be developed in direct consultation with management, staff , clients, and other relevant stakehold-ers. During the initial consultation, establishing realistic parameters for the instrument in terms of topics covered, number of questions, and length is critical. Th e defi nition of “realistic parameters” will vary case by case, but in all cases it will be determined by the purpose of research; the budget; fi nancial, human, and technological resources; and the timeframe.
After the initial consultation, management and other relevant stakeholders need to be consulted periodically as the research instrument goes through various iterations. Relevant stakeholders should also be given the opportu-
nity to approve the fi nal instrument before taking it to the pilot-testing phase and to review the results of the pilot test before the instrument is rolled out.
Pilot-Testing the Research Instrument. No research instrument should be implemented without fi rst undergo-ing a pilot test. Th e instrument should be pilot-tested with enough clients to determine which questions are worded or translated poorly, are ambiguous, or are diffi -cult to answer; how long it takes on average to administer; and whether it yields the desired information. At the con-clusion of the pilot test, the results should once again be vetted with relevant stakeholders and revised as necessary.
Monitoring Data Collection Quality. Th e MFI should build a quality monitoring system into every research plan. Quality monitoring is particularly important dur-ing data collection and data entry. Common methods of quality control include (1) assigning supervisors to observe data collection, (2) reviewing completed surveys or discussion summaries for completeness and accuracy, (3) contacting interviewees to confi rm that they were surveyed, or (4) resurveying interviewees to confi rm the responses provided.
When using program staff or local volunteers to conduct research, monitoring data quality is particularly important. Program staff and local volunteers are more prone than professional researchers to sloppy or fraudu-lent data collection. Common examples of sloppy data collection include leaving survey questions blank, imput-ing or guessing survey responses, failing to indicate the reasons for missing values, and coding responses inconsis-tently.3 Common fraudulent practices including making up responses to survey questions or creating phantom survey respondents.
Quality monitoring methods 1 through 4 are best done on a random basis. If the research is carried out by external entities, the methods for quality control should be negotiated and made explicit up front and made part of the contractual responsibilities.
Cleaning the Data Set. Data must be cleaned before be-ginning the analysis of any data set. Data cleaning refers to scanning the data for data collection, entry, and coding errors and correcting errors found. Basic data cleaning includes analyzing frequencies, central tendencies, ranges, and distributions to look for obvious errors, suspicious values, and extreme outliers. It also includes examining the incidence of missing values to determine nonresponse patterns or evidence suggesting that certain questions might not have been asked as intended.
Ideally, those persons responsible for collecting and entering the data should do the data cleaning. If the MFI hires an external researcher, the contract should specify who is responsible for data cleaning. Cleaning up a contaminated data set can take days to weeks of full-time work, resulting in lost time and expenditures not
3. Missing values are typically coded similar to 98 = not applicable; 99 = do not know. Knowing why a value is missing is important for data cleaning and data analysis. Data analysts do not know how to treat missing values if they are not coded properly.
Box 4.7 Training and Quality Control at FOCCAS
FOCCAS has successfully implemented a multiple component system of training and quality control. FOCCAS conducts qualitative research using primar-ily focus group discussions. To simplify the focus group process for the loan officers, FOCCAS staff developed and standardized a discussion guide. The discussion guide includes a data recording sheet intended to simplify focus group facilitation and the recording of participants’ responses.
All loan officers who participate in the FGDs receive the same training. FOCCAS also pretests all discussion guides before implementation to ensure that translation of the guide to local dialects is ac-curate. If the data collected from clients speaking different dialects reveals distinct irregularities, loan officers rephrase the discussion guide.
Next, the client education manager visits the focus group site to verify that the discussion guide is accurate for the local context. The client educa-tion manager also attends selected FGDs to observe how loan officers enter responses into the data entry forms and perform the analysis. In this manner, the assessment process at FOCCAS incorporates mul-tiple opportunities for training, support, troubleshoot-ing, and feedback “until the process is smooth.”
Data Analysis 41

anticipated in the original budget and scope of work for the research. Establishing expectations and protocols for cleaning the data up front is preferable to trying to deal with a contaminated data set after the fact.
Creating Data Processing Protocols. As a general rule, contact with the data should be limited to a small number of people. As diff erent people work with the data, they transform the data by, for example, creating new variables out of existing variables, or redefi ning or recoding existing variables. If they do not leave a record of the transforma-tion (more common than not), the next person to use the data will not be able to follow the changes. Th e problem is compounded when people who have worked with the data leave the organization, taking whatever knowledge they have about the data set with them.
Th is problem can be avoided by creating a regularly updated code book that explains what the data are, how variables are defi ned, and what transformations to the data have been made. Th e code book helps to ensure that people who work with the data can understand, interpret, and use the data and also protects the MFI against the loss of institutional knowledge that occurs when people familiar with the data leave the organization.
Criteria for selecting data analysis software are de-scribed in Box 4.8.
Verifying Data Entry. Errors can easily creep into the data during data entry. Common errors include mis-takenly keying in the wrong value, misreading survey
forms, coding illegible or ambiguous data, or conducting fraudulent data entry. To limit data-entry errors, it is important to provide adequate training to operators and to employ other methods of quality control, including random checks for data entry accuracy and double data
entry. Double data entry involves entering the data twice into separate data sets using diff erent operators. Any dis-crepancies between the two data sets are resolved by going back to the completed survey forms. Other data entry errors will be picked up during data cleaning.
Th e data fi elds should also be created before survey implementation to allow immediate data entry on survey completion. Th e data fi eld should include a separate, well-defi ned fi eld for each survey question and each possible response.
Creating Incentive Systems. MFIs need to carefully consider incentive systems for data collection and analysis. Good incentive systems create productive incentives that increase operational effi ciency and eff ectiveness. Poor incentive systems, on the other hand, create dysfunctional incentives for staff to pursue narrow self-interests or to play the system for personal benefi t. For example, paying survey enumerators for surveys completed might appear a good idea to increase survey cost-eff ectiveness. When this incentive was implemented by one SEEP member, how-ever, a surge in sloppy and fraudulent collection practices and mostly worthless surveys resulted.
Providing Training in Data Analysis. Providing train-ing to all staff involved in the process of data collection, data entry, and data analysis is important. For outsourced research, researchers should be willing to demonstrate and vouch for the experience and expertise of its research team. If the external researcher hires a data collection team (e.g., local university students) specifi cally for the contracted research, the researcher should also be willing to guarantee contractually that all participants will receive adequate training and describe what the training will be.
If the client assessment is ongoing, developing a train-ing manual, when feasible, is a good idea. Th e manual should cover the issues listed above in suffi cient depth to provide a written resource to guide ongoing eff orts or as-sist with retraining of staff , given inevitable staff turnover.
Box 4.8 Data Analysis Software
Several data analysis programs offer a range of capa-bilities, ease of use, and reasonable cost. Microsoft Excel is probably the most basic and widely used data management and analysis program. Excel can perform a range of statistical analysis, including all the statistical procedures an MFI is likely to use. Micro-soft Access is another popular and widely available database program capable of performing basic data analysis. Access has the added advantage of being one of the most widely used MIS programs among MFIs.
Many other statistical software packages are capable of performing both the basic types of analysis performed by most MFIs and more advanced statisti-cal analysis. Well-known examples include Epi Info, SPSS, and SAS. (Epi Info is recommended in the SEEP/AIMS manual because it can be downloaded at no cost from the Internet.) Because virtually all statis-tical software packages are capable of meeting the limited data analysis needs of MFIs, criteria for selec-tion should turn on other factors, such as cost, ease of use, and portability from one format to another (for example, whether the software easily imports or exports Excel or Access data).
Providing training to all staff involved in the process of data collection, data entry, and data analysis is important.
42 Data Analysis

Th is chapter has reviewed important issues related to data analysis. Th e lack of data analysis capacity was one of the two most important barriers to client assessment that the CAWG research partners cited, and substantial anecdotal evidence suggests that this is a general problem through-out the microfi nance industry.
Problems with data analysis stem not only from lack of capacity, but also from the failure to plan for data analysis and link it to other steps in the client assessment process. Sound planning for data analysis will link it explicitly to the steps that come before and after, including establish-ing research objectives, defi ning information needs, as-sessing organizational capacity, and creating the research design. Data analysis also shapes in large part the client information that serves as the basis for report writing, decision-making, and action.
Data analysis methods for quantitative and qualitative information are unique and require diff erent skills. Most MFIs will likely need only a relatively small set of quan-titative data analysis methods used for describing clients and testing associations, including frequencies, central tendencies, t-tests, ANOVA, correlations, and chi-square tests. MFIs need to avoid black boxes and to match the level of quantitative data analysis to the information needs and technical comprehension of the primary audi-ences. At the same time, they need to be careful to avoid reducing qualitative data to descriptions and frequencies, thereby losing much of the richness and depth of the data,
which are the comparative advantages of qualitative data.Th e real power of data analysis comes through the
segmentation of clients into diff erent analytical groups. Segmentation is typically based on demographic or pro-gram participation characteristics.
Th e quality of the data analysis is only as good as the quality of the data itself. Errors can creep in at many places during data collection and data entry. Th us, the MFI must implement quality control mechanisms in data collection and data entry. Useful quality control mechanisms including vetting of the research instrument with stakeholders, pilot-testing the research instrument, monitoring data collection and data entry, cleaning the data set, creating data processing and analysis protocols, creating appropriate incentive systems, and providing adequate training in data collection, data entry, and data analysis.
In conclusion, data analysis is a critical step in the cli-ent assessment process. Th is step is as important as tool and indicator selection and merits as much attention. Just as tool and indicator selection should be kept simple initially and fi ne-tuned to the MFI’s needs, so should data analysis. With more experience, resources, and technical abilities, the MFI can increase the sophistication of its data analysis over time commensurate with its needs and the technical understanding of the primary audience for the client information.
4.8 Summary and Conclusions
Data Analysis 43


BUILDING SUCCESSFUL MICROFINANCE INSTITUTIONS
BY ASSESSING CLIENTS NEEDS
The Benefits of Client Assessment
CHAPTER 05
Client assessment is a means to an end. Th e end is im-proved fi nancial and social performance. Th e causal chain linking client assessment to improved fi nancial and social performance follows two causal pathways, as Figure 5.1 illustrates.
In the fi rst causal pathway, client assessment produces more and better client information; more and better client information produces improved management decisions; and improved management decisions produce improved fi nancial and social performance. In the second causal
pathway, the process of client assessment produces an increased customer orientation among staff (in part by promoting internalization of the principles and values of customer service); an increased customer orientation among staff produces increased customer-oriented behav-ior; and increased customer-oriented behavior produces improved fi nancial and social return.
Th is chapter presents three types of evidence for the causal relationships depicted in Figure 5.1. Before presenting this evidence, Section 5.1 discusses how the unique social context of microfi nance complicates the causal link between client assessment and organizational performance, and it suggests an approach for managing this complication. Section 5.2 presents the fi ndings from client assessment cost-eff ectiveness studies performed on three Imp-Act participant organizations in Honduras (Covelo network), South Africa (Small Enterprise Foun-dation [SEF]), and Bosnia-Herzegovina (Prizma). Each study found evidence of benefi ts far in excess of costs. Section 5.3 summarizes the many actions taken by the CAWG research partners in response to client informa-tion. Th e number and scope of actions taken strongly suggest signifi cant benefi ts. Section 5.4 summarizes the empirical evidence in the private, public, and nonprofi t sectors showing unambiguous evidence that client assess-ment is linked to improved organizational performance along multiple dimensions. Although the microfi nance sector presents a unique case, the sector is not so distinc-tive that the lessons drawn from other sectors do not apply. Finally, Section 5.5 describes criteria for making client information useful, and Section 5.6 summarizes the chapter and off ers concluding remarks.
Figure 5.1 Client Assessment Causal Chain
Few would dispute the theoretical proposition that client information leads to improved organizational perfor-mance. In practice, however, this may not always be the case. Experience shows that the links in the causal chain can break at a number of points. Client data might ac-
cumulate without being transformed into client informa-tion, client information might not be valid or useful, staff might not internalize the importance of customer service, management might make poor decisions, or uncontrol-lable external factors might diminish the eff ectiveness of
5.1 Costs and Benefi ts of Client Assessment in the Social Context of Microfi nance

management actions. Demonstrating the benefi ts of client assessment
requires that theoretical benefi ts be made concrete. Mak-ing the fi nancial benefi ts of client assessment concrete is relatively easy. Methods for measuring fi nancial perfor-mance are well established, and attributing changes in fi nancial performance to management actions is relatively straightforward. In contrast, making the social benefi ts of client assessment concrete is relatively diffi cult. No widely accepted method exists for measuring social performance, and attributing social outcomes to management actions is anything but straightforward.
Rigorously measuring social performance, although an ideal, is unrealistic for the vast majority of MFIs. Th e practical diffi culties involved in measuring social perfor-mance require pragmatic, second-best solutions. One such solution is client monitoring, which tracks indicators of client well-being but with no pretense of proving impact. Instead, the purpose is to monitor changes in key indica-tors that serve as signposts (or reference points) to tell the MFI whether its path to Impact City, using Freedom from Hunger’s analogy for client assessment,1 is along the right road.
Another pragmatic solution is the one employed by the cost-eff ective studies summarized in the following sec-tion. Due to the diffi culties of measuring social perfor-mance, the authors of the cost-eff ective studies opted to focus on the fi nancial benefi ts of client assessment. Th eir methodology and conclusions assume that the improve-
ment in fi nancial performance refl ects a correspond-ing improvement in social performance. In particular, improvements in indicators suggestive of customer value (for example, client retention, customer satisfaction, or program growth) should be associated with an increase in social impact.
Th is assumption has a certain intuitive appeal but only to a point. Th e assumption depends on the extent to which the observed improvements are nested within the context of the MFI’s social mission. Th at is, improved client retention, greater customer satisfaction, or higher program growth are reasonable indicators of improved social performance to the extent that they occur among the MFI’s core target market. For example, client informa-tion leading a “poverty-focused” MFI to move up market would constitute reduced social performance within the narrow context of the MFI’s social mission. Real-life examples of this tension include the experiences of Lift Above Poverty Organisation, presented in Chapter 3, and the Covelo network, presented in this chapter.
Th is pragmatic shortcut to estimating social perfor-mance is far from perfect, and MFIs should not rely solely on such indicators. Rather, indicators of customer value are best used in conjunction with other social indi-cators (see previous paragraph), qualitative information, or other sources of information as part of an integrated system aimed at improving impact. But where no other information is available they can still shed important light on the MFI’s social performance.
One approach to demonstrate the benefi ts of client assessment is to compare the monetized benefi ts of client assessment to its monetized costs (fi nancial costs plus opportunity costs). Th e Imp-Act Action Research Program commissioned three cost-eff ectiveness studies of the Covelo microfi nance network in Honduras, SEF in South Africa, and Prizma in Bosnia-Herzegovina for this purpose. Th e main fi ndings of these studies are presented in this section.
Covelo
Four members of the Covelo microfi nance network in Honduras implemented three of the fi ve SEEP/AIMS tools between 2001 and 2004: client satisfaction focus group discussions (FGDs); exit surveys; and loans, sav-ings, and profi ts use over time. Th e author of the Covelo study estimated the overall cost to implement the three tools to be $14,000 to $20,000 per institution, with the opportunity cost of staff time representing the primary cost at all four MFIs.2 Th e cost of staff time was particu-larly high at the MFI at the high end of the cost range
because it made the strategic decision to involve a wider selection of staff in the exercise to develop staff assess-ment skills and foster a client-focused organizational cul-ture. Th e average cost to implement the tools in the other three MFIs was US$2,795, US$3,899, and US$2,426.
Th e study examined the benefi ts of the assessment ex-ercise from several perspectives. One perspective estimat-ed what percentage of net income earned would need to be attributed to the assessment exercise to cover its costs. Th e estimates ranged from 2 to 13 percent (Copestake, p. 57). Another perspective estimated the percentage of net income that would need to be attributed to program changes that the MFIs made to cover the assessment costs. Program changes and the relevant percentage of net income needed to cover assessment costs were (1) sim-plifi cation in loan procedures at 0.37 to 0.40 percent, (2) introduction in individual loans at 11.34 to 34.0 percent, (3) the opening of three new branches at 4.6 percent, (4) accelerated individual lending due to streamlined ap-praisal at 19.0 percent, and (5) the reduction in client exit rates at 9.5 percent (Copestake, p. 57).
Finally, simulation analysis estimated the marginal gains
5.2 Client Assessment Cost-Effectiveness Studies
1. To review this analogy, see the introduction to Chapter 3, “Client Assessment Tools.”2. James Copestake, “Cost-Eff ectiveness of Microfi nance Client Assessment in Honduras,” Small Enterprise Development, 15:, no. 3
(2004): 52–68.
46 The Benefi ts of Client Assessment

to a “typical” microfi nance nongovernmental organization in Honduras from a one-percentage point change in the average loan size, net intake, and reduced operating costs were US$2,623, US$2,571, and US$38,484, respectively (Copestake, p. 58).
As a result of program changes made by Covelo mem-bers because of client assessment activities, the compo-sition of their loan portfolios underwent a signifi cant change. From December 2000 to June 2003, the percent-age of the members’ loan portfolios allocated to solidarity and individual loans, urban areas, and males increased, while the percentage allocated to village bank loans, rural areas, and females decreased. On one hand, this portfolio restructuring is likely to lead to an increase in fi nancial self-suffi ciency. On the other hand, restructuring is also likely to lead to reduced depth of outreach because the percentage of marginally poor or non-poor clients is likely to increase relative to the percentage of very poor and poor clients. Whether this outcome increases or decreases overall social performance depends on the mission and social objectives of the aff ected institutions.
Small Enterprise Foundation
Th e Small Enterprise Foundation has created an “impact management system,” an integrated system designed to help SEF understand and improve client impact. SEF’s impact management system uses a number of compo-nents, including participatory wealth ranking, in-depth interviews, subjective and objective client questionnaires, dropout monitoring, and a management information system. Since 1997, SEF attributes numerous product and operational changes directly or indirectly to the impact management system, including modifi cations to existing loan products, staff incentives, and management struc-tures. Th e author of the SEF study estimated the normal monthly cost of the impact management system to be $1,728, for an annual cost of $21,353.3
To estimate the benefi ts of the impact management system, the author focused on the narrow context of a large upward spike in dropouts during 2001 and 2002. A dropout study launched by SEF in response to this spike found that dropouts were caused primarily by factors under SEF’s control, such as inappropriate loan sizes, inappropriate business evaluations by fi eldworkers, inappropriate loan utilization, and poor client service by SEF staff . At the root of these problems was a fi eldworker incentive system that overemphasized portfolio growth at the expense of service quality. In response to this fi nd-ing, SEF revised its fi eldworker incentive system, which produced a dramatic fall in dropouts and set the stage for rapid program growth from mid-2002 to the present.
To monetize the benefi ts of SEF’s impact management system in the context of the dropout crisis, the author posited a counterfactual scenario in which client dropouts
remained at or near the levels reached during the upward spike, and program size remained constant. (SEF would not have increased program growth until it resolved the dropout problem.) In this scenario, the estimated gain to SEF in terms of increased interest income from June 2002 to December 2003 was $369,350, including a $118,333 gain from improved client retention and a $251,017 gain from increased program growth (Baumann, p. 37).
Th e author then compared these marginal benefi ts to the marginal cost of $32,020 to implement the impact management system in response to the dropout crises. Th is comparison yielded a return on investment equal to 1,153 percent, including a 369-percent return from improved client retention and a 784-percent return from increased program growth (Baumann, p. 39).
Finally, the author estimated the annual rate of return to investment in the impact management system under hypothetical dropout scenarios over a six-year period. Th e estimated rate of return was negative in year 1 at – 930 per-cent but rose to 1,134 percent by year 6 (Baumann, p. 40).
Prizma
Th e Prizma study estimated the break-even point in terms of increased customer retention for the poverty scorecard, exit surveys, and client satisfaction FGDs implemented by Prizma.4 Th e cost to develop and implement the three tools was estimated at $42,056. At this cost, the author estimated that Prizma would need to retain an additional 152 (2.2 percent) of its group enterprise loan clients for one additional loan cycle to break even (Woller, p. 48).
Considering the three tools separately, Prizma would need to retain 78 group loan clients (1.1 percent) for one loan cycle to cover the costs of the poverty scorecard, 24 group loan clients (0.4 percent) for one loan cycle to cover the costs of exit monitoring, and 50 group loan clients (0.7 percent) for one loan cycle to cover the costs of the FGDs (Woller, p. 48). Th ese fi gures translate to a reduction in Prizma’s weighted average dropout rate from 44.4 percent to 42.2 percent to cover all client assessment costs, to 43.3 percent to cover the costs of the poverty scorecard, to 44.0 percent to cover the costs of exit moni-toring, and to 43.7 percent to cover the costs of the FGDs (Woller, p. 48).
Th e author further estimated that each additional client retained per loan cycle beyond the break-even point add-ed $278 directly to Prizma’s bottom line. Were Prizma, for example, to reduce dropout by 345 group loan clients (5 percent), it would add $53,780 directly to its bottom line each loan cycle. How far it would be possible or cost eff ective to reduce Prizma’s dropout rate is not known, but reductions in the range of 5 to 10 percent appear reason-able, producing direct bottom-line benefi ts of $52,780 to $105,560 per loan cycle (Woller, p. 50).
3. Ted Baumann, “Imp-Act Cost-Eff ectiveness Study of Small Enterprise Foundation, South Africa,” Small Enterprise Development,15: no. 3 (2004): 28–40.
4. Gary Woller, “Th e Cost-Eff ectiveness of Social Performance Assessment: Th e Case of Prizma in Bosnia-Herzegovina,” Small Enter-prise Development, 15: no. 3 (2004): 41–51.
The Benefi ts of Client Assessment 47

Another approach to demonstrating the benefi ts of client assessment is to link the means of client assessment to its ends through the causal pathways Figure 5.1 illustrates. In the upper causal pathway, management action is the link closest to the end of the causal chain. Th e widespread evidence of management action in response to client information suggests strongly that management fi nds cli-ent information useful, implying in turn the next and fi nal link in the causal chain.
Overall, the 17 CAWG research partners reported 64 program changes over the two-year project based directly or indirectly on client assessment information. Program changes made fell into one of three broad categories: (1) product and service innovations, (2) modifi cations to product terms and conditions, and (3) modifi cations to institutional policies and practices.
Product and Service Innovations
A principal benefi t of client assessment is that it yields information that enables MFIs to assess the strengths and weaknesses of current market off erings, how market off erings are used by clients, how clients benefi t (or do not benefi t) from the market off erings, the level of client satisfaction with market off erings, and client demand for new market off erings. Such information is useful for im-proving existing market off erings or developing new ones.
Th e CAWG research partners made numerous product innovations in response to information gathered from FGDs with clients and staff . (See Table 5.1.) ASA introduced two new insurance products, Avance Chalco introduced credit life insurance for its clients, and FOC-CAS introduced an individual loan product. Partner in-troduced an agriculture loan that off ered several diff erent features from its standard business loan, including a lower interest rate, a grace period of up to nine months, and a longer repayment term of up to 25 months. From its “staff satisfaction” FGDs, CARD learned that administering its voluntary savings product imposed an excessive time burden on loan offi cers, which led to ineff ective adminis-tration of the product. As a result, CARD decided to stop collecting voluntary savings. DEMOS learned that FGDs produce unintended side eff ects as well as benefi ts. (See Box 5.1.)
Th e FGD was not the only assessment tool that proved useful as a basis for management decision-making and action. Using a combination of tools, NABW uncovered signifi cant sources of dissatisfaction among both group and individual loan clients. Group loan clients com-plained that the program did not consider individual requests for credit and too strongly encouraged equal loan growth among group members. Individual loan clients complained that the loan size increment from cycle to cycle was too small, and they lacked the collateral to qual-ify for larger loans. Based on this information, NABW developed a new loan product called the “middle-level
program,” which combined certain elements of the group and individual loans consistent with clients’ stated needs.
CARD used a variety of assessment tools to examine concerns, weaknesses, and problems that hampered eff ec-tive service delivery. Th is process resulted in the consoli-dation of three loan products into a single loan product and the introduction of an emergency loan to address short-term client needs, such as school fees, utility bills, or medical bills. Informal assessment tools can also yield useful results, as ACF and SAT found out. (See Box 5.2.)
5.3 Usefulness of Client Assessment in Promoting Management Action
Box 5.1Benefits and Unintended Consequences of Client Assessment at DEMOS
The experience of DEMOS demonstrates both the benefits of client assessment and the risk of unintended side effects of management action in response. Across several focus group discussions, DEMOS discovered a strong demand for individual loans among urban clients and animal husbandry loans among rural clients (particularly for the purchase, raising, and sale of cows). In response, DEMOS introduced an individual loan for urban clients and three new animal husbandry loans for rural cli-ents. The introduction of the animal husbandry loans had the unintended effect of creating an imbalance in DEMOS’ loan portfolio, thereby increasing its overall credit risk. DEMOS has since instituted policies to balance its portfolio risk.
MFI Innovation
ACF • Introduced residential mortgage loan
ASA • Introduced two insurance productsa
Avance Chalco • Introduced credit life insurance
CARD • Consolidated three loan products into a single product• Introduced emergency loans
DEMOS • Introduced two loan productsa
• Introduced three animal husbandry loansb
• Introduced individual loans in urban areas
FASL • Introduced hybrid loan with attributes of Susu and solidarity loans
FOCCAS • Introduced individual loan
Integra • Introduced new loan product
NABW • Introduced “middle-level” loan
Nirdhan • Introduced credit life insurance• Introduced housing loan• Introduced microenterprise loan
Partner • Introduced agriculture loan
SAT • Introduced solidarity loan
a. Counted as two program changes.b. Counted as three program changes.
Table 5.1 Product Innovations
48 The Benefi ts of Client Assessment

FASL used the fi ndings from an impact survey and “loans, savings, and profi ts over time” interviews to de-velop and pilot-test a hybrid loan product that combined the attributes of Susu savings with solidarity group loans.5
Th e pilot test proved so successful that FASL allocated US$1,500,000 of its loan fund to this product. Based on feedback from semistructured client workshops, Nirdhan introduced credit life insurance, a housing loan, and a microenterprise loan targeted to clients with larger busi-nesses and larger credit needs.
Th e CAWG research partners also made a number of service innovations based on assessment information. (Table 5.2 summarizes the service innovations.) K-Rep learned from clients that loan offi cers were insuffi ciently sensitive to gender-related issues. K-Rep’s managing director subsequently organized a staff workshop in gender dynamics. Based on impact study fi ndings, Integra decided to off er training for advanced entrepreneurs and start a business mentoring program.
FOCCAS made several innovations to its non-fi nancial services based on client assessment fi ndings. It reviewed and improved selected education modules, developed and introduced a malaria-control education
module, and collaborated with the Ugandan Ministry of Health and other entities to off er family planning services, learning/instructional materials, and other non-fi nancial services.
Th rough a variety of assessment activities, SAT learned that its clients were working so hard to repay their loans that they did not have time to attend to spiritual needs, be with their families, or participate in community activities. As a result, SAT developed a training unit to teach its clients how to manage their time more eff ectively.
Modifications to Product Terms and Conditions
Client assessment is also an eff ective method to evaluate the strengths and weaknesses and the level of client and staff satisfaction with the terms and conditions of current market off erings. Such information is useful in turn for modifying existing terms and conditions. Th e CAWG re-search partners made numerous modifi cations to existing terms and conditions based on client information. Some examples are provided below. (Table 5.3 summarizes these modifi cations.)
Avance Chalco, ASA, and Integra reduced the interest rates charged on loans. ASA also tied the number of loans a member could take to her savings behavior and facilitated linkages with commercial banks for clients who needed bigger loans. CRS/Benin accelerated its loan disbursement process and reinstituted the six-month loan cycle for clients past the fourth loan cycle. FOCCAS implemented a variety of changes that increased the fl ex-ibility of its loan policies and terms, and also increased the maximum amount of both initial and repeat loans.
NABW learned that group loan clients, especially ur-ban clients, found it diffi cult to organize the minimum 8 to 12 people required to form a loan group. Th e MFI also found out that local markets were closely integrated with the markets of the nearby countries of Uzbekistan, Ka-zakhstan, and Kyrgyzstan, which made inventory turnover cycles longer. As a consequence of these fi ndings, NABW lowered the minimum group size to fi ve and reduced the loan repayment frequency from every two weeks to once a month.
Information from ex-clients was the catalyst in several cases to modify terms and conditions. CARD learned that more than 50 percent of former clients left CARD for personal reasons (e.g., pregnancy, illness in the family, disagreement with staff or group members, or temporary relocation). Based on this information, the MFI launched two resting (from borrowing) programs: one for current clients who wanted only savings and insurance and the other, called Balik CARD, which means Rejoin CARD in Tagalog, for ex-clients who wanted to rejoin the program. Balik CARD allowed ex-clients to rejoin the program and rest from borrowing as long as they continued to contrib-ute to compulsory savings.
Box 5.2 Benefits of Informal ClientInformation at ACF and SAT
Microfinance institutions need not use formal assess-ment methods to generate useful client information. Even informal information can be the basis for sig-nificant program changes. The ACF learned through informal client feedback that clients preferred to be responsible for their own loans. In response, ACF elected to switch from group lending to individual lending.
Meanwhile, SAT learned from informal client feedback that its core Trust Bank model (a variant of village banking) needed to be supplemented with another product to allow for longer loan terms and larger loan amounts. Consequently, it introduced a solidarity group loan, which now accounts for nearly one-half of its group loan portfolio.
MFI Innovation
FOCCAS • Improved various learning modules• Developed malaria-control learning module• Developed other non-financial services
Integra • Introduced training for advanced entrepreneurs• Introduced business mentoring program
K-Rep • Organized gender-dynamics training workshops for staff
SAT • Developed time-management training
Table 5.2 Service Innovations
5 Susu savings is a variation on the Rotating Credit and Savings Association found in Ghana.
The Benefi ts of Client Assessment 49

In contrast to CARD, Partner and NABW learned that clients tended to leave the program due to dissatisfaction with products and the terms and conditions. Ex-clients at Partner cited their inability to satisfy Partner’s collateral requirements for larger loans as a primary reason for exit-ing the program. Apparently, as loan sizes grew larger for repeat clients, it became more diffi cult for them to off er suffi cient collateral or provide guarantors for the loans. In response, Partner decided to relax its collateral require-ments for repeat borrowers.
At NABW, ex-clients cited concerns about their ability to guarantee group members’ loans as loan sizes grew over time and their dissatisfaction with NABW’s restrictive policy regarding savings withdrawal. As a result, NABW lowered its maximum loan size for its group loan product from US$1,000 to US$750 and made its savings with-drawal policy more fl exible. For group clients wanting loans in excess of US$750, the MFI simplifi ed the rules for transferring to the individual lending program.
Nirdhan off ers an interesting case in which an MFI used assessment methods to secure permission from cli-ents to implement an otherwise unpopular modifi cation to existing terms and conditions. When Nirdhan began its lending program, it charged a 20-percent annual inter-est rate only to realize later that a 20-percent interest rate did not generate suffi cient revenues to cover its operating costs. Management raised this issue to its client work-shops, explained the situation, and received the clients’ consent to raise the interest rate to 25 percent.
Modifications to Institutional Policies and Strategy
Client assessment can also yield useful information about institutional policies that serve as the basis for institu-tional reforms and strategic decisions. Th e experiences of the CAWG research partners provide several examples in which client assessment informed major strategic deci-sions (see Table 5.4).
On observing the program methodology of ASA Bangladesh, CARD management and staff were so impressed with its simplicity and cost-eff ectiveness that they initiated a process to investigate ways to integrate the ASA methodology into CARD’s lending program. Toward this end, CARD undertook a number of assess-ment activities, including staff workshops, client FGDs, and a staff satisfaction survey. Based on the fi ndings from these activities, CARD pilot-tested the ASA methodol-ogy in new branches and started a process of adopting ASA principles in existing branches, where appropriate, with the eventual objective of implementing the changes organization-wide.
In response to a donor’s request to target small- and medium-sized enterprises (SME) in addition to microen-terprises, DEMOS conducted a series of client FGDs to assess the demand for and feasibility of SME loans. Based on the fi ndings, DEMOS decided to off er SME loans rather than microloans in Western Slavonia as originally planned.
MFI Modification
ASA • Reduced interest rate on loans from 24 percent to 20 percent• Linked number of loans to program savings• Linked clients with commercial banks for larger loans• Reduced loan sizes
Avance Chalco • Reduced interest rate on loans
CARD • Terminated voluntary savings• Clarified policies regarding stock ownership• Introduced resting program for current clients • Introduced resting program (Balik CARD) for ex-clients who wanted to rejoin• Introduced more flexible savings withdrawal rules• Based loan size on CARD’s repayment rates and group-meeting attendance• Changed policy regarding renewal of emergency loans • Changed other terms and conditions
CRS/Benin • Accelerated loan disbursement• Reinstituted six-month loan cycle for clients past the fourth loan cycle
FOCCAS • Increased initial and subsequent loan sizes• Adopted more flexible loan terms and conditions
Integra • Reduced interest rate on loans
NABW • Eliminated obligatory savings• Reduced minimum group size• Reduced frequency of loan payment from every two weeks to monthly• Decreased maximum loan size for group loan from US$1,000 to US$750• Simplified rules for qualifying for individual loans• Made savings withdrawal rules more flexible
Nirdhan • Raised interest rate on loans from 20 percent to 25 percent
Partner • Introduced more flexible collateral requirements for repeat clients
Table 5.3 Modifications to Product Terms and Conditions
50 The Benefi ts of Client Assessment

ACF used client information to retarget its entire pro-gram to a diff erent market segment (see Box 5.3).
Fundraising and Public Relations
A fi nal benefi t of client assessment is its use for fundrais-ing and public relations (PR). Both the Fund for Support of Microentrepreneurship (FORA) and Integra reported that the fi ndings of the Wider Impact Survey proved use-ful for fundraising and PR purposes. In Integra’s case, one of its major donors had recently added the requirement that Integra report on the social impact of its program. Integra was only able to meet this requirement thanks to the Wider Impact Survey. Integra, moreover, attributed the fi ndings of the Wider Impact Survey to the donor’s decision to extend its fi nancial support for another fi ve years.
Judging by the experience of the MFIs participating in the CAWG Imp-Act project, client assessment yields signifi cant benefi ts in terms of improved management decision-making and action. CARD alone accounted for 16 (25 percent) of the 64 program changes (see Box 5.4), although ASA (6 changes), DEMOS (7 changes), NABW (7 changes), FOCCAS (6 changes), and Integra (4 changes) also made several program changes.
One common belief is that client assessment is more appropriate for larger MFIs that have more resources to invest in client assessment and greater internal capacity to implement it. Table 5.5, however, does not yield any clear relationship between program size and program changes made. Th e research partners making the most program modifi cations included the two largest research partners (CARD and ASA) but also three small MFIs (DEMOS, Integra, and NABW) and one medium-sized MFI (FOCCAS). ACF, another small research partner, also managed to make three program changes.
Th e number of program changes made is not the only evaluation measure for assessing the benefi ts of client as-sessment. Th e signifi cance of the program changes should also be considered. Using this standard, large and small MFIs alike made signifi cant program changes, such as the adoption of an entirely new program methodology at CARD, the decision to abandon traditional markets at ACF, or the entrance into new market segments using new lending methodologies at DEMOS, FASL, FOC-CAS, Nirdhan, Partner, and SAT.
Th e common trait shared by these MFIs that is not discernible from Table 5.5 is a commitment to the cli-ent assessment among key stakeholders, particularly management and staff . Resources and technical capacity are important, but they cannot compensate for lack of stakeholder buy-in. Eff ective client assessments can be conducted with limited resources and technical capacity, as demonstrated by several of the research partners, but conducting eff ective client assessments without stake-holder support is nearly impossible.
One trend discernible in Table 5.5 is the overwhelming focus on qualitative assessment tools, in particular client satisfaction FGDs and, to a lesser extent, exit interviews. Th is fi nding refl ects the cost-eff ectiveness of focus group research. Th e FGD is a relatively inexpensive and easy-to-implement assessment tool for large and small organiza-tions alike that, judging by the experience of the research partners, can yield much useful information.
In conclusion, the experiences of the 17 research part-ners demonstrate both the benefi ts and the practicality of client assessment. Th e primary constraint to eff ective cli-ent assessment is stakeholder commitment to the process. With stakeholder commitment, any MFI can reap the benefi ts of client assessment, regardless of its size or level of sophistication.
MFI Modification
ACF • Switched from group lending to individual lending• Switched target market from microenterprises to SMEs
CARD • Increased middle management spending authority• Rolled out ASA methodology in all new branches• Changed internal conflict-resolution policies• Simplified and streamlined various administrative policies• Hired more branch managers• Split single branch into two branches
CRECER • Accelerated repayment of internal account loans
DEMOS • Decided to not introduce microloans but to introduce SME loans
Table 5.4 Modifications to Institutional Policies and Strategies
Box 5.3 Client Assessment Informs a Major Strategic Decision at ACF
ACF’s mission is to create jobs and support the emer-gence of a middle class. Its core loan product toward this end has been the secured microloan targeted to microenterprises employing up to five people. During routine site visits, however, ACF field staff observed that no growth had occurred in business equity, the average number of employees, or average fam-ily expenditures among secured microloan clients. Basing its decision on this finding, ACF retargeted its entire program to SMEs, which it believed would cre-ate new jobs more quickly and therefore support the emergence of a middle class sooner.
Box 5.4 Benefits of ClientAssessment at CARD
Among the CAWG research partners, none demon-strates the benefits of client assessment more than CARD. Of 64 program changes documented in Tables 5.1 to 5.4, CARD accounts for 16, or one-fourth. Although CARD’s experience may be considered an outlier, it demonstrates the potential that client as-sessment has to produce a significant impact on an MFI’s market offerings, policies, and strategy.
The Benefi ts of Client Assessment 51

MFI
Nu
mb
er o
f C
lien
tsa
Gro
ss L
oan
P
ort
folio
(U
S$
in
mill
ion
s)
Clie
nt
Ass
essm
ent
Met
ho
do
log
ies
Use
d
Pro
du
ct a
nd
S
ervi
ce
Inn
ova
tio
ns
Mo
dif
icat
ion
s to
Ter
ms
and
C
on
dit
ion
s
Mo
dif
icat
ion
s to
In
stit
uti
on
al P
oli-
cies
an
d S
trat
egy
Tota
l Pro
gra
m
Mo
dif
icat
ion
s
AC
F28
595
6•
Info
rmal
clie
nt f
eedb
ack
• S
ite v
isits
by
field
sta
ff1
02
3
AS
A49
,822
2,84
0•
Clie
nt s
atis
fact
ion
FGD
s•
Exi
stin
g M
IS2
40
6
Ava
nce
Cha
lco
821
330
• C
lient
sat
isfa
ctio
n FG
Ds
11
02
CA
RD
62,2
468,
647
• C
lient
sat
isfa
ctio
n FG
Ds
• S
taff
sat
isfa
ctio
n FG
Ds
• Va
rious
par
ticip
ator
y ra
pid
asse
ssm
ent
(PR
A) t
ools
• W
ealth
ran
king
• E
xit
inte
rvie
ws
• Lo
an u
tiliz
atio
n ch
eckl
ists
• In
form
al o
bser
vatio
ns
28
616
CR
EC
ER
40,1
426,
019
• C
lient
sat
isfa
ctio
n FG
Ds
• In
divi
dual
clie
nt in
terv
iew
s0
01
1
CR
S/B
enin
4,72
410
0•
Clie
nt s
atis
fact
ion
FGD
s0
20
2
DE
MO
S54
243
2•
Clie
nt s
atis
fact
ion
FGD
s6
01
7
FAS
L3,
400
1,78
4•
Impa
ct s
urve
y•
Loan
s, s
avin
gs, a
nd p
rofit
s us
e ov
er t
ime
inte
rvie
ws
10
01
FOC
CA
S16
,811
750
• C
lient
sat
isfa
ctio
n FG
Ds
• C
redi
t as
soci
atio
n m
eetin
gs4
20
6
FOR
A10
,788
6,45
0•
Impa
ct s
urve
y0
00
0
Inte
gra
103
211
• Im
pact
sur
vey
• S
taff
sat
isfa
ctio
n FG
Ds
31
04
K-R
ep38
,739
14,4
90•
Impa
ct a
sses
smen
t•
Clie
nt s
atis
fact
ion
FGD
s1
00
1
NA
BW
5,81
495
2•
Clie
nt in
terv
iew
s•
Clie
nt s
atis
fact
ion
FGD
s•
Exi
t in
terv
iew
s
16
07
Nird
han
35,2
482,
655
• C
lient
wor
ksho
ps3
10
4
Par
tner
7,13
99,
976
• E
xit
FGD
s•
Clie
nt s
atis
fact
ion
FGD
s1
10
2
Priz
ma
8,11
23,
882
• C
lient
sat
isfa
ctio
n FG
Ds
• E
xit
surv
eys
• P
over
ty s
core
card
00
00
SA
T25
,562
1,62
3•
Info
rmal
clie
nt f
eedb
ack
• Im
pact
sur
vey
• C
lient
sat
isfa
ctio
n FG
Ds
• E
xit
inte
rvie
ws
• E
mpo
wer
men
t in
terv
iew
s•
Loan
s, s
avin
gs, a
nd p
rofit
s us
e ov
er t
ime
inte
rvie
ws
20
02
Tota
l29
7,39
480
6,73
328
2610
64
a. T
he n
umbe
r of
clie
nts
and
gros
s lo
an p
ortf
olio
are
bas
ed o
n 20
02 f
igur
es.
Tabl
e 5.
5Pa
rtic
ipan
t MFI
Info
rmat
ion,
Clie
nt A
sses
smen
t Met
hodo
logi
es, a
nd S
ubse
quen
t Mod
ifica
tions
Mad
e52 The Benefi ts of Client Assessment

MFI
Nu
mb
er o
f C
lien
tsa
Gro
ss L
oan
P
ort
folio
(U
S$
in
mill
ion
s)
Clie
nt
Ass
essm
ent
Met
ho
do
log
ies
Use
d
Pro
du
ct a
nd
S
ervi
ce
Inn
ova
tio
ns
Mo
dif
icat
ion
s to
Ter
ms
and
C
on
dit
ion
s
Mo
dif
icat
ion
s to
In
stit
uti
on
al P
oli-
cies
an
d S
trat
egy
Tota
l Pro
gra
m
Mo
dif
icat
ion
s
Tota
l29
7,39
480
6,73
328
2610
64
Th e determinants and impact of a customer orienta-tion are among the most thoroughly researched topics in marketing. As noted in the introduction to this book, a customer orientation refers to organizational culture and practices focused on serving the needs and wants of customers in which the “generation of market intel-ligence pertaining to current and future customer needs, dissemination of intelligence across departments, and organization-wide responsiveness to it” constitute an integral component.
Academic researchers have conducted 48 empirical studies examining the relationship between customer orientation and various dimensions of organizational per-formance within the context of large businesses, SMEs, nonprofi t organizations, and federal government agencies and in countries as diverse as the United States, Japan,
Hungary, Slovenia, Poland, Australia, Taiwan, Ghana, Greece, Russia, Great Britain, Germany, France, Swe-den, and Malta.6 Of the 48 empirical studies, 44 found a positive and signifi cant relationship between a customer orientation and at least one measure of organizational performance as measured by profi tability, sales, market share, or innovation success.
Th e empirical studies also provide strong evidence supporting the lower causal pathway portrayed in Figure 5.1. Th e studies found that a customer orientation exerts a signifi cant infl uence on organizational culture. Th is infl u-ence is manifested in several ways but most importantly in terms of improved customer service, higher levels of intra-organizational trust, increased staff job satisfaction and esprit de corps, and lower staff turnover.
5.4 Empirical Evidence for the Benefi ts of Client Assessment
5.5 Making Client Assessment Information Useful
Th e preceding sections established that client assessment is an eff ective means to improve organizational perfor-mance. Nonetheless, the mere act of implementing client assessment does not guarantee successful fulfi llment of the desired ends. A weak link at any point in the causal chain can cause the chain to break. In the end, client information is only as good as the indicators used, the tools applied, the data analysis performed, the reports made, the actions taken, and the skills and dedication of the management and staff members responsible for implementing it.
Usefulness Criteria for Client Assess-ment Information
For client information to be useful for decision-makers, it must meet the following fi ve criteria:
1. Accuracy. Client information should accurately portray the characteristics, perceptions, and behav-iors of clients. Although 100-percent accuracy is an unrealistic expectation, client information should be as accurate as possible, given resource and capac-ity constraints. Accuracy requires that indicators measure what they are supposed to measure, tools are appropriate and implemented correctly, samples are representative, data analysis is thorough, fi ndings are interpreted correctly, staff is well-trained, and the assessment process is monitored carefully.
2. Clarity. Client information should be structured and presented in such a way that its key fi ndings are read-ily understandable. Th e methodologies used to collect and analyze information and fi ndings should be
transparent, understandable, and presented at a level of sophistication relevant to the primary audience.
3. Friendliness to users. Client information should be presented in a format that is readily accessible. Major fi ndings, key implications, and important recom-mendations should be easy to locate and understand. Information should be presented in a format that assumes key decision-makers have limited time to review and process the fi ndings. Tables, fi gures, charts, and bullet points are preferable to narrative text, where feasible. Short reports are preferable to long reports.
4. Timeliness. Th e data collection, analysis, and report-ing cycles should be timed to coincide with decision-makers’ information needs. Th e process, however, should retain suffi cient fl exibility to generate infor-mation on an as-needed basis. Client assessment activities implemented by CRECER in response to the Bolivian currency devaluation provide a good example of a fl exible and timely use of client assess-ment that had a signifi cant impact of management decision-making and action. (See Box 5.5.)
5. Practicality. Client information should be presented at a level of generality that makes clear broad organi-zational implications, but also at a level of specifi city that allows applications to specifi c cases. Information that is too general or too specifi c has little practical decision-making relevance.
Information that is too general does not provide enough information to enable the MFI to take ap-propriate action. For example, information that clients
6. For a summary and bibliography of these studies, see Gary Woller, “From Market Failure to Marketing Failure: Market Orientation As the Key to Deep Outreach in Microfi nance” Journal of International Development, 14: no. 3 (2002): 305–324.
The Benefi ts of Client Assesment 53
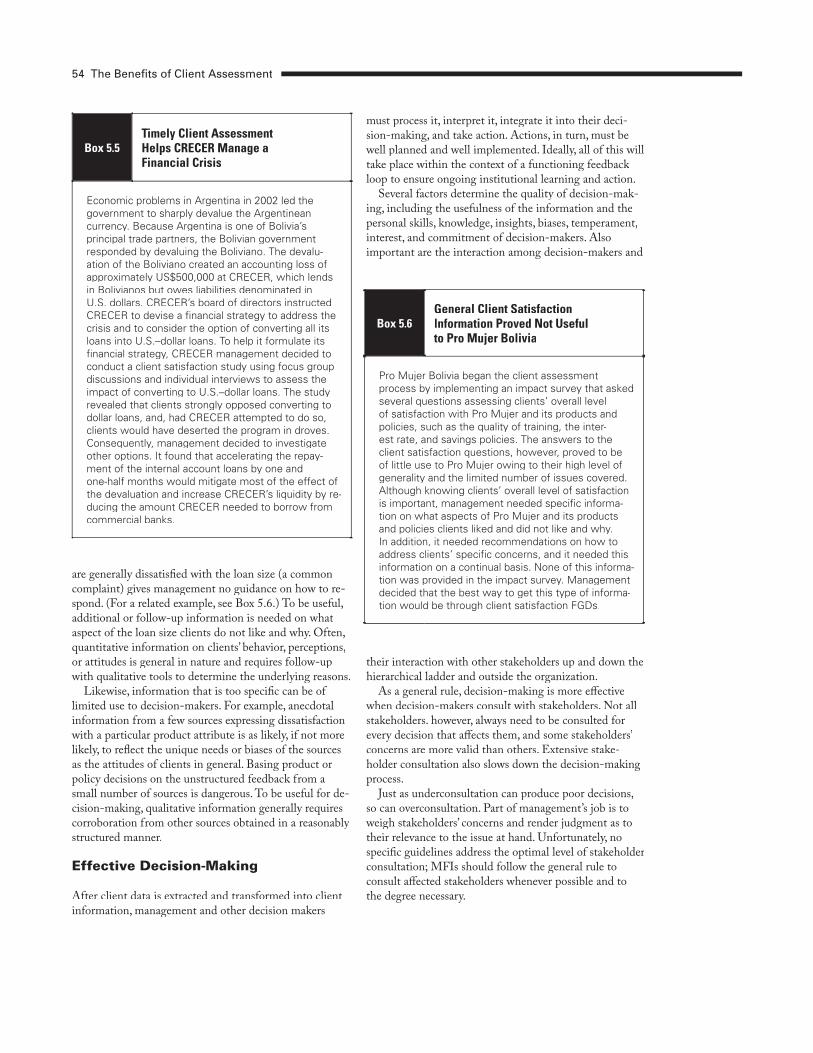
are generally dissatisfi ed with the loan size (a common complaint) gives management no guidance on how to re-spond. (For a related example, see Box 5.6.) To be useful, additional or follow-up information is needed on what aspect of the loan size clients do not like and why. Often, quantitative information on clients’ behavior, perceptions, or attitudes is general in nature and requires follow-up with qualitative tools to determine the underlying reasons.
Likewise, information that is too specifi c can be of limited use to decision-makers. For example, anecdotal information from a few sources expressing dissatisfaction with a particular product attribute is as likely, if not more likely, to refl ect the unique needs or biases of the sources as the attitudes of clients in general. Basing product or policy decisions on the unstructured feedback from a small number of sources is dangerous. To be useful for de-cision-making, qualitative information generally requires corroboration from other sources obtained in a reasonably structured manner.
Effective Decision-Making
After client data is extracted and transformed into client information, management and other decision makers
must process it, interpret it, integrate it into their deci-sion-making, and take action. Actions, in turn, must be well planned and well implemented. Ideally, all of this will take place within the context of a functioning feedback loop to ensure ongoing institutional learning and action.
Several factors determine the quality of decision-mak-ing, including the usefulness of the information and the personal skills, knowledge, insights, biases, temperament, interest, and commitment of decision-makers. Also important are the interaction among decision-makers and
their interaction with other stakeholders up and down the hierarchical ladder and outside the organization.
As a general rule, decision-making is more eff ective when decision-makers consult with stakeholders. Not all stakeholders. however, always need to be consulted for every decision that aff ects them, and some stakeholders’ concerns are more valid than others. Extensive stake-holder consultation also slows down the decision-making process.
Just as underconsultation can produce poor decisions, so can overconsultation. Part of management’s job is to weigh stakeholders’ concerns and render judgment as to their relevance to the issue at hand. Unfortunately, no specifi c guidelines address the optimal level of stakeholder consultation; MFIs should follow the general rule to consult aff ected stakeholders whenever possible and to the degree necessary.
Box 5.5Timely Client Assessment Helps CRECER Manage a Financial Crisis
Economic problems in Argentina in 2002 led the government to sharply devalue the Argentinean currency. Because Argentina is one of Bolivia’s principal trade partners, the Bolivian government responded by devaluing the Boliviano. The devalu-ation of the Boliviano created an accounting loss of approximately US$500,000 at CRECER, which lends in Bolivianos but owes liabilities denominated in U.S. dollars. CRECER’s board of directors instructed CRECER to devise a financial strategy to address the crisis and to consider the option of converting all its loans into U.S.–dollar loans. To help it formulate its financial strategy, CRECER management decided to conduct a client satisfaction study using focus group discussions and individual interviews to assess the impact of converting to U.S.–dollar loans. The study revealed that clients strongly opposed converting to dollar loans, and, had CRECER attempted to do so, clients would have deserted the program in droves. Consequently, management decided to investigate other options. It found that accelerating the repay-ment of the internal account loans by one and one-half months would mitigate most of the effect of the devaluation and increase CRECER’s liquidity by re-ducing the amount CRECER needed to borrow from commercial banks.
Box 5.6General Client Satisfaction Information Proved Not Useful to Pro Mujer Bolivia
Pro Mujer Bolivia began the client assessment process by implementing an impact survey that asked several questions assessing clients’ overall level of satisfaction with Pro Mujer and its products and policies, such as the quality of training, the inter-est rate, and savings policies. The answers to the client satisfaction questions, however, proved to be of little use to Pro Mujer owing to their high level of generality and the limited number of issues covered. Although knowing clients’ overall level of satisfaction is important, management needed specific informa-tion on what aspects of Pro Mujer and its products and policies clients liked and did not like and why. In addition, it needed recommendations on how to address clients’ specific concerns, and it needed this information on a continual basis. None of this informa-tion was provided in the impact survey. Management decided that the best way to get this type of informa-tion would be through client satisfaction FGDs.
54 The Benefi ts of Client Assessment

5.6 Summary and Conclusions
Th is chapter has summarized the evidence drawn from the Imp-Act Action Research Program, the CAWG research partners, and empirical studies on the benefi ts of client assessment. In all three cases, the evidence points conclusively to the conclusion that client assessment yields numerous and signifi cant net benefi ts in terms of improved organizational performance.
Th e evidence confi rms that the benefi ts of client assessment work through two causal pathways. In one pathway, client assessment leads to management actions that improve organizational performance. Th e CAWG research partners made a large number and wide variety of program changes in response to client information; as the Imp-Act cost-eff ectiveness studies demonstrate, the returns on such actions can exceed the costs by many times. In the other pathway, client assessment fosters an organizational culture characterized by improved customer service, higher employee morale, and a more collaborative work environment.
Th e evidence does not directly measure the social re-
turns to client assessment. Nonetheless, under reasonable assumptions, the social returns to client assessment can be inferred from the evidence presented.
Th e evidence is so strong that it changes the question from whether MFIs can aff ord to do client assessment to whether MFIs can aff ord not to do client assessment. not to do client assessment. notIn fi nancial service markets increasingly characterized by competition and discerning customers, those MFIs that invest in learning from clients will be the ones most likely to survive and grow in the long run.
Small program size and lack of experience are not valid reasons for not doing client assessment. Th e experience of the CAWG research partners shows that even informal and unstructured client assessment can lead to impor-tant program changes. If all the MFI can do is to talk informally with clients, then it should at least do that. It is impossible to know what clients are thinking without talking to them. If beginners take the advice off ered earlier in the book to start small and simple, they too can reap the benefi ts that client assessment has to off er.
The Benefi ts of Client Assessment 55


BUILDING SUCCESSFUL MICROFINANCE INSTITUTIONS
BY ASSESSING CLIENTS NEEDS
Conclusion
CHAPTER 06
Th is book has discussed a number of important issues re-lated to client assessment in microfi nance. It has focused in particular on the issues related to the obstacles to client assessment with related lessons learned and recommenda-tions, indicator and tool selection, and data analysis. It has also off ered a compelling case that client assessment is a cost-eff ective strategy to improve long-term fi nancial and social performance.
Two themes run throughout each chapter of the book: the need to integrate client assessment into strategic organizational planning and the importance of context in determining the “best” approach to client assessment. Rather than reiterate these points once more, this chapter concludes the book with a case study of Sinapi Aba Trust (SAT) in Ghana in which strategy and context operated hand in hand to drive the client assessment process.
Th e starting point for client assessment at SAT was its mission to “transform” the lives of the economically disadvantaged by providing opportunities for enterprise development and income generation.1 SAT considers client assessment necessary to ensure the MFI is fulfi lling its institutional mission of holistic client transformation.
SAT is also committed to client assessment as a means to ensure that it remains focused on its target market, particularly given internal and external forces pushing SAT up-market. SAT is in the process of transform-ing into a formal deposit-taking institution. Meanwhile, competition in the microfi nance sector is steadily increas-ing in Ghana, including competition from commercial banks, and clients are becoming more sophisticated in their demands for microfi nance products and services. Management is aware that the transformation process, together with increased competition, will place signifi cant pressure on SAT to move up-market to more profi table market segments. To counteract these forces, management believes that having a means to monitor the level of client satisfaction and the impact of the program on clients’ lives is important.
SAT management also wants to know whether clients have had any negative experiences that might aff ect their quality of life or cause them to exit the program. Th us, understanding the dynamics behind client retention is considered critical to SAT’s future growth and expansion, especially as it transforms into a formal savings and loan.
On top of all this, SAT’s donors and other external stakeholders are increasingly concerned about monitor-ing the eff ectiveness of their funding toward improving the lives of the poor. Donors are beginning to cut back on funding to MFIs because they question how microfi nance relates to their overall development goals.
Th e challenge to SAT in this context was to implement a client assessment system that would help monitor its success in achieving its social mission, inform the trans-formation process, and improve the quality and delivery of products and services. On considering its information priorities in the context of its strategic objectives and after extensive internal discussion, SAT elected to design and implement an integrated Client Impact Monitoring System (CIMS).
SAT believes that client monitoring is the most cost-eff ective way to ensure compliance with its social mission, particularly given the context in which it operates. SAT also believes that an integrated monitoring system will help it stay abreast of changes in clients’ well-being and fl ag adverse trends that required more in-depth follow-up. SAT’s decision to develop the CIMS was also made in response to friendly pressure from Opportunity Interna-tional (Opportunity) (SAT’s North American partner) to participate in a research program, along with other Opportunity partners, to develop and test network-wide indicators of holistic social transformation.
When the decision to implement CIMS was made, the next step was to select holistic transformation indica-tors to include in CIMS. Th e process of selecting CIMS indicators took years. Beginning in 1997, Opportunity launched an initiative to develop a set of network-wide
1. Sinapi Aba Trust defi nes “transformation” as profound economic, social, political, and spiritual changes in clients’ lives.

client indicators by commissioning a series of in-depth case studies in Ghana, Indonesia, Colombia, and Russia. Th ese studies contributed to a conceptual framework and a draft set of network-wide indicators. Opportunity next sought to narrow this draft list to a few key indicators that could be monitored on a quarterly basis.
Accordingly, Opportunity sponsored a brainstorming session in 2001 for Opportunity staff and implementing partners to narrow the list to a limited number of generic transformational indicators that partners would agree to adapt and monitor. Generic indicators fell into one of ten impact domains: business employment, business income, business networks, personal cash savings, housing, children’s education, decision-making, community and
religious involvement, and health.Each of the ten impact domains was included in
SAT’s January/February 2002 implementation of the SEEP/AIMS impact survey. SAT analyzed the survey results to identify indicators that would be valid measures for demonstrating changes over time resulting from program participation. Th e analysis sought to balance the dual goals of identifying indicators appropriate for all of Opportunity’s partners and measuring what was of most interest to SAT management.
Concurrent to the SEEP/AIMS implementation and analysis, SAT held several focus group discussions with loan offi cers from the northern and southern sectors of the country. Th e discussions aimed at determining their
Impact Domain Level of Impact—General
Level of Impact—Specific Underlying Hypothesis Potential Use for Indicator
Business employment
Economic • Enterprise• Household• Community
As program participation increases, job creation increases.
• Determine the appropriateness of loan targeting.• Compare effectiveness of loan products in job creation.• Analyze job creation by enter-prise sectors.• Analyze relationship between business expansion and loan demand.
Personal cash savings
Economic • Individual• Enterprise• Household
• As program participa-tion increases, the amount of personal cash savings increases.• The primary use of cash savings increasingly includes more types of household needs.
• Examine the possibility of designing strategies to mobilize clients’ savings as SAT converts to a formal savings institution.• Advise clients on saving strate-gies.
Housing • Economic• Social
• Individual• Household
As program participation increases, households increase the number and value of investments.
• Analyze effectiveness of SAT products by poverty status.
Children’s education
• Economic• Social
Household As program participation increases, the number of school-age dependents at-tending school increases.
• Help design education savings or loan products. • Improve training on importance of education, especially for girls.
Decision-making • Empowerment• Political
• Individual• Household
As program participation increases, women clients participate more in house-hold decisions.
• Determine appropriateness of SAT’s products and services in empowering clients.• Improve training in leadership skills.
Community involvement
• Economic• Social• Empowerment
• Individual• Community
As program participation increases, the amount and variety of community involvement increases.
• Strengthen link between com-munity organizations and clients.• Improve client orientation to strengthen service, giving, and conflict resolution skills.
Religious involvement
• Spiritual• Economic
• Individual• Community
As program participation increases, the amount of time spent on religious activities increases.
Improve client training on time management.
Health Economic • Individual• Household
As program participation increases, ability to pay for health care increases.
• Strengthen weekly meetings and orientation with topics such as eating balanced diets.• Help clients avoid self-medica-tion and live a healthy lifestyle.
Table 6.1 CIMS Transformational Indicators and Their Program Implications at SAT
58 Conclusion
views on women’s empowerment and what SAT could do to empower women. Topics discussed included the following:
• Defi nitions and indicators of empowerment in the Ghanaian context;
• Indicators of successful transformation for SAT clients;
• Ways in which SAT’s programs contributed to trans-formation and empowerment;
• Problems, obstacles, and challenges facing clients; and
• Possible changes, additions, or adaptations to SAT’s programs to help clients achieve higher levels of transformation and empowerment.
In November 2001, SAT also conducted gender research for the purpose of understanding what, how, when, and why transformation occurs in the lives of clients and their households. Th e gender research had two components. Th e fi rst was in-depth interviews with female clients to understand how and under what circumstances participation in SAT’s programs led to signifi cant transformation and to identify areas and types of transformation that typically occur in clients’ lives. Th e second component was in-depth interviews with clients’ husbands to learn their perceptions of changes that had occurred as a result of their wives’ participation in SAT and whether they believed these changes were positive or negative.
All these activities, together with secondary data from previous impact assessment work, helped SAT iden-tify indicators that were consistent with Opportunity’s emphasis on holistic client transformation but that were also adapted to the Ghanaian cultural context and SAT’s product mix. Eight impact domains made it to the current version of CIMS: business employment, personal cash savings, housing, children’s education, decision-making,
community and religious involvement, and health. Table 6.1 summarizes the specifi c indicators included in CIMS, their relevant impact domains, levels of impact, underly-ing hypotheses, and potential uses (as described by SAT).
Th e case study of SAT is off ered neither to demon-strate an ideal for client assessment nor to serve as a model for any other MFI. SAT, moreover, has been the benefactor of substantial technical assistance, which means that its ambitious and complex assessment work is replicable by probably only a minority of MFIs. SAT still has much work to do in developing and refi ning the CIMS, and no guarantee exists that the CIMS will de-liver the hoped-for benefi ts. SAT may yet be an example of successful client assessment or unsuccessful client assessment.
But failure is a risk in any activity. No guarantees are available in client assessment, but ways exist to increase the likelihood of success. Careful planning is one way, as are sound implementation, fl exibility to adapt deci-sions and actions to context, eff ective communication with stakeholders, and a willingness and ability to learn from experience. So far, SAT’s client assessment work has embodied these characteristics, and these characteristics, not the specifi c approach, make SAT an instructive ex-ample for other MFIs embarking on the client assessment process.
Operating an MFI involves similar risks. Success is not guaranteed, but the likelihood of success can be increased through the use of tools such as client assessment.
Th is book began by emphasizing the necessity of client assessment and concludes by reemphasizing it. Client assessment is a core activity of successful businesses. Client assessment is not something to be done only if time and resources allow; this process is integral to how the organi-zation operates. Client assessment is not simply another line item on the expense ledger but is an investment in knowledge that yields returns that far exceed its costs.
Conclusion 59


Indicatora Institution and Sourceb of Information
HOUSEHOLD-LEVEL INDICATORS
Household income • ACF: CM • ASA: ILS• Avance Chalco: IS• CARD: MT• FASL: IS• FORA: CMS• K-Rep: IS• NABW: NA• SAT: CMS
Household expenditures • ACF: CM• FASL: IS• FORA: CMS• Integra: CMS• K-Rep: IS• SAT: CMS
Ownership of household assets • ACF: CM• FASL: IS• Integra: CMS• K-Rep: IS• NABW: IS• Nirdhan: PI• Prizma: PS• SAT: CMS
Transport assets • Prizma: PS
Access to utilities or public services • SAT: CMS
Dependency ratio • SAT: CMS
Education/educational expenditures/literacy • CARD: MT• FASL: IS• K-Rep: IS• NABW: IS• Nirdhan: PI• Prizma: PS• SAT: CMS
Housing status/housing expenditures/housing improvements • ACF: CM • ASA: ILS• Avance Chalco: IS• FASL: IS• NABW: IS• Nirdhan: PI• SAT: CMS
BUILDING SUCCESSFUL MICROFINANCE INSTITUTIONS
BY ASSESSING CLIENTS NEEDS
Appendix
Table A.1 Client Indicators Collected by the CAWG Research Partners

Indicatora Institution and Sourceb of Information
Housing conditions (e.g., size; wall, roof, and flooring materials; struc-tural condition)
• ASA: HI• CARD: MT
Household savings & investments • ACF: CM• FASL: IS• Integra: CMS• K-Rep: IS• SAT: CMS
Health status/healthcare • ASA: ILS• NABW: IS• SAT: CMS
Household/child nutrition • ASA: ILS• NABW: IS
Food expenditures/food security • NABW: IS• SAT: CMS
Household size • CARD: MT• Integra: CMS• Prizma: PS
Sources of household income/number of income earners • CARD: MT• Integra: CMS
Number of livestock • DEMOS: NA
Geographic location • Prizma: PS
Meat consumption • Prizma: PS
Sweets consumption • Prizma: PS
Household employment • K-Rep: IS
Participation in and attitudes toward financial-service associations • K-Rep: IS
Time spent with family • Integra: CMS
Holidays taken • Integra: CMS
Frequency of eating out • Integra: CMS
Frequency of having guests • Integra: CMS
Number of unemployed in household • Integra: CMS
Participation in Susu schemes • FASL: IS
ENTERPRISE-LEVEL INDICATORS
Jobs created/persons employed • ACF: CM• ASA: ILS• Avance Chalco: IS• FASL: IS• FORA: CMS• K-Rep: IS • Integra: CMS• NABW: IS• SAT: CMS
Enterprise/productive assets • ACF: CM• Avance Chalco: IS• CARD: MT• DEMOS: CMS• FASL: IS• Integra: CMS• NABW: IS• Nirdhan: PI
Enterprise sales/turnover • ACF: CM• Avance Chalco: IS• FASL: IS• Integra: CMS• NABW: IS• Nirdhan: PI
62 Appendix
Table A.1 Client Indicators Collected by the CAWG Research Partners (cont’d)

Indicatora Institution and Sourceb of Information
Business knowledge/practice/skills • FASL: IS• K-Rep: IS• NABW: IS
Working capital/inventory/stock • ACF: CM• FASL: IS• Integra: CMS• K-Rep: IS• NABW: IS
Enterprise income/cash flow • ACF: CM• Avance Chalco: IS• FORA: CMS• SAT: CMS
Family members in business • ACF: CM• K-Rep: IS• SAT: CMS
Enterprise/product/resource diversification • Avance Chalco: IS• FASL: IS• K-Rep: IS• NABW: IS
Use of loans • Avance Chalco: IS• CARD: LUC• Integra: CMS• K-Rep: IS
Use of business income • Avance Chalco: IS• Integra: CMS
Current assets (other than inventory/working capital) • ACF: CM• Integra: CMS
Investment in premises • Integra: CMS
Sales outlets • FORA: CMS
Enterprise costs • FORA: CMS
Liabilities • ACF: CM• Integra: CMS
Accounts receivable • Integra: CMS
Source of money to repay debt • Integra: CMS
Proportion of loans repaid with business income • Integra: CMS
Increase in debt • Integra: CMS
INDIVIDUAL-LEVEL INDICATORS
Household roles/intrahousehold decision-making • ASA: ILS• FASL: IS• K-Rep: IS• NABW: NA• SAT: CMS
Participation in group/credit program/community • ASA: ILS• FASL: IS• K-Rep: IS• NABW: NA• SAT: CMS
Self-esteem/confidence • ASA: ILS• NABW: NA
Leadership • ASA: ILS• K-Rep: IS
Control over assets/resources • ASA: ILS• NABW: NA
Behavior of informal lenders • K-Rep: IS
Contraceptive usage • Nirdhan: PI
Table A.1 Client Indicators Collected by the CAWG Research Partners (cont’d)
Appendix 63

Indicatora Institution and Sourceb of Information
Civil (marital) status • CARD: MT
Whether endorsed by center • CARD: MT
Age • CARD: MT
Trust • Integra: CMS
Perception of control • Integra: CMS
Money borrowing • Integra: CMS
Time spent with friends • Integra: CMS
Time spent watching television • Integra: CMS
Personal/social responsibility • NABW: NA
Knowledge, know-how, skills • NABW: NA
Personal security/domestic violence • NABW: NA
Ownership of property and assets • NABW: NA
Control over business decisions • SAT: CMS
Participation in religious activities • SAT: CMS
COMMUNITY-LEVEL INDICATORS
Participation in community organizations/activities • FASL: IS• Integra: CMS
Local community involvement as entrepreneur • Integra: CMS
Level of voluntary involvement • Integra: CMS
Number of organizations joined • Integra: CMS
Forward and backward economic linkages • NABW: NA
a Table A.1 lists general indicator categories. The table does not list different indicators collected by the same MFI or by different MFIs in each indicator category.b CM=client monitoring; CMS=client monitoring system; HI=housing index; ILS=Internal Learning System; IS=impact survey; LUC=loan use checklist; MT=means test; PI=personal interview; PS=poverty scorecard; SV=site visit; NA=no answer.
Table A.1 Client Indicators Collected by the CAWG Research Partners (cont’d)
64 Appendix

Client satisfaction focus group discussions (FGDs) • ASA (SEEP/AIMS)• Avance Chalco (SEEP/AIMS)• CARD (SEEP/AIMS)• CRECER (SEEP/AIMS)• FASL (SEEP/AIMS)• FOCCAS (SEEP/AIMS)• SAT (SEEP/AIMS)• ACF (MicroSave)• CARD (MicroSave)• CRS/Benin (MicroSave)• DEMOS (MicroSave)• FOCCAS (MicroSave)• FORA (MicroSave)• K-Rep (MicroSave)• Partner (MicroSave)• Prizma (MicroSave)• NABW
Client satisfaction survey • NABW• Partner
Client satisfaction individual interviews • ACF• NABW• Partner
Participatory rapid assessment • CARD• DEMOS• FOCCAS• FORA• K-Rep• NABW• Partner
Exit survey • ASA (SEEP/AIMS)• Avance Chalco (SEEP/AIMS)• CARD (SEEP/AIMS)• FASL (SEEP/AIMS)• SAT (SEEP/AIMS)• ACF• DEMOS• NABW• Partner• Prizma
Exit monitoring (integration of exit into management information system) • FOCCAS • FORA • Partner• Prizma
Exit FGDs • NABW
Exit individual interviews • NABW
Exit integrated in observation checklists • CARD
Individual interviews with passive clients • NABW
Client monitoring • ACF• ASA• CRECER• DEMOS• FORA• Integra• NABW• Nirdhan• SAT
Table A.2 Summary of Institutions Implementing Client Satisfaction Research
Appendix 65
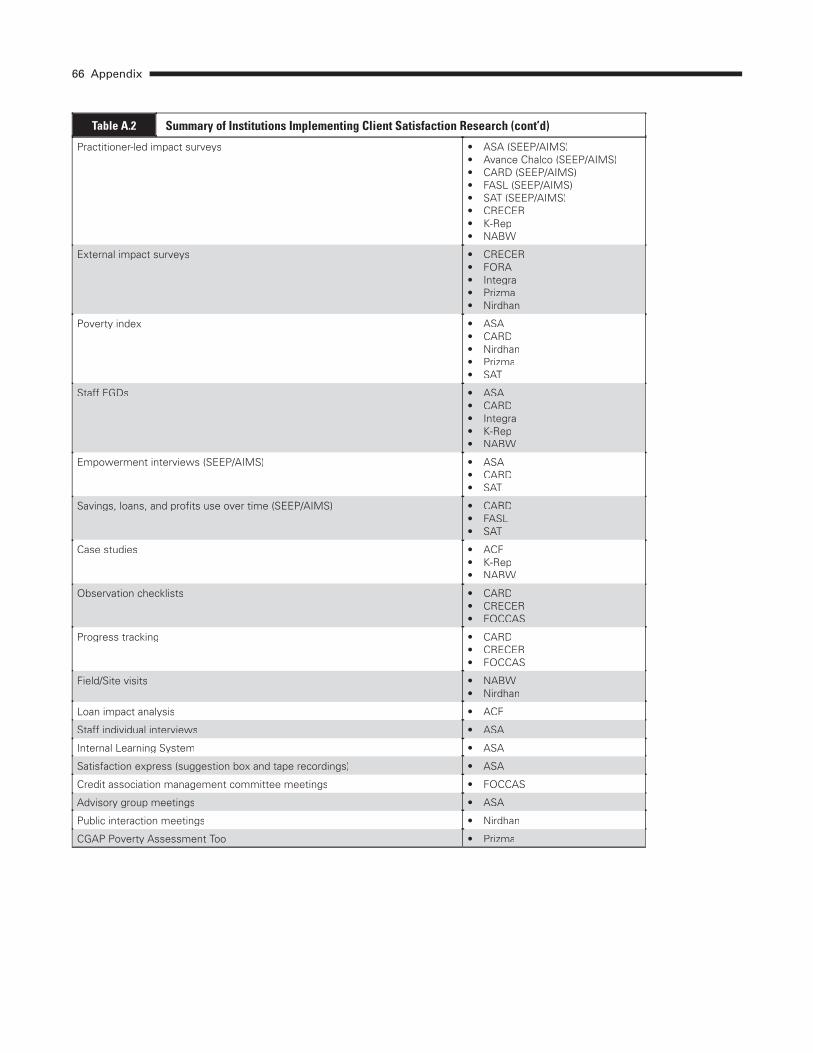
Practitioner-led impact surveys • ASA (SEEP/AIMS)• Avance Chalco (SEEP/AIMS)• CARD (SEEP/AIMS)• FASL (SEEP/AIMS)• SAT (SEEP/AIMS)• CRECER• K-Rep• NABW
External impact surveys • CRECER • FORA • Integra • Prizma • Nirdhan
Poverty index • ASA• CARD• Nirdhan• Prizma• SAT
Staff FGDs • ASA• CARD• Integra• K-Rep• NABW
Empowerment interviews (SEEP/AIMS) • ASA• CARD• SAT
Savings, loans, and profits use over time (SEEP/AIMS) • CARD• FASL• SAT
Case studies • ACF• K-Rep• NABW
Observation checklists • CARD• CRECER• FOCCAS
Progress tracking • CARD• CRECER• FOCCAS
Field/Site visits • NABW• Nirdhan
Loan impact analysis • ACF
Staff individual interviews • ASA
Internal Learning System • ASA
Satisfaction express (suggestion box and tape recordings) • ASA
Credit association management committee meetings • FOCCAS
Advisory group meetings • ASA
Public interaction meetings • Nirdhan
CGAP Poverty Assessment Tool • Prizma
Table A.2 Summary of Institutions Implementing Client Satisfaction Research (cont’d)
66 Appendix

THE SEEP NETWORK
BY ASSESSING CLIENTS’ NEEDS
Gary WollerPRINCIPAL AUTHOR
BU
ILD
ING
SU
CC
ES
SFU
L M
ICR
OFIN
AN
CE
INS
TIT
UTIO
NS
The
SE
EP
Ne
twork
THE SEEP NETWORK
1825 Connecticut Avenue NW Washington, DC 20009
Phone 202.884.8392 Fax 202.884.8479
E-mail [email protected]
Web site & Bookstore www.seepnetwork.org


![[Gary W. Cox] Making Votes Count](https://img.pdfslide.net/doc/110x75/6361c4fb40b666b8ec0e1200/gary-w-cox-making-votes-count.jpg)
