Embed Size (px)
Citation preview

This article appeared in a journal published by Elsevier. The attached
copy is furnished to the author for internal non-commercial research
and education use, including for instruction at the authors institution
and sharing with colleagues.
Other uses, including reproduction and distribution, or selling or
licensing copies, or posting to personal, institutional or third party
websites are prohibited.
In most cases authors are permitted to post their version of the
article (e.g. in Word or Tex form) to their personal website or
institutional repository. Authors requiring further information
regarding Elsevier’s archiving and manuscript policies are
encouraged to visit:
http://www.elsevier.com/authorsrights

Author's personal copy
Conceptual modeling of onshore hydrocarbon seep occurrence in theDezful Embayment, SW Iran
Sanaz Salati a,b,*, Frank J.A. van Ruitenbeek a, Emmanuel John M. Carranza a,1,Freek D. van der Meer a, Majid H. Tangestani b
a Faculty of Geo-information Science and Earth Observation (ITC), University of Twente, P.O. Box 6, 7500 AA Enschede, The NetherlandsbDepartment of Earth Sciences, Faculty of Sciences, Shiraz University, 71454 Shiraz, Iran
a r t i c l e i n f o
Article history:
Received 17 April 2012
Received in revised form
20 February 2013
Accepted 4 March 2013
Available online 14 March 2013
Keywords:
Onshore hydrocarbon seeps
Spatial pattern
Spatial analysis
Conceptual model
a b s t r a c t
Petroleum and gas seeps on the ground surface are direct indicators of accumulations of hydrocarbons in
the subsurface and could reflect the migration of hydrocarbons in a sedimentary basin. Quantitative
analyses of the spatial pattern of hydrocarbon seeps and their spatial associations with geological fea-
tures could aid in deducing geological controls on their occurrence. In this study the Fry analysis was
applied to study the spatial pattern of mapped hydrocarbon seeps, whereas spatial association analyses
were implemented to quantify the spatial association of mapped seeps and their alteration products with
geological features. The spatial pattern analysis of hydrocarbon seeps showed that oil seeps followed
prominent NWeSE and NEeSW trends while gas seeps followed NWeSE and NeS trends suggesting that
NNEeSSW and NWeSE fractures are possible migration pathways for hydrocarbons to reach the surface.
The results of the spatial association analysis illustrated strong positive spatial associations of oil and gas
seeps with the Gachsaran and the Mishan formations, implying upward migration of hydrocarbons
through permeable micro-fractures and micro-pores in their strata. A conceptual model has proposed for
the occurrence of onshore hydrocarbon seeps in the Dezful Embayment.
� 2013 Elsevier Ltd. All rights reserved.
1. Introduction
Petroleum and gas seeps on the ground surface are direct in-
dicators of accumulations of hydrocarbons in the subsurface and
could reflect the migration of hydrocarbons in a sedimentary basin.
Due to high pressures at depths, hydrocarbons in the subsurface
can escape to the surface through fractures in rocks and planes of
weakness between geological layers.
There are extensive studies about spatial patterns of hydrocar-
bon seeps in offshore areas (De Boever et al., 2009; Huang et al.,
2009; Jin et al., 2011; Washburn et al., 2005) and various concep-
tual models of hydrocarbon migration in such areas have been
proposed (Ding et al., 2008; Leifer and Boles, 2005, 2006). In
contrast, few studies have been published about the geological
context of hydrocarbon seeps in onshore areas (Clarke and Cleverly,
1991; Link, 1952; MacGregor, 1993). Hydrocarbon seeps are
spatially associated with structures such as faults, fractures, folds,
unconformities, and salt domes. They can be found within the
reservoirs and cap rock formations exposed at the surface. Spatial
associations of hydrocarbon seeps with geological features could
aid in investigation of cap rock capacity at regional scales (O’Brien
et al., 2005; Pinet et al., 2008). In addition, recognition of spatial
associations between hydrocarbon seeps with geological features
could provide additional valuable information for exploration and
environmental programs (Ellis et al., 2001; Etiope et al., 2006).
Methods for quantitative analyses of the spatial pattern of
mineral deposits and their spatial associations with geological
features have been extensively applied for mineral prospectivity
mapping (Carranza, 2009a, b; Carranza and Sadeghi, 2010). Such
methods have not yet been applied, however, to study hydrocarbon
seep occurrences. Like in mineral prospectivity analysis, quantita-
tive analyses of the spatial pattern of hydrocarbon seeps and their
spatial associations with geological features such as faults, frac-
tures, and lithologies could aid in deducing geological controls on
their occurrence. Analysis of the spatial pattern of mapped hydro-
carbon seeps could provide insights into which geological features
control their localization at the surface. In addition, analysis of
spatial association of mapped seeps with geological features is
instructive inweighing the importance of each geological feature as
* Corresponding author. Faculty of Geo-information Science and Earth Observa-
tion (ITC), University of Twente, P.O. Box 6, 7500 AA Enschede, The Netherlands.
Tel.: þ31 53 4874227; fax: þ31 53 4874336.
E-mail addresses: [email protected], [email protected] (S. Salati).1 Present address: School of Earth and Environmental Sciences, James Cook
University, Townsville, Queensland 4811, Australia.
Contents lists available at SciVerse ScienceDirect
Marine and Petroleum Geology
journal homepage: www.elsevier .com/locate/marpetgeo
0264-8172/$ e see front matter � 2013 Elsevier Ltd. All rights reserved.
http://dx.doi.org/10.1016/j.marpetgeo.2013.03.001
Marine and Petroleum Geology 43 (2013) 102e120

Author's personal copy
controls on the occurrence of hydrocarbon seeps. Consequently,
such analyses would allow development of a conceptual model of
how hydrocarbon seeps are localized at the surface and why they
occur only at specific sites.
In this paper, we describe quantitatively the spatial pattern of
mapped hydrocarbon seeps in the Dezful Embayment, SW Iran. The
prime objectives of this study are to obtain insights about (a) links
between geological structures such as faults, fold axes and fractures
and hydrocarbon seeps and (b) the probability of spatial association
of different geological features such as lithological units and their
associated structures with oil and gas seeps. We chose the Dezful
Embayment for this study because sufficient knowledge exists
about the distribution of petroleum at the surface and in the
subsurface.
2. Geological setting of the study area
The study area is located in the Zagros fold-thrust belt, SW Iran.
The co-existence of rich source rocks, excellent reservoirs, efficient
seal, large anticlines and rock fractures resulting from the Zagros
folding explain the importance of the Zagros fold-thrust belt as a
prolific petroleum province (Bordenave and Hegre, 2005). At least
40e50% of Iranian seeps in the SEEPS database, which was pro-
duced by the British Petroleum and described by Clarke and
Cleverly (1991), can be linked to underlying hydrocarbon accu-
mulations (MacGregor, 1993).
2.1. General geology
The Zagros fold-thrust belt resulted from the continental colli-
sion between the Arabian plate and Iranian block (Berberian and
King, 1981). This compressive movement began during Late
Cretaceous and became widespread following the continente
continent collision in Miocene, which is still active in NeS direc-
tion (Falcon, 1974; Sella et al., 2002; Stocklin, 1968). The conver-
gence direction is oblique to NWeSE trend of the orogenic belt. The
Zagros fold-thrust belt, which lies south of the Zagros Suture
(Fig.1), is divided into NW-SE trending structural zones (imbricated
and simply folded belt) and laterally divided to Lurestan, Dezful
embayment and Fars region (Berberian and King, 1981; Carruba
et al., 2006; Falcon, 1974; Motiei, 1993; Sherkati and Letouzey,
2004; Stocklin, 1968).
The Dezful Embayment, situated in the central-southern part of
the Zagros fold-thrust belt (Fig. 1), hosts most of the onshore hy-
drocarbon reservoirs of Iran. This area, which is situated southwest
of the Mountain Front Fault (MFF), is dominated by NWeSE
trending folds and thrusts. The NW boundary of the Dezful
Embayment coincides with the Balarud fault zone (BFZ) and its SE
Figure 1. Structural setting of the Zagros fold including locations of oil and gas fields.
S. Salati et al. / Marine and Petroleum Geology 43 (2013) 102e120 103

Author's personal copy
boundary is defined by the Kazerun fault zone (KFZ). The NEeSW-
trending BFZ, the NeS-trending KFZ and Izeh fault zone (IFZ), and
the NWeSE-trending MFF are seismically active (Berberian, 1995)
and have significant influence on hydrocarbon entrapment in the
Zagros fold-thrust belt (Beydoun et al., 1992; Bordenave and Hegre,
2005; Hessami et al., 2001; McQuillan, 1991).
The stratigraphy of the study area (Fig. 2) is defined by a
competent group formed by a structural unit between the lower
detachment or lower mobile group (the Hormuz salt) and the
upper detachment or upper mobile group (the Gachsaran evapo-
rites) (O’Berian, 1957). The mobile Gachsaran Formation migrated
from the crest of anticlines downward and accumulated within
synclines, accentuating the asymmetry of the whole structure
(Sherkati et al., 2005). This deformation caused severe disharmony
between surface structures and the underlying structures
(Abdollahi Fard et al., 2011; Alavi, 2004; Bahroudi and Koyi, 2004;
Gill and Ala, 1972; Kashfi, 1980; Motiei, 1993; O’Berian, 1957;
Sherkati and Letouzey, 2004; Sherkati et al., 2005). The ongoing
late Tertiary folding concurrent with deposition, means that the
lower member of the Gachsaran Formation (seal) thin as they
overlap and wedge out onto growth folds in the Asmari reservoir
(Alavi, 2004; Warren, 2006). The base of the Gachsaran Formation
forms a major décollement, which shows the repetition by fault-
ing. Several thrusts produced by slip on the basal Gachsaran
displace the Gachsaran evaporites and its overlying units (Alavi,
2004).
2.2. Petroleum geology
The Cretaceous to Early Miocene shallow petroleum system of
the Dezful Embayment is one of the world richest oil fields because
it contains about 8% of global oil reserves (Bordenave and Hegre,
2010). This petroleum system comprises two source rocks
including the Kazhdumi and the Pabdeh Formations, two reservoirs
including the Asmari and the Sarvak Formation, and two seals
including the Gachsaran and the Gurpi Formations.
The Albian Kazhdumi Formation (Kz) consists of bituminous
shale with argillaceous limestone. Except in oil fields to the NE of
the Dezful Embayment, most of the oil accumulated in the Asmari/
Sarvak reservoirs originated from the Kz (Bordenave and Hegre,
2010). The Eocene Pabdeh Formation (Pd) is composed of marls,
shales, and carbonates, all rich in pelagic micro-fauna. Recent
studies showed that most parts of the Pd, including its limestone
beds, were deposited in a ramp environment. The Pd separates the
structural traps of the Cretaceous Bangestan Group from the
overlying Asmari Formation (Bordenave and Hegre, 2010).
The Asmari Formation contains 75% of the onshore hydrocarbon
reserves. Fractures resulting from the Zagros folding enhanced the
quality of this limestone reservoir by facilitating the expulsion of oil
from source rocks in anticline areas (Bordenave and Hegre, 2005).
The Sarvak Formation, which is the second major reservoir, ac-
counts for 23% of hydrocarbon reserves in the Dezful embayment.
The Sarvak limestone Formation is often interconnected to the
Asmari Formation in high-relief often thrust anticlines and have the
same oil water level because of the fracturing of the Pabdeh-Gurpi
marls in the crestal part of the anticlines (Bordenave and Hegre,
2005). The Asmari reservoir is sealed by the Gachsaran evapo-
rites. The Gachsaran Formation exhibits rhythmic bedding con-
sisting of bluish-green marl, limestone, dolomite and anhydrite,
with/without bedded salt (Gill and Ala, 1972; Motiei, 1993). The
Sarvak reservoir is sealed by the Gurpi Formation, which is domi-
nated by marl and thin interlayers of limestone.
Oil migrated from the source rocks through structures formed
during the Zagros folding around 10 Ma ago and continued
throughout the Late Miocene and Pliocene. Oil expulsion from the
Kz and Pd began between 8 Ma and 3 Ma ago during deposition of
the Aghajari Formation (Bordenave and Hegre, 2010). Oil expulsion
from the source rocks was also coeval with the formation of the
Figure 2. Formations correlation within the Zagros belt (James and Wynd, 1965).
S. Salati et al. / Marine and Petroleum Geology 43 (2013) 102e120104

Author's personal copy
Zagros folds such that hydrocarbons migrated almost vertically to
reserves in neighboring anticlines. High pressure in pore spaces of
the Kz formed a barrier, however, and prevented oil generated in
deeper source rocks from reaching the reservoirs (Bordenave and
Hegre, 2010). Oil was expelled from the Pd only in the deeper
part of some of synclines, which represent less than 1% of the total
oil expelled (Bordenave and Hegre, 2005).
2.3. Hydrocarbon seeps in the Zagros belt
The presence of hydrocarbon seeps led to the discovery of the
subsurface petroleum in the SW Iran in early 1900s. There are
different types of hydrocarbon seeps in the Zagros fold-thrust belt,
such as crude oil, heavy oil or asphalt, gas, gas/oil. Gach-e-tursh and
sulphur springs are products of the subsurface alteration processes
of gas seeps (Clarke and Cleverly, 1991), which are common in the
Dezful Embayment. The term Gach-e-tursh, which was used by
Thomas (1952), represents an association of oxidizing petroleum
seep, gypsum, jarosite, sulphuric acid, and sulphur.
To the best of the author’s knowledge there are few published
studies about hydrocarbon seeps in the Zagros oil fields in Iran
(Link, 1952; Safari et al., 2011). Based on geological controls, Link
(1952) classified seeps into 5 groups. The Zagros hydrocarbon
seeps were classified as seeps coming from oil accumulations,
which have been eroded or reservoirs ruptured by faulting and
folding. By using Remote Sensing techniques, Safari et al. (2011)
studied the role of the Kzerun fault on localizing oil and sulfur
springs in the Nargesi oil field, SW Iran.
3. Methods
We used 14.1:100,000 scale geological maps of the Dezful
Embayment, which have been compiled by the Iranian oil com-
pany, to provide lithologic, structural, and hydrocarbon seep
maps. Existing knowledge about petroleum systems in the Zagros
oil fields (Bordenave, 2002; Bordenave and Hegre, 2010), and
extensive studies about the structural framework of the Zagros
fold-thrust belt (Berberian, 1995; Bordenave and Hegre, 2005;
Carruba et al., 2006; Hessami et al., 2001; McQuillan, 1991; Sepehr
and Cosgrove, 2002; Sherkati and Letouzey, 2004) provide us in-
sights into defining geological controls on petroleum systems in
the Zagros. Insights into geological controls on hydrocarbon seeps
migration and localization can be derived by examining the
spatial distribution of hydrocarbon seeps via spatial pattern and
spatial association analyses. Because several locations of heavy
oil/asphalt seeps and two products of gas seep alteration, namely
Gach-e-tursh and sulphur springs, exist in geological maps of the
study area, these sub-sets of seeps were used in the spatial
analyses.
3.1. Analysis of spatial pattern of hydrocarbon seeps
Hydrocarbon seeps exhibit trends that are similar to trends of
faults and anticline axes (Fig. 3) and lithologic units (Fig. 4) in the
study area. This illustrates that hydrocarbon seeps in the Zagros oil
fields are, in general, structurally controlled (Beydoun et al., 1992;
Bordenave and Hegre, 2010; Douglas Elmore and Farrand, 1981;
Link, 1952; Rudkiewicz et al., 2007). However, there is a question
about which specific sets of geological structures controls the
occurrence of each sub-set of hydrocarbon seeps at regional and
local scales. An answer to this question can be explored through
analysis of the spatial pattern of each sub-set of hydrocarbon seeps.
For this purpose, we applied Fry analysis (Fry, 1979) to maps of
locations of hydrocarbon seeps in the study area.
Fry analysis is a geometrical method of examining spatial
autocorrelation of a set of points, by plotting translations of
points whereby each point is used as an origin for translation.
Fry analysis describes the spatial pattern of a set of points based
on orientations and distances between pairs of translated points.
A rose diagram can be created for orientations and frequencies
of orientations between all pairs of translated points and pairs
of translated points within specific distances. These orientations
reveal trends in the points of interest at regional and local scales
(Carranza, 2009a,b; Carranza and Sadeghi, 2010). Analysis of
point’s trends at local scales can be used to deduce processes
that localize hydrocarbon occurrences (as points) at certain
areas. To analyze trends between any two neighboring seeps, a
minimum distance was used within which there is a maximum
probability for only one neighbor point next to any one of the
points.
We used the DotProc (http://www.kuskov.com) package for Fry
analysis. We exported the map coordinates of hydrocarbon seep
locations into a delimited file, which is supported by the DotProc
software. Fry point coordinates were then exported back into the
GIS to visualize and analyze the spatial pattern of seeps. We applied
this method to all hydrocarbon seeps and to each sub-set of seeps,
as well.
3.2. Analysis of spatial association between hydrocarbon seeps and
geological features
Analysis of the spatial association of occurrences of hydrocarbon
seeps with geological features could provide insights into which
features plausibly controlled those occurrences at specific loca-
tions. We applied the distance distribution analysis (Berman, 1977)
for quantifying spatial association between hydrocarbon seeps and
structural features such as mapped faults and anticline axes. The
quantified spatial association refers to the distance or range of
distances where hydrocarbon seeps are preferentially located from
structural features such as faults and anticline axes. Also, we
applied weights-of-evidence (WofE) analysis (Bonham-Carter,
1994) to quantify spatial associations of hydrocarbon seeps with
lithologic units.
3.2.1. Distance distribution analysis
The distance distribution analysis quantifies spatial associations
between a set of point objects and another set of objects with a
particular geometry. It compares a cumulative relative frequency
distribution of distances from a set of linear geo-objects to a set of
points of interest (denotes as D(M)) and a cumulative relative fre-
quency distribution of distances from the same set of linear objects
to a set of random point geo-objects (denotes as D(N)). In this study,
D(M) and D(N) represent, respectively, a cumulative relative fre-
quency distribution of distances from faults and anticline axes to
hydrocarbon seeps and a cumulative relative distribution of dis-
tances from the same lineaments to a set of random points. The
graph of D(M) is compared with the graph of D(N) by computing
KolmogoroveSmirnov statistic to test the null hypothesis that lo-
cations of points of interest and linear geo-objects are spatially
independent:
D ¼ DðMÞ � DðNÞ (1)
A positive D implies that there is a positive spatial association
between the points of interest (hydrocarbon seeps) and the set of
linear geo-objects, whereas a negative D implies negative spatial
association between them. If D ¼ 0, it implies that the locations of
points of interest and the linear geo-objects are spatially indepen-
dent. An upper confidence band for the graph of D(N) curve can be
S. Salati et al. / Marine and Petroleum Geology 43 (2013) 102e120 105

Author's personal copy
calculated to determine statistically and graphically if D(M) is
greater than D(N) (Berman, 1977):
UDðNÞ ¼ DðNÞ þ
ffiffiffiffiffiffiffiffiffiffiffiffiffiffiffiffiffiffiffiffiffiffiffiffiffiffiffiffiffiffiffi
9:21
�
N þM
4NM
�
s
(2)
whereM is the number of points of interest and N is the number of
random point geo-objects. The value of 9.21 is a critical c2 value for
2 degrees of freedom and significance level a ¼ 0.01 (Berman,
1977).
The b statistic, which has a c2 distribution, can be applied to find
the distance from a set of linear geo-objects at which a positive D
value is the highest (Berman, 1977):
b ¼ 4D2NM=ðN þMÞ (3)
We applied this method to quantifying spatial association of
hydrocarbon seeps with faults and anticline axes. The values of D
(Eq. (1)) show the spatial association of hydrocarbon seeps with
structural features and values of b (Eq. (3)) determine the distance
of optimal positive spatial association between the same linea-
ments and seeps. A positive spatial association (D > 0) between a
set of hydrocarbon seep locations and a set of geological features
suggests that the later represents a set of probable geological
controls on the occurrence of the former. The value of b represents
an optimal distance from the geological features, which within this
distance there is significantly higher proportion of the occurrence
of hydrocarbon seeps than would be expected due to chance.
Figure 3. Distribution of faults, anticline axes, and hydrocarbon seeps in the study area.
S. Salati et al. / Marine and Petroleum Geology 43 (2013) 102e120106
Author's personal copy
3.2.2. Weights of evidence (WofE) analysis
The WofE analysis uses a log-linear derivation of Bayesian
probability to quantify spatial association between a dependent
variable (e.g., hydrocarbon seep occurrence) and an independent
variable (e.g., presence of geological features) by statistical means
(see (Bonham-Carter, 1994) for more details). In WofE analysis, a
positive weight (Wþ) and a negative weight (W�) represent,
respectively, positive and negative spatial associations of points of
interest D with spatial feature B. The Wþ is calculated as:
Wþ ¼ logePfBjDg
P�
B�
�D� (4)
and W� is calculated as:
W� ¼ logeP�
BjDg
P�
B�
�D� (5)
where B is a binary map of a spatial feature and D is a binary map of
points of interest. The PfBjDg=PfBjDg is known as “sufficiency
ratio” (LS) and PfBjDg=PfBjDg is known as “necessity ratio” (LN).
These ratios are also known as “likelihood ratios” (Bonham-Carter,
1994). D and B, respectively, indicate the presence of the points of
interest and the spatial feature, whereas, D and B, respectively,
represent the absence of the points of interest and the spatial
feature.
The contrast (C), which is a measure of the spatial association
between the points of interest and the spatial features, is calculated
as:
C ¼�
Wþ
��
W�
(6)
We applied the WofE method to provide a measure of spatial
association of hydrocarbon seeps (D) with lithologic units (B). A
studentized contrast (SigC) provides a measure of the certainty
with which the contrast is known (Bonham-Carter, 1994). It is
defined as the ratio of the contrast divided by its standard devia-
tion. The studentized contrast (SigC) is calculated as (Bonham-
Carter, 1994):
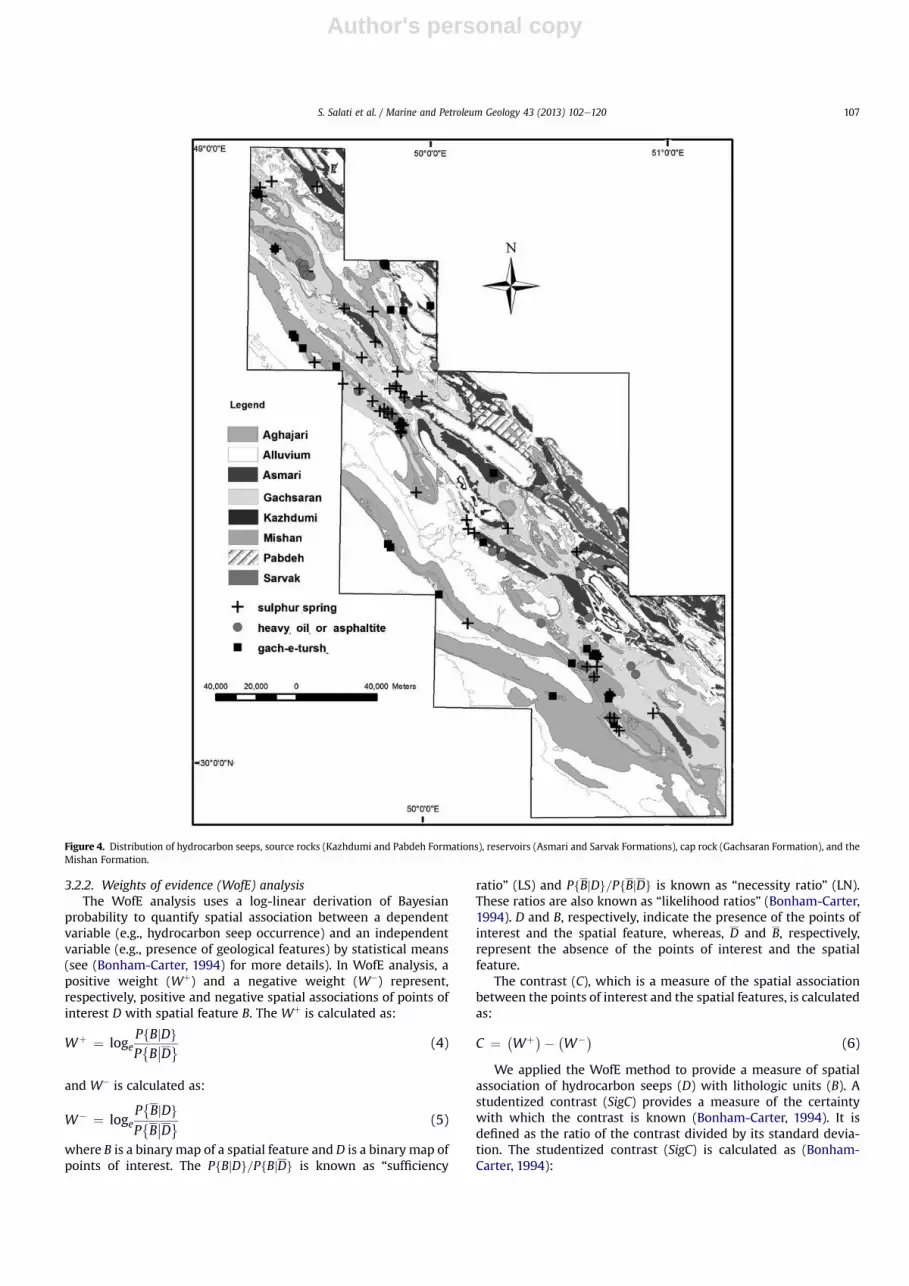
Figure 4. Distribution of hydrocarbon seeps, source rocks (Kazhdumi and Pabdeh Formations), reservoirs (Asmari and Sarvak Formations), cap rock (Gachsaran Formation), and the
Mishan Formation.
S. Salati et al. / Marine and Petroleum Geology 43 (2013) 102e120 107

Author's personal copy
SigC ¼C
ffiffiffiffiffiffiffiffiffiffiffiffiffiffiffiffiffiffiffiffiffiffiffiffiffiffiffiffiffiffiffiffiffiffiffiffiffiffiffiffi
s2�
Wþ
þ s2�
W�
q (7)
A SigC greater than 2 suggests a statistically significant spatial
association. The maximum SigC is used as index of significant
spatial association between hydrocarbon seeps and lithological
units.
4. Results
4.1. Spatial patterns of hydrocarbon seeps
Mapped hydrocarbon seeps in the Dezful Embayment show
prominent 315�� 15 trend (Fig. 5), which is roughly the same as
the general trend of folds and faults in the Zagros fold-thrust belt.
Fry plots of hydrocarbon seeps at local scales (<43 km) show
subsidiary NNEeSSW trend (Fig. 5a). At the local scale, the Fry
plots of heavy oil or asphalt seeps show a prominent NWeSE
trend and a subsidiary NNEeSSW trend (Fig. 6). The Fry plots of
Gach-e-tursh and sulphur springs show prominent NWeSE and
subsidiary NeS trends (Figs. 7a and b). These trends seem corre-
spond with trends of major lineaments that are either perpen-
dicular or parallel to (a) the general trend of the Zagros folds
related to the shortening trend of the Zagros (NEeSW) and (b) the
trends of basement faults (NeS and NWeSE). These indicate the
ongoing influence of NWeSE and NNEeSSW trending faults and/
or fractures on the occurrence of hydrocarbon seeps in the Dezful
Embayment.
It is known that there is a close correlation between the oil
production pattern and structures trending NNEeSSW (McQuillan,
1991) or NeS (Edgell, 1996). Thrust faults exposed to the surface are
Figure 5. Fry plots and trends of pairs of Fry points of locations mapped hydrocarbon seeps.
S. Salati et al. / Marine and Petroleum Geology 43 (2013) 102e120108

Author's personal copy
parallel to the NW-SE trending folds and are mostly located at the
southwestern limb of anticlines. In addition, there are two types of
fractures in the Dezful Embayment (Lacombe et al., 2011; Mobasher
and Babaie, 2007; Stephenson et al., 2007; Wennberg et al., 2007):
fold related fractures and fault related fractures. The 45 � 5�(NEe
SW) trend of all hydrocarbon seeps is perpendicular to the axial
trace of anticlines. This trend, which is possibly related to fold- and/
or fault-related fractures, is strongly evident in the Fry plots of
Gach-e-tursh at the local scale (Fig. 7a). At the local scale, the Fry
plots of the Gach-e-tursh and sulphur springs show a prominent
160�e170� (roughly NeS). This trend is plausibly due to fractures
formed at small oblique angles to the main NeS (10 � 5�) trending
faults (e.g., Kazerun) (Mobasher and Babaie, 2007). The subsidiary
E-W trend (80�e90�) of mapped hydrocarbon seeps is plausibly
related to fractures oblique to NWeSE trending folds, NWeSE
trending faults, and NeS trending basement faults.
By inference from the analyses of the spatial patterns of mapped
hydrocarbon seeps in the study area, it is likely that NNWeSSE
trending faults/fractures are plausible structural controls on the
occurrences of oil and gas seeps. Heavy oil or asphalt seeps showed
the prominent NWeSE trend, which is the same as the general
trend of folds. Gas seep alteration products (Gach-e-tursh and
sulphur springs) showed the prominent NNWeSSE trends, which
are similar to the general trends of folds and basement faults. The
results of the spatial pattern analyses can be interpreted further by
analysis of spatial associations between mapped seeps and struc-
tural and lithological units.
4.2. Spatial associations of hydrocarbon seeps with structural units
Heavy oil or asphalt seeps have positive spatial association with
anticlines (Fig. 8a). Within 4 km of anticline axes, 78% of heavy oil
Figure 6. Fry plots and trends of pairs of Fry points of locations mapped heavy oil or asphalt seeps.
S. Salati et al. / Marine and Petroleum Geology 43 (2013) 102e120 109

Author's personal copy
or asphalt seeps are present. Based on the curve of D, there is at
most 22% higher occurrence of heavy oil or asphalt seeps than
would be expected due to chance (Fig. 8a). As indicated in Figure 8b,
there is positive spatial association between heavy oil or asphalt
seeps and thrust faults. It appears in Figure 8b that about 60% of the
heavy oil or asphalt seep occurrences are within 6 km of the
mapped thrust faults suggesting that fault related fractures or/and
non-fault related fractures can provide pathways for heavy oil seeps
to reach the surface.
Sulphur springs have positive spatial association with anti-
cline axes (Fig. 8c) and thrust faults (Fig. 8d). However, these
spatial associations are not statistically significant (at a ¼ 0.01).
The two peaks in the D curve (Figs. 8c) imply that there are two
groups of sulphur springs in the area. The first group is
comprised of about 30% of the sulphur springs located about an
average of 1 km away from anticline axes. The second group is
comprised of about 70% of springs located about an average of
4 km away from anticline axes. It appears in Figure 8c that about
78% of the sulphur springs occurrences are within 10 km of the
mapped thrust faults.
Gach-e-tursh shows weak but significant (at a ¼ 0.05) posi-
tive spatial association with anticline axes. As indicated in
Figures 8e, 38% of the Gach-e-tursh is located within 1 km of the
mapped anticline axes. Within 1 km of anticline axes, there is at
most 20% higher frequency of Gach-e-tursh than would be
expected due to chance. The Gach-e-tursh shows statistically
significant (at a ¼ 0.01) positive spatial association with thrust
faults (Figs. 8f).
4.3. Spatial association of hydrocarbon seeps with lithological units
Table 1 presents the weights and contrast values calculated for
each lithologic unit with respect to the heavy oil or asphalt seeps,
Gach-e-tursh, and sulphur springs. The hydrocarbon seeps exhibit
positive spatial associations with the Asmari (reservoir), Gachsaran
(cap rock), and Mishan Formations.
The Gachsaran Formation shows significant positive spatial as-
sociationwith heavy oil or asphalt seeps. Heavy oil or asphalt seeps
have positive spatial associations with the Asmari and Mishan
Formations. Heavy oil or asphalt seeps lack spatial associations
with the other lithological units with negative values of SigC.
Gach-e-tursh and sulphur springs show a significant positive
spatial association with the Mishan Formation and positive spatial
association with the Gachsaran Formation. The other lithological
units do not show spatial associations with sulphur springs and
Gach-e-tursh.
The quantified spatial associations of lithological units with
mapped hydrocarbon seeps and their alteration products are
coherent with facts that the densities of oil and gas seeps are not
decreased upwards in the stratigraphy.
Figure 7. Fry plots and trends of pairs of Fry points of locations mapped (A) Gach-e-Tursh seeps, and (B) sulphur springs.
S. Salati et al. / Marine and Petroleum Geology 43 (2013) 102e120110

Author's personal copy
Figure 8. Graphs of cumulative relative frequency of distances at seep locations (D(M)) and non-seep locations (D(N)) around structural units in the Dezful Embayment. D and u
D(N) represent spatial association of seeps with structures and confidence band for a ¼ 0.01 respectively. (a) and (b) show analysis of spatial association of heavy oil or asphalt seeps
with anticline axis and with thrust faults; (c) and (d) represent analysis of spatial association of sulphur springs with anticline axis and with thrust faults; (e) and (f) show analysis of
spatial association of Gach-e-Tursh with anticline axis and with thrust faults.

Author's personal copy
4.4. Spatial association of sub-sets of hydrocarbon seeps with
structures only in lithological units having positive spatial
association
The results of the spatial association analysis show that heavy oil
or asphalt seeps have significant positive spatial associations with
anticline axes in the Asmari reservoir, Gachsaran, and Mishan
Formations (Fig. 9a, c and e). These positive spatial associations are
optimal within 2.6 km of the anticline axes in the Asmari Formation
(Fig. 9b), within 5.8 km of anticline axes in the Gachsaran Formation
(Fig. 9d), andwithin3.8kmof anticline axes in theMishanFormation
(Fig. 9f).Within 2.6 km, there is 100% occurrence of known heavy oil
or asphalt seeps of the anticline axes in the Asmari Formation
(Fig. 9a).Within 5.8 kmof anticline axes of theGachsaran Formation,
there is at least 50% higher frequency of heavy oil or asphalt seeps
than would be expected due to chance (Fig. 9c). According to the
curveD in Figure 9e,within3.8 kmof theanticline axes in theMishan
Formation, there is at least 85% higher frequency of heavy oil or
asphalt seeps thanwould be expected due to chance. From the curve
D, it appears that heavy oil or asphalt seeps have stronger positive
spatial association with anticline axes in the Asmari Formation.
These results are coherentwith the fact that oil seeps occurring close
to the Oligocene Asmari Formation represent the final exhaustion of
former oil accumulations (Douglas Elmore and Farrand, 1981).
Figure 10 shows the analyses of spatial associations of heavy oil
or asphalt seeps with thrust faults in the three lithologic formations
having positive spatial associations with these seeps. There is no
positive spatial association between heavy oil or asphalt seeps
within 15 km of thrust faults in the Asmari Formation (Fig. 10a), but
this sub-set of seeps have positive spatial associations with thrust
faults in the Gachsaran and Mishan Formations (Fig. 10c and e). The
two peaks in the D and b curves (Fig. 10c and d) imply that there are
two groups of heavy oil or asphalt seeps with respect to thrust
faults in the Gachsaran Formation. The first group is comprised of
about 70% of the heavy oil or asphalt seeps located about an average
of 3.8 km away from thrust faults. The second group is comprised of
about 30% of heavy oil or asphalt seeps located about an average of
10.4 km away from thrust faults. The positive spatial association of
heavy oil or asphalt seeps is optimal within 5.4 km of thrust faults
in the Mishan Formation (Fig. 10f).
Figure 11 shows the analyses of spatial association of Gach-e-
tursh with structures in the Mishan and Gachsaran Formations.
There are statistically significant (at a ¼ 0.01) positive spatial as-
sociations between Gach-e-tursh and structures in the Gachsaran
Formation (Fig. 11a and c). The two peaks in the D and b curves
(Fig. 11b) imply that there are two groups of Gach-e-tursh with
respect to anticline axes in the Gachsaran Formation. The first
group is comprised of about 78% of the Gach-e-tursh located about
an average of 5.8 km away from anticline axes. The second group is
comprised of about 22% of Gach-e-tursh located about an average
of 10.9 km away from anticline axes. There are also two peaks in the
D and b curves of the spatial association of the Gach-e-tursh with
thrust faults in the Gachsaran Formation. The first group is
comprised of about 85% of the Gach-e-tursh located about an
average of 5.4 km away from thrust faults. The second group is
comprised of about 15% of Gach-e-tursh located about an average of
10.4 km away from thrust faults.
The Gach-e-tursh has statistically significant (at a ¼ 0.01) pos-
itive spatial associations with structures in the Mishan Formation
(Fig. 11e and g). The positive spatial association is optimal at 6.8 km
of the anticline axes (Fig. 11f). The two peaks in the D and b curves
(Fig. 11g and h) imply that there are two groups of Gach-e-tursh
with respect to thrust faults of the Mishan Formation. The first
group is comprised of about 63% of the Gach-e-tursh located about
an average of 5.4 km away from thrust faults. The second group is
comprised of about 37% of Gach-e-tursh located about an average of
15 km away from thrust faults.
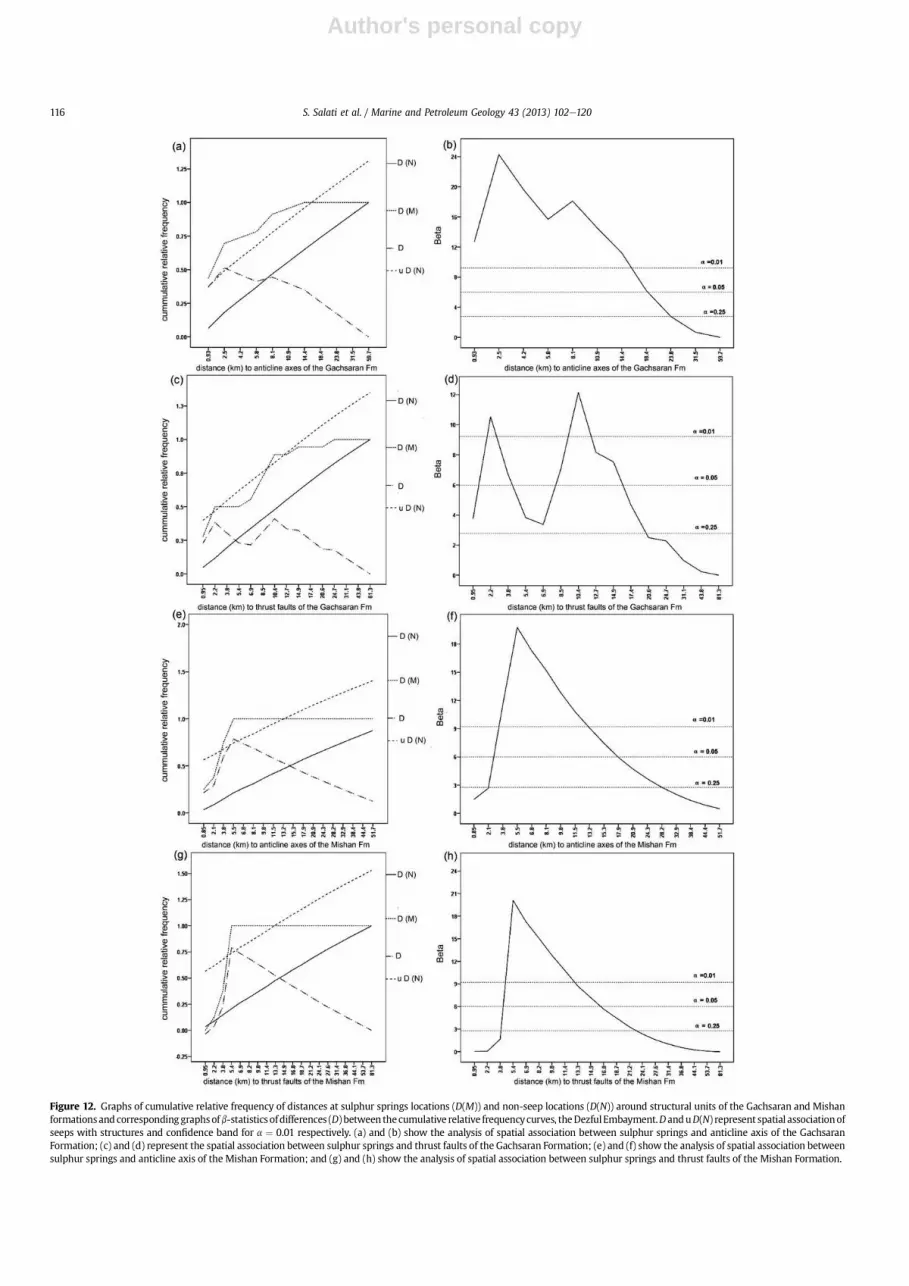
Sulphur springs have positive spatial association with anticline
axes and thrust faults in the Gachsaran Formation (Fig. 12a and c).
Within 2 km of anticline axes and thrust faults in the Gachsaran
Formation, there are at least 70% and 50% of known sulphur springs,
respectively. The two peaks in the D and b curves (Fig. 12c and d)
Table 1
Variation of weights and contrasts for lithologic units with respect to (a) heavy oil or
asphalt seeps; (b) Gach-e-tursh; and (c) sulphur springs. Values in bold represent
statistically significant positive spatial associations.
Variation of weights and contrasts for lithological units with respect to heavy
oil or asphalt seeps
Lithologic units Wþ W� C SigC
Alluvium 0.006 0.14 �0.13 �0.27
Bakhtiari 0 0.076 �0.076 �0.15
Lahbari 0 0.09 �0.09 �0.18
Aghajari �1.14 0.11 �1.15 �2.3
Mishan 0.8 �0.06 0.86 1.72
Gachsaran 1.3 �0.05 1.63 3.26
Asmari 1.09 �0.02 1.11 2.22
Gadvan 0 0.001 �0.001 �0.002
Gurpi 0 0.009 �0.009 �0.019
Hurmuz 0 0.0002 �0.0002 �0.0004
Kazhdumi 0 0.003 �0.003 �0.006
Pabdeh 0 0.2 �0.2 �0.4
Sarvak 0 0.02 �0.02 �0.04
Daryan 0 0.0002 �0.0002 �0.0004
Fahlyan 0 0.003 �0.003 �0.006
Shahbazan 0 0.0002 �0.0002 �0.0004
Tutak 0 0.0002 �0.0002 �0.0004
Variation of weights and contrasts for lithologic units with respect to
Gach-e-tursh
Lithologic units Wþ W� C SigC
Alluvium �1.06 0.25 �1.31 �1.35
Bakhtiari 0 0.076 �0.076 �0.078
Lahbari 0 0.09 �0.09 �0.092
Aghajari 0 3.11 �3.11 �3.2
Mishan 2 �0.39 2.39 2.4
Gachsaran 1.08 �0.45 1.53 1.57
Asmari �0.28 �0.3 0.3 �0.3
Gadvan 0 0.001 �0.001 �0.001
Gurpi 0 0.009 �0.009 �0.01
Hurmuz 0 �0.0002 �0.0002 �0.0002
Kazhdumi 0 0.003 �0.003 �0.003
Pabdeh 0.59 �0.025 0.615 0.6
Sarvak 0 0.02 �0.02 �0.02
Daryan 0 0.0018 �0.0018 �0.005
Fahlyan 0 0.005 �0.005 �0.005
Shahbazan 0 0.0002 �0.0002 �0.0002
Tutak 0 0.0002 �0.0002 �0.0002
Variation of weights and contrasts for lithologic units with respect to sulphur
springs
Lithologic units Wþ W� C SigC
Alluvium �0.2 0.07 �2.07 �3.45
Bakhtiari 0 0.076 �0.076 �0.13
Lahbari 0 0.09 �0.09 �0.15
Aghajari 0 0.16 �0.16 �0.3
Mishan 1.53 �0.2 1.75 2.9
Gachsaran 1.13 �0.5 1.63 2.7
Asmari �1.2 0.05 �1.25 �2.08
Gadvan 0 0.001 �0.001 �0.001
Gurpi 0 0.009 �0.009 �0.01
Hurmuz 0 0.0002 �0.0002 �0.0003
Kazhdumi 0 0.003 �0.003 �0.005
Pabdeh �0.33 0.008 �0.34 0.6
Sarvak 0.02 0.02 �0.02 �0.03
Daryan 0 0.0018 �0.0018 �0.003
Fahlyan 0 0.003 �0.003 �0.005
Shahbazan 0 0.0002 �0.0002 �0.0003
Tutak 0 0.0002 �0.0002 �0.0003
S. Salati et al. / Marine and Petroleum Geology 43 (2013) 102e120112

Author's personal copy
Figure 9. Graphs of cumulative relative frequency of distances at heavy oil or asphalt seep locations (D(M)) and non-heavy oil or asphalt locations (D(N)) around structural units of
the three formations and corresponding graphs of b-statistics of differences (D) between the cumulative relative frequency curves, the Dezful Embayment. D and u D(N) represent
spatial association of seeps with structures and confidence band for a ¼ 0.01 respectively. (a) and (b) show the analysis of the spatial association between heavy oil or asphalt and
anticline axis of the Asmari Formation; (c) and (d) represent the spatial association between heavy oil or asphalt and anticline axis of the Gachsaran Formation; (e) and (f) show the
analysis of the spatial association of heavy oil or asphalt seeps with the Mishan Formation.
S. Salati et al. / Marine and Petroleum Geology 43 (2013) 102e120 113

Author's personal copy
Figure 10. Graphs of cumulative relative frequency of distances at heavy oil or asphalt seep locations (D(M)) and non-heavy oil or asphalt locations (D(N)) around thrust faults of
three formations and corresponding graphs of b-statistics of differences (D) between the cumulative relative frequency curves, the Dezful Embayment. D and u D(N) represent
spatial association of seeps with structures and confidence band for a ¼ 0.01 respectively. (a) and (b) show the analysis of spatial association between heavy oil or asphalt seeps and
thrust faults of the Asmari Formation; (c) and (d) represent the spatial association between heavy oil or asphalt seeps and thrust faults of the Gachsaran Formation; and (e) and (f)
show the spatial association between heavy oil or asphalt seeps and thrust faults of the Mishan Formation.

Author's personal copy
Figure 11. Graphs of cumulative relative frequency of distances at Gach-e-tursh locations (D(M)) and non-seep locations (D(N)) around structural units of the Gachsaran and Mishan
formations and corresponding graphs of b-statistics of differences (D) between the cumulative relative frequency curves, the Dezful Embayment. D and u D(N) represent spatial
association of seeps with structures and confidence band for a ¼ 0.01 respectively. (a) and (b) show the analysis of spatial association between Gach-e-tursh and anticline axis of the
Gachsaran Formation; (c) and (d) represent the spatial association between Gach-e-tusrh and thrust faults of the Gachsaran Formation; (e) and (f) show the analysis of spatial
association between Gach-e-tursh and anticline axis of the Mishan Formation; and (g) and (h) show the analysis of spatial association between Gach-e-tursh and thrust faults of the
Mishan Formation.
Author's personal copy
Figure 12. Graphs of cumulative relative frequency of distances at sulphur springs locations (D(M)) and non-seep locations (D(N)) around structural units of the Gachsaran and Mishan
formationsandcorrespondinggraphsofb-statistics ofdifferences (D) between thecumulative relative frequencycurves, theDezful Embayment.D anduD(N) represent spatial associationof
seeps with structures and confidence band for a ¼ 0.01 respectively. (a) and (b) show the analysis of spatial association between sulphur springs and anticline axis of the Gachsaran
Formation; (c) and (d) represent the spatial association between sulphur springs and thrust faults of the Gachsaran Formation; (e) and (f) show the analysis of spatial association between
sulphur springs and anticline axis of the Mishan Formation; and (g) and (h) show the analysis of spatial association between sulphur springs and thrust faults of the Mishan Formation.
S. Salati et al. / Marine and Petroleum Geology 43 (2013) 102e120116

Author's personal copy
imply that there are two groups of sulphur springs in the area. The
first group is comprised of about 50% of the sulphur springs located
about an average of 2.2 km away from thrust faults of the Gach-
saran. The second group is comprised of about 50% of springs
located about an average of 10.4 km away from thrust faults in the
Gachsaran Formation. In the Gachsaran Formation, the positive
spatial association of sulphur springs with anticline axes is stronger
than with thrust faults.
Sulphur springs show significant spatial associations (at
a ¼ 0.01) with anticline axes and thrust faults in the Mishan For-
mation (Fig. 12e and g). These associations are optimal within
5.5 km of anticline axes and 5.4 km of thrust faults (Fig. 12f and h).
By means of spatial association analysis, it is possible to rank the
individual sets of geological features in terms of their relative
importance as controls on the occurrences of each sub-set of hy-
drocarbon seeps. In the distance distribution method, a basis for
this ranking is the ratio of the value of D(M) to the value of the D(N)
at the optimal distance of optimal positive spatial association of a
set of geological feature (Carranza, 2009a). As summarized in
Table 2, oil and gas seeps are mostly associated with the Mishan
Formation and with structures in that formation. This finding
suggests that hydrocarbons migrated upwards in the stratigraphy
in the Dezful Embayment.
5. Conceptual modeling of occurrence of hydrocarbon seeps
in the Dezful Embayment
The strong positive spatial associations of oil seeps and products
of gas seeps alteration such as sulphur springs and Gach-e-tursh
with the Mishan Formation and with anticline axes and thrust
faults in that formation (Table 2) imply that densities of hydrocar-
bon seeps are not decreased upwards in the stratigraphy. The re-
sults of spatial association analyses (Figs. 9 and 10) imply that there
are probably two groups of heavy oil or asphalt seeps. The first
group is spatially associated with the Asmari anticlines exposed to
the surface. The occurrence of this first group of seeps could be due
to the final exhaustion of former oil accumulations in the Asmari
reservoir. The second group is spatially associated with the Gach-
saran cap rock and the overlying Mishan Formation, where heavy
oil or asphalt seeps showed stronger positive spatial associations
with structures in the Mishan Formation than in the Gachsaran cap
rock (Table 2). Where the Gachsaran Formation is exposed to the
surface and where it is overlain by the Mishan Formation, heavy oil
or asphalt seeps show spatial associations with associated struc-
tures (Fig. 13a). Although the Gachsaran Formation has flowed by
salt tectonics (Berberian, 1995), resulting in disharmonic relation-
ship between folds in the surface and evaporites in the subsurface,
oil likely escaped through prominent NWeSE and NEeSW trending
faults and fractures formed during the Miocene syntectonic depo-
sition of the Gachsaran Formation and/or through subsidiary NeS
and NEeSW trending fractures formed by the reactivation of
basement faults. In the former case, when oil migrated to pre-
existing structures in the Asmari reservoir sealed by the Gach-
saran cap rock in the late Miocene-Pliocene, hydrocarbons may
have been localized in fractures related to salts and/or in NWeSE
faults in SW flanks of anticlines. Later, localized hydrocarbons re-
migrated upwards due to active tectonics in the area. The second
case could have happened when NeS and NEeSW trending frac-
tures formed by the shortening and the reactivation of basement
faults breached the seal or superimposed the former structures.
When the Gachsaran Formation was buried (Fig. 13b), it likely
acted as a detachment zone such that overlying formations may
have been folded into anticlines. The axes of those anticlines were
likely displaced to the SW with respect to fold crests within un-
derlying strata (cf. Sherkati et al., 2005; Allen and Talebian, 2011). In
this case, oil could have migrated through thrust faults in the
southwestern flank of the Gachsaran cap rock and joined the NNEe
SSW trending fault-related fractures. The oil could have lost its
lighter components and occurred as heavy oil or asphalt seeps in
the Mishan Formation at the surface. Hydrocarbon seeps could
have occurred at the contact zone of theMishan Formationwith the
Gachsaran cap rock. They likely found active faults related to salts of
Table 2
Summary of statistically significant results of analyses of spatial associations between each sub-set of hydrocarbon seeps and individual sets of structural features of the
formations having positive spatial associations with seep. Values in bold represent statistically significant positive spatial associations.
Summary of statistically significant results of analyses of spatial associations between heavy oil or asphalt seeps and individual sets of structural features of three
formations having positive spatial associations with seeps
Structural features Distance (d) of optimal
positive spatial association
Values of (D(M)) at
d (see Figs. 6 and 7)
Values of D(N) at
d (see Figs. 6 and 7)
Values of (D(M)):
D(N) at d
Anticline axes of the Asmari Fm 2.6 100 0.16 6.2
Anticline axes of the Gachsaran Fm 5.8 0.93 0.37 2.5
Anticline axes of the Mishan Fm 3.8 1 0.14 7.1
Thrust faults of the Gachsaran Fm 10.4 1 0.48 2
Thrust faults of the Mishan Fm 5.4 1 0.2 5
Summary of statistically significant results of analyses of spatial associations between Gach-e-tursh and individual sets of structural features of tow Formations having
positive spatial associations with seeps
Structural features Distance (d) of optimal
positive spatial association
Values of (D(M))
at d (see Fig. 8)
Values of D(N)
at d (see Fig. 8)
Values of (D(M)):
D(N) at d
Anticline axes of the Gachsaran Fm 10.9 0.89 0.55 1.6
Anticline axes of the Mishan Fm 6.8 0.91 0.26 3.5
Thrust faults of the Gachsaran Fm 5.4 0.81 0.26 3.1
Thrust faults of the Mishan Fm 14.9 1 0.52 1.9
Summary of statistically significant results of analyses of spatial associations between sulphur springs and individual sets of structural features of tow Formations
having positive spatial associations with seeps
Structural features Distance (d) of optimal
positive spatial association
Values of (D(M))
at d (see Fig. 9)
Values of D(N)
at d (see Fig. 9)
Values of (D(M)):
D(N) at d
Anticline axes of the Gachsaran Fm 2.5 0.69 0.18 3.8
Anticline axes of the Mishan Fm 5.5 1 0.2 5
Thrust faults of the Gachsaran Fm 10.4 0.88 0.47 1.9
Thrust faults of the Mishan Fm 5.4 1 0.2 5
S. Salati et al. / Marine and Petroleum Geology 43 (2013) 102e120 117

Author's personal copy
the cap rock and a network of open fractures asmigration pathways
to reach the surface. Because the SW flanks of the Gachsaran an-
ticlines are thrusted, heavy oil or asphalt seeps likely occurred at
the southwestern parts of structures. In addition, the low perme-
ability of marl of the Mishan Formation would have not allowed
hydrocarbons to migrate to the surface through this Formation in
the subsurface. The foregoing interpretations of results of the
spatial analyses of heavy oil or asphalt seeps with structures and
lithologic units suggest, therefore, that subsurface fractures and
faults of the Gachsaran cap rock, particularly at the southwestern
flank, provided favorable pathways for the vertical migration of
these seeps to reach the surface.
The positive spatial associations of Gach-e-tursh and sulphur
springs with the Gachsaran and Mishan structures (Figs. 11 and 12)
imply that gas seeps have migrated upwards in stratigraphy and
have produced these alterations in the respective formations. Gas-
free oil seeps are rare or do not exist because oil buoyancy itself was
not enough to reach the surface. However, gas may have segregated
from oil in the subsurface and probably escaped through permeable
fractures even when seal was effective and not breached by faults.
Thus, gas may have probably migrated through NWeSE, and NNEe
SSW trending fractures within the Gachsaran cap rock. Products of
gas seep alteration such as Gach-e-tursh and sulphur springs have
occurred within the Gachsaran Formation (Fig. 13a) or at the con-
tact zone of the Gachsaran Formation with the Mishan Formation
(Fig. 13b). The configuration of Gach-e-tursh at the surface as vein
fillings or matrix cement could be an important factor for better
understanding of gas seeps pathways mineralization. Gas may have
entered basinal water and have changed its chemical properties.
This water likely rose up and was enriched in sulphate by disso-
lution of anhydrite in the Gachsaran Formation. This action may
have produced features such as galleries at the contact between
limestone and gypsum following maximum dip in rhythmic units
of the Gachsaran cap rocks in the subsurface and/or at the sharp
Figure 13. Conceptual model for the occurrence of onshore hydrocarbon seeps and their alteration products in the Dezful Embayment, (a) when the Gachsaran Formation has
exposed at the surface and (b) when it is overlaid by the Mishan Formation.
S. Salati et al. / Marine and Petroleum Geology 43 (2013) 102e120118

Author's personal copy
contact zone of the Gachsaran Formation with the Mishan Forma-
tion. Such features could have been potential conduits for fluid flow
in the subsurface.
6. Discussion
The results of Fry analyses of hydrocarbon seep locations are
useful for visual interpretations of which structures likely
controlled the occurrence of hydrocarbon seeps in the Dezful
Embayment. The syntheses of those results with the results of
analyses of spatial association of seeps with geological features are
useful for development of a conceptual model for the occurrence of
onshore hydrocarbon seeps in the Dezful Embayment. In this
conceptual model, we suggest that hydrocarbon seeps and their
alteration products likely occur in the Mishan Formation. In areas
where the Gachsaran cap rock does not outcrop, it is likely that
hydrocarbon seeps and their alteration products occur on the sur-
face of the overlying Mishan Formation. The deformation of the
petroleum basin in the Dezful Embayment has resulted in faults
and fractures, which were likely potential pathways for hydrocar-
bons to migrate upwards to the surface. The structural disharmony
between the underlying carbonate reservoir and overlying folds,
which resulted from salt tectonics, likely played a role in the lateral
displacement of hydrocarbon seeps from their source rocks. How-
ever, oil cannot flow except under well conditions, governed by
factors such as viscosity and capillarity. In some areas, oil was likely
trapped at the water table where it had biodegraded or had flowed
downward to emerge groundwater, although the associated gas
could have escaped into the surface rocks.
Many oil fields in SW of Iran have a gas cap (Alshahran and
Nairn, 1997); thus, a better understanding of the occurrences of
gas seeps and their alteration products may benefit from
petroleum-finding survey. However, an advantage of spatial ana-
lyses in the present study is the provision of empirical evidence for
establishing a conceptual model of geological controls on hydro-
carbon seep occurrence. Therefore, the methods of spatial analyses
demonstrated here could provide geo-information that can be used
as scientific basis for selecting potential areas for investigation of
hydrocarbon entrapment.
Nevertheless, results of the application of the spatial analytical
methods used in the present study can be undermined by the (lack
of) quality and completeness of the datasets used and by the scale
compatibility between the datasets. The datasets used here were
derived from geological maps compiled by the Iranian oil company.
Thus, the datasets used are compatible in scale although they may
not be complete. Accordingly, there is a possibility that hydrocar-
bon seeps are associated with minor structures that were not
mappable at the scale of map shown in Figures 3 and 4. It follows
that the quantified spatial associations between hydrocarbons
seeps and structures presented in this study are tentative. This
means that the analyses and the conceptual model presented must
be updated as new data become available.
7. Concluding remarks
With the aid of spatial pattern and spatial association analyses, a
conceptual model for the occurrence of oil and gas seeps in the
Dezful Embayment was developed. Oil seeps likely have migrated
along NWeSE and NEeSW trending faults and fractures in SW
flanks of anticlines, whereas gas seeps likely have escaped to the
surface through prominent NWeSE and NeS trending faults and
fractures. The positive spatial associations of seeps with the Mishan
Formation imply that the density of seeps is not decreased upwards
in the stratigraphy suggesting upward migration of hydrocarbons
through permeable micro-fractures and micro-pores in their strata.
Salt tectonics has played an important role in the lateral migration
of hydrocarbon seeps from their sources.
Acknowledgment
The authors thank the European Union e in particular the
Erasmus Mundus programmme e for financial support of the
research.
References
Abdollahi Fard, M., Sepehr, M., sherkati, S., 2011. Neogene salt in SW Iran and itsinteraction with Zagros folding. Geological Magazin 148, 854e867.
Alavi, M., 2004. Regional stratigraphy of the Zagros fold-thrust belt of Iran and itsproforland evolution. American Journal of Science 304 (January), 1e20.
Alshahran, A., Narin, A., 1997. Sedimentary Basins and Petroleum Geology of theMiddle East. Elsevier Publishing.
Allen, M.B., Talebian, M., 2011. Structural variation along the Zagros and the natureof the Dezful Embayment. Geological Magazine 148, 911e924.
Bahroudi, A., Koyi, H.A., 2004. Tectono-sedimentary framework of the GachsaranFormation in the Zagros foreland basin. Marine and Petroleum Geology 21 (10),1295e1310.
Berberian, M., 1995. Master “blind” thrust faults hidden under the Zagros folds:active basement tectonics and surface morphotectonics. Tectonophysics 241(3e4), 193e195.
Berberian, M., King, G.C.P., 1981. Towards a paleogeography and tectonic evolutionof Iran. Cnadian Journal of Earth Sciences 18, 210e265.
Berman, M., 1977. Distance distributions associated with Poisson processes ofgeometric figures. Journal of Applied Probability 14, 195e199.
Beydoun, Z.R., Hughes, M.W., Stoneley, R., 1992. Petroleum in the Zagros Basin: a lateTertiary foreland basin overprinted onto the outer edge of the vast hydrocarbon-rich PaleozoiceMesozoic passive margin shelf. In: Macqueen, R.W., Leckie, D.A.(Eds.), ForelandBasins andFoldBelts. AAPGBulletinMemoir, vol. 55, pp. 307e336.
Bonham-Carter, G.F., 1994. Geographic Information Systems for Geoscientists:Modelling with GIS. In: Computer Methods in the Geosciences, vol. 13. Perga-mon Press, Oxford, U.K. p. 398.
Bordenave, M.L., 2002. The Middle Cretaceous to Early Miocene Petroleum Systemin the Zagros Domain of Iran, and Its Prospect Evaluation. AAPG AnnualMeeting, Houston, Texas, March, pp. 10e13.
Bordenave, M.L., Hegre, J.A., 2005. The influence of tectonics on the entrapment ofoil in the Dezful Embayment, Zagros foldbelt, Iran. Journal of Petroleum Geol-ogy 28 (4), 339e368.
Bordenave, M.L., Hegre, J.A., 2010. Current distribution of oil and gas field in theZagros fold belt of Iran and contiguous offshore as the result of the petroleumsystems. Geological Society of London 330, 291e353.
Carranza, E.J.M., 2009a. Controls on mineral deposit occurrence inferred fromanalysis of their spatial pattern and spatial association with geological features.Ore Geology Reviews 35 (3e4), 383e400.
Carranza, E.J.M., 2009b. In: Hale, M. (Ed.), Geochemical Anomaly and Mineral Pro-spectivity Mapping in GIS. Handbook of Exploration and EnvironmentalGeochemistry, vol. 11. Elsevier B.V..
Carranza, E.J.M., Sadeghi, M., 2010. Predictive mapping of prospectivity and quan-titative estimation of undiscovered VMS deposits in Skellefte district (Sweden).Ore Geology Reviews 38 (3), 219e241.
Carruba, S., Cesare, R.P., Buonaguro, R., Calabro, R., Carpi, R., Naini, M., 2006.Structural Pattern of the Zagros Fold-and-thrust Belt in the Dezful Embayment(SW Iran). Geological society of America. pp. 11e32.
Clarke, R.H., Cleverly, R.W., 1991. petroleum seepage and post-accumulationmigration. In: England, W.A., Fleet, A.J. (Eds.), Petroleum Migration. GeologicalSociety of London, Special Publication No.59, pp. 265e271.
De Boever, E., Huysmans, M., Muchez, P., Dimitrov, L., Swennen, R., 2009. Control-ling factors on the morphology and spatial distribution of methane-relatedtubular concretions e case study of an Early Eocene seep system. Marine andPetroleum Geology 26 (8), 1580e1591.
Ding, F., Spiess, V., Brüning, M., Fekete, N., Keil, H., Bohrmann, G., 2008. A conceptualmodel for hydrocarbon accumulation and seepage processes around Chapopoteasphalt site, southern Gulf of Mexico: from high resolution seismic point ofview. Journal of Geophisical Research 113.
Douglas Elmore, R., Farrand, W.R., 1981. Asphalt-bearing sediment in SynorogenicMiocene-Pliocene Molasse, Zagros Mountain, Iran. AAPG Bulletien.
Edgell, H., 1996. Salt tectonism in the Persian Gulf basin. In: Alsop, G.I., Blundell, D.J.,Davison, I. (Eds.), Salt Tectonics. Geological Society, London, Special Publica-tions, vol. 100, pp. 129e151.
Ellis, J.M., Davis, H.H., Zamudio, J.A., Sept 2001. Exploring for onshore oil seeps withhyperspectral imaging. Oil and Gas Journal 10, 49e56.
Etiope, G., Papatheodorou, G., Christodoulou, D., Ferentinos, G., Sokos, E., Favali, P.,2006. Methane and hydrogen sulfide seepage in the NW Peloponnesus petro-liferous basin (Greece): origin and geohazard. AAPG Bulletien 90 (5), 701e713.
Falcon, N.L., 1974. Southern Iran: Zagros mountains. In: Spencer, A. (Ed.), MesozoiceCenozoic Orogenic Belts. Geological Society of London, Special Publication, vol.4, pp. 199e211.
S. Salati et al. / Marine and Petroleum Geology 43 (2013) 102e120 119

Author's personal copy
Fry, N., 1979. Random point distributions and strain measurement in rocks. Tecto-nophysics 60, 89e105.
Gill, W.D., Ala, M.A., 1972. Sedimentology of Gachsaran formation (Lower Fars Se-ries), southwest Iran. AAPG Bulletin 56, 1965e1974.
Hessami, K., Koyi, H.A., Talbot, C.J., 2001. The significance of strike-slip faulting inthe basement of the Zagros fold and thrust belt. Journal of Petroleum Geology24 (1), 5e28.
Huang, B., Xiao, X., Li, X., Cai, D., 2009. Spatial distribution and geochemistry of thenearshore gas seepages and their implications to natural gas migration in theYinggehai Basin, offshore South China Sea. Marine and Petroleum Geology 26(6), 928e935.
James, G.A., Wynd, J.G., 1965. Stratigraphic nomenclature of Iranian oil consortiumagreement area. AAPG Bulletin 49, 2182e2245.
Jin, Y.K., Kim, Y.-G., Baranov, B., Shoji, H., Obzhirov, A., 2011. Distribution andexpression of gas seeps in a gas hydrate province of the northeastern Sakhalincontinental slope, Sea of Okhotsk. Marine and Petroleum Geology 28 (10),1844e1855.
Kashfi, M., 1980. Stratigraphy and environmental sedimentology of lower Parsgroup (Miocene), south-southwest Iran. The American Association of PetroleumGeologists 64, 2095e2107.
Lacombe, O., Bellahsen, N., Mouthereau, F., 2011. Fracture patterns in the Zagrossimply folded belt (Fars, Iran): constraints on early collisional tectonic historyand role of basement faults. Geological Magazin, 1e24.
Leifer, I., Boles, J., 2005. Measurement of marine hydrocarbon seep flow throughfractured rock and unconsolidated sediment. Marine and Petroleum Geology 22(4), 551e568.
Leifer, I., Boles, J., 2006. Corrigendum to: measurement of marine hydrocarbonseep flow through fractured rock and unconsolidated sediment: [Marine andPetroleum Geology 22 (2005), 551e558]. Marine and Petroleum Geology 23(3), 401.
Link, W.K., 1952. Significance of oil and gas seeps in world oil exploration. AAPGBulletin 36, 1505e1541.
MacGregor, D.S., 1993. Relationships between seepage, tectonics and subsurfacepetroleum reserves. Marine and Petroleum Geology 10 (6), 606e619.
McQuillan, H., 1991. The role of basement tectonics in the control of sedimentaryfacies, structural patterns and salt plug emplacements in the Zagros fold belt ofsouthwest Iran. Journal of Southeast Asian Earth Sciences 5 (1e4), 453e463.
Mobasher, K., Babaie, H., 2007. Kinematic significance of fold- and fault-relatedfracture systems in the Zagros mountains, southern Iran. Tectonophysics 451,156e169.
Motiei, H., 1993. Stratigraphy of Zagros. Geological Survey of Iran (in Farsi). p. 536.O’Berian, C.A.E., 1957. Salt diapirism in south Persia. Geologie en Mijnbouw 19,
357e376.O’Brien, G.W., Lawrence, G.M., Williams, A.K., Glenn, K., Barrett, A.G., Lech, M.,
Edwards, D.S., Cowley, R., Boreham, C.J., Summons, R.E., 2005. Yampi Shelf, Browse
Basin, North-West Shelf, Australia: a test-bed for constraining hydrocarbonmigration and seepage rates using combinations of 2D and 3D seismic data andmultiple, independent remote sensing technologies. Marine and Petroleum Ge-ology 22 (4), 517e549.
Pinet, N., Duchesne, M., Lavoie, D., Bolduc, A., Long, B., 2008. Surface and subsurfacesignatures of gas seepage in the St. Lawrence Estuary (Canada): significance tohydrocarbon exploration. Marine and Petroleum Geology 25 (3), 271e288.
Rudkiewicz, J.L., Sherkati, S., Letouzey, J., 2007. Evolution of maturity in NorthernFars and in the Izeh zone (Iranian Zagros) and link with hydrocarbon pro-spectivity. In: Lacombe, O., Roure, F., Lavé, J., Vergés, J. (Eds.), Thrust Belts andForeland Basins. Springer Berlin Heidelberg, pp. 229e246.
Safari, H.O., Pirasteh, S., Mansor, S.B., 2011. Role of the Kazerun fault for localizing oilseepage in the Zagros Mountain, Iran: an application of GiT. InternationalJournal of Remote Sensing 32 (1), 1e16.
Sella, G.F., Dixon, T.H., Mao, A., 2002. A model for recent plate velocities from spacegeodesy. Journal of Geophisical Research 107, 11.11e11.30.
Sepehr, M., Cosgrove, J.W., 2002. The Major Fault Zones Controlling the Sedimen-tation, Deformation and Entrapment of Hydrocarbon in the Zagros Fold-thrustBelt, Iran: AAPG Annual Meeting, Houston, Texas, March 10e13.
Sherkati, S., Letouzey, J., 2004. Variation of structural style and basin evolution inthe central Zagros (Izeh zone and Dezful Embayment), Iran. Marine and Pe-troleum Geology 21 (5), 535e554.
Sherkati, S., Molinaro, M., De Lamotte, D.F., Letouzey, J., 2005. Detachment foldingin the central and eastern Zagros fold belt (Iran): salt mobility, multipledetachment and late basement control. Journal of Structural Geology 27 (9),1680e1690.
Stephenson, B.J., Koopman, A., Hillgratner, H., Mc Quillan, H., Bourne, S., Noad, J.J.,Rawnsley, K., 2007. Structural and stratigraphic controls on fold related frac-turing in the Zagros mountains, Iran: implications for reservoir development.From. In: Lonergan, L., Jolly, R.J.H., Rawnsley, K., Sanderson, D.J. (Eds.), FracturedReservoirs. Geological Society, London, Special Publications, vol. 270, pp. 1e21.
Stocklin, J., 1968. Structural history and tectonics of Iran. A review. AAPG Bulletin 52,1229e1258.
Thomas, A.N., 1952. “Gach-i-turush” and associated phenomena in southwest Per-sia. V11 Convegno Nazionale Del Metano E Del Petrolio Taormina, section 1,preprint.
Warren, J.,K., 2006. Evaporites. Springer, Germany.Washburn, L., Clark, J.F., Kyriakidis, P., 2005. The spatial scales, distribution, and
intensity of natural marine hydrocarbon seeps near Coal Oil Point, California.Marine and Petroleum Geology 22 (4), 569e578.
Wennberg, O.P., Azizzadeh, M., Aqrawi, A.A.M., Blanc, E., Brockbank, P., Lyslo, K.B.,Pickard, N., Salem, L.D., Svana, T., 2007. The Khaviz anticline: an outcropanalogue to giant fractured Asmari Formation reservoirs in SW Iran. From. In:Lonergan, L., Jolly, R.J.H., Rawnsley, K., Sanderson, D.J. (Eds.), Fractured Reser-voirs. Geological Society, London, Special Publications, vol. 270, pp. 23e42.
S. Salati et al. / Marine and Petroleum Geology 43 (2013) 102e120120


