Embed Size (px)
Citation preview

Gas Transfer Controls Carbon Limitation During BiomassProduction by Marine AlgaeBojan Tamburic,*[a] Christian R. Evenhuis,[a] David J. Suggett,[a] Anthony W. D. Larkum,[a]
John A. Raven,[a, b] and Peter J. Ralph[a]
Introduction
Biofuel from microalgae
&&please provide academic titles (Prof. , Dr.) for all authors.&& Microalgae have the potential to provide sustainable andaffordable transport fuels in the future. These unicellular pho-tosynthetic organisms use light energy to fix atmospheric CO2
and synthesise biomass. Algal biomass is then processedchemically to either biodiesel by transesterification or to bio-crude oil by hydrothermal liquefaction.[1] Algal biofuels are ofparticular interest in Australia as many algae can be grown inhostile conditions, such as saltwater ponds on arid coastal ter-rain.[2] Algae cultivation that covers 1 million hectares of land(roughly the size of Sydney) would, by a conservative esti-mate,[3] produce enough bio-crude to replace 40 billion litresof crude oil per annum, which is equal to the entire crude oildemand of Australia, 85 % of which is currently imported.[4]
It has been estimated that there are over 350 000 extant spe-cies of algae, which range across the most commonly recog-nised green, brown, red and golden brown algae to otherforms that have been discovered only recently.[5] More thanhalf of the ~20 microalgal species that are currently used inbiofuel production are green algae (Chlorophyta), but there isa huge biodiversity of algae yet to be explored for bio-energyapplications.[6] This includes the biofuel candidate marine mi-
croalga Nannochloropsis oculata (N. oculata), which is knownfor its high lipid productivity.[7] To develop production systemsand processes that maximise biofuel output, it is first necessaryto gain a deep understanding of photosynthetic controls fora given algal species.
Limits to biomass production
Resource availability fundamentally governs algal growth rates,the rate of biomass accumulation and hence the maximumachievable yield of biofuel.[8] Photosynthesis is driven by lightenergy, photochemistry and downstream energy transforma-tions, which generate a reductant and adenosine triphosphate(ATP) that fuel metabolic reactions and consume inorganic nu-trients (for example, carbon, nitrogen and phosphorus) to con-struct complex, energy-rich organic macromolecular com-pounds. The dependence of both the growth rate and biomassyield on the availability of these resources can be describedmathematically using threshold and co-limitation theory, withtaxonomic-specific variations that determine whether lightavailability and nutrient concentrations are limiting, saturatingor excessive.[9] The algal cell size, in particular, influences theeffectiveness of resource acquisition; for example, larger cellswith a smaller surface-area-to-volume quotient exhibit lowerlight harvesting efficiency caused by enhanced pigment pack-aging as well as a lower inorganic nutrient uptake.[10] The ex-ternal nutrient concentration and the intracellular demand forinorganic nutrients both dictate the elemental stoichiometry ofan algal cell, described most commonly by the “RedfieldRatio”.[11] Consequently, a large number of factors, which canultimately operate in complex positive or negative feedbackloops, influence how rapidly microalgal cells drive photosyn-thesis and subsequently accrue biomass.
[a] B. Tamburic, C. R. Evenhuis, D. J. Suggett, A. W. D. Larkum, J. A. Raven,P. J. RalphPlant Functional Biology and Climate Change ClusterUniversity of Technology SydneyUltimo, New South Wales ### (Australia)
[b] J. A. RavenDivision of Plant SciencesUniversity of Dundee at the James Hutton InstituteInvergowrie ### (United Kingdom)
Supporting Information for this article is available on the WWW underhttp://dx.doi.org/10.1002/cssc.201500332.
This study presents the first in-depth analysis of CO2 limitationon the biomass productivity of the biofuel candidate marinemicroalga Nannochloropsis oculata. Net photosynthesis de-creased by 60 % from 125 to 50 mmolO2
L�1 h�1 over a 12 h light
cycle as a direct result of carbon limitation. Continuous dis-solved O2 and pH measurements were used to develop a de-tailed diurnal mechanism for the interaction between photo-synthesis, gas exchange and carbonate chemistry in the
photo-bioreactor. Gas exchange determined the degree ofcarbon limitation experienced by the algae. Carbon limitationwas confirmed by delivering more CO2, which increased netphotosynthesis back to its steady-state maximum. This studyhighlights the importance of maintaining replete carbon con-centrations in photo-bioreactors and other culturing facilities,either by constant pH operation or preferably by designinga feedback loop based on the dissolved O2 concentration.
ChemSusChem 0000, 00, 0 – 0 � 0000 Wiley-VCH Verlag GmbH & Co. KGaA, Weinheim1
These are not the final page numbers! ��These are not the final page numbers! ��
Full PapersDOI: 10.1002/cssc.201500332
1 12 23 34 45 56 67 78 89 9
10 1011 1112 1213 1314 1415 1516 1617 1718 1819 1920 2021 2122 2223 2324 2425 2526 2627 2728 2829 2930 3031 3132 3233 3334 3435 3536 3637 3738 3839 3940 4041 4142 4243 4344 4445 4546 4647 4748 4849 4950 5051 5152 5253 5354 5455 5556 5657 57

If cells are in exponential growth, the allocation of energy,reductant and assimilated inorganic nutrients are near optimal.Under these ideal conditions, the cells are acclimated toa steady-state supply of resources, regardless of whether theresources are available in excess or limiting.[8, 9] In contrast, con-ditions in large-scale biofuel cultivation facilities (and in naturein general) are highly variable so that an algal culture can ex-perience different limitations depending on the time of day,the age of the culture and the location within the culturevessel.[12] In addition to maximising biomass production rate,algal cells also allocate resources to fitness-increasing traits,such as defence against grazers, parasitoids and viruses. Undervariable environmental conditions, algal cells are in a dynamicstate and the instantaneous growth rate depends on whatlimit is already imposed. This is a fundamental challenge foralgae producers looking to increase algal biofuel yield, as theinsights of how algae grow under steady-state conditions inthe laboratory may not be relevant to large-scale productionconditions. For example, light availability in an algal pond de-creases exponentially with depth and thus small shifts in celllocation caused by mixing or turbulence result in the algalcells experiencing a highly stochastic light field.[13]
Microalgae have, therefore, evolved numerous mechanismsto cope with environmental variability, which can operate onscales of microseconds to days. For example, the reaction cen-tres continually balance the excitation pressure required toconvert energy photochemically and produce reductant andATP;[14] similarly, cells regulate the supply of inorganic nu-trients, which includes carbon.[15] All such regulatory mecha-nisms incur costs to the cells and reduce the efficiency of bio-mass accumulation, that is, growth.[16] It is, therefore, importantto be aware of the regulatory costs upon maximisation of thebiomass yield of a microalgal culture system. Recently, ad-vanced molecular biology tools have become increasinglyused to identify lipid production pathways[17] as well as geneticmarkers of algal stress.[18] These studies produce intriguing re-sults, which are only reproducible and valid if physical parame-ters such as light, temperature and nutrient availability aremeasured and controlled.
Photo-bioreactors (PBRs) are devices used to grow microal-gae on a laboratory scale. They are used to maintain precisecontrol over the algal growth environment, such as light andgas supply, and continuously measure key parameters, whichinclude the dissolved oxygen concentration and pH. PBR stud-ies facilitate a deeper understanding of the effect of dynamicfluctuations on conditions and limitations in biomass produc-tion and they generate more reproducible experimental resultsthan open systems. PBRs exist in multiple geometries, whichinclude flat-panel, tubular, annular and helical systems.[19] Thedesign of a PBR influences the limitations that the culture ex-periences. For example, an important consideration in any PBRdesign is the provision of appropriate illumination to algalcells.[20] Light is absorbed and scattered by algal cells, which re-sults in the formation of an attenuation gradient normal to thePBR surface. Another important factor is the PBR surface-to-volume quotient: a relatively large surface area increases theeffectiveness of light absorption but may lead to photo-
damage in algae, whereas a relatively large volume makesbetter use of space but requires additional energy for mixing,gas exchange and aeration. Fluid dynamics control the circula-tion and movement of individual algal cells within this lightgradient, and the photochemical reactions of photosynthesisand respiration add further complexity to the fluid dynamics ofgas exchange.[21]
Carbon availability and limitation
Carbon is an essential element for the biosynthesis of organicmolecules within a cell ; algae have developed (or inherited)a series of metabolic mechanisms that harvest and fix inorgan-ic carbon. Microalgal photosynthesis fixes inorganic carboninto sugars, which then act as substrates for more complexmolecules, such as starch and lipids. CO2 is fixed by the Calvin–Benson cycle by the enzyme ribulose bisphosphate carboxy-lase oxygenase (RuBisCO) using ATP as energy and nicotina-mide adenine dinucleotide phosphate (NADPH) as the reduc-tant. Importantly, O2 competes continuously with CO2 for Ru-BisCO, and the process of O2 consumption by RuBisCO isknown as photo-respiration.[22] Photo-respiration reduces CO2
fixation efficiency by 20 to 30 %, and the rate of photo-respira-tion increases under a carbon-limited environment.[23, 24] Micro-algae have evolved a series of carbon-concentrating mecha-nisms (CCMs) independently that increase the concentration ofCO2 available at the RuBisCO active site and thereby inhibitphoto-respiration competitively.[25] Many of these CCMs active-ly pump bicarbonate (HCO3
�) into algal cells, in which it is de-hydrated to CO2 by the carbonic anhydrase enzyme, which ele-vates intracellular CO2 that, in turn, decreases photo-respirationand potentially increases the energetic efficiency of photosyn-thesis.[16]
The rate of photosynthesis in the PBR can be calculated im-mediately from changes in oxygen concentration.[26] In an algalmonoculture, the concentration of dissolved O2 and CO2 ina PBR is in dynamic equilibrium with air that is bubbledthrough the PBR (Figure 1). The relationship for oxygen maybe described by Fick’s Law &&which one is meant?&&[Eq. (1)]:
d½O2 �dt ¼ ðP� RÞ � kLað½O2� � ½O2�eqÞ ð1Þ
in which [O2] is the dissolved O2 concentration; (P�R) is therate of net photosynthetic O2 production, that is, the rate ofphotosynthesis P minus the rate of dark (mitochondrial) respi-ration R ; kLa is the gas exchange (or mass transfer) coefficient;and [O2]eq is the equilibrium or Henry’s Law O2 concentration.Dissolved O2 concentrations can be measured directly by usingan optode or an electrode.
A similar mathematical expression can be written for CO2.[27]
Although the mass transfer coefficient is scaled by the ratio ofmolecular masses, there is an additional complication in thatdissolved CO2 is in equilibrium with HCO3
� and carbonate ions(CO3
2� ; Figure 1). The addition of CO2 to seawater increasesthe concentration of HCO3
� but decreases the concentration ofCO3
2�.[28] The formation of HCO3� leads to the dissociation of
ChemSusChem 0000, 00, 0 – 0 www.chemsuschem.org � 0000 Wiley-VCH Verlag GmbH & Co. KGaA, Weinheim2
�� These are not the final page numbers!�� These are not the final page numbers!
Full Papers
1 12 23 34 45 56 67 78 89 9
10 1011 1112 1213 1314 1415 1516 1617 1718 1819 1920 2021 2122 2223 2324 2425 2526 2627 2728 2829 2930 3031 3132 3233 3334 3435 3536 3637 3738 3839 3940 4041 4142 4243 4344 4445 4546 4647 4748 4849 4950 5051 5152 5253 5354 5455 5556 5657 57

protons, which reduces the pH of the solution in the PBR;however, this pH shift is buffered by the corresponding de-crease in CO3
2�.[29] This dampened pH response in saltwatercultures calls for greater measurement precision to resolvechanges in carbonate chemistry. The various dissociation con-stants of carbonate chemistry have been measured as a func-tion of temperature, salinity and alkalinity[26, 28] and can be usedto calculate the concentrations of carbonate species in solu-tion. The equations can be solved conveniently using thespreadsheet “CO2 sys”.[30] Hence, pH is an indirect measure ofthe quantity of inorganic carbon available in a stable marineenvironment. However, once biology becomes involved, pho-tosynthesis (P) and dark respiration (R) processes alter the pHvalue. Algal photosynthesis fixes CO2 and produces O2 as a by-product, whereas respiration is essentially the elemental rever-sal of this photosynthesis (Figure 1). So, if pH and [O2] aremonitored continuously and provided that gas exchange andcarbonate chemistry are measured, it is possible disentanglethe rate of photosynthesis from the dynamics of gas transfer ina PBR.[24, 31]
The carbonate chemistry of seawater equilibrated with air atthe ambient CO2 concentration of 400 ppm indicates that thepredominant inorganic carbon species is bicarbonate, with car-bonate next most abundant and CO2 even less abundant.[26, 27]
The CO2 concentration in air-equilibrated seawater is approxi-mately the same as that in air ; however, the mass transfer co-efficient of CO2 is 10 000-fold lower in seawater, therefore, thesupply of CO2 to the surface of photosynthesising cells in sea-water is much slower than that in air.[32] This makes bicarbon-ate, present at �200 times the concentration of CO2, a clearcandidate for transport across the plasmalemma by the CCMpresent in most marine microalgae, which include many candi-date biofuel species.[33–35] The Nannochloropsis CCM is basedon an active bicarbonate influx across the plasmalemma with
internal conversion to CO2 and a leak of some of the CO2 backto the medium.[34] Importantly, the conversion of bicarbonateto CO2 involves the production of equal quantities of hydroxylions or the uptake of equal quantities of protons. Intracellularacid–base regulation involves the efflux of these hydroxyl ionsor protons, so that the effect on the medium acid–base andequilibrium concentrations of inorganic carbon species is thesame for bicarbonate entry as would have been the case forCO2 uptake.[26, 36]
Therefore, the pH increases during the photo-period in thediurnal light cycle because the consumption of bicarbonate,and the corresponding influx of protons and/or efflux of hy-droxyl ions by photosynthesis is faster than the re-supply of in-organic carbon as CO2 from the gas stream. Some of this pHincrease is also the result of nitrate assimilation if nitrate is thenitrogen source.[36, 37] There are strong experimental indicationsthat inorganic carbon may limit algal growth across the diurnalphoto-period.[38, 39] The concept of using a constant pH system,or pH-stat, to control carbon availability in a PBR has beenused extensively.[40–43] The pH-stat solves many of the challeng-es associated with managing carbonate chemistry in large-scale culturing facilities, however, there are some advantagesin alternative methods. Firstly, if CO2 addition was managedmore precisely, it may be possible to reduce running costs orto improve yields of algal biomass production. Secondly, if thepH (or equivalently CO2) is controlled, the rate of carbon fixa-tion cannot be estimated from changes in pH.
Aims and objectives
The aims of this study are to determine the carbon availabilityin PBRs using measurements of dissolved oxygen concentra-tion [O2] and pH, and to investigate the effects of carbon limi-tation on the green microalga N. oculata. The objectives are todetermine when N. oculata cells become carbon limited duringthe diurnal light cycle, to quantify to what extent this carbonlimitation affects their photosynthetic activity and to examinewhether CO2 addition can alleviate the situation.
Results and Discussion
Diurnal [O2] and pH variations
Nannochloropsis oculata cells were cultivated to an exponentialgrowth phase under a 12:12 h diurnal light/dark cycle in twoPBRs. The dissolved oxygen concentration [O2] and pH weremeasured continuously, and the cell density was measured byautomated cell counts (complete results profile available in theSupporting Information, page 1). Diurnal [O2] and pH profilesconsistently follow the characteristic and reproducible trendsshown on page 2 in the Supporting Information. To investigatethis phenomenon in more detail, a single representative light/dark period is shown in Figure 2; five distinct phases (A, B, C,D and E) have been assigned to represent the variations in [O2]and pH value.
During the dark cycle (phases D and E) the [O2] profile re-mains steady at, or near, the [O2] minimum of 218 mmol L�1
Figure 1. The major continuous inputs to a gas-bubbled PBR (light, O2, CO2)and the main processes [P : photosynthesis; R : respiration; kLa : gas ex-change; carbonate chemistry including bicarbonate ions (HCO3
�), carbonateions (CO3
2�) and protons (H+)] .
ChemSusChem 0000, 00, 0 – 0 www.chemsuschem.org � 0000 Wiley-VCH Verlag GmbH & Co. KGaA, Weinheim3
These are not the final page numbers! ��These are not the final page numbers! ��
Full Papers
1 12 23 34 45 56 67 78 89 9
10 1011 1112 1213 1314 1415 1516 1617 1718 1819 1920 2021 2122 2223 2324 2425 2526 2627 2728 2829 2930 3031 3132 3233 3334 3435 3536 3637 3738 3839 3940 4041 4142 4243 4344 4445 4546 4647 4748 4849 4950 5051 5152 5253 5354 5455 5556 5657 57

(Figure 2 a). This [O2] minimum is slightly lower than the [O2] ofseawater in equilibrium with air (221 mmol L�1 at 20 8C), calcu-lated from Henry’s Law[32] because of the consumption ofoxygen by N. oculata cells by dark respiration. If the light isturned on, photosynthetic O2 production starts up withina matter of minutes, and [O2] reaches its maximum of252 mmol L�1 within the first hour (phase A). At this point, [O2]reflects the maximum rate of photosynthesis achievablethrough the steady-state acclimation of N. oculata to the aver-age photon availability within the PBR, if we assumereplete nitrate and phosphate concentrations (ap-proximately 300 mg L
�1 of nitrate and 40 mg L�1 ofphosphate). Following this steady-state maximum,[O2] begins to decrease (phase B) and approachesa new plateau of 236 mmol L�1, the “terminal [O2]”,near the end of the light cycle (phase C). This de-crease in [O2] may be attributed to a decrease in therate of photosynthesis and/or an increase in the rateof respiration over the light cycle. As the light intensi-ty does not change, this behaviour indicates eitherthe presence of nutrient limitation or photo-inhibi-tion. If the light is turned off, [O2] returns quickly toits dark cycle minimum of 218 mmol L�1.
The pH is at its minimum value of 8.0 at the end ofthe dark cycle (Figure 2 b). This is lower than theequilibrium pH of 8.2 because of CO2 production bydark respiration during the dark cycle. The pH in-crease during the light cycle (phases A, B and C) is anindication of photosynthetic carbon consumption byN. oculata cells. Notably, the pH response is signifi-
cantly slower than the corresponding [O2] response (Figure 2 a).The rate of pH increase slows gradually, and the pH reachesa maximum value of 9.5 near the end of the light cycle(phase C). During the dark cycle (phases D and E), the pH grad-ually returns to its &&dark&& minimum of 8.0.
[O2] as a measure of net photosynthesis
The net rate of photosynthetic O2 production or consumptioncan be calculated from the dissolved oxygen concentration.[26]
In this experiment, the “spikes” in the [O2] profile (Figure 2 a)are artefacts that were introduced deliberately to measure therate of photosynthesis and gas exchange at specific timepoints.[38, 44] The spikes were created by switching off air bub-bling for approximately 15 min before turning it back on again(Figure 3).
Initially, there is a dynamic equilibrium between gas ex-change and the biological processes, which gives an [O2] of[O2]de.[32] If the gas supply is turned off, the gas transfer coeffi-cient is negligible and Equation (1) can be simplified to Equa-tions (2) and (3):
d½O2 �dt ¼ P� R ð2Þ
solution : ½O2� ¼ ðP� RÞt þ ½O2�de ð3Þ
Net photosynthesis (P�R) is, therefore, equal to the gradientof the linear increase in [O2]. Once gas exchange is turnedback on, Equation (1) can now be solved because the startpoint [O2] and the end point [O2]eq are both known [Eq. (4)]:
solution : ½O2� ¼ D½O2�e�kL a t þ ½O2�de ð4Þ
The decrease in [O2] is described as an exponential function,and the gas exchange coefficient (kLa) determines the half-lifeof this exponential decay.[26] The gas exchange coefficient is
Figure 2. Representative a) [O2] and b) pH profiles over a single day (12:12 hlight/dark cycle) for N. oculata in linear growth phase; both profiles showevidence of carbon limitation that occurs towards the end of the light cycle.Spikes in [O2] were used for oxygen evolution measurements (see Figure 3).
Figure 3. A typical spike in the [O2] profile, which was used to calculate the net photo-synthesis (P�R) and the gas exchange coefficient (kLa) at a specific point in time.
ChemSusChem 0000, 00, 0 – 0 www.chemsuschem.org � 0000 Wiley-VCH Verlag GmbH & Co. KGaA, Weinheim4
�� These are not the final page numbers!�� These are not the final page numbers!
Full Papers
1 12 23 34 45 56 67 78 89 9
10 1011 1112 1213 1314 1415 1516 1617 1718 1819 1920 2021 2122 2223 2324 2425 2526 2627 2728 2829 2930 3031 3132 3233 3334 3435 3536 3637 3738 3839 3940 4041 4142 4243 4344 4445 4546 4647 4748 4849 4950 5051 5152 5253 5354 5455 5556 5657 57

strongly dependent on temperature, pressure, salinity andbubble size,[30] but these are all assumed to be constantthroughout the experiment. Once kLa is known, it is possibleto calculate (P�R) directly from the [O2] profile without per-forming a spike by using the expected dissolved oxygen con-centration calculated from Henry’s Law ([O2]eq) and consideringFick’s Law solution under steady-state conditions [Eq. (5)]:
solution : ½O2�de ¼ ½O2�eq þ P�RkL a ð5Þ
Equations (3)–(5) were fitted to the [O2] measurementsbefore bubbling was interrupted [Eq. (5)] , during the interrup-tion [Eq.( 3)] and after [Eq. (4)] using the least squares fittingprocedure in gnuplot.
A more precise way to calculate net photosynthesis is toremove the complication of gas exchange by measuring [O2]in a traditional cuvette-based respirometer setup.[44, 45] By usingthis system, a 2 mL culture sample was extracted from thePBR, dark-adapted for 10 min and the oxygen production ratewas measured by performing a rapid light curve over five irra-diances. The use of a sealed cuvette ensures that photosynthe-sis rate measurements are free of interference from atmospher-ic gas exchange. However, it is difficult to relate the light fieldthat cells experience in the PBR to the light field in the respir-ometer cuvette. Other bulk properties, such as mixing, will alsobe different. For these reasons, the rate of photosynthesismeasured in the PBR and cuvette are not compared directly,and different ordinate scales are used in Figure 4.
A similar diurnal pattern is observed in the PBRs and in therespirometer setup, which implies that [O2] can be used withconfidence as proxy for net photosynthesis provided that thegas exchange is controlled and stable[46] (Figure 4). Dark respi-ration (R) measurements of 20 mmolO2
L�1 h�1 are consistent
across the diurnal cycle in the PBR and against the cuvette-
based system. Net photosynthesis (P�R) is at its steady-statemaximum of 125 mmolO2
L�1 h�1
&&at the start of the lightcycle&& and decreases to the terminal rate of 50 mmo-lO2
L�1 h�1 by the end of the light cycle. This corresponds to
a 60 % decrease in net photosynthesis by the end of the lightcycle, or a ~30 % decrease in net productivity.
pH as a measure of carbon availability
As outlined in the Introduction (Figure 1), dissolved CO2 in-creases the concentration of HCO3
� ions and decreases theconcentration of CO3
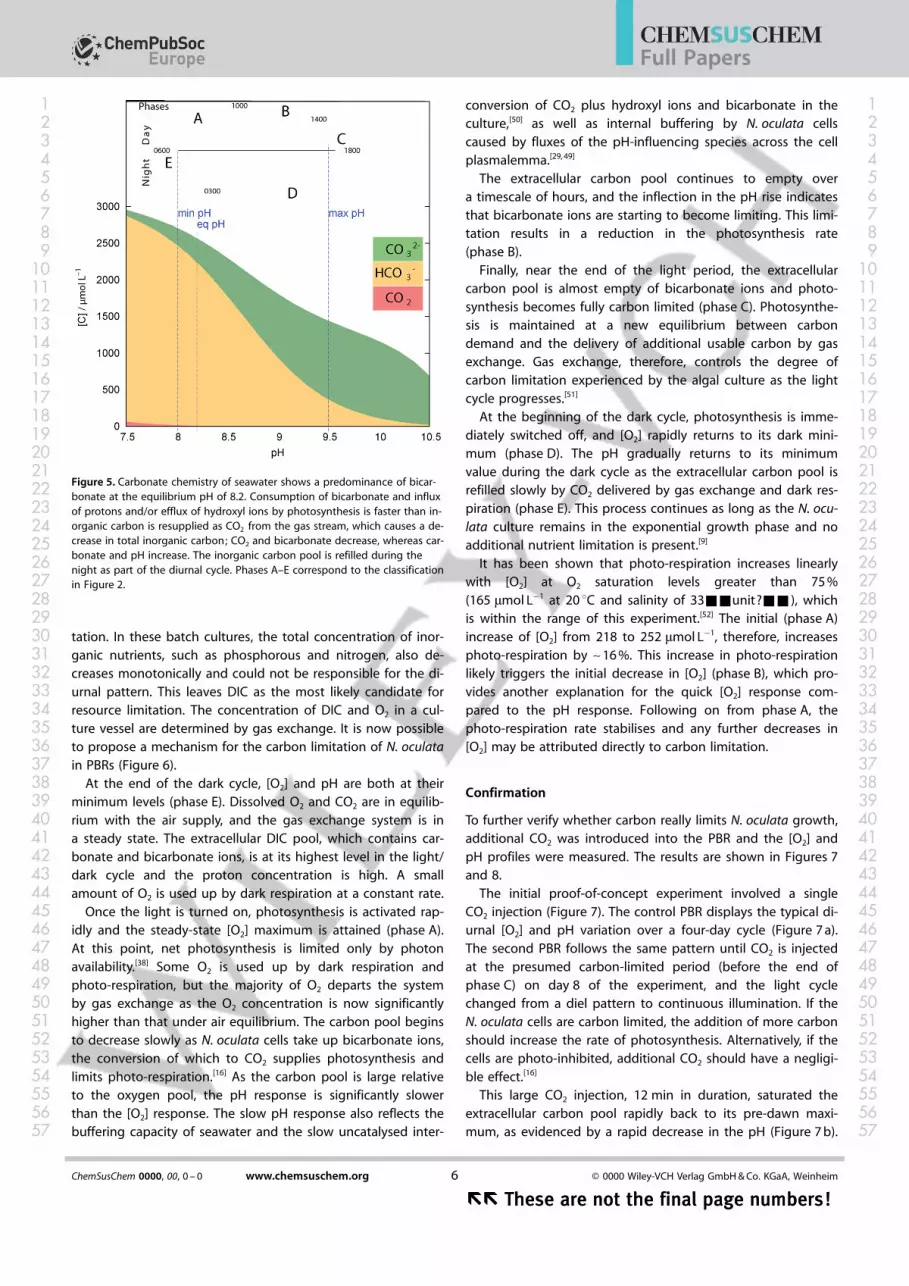
2� ions in seawater; pH can be used as anindirect measure of carbon availability in a PBR.[47] The increasein pH over the light cycle (Figure 2 b) can be attributed to theremoval of dissolved inorganic carbon (DIC) by N. oculata cells,which shifts the equilibrium of the carbonate system. DissolvedCO2 molecules have little direct influence on N. oculata photo-synthesis as bicarbonate dominates the extracellular carbonpool (Figure 5) and is also the inorganic carbon species takenup by the CCM. At the minimum pH of 8.0, the bicarbonatepool is almost full at ~2500 mmol L�1, whereas at the maximumpH of 9.5, the bicarbonate concentration is reduced to~300 mmol L�1 and carbonate is the dominant carbon species(Figure 5). The pH of the medium normally increases with timeif algae are grown with nitrate because of the excretion ofOH� anions,[37, 48] but this does not occur here as the pH returnsto the same dark cycle minimum after 24 h. This is consistentwith the fact that N. oculata uses an acid–base regulationmechanism to synthesise organic acids to neutralise excessOH� and store the resulting organic anion salts in vacuoles.[49]
N. oculata cells, like most algae, cannot use carbonate asa carbon source.[14, 25] As bicarbonate is used up and becomesa limiting resource, so the rate of pH increase decreases.N. oculata cells find it more difficult to obtain carbon, and the
rate of photosynthesis decreases consequently(Figure 4). The pH maximum plateau at the end ofthe light cycle (Figure 2 b), therefore, represents thepoint at which the carbon-limited rate of photosyn-thesis matches the input of carbon from gas ex-change. The reduced afternoon [O2] terminal corre-sponds to the equilibrium between the rate at whichcarbon is removed from solution by photosynthesisand the rate at which carbon is added to solution bygas exchange (bubbling). This equilibrium willdepend on the factors that affect both photosynthe-sis (light level, cell number, temperature, nutrientlevels) and gas exchange (gas bubbling rate, CO2
concentration, bubble size, gas residence time).[5, 47]
Mechanism
The asymptotic diurnal [O2] trend cannot be attribut-ed to photo-inhibition as the light availability in a cul-ture decreases monotonically with age; hence photo-inhibition is more likely in dilute cultures at earlystages of growth. Therefore, this afternoon decreasein photosynthesis is likely caused by a resource limi-
Figure 4. A comparison between different types of photosynthesis rate measurementsand calculations over two days of PBR operation: red pluses, calculated using [O2] spikes;red line, calculated directly from [O2] profile using Fick’s Law &&which one?&& andassuming constant gas exchange; blue dots (in the light) and blue squares (in the dark),measured using the cuvette-based respirometer setup.
ChemSusChem 0000, 00, 0 – 0 www.chemsuschem.org � 0000 Wiley-VCH Verlag GmbH & Co. KGaA, Weinheim5
These are not the final page numbers! ��These are not the final page numbers! ��
Full Papers
1 12 23 34 45 56 67 78 89 9
10 1011 1112 1213 1314 1415 1516 1617 1718 1819 1920 2021 2122 2223 2324 2425 2526 2627 2728 2829 2930 3031 3132 3233 3334 3435 3536 3637 3738 3839 3940 4041 4142 4243 4344 4445 4546 4647 4748 4849 4950 5051 5152 5253 5354 5455 5556 5657 57
tation. In these batch cultures, the total concentration of inor-ganic nutrients, such as phosphorous and nitrogen, also de-creases monotonically and could not be responsible for the di-urnal pattern. This leaves DIC as the most likely candidate forresource limitation. The concentration of DIC and O2 in a cul-ture vessel are determined by gas exchange. It is now possibleto propose a mechanism for the carbon limitation of N. oculatain PBRs (Figure 6).
At the end of the dark cycle, [O2] and pH are both at theirminimum levels (phase E). Dissolved O2 and CO2 are in equilib-rium with the air supply, and the gas exchange system is ina steady state. The extracellular DIC pool, which contains car-bonate and bicarbonate ions, is at its highest level in the light/dark cycle and the proton concentration is high. A smallamount of O2 is used up by dark respiration at a constant rate.
Once the light is turned on, photosynthesis is activated rap-idly and the steady-state [O2] maximum is attained (phase A).At this point, net photosynthesis is limited only by photonavailability.[38] Some O2 is used up by dark respiration andphoto-respiration, but the majority of O2 departs the systemby gas exchange as the O2 concentration is now significantlyhigher than that under air equilibrium. The carbon pool beginsto decrease slowly as N. oculata cells take up bicarbonate ions,the conversion of which to CO2 supplies photosynthesis andlimits photo-respiration.[16] As the carbon pool is large relativeto the oxygen pool, the pH response is significantly slowerthan the [O2] response. The slow pH response also reflects thebuffering capacity of seawater and the slow uncatalysed inter-
conversion of CO2 plus hydroxyl ions and bicarbonate in theculture,[50] as well as internal buffering by N. oculata cellscaused by fluxes of the pH-influencing species across the cellplasmalemma.[29, 49]
The extracellular carbon pool continues to empty overa timescale of hours, and the inflection in the pH rise indicatesthat bicarbonate ions are starting to become limiting. This limi-tation results in a reduction in the photosynthesis rate(phase B).
Finally, near the end of the light period, the extracellularcarbon pool is almost empty of bicarbonate ions and photo-synthesis becomes fully carbon limited (phase C). Photosynthe-sis is maintained at a new equilibrium between carbondemand and the delivery of additional usable carbon by gasexchange. Gas exchange, therefore, controls the degree ofcarbon limitation experienced by the algal culture as the lightcycle progresses.[51]
At the beginning of the dark cycle, photosynthesis is imme-diately switched off, and [O2] rapidly returns to its dark mini-mum (phase D). The pH gradually returns to its minimumvalue during the dark cycle as the extracellular carbon pool isrefilled slowly by CO2 delivered by gas exchange and dark res-piration (phase E). This process continues as long as the N. ocu-lata culture remains in the exponential growth phase and noadditional nutrient limitation is present.[9]
It has been shown that photo-respiration increases linearlywith [O2] at O2 saturation levels greater than 75 %(165 mmol L�1 at 20 8C and salinity of 33&&unit?&&), whichis within the range of this experiment.[52] The initial (phase A)increase of [O2] from 218 to 252 mmol L�1, therefore, increasesphoto-respiration by ~16 %. This increase in photo-respirationlikely triggers the initial decrease in [O2] (phase B), which pro-vides another explanation for the quick [O2] response com-pared to the pH response. Following on from phase A, thephoto-respiration rate stabilises and any further decreases in[O2] may be attributed directly to carbon limitation.
Confirmation
To further verify whether carbon really limits N. oculata growth,additional CO2 was introduced into the PBR and the [O2] andpH profiles were measured. The results are shown in Figures 7and 8.
The initial proof-of-concept experiment involved a singleCO2 injection (Figure 7). The control PBR displays the typical di-urnal [O2] and pH variation over a four-day cycle (Figure 7 a).The second PBR follows the same pattern until CO2 is injectedat the presumed carbon-limited period (before the end ofphase C) on day 8 of the experiment, and the light cyclechanged from a diel pattern to continuous illumination. If theN. oculata cells are carbon limited, the addition of more carbonshould increase the rate of photosynthesis. Alternatively, if thecells are photo-inhibited, additional CO2 should have a negligi-ble effect.[16]
This large CO2 injection, 12 min in duration, saturated theextracellular carbon pool rapidly back to its pre-dawn maxi-mum, as evidenced by a rapid decrease in the pH (Figure 7 b).
Figure 5. Carbonate chemistry of seawater shows a predominance of bicar-bonate at the equilibrium pH of 8.2. Consumption of bicarbonate and influxof protons and/or efflux of hydroxyl ions by photosynthesis is faster than in-organic carbon is resupplied as CO2 from the gas stream, which causes a de-crease in total inorganic carbon; CO2 and bicarbonate decrease, whereas car-bonate and pH increase. The inorganic carbon pool is refilled during thenight as part of the diurnal cycle. Phases A–E correspond to the classificationin Figure 2.
ChemSusChem 0000, 00, 0 – 0 www.chemsuschem.org � 0000 Wiley-VCH Verlag GmbH & Co. KGaA, Weinheim6
�� These are not the final page numbers!�� These are not the final page numbers!
Full Papers
1 12 23 34 45 56 67 78 89 9
10 1011 1112 1213 1314 1415 1516 1617 1718 1819 1920 2021 2122 2223 2324 2425 2526 2627 2728 2829 2930 3031 3132 3233 3334 3435 3536 3637 3738 3839 3940 4041 4142 4243 4344 4445 4546 4647 4748 4849 4950 5051 5152 5253 5354 5455 5556 5657 57

At the same time, [O2] returned to its maximum value, whichindicates that steady-state photosynthesis is possible ina carbon-replete system at any point during the light cycle.Following CO2 addition, the light cycle was extended for an ad-ditional 10 h (Figure 7 b). Over this time, the [O2] reduction cor-responded directly to carbon pool depletion (increased pH)with no evidence of photo-inhibition, circadian cycles or anyother light-related effects.
A second experiment was performed to determine whether[O2] could be maintained at its carbon-replete maximum byperiodic CO2 injection (Figure 8). In the control PBR, the typicaldiurnal carbon limitation pattern was observed over a periodof five days (Figure 8 a). In the second PBR, a brief CO2 injectionof 10 s in duration was applied whenever [O2] began to fall be-neath the light-limited maximum (Figure 8 b). The maximumdaily [O2] was maintained across five consecutive light cyclesby applying a set of 5–8 such CO2 injections to maintaina carbon-replete environment.
One way to ensure that the PBR remains carbon replete is tooperate the PBR as a pH-stat at the night cycle minimum pH
of 8.0. There are two disadvantages to this approach: 1) thepH response time from the carbonate chemistry is slow, espe-cially in the absence of external carbonic anhydrase in Nanno-chloropsis spp., and 2) carbonate chemistry is complex and pHis only a proxy for carbon availability. Salinity and dissolved nu-trient concentrations play a significant role to determine therelationship between carbonate chemistry and pH.[29] In a pH-stat system, the control parameter is separated by numerouschemical and metabolic steps from the desired algal physiolog-ical response, that is, maximum photosynthesis rate. pH is oneof many inputs of photosynthesis, which include irradiance,temperature, inorganic nutrient availability and cell density. Amore precise control system could instead utilise [O2] , which isa direct output of photosynthesis. An example of one such“[O2]-stat” system in operation is given in Figure 8. As the [O2]response is more dynamic and faster, it would result in moreefficient CO2 delivery, but it will carry additional challenges inmaintaining a steady equilibrium.
Figure 6. Mechanism for carbon limitation of N. oculata in a PBR. Changes in arrow thickness indicate changes in the rate of photosynthesis, respiration andgas exchange. Changes in the red and white ovals indicate changes in extracellular DIC and proton (H+) pool sizes respectively.
ChemSusChem 0000, 00, 0 – 0 www.chemsuschem.org � 0000 Wiley-VCH Verlag GmbH & Co. KGaA, Weinheim7
These are not the final page numbers! ��These are not the final page numbers! ��
Full Papers
1 12 23 34 45 56 67 78 89 9
10 1011 1112 1213 1314 1415 1516 1617 1718 1819 1920 2021 2122 2223 2324 2425 2526 2627 2728 2829 2930 3031 3132 3233 3334 3435 3536 3637 3738 3839 3940 4041 4142 4243 4344 4445 4546 4647 4748 4849 4950 5051 5152 5253 5354 5455 5556 5657 57

Conclusions
The green alga N. oculata was cultured in an environmentalphoto-bioreactor, and a significant reduction in the rate ofphotosynthesis was observed during the light cycle. Photosyn-
thesis was limited by the deple-tion of usable carbon, or morespecifically bicarbonate ions, inthe system. A mechanism thatinvolves photosynthesis, respira-tion and carbonate chemistrycan explain this phenomenon.The addition of CO2 was used torecover the steady-state maxi-mum photosynthesis rate and,therefore, prove that N. oculatacells were carbon limited underthe environmental conditionsprovided by the photo-bioreac-tor. This ability to identify andanalyse carbon limitation is ofcritical importance to both ex-perimental design and commer-cial algal biomass production.
The dissolved oxygen concen-tration [O2] proved to be an ef-fective proxy for photosynthesisrate. In future, a feedback loopwill be used to maintain [O2] atits maximum level by graduallyincreasing the CO2 concentrationin the gas bubbling mix acrossthe light cycle. This approachwould alleviate carbon limitationand maximise photosynthesis,which would also maximiseN. oculata biomass production inthe absence of other limitingfactors, such as nitrogen orphosphorus depletion. As theCO2 molar fraction of the gasphase and the gas exchange co-efficient are both known, it willalso be possible to calculate theCO2 sequestration rate by N. ocu-lata cells. Once set up, thissystem could be applied to anyphoto-bioreactor geometry orindeed to any algal species.
Experimental Section
Algae and stock culture
The microalga Nannochloropsisoculata (Droop) Green (AustralianNational Algae Culture Collection;strain CS-179) was used. Taxonomi-cally, N. oculata is in the class Eu-
stigmatophyceae of the phylum Heterokontophyta. N. oculata wasgrown in f/2 seawater medium: artificial seawater (salinity 33) en-riched with 54.7 mg L�1 NO3, 4.5 mg L�1 PO4 and micronutrients.Stock cultures were maintained in 200 mL Erlenmeyer flasks at
Figure 7. Effects of a single CO2 injection on diurnal [O2] and pH profiles. a) The control experiment shows consis-tent [O2] and pH profiles over a four-day period. b) A single, large CO2 injection at terminal [O2] on day 8 of theexperiment fills up the carbon pool and returns [O2] back to its steady-state maximum, which effectively replicatesDIC replenishment during a night cycle.
Figure 8. The use of periodic CO2 injections to maintain [O2] at its carbon-replete maximum throughout the lightcycle. Algae are increasingly carbon limited across the light cycle in a) the control experiment, whereas a higherrate of net photosynthesis could be consistently maintained with b) periodic CO2 injection across five consecutivelight cycles.
ChemSusChem 0000, 00, 0 – 0 www.chemsuschem.org � 0000 Wiley-VCH Verlag GmbH & Co. KGaA, Weinheim8
�� These are not the final page numbers!�� These are not the final page numbers!
Full Papers
1 12 23 34 45 56 67 78 89 9
10 1011 1112 1213 1314 1415 1516 1617 1718 1819 1920 2021 2122 2223 2324 2425 2526 2627 2728 2829 2930 3031 3132 3233 3334 3435 3536 3637 3738 3839 3940 4041 4142 4243 4344 4445 4546 4647 4748 4849 4950 5051 5152 5253 5354 5455 5556 5657 57

20 8C under cool-white fluorescent light with an irradiance of (50�5) &&mmolphoton m�2 s�1
&& and a 12:12 h light/dark cycle in anincubator (Labec Temperature Cycling Chamber incubator, LabecPty Ltd, Australia). Cultures were diluted seven days before the ex-periment to ensure that N. oculata cells were in the exponentialgrowth phase. PBRs were inoculated with a 1:10 v/v algal dilutionin f/2 to give a starting concentration of approximately106 cells mL�1.
PBRs
Experiments were performed in environmental photo-bioreactors(ePBR, Phenometrics, Lensing, MI, USA) with an inverted conicalfrustum geometry and a working volume of 500 mL.[38] Two simul-taneous ePBR experimental replicates were used. The algae weremixed by magnetic stirring. The temperature was maintained at20 8C using a Peltier heater-cooler connected to a water jacket.Cool-white LED illumination was delivered from above; the pathlength through the algal culture was 20 cm. The algae were illumi-nated with a photon flux density of 500 mmolphoton m�2 s�1 overa 12:12 h light/dark cycle during a six-day adaptation period. Onceacclimation was complete, that is, once N. oculata cells hadreached the exponential growth phase, irradiance was increased to2000 mmolphoton m�2 s�1 (12:12 h light/dark cycle), which corre-sponds to the day-time maximum irradiance at outdoor culturingfacilities. Air bubbling was also turned on at this time. Oil-free lab-oratory air was humidified by passing it through distilled waterafter which it was filtered through a 0.2 mm filter and then deliv-ered through a 0.45 mm sterile needle placed near the bottom ofthe ePBR vessel.
Continuous [O2] and pH measurements
Dissolved oxygen [O2] was measured by using a 3 mm robust [O2]optical probe with optical isolation (OXROB10-OI-CL4; PyroScience,Aachen, Germany). A two-point [O2] calibration against air-saturat-ed and nitrogen-saturated seawater was performed. A prototypepH optical probe with optical isolation (PyroScience, Aachen, Ger-many) was used to measure pH; it was calibrated by titration withNaOH and HCl, and the pH response was linear within the pHregion of interest.
Automated cell counts
Samples (1 mL) were extracted daily from each ePBR, fixed with1 % glutaraldehyde and stored in the dark at 5 8C. A 10 mL aliquotwas pipetted into a haemocytometer (Neubauer, Germany) andplaced under a compound microscope (BX50 with analySIS soft-ware, Olympus, Victoria, Australia) at 20 � magnification. The cellswere left to settle for 5 min before 15–30 images of different hae-mocytometer squares were recorded. A custom ImageJ script wasused to scan the resulting JPEG files through format changes toquantify the cell density and size distribution. The software wasable to distinguish between N. oculata cells, cell detritus, dust andair bubbles.
Cuvette system
Occasional oxygen production and carbon addition experimentswere performed in a 1 cm square-sided cuvette with a 1.6 mLworking volume and a custom-designed gas-tight lid.[44, 45] Freshsamples were extracted from one ePBR and dark-incubated for
10 min before the experiment. The temperature was controlled at20 8C in an optical cuvette holder (ED-101US/MD, Heinz WalzGmbH, Effeltrich, Germany) with integrated magnetic stirring.White actinic light was provided by the multi-colour pulse-ampli-tude-modulated fluorometer (MC PAM; Heinz Walz GmbH, Effel-trich, Germany). A [O2] fixed needle-type minisensor probe withoptical isolation (OXF1100-OI; PyroScience, Aachen, Germany) wasused to measure photosynthesis and respiration rates.
Oxygen production
Oxygen production was measured several times per day in theePBR. The air supply was turned off for approximately 15 min tomeasure the rate of oxygen production (modelled by a linear in-crease) associated with net photosynthesis. Once the air supplywas turned back on, the oxygen concentration returned to itsbaseline as a result of gas exchange (modelled by an exponentialdecay). Rapid light curves were used to measure oxygen produc-tion in the cuvette. Five consecutive illumination steps were used:44 mmolphoton m�2 s�1 for 8 min; 122 mmolphoton m�2 s�1 for 4 min;258 mmolphoton m�2 s�1 for 2 min; 499 mmolphoton m�2 s�1 for 2 min;831 mmolphoton m�2 s�1 for 2 min.
Carbon addition
Two mass flow controllers were used to mix pure CO2 at a flowrate of 20 mL min�1 with air at a flow rate of 70 mL min�1 to givea CO2 molar gas fraction of 22.3 %. This CO2 was delivered into oneof the ePBRs at the end of the light cycle on day 10 of the experi-ment (Figure 7). It was delivered over a period of 12 min throughan additional humidified gas line with a 0.45 mm sterile needle. Ina second experiment, CO2 was instead delivered periodically at10 s intervals (Figure 8). A solenoid valve was used to control CO2
injection.
Acknowledgements
The authors would like to thank Dr Milan Szab� for his scientificinput and PyroScience GmbH for giving us access to their proto-type pH optodes.
Keywords: biomass · carbon dioxide fixation · kinetics ·photosynthesis · renewable resources
[1] L. Garcia Alba, M. P. Vos, C. Torri, D. Fabbri, S. R. A. Kersten, D. W. F. Bril-man, ChemSusChem 2013, 6, 1330 – 1333.
[2] M. A. Borowitzka, J. Appl. Phycol. 1997, 9, 393 – 401.[3] D. R. Georgianna, S. P. Mayfield, Nature 2012, 488, 329 – 335.[4] Bureau of Resources and Energy Economics, 2014 Australian Energy Sta-
tistics Data, Australian Government, 2014.[5] A. W. D. Larkum, I. L. Ross, O. Kruse, B. Hankamer, Trends Biotechnol.
2012, 30, 198 – 205.[6] T. M. Mata, A. A. Martins, N. S. Caetano, Renewable Sustainable Energy
Rev. 2010, 14, 217 – 232.[7] M. J. Griffiths, S. T. L. Harrison, J. Appl. Phycol. 2009, 21, 493 – 507.[8] C. M. Moore, M. M. Mills, K. R. Arrigo, I. Berman-Frank, L. Bopp, P. W.
Boyd, E. D. Galbraith, R. J. Geider, C. Guieu, S. L. Jaccard, T. D. Jickells, J.La Roche, T. M. Lenton, N. M. Mahowald, E. MaraÇ�n, I. Marinov, J. K.Moore, T. Nakatsuka, A. Oschlies, M. A. Saito, T. F. Thingstad, A. Tsuda, O.Ulloa, Nat. Geosci. 2013, 6, 701 – 710.
[9] R. J. Geider, H. L. MacIntyre, T. M. Kana, Limnol. Oceanogr. 1998, 43,679 – 694.
ChemSusChem 0000, 00, 0 – 0 www.chemsuschem.org � 0000 Wiley-VCH Verlag GmbH & Co. KGaA, Weinheim9
These are not the final page numbers! ��These are not the final page numbers! ��
Full Papers
1 12 23 34 45 56 67 78 89 9
10 1011 1112 1213 1314 1415 1516 1617 1718 1819 1920 2021 2122 2223 2324 2425 2526 2627 2728 2829 2930 3031 3132 3233 3334 3435 3536 3637 3738 3839 3940 4041 4142 4243 4344 4445 4546 4647 4748 4849 4950 5051 5152 5253 5354 5455 5556 5657 57

[10] Z. V. Finkel, J. Beardall, K. J. Flynn, A. Quigg, T. A. V. Rees, J. A. Raven, J.Plankton Res. 2009, 31, 119 – 137.&&please check reference, wecouldn’t identify it.&&
[11] A. C. Redfield, Am. Sci. 1958, 46, 205 – 221.[12] M. J. Barbosa, M. Janssen, N. Ham, J. Tramper, R. H. Wijffels, Biotechnol.
Bioeng. 2003, 82, 170 – 179.[13] R. J. Ritchie, A. W. D. Larkum, Photosynthetica 2012, 50, 481 – 500.[14] G. Johnsen, E. Sakshaug, J. Phycol. 2007, 43, 1236 – 1251.[15] L. L. Beer, E. S. Boyd, J. W. Peters, M. C. Posewitz, Curr. Opin. Biotechnol.
2009, 20, 264 – 271.[16] J. A. Raven, Physiol. Plant. 2011, 142, 87 – 104.[17] R. Miller, G. Wu, R. R. Deshpande, A. Vieler, K. G�rtner, X. Li, E. R. Moeller-
ing, S. Z�uner, A. J. Cornish, B. Liu, B. Bullard, B. B. Sears, M.-H. Kuo, E. L.Hegg, Y. Shachar-Hill, S.-H. Shiu, C. Benning, Plant Physiol. 2010, 154,1737 – 1752.
[18] S. Shigeoka, T. Ishikawa, M. Tamoi, Y. Miyagawa, T. Toru, Y. Yukinori, Y.Kazuya, J. Exp. Bot. 2002, 53, 1305 – 1319.
[19] C. Posten, Eng. Life Sci. 2009, 9, 165 – 177.[20] B. Tamburic, F. W. Zemichael, P. Crudge, G. C. Maitland, K. Hellgardt, Int.
J. Hydrogen Energy 2011, 36, 6578 – 6591.[21] I. Perner-Nochta, C. Posten, J. Biotechnol. 2007, 131, 276 – 285.[22] R. Sayre, Bioscience 2010, 60, 722 – 727.[23] X.-G. Zhu, S. P. Long, D. R. Ort, Curr. Opin. Biotechnol. 2008, 19, 153 –
159.[24] J. E. Keffer, G. T. Kleinheinz, J. Ind. Microbiol. Biotechnol. 2002, 29, 275 –
280.[25] M. H. Spalding, J. Exp. Bot. 2008, 59, 1463 – 1473.[26] R. Zeebe, D. Wolf-Gladrow, Carbon Dioxide in Seawater : Equilibrium, Ki-
netics, Isotopes, Elsevier, Amsterdam 2001.[27] A. Ridgwell, R. Zeebe, Earth Planet. Sci. Lett. 2005, 234, 299 – 315.[28] F. J. Millero, J.-Z. Zhang, K. Lee, D. M. Campbell, Mar. Chem. 1993, 44,
153 – 165.[29] J. Goldman, P. Brewer, Limnol. Oceanogr. 1980, 25, 352 – 357.[30] E. Lewis, D. Wallace, Program Developed for Carbon Dioxide System Cal-
culations, Brookhaven National Laboratory, 1998.[31] J. Doucha, F. Straka, K. L�vansky, J. Appl. Phycol. 2005, 17, 403 – 412.[32] R. Sander, Compilation of Henry’s Law Constants for Inorganic and Or-
ganic Species of Potential Importance in Environmental Chemistry, Max-Planck Institute of Chemistry, 1999.
[33] N. A. Nimer, D. M. Iglesias-Rodriguez, M. J. Merrett, J. Phycol. 1997, 33,625 – 631.
[34] I. E. Huertas, M. Rouco, V. L�pez-Rodas, E. Costas, New Phytol. 2010, 188,478 – 487.
[35] A. Sukenik, D. Tchernov, A. Kaplan, J. Phycol. 1997, 33, 969 – 975.[36] J. Raven, M. De Michelis, Plant Cell Environ. 1979, 2, 245 – 257.[37] P. Brewer, J. Goldman, Limnol. Oceanogr. 1976, 21, 108 – 117.[38] B. Tamburic, S. Guruprasad, D. T. Radford, M. Szab�, R. M. Lilley, A. W. D.
Larkum, J. B. Franklin, D. M. Kramer, S. I. Blackburn, J. A. Raven, M.Schliep, P. J. Ralph, PLoS One 2014, 9, e86047.
[39] C. Posten, G. Schaub, J. Biotechnol. 2009, 142, 64 – 69.[40] L. Nedbal, M. Trt�lek, J. Cerveny, O. Kom�rek, H. B. Pakrasi, Biotechnol.
Bioeng. 2008, 100, 902 – 910.[41] N. R. Moheimani, J. Appl. Phycol. 20132, 25, 387 – 398.&&ok?&&
[42] C. G. Borkenstein, J. Knoblechner, H. Fr�hwirth, M. Schagerl, J. Appl.Phycol. 2011, 23, 131 – 135.&&ok?&&
[43] P. Brading, M. E. Warner, P. Davey, D. J. Smith, E. P. Achterberg, D. J. Sug-gett, Limnol. Oceanogr. 2011, 56, 927 – 938.
[44] D. Wangpraseurt, B. Tamburic, M. Szab�, D. Suggett, P. J. Ralph, M. K�hl,PLoS One 2014, 9, e112809.
[45] B. Tamburic, M. Szab�, N.-A. T. Tran, A. W. D. Larkum, D. J. Suggett, P. J.Ralph, Bioresour. Technol. 2014, 169, 320 – 327.
[46] J. U. Grobbelaar, J. Appl. Phycol. 2009, 21, 519 – 522.&&ok?&&
[47] E. Molina Grima, F. G. Acien Fernandez, F. Garcia Camacho, F. Cama-cho Rubio, Y. Chisti, J. Appl. Phycol. 2000, 12, 355 – 368.
[48] M. Cramer, J. Myers, J. Gen. Physiol. 1948, 32, 93 – 102.[49] J. A. Raven, F. A. Smith, New Phytol. 1976, 76, 415 – 431.[50] I. Huertas, G. Espie, B. Colman, L. Lubian, Planta 2000, 211, 43 – 49.[51] M. Janssen, L. de Bresser, T. Baijens, J. Tramper, L. R. Mur, J. Snel, R. H.
Wijffels, J. Appl. Phycol. 2000, 12, 225 – 237.[52] S. Raso, B. van Genugten, M. Vermu, R. H. Wijffels, J. Appl. Phycol. 2012,
24, 863 – 871.
Received: March 5, 2015
Revised: June 22, 2015
Published online on && &&, 0000
ChemSusChem 0000, 00, 0 – 0 www.chemsuschem.org � 0000 Wiley-VCH Verlag GmbH & Co. KGaA, Weinheim10
�� These are not the final page numbers!�� These are not the final page numbers!
Full Papers
1 12 23 34 45 56 67 78 89 9
10 1011 1112 1213 1314 1415 1516 1617 1718 1819 1920 2021 2122 2223 2324 2425 2526 2627 2728 2829 2930 3031 3132 3233 3334 3435 3536 3637 3738 3839 3940 4041 4142 4243 4344 4445 4546 4647 4748 4849 4950 5051 5152 5253 5354 5455 5556 5657 57

FULL PAPERS
B. Tamburic,* C. R. Evenhuis, D. J. Suggett,A. W. D. Larkum, J. A. Raven, P. J. Ralph
&& –&&
Gas Transfer Controls CarbonLimitation During Biomass Productionby Marine Algae
Just grow it: We present the first in-depth analysis of CO2 limitation on bio-mass productivity of the marine microal-ga Nannochloropsis oculata. Net photo-synthesis decreases by 60 % over a 12 hlight cycle as a direct result of carbonlimitation. Continuous dissolved O2 andpH measurements are used to developa detailed diurnal mechanism for the in-teraction between photosynthesis, gasexchange and carbonate chemistry inthe photo-bioreactor.&&ok? text andgraphics were missing.&&Tamburic etal. study CO2 limitation on #biomassproductivity in a #photobioreactor
ChemSusChem 0000, 00, 0 – 0 www.chemsuschem.org � 0000 Wiley-VCH Verlag GmbH & Co. KGaA, Weinheim11
These are not the final page numbers! ��These are not the final page numbers! ��
1 12 23 34 45 56 67 78 89 9
10 1011 1112 1213 1314 1415 1516 1617 1718 1819 1920 2021 2122 2223 2324 2425 2526 2627 2728 2829 2930 3031 3132 3233 3334 3435 3536 3637 3738 3839 3940 4041 4142 4243 4344 4445 4546 4647 4748 4849 4950 5051 5152 5253 5354 5455 5556 5657 57


