Embed Size (px)
Citation preview

GDF15 promotes osteoclast differentiation, inhibits osteoblast differentiation and high serum GDF15 levels are associated withmultiple myeloma bone disease
by Marita Westhrin, Siv Helen Moen, Toril Holien, Anne Kærsgaard Mylin, Lene Heickendorff, Oddrun Elise Olsen, Anders Sundan, Ingemar Turesson, Peter Gimsing,Anders Waage, and Therese Standal
Haematologica 2015 [Epub ahead of print]
Citation: Westhrin M, Moen SH, Holien T, Mylin AK, Heickendorff L, Olsen OE, Sundan A, Turesson I,Gimsing P, Waage A, and Standal T. GDF15 promotes osteoclast differentiation, inhibits osteoblast differentiation and high serum GDF15 levels are associated with multiple myeloma bone disease. Haematologica. 2015; 100:xxxdoi:10.3324/haematol.2015.124511
Publisher's Disclaimer.E-publishing ahead of print is increasingly important for the rapid dissemination of science.Haematologica is, therefore, E-publishing PDF files of an early version of manuscripts thathave completed a regular peer review and have been accepted for publication. E-publishingof this PDF file has been approved by the authors. After having E-published Ahead of Print,manuscripts will then undergo technical and English editing, typesetting, proof correction andbe presented for the authors' final approval; the final version of the manuscript will thenappear in print on a regular issue of the journal. All legal disclaimers that apply to thejournal also pertain to this production process.
Copyright 2015 Ferrata Storti Foundation.Published Ahead of Print on August 20, 2015, as doi:10.3324/haematol.2015.124511.

1
GDF15 promotes osteoclast differentiation, inhibits osteoblast
differentiation and high serum GDF15 levels are associated
with multiple myeloma bone disease
Marita Westhrin1, Siv Helen Moen1, Toril Holien1, Anne Kærsgaard Mylin2, Lene
Heickendorff3, Oddrun Elise Olsen1, Anders Sundan1, Ingemar Turesson4, Peter Gimsing2,
Anders Waage1, Therese Standal 1,5,*
1K.G. Jebsen Center for Myeloma Research, Department of Cancer Research and Molecular
Medicine, Norwegian University of Science and Technology, Trondheim, Norway
2Department of Haematology, Rigshospitalet, University of Copenhagen, Copenhagen,
Denmark, 3Department of Clinical Biochemistry, Aarhus University Hospital, Aarhus,
Denmark, 4Department of Hematology, Skane University Hospital, Malmo, Sweden, 5Centre
of Molecular Inflammation Research, Norwegian University of Science and Technology,
Trondheim, Norway
Corresponding author: Therese Standal
Department of Cancer Research and Molecular Medicine
Faculty of Medicine, Norwegian University of Science and Technology
Medisinsk teknisk forskningssenter, Olav Kyrres gt 9
7489 Trondheim, Norway
phone: + 47 72 82 53 51, email: [email protected]

2
Multiple myeloma (MM) is a hematological cancer caused by malignant plasma cells in the
bone marrow. A characteristic feature of this cancer is the destruction of bone, affecting
nearly all myeloma patients. The osteolytic bone disease is caused by increased number and
activity of osteoclasts, combined with reduced number and dysfunction of osteoblasts.1
Growth differentiation factor 15 (GDF15) is a member of the TGF-beta family that has been
shown to play a role in several types of cancer, inflammation, cardiovascular disease and
many other pathologies.2 Stromal cells in the bone marrow of multiple myeloma patients
overexpress GDF15, 3, 4 and high levels of GDF15 in the circulation of myeloma patients are
associated with a poor prognosis.4, 5 Moreover, GDF15 was recently shown to enhance the
tumor-initiating and self-renewal potential of malignant plasma cells, as well as conferring
drug resistance.4, 5
In terms of effects of GDF15 on bone cells, the results are conflicting. One study
demonstrated an important role of GDF15 for bone remodeling during hypoxia. 6 In particular,
GDF15 produced by osteocytes promoted osteoclast differentiation both in vitro and in vivo. 6
Moreover, GDF15 was shown to promote osteoclast formation in prostate cancer
metastasizing to bone. 7 In contrast, another study showed that GDF15 inhibited osteoclast
formation in vitro. 8 These studies were, however, performed on mouse bone marrow
mononuclear cells or murine macrophage-like cell lines, and how GDF15 affects human
osteoclast differentiation is not reported. Moreover, little is known on how GDF15 affects
osteoblast differentiation. Hence, we wanted to characterize the effect of GDF15 on the
differentiation of human osteoclasts and osteoblasts and to measure GDF15 in serum from a
well-characterized cohort of myeloma patients to see whether high GDF15 levels are
associated with osteolytic bone disease.
3
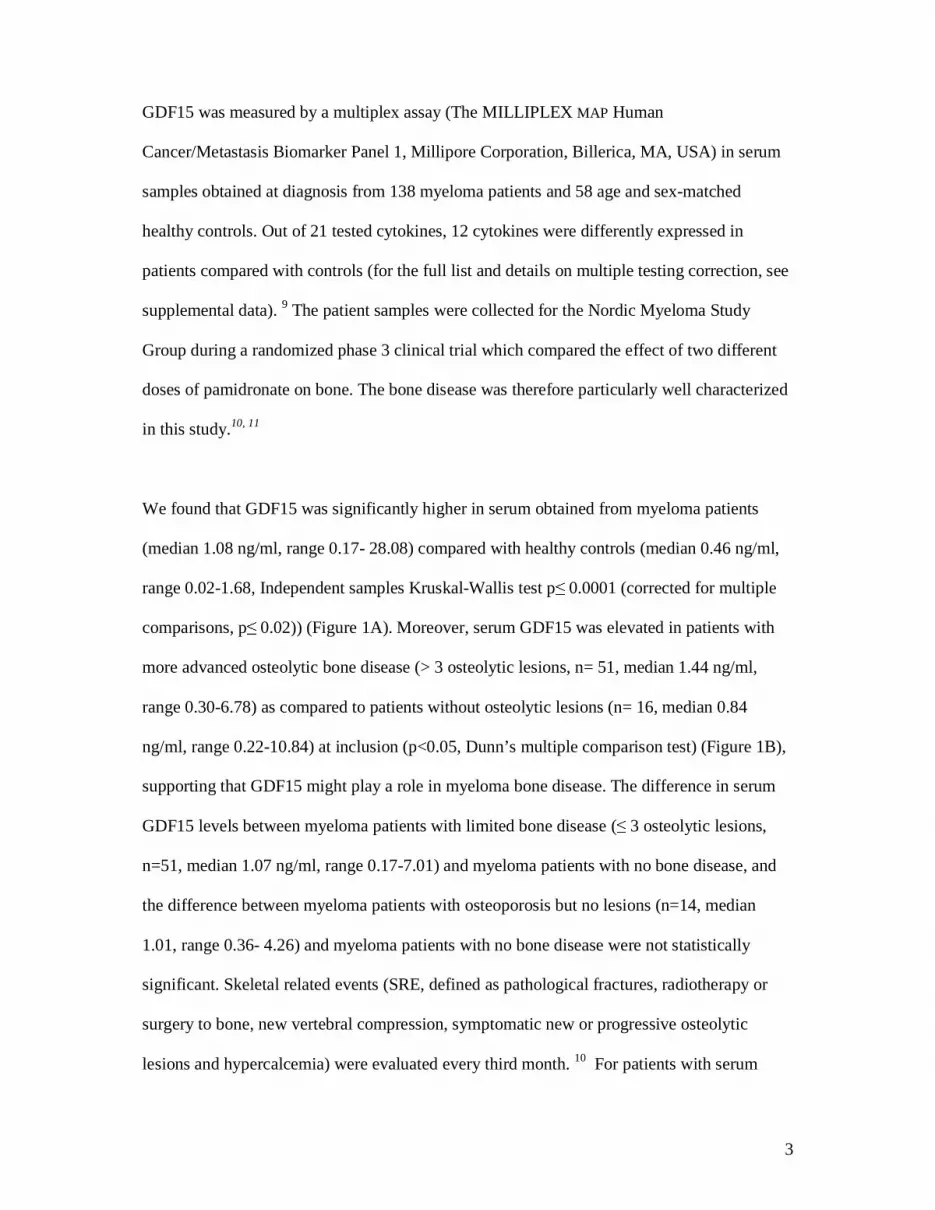
GDF15 was measured by a multiplex assay (The MILLIPLEX MAP Human
Cancer/Metastasis Biomarker Panel 1, Millipore Corporation, Billerica, MA, USA) in serum
samples obtained at diagnosis from 138 myeloma patients and 58 age and sex-matched
healthy controls. Out of 21 tested cytokines, 12 cytokines were differently expressed in
patients compared with controls (for the full list and details on multiple testing correction, see
supplemental data). 9 The patient samples were collected for the Nordic Myeloma Study
Group during a randomized phase 3 clinical trial which compared the effect of two different
doses of pamidronate on bone. The bone disease was therefore particularly well characterized
in this study.10, 11
We found that GDF15 was significantly higher in serum obtained from myeloma patients
(median 1.08 ng/ml, range 0.17- 28.08) compared with healthy controls (median 0.46 ng/ml,
range 0.02-1.68, Independent samples Kruskal-Wallis test p≤ 0.0001 (corrected for multiple
comparisons, p≤ 0.02)) (Figure 1A). Moreover, serum GDF15 was elevated in patients with
more advanced osteolytic bone disease (> 3 osteolytic lesions, n= 51, median 1.44 ng/ml,
range 0.30-6.78) as compared to patients without osteolytic lesions (n= 16, median 0.84
ng/ml, range 0.22-10.84) at inclusion (p<0.05, Dunn’s multiple comparison test) (Figure 1B),
supporting that GDF15 might play a role in myeloma bone disease. The difference in serum
GDF15 levels between myeloma patients with limited bone disease (≤ 3 osteolytic lesions,
n=51, median 1.07 ng/ml, range 0.17-7.01) and myeloma patients with no bone disease, and
the difference between myeloma patients with osteoporosis but no lesions (n=14, median
1.01, range 0.36- 4.26) and myeloma patients with no bone disease were not statistically
significant. Skeletal related events (SRE, defined as pathological fractures, radiotherapy or
surgery to bone, new vertebral compression, symptomatic new or progressive osteolytic
lesions and hypercalcemia) were evaluated every third month. 10 For patients with serum

4
GDF15 equal to or less than median serum GDF15 levels (GDF15 ≤ 1.08 ng/ml, n= 65) time
to skeletal related event (SRE) was not reached, while estimated time from inclusion to SRE
in the group of patients with serum GDF15 > 1.08 ng/ml was 35 months (n= 59). This
difference was however not statistically significant (p= 0.08 log-rank test, Figure 1C). Median
time from inclusion to SRE for the whole group of patients with registered skeletal status was
42 months (n= 124). In line with what has been reported previously 5 we found that low serum
GDF15 was associated with better overall survival: the median survival of patients who had a
serum GDF15 of ≤ 1.08 ng/ml (n = 69) was estimated to 82 months, while the median
survival for patients with GDF15 levels above 1.08 ng/ml was estimated to 35 months
(p= 0.002, log-rank test) (Figure 3B). Overall median survival for the 138 myeloma patients
was estimated to 59 months. An increase in serum GDF15 levels of 1 ng/ml leads to an
increased risk of death of 1.187 (univariate cox regression, p< 0.001).
Importantly, levels of serum GDF15 correlated with levels of markers for osteoclast activity,
carboxy-terminal crosslinked telopeptide of type I collagen (CTX1) (Spearman’s rho 0.40, p
≤0.001) and carboxy-terminal crosslinked telopeptide of type I collagen generated by MMPs
(ICTP) (Spearman’s rho 0.63, p ≤ 0.001), supporting an association between high GDF15 and
increased osteoclast activation. In contrast, serum GDF15 did not correlate with markers for
osteoblast activity bone-specific alkaline phosphatase (bALP) (rho -0.06, p= 0.52) or amino-
terminal propeptide of procollagen (PINP) (rho 0.15, p= 0.07).
To evaluate the effect of GDF15 on osteoclast differentiation in vitro we differentiated
osteoclasts from peripheral blood mononuclear cells (PBMC) (n=3) or from purchased pre-
osteoclasts (Lonza Inc., Allendale, NJ, USA, n=2). The cells were cultured in osteoclast
medium (a-MEM with human serum (20%), M-CSF (30ng/ml) and RANKL (50ng/ml) for up
5
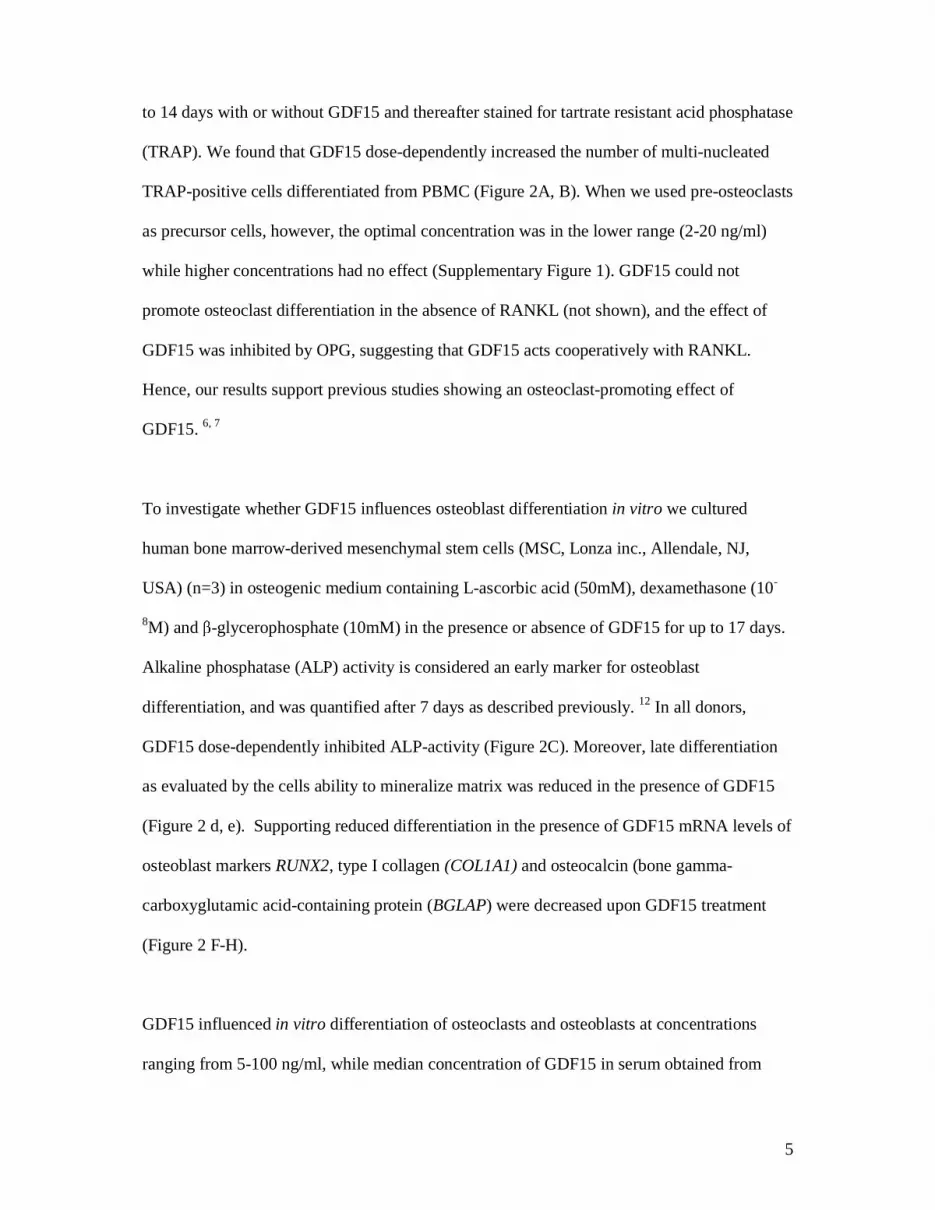
to 14 days with or without GDF15 and thereafter stained for tartrate resistant acid phosphatase
(TRAP). We found that GDF15 dose-dependently increased the number of multi-nucleated
TRAP-positive cells differentiated from PBMC (Figure 2A, B). When we used pre-osteoclasts
as precursor cells, however, the optimal concentration was in the lower range (2-20 ng/ml)
while higher concentrations had no effect (Supplementary Figure 1). GDF15 could not
promote osteoclast differentiation in the absence of RANKL (not shown), and the effect of
GDF15 was inhibited by OPG, suggesting that GDF15 acts cooperatively with RANKL.
Hence, our results support previous studies showing an osteoclast-promoting effect of
GDF15. 6, 7
To investigate whether GDF15 influences osteoblast differentiation in vitro we cultured
human bone marrow-derived mesenchymal stem cells (MSC, Lonza inc., Allendale, NJ,
USA) (n=3) in osteogenic medium containing L-ascorbic acid (50mM), dexamethasone (10-
8M) and β-glycerophosphate (10mM) in the presence or absence of GDF15 for up to 17 days.
Alkaline phosphatase (ALP) activity is considered an early marker for osteoblast
differentiation, and was quantified after 7 days as described previously. 12 In all donors,
GDF15 dose-dependently inhibited ALP-activity (Figure 2C). Moreover, late differentiation
as evaluated by the cells ability to mineralize matrix was reduced in the presence of GDF15
(Figure 2 d, e). Supporting reduced differentiation in the presence of GDF15 mRNA levels of
osteoblast markers RUNX2, type I collagen (COL1A1) and osteocalcin (bone gamma-
carboxyglutamic acid-containing protein (BGLAP) were decreased upon GDF15 treatment
(Figure 2 F-H).
GDF15 influenced in vitro differentiation of osteoclasts and osteoblasts at concentrations
ranging from 5-100 ng/ml, while median concentration of GDF15 in serum obtained from

6
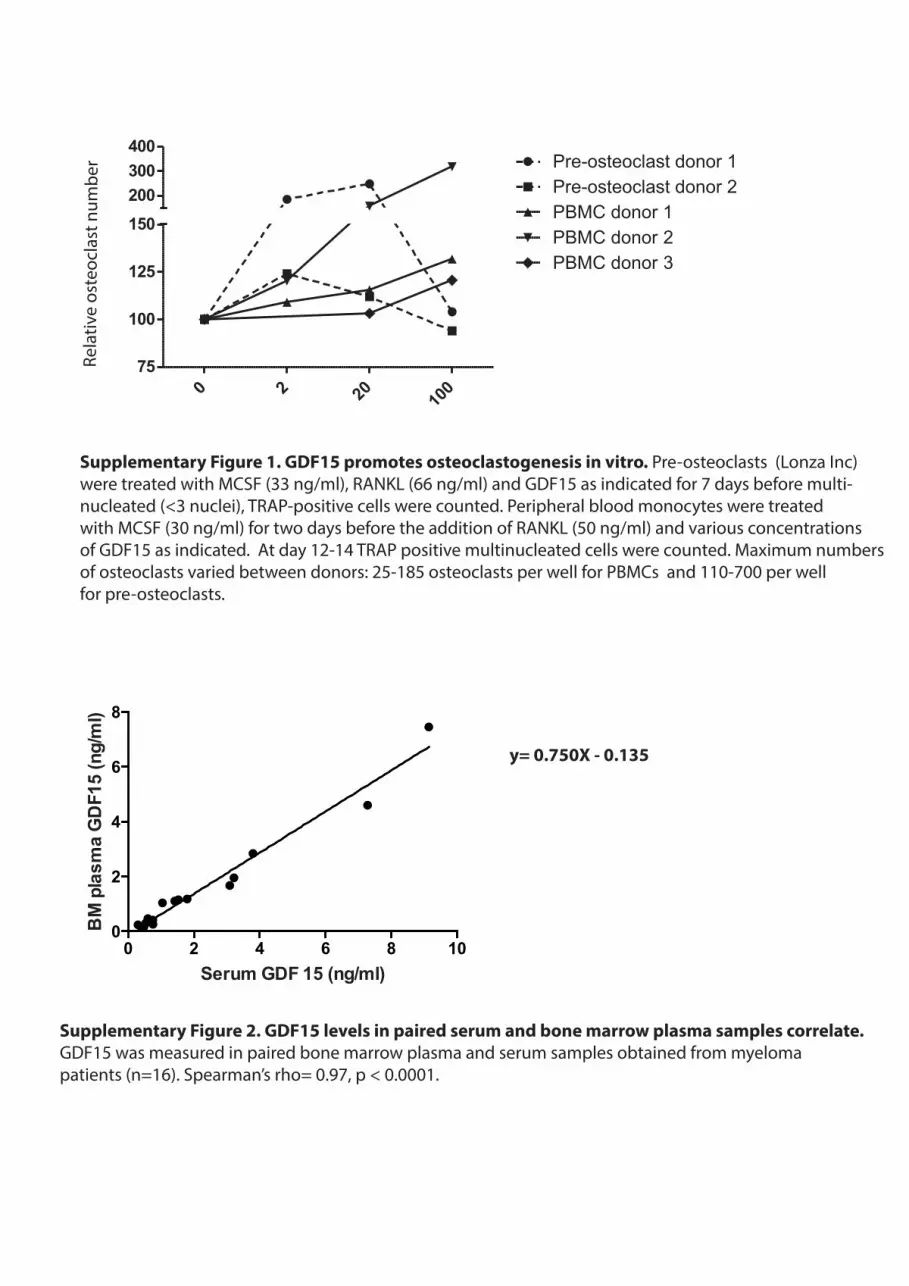
myeloma patients was 1.08 ng/ml (Figure 1A). To compare levels of GDF15 in bone marrow
plasma with levels in blood serum we measured GDF15 by the multiplex assay (Millipore) in
a set of paired bone-marrow plasma and serum samples obtained from myeloma patients
(n=16) (Supplementary Figure 2). In accordance with previously published data 5, there was a
strong correlation between bone marrow plasma levels and serum levels (Spearman’s rho = 0.
97, p< 0.0001), which implies that levels of GDF15 in serum reflect levels of GDF15 in bone
marrow (BM). In our set of samples levels in bone marrow plasma appeared approximately
25 % lower than levels in serum (Supplementary Figure 2). However, this was not observed
in a previous study. 5 Unprocessed GDF15 is stored in extracellular matrix13, and might be
activated/released locally. Hence, future studies should address the relationship between
circulating levels of GDF15 and levels locally in the bone marrow, and whether GDF15 in
concentrations found locally in myeloma bone marrow influence bone homeostasis in vivo.
Importantly, levels of GDF15 in bone marrow plasma from myeloma patients were elevated
compared with levels in bone marrow plasma from healthy persons,5 suggesting that cells in
myeloma bone marrow are exposed to higher concentrations of GDF15 than cells in a healthy
bone marrow.
In conclusion, serum GDF15 is elevated in myeloma patients with advanced osteolytic bone
disease compared to patients with no lesions, and correlates with serum markers for osteoclast
activity. We found GDF15 to increase osteoclast differentiation and at the same time inhibit
osteoblast differentiation in vitro. Hence, GDF15 might play a role in uncoupling bone
formation and resorption in multiple myeloma. Our results presented here and recent reports
by others 4, 5 suggest that GDF15 may be of interest as a target for treatment of multiple
myeloma.

7
Conflicts of interest
The authors declare no conflicts of interests.
Author contributions
Study design: TS, AW, PG, IT, AKM. Study conduct and data collection: MW, SHM, TH,
LH, OEO. Data analysis: TS, MW, LH, TH. Data interpretation: TS, MW, SHM, LH, AKM,
AS. Drafting manuscript: TS and MW. All authors contributed in revising the manuscript and
approved the final version of manuscript.
Acknowledgement
We thank Berit Størdal for excellent technical assistance. The work was supported by the
Norwegian Cancer Society (project ID 450930), the K.G. Jebsen Foundation and the Cancer
Foundation at St Olavs Hospital.

8
References
1. Yaccoby S. Advances in the understanding of myeloma bone disease and tumour growth. Br J Haematol. 2010;149(3):311-321. 2. Unsicker K, Spittau B, Krieglstein K. The multiple facets of the TGF-beta family cytokine growth/differentiation factor-15/macrophage inhibitory cytokine-1. Cytokine Growth Factor Rev. 2013;24(4):373-384. 3. Corre J, Mahtouk K, Attal M, et al. Bone marrow mesenchymal stem cells are abnormal in multiple myeloma. Leukemia. 2007;21(5):1079-1088. 4. Tanno T, Lim Y, Wang Q, et al. Growth differentiating factor 15 enhances the tumor-initiating and self-renewal potential of multiple myeloma cells. Blood. 2014;123(5):725-733. 5. Corre J, Labat E, Espagnolle N, et al. Bioactivity and prognostic significance of growth differentiation factor GDF15 secreted by bone marrow mesenchymal stem cells in multiple myeloma. Cancer Res. 2012;72(6):1395-1406. 6. Hinoi E, Ochi H, Takarada T, et al. Positive regulation of osteoclastic differentiation by growth differentiation factor 15 upregulated in osteocytic cells under hypoxia. J Bone Miner Res. 2012;27(4):938-949. 7. Wakchoure S, Swain TM, Hentunen TA, et al. Expression of macrophage inhibitory cytokine-1 in prostate cancer bone metastases induces osteoclast activation and weight loss. Prostate. 2009;69(6):652-661. 8. Vanhara P, Lincova E, Kozubik A, Jurdic P, Soucek K, Smarda J. Growth/differentiation factor-15 inhibits differentiation into osteoclasts--a novel factor involved in control of osteoclast differentiation. Differentiation. 2009;78(4):213-222. 9. Olsen OE, Wader KF, Misund K, et al. Bone morphogenetic protein-9 suppresses growth of myeloma cells by signaling through ALK2 but is inhibited by endoglin. Blood Cancer J. 2014;4:e196. 10. Gimsing P, Carlson K, Turesson I, et al. Effect of pamidronate 30 mg versus 90 mg on physical function in patients with newly diagnosed multiple myeloma (Nordic Myeloma Study Group): a double-blind, randomised controlled trial. Lancet Oncol. 2010;11(10):973-982. 11. Mylin AK, Abildgaard N, Johansen JS, et al. Serum YKL-40: a new independent prognostic marker for skeletal complications in patients with multiple myeloma. Leuk Lymphoma. 2015;1-10. [Epub ahead of print] 12. Standal T, Abildgaard N, Fagerli UM, et al. HGF inhibits BMP-induced osteoblastogenesis: possible implications for the bone disease of multiple myeloma. Blood. 2007;109(7):3024-3030. 13. Bauskin AR, Brown DA, Junankar S, et al. The propeptide mediates formation of stromal stores of PROMIC-1: role in determining prostate cancer outcome. Cancer Res. 2005;65(6):2330-2336.

9
Figure legends
Figure 1
GDF15 serum levels in myeloma patients at time of diagnosis are higher in patients with
osteolytic lesions. (a) GDF15 was measured in serum samples from MM patients (n=138) and
healthy controls (n=58). Differences between groups were analyzed by Kruskal-Wallis test
and bars indicate median values. (b) Bone disease status at inclusion was available for 132 of
the myeloma patients, and the patients were divided into groups based on degree of bone
destruction: limited ≤3 osteolytic lesions (n=51), advanced >3 osteolytic lesions (n=51) and
diffuse osteoporosis, without lesions (n=14). Serum GDF15 levels in these groups were
compared with serum GDF15 levels in patients without bone disease (n=16) using Dunn’s
multiple comparison test. Bars indicate median values. (c) Kaplan-Meier plot of the
appearance of SRE in myeloma patients with serum GDF15 ≤ 1.08 ng/ml or GDF15 > 1.08
ng/ml. (d) Kaplan-Meier plot of survival in myeloma patients with serum GDF15 ≤ 1.08
ng/ml or GDF15 > 1.08 ng/ml.
Figure 2
GDF15 promotes osteoclastogenesis and inhibits osteoblastogenesis in vitro. (a) Peripheral
blood monocytes were treated with M-CSF (30 ng/ml) and left to differentiate in the presence
of RANKL (50 ng/ml) with or without OPG (200 ng/ml) and various concentrations of
GDF15 as indicated. At day 14 TRAP positive multinucleated cells were counted. Error bars
= SEM of triplicate wells. The data shows one representative experiment out of 3. (b)
Representative images of TRAP stained osteoclasts. (c) Alkaline phosphatase (ALP)

10
activity/ug DNA was determined in human bone marrow-derived mesenchymal stem cells
(hMSC) differentiated in osteogenic medium containing L-ascorbic acid (50mM),
dexamethasone (10-8M) and β-glycerophosphate (10 mM) for 7 days. Error bars = SEM of
triplicates. (d) hMSC were differentiatied for 17 days in osteogenic media and stained with
Alizarin Red-S (ARS) to quantify degree of mineralization. Error bars = SEM of duplicates.
(e) mRNA expression of RUNX2, (f) COL1A1 and (h) BGLAP in hMSC at day 7 post
differentiation. Bars represent mean of triplicates, error bars represent maximal relative
quantity. The data shows one representative experiment out of 3.


0 0.5 5 50 100
0
1
2
3
GDF15 (ng/ml)
RQ
RU
NX2
0 0.5 5 50 100
0
5
10
15
GDF15 (ng/ml)
RQ
CO
L1A
0
20
40
60
80
100
0 2 20 50 100
# os
teoc
last
s
- OPG+ OPG
GDF15 (ng/ml)0 5 10 20 50 10
00
2000
4000
6000
8000
ALP
act
ivity
/ug
DN
A
GDF15 (ng/ml)
0 5 10 20 50 100
0.00
0.05
0.10
0.15
0.20
GDF15 (ng/ml)
AR
S (u
M)
0 ng/ml
100 ng/ml
GDF15
GDF15
A B C
D E F
Figure 2
0 0.5 5 50 100
0.0
0.5
1.0
1.5
GDF15 (ng/ml)
RQ
BG
LAP
G
0 2 20 100
75
100
125
150200300400
Pre-osteoclast donor 1Pre-osteoclast donor 2PBMC donor 1PBMC donor 2PBMC donor 3
Rela
tive
oste
ocla
st n
umbe
r
Supplementary Figure 1. GDF15 promotes osteoclastogenesis in vitro. Pre-osteoclasts (Lonza Inc) were treated with MCSF (33 ng/ml), RANKL (66 ng/ml) and GDF15 as indicated for 7 days before multi-nucleated (<3 nuclei), TRAP-positive cells were counted. Peripheral blood monocytes were treated with MCSF (30 ng/ml) for two days before the addition of RANKL (50 ng/ml) and various concentrations of GDF15 as indicated. At day 12-14 TRAP positive multinucleated cells were counted. Maximum numbers of osteoclasts varied between donors: 25-185 osteoclasts per well for PBMCs and 110-700 per wellfor pre-osteoclasts.
0 2 4 6 8 100
2
4
6
8
Serum GDF 15 (ng/ml)
BM
pla
sma
GD
F15
(ng/
ml)
y= 0.750X - 0.135
Supplementary Figure 2. GDF15 levels in paired serum and bone marrow plasma samples correlate.GDF15 was measured in paired bone marrow plasma and serum samples obtained from myelomapatients (n=16). Spearman’s rho= 0.97, p < 0.0001.

Supplementary results, materials and methods Serum analyses In addition to GDF15, we measured 20 other cytokines in these samples. Briefly, of the 21 factors analyzed (GDF15, Nrp1, HGF, Leptin, Il1b, IL5, IL6, IL17, Eotaxin, GCSF, IP10, MCP1, MIP1a, MIPb, VEGF, GMCSF, BMP9, Follistatin, Dkk1, OPG and Endoglin) 12 cytokines were differently expressed between controls and patients: HGF, IL1b, 1L5, IL6, Eotaxin, GCSF, MCP1, MIP1a, BMP9, Follistatin, GDF15, OPG (Independent samples Kruskal-Wallis test, p< 0.002 was considered significant due to adjustment for multiple comparisons p 0.05/21= 0,002). We then examined whether there were differences in levels of these 12 cytokines when the patients were categorized according to degree of bone disease. Of the 12, 3 cytokines differed between the different bone status groups: HGF, BMP9 and GDF15. BMP9 levels were higher in the group of patients with limited bone disease compared with the group without bone disease, but there was no significance difference between the group with advanced bone disease compared with the ones without bone disease. The data on BMP9 (and Endoglin) has been previously published. (1) HGF was significantly higher in the group with advanced bone disease compared with the ones without bone disease, and significantly different between the group with osteopenia and the group without bone disease. (Table1). GDF15 results are presented in the main text. Table 1. Median values of HGF and BMP9 in patients grouped according to skeletal disease. * p<0.05, ** p< 0.01 as compared with ”no lesion” group, Dunn’s multiple comparisons test.
No lesions Limited Advanced Osteoporosis HGF 362 pg/ml 637 pg/ml 816 pg/ml * 867 pg/ml *
BMP9 127 pg/ml 234 pg/ml ** 161 pg/ml 237 pg/ml

Patient samples Patient serum samples were collected for the Nordic Myeloma Study Group during a randomized phase 3 clinical trial on pamidronate dosage in the years 2001–2005. Serum samples obtained at diagnosis were available from 138 patients, and these samples were included in the analyses. At inclusions the patients were defined as having skeletal disease according to the following criteria: advanced osteolytic bone disease (> 3 osteolytic lesions, n= 51), limited bone disease (≤ 3 osteolytic lesions, n=51), osteoporosis but no lesions (n=14) and no bone disease (n=16). Skeletal related events (SRE) were evaluated every third month and were defined as pathological fractures, radiotherapy or surgery to bone, new vertebral compression, symptomatic new or progressive osteolytic lesions and hypercalcemia. (2, 3). Of the 138 patients, skeletal status was available at diagnosis for 132 patients. For comparison, serum was collected from 58 age- and gender-matched healthy volunteers. To examine levels of GDF15 in bone marrow versus blood serum, paired serum and bone marrow plasma samples (n=16) were obtained from the Norwegian Myeloma Biobank, St. Olavs Hospital, Trondheim.
Serum assays GDF15, OPG and DKK1 were measured using a multiplex assay (The MILLIPLEX MAP Human Cancer/Metastasis Biomarker Panel 1, HCMBMAG-22K, Millipore Corporation, Billerica, MA, USA). BMP-9, Endoglin and Follistatin by MILLIPLEX MAP Human Angiogenesis/Growth Factor Magnetic Bead Panel - Cancer Multiplex Assay, Millipore). IL-1b, IL-5 IL-6, IL-17, IP-10, MCP-1, MIP-1a, MIP-1b, Eotaxin, G-CSF, GM-CSF, HGF, Leptin and VEGF were measured by a customized Bio-Plex Pro Assay, Bio-Rad. NRP1 were measured by ELISA (R&D, Minneapolis, MN, USA and Uscn Life Science Inc, Houston, TX, USA). Markers for osteoclast activity (CTX1 and ICTP) and markers for osteoblast activity (bALP and PINP) were analyzed as previously described (3).
Recombinant proteins MCSF, RANKL, OPG and GDF15 were obtained from R& D Systems (Minneapolis, MN, USA). All recombinant proteins were reconstituted and stored according to the manufacturer’s instructions. In particular, GDF15 was reconstituted in 4mM HCL with 0.1% BSA, aliquoted and stored at -80⁰C until used. Osteoclast differentiation Isolation of PBMC from buffy coats obtained from the Blood bank, St. Olavs Hospital, Trondheim, was performed with density gradient (LymphoprepTM, Axis-Shield PoC, Oslo, Norway). The mononuclear cells were incubated for 1 hour before non -adherent cells were washed away (3x) using Hanks Buffered Salt Solution (HBSS, Sigma-Aldrich, St Louis, MO). Isolated monocytes (n=3 donors) were seeded 1x10⁵ cells/ml and cultured in αMEM (without phenol red) with human serum (20%) and M-CSF (30 ng/ml) for two days. At that point RANKL (50 ng/ml), OPG (200 ng/ml) and GDF15 (5-200 ng/ml) were added (all R&D Systems). Medium was renewed every 4-5 days. Human pre-osteoclast precursors purchased from Lonza (n=2, Lonza Inc, Walkersville, MD, USA) and cultured according to the

manufacturer’s instructions. To induce differentiation, M-CSF (33ng/ml) and RANKL (66ng/ml) with/without OPG (200ng/ml) and GDF15 (0.5 -100 ng/ml ) were added. Medium was renewed after 3 days.
Osteoblast differentiation
Human mesenchymal stem cells (n=4, Lot numbers 0000318006, 0000307219, 0000351482 and 000374385) were purchased from Lonza and cultured in MSC growth medium (MSCGM, Lonza) and cultured at 37°C with 5% CO2. MSC were used before reaching passage 6 and were subcultivated at 80 % confluence. For differentiation towards osteoblasts, MSC were cultured in MSCGM containing ascorbic acid (50 uM), dexamethasone (10-8M) and β-glycerol phosphate (10 mM). The osteogenic medium was changed every 4-5 days, and the cells were differentiated for up to 17 days as indicated in the figure legends. ALP assay Alkaline phosphatase (ALP) activity was quantified by ELF 97 Endogenous Phosphatase Detection Kit (Molecular Probes, Eugene, OR) as previously described (4) Briefly, MSCs were seeded at 3000 cells/well in 96-well plates, cultured for 7 days as indicated before fixation in 4% para-formaldehyde for 10 minutes at room temperature. To permeabilize the cells, 200 µL/well of phosphate-buffered saline (PBS)/0.2% Tween-20 was added and the plates were incubated for 15 minutes. The cells were briefly rinsed twice in water, and then left for 10 minutes in H2O. Substrate was diluted 1:20 in substrate buffer, 50 µL/well, and incubated for 5 minutes. Then, fluorescence was detected using a multilabel counter (Viktor 1420; Perkin Elmer, Wellesley, MA) with excitation filter at 355 nm and emission filter at 535 nm. To adjust for differences in cell number, cells were subsequently lysed in 100 µL 10% SDS and DNA were quantified using SybrGreen (Molecular Probes). All samples were run in triplicates. Alizarin Red staining hMSCs were seeded at 9 000 cells/well in 24-well plates and cultured for 17 days. Media were renewed every 3 to 4 days. Cultures were terminated by fixing cells in 3-4 % para-formaldehyde for 10 minutes on ice. Fixed cultures were rinsed with PBS and then with water, thereafter stained with 500 µL/well 40 mM Alizarin Red-S (ARS; Sigma-Aldrich) at pH 4.2 and room temperature with gentle agitation. Cells were then washed 5 times with water followed by a 15-minute rinse with PBS under gentle rotation. Stained cultures were photographed, then destained by incubating in 10% (wt/vol) cetylpyridinium chloride (CPC) in 10 mM sodium phosphate buffer pH 7.0 for 1 hour at room temperature. ARS concentration in these extracts was determined by absorbance at 562 nm. A standard curve was obtained by diluting ARS in CPC. TRAP staining

TRAP staining was performed using the Tartrate-Resistant Acid Phosphatase, Leukocyte (TRAP) Kit (Sigma-Aldrich) according to the manufactures instructions, with the following modifications: Cells were fixed using glutaraldehyde (2.5%) and the samples were incubated in the staining solution for 2 hours for PBMC derived osteoclasts, and 1 hours for pre-osteoclasts. TRAP positive multinuclear cells with ≥3 nuclei were counted as osteoclasts. All samples were run in triplicates. PCR For RNA isolation the High Pure Isolation Kit (Roche Applied Science, Indianapolis, IN) was used. Samples were frozen at -80°C until used. For determination of RNA concentration and RNA quality the NanoDrop Spectrophotometer (ND-1000 Spectrophotometer, NanoDrop Technologies Inc.) was employed. For cDNA synthesis the High Capacity RNA-to-cDNA Kit (Applied Biosystems) was utilized. RT-PCR analysis was performed using TaqMan Gene Expression Array (Applied Biosystems). The comparative Ct method was used to estimate relative changes in gene expression using GAPDH as housekeeping gene. The following primers were used RUNX2 (Hs00231692_m1, lot 959159), BGLAP (Hs01587814_g1, lot 969519) COL1A1 (Hs 00164004_m1, lot 963537). The housekeeping gene glyceraldehydes-3-phosphate dehydrogenase (GAPDH, Hs99999905_m1, lot 853053) was used as an endogenous control. Genes with a Ct value ≥35 were considered as not detected. The Applied Step One Software 2.1 was used to analyze the samples. Statistics Statistical analyses were performed with the SPSSX/PC computer program (SPSS, Chicago, IL, USA) or Prism version 6.0d (GraphPad Software, La Jolla, CA, USA). Independent samples Kruskal-Wallis test were performed to identify cytokines differently expressed between patients and controls. For this analysis, due to multiple comparisons, results were considered statistically significant when p < .002. Cytokines that were differently expressed between the two groups were further tested to find out whether they varied according to skeletal status. Kruskal-Wallis test followed by Dunn’s multiple comparison test was used to test for significant differences in cytokine levels between the different skeletal disease groups. Spearman’s test was used to test for correlations and Kaplan-Meier analyses followed by log-rank tests was used to test for differences in time to SRE or overall survival.
References 1. Olsen OE, Wader KF, Misund K, Vatsveen TK, Ro TB, Mylin AK, et al. Bone morphogenetic protein-9 suppresses growth of myeloma cells by signaling through ALK2 but is inhibited by endoglin. Blood cancer journal. 2014;4:e196. 2. Gimsing P, Carlson K, Turesson I, Fayers P, Waage A, Vangsted A, et al. Effect of pamidronate 30 mg versus 90 mg on physical function in patients with newly diagnosed multiple myeloma (Nordic Myeloma Study Group): a double-blind, randomised controlled trial. The Lancet Oncology. 2010 Oct;11(10):973-82. 3. Mylin AK, Abildgaard N, Johansen JS, Heickendorff L, Kreiner S, Waage A, et al. Serum YKL-40: a new independent prognostic marker for skeletal complications in patients with multiple myeloma. Leukemia & lymphoma. 2015 Feb 11:1-10.

4. Standal T, Abildgaard N, Fagerli UM, Stordal B, Hjertner O, Borset M, et al. HGF inhibits BMP-induced osteoblastogenesis: possible implications for the bone disease of multiple myeloma. Blood. 2007;109(7):3024-30.


![Medicarpin, a legume phytoalexin, stimulates osteoblast differentiation and promotes peak bone mass achievement in rats: evidence for estrogen receptor [beta]- …](https://img.pdfslide.net/doc/110x75/63292a3c6385b652af04cf12/medicarpin-a-legume-phytoalexin-stimulates-osteoblast-differentiation-and-promotes-1679722339.jpg)


