Embed Size (px)
Citation preview

GENE EXPRESSION AND MICRO
RNA PROFILING IN ACUTE
PANCREATITIS
by
Miss Kiran Altaf
(MBBS, MRCS)
A thesis submitted to the
University of Liverpool for the degree of DOCTOR OF
PHILOSOPHY
June 2018

1 | P a g e
Abstract
Introduction
Prognostication in Acute pancreatitis (AP) remains a challenging issue. This study aimed to
measure gene expression of the peripheral blood in patients with acute pancreatitis and
identify an expression signature that would accurately stratify patients into either mild or
severe disease groups. MicroRNAs (miRNAs) are small non-coding RNAs that regulate gene
expression and play important roles in a variety of cellular functions. These have emerged as
major potential biomarkers in a variety of sepsis related disorders and cancers. Alongside,
gene expression profiling, the prognostic potential of micro RNA at the time of admission in
context of acute pancreatitis was also explored.
Methods
This observational study was conducted at Royal Liverpool University Hospital, NHS
Foundation Trust, in collaboration with University Hospital Aintree, NHS Foundation Trust.
For gene expression profiling, Affymetrix HGU133 Plus 2.0 microarrays were utilised. Total
RNA extracted from whole blood samples of patients collected at the time of admission was
included. A pilot study was conducted in the first instance to enable sample size calculations.
Analysis was performed using Partek Genomics Suite software. Expression level data were
quantile normalised and ANOVA was used with batch hybridization effects.
For microRNA analysis, a similar pilot study was undertaken to estimate sample size. Total
RNA was extracted from plasma samples of patients obtained at the time of admission. RNA
were hybridised to GeneChipTM miRNA 2.0 arrays. Analysis was performed using
appropriate packages in R/Bioconductor and using Partek Genomics Suite software.

2 | P a g e
Expression level data were invariant set normalized. Differential expression of miRNAs in
severe compared to mild pancreatitis was detected using ANOVA with batch hybridization
effects removed. Severity was defined in line with Atlanta criteria for both the parts of the
study.
Results
58 patients were included (23 severe, 35 mild). After adjusting for batch effects, setting
power at 80%, fold change at 1.5 and significance at 0.05, 98 genes were identified that were
differentially expressed between mild and severe disease. More specifically, 49 genes were
up-regulated in severe form and 49 were down-regulated when compared to the mild disease.
Canonical pathway analysis revealed signalling in T cells and lymphocytes to be the most
significant pathway involved in the process. These were specifically down-regulated in
severe form of the disease. While a lot of processes associated with the cellular immune
response were down-regulated in severe pancreatitis, the innate response didn’t change and
the humoral response might be stimulated. Nuclear Factor of Activated T cells (NFAT) was
noted to be the most significantly implicated gene in the dataset, being a key molecule
implicated in at least 12 different pathways.
Nineteen patients were included (severe 9, mild 10) for the miRNA profiling. Keeping the
FDR p <0.05, 45 micro RNA were found to be differentially expressed between mild and
severe pancreatitis. Out of these, only 23 were annotated in IPA – 22 were novel discoveries.
Interestingly, 19 small nucleolar RNA (snoRNAs) were identified to be differentially
expressed between the two groups.

3 | P a g e
Conclusions
Understanding more about the pathophysiology and genomic regulation in acute pancreatitis
will provide us with potential prognostic biomarkers and targets for therapy. This study has
selected a series of gene expression features which could act as biomarkers to accurately
stratify patients into mild and severe groups. Appropriate therapy can then be chosen earlier
to improve outcomes in the disease. MiRNA and snoRNA can predict severity of acute
pancreatitis at the time of admission. These can also be developed to predict specific
complications of the disease, including organ failure and pancreatic necrosis, as early as, at
the time of admission. Once developed, this could fill in the gap that currently exists in
prognostication arena in acute pancreatitis.

4 | P a g e
Acknowledgements
This thesis is truly a team effort and the list of people who have contributed to it, through
their valuable time and efforts, grows by the day.
Liverpool NIHR Pancreas Biomedical Research Unit (PBRU) revolutionised my journey into
the unknown world of transcriptomics, for which, I will forever be grateful. Jane, Brian and
Lucille held my hand and taught me the complexities of human research and mind boggling
microarray analyses. All the members of the unit worked round the clock to ensure we
captured all the precious patient samples that would go on to form basis of so many
wonderfully successful projects which have put PBRU right in the centre of the envy of all
the world renowned pancreatic centres.
I am indebted to Professor Robert Sutton for inspiring me along the way. I was not sure if
research was for me in the beginning. He truly has taught me by example. His constant
encouragement has seen me through some really difficult times, something I will always be
obliged for. I definitely look up to him for all my academic and clinical aspirations.
I think behind every successful woman are two men – in my case, it is my father – who
dreamt a lot bigger for me than I could possibly have for myself. If there is one thing I want
from my life, it is to make him very proud of me. My husband is the next in line; who made
my dreams his own, my aspirations his objective and my struggle his passion. I would truly
be lost without him.
Finally, I would like to dedicate this work to my mother, without whose prayers and good
wishes, I would be nothing. Whatever I have achieved or hope to in future, it’s all because of
her. She continues to be my number one fan and I hope to never let her down.

5 | P a g e
Outputs
This project has led to following papers, abstracts and presentations.
1. Prediction of the severity of acute pancreatitis on admission by carboxypeptidase-B
activation peptide: A Systematic review and meta-analysis
Clinical Biochemistry 2015 Jul;48(10-11):740-6
Deng L, Wang L, Yong F, Xiong J, Jin T, De La Iglesia-Garcia D, Bharucha
S, Altaf K, Huang W, Xia Q.
2. Prediction of the severity of acute pancreatitis on admission by urinary trypsinogen
activation peptide: a meta-analysis
World Journal of Gastroenterology 2013 Jul 28;19(28):4607-15.
Wei Huang, Kiran Altaf, Tao Jin, Jun-Jie Xiong, Li Wen, Muhammad A. Javed, Ping Xue,
Christopher M. Halloran, Qing Xia
3. Meta-Analysis of the Role of C-Reactive Protein in Predicting Severity of Acute
Pancreatitis
Pancreas Volume 41, Number 8, November 2012
T. Jin, K. Altaf, JJ Xiong, MA Javed, W Huang, R Sutton, Q Xia
4. Urinary Trypsinogen Activation Peptide (TAP) and Carboxypeptidase B Activation
Peptide (CABAP) in Severity Stratification of Acute Pancreatitis: a Meta-analysis
Pancreas Volume 41, Number 8, November 2012
T. Jin, K. Altaf, J.J. Xiong, L. Wen, M.A. Javed, X.N. Yang, P. Xue, W. Huang, R. Sutton,
Q. Xia
5. Gene Expression profiling in acute pancreatitis
Pancreas Volume 42, Number 8, November 2013
K. Altaf, B. Lane, L. Rainbow, C. Halloran, W. Greenhalf, R. Sutton

6 | P a g e
6. Micro RNA profiling in acute pancreatitis
Pancreas Volume 42, Number 8, November 2013
K. Altaf, B. Lane, L. Rainbow, C. Halloran, W. Greenhalf, R. Sutton
7. Gene expression profiling in acute pancreatitis. American Pancreatic Association
(APA) Annual Conference. November 2013. Poster Presentation
8. Micro RNA profiling in acute pancreatitis. American Pancreatic Association (APA)
Annual Conference. November 2013. Poster Presentation
9. Gene expression profiling in acute pancreatitis. Pancreatic society of Great Britain and
Ireland (PSGBI) annual conference. December 2013. Oral Presentation
10. Micro RNA profiling in acute pancreatitis. Pancreatic society of Great Britain and
Ireland (PSGBI) annual conference. December 2013. Poster Presentation
11. Trypsinogen activation peptide and Carboxypeptidase B activation peptide in
severity stratification in Acute Pancreatitis – A meta-analysis. American Pancreatic
Association (APA) Annual Conference. November 2012. Poster Presentation
12. Meta-Analysis of the Role of C-Reactive Protein in Predicting Severity of Acute
Pancreatitis. American Pancreatic Association (APA) Annual Conference. November
2012. Poster Presentation

7 | P a g e

8 | P a g e
Table of Contents
CHAPTER 1: ACUTE PANCREATITIS – CLINICAL COURSE AND COMPLICATIONS ................................ 22
1.1 Pancreas as a gland .................................................................................................................... 23
1.2 Acute pancreatitis – an overview .................................................................................................. 24
1.2.1 Classification ........................................................................................................................ 25
1.2.2 Aetiology .............................................................................................................................. 26
1.2.3 Clinical course ...................................................................................................................... 28
1.2.4 Complications associated with the severe disease ................................................................ 29
1.2.5 Mortality in acute pancreatitis ........................................................................................... 32
1.2.6 Available treatment modalities .......................................................................................... 32
CHAPTER 2: WHAT HAPPENS IN ACUTE PANCREATITIS - COMPLEX PATHOGENESIS SURROUNDING
THE DISEASE ......................................................................................................................................... 37
2.1 The Trypsin Centred Theory ....................................................................................................... 38
2.2 Inflammatory versus anti-inflammatory response in Acute Pancreatitis ................................ 39
2.3 Inflammatory Role of Acinar Cells ............................................................................................. 40
2.4 Calcium Signalling ....................................................................................................................... 41
2.5 Acute Pancreatitis as a model of sepsis .................................................................................... 42
2.6 Oxidative Stress in Acute Pancreatitis ....................................................................................... 44
CHAPTER 3: PROGNOSTICATION IN ACUTE PANCREATITIS ................................................................ 46
3.1 Significance of severity stratification in acute pancreatitis ...................................................... 47
3.2 An ideal biomarker does not exist ............................................................................................. 47
3.3 Current scoring methods............................................................................................................ 48
3.3.1 Scoring systems ................................................................................................................... 48
3.3.2 Organ failure scores ............................................................................................................ 49
3.3.3 Radiology scores .................................................................................................................. 49
3.3.4 Biochemical parameters ..................................................................................................... 50
CHAPTER 4: GENE EXPRESSION AND MICRO RNA PROFILING ............................................................ 53
4.1 Circulatory blood (peripheral) gene expression profiling ......................................................... 53
4.1.1 Peripheral blood gene expression profiling in acute pancreatitis ..................................... 56
4.1.2 Gene expression Microarrays ............................................................................................. 57
4.2 MicroRNA Profiling ..................................................................................................................... 57
4.2.1 MicroRNA profiling in sepsis and acute pancreatitis ......................................................... 58
4.3 Messenger RNA and Micro RNA interaction ............................................................................. 59
CHAPTER 5: HYPOTHESIS AND AIMS ................................................................................................... 61

9 | P a g e
5.1 Hypothesis .................................................................................................................................. 62
5.1.1 Aims ..................................................................................................................................... 62
5.1.2 Objectives ............................................................................................................................ 62
CHAPTER 6: LIVERPOOL PANCREAS RESEARCH UNIT ACUTE PANCREATITIS BIOBANK, DATABASE,
SAMPLE COLLECTION AND CLINICAL DATA ......................................................................................... 64
6.1 Sample collection ....................................................................................................................... 67
6.2 Clinical Data ................................................................................................................................ 69
6.2.1 Definitions of organ failure ................................................................................................. 71
6.2.2 Definition of Outcome/Severity Assessment ..................................................................... 72
6.3 Classifications of severity of acute pancreatitis ........................................................................ 74
6.4 Clinical Data ................................................................................................................................ 75
CHAPTER 7: GENE EXPRESSION PROFILING ......................................................................................... 82
7.1 Sample preparation – the RNA extraction ................................................................................ 83
7.2 Quality control Assessments ...................................................................................................... 85
7.2.1 Qualitative assessment of RNA samples using Agilent 2100 Bioanalyzer ......................... 86
7.3 Protocol A – 3’ IVT Express protocol .......................................................................................... 87
7.3.1 Step 1 – Preparation of Poly-A RNA control mixture ......................................................... 88
7.3.2 Step 2 – 1st strand cDNA synthesis (using reverse transcription) ...................................... 89
7.3.3 Step 3 – 2nd strand cDNA synthesis ..................................................................................... 90
7.3.4 Step 4 – synthesis of labelled aRNA (using In Vitro Transcription IVT) ............................. 90
7.3.5 Step 5 – Purification of aRNA .............................................................................................. 90
7.3.6 Step 6 – Analysis of aRNA size ............................................................................................ 91
7.4 Protocol B – Ovation whole blood protocol .............................................................................. 91
7.4.1 Step 1 – Preparation of Poly-A RNA control mixture ......................................................... 93
7.4.2 Step 2 - 1st strand cDNA synthesis ...................................................................................... 93
7.4.3 Step 3 - 2nd strand cDNA synthesis ..................................................................................... 94
7.4.4 Step 4 - SPIA® Amplification ............................................................................................... 94
7.4.5 Step 5 - Purification of amplified cDNA .............................................................................. 94
7.4.6 Step 6 – Fragmentation of amplified cDNA ........................................................................ 95
7.4.7 Step 7 - Biotin Labelling ...................................................................................................... 96
7.4.8 Step 8 - Hybridization .......................................................................................................... 96
7.4.9 Step 9 - Washing, staining and scanning ............................................................................ 97
7.5 Statistics ...................................................................................................................................... 98
7.6 Optimisation and selection of protocol and pilot study ........................................................... 99

10 | P a g e
7.6.1 Globin mitigation protocols .............................................................................................. 100
7.6.2 cRNA versus cDNA targets ................................................................................................ 102
7.6.3 The Ovation Whole blood protocol .................................................................................. 103
7.7 Quantitative and Qualitative Analyses .................................................................................... 105
7.8 Data Analysis ............................................................................................................................ 108
7.9 Qualitative Assessments of the sample preparation and processing .................................... 118
7.9.1 Qualitative and Quantitative Analyses after the RNA extractions.................................. 119
7.9.2 Qualitative and Quantitative Analyses after amplification of cDNA .................................. 126
7.9.3 Qualitative and Quantitative Analyses after fragmentation of cDNA ................................ 130
7.10 Quality Control metrics for Hybridization ............................................................................. 133
7.11 Qualitative Analyses............................................................................................................... 137
7.12 Principle Component Analysis ............................................................................................... 141
7.13 Hierarchical Clustering ........................................................................................................... 144
7.14 Overall gene expression differences between severe and mild acute pancreatitis ............ 145
CHAPTER 8: MICRO RNA PROFILING .................................................................................................. 156
8.1 Samples Used ........................................................................................................................... 157
8.2 Total RNA extraction from Plasma samples ............................................................................ 157
8.2.1 Prior to extraction ............................................................................................................. 157
8.2.2 Procedure of RNA extraction ............................................................................................ 158
8.3 Quantification of extracted RNA ............................................................................................. 160
8.4 Poly A tailing and ligation ........................................................................................................ 160
8.4.1 Poly (A) Tailing ................................................................................................................... 162
8.4.2 FlashTag Biotin HSR Ligation ............................................................................................. 163
8.5 Affymetrix GeneChip miRNA Array Procedure ....................................................................... 163
8.5.1 Hybridization ..................................................................................................................... 163
8.5.2 Washing and Staining ........................................................................................................ 164
8.5.3 Scanning ............................................................................................................................. 166
8.6 Analysis ..................................................................................................................................... 166
8.7 Quantitative Assessments ....................................................................................................... 167
8.8 Principle Component Analysis ................................................................................................. 171
8.9 Hierarchical Clustering and differentially expressed miRNA ...................................................... 172
CHAPTER 9: DISCUSSION .................................................................................................................... 178
9.1 Biomarker Research in Acute Pancreatitis .............................................................................. 180
9.2 T Cell Signalling and Role of Adaptive Immunity In Acute Pancreatitis ................................. 183

11 | P a g e
9.3 Nuclear Factor of Activated T Cells (NFAT) as the Key Player in Determining Severity in Acute
Pancreatitis ..................................................................................................................................... 184
9.4 MicroRNA and SnoRNA as potential Biomarkers in Acute Pancreatitis ................................. 190
CONCLUDING REMARKS ..................................................................................................................... 194
REFERENCES ........................................................................................................................................ 198
APPENDICES ........................................................................................................................................ 218

12 | P a g e
Table of Figures
Figure 1.1 – Pathological conditions affecting pancreas
Figure1. 2 - Conditions leading to acute pancreatitis
Figure 1.3 - Clinical course of Acute Pancreatitis
Figure 1.4 - Course of severe acute pancreatitis – (adopted with permission)
Figure 1.5 - Complications of Acute Pancreatitis
Figure 7.1 - 3’ In vitro Transcription protocol (Adapted with permission)
Figure 7.2 - Ribo-SPIATM 3’ RNA Amplification Protocol (Adapted with permission)
Figure 7.3 - Normal amplified RNA trace
Figure 7.4 - Bioanalyzer traces of the Total RNA prior to Amplification
Figure 7.5 - Quality control Statistics
Figure 7.6 - Probe level data and RNA degradation plot
Figure 7.7 - Expression level data
Figure 7.8 - Volcano plot to demonstrate difference between the two groups
Figure 7.9 - Sample size calculation in time 2 hrs group
Figure 7.10 - Sample size calculation in time 2 hrs group with fold change of 4
Figure 7.11 - Sample size calculation in time 0 hr group with fold change of 2
Figure 7.12 - Sample size calculation in time 0 hr group with fold change of 4
Figure 7.13 - Expression levels of haemoglobin probes
Figure 7.14 - Bioanalyzer trace for extracted RNA (Batch 1)
Figure 7.15 - Repeat processing of AP052
Figure 7.16 - Bioanalyzer trace for extracted RNA (Batch 2)
Figure 7.17 - Bioanalyzer trace for extracted RNA (Batch 3)
Figure 7.18 - Bioanalyzer trace for extracted RNA (Batch 4)
Figure 7.19 - Bioanalyzer trace for extracted RNA (Batch 5)
Figure 7.20 - Bioanalyzer traces demonstrating traces relating to varying RINs and hence
degradation of RNA
Figure 7.21 –Bioanalyzer traces of amplified cDNA (Batch 1)
13 | P a g e
Figure 7.22 –Bioanalyzer traces of amplified cDNA (Batch 2)
Figure 7.23 –Bioanalyzer traces of amplified cDNA (Batch 3)
Figure 7.24 –Bioanalyzer traces of amplified cDNA (Batch 4)
Figure 7.25 –Bioanalyzer traces of amplified cDNA (Batch 5)
Figure 7.26 – Bioanalyzer traces of fragmented cDNA (Batch 1)
Figure 7.27 – Bioanalyzer traces of fragmented cDNA (Batch 2)
Figure 7.28 – Bioanalyzer traces of fragmented cDNA (Batch 3)
Figure 7.29 – Bioanalyzer traces of fragmented cDNA (Batch 4)
Figure 7.30 – Bioanalyzer traces of fragmented cDNA (Batch 5)
Figure 7.31 – Actin and GAPDH probe sets
Figure 7.32 – Distribution of probes on U133A genechip
Figure 7.33 – Quality control metrics of the house keeping genes
Figure 7.34 – RNA degradation plot
Figure 7.35 – Quality Control Metrics for labelling, hybridisation, 3’-5’ and pm/mm
Figure 7.36 – Quality control metrics for probe level, expression level and REL intensities
Figure 7.37 – Principle Component Analysis demonstrating difference between MAP and
SAP, with and without batch effects
Figure 7.38 – Principle Component Analysis demonstrating difference between different
batches
Figure 7.39 - Hierarchical Cluster Analysis of differential gene expression data from mild and
severe acute pancreatitis patients. Heat map depicting the gene expression patterns in 58
patients (35 mild and 23 severe acute pancreatitis). Columns represent individual samples and
rows represent each gene. Each cell in the matrix represents the expression level of a gene
feature in an individual sample. Blue represents mild and red illustrates severe patients.
Upregulated (high expression level) genes are coloured red whereas downregulated (low
expression level) genes are shown as green, as indicated in the scale bar (log2-transformed
scale).
Figure 7.40 - Top canonical pathways differentially expressed in SAP and MAP
Figure 7.41 - T Cell Receptor Signalling from the canonical pathways
Figure 7.42 – Role of NFAT in T cell signalling
Figure 8.1 – Poly-A Tailing and ligation (Adapted with permission)

14 | P a g e
Figure 8.2 – Quality Control Metrics of Probe intensities of the House keeping genes
Figure 8.3 – Quality Control Metrics of Perfect match intensities
Figure 8.4 - QC metrics box plot on Log Expression Signal
Figure 8.5 – Principle component analysis according to disease severity
Figure 8.6 – Principle Component Analysis according to date of sample processing
Figure 8.7 - Hierarchical Cluster Analysis of differentially expressed miRNA in mild and
severe acute pancreatitis patients. Heat map depicting the miRNA expression patterns in 19
patients (10 mild and 9 severe acute pancreatitis). This was calculated keeping the FDR p <
0.05. 45 differentially expressed miRNA were identified, out of which only 23 were
annotated in IPA/MetaCore. Columns represent individual samples and rows represent each
gene. Each cell in the matrix represents the expression level of a gene feature in an individual
sample. Blue represents mild and red illustrates severe patients. Upregulated (high expression
level) genes are coloured red whereas downregulated (low expression level) genes are shown
as green.

15 | P a g e
Table of tables
Table 6.1 - SOFA Scoring System
Table 6.2 – Demographic Characteristics of included patients
Table 6.3 – ASSIST and Charlson’s Scores of included patients
Table 6.4 – Prediction of Severity of included patients
Table 6.5 – Imaging details of included patients
Table 6.6 – SOFA scoring of included patients
Table 6.7 – Complications of included patients
Table 6.8 – Local and systemic complications in SAP patients
Table 7.1 – Concentration of RNA samples prior to amplification process
Table 7.2 – Concentration of amplified RNA
Table 7.3 – Concentration of amplified cDNA
Table 7.4 – Quality control metrics
Table 7.5 – Samples in each batch
Table 7.6 – RNA concentrations
Table 7.7 – Results of Degradometer Batch 1
Table 7.8 – Results of Degradometer Batch 2
Table 7.9 – Results of Degradometer Batch 3
Table 7.10 – Quality control metrics for batch 1 hybridizations
Table 7.11. Top 50 differentially expressed genes (upregulated) in severe and mild acute
pancreatitis
Table 7.12 - Top 50 differentially expressed genes (down regulated) in severe and mild acute
pancreatitis
Table 7.13 - Top canonical pathways differentially expressed in SAP and MAP
Table 8.1 – Samples included
Table 8.2 – Total RNA concentration of the samples included
Table 8.3 - Quality Control Metrics of the hybridisations
Table 8.4 – List of top 20 differentially expressed miRNA between MAP and SAP

16 | P a g e
Declarations
All the work described in this thesis has been undertaken by me, with few exceptions.
- Microarray experiments were performed by Dr. Lucille Rainbow
- Bioinformatic analyses were conducted by Dr. Brian Lane
- A substantial number of samples were collected by myself. However, recruitment to
Acute Pancreatitis Biobank (where the samples have been used from) was undertaken
by clinical staff of the unit according to a pre-planned rota.
- Clinical Data was retrieved from Acute Pancreatitis Biobank Database, which I set up,
populated and was responsible for the maintenance of.
This study and my fellowship was funded by National Institute of Health Research (NIHR).

17 | P a g e
Abbreviations
AP – Acute Pancreatitis
miRNA – Micro RNA
RNA – Ribonucleic Acid
HGU133 – Human Genome U133
ANOVA – Analysis of Variance
NFAT – Nuclear Factor of Activated T Cells
FDR – False Discovery Rate
snoRNA – Small Nucleolar RNA
NIHR – National Institute of Health Research
PBRU – Pancreas Biomedical Research Unit
PP – Pancreatic Polypeptide
MODY – Mature Onset Diabetes of the young
PDAC – Pancreatic Adenocarcinoma
VIPoma – Vasoactive Peptide oma
MEN1 – Multiple Endocrine Neoplasia type 1
MAP – Mild Acute Pancreatitis
SAP – Severe Acute Pancreatitis
CP – Chronic Pancreatitis
ERCP – Endoscopic Retrograde Cholangiopancreatography
HIV – Human Immunodeficiency Virus
UK – United Kingdom
SIRS – Systemic Inflammatory Response Syndrome
CT – Computed Tomography
EPR necrosis – Extra-Pancreatic Retroperitoneal necrosis
ARDS – Acute Respiratory Distress Syndrome
DIC – Disseminated Intravascular Coagulopathy
HUS – Haemolytic Uraemic Syndrome

18 | P a g e
MARPN – Minimal access Retroperitoneal Pancreatic Necrosectomy
ER stress – Endoplasmic Reticulum Stress
TNF – Tumour Necrosis Factor
IL – Interleukin
PG – Prostaglandin
PAF – Platelet Activating Factor
CRP – C Reactive Protein
MODS – Multi-Organ Dysfunction Syndrome
CARS – Compensatory Anti-inflammatory Response Syndrome
HLA-DR – Human Leukocyte Antigen – antigen D Related
MCP – Monocyte Chemo-attractant Protein
MIP – Macrophage Inflammatory Protein
RANTES – Regulated upon Activation, Normal T Expressed and Secreted
CINC – Cytokine Induced Neutrophil Chemo-attractant (CINC)
NF- κ β – Nuclear Factor - κ β
STAT – Signal Transducer and Activators of Transcription
MAPK – Mitogen Activated Protein Kinase
AP-1 – Activating Factor 1
SOCE – Store Operated Calcium Entry
MPTP – Mitochondrial Permeability Transition Pore
ATP – Adenosine Triphosphate
IP3 – Inositol Triphosphate
STIM1 – Stromal Interaction Molecule 1
PMNs – PolyMorphonuclear Leukocytes
RBCs – Red Blood Cells
ET – Endotoxin Tolerance
LPS – Lipopolysaccharide
NO – Nitric Oxide
PPV – Positive Predictive Value

19 | P a g e
APACHE – Acute Physiology and Chronic Health Evaluation
NPV – Negative Predictive Value
AST – Aspartate Transaminase
ALT – Alanine Transaminase
MPM – Mortality Probability Model
AC – Atlanta Classification
ICU – Intensive Care Unit
SOFA – Sequential Organ Failure Assessment
CTSI – CT Severity Index
TAP – Trypsinogen Activation Peptide
ELISA - Enzyme-Linked Immunosorbent Assay
SAA – Serum Amyloid A
CAD – Coronary Artery Disease
mRNA – Messenger RNA
PBMCs – Peripheral Blood Mononuclear Cells
SOP – Standard Operating Procedure
COSHH - Control of Substances Hazardous to Health
QA – Quality Assessment
RLUH – Royal Liverpool University Hospital
GCLP – Good Clinical and Laboratory Practice
LIMS – Laboratory Information and Management System
EDTA - Ethylenediaminetetraacetic acid
BRT – Blood RNA Tube
CECT – Contrast Enhanced Computed Tomography
OF – Organ Failure
CVS – Cardiovascular System
CNS – Central Nervous System
GCS – Glasgow Coma Scale
DBC – Determinant Based Classification

20 | P a g e
MCT – Microcentrifuge Tube
PSC – PAXgene Shredder spin Column
PRC – PAXgene RNA spin Column
DNA – Deoxyribonucleic Acid
IVT – In Vitro Transcription
PCR – Polymerase Chain Reaction
cDNA – complementary DNA
aRNA – antisense RNA
GCOS - GeneChip® Operating Software
AGCC – Affymetrix GeneChip Command Console
RPM – Rotations Per Minute
DMSO – Dimethyl Sulfoxide
QC – Quality Control
ASSIST – Alcohol, Smoking and Substance Involvement Screening Test
HDU – High Dependency Unit
SMV – Superior Mesenteric Vein
PNA – Peptide Nucleic Acid
cRNA – complementary RNA
GAPDH - Glyceraldehyde 3-phosphate dehydrogenase
CV – Coefficient of Variance
rRNA – ribosomal RNA
pm/mm – perfect match/mismatch
REL – Relative Expression Level
PCA – Principle Component Analysis
MMP – Matrix Metallopeptidase
OLAH – Oleoyl-ACP hydrolase
ADAMST – A Disintegrin And Metalloproteinase with thrombospondin motifs
HPGD – Hydroxy prostaglandin dehydrogenase 15
PPAR – Peroxisome Proliferator-Activated Receptors

21 | P a g e
CRISP3 - Cysteine- Rich Secretory Protein 3
NOV – Neuroblastoma overexpressed
TRAT - T cell Receptor Associated Transmembrane Adaptor
TRDV - T cell Receptor Delta Variable
TRAV - T cell Receptor Alpha Variable
TRAC - T cell Receptor Alpha constant
TCR – T Cell Receptor
B-H – Benjamini-Hochberg
PLC – Phospholipase C
CRAC – Calcium Release Activated Calcium
IPA – Ingenuity Pathway Analysis
MUC – Mucin
GLUT1 – Glucose Transporter 1
GPC3 – Glypican 3
ABCA1 - ATP-Binding Cassette Transporter
SLE – Systemic Lupus Erythematosus
ncRNA – non coding RNA
IFN – Interferon
GDF – Growth Differentiation Factor
PTX3 – Pentraxin 3
APPRENTICE - Acute Pancreatitis Patient Registry to Examine Novel Therapies in Clinical
Experience
Tregs – Regulatory T cells
ARRE-2 - Antigen Receptor Response Element – 2
ALI – Acute Lung Injury
CRC – Colorectal Cancer

22 | P a g e
CHAPTER 1: ACUTE PANCREATITIS –
CLINICAL COURSE AND COMPLICATIONS

23 | P a g e
1.1 Pancreas as a gland
Pancreas is a retroperitoneal lobulated organ which serves, both, as an endocrine and
exocrine gland. Various types of endocrine cells (α, β, δ, and PP), arranged as islets of
Langerhans, produce different peptides, including glucagon, insulin, somatostatin, pancreatic
polypeptide, which are invariably delivered to other parts of the body via the blood stream.
Acinar exocrine cells are essentially of one type, although each one contains a myriad of
different substances, helping to secrete a potent mixture of digestive enzymes in response to
food intake. These enzymes are synthesised and secreted by the acinar cells, whereas,
columnar epithelial cells lining the ductal system secrete bicarbonate. However, the acinar
cell itself is not the functional unit in the exocrine pancreatic tissue because acinar cells are
organized into acini which are made up of many acinar cells and are linked by numerous gap-
junctional channels that help to allow direct chemical and electrical intercellular
communication.
Morphological and functional disorders affecting pancreatic tissue, both exocrine and
endocrine, lead to a whole spectrum of clinical conditions (figure 1.1). Benign diseases of the
pancreas are often complex and can prove to be challenging, both diagnostically and
therapeutically. Despite advances, cancer of the pancreas still carries a dismal prognosis.

24 | P a g e
Pancreas
Benign Malignant
•Acute Pancreatitis•Chronic Pancreatitis•Autoimmune Pancreatitis
•Cystic Fibrosis•Haemochromatosis
•PDAC*•Acinar cell tumours•Sarcomas•Small cell carcinoma•Giant cell tumour•IPMN ±•Mucinous carcinoma•Cystic tumours•Pancreatoblastoma•Solid and pseudopapillarytumours
•Mixed type tumours •Borderline malignancies ¥
Exocrine Endocrine
Congenital
•Gastrinoma•Insulinoma•Glucagonoma•VIPoma•MEN1•Non functioning islet cell tumours
•PPoma
Exocrine Endocrine
•Type I and II Diabetesmellitus•Impaired glucosetolerance•MODY Diabetes•Gestational Diabetes
•Pancreas agenesis andhypoplasia
•Annular pancreas•Pancreas divisum•Ectopic pancreas•Congenital pancreaticcysts
•Congenital secretory insufficiency
•Hereditary pancreatitis
MODY – Maturity Onset Diabetes of the Young
*Pancreatic Ductal AdenoCarcinoma
±Intraductal Papillary Mucinous Neoplasm
Ductal-endocrine/acinar-endocrine ¥Mucinous cystic tumour with dysplasia/IPMN with dysplasia
MEN1 - Multiple Endocrine Neoplasia Type 1
PPoma – Pancreatic Polypeptide oma
Figure 1.6 – Pathological conditions affecting pancreas
1.2 Acute pancreatitis – an overview
“Most terrible of all calamities that occur in connection with the abdominal viscera. The
suddenness of its onset, the illimitable agony which accompanies it, and the mortality
attendant upon it render it all the most formidable of catastrophes”.
- Moynihan 1925 [1].

25 | P a g e
The incidence of acute pancreatitis is increasing in Europe, with significant medical, surgical
and financial implications. The overall incidence of acute pancreatitis is 150 to 420 cases per
million population in UK with a hospital admission rate of 9.6 per year per 100,000
population in the United Kingdom [2, 3].
1.2.1 Classification
Acute pancreatitis may be classified based on pathology, aetiology, severity of disease or the
presence of necrosis.
Clinically, acute pancreatitis can be classified as mild or severe.
Mild oedematous pancreatitis (MAP) usually presents with minimal organ dysfunction and
leads to uneventful recovery. In this state, the pancreas shows oedematous swelling and
multiple tiny spots of fatty tissue necrosis, mainly on the surface of the gland but also to some
extent in the interlobular fatty tissue that infiltrates the pancreas [4]. The mild form only
rarely progresses to severe pancreatitis [5], since the interstitial oedema, which is rich in
pancreatic enzymes, is usually resolved by macrophages within a few days and does not lead
to secondary changes. The fate of fat necrosis depends on its size. A small focus of fat
necrosis (<1 cm) on the surface of the pancreas, as seen in mild pancreatitis, resolves entirely.
The necrotic material, rich in lipids, is phagocytised by macrophages, which are transformed
to foam cells. Later such an area may show a small focus of fibrotic tissue.
Severe acute pancreatitis (SAP) is associated with organ failure and/or local complications
such as necrosis, abscess, or pseudocyst. The peri-pancreatic tissue shows numerous large
and often confluent areas of fat necrosis. In addition, there are also necrotic foci within the
pancreas, although these are usually small compared with the extra-pancreatic alterations.
Intra-pancreatic necrosis also develops in the interlobular fatty tissue, where it is dependent
on the amount of fat in the pancreas. Where fat necrosis comes into contact with a blood
vessel, it damages the vessel wall, leading to thrombosis and eventually, vessel necrosis,
rupture, and haemorrhage. Focal destruction of single interlobular ducts and peripheral acinar
cells are further sequelae of expanding fat necrosis. Fat necrosis can become infected, usually
with the gut derived gram negative bacteria, adding to the mortality of the disease. Infection
of the peritoneal cavity leads to purulent peritonitis. Necrotic areas within the pancreas

26 | P a g e
resolve slowly and may induce interlobular fibrosis [6, 7]. If this process, termed the
“necrosis–fibrosis sequence” [8], takes place repeatedly because of recurrent attacks of severe
acute pancreatitis and also involves the large interlobular ducts or the main duct, acute
pancreatitis may evolve into chronic pancreatitis (CP) [7, 9-11].
1.2.2 Aetiology
Gallstones and alcohol excess continue to be the main causative agents (figure 1.2). In
approximately 10–20% of patients, no aetiology is identified. Some of these patients may
have microlithiasis as the aetiology of AP. With the increasing knowledge and understanding
of the role of genetic abnormalities in hereditary and idiopathic chronic pancreatitis (CP), it is
possible that these abnormalities will be implicated in idiopathic AP. Furthermore,
polymorphisms in inflammatory mediators may influence disease severity [12] .
Acute Pancreatitis
Mechanical•Gallstones•Ampullary obstruction•Pancreatic duct obstruction•Iatrogenic – ERCP*•Congenital malformation•Trauma
Toxic-Metabolic•Alcohol •Hypertriglyceridemia•Hypercalcemia•Medications•Organophosphates•Scorpion toxin•Methylene chloride
Vascular•Hypotension•Vasculitis•Hypercoagulable state•Embolism
Miscelleneous•Tropical pancreatitis•Cystic fibrosis•Autoimmune
Infection•Cytomegalovirus•Tuberculosis•HIV•Coxsakie virus•Mumps virus•parasites
*Endoscopic Retrograde Cholangio-Pancreatography
Human Immunodeficiency Virus
Figure1. 7 - Conditions leading to acute pancreatitis

27 | P a g e
Gallstone (Biliary) pancreatitis – Gallstones are implicated in approximately 80% of all
cases of acute pancreatitis [13, 14]. Although gallstones are common, they rarely cause
pancreatitis. It is estimated that over a 20- to 30-year period, the risk of developing biliary
pancreatitis in patients with asymptomatic gallstones is approximately 2%. Various theories
have been proposed about the possible mechanism of development of pancreatitis secondary
to gallstones, most of these arising out of works of Opie [15].
Detailed studies of patients with “idiopathic” acute pancreatitis suggest that a high proportion
of these cases are due to microlithiasis, which may be detected by endoluminal ultrasound
(EUS) if performed early enough after the onset of disease. Such studies suggest that up to
80% of “idiopathic” cases are actually due to gallstones [16-18].
Alcoholic pancreatitis - Alcoholic pancreatitis can present as acute pancreatitis, although in
most patients, it occurs in the presence of already established chronic pancreatitis. It is the
most common cause of recurrent pancreatitis. In UK, approximately 20-30% cases of acute
pancreatitis are thought to be due to alcohol abuse [19]. It is of interest to note that the
incidence of alcohol-induced acute pancreatitis may have been increasing over the past
decade. A study in the UK has reported an increase in the crude incidence rate of alcohol-
induced acute pancreatitis from 14.5 cases per 100 000 population in 1989–90 to 20.7 per
1,00,000 in 1999–2002 [19]. The incidence of alcoholic pancreatitis is low (about 5%) in
alcohol abusers [20, 21]. As reported by Dreiling and Koller [20], given 100 alcoholics, five
will develop clinical acute pancreatitis, 15 will develop alcoholic cirrhosis, while only one
will develop clinical evidence of both diseases. This estimate suggests that in addition to
alcohol ingestion, other factors, such as genetic background or environmental influences, may
affect patient susceptibility. Several major physiological mechanisms may contribute to the
development of alcoholic pancreatitis, including abnormal sphincter of Oddi spasm,
obstruction of the small ducts by proteinaceous material, and direct toxic effect of alcohol
and its metabolites. Despite the fact that alcoholic pancreatitis can be complicated by severe
disease, it is a less common cause of fatal pancreatitis.
Other aetiologies - Other potential causes identified include pancreatic cancer in 1% of
cases, post-ERCP in 2–3%, medications in 1%, miscellaneous causes in 2%, and unknown
causes in 15–23% of first attacks of acute pancreatitis.

28 | P a g e
Recurrent Acute Pancreatitis - Bouts of recurrent acute pancreatitis are most commonly
alcohol-related (60%); other aetiologies include unknown causes (17%) and untreated
gallstones (19%). Recurrent acute pancreatitis appears to be relatively benign and is
associated with a low mortality rate.
1.2.3 Clinical course
The majority of patients with mild pancreatitis recover uneventfully and once the etiological
factor is identified and removed, there are no long-term complications or recurrences.
Approximately 10–20% of patients with acute pancreatitis develop severe disease and have a
complicated hospital course.
In general, severe pancreatitis develops in two phases (Figure 1.3).
Acute Pancreatitis
Mild edematous pancreatitis SIRS
Organ failure
Acute necrotising pancreatitis
Sterile Infected
Sepsis Systemic failure
Death
PseudocystComplete resolution
Death
□early phase
□late phase
Figure 1.8 - Clinical course of Acute Pancreatitis
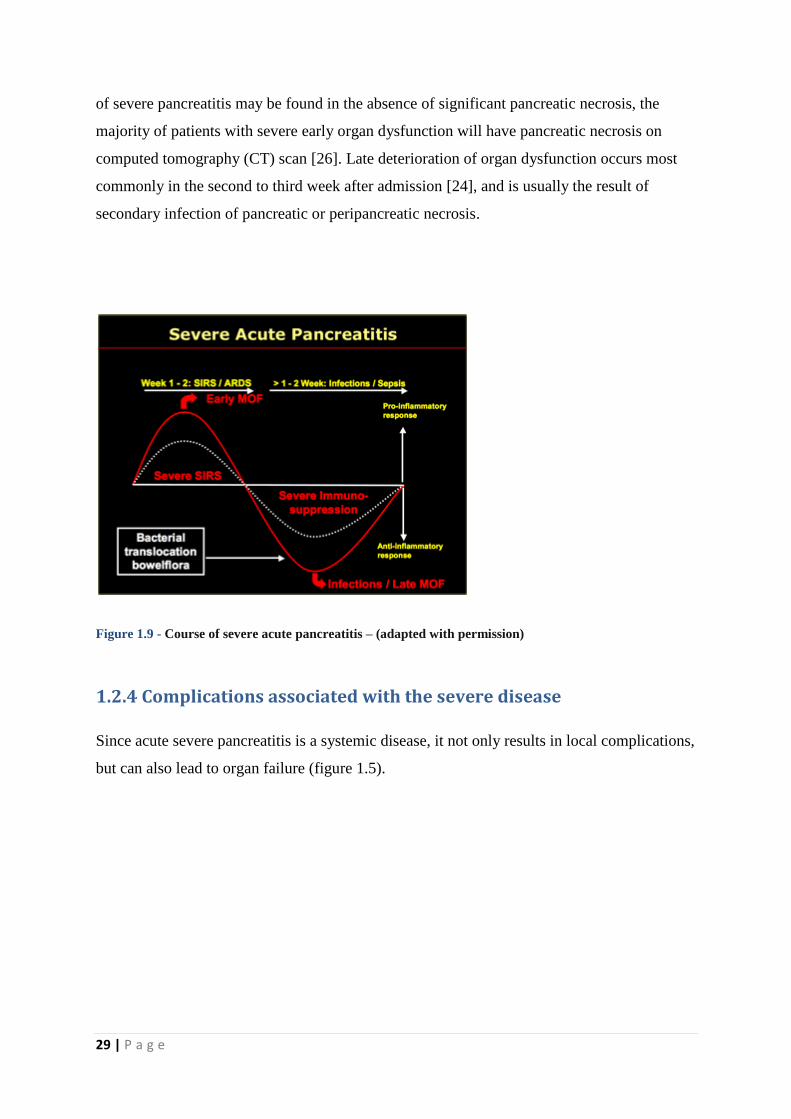
The first two weeks after onset of symptoms are characterised by the systemic inflammatory
response syndrome (SIRS) (Figure 1.4). Release of pro-inflammatory mediators is thought to
contribute to the pathogenesis of SIRS associated pulmonary, cardiovascular, and renal
insufficiency [22, 23]. Similarly, pancreatic necrosis develops within the first four days after
the onset of symptoms to its full extent in most of the cases [24], although late onset
pancreatic necrosis has also been reported in literature [25]. Although SIRS in the early phase
29 | P a g e
of severe pancreatitis may be found in the absence of significant pancreatic necrosis, the
majority of patients with severe early organ dysfunction will have pancreatic necrosis on
computed tomography (CT) scan [26]. Late deterioration of organ dysfunction occurs most
commonly in the second to third week after admission [24], and is usually the result of
secondary infection of pancreatic or peripancreatic necrosis.
Figure 1.9 - Course of severe acute pancreatitis – (adapted with permission)
1.2.4 Complications associated with the severe disease
Since acute severe pancreatitis is a systemic disease, it not only results in local complications,
but can also lead to organ failure (figure 1.5).

30 | P a g e
Acute Pancreatitis
Pancreatic•Pancreatic necrosis•Pancreatic abscess•Pancreatic fistula•Pseudocyst•Endocrine/exocrine insufficiency
Pulmonary•Hypoxemia•Pulmonary embolism•Atelectasis•Pneumonia•Pleural effusion•Mediastinal abscess•ARDS
Abdominal•EPR necrosis¥•Mesenteric/bowel ischaemia•Bowel infarction/perforation•Colonic necrosis•Biliary fistula•Small bowel/duodenal fistula•Colonic fistula•Liver abscess
Haematological•DIC*•TTP±•HUS
Central Nervous System•Psychosis•Pancreatic encephalopathy•Purtscher’s retinopathy
Metabolic•Hypocalcemia•Hyperglycemia•Hypertriglyceridemia•Acidosis
Cardiac•Shock•Pericardial effusion•Myocardial infarction•Arrhythmias
Vascular•Splenic vein thrombosis•Portal vein thrombosis•Hameorrhage•Pseudoaneurysm rupture
Peripheral•Fat necrosis (skin and bones)•Arthritis•Rhabdomyolysis
Renal•Renal failure•Oliguria•Azotemia
EPR necrosis – Extra-pancreatic retroperitoneal necrosis, ARDS – Acute Respiratory Distress Syndrome, DIC – Disseminated Intra-vascular
Coagulopathy, TTP – Thrombotic Thrombocytopenic Purpura, HUS – Haemolytic Uraemic Syndrome
Figure 1.10 – Complications of Acute Pancreatitis
Respiratory dysfunction is the most critical of all extra-pancreatic manifestations. It occurs
in almost 75% of cases and ranges from hypoxemia to Acute Respiratory Distress Syndrome
(ARDS). Course of pulmonary dysfunction and subsequent failure happens in three stages;
Stage 1 deals with pulmonary manifestations in the form of tachypnoea, mild respiratory
alkalosis and hypoxemia without any noticeable changes radiologically; stage 2 emphasises
radiologic changes observed in the form of pulmonary infiltrates or atelectasis, pleural
effusions, and pulmonary oedema and stage 3 is hallmarked by ARDS, characterised by
severe dyspnoea and extreme hypoxemia refractory to a high inspired oxygen concentration.
Vascular complications in pancreatitis are well recognized and occur in approximately one
fourth of the patients [27]. The most common complications are haemorrhage into a

31 | P a g e
pseudocyst, erosions of the upper gastrointestinal arteries, thromboses of the portal venous
system, formation of varices or pseudoaneurysms and rupture of a pseudoaneurysm.
Pancreatitis in combination with vascular complications is dangerous and potentially lethal.
The survival of patients with pancreatitis and vascular complications depends on the early
diagnosis of these complications.
Acute renal failure is one of the most common complications in patients with severe acute
pancreatitis. Its incidence rate ranges from 14% to 42% in the literature [28, 29]. The history
of renal disease, acute coronary syndrome (ACS), and hypoxemia are the significant risk
factors for it [30].
Pancreatic pseudocysts are well known sequelae of acute pancreatitis with a prevalence rate
ranging from 6% to 18.5% [5, 31]. Complications arising out of pseudocysts, influencing
patient morbidity and mortality include rupture into gastro-intestinal tract tract, peritoneal
cavity or vascular system [32], haemorrhage due to erosion into a major vessel [33], infection
[34] and obstructive jaundice arising from pressure on the common bile duct [35, 36].
Pancreatic and gastrointestinal tract fistulas (gastric, enteric, duodenal, and colonic) are
common complications of severe necrotizing pancreatitis. Mortality in these patients parallels
the mortality for severe necrotizing pancreatitis [37, 38].
Pancreatic endocrine and exocrine insufficiencies are well reported follow-up
complications of acute necrotizing pancreatitis. Pancreatic endocrine insufficiency is
diagnosed on the basis of abnormal oral glucose tolerance test, after recovery from acute
illness. Pancreatic exocrine insufficiency is diagnosed on the basis of clinical symptoms of
steatorrhea [39-41].
In contemporary pancreatic practice, the diagnosis and management of colonic
complications of pancreatitis remains a relatively difficult management problem. These
roughly include colonic necrosis [42-44], colonic fistula [42], colonic stricture/stenosis [45],
colonic obstruction and colonic haemorrhage [44]. In 1989, Aldridge and colleagues reported
36 cases of large bowel involvement in acute necrotising pancreatitis and discovered a
spectrum of changes in the resected colons ranging from pericolitis through to ischaemic
necrosis, suggesting at least two possible mechanisms [43]. Kriwanek et al found colonic

32 | P a g e
necrosis to be an independent prognostic factor for death in his patient cohort with an
associated mortality of 53% [46]. Hence, colonic necrosis is a potentially lethal complication
of acute pancreatitis with a mortality of 54% and an overall mortality of 35% for patients
with colonic complications of pancreatitis [44].
1.2.5 Mortality in acute pancreatitis
The mortality of acute pancreatitis is reported in the literature as being between 1.3 and 10%.
A range of 2–5% likely represents a true mortality because the higher rates are indicated in
studies from referral centres and probably do not include patients with mild disease. Overall,
studies suggest a reduction in mortality in the last decade. The mortality rate takes a big leap
in severe acute pancreatitis, where the reported figures are between 14 and 30%.
Approximately half of this mortality is seen in the first two weeks [47-49]. Mortality appears
to be influenced by age, aetiology (higher in patients with idiopathic, post-ERCP pancreatitis,
and gallstone), presence of organ failure on admission and the presence of pancreatic
necrosis. Additionally, patients with severe pancreatitis transferred to tertiary care facilities
for management have higher mortalities [50]. Most studies suggest that approximately 10–
20% of fatal pancreatitis is missed with the diagnosis only being made at autopsy. The missed
diagnosis appears in patients who present without abdominal pain, with acute respiratory
failure or neurological changes, and/or normal serum enzymes or pancreatic imaging.
1.2.6 Available treatment modalities
For a disease of this magnitude, it is unfortunate that there is no pancreatitis specific
pharmacotherapy available to treat acute pancreatitis. Therefore, the management of the
disease largely remains supportive. The primary objective in the initial treatment of acute
pancreatitis is to provide supportive therapy and to treat specific complications as these arise.
It is also of paramount importance to make efforts to limit both the pancreatic inflammation
and invariably, pancreatic necrosis and the systemic inflammatory response by specifically
interrupting their pathogenesis.
Fluid resuscitation and rehydration - Maintaining an adequate intravascular volume is
probably the most essential therapeutic measure in the treatment of acute pancreatitis. If not

33 | P a g e
achieved, it is also the most consequential mistake. Patients with acute pancreatitis can
sequester large amounts of fluid into the retroperitoneal space, intraperitoneal cavity
(pancreatic ascites), gut and the pleural space. Haemodilution to a haematocrit of around 30%
with dextran 60 has been shown to improve pancreatic microcirculation and oxygenation in
experimental acute pancreatitis [51]. There is also increasing evidence that oxygen
supplementation to maintain an arterial saturation of 95% is associated with the resolution of
organ failure, since it ensure optimal oxygen transport [52].
Nutritional supplementation – Severe acute pancreatitis creates a catabolic stress state,
exacerbating the pathological progression by promoting systemic inflammatory response and
nutritional deterioration [53]. This, combined with absence of oral intake, promotes persistent
negative nitrogen balance that appears to be associated with a higher mortality rate as a result
of loss of function and structural integrity of vital organs [5, 54, 55] Increasing evidence
suggests that enteral feeding is not only safe but can also reduce complications by helping to
maintain the intestinal barrier function and intestinal blood flow, and by preventing or
reducing bacterial translocation from the gut. Furthermore, enteral nutrition eliminates some
of the complications of parenteral nutrition, such as catheter sepsis, as well as other less
common complications.
Recent meta-analyses have supported use of enteral nutrition in patients with severe
pancreatitis requiring nutritional support over total parenteral nutrition. It has also been found
that patients receiving enteral nutrition are less likely to suffer from multiple organ failure,
systemic infections, operative interventions and more importantly, death [56-58].
Treatment of pain – Inflammatory mediators released as a result of pancreatic inflammation
and necrosis can have a direct effect on sensory nerve fibres in the celiac plexus (spinal cord
level T5–T9) and therefore mediate visceral pain, which is often excruciating. Adequate pain
relief is therefore one of the most important and urgent treatment goals. The systemic
administration of intravenous procaine hydrochloride has long been advocated as an
alternative to opiates, but has now been shown to be completely ineffective for the treatment
of pain in patients with acute pancreatitis [59, 60]. Concerns that morphine analogues might
negatively affect the course of pancreatitis because of their inhibitory effect on the sphincter
of Oddi are unwarranted [61]. Some centres have begun to use thoracic epidural analgesia to
treat pain in acute pancreatitis patients [62] . This medication not only leads to rapid pain

34 | P a g e
relief [63] but often abolishes the need for opiates. Although shown to be effective in a few
studies, well designed randomised multicentre trials are required to establish its efficacy.
Role of antibiotics in acute pancreatitis – Infected pancreatic necrosis increases mortality
risk to more than 40% and requires surgical debridement to improve clinical outcome [24, 64,
65] . The infecting agents, usually gut-derived bacteria [66], and organisms are thought to
migrate from nearby bowel via intervening lymphatics. Gut mucosal defences against
bacterial translocation become impaired in severe acute pancreatitis [67, 68]. Infected
pancreatic necrosis worsens pre-existing multi-organ failure and may lead to development of
new organ failure or other signs of systemic sepsis [5]. There appears to be a window of
opportunity of around 1-2 weeks during which infection may be prevented by administering
antibacterial therapy with agents active against enteric organisms [24, 69]. Recent meta-
analyses have reported conflicting results with regards to efficacy of prophylactic antibiotic
therapy in acute pancreatitis. While some of them have not shown any reduction in mortality
or protection against infected necrosis or frequency of surgical intervention [70, 71], others
have strongly advocated prophylactic use of antibiotics in settings of acute necrotising
pancreatitis [72, 73][74].
1.2.6.1 Interventional management
Endoscopic sphincterotomy - There has been much interest and debate on the early
endoscopic removal of gallstones retained in the common bile duct in patients with acute
biliary pancreatitis. Although ERCP has no role in the initial diagnosis of acute pancreatitis,
there is good evidence that early endoscopic sphincterotomy with the aim of removing
obstructing gallstones is the procedure of choice in patients with cholangitis or with impacted
stones [75]. In cases of mild acute biliary pancreatitis without signs of cholestasis, cholangitis
or clinical deterioration, monitoring of the clinical progress alone suffices, without requiring
any interventional modality. A randomised controlled trial has shown that patients with
predicted severe pancreatitis, but without biliary obstruction, do not benefit from endoscopic
sphincterotomy [76].
Surgical procedures – Management of pancreatic necrosis has taken a shift from very
aggressive open surgery to more conservative intensive care approach in the recent years.
Surgery is now indicated in acute necrotising pancreatitis only for infected pancreatic tissue,

35 | P a g e
diagnosis of which is made on the evidence of bacterial or fungal growth on the fine needle
aspiration or presence of gas in the retroperitoneum on CT scan. Aim of a standard surgical
treatment is to control the focus so that further complications are avoided by restricting the
progression of infection and release of pro-inflammatory mediators. Although a generally
accepted principle of organ preserving surgical approach is the gold standard, four principle
methods have been advocated.
Necrosectomy combined with open packing [77]
Planned staged re-laparotomies with repeated lavage [78]
Closed continuous lavage of the lesser sac and retroperitoneum [79]
Closed packing [80]
Open necrosectomy has been associated with high rates of morbidity (34-95%) and mortality
(11-39%), along with the risk of long term pancreatic insufficiency [39, 81-83], morbidity is
low in techniques which provide postoperative exit channels for further slough and infected
debris [84].
Advent of minimally invasive interventional procedures has revolutionised the surgical
management of acute necrotising pancreatitis. The rationale is to minimise peri- and
postoperative stress in critically ill septic patients, suffering from multi-organ failure. These
procedures, including percutaneous drainage, endoscopic drainage, or minimally invasive
surgery play a role as a temporary measure to bridge the critical early time after onset of
acute pancreatitis to a later optimal time point for definitive intervention. The Dutch
multicentre randomised controlled trial demonstrated that a minimally invasive step-up
approach, which consisted of percutaneous/endoscopic drainage of infected fluid collection
as the first step and minimally invasive retroperitoneal necrosectomy as the next step if
required, reduced the rate of the major complications and death among patients with
necrotising pancreatitis and infected necrotic tissue, as compared with open necrosectomy
[85].
The pancreatic unit at the Royal Liverpool University Hospital has been performing Minimal
Access Retroperitoneal Pancreatic Necrosectomy (MARPN) since 1998.
The technique involves using a nephroscope over a guidewire that is placed under CT
guidance into the necrotic tissue and can be performed under local anaesthetic as well.

36 | P a g e
Various publications outlining the unit’s experience with the technique and comparing it with
the traditional open necrosectomy (ON) have shown superiority of MARPN over the former.
ON was found to be associated with increased post-operative multi-organ failure and
mortality when compared with MARPN [39, 86-89].

37 | P a g e
CHAPTER 2: WHAT HAPPENS IN ACUTE
PANCREATITIS - COMPLEX
PATHOGENESIS SURROUNDING THE
DISEASE

38 | P a g e
Acute pancreatitis is a disorder that has numerous causes and an obscure pathogenesis. The
spectrum of the disease can range from mild and self-limiting to severe and fatal. Several
aspects of the condition remain poorly understood or controversial, although recent advances
have improved our understanding in many areas, such as predisposing risk factors, pathology,
and biochemical events within the pancreas, through a large number of clinical and
experimental studies. However, the earliest changes in the pancreas, the so-called initiator or
trigger mechanisms, await discovery. The clinical disease varies in severity, but the basic
response of the pancreas to the injurious stimulus appears to be limited to one or two
sequences of events, giving credence to the idea of a "common pathway" for the initiation of
pancreatitis, despite the disparate predisposing factors. The latter must lead to similar cellular
alterations, which manifest as clinically similar forms of pancreatitis. Any encompassing
theory of the pathogenesis of pancreatitis must explain the diversity of the initiating stimuli,
the varying clinical and pathologic pictures and the systemic manifestations of the disease.
2.1 The Trypsin Centred Theory
This widely popular theory rests on the common knowledge that most experimental models
of AP have shown pathological activation of trypsinogen to trypsin [90-92]. This invariably
establishes a cause-effect relationship [91, 93]. However, new emerging evidence questions
this very notion [91].
the detectable premature trypsinogen activation – may not be pathologically significant
quantitatively
Protective responses within the acinar cell may be adequate to clear the response
efficiently
It may lead to some pathologic acinar cell inflammatory signalling without incurring any
direct cell damage
Alternatively, it may cause some direct cell damage, consequently, triggering protective
and pathologic cellular pathways such as autophagy and endoplasmic reticulum (ER)
stress, and activate pathological inflammatory signalling
Premature activation may act as a protective response leading to rapid cell death [94, 95]

39 | P a g e
Trypsinogen knock out mice experiments have successfully shown development of local
and systemic inflammation comparable to that seen in wild type mice in the absence of
significant pathological trypsinogen activation [96, 97].
Other, alternative, trypsin-independent pathological events may be present in sufficient
degree to cause pancreatitis independently of or in conjunction with trypsin-related injury
[96].
Thus, premature trypsinogen activation seems to contribute to a component of local injury but
inflammation, both local and systemic, progresses independently of trypsinogen activation
during acute pancreatitis and therefore, this does not necessarily translate into pathogenicity
[96-98]. Although some recent work into hereditary pancreatitis with identification of mutant
genes (PRSS1, CFTR, SPINK1, CTRC and CASR) [99-102] has supported the trypsin
centred theory, it is not without its flaws [103-109] and this remains open to speculations.
Regardless of the exact mechanisms leading to the development of pancreatitis, once the
inciting agent/pathway activates the inflammatory cascade, the pancreatic inflammation is
driven by release of active pancreatic enzymes and inflammatory mediators into the blood
stream [110, 111]. TNF-α, IL-1, IL-6, IL-8, IL-10, PGE2, C reactive protein and PAF
especially are crucial in this process [112-118]. The release of these interleukins and TNF-α
from macrophages triggers an inflammatory cascade, resulting in necrosis of the acini and
pancreatic islets, interstitial fat necrosis, necrotising vasculitis and systemic inflammatory
response syndrome (SIRS) [23]. SIRS may develop into ARDS and multi-organ dysfunction
syndrome (MODS). TNF-α induced response also damages the intestinal barrier leading to
bacterial translocation (from small bowel or colon) and pancreatic infection. It is an important
factor for complications, increases mortality by several folds [119-121] and may be a feature
of early phase of the disease [122].
2.2 Inflammatory versus anti-inflammatory response in
Acute Pancreatitis
The initial events in acute pancreatitis lead to disruption of the acinar cells, following on from
intracellular co-localisation of digestive and lysosomal enzymes [123-125]. When the natural

40 | P a g e
defence mechanisms fail to contain the inflammatory process to the local site, uncontrolled
activation of inflammatory cells and mediators leads to an inflammatory rampage that leads
to SIRS [126]. Cytokines are poured out into the circulation [127], leading to activation of
other pro-inflammatory signals, synthesis of acute phase proteins and activation of vascular
endothelium. This leads to increased permeability, copious leakage from the capillaries and
migration of leukocytes into the tissues. Coagulation cascade is activated consequently.
Vascular endothelium in addition to being activated, also suffers damage from the proteolytic
enzymes and oxygen radicals released from circulating activated neutrophils and monocytes
[128]. This dysfunction of endothelium results in impairment of microcirculation, lack of
oxygen to organs and subsequently leads to organ dysfunction and failure [129, 130].
The emerging concept of compensatory anti-inflammatory response syndrome (CARS) has
provided useful explanations for some of the aspects of the pathophysiology of the disease
[131, 132]. Although, a lot of it still hides in the shrouds of mystery, it is widely agreed upon
that in acute pancreatitis, it is observed and leads to effects in the later part of the disease –
secondary infections due to excessive immunosuppression [24]. Some studies have provided
useful data and hence, established evidence that in AP decreased HLA-DR expression of
monocytes, resultant from impaired antigen presentation capacity [133], is positively
associated with development of secondary infections [132], organ failure [134] and mortality
[135]. Another important contributor to CARS is IL-10. It not only decreases monocyte
HLA-DR expression but has also been found to predict development of organ failure in the
early part of the disease [136]. IL-6 and IL-1ra are also important as IL-6 prevents synthesis
of TNF α and IL 1β.
2.3 Inflammatory Role of Acinar Cells
It has only transpired recently that pancreatic acinar cells act as inflammatory cells, releasing
inflammatory signals and provoking immune responses when noxious stimuli incite injury
within them. These are also capable of activating signalling pathways, giving way to
expression of various inflammatory mediators [137, 138].
Cytokine production by acinar cells in the context of AP has been well established by various
studies which have shown production, release and response to TNF α, IL-6, IL-10 and IL-1β

41 | P a g e
in in vivo and in vitro models [139-144]. These cytokines not only accelerate pancreatic
inflammation, through induction of regulatory genes in acinar cells, but also play a pivotal
role in determining severity of acute pancreatitis by inducing apoptosis in acinar cells [139,
145].
Chemokines have also been laid out to be involved in the early inflammatory response
mounted by acinar cells. Monocyte chemo-attractant protein-1 (MCP-1), macrophage
inflammatory protein (MIP)-1α, regulated upon activation, normal T expressed and secreted
(RANTES), IL-8, cytokine induced neutrophil chemo-attractant (CINC), Mob-1 (the
homologue of human IP-10) and MIP-2 have all been identified as being secreted by acinar
cells during AP in animal models [140, 146-151].
Acinar cells regulate the pathological functioning of cytokines and chemokines, in the
context of acute pancreatitis, through four major inflammatory pathways - Nuclear Factor-κβ
(NF-κβ), Signal Transducers and Activators of Transcription (STAT), Mitogen Activated
Protein Kinase (MAPK) and Activating Factor 1 (AP-1). These pathways accentuate the
inflammatory process, through induction of genes responsible for expression of cytokines and
chemokines, leading to overproduction [137-139, 142, 143, 150-157].
2.4 Calcium Signalling
Works from Liverpool NIHR Pancreas Biomedical Research unit have clearly demonstrated
prolonged elevations in cytosolic calcium to be the trigger of AP [158], which leads to store-
operated calcium entry dependent (SOCE) pancreatic acinar cell injury and necrosis [159-
164]. The concept is undoubtedly old but there has been increasing evidence in the recent
times. The abnormal elevations of calcium lead to molecular events that play a crucial role in
the pathogenesis of AP. These include premature intracellular enzyme activation,
mitochondrial dysfunction, impaired autophagy and vacuolization, to name a few [165].
Mitochondrial dysfunction, likely due to intracellular calcium overload, is now recognised to
be at the heart of the pathogenesis of AP, being the principle mechanism of injury [159, 166-
171]. Mitochondrial matrix calcium overload drives opening of the Mitochondrial
Permeability Transition Pore (MPTP) – a non-specific channel that forms in the inner
mitochondrial membrane that has already been demonstrated to be crucial to AP by

42 | P a g e
mediating impaired ATP production, defective autophagy, zymogen activation, inflammatory
responses and necrosis. Cell death occurs when the ability to produce ATP has been critically
affected due to significant damage to the mitochondria consequent to the cytosolic calcium
overload [172]. Additionally, many studies have indicated the importance of inositol
triphosphate (IP3) [173-175] and ryanodine [161, 176] stimulated calcium release channels on
internal stores to pancreatic injury induced by AP precipitants. Concurrently, recent evidence
has demonstrated a role for the STIM1-Orai complex as the principal calcium entry channel
in pancreatic acinar cells [160, 164, 177]. Indeed, inhibition of Orai1 channels has been
shown to cause reduced pathological calcium entry into murine pancreatic acinar cells,
necrotic cell death and trypsin activation, suggesting therapeutic potential of calcium release
activated calcium channel blockade to ameliorate AP [160].
2.5 Acute Pancreatitis as a model of sepsis
AP has now been well established in the literature as a clinical example of immune response
in sepsis and indeed, the complications and outcomes of the two closely resemble each other
– organ dysfunction and failure [178]. This suggests the intricate and absolute involvement of
pro-inflammatory cascade, initiated by perhaps, different aetiologies to be the main driving
force.
As mentioned earlier, SIRS is likely to be the main contributor towards early mortality of the
disease, with MODS occurring as a complication of the SAP in 20-80% of the cases [179].
Distinction between SIRS and sepsis can often be tricky, as the presentation may be very
similar. The involved pathophysiological mechanisms are complex and similar and comprise
of activation of several inflammatory mediators and components of the complement cascade.
Polymorphonuclear leukocytes (PMNs) not only contribute towards the initiation of the
pathological response but also extend the inflammatory process. Ischaemic injury is incited
by cytotoxic insult and sequestration of platelets, PMNs and red blood cells (RBCs) in the
microcirculation, leading to systemic hypotension, low peripheral resistance and a hyper-
dynamic circulation. This eventually translates into anaerobic metabolism and subsequent
lactic acidosis, culminating into tissue injury and organ failure.
43 | P a g e
Another important consideration into the two disease states is the ability of the triggering
factor to activate the host inflammatory response in an uncontrolled fashion with resultant
dissemination into the system, leading to multiple systemic effects – organ
dysfunction/failure. TNF α, IL-1 and nitric oxide are the most common mediators involved in
this.
Coagulation abnormalities are an important contributor to the inflammatory process in both
sepsis and AP. These are initiated, in part, by the pro-inflammatory cytokines and activated
endothelial cells [180] and can lead to widespread thrombosis, culminating in disseminated
intra-vascular coagulopathy (DIC) and hence, organ failure [181]. Indeed, these
microcirculatory disorders affecting the capillary blood flow, capillary permeability and
leukocyte endothelial interaction have been demonstrated in the colon, liver, and lungs, in
addition to the pancreas, in studies [129].
A landmark study in 2004 also implicated genetic polymorphisms for cytokines to be
associate with prognosis, both in sepsis and AP. This especially applies to the polymorphisms
involving glutathione levels in acinar cells. This may lead to increased oxidative stress and
further clinical deterioration [12].
A recent interesting concept has also endeavoured to explain the pathophysiological
similarities between SAP, SIRS and Sepsis. This is tied in by the ‘endotoxin tolerance’ (ET).
Essentially, it is the diminished capacity of the host or macrophage/monocyte to respond to a
Lipopolysaccharide (LPS) challenge after a first exposure to this stimulus [182, 183].
Experimental works have verified, to an extent, the hypothesis that the innate immune system
of patients with SAP, SIRS and sepsis has characteristics of endotoxin tolerance. Works of
Vasilescu and others [184] have placed merit on the role of TNF α related mechanisms as the
underlying cause behind the phenomenon. They showed that the TNF α releasing capacity of
the whole blood is lower in SAP than in trauma patients but higher than in diffuse peritonitis.
Similar findings have previously been recorded by Ertel et al [185]. These TNF α releasing
mechanisms form basis of the pathophysiological similarities in SAP and severe sepsis. There
has been increasing evidence to place more significance on ET in response of innate
immunity in SIRS, SAP and sepsis, assuming the role of a pivotal component of immune
dysregulation that sits at the heart of clinical evolution of patients with SAP. Further studies
on the matter will elaborate on the more intricate and complex components of the process but

44 | P a g e
the concept that the immune depression of patients with SAP, SIRS and sepsis is based on a
mechanism similar to endotoxin tolerance, and that in SAP, the amplitude of the immune
depression is of an intermediate degree between SIRS and sepsis, presents a very plausible
theory, rendering SAP a very good clinical model for these conditions.
2.6 Oxidative Stress in Acute Pancreatitis
Our understanding of role of oxygen metabolites in inflammation has improved considerably
and perhaps, dramatically over the last decade or so. These are important contributors
towards release of inflammatory mediators and their sequestration within tissues,
development of pancreatic oedema and also play an important role in controlling extent of
necrosis at cellular level, both in acinar and non-acinar cells. Imbalance of free radicals
release-clearance mechanisms and reduced anti-oxidative capability, demonstrated in both
patients and animal models, has been proposed to be at the centre of the disease process in
AP and SIRS. [186-189]. Animal models and human studies have placed significant value on
oxidative stress as the common pathway in the pathogenesis of AP [190-194]. Experimental
data have also suggested for a very early involvement of pancreatic oxidative stress in the
disease process of AP. These assumptions and notions are supported by further studies on the
topic, which have demonstrated conveniently, decreased antioxidant levels and increased
release of peroxidation by-products in AP.
Although some studies have shown excessive production of free radicals to be associated
with increased cell damage and necrosis and pancreatic edema [195], a landmark study by
Booth et al [187] showed for the first time that in animal model, free radical production led to
apoptosis and inhibition of the same caused necrosis. These findings suggest that free radical
generation within acinar cells may be a protective response during pancreatitis. It was also
postulated in the same study that oxidative stress in the neutrophils activated during
inflammatory response to acinar injury may be responsible for further propagation of local
and systemic inflammation. As it materialises, oxidative stress may well have a dual role in
pancreatic injury.
Hydrogen peroxide, superoxide, hydroxyl radical and singlet oxygen all cause destruction of
lipid membranes and lysosomal membranes by peroxidation of fatty acids, leading to cellular

45 | P a g e
and endothelial injury in AP. These act on arachidonic acid cascade and through their platelet
aggregation and vasoconstricting effects, lower tissue circulation [196]. These also exert their
pro-inflammatory influence and promote activation of leukocytes and lysosomal discharge
[197]. A vicious cycle develops when the activated leukocytes cause respiratory burst,
culminating in more free radical formation and hence, more tissue and acinar cell damage
[139, 198, 199]. This oxidative stress in the neutrophils, accentuating the further propagation
of local and systemic inflammation [187], may well be the driving force providing synergy
between pro-inflammatory cytokines and oxidative stress in AP, perhaps through activation
of mitogen activated protein kinases and nuclear factor-kappa B (NF-kB) and inactivation of
protein phosphatises [200-203].
Nitric oxide (NO), on the other hand, has a dual role. Its protective role is shown by its
ability to relax smooth muscle, especially sphincter of Oddi and to improve pancreatic
microvascular blood flow by vasodilation. Pancreatic damage is caused due to its free radical
action and its association with bacterial translocation, putting endotoxemia in the centre of
pathogenesis of MOF and septic complications of AP. Indeed high levels of NO have been
correlated with sepsis and mortality in AP [204]. These different roles can be explained by
difference in concentration and synthesis of NO at different stages of the disease. Early phase
of AP is characterised by low concentration of NO, which only causes muscle relaxation and
vasodilation and hence, is protective. The concentration increases as the disease progresses
and NO starts acting as a free radical participating in oxidative reactions [205].
Whether the oxygen free radical species are the initiators of the tissue damage in AP remains
to be elucidated but these have been proven to be important mediators in the early and later
courses of AP, correlating with clinical severity in many studies [206, 207].

46 | P a g e
CHAPTER 3: PROGNOSTICATION IN
ACUTE PANCREATITIS

47 | P a g e
3.1 Significance of severity stratification in acute pancreatitis
Acute pancreatitis resolves spontaneously in approximately 80% of the patients, without
requiring any intervention. However, a subset of the patients goes on to develop the severe
form of the disease, including local and systemic complications and require intensive
management. These patients should be monitored and managed in high dependency/critical
care units as their condition demands. Unfortunately, it is not possible to accurately identify
such patients when they present with the disease. Similarly, it is not feasible to manage all the
patients who are diagnosed with acute pancreatitis to be managed in the critical care settings.
Current scoring and predicting systems have their short comings and fail to achieve what is
required. Therefore, it becomes difficult to allocate the health resources to the patients who
need them the most. If patients, who potentially will develop severe acute pancreatitis in the
course of their disease, can be accurately identified immediately on admission through a
scoring system/biochemical parameter, it will not only enable the medical team to single out
these patients and provide them with the best care possible, it will also ensure that the health
resources are appropriately and efficiently used.
3.2 An ideal biomarker does not exist
An ideal prognostic system/marker doesn’t exist, and current approaches fall short of what is
needed when dealing with individual patients. It has been 35 years since Ranson et al. [208]
showed that it was possible to stratify patients with acute pancreatitis according to their risk of
dying. Since then, there have been thousands of articles promoting hundreds of prognostic
markers and systems. The fact that very few of these have actually found place in the clinical
practice goes on to show that we still haven’t found what we are looking for.
An ideal or desirable detection scoring system/biomarker should:
Have high sensitivity and positive prediction value (PPV).
Be able to predict necrosis early (<48 hours)
Be performed rapidly (<4 hrs)
Be available in most hospitals
Be relatively inexpensive

48 | P a g e
Be objective and not observer-dependent [209].
The extent to which different clinical, laboratory and radiological detection methods satisfy
these requirements vary greatly and show distinct limitations peculiar to each individual
system.
3.3 Current scoring methods
3.3.1 Scoring systems
APACHE II (Acute Physiology and Chronic Health Evaluation II) is a classification
system designed to measure the severity of a disease for acutely unwell adult patients [210]. In
the prediction of mortality for acute pancreatitis, it has been analysed in various studies and
has been found to have a sensitivity of 65-81%, specificity of 77-91%, PPV of 23-69% and
NPV of 86-99% [211]. Some studies have found a significant association of APACHE II with
mortality, but conflicting results were found within these as well [212-214]. Moreover, it relies
very heavily on age. In fact, a 76-year-old (6 points) would require very little physiologic
disruption to be classified in the category of ‘severe acute pancreatitis’ (>8 points). This has
been one of the arguments all along of defined number of APACHE II points when the age is
high. Hence, the need for more accurate predictors of mortality.
Ranson’s Criteria were initially introduced in 1974 for the assessment of severity of acute
pancreatitis [208]. It is an objective indicator of diseases severity and is particularly useful at
the two ends of the scale. Pancreatitis is mild when the score is ≤2, whereas pancreatitis is
severe when the score is >6. The correlation of severity of disease or development of necrosis
in patients with a score of 3-5 (which is a common occurrence) is deficient [215, 216].
Moreover, the system requires the completion of 11 measurements, which necessitates a total
of 48 hrs of observation for proper evaluation [217]. Although a modification of the Ranson’s
scoring was introduced by Blamey et al [218], the overall sensitivity of these numeric systems
in the initial staging of an attack of pancreatitis remains 65%, with specificity of 70%, PPV of
20-63% and NPV of 86-94% [211]. Some studies have found conflicting results between
patients who died compared with those who survived [208, 209, 219, 220].

49 | P a g e
The Glasgow Criteria were originally presented in 1978 [221] and the original system used
nine data elements. This was subsequently modified to eight data elements, by the removal of
the contribution of transaminase levels (either AST or ALT (>100 U/l) [218]. The Glasgow
criteria have been analysed in multiple studies and the sensitivity was found to be 94%,
specificity 28%, PPV 18-66% and NPV 86-100% [211]. The score, however, is not valid for
repeated measurements beyond 48 hrs and like Ranson’s criteria, has not been validated for
use in children.
Other scoring systems like, Mortality Probability Model (MPM) [222] and APACHE III
[223] (a modified version of APACHE II including the prior site of health care- i.e. hospital
floor, emergency room etc. – and additional physiological parameters – urine output, blood
urea nitrogen, albumin, bilirubin, glucose) at 96 hrs have been calculated and brought forward
but without creating much influence on the current clinical practice.
3.3.2 Organ failure scores
It has been shown in various studies that development of organ failure in the first week of
acute pancreatitis is not only marker of poor prognosis but also translates into local
complications later on [224]. According to Atlanta classification (AC) [5], patients with
persistent organ failure in the first week are likely to have severe acute pancreatitis. Various
organ failure scoring systems have been validated and are in clinical use. Ideally for ICU use,
these scoring systems can be used to assess patients outside the intensive care environment as
well. These include Sequential Organ Failure Assessment (SOFA) [225], Marshall’s scoring
system [226] and Goris system [227], among others.
3.3.3 Radiology scores
Unlike clinical scores, radiological scores are based on local anatomic changes in the
pancreatic and peri-pancreatic tissues. Contrast-enhanced CT scans can be used to assess
pancreatic necrosis, since loss of perfusion consequent upon necrosis results in a reduced
enhancement. In 1985, Balthazar et al [228] proposed a scoring system for the grading of
disease severity based on the CT findings. The severity of pancreatitis is divided into 5 distinct
groups, from A to E. Most patients with severe acute pancreatitis (SAP) exhibit one or more

50 | P a g e
pancreatic fluid collections and are classified as grades D or E according to the Balthazar score.
Furthermore, when the score is >5, this is defined as SAP on the CT severity index (CTSI) – a
development of the Balthazar score in which is included the pancreatic necrosis. Even in these
cases, as with the clinical scores, the commonly used radiological scores are particularly useful
in predicting survival in the absence of peri-pancreatic fluid collections (Balthazar score) or
collections/pancreatic necrosis (CTSI), but when these abnormalities are present, the scores
may miss up to 50-59% of patients who eventually die from the disease [211].
From the above mentioned facts, it is evident that there is no one most reliable predictor of
mortality and all scores and parameters seem to show a good NPV but a relatively low PPV.
The ability to confidently exclude a large cohort of patients with a low risk of mortality is of
value in the management of patients with acute pancreatitis. However, all scoring systems and
prognostic factors suffer from a low PPV and patients scoring highly on such parameters do
not necessarily progress to a fatal outcome.
3.3.4 Biochemical parameters
Much effort has been directed to develop a single, simple, rapid, affordable and reliable
laboratory test for the prediction of severity and to monitor disease progression. So far, several
single biological parameters, which represent important steps in the pathophysiology of acute
pancreatitis, have been evaluated, and several tests have been developed.
Trypsinogen Activation Peptide (TAP) is the most studied activation peptide in acute
pancreatitis. It is specifically related to the onset of acute pancreatitis and therefore, seem to be
a good marker for it [229-231]. It is rapidly cleared by the kidneys and excreted into the urine
[232], so that its detection in urine is easier than in serum. However, 30% of all patients with
acute pancreatitis have normal TAP values in urine on admission [229]. Similarly, urinary TAP
has not been able to predict mild pancreatitis following ERCP [233]. Two multicentre studies
investigated the predictive value of urinary TAP [230, 234]. The American study showed a
very high sensitivity of 100% and a specificity of 85% within 48 hrs, while the European trial
demonstrated a sensitivity of only 58% and a specificity of 73% within 24 hrs after the onset
of symptoms. Likelihood ratios for a positive urinary TAP assay at 48 hrs showed a small
increase in the positive likelihood of severe acute pancreatitis from 20% to 35% [235]. This
finding may limit the clinical usefulness of urinary TAP measurements for the prediction of

51 | P a g e
disease severity. The general accuracy of TAP alone does not qualify for clinical decision-
making. The elevated TAP concentration in severe cases decreases quickly in serum and within
72 hrs in urine, so that the prognostic accuracy declines rapidly [229-231, 234]. Moreover, the
TAP-ELISA is still too complex and too expensive to be used as a routine test in everyday
practice.
In patients with acute pancreatitis, elevated Tumour Necrosis Factor (TNF) levels have been
well documented [236]. However, TNF measurements are inconsistent even in severe disease
because of intermittent release and rapid clearance by the liver before it reaches the general
circulation.
The importance of Interleukin-6 (IL-6) in the acute phase response has been confirmed by the
observation that it stimulates the synthesis of acute phase proteins, including C reactive protein
(CRP), from hepatocytes in vitro and in vivo [237, 238]. Its concentrations peak already 24 hrs
after the onset of the disease, but decrease to baseline within four days [239]. A large series of
patients with acute pancreatitis confirmed that IL-6 levels on admission correlate well with the
subsequent course of pancreatitis [240]. But due to its rapid decline, IL-6 does not seem to be
a useful marker for monitoring disease progression. Similarly, Interleukin-8 (IL-8) levels
have been shown to increase even earlier than IL-6, with a peak detected 12 hours after the
onset of acute pancreatitis [241]. However, similar to IL-6, IL-8 decreases rapidly within 3-5
days [242] and consequently, disease progression cannot be recorded with these markers.
The most famous acute-phase reactant and most commonly used serum parameter for the
staging of acute pancreatitis is C-Reactive Protein (CRP). The importance of CRP in
predicting severity of acute pancreatitis has been shown in numerous clinical studies over the
past years [243-245]. Increased levels of CRP are a direct effect of hepatocytes stimulation by
cytokine release. This also explains the chronological delay of increased CRP levels compared
to IL-6 and IL-8 concentrations, with peak levels occurring 48-96 hrs after symptom onset.
Pezzilli et al [242] found the highest sensitivity and specificity for predicting severity of acute
pancreatitis for IL-6 and IL-8 on days 1 and 2, while on day 3 CRP surpassed both of these
mediators. This is due to the relative rapid decrease of the two cytokines. Although, CRP is a
valuable parameter for predicting severity of acute pancreatitis more than 48 hrs after the onset
of the disease and for monitoring disease progression, it does not help with prediction within
the first 48 hours of the disease onset.
52 | P a g e
Serum Amyloid A (SAA) proteins constitute a family of apolipoproteins mainly synthesized
in liver in response to cytokines [246]. SAA has been found to be of similar value for the
discrimination between oedematous and necrotising pancreatitis as CRP [247, 248]. However,
SAA was less accurate than CRP in predicting infection, multi-organ failure and death.
Moreover, in contrast to CRP, SAA does not have an accepted cut-off value. The European
multicentre trial [248] was able to demonstrate that SAA distinguishes mild from severe acute
pancreatitis already at the onset of the disease and that this difference was significant for the
whole observation period of five days. However, the other trial could not demonstrate the early
predictive value of SAA [247].
It is very clear from the discussion above that despite the proliferation of scoring systems and
biochemical parameters for grading acute pancreatitis, there is still no single system or
biomarker which is completely reliable in accurately predicting the severity of the disease
within the first 48 hrs.

53 | P a g e
CHAPTER 4: GENE EXPRESSION AND
MICRO RNA PROFILING
4.1 Circulatory blood (peripheral) gene expression profiling

54 | P a g e
Gene expression profiling represents a new and promising tool which could enable us to come
up with a more comprehensive management of human diseases and disease risk factors. In
particular, microarray based transcriptional portraits (transcriptomes) of disease can identify
disease-specific signatures [249, 250], which will ultimately be translated into clinically useful
molecular biomarkers. Recently, investigators have measured gene expression of the pancreas
in experimental pancreatitis and have identified several novel genes which are likely to be
important in the development and severity of acute pancreatitis [251, 252]. Ji et al [251] utilized
microarrays to identify genes commonly induced in rat pancreatic acinar cells within 1-4 hours
in two in vivo models (caerulein and taurocholate) and observed that a complex programme of
gene expression was rapidly initiated early in the course of the disease. Their data suggested a
model in which early signalling events led to activation of transcription factors which regulated
the expression of specific cellular and secreted molecules. These secreted factors were
hypothesised to be useful prognostic indices for the disease. Similarly, some researchers have
identified genes likely to be involved in the endogenous self-protection mechanisms in acute
pancreatitis using experimental animal models [253], while others have studied changes in the
population of leukocytes in pancreatitis and have emphasized on a pathogenetic role of immune
system in the development of acute pancreatitis [254].
Although the early acinar cell expression is important for the subsequent severity of acute
pancreatitis and could provide insight into the mechanisms involved in the initiation of acute
pancreatitis [251], obtaining pancreatic tissue to analyse acinar cell gene expression is not a
practical option in human patients. This difficulty in obtaining pancreatic samples has clearly
impeded transcriptomic research in this area.
Circulating blood is easily accessible and has been suggested as an alternative to tissue samples
for molecular profiling of human disease and disease risk. This is based on the capacity of
peripheral blood to reflect pathological changes in the body and the identification of these
alterations as a blood molecular signature. Since sample acquisition is a daunting challenge for
the application of molecular profiling as a diagnostic tool or for the identification of candidate
risk factors, possibility of utility of peripheral blood cells as ‘surrogate’ for biopsy tissue for
profiling in humans [255] appears to be an attractive option. Blood sampling enables relatively
large samples to be collected and is highly amenable to standardisation of technical procedures.
Thus, blood represents an attractive alternative sample for profiling human diseases and
discovering new biomarkers.

55 | P a g e
Recent studies have shown that the peripheral blood leukocytes have the ability to respond
differentially to varying environmental, physiological and pathological insults or perturbations
occurring anywhere in the body. Indeed, these cells have been found to share more than 80%
of the transcriptome with each of the nine tissues tested in one of these studies, namely: brain,
colon, heart, kidney, liver, lung, prostate, spleen and stomach [256]. It also showed that these
blood cells expressed organ specific genes, such as β-myosin heavy chain (heart) and insulin
(pancreas).
Early profiling studies of the peripheral blood leukocytes involved analysis of haematological
malignancies where these cells displayed disease-specific gene-expression signatures accurate
enough to identify clinically relevant patient subgroups (i.e. subgroups associated with
response to treatment, prognosis and novel malignancy subtypes) [257]. Others profiled gene
expression of peripheral blood leukocytes in a wide range of non-haematological disorders and
demonstrated that monitoring gene expression in blood results in distinct transcriptional
signatures for more than 35 different conditions in humans [256], including, osteoarthritis
[258], schizophrenia [259], cardiovascular disease and various types of cancers: bladder [260],
colorectal [261] and breast [262].
In the recent years, the peripheral blood leukocyte gene expression in cardiovascular disease
has been the target of extensive investigations. In one of the initial studies, Ma et al identified
significant differences between blood samples from coronary artery disease (CAD) patients as
compared to healthy controls [263]. Some of these changes could be interpreted in terms of
potential contribution of peripheral blood leukocytes to the pathogenesis of CAD [263]. In
another study, peripheral blood leukocytes responded to changing plasma lipid levels by
regulating a network of genes, including genes involved in immune responses and
inflammation and in lipid and fatty acid metabolisms [264]. This study provided further data
on the inert relationships between plasma lipid levels and leukocytes in the atherogenic process.
It also suggested that peripheral blood leukocyte gene expression profiling was not only useful
for identifying disease biomarkers but might also shed light on disease pathways involved.
Similarly, Chon et al [265] studied changes in mRNA levels in leukocytes from untreated or
treated hypertensive patients. Their findings indicated that microarray gene expression
profiling of peripheral leukocytes can distinguish hypertensive patients from age- and sex-
matched controls.

56 | P a g e
In oncology studies, Twine et al [266] tested for surrogate transcriptional markers in peripheral
blood mononuclear cells of patients with renal cell carcinoma; an eight-gene classifier set was
identified to best predict renal cell carcinoma versus normal. Subsequently, the same group
showed significant correlation with overall survival and progression-free survival in patients
in a phase II study of CCI-779 [267]. In another study, Sharma et al [262] reported a 37-gene
signature that detected breast cancer correctly in more than 80% of cases. In this study, female
patients without cancer but with other comorbidities were classified correctly as ‘non-cancer’,
highlighting the specificity of the breast-cancer signature identified from blood.
Many other studies support the power of blood leukocyte gene-expression profiling in disease
detection, classification and diagnosis. Such studies have investigated profiles in asthma [268],
severe lupus erythematous [269], rheumatoid arthritis [270], Crohn’s disease and ulcerative
colitis [271], pulmonary arterial hypertension [272], ischemic stroke and Alzheimer’s and
Huntington’s diseases [273, 274].
4.1.1 Peripheral blood gene expression profiling in acute pancreatitis
Based on all the above mentioned evidence, it can be confidently stated that microarray based
peripheral blood leukocyte gene-expression profiling holds great promise. But to date, no one
has actually studied the role of blood derived inflammatory cells as markers for pancreatic
inflammation. It is hypothesised, for this project, that the peripheral blood leukocytes can serve
as a ‘reporter function’ as biomarkers of acute pancreatitis, and as such would express unique
genes during pancreatitis. Further, as discussed before, these cells represent an easily
accessible, non-invasive source of material. This easy availability of blood leukocytes to
provide reporter function for solid organ disease will likely prove useful in pancreatitis. It is
therefore, postulated, for the reasons stated above, that the response to pancreatitis and
potentially the prognostic indicator of disease severity, rests in the peripheral blood leukocytes.
These are the cells which mediate the immunologic reaction to pancreatitis. The genetic map
of these leukocytes during this disease has not been looked into before. Recently, Bluth et al
[275] looked into the gene expression profiles in cells of peripheral blood in a rat model of
experimental pancreatitis (sodium taurocholate) and used a model of septic shock and saline
controls as controls to identify new molecular markers of acute pancreatitis using microarray
technology. They found 140 genes which showed unique significant changes in expression of

57 | P a g e
PBMCs during the acute phase of acute pancreatitis, but not in sepsis. They concluded that
pancreatitis related genes are induced in cells outside the pancreas – in peripheral blood
mononuclear cells during necrotising pancreatitis. It should not be surprising that such genes
are induced since these genes were originally identified from inflamed pancreatic tissue which
likely already had similar peripheral blood mononuclear cells infiltrating them.
4.1.2 Gene expression Microarrays
Gene expression microarrays have revolutionised the advances in genomics. From analysis of
378 arrayed lysed bacterial colonies in 1982 [276] to complete eukaryotic genome expression
on a microarray in 1997 [277], the microarray technology has come a long way in developing
our understanding of molecular mechanisms underlying normal and pathological biological
phenomena. It has enabled us to measure expression of the whole human genome with a
single biological sample and provide a snapshot of all the transcriptional activity in it.
Microarrays have facilitated the discovery of totally novel and unexpected functional roles of
genes, as opposed to study of a single gene or a subset of genes which was the only possible
molecular biology application available in the past. These tools have helped molecular
biologists in discovering novel disease subtypes, developing new diagnostic tools, and
identifying underlying mechanisms of disease or drug response.
4.2 MicroRNA Profiling
MicroRNA (miRNA) have emerged as the most significant scientific discovery of the decade.
Their role in understanding pathophysiology of many disease processes, as diagnostic,
prognostic and predictive tissue specific biomarkers, is only just beginning to be unravelled
[278-288].
These are small (18-22 nucleotide), non-coding RNA that arise from a longer precursor RNA,
exhibiting a hairpin structure. The active 22 nucleotide moiety then gets incorporated into the
composite machinery – this results in translational silencing when it forms a partial duplex
with the 39 untranslated regions of the targeted mRNA [289, 290]. Other mechanism
proposed for its gene expression control is by degradation of mRNA.

58 | P a g e
MicroRNA regulate gene expression and are implicated in many biological and pathological
processes, including modulation of haematopoietic lineage differentiation, insulin secretion,
apoptosis, stress response and cell and organ development [291-295]. A single miRNA can
regulate an average of 200 mRNA targets and concurrently, a single mRNA can be regulated
by several miRNA, leading to a very complex genomic regulation of the disease process
[289].
MicroRNA have been particularly appealing due to their stability in various tissues samples,
even post-fixation. These can still be extracted and assessed with incredible efficiency and
reliability [296]. Since circulating nucleic acids usually occur in very small amounts in the
body fluids and are very difficult to extract and detect reliably [297], this miRNA stability
can certainly be exploited into development of practical detection methods, rendering them
almost perfect to act as clinical biomarkers. Recent studies have also revealed the possible
superiority of miRNA over mRNA in terms of accuracy as biomarkers since mRNA has to be
translated into a protein for it to exert its effect, whereas, miRNA are an active moiety in
themselves, impacting the expression of multiple genes and therefore, are more likely to
emulate the real biological and pathological events. Also, it is postulated that powerful and
yet simple approaches to miRNA characterisation and quantification will far outweigh
traditional, more cumbersome and inconvenient proteomic biomarker discovery techniques in
terms of biomarker validation [298]. Furthermore, miRNA are more likely to predict clinical
behaviour, prognosis and therapeutic response in pathological states with more accuracy
since these influence the behaviour and phenotype of the tissue these are expressed from.
Additionally, it has been established in some well-designed recent studies that miRNA enter
circulation and stay in it in unaltered form. The reasons behind this remarkable stability are
predicated to be them being packaged within exosomes secreted from cells [299] or found in
protein associations – Argonaute [300] or Nucleophosmin [301, 302]. This protects them
from degradation from endogenous RNAses, contributing towards their inherent stability and
making them an ideal candidates for serum/plasma based biomarkers. This also makes them
best suited for affecting the distant cells in way of novel signalling molecules and mediating
short and long range inter-cellular communication as extra-cellular messengers.
4.2.1 MicroRNA profiling in sepsis and acute pancreatitis

59 | P a g e
Sepsis usually results from malfunction of regulatory mechanisms, precipitating loss of
control of inflammation, immunosuppression and tissue/organ damage [303-305]. MiRNA
have been found to play a pivotal role in sepsis – these strictly regulate the expression of pro
and anti-inflammatory genes involved in disease process, mainly correlated with cytokines
[306] and therefore, their aberrant expression can be investigated to be used as diagnostic,
prognostic and predictive marker.
Sepsis provides a good model for acute pancreatitis, where many patho-physiological
processes are similar and the critical driving immune responses are identical. Therefore, it
doesn’t come as a surprise that the prognostic role of miRNA in acute pancreatitis has been
investigated on the similar lines.
Current literature and body of research has identified at least three potential roles for miRNA
in the setting of acute pancreatitis - as a diagnostic/prognostic marker, as a marker of
pathophysiological processes in the pancreatic tissue and as a marker of mediation of end-
organ/distant organ failure due to their ability to act as inter-cellular signalling molecules.
The last one is especially intriguing since the evidence on distant organ failure in acute
pancreatitis is not as well defined as local complications.
4.3 Messenger RNA and Micro RNA interaction
The complex genomic relationship that results from mRNA and miRNA interactions
translates into a stringent control that is exerted by miRNA on cellular protein output and
function. Needless to say, learning more about mRNA and miRNA interactions is absolutely
crucial in identifying important cellular pathways that are pivotal to patho-physiology of the
disease.
Currently, there are few methods in place to identify regulatory miRNAs. The most
traditional method remains based on microarray expression data, using prediction algorithms
such as TargetScanS [307], PicTar [308] and miRanda [309] and gene set testing [310].
Another newer and perhaps a better method has been put forward which is based on Odds
Ratio [311]. This methods takes expression data from both miRNA and mRNA into
consideration and determines if there is an association between miRNA expression and its
predicted targets. If the association is found to be statistically significant, the miRNA is

60 | P a g e
considered to be regulatory. Some of the other publications have also put forward varying
integrative methods but these are not without their limitations – these do not take into
consideration the fact that miRNA may co-regulate a group of mRNAs [311]; these may not
provide any information on miR-mR pairs of interest [312, 313]; expression data correlation
between miRNA and mRNA is not taken into account [312]; Identification of the modules is
always based on negative correlation between miRNA and mRNA [314] which is not always
true, as has been recently shown in a study [315]. These limitations have been overcome and
dealt with in a new statistical model proposed [316] that identifies regulatory miRNA clusters
regulating mRNA clusters and estimates the association between the two, since both the steps
are crucial for obtaining more useful biological information.
With this in mind, the plan is to take a systems biology approach to attain better
understanding of the biological processes and the disease. This will be in line with the key
components already outlined for this approach – measurement of the molecules, integration
of biological information, identification of molecular responses to the disease process,
formatting models to be tested and consequent refinement of these models though hypothesis
testing. These models can then be utilised to predict disease responses, identify new time
points in the course of the disease and add to our understanding of the key pathophysiological
events [317].

61 | P a g e
CHAPTER 5: HYPOTHESIS AND AIMS

62 | P a g e
5.1 Hypothesis
It is hypothesised that mild and severe acute pancreatitis are two distinct entities, associated
with different disease courses.
Gene expression and miRNA profiling can identify gene and miRNA signature/s which may
be exploited to act as potential prognostic markers to predict severity of the disease at the
time of admission.
5.1.1 Aims
To establish protocol and Standard operating procedures for collection of samples from
patients with acute pancreatitis and establish and an Acute Pancreatitis Biobank,
associated with Acute Pancreatitis Database, housing demographic and clinical
information for the recruited patients.
To develop a gene expression profile of peripheral blood in patients with acute
pancreatitis and identify differentially expressed genes between mild and severe acute
pancreatitis.
To develop a micro RNA profile of peripheral blood in patients with acute pancreatitis
and find a micro RNA signature which will accurately stratify patients in mild and
severe groups.
5.1.2 Objectives
To measure gene expression profiles in patients with mild and severe acute
pancreatitis, using RNA extracted from peripheral blood collected within the first 24
hours of disease presentation.

63 | P a g e
To measure micro RNA profiles in patients with mild and severe acute pancreatitis,
using RNA extracted from plasma samples of patients collected within the first 24
hours of disease presentation.
To develop a protocol which not only suits the needs and demands of the project but
is also robust and reproducible for the main study.

64 | P a g e
CHAPTER 6: LIVERPOOL PANCREAS
RESEARCH UNIT ACUTE PANCREATITIS
BIOBANK, DATABASE, SAMPLE
COLLECTION AND CLINICAL DATA

65 | P a g e
Acute pancreatitis research is severely limited by the availability of biological samples at
appropriate and clinically relevant time points. The first 24 hours are the most crucial in
terms of diagnosing, predicting the severity of the attack and intervening in the right patient
group. For all of this to happen, it is fundamental that the biological processes during this
time period are properly understood at the cellular and molecular level.
The Liverpool NIHR Pancreas Biomedical Research Unit (PBRU) was established in 2008
with the mandate to translate basic pancreatic research into a clinical setting, in order to
improve the treatment of patients with acute pancreatitis, chronic pancreatitis and pancreatic
cancer.
The three main themes of research are:
Drug discovery and development of new interventions
Application of new diagnostic and imaging strategies
Validation of new biomarkers and screening protocols
In 2010, the Liverpool NIHR Pancreas Biomedical Research Unit (PBRU) Acute pancreatitis
(AP) Biobank was established to enable us to create a pool of patient samples which will
contribute towards various research projects in the fields of proteomics, genomics,
metabolomics and pharmacology. This was established under the ethical approval awarded by
the Sheffield Ethics Committee (reference number 10/H1308/31).
The PBRU Biobank is managed on the basis of set of rules and regulations governing the
collection, storage and future use of these samples. The samples for the PBRU AP Biobank
are obtained and stored from donors for research purposes in compliance with the Human
Tissue Act, 2004. All individual studies, where the biobanking of samples is required, have to
have the approval of the Executive Director and full ethical approval before the study begins.
All studies have to be transparent, auditable, and allow the chain of custody of all samples to
be followed at all times. Samples are only taken from donors following full, informed
consent given by the donor.

66 | P a g e
Standard Operating Procedures (SOPs) are in place to control all aspects of sample storage.
SOPs contain details and follow procedures concerning:-
Donor identification
Obtaining consent
Sample anonymisation
Sample collection
Sample processing
Sample storage (including database storage of sample information and coding)
Sample analysis (samples to be analysed according to ethically approved sample
protocols for the study)
All procedures are COSHH (Control of Substances Hazardous to Health Regulations)
and risk assessed and obey University of Liverpool (and where applicable NHS)
Health and Safety rules
SOPs are signed off by the author, with two signatories to approve the SOP and
Quality Assessment (QA) review, which ensures that only approved SOPs that comply
with the applicable regulatory requirements for the study are produced
All SOPs are version controlled (by the Liverpool Cancer Trials Unit Document
Management System) and only issued to designated copyholders
The location of the freezers where the samples are to be stored, and the electronic
database are clearly identified
A Disaster Recovery Plan is in place in the event of equipment failure
The Biobank stores samples obtained from patients who present and are admitted to Royal
Liverpool University Hospital (RLUH) with provisional diagnosis of acute pancreatitis. After
obtaining informed written consent, these samples are collected at specific time points – 24
hours, 48 hours, week one, two and four of patient’s hospital stay. Once a patient is
discharged, no follow-up is undertaken and patients are not contacted for further
samples/information. The whole blood collected from these patients is taken to PBRU
laboratory immediately and processed according to specific Good Clinical and Laboratory
Practice (GCLP) approved Standard Operating Procedures (SOPs) to render plasma, serum
and white cell pellets. Whole blood is collected into PAXgene Blood RNA tubes and stored
in -800C freezer for RNA isolation to be undertaken later on.

67 | P a g e
Clinical data from these patients is recorded in the Acute Pancreatitis database. It consists of
two linked databases, first of which is an identifiable database of demographic data that
includes name, date of birth, address, General Practitioner details and hospital unit number,
with a coded link to a second pseudo-anonymised clinical database. The identifiable
demographic database is stored on a password-protected, separate Royal Liverpool
University Hospital network drive. The separate pseudo-anonymised clinical database is
maintained on a password-protected, separate University of Liverpool network drive. This
specifically designed clinical database includes details of each coded patient's presenting
features, diagnostic tests, clinical course, interventions, complications and outcome, obtained
predominantly from patient medical records, and includes a coded link to the patient's banked
research samples. The banked research samples are also coded and are not identifiable
without reference to the pseudo-anonymised Clinical Database and from that to the
demographic database. The clinical database contains all relevant Good Clinical Practice data
on every research sample, including when taken, when processed and where stored. Only
PBRU staff have access to the full data set and are able to link samples back to individual
patients.
6.1 Sample collection
All samples for the project were obtained from the Liverpool NIHR PBRU Acute Pancreatitis
Biobank. These samples have been collected following the SOP ‘Collection of Samples for
the Acute Pancreatitis Biobank in the PBRU’ (version 3, document reference SOP 051). A
brief overview of the process is described below.
Patients with probable diagnosis of acute pancreatitis are identified first through biochemistry
department of RLUH, where a list is generated of all patients who have presented with raised
amylase levels (>450 U/l, three times the normal range) in the last 24 hours. These patients
are then reviewed for their suitability for inclusion (clinical and biochemical picture
compatible with the diagnosis). After obtaining written informed consent, blood samples are
collected using premade kits with pre labelled tubes, in line with the Laboratory Information

68 | P a g e
Management System (LIMS). Kits are used according to the time point at which patient is
being approached for the sample collection, e.g., Kit A is used for the first 24 hours samples,
Kit B for the 48 hours, week 1, 2 and 4 samples and Kit C for all other time points.
Approximately 20 mls of blood is drawn into two BD Vacutainer® K2 EDTA tubes (10 and 4
mls) for plasma and cell pellet extraction, BD Vacutainer® SST™ tube for serum and
PAXgene Blood RNA Tube (BRT) for RNA extraction to be undertaken later on. These
samples are then taken to the PBRU laboratory and processed according to the SOP
‘Processing of Samples for the Acute Pancreatitis Biobank in PBRU’.
PAXgene BRTs were collected at 24 hours, 48 hours, week 1, 2 and 4 time points. These
were either stored within 10 minutes of being collected in -800C freezer in the GCLP
laboratory (time 0 hour samples) or incubated at room temperature for two hours after being
collected before being stored at -800C (time 2 hours samples). For the sake of this project,
only PAXgene BRTs collected within the first 24 hours of patient admission were included
and RNA extractions undertaken from these. Since this part of the study was majorly
intended for sample size calculations and for assessing baseline variability among our patient
population, only patients with mild pancreatitis were included.
The definitions of mild and severe acute pancreatitis are in accordance with the Atlanta
Classification for acute pancreatitis [5]. Presence of organ failure (renal, respiratory,
cardiovascular, hepatic, nervous system) within the first week of admission or development
of pancreatic parenchymal necrosis after that is considered as severe form of the disease. The
severity of the disease was estimated only when patients had been discharged or had died.
Data pertaining to these would be derived from the PBRU Acute pancreatitis database which

69 | P a g e
is a prospective database storing all the clinical and demographic information on our patients
who have donated samples to us.
In order to determine if there was a difference in the gene expression of the samples stored at
different time points from the time of collection, two PAXgene BRTs were collected from six
patients, one stored within 10 minutes of being collected (time 0 hour samples) and the other
one after two hours of incubation at room temperature (time 2 hours samples). All these pair
matched samples were stored in the -800C freezer in the GCLP laboratory.
6.2 Clinical Data
Clinical characteristics were collected for all included patients. These were retrieved from the
Liverpool NIHR PBRU Acute Pancreatitis Database that houses information on patients who
are recruited to the Acute Pancreatitis Biobank. This information includes their demographic
data and detailed account of their hospital admission. These are as follows:-
Details of hospital admission (symptom onset, date and time of admission, length of
stay, aetiology)
Details of co-morbidities (in the form of Charlson’s scoring), past surgical and
specifically, biliary surgery and in use medication
Details of haematology and biochemistry (blood tests) and scoring systems (APACHE
II)
Details of imaging (ultrasound, CT scans) and microbiology
Details of surgical procedures (if undertaken)
Details of intensive care admission – supportive treatments used

70 | P a g e
Details of complications and outcomes
These data were used to label these patients as mild and severe according to Atlanta
classification (1992) for the purpose of data analysis. During the course of the project, revised
Atlanta classification was published, which was soon followed by determinant based
classification. Since this project was conceived and started, with samples collected, before the
new classifications were proposed, it was deemed best to continue with the old Atlanta
classification and therefore, data analysis was undertaken according to that.
Keeping in mind the objectives of this study, it was obvious that Atlanta classification [5]
would be used to include/exclude patients for this study. Accurate characterisation of the
patient cohort would be of paramount importance. Sample size calculations had indicated a
sample size of 40 in mild and severe categories. Patient characteristics were retrieved from
the Acute Pancreatitis Database. This is a database set up in 2010 in line with the Acute
Pancreatitis biobank. The aim was to collect phenotypic information on all the samples being
collected for research so that genotype could be correlated with the phenotype of these
patients. The database contains comprehensive data on clinical features and outcomes of
these patients who have been recruited to donate samples to the biobank.
Diagnosis of acute pancreatitis was based on two of the following three features: 1)
abdominal pain suggestive strongly of acute pancreatitis, 2) serum amylase activity at least
three times greater than the upper limit of normal 3) characteristic findings of acute
pancreatitis on trans-abdominal ultrasonography or on Contrast Enhanced CT (CECT) scan.
As indicated, patients who developed organ failure (OF) lasting for more than 48 hours (i.e.,
organ failure recorded at least once during each of three consecutive days) or developed
>30% pancreatic necrosis were classified as severe patients. The first hospital day was
designated as day 1; day 2 started at 8 AM on the following day and lasted for 24 hours.

71 | P a g e
Persistent evidence of organ failure (one or more organ systems) on at least one occasion on
three consecutive days was recorded for each patient. Patients with no complications or
transient OF were classified and included in the mild group.
6.2.1 Definitions of organ failure
This was defined according to Sepsis-related Organ Failure Assessment (SOFA) scoring
[225]. As per AC, only respiratory, renal and CVS failures were considered for severity
assessment. A score of ≥2 was considered. Although Atlanta classification advises use of
Marshall Scoring system for organ failure, SOFA score was chosen for the ease of recording
on patients. Marshall scoring requires assessment of cardiovascular status by taking into
consideration patient’s response to fluid resuscitation. This can only be undertaken
prospectively, while one attends to the patient. Accurate quantification of the same may
become problematic and potentially, impossible retrospectively. SOFA is easy to use and
record and takes six organ systems into consideration. It is also important to note that point
criteria and hence points scored on both the scoring systems are more or less the same,
therefore, organ failure for the purpose of this project was assessed through SOFA scoring.
Definitions are detailed in table 1.
Table 6.2 - SOFA Scoring System
System 1 2 3 4
Respiratory
PaO2/FiO2
mm Hg
<400 <300 <200* <100*
Coagulation
x 103 mm3
<150 <100 <50 <20
Liver (bilirubin) 20-32 33-101 102-204 >204
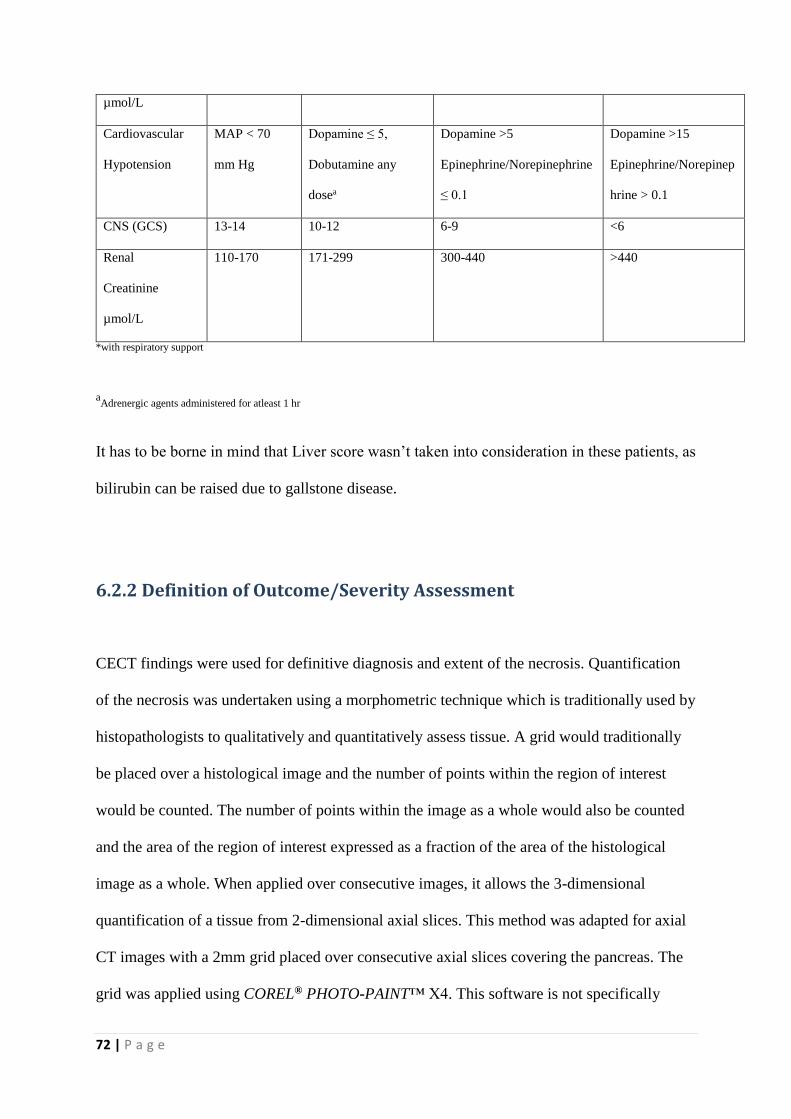
72 | P a g e
µmol/L
Cardiovascular
Hypotension
MAP < 70
mm Hg
Dopamine ≤ 5,
Dobutamine any
dosea
Dopamine >5
Epinephrine/Norepinephrine
≤ 0.1
Dopamine >15
Epinephrine/Norepinep
hrine > 0.1
CNS (GCS) 13-14 10-12 6-9 <6
Renal
Creatinine
µmol/L
110-170 171-299 300-440 >440
*with respiratory support
aAdrenergic agents administered for atleast 1 hr
It has to be borne in mind that Liver score wasn’t taken into consideration in these patients, as
bilirubin can be raised due to gallstone disease.
6.2.2 Definition of Outcome/Severity Assessment
CECT findings were used for definitive diagnosis and extent of the necrosis. Quantification
of the necrosis was undertaken using a morphometric technique which is traditionally used by
histopathologists to qualitatively and quantitatively assess tissue. A grid would traditionally
be placed over a histological image and the number of points within the region of interest
would be counted. The number of points within the image as a whole would also be counted
and the area of the region of interest expressed as a fraction of the area of the histological
image as a whole. When applied over consecutive images, it allows the 3-dimensional
quantification of a tissue from 2-dimensional axial slices. This method was adapted for axial
CT images with a 2mm grid placed over consecutive axial slices covering the pancreas. The
grid was applied using COREL® PHOTO-PAINT™ X4. This software is not specifically

73 | P a g e
designed for use in morphometry. It is primarily used as an editing package for digital
photographs. However, it contained several features which allowed it to be used for
manipulating the CE-CT images for the morphometric analysis. It also allowed for the
magnification of the images if required. The whole of the pancreas was clearly identified,
outlined and divided into head, body and tail before the point-counting was commenced.
Both viable and non viable areas in each part of the pancreas were assessed using this method
and this was expressed as a fraction of the area of the pancreas as a whole. This process was
repeated for all axial slices of the abdomen which included the pancreas (average of 60 slices
per CE-CT scan) and the average of each consecutive fraction was calculated as the
percentage necrosis of the pancreas. The percentage necrosis was assessed for each part of
the pancreas for each CT scan included in the study.
Axial slices obtained in the portal phase of contrast enhancement (approximately 70
seconds) were reviewed.
There is no consensus on the exact boundaries of the different parts of the pancreas. Major
anatomy [318] and pancreas [319] textbooks, although divide pancreas in to head, neck, body
and tail, do not define the boundaries between these major parts. For the purpose of this
project, it was imperative that we defined these anatomic divisions precisely. According to
‘Radiology of Pancreas [320] (a textbook on dedicated pancreatic radiology), the head of the
pancreas along with the uncinate process is taken as the part of the pancreas which is seen on
the right of the mesenteric and portal veins. Neck is constricted portion of the pancreas lying
to the left of the right border of the superior mesenteric vein and to the right of its left border.
According to the classification proposed by the Japanese Pancreas Society, portion of the
gland left to the left border superior mesenteric vein is bisected into the body (the right half)
and the tail (the left half). However, it was important that these boundaries would be visible
on the CE-CT too.

74 | P a g e
Pancreatic necrosis was defined as the loss of normal enhancement of the pancreas when
compared with the liver and spleen as well as loss of the normal lobulated pancreatic outline.
Reduced enhancement without loss of normal architecture was not considered to be necrosis.
For the purposes of this study, pancreatic pseudocyst, phlegmon and peripancreatic abscesses
were noted but not included in the pancreatic necrosis estimation. Pancreatic abscesses were
quantified in a similar manner but separate to necrosis.
Pancreatic pseudocysts and peri-pancreatic abscesses were noted when present.
6.3 Classifications of severity of acute pancreatitis
When the project was conceived, Atlanta classification [5] was taken as the guide for
defining the severity of the disease. Definitions considered are as follows:-
Mild acute pancreatitis is defined as the absence of organ failure or the presence of organ
failure that does not exceed 48 hours in duration (Transient organ failure).
Severe acute pancreatitis was defined as persistence of organ failure – organ failure
documented at least once in three consecutive days (Persistent organ failure) and/or presence
of >30% pancreatic necrosis.
However, during the course of the project, at least two more clinically relevant and
internationally agreed upon classifications were published and widely discussed. These
were:-
Determinant Based Classification (DBC) [321] – This one hypothesised that the spectrum
of the disease was too wide to be classified into just two categories and therefore, more
classes were needed for more accurate description of the disease as the outcomes varied with
each. This classification proposed four different groups:-
Mild – No peri-pancreatic necrosis or organ failure

75 | P a g e
Moderate – Sterile pancreatic necrosis and/or transient organ failure
Severe – Infected pancreatic necrosis or persistent organ failure
Critical – Infected pancreatic necrosis and persistent organ failure
Revision of Atlanta Classification [322] – Like DBC, this web based consensus also
recognised the short-comings of the old AC and aimed to improve the assessment of severity
through sensible integration of new concepts of the pathology in with the existing
information which should then consequently, help with standardised reporting of the data and
of the disease management across the globe. Their revision classified the disease into three
different categories:-
Mild – No organ failure/local or systemic complications
Moderately severe – Transient organ failure, local complications or exacerbation of a
comorbid disease.
Severe – Persistent organ failure
Local complications have been defined as peri-pancreatic fluid collections, pancreatic and
peri-pancreatic necrosis (sterile or infected), pseudocyst and walled-off necrosis (sterile or
infected).
As mentioned and explained above, this project only concerns the old Atlanta classification.
6.4 Clinical Data
During the time of my PhD, I managed to recruit 315 patients with acute pancreatitis to the
Acute Pancreatitis Biobank. These included patients who had primarily presented to Royal
Liverpool University Hospital (RLUH) with the disease and also the ones who had been
transferred from other hospitals for more definitive and ongoing management of their
complicated disease course. I obtained and processed samples from them at different time

76 | P a g e
points, for the biobank. These were at the time of admission, 48 hours, 72 hours, week 1, 2
and 4. This amounted to approximately 800 samples in 18 months duration.
For this project, I only included fifty eight patients, who had presented primarily to RLUH
and their samples were collected within 24 hours of hospital presentation. They had been
recruited prospectively to Acute Pancreatitis Biobank from June 2010 to June 2012 and
samples were collected prospectively at the time of admission. Baselines characteristics were
also recorded for each patient and clinical details observed for the length of the stay. Severity
assessment was then undertaken retrospectively (at the end of the clinical episode), using
Atlanta Classification to see if the patient had a severe or mild attack. Baseline demographic
characteristics are given below in table 6.1.
Table 6.2 – Demographic characteristics of included patients
Characteristics Mild Severe
Median Median
Number 35 23
Gender (Male/Female) 20:16 14:9
Age (years) 64 63
Aetiology
Gallstones
Alcohol
Post-ERCP
Idiopathic
20
9
2
4
16
5
1
1
Duration (Symptoms to
admission) (hours)
6 4
Duration (Admission to
sampling) (hours)
14.6 15.5
Duration (Symptoms to
sampling) (hours)
22.75 20.25
History of acute pancreatitis 9 5
Length of hospital stay
(days)
10 16

77 | P a g e
Clinical co-morbidities were also taken into consideration for the recruited patients using
Charlson’s Co-morbidity index. Smoking and alcohol history was ascertained using World
Health Organisation’s recommended Alcohol, Smoking and Substance Involvement
Screening Test (ASSIST) (Version 3). These data are presented in table 6.3.
Table 6.3 – ASSIST and Charlson’s scores for included patients
Parameters Mild Severe
Median Median
Smoking 20 15
ASSIST score - Smoking 25 20
ASSIST score - Alcohol 27 26
Charlson’s score 2 3
Prediction of severity of the disease was recorded using Glasgow’s criteria, and CRP values
at the time of admission, at 48 hours and at the end of week one. These values are illustrated
in table 4. Glasgow and APACHE II scores were not found to be of significance in our
dataset, with non-discriminatory values between the two groups. Only CRP values at
admission, 24 and 48 hours were significantly different between mild and severe groups.
Table 6.4 – Prediction of Severity of included patients
Mild Severe
Median Median
Glasgow score on admission 1 2
Glasgow score at 48 hours 1 2
CRP on admission (mg/dl) 31 78
CRP at 48 hours (mg/dl) 130 216
CRP at 72 hours (mg/dl) 136 272
APACHE II score on admission 7 8
APACHE II score at 48 hours 7 8
Approximately 76% of MAP patients underwent ultrasound scanning to assess for presence
of gallstones. This amounted to 56% in SAP patients. Almost the same number in both the

78 | P a g e
groups had CT scan to assess severity of the disease. CT severity index (CTSI) was
understandably higher in SAP than in MAP group, largely due to severe localised disease in
the form of fluid collections in SAP. Also, extent of pancreatic parenchymal necrosis was
more prevalent in SAP than in their counterparts. While similar number of patients in both
the groups had two CT scans, slightly more patients went on to have a third and then a fourth
scan in SAP group (3 vs. 5; 1 vs. 3 respectively). Extra-pancreatic complications, identified
on the CT scans, included, gastric outlet obstruction, ascites, pleural effusion, thromboses
(portal vein, splenic vein, superior mesenteric vein), splenic infarcts and liver abscesses.
Details of radiologic findings are summarised in the table below.
Table 6.5 – Imaging details of included patients
Mild Severe
Median Median
Ultrasound undertaken 26 13
CT undertaken 19 20
CTSI 4 6
Balthazar Score 2 14 10
Balthazar Score 4 3 9
No Pancreatic necrosis 13 10
Pancreatic necrosis < 30% 15 2
Pancreatic necrosis >30% 0 6
Only five patients needed intubational feeding. Interestingly, two belonged to MAP and three
to the SAP group. The duration of the feeding averaged to five days. None of the patients
required total parenteral nutrition. Only two patients underwent minimal access
retroperitoneal pancreatic necrosectomy (MARPN). One patient required two procedures,
whereas, adequate debridement was achieved after three procedures in the other. Another
patient required open necrosectomy. One patient in the MAP group and two in the SAP
needed percutaneous drainage of peri-pancreatic collections.

79 | P a g e
Thirteen (56%) SAP patients needed intensive care admission and care – mainly for
respiratory and cardiovascular support, in the form of inotropes and ventilation. The average
ITU/HDU stay was eight days. As anticipated, none of the MAP patients needed such input
and were all managed on the wards, without additional organ support.
Table 6.6 shows the daily SOFA scores between the two groups. The scores are distinctly
higher for the SAP patients – this becomes more evident and significant from day four
onwards when the scores become almost normal for the MAP, but increase or are consistently
the same for the SAP. It would not be wrong to say that the discriminatory value of SOFA
scores increases after 72 hours, based on our dataset.
Table 6.6 – SOFA scoring of included patients
Mild Severe
Median Median
SOFA score Day 1 1 2
SOFA score Day 2 1 2
SOFA score Day 3 1 3
SOFA score Day 4 0 3
SOFA score Day 5 0 4
SOFA score Day 6 0 3
SOFA score Day 7 0 3
Table 6.7 shows the overall and organ specific complications in our dataset. While all SAP
patients, by definition, had complications, 12 out of 35 MAP also had various complications
but not fitting the SAP criteria. These included pleural effusion (n=3), acute coronary
syndrome (n=2), Portal vein thrombosis (n=1), cardiac arrhythmias (n=1) and pancreatic
parenchymal necrosis of less than 30% (n=4). Five of the SAP (21%) had acute circulatory
failure for more than 48 hours. Vascular complications in four SAP patients comprised portal,
splenic and superior mesenteric vein (SMV) thromboses and pseudo-aneurysm. Almost half
of all the SAP patients developed respiratory complications – five had respiratory failure for

80 | P a g e
more than 48 hours; others had pleural effusion (n=5), atelectasis (n=4) and hypoxia (n=2).
Approximately 49% of all SAP patients were found to have pancreatic parenchymal necrosis
of more than 30%, categorising them into the severe category. Pseudocysts were identified in
four cases, along with a liver abscess and a small bowel fistula.
None of the included patients had any neurological complications.
Seven patients (30%) with SAP died during the course of the disease, accounting for an
overall mortality of 12%.
Table 6.7 – Complications of included patients
Total Mild Severe
Number of patients Number of patients Number of patients
Complications
developed
35/58 12 23
Cardiac 10/58 3 7
Vascular 5/58 1 4
Respiratory 16/58 4 12
Abdominal 18/55 5 13
Death 7/58 0 7
Specific complications of the patients with SAP are listed in table. Nine patients only had
local complications, whereas, nine patients had isolated organ failure. Five patients had both.
Table 6.8 – Local and systemic complications in SAP patients
ID Local complications Systemic complications/Organ
Failure
Mortality
AP09 >50% pancreatic necrosis Respiratory failure in the first week
AP011 Respiratory failure in the first week
AP29 Circulatory and respiratory failure
in the first week
Yes
AP34 45% pancreatic necrosis
AP46 Pancreatic abscess > 3 cm

81 | P a g e
AP51 >50% pancreatic necrosis,
SMV thrombosis, splenic
infarcts
AP57 40% pancreatic necrosis
AP58 Peri-pancreatic fluid
collections
Respiratory failure in the first week
AP63 Respiratory failure in the first week
AP66 Peri-pancreatic fluid
collections
Circulatory failure in the first week Yes
AP81 Circulatory failure in the first week Yes
AP99 35% pancreatic necrosis
AP103 >50% pancreatic necrosis
AP117 Peri-pancreatic fluid
collections, splenic and
SMV thromboses, small
bowel fistulae
Respiratory failure in the first week
AP144 30% pancreatic necrosis Respiratory failure in the first week
AP168 Respiratory and circulatory failure
in the first week
Yes
AP177 Respiratory failure in the first week
AP187 Respiratory and circulatory failure
in the first week
Yes
AP192 Respiratory, renal and circulatory
failure in the first week (multi-
organ)
Yes
AP234 40% pancreatic necrosis
AP273 75% pancreatic necrosis
AP307 50% pancreatic necrosis
UHA08 Respiratory and circulatory failure
in the first week
Yes

82 | P a g e
CHAPTER 7: GENE EXPRESSION
PROFILING

83 | P a g e
7.1 Sample preparation – the RNA extraction
The RNA samples to be used for the project were manually extracted from the PAXgene
BRTs using the PAXgene Blood RNA kit (Qiagen). All samples were processed following
the same protocol.
Before the procedure – All PAXgene BRTs were taken out of the -80 o C freezer and
incubated at room temperature (15-25o C) for 2 hrs after thawing.
PAXgene BRTs were centrifuged for 10 minutes at 4000 x g using a swing-out rotor.
Supernatant was removed by decanting. RNase-free water (4 mls) was added to the pellet.
Mixture was vortexed until the pellet was visibly dissolved, and then, centrifuged for 10
minutes at 4000 x g using a swing-out rotor. Entire supernatant was discarded.
Buffer BR1, which is a resuspension buffer, (350μl) was added and vortexed until the
pellet was visibly dissolved.
Sample was pipetted into a 1.5 ml microcentrifuge tube (MCT). Buffer BR2, a binding
buffer (300μl) and proteinase K (40 μl) were added to the sample and mixed by vortexing
for 5 seconds, and incubated for 10 minutes at 55°C using a shaker–incubator at 400 rpm.
Proteinase K was added to ensure adequate protein digestion.
Lysate was then pipetted directly into a PAXgene Shredder spin column (PSC) and
centrifuged for 3 minutes at 17,000 x g to homogenise the cell lysate and remove residual
cell debris. Entire supernatant of the flow-through fraction was transferred to a fresh 1.5
ml microcentrifuge tube without disturbing the pellet in the processing tube.
Ethanol (350 μl - >99%) was added to the supernatant to adjust binding conditions and
mixture was then mixed by vortexing, and centrifuged briefly (one second at 700 x g) to
remove drops from the inside of the tube lid.
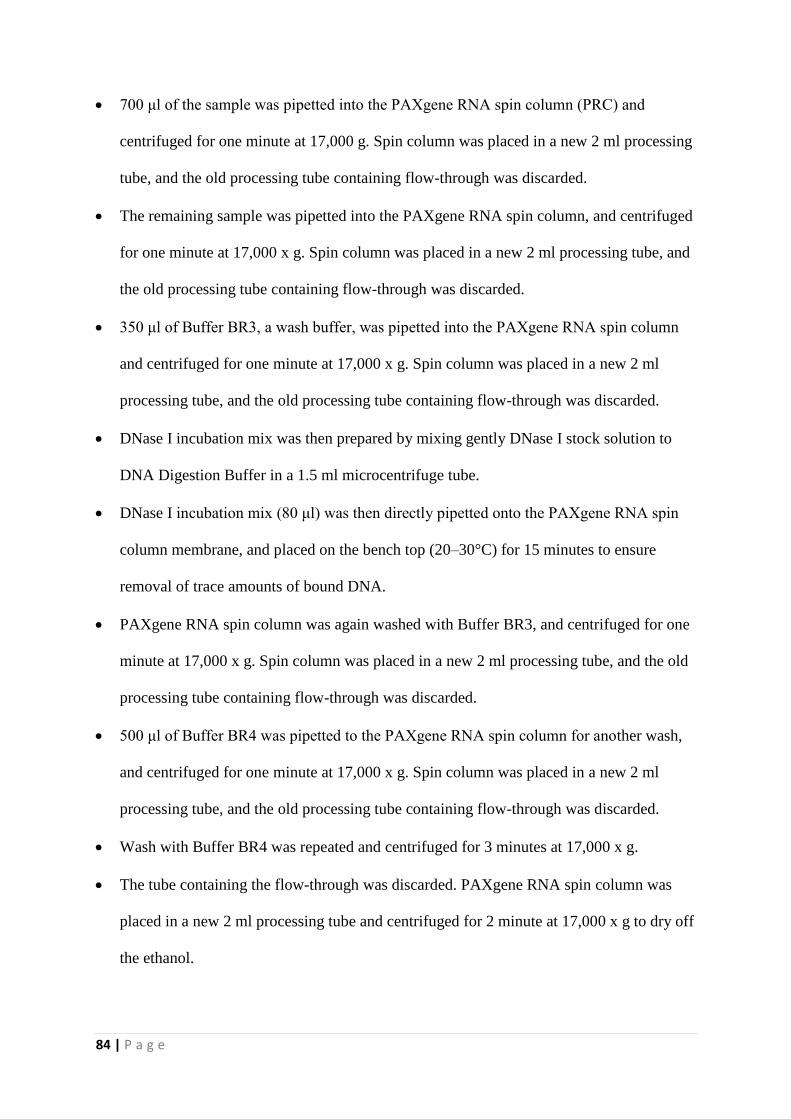
84 | P a g e
700 μl of the sample was pipetted into the PAXgene RNA spin column (PRC) and
centrifuged for one minute at 17,000 g. Spin column was placed in a new 2 ml processing
tube, and the old processing tube containing flow-through was discarded.
The remaining sample was pipetted into the PAXgene RNA spin column, and centrifuged
for one minute at 17,000 x g. Spin column was placed in a new 2 ml processing tube, and
the old processing tube containing flow-through was discarded.
350 μl of Buffer BR3, a wash buffer, was pipetted into the PAXgene RNA spin column
and centrifuged for one minute at 17,000 x g. Spin column was placed in a new 2 ml
processing tube, and the old processing tube containing flow-through was discarded.
DNase I incubation mix was then prepared by mixing gently DNase I stock solution to
DNA Digestion Buffer in a 1.5 ml microcentrifuge tube.
DNase I incubation mix (80 μl) was then directly pipetted onto the PAXgene RNA spin
column membrane, and placed on the bench top (20–30°C) for 15 minutes to ensure
removal of trace amounts of bound DNA.
PAXgene RNA spin column was again washed with Buffer BR3, and centrifuged for one
minute at 17,000 x g. Spin column was placed in a new 2 ml processing tube, and the old
processing tube containing flow-through was discarded.
500 μl of Buffer BR4 was pipetted to the PAXgene RNA spin column for another wash,
and centrifuged for one minute at 17,000 x g. Spin column was placed in a new 2 ml
processing tube, and the old processing tube containing flow-through was discarded.
Wash with Buffer BR4 was repeated and centrifuged for 3 minutes at 17,000 x g.
The tube containing the flow-through was discarded. PAXgene RNA spin column was
placed in a new 2 ml processing tube and centrifuged for 2 minute at 17,000 x g to dry off
the ethanol.

85 | P a g e
The tube containing the flow-through was discarded. RNA was eluted by pipetting 40 μl
of elution buffer BR5 into the PAXgene RNA spin column placed in a 1.5 ml
microcentrifuge tube and centrifuged for 1 minute at 17,000 g to elute the RNA.
This 1st elute was stored in two aliquots, 15 μl each, and the rest was reserved for
qualitative and quantitative assessments.
PAXgene spin column was placed in a fresh 1.5 ml microcentrifuge tube and 40 μl of
elution buffer was pipetted on to elute the remaining RNA. It was centrifuged for one
minute at 17,000 x g.
This was stored as one aliquot and called 2nd elute.
All the extracted samples were labelled and stored in the -80°C freezer until further
processing.
7.2 Quality control Assessments
Aliquots for quality control assessments were taken at the time of extraction. Concentration
of the samples was analysed using Thermo Scientific NanoDrop™ 1000 Spectrophotometer
and the qualitative assessment was undertaken using Agilent 2100 Bioanalyzer with the
Agilent RNA 6000 Nano Kit.
Since 100 ng of RNA was required in a total volume of 3 μl, concentration of the sample was
adjusted accordingly. Highly concentrated samples were diluted with RNase free water and
diluted samples were speed vacuumed to achieve uniform concentration throughout. Samples
were renamed for feasibility with further analyses.

86 | P a g e
7.2.1 Qualitative assessment of RNA samples using Agilent 2100
Bioanalyzer
Before starting: All reagent and reagent mixes, except RNA ladder, were kept at 4°C.
Reagents were taken out of the fridge to warm at room temperature for at least 30 minutes.
The dye and gel-dye mix was wrapped in aluminium foil and put in the drawer to protect
from light.
Gel matrix was prepared by adding 550 μl of gel matrix to a spin filter and spun for 10 minutes
at 4000 rpm.
Electrode cleaners were used, one with RNase Zap and the other with RNase free water (350
μl). These were put in machine and run for 1 minute each.
Gel-dye matrix was prepared by adding 1 μl of dye to a 65 μl tube of gel matrix and
vortexed. Mix was then centrifuged at maximum speed at 14000 rpm for 10 minutes.
9 μl of gel-dye matrix was loaded into the well marked G. Another 9 μl of the gel dye matrix
was pipetted in the two additional wells marked G. 5 μl of marker was then pipetted into the
well marked ladder and each of the 12 RNA wells
The RNA samples and RNA ladder were denatured by incubating in the 70° C heating block
for 2 minutes and put on ice for 5 minutes.
1 μl of ladder was loaded into the well marked “ladder” and 1 μl of RNA into each of the 12
wells.

87 | P a g e
After being placed in the adapted vortexer and mixed for one minute at 2400 rpm, the loaded
chip was placed in the Bioanalyzer and run for 30 minutes to obtain the traces.
Once it was ensured that the samples were of high quality, as assessed by the Bioanalyzer
traces, these were processed through for preparation for the microarray experiments.
7.3 Protocol A – 3’ IVT Express protocol
Since HG U133 Plus 2.0 arrays were intended to be utilised for the project, the 3’ IVT
Express protocol was used for preparation of the targets.
The overview of the protocol is summarised in figure 7.1.

88 | P a g e
Figure 7.1 - 3’ In vitro Transcription protocol (Adapted with permission)
7.3.1 Step 1 – Preparation of Poly-A RNA control mixture
Poly-A RNA control mixture was prepared. Poly-A controls are prokaryotic genes which are
absent in eukaryotic samples (dap, thre, phe, lys). These are in vitro synthesised and the
polyadenylated transcripts for B. subtilis genes are premixed at staggering concentrations.
Examining the hybridization intensities of these controls on the Genechip arrays helps to
monitor the labelling process independently from the quality of the starting RNA.

89 | P a g e
Serial dilutions required to prepare poly A control mixture depend on the amount of the
starting material. Since I used 100 ng as the input amount of RNA, the serial dilutions
selected were: 1:20 (1st dilution), 1:50 (2nd dilution), 1:50 (3rd dilution), 1:10 (4th dilution).
For 1st dilution, 2 µl of Poly A control stock was added to 38 µl of Poly A control dilution
buffer. 2 µl of this solution was added to 98 µl of dilution buffer to produce the 2nd
dilution. 2 µl of the 2nd dilution was mixed with 98 µl of dilution buffer to produce the 3rd
dilution. Finally, 4 µl of the solution was mixed with 36 µl of dilution buffer to produce
the 4th dilution.
2 µl of the 4th dilution was added to 3 µl of each RNA sample to make a 5 µl solution,
ready for the 1st strand synthesis.
7.3.2 Step 2 – 1st strand cDNA synthesis (using reverse transcription)
First strand master mix was prepared by mixing 4 μl of buffer mix with 1 μl of enzyme
mix for each sample.
5 μl of the master mix was aliquotted to 12 PCR tubes.
5 μl of the Total RNA/poly-A Control Mixture (from step 1) was added to each aliquot of
the first strand master mix to achieve a final volume of 10 μl.
Samples were incubated for two hours at 42 °C in a thermal cycler.

90 | P a g e
7.3.3 Step 3 – 2nd strand cDNA synthesis
Second strand master mix was prepared by mixing 5 μl of buffer mix, 13 μl of nuclease
free water and 2 μl of enzyme mix for each sample.
20 μl of the master mix was transferred to each (10 μl) cDNA sample.
Samples were placed in a 16 °C thermal cycler block and incubated for an hour followed
by 10 minutes at 65°C.
7.3.4 Step 4 – synthesis of labelled aRNA (using In Vitro Transcription
IVT)
IVT master mix was prepared by mixing together IVT biotin label (4 μl), labelling buffer
(20 μl) and enzyme mix (6 μl) for each sample.
IVT Master Mix (30 μl) was transferred to each (30 μl) double-stranded cDNA sample
and the reactions were incubated for 16 hours at 40 °C in thermal cycler.
7.3.5 Step 5 – Purification of aRNA
After synthesis, the aRNA was purified to remove enzymes, salts, and unincorporated
nucleotides.
aRNA Binding Mix was prepared by mixing RNA binding beads (10 μl ) and aRNA
binding buffer concentrate (50 μl) for each sample.
60 μl of aRNA Binding Mix was added to each sample and the resultant 120 μl was
transferred to the U-bottom plate.
120 μl of 100% ethanol was added to each sample and mixed adequately to allow aRNA
to bind to the RNA binding beads.

91 | P a g e
Magnetic beads were captured using the magnetic stand. Once capture was complete and
RNA binding beads had formed pellets, supernatant was discarded and plate removed
from the stand.
RNA binding beads were washed using aRNA Wash Solution (100 μl/sample) and shaken
at a moderate speed for 1 min on lab-line titre plate shaker. Magnetic beads were captured
using the magnetic stand. Once capture was complete and RNA binding beads had
formed pellets, supernatant was discarded and plate removed from the stand.
Another wash was performed following the same procedure and the plate shaken at very
high speed for one min on lab-line titre plate shaker to evaporate residual ethanol.
Purified aRNA was eluted from the RNA binding beads by adding 50 μl of preheated
(50–60 °C) aRNA Elution Solution to each sample. The plate was then shaken vigorously
for 3 minutes on the lab-line titre plate shaker. RNA binding beads were captured by
moving the plate to the magnetic stand. Supernatant (containing the eluted aRNA) was
transferred to a nuclease free PCR tube.
7.3.6 Step 6 – Analysis of aRNA size
The size distribution of aRNA was evaluated using Agilent 2100 Bioanalyzer with the
Agilent RNA 6000 Nano Kit. Concentration of aRNA was assessed using Thermo Scientific
NanoDropTM 1000 Spectrophotometer to ensure adequacy of the amplification process.
7.4 Protocol B – Ovation whole blood protocol
The overview of the protocol is summarised in figure 7.2.

92 | P a g e
Figure 7.2 - Ribo-SPIATM 3’ RNA Amplification Protocol (Adapted with permission)
Before proceeding with the protocol, concentration of RNA samples was analysed using
Thermo Scientific NanoDrop™ 1000 Spectrophotometer and the qualitative assessment was
undertaken using Agilent 2100 Bioanalyzer with the Agilent RNA 6000 Nano Kit.

93 | P a g e
7.4.1 Step 1 – Preparation of Poly-A RNA control mixture
Since serial dilutions required to prepare poly A control mixture depend on the amount of the
starting material and the starting RNA input for this protocol was 40 ng, the serial dilutions
selected for this protocol were : 1:20 (1st dilution), 1:50 (2nd dilution), 1:50 (3rd dilution), 1:25
(4th dilution).
For 1st dilution, 2 µl of Poly-A control stock was added to 38 µl of Poly A control dilution
buffer. 2 µl of this solution was added to 98 µl of dilution buffer to produce the 2nd dilution. 2
µl of the 2nd dilution was mixed with 98 µl of dilution buffer to produce the 3rd dilution.
Finally, 2 µl of the solution was mixed with 48 µl of dilution buffer to produce the 4th
dilution (total volume of 50 µl).
2 µl of the 4th dilution was added to 3 µl of each RNA sample to make a 5 µl solution, ready
for the 1st strand synthesis.
7.4.2 Step 2 - 1st strand cDNA synthesis
2 μl of first strand primer mix was mixed with 5 μl of the RNA sample to allow for
primer annealing.
1st strand master mix was prepared by mixing buffer mix (12 μl) and enzyme mix (1 μl).
13 μl of master mix was added to each reaction to make up a final volume of 20 μl.
Samples were incubated at 48°C for 60 minutes, at 70°C for 15 minutes and cooled to
4°C in thermal cycler.

94 | P a g e
7.4.3 Step 3 - 2nd strand cDNA synthesis
Second strand master mix was prepared by combining buffer mix (18 μl) and enzyme mix
(2 μl). 20 μl of the mix was added to each first strand reaction tube.
Samples were incubated at 37 °C for 30 minutes, at 75 °C for 15 minutes and then cooled
to 4 °C.
7.4.4 Step 4 - SPIA® Amplification
Master mix was made by combining sequentially the SPIA buffer mix (72 μl), SPIA
primer mix (2 μl), nuclease free water (4 μl) and SPIA enzyme mix (40 μl).
118 μl of the SPIA master mix was added to the entire volume of the 2nd strand reaction.
Resultant 158 μl reaction volume was split into two 79 μl volume in new PCR tubes.
24 PCR tubes were left to incubate at 48 °C for 30 minutes and then cooled to 4 °C.
3 μl of Ovation whole blood reagent was added to each 79 μl of SPIA reaction.
All reactions were incubated at 48 °C for 30 minutes, at 95°C for 5 minutes and then
cooled to 4 °C.
7.4.5 Step 5 - Purification of amplified cDNA
This was undertaken using the Qiagen QIAquick® PCR Purification Kit.
160 μl of amplified cDNA product (82 μl aliquots pooled together) was added to PCR
tubes containing 800 μl of PB buffer each and mixed by vortexing.
480 μl of sample was loaded onto the QIAquick® spin column and centrifuged for one
minute at 13,000 rpm.

95 | P a g e
Remaining 480 μl of the sample was loaded onto the same column and centrifuged for
one minute at 13,000 rpm.
700 μl of 80% ethanol was added to the column and centrifuged for one minute at 13,000
rpm.
Ethanol treatment was repeated another time and to remove the remaining liquid, column
was centrifuged for one additional minute at 13,000 rpm.
Nuclease-free water (30 μl) was added to the centre of each column and allowed to stand
for five minutes at room temperature to elute purified cDNA.
Columns were then centrifuged at 13,000 rpm for one minute to collect 25 μl of purified
cDNA.
Concentration of the purified amplified cDNA was analysed using Thermo Scientific
NanoDrop™ 1000 Spectrophotometer. Since 4.4 μg of RNA was required in a final volume
of 25 μl for further labelling and fragmentation reactions, samples were diluted in nuclease
free water to achieve desired concentration.
7.4.6 Step 6 – Fragmentation of amplified cDNA
Fragmentation master mix was prepared by mixing together fragmentation buffer (5 μl)
and enzyme mix (2 μl) together for each sample.
25 μl of the purified SPIA™ cDNA into a PCR tube was added to 7 μl of the
Fragmentation Master Mix.
After adequate mixing, tubes were incubated at 37 °C for 30 minutes, at 95 °C for 2
minutes and cooled to 4 °C.

96 | P a g e
7.4.7 Step 7 - Biotin Labelling
Fragmentation of amplified cDNA was immediately followed by the Biotin labelling.
Labelling master mix was prepared by combining together labelling buffer (15 μl),
reagent (1.5 μl) and enzyme mix (1.5 μl).
18 μl of labelling master mix was added to each sample (32 μl), making up a total volume
of 50 μl for the hybridization reaction.
Samples were mixed thoroughly by vortexing and spinning and incubated in a pre-
warmed thermal cycler at 37 °C for 60 minutes, at 70 °C for 10 minutes and then cooled
to 4 °C.
The fragmentation success and the size distribution of the final fragmented and biotinylated
product was viewed on Agilent 2100 Bioanalyzer on an RNA 6000 Nano LabChip®.
7.4.8 Step 8 - Hybridization
The Affymetrix Genechip® Human Genome U133 Plus 2.0 arrays (HG-U133 Plus 2.0) were
used. This particular array is comprised of 1,300,000 unique oligonucleotide features
covering over 47,000 transcripts and variants, which, in turn, represent approximately 39,000
of the best characterized human genes. The probe sets used for the design of the array have
been selected from Genebank®, dbEST and RefSeq. Oligonucleotide probes are synthesized
in situ complementary to each corresponding sequence. Eleven pairs of oligonucleotide
probes are used to measure the level of transcription of each sequence represented.
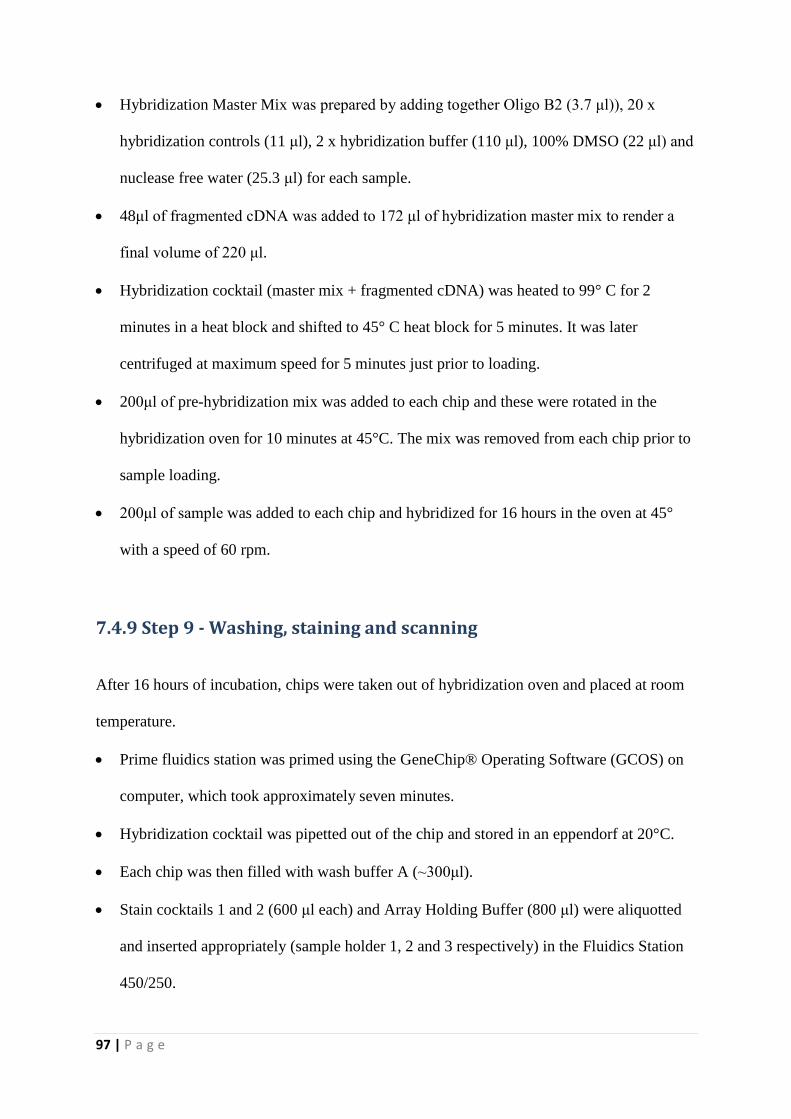
97 | P a g e
Hybridization Master Mix was prepared by adding together Oligo B2 (3.7 μl)), 20 x
hybridization controls (11 μl), 2 x hybridization buffer (110 μl), 100% DMSO (22 μl) and
nuclease free water (25.3 μl) for each sample.
48μl of fragmented cDNA was added to 172 μl of hybridization master mix to render a
final volume of 220 μl.
Hybridization cocktail (master mix + fragmented cDNA) was heated to 99° C for 2
minutes in a heat block and shifted to 45° C heat block for 5 minutes. It was later
centrifuged at maximum speed for 5 minutes just prior to loading.
200μl of pre-hybridization mix was added to each chip and these were rotated in the
hybridization oven for 10 minutes at 45°C. The mix was removed from each chip prior to
sample loading.
200μl of sample was added to each chip and hybridized for 16 hours in the oven at 45°
with a speed of 60 rpm.
7.4.9 Step 9 - Washing, staining and scanning
After 16 hours of incubation, chips were taken out of hybridization oven and placed at room
temperature.
Prime fluidics station was primed using the GeneChip® Operating Software (GCOS) on
computer, which took approximately seven minutes.
Hybridization cocktail was pipetted out of the chip and stored in an eppendorf at 20°C.
Each chip was then filled with wash buffer A (~300μl).
Stain cocktails 1 and 2 (600 μl each) and Array Holding Buffer (800 μl) were aliquotted
and inserted appropriately (sample holder 1, 2 and 3 respectively) in the Fluidics Station
450/250.
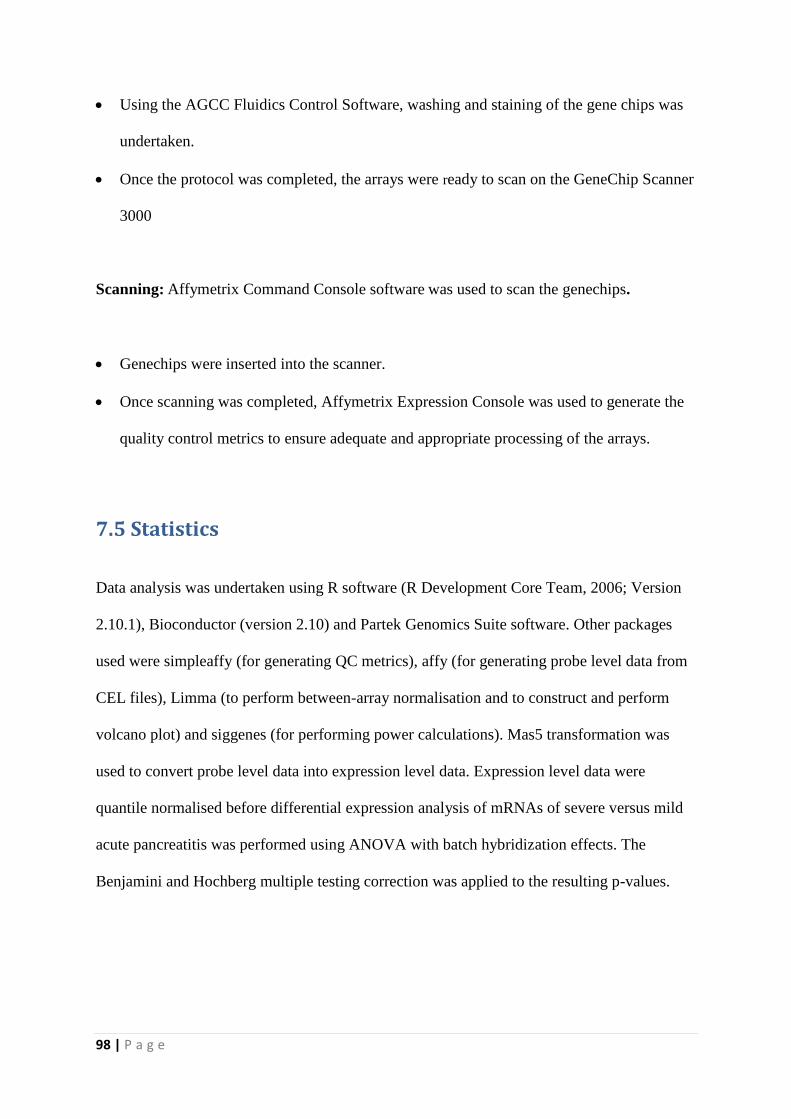
98 | P a g e
Using the AGCC Fluidics Control Software, washing and staining of the gene chips was
undertaken.
Once the protocol was completed, the arrays were ready to scan on the GeneChip Scanner
3000
Scanning: Affymetrix Command Console software was used to scan the genechips.
Genechips were inserted into the scanner.
Once scanning was completed, Affymetrix Expression Console was used to generate the
quality control metrics to ensure adequate and appropriate processing of the arrays.
7.5 Statistics
Data analysis was undertaken using R software (R Development Core Team, 2006; Version
2.10.1), Bioconductor (version 2.10) and Partek Genomics Suite software. Other packages
used were simpleaffy (for generating QC metrics), affy (for generating probe level data from
CEL files), Limma (to perform between-array normalisation and to construct and perform
volcano plot) and siggenes (for performing power calculations). Mas5 transformation was
used to convert probe level data into expression level data. Expression level data were
quantile normalised before differential expression analysis of mRNAs of severe versus mild
acute pancreatitis was performed using ANOVA with batch hybridization effects. The
Benjamini and Hochberg multiple testing correction was applied to the resulting p-values.

99 | P a g e
7.6 Optimisation and selection of protocol and pilot study
Since the HU 133 Plus 2.0 arrays were used for this particular project, we used the 3’ IVT
express protocol (Protocol A), which is the complementary protocol to these arrays, to carry
out the amplification and labelling processes. However, when the size of the resultant
amplified unfragmented RNA was analysed, abnormal peaks were observed on the trace. A
normal amplified RNA looks like the following figure 11.1.
Figure 7.3 – Normal amplified RNA trace
The unexpected peaks were observed throughout all the samples. Similarly, the
electrophoresis gel image also showed abnormal bands in the region of 700-800 nucleotides.
These abnormal findings were thought to be due to very high levels of haemoglobin mRNA
in the samples. This is not an uncommon finding, especially when dealing with human whole
blood samples.

100 | P a g e
The degree of globin message representation in mRNA in whole blood can vary widely, with
globin mRNA species constituting up to 70% of whole blood mRNA in some patients [323]
and can interfere with assessment of other genes.
Increases in globin mRNA contributes to decreased sensitivity of detection of transcripts on
microarrays [324]. It has been shown by several groups [325-327] that excessive level of
globin transcripts can induce a data artefact through promiscuous cross hybridization to
microarray probes. Consistent with this, both scale factor and percentage present calls are
negatively impacted by increasing amounts of globin.
Conversely, Globin reduction improves the detection of sensitivity of the microarrays by
increasing the call rates from higher signal intensities and lower signal to noise ratios and
permitting detection of additional ‘masked’ genes [326, 328].
Therefore, it was decided that the Ovation whole blood protocol would be used to reduce
globin levels. A justification of this is given below.
7.6.1 Globin mitigation protocols
To improve the laboratory assays and increase discovery power, several commercially
available solutions have been developed to reduce or mitigate the effects of excess globin
transcripts on microarray hybridization signal in the last few years. These can be classified
into two strategies.
Globin clear approach: The first approach focuses on minimizing the amplification of
globin specific messages in amplified cRNA. These methods include physically removing

101 | P a g e
globin transcripts from total RNA by hybridization to anti-globin oligonucleotides affixed to
magnetic beads (GLOBINclear™) [328]. Because of sample manipulation, GLOBINclear has
the potential to adversely affect the integrity of total RNA [329], is difficult to scale up and
requires species-specific reagents.
Globin reduction PNA approach: This method blocks the amplification of globin
transcripts by using oligonucleotides of nucleic acid analogs (PNA, LNA), which when
bound to a transcript prevents its amplification by reverse transcriptase [330]. The PNA
approach was once recommended by Affymetrix but has subsequently been withdrawn from
the market. The PNA-based technique was simple and scalable, but PNA design was difficult
and costly to expand for other species. Theoretically, the PNA-based process seemed to fit
better into the established target preparation process because it was performed in the same
tube as the cDNA synthesis reaction. However, the stability of PNA in the long term was
unknown and the method required taking measures to prevent PNA aggregation and
precipitation. The method had been shown by the manufacturers to increase detection of
transcripts and reduce biological variation between samples. However, it was not known how
it would transform a gene expression profile, or to what extent it could generate a profile
similar to that of samples without high levels of globin mRNA.
Disadvantages of Globin clear and PNA techniques: Despite globin reduction protocols,
globin depletion is ∼75%. These techniques are mostly efficient at reducing globin mRNA
from cRNA but can induce RNA type-dependent changes in quality of RNA during sample
preparation and quality of microarray results. Both techniques generate a hybridization target
composed of cRNA and rely on the post-RNA isolation manipulation of the samples prior to
or at the first step of mRNA amplification, leading to potential processing bias in gene
expression data. The globin reduction steps introduce particular transformations to the

102 | P a g e
original gene expression profiles, and even after globin removal, it would not be possible to
recover a profile equivalent to that of an identical RNA sample without globin mRNA
excesses.
A study [326] compared these two methods (GLOBINclear and GeneChip Globin-Reduction
PNA Kit) in a Jurkat cell line and showed that neither method could recover a profile
equivalent to that of an identical RNA sample without globin mRNA excess. Therefore, none
of these protocols could completely remove globin gene mRNA and the remaining globin
genes in the blood samples still continue to drive the main eigenvector in the data set.
Thus, despite the application of globin reduction protocols, overrepresentation of globin
genes on the microarrays can be a confounder for biomarker discovery, particularly in
diseases with subtle gene expression signature.
7.6.2 cRNA versus cDNA targets
Several groups have detected widespread cross-hybridization in microarray measurements
[331, 332], and on the order of 10% of the probes on a common oligonucleotide array
platform were predicted to be susceptible to cross-hybridization [332]. High level of
promiscuity in DNA-RNA hybridisations underlies widespread cross hybridization in
microarrays. This cross hybridisation can be reduced by using cDNA targets instead of
cRNA.
From its inception, microarray technology took advantage of either of two types of
biochemical entities as the labelled target, cRNA [333] or cDNA [334]. Although in many
aspects these two types of labelled target are considered to be equivalent for the purpose of
microarray analysis, the use of cRNA has held an important methodological advantage.

103 | P a g e
Because RNA polymerase does not require a primer, it was rather straightforward to design a
near-linear target amplification method, which has been extremely useful in experiments with
small amounts of starting RNA [333], including most clinical studies. Even so, there are hints
in the literature indicating that DNA-RNA hybridization might be less specific than DNA-
DNA hybridization and hence, more susceptible to cross hybridization. One such relevant
observation is that in free solution DNA-RNA hybrids, certain mismatch ‘wobble’ base pairs
are more stable than complementary base pairs [335]. This effect is, however, absent in
DNA-DNA hybrids [336], indicating that targets made of DNA might be a more specific
alternative to standard RNA targets. These characteristics also support the use of DNA as a
means of mitigating the effects of globin, and potentially other highly abundant interfering
transcripts. cDNA hybridizations have greater intensity (low Scale Factor) and better
discrimination between true signal and background. Not only are there improvements in
hybridization metrics, but the deleterious effects of globin cross-hybridization are reduced.
Another study concluded that the cDNA target is better able to discriminate between the
correct probe and similar but incorrect probes and that it is unlikely that the increased
specificity using cDNA targets instead of cRNA targets comes at the price of decreased
sensitivity [337].
7.6.3 The Ovation Whole blood protocol
Ovation whole blood technique is a new single primer, isothermal linear amplification
method, according to which, small amounts of total RNA are reverse transcribed into cDNA
using a chimeric RNA/DNA primer containing oligo (dT) and a unique RNA sequence tag at
the 5’ end. A single linear isothermal amplification reaction rapidly generates sufficient
single stranded cDNA for multiple hybridization reactions.

104 | P a g e
This method does not specifically restrict amplification of globin transcripts; rather it relies
on the high specificity of DNA-based hybridization [337, 338]. During this procedure, all
transcripts, including globin, are amplified to produce complementary cDNA. It is believed
that the high specificity of DNA-DNA interactions reduces cross hybridization signal due to
excess globin, thereby reducing artifactual signals. The methodology amplifies target mRNA
using a novel template generation and isothermal strand displacement strategy [338, 339]. It
has recently been improved with the addition of the Whole Blood reagent (WB) that
optimizes the amplification for whole blood samples.
A recent study by Parrish et al [325] compared and quantified the impact of various
mitigation technologies by employing the cDNA hybridization and PNA protocol. Their
results reiterated the fact that globin related cross hybridization is the main source of artefact.
They also found that the cDNA amplification (ovation whole blood protocol) improved the
percent present calls by 25%, as compared to 10% by the PNA treatment and also exhibited
more uniform detection and discrimination of low expressed genes by increasing expression
signal across a wider range of low intensity probes. Another important characteristic of the
cDNA targets was found to be the reduction of background intensity.
In a nutshell, the Ovation whole blood protocol is highly reproducible and sensitive, fast and
simple to operate. Both whole transcript amplification and 3’ initiated RNA amplification
reproducibly generate high quality cDNA amplification products suitable for undertaking
transcriptomic studies on GeneChip microarrays. The system provides a means for global
gene expression analysis from very small samples and is particularly useful for clinical
research where supplies of biologic samples are limited.

105 | P a g e
7.7 Quantitative and Qualitative Analyses
There were 6 paired samples for the pilot study. Prior to the amplification process, it was
ensured that the concentration of total RNA was adequate for the downstream application.
Table 11.1 lists the final concentrations of the samples.
Table 7.1 – Concentration of RNA samples prior to amplification process
Sample ID New ID Concentration (ng/ μl) Final concentration (ng/ μl)
AP040 – 0 hr 1 31.6* 50.2
AP040 – 2 hrs 2 41.6 41.6
AP041 – 0 hr 3 41 41
AP041 – 2 hrs 4 67.3 67.3
AP042 – 0 hr 5 45.3 45.3
AP042 – 2 hrs 6 243.9± 50.08
AP043 – 0 hr 7 36.1 36.1
AP043 – 2 hrs 8 30.2* 45
AP044 – 0 hr 9 137.5± 50.9
AP044 – 2 hrs 10 123.4± 51.4
AP045 – 0 hr 11 36.5 36.5
AP045 – 2 hrs 12 20.5* 43
*these samples were speed vacuumed to achieve a concentration of >40 ng/ μl
±these samples were diluted to achieve a concentration of >50 ng/ μl

106 | P a g e
Figure 7.4 – Bioanalyzer traces of the Total RNA prior to Amplification
Amplified RNA (Protocol A) was found to be in adequate concentration as can be seen in the
table 7.2.
Table 7.2 – Concentration of amplified RNA
ID Concentration (ng/μl)
1 969.6
2 1045
3 1039

107 | P a g e
4 1114.7
5 1080.2
6 884.5
7 965.3
8 892.6
9 558.3
10 515.9
11 866
12 874
For Protocol B, cDNA was synthesized and quantified. It was found to have amplified
adequately and efficiently as is reflected in the concentration and Bioanalyzer traces.
Table 7.3 – Concentration of amplified cDNA
ID Concentration
(ng/ μl )
Volume of sample
required (μl)*
Volume of nuclease free
water required (μl)±
Final
volume (μl)
1 351.5 12.60 12.4 25
2 320.7 13.72 11.8 25
3 298.7 14.75 10.25 25
4 272.1 16.20 8.8 25
5 251.1 17.55 7.45 25
6 290.8 15.15 9.85 25
7 296 14.90 10.1 25
8 264 16.67 8.33 25

108 | P a g e
9 290.3 15.16 9.84 25
10 270 16.30 8.70 25
11 255.4 17.23 7.70 25
12 234 18.82 6.18 25
*4400/concentration = volume of sample required
±25-volume of sample required = volume of nuclease free water require
The qualitative assessment was undertaken using Agilent 2100 Bioanalyzer with the Agilent
RNA 6000 Nano Kit.
7.8 Data Analysis
Table 7.4 shows the various parameters looked at for the HU133 plus 2.0 arrays.
Table 7.4 – Quality control metrics
QC metrics for HG U133 Plus 2.0 arrays
1 2 3 4 5 6 7 8 9 10 11 12
Scale
Factor 1.51 1.652 1.39 1.417 1.658 1.62 2.222 1.604 1.293 1.372 1.746 1.618
Backgro
und
Avg:
28.46
Avg:
31.33
Avg:
30.78
Avg:
32.66
Avg:
28.44
Avg:
30.44
Avg:
27.47
Avg:
29.55
Avg:
30.22
Avg:
30.56
Avg:
28.18
Avg:
30.80
Corner
+
Avg:
191
Avg:
193
Avg:
208
Avg:
205
Avg:
159
Avg:
209
Avg:
111
Avg:
127
Avg:
130
Avg:
136
Avg:
111
Avg:
123
Corner-
Avg:
1330
7
Avg:
16526
Avg:
9921
Avg:
18193
Avg:
13220
Avg:
14850
Avg:
10296
Avg:
9593
Avg:
9034
Avg:
5890
Avg:
7465
Avg:
7848

109 | P a g e
Central-
Avg:
1338
6
Avg:
16870
Avg:
10469
Avg:
18377
Avg:
14220
Avg:
15135
Avg:
11638
Avg:
10366
Avg:
8681
Avg:
6339
Avg:
7475
Avg:
7939
Number
Present:
2963
0
54.%
28667
52.4%
33152
60.6%
32677
59.8%
31571
57.7%
32714
59.8%
30964
56.6%
32153
58.8%
33664
61.6%
33202
60.7%
30174
55.2%
32135
58.8%
Internal
Control
s
Sig(3'
/5')
Sig(3'/
5')
Sig(3'/
5')
Sig(3'/
5')
Sig(3'/
5')
Sig(3'/
5')
Sig(3'/
5')
Sig(3'/
5')
Sig(3'/
5')
Sig(3'/
5')
Sig(3'/
5')
Sig(3'/
5')
GAPDH 1.38 1.41 1.41 1.35 1.58 1.61 1.42 1.55 1.47 1.64 1.65 1.88
Beta
Actin 2.35 2.08 2.32 2.68 2.34 2.78 2.06 2.81 2.81 3.07 2.84 4.72
Spike
Control
s
Probe
Set
Sig
(3’) Sig(3') Sig(3') Sig(3') Sig(3') Sig(3') Sig(3') Sig(3') Sig(3') Sig(3') Sig(3') Sig(3')
bioB
3739.
3 (P)
3781.2
(P)
3215.5
6 (P)
2838.3
(P)
3273.2
(P)
3575.2
(P)
3378.7
(P)
3185.7
(P)
2739.5
(P)
2769.6
(P)
3441.7
(P)
3546.0
(P)
bioC
7623.
7 (P)
7632.2
(P)
7116.9
(P)
6300.6
(P)
7128.4
(P)
7907.3
(P)
6865.1
(P)
6887.7
(P)
5783.4
(P)
5895.1
(P)
7465.1
(P)
7338.3
(P)
bioD
2271
6.3
(P)
20763.
8 (P)
20295.
7 (P)
18121.
5 (P)
20232.
0 (P)
21844.
7 (P)
21408.
7 (P)
20077.
6 (P)
16512.
8 (P)
17844.
9 (P)
21153.
8 (P)
20629.
1 (P)
cre
3384
0.7
(P)
33171.
3 (P)
32022.
7 (P)
27645.
7 (P)
32237.
7 (P)
34509.
6 (P)
35189.
8 (P)
30979.
0 (P)
26253.
1 (P)
29001.
9 (P)
33241.
7 (P)
33513.
6 (P)
dap
6300.
8 (P)
6850.4
(P)
6861.1
(P)
6919.9
(P)
9441.5
(P)
8453.6
(P)
8245.1
(P)
7505.8
(P)
5677.2
(P)
7502.0
(P)
8677.3
(P)
7639.4
(P)
lys
942.3
(P)
913.3
(P)
1103.6
(P)
934.2
(P)
1741.0
(P)
1278.2
(P)
1145.2
(P)
1202.8
(P)
885.4
(P)
1306.8
(P)
1395.6
(P)
1973.5
(P)
phe
731.0
(P)
924.6
(P)
874.5
(P)
963.5
(P)
1423.6
(P)
1584.1
(P)
989.0
(P)
1343.0
(P)
995.0
(P)
1265.9
(P)
1769.6
(P)
1283.9
(P)

110 | P a g e
thr
969.5
(P)
1037.1
(P)
982.5
(P)
1511.2
(P)
2249.3
(P)
1742.5
(P)
1824.1
(P)
1658.0
(P)
1172.2
(P)
1431.4
(P)
2006.4
(P)
1933.6
(P)
All arrays scanned for 54675 probe sets. Scale factor was found to be the same through all the
samples, depicting uniformity in the quality of these. Background was found to be within a
range of 27-33. Although there are no official guidelines regarding background, Affymetrix
has found that typical Average Background values range from 20-100 for arrays scanned with
the GeneChip® Scanner 3000. This may point towards a low probability of inappropriate
hybridization and therefore, more accurate results. All 12 arrays had comparable background
values. Note that the low background has shifted the mean intensity towards the left side.
This is graphically represented in figure 7.5, (generated from the simpleaffy package).

111 | P a g e
Figure 7.5 – Quality control Statistics
Corner+, Corner_ and Central_ values indicate adequate alignment of the grid to the
microarray slide. Percentage of present calls varied from 51 to 62%, which is considerably
high as compared to usual microarray results, where it averages around 30-40%.
Several internal controls were checked for. B2 oligo, which serves as a positive hybridization
control, was shown to have performed adequately as no grid misalignment was observed.
Poly A control genes (dap, lys, phe, thre) were used to monitor the entire target labelling
process. These were all called present with increasing signal values in the order of lys, phe,

112 | P a g e
thr, dap. Hybridization controls, bioB, bioC, bioD and cre were used to evaluate sample
hybridization efficiency on eukaryotic gene expression arrays. All of these were called
present with increasing signal values, reflecting their relative concentrations. Internal control
genes, β-actin and GAPDH, were used to assess RNA sample and assay quality. The signal
values of the 3’ probe sets for actin and GAPDH were compared to the signal values of the
corresponding 5’probe sets (3’/5’ ratios). These were all within range (less than 3, since this
was a one-cycle assay).
The affy package was used to generate probe level data from CEL files for the 12 arrays and
is shown in figure 7.6.
Figure 7.6 Probe level data and RNA degradation plot

113 | P a g e
As can be seen from the figure, probe level intensities overlap and have a similar
distribution. RNA degradation plots showed similar pattern across all the arrays. Expression
level data were generated from probe level data using the mas5 transformation and is
represented in a box plot below (figure 7.7).
Figure 7.7 – Expression level data
A between-array normalisation was performed (from the limma package) to remove inter-
array differences. Data were filtered to remove control probes, probes flagged “Absent” in all
samples and probes with a CV across all arrays greater than the 90th quantile.
One of the objectives of the study was to see the variability between the samples stored
immediately after collection (time 0 hour) and those stored after two hours of incubation at
room temperature (time 2 hours). These treatments were used as factors in a fixed term linear
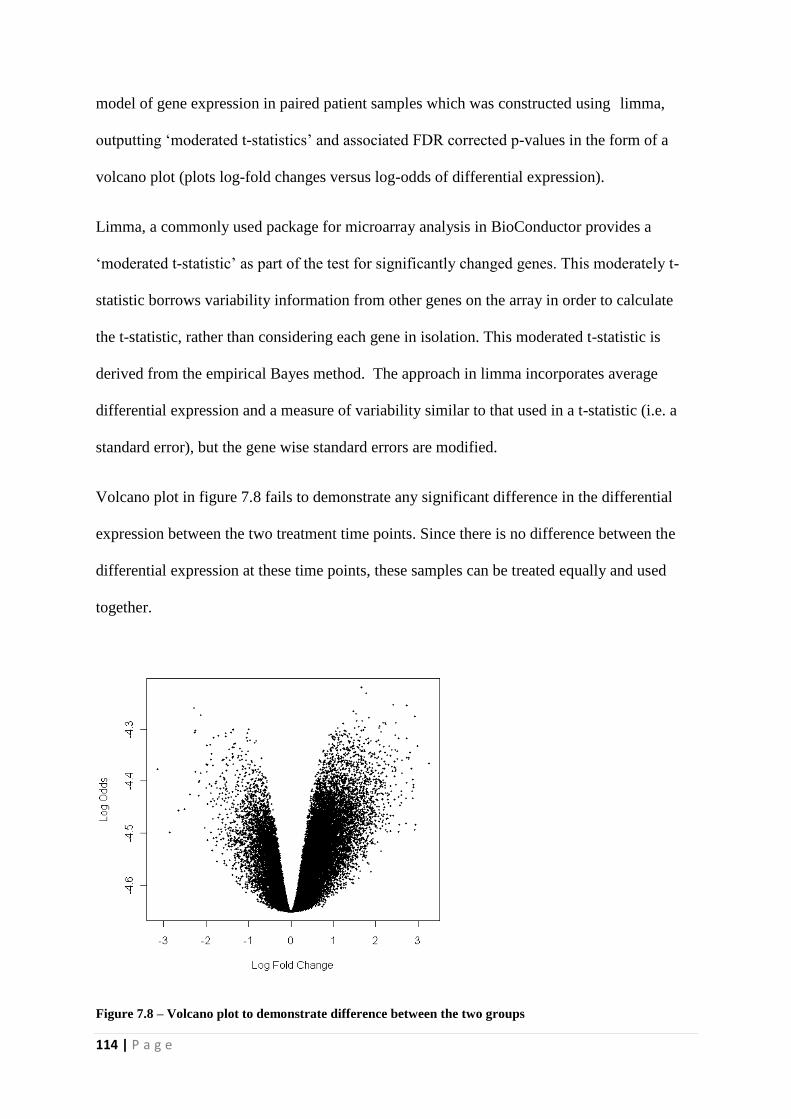
114 | P a g e
model of gene expression in paired patient samples which was constructed using limma,
outputting ‘moderated t-statistics’ and associated FDR corrected p-values in the form of a
volcano plot (plots log-fold changes versus log-odds of differential expression).
Limma, a commonly used package for microarray analysis in BioConductor provides a
‘moderated t-statistic’ as part of the test for significantly changed genes. This moderately t-
statistic borrows variability information from other genes on the array in order to calculate
the t-statistic, rather than considering each gene in isolation. This moderated t-statistic is
derived from the empirical Bayes method. The approach in limma incorporates average
differential expression and a measure of variability similar to that used in a t-statistic (i.e. a
standard error), but the gene wise standard errors are modified.
Volcano plot in figure 7.8 fails to demonstrate any significant difference in the differential
expression between the two treatment time points. Since there is no difference between the
differential expression at these time points, these samples can be treated equally and used
together.
Figure 7.8 – Volcano plot to demonstrate difference between the two groups

115 | P a g e
Power calculations were performed using the Siggenes package. Power was set at 80%,
specificity (significance cut-off) at 0.05 and minimum fold change at 2. Figure 7.9 shows the
minimum number of samples required in each group to achieve 80% power (in time 2 hours
group) to be approximately 40.
Figure 7.9 – Sample size calculation in time 2 hours group
Figure 7.10 shows the same calculation performed with fold change increased to 4, giving a
sample size of 20 in each group.

116 | P a g e
Figure 7.10 – Sample size calculation in time 2 hours group with fold change of 4
The same calculations were repeated for the other treatment group (time 0 hour) with varying
fold changes (2 and 4 in figures 7.11 and 7.12, respectively).
Figure 7.11 – Sample size calculation in time 0 hour group with fold change of 2

117 | P a g e
Figure 7.12 – Sample size calculation in time 0 hour group with fold change of 4
Solely using samples from time 0 hour group will require an unrealistically large number of
patient samples for each group, but this number could be significantly reduced by using
samples from time 2 hours group. This does point towards a varying difference in the
differential expression of these groups which may mean that although there was no
significant difference in the differential expression of the two groups on the volcano plot,
there could be a difference in gene expression variance in these groups. In the light of these
results, samples from time 2 hours group will be used for the main study, with 40 samples in
each group (mild and severe).
One of the other objectives of this pilot study was to establish and refine a protocol for
processing samples and data analysis for the main study. Experience with the 3’ IVT express
kit had shown an abundance of globin mRNA leading to potential problems with the
processing and subsequent data analyses. A method was sought to remove haemoglobin from
mRNA prior to hybridisation. The Ovation whole blood protocol was then used to check if it

118 | P a g e
neutralised the abundance of globin mRNA in our samples. Figure 7.13 shows a box plot of
expression levels data with alpha and beta haemoglobin probes overlaid following treatment
with the Ovation whole blood protocol.
Figure 7.13 – Expression levels of haemoglobin probes
All haemoglobin alpha- and beta-probes fall within the upper or lower quantiles of expression
level, indicating that the abundance of globin mRNA has fallen to within expected limits.
This provided the confidence that the Ovation whole blood system protocol not only solved
the problem of abundance of globin mRNA in the samples, it also suited the project since a
small amount of starting RNA was required and the procedure was very user friendly and
highly reproducible. This protocol was therefore used for the main study.
7.9 Qualitative Assessments of the sample preparation and
processing
Qualitative checks were undertaken at three important steps:-

119 | P a g e
After RNA extraction – to assess quality and quantity of the RNA to be used for
further experiments
After amplification of the resultant cDNA – to assess adequacy of the amplification
process and of the quantity of the resultant amplified product
After fragmentation – to assess adequacy of the resultant fragment and its suitability
for the hybridization process
7.9.1 Qualitative and Quantitative Analyses after the RNA extractions
All 58 samples were processed in a total of five batches so as to minimise batch effects. Care
was taken to have a constant proportion of mild and severe patients in each batch so that there
was homogeneity among the samples and any effects observed were due to the disease
process and not due to the way samples were processed or handled. Details of the batches are
given below:-
Table 7.5 – Samples in each batch
Batch 1
AP034 AP047 AP052
AP079 AP065 AP051
AP059 AP046 AP055
AP091 AP029 AP048
Batch 2
AP067 AP062 AP072
AP0100 AP088 AP081
AP097 AP066 AP103
AP063 AP058 AP105
Batch 3
AP057 AP117 AP135
AP077 AP124 AP137
AP078 AP128 AP144
AP099 AP129 AP149
Batch 4
AP164 AP191 AP230
AP168 AP192 AP234
AP177 AP203 AP300
AP187 AP206
Batch 5

120 | P a g e
AP009 AP227 AP273
AP011 AP232 AP307
AP021 AP251 UHA-08
AP211 AP267
Red highlighted samples are severe acute pancreatitis
PAXgene Blood RNA kit (Qiagen) was used to extract RNA from stored PAXgene Blood
RNA Tubes, as described in the methods section. Following table demonstrates the
concentrations of the extracted RNA using Thermo Scientific NanoDrop™ 1000
Spectrophotometer and the bioanalyzer traces using Agilent 2100 Bioanalyzer with the
Agilent RNA 6000 Nano Kit are also shown below. Nanodrop Traces are provided in
Appendix 1.
Table 7.6 – RNA concentrations
Sample Concentration RIN Sample Concentration RIN
(µg)
AP034 40.2 8.90 AP057 126.7 7.70
AP079 110.2 8.40 AP077 36 8.80
AP059 274.5 7.90 AP078 50.6 8.50
AP091 144.4 7.80 AP099 46.4 8.60
AP047 235.7 8.70 AP117 58.8 8.50
AP065 50.4 8.10 AP124 122.3 8.70
AP046 225.8 8.30 AP128 41.6 8.40
AP029 41.4 8.40 AP129 59.4 8.40
AP052 61 2.50 AP135 160 8.40
AP051 58.9 7.80 AP137 176 8.40
AP055 331.1 8.10 AP144 78.2 NA
AP048 165.7 8.40 AP149 44.3 8.20
AP067 106.3 8.40 AP164 293.4 8.0
AP100 84.5 8.10 AP168 54.2 8.7
AP097 133 860 AP177 47.2 8.0
AP063 112.9 8.60 AP187 111.1 8.3
AP062 64.2 8.50 AP191 8.4 NA
AP088 1109 7.80 AP192 134.5 7.50
AP066 72.5 8.50 AP203 108.1 NA

121 | P a g e
AP058 49.6 NA AP206 58.4 8.7
AP072 107.4 NA AP230 112.7 8.0
AP081 138.6 8.30 AP234 37 7.80
AP103 45.5 8.10 AP300 43.9 7.70
AP105 45 NA
AP009 155 8.4
AP011 126 8.5
AP021 84.5 8.9
AP211 35.4 7.40
AP227 92.2 9.10
AP232 27.6 7.90
AP251 16.1 6.60
AP267 135.4 8.50
AP273 115.4 8.50
AP307 58.1 8.80
UHA-08 45.2 NA
Figure 7.14 – Bioanalyzer trace for extracted RNA (Batch 1)
Since AP052 didnt show the usual 28S and 18S peaks, this was repeated to ensure good
quality of the sample. This is shown in Figure 12.2.

122 | P a g e
Figure 7.15 – Repeat processing of AP052
Additional peaks were seen in the traces for at least four samples in batch 2 (AP105, AP072,
AP058 and AP066), four samples in batch 3 (AP099, AP117, AP144 and AP149), three
samples in batch 4 (AP191, AP203 and AP300) and two samples in batch 5 (AP273 and
UHA-08).
Figure 7.16 – Bioanalyzer trace for extracted RNA (Batch 2)
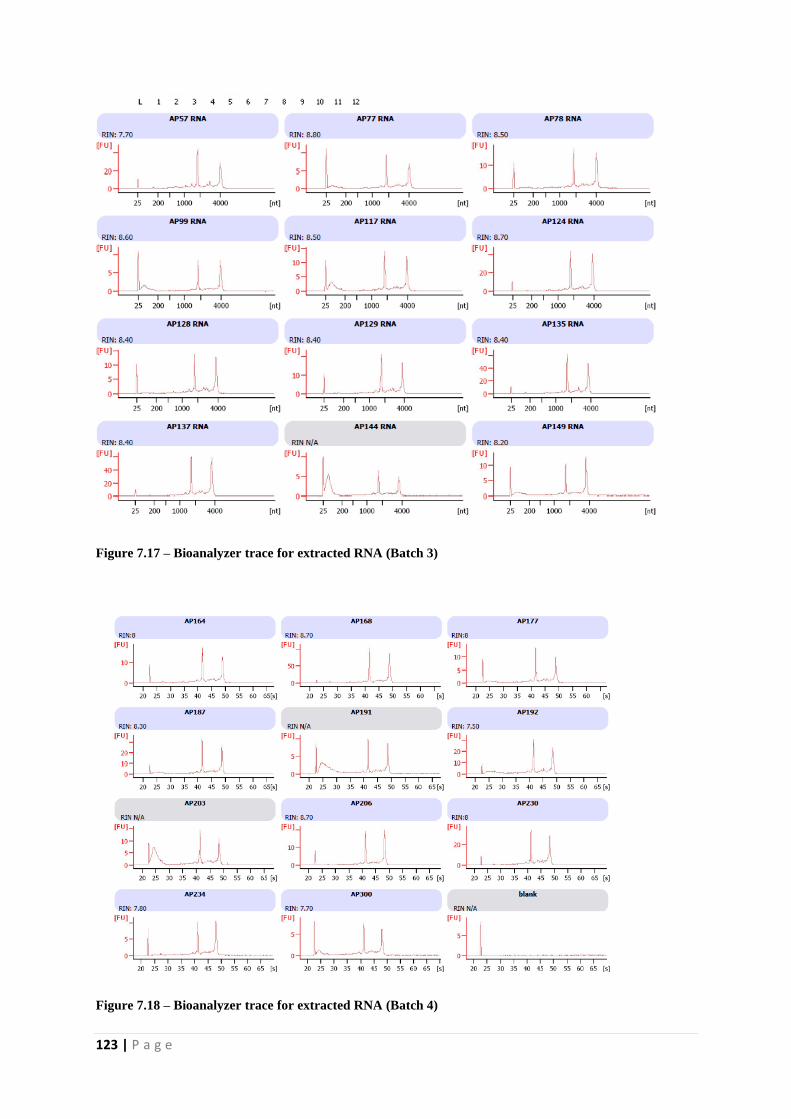
123 | P a g e
Figure 7.17 – Bioanalyzer trace for extracted RNA (Batch 3)
Figure 7.18 – Bioanalyzer trace for extracted RNA (Batch 4)

124 | P a g e
Figure 7.19 – Bioanalyzer trace for extracted RNA (Batch 5)
These additional peaks didn’t appear to be due to RNA degradation which is
characteristically a different trace, without the presence of distinct 18S and 28S bands (figure
12.7).
Figure 7.20 – Bioanalyzer traces demonstrating traces relating to varying RINs and hence degradation of
RNA

125 | P a g e
To assess this better, another application called degradometer (Version 1.41) was used to
ascertain the quality of these ‘affected’ samples. It provides quantitative data about the
integrity and concentration of eukaryotic total RNA. The ‘DegFact’ represents the
degradation – the higher the number, the more the degradation. T18S shows the timing of the
18S rRNA peak; usually approximately 41.4 seconds, whereas T28S is the timing of the 28S
rRNA peak; usually 48 seconds.18S is the signal intensity of the 18S rRNA peak and 18S is
the signal intensity of the 28S rRNA peak. Finally, 28S/18S is the ratio of 28S/18S signal
heights. This number decreases in apoptosis. A DegFact value of <8 is considered
satisfactory and is indicative of minimal degradation. Following tables (7.7, 7.8, 7.9) show
results from the first 3 batches. These provided enough assurance that the RNA was of high
quality and without significant degradation and therefore, it was decided to proceed with the
samples.
Table 7.7 – Results of Degradometer Batch 1
Sample DegFact
RNA
Concentration t18S t28S 18S 28S 28S/18S
ng/µl
AP34 4.27 25.9 41.05 48 40.7 29.84 0.73
AP46 5.02 201.2 41.1 48 39.01 26.92 0.69
AP47 4.03 214.4 41.05 48 43.75 34.29 0.78
AP48 3.56 221.2 41.2 48 45.27 30.13 0.67
AP51 5.67 44.1 41.15 48 36.7 22.21 0.61
AP52 9.58 49.1 40.95 48 27.07 19.77 0.73
AP55 4.83 285.6 41.15 48 40.51 25.74 0.64
AP59 4.66 217.1 41.1 48 48.99 27.33 0.56
AP65 6.69 40.9 41.05 48 33.69 23.3 0.69
AP79 4.56 94.2 41.1 48 44.61 30.85 0.69
AP91 5.11 110.9 41.1 48 46.42 26.76 0.58
Table 7.8 – Results of Degradometer Batch 2
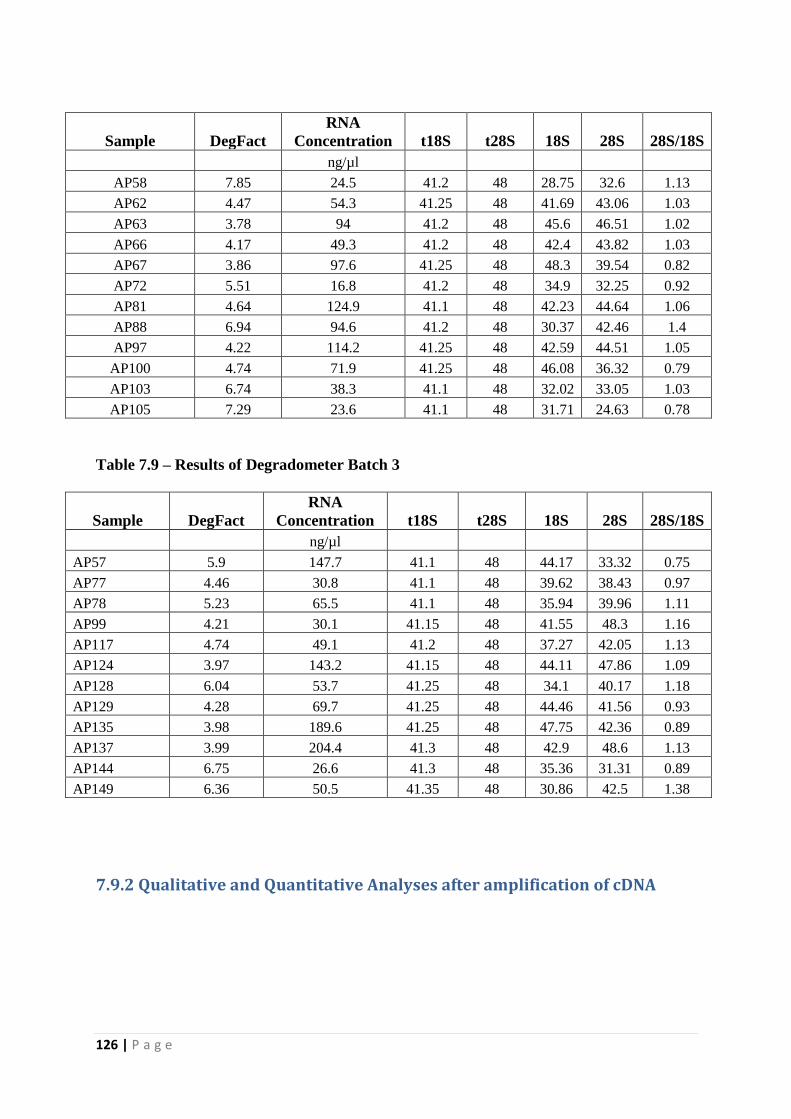
126 | P a g e
Sample DegFact
RNA
Concentration t18S t28S 18S 28S 28S/18S
ng/µl
AP58 7.85 24.5 41.2 48 28.75 32.6 1.13
AP62 4.47 54.3 41.25 48 41.69 43.06 1.03
AP63 3.78 94 41.2 48 45.6 46.51 1.02
AP66 4.17 49.3 41.2 48 42.4 43.82 1.03
AP67 3.86 97.6 41.25 48 48.3 39.54 0.82
AP72 5.51 16.8 41.2 48 34.9 32.25 0.92
AP81 4.64 124.9 41.1 48 42.23 44.64 1.06
AP88 6.94 94.6 41.2 48 30.37 42.46 1.4
AP97 4.22 114.2 41.25 48 42.59 44.51 1.05
AP100 4.74 71.9 41.25 48 46.08 36.32 0.79
AP103 6.74 38.3 41.1 48 32.02 33.05 1.03
AP105 7.29 23.6 41.1 48 31.71 24.63 0.78
Table 7.9 – Results of Degradometer Batch 3
Sample DegFact
RNA
Concentration t18S t28S 18S 28S 28S/18S
ng/µl
AP57 5.9 147.7 41.1 48 44.17 33.32 0.75
AP77 4.46 30.8 41.1 48 39.62 38.43 0.97
AP78 5.23 65.5 41.1 48 35.94 39.96 1.11
AP99 4.21 30.1 41.15 48 41.55 48.3 1.16
AP117 4.74 49.1 41.2 48 37.27 42.05 1.13
AP124 3.97 143.2 41.15 48 44.11 47.86 1.09
AP128 6.04 53.7 41.25 48 34.1 40.17 1.18
AP129 4.28 69.7 41.25 48 44.46 41.56 0.93
AP135 3.98 189.6 41.25 48 47.75 42.36 0.89
AP137 3.99 204.4 41.3 48 42.9 48.6 1.13
AP144 6.75 26.6 41.3 48 35.36 31.31 0.89
AP149 6.36 50.5 41.35 48 30.86 42.5 1.38
7.9.2 Qualitative and Quantitative Analyses after amplification of cDNA
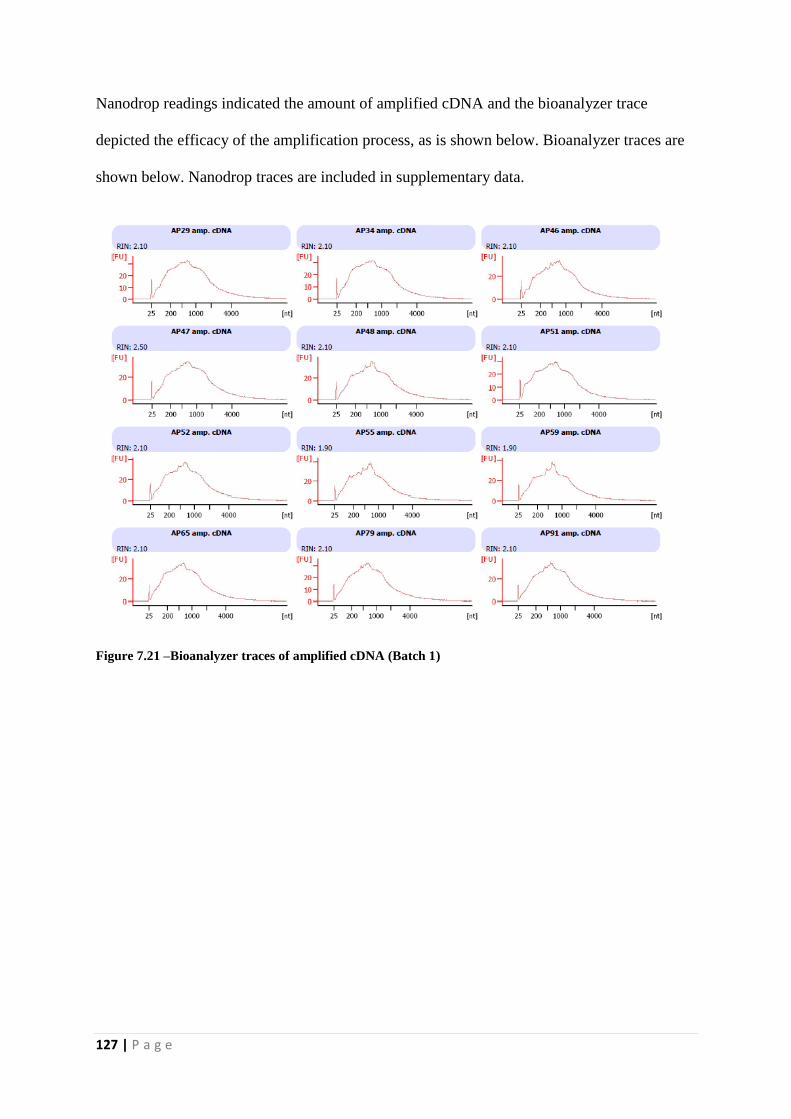
127 | P a g e
Nanodrop readings indicated the amount of amplified cDNA and the bioanalyzer trace
depicted the efficacy of the amplification process, as is shown below. Bioanalyzer traces are
shown below. Nanodrop traces are included in supplementary data.
Figure 7.21 –Bioanalyzer traces of amplified cDNA (Batch 1)

128 | P a g e
Figure 7.22 –Bioanalyzer traces of amplified cDNA (Batch 2)
Figure 7.23 –Bioanalyzer traces of amplified cDNA (Batch 3)
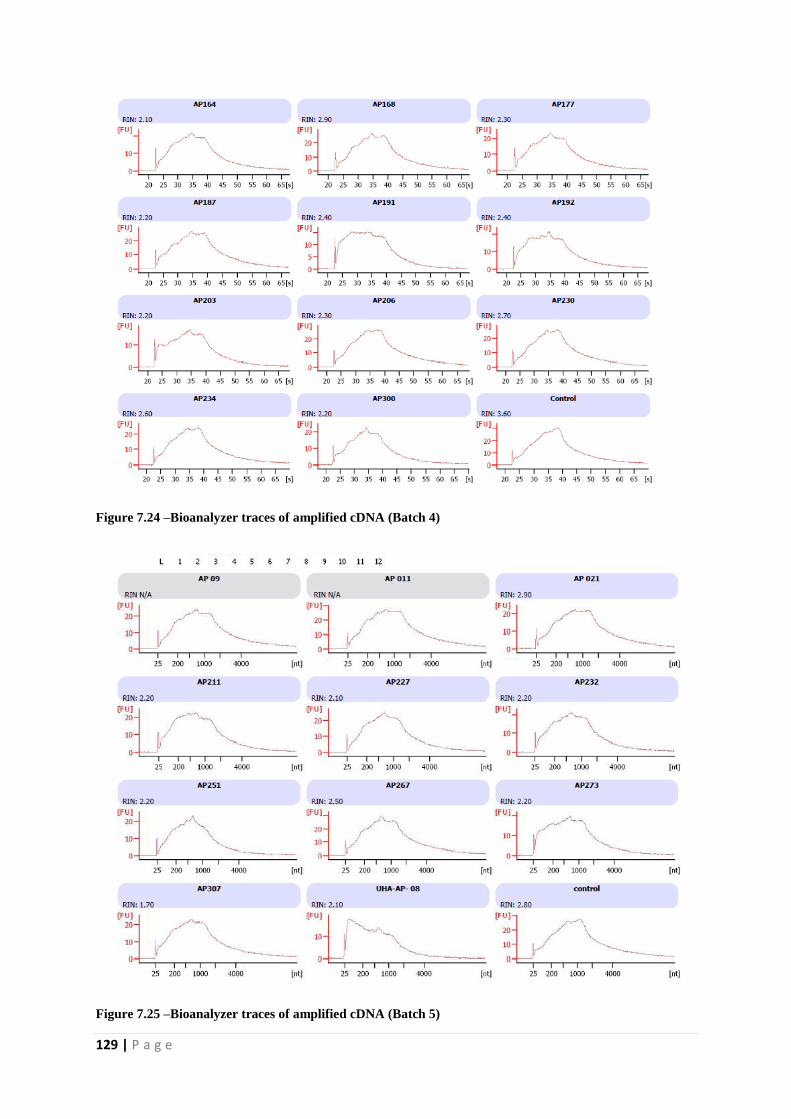
129 | P a g e
Figure 7.24 –Bioanalyzer traces of amplified cDNA (Batch 4)
Figure 7.25 –Bioanalyzer traces of amplified cDNA (Batch 5)

130 | P a g e
7.9.3 Qualitative and Quantitative Analyses after fragmentation of cDNA
cDNA was later fragmented to achieve fragments of ~ 90-120 nt. This would ensure
appropriate size that would facilitate hybridization. All fragmented cDNA revealed adequate
size. This is shown in figures 7.26, 7.27, 7.28, 7.29 and 7.30.
Figure 7.26 – Bioanalyzer traces of fragmented cDNA (Batch 1)

131 | P a g e
Figure 7.27 – Bioanalyzer traces of fragmented cDNA (Batch 2)

132 | P a g e
Figure 7.28 – Bioanalyzer traces of fragmented cDNA (Batch 3)
Figure 7.29 – Bioanalyzer traces of fragmented cDNA (Batch 4)

133 | P a g e
Figure 7.30 – Bioanalyzer traces of fragmented cDNA (Batch 5)
7.10 Quality Control metrics for Hybridization
High 3’5’ ratios for house-keeping genes were noticed. Typically, a normal value for 3’/5’
ratio for the GAPDH is up to 3 and up to 20 for beta actin, since this gene is 2.2 kb long. This
can be explained by the fact that the 5’ probes for the human actin gene are approximately 1.7
kb from the 3’ polyA tail of the message. QPCR analysis has revealed that the Ovation
amplified cDNA material is long enough to provide good transcript representation out to 1 kb
from the polyA tail (Figures 7.31 and 7.32). This is completely adequate for use on the
current generation of Affx arrays as the probes for the arrays are designed to be within 600
bases of the polyA tail.

134 | P a g e
Table 7.10 – Quality control metrics for batch 1 hybridizations
Sample Name AP029 AP034 AP046 AP047 AP048 AP051
Scale Factor (SF): 0.2942 0.31752 0.3356 0.2865 0.3668 0.3385
Background: 27.1639 29.7466 27.684 29.506 28.704 28.947
Total Probe Sets: 54675 54675 54675 54675 54675 54675
Number Present: 56.3457 60.2451 61.652 62.219 59.076 55.02
Housekeeping Controls: AFFX-
HUMGAPDH/M33197 11.7952 11.6848 11.679 11.429 11.81 11.876
AFFX-HSAC07/X00351 11.9694 12.0084 12.246 11.903 12.34 12.138
Spike Controls:
Probe Set Sig(3') Sig(3') Sig(3') Sig(3') Sig(3') Sig(3')
AFFX-r2-Ec-bioB 9.11221 9.29811 9.4174 9.0247 9.3237 9.2846
AFFX-r2-Ec-bioC 10.2282 10.3554 10.469 10.198 10.448 10.371
AFFX-r2-Ec-bioD 11.7378 11.8621 11.958 11.708 12.019 11.944
AFFX-r2-P1-cre 12.5358 12.6011 12.758 12.436 12.821 12.708
Sample Name AP052 AP055 AP059 AP065 AP079 AP091
Scale Factor (SF): 0.3278 0.3678 0.2841 0.3864 0.3276 0.28361
Background: 28.576 28.3763 30.198 28.351 29.332 28.7078
Total Probe Sets: 54675 54675 54675 54675 54675 54675
Number Present: 58.345 58.9886 59.546 56.913 59.497 60.225
Housekeeping Controls: AFFX-
HUMGAPDH/M33197 11.792 11.7199 11.557 12.126 11.641 11.3354
AFFX-HSAC07/X00351 12.162 12.2479 11.95 12.343 11.914 11.8933
Spike Controls:
Probe Set Sig(3') Sig(3') Sig(3') Sig(3') Sig(3') Sig(3')
AFFX-r2-Ec-bioB 9.2079 9.25516 8.9654 9.3981 9.1323 9.16866
AFFX-r2-Ec-bioC 10.369 10.3948 10.162 10.468 10.326 10.2459
AFFX-r2-Ec-bioD 11.869 11.9666 11.754 12.062 11.739 11.7761
AFFX-r2-P1-cre 12.655 12.7418 12.511 12.836 12.536 12.4713

135 | P a g e
Figure 7.31 – Actin and GAPDH probe sets
Figure 7.32 – Distribution of probes on U133A genechip
Having said that, it has to be kept in mind that the QC metrics by Affymetrix have been
optimized for aRNA probes, not cDNA, so their recommended values may not be applicable
on the selected ovation protocol treated hybridizations. Besides, the percentage of present

136 | P a g e
calls was found to be quite high in the samples, along with improved scaling factor and low
background.
Keeping all this in the context, these QC metrics were considered adequate and reliable.
Diagrammatic representation is presented below in figures, including RNA degradation plot
(Figures 7.33 and 7.34)
Figure 7.33 – Quality control metrics of the house keeping genes

137 | P a g e
Figure 7.34 – RNA degradation plot
7.11 Qualitative Analyses
Quality control metrics (QC) were performed to ensure efficient hybridizations. These can be
broadly classified into within arrays, between arrays and between batches. It is of paramount
importance to perform quality checks at all these points so as to minimise any systematic bias.
For ‘within array’ QCs, assessment of 'housekeeping genes' is undertaken (approximately 100
on standard affymetrix chips). These act as controls and there are several probe sets
corresponding to controls. These are easily identified by the letters ‘AFFX’ at the beginning of
the probe identifier. Some of them are spiked-in control genes. The matching targets are added
in precise quantities and at different steps in the labelling and hybridization process. These
transcripts have predictable expression levels and so the probe sets play an important quality
control role in the MAS algorithm. Controlled input results in predictable outcomes, enabling
discovery and correction of sources of error, if any. The chips are re-scaled so the average
values of these housekeeping genes are equal across all chips. This is much better than using a
single housekeeping gene, and probably adequate for about 80% of chips in practice. Figure
(7.35) below depict the QCs for labelling, hybridization, 3’-5’ and pm/mm respectively. These
demonstrate that the intensity of the house keeping genes was predominantly consistent

138 | P a g e
through all the samples. There was some variability but it was not significant enough for the
sample to be labelled as an outlier and therefore, all samples were included in the final analysis.
Labelling
Hybridization

139 | P a g e
3’/5’ ratio
Perfect match/mismatch repair
Figure 7.35 – Quality Control Metrics for labelling, hybridisation, 3’-5’ and pm/mm
Quality control for ‘between arrays’ was performed by looking at probe level, expression level
and relative expression level (REL) data.

140 | P a g e
Box plots show a picture of the overall distribution of probe intensities found on each array.
As it can be seen in the figures below (7.36), that the probe level, expression level and REL
intensities overlap and have similar distribution.

141 | P a g e
Figure 7.36 – Quality control metrics for probe level, expression level and REL intensities
Data obtained from the probes (probe level data) was transformed to expression estimates using
MAS5. This is a standard affymetrix algorithm which performs background correction and
normalisation algorithm. It converts the values to log10 and then averages across genes and
samples. It helps to equalise the contribution of different probes as well.
7.12 Principle Component Analysis
Batch effects are technical sources of variation that have been added to the samples during
handling. The importance of removing these cannot be over-emphasised. Their presence
decreases statistical power, since it adds variation to the data, may act as a confounder and
induce differences between the study groups. It is absolutely critical that this type of
technical variation does not confound with the biology, ensuring that biological treatment
groups do not overlap with technical groups. This is often evaluated using explorative

142 | P a g e
approaches, involving distance measures, clustering and spatial methods. Principle
Component Analysis (PCA) was used in this study to illustrate this and Analysis of Variance
(ANOVA) to assess and correct for batch effects.
Figure 7.37 shows differences between the two study groups on the basis of their disease
(mild vs. severe) with and without the batch effects, respectively.
With batch effects
Without batch effects
Figure 7.37 – Principle Component Analysis demonstrating difference between MAP and SAP, with and
without batch effects

143 | P a g e
Another difference to assess for was between the different batches. Since all the samples were
processed in five batches, these were classified according to that and batch effects removed. Figure
7.38 depicts the different batches before and after removal of batch effects, respectively.
With batch effects
Without Batch Effects
Figure 7.38 – Principle Component Analysis demonstrating difference between different batches

144 | P a g e
7.13 Hierarchical Clustering
As the next step, gene expression analysis was performed by using two way ANOVA (with
CV <30%, IQR >0.5 and fold change of 2.0). ANOVA not only improves the estimate of
disease effects but also quantitates both batch and disease effects per gene, using only the
disease specific effects for inference. Based on that, 98 genes were identified that are
differentially expressed between mild and severe pancreatitis. Based on those 98, the groups
separate out quite well as can be seen in hierarchical clustering plot below. Both the gene and
sample distances were Euclidean and average linkage was used for clustering; the images are
scaled so that mean is 0 and standard deviation is 1.
Figure 7.39 - Hierarchical Cluster Analysis of differential gene expression data from mild and severe
acute pancreatitis patients. Heat map depicting the gene expression patterns in 58 patients (35 mild and
23 severe acute pancreatitis). Columns represent individual samples and rows represent each gene. Each

145 | P a g e
cell in the matrix represents the expression level of a gene feature in an individual sample. Blue
represents mild and red illustrates severe patients. Upregulated (high expression level) genes are coloured
red whereas downregulated (low expression level) genes are shown as green, as indicated in the scale bar
(log2-transformed scale).
The above figure shows the genes clustering to specific disease groups. While there are a few
samples that are intermediate in their expression, the fact that clustering is clearly appreciated
translates into a clear distinction between the groups – mild and severe. This provides
evidence that based on gene expression, these are two different disease groups where
different mechanisms are at play, leading to different clinical pictures and hence the
outcomes.
It also raises an extremely pertinent point of the intermediate patients – where the expression
lies somewhere between the two, eluding to presence of a different entity which may have
different clinical presentation and may represent a different category altogether.
7.14 Overall gene expression differences between severe and
mild acute pancreatitis
98 genes were differentially expressed (FC 1.5, FDR < 0.05) in severe acute pancreatitis
(SAP) in comparison to mild acute pancreatitis (MAP). Table 7.11 lists the most significantly
differentially expressed (upregulated) genes between all SAP and the corresponding FC and
p-values obtained from comparisons with MAP. Details are provided in appendix 2. The
single most up-regulated gene was MMP8 (Matrix Metallopeptidase 8) (FC=4.49), which
codes for MMP 8 protein - a neutrophil collagenase, actively involved in breaking down of
the extracellular matrix. Its role in cancer is very well established where it is involved in
proliferation, invasion, epithelial-to mesenchymal transformation, metastasis and

146 | P a g e
angiogenesis. OLAH and ADAMST genes code for enzymes that are heavily involved in the
extracellular matrix remodelling and development. Another important upregulated gene was
found to be HPGD (Hydroxy prostaglandin dehydrogenase 15). This enzyme converts
proinflammatory PGE2 to anti-inflammatory PGE2. In a recent study, HPGD is found to be
protective against Lipopolysaccharide induced liver injury by activating PPAR-γ in Kupffer
cells and concurrently, inhibiting their ability to produce inflammatory cytokines [340]. It is
safe to assume a similar role is played by HPGD upregulation in the setting of acute
pancreatitis as well. Cysteine- rich secretory protein 3 (CRISP3) gene was found to be
upregulated in our dataset as well. It is defence-associated molecule (due to its expression in
B lymphocytes) with predominant expression in the salivary gland, pancreas and prostate. It
has been shown to be involved in pathophysiology of chronic pancreatitis [341]. CRISP-3
seems to play an important role in acinar cell degeneration and ductal cell proliferation in the
course of the tissue destruction and remodelling in chronic pancreatitis and has also been
found to be expressed in specific granules of neutrophils in response to pathogen infections
[342, 343]. This would explain its source and potential role in the context of AP where
neutrophils are the hallmark cellular component.
Table 7.11. Top 50 differentially expressed genes (upregulated) in severe and mild acute
pancreatitis
Gene Symbol ID P value Fold Change
MMP8 231688_at 0.000108 4.49
OLAH 222945_x_at 0.0005 3.419
ADAMTS2 226311_at 0.0000419 3.095
RETN 220570_at 0.000028 3.085
HPGD 211548_s_at 0.00263 3.077
SLC1A3 202800_at 0.000335 3.072
OLAH 233126_s_at 0.00108 2.918
HPGD 203914_x_at 0.00316 2.915

147 | P a g e
OLAH 219975_x_at 0.0028 2.87
GPR84 223767_at 0.000604 2.847
SLC51A 229230_at 0.000368 2.739
CRISP3 207802_at 0.000132 2.701
HPGD 211549_s_at 0.000838 2.624
DAAM2 212793_at 0.0018 2.551
CD163 216233_at 0.0000173 2.538
FGF13 205110_s_at 0.00332 2.537
ANKRD22 239196_at 0.000477 2.534
VSIG4 204787_at 0.000163 2.452
BPI 205557_at 0.0000131 2.445
PFKFB2 226733_at 0.000208 2.398
TIMP4 206243_at 0.0000661 2.391
ARG1 231663_s_at 0.000666 2.335
SH3PXD2B 231823_s_at 0.00036 2.315
HGF 210997_at 0.000874 2.31
HGF 209960_at 0.000334 2.302
PTGES 210367_s_at 0.000518 2.252
SAMSN1 1555638_a_at 0.000349 2.238
TMEM45A 219410_at 0.0000832 2.227
CEACAM1 210610_at 0.000094 2.221
DLC1 224822_at 0.00183 2.21
TCN1 205513_at 0.0000795 2.196
DHRS9 224009_x_at 0.000477 2.195
SEMA6B 223567_at 0.000799 2.182
LCN2 212531_at 0.00161 2.165
CYP1B1-AS1 1553829_at 0.00273 2.157
ADAMTS2 214535_s_at 0.0000261 2.151
DHRS9 223952_x_at 0.000497 2.149
LTF 202018_s_at 0.00292 2.134
CEACAM1 206576_s_at 0.00104 2.124
CRISP2 210262_at 0.000751 2.111
HGF 210998_s_at 0.000224 2.103
C1QC 225353_s_at 0.00269 2.1
THBS1 235086_at 0.000875 2.094
CEACAM1 211889_x_at 0.00129 2.09
SIRT5 219185_at 0.0000365 2.073
DHRS9 219799_s_at 0.000357 2.06
FGF13-AS1 1560537_at 0.000345 2.053
ERLIN1 202444_s_at 0.0000247 2.048
PDE4D 1554717_a_at 0.000131 2.027
KL 205978_at 0.000595 2.012
The most differentially expressed genes (upregulated) in severe and mild acute pancreatitis, (FC 1.5 and FDR <
0.05) and the corresponding FC and p-values. Abbreviations: FC = fold changes (FC); FDR = False discovery
rate.

148 | P a g e
Table 7.12 lists the most differentially expressed (downregulated) genes between all SAP and
the corresponding FC and p-values obtained from comparisons with MAP.
Table 7.12 - Top 50 differentially expressed genes (down regulated) in severe and mild
acute pancreatitis
Gene Symbol ID P value Fold Change
NELL2 203413_at 0.000450 -2.594
NOV 214321_at 0.000285 -2.519
YME1L1 234849_at 0.000218 -2.407
YME1L1 234013_at 0.00125 -2.405
TRDV3 216191_s_at 0.0000328 -2.398
YME1L1 217143_s_at 0.0000358 -2.386
RORA 226682_at 0.0000236 -2.364
P2RY10 236280_at 0.0000354 -2.321
THEMIS 1558972_s_at 0.00018 -2.299
INPP4B 235046_at 0.000166 -2.292
TRAT1 217147_s_at 0.00037 -2.283
KIAA1671 225525_at 0.000529 -2.254
GZMK 206666_at 0.0000878 -2.235
YME1L1 213830_at 0.0000298 -2.214
BCL11B 219528_s_at 0.000125 -2.208
RPS6KA5 1557113_at 5.51E-06 -2.201
GBP4 235175_at 0.000101 -2.178
TRAV9-2 217412_at 0.000319 -2.165
GATA3 209602_s_at 0.0000954 -2.159
CD28 206545_at 0.000194 -2.139
CAMK4 229029_at 0.00103 -2.113
TBC1D4 203387_s_at 0.0000443 -2.104
CD160 207840_at 0.000213 -2.091
TRAV24 234398_at 0.000694 -2.09
BEX2 224367_at 0.00321 -2.082
PRKCQ-AS1 1561004_at 0.000382 -2.075
IFNLR1 244261_at 0.000122 -2.068
TRAC 210972_x_at 0.00035 -2.03
DPP4 211478_s_at 0.000147 -2.026
RPS6KA5 204635_at 0.0000249 -2.022
GRAMD1C 219313_at 0.000717 -2.02
ATP8B2 226771_at 0.0000993 -2.016
ETV7 224225_s_at 0.00165 -2.012
ISM1 235182_at 0.00174 -2.007
LOC105369609 244798_at 0.00274 -2.003
CAMK4 241871_at 0.000522 -2
THEMIS 1558971_at 0.000189 -1.984
CD3D 213539_at 0.000425 -1.982
PYHIN1 240413_at 0.000401 -1.977

149 | P a g e
RORA 236266_at 0.000103 -1.975
LCK 204891_s_at 0.000231 -1.972
BCL11B 222895_s_at 0.000208 -1.97
YME1L1 211902_x_at 0.000521 -1.968
CXCR3 207681_at 0.0000454 -1.966
CD40LG 207892_at 0.000941 -1.954
MYBL1 213906_at 0.000183 -1.954
NR3C2 205259_at 0.000664 -1.939
GBP5 238581_at 0.000391 -1.936
TRAC 209671_x_at 0.000479 -1.935
RPS6KA5 204633_s_at 0.000152 -1.931
The most differentially expressed genes (downregulated) in severe and mild acute pancreatitis, (FC 1.5 and FDR
< 0.05) and the corresponding FC and p-values. Abbreviations: FC = fold changes (FC); FDR = False
discovery rate.
NOV (Neuroblastoma overexpressed) was found to be one of the most downregulated genes
in our dataset. NOV is involved in regulating multiple cellular activities, including migration,
proliferation, differentiation and survival. It has also been found to be involved in causing
Ca2+ influx. Recently, regulatory T cells were identified to mediate oligodendrocyte
differentiation in regeneration of myelin following damage. NOV was thought to be a key
player in facilitating this process.
YME1L1 encodes for ATPases and is involved in mitochondrial organisation and protein
metabolism. Pancreas is known to be one of the only organs in the body to have high
concentrations of its protein due to high concentration of mitochondria. YME1L1 controls the
accumulation of respiratory chain subunits and is required for apoptotic resistance, cristae
morphogenesis, and cell proliferation.
T cell Receptor Associated Transmembrane Adaptor 1(TRAT1), T cell Receptor Delta
Variable 3(TRDV3), T cell Receptor Alpha Variable 9-2 and 24(TRAV 9-2 and TRAV24), T
cell Receptor Alpha constant (TRAC) are all responsible for stabilising the T cell receptor
(TCR) and are particularly involved in NFAT pathway. These were found to be most
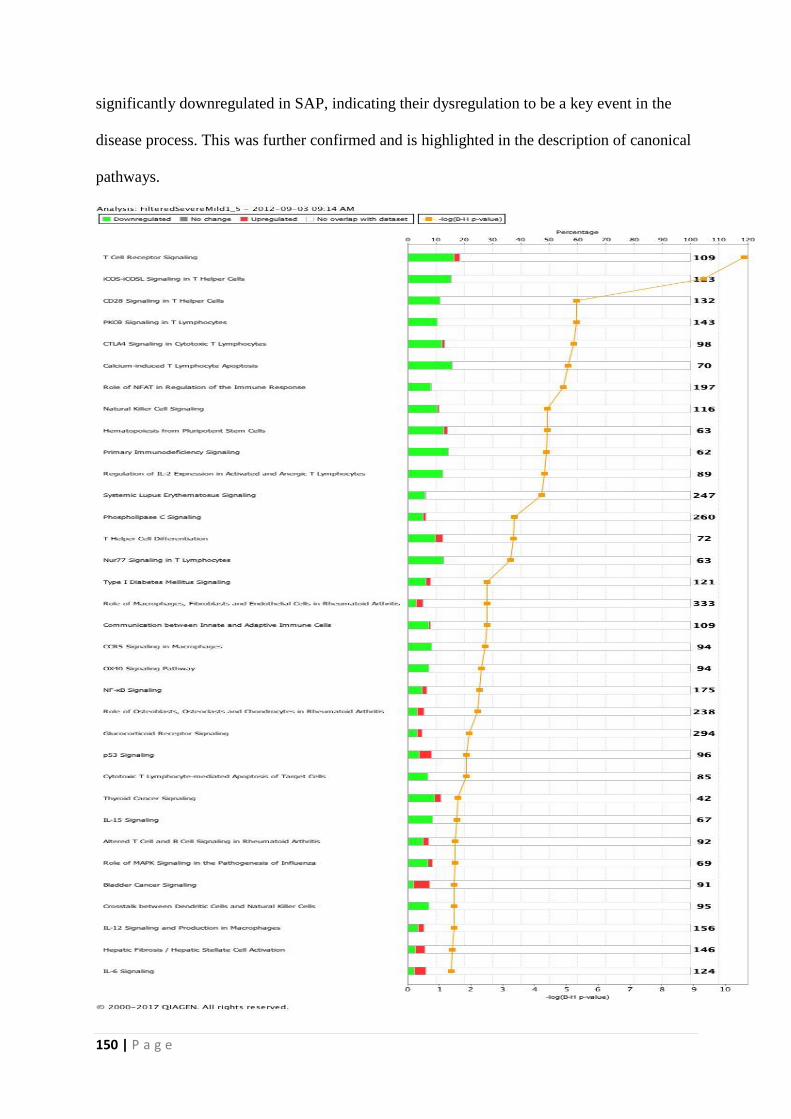
150 | P a g e
significantly downregulated in SAP, indicating their dysregulation to be a key event in the
disease process. This was further confirmed and is highlighted in the description of canonical
pathways.

151 | P a g e
Figure 7.40 - Top canonical pathways differentially expressed in SAP and MAP
The above figure (7.40) lists top 34 pathways differentially expressed in severe acute
pancreatitis when compared with mild acute pancreatitis. The stacked bar chart displays the
percentage of genes that were upregulated (red), downregulated (green), and genes not
overlapping with our data set (white) in each canonical pathway. The numerical value at the
top of each bar represents the total number of genes in the canonical pathway. The secondary
x-axis shows the −log of P-value calculated by the Benjamini-Hochberg (B-H) method; the
B-H method was used to adjust the right-tailed Fisher’s exact test P-value, which indicates
the significance of each pathway.
Adjusting the rate helps to control for the fact that sometimes small p-values (less than 5%)
happen by chance, which could lead to incorrect rejection of the true null hypotheses. In other
words, the B-H procedure helps to avoid type I errors (false positives).
Details of the top canonical pathways identified are listed in table 14.3.
Table 7.13 - Top canonical pathways differentially expressed in SAP and MAP
Ingenuity Canonical pathways P
value
Downregulated Upregulated No overlap with the
data set
T Cell Receptor Signalling 10.6 18/109 (17%) 2/109 (2%) 89/109 (82%)
iCOS-iCOSL Signalling in T Helper
Cells
9.31 19/123 (15%) 0/123 (0%) 104/123 (85%)
CD28 Signalling in T Helper Cells 5.32 15/132 (11%) 0/132 (0%) 117/132 (89%)
PKCθ Signalling in T Lymphocytes 5.32 15/143 (10%) 0/143 (0%) 128/143 (90%)
CTLA4 Signalling in Cytotoxic T
Lymphocytes
5.24 12/98 (12%) 1/98 (1%) 85/98 (87%)
Calcium-induced T Lymphocyte
Apoptosis
5.04 11/70 (16%) 0/70 (0%) 59/70 (84%)
Role of NFAT in Regulation of the
Immune Response
4.91 16/197 (8%) 1/197 (1%) 180/197 (91%)
Natural Killer Cell Signalling 4.4 12/116 (10%) 1/116 (1%) 103/116 (89%)
Hematopoiesis from Pluripotent Stem
Cells
4.4 8/63 (13%) 1/63 (2%) 54/63 (86%)
Primary Immunodeficiency Signalling 4.37 9/62 (15%) 0/62 (0%) 53/62 (85%)

152 | P a g e
Regulation of IL-2 Expression in
Activated and Anergic T Lymphocytes
4.31 11/89 (12%) 0/89 (0%) 78/89 (88%)
Systemic Lupus Erythematosus
Signalling
4.21 15/247 (6%) 1/247 (0%) 231/247 (94%)
Phospholipase C Signalling 3.37 14/260 (5%) 3/260 (1%) 243/260 (93%)
T Helper Cell Differentiation 3.32 7/72 (10%) 2/72 (3%) 63/72 (88%)
Nur77 Signalling in T Lymphocytes 3.24 8/63 (13%) 0/63 (0%) 55/63 (87%)
Type I Diabetes Mellitus Signalling 2.51 8/121 (7%) 2/121 (2%) 111/121 (92%)
Role of Macrophages, Fibroblasts and
Endothelial Cells in Rheumatoid
Arthritis
2.51 10/333 (3%) 8/333 (2%) 315/333 (95%)
Communication between Innate and
Adaptive Immune Cells
2.51 8/109 (7%) 1/109 (1%) 100/109 (92%)
CCR5 Signalling in Macrophages 2.45 8/94 (9%) 0/94 (0%) 86/94 (91%)
OX40 Signalling Pathway 2.34 7/94 (7%) 0/94 (0%) 87/94 (93%)
NF-κB Signalling 2.26 9/175 (5%) 3/175 (2%) 163/175 (93%)
Role of Osteoblasts, Osteoclasts and
Chondrocytes in Rheumatoid Arthritis
2.2 8/238 (3%) 6/238 (3%) 224/238 (94%)
Glucocorticoid Receptor Signalling 1.94 10/294 (3%) 5/294 (2%) 279/294 (95%)
p53 Signalling 1.85 4/96 (4%) 4/96 (4%) 88/96 (92%)
Cytotoxic T Lymphocyte-mediated
Apoptosis of Target Cells
1.85 6/85 (7%) 0/85 (0%) 79/85 (93%)
Thyroid Cancer Signalling 1.6 4/42 (10%) 1/42 (2%) 37/42 (88%)
IL-15 Signalling 1.56 6/67 (9%) 0/67 (0%) 61/67 (91%)
Altered T Cell and B Cell Signalling
in Rheumatoid Arthritis
1.49 5/92 (5%) 2/92 (2%) 85/92 (92%)
Role of MAPK Signalling in the
Pathogenesis of Influenza
1.49 5/69 (7%) 1/69 (1%) 63/69 (91%)
Bladder Cancer Signalling 1.48 2/91 (2%) 5/91 (5%) 84/91 (92%)
Crosstalk between Dendritic Cells and
Natural Killer Cells
1.48 7/95 (7%) 0/95 (0%) 88/95 (93%)
IL-12 Signalling and Production in
Macrophages
1.47 6/156 (4%) 3/156 (2%) 147/156 (94%)
Hepatic Fibrosis / Hepatic Stellate Cell
Activation
1.42 4/146 (3%) 5/146 (3%) 137/146 (94%)
IL-6 Signalling 1.39 3/124 (2%) 5/124 (4%) 116/124 (94%)
Figure below (7.41) depicts the genes involved in TCR signalling in our dataset. The
downregulated genes are highlighted in green. This demonstrates the process of TCR
activation which promotes a number of signalling cascades, resulting in cytokine production
and progression of inflammation. Lymphocyte protein tyrosine kinase (Lck) and Zeta-chain
associated protein kinase (Zap-70) become activated and further lead to recruitment of

153 | P a g e
inducible T cell kinase (Itk). This phosphorylates phospholipase C γ1 (PLCγ1) which in turn
hydrolyses phosphatidylinositol 4,5-bisphosphate (PIP2) to produce the second messengers
diacylglycerol (DAG) and inositol trisphosphate (IP3). IP3 triggers the release of Ca2+ from
endoplasmic reticulum, which promotes entry of extracellular Ca2+ into cells through calcium
release-activated Ca2+ (CRAC) channels. Calcium-bound calmodulin (Ca2+/CaM) activates
the phosphatase calcineurin, which promotes IL-2 gene transcription through the transcription
factor NFAT.
Figure 7.41 - T Cell Receptor Signalling from the canonical pathways

154 | P a g e
Interestingly, NFAT was found to be the most abundantly expressed molecule in the
differentially expressed canonical pathways. Out of the top 25, at least 12 pathways had
NFAT as a key component, making it a crucial player in the pathogenesis.
As is evident from the figure below (7.42), on antigen engagement of lymphocyte receptors,
phospholipase C-γ (PLC-γ) becomes activated and hydrolyses phosphatidylinositol-4,5-
bisphosphate into inositol-1,4,5trisphosphate (IP3) and diacylglycerol. IP3 then binds to
specific receptors on the endoplasmic reticulum and drives calcium release from the
endoplasmic reticulum into the cytoplasm, which triggers STIM1 and Orai1-mediated
opening of calcium release activated calcium channels. As a result of increased intracellular
calcium, the calcineurin enzyme becomes active and dephosphorylates NFAT, allowing
NFAT translocation into the nucleus and subsequent regulation of gene expression. It should
be noted, however, that NFAT must ultimately bind to additional transcription factors, such
as AP1 to regulate gene expression [344, 345].

155 | P a g e
Figure 7.42 – Role of NFAT in regulating immune response from the canonical pathways

156 | P a g e
CHAPTER 8: MICRO RNA PROFILING

157 | P a g e
8.1 Samples Used
Plasma samples obtained from patients with acute pancreatitis were used for this part of the
project. These were obtained from patients at the time of admission and retrieved from
Liverpool NIHR Pancreas Biomedical Research Unit Acute Pancreatitis Biobank, where
these were stored as 1 ml aliquots.
Multiple experiments were designed to optimise the RNA extraction protocol to ensure
maximum concentration of total RNA. Following is the final optimised protocol.
8.2 Total RNA extraction from Plasma samples
One aliquot of 1 ml plasma was used for each patient. Protocol used was Plasma/Serum
Circulating RNA Purification Kit from Norgen Biotek Corporation.
8.2.1 Prior to extraction
All centrifugation steps were performed at room temperature.
All solutions were at room temperature prior to use.
Wash Solution I was prepared beforehand by adding 14.5 mL of 95% ethanol to the bottle
containing the concentrated RNA Wash Solution.
Wash Solution II was also prepared by adding 10 mL of 95% ethanol to the bottle
containing the concentrated RNA Wash Solution.
1 ml aliquots were speed vacuumed to 500 µl to concentrate the RNA and maximise the
yield.

158 | P a g e
8.2.2 Procedure of RNA extraction
One mL of Lysis Solution was added to 500 µl of concentrated plasma sample. This was
vortexed for 15 seconds.
The lysate was incubated for 10 minutes at 60oC.
1.5 mls of 96 - 100% Ethanol was added to the plasma sample. This was mixed by vortexing
for 10 seconds.
Lysate was then transferred to the Maxi Column assembly and vortexed for 15 seconds.
The Maxi Column assembly was centrifuged for 2 minutes at 3,000 RPM, after which, the
collection tube was removed and flow-through discarded. The Maxi Column was
reassembled with the collection tube and process repeated till all the lysate was applied.
700 μL of Wash Solution I was then applied to the column and centrifuged for 2 minute at
3,000 RPM, the flow-through discarded and Maxi Column with the collection tube
reassembled. The process was repeated one more time.
700 μL of Elution Solution I was applied to the column and centrifuged for 2 minutes at 500
RPM, followed by 3 minutes at 3,000 RPM. Maxi Column was discarded from the conical
tube.
One mL of Binding Solution was added to the eluted RNA contained within the conical tube
and vortexed for 15 seconds.

159 | P a g e
0.5 mL of 96 - 100% ethanol was added to the resultant mixture. This was then mixed by
vortexing for 10 seconds.
700 μL of this mixture was applied onto the Mini Spin Column and centrifuged for one
minute at 14,000 RPM.
This was repeated to load the rest of the sample.
400 μL of Wash Solution II was applied to the column and centrifuged for one minute at
14,000 RPM.
This was repeated a second time to wash the column.
The column was centrifuged for 2 minutes at 14,000 RPM in order to thoroughly dry the
resin.
The column was placed into a fresh 1.7 ml Elution tube and 100 μL of Elution Solution
II was added to the column. It was centrifuged for 3 minutes at 2,000 RPM, followed by two
minutes at 14,000 RPM.
The resultant total RNA was then used for further assessment.

160 | P a g e
8.3 Quantification of extracted RNA
Aliquots of total RNA for quality control assessments were taken at the time of extraction.
Concentration of the samples was analysed using Thermo Scientific NanoDrop™ 1000
Spectrophotometer.
8.4 Poly A tailing and ligation
Following figure provides diagrammatic representation of the process of Poly A tailing and
ligation of the extracted RNA (Figure 8.1).

161 | P a g e
Figure 8.1 – Poly-A Tailing and ligation (Adapted with permission)

162 | P a g e
8.4.1 Poly (A) Tailing
Protocol used was FlashTag® Biotin HSR RNA Labeling Kit for Affymetrix® GeneChip®
miRNA Arrays.
The total RNA was in a final volume of 80 µl. This was speed vacuumed to a volume of 8 µl.
All samples were heat denatured at 80oC for 10 minutes.
ATP mix was diluted in 1mM Tris in a ratio of 1:500.
2μl RNA Spike Control Oligos was added to the RNA sample, taking the total volume to 10
µl.
Following components were added to the 10μl RNA/Spike Control Oligos, for a volume of
15μl and microfuged:-
1.5μl 10X Reaction Buffer
1.5μl 25mM MnCl2
1.0μl diluted ATP Mix
1.0μl PAP Enzyme
The mixture was incubated in a 37oC heat block for 15 minutes.

163 | P a g e
8.4.2 FlashTag Biotin HSR Ligation
15μl of tailed RNA was briefly microfuged and placed on ice.
4μl 5X FlashTag Biotin HSR Ligation Mix and 2 μl of T4 DNA Ligase was added. The
resultant mixture was gently mixed and microfuged.
This was incubated at 25°C (room temperature) for 30 minutes.
The reaction was stopped by adding 2.5μl HSR Stop Solution. The 23.5μl of ligated
sample was mixed and microfuged.
8.5 Affymetrix GeneChip miRNA Array Procedure
8.5.1 Hybridization
The 20X Eukaryotic Hybridization Controls (bioB, bioC, bioD, cre from GeneChip
Eukaryotic Hybridization Control Kit) were completely thawed and then heated for 5 minutes
at 65°C.
The following components were added to the biotin-labelled sample in order to prepare the
array hybridization cocktail:-
50μl 2X Hybridization Mix
15μl 27.5% Formamide
10μl DMSO

164 | P a g e
5μl 20X Eukaryotic Hybridization Controls
1.7μl Control Oligonucleotide B2, 3nM
The resultant volume was 103.2μl. This was incubated at 99oC for 5 minutes, then 45oC for 5
minutes.
100μl was aspirated and injected into an array (miRNA_2.0 array from Affymetrix).
The pipette tip was removed from the upper right septum of the array and both septa were
covered with 1/2" Tough-Spots to minimize evaporation and/or prevent leaks.
Affymetrix Hybridization Oven 640 was turned on and preheated at the temperature of 48°C
and RPM of 60.
The arrays were placed into hybridization oven trays and loaded into the hybridization oven.
The arrays were then incubated at 48°C and 60 rpm for 16 hours.
8.5.2 Washing and Staining
After 16 hours of hybridization, the arrays were removed from the oven and the Tough-Spots
taken off.
The hybridization cocktail was extracted from each array and transferred to a new tube in
order to save the hybridization cocktail and stored at –80°C for long-term storage.

165 | P a g e
Each array was completely filled with Array Holding Buffer.
The arrays were allowed to equilibrate to room temperature before washing and staining.
Vials were placed into sample holders on the fluidics station:-
One (amber) vial containing 600μl Stain Cocktail 1 in sample holder 1.
One (clear) vial containing 600μl Stain Cocktail 2 in sample holder 2.
One (clear) vial containing 800μl Array Holding Buffer in sample holder 3.
These were washed and stained with Fluidics Station 450 using fluidics script FS450_0003.
Post Hyb Wash #1 - 10 cycles of 2 mixes/cycle with Wash Buffer A at 25°C.
Post Hyb Wash #2 - 8 cycles of 15 mixes/cycle with Wash Buffer B at 50°C.
1st Stain: The probe array was stained for 10 minutes with Stain Cocktail 1at 25°C.
Post Stain Wash - 10 cycles of 4 mixes/cycle with Wash Buffer A at 30°C.
2nd Stain: The probe array was stained for 10 minutes with Stain Cocktail 2 at 25°C.
3rd Stain: The probe array was stained for 10 minutes with Stain Cocktail 1 at 25°C.
Final Wash - 15 cycles of 4 mixes/cycle with Wash Buffer A at 35°C.

166 | P a g e
The probe array was completely filled with Array Holding Buffer.
Once it was ensured that there were no air bubbles, both septa were covered with 3/8" Tough-
Spots. The array glass surfaces were inspected for dust and other particulates prior to
scanning.
8.5.3 Scanning
Once the protocol was completed, the arrays were ready to scan on the GeneChip Scanner
3000. Affymetrix Command Console software was used to scan the genechips.
Genechips were inserted into the scanner. Once scanning was completed, Affymetrix
Expression Console was used to generate the quality control metrics to ensure adequate and
appropriate processing of the arrays.
8.6 Analysis
The miRNA QC Tool software was used for data summarisation, normalisation, and quality
control.
Analysis was performed using appropriate packages in R/Bioconductor and using Partek
Genomics Suite software. Expression level data were invariant set normalised. Differential
expression of miRNAs in severe versus mild acute pancreatitis was detected using ANOVA
with batch hybridization effects removed. The Benjamini and Hochberg multiple testing
correction was applied to the resulting p-values.
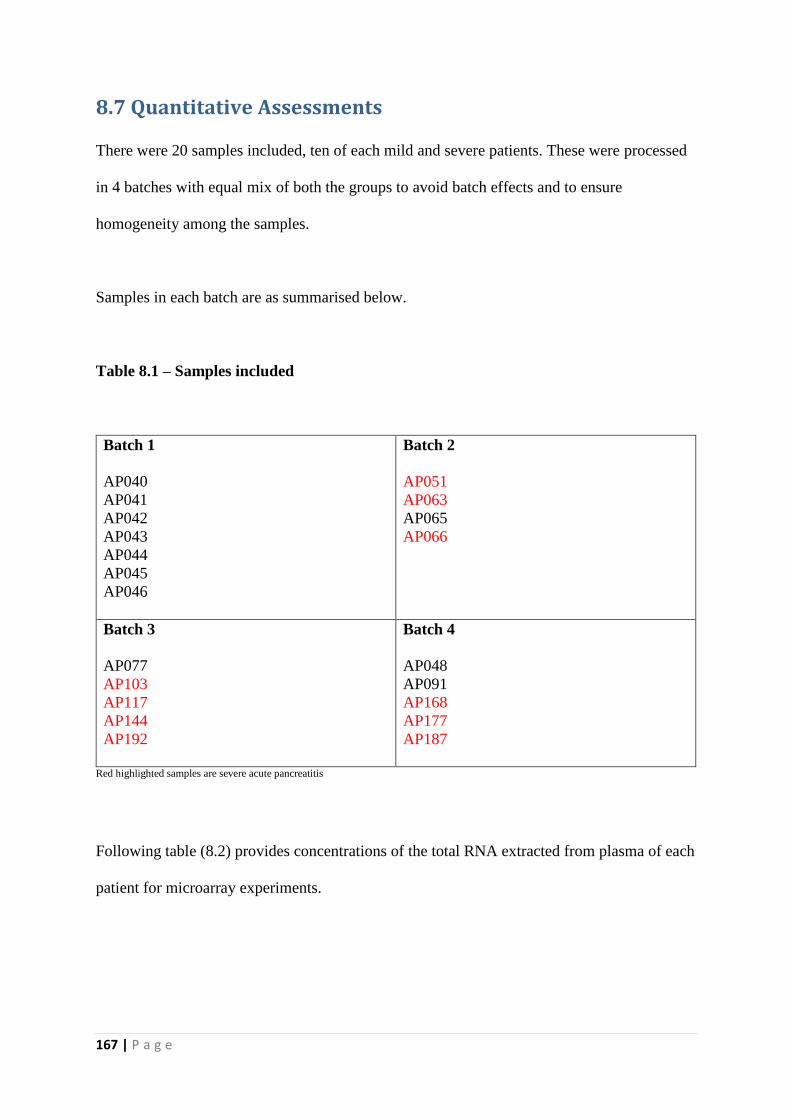
167 | P a g e
8.7 Quantitative Assessments
There were 20 samples included, ten of each mild and severe patients. These were processed
in 4 batches with equal mix of both the groups to avoid batch effects and to ensure
homogeneity among the samples.
Samples in each batch are as summarised below.
Table 8.1 – Samples included
Batch 1
AP040
AP041
AP042
AP043
AP044
AP045
AP046
Batch 2
AP051
AP063
AP065
AP066
Batch 3
AP077
AP103
AP117
AP144
AP192
Batch 4
AP048
AP091
AP168
AP177
AP187
Red highlighted samples are severe acute pancreatitis
Following table (8.2) provides concentrations of the total RNA extracted from plasma of each
patient for microarray experiments.

168 | P a g e
Table 8.2 – Total RNA concentration of the samples included
Sample Concentration (ng/µl)
AP040 3.3
AP041 2.7
AP042 1.5
AP043 2.3
AP044 0.9
AP045 2.3
AP051 3.9
AP063 1.5
AP065 2.4
AP066 2.3
AP077 4.4
AP103 3.0
AP117 2.0
AP144 3.2
AP192 3.6
AP048 4.7
AP091 6.2
AP168 6.4
AP177 4.6
AP187 6.1
The first step post hybridization and scanning of the arrays is the generation of quality control
(QC) metrics to ensure efficient hybridization. Following are the QC metrics for the included
samples.
Table 8.3 - Quality Control Metrics of the hybridizations
Samples Mean Intensity Mean Background
Intensity
Detected
Probes*
Detected
Probe
sets¥
AP040 86.63517
39.03065 19149 3273
AP041 85.28208
39.56137 12894 1823
AP042 74.03575
36.58618 13356 1792
AP043 84.91063
39.05802 12305 1906

169 | P a g e
AP044 90.64921
39.60151 12422 1987
AP045 87.27647
40.36115 13691 2088
AP051 90.4346
51.05437 13940 2193
AP063 89.57281 52.92628
12599 1954
AP065 76.81561
38.08247 14702 2406
AP066 85.99326 41.41285 14468 2391
AP077 80.21484
42.16008 13756 2231
AP103 71.31986 38.12845 13346 1994
AP117 73.73982
38.61769 12687 1577
AP144 139.3286 47.36808 21823 3313
AP192 83.2539
40.13697 12677 1867
AP048 80.46622
39.51514 12555 1992
AP091 84.81396
40.57718 17584 3018
AP168 76.28916 38.0399 12608 1949
AP177 75.0023 39.34704 11931 1598
AP187 83.39607
45.20448 13611 2361 *Out of total 202752 probes
¥Out of total 20643 probe sets
The above table indicates uniformity and homogeneity among the samples that hybridized to
accepted standards, making the data retrieved from them reliable and of biological
importance.
This was then further investigated in the form of box plots. These are as follows:-
Figure 8.2 – Quality Control Metrics of Probe intensities of the House keeping genes

170 | P a g e
This figure (8.2) shows the log 2 expression of the probe intensities of the house keeping
genes. This appeared to be fairly evenly distributed across all the samples, but sample 20
seemed to be an outlier.
Figure 8.3 – Quality Control Metrics of Perfect match intensities
This was further confirmed on ‘perfect match’ intensities as well. But the expression level
boxplot (see below) didn’t demonstrate this as clearly. Therefore, it was decided to proceed to
principle component analysis for batch effects with 20 samples.
Figure 8.4 - QC metrics box plot on Log Expression Signal

171 | P a g e
8.8 Principle Component Analysis
Principle Component Analysis (PCA) was then performed to look for and correct batch
effects and also to analyse differential expression. This was done using Parteik. While it
showed grouping of the samples into mild and severe rather elegantly, sample 20 was an
obvious outlier. Therefore, it was decided to remove this from the group and performed the
rest of analyses with 19 samples (10 MAP, 9 SAP). Also, it was noted on the PCA plots that
when classified according to batch dates, reassuringly, no significant clustering was observed.
Figure 8.5 – Principle component analysis according to disease severity
With Batch Effects
Batch Effects Removed
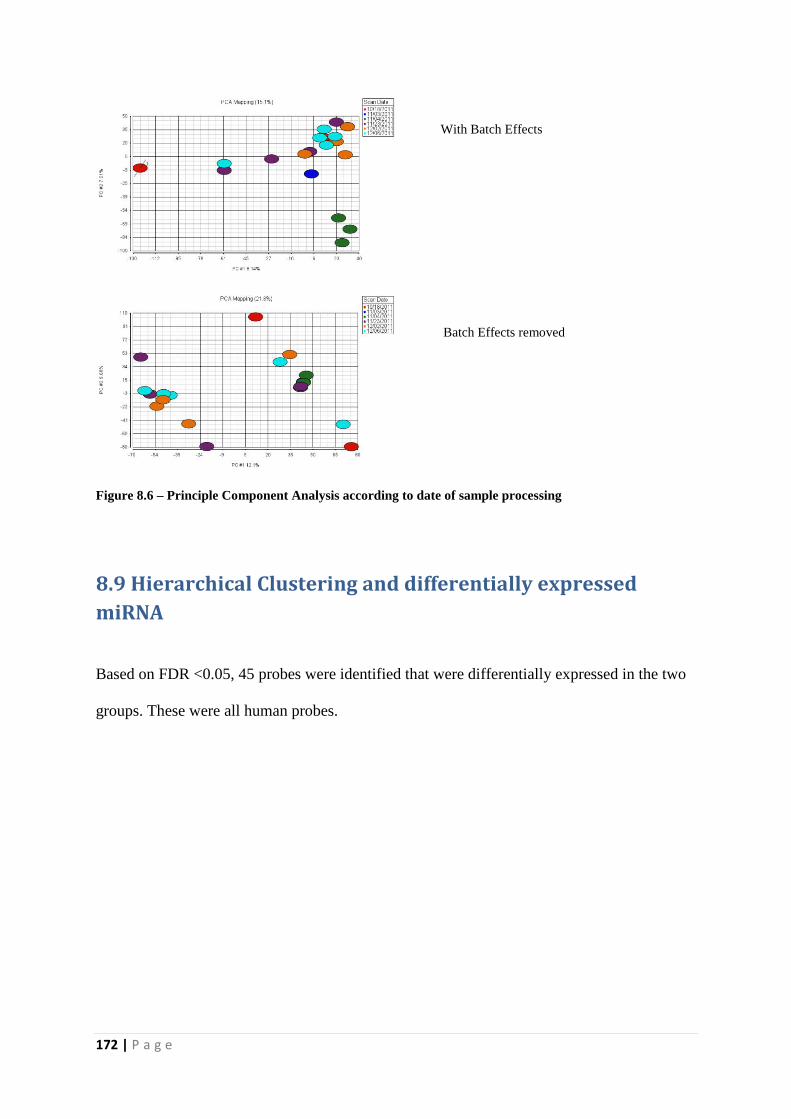
172 | P a g e
Figure 8.6 – Principle Component Analysis according to date of sample processing
8.9 Hierarchical Clustering and differentially expressed
miRNA
Based on FDR <0.05, 45 probes were identified that were differentially expressed in the two
groups. These were all human probes.
With Batch Effects
Batch Effects removed

173 | P a g e
Figure 8.7 - Hierarchical Cluster Analysis of differentially expressed miRNA in mild and severe acute
pancreatitis patients. Heat map depicting the miRNA expression patterns in 19 patients (10 mild and 9
severe acute pancreatitis). This was calculated keeping the FDR p < 0.05. 45 differentially expressed
miRNA were identified, out of which only 23 were annotated in IPA/MetaCore. Columns represent
individual samples and rows represent each gene. Each cell in the matrix represents the expression level
of a gene feature in an individual sample. Blue represents mild and red illustrates severe patients.
Upregulated (high expression level) genes are coloured red whereas downregulated (low expression level)
genes are shown as green.
Here is the list of top 20 differentially expressed miRNA between the two groups in order of
their ranking based on p value and the fold change. Complete list is provided in appendix 3.

174 | P a g e
Table 8.4 – List of top 20 differentially expressed miRNA between MAP and SAP.
Affy ID Adjusted p Value Fold Change
hp_hsa-mir-631_st 0.013909811 -1.86365
hp_hsa-mir-3129_x_st 0.013909811 -1.58772
ENSG00000238824_st 0.013909811 -1.29649
hp_hsa-mir-1291_s_st 0.018768512 1.813645
ACA50_st 0.018768512 -1.31933
ENSG00000212611_x_st 0.019781918 -1.26774
hsa-miR-592_st 0.021760076 1.7757
ACA9_x_st 0.021760076 -1.55509
ENSG00000239005_x_st 0.021760076 -1.45394
ENSG00000238450_x_st 0.022441665 1.509782
hp_hsa-mir-3157_st 0.022441665 -1.4312
ENSG00000238615_st 0.022441665 1.341408
hp_hsa-mir-548n_x_st 0.024523767 -1.77023
hsa-miR-302e_st 0.026509154 -1.52089
hsa-miR-513c_st 0.026509154 1.452108
hsa-miR-548j_st 0.028097164 -1.45883
ENSG00000206898_st 0.03542224 -1.24917
hsa-miR-758_st 0.03572517 1.638581
hsa-miR-3187_st 0.03572517 -1.58219
v49_ENSG00000200237_st 0.037128192 -1.12136
Role of miR-631 is well studied in prostate cancer. It is avowed to inhibit the migration and
invasion of prostate cancer cells. Related canonical pathways are metabolism and
glycosaminoglycan metabolism.
miR-1291 (derived form SNORA34) has has been implicated in pathogenesis of various
related and unrelated malignancies and disease processes. It was downregulated in clinical
pancreatic ca samples and human pancreatic cancer cell lines and was also found to have
significantly lower expression in oesophageal squamous cell carcinoma by acting as a tumour
suppressor by targeting Mucin 1 (MUC1). High circulating levels have also been related to
acute myocardial infarction. Loss of tumour repressive miR-1291 enhances renal cell
carcinoma proliferation, migration and invasion through targeting SLC2A1/GLUT1. It is also

175 | P a g e
a biologically relevant regulator of GPC3 expression in hepatoma cells and acts through
silencing of the endoplasmic reticulum stress sensor IRE1alpha.
miR-758-5p is another miRNA that has been associated with varying disease processes but
its role is mainly defined in cholesterol metabolism. It decreases lipid accumulation of foam
cell by regulating CD36-mediated cholesterol uptake and its expression is significantly
upregulated in hyper-cholesterolemic plaques, perhaps through regulating Cholesterol-Efflux
Regulatory Protein (ABCA1). It has also been suggested that it may serve as a potential
diagnostic biomarker for lupus nephritis in patients with systemic lupus erythematosus (SLE).
It also mediates Hepatitis C virus infection induced changes in Toll like Receptor 3 and 7.
Small nucleolar RNA SNORA70 (U70) is a non-coding RNA (ncRNA) molecule which
functions in the biogenesis (modification) of other small nuclear RNAs (snRNAs).
miR-592 has been linked to progress of various malignant processes. It has been laid out to
be a novel and a potential carcinogen-initiated and metastasis-related biomarker in colorectal
cancer, and down-regulation of miR-592 has been given due consideration as a potentially
significant molecular treatment strategy for these patients [346, 347]. Overexpression of miR-
592 has been shown to reduce cell proliferation, migration and invasion and induce cell arrest
at G1/G0 phase in glioma tissues and cell lines. It was also demonstrated to yield smaller
tumour volume and weight, specifying a promising application for its use in glioma treatment
[348]. In addition to glioma, miR-592 is being considered as a promising therapeutic target
for non-small cell lung cancer, due to its function as a tumour suppressor by suppressing
SOX-9 [349].
miR-513 is expressed in human cholangiocytes and is down-regulated upon IFN-γ exposure.
It regulates B7-H1 (a molecule that plays a critical role in immunomodulation of the cell
176 | P a g e
mediated immune response) translation and is involved in IFN- γ induced B7-H1 expression
in the cholangiocytes. This emphasises role for miRNA mediated gene silencing in the
regulation of cholangiocyte response to IFN- γ [350].
Small Nucleolar RNA (SnoRNA) U13 (SnoU13) was first described in 1989 [351]. It has
been well characterized in 35 species by both functional assay and prediction. It is involved
in the nucleolytic cleavage at the 3′ end of 18S rRNA where it works as a trans-acting factor.
SnoRNAs, in general, are poorly understood. While it is well known that they form the
majority of non- coding RNAs, their functional value and role in cellular interactions is still
largely unknown. Traditionally, snoRNAs have always been thought to be exclusively inside
the nucleolus and Cajal bodies, involved in maturation of ribosomal RNA (rRNA) and small
nuclear RNA (snRNA) locally [351, 352]. A recent study has however demonstrated that
while more than 99% of the U13 snoRNAs are nuclear in their location in unstressed cells,
cytoplasmic presence of snoRNA has been manifested by qPCR and RNA-seq, in response to
stress, where their cytoplasmic abundance as a class is dynamically regulated by oxidative
tone and is very rapid and significant. Because the nuclear snoRNAs are in vast excess to the
cytoplasmic snoRNAs, even small changes in the nuclear pool would be expected to create
large relative changes in the cytoplasmic pool. This study also suggests that cells have robust
mechanisms for maintaining the cytoplasmic levels of snoRNAs and that detection of
snoRNAs in the cytoplasm is not simply a “mass effect” in which some proportion of
snoRNAs spill over into the cytoplasm [353]. It also entertains the possibility of anti-sense
interactions of U13 snoRNA and the cytoplasmic mRNAs which could result in nucleotide
modifications. It is safe to say that U13 snoRNA potentially could exert far reaching effects
on cytoplasmic functions, a lot more than previously thought to be.
Small Nucleolar RNA U30 thought to act as a 2'-O-ribose methylation guide for ribosomal
RNA [354].

177 | P a g e
Small Nucleolar RNA ACA 9 (SnoRA9) guides the sites of modifications of uridines to
pseudouridines [355].
Small nucleolar RNA SNORA50 (also known as ACA50) is a non-coding RNA which
affects modification of other small nuclear RNAs (snRNAs). ACA50 was originally cloned
from HeLa cells and belongs to the H/ACA box class of snoRNAs. SnoRNA ACA50 is
predicted to guide the pseudouridylation of U34 and U105 of 18S ribosomal RNA (rRNA)
[355].

178 | P a g e
CHAPTER 9: DISCUSSION

179 | P a g e
In this observational, translational study, including 58 patients with acute pancreatitis, it has
been identified and established that severe and mild acute pancreatitis are two different
disease groups. While the underlying basic mechanisms of initiation of the disease may stand
true for both of them, the progression is governed by different pathways altogether. It begins
to explain why the outcomes and disease courses are so different for the same disease. The
microarray experiments have identified various genes (98 genes with a fold change of 1.5)
that are differentially expressed between mild and severe pancreatitis. Most of these
differentially expressed genes are associated with various inflammatory processes and are
involved in remodelling of extracellular matrix, recruitment of inflammatory cells, cellular
proliferation and angiogenesis. These are all well-known early and key events in the initiation
and progression of acute pancreatitis. Results confirm their significance in the disease
process. By associating particular genes to these individual processes, it makes a lot of
scientific sense to investigate these as potential biomarkers, especially early on in the disease
course.
Most interestingly, the functional analysis has shed light on the immune response in the
disease and pathways involved. T cell signalling pathways have been found to be among the
top most significant canonical pathways. This is a very important finding. This indicates a
role of adaptive immunity in pathogenesis that has not been explored and emphasised on
before.
Another important canonical pathway that has been diagnosticated to be differentially
expressed in SAP is ‘role of NFAT in immune response’. Its significance lies in the fact that
NFAT has also been noted to be the most significantly implicated gene in our dataset, being a
key molecule in at least 12 different pathways (out of the top 25 most differentially expressed
pathways). This is of particular importance.

180 | P a g e
Based on a pilot study of 19 samples including mild and severe patients, a differential
miRNA expression between the two disease states was successfully demonstrated. The
groups separated out as two different entities, based on the miRNA expression. This was
clearly demonstrated on hierarchical clustering. At least 45 miRNA were identified to be
differentially expressed between the disease states. This was based on FDR of <0.05. These
miRNA are the point of interest. Looking into their function, specification and interaction
with mRNAs and targets will provide invaluable information on the pathogenesis of the
disease but also an insight into potential biomarkers. Interpreting canonical pathways for
miRNA implicated in this dataset would have to be considered with caution – not much is
known about them and therefore, lack of evidence for links to a particular function does not
translate to absence of it. In fact, most of the differentially expressed miRNA in this dataset
have been found to be of prognostic/predictive value in various malignancies and their role in
the setting of inflammation, infection or sepsis is largely unknown.
Of particular note, was the abundance of sno RNAs in our dataset – in fact, almost 50% of
our most differentially expressed miRNA were found to be sno RNAs. Small Nucleolar RNA
(sno RNA) represent a class of regulatory RNAs responsible for post-transcriptional
maturation of ribosomal RNAs (rRNAs). Since defects in ribosome maturation and function
can cause disruption of vital processes and lead to diseases and transformation of normal cells
into tumour cells [356-358], it is well reasoned to postulate that snoRNA level can affect
physiological condition of cells, tissues, and organs, thereby leading to various diseases.
9.1 Biomarker Research in Acute Pancreatitis
Acute pancreatitis continues to be a clinical challenge. While management of the disease is
uncertain and unpredictable at best, prognostication poses an even bigger problem. Severe
acute pancreatitis, especially, is associated with high morbidity and mortality and therefore,

181 | P a g e
early identification is the key. The current scoring systems require at least 48 hours to be of
full use and even then, suffer from low sensitivity. The crying need of the time is an efficient,
robust clinical system, whereby a patient diagnosed to have AP can readily be stratified into a
category with good confidence and outcomes predicted. This will help to allocate clinical
care in the best suited manner. This will be particularly useful in clinical trials, where
categorisation of patients into an appropriate group is of paramount importance. Accurate
disease stratification ensures effective assessment of the impact of the treatment. Once a
reliable method/molecules is/are identified, this can then be exploited to not only assess
severity at the time of admission but also predict different outcomes, i.e., necrosis, organ
failure, death etc.
Biomarker discovery has taken an accelerated pace in recent times and is taking advantage of
ever growing technologies. The approaches involved are multidisciplinary, from basic to
translational and clinical research. As biological processes are complex, multi-technological
approaches are crucial in understanding the basic pathophysiology. Prognostication in acute
pancreatitis is still evolving. From implementation of Ranson’s Score in 1974 [359] to the
new genomic markers in the form of miRNA, we have come a long way in unravelling the
mysteries of pathophysiology that have led the path for discovering more reliable and
clinically useable biomarkers. However, this unfortunately still hasn’t translated into ultimate
success. We still do not have any biomarker/panel of biomarkers which is efficient enough.
More and more clinical parameters and molecular entities are being tested every day.
Many clinical and biochemical markers and scoring systems have been tried in the clinical
and experimental arenas – Modified Glasgow scale, APACHE II, organ failure related
scoring systems(SOFA, Marshall, MOF/Goris), radiologic scores (Balthazar, CTSI), CRP and
procalcitonin are some examples. Cytokines are at the helm of prognostication – there is
already sizeable, well established body of data, grounding its claim to be reliable in

182 | P a g e
predicting severity in AP [360-362]. However, because of their limitations, no cytokines are
useful enough to indicate disease progression of AP with simplicity and accuracy for routine
clinical use. Recently, Growth differentiation factor-15 (GDF-15) and pentraxin 3 (PTX3)
have been shown to have higher discriminatory value than the traditional markers of CRP and
APACHE II in AP [363]. Another study found quantitative assessment of raised histone
levels in plasma (from early death of immune cells) to be accurate in predicting persistent
organ failure and mortality in patients with AP [364].
Results from Early Achievable Severity (EASY) index trial are awaited with great
anticipation [365]. This is the first multi-centred, international trial that will endeavour to
identify factors, predicting severity of AP by way of easily obtainable parameters which are
not only quick to gather but are also representative of the disease course. Along the same
lines, is the establishment of Acute Pancreatitis Patient Registry to Examine Novel Therapies
in Clinical Experience (APPRENTICE) [366]. It is yet another international, multi-centre
consortium that aims to better understand the natural history of AP worldwide and to develop
a platform for future randomized clinical trials. This electronic prospective registry will be
fed from high-volume international centres with expertise in pancreatic diseases and will
describe the current trends of demographics, risk factors, clinical profile, treatment patterns,
and outcomes of AP around the world. In addition, the establishment of this unique
international collaboration will not only serve as a bank for proteomic and genomic data from
the included patients it will also allow for it to be used as a platform for future randomized
clinical trials that can translate new therapies in less time and with a diversified patient
population.
183 | P a g e
9.2 T Cell Signalling and Role of Adaptive Immunity In Acute
Pancreatitis
T cell depletion (CD4+ and CD8+) in the peripheral blood in the setting of SAP is now a
celebrated fact. Many studies have substantiated the claim [254, 367-371]. This begs the
question – why? What mechanisms are at play here? It would be reasonable to assume, for
starters, that SIRS forces lymphocyte influx into the site/s of inflammation, like pancreas,
lungs or kidneys, thereby, depleting the peripheral blood of its presence [372]. It has to be
borne in mind that peripheral lymphocytes constitute a very small proportion of the total
population as most of it is constantly being redistributed between other lymphoid tissues and
organs [373], and therefore, a fall in the peripheral count does not necessarily represent
impaired immune response [368]. Be that as it may, recent studies have now implicated role
of apoptosis in eliminating excessive T cells which have been found to be primed to
apoptosis in AP [369, 374]. Indeed, thymic atrophy as a consequence of apoptosis occurs
during SAP in rats [375]. Also backing this piece of evidence is TGF β and intracellular
calcium mobilisation induced apoptosis of lymphocytes in rat models of pancreatitis [369,
376]. During the course of the disease, CD4+ are depleted, both in MAP and SAP, whereas
CD8+ cell population is relatively unscathed [374] but this does not necessarily translate into
impaired host immunity as the CD4+:CD8+ ratio remains unchanged. Among the CD4+
cells themselves, Th1 CD4+ cells have been found to be more suppressed than their Th2
counterparts. This has been eloquently described in many studies and confirmed by a much
sharper rise in the Th2 cytokine production as opposed to Th1 [369, 374, 377], prompting a
Th1/Th2 cytokine imbalance and a resultant depression of host’s immune mechanisms. It is
important to briefly mention the role of regulatory T cells (Tregs), whose expression seems to
increase through varying stages of SAP. These cells regulate immunosuppression through

184 | P a g e
their anti-inflammatory and immunomodulatory roles and may provide a compensatory
response to the systemic inflammation in SAP [378, 379].
Experimental models of pancreatitis have hailed T cell activation to be at the centre of
systemic immune-inflammatory response that is hallmark of AP. T cell deficient and CD4+
depleted mice developed a less severe disease than their healthy counterparts [380], turning
the spotlight to the role of the adaptive immune response in this cascade. The very same
paper also presented a plausible notion that T cells remain immunocompetent and augment
immune responses locally and systemically, much like a burn injury, where the insult primes
the immune system for an augmented T cell effect that could potentially precipitate a fatal
shock like syndrome [381].
9.3 Nuclear Factor of Activated T Cells (NFAT) as the Key
Player in Determining Severity in Acute Pancreatitis
Nuclear Factor of Activated T cells or NFAT was first described as an inducible nuclear
factor binding to the Antigen Receptor Response Element – 2 (ARRE-2) of IL-2 promoter in
human T cells [382, 383]. At the time of inception, it was considered to be exclusively
associated with and expressed by T cells. However, further works have made evident its
intimate involvement with various immune and non-immune cells and authenticated its
pivotal regulatory role in inflammation, embryonic development, organogenesis, cell
development and differentiation, cell motility, angiogenesis, tumorigenesis and cell survival
[384-387]. The NFAT family consists of five members, four of which are calcium responsive
(NFAT1-4) [388-392] and are activated by Ca2+ influx in the cell. This is either mediated
through the PLC-γ pathway or store operated Ca2+ entry, particularly in lymphoid T cells
[393]. Once intracellular levels of calcium increases, Calcineurin (a unique
calcium/calmodulin-activated serine/threonine protein phosphatase) dephosphorylates the

185 | P a g e
isoforms, thereby activating them and leading to nuclear translocation [394-396], where
active transcription of downstream gene targets subsequently occurs. This in fact, establishes
a direct link between calcium signalling and gene expression [387, 397, 398].
Evidence for role of NFAT signalling in inflammation and sepsis is accumulating. Studies
have identified it to be critically important in various inflammatory responses [399] where it
increases the expression of proinflammatory cytokines including interleukins (IL 2,3,13),
TNF α, GM-CSF and MIP [400, 401]. NFAT is now known to be activated during sepsis and
regulates expression of macrophage specific inducible nitric oxide synthase which is crucial
for bactericidal activity of macrophages [402]. In the further extension of the same line of
work [403], authors demonstrated in a murine model of sepsis induced acute lung injury
(ALI) that NFAT regulated inflammatory genes produced by macrophages which seemed to
be restricted to macrophages only. They stimulated NFAT deficient macrophages with LPS
and discovered resultant attenuated expression of several cytokines, chemokines, and their
receptors, thus translating to a profound phenotypic effect of NFAT deletion in sepsis
induced ALI. NFAT deletion also showed decreased pulmonary oedema, neutrophilic
inflammation and improved arterial oxygenation and survival.
In addition, NFAT activation has been hailed as a momentous step in regulating neutrophil
recruitment, systemic inflammation and T-cell dysfunction during abdominal sepsis [404].
Role of NFAT members in different mouse disease models such as spontaneous pulmonary
hypertension, diabetic retinopathy and regulation of innate immune responses to fungal
pathogens is well documented [405-407].
A study by Awla et al in 2012 avowed for the first time the key role of NFAT in AP [408].
They showed AP was associated with increased NFAT transcriptional activity which was not
limited to pancreas only and instead, featured in the lung, aorta and spleen too. This indicated
186 | P a g e
that AP is associated with local and systemic activation of NFAT signalling. NFAT deficient
mice did not exhibit activation of trypsinogen, tissue damage and neutrophil infiltration in the
lung or pancreas. They demonstrated and concluded that NFAT signalling is involved in the
activation of trypsinogen in the pancreas, co-ordination of neutrophilic infiltration, regulation
of systemic pulmonary recruitment of neutrophils and transcriptional regulation of CXCL2 in
the pancreas, setting its activity at the heart of the initiation of the disease. Another far
reaching notion from this study is the role of NFAT signalling in innate immunity, when it
has traditionally been exclusively associated with adaptive immune response. The authors
proved through experimental models that initiation of AP which was largely driven by innate
immune responses was highly dependent on NFAT signalling, implicating it as a powerful
component of the innate inflammatory response. Another study also that Toll-like receptor
signalling in bone marrow derived macrophages appears to be dependent on NFAT activity
[409].
A fascinating proposition was put forward by in 2010 by da Costa Martins et al. – they
believed that a strong and perhaps vital interaction existed between NFAT and miRNA,
where both affected and regulated function [410]. This was further authenticated by another
study that demonstrated miRNA induced suppression of DYRK1A which reduced nuclear
export of NFAT and hence activated it. This may translate into a genetic and an epigenetic
role for NFAT, affecting various cellular signalling molecules [411]. It still remains to be
seen as to how this works in the setting of inflammatory systemic diseases, such as acute
pancreatitis, since most of the evidence is in setting of tumorigenesis. Nonetheless, it stands
as a viable, potential area of study.
187 | P a g e
In addition to its seminal functions in immune surveillance, NFAT has secured a reputation
for itself as a key player in diverse pathophysiological states, both inflammation and cancer
included. The substratal principle underlying the two main pathologies remains the activation
of NFAT proteins in the nucleus and binding to the DNA to cause transcription of its
downstream targets. NFAT activity has been shown to be crucial for cell survival and
proliferation, invasive migration, and angiogenesis. Up till now only few mediators of the
NFAT signalling axis have been identified - several others remain to be discovered. But more
important than that, we need to have a clearer idea of the processes that drive NFAT
activation. Possible mutations and/or amplifications in NFAT binding partners and
export/maintenance kinases may be responsible. – these are frequently seen in several disease
processes that are associated with constitutive NFAT nuclear localization. It is perfectly
reasonable to opine that there is a lot of cross talk between NFAT and other pro-
inflammatory signalling pathways, since NFAT is closely linked to inflammation. Role of
calcium signalling in this setting, particularly with reference to Calcineurin/NFAT pathway,
cannot be over-emphasised. However, it is still a long way before a case for the use of agents
inhibiting release of intracellular calcium release to block NFAT mediated cellular activities
can be made. Nonetheless, these findings are encouraging for development of better
therapeutics with multi-modal mechanism of action in human diseases.
Another important and extremely significant interaction to consider in our dataset is between
calcium/calmodulin dependent phosphatase, Calcineurin and NFAT, both of which were
found to be significantly downregulated in SAP. Canonical activation of NFAT family
members depends on cytosolic rise in calcium levels, contributed either from the endoplasmic
reticulum or from extracellular matrix. This activates calcineurin which leads to the nuclear
import of NFAT by dephosphorylating residues and causing exposure of a nuclear

188 | P a g e
localization sequence [412]. After nuclear import, NFAT reaches out to its nuclear binding
partners and activates the expression of NFAT dependent inflammatory and
immunomodulatory cytokines [413, 414].
What makes role of NFAT so important, yet complex in immunity? They are the ‘star’
molecules that bridge the innate and adaptive immune responses and also modulate
inflammatory responses [399, 415]. We know from evidence that the expression of NFAT
family members is cell specific and these have differential binding ability to coactivators.
This may explain their distinct roles in the immune system [344]. The calcineurin NFAT axis
plays an extremely meaningful role in acquired immunity – in fact, it forms the basis of
immunosuppressive treatment in transplant recipients [344, 416]. Per contra, its relevance and
contribution in innate immunity is still poorly understood, although there has been a study
implicating role of NFAT family members in neutrophil mediated innate immunity during
fungal infection with Candida albicans [417].
NFAT regulation and NF-kB signalling were found to be among the most differentially
expressed canonical pathways in the current study group. Crosstalk between these two has
been identified in previous studies in the context of infection [418]. The two families share
Rel homology domain structure, recognise similar DNA binding sequences and work hand in
hand to regulate inflammatory cytokines and chemokines [419-421]. Indeed, studies have
shown direct interaction between NFAT and NFκB that effectively integrates 2 disparate
signalling pathways in promoting cardiac hypertrophy and ventricular remodelling [422].
While specific mechanisms of these interactions are yet to be determined with certainty, it
has been thought to be through their synergistic promotion of gene expression or through a
non-coding RNA, which serves as a scaffolding platform for the interaction to occur [423,
424]. Moreover, Calcineurin has also been found to improve NFkB activity through
dissociation and degradation of IkB (inhibitory molecule) [425].

189 | P a g e
It is now well established that NFAT plays a crucial role not only in activation of T cells, but
also in regulation of many aspects of T cell function. Therefore, it is no surprise that it has
been considered as a potential target for immune regulatory therapeutics. Calcineurin
inhibitors, such as cyclosporine A and FK506, renowned for their use as immunosuppressors
to treat graft rejection and autoimmune diseases [426-429] , block calcineurin enzymatic
activity and therefore, cannot be classified as true NFAT inhibitors [430]. These will block
any other target that is dephosphorylated by calcineurin, possibly causing various toxicities
associated with their use [431, 432]. The solution to this quandary was identified in the form
of VIVIT peptide, a selective inhibitor of calcineurin mediated dephosphorylation of NFAT,
which was found to prolong graft survival in experimental model of islet cell transplantation
[433]. While far more promising than the earlier alternatives, these peptides still have the
potential of blocking calcineurin interactions with other substrates like calcineurin inhibitors
(CABIN1/AKAP79) [434]. Answer to this predicament appeared in the form of mutations in
the two different regions of calcineurin that were pivotal to calcineurin and NFAT
interactions [434, 435]. These newly identified mutations not only selectively impaired
calcineurin binding to NFAT but also did not seem to affect any interactions between
calcineurin and its other substrates [435]. This, unquestionably, constitutes a reasonably
attractive target for design of even more precise inhibitors. As fascinating as the use of these
peptide inhibitors appears, there are some plausible issues with their delivery, which could, in
principle, be overcome by making use of smaller organic molecules by incorporating
structural changes that consequently improves specificity, stability, delivery and distribution.
Roehrl et al. [436] came up with a list of compounds in 2004, using Fluorescence
Polarization Assay, which specifically inhibited calcineurin and NFAT interactions,
culminating in impairment of NFAT dependent cytokine production by T cells. This was
closely followed by Venkatesh et al [437] who used a slightly different cell based method to

190 | P a g e
identify inhibitors of nuclear translocation of NFAT which acted by blocking store-operated
calcium channels and hindering calcium mobilisation. These two approaches have provided
immensely useful molecules that act upstream of calcineurin, aptly block NFAT dependent
transcription and also consolidate cyclosporine effects [437]. These avenues can also be
exploited to identify small molecules that will be selective and specific enough to modulate
specific NFAT regulated functions. Also to ponder over is the matter of interactions between
NFAT and its specific transcriptional partners which may be at the heart of complex
signalling pathways that NFAT integrates into, to control various and numerous cellular
programmes. The key would be to identify the protein-protein contact surfaces that are
specific for these interactions. Molecules could then be designed and modified accordingly to
regulate specific functions. These therapeutic molecules could revolutionise the treatment,
improving the toxicity profile.
9.4 MicroRNA and SnoRNA as potential Biomarkers in Acute
Pancreatitis
MiRNA have emerged as fantastic, novel biomarkers with many advantages to their
credentials. Unlike mRNA, they are incredibly stable in circulation (blood, urine and tears) as
they are protected from RNases and endure long-term storage well. A single miRNA
regulates expression of multiple mRNA and therefore, offers complexity to the process and
has rightly been implicated in the pathogenesis of many a disease processes. Recent studies
have corroborated that miRNAs are not just the by-products of cell lysis. They possibly enter
circulation by being packaged into endosomes or simply avoid degradation by associating
with argonaute or nucleophosmin [299, 301, 302]. Another neoteric role for miRNA is as
signalling molecules, for they affect functioning of distant cells once out in the circulation,
perhaps by influencing the gene expression of the target cells [299]. Their ability to control

191 | P a g e
gene expression without affecting DNA sequence makes them one of the most powerful
epigenetic regulators.
Most of the published work on miRNA biomarkers to date has been for cancer diagnosis.
Many serum/plasma studies have profiled the most abundant miRNAs in the tissue of interest
and then assayed these in the circulation on the assumption that miRNAs that are high in the
tissue will be secreted and readily detectable in blood. This is truly applicable in case of acute
pancreatitis. It will not be clinically and technically feasible to sample pancreatic tissue in
patients who are acutely unwell. If a peripheral blood sample, which is much easier to obtain,
can provide the same information, such as miRNA profiling reflective of the pancreatic
tissue, this could revolutionise the prognostication in this disease state.
To the best of our knowledge, this is the first study that has demonstrated the involvement of
snoRNA in acute pancreatitis. The specific role of snoRNA in many disease processes
remains a bit of an enigma. While their functions largely remain unknown, there is emerging
evidence of their involvement in malignant, neurodegenerative and viral diseases. In fact,
they are slowly being recognised as fantastic biomarkers – a new study from China has
implicated snoRNA in pathogenesis of colorectal cancer (CRC) and progression from
ulcerative colitis to adenocarcinoma, linking it to the ‘inflammation to malignancy’ pathway
[438]. They showed that snoRA15 and 41 were upregulated in CRC and as such, behaved as
‘oncogenes’, due to their location at the genomic amplification regions that are
characteristically associated with oncogenic function [439]. It was also noted that snoRD33 is
downregulated in CRC and may well be a ‘tumour suppressor’, as it suppresses cancer cell
growth and metastasis to distant organs by blocking antioxidant pathways [440]. Following
the pattern, they identified the same snoRNA to be upregulated in UC patient samples as
well. However, snoRD33 expression was found to be highest in CRC, lowest in controls and
in between in UC, creating a place for this particular snoRNA as a mediator to promote colon

192 | P a g e
inflammation. This study very sensibly provides a link between inflammation and
carcinogenesis. Expression of these snoRNAs was also found to be associated with disease
severity, rendering them particularly useful as biomarkers for CRC prognosis and also for
differentiating UC from CRC. This is extremely significant in terms of disease management.
snoRNA are very stable in plasma and serum and lend themselves to be excellent biomarkers
that can be easily employed in the clinical setting [441]. In fact, use of a snoRNA based
biomarker panel in setting of non-small cell lung carcinoma has been very encouraging with
81.1% sensitivity and 95.8% specificity [442].
There is no direct evidence of involvement of snoRNAs in inflammation or sepsis and
perhaps, this represents an area of unmet need. They categorically have proved themselves to
be incredible biomarkers and their role in the setting of sepsis and acute pancreatitis, where
there is a critical need for specific and sensitive biomarkers, is undoubtedly an area for future
research. It is hoped that the next step would be quantitative assessment and then validation
in an independent cohort.
This study is not without its fair share of limitations, which must be acknowledged and taken
into account while interpreting the results. Sample size, while representative of the
population, is smaller than anticipated. This was partly due to the fact that the process of
recruitment was prospective and severe patients were difficult to recruit as opposed to mild
acute pancreatitis. Sometimes, these patients with SAP were too unwell to consent to
participate in the study and therefore, couldn’t be included. Also, these patients were not as
frequent to present as the mild acute pancreatitis, following the natural distribution of the
disease severity. Being the tertiary referral centre for SAP, many patients were transferred
from other hospitals later than 24 hours of presentation and hence were not eligible for
inclusion.

193 | P a g e
While transcriptomic analysis is a very powerful tool for investigating molecular changes in
different biological states, caution has to be exercised in interpreting the data. RNA profiling
methods measure the concentration of RNA at a specific state and therefore, it is a plausible
speculation that dynamically modulated processes and transcripts could be missed.
Additionally, it does not inform of the regulatory changes associated with translation or of the
effects of modulation by other proteins. Sample heterogeneity and preparation can introduce
some serious bias in the results. While all care was taken to exclude batch effects, it is
impossible to exclude it completely. Finally, both the RNA and miRNA profiling methods
can only observe the average effect of multiple cell types and numbers of cells in different
states in the sample which can add uncertainty to the data.
Further works would almost certainly involve characterising the mRNA and miRNA better
and understanding and identifying their targets. The list generated from this study of potential
candidate genes and miRNA is not exhaustive but most definitively a step in the right
direction. Next step should be quantification of these in AP patients and assess their value as
prognostic markers.
It is anticipated that the next five years will see a rapid expansion in the use of molecular
diagnostic tests. This is likely to be particularly true for the introduction of mRNA and
miRNA-based tests. Several companies are developing tests that utilize these for determining
the diagnosis or prognosis of a variety of diseases. However, the increasing use of high
content platforms, such as microarrays, is leading to identification of marker panels, therefore
driving us towards the adoption of multiplex detection platforms and multiple marker tests.
Given the fact that acute pancreatitis is a complex disease with multiple pathways involving
intricately linked innate and acquired immune mechanisms, a panel of biomarkers is likely to
be more suited than a single agent. This requires validations studies and testing in clinical
trials settings.

194 | P a g e
CONCLUDING REMARKS
195 | P a g e
This observational, pilot study has successfully demonstrated that mild and severe acute
pancreatitis are two distinct groups and exhibit different courses of disease, evident at the
molecular and genomic levels. Microarray based experiments have clearly delineated the two
groups and have also provided useful insights into the pathophysiology, highlighting the key
pathways and molecules involved. This is of immense value, hinting at potential lines of
enquiry for ascertaining prognostication and treatment in AP.
NFAT emerged as the most significantly differentially expressed molecule, playing a pivotal
role in many dynamic processes found to be associated with the disease. The relevance of the
calcium-regulated NFAT transcription factors to the regulation of many aspects of T-cell
function is well stated in the more recent literature. In fact, during T-cell activation, most
cytokine genes are regulated by NFAT proteins. As in line with the recent studies, our study
has also identified role of NFAT in targeting many other genes that influence the activated T
cells. The answer perhaps lies, in part, with the molecular structure of NFAT DNA-binding
domain – this has various surfaces, allowing for interactions with different transcriptional
factors that result in integration of NFAT into many signalling pathways.
Future studies should focus on better characterisation of regulatory mechanisms surrounding
NFAT activation, in the hope that newly identified transcriptional factors and target genes
will give a better overview of the involvement of NFAT in various processes, not only
including T cells but also other cells of the immune systems and spot the mechanisms that
regulate them too.
Another area of future endeavours, which already has attracted a lot of interest, is that of
NFAT inhibitors and their development. While these have been tried in various trials, results
have been far from encouraging. Derivatives of cyclosporine, although having been evaluated
in phase III clinical trials, have not resulted in any commercial products, likely due to their

196 | P a g e
potential toxicity. Natural compounds possessing NFAT inhibition activities are
unfortunately less potent. Peptide inhibitors of NFAT appear more lucrative as these are less
toxic and have appeared to hold good potential as drug candidates in recent experimental
models.
Micro RNA hold a great deal of promise as biomarkers. The last ten years have seen a rapid
rise in recognition of their ability to serve as potential biomarkers in diagnostic, prognostic
and predictive arenas. This study has identified miRNA that are differentially expressed
between MAP and SAP and their use and development in the field of severity stratification is
within realm of possibility.
In short, Genomics has presented us with, in the recent times, an extremely useful and
powerful tool to investigate how molecular networks change between biological states. There
are however, limitations to their application. It is possible to miss dynamically modulated
processes and transcripts with most RNA experiments that measure the concentrations of
RNA (for both mRNA and miRNA) at a specific state. Also, one can only contemplate the
average effect of various cell types and numbers of cells in different states in the sample. It is
also almost impossible to detect regulatory changes with the processes of translation. With
regards to miRNA, their levels may not always correspond to their regulatory activities which
in turn could have been modulated by other factors/molecules.
One of the most confounding factors in RNA based experiments is the sample preparation
and ensuring uniformity in sample handling and taking into account the heterogeneity of the
disease within the sample, different cell types in the sample and genetic and environmental
factors on individuals.
At any rate, Genomic and transcriptomic analyses, as these stand, are the most powerful tool
for interrogating molecular networks associated with disease and disease forms and are likely

197 | P a g e
to revolutionise the biomarker discovery, with particular emphasis on developing molecular
signatures leading to molecular tests, in the coming times.

198 | P a g e
REFERENCES

199 | P a g e
1. Moynihan, B., Acute Pancreatitis. Ann Surg, 1925. 81(1): p. 132-42. 2. Roberts, S.E., et al., Incidence and case fatality for acute pancreatitis in England:
geographical variation, social deprivation, alcohol consumption and aetiology--a record linkage study. Aliment Pharmacol Ther, 2008. 28(7): p. 931-41.
3. Gurusamy, K.S., M. Farouk, and J.H. Tweedie, UK guidelines for management of acute pancreatitis: is it time to change? Gut, 2005. 54(9): p. 1344-5.
4. Kloppel G, von Gerkan R, Dreyer T. Pathomorphology of acute pancreatitis. Analysis of 367 autopsy cases and 3 surgical specimen. In Gyr KE, Singer MV, Sarles H, eds. Pancreatitis: Concepts and classification, Amsterdam: Elsevier, 1984:29-35
5. Bradley, E.L., 3rd, A clinically based classification system for acute pancreatitis. Summary of the International Symposium on Acute Pancreatitis, Atlanta, Ga, September 11 through 13, 1992. Arch Surg, 1993. 128(5): p. 586-90.
6. Detlefsen, S., et al., Fibrogenesis in alcoholic chronic pancreatitis: the role of tissue necrosis, macrophages, myofibroblasts and cytokines. Mod Pathol, 2006. 19(8): p. 1019-26.
7. Kloppel, G. and B. Maillet, Chronic pancreatitis: evolution of the disease. Hepatogastroenterology, 1991. 38(5): p. 408-12.
8. Kloppel, G. and B. Maillet, The morphological basis for the evolution of acute pancreatitis into chronic pancreatitis. Virchows Arch A Pathol Anat Histopathol, 1992. 420(1): p. 1-4.
9. Seligson, U., et al., Clinical course and autopsy findings in acute and chronic pancreatitis. Acta Chir Scand, 1982. 148(3): p. 269-74.
10. Ammann, R.W. and B. Muellhaupt, Progression of alcoholic acute to chronic pancreatitis. Gut, 1994. 35(4): p. 552-6.
11. Ammann, R.W., P.U. Heitz, and G. Kloppel, Course of alcoholic chronic pancreatitis: a prospective clinicomorphological long-term study. Gastroenterology, 1996. 111(1): p. 224-31.
12. Rahman, S.H., et al., Association of antioxidant enzyme gene polymorphisms and glutathione status with severe acute pancreatitis. Gastroenterology, 2004. 126(5): p. 1312-22.
13. Winslet, M.C., C. Imray, and J.P. Neoptolemos, Biliary acute pancreatitis. Hepatogastroenterology, 1991. 38(2): p. 120-3.
14. UK guidelines for the management of acute pancreatitis. Gut, 2005. 54 Suppl 3: p. iii1-9. 15. Opie, E.L. and J.C. Meakins, Data Concerning the Etiology and Pathology of Hemorrhagic
Necrosis of the Pancreas (Acute Hemorrhagic Pancreatitis). J Exp Med, 1909. 11(4): p. 561-78.
16. Lee, S.P., J.F. Nicholls, and H.Z. Park, Biliary sludge as a cause of acute pancreatitis. N Engl J Med, 1992. 326(9): p. 589-93.
17. Frossard, J.L., et al., Usefulness of endoscopic ultrasonography in patients with "idiopathic" acute pancreatitis. Am J Med, 2000. 109(3): p. 196-200.
18. Marotta, P.J., J.C. Gregor, and D.H. Taves, Biliary sludge: a risk factor for 'idiopathic' pancreatitis? Can J Gastroenterol, 1996. 10(6): p. 385-8.
19. Tinto, A., et al., Acute and chronic pancreatitis--diseases on the rise: a study of hospital admissions in England 1989/90-1999/2000. Aliment Pharmacol Ther, 2002. 16(12): p. 2097-105.
20. Dreiling, D.A. and M. Koller, The natural history of alcoholic pancreatitis: update 1985. Mt Sinai J Med, 1985. 52(5): p. 340-2.
21. Steinberg, W. and S. Tenner, Acute pancreatitis. N Engl J Med, 1994. 330(17): p. 1198-210. 22. Johnson, C.D., et al., Double blind, randomised, placebo controlled study of a platelet
activating factor antagonist, lexipafant, in the treatment and prevention of organ failure in predicted severe acute pancreatitis. Gut, 2001. 48(1): p. 62-9.
23. Norman, J., The role of cytokines in the pathogenesis of acute pancreatitis. Am J Surg, 1998. 175(1): p. 76-83.
24. Beger, H.G., et al., Bacterial contamination of pancreatic necrosis. A prospective clinical study. Gastroenterology, 1986. 91(2): p. 433-8.

200 | P a g e
25. Wijffels, N.A., et al., Late development of pancreas necrosis during acute pancreatitis: an underestimated phenomenon associated with high morbidity and mortality. Pancreas, 2007. 34(2): p. 215-9.
26. Tenner, S., et al., Relationship of necrosis to organ failure in severe acute pancreatitis. Gastroenterology, 1997. 113(3): p. 899-903.
27. Dorffel, T., et al., Vascular complications in acute pancreatitis assessed by color duplex ultrasonography. Pancreas, 2000. 21(2): p. 126-33.
28. Company, L., et al., Factors predicting mortality in severe acute pancreatitis. Pancreatology, 2003. 3(2): p. 144-8.
29. Herrera Gutierrez, M.E., et al., [Acute renal failure profile and prognostic value in severe acute pancreatitis]. Med Clin (Barc), 2000. 115(19): p. 721-5.
30. Li, H., et al., Risk factors and outcome of acute renal failure in patients with severe acute pancreatitis. J Crit Care, 2010. 25(2): p. 225-9.
31. Imrie, C.W., L.J. Buist, and M.G. Shearer, Importance of cause in the outcome of pancreatic pseudocysts. Am J Surg, 1988. 156(3 Pt 1): p. 159-62.
32. Yamamoto, T., et al., Rupture of a pancreatic pseudocyst into the portal venous system. Abdom Imaging, 1999. 24(5): p. 494-6.
33. Balachandra, S. and A.K. Siriwardena, Systematic appraisal of the management of the major vascular complications of pancreatitis. Am J Surg, 2005. 190(3): p. 489-95.
34. Boerma, D., et al., Internal drainage of infected pancreatic pseudocysts: safe or sorry? Dig Surg, 1999. 16(6): p. 501-5.
35. Maema, A., et al., Proximal bile duct stricture caused by a pancreatic pseudocyst: intra-operative placement of a metallic stent. Hepatogastroenterology, 1999. 46(27): p. 2020-3.
36. Noda, T., et al., A case of chronic pancreatitis with pseudocysts complicated by infection and obstructive jaundice. Am J Gastroenterol, 1994. 89(11): p. 2066-9.
37. Tsiotos, G.G., C.D. Smith, and M.G. Sarr, Incidence and management of pancreatic and enteric fistulas after surgical management of severe necrotizing pancreatitis. Arch Surg, 1995. 130(1): p. 48-52.
38. Ho, H.S. and C.F. Frey, Gastrointestinal and pancreatic complications associated with severe pancreatitis. Arch Surg, 1995. 130(8): p. 817-22; discussion 822-3.
39. Connor, S., et al., Early and late complications after pancreatic necrosectomy. Surgery, 2005. 137(5): p. 499-505.
40. Tsiotos, G.G., E. Luque-de Leon, and M.G. Sarr, Long-term outcome of necrotizing pancreatitis treated by necrosectomy. Br J Surg, 1998. 85(12): p. 1650-3.
41. Tzovaras, G., et al., Early and long-term results of surgery for severe necrotising pancreatitis. Dig Surg, 2004. 21(1): p. 41-6; discussion 46-7.
42. Adams, D.B., B.R. Davis, and M.C. Anderson, Colonic complications of pancreatitis. Am Surg, 1994. 60(1): p. 44-9.
43. Aldridge, M.C., et al., Colonic complications of severe acute pancreatitis. Br J Surg, 1989. 76(4): p. 362-7.
44. Mohamed, S.R. and A.K. Siriwardena, Understanding the colonic complications of pancreatitis. Pancreatology, 2008. 8(2): p. 153-8.
45. Maisonnette, F., et al., Development of colonic stenosis following severe acute pancreatitis. HPB (Oxford), 2003. 5(3): p. 183-5.
46. Kriwanek, S., et al., Complications after surgery for necrotising pancreatitis: risk factors and prognosis. Eur J Surg, 1999. 165(10): p. 952-7.
47. Alikhan, M., et al., Variable pathologic interpretation of columnar lined esophagus by general pathologists in community practice. Gastrointest Endosc, 1999. 50(1): p. 23-6.
48. Mutinga, M., et al., Does mortality occur early or late in acute pancreatitis? Int J Pancreatol, 2000. 28(2): p. 91-5.

201 | P a g e
49. Fu, C.Y., et al., Timing of mortality in severe acute pancreatitis: experience from 643 patients. World J Gastroenterol, 2007. 13(13): p. 1966-9.
50. de Beaux, A.C., K.R. Palmer, and D.C. Carter, Factors influencing morbidity and mortality in acute pancreatitis; an analysis of 279 cases. Gut, 1995. 37(1): p. 121-6.
51. Klar, E., et al., Improvement of impaired pancreatic microcirculation by isovolemic hemodilution protects pancreatic morphology in acute biliary pancreatitis. Surg Gynecol Obstet, 1993. 176(2): p. 144-50.
52. Brown, A., et al., Can fluid resuscitation prevent pancreatic necrosis in severe acute pancreatitis? Pancreatology, 2002. 2(2): p. 104-7.
53. Hartwig, W., et al., Surgical management of severe pancreatitis including sterile necrosis. J Hepatobiliary Pancreat Surg, 2002. 9(4): p. 429-35.
54. Pisters, P.W. and J.H. Ranson, Nutritional support for acute pancreatitis. Surg Gynecol Obstet, 1992. 175(3): p. 275-84.
55. Sitzmann, J.V., et al., Total parenteral nutrition and alternate energy substrates in treatment of severe acute pancreatitis. Surg Gynecol Obstet, 1989. 168(4): p. 311-7.
56. Cao, Y., et al., Meta-analysis of enteral nutrition versus total parenteral nutrition in patients with severe acute pancreatitis. Ann Nutr Metab, 2008. 53(3-4): p. 268-75.
57. Al-Omran, M., et al., Enteral versus parenteral nutrition for acute pancreatitis. Cochrane Database Syst Rev, 2010(1): p. CD002837.
58. Petrov, M.S., et al., Enteral nutrition and the risk of mortality and infectious complications in patients with severe acute pancreatitis: a meta-analysis of randomized trials. Arch Surg, 2008. 143(11): p. 1111-7.
59. Kahl, S., et al., Procaine hydrochloride fails to relieve pain in patients with acute pancreatitis. Digestion, 2004. 69(1): p. 5-9.
60. Lerch, M.M., No more intravenous procaine for pancreatitis pain? Digestion, 2004. 69(1): p. 2-4.
61. Thompson, D.R., Narcotic analgesic effects on the sphincter of Oddi: a review of the data and therapeutic implications in treating pancreatitis. Am J Gastroenterol, 2001. 96(4): p. 1266-72.
62. Bernhardt, A., et al., [Using epidural anesthesia in patients with acute pancreatitis--prospective study of 121 patients]. Anaesthesiol Reanim, 2002. 27(1): p. 16-22.
63. Jorgensen, H., et al., Epidural local anaesthetics versus opioid-based analgesic regimens on postoperative gastrointestinal paralysis, PONV and pain after abdominal surgery. Cochrane Database Syst Rev, 2000(4): p. CD001893.
64. Bassi, C., et al., Behavior of antibiotics during human necrotizing pancreatitis. Antimicrob Agents Chemother, 1994. 38(4): p. 830-6.
65. Farkas, G., et al., Surgical strategy and management of infected pancreatic necrosis. Br J Surg, 1996. 83(7): p. 930-3.
66. Garg, P.K., et al., Incidence, spectrum and antibiotic sensitivity pattern of bacterial infections among patients with acute pancreatitis. J Gastroenterol Hepatol, 2001. 16(9): p. 1055-9.
67. Rahman, S.H., et al., Intestinal hypoperfusion contributes to gut barrier failure in severe acute pancreatitis. J Gastrointest Surg, 2003. 7(1): p. 26-35; discussion 35-6.
68. Ammori, B.J., et al., Early increase in intestinal permeability in patients with severe acute pancreatitis: correlation with endotoxemia, organ failure, and mortality. J Gastrointest Surg, 1999. 3(3): p. 252-62.
69. Bassi, C., Infected pancreatic necrosis. Int J Pancreatol, 1994. 16(1): p. 1-10. 70. Jafri, N.S., et al., Antibiotic prophylaxis is not protective in severe acute pancreatitis: a
systematic review and meta-analysis. Am J Surg, 2009. 197(6): p. 806-13. 71. Wittau, M., et al., The weak evidence base for antibiotic prophylaxis in severe acute
pancreatitis. Hepatogastroenterology, 2008. 55(88): p. 2233-7.

202 | P a g e
72. Sharma, V.K. and C.W. Howden, Prophylactic antibiotic administration reduces sepsis and mortality in acute necrotizing pancreatitis: a meta-analysis. Pancreas, 2001. 22(1): p. 28-31.
73. Xu, T. and Q. Cai, Prophylactic antibiotic treatment in acute necrotizing pancreatitis: results from a meta-analysis. Scand J Gastroenterol, 2008. 43(10): p. 1249-58.
74. villatoro C, Bassi C - Antibiotic therapy for prophylaxis against infection of pancreatic necrosis in acute pancreatitis. The Cochrane library 2009, Issue 1.
75. Neoptolemos, J.P., et al., Controlled trial of urgent endoscopic retrograde cholangiopancreatography and endoscopic sphincterotomy versus conservative treatment for acute pancreatitis due to gallstones. Lancet, 1988. 2(8618): p. 979-83.
76. Folsch, U.R., et al., Early ERCP and papillotomy compared with conservative treatment for acute biliary pancreatitis. The German Study Group on Acute Biliary Pancreatitis. N Engl J Med, 1997. 336(4): p. 237-42.
77. Bradley, E.L., 3rd, Management of infected pancreatic necrosis by open drainage. Ann Surg, 1987. 206(4): p. 542-50.
78. Sarr, M.G., et al., Acute necrotizing pancreatitis: management by planned, staged pancreatic necrosectomy/debridement and delayed primary wound closure over drains. Br J Surg, 1991. 78(5): p. 576-81.
79. Beger, H.G., et al., Necrosectomy and postoperative local lavage in necrotizing pancreatitis. Br J Surg, 1988. 75(3): p. 207-12.
80. Fernandez-del Castillo, C., et al., Debridement and closed packing for the treatment of necrotizing pancreatitis. Ann Surg, 1998. 228(5): p. 676-84.
81. Rau, B., A. Bothe, and H.G. Beger, Surgical treatment of necrotizing pancreatitis by necrosectomy and closed lavage: changing patient characteristics and outcome in a 19-year, single-center series. Surgery, 2005. 138(1): p. 28-39.
82. Rodriguez, J.R., et al., Debridement and closed packing for sterile or infected necrotizing pancreatitis: insights into indications and outcomes in 167 patients. Ann Surg, 2008. 247(2): p. 294-9.
83. Howard, T.J., et al., Declining morbidity and mortality rates in the surgical management of pancreatic necrosis. J Gastrointest Surg, 2007. 11(1): p. 43-9.
84. Werner, J., et al., Management of acute pancreatitis: from surgery to interventional intensive care. Gut, 2005. 54(3): p. 426-36.
85. van Santvoort, H.C., et al., A step-up approach or open necrosectomy for necrotizing pancreatitis. N Engl J Med, 2010. 362(16): p. 1491-502.
86. Connor, S., et al., Increasing age and APACHE II scores are the main determinants of outcome from pancreatic necrosectomy. Br J Surg, 2003. 90(12): p. 1542-8.
87. Connor, S., et al., Minimally invasive retroperitoneal pancreatic necrosectomy. Dig Surg, 2003. 20(4): p. 270-7.
88. Gomatos, I.P., et al., Outcomes From Minimal Access Retroperitoneal and Open Pancreatic Necrosectomy in 394 Patients With Necrotizing Pancreatitis. Ann Surg, 2016. 263(5): p. 992-1001.
89. Raraty, M.G., et al., Minimal access retroperitoneal pancreatic necrosectomy: improvement in morbidity and mortality with a less invasive approach. Ann Surg, 2010. 251(5): p. 787-93.
90. Gorelick, F.S. and E. Thrower, The acinar cell and early pancreatitis responses. Clin Gastroenterol Hepatol, 2009. 7(11 Suppl): p. S10-4.
91. Sah, R.P. and A.K. Saluja, Trypsinogen activation in acute and chronic pancreatitis: is it a prerequisite? Gut, 2011. 60(10): p. 1305-7.
92. Saluja, A.K., et al., Why does pancreatic overstimulation cause pancreatitis? Annu Rev Physiol, 2007. 69: p. 249-69.
93. Sah, R.P. and A. Saluja, Molecular mechanisms of pancreatic injury. Curr Opin Gastroenterol, 2011. 27(5): p. 444-51.

203 | P a g e
94. Halangk, W., et al., Trypsin activity is not involved in premature, intrapancreatic trypsinogen activation. Am J Physiol Gastrointest Liver Physiol, 2002. 282(2): p. G367-74.
95. Lerch, M.M. and F.S. Gorelick, Early trypsinogen activation in acute pancreatitis. Med Clin North Am, 2000. 84(3): p. 549-63, viii.
96. Dawra, R., et al., Intra-acinar trypsinogen activation mediates early stages of pancreatic injury but not inflammation in mice with acute pancreatitis. Gastroenterology, 2011. 141(6): p. 2210-2217 e2.
97. Sah, R.P., P. Garg, and A.K. Saluja, Pathogenic mechanisms of acute pancreatitis. Curr Opin Gastroenterol, 2012. 28(5): p. 507-15.
98. Gaiser, S., et al., Intracellular activation of trypsinogen in transgenic mice induces acute but not chronic pancreatitis. Gut, 2011. 60(10): p. 1379-88.
99. Chen, J.M. and C. Ferec, Chronic pancreatitis: genetics and pathogenesis. Annu Rev Genomics Hum Genet, 2009. 10: p. 63-87.
100. LaRusch, J. and D.C. Whitcomb, Genetics of pancreatitis. Curr Opin Gastroenterol, 2011. 27(5): p. 467-74.
101. Whitcomb, D.C., Genetic aspects of pancreatitis. Annu Rev Med, 2010. 61: p. 413-24. 102. Whitcomb, D.C., Genetics of alcoholic and nonalcoholic pancreatitis. Curr Opin
Gastroenterol, 2012. 28(5): p. 501-6. 103. Archer, H., et al., A mouse model of hereditary pancreatitis generated by transgenic
expression of R122H trypsinogen. Gastroenterology, 2006. 131(6): p. 1844-55. 104. Howes, N., et al., Clinical and genetic characteristics of hereditary pancreatitis in Europe. Clin
Gastroenterol Hepatol, 2004. 2(3): p. 252-61. 105. Kereszturi, E., et al., Hereditary pancreatitis caused by mutation-induced misfolding of
human cationic trypsinogen: a novel disease mechanism. Hum Mutat, 2009. 30(4): p. 575-82. 106. Rebours, V., et al., The natural history of hereditary pancreatitis: a national series. Gut, 2009.
58(1): p. 97-103. 107. Rosendahl, J., et al., Complete analysis of the human mesotrypsinogen gene (PRSS3) in
patients with chronic pancreatitis. Pancreatology, 2010. 10(2-3): p. 243-9. 108. Szmola, R. and M. Sahin-Toth, Uncertainties in the classification of human cationic
trypsinogen (PRSS1) variants as hereditary pancreatitis-associated mutations. J Med Genet, 2010. 47(5): p. 348-50.
109. Whitcomb, D.C., Mechanisms of disease: Advances in understanding the mechanisms leading to chronic pancreatitis. Nat Clin Pract Gastroenterol Hepatol, 2004. 1(1): p. 46-52.
110. De Beaux, A.C. and K.C. Fearon, Circulating endotoxin, tumour necrosis factor-alpha, and their natural antagonists in the pathophysiology of acute pancreatitis. Scand J Gastroenterol Suppl, 1996. 219: p. 43-6.
111. Denham, W., et al., Gene targeting demonstrates additive detrimental effects of interleukin 1 and tumor necrosis factor during pancreatitis. Gastroenterology, 1997. 113(5): p. 1741-6.
112. Uhl, W., et al., IAP Guidelines for the Surgical Management of Acute Pancreatitis. Pancreatology, 2002. 2(6): p. 565-73.
113. Bhatia, M., et al., Inflammatory mediators in acute pancreatitis. J Pathol, 2000. 190(2): p. 117-25.
114. Bhatia, M., J.P. Neoptolemos, and J. Slavin, Inflammatory mediators as therapeutic targets in acute pancreatitis. Curr Opin Investig Drugs, 2001. 2(4): p. 496-501.
115. Bhatia, M., Novel therapeutic targets for acute pancreatitis and associated multiple organ dysfunction syndrome. Curr Drug Targets Inflamm Allergy, 2002. 1(4): p. 343-51.
116. Fink, G.W. and J.G. Norman, Specific changes in the pancreatic expression of the interleukin 1 family of genes during experimental acute pancreatitis. Cytokine, 1997. 9(12): p. 1023-7.
117. Nozawa, F., et al., Tumor necrosis factor alpha acts on cultured human vascular endothelial cells to increase the adhesion of pancreatic cancer cells. Pancreas, 2000. 21(4): p. 392-8.

204 | P a g e
118. Norman, J.G., G.W. Fink, and M.G. Franz, Acute pancreatitis induces intrapancreatic tumor necrosis factor gene expression. Arch Surg, 1995. 130(9): p. 966-70.
119. Matheus, A.S., et al., Do the Effects of Pentoxifylline on the Inflammatory Process and Pancreatic Infection Justify Its Use in Acute Pancreatitis? Pancreatology, 2009. 9(5): p. 687-693.
120. Raraty, M.G., et al., Acute pancreatitis and organ failure: pathophysiology, natural history, and management strategies. Curr Gastroenterol Rep, 2004. 6(2): p. 99-103.
121. Isenmann, R. and H.G. Beger, Bacterial infection of pancreatic necrosis: role of bacterial translocation, impact of antibiotic treatment. Pancreatology, 2001. 1(2): p. 79-89.
122. Petrov, M.S., et al., Organ failure and infection of pancreatic necrosis as determinants of mortality in patients with acute pancreatitis. Gastroenterology, 2010. 139(3): p. 813-20.
123. Singh, V.P., et al., Phosphatidylinositol 3-kinase-dependent activation of trypsinogen modulates the severity of acute pancreatitis. J Clin Invest, 2001. 108(9): p. 1387-95.
124. Steer, M.L., Frank Brooks memorial Lecture: The early intraacinar cell events which occur during acute pancreatitis. Pancreas, 1998. 17(1): p. 31-7.
125. Warshaw, A.L., Damage prevention versus damage control in acute pancreatitis. Gastroenterology, 1993. 104(4): p. 1216-9.
126. Bone, R.C., Toward a theory regarding the pathogenesis of the systemic inflammatory response syndrome: what we do and do not know about cytokine regulation. Crit Care Med, 1996. 24(1): p. 163-72.
127. Montravers, P., et al., Lymphatic release of cytokines during acute lung injury complicating severe pancreatitis. Am J Respir Crit Care Med, 1995. 152(5 Pt 1): p. 1527-33.
128. Osman, M.O. and S.L. Jensen, Acute pancreatitis: the pathophysiological role of cytokines and integrins. New trends for treatment? Dig Surg, 1999. 16(5): p. 347-62.
129. Foitzik, T., et al., Persistent multiple organ microcirculatory disorders in severe acute pancreatitis: experimental findings and clinical implications. Dig Dis Sci, 2002. 47(1): p. 130-8.
130. Menger, M.D., T. Plusczyk, and B. Vollmar, Microcirculatory derangements in acute pancreatitis. J Hepatobiliary Pancreat Surg, 2001. 8(3): p. 187-94.
131. Bone, R.C., Sir Isaac Newton, sepsis, SIRS, and CARS. Crit Care Med, 1996. 24(7): p. 1125-8. 132. Mentula, P., et al., Plasma anti-inflammatory cytokines and monocyte human leucocyte
antigen-DR expression in patients with acute pancreatitis. Scand J Gastroenterol, 2004. 39(2): p. 178-87.
133. Wolk, K., et al., Impaired antigen presentation by human monocytes during endotoxin tolerance. Blood, 2000. 96(1): p. 218-23.
134. Mentula, P., et al., Decreased HLA (human leucocyte antigen)-DR expression on peripheral blood monocytes predicts the development of organ failure in patients with acute pancreatitis. Clin Sci (Lond), 2003. 105(4): p. 409-17.
135. Richter, A., et al., HLA-DR expression in acute pancreatitis. Eur J Surg, 1999. 165(10): p. 947-51.
136. Mentula, P., et al., Early prediction of organ failure by combined markers in patients with acute pancreatitis. Br J Surg, 2005. 92(1): p. 68-75.
137. Ramnath, R.D., J. Sun, and M. Bhatia, Involvement of SRC family kinases in substance P-induced chemokine production in mouse pancreatic acinar cells and its significance in acute pancreatitis. J Pharmacol Exp Ther, 2009. 329(2): p. 418-28.
138. Ramudo, L., et al., Signal transduction of MCP-1 expression induced by pancreatitis-associated ascitic fluid in pancreatic acinar cells. J Cell Mol Med, 2009. 13(7): p. 1314-20.
139. Gukovskaya, A.S., et al., Pancreatic acinar cells produce, release, and respond to tumor necrosis factor-alpha. Role in regulating cell death and pancreatitis. J Clin Invest, 1997. 100(7): p. 1853-62.

205 | P a g e
140. Blinman, T.A., et al., Activation of pancreatic acinar cells on isolation from tissue: cytokine upregulation via p38 MAP kinase. Am J Physiol Cell Physiol, 2000. 279(6): p. C1993-2003.
141. Kim, H., et al., Suppression of NF-kappaB activation and cytokine production by N-acetylcysteine in pancreatic acinar cells. Free Radic Biol Med, 2000. 29(7): p. 674-83.
142. Ramudo, L., M.A. Manso, and I. De Dios, Biliary pancreatitis-associated ascitic fluid activates the production of tumor necrosis factor-alpha in acinar cells. Crit Care Med, 2005. 33(1): p. 143-8; discussion 248.
143. Ramudo, L., et al., Kinetic study of TNF-alpha production and its regulatory mechanisms in acinar cells during acute pancreatitis induced by bile-pancreatic duct obstruction. J Pathol, 2005. 206(1): p. 9-16.
144. Ramudo, L., et al., Pro- and anti-inflammatory response of acinar cells during acute pancreatitis. Effect of N-acetyl cysteine. Cytokine, 2005. 32(3-4): p. 125-31.
145. Yasuda, H., et al., Cytokine expression and induction of acinar cell apoptosis after pancreatic duct ligation in mice. J Interferon Cytokine Res, 1999. 19(6): p. 637-44.
146. Brady, M., et al., Expression of the chemokines MCP-1/JE and cytokine-induced neutrophil chemoattractant in early acute pancreatitis. Pancreas, 2002. 25(3): p. 260-9.
147. Bhatia, M., et al., MCP-1 but not CINC synthesis is increased in rat pancreatic acini in response to cerulein hyperstimulation. Am J Physiol Gastrointest Liver Physiol, 2002. 282(1): p. G77-85.
148. Grady, T., et al., Chemokine gene expression in rat pancreatic acinar cells is an early event associated with acute pancreatitis. Gastroenterology, 1997. 113(6): p. 1966-75.
149. Sun, L.K., et al., Prostaglandin E2 modulates TNF-alpha-induced MCP-1 synthesis in pancreatic acinar cells in a PKA-dependent manner. Am J Physiol Gastrointest Liver Physiol, 2007. 293(6): p. G1196-204.
150. Tamizhselvi, R., P.K. Moore, and M. Bhatia, Inhibition of hydrogen sulfide synthesis attenuates chemokine production and protects mice against acute pancreatitis and associated lung injury. Pancreas, 2008. 36(4): p. e24-31.
151. Yubero, S., et al., The role of redox status on chemokine expression in acute pancreatitis. Biochim Biophys Acta, 2009. 1792(2): p. 148-54.
152. Gukovsky, I., et al., Curcumin ameliorates ethanol and nonethanol experimental pancreatitis. Am J Physiol Gastrointest Liver Physiol, 2003. 284(1): p. G85-95.
153. Ramnath, R.D., J. Sun, and M. Bhatia, Role of calcium in substance P-induced chemokine synthesis in mouse pancreatic acinar cells. Br J Pharmacol, 2008. 154(6): p. 1339-48.
154. Robinson, K., et al., Peptide YY attenuates STAT1 and STAT3 activation induced by TNF-alpha in acinar cell line AR42J. J Am Coll Surg, 2006. 202(5): p. 788-96.
155. Vaquero, E., et al., Localized pancreatic NF-kappaB activation and inflammatory response in taurocholate-induced pancreatitis. Am J Physiol Gastrointest Liver Physiol, 2001. 280(6): p. G1197-208.
156. Vona-Davis, L.C., et al., Expression of STAT3 and SOCS3 in pancreatic acinar cells. J Surg Res, 2005. 127(1): p. 14-20.
157. Yu, J.H., K.H. Kim, and H. Kim, Suppression of IL-1beta expression by the Jak 2 inhibitor AG490 in cerulein-stimulated pancreatic acinar cells. Biochem Pharmacol, 2006. 72(11): p. 1555-62.
158. Ward, J.B., et al., Is an elevated concentration of acinar cytosolic free ionised calcium the trigger for acute pancreatitis? Lancet, 1995. 346(8981): p. 1016-9.
159. Criddle, D.N., et al., Fatty acid ethyl esters cause pancreatic calcium toxicity via inositol trisphosphate receptors and loss of ATP synthesis. Gastroenterology, 2006. 130(3): p. 781-93.
160. Gerasimenko, J.V., et al., Ca2+ release-activated Ca2+ channel blockade as a potential tool in antipancreatitis therapy. Proc Natl Acad Sci U S A, 2013. 110(32): p. 13186-91.
161. Husain, S.Z., et al., The ryanodine receptor mediates early zymogen activation in pancreatitis. Proc Natl Acad Sci U S A, 2005. 102(40): p. 14386-91.

206 | P a g e
162. Kruger, B., E. Albrecht, and M.M. Lerch, The role of intracellular calcium signaling in premature protease activation and the onset of pancreatitis. Am J Pathol, 2000. 157(1): p. 43-50.
163. Raraty, M., et al., Calcium-dependent enzyme activation and vacuole formation in the apical granular region of pancreatic acinar cells. Proc Natl Acad Sci U S A, 2000. 97(24): p. 13126-31.
164. Wen, L., et al., Inhibitors of ORAI1 Prevent Cytosolic Calcium-Associated Injury of Human Pancreatic Acinar Cells and Acute Pancreatitis in 3 Mouse Models. Gastroenterology, 2015. 149(2): p. 481-92 e7.
165. Criddle, D.N., et al., The pancreas misled: signals to pancreatitis. Pancreatology, 2007. 7(5-6): p. 436-46.
166. Huang, W., et al., Fatty acid ethyl ester synthase inhibition ameliorates ethanol-induced Ca2+-dependent mitochondrial dysfunction and acute pancreatitis. Gut, 2014. 63(8): p. 1313-24.
167. Lerch, M.M., W. Halangk, and J. Mayerle, Preventing pancreatitis by protecting the mitochondrial permeability transition pore. Gastroenterology, 2013. 144(2): p. 265-9.
168. Schild, L., et al., Induction of permeability transition in pancreatic mitochondria by cerulein in rats. Mol Cell Biochem, 1999. 195(1-2): p. 191-7.
169. Shalbueva, N., et al., Effects of oxidative alcohol metabolism on the mitochondrial permeability transition pore and necrosis in a mouse model of alcoholic pancreatitis. Gastroenterology, 2013. 144(2): p. 437-446 e6.
170. Sung, K.F., et al., Prosurvival Bcl-2 proteins stabilize pancreatic mitochondria and protect against necrosis in experimental pancreatitis. Exp Cell Res, 2009. 315(11): p. 1975-89.
171. Voronina, S.G., et al., Dynamic changes in cytosolic and mitochondrial ATP levels in pancreatic acinar cells. Gastroenterology, 2010. 138(5): p. 1976-87.
172. Criddle, D.N., et al., Calcium signalling and pancreatic cell death: apoptosis or necrosis? Cell Death Differ, 2007. 14(7): p. 1285-94.
173. Kim, J.Y., et al., Transporter-mediated bile acid uptake causes Ca2+-dependent cell death in rat pancreatic acinar cells. Gastroenterology, 2002. 122(7): p. 1941-53.
174. Murphy, J.A., et al., Direct activation of cytosolic Ca2+ signaling and enzyme secretion by cholecystokinin in human pancreatic acinar cells. Gastroenterology, 2008. 135(2): p. 632-41.
175. Voronina, S., et al., Bile acids induce calcium signals in mouse pancreatic acinar cells: implications for bile-induced pancreatic pathology. J Physiol, 2002. 540(Pt 1): p. 49-55.
176. Orabi, A.I., et al., Cluster of differentiation 38 (CD38) mediates bile acid-induced acinar cell injury and pancreatitis through cyclic ADP-ribose and intracellular calcium release. J Biol Chem, 2013. 288(38): p. 27128-37.
177. Lur, G., et al., Ribosome-free terminals of rough ER allow formation of STIM1 puncta and segregation of STIM1 from IP(3) receptors. Curr Biol, 2009. 19(19): p. 1648-53.
178. Guzman, E.A. and M. Rudnicki, Intricacies of host response in acute pancreatitis. J Am Coll Surg, 2006. 202(3): p. 509-19.
179. Kylanpaa, M.L., H. Repo, and P.A. Puolakkainen, Inflammation and immunosuppression in severe acute pancreatitis. World J Gastroenterol, 2010. 16(23): p. 2867-72.
180. Levi, M. and H. Ten Cate, Disseminated intravascular coagulation. N Engl J Med, 1999. 341(8): p. 586-92.
181. Lasson, A. and K. Ohlsson, Consumptive coagulopathy, fibrinolysis and protease-antiprotease interactions during acute human pancreatitis. Thromb Res, 1986. 41(2): p. 167-83.
182. Fan, H. and J.A. Cook, Molecular mechanisms of endotoxin tolerance. J Endotoxin Res, 2004. 10(2): p. 71-84.
183. Cavaillon, J.M., et al., Reprogramming of circulatory cells in sepsis and SIRS. J Endotoxin Res, 2005. 11(5): p. 311-20.

207 | P a g e
184. C. Vasilescu et al. Severe Acute Pancreatitis between systematic inflammatory response syndrome and sepsis: insights from a mathematical model of endotoxin tolerance. The American Journal of Surgery 194 (Suppl to 2007) S33-S38
185. Ertel, W., et al., Downregulation of proinflammatory cytokine release in whole blood from septic patients. Blood, 1995. 85(5): p. 1341-7.
186. Gul, M., et al., The beneficial effects of pentoxifylline on caerulein-induced acute pancreatitis in rats. Dig Dis Sci, 2009. 54(3): p. 555-63.
187. Booth, D.M., et al., Reactive oxygen species induced by bile acid induce apoptosis and protect against necrosis in pancreatic acinar cells. Gastroenterology, 2011. 140(7): p. 2116-25.
188. Lenaz, G., The mitochondrial production of reactive oxygen species: mechanisms and implications in human pathology. IUBMB Life, 2001. 52(3-5): p. 159-64.
189. Que, R.S., et al., Correlation of nitric oxide and other free radicals with the severity of acute pancreatitis and complicated systemic inflammatory response syndrome. Pancreas, 2010. 39(4): p. 536-40.
190. Esrefoglu, M., Experimental and clinical evidence of antioxidant therapy in acute pancreatitis. World J Gastroenterol, 2012. 18(39): p. 5533-41.
191. Braganza, J.M., et al., Evidence for early oxidative stress in acute pancreatitis. Clues for correction. Int J Pancreatol, 1995. 17(1): p. 69-81.
192. Esrefoglu, M., et al., Ultrastructural clues for the protective effect of melatonin against oxidative damage in cerulein-induced pancreatitis. J Pineal Res, 2006. 40(1): p. 92-7.
193. Esrefoglu, M., et al., Ultrastructural clues for the protective effect of ascorbic acid and N-acetylcysteine against oxidative damage on caerulein-induced pancreatitis. Pancreatology, 2006. 6(5): p. 477-85.
194. Thareja, S., et al., Variations in the levels of oxidative stress and antioxidants during early acute pancreatitis. Trop Gastroenterol, 2009. 30(1): p. 26-31.
195. Hackert, T. and J. Werner, Antioxidant therapy in acute pancreatitis: experimental and clinical evidence. Antioxid Redox Signal, 2011. 15(10): p. 2767-77.
196. Tate, R.M., et al., Oxygen metabolites stimulate thromboxane production and vasoconstriction in isolated saline-perfused rabbit lungs. J Clin Invest, 1984. 74(2): p. 608-13.
197. Hotter, G., et al., Free radical enhancement promotes leucocyte recruitment through a PAF and LTB4 dependent mechanism. Free Radic Biol Med, 1997. 22(6): p. 947-54.
198. Kusske, A.M., A.J. Rongione, and H.A. Reber, Cytokines and acute pancreatitis. Gastroenterology, 1996. 110(2): p. 639-42.
199. Sanfey, H., G.B. Bulkley, and J.L. Cameron, The role of oxygen-derived free radicals in the pathogenesis of acute pancreatitis. Ann Surg, 1984. 200(4): p. 405-13.
200. de Dios, I., et al., Redox-sensitive modulation of CD45 expression in pancreatic acinar cells during acute pancreatitis. J Pathol, 2006. 210(2): p. 234-9.
201. Escobar, J., et al., Cross-talk between oxidative stress and pro-inflammatory cytokines in acute pancreatitis: a key role for protein phosphatases. Curr Pharm Des, 2009. 15(26): p. 3027-42.
202. Gukovskaya, A.S., et al., Neutrophils and NADPH oxidase mediate intrapancreatic trypsin activation in murine experimental acute pancreatitis. Gastroenterology, 2002. 122(4): p. 974-84.
203. Pereda, J., et al., Interaction between cytokines and oxidative stress in acute pancreatitis. Curr Med Chem, 2006. 13(23): p. 2775-87.
204. Mettu, S.R., et al., Efficacy of serum nitric oxide level estimation in assessing the severity of necrotizing pancreatitis. Pancreatology, 2003. 3(6): p. 506-13; discussion 513-4.
205. Schulz, H.U., et al., Oxidative stress in acute pancreatitis. Hepatogastroenterology, 1999. 46(29): p. 2736-50.
206. Dziurkowska-Marek, A., et al., The dynamics of the oxidant-antioxidant balance in the early phase of human acute biliary pancreatitis. Pancreatology, 2004. 4(3-4): p. 215-22.

208 | P a g e
207. Rau, B., et al., Pathophysiologic role of oxygen free radicals in acute pancreatitis: initiating event or mediator of tissue damage? Ann Surg, 2000. 231(3): p. 352-60.
208. Ranson, J.H., et al., Prognostic signs and the role of operative management in acute pancreatitis. Surg Gynecol Obstet, 1974. 139(1): p. 69-81.
209. Ranson, J.H., K.M. Rifkind, and J.W. Turner, Prognostic signs and nonoperative peritoneal lavage in acute pancreatitis. Surg Gynecol Obstet, 1976. 143(2): p. 209-19.
210. Larvin, M. and M.J. McMahon, APACHE-II score for assessment and monitoring of acute pancreatitis. Lancet, 1989. 2(8656): p. 201-5.
211. Gravante, G., et al., Prediction of mortality in acute pancreatitis: a systematic review of the published evidence. Pancreatology, 2009. 9(5): p. 601-14.
212. Kong, L., et al., Clinical characteristics and prognostic factors of severe acute pancreatitis. World J Gastroenterol, 2004. 10(22): p. 3336-8.
213. Bourgaux, J.F., et al., Infectious complications, prognostic factors and assessment of anti-infectious management of 212 consecutive patients with acute pancreatitis. Gastroenterol Clin Biol, 2007. 31(4): p. 431-5.
214. Mofidi, R., et al., Prognostic factors in patients undergoing surgery for severe necrotizing pancreatitis. World J Surg, 2007. 31(10): p. 2002-7.
215. Balthazar, E.J., Acute pancreatitis: assessment of severity with clinical and CT evaluation. Radiology, 2002. 223(3): p. 603-13.
216. Banks, P.A., Acute pancreatitis: medical and surgical management. Am J Gastroenterol, 1994. 89(8 Suppl): p. S78-85.
217. Dervenis, C., et al., Diagnosis, objective assessment of severity, and management of acute pancreatitis. Santorini consensus conference. Int J Pancreatol, 1999. 25(3): p. 195-210.
218. Blamey, S.L., et al., Prognostic factors in acute pancreatitis. Gut, 1984. 25(12): p. 1340-6. 219. Ranson, J.H. and B.S. Pasternack, Statistical methods for quantifying the severity of clinical
acute pancreatitis. J Surg Res, 1977. 22(2): p. 79-91. 220. Wilson, C., D.I. Heath, and C.W. Imrie, Prediction of outcome in acute pancreatitis: a
comparative study of APACHE II, clinical assessment and multiple factor scoring systems. Br J Surg, 1990. 77(11): p. 1260-4.
221. Imrie, C.W., et al., A single-centre double-blind trial of Trasylol therapy in primary acute pancreatitis. Br J Surg, 1978. 65(5): p. 337-41.
222. Koc, M., et al., Comparison and validation of scoring systems in a cohort of patients treated for perforated peptic ulcer. Langenbecks Arch Surg, 2007. 392(5): p. 581-5.
223. Williams, M. and H.H. Simms, Prognostic usefulness of scoring systems in critically ill patients with severe acute pancreatitis. Crit Care Med, 1999. 27(5): p. 901-7.
224. Johnson, C.D. and M. Abu-Hilal, Persistent organ failure during the first week as a marker of fatal outcome in acute pancreatitis. Gut, 2004. 53(9): p. 1340-4.
225. Vincent, J.L., et al., The SOFA (Sepsis-related Organ Failure Assessment) score to describe organ dysfunction/failure. On behalf of the Working Group on Sepsis-Related Problems of the European Society of Intensive Care Medicine. Intensive Care Med, 1996. 22(7): p. 707-10.
226. Marshall, J.C., et al., Multiple organ dysfunction score: a reliable descriptor of a complex clinical outcome. Crit Care Med, 1995. 23(10): p. 1638-52.
227. Goris, R.J., et al., Multiple-organ failure. Generalized autodestructive inflammation? Arch Surg, 1985. 120(10): p. 1109-15.
228. Balthazar, E.J., et al., Acute pancreatitis: prognostic value of CT. Radiology, 1985. 156(3): p. 767-72.
229. Gudgeon, A.M., et al., Trypsinogen activation peptides assay in the early prediction of severity of acute pancreatitis. Lancet, 1990. 335(8680): p. 4-8.
230. Tenner, S., et al., Urinary trypsinogen activation peptide (TAP) predicts severity in patients with acute pancreatitis. Int J Pancreatol, 1997. 21(2): p. 105-10.

209 | P a g e
231. Kemppainen, E., et al., Plasma trypsinogen activation peptide in patients with acute pancreatitis. Br J Surg, 2001. 88(5): p. 679-80.
232. Hurley, P.R., et al., Development of radioimmunoassays for free tetra-L-aspartyl-L-lysine trypsinogen activation peptides (TAP). J Immunol Methods, 1988. 111(2): p. 195-203.
233. Banks, P.A., et al., Urinary trypsinogen activation peptides (TAP) are not increased in mild ERCP-induced pancreatitis. Pancreas, 1996. 12(3): p. 294-7.
234. Neoptolemos, J.P., et al., Early prediction of severity in acute pancreatitis by urinary trypsinogen activation peptide: a multicentre study. Lancet, 2000. 355(9219): p. 1955-60.
235. Windsor, J.A., Search for prognostic markers for acute pancreatitis. Lancet, 2000. 355(9219): p. 1924-5.
236. Paajanen, H., et al., Serum tumour necrosis factor compared with C-reactive protein in the early assessment of severity of acute pancreatitis. Br J Surg, 1995. 82(2): p. 271-3.
237. Geiger, T., et al., Induction of rat acute-phase proteins by interleukin 6 in vivo. Eur J Immunol, 1988. 18(5): p. 717-21.
238. Castell, J.V., et al., Interleukin-6 is the major regulator of acute phase protein synthesis in adult human hepatocytes. FEBS Lett, 1989. 242(2): p. 237-9.
239. Messmann, H., et al., Post-ERP pancreatitis as a model for cytokine induced acute phase response in acute pancreatitis. Gut, 1997. 40(1): p. 80-5.
240. Leser, H.G., et al., Elevation of serum interleukin-6 concentration precedes acute-phase response and reflects severity in acute pancreatitis. Gastroenterology, 1991. 101(3): p. 782-5.
241. Messmann, H., et al., Interleukins and their antagonists but not TNF and its receptors are released in post-ERP pancreatitis. Eur J Gastroenterol Hepatol, 1998. 10(7): p. 611-7.
242. Pezzilli, R., et al., Serum interleukin-6, interleukin-8, and beta 2-microglobulin in early assessment of severity of acute pancreatitis. Comparison with serum C-reactive protein. Dig Dis Sci, 1995. 40(11): p. 2341-8.
243. Wilson, C., et al., C-reactive protein, antiproteases and complement factors as objective markers of severity in acute pancreatitis. Br J Surg, 1989. 76(2): p. 177-81.
244. Buchler, M., et al., Sensitivity of antiproteases, complement factors and C-reactive protein in detecting pancreatic necrosis. Results of a prospective clinical study. Int J Pancreatol, 1986. 1(3-4): p. 227-35.
245. Viedma, J.A., et al., Role of interleukin-6 in acute pancreatitis. Comparison with C-reactive protein and phospholipase A. Gut, 1992. 33(9): p. 1264-7.
246. Malle, E., et al., Serum amyloid A (SAA) protein enhances formation of cyclooxygenase metabolites of activated human monocytes. FEBS Lett, 1997. 419(2-3): p. 215-9.
247. Rau, B., et al., Serum amyloid A versus C-reactive protein in acute pancreatitis: clinical value of an alternative acute-phase reactant. Crit Care Med, 2000. 28(3): p. 736-42.
248. Mayer, J.M., et al., Serum amyloid A is a better early predictor of severity than C-reactive protein in acute pancreatitis. Br J Surg, 2002. 89(2): p. 163-71.
249. Kittleson, M.M. and J.M. Hare, Molecular signature analysis: using the myocardial transcriptome as a biomarker in cardiovascular disease. Trends Cardiovasc Med, 2005. 15(4): p. 130-8.
250. Liew, C.C. and V.J. Dzau, Molecular genetics and genomics of heart failure. Nat Rev Genet, 2004. 5(11): p. 811-25.
251. Ji, B., et al., Pancreatic gene expression during the initiation of acute pancreatitis: identification of EGR-1 as a key regulator. Physiol Genomics, 2003. 14(1): p. 59-72.
252. Dusetti, N.J., et al., Expression profiling in pancreas during the acute phase of pancreatitis using cDNA microarrays. Biochem Biophys Res Commun, 2000. 277(3): p. 660-7.
253. Nakada, S., et al., Identification of candidate genes involved in endogenous protection mechanisms against acute pancreatitis in mice. Biochem Biophys Res Commun, 2010. 391(3): p. 1342-7.

210 | P a g e
254. Pezzilli, R., et al., Circulating lymphocyte subsets in human acute pancreatitis. Pancreas, 1995. 11(1): p. 95-100.
255. Rockett, J.C., et al., Surrogate tissue analysis: monitoring toxicant exposure and health status of inaccessible tissues through the analysis of accessible tissues and cells. Toxicol Appl Pharmacol, 2004. 194(2): p. 189-99.
256. Liew, C.C., et al., The peripheral blood transcriptome dynamically reflects system wide biology: a potential diagnostic tool. J Lab Clin Med, 2006. 147(3): p. 126-32.
257. Ebert, B.L. and T.R. Golub, Genomic approaches to hematologic malignancies. Blood, 2004. 104(4): p. 923-32.
258. Marshall, K.W., et al., Blood-based biomarkers for detecting mild osteoarthritis in the human knee. Osteoarthritis Cartilage, 2005. 13(10): p. 861-71.
259. Tsuang, M.T., et al., Assessing the validity of blood-based gene expression profiles for the classification of schizophrenia and bipolar disorder: a preliminary report. Am J Med Genet B Neuropsychiatr Genet, 2005. 133B(1): p. 1-5.
260. Osman, I., et al., Novel blood biomarkers of human urinary bladder cancer. Clin Cancer Res, 2006. 12(11 Pt 1): p. 3374-80.
261. Han, M., et al., Novel blood-based, five-gene biomarker set for the detection of colorectal cancer. Clin Cancer Res, 2008. 14(2): p. 455-60.
262. Sharma, P., et al., Early detection of breast cancer based on gene-expression patterns in peripheral blood cells. Breast Cancer Res, 2005. 7(5): p. R634-44.
263. Ma, J. and C.C. Liew, Gene profiling identifies secreted protein transcripts from peripheral blood cells in coronary artery disease. J Mol Cell Cardiol, 2003. 35(8): p. 993-8.
264. Ma, J., et al., Identifying leukocyte gene expression patterns associated with plasma lipid levels in human subjects. Atherosclerosis, 2007. 191(1): p. 63-72.
265. Chon, H., et al., Broadly altered gene expression in blood leukocytes in essential hypertension is absent during treatment. Hypertension, 2004. 43(5): p. 947-51.
266. Twine, N.C., et al., Disease-associated expression profiles in peripheral blood mononuclear cells from patients with advanced renal cell carcinoma. Cancer Res, 2003. 63(18): p. 6069-75.
267. Burczynski, M.E. and A.J. Dorner, Transcriptional profiling of peripheral blood cells in clinical pharmacogenomic studies. Pharmacogenomics, 2006. 7(2): p. 187-202.
268. Gladkevich, A., et al., Microarray profiling of lymphocytes in internal diseases with an altered immune response: potential and methodology. Mediators Inflamm, 2005. 2005(6): p. 317-30.
269. Rus, V., et al., Gene expression profiling in peripheral blood mononuclear cells from lupus patients with active and inactive disease. Clin Immunol, 2004. 112(3): p. 231-4.
270. Lequerre, T., et al., Gene profiling in white blood cells predicts infliximab responsiveness in rheumatoid arthritis. Arthritis Res Ther, 2006. 8(4): p. R105.
271. Burczynski, M.E., et al., Molecular classification of Crohn's disease and ulcerative colitis patients using transcriptional profiles in peripheral blood mononuclear cells. J Mol Diagn, 2006. 8(1): p. 51-61.
272. Bull, T.M., et al., Gene microarray analysis of peripheral blood cells in pulmonary arterial hypertension. Am J Respir Crit Care Med, 2004. 170(8): p. 911-9.
273. Maes, O.C., et al., Transcriptional profiling of Alzheimer blood mononuclear cells by microarray. Neurobiol Aging, 2007. 28(12): p. 1795-809.
274. Borovecki, F., et al., Genome-wide expression profiling of human blood reveals biomarkers for Huntington's disease. Proc Natl Acad Sci U S A, 2005. 102(31): p. 11023-8.
275. Bluth, M., et al., Use of gene expression profiles in cells of peripheral blood to identify new molecular markers of acute pancreatitis. Arch Surg, 2008. 143(3): p. 227-33; discussion 233-4.
276. Augenlicht, L.H. and D. Kobrin, Cloning and screening of sequences expressed in a mouse colon tumor. Cancer Res, 1982. 42(3): p. 1088-93.

211 | P a g e
277. Lashkari, D.A., et al., Yeast microarrays for genome wide parallel genetic and gene expression analysis. Proc Natl Acad Sci U S A, 1997. 94(24): p. 13057-62.
278. Calin, G.A. and C.M. Croce, MicroRNA-cancer connection: the beginning of a new tale. Cancer Res, 2006. 66(15): p. 7390-4.
279. Chang, T.C. and J.T. Mendell, microRNAs in vertebrate physiology and human disease. Annu Rev Genomics Hum Genet, 2007. 8: p. 215-39.
280. Croce, C.M. and G.A. Calin, miRNAs, cancer, and stem cell division. Cell, 2005. 122(1): p. 6-7. 281. Cummins, J.M. and V.E. Velculescu, Implications of micro-RNA profiling for cancer diagnosis.
Oncogene, 2006. 25(46): p. 6220-7. 282. Dalmay, T. and D.R. Edwards, MicroRNAs and the hallmarks of cancer. Oncogene, 2006.
25(46): p. 6170-5. 283. Garzon, R., et al., MicroRNA expression and function in cancer. Trends Mol Med, 2006.
12(12): p. 580-7. 284. Giannakakis, A., et al., miRNA genetic alterations in human cancers. Expert Opin Biol Ther,
2007. 7(9): p. 1375-86. 285. Hammond, S.M., MicroRNAs as oncogenes. Curr Opin Genet Dev, 2006. 16(1): p. 4-9. 286. He, L., et al., microRNAs join the p53 network--another piece in the tumour-suppression
puzzle. Nat Rev Cancer, 2007. 7(11): p. 819-22. 287. Mattes, J., A. Collison, and P.S. Foster, Emerging role of microRNAs in disease pathogenesis
and strategies for therapeutic modulation. Curr Opin Mol Ther, 2008. 10(2): p. 150-7. 288. Stefani, G., Roles of microRNAs and their targets in cancer. Expert Opin Biol Ther, 2007.
7(12): p. 1833-40. 289. Esteller, M., Non-coding RNAs in human disease. Nat Rev Genet, 2011. 12(12): p. 861-74. 290. Weber, J.A., et al., The microRNA spectrum in 12 body fluids. Clin Chem, 2010. 56(11): p.
1733-41. 291. Chen, C.Z. and H.F. Lodish, MicroRNAs as regulators of mammalian hematopoiesis. Semin
Immunol, 2005. 17(2): p. 155-65. 292. Poy, M.N., et al., A pancreatic islet-specific microRNA regulates insulin secretion. Nature,
2004. 432(7014): p. 226-30. 293. Welch, C., Y. Chen, and R.L. Stallings, MicroRNA-34a functions as a potential tumor
suppressor by inducing apoptosis in neuroblastoma cells. Oncogene, 2007. 26(34): p. 5017-22.
294. Miska, E.A., How microRNAs control cell division, differentiation and death. Curr Opin Genet Dev, 2005. 15(5): p. 563-8.
295. Zamore, P.D. and B. Haley, Ribo-gnome: the big world of small RNAs. Science, 2005. 309(5740): p. 1519-24.
296. Li, J., et al., Comparison of miRNA expression patterns using total RNA extracted from matched samples of formalin-fixed paraffin-embedded (FFPE) cells and snap frozen cells. BMC Biotechnol, 2007. 7: p. 36.
297. Swaminathan, R. and A.N. Butt, Circulating nucleic acids in plasma and serum: recent developments. Ann N Y Acad Sci, 2006. 1075: p. 1-9.
298. Rifai, N., M.A. Gillette, and S.A. Carr, Protein biomarker discovery and validation: the long and uncertain path to clinical utility. Nat Biotechnol, 2006. 24(8): p. 971-83.
299. Valadi, H., et al., Exosome-mediated transfer of mRNAs and microRNAs is a novel mechanism of genetic exchange between cells. Nat Cell Biol, 2007. 9(6): p. 654-9.
300. Windsor, J.A., Assessment of the severity of acute pancreatitis: no room for complacency. Pancreatology, 2008. 8(2): p. 105-9.
301. Arroyo, J.D., et al., Argonaute2 complexes carry a population of circulating microRNAs independent of vesicles in human plasma. Proc Natl Acad Sci U S A, 2011. 108(12): p. 5003-8.
302. Wang, K., et al., Export of microRNAs and microRNA-protective protein by mammalian cells. Nucleic Acids Res, 2010. 38(20): p. 7248-59.

212 | P a g e
303. Hotchkiss, R.S. and D.W. Nicholson, Apoptosis and caspases regulate death and inflammation in sepsis. Nat Rev Immunol, 2006. 6(11): p. 813-22.
304. Hotchkiss, R.S., et al., Depletion of dendritic cells, but not macrophages, in patients with sepsis. J Immunol, 2002. 168(5): p. 2493-500.
305. Hotchkiss, R.S., et al., Sepsis-induced apoptosis causes progressive profound depletion of B and CD4+ T lymphocytes in humans. J Immunol, 2001. 166(11): p. 6952-63.
306. Vasilescu, C., et al., MicroRNA fingerprints identify miR-150 as a plasma prognostic marker in patients with sepsis. PLoS One, 2009. 4(10): p. e7405.
307. Lewis, B.P., C.B. Burge, and D.P. Bartel, Conserved seed pairing, often flanked by adenosines, indicates that thousands of human genes are microRNA targets. Cell, 2005. 120(1): p. 15-20.
308. Krek, A., et al., Combinatorial microRNA target predictions. Nat Genet, 2005. 37(5): p. 495-500.
309. John, B., et al., Human MicroRNA targets. PLoS Biol, 2004. 2(11): p. e363. 310. Subramanian, A., et al., Gene set enrichment analysis: a knowledge-based approach for
interpreting genome-wide expression profiles. Proc Natl Acad Sci U S A, 2005. 102(43): p. 15545-50.
311. Jayaswal, V., et al., Identification of microRNAs with regulatory potential using a matched microRNA-mRNA time-course data. Nucleic Acids Res, 2009. 37(8): p. e60.
312. Joung, J.G. and Z. Fei, Computational identification of condition-specific miRNA targets based on gene expression profiles and sequence information. BMC Bioinformatics, 2009. 10 Suppl 1: p. S34.
313. Joung, J.G., et al., Discovery of microRNA-mRNA modules via population-based probabilistic learning. Bioinformatics, 2007. 23(9): p. 1141-7.
314. Peng, X., et al., Computational identification of hepatitis C virus associated microRNA-mRNA regulatory modules in human livers. BMC Genomics, 2009. 10: p. 373.
315. Ritchie, W., et al., Conserved expression patterns predict microRNA targets. PLoS Comput Biol, 2009. 5(9): p. e1000513.
316. Jayaswal, V., et al., Identification of microRNA-mRNA modules using microarray data. BMC Genomics, 2011. 12: p. 138.
317. Hood, L., et al., Systems biology at the Institute for Systems Biology. Brief Funct Genomic Proteomic, 2008. 7(4): p. 239-48.
318. Anatomy: Descriptive and surgical, XI Splanchology 2j. Henry Gray. Published in 1858. 319. Anatomy: Descriptive and surgical, XI Splanchology 2j. Henry Gray. Published in 1858. 320. Radiology of Pancreas, pgs 23-24. Albert L Baert, Guy Delorme, Lieven Van Hoe. Published by
Springer in 1999.
321. Dellinger, E.P., et al., Determinant-based classification of acute pancreatitis severity: an international multidisciplinary consultation. Ann Surg, 2012. 256(6): p. 875-80.
322. Banks, P.A., et al., Classification of acute pancreatitis--2012: revision of the Atlanta classification and definitions by international consensus. Gut, 2013. 62(1): p. 102-11.
323. Wu K, Miyada G. Globin reduction protocol: a method for processing whole blood RNA samples for improved array results. Affymetrix Technical Note.
324. Thach, D.C., et al., Surveillance of transcriptomes in basic military trainees with normal, febrile respiratory illness, and convalescent phenotypes. Genes Immun, 2005. 6(7): p. 588-95.
325. Parrish, M.L., et al., cDNA targets improve whole blood gene expression profiling and enhance detection of pharmocodynamic biomarkers: a quantitative platform analysis. J Transl Med, 2010. 8: p. 87.
326. Liu, J., et al., Effects of globin mRNA reduction methods on gene expression profiles from whole blood. J Mol Diagn, 2006. 8(5): p. 551-8.

213 | P a g e
327. Wright, C., et al., Characterization of globin RNA interference in gene expression profiling of whole-blood samples. Clin Chem, 2008. 54(2): p. 396-405.
328. Field, L.A., et al., Functional identity of genes detectable in expression profiling assays following globin mRNA reduction of peripheral blood samples. Clin Biochem, 2007. 40(7): p. 499-502.
329. Vartanian, K., et al., Gene expression profiling of whole blood: comparison of target preparation methods for accurate and reproducible microarray analysis. BMC Genomics, 2009. 10: p. 2.
330. Affymetrix: An analysis of blood processing methods to prepare samples for GeneChip Expression Profiling 2003
331. Zhang, J., et al., Detecting false expression signals in high-density oligonucleotide arrays by an in silico approach. Genomics, 2005. 85(3): p. 297-308.
332. Wu, C., R. Carta, and L. Zhang, Sequence dependence of cross-hybridization on short oligo microarrays. Nucleic Acids Res, 2005. 33(9): p. e84.
333. Lockhart, D.J., et al., Expression monitoring by hybridization to high-density oligonucleotide arrays. Nat Biotechnol, 1996. 14(13): p. 1675-80.
334. Schena, M., et al., Quantitative monitoring of gene expression patterns with a complementary DNA microarray. Science, 1995. 270(5235): p. 467-70.
335. Sugimoto, N., M. Nakano, and S. Nakano, Thermodynamics-structure relationship of single mismatches in RNA/DNA duplexes. Biochemistry, 2000. 39(37): p. 11270-81.
336. Allawi, H.T. and J. SantaLucia, Jr., Nearest-neighbor thermodynamics of internal A.C mismatches in DNA: sequence dependence and pH effects. Biochemistry, 1998. 37(26): p. 9435-44.
337. Eklund, A.C., et al., Replacing cRNA targets with cDNA reduces microarray cross-hybridization. Nat Biotechnol, 2006. 24(9): p. 1071-3.
338. Kurn, N., et al., Novel isothermal, linear nucleic acid amplification systems for highly multiplexed applications. Clin Chem, 2005. 51(10): p. 1973-81.
339. Barker, C.S., et al., Increased DNA microarray hybridization specificity using sscDNA targets. BMC Genomics, 2005. 6: p. 57.
340. Yao, L., et al., 15-hydroxyprostaglandin dehydrogenase (15-PGDH) prevents lipopolysaccharide (LPS)-induced acute liver injury. PLoS One, 2017. 12(4): p. e0176106.
341. Liao, Q., et al., Preferential expression of cystein-rich secretory protein-3 (CRISP-3) in chronic pancreatitis. Histol Histopathol, 2003. 18(2): p. 425-33.
342. Pfisterer, P., et al., CRISP-3, a protein with homology to plant defense proteins, is expressed in mouse B cells under the control of Oct2. Mol Cell Biol, 1996. 16(11): p. 6160-8.
343. Haendler, B., et al., Differential androgen regulation of the murine genes for cysteine-rich secretory proteins (CRISP). Eur J Biochem, 1997. 250(2): p. 440-6.
344. Macian, F., NFAT proteins: key regulators of T-cell development and function. Nat Rev Immunol, 2005. 5(6): p. 472-84.
345. Hogan, P.G., et al., Transcriptional regulation by calcium, calcineurin, and NFAT. Genes Dev, 2003. 17(18): p. 2205-32.
346. Liu, M., et al., Up-regulation of miR-592 correlates with tumor progression and poor prognosis in patients with colorectal cancer. Biomed Pharmacother, 2015. 69: p. 214-20.
347. Fu, Q., et al., An oncogenic role of miR-592 in tumorigenesis of human colorectal cancer by targeting Forkhead Box O3A (FoxO3A). Expert Opin Ther Targets, 2016. 20(7): p. 771-82.
348. Peng, T., et al., MiR-592 functions as a tumor suppressor in glioma by targeting IGFBP2. Tumour Biol, 2017. 39(7): p. 1010428317719273.
349. Li, Z., et al., miR-592 functions as a tumor suppressor in human non-small cell lung cancer by targeting SOX9. Oncol Rep, 2017. 37(1): p. 297-304.
350. Gong, A.Y., et al., MicroRNA-513 regulates B7-H1 translation and is involved in IFN-gamma-induced B7-H1 expression in cholangiocytes. J Immunol, 2009. 182(3): p. 1325-33.

214 | P a g e
351. Tyc, K. and J.A. Steitz, U3, U8 and U13 comprise a new class of mammalian snRNPs localized in the cell nucleolus. EMBO J, 1989. 8(10): p. 3113-9.
352. Samarsky, D.A., et al., The snoRNA box C/D motif directs nucleolar targeting and also couples snoRNA synthesis and localization. EMBO J, 1998. 17(13): p. 3747-57.
353. Holley, C.L., et al., Cytosolic accumulation of small nucleolar RNAs (snoRNAs) is dynamically regulated by NADPH oxidase. J Biol Chem, 2015. 290(18): p. 11741-8.
354. Tycowski, K.T., et al., A small nucleolar RNA requirement for site-specific ribose methylation of rRNA in Xenopus. Proc Natl Acad Sci U S A, 1996. 93(25): p. 14480-5.
355. Kiss, A.M., et al., Human box H/ACA pseudouridylation guide RNA machinery. Mol Cell Biol, 2004. 24(13): p. 5797-807.
356. Badhai, J., et al., Ribosomal protein S19 and S24 insufficiency cause distinct cell cycle defects in Diamond-Blackfan anemia. Biochim Biophys Acta, 2009. 1792(10): p. 1036-42.
357. Hariharan, N. and M.A. Sussman, Stressing on the nucleolus in cardiovascular disease. Biochim Biophys Acta, 2014. 1842(6): p. 798-801.
358. Trainor, P.A. and A.E. Merrill, Ribosome biogenesis in skeletal development and the pathogenesis of skeletal disorders. Biochim Biophys Acta, 2014. 1842(6): p. 769-78.
359. Ranson, J.H., et al., Objective early identification of severe acute pancreatitis. Am J Gastroenterol, 1974. 61(6): p. 443-51.
360. Zhang, J., J. Niu, and J. Yang, Interleukin-6, interleukin-8 and interleukin-10 in estimating the severity of acute pancreatitis: an updated meta-analysis. Hepatogastroenterology, 2014. 61(129): p. 215-20.
361. Brivet, F.G., D. Emilie, and P. Galanaud, Pro- and anti-inflammatory cytokines during acute severe pancreatitis: an early and sustained response, although unpredictable of death. Parisian Study Group on Acute Pancreatitis. Crit Care Med, 1999. 27(4): p. 749-55.
362. Chen, C.C., et al., Proinflammatory cytokines in early assessment of the prognosis of acute pancreatitis. Am J Gastroenterol, 1999. 94(1): p. 213-8.
363. Deng, L.H., et al., Plasma cytokines can help to identify the development of severe acute pancreatitis on admission. Medicine (Baltimore), 2017. 96(28): p. e7312.
364. Liu, T., et al., Accuracy of circulating histones in predicting persistent organ failure and mortality in patients with acute pancreatitis. Br J Surg, 2017. 104(9): p. 1215-1225.
365. Hritz, I. and P. Hegyi, Early Achievable Severity (EASY) index for simple and accurate expedite risk stratification in acute pancreatitis. J Gastrointestin Liver Dis, 2015. 24(2): p. 177-82.
366. Papachristou, G.I., et al., Acute pancreatitis patient registry to examine novel therapies in clinical experience (APPRENTICE): an international, multicenter consortium for the study of acute pancreatitis. Ann Gastroenterol, 2017. 30(1): p. 106-113.
367. Curley, P.J., et al., Reduction in circulating levels of CD4-positive lymphocytes in acute pancreatitis: relationship to endotoxin, interleukin 6 and disease severity. Br J Surg, 1993. 80(10): p. 1312-5.
368. Widdison, A.L. and S. Cunningham, Immune function early in acute pancreatitis. Br J Surg, 1996. 83(5): p. 633-6.
369. Takeyama, Y., et al., Peripheral lymphocyte reduction in severe acute pancreatitis is caused by apoptotic cell death. J Gastrointest Surg, 2000. 4(4): p. 379-87.
370. Du, W.D., et al., Therapeutic efficacy of high-dose vitamin C on acute pancreatitis and its potential mechanisms. World J Gastroenterol, 2003. 9(11): p. 2565-9.
371. Pezzilli, R., et al., Early activation of peripheral lymphocytes in human acute pancreatitis. J Clin Gastroenterol, 2003. 36(4): p. 360-3.
372. Bhatia, M., et al., Pathophysiology of acute pancreatitis. Pancreatology, 2005. 5(2-3): p. 132-44.
373. Laurence, J., T-cell subsets in health, infectious disease, and idiopathic CD4+ T lymphocytopenia. Ann Intern Med, 1993. 119(1): p. 55-62.

215 | P a g e
374. Pietruczuk, M., et al., Alteration of peripheral blood lymphocyte subsets in acute pancreatitis. World J Gastroenterol, 2006. 12(33): p. 5344-51.
375. Takeyama, Y., et al., Thymic atrophy caused by thymocyte apoptosis in experimental severe acute pancreatitis. J Surg Res, 1998. 78(2): p. 97-102.
376. Andjelic, S., et al., Intracellular Ca2+ elevation and cyclosporin A synergistically induce TGF-beta 1-mediated apoptosis in lymphocytes. J Immunol, 1997. 158(6): p. 2527-34.
377. Ueda, T., et al., Functional alterations of splenocytes in severe acute pancreatitis. J Surg Res, 2002. 102(2): p. 161-8.
378. Bluestone, J.A. and Q. Tang, How do CD4+CD25+ regulatory T cells control autoimmunity? Curr Opin Immunol, 2005. 17(6): p. 638-42.
379. Jiang, H. and L. Chess, Regulation of immune responses by T cells. N Engl J Med, 2006. 354(11): p. 1166-76.
380. Sweeney, K.J., et al., Serum antigen(s) drive the proinflammatory T cell response in acute pancreatitis. Br J Surg, 2003. 90(3): p. 313-9.
381. Povoski, S.P., et al., The critically ill patient after hepatobiliary surgery. Crit Care, 1999. 3(6): p. 139-144.
382. Shaw, J.P., et al., Identification of a putative regulator of early T cell activation genes. Science, 1988. 241(4862): p. 202-5.
383. Durand, D.B., et al., Characterization of antigen receptor response elements within the interleukin-2 enhancer. Mol Cell Biol, 1988. 8(4): p. 1715-24.
384. Rao, A., NF-ATp: a transcription factor required for the co-ordinate induction of several cytokine genes. Immunol Today, 1994. 15(6): p. 274-81.
385. Graef, I.A., F. Chen, and G.R. Crabtree, NFAT signaling in vertebrate development. Curr Opin Genet Dev, 2001. 11(5): p. 505-12.
386. Graef, I.A., et al., Signals transduced by Ca(2+)/calcineurin and NFATc3/c4 pattern the developing vasculature. Cell, 2001. 105(7): p. 863-75.
387. Mancini, M. and A. Toker, NFAT proteins: emerging roles in cancer progression. Nat Rev Cancer, 2009. 9(11): p. 810-20.
388. McCaffrey, P.G., et al., Isolation of the cyclosporin-sensitive T cell transcription factor NFATp. Science, 1993. 262(5134): p. 750-4.
389. Luo, C., et al., Recombinant NFAT1 (NFATp) is regulated by calcineurin in T cells and mediates transcription of several cytokine genes. Mol Cell Biol, 1996. 16(7): p. 3955-66.
390. Northrop, J.P., et al., NF-AT components define a family of transcription factors targeted in T-cell activation. Nature, 1994. 369(6480): p. 497-502.
391. Hoey, T., et al., Isolation of two new members of the NF-AT gene family and functional characterization of the NF-AT proteins. Immunity, 1995. 2(5): p. 461-72.
392. Lopez-Rodriguez, C., et al., NFAT5, a constitutively nuclear NFAT protein that does not cooperate with Fos and Jun. Proc Natl Acad Sci U S A, 1999. 96(13): p. 7214-9.
393. Luo, C., et al., Interaction of calcineurin with a domain of the transcription factor NFAT1 that controls nuclear import. Proc Natl Acad Sci U S A, 1996. 93(17): p. 8907-12.
394. Feske, S., et al., Gene regulation mediated by calcium signals in T lymphocytes. Nat Immunol, 2001. 2(4): p. 316-24.
395. Wesselborg, S., et al., Identification of a physical interaction between calcineurin and nuclear factor of activated T cells (NFATp). J Biol Chem, 1996. 271(3): p. 1274-7.
396. Loh, C., et al., Calcineurin binds the transcription factor NFAT1 and reversibly regulates its activity. J Biol Chem, 1996. 271(18): p. 10884-91.
397. Rao, A., C. Luo, and P.G. Hogan, Transcription factors of the NFAT family: regulation and function. Annu Rev Immunol, 1997. 15: p. 707-47.
398. Crabtree, G.R. and E.N. Olson, NFAT signaling: choreographing the social lives of cells. Cell, 2002. 109 Suppl: p. S67-79.

216 | P a g e
399. Zanoni, I. and F. Granucci, Regulation and dysregulation of innate immunity by NFAT signaling downstream of pattern recognition receptors (PRRs). Eur J Immunol, 2012. 42(8): p. 1924-31.
400. Aramburu, J., et al., Affinity-driven peptide selection of an NFAT inhibitor more selective than cyclosporin A. Science, 1999. 285(5436): p. 2129-33.
401. Yarilina, A., et al., TNF activates calcium-nuclear factor of activated T cells (NFAT)c1 signaling pathways in human macrophages. Proc Natl Acad Sci U S A, 2011. 108(4): p. 1573-8.
402. Ranjan, R., et al., The transcription factor nuclear factor of activated T cells c3 modulates the function of macrophages in sepsis. J Innate Immun, 2014. 6(6): p. 754-64.
403. Karpurapu, M., et al., Inhibition of nuclear factor of activated T cells (NFAT) c3 activation attenuates acute lung injury and pulmonary edema in murine models of sepsis. Oncotarget, 2018. 9(12): p. 10606-10620.
404. Zhang, S., et al., Nuclear factor of activated T cells regulates neutrophil recruitment, systemic inflammation, and T-cell dysfunction in abdominal sepsis. Infect Immun, 2014. 82(8): p. 3275-88.
405. Ramiro-Diaz, J.M., et al., NFAT is required for spontaneous pulmonary hypertension in superoxide dismutase 1 knockout mice. Am J Physiol Lung Cell Mol Physiol, 2013. 304(9): p. L613-25.
406. Zetterqvist, A.V., et al., Nuclear factor of activated T cells is activated in the endothelium of retinal microvessels in diabetic mice. J Diabetes Res, 2015. 2015: p. 428473.
407. Herbst, S., et al., Phagocytosis-dependent activation of a TLR9-BTK-calcineurin-NFAT pathway co-ordinates innate immunity to Aspergillus fumigatus. EMBO Mol Med, 2015. 7(3): p. 240-58.
408. Awla, D., et al., NFATc3 regulates trypsinogen activation, neutrophil recruitment, and tissue damage in acute pancreatitis in mice. Gastroenterology, 2012. 143(5): p. 1352-60 e1-7.
409. Minematsu, H., et al., Nuclear presence of nuclear factor of activated T cells (NFAT) c3 and c4 is required for Toll-like receptor-activated innate inflammatory response of monocytes/macrophages. Cell Signal, 2011. 23(11): p. 1785-93.
410. da Costa Martins, P.A., et al., MicroRNA-199b targets the nuclear kinase Dyrk1a in an auto-amplification loop promoting calcineurin/NFAT signalling. Nat Cell Biol, 2010. 12(12): p. 1220-7.
411. Liao, J.M., et al., MiR-1246: a new link of the p53 family with cancer and Down syndrome. Cell Cycle, 2012. 11(14): p. 2624-30.
412. Muller, M.R. and A. Rao, NFAT, immunity and cancer: a transcription factor comes of age. Nat Rev Immunol, 2010. 10(9): p. 645-56.
413. Goodridge, H.S., R.M. Simmons, and D.M. Underhill, Dectin-1 stimulation by Candida albicans yeast or zymosan triggers NFAT activation in macrophages and dendritic cells. J Immunol, 2007. 178(5): p. 3107-15.
414. Mourao-Sa, D., et al., CLEC-2 signaling via Syk in myeloid cells can regulate inflammatory responses. Eur J Immunol, 2011. 41(10): p. 3040-53.
415. Fric, J., et al., NFAT control of innate immunity. Blood, 2012. 120(7): p. 1380-9. 416. Wu, H., et al., NFAT signaling and the invention of vertebrates. Trends Cell Biol, 2007. 17(6):
p. 251-60. 417. Greenblatt, M.B., et al., Calcineurin regulates innate antifungal immunity in neutrophils. J
Exp Med, 2010. 207(5): p. 923-31. 418. Pang, Z., et al., The calcineurin-NFAT axis contributes to host defense during Pseudomonas
aeruginosa lung infection. J Leukoc Biol, 2017. 102(6): p. 1461-1469. 419. de Lumley, M., et al., A biophysical characterisation of factors controlling dimerisation and
selectivity in the NF-kappaB and NFAT families. J Mol Biol, 2004. 339(5): p. 1059-75. 420. Sica, A., et al., Interaction of NF-kappaB and NFAT with the interferon-gamma promoter. J
Biol Chem, 1997. 272(48): p. 30412-20.

217 | P a g e
421. McCaffrey, P.G., et al., A T cell nuclear factor resembling NF-AT binds to an NF-kappa B site and to the conserved lymphokine promoter sequence "cytokine-1". J Biol Chem, 1992. 267(3): p. 1864-71.
422. Liu, Q., et al., Interaction between NFkappaB and NFAT coordinates cardiac hypertrophy and pathological remodeling. Circ Res, 2012. 110(8): p. 1077-86.
423. Huang, W., et al., DDX5 and its associated lncRNA Rmrp modulate TH17 cell effector functions. Nature, 2015. 528(7583): p. 517-22.
424. Song, X., et al., Promoter-associated noncoding RNA from the CCND1 promoter. Methods Mol Biol, 2012. 809: p. 609-22.
425. Frantz, B., et al., Calcineurin acts in synergy with PMA to inactivate I kappa B/MAD3, an inhibitor of NF-kappa B. EMBO J, 1994. 13(4): p. 861-70.
426. Gremese, E. and G.F. Ferraccioli, Benefit/risk of cyclosporine in rheumatoid arthritis. Clin Exp Rheumatol, 2004. 22(5 Suppl 35): p. S101-7.
427. Ponticelli, C., et al., From cyclosporine to the future. Transplant Proc, 2004. 36(2 Suppl): p. 557S-560S.
428. Kaufman, D.B., et al., Immunosuppression: practice and trends. Am J Transplant, 2004. 4 Suppl 9: p. 38-53.
429. Griffiths, B. and P. Emery, The treatment of lupus with cyclosporin A. Lupus, 2001. 10(3): p. 165-70.
430. Kiani, A., A. Rao, and J. Aramburu, Manipulating immune responses with immunosuppressive agents that target NFAT. Immunity, 2000. 12(4): p. 359-72.
431. Bechstein, W.O., Neurotoxicity of calcineurin inhibitors: impact and clinical management. Transpl Int, 2000. 13(5): p. 313-26.
432. Olyaei, A.J., A.M. de Mattos, and W.M. Bennett, Nephrotoxicity of immunosuppressive drugs: new insight and preventive strategies. Curr Opin Crit Care, 2001. 7(6): p. 384-9.
433. Noguchi, H., et al., A new cell-permeable peptide allows successful allogeneic islet transplantation in mice. Nat Med, 2004. 10(3): p. 305-9.
434. Li, H., A. Rao, and P.G. Hogan, Structural delineation of the calcineurin-NFAT interaction and its parallels to PP1 targeting interactions. J Mol Biol, 2004. 342(5): p. 1659-74.
435. Rodriguez, A., et al., The linker region joining the catalytic and the regulatory domains of CnA is essential for binding to NFAT. J Biol Chem, 2005. 280(11): p. 9980-4.
436. Roehrl, M.H., et al., Selective inhibition of calcineurin-NFAT signaling by blocking protein-protein interaction with small organic molecules. Proc Natl Acad Sci U S A, 2004. 101(20): p. 7554-9.
437. Venkatesh, N., et al., Chemical genetics to identify NFAT inhibitors: potential of targeting calcium mobilization in immunosuppression. Proc Natl Acad Sci U S A, 2004. 101(24): p. 8969-74.
438. Yang, X., et al., SnoRNAs are involved in the progression of ulcerative colitis and colorectal cancer. Dig Liver Dis, 2017. 49(5): p. 545-551.
439. Bell, D.W., Our changing view of the genomic landscape of cancer. J Pathol, 2010. 220(2): p. 231-43.
440. Crea, F., et al., The non-coding transcriptome as a dynamic regulator of cancer metastasis. Cancer Metastasis Rev, 2014. 33(1): p. 1-16.
441. Mannoor, K., J. Liao, and F. Jiang, Small nucleolar RNAs in cancer. Biochim Biophys Acta, 2012. 1826(1): p. 121-8.
442. Liao, J., et al., Small nucleolar RNA signatures as biomarkers for non-small-cell lung cancer. Mol Cancer, 2010. 9: p. 198.

218 | P a g e
APPENDICES

219 | P a g e
Appendix 1
RNA Extractions – Nanodrops for qualitative and quantitative assessment
Batch 1

220 | P a g e

221 | P a g e

222 | P a g e
Batch 2

223 | P a g e

224 | P a g e

225 | P a g e
Batch 3

226 | P a g e

227 | P a g e

228 | P a g e
Batch 4

229 | P a g e

230 | P a g e

231 | P a g e
Batch 5

232 | P a g e

233 | P a g e

234 | P a g e
CDNA – Nanodrops for quantitative assessment
Batch 1

235 | P a g e

236 | P a g e

237 | P a g e
Batch 2

238 | P a g e

239 | P a g e

240 | P a g e
Batch 3

241 | P a g e
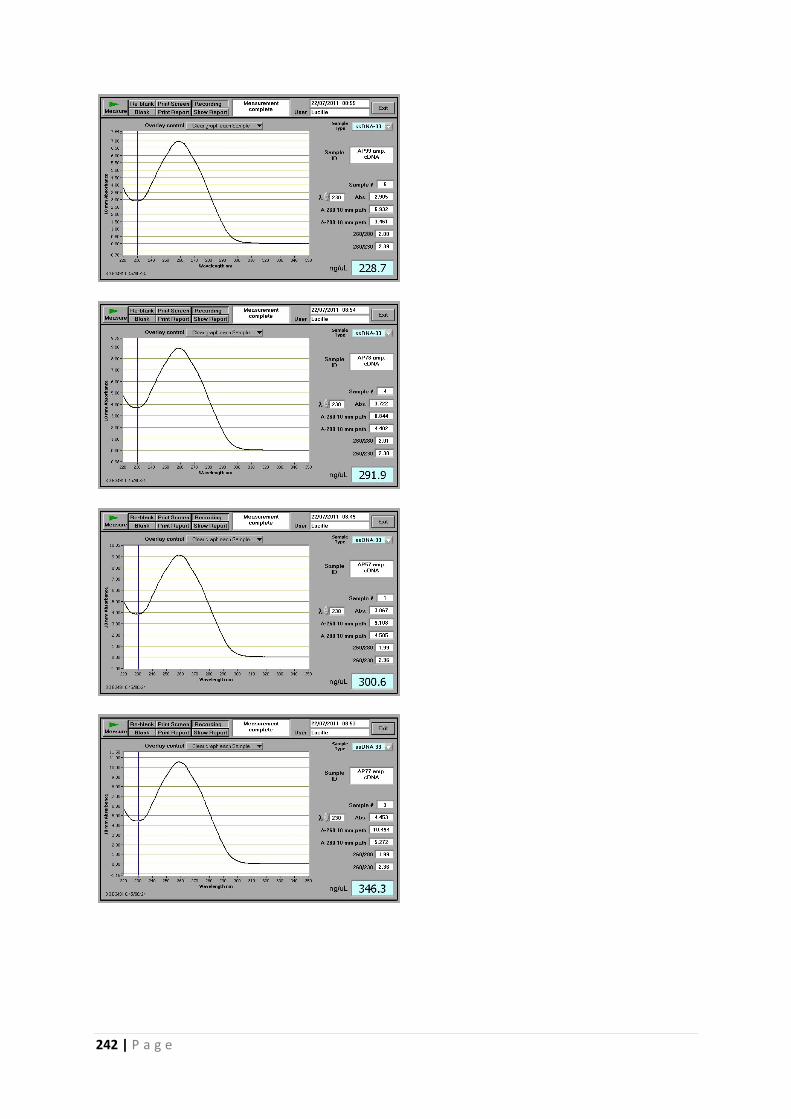
242 | P a g e

243 | P a g e

244 | P a g e
Batch 4

245 | P a g e

246 | P a g e

247 | P a g e
Batch 5

248 | P a g e

249 | P a g e

250 | P a g e
Appendix 2
List of all differentially expressed upregulated genes in severe and mild
acute pancreatitis
Expr p-value
Expr Fold
Change Symbol Entrez Gene Name Location Type(s)
0.000108 4.49 MMP8 matrix metallopeptidase 8 Extracellular Space peptidase
0.0005 3.419 OLAH oleoyl-ACP hydrolase Cytoplasm enzyme
0.0000419 3.095 ADAMTS2 ADAM metallopeptidase with thrombospondin type 1 motif 2 Extracellular Space peptidase
0.000028 3.085 RETN resistin Extracellular Space other
0.00263 3.077 HPGD hydroxyprostaglandin dehydrogenase 15-(NAD) Cytoplasm enzyme
0.000335 3.072 SLC1A3 solute carrier family 1 member 3 Plasma Membrane transporter
0.00108 2.918 OLAH oleoyl-ACP hydrolase Cytoplasm enzyme
0.00316 2.915 HPGD hydroxyprostaglandin dehydrogenase 15-(NAD) Cytoplasm enzyme
0.0028 2.87 OLAH oleoyl-ACP hydrolase Cytoplasm enzyme
0.000604 2.847 GPR84 G protein-coupled receptor 84 Plasma Membrane G-protein receptor
0.000368 2.739 SLC51A solute carrier family 51 alpha subunit Plasma Membrane transporter
0.000132 2.701 CRISP3 cysteine rich secretory protein 3 Extracellular Space other
0.000838 2.624 HPGD hydroxyprostaglandin dehydrogenase 15-(NAD) Cytoplasm enzyme
0.0018 2.551 DAAM2 dishevelled associated activator of morphogenesis 2 Cytoplasm other
0.0000173 2.538 CD163 CD163 molecule Plasma Membrane transmembrane receptor
0.00332 2.537 FGF13 fibroblast growth factor 13 Extracellular Space growth factor
0.000477 2.534 ANKRD22 ankyrin repeat domain 22 Nucleus transcription regulator
0.000163 2.452 VSIG4 V-set and immunoglobulin domain containing 4 Plasma Membrane other
0.0000131 2.445 BPI bactericidal/permeability-increasing protein Plasma Membrane transporter
0.000208 2.398 PFKFB2 6-phosphofructo-2-kinase/fructose-2,6-biphosphatase 2 Cytoplasm kinase
0.0000661 2.391 TIMP4 TIMP metallopeptidase inhibitor 4 Extracellular Space other
0.000666 2.335 ARG1 arginase 1 Cytoplasm enzyme
0.00036 2.315 SH3PXD2B SH3 and PX domains 2B Cytoplasm other
0.000874 2.31 HGF hepatocyte growth factor Extracellular Space growth factor
0.000334 2.302 HGF hepatocyte growth factor Extracellular Space growth factor
0.000518 2.252 PTGES prostaglandin E synthase Cytoplasm enzyme
0.000349 2.238 SAMSN1 SAM domain, SH3 domain and nuclear localization signals 1 Nucleus other
0.0000832 2.227 TMEM45A transmembrane protein 45A Plasma Membrane other
0.000094 2.221 CEACAM1 carcinoembryonic antigen related cell adhesion molecule 1 Plasma Membrane transporter
0.00183 2.21 DLC1 DLC1 Rho GTPase activating protein Cytoplasm other
0.0000795 2.196 TCN1 transcobalamin 1 Cytoplasm transporter
0.000477 2.195 DHRS9 dehydrogenase/reductase 9 Cytoplasm enzyme
0.000799 2.182 SEMA6B semaphorin 6B Plasma Membrane other
0.00161 2.165 LCN2 lipocalin 2 Extracellular Space transporter
0.00273 2.157
CYP1B1-
AS1 CYP1B1 antisense RNA 1 Other other
0.0000261 2.151 ADAMTS2 ADAM metallopeptidase with thrombospondin type 1 motif 2 Extracellular Space peptidase
0.000497 2.149 DHRS9 dehydrogenase/reductase 9 Cytoplasm enzyme
0.00292 2.134 LTF lactotransferrin Extracellular Space peptidase

251 | P a g e
0.00104 2.124 CEACAM1 carcinoembryonic antigen related cell adhesion molecule 1 Plasma Membrane transporter
0.000751 2.111 CRISP2 cysteine rich secretory protein 2 Extracellular Space other
0.000224 2.103 HGF hepatocyte growth factor Extracellular Space growth factor
0.00269 2.1 C1QC complement C1q C chain Extracellular Space peptidase
0.000875 2.094 THBS1 thrombospondin 1 Extracellular Space other
0.00129 2.09 CEACAM1 carcinoembryonic antigen related cell adhesion molecule 1 Plasma Membrane transporter
0.0000365 2.073 SIRT5 sirtuin 5 Cytoplasm enzyme
0.000357 2.06 DHRS9 dehydrogenase/reductase 9 Cytoplasm enzyme
0.000345 2.053 FGF13-AS1 FGF13 antisense RNA 1 Other other
0.0000247 2.048 ERLIN1 ER lipid raft associated 1 Plasma Membrane other
0.000131 2.027 PDE4D phosphodiesterase 4D Cytoplasm enzyme
0.000595 2.012 KL klotho Extracellular Space enzyme

252 | P a g e
List of all differentially expressed downregulated genes in severe and mild
acute pancreatitis
Expr p-
value
Expr Fold
Change Symbol Entrez Gene Name Location Type(s)
0.000152 -1.931 RPS6KA5 ribosomal protein S6 kinase A5 Nucleus kinase
0.000479 -1.935 TRAC T-cell receptor alpha constant Plasma Membrane other
0.000391 -1.936 GBP5 guanylate binding protein 5 Plasma Membrane enzyme
0.000664 -1.939 NR3C2 nuclear receptor subfamily 3 group C member 2 Nucleus ligand-dependent nuclear receptor
0.000941 -1.954 CD40LG CD40 ligand Extracellular Space cytokine
0.000183 -1.954 MYBL1 MYB proto-oncogene like 1 Nucleus transcription regulator
0.0000454 -1.966 CXCR3 C-X-C motif chemokine receptor 3 Plasma Membrane G-protein coupled receptor
0.000521 -1.968 YME1L1 YME1 like 1 ATPase Cytoplasm peptidase
0.000208 -1.97 BCL11B B-cell CLL/lymphoma 11B Nucleus transcription regulator
0.000231 -1.972 LCK LCK proto-oncogene, Src family tyrosine kinase Cytoplasm kinase
0.000103 -1.975 RORA RAR related orphan receptor A Nucleus ligand-dependent nuclear receptor
0.000401 -1.977 PYHIN1 pyrin and HIN domain family member 1 Nucleus other
0.000425 -1.982 CD3D CD3d molecule Plasma Membrane transmembrane receptor
0.000189 -1.984 THEMIS thymocyte selection associated Cytoplasm other
0.000522 -2 CAMK4 calcium/calmodulin dependent protein kinase IV Nucleus kinase
0.00274 -2.003 LOC105369609 uncharacterized LOC105369609 Other other
0.00174 -2.007 ISM1 isthmin 1 Other other
0.00165 -2.012 ETV7 ETS variant 7 Nucleus transcription regulator
0.0000993 -2.016 ATP8B2 ATPase phospholipid transporting 8B2 Plasma Membrane transporter
0.000717 -2.02 GRAMD1C GRAM domain containing 1C Other other
0.0000249 -2.022 RPS6KA5 ribosomal protein S6 kinase A5 Nucleus kinase
0.000147 -2.026 DPP4 dipeptidyl peptidase 4 Plasma Membrane peptidase
0.00035 -2.03 TRAC T-cell receptor alpha constant Plasma Membrane other
0.000122 -2.068 IFNLR1 interferon lambda receptor 1 Plasma Membrane transmembrane receptor
0.000382 -2.075 PRKCQ-AS1 PRKCQ antisense RNA 1 Other other
0.00321 -2.082 BEX2 brain expressed X-linked 2 Nucleus other
0.000694 -2.09 TRAV24 T cell receptor alpha variable 24 Other other
0.000213 -2.091 CD160 CD160 molecule Plasma Membrane transmembrane receptor
0.0000443 -2.104 TBC1D4 TBC1 domain family member 4 Cytoplasm other
0.00103 -2.113 CAMK4 calcium/calmodulin dependent protein kinase IV Nucleus kinase
0.000194 -2.139 CD28 CD28 molecule Plasma Membrane transmembrane receptor
0.0000954 -2.159 GATA3 GATA binding protein 3 Nucleus transcription regulator
0.000319 -2.165 TRAV9-2 T cell receptor alpha variable 9-2 Other other
0.000101 -2.178 GBP4 guanylate binding protein 4 Cytoplasm enzyme
5.51E-06 -2.201 RPS6KA5 ribosomal protein S6 kinase A5 Nucleus kinase
0.000125 -2.208 BCL11B B-cell CLL/lymphoma 11B Nucleus transcription regulator
0.0000298 -2.214 YME1L1 YME1 like 1 ATPase Cytoplasm peptidase
0.0000878 -2.235 GZMK granzyme K Cytoplasm peptidase
0.000529 -2.254 KIAA1671 KIAA1671 Other other
0.00037 -2.283 TRAT1
T cell receptor associated transmembrane
adaptor 1 Plasma Membrane kinase
0.000166 -2.292 INPP4B inositol polyphosphate-4-phosphatase type II B Cytoplasm phosphatase
0.00018 -2.299 THEMIS thymocyte selection associated Cytoplasm other

253 | P a g e
0.0000354 -2.321 P2RY10 purinergic receptor P2Y10 Plasma Membrane G-protein coupled receptor
0.0000236 -2.364 RORA RAR related orphan receptor A Nucleus ligand-dependent nuclear receptor
0.0000358 -2.386 YME1L1 YME1 like 1 ATPase Cytoplasm peptidase
0.0000328 -2.398 TRDV3 T cell receptor delta variable 3 Other other
0.00125 -2.405 YME1L1 YME1 like 1 ATPase Cytoplasm peptidase
0.000218 -2.407 YME1L1 YME1 like 1 ATPase Cytoplasm peptidase
0.000285 -2.519 NOV nephroblastoma overexpressed Extracellular Space growth factor
0.00045 -2.594 NELL2 neural EGFL like 2 Extracellular Space other

254 | P a g e
Appendix 3
List of all differentially expressed miRNA in severe and mild acute
pancreatitis
Rank ID F p-value
Adjusted p-
value
Log Fold
Change
Fold
Change
Absolute
Fold
Change
1 MIR631 3.69E-06 0.013909811 -0.89813 -1.86365 1.863649
2 MIR3129 7.20E-06 0.013909811 -0.66696 -1.58772 1.587725
3 snoU13 9.09E-06 0.013909811 -0.37461 -1.29649 1.296491
4 MIR1291 2.04E-05 0.018768512 0.858892 1.813645 1.813645
5 ACA50 1.82E-05 0.018768512 -0.39981 -1.31933 1.319331
6 SNORD30 2.58E-05 0.019781918 -0.34226 -1.26774 1.267737
7 MIR758 4.26E-05 0.021760076 0.828388 1.7757 1.7757
8 ACA9 3.73E-05 0.021760076 -0.637 -1.55509 1.555091
9 snoU13 3.91E-05 0.021760076 -0.53997 -1.45394 1.453938
10 snoU13 4.91E-05 0.022441665 0.59434 1.509782 1.509782
11 MIR3157 5.83E-05 0.022441665 -0.51723 -1.4312 1.431205
12 snoU13 5.86E-05 0.022441665 0.423748 1.341408 1.341408
13 MIR548n 6.94E-05 0.024523767 -0.82394 -1.77023 1.770233
14 MIR302e 8.66E-05 0.026509154 -0.60491 -1.52089 1.520889
15 MIR513c 8.34E-05 0.026509154 0.538149 1.452108 1.452108
16 MIR548j 9.79E-05 0.028097164 -0.54481 -1.45883 1.458825
17 SNORA51 0.000131 0.03542224 -0.32097 -1.24917 1.249168
18 MIR758 0.000148 0.03572517 0.712447 1.638581 1.638581
19 MIR3187 0.000141 0.03572517 -0.66193 -1.58219 1.582195
20 SNORA70 0.000162 0.037128192 -0.16524 -1.12136 1.121356
21 MIR184 0.00019 0.03787902 0.666223 1.586912 1.586912
22 MIR199b 0.000186 0.03787902 -0.62895 -1.54644 1.546441
23 SNORD109A 0.000188 0.03787902 -0.51885 -1.43281 1.432809
24 MIR636 0.000248 0.039727972 0.792679 1.732288 1.732288
25 MIR1976 0.000237 0.039727972 -0.7054 -1.6306 1.630598
26 snoU13 0.000265 0.039727972 -0.65159 -1.5709 1.570901
27 snosnR60_Z15 0.000229 0.039727972 0.624232 1.54139 1.54139
28 14qII-17 0.000268 0.039727972 0.562621 1.47695 1.47695
29 SNORA25 0.000241 0.039727972 -0.54568 -1.4597 1.459705
30 MIR23a 0.000224 0.039727972 -0.52215 -1.43609 1.436094
31 MIR192 0.000253 0.039727972 -0.28773 -1.22071 1.220714
32 SNORA8 0.000312 0.042511604 0.600929 1.516693 1.516693
33 snoU13 0.000298 0.042511604 -0.43351 -1.35051 1.350514
34 SNORA3 0.000315 0.042511604 0.368014 1.290575 1.290575
35 SNORA27 0.000327 0.042862865 0.612952 1.529385 1.529385
36 MIR432* 0.000353 0.044994617 -0.65758 -1.57743 1.57743

255 | P a g e
37 SNORA8 0.000373 0.045138987 0.768009 1.702918 1.702918
38 snoU13 0.000374 0.045138987 0.447187 1.36338 1.36338
39 U8 0.000406 0.047838964 0.404085 1.32325 1.32325
40 SNORA22 0.000421 0.04784593 0.757156 1.690155 1.690155
41 MIR373 0.000458 0.04784593 0.703811 1.628801 1.628801
42 SNORD56 0.000456 0.04784593 0.441721 1.358223 1.358223
43 MIR589 0.00044 0.04784593 -0.39282 -1.31295 1.312953
44 MIR135b 0.000428 0.04784593 -0.33667 -1.26284 1.262841
45 MIR487b 0.000479 0.048927839 0.349223 1.273875 1.273875


