Embed Size (px)
Citation preview

RESEARCH ARTICLE Open Access
Gene expression profiling in whole bloodidentifies distinct biological pathways associatedwith obesitySujoy Ghosh1*, Robert Dent2, Mary-Ellen Harper3, Shelby A Gorman4, Joan S Stuart4, Ruth McPherson5*
Abstract
Background: Obesity is reaching epidemic proportions and represents a significant risk factor for cardiovasculardisease, diabetes, and cancer.
Methods: To explore the relationship between increased body mass and gene expression in blood, we conductedwhole-genome expression profiling of whole blood from seventeen obese and seventeen well matched leansubjects. Gene expression data was analyzed at the individual gene and pathway level and a preliminaryassessment of the predictive value of blood gene expression profiles in obesity was carried out.
Results: Principal components analysis of whole-blood gene expression data from obese and lean subjects led toefficient separation of the two cohorts. Pathway analysis by gene-set enrichment demonstrated increased transcriptlevels for genes belonging to the “ribosome”, “apoptosis” and “oxidative phosphorylation” pathways in the obesecohort, consistent with an altered metabolic state including increased protein synthesis, enhanced cell death fromproinflammatory or lipotoxic stimuli, and increased energy demands. A subset of pathway-specific genes acted asefficient predictors of obese or lean class membership when used in Naive Bayes or logistic regression basedclassifiers.
Conclusion: This study provides a comprehensive characterization of the whole blood transcriptome in obesityand demonstrates that the investigation of gene expression profiles from whole blood can inform and illustratethe biological processes related to regulation of body mass. Additionally, the ability of pathway-related geneexpression to predict class membership suggests the feasibility of a similar approach for identifying clinically usefulblood-based predictors of weight loss success following dietary or surgical interventions.
BackgroundWhile excess energy intake and declining energy expen-diture are clearly important contributors, individual sus-ceptibility to obesity is also strongly influenced bygenetic factors. Twin, adoption, and family studies haveindicated that 40-70% of inter-individual variation inbody mass index (BMI) is heritable [1,2]. A compen-dium of evidence for the genetic bases of obesity havebeen accrued from single-gene mutation studies, Men-delian inheritance patterns, transgenic and knockoutmurine models, animal and human quantitative trait loci
(QTL), candidate-gene association studies, and genomescan linkages and have been incorporated into the Obe-sity Gene Map database [3]. Also recently, a number ofgenome-wide association studies (GWAS) have demon-strated associations of single-nucleotide polymorphisms(SNPs) to qualitative and quantitative indices of adipos-ity in several populations [2,4-10]. A combination ofindependent studies and meta-analysis of existingGWAS data have implicated a total of 18 genetic loci asrelevant for body weight regulation to date [11].In addition to DNA sequence variants, genetic influ-
ences are also manifested through differences in genetranscription, leading to differential messenger RNAlevels. While such differences might be expected tooccur in biologically relevant tissues (muscle and adi-pose tissue in obesity, for example), several recent
* Correspondence: [email protected]; [email protected] Biotechnology Research Institute, North Carolina CentralUniversity, Durham, USA5University of Ottawa Heart Institute, Ottawa, CanadaFull list of author information is available at the end of the article
Ghosh et al. BMC Medical Genomics 2010, 3:56http://www.biomedcentral.com/1755-8794/3/56
© 2010 Ghosh et al; licensee BioMed Central Ltd. This is an Open Access article distributed under the terms of the Creative CommonsAttribution License (http://creativecommons.org/licenses/by/2.0), which permits unrestricted use, distribution, and reproduction inany medium, provided the original work is properly cited.
studies have demonstrated an alteration in the periph-eral blood transcriptome in diseases of non-hematologicorigin. These include disorders such as chronic fatiguesyndrome, schizophrenia and colon cancer [12-17].Additionally, the blood transcriptome has also beenfound to be responsive to diverse environmental andsocio-economic stimuli including ionizing radiation incancer therapy, benzene exposure, socio-economic sta-tus, etc. [18-21]. These findings raise the intriguing pos-sibility that blood transcriptome profiles might provide avalid biological readout for otherwise hard to study dis-ease processes in humans and additionally generateinformation of high predictive and diagnostic content.In line with this argument, we postulated that differ-ences in transcript abundance might also occur in bloodfrom obese subjects compared to lean subjects, as a con-sequence of either pre-existing genetic variations, or asan adaptive response to obesity, independent of thegenetic background. To test this hypothesis, we havecarried out transcriptional profiling of peripheral bloodfrom obese subjects and well-matched lean controls andconducted enrichment analysis to identify biologicalpathways that are preferentially associated with obesity.Our study demonstrates significant gene expression dif-ferences in blood from obese subjects compared to leancontrols, particularly along the lines of differentialexpression of genes in key metabolic pathways regulat-ing cell survival, protein synthesis and energy harvest.These findings are important on three levels. First, ourresults demonstrate the importance of blood as a biolo-gically informative tissue in the elucidation of the obesestate. Second, as differences in gene expression are oftendriven by sequence variants in gene regulatory regions,our study provides a mechanism for the selection ofobesity-associated candidate genes for the determinationof possible regulatory sequence variants. Finally, theidentification of adiposity related gene expression differ-ences in a clinically accessible tissue such as blood leadsthe way for the determination of biomarkers of weightregulation that could be implemented in a clinicalsetting.
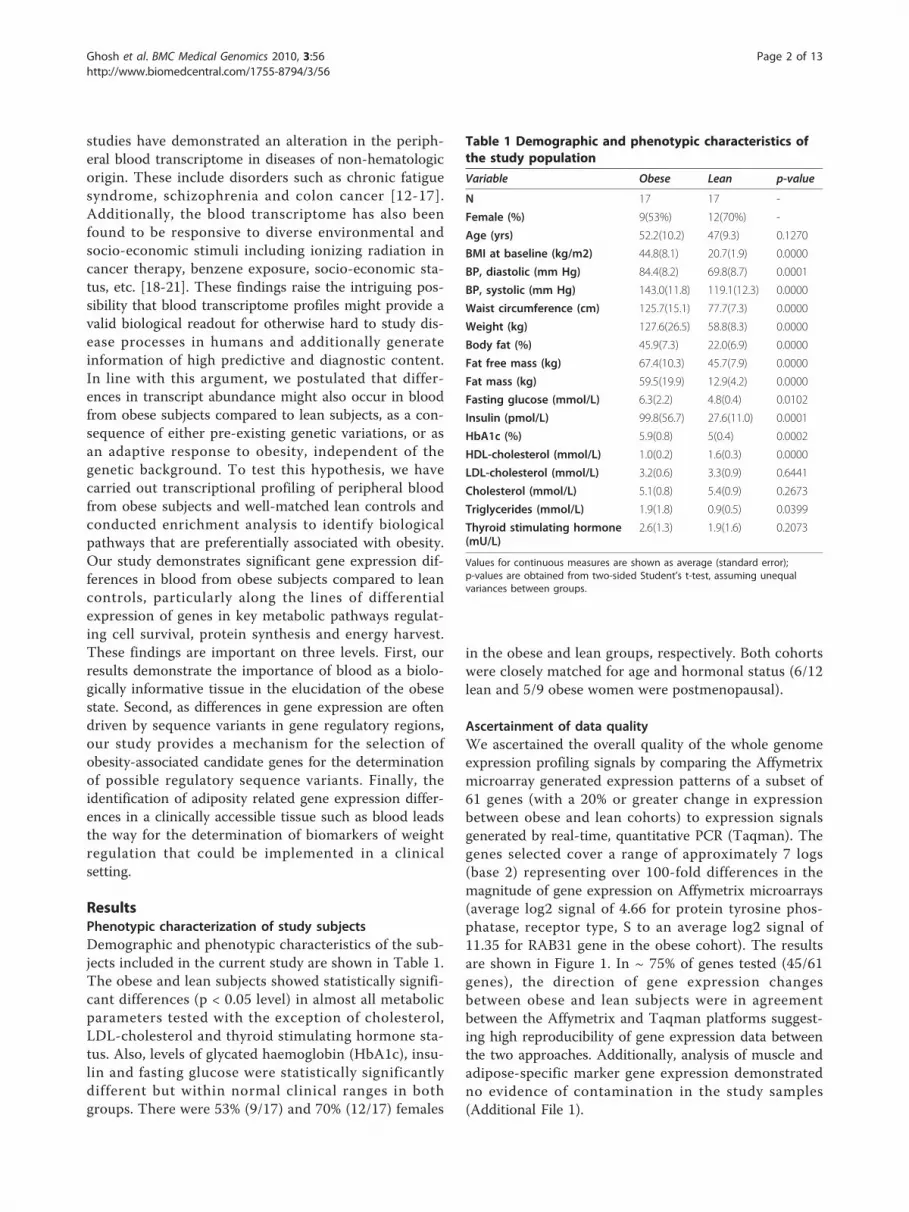
ResultsPhenotypic characterization of study subjectsDemographic and phenotypic characteristics of the sub-jects included in the current study are shown in Table 1.The obese and lean subjects showed statistically signifi-cant differences (p < 0.05 level) in almost all metabolicparameters tested with the exception of cholesterol,LDL-cholesterol and thyroid stimulating hormone sta-tus. Also, levels of glycated haemoglobin (HbA1c), insu-lin and fasting glucose were statistically significantlydifferent but within normal clinical ranges in bothgroups. There were 53% (9/17) and 70% (12/17) females
in the obese and lean groups, respectively. Both cohortswere closely matched for age and hormonal status (6/12lean and 5/9 obese women were postmenopausal).
Ascertainment of data qualityWe ascertained the overall quality of the whole genomeexpression profiling signals by comparing the Affymetrixmicroarray generated expression patterns of a subset of61 genes (with a 20% or greater change in expressionbetween obese and lean cohorts) to expression signalsgenerated by real-time, quantitative PCR (Taqman). Thegenes selected cover a range of approximately 7 logs(base 2) representing over 100-fold differences in themagnitude of gene expression on Affymetrix microarrays(average log2 signal of 4.66 for protein tyrosine phos-phatase, receptor type, S to an average log2 signal of11.35 for RAB31 gene in the obese cohort). The resultsare shown in Figure 1. In ~ 75% of genes tested (45/61genes), the direction of gene expression changesbetween obese and lean subjects were in agreementbetween the Affymetrix and Taqman platforms suggest-ing high reproducibility of gene expression data betweenthe two approaches. Additionally, analysis of muscle andadipose-specific marker gene expression demonstratedno evidence of contamination in the study samples(Additional File 1).
Table 1 Demographic and phenotypic characteristics ofthe study population
Variable Obese Lean p-value
N 17 17 -
Female (%) 9(53%) 12(70%) -
Age (yrs) 52.2(10.2) 47(9.3) 0.1270
BMI at baseline (kg/m2) 44.8(8.1) 20.7(1.9) 0.0000
BP, diastolic (mm Hg) 84.4(8.2) 69.8(8.7) 0.0001
BP, systolic (mm Hg) 143.0(11.8) 119.1(12.3) 0.0000
Waist circumference (cm) 125.7(15.1) 77.7(7.3) 0.0000
Weight (kg) 127.6(26.5) 58.8(8.3) 0.0000
Body fat (%) 45.9(7.3) 22.0(6.9) 0.0000
Fat free mass (kg) 67.4(10.3) 45.7(7.9) 0.0000
Fat mass (kg) 59.5(19.9) 12.9(4.2) 0.0000
Fasting glucose (mmol/L) 6.3(2.2) 4.8(0.4) 0.0102
Insulin (pmol/L) 99.8(56.7) 27.6(11.0) 0.0001
HbA1c (%) 5.9(0.8) 5(0.4) 0.0002
HDL-cholesterol (mmol/L) 1.0(0.2) 1.6(0.3) 0.0000
LDL-cholesterol (mmol/L) 3.2(0.6) 3.3(0.9) 0.6441
Cholesterol (mmol/L) 5.1(0.8) 5.4(0.9) 0.2673
Triglycerides (mmol/L) 1.9(1.8) 0.9(0.5) 0.0399
Thyroid stimulating hormone(mU/L)
2.6(1.3) 1.9(1.6) 0.2073
Values for continuous measures are shown as average (standard error);p-values are obtained from two-sided Student’s t-test, assuming unequalvariances between groups.
Ghosh et al. BMC Medical Genomics 2010, 3:56http://www.biomedcentral.com/1755-8794/3/56
Page 2 of 13

Principal components analysis of gene expression dataWe performed multivariate, principal components analy-sis to determine whether blood gene expression signalswere capable of distinguishing between the obese andlean subjects. Figure 2 shows a scatterplot representingthe first two principal components based on geneexpression profiles from 17 obese and 17 lean subjects.Analysis of the principal component model performanceindicated that 27% of the total variance in gene expres-sion was modelled in the first principal component(R2X) with a cross-validated prediction of 22.4%. Thecross-validation results indicate that the variability cap-tured in the first component is statistically greater thanthe significance limit of 2.9% (Additional file 2).
Identification of differentially expressed genesGenes showing differential expression between the obeseand lean subjects were identified via the ComparativeMarker Selection module in GenePattern [22], using thesignal-to-noise algorithm for ranking genes. A permuta-tion testing was performed to compute the significance(nominal p-value) of the rank assigned to each gene.A false discovery rate (FDR) was also calculated to con-trol for multiple testing. A total of 12127 probesets weredetected above background (set to 50 units) amongwhich 374 probesetes were overexpressed (2-fold orgreater) and 75 probesets were underexpressed (2-foldor greater) in the obese samples compared to the leans.The results of the differential gene analysis are pre-sented in Additional Files 3 and 4. Inspection of thegene list showed that a majority of the genes upregu-lated in the obese subjects were genes known to beselectively expressed in erythrocytes/reticulocytes. Theseincluded genes such as carbonic anhydrase, ferrochela-tase, synuclein, glycophorin B, etc. This finding is con-sistent with previous observations of higher red bloodcell counts (hematocrit) in obesity [23-26] and providesevidence for the expansion of transcriptionally activereticulocytes in obesity. Conversely, several genes relatedto immune function showed reduced expression in theobese subjects.
Pathway analysis of gene expression difference betweenlean and obese subjectsThe transcriptome data was next subjected to bioinfor-matic pathway analysis by the Gene Set EnrichmentAnalysis (GSEA) algorithm [27]. The values for theGSEA algorithmic parameters used in the current studyare indicated in Additional File 5 and details about theGSEA algorithm have been explained in Materials andMethods. Pathway analysis was conducted either withthe Kyoto Encyclopedia for Genes and Genomes(KEGG) metabolic pathway database [28], or a user-created custom database consisting of pathways drawn
Figure 1 Comparison of gene expression signals generated byAffymetrix microarrays and quantitative real-time PCR. Geneexpression signals were generated by real-time, quantitative PCR(Taqman, black bars) and oligonucleotide microarrays (Affymetrix,white bars). Overexpression or underexpression of a gene in theobese and lean cohorts is expressed as a log ratio, to the base 2.Affymetrix and Taqman based results for each gene are shown as astacked bar. For each gene, agreement between the results fromthe two platforms is indicated when both white and black bars lieon the same side of the zero (0) value on the log ratio axis;conversely, disagreement is indicated when the gray and black barslie on opposite sides. The overall agreement between the twoplatforms was 85% (45/53 genes showed agreement in thedirection of differential expression).
Ghosh et al. BMC Medical Genomics 2010, 3:56http://www.biomedcentral.com/1755-8794/3/56
Page 3 of 13

from several sources (Additional File 6). Pathways wereevaluated by their normalized enrichment score (NES),nominal p-values (permuted) and false discovery rates,as described in [29].KEGG Pathway analysisEnrichment analysis of gene expression profiles againstKEGG pathways identified 5 pathways at ppermuted <0.05 level (Additional File 7). Notable among them werethe ’apoptosis’, ‘ribosome’, and ‘oxidative phosphoryla-tion’ pathways. The pathway enrichment plots andexpression profiles of a subset of genes contributing sig-nificantly to the enrichment of these 3 pathways are col-lectively shown in Figure 3. A number of genes,including apoptotic protease activating factor 1, baculo-viral IAP repeat containing 2, caspase 7, Fas, interleukin1 beta, interleukin 1 receptor associated kinase 4, etc.contributed to the core enrichment of the ‘apoptosis’pathway in the obese subjects (Additional File 8).Enrichment of the ribosome pathway was effected by
coordinate upregulation of several ribosomal proteingenes (ribosomal protein L31, S7, S24, L35, L7 forexample). Several genes involved in the mitochondrialprocess of electron transfer and ATP synthesis demon-strated increased expression in the obese cohort leadingto a significant enrichment of the ‘oxidative phosphory-lation’ pathway in this group. Some of the genes contri-buting to core enrichment of this pathway includedcytochrome c oxidase subunits 6C, 7B and 7C, NADH-coenzyme Q reductase, NADH deyhdrogenase beta sub-complex 3, etc.Custom Pathway analysisIn addition to investigating pathway enrichment basedon the KEGG database, we also subjected a set of ‘cus-tom’ pathways to analysis by GSEA (Additional File 6).GSEA analysis of the custom pathways identified 2 path-ways as significantly upregulated in the obese, at a nom-inal p-value < 5% and FDR < 5%. These were the‘electron transport chain pathway’ and the ‘erythrocyte/
Figure 2 Multivariate analysis of obese and lean subjects based on gene expression signals. Principal component analysis (PCA) wasperformed on lean and obese subjects based on 12128 Affymetrix probe-set signals. A scatterplot of the first two principal componentsdemonstrate a general separation of the obese and lean phenotypes along the first principal component (PC1). Model parameters are as follows:Further details on the PCA model parameters are included in Supplemental Table 2.
Ghosh et al. BMC Medical Genomics 2010, 3:56http://www.biomedcentral.com/1755-8794/3/56
Page 4 of 13
reticulocytespecific_affytechnote’ pathways (AdditionalFile 9). The ‘electron transport chain pathway’ (NationalCancer Institute Pathway Interaction Database [30]) is asubset of the KEGG ‘oxidative phosphorylation’ pathway.The ‘erythrocyte/reticulocytespecific_affytechnote’ path-way consists of genes reported to be selectively enrichedfor expression in erythrocytes/reticulocytes (Affymetrix,[31,32]). Identification of this gene-set as an obesity-upregulated pathway further supports our earlier obser-vation of increased expression of individual erythrocyte/reticulocyte specific genes in the obese subjects. Detailsare provided in Additional Files 10 and 11.Effects of gender on pathway enrichmentSince our study cohort contained both male and femalesubjects, the contribution of gender to pathway enrich-ment was investigated. To determine whether pathwayranks were influenced by gender, we carried out inde-pendent gene-set enrichment analyses on subgroupscomprised of female or male subjects only. We com-pared the relative ranks of the KEGG pathways in thethree analyses as an indication of their sensitivity togender. ‘Apoptosis’ was ranked 7th, 8th and 3rd and ‘oxi-dative phosphorylation’ was ranked 10th, 12th and 18th
for All subjects, Females and Males respectively. The‘ribosome’ pathway was the top ranked pathway for Allsubjects and Females analysis, but was ranked 27th inthe analysis involving the Males. We repeated the samesubgroup analyses on the custom pathway set and in allcases the ‘electron transport chain pathway’ and the‘erythrocyte/reticulocytespecific_affytechnote’ pathwaysremained the top 2 ranked pathways for all groupstested. Details are provided in Additional File 12.Effect of cell populations on pathway enrichmentSince whole-blood consists of a mixture of various celltypes, we investigated the relation between the observedenrichment in “ribosome”, “apoptosis” and “oxidativephosphorylation” pathways in the obese and enrichmentof reticulocytes/erythrocytes in obese subjects as pre-viously reported [23-26]. We scaled the gene expressiondata independently by the expression of 2 erythrocyte-spe-cific transcripts, hemoglobin D (HBD) and erythrocytemembrane protein, band 2 (EMPB2) and subjected thescaled data to gene-set enrichment analysis. Of the original3 pathways found to be enriched in the obese subjects, the“ribosome” pathway was still the top differentiallyexpressed pathway with both unscaled and scaled data.However, the “apoptosis” and “oxidative phosphorylation”pathways were no longer significantly enriched, with eitherof the scaled datasets. Pathway enrichment results withscaled data are provided in Additional File 13.
Class prediction via blood gene expressionWe next examined whether biological pathways impli-cated from gene-set enrichment analysis of the current
study could provide a set of mechanism-based gene pre-dictors that would be capable of predicting obese andlean subjects with high accuracy. We created an initial,inclusive set containing all genes (features) belonging tothe ribosome, apoptosis or oxidative phosphorylationpathways (183 genes). Since this list was also likely tocontain redundant and non-informative genes, weapplied two independent feature selection algorithms toidentify a smaller set of genes that would be capable ofdistinguishing between the obese and lean phenotypeswith high success rates, based on the metrics specific tothe two algorithms used (described in detail in Materialsand Methods). A search for overlapping genes scoringhigh in both algorithms (ranked within the top 20 genesin both) resulted in a set of 11 genes. The logged geneexpression signals from the full (183) and filtered (11)gene-sets were then used as inputs into four differentclassifiers representing distinct algorithmic approachesto classification and prediction. These included theNaive Bayes, Logistic Regression, Random Forests andZeroR classifiers. A full description of the classifiers ispresented in Materials and Methods and Additional File14. Each classifier was first trained on a randomlyselected 66% of the samples and then used to predictthe class for the remaining 33% samples. The processwas repeated 100 times for each classifier. Classifier per-formance was evaluated by four parameters (true posi-tive, true negative, false positive and false negativerates). A description of the performance evaluators canbe found in Additional File 14. The classifier ZeroR sim-ply predicts the same class for all instances and wasused as a baseline classifier. Any classifier should per-form significantly better than ZeroR in order to be con-sidered useful. Table 2 compares the performance of thefour classifiers with either the full gene-set (183 genes)or the filtered set (11 genes). For each of the four per-formance evaluators, we plotted the average and stan-dard deviation values for the four parameters over the100 iterations. Overall, the Naïve Bayes and logisticregression classifiers performed better than the decision-tree based classifier (Random Forests) and all three clas-sifiers performed significantly better than ZeroR.A comparison of the classifier results with the full (183)or filtered (11) gene-set inputs showed that both inputshad similar true positive and false negative rates. BothNaïve Bayes and logistic regression classifiers displayedhigh sensitivity as indicated by true positive rates closeto 1.0. These two classifiers also demonstrated lowerfalse-positive rates with the filtered gene set comparedto the full gene set. Additionally, the filtered gene setclassifiers displayed higher specificities (true negativerates) compared to the full gene set based classifiers.Based on these results, we found the 11-gene basedNaïve Bayes or logistic regression based classifiers to
Ghosh et al. BMC Medical Genomics 2010, 3:56http://www.biomedcentral.com/1755-8794/3/56
Page 5 of 13

perform better compared to the 183-gene classifiers forpredicting class membership. The identities of the 11genes are shown in Table 3 and appear to be primarilycomposed of genes from the oxidative phosphorylationand apoptosis pathways.
DiscussionOur study demonstrates significant gene expression dif-ferences in whole blood from age-matched obese andlean subjects of Northern European White geneticancestry. These differences further lead to the identifica-tion of differentially enriched biological pathways inobesity and lead to an increased appreciation and under-standing of genomic changes in whole blood related tobody mass expansion. The current study is not designedto resolve whether the observed transcriptional differ-ences are causal or caused, i.e. whether the differences
in gene expression are related to the development ofobesity or reflect an adaptive mechanism in response toincreased body mass. Although blood is usually not con-sidered to be a target organ for obesity, certain observa-tions are pertinent. First, the physiological role of bloodas a sentinel tissue and a systemic integrator of tissueand organ-level perturbations could lead to adaptiveresponses in response to major metabolic perturbationssuch as excessive build-up of body mass and the atten-dant increases in the demand for nutrient and oxygentransport. Secondly, the chronic low-grade tissue inflam-mation observed in obesity [33] is expected to have adirect effect on circulating leukocytes, including immunedysfunction and apoptosis. Finally, macrophages inblood share many functional and antigenic propertieswith preadipocytes and adipocytes and transcriptomeprofiles of preadipocytes are reportedly closer to the
Figure 3 Gene-set enrichment analysis. Gene-set enrichment analysis against the KEGG database for differentially enriched pathways in wholeblood between obese and lean subjects. Enrichment plots for the 3 pathways upregulated in the obese cohort are shown on the left side withthe relative gene positions indicated by the straight lines (line plot) under each graph. Lines clustered to the left represent higher ranked genesin the ranked list. Expression profiles for a subset of genes (shaded in yellow in the line plots) contributing to core enrichment for each pathwayare shown to the right as a heatmap. The heatmap compares subject-level gene expression in both obese and lean subjects. Gene expression isnormalized for each row. Lower levels of expression are represented in shades of blue and higher expression in red.
Ghosh et al. BMC Medical Genomics 2010, 3:56http://www.biomedcentral.com/1755-8794/3/56
Page 6 of 13

macrophages than to adipocytes [34]. In this context,our study provides the first detailed investigation of theblood transcriptome in relation to obesity and providesevidence in favor of its dynamic involvement in the pro-cess. It is important to note here that the between-group differences in gene expression were usually smalland there was considerable heterogeneity in individualgene expression values among subjects in the obese orlean categories. However, the between-group variationexceeded the within-group variation for several genesleading to statistically significant differences between thegroups. Additionally, as demonstrated by principal com-ponents analysis, blood gene expression profiles wereable to distinguish lean subjects from obese subjectseven when the subject classes were not exposed a priori(unsupervised clustering). Since gene expression mea-sures were used as input for the PCA analysis, theseresults suggest that the differences in blood transcriptlevels between obese and lean subjects were significantand informative enough to cause a separation betweenthe two classes.The application of pathway analysis provided addi-
tional information and insight into the biological pro-cesses that are differentially regulated in obese and leanblood samples. Some of the pathways with increasedcomponent transcript abundances included the “ribo-some”, “apoptosis” and “oxidative phosphorylation”pathways. Upregulation of the ribosomal pathway in theobese subjects was due to an increased expression ofseveral ribosomal protein-encoding genes, indicative ofenhanced protein synthesis in blood cells, possibly as aconsequence of enhanced metabolic demands in theobese state. This observation is consistent with a recentreport that links ribosomal RNA synthesis to cellularenergy supply through activation of the AMP-activatedprotein kinase [35]. The presence of increased apoptosisin the obese phenotype has also been well documentedin animal and human cell culture models. For example,increased cardiomyocyte apoptosis has been reported inleptin-deficient ob/ob mice and leptin-resistant db/dbmice [36]. Prolonged exposure to free fatty acids alsohave pro-apoptotic effects on human pancreatic islets[37] and circulating cytokines, such as tumor necrosisfactor alpha (TNF-a) have been reported to induce
apoptosis in cultured human preadipocytes and adipo-cytes [38]. Our findings now provide evidence for activa-tion of a similar apoptotic program in blood from obesesubjects. While the current study does not allow us topinpoint the cause of the enhanced apoptosis, we specu-late that obesity-associated chronic inflammation [39,40]or lipotoxicity are contributing factors. Finally, theobserved upregulation of the ‘oxidative phosphorylation’pathway in obese subjects is consistent with a responseto increased energy demands in obese subjects. Func-tional and gene expression studies have previously indi-cated impairment in oxidative phosphorylation andmitochondrial function in subjects with type 2 diabetescompared to controls [29,41,42]. Our findings are con-sistent with Takamura et al., who demonstrated anupregulation of oxidative phosphorylation genes in thelivers of obese, type 2 diabetic patients compared tonon-obese diabetics [43]. More interestingly, our find-ings now point to a similar involvement of energy-har-vesting mechanisms in obese blood and provide furtherevidence in favor of a role for mitochondrial dysfunctionin obesity [44,45]. A gender-based sub-analysis demon-strated relative stability of the “apoptosis” and “oxidativephosphorylation” pathway ranks in both genders; in con-trast, the “ribosome” pathway differed significantly inrank between females and males, suggesting a gender-
Table 2 Classification of lean and obese subjects
True Positive Rate (Sensitivity) False Positive Rate True Negative Rate (Specificity) False Negative Rate
Classifier Full Filtered Full Filtered Full Filtered Full Filtered
Naïve Bayes 0.96 (0.09) 0.93 (0.08) 0.18 (0.16) 0.003 (0.02) 0.82 (0.17) 0.99 (0.02) 0.03 (0.09) 0.06 (0.08)
Logistic Regression 0.98 (0.04) 0.95 (0.07) 0.11 (0.16) 0.01 (0.03) 0.89 (0.16) 0.99 (0.03) 0.01 (0.04) 0.05 (0.08)
Random Forests 0.95 (0.09) 0.94 (0.11) 0.17 (0.17) 0.10 (0.14) 0.83 (0.17) 0.89 (0.14) 0.05 (0.09) 0.06 (0.11)
ZeroR 0.81 (0.39) 0.81 (0.39) 0.81 (0.39) 0.81 (0.39) 0.19 (0.39) 0.19 (0.39) 0.19 (0.39) 0.19 (0.39)
Comparison of classifier performance for predicting obese and lean phenotype with a full (183 genes) or filtered (11 gene) gene inputs
Table 3 Identity of genes constituting the 11-geneclassifier
ProbesetID GeneName
202110_at cytochrome c oxidase subunit VIIb
208746_x_at ATP synthase, H+ transporting, mitochondrial F0 complex,subunit G
202875_s_at ATPase, H+ transporting, lysosomal 42kDa, V1 subunit C1
215719_x_at Fas (TNF receptor superfamily, member 6)
201134_x_at cytochrome c oxidase subunit VIIc
201783_s_at v-rel reticuloendotheliosis viral oncogene homolog A
202076_at baculoviral IAP repeat-containing 2
208737_at ATPase, H+ transporting, lysosomal 13kDa, V1 subunit Gisoform 1
202429_s_at protein phosphatase 3 (formerly 2B), catalytic subunit,alpha isoform
206752_s_at DNA fragmentation factor, 40kDa, beta polypeptide
213052_at protein kinase, cAMP-dependent, regulatory, type II, alpha
Ghosh et al. BMC Medical Genomics 2010, 3:56http://www.biomedcentral.com/1755-8794/3/56
Page 7 of 13

specific effect (Additional File 7). Since a majority ofgenes upregulated in the obese subjects are highlyexpressed in erythrocytes and reticulocytes, we scaledthe gene expression data independently by the expres-sion of two erythrocyte-specific transcripts, hemoglobinD (HBD) and erythrocyte membrane protein, band 2(EMPB2) and subjected the scaled data to gene-setenrichment analysis. Of the three pathways found to bedifferentially upregulated in the obese subjects, the“ribosome” pathway remained the top differentiallyexpressed pathway (with the scaled data) whereas the“apoptosis” and “oxidative phosphorylation” pathwayswere no longer significantly enriched, with either of thescaled datasets. These findings suggest that an increasein erythrocyte/reticulocyte numbers in the obese (differ-ential hematocrit) is a possible explanatory mechanismfor the observed increase in transcript levels for “apop-tosis” and “oxidative phosphorylation” in the obese sub-jects. The results for the “ribosome” pathway, incontrast, suggest a significant upregulation of the tran-scripts for the component genes of this pathway in theobese subjects, even after adjustment for erythrocyte-specific gene expression. We note one caveat to thescaling approach used here for investigating cell numbereffects. Since the same amount of cRNA was used fromeach sample for hybridization, the relative enrichment ofcell types is expected to have a real effect on geneexpression only for genes that are differentiallyexpressed among the cell types (e.g. hemoglobin tran-scripts that are expressed only in reticulocytes and notlymphocytes). For genes expressed at comparable levelsacross cell types, the differential cell type representationshould not have an effect on expression unless there is atrue upregulation or downregulation of these genesbetween the two groups (although the cellular origin forthe differential expression may not be known). Scalingthe gene expression data by the expression of reticulo-cyte/erythrocyte specific genes cannot distinguishbetween the above two mechanisms of enhanced geneexpression and can lead to potentially incorrect conclu-sions. However, our results clearly demonstrate thatinter-individual variations in hematocrit, especiallybetween obese and lean subjects, may affect interpreta-tion of expression data and should be considered as animportant co-variate in future studies.Several recent publications have reported on the suc-
cessful application of gene expression signatures as clas-sifiers or predictors of phenotypic class, diseaseprogression and therapeutic prognosis, primarily in thearea of diagnosis and treatment of several types of can-cers [16,46-48]. However, the biological mechanismslinking the predictive genes to the outcomes being pre-dicted are not always clear. This lack of mechanism hasoften been criticized as a barrier to the clinical utility of
the gene predictors. One solution to the problem is tochoose gene predictors from biological pathways asso-ciated a priori with the phenotype or outcome of inter-est. This approach was pursued in this study and led tothe identification of an 11-gene based classifier thatcould distinguish and predict obese and lean subjectswith high accuracy. Our motivation for this exercise wasto provide proof-of-concept data to test if blood geneexpression patterns can have predictive value in thecontext of obesity. While such prediction is not necessa-rily required for distinguishing obesity from leanness,blood based gene biomarkers can significantly advancethe clinical management of obesity by, for example,allowing the prediction of weight loss success from dietor bariatric surgery.One potential downstream application of differential
gene expression analysis in whole-blood is the selectionof candidate genes with possible regulatory polymorph-isms (single nucleotide polymorphisms in promoterregions, for example) that associate with obesity andhelp explain the observed differences in expression.Comprehensive sequencing of the regulatory regions ofsuch candidate genes are expected to yield additionalinsights into the genetics of obesity such as the identifi-cation of expression QTLs (eQTLs). While a direct sub-ject-level association of gene regulatory polymorphismsto gene expression levels is outside the scope of the cur-rent work, we conducted a preliminary analysis of theexistence of putative regulatory variants in the 11 genepredictors identified in our analysis. Based on data fromthe NCBI dbSNP database (Build 131), several genescontained common sequence variants near the 5’-end ofthe gene spanning a region 2000 bases upstream of thestart codon (SNPs rs2515192 and rs3019164 forATP6V1C1, rs1317775 and rs1318199 for BIRC2,rs11709092 for PRKAR2A, etc.). It is reasonable to spec-ulate that a subset of these upstream sequence variantscould influence transcription.Our study relied on whole-blood collected in PAX-
gene tubes instead of peripheral blood mononuclearcells (PBMCs), consistent with our ultimate goal ofidentifying clinically relevant and useful predictors ofweight loss success. This procedure, however, has thedisadvantage of investigating a relatively heterogeneouscell population where noise could mask gene expressiondifferences in specific cell types. PBMC’s, consisting oflymphocytes and monocytes provide a consistent andhomogeneous sample for transcriptome analysis. How-ever, the extra fractionation procedure for PBMCsrequires a prolonged period before RNA stabilizationleading to significant ex vivo changes in gene expressionprofiling [49]. Additionally, compared to whole blood,several cell types including neutrophils, basophils, eosi-nophils, platelets, reticulocytes and erythrocytes are
Ghosh et al. BMC Medical Genomics 2010, 3:56http://www.biomedcentral.com/1755-8794/3/56
Page 8 of 13

depleted in PBMCs which lead to loss of importanttranscription information. On the other hand, PAX sam-ples show a decrease in the number of expressed genesand lower gene expression values with higher variabilitycompared to the PBMCs [50], primarily due to the highabundance of globin transcripts that constitute over 70%of whole blood mRNA [51]. However, the PAXgene sys-tem employs an easy way to collect, store, transport andstabilize RNA from whole blood and based on our over-all goals, was the method of choice for our analysis. Inthis context, the ability of gene expression signaturesfrom biologically relevant pathways to accurately classifyand predict obese and lean classes, as observed in thisstudy, provides further validation of our approach andsuggests future suitability of the PAXgene based wholeblood transcriptome for yielding clinically usable bio-markers related to weight regulation. Additional sensi-tivity could be obtained in future studies via selectivereduction of the globin transcript from whole bloodRNA samples [52,53].There are the following limitations to the current
study. First, since the study employed whole blood, therelative contribution of the number and transcriptionalprograms in specific cell types towards the observedgene expression differences cannot be clearly delineated.Second, the relatively small sample sizes reduced thepower for detection of subtle differences in expression.Also, due to small sample numbers, we had to rely oncross-validation methods for calculation of predictionerrors instead of testing candidate predictors on newsamples. The possibility of over-fitting cannot, therefore,be entirely ruled out.
ConclusionsGene expression profiling in whole blood demonstratedsignificant differences in transcript levels that were cap-able of separating obese and lean phenotypes in multi-variate analysis. Gene-set enrichment analysis furtheridentified differences in biological pathways relating tocell survival, protein synthesis and energy harvestbetween the obese and lean groups. A subset of genesresponsible for pathway enrichment also acted as effi-cient predictors of phenotype (obese or lean) when theirexpression signatures were used as inputs to NaiveBayes or logistic regression based classifiers. Together,our study is the first to investigate the information con-tent in whole blood in relation to obesity. Our findingsdemonstrate that the investigation of gene expressionprofiles from whole blood can inform and illustrate thebiological processes related to regulation of body mass.Additionally, the ability of pathway-related gene expres-sion to predict class membership suggests the feasibilityof a similar approach to identify blood-based robust
predictors of weight loss success in response to dietaryand surgical interventions.
MethodsStudy SubjectsTwenty consecutive obese subjects enrolled in theOttawa Hospital Weight Management Program at theOttawa Hospital, Ottawa, with a body mass index (BMI)of 30-50 kg/m2, were recruited for study. All subjectswere of Northern European White genetic ancestry.Patients were excluded on the basis of medical condi-tions possibly affecting whole blood gene expression,including out of normal range thyroid indices (TSH,free T3) at week 1 or week 13, diabetes mellitus treatedwith insulin or oral hypoglycemic agents, cigarettesmoking, congestive heart failure, obstructive sleepapnea, active malignancy. Patients treated with weight-altering medications including tricyclic antidepressants,paroxetine, mirtazepine, lithium, valproate, gabapentinand typical and atypical antipsychotics, fluoxetine indoses greater than 20mg, bupropion, topiramate, sys-temic glucocorticoids and weight management drugswere also excluded. Blood samples were collected atbaseline prior to initiation of weight loss therapy.Twenty lean subjects from the same genetic ancestry(Northern European White), with a BMI ≤ the 10th per-centile for age and sex and no prior history of havinghad a BMI> 25th percentile for more than a 2 year con-secutive period, were recruited from the Ottawa com-munity. Lean subjects were excluded if they had anymedical conditions affecting weight gain such ashyperthyroidism, anorexia nervosa, bulimia, majordepression, or malabsorption syndromes. BMI for obeseand lean subjects was categorized according to thepopulation percentiles for age and sex using the Cana-dian Heart Health Survey data for subjects over the ageof 18 years (data on file; Health Canada). The study pro-tocol was approved by the Human Research EthicsCommittees of the Ottawa Hospital and the Universityof Ottawa Heart Institute and informed consent wasobtained from all participants prior to their enrollinginto the program.
Sample preparation for transcriptome analysis2.5 ml of fasting whole blood was drawn from studysubjects by standard venipuncture and directly trans-ferred to PAXgene blood RNA tubes (Qiagen, SantaClara, CA). PAXgene tubes were processed at designatedtimes after phlebotomy by the PAXgene protocol. Isola-tion of total RNA was accomplished according to themanufacturer’s instructions. Prior to further processing,RNA quality was ascertained by electropherograms onthe Agilent 2100 Bioanalyzer. Extracted RNA from all
Ghosh et al. BMC Medical Genomics 2010, 3:56http://www.biomedcentral.com/1755-8794/3/56
Page 9 of 13

samples was stored -70°C until processed for microarrayhybridizations.
Microarray hybridization and data analysisHybridization of 100 nanograms of labeled cRNA fromeach sample was carried out on Affymetrix GeneChip®Human Genome U133 Plus 2.0 Arrays according to themanufacturer’s instructions. Microarray data was depos-ited in the Gene Expression Omnibus data repository(accession number GSE18897). Gene expression signalswere generated from hybridized and scanned Affymetrixarrays by the GC-RMA algorithm [54]. Probesets with anormalized average expression level of less than 50 unitsin all of the tested groups were eliminated from furtheranalysis. Significance of differential gene expression wasascertained via the signal-to-noise algorithm from theGenePattern Comparative Marker Selection module [22],employing a permutation-based t-test and false discoveryrate (FDR) control. The Signal-to-Noise feature selectionmethod is a variation of the more commonly used t-teststatistic and looks at the difference of the means in eachof the classes scaled by the sum of the standard devia-tions: Sx = (μ0-μ1)/(s0 + s1) where μ0 is the mean ofclass 0 and s0 is the standard deviation of class 0. TheSignal-to-Noise statistic penalizes genes that have highervariance in each class more than those genes that have ahigh variance in one class and a low variance in another.
Pathway analysisBioinformatic pathway analysis was conducted with theGene Set Enrichment Analysis (GSEA) software package[27,55]. GSEA is a computational method to detect sta-tistically significant, concordant differences in a prioridefined gene sets (pathways) between two biologicalstates. GSEA accomplishes this task by calculating aweighted Kolmogorov-Smirnov statistic, adjusted forgene-set size (known as the Normalized EnrichmentScore, NES) for each gene-set, based on the over-repre-sentation of members of a gene-set towards the top orbottom of a list of genes ranked by the strength of theircorrelation (positive or negative) to one of the two phe-notypes. The statistical significance of NES score is esti-mated by a permutation test based on random shufflingof the phenotype or tag (gene) labels. GSEA addressesthe problem of multiple testing (testing hundreds ofgene-sets simultaneously) by calculating a false-discoveryrate and a family-wise error rate on the ES p-values.
Quantitative real time polymerase chain reaction (RT-PCR)Whole blood was collected in PAXgene™ blood tubes(Qiagen, Santa Clara, CA) and total RNA was extractedusing the PAXgene™ blood kit. All RNA was treatedwith DNase I to remove genomic DNA contamination.The RNA was converted to cDNA in a 96-well
microtiter plate on an ABI PRISM 7700 SequenceDetector System (Applied Biosystems, Foster City, CA)using the Applied Biosystems High Capacity cDNAarchive kit. Gene expression was conducted on theApplied Biosystems 7900 using TaqMan® RT-PCR tech-nology. A global median absolute deviation (MAD) wascomputed from the gene expression values by taking themedian deviation for each set of technical replicates,using either the Ct values or log2 calculated abundances.Outliers were defined as having more than five timesthe global MAD. Following technical and biological out-lier identification the data was normalized using refer-ence housekeeper genes. The mean Ct value of allreference genes across all samples ("global mean Ct”)was subtracted from the mean Ct value of all referencegenes within each sample ("sample reference mean”) todetermine a normalization factor for each sample. Thenormalization factor for a given sample was then sub-tracted from its Ct value resulting in a normalized Ct.All Ct values were then converted to log2 abundances.
Class Prediction from gene expressionClass prediction (obese or lean) from gene expressiondata was carried out through the WEKA Explorer andWEKA Experimenter applications. First, 183 genesbelonging to the 3 obese-upregulated pathways (ribo-some, apoptosis and oxidative phosphorylation) wereused to identify a subset of maximally informative fea-tures (genes) for classifier testing while removing irrele-vant or redundant features that could negatively impactalgorithm performance. Feature selection was accom-plished by two independent ‘filtering-based’ algorithms(Information Gain and Cfs Subset Evaluator) and using10-fold cross validation for each method [56,57]. We didnot use ‘wrapper-based’ feature-selection because wewanted the selected features to be independent of classi-fication algorithms [58]. Both procedures resulted in alist of genes that were then ranked based on theirimportance in each feature selection method. Fromthese ranked lists, we selected a total of 11 genes thatwere ranked within the top 20 genes in both lists. Geneexpression signals for these 11 genes were then used asinput in 4 different classifiers (Naïve Bayes, LogisticRegression, Random Forests and ZeroR) representing 4different algorithmic approaches (Bayesian, regression,decision trees and rule-based, respectively) which wereindependently tested for predictive performance (Addi-tional File 13) [59,60]. Classifer-specific parameters werekept at the defaults provided in WEKA Experimenter.Each classifier used 66% of the samples for training(from a total of 34 obese plus lean subjects) and 33% fortesting (chosen at random for each round) for a total of100 iterations. For each classifier, the true positive rate,true negative rate, false positive rate, and false negative
Ghosh et al. BMC Medical Genomics 2010, 3:56http://www.biomedcentral.com/1755-8794/3/56
Page 10 of 13

rates were calculated (average plus standard deviationover 100 iterations) and the values used to compareindividual classifiers for their predictive performance.
Additional material
Additional file 1: Comparison of expression of adipocyte andmuscle specific genes in whole blood samples utilized in thecurrent study. Data for adipocyte-specific and muscle-specific geneexpression was obtained from microarray data available on 79 differenttissues from the Genomics Institute of Novartis Research Foundationhttp://www.gnf.org. Relative expression in whole blood was alsoobtained from the same source. The average expression and standarddeviation in adipocyte-specific and muscle-specific gene expressionobserved in whole blood samples used in the current study
Additional file 2: PCA model output from multivariate analysis onobese and lean subjects based on whole blood gene expressionsignals. Analysis of performance of the PCA model separating obesefrom lean subjects based on blood gene expression signals.
Additional file 3: Top 100 differentially expressed genes in wholeblood from obese and lean subjects. Using the GenePattern algorithmhttp://www.broadinstitute.org/cancer/software/genepattern/ a list of thetop 50 upregulated and top 50 downregulated genes in obese and leansamples was generated and plotted on a heat-map for visualization.Higher expression levels are indicated in red and lower expression levelsare indicated in blue. Genes (rows) are indicated by their Affymetrixprobeset identifiers and samples (columns) are indicated by their obeseor lean categories.
Additional file 4: Differential gene expression analysis betweenobese and lean subjects from blood transcriptome data.Identification of top 200 differentially expressed genes between Obeseand Lean subjects using the Comparative Marker Selection module inGenePattern. Results for top 100 upregulated and top 100downregulated genes (Obese vs. Lean) are shown.
Additional file 5: Description and value ranges of the parametersused in gene-set enrichment analysis (GSEA) in the present study.For detailed explanation of parameters and acceptable value ranges,please see additional documentation at http://www.broadinstitute.org/gsea/doc/GSEAUserGuideFrame.html.
Additional file 6: Custom pathway database used in the GSEAstudies. Column 1 indicates the pathway name, column 2 indicates thesource for the pathway information. Subsequent columns represent thegene symbols for the genes constituting the pathway.
Additional file 7: List of pathways determined to be upregulated inthe Obese subjects compared to the Lean subjects and vice versa.These results were obtained by querying the pathways in the KEGGdatabase (> = 10 and < = 200 gene members) and using the GSEAalgorithm.
Additional file 8: List of gene members of the 3 pathways identifiedby GSEA as upregulated in obese subjects. List of genes in theoxidative phosphorylation, ribosome and apoptosis signaling pathwaysthat were expressed in blood from obese and lean subjects. The column‘Core Enrichment’ describes whether a gene contributed significantlytowards the enrichment of the respective pathway in the gene setenrichment analysis.
Additional file 9: List of pathways determined to be upregulated inthe Obese subjects compared to the Lean subjects and vice versa.These results were obtained by querying the pathways in a user-definedcustom database (> = 10 and < = 200 gene members) and using theGSEA algorithm.
Additional file 10: Expression patterns of genes reported to beenriched in erythrocyte/reticulocyte fraction among lean and obesesubjects. The average log2 expression signal in obese and lean subjects,differential expression (log ratio) and statistical significance of thedifferences in expression in the two groups are indicated.
Additional file 11: Overexpression of erythrocyte/reticulocyteenriched genes in obese blood samples. A scatter plot of log averageexpression of genes (x-axis) versus the differences of log expressionbetween the obese and lean cohorts (y-axis) was created (also known asa MA plot). Each gene is indicated by a gray dot with the exception ofgenes reported to be enriched in erythrocytes/reticulocytes (comparedto other blood cell types) which are shown as black pluses. A value of 0on the y-axis signifies no differences in gene expression between thelean and obese cohorts.
Additional file 12: Gene set enrichment analysis between obese andlean subjects considering male only or female only cohorts.Pathways are ranked in descending order of their enrichment for eachcomparison. Results with males only are shown first, followed by theresults with females only.
Additional file 13: Gene set enrichment analysis between obese andlean subjects after scaling of gene expression data by expressionlevels of erythrocyte membrane protein band 2 (EMPB2) andhemoglobin D (HBD) genes respectively. Pathways are ranked indescending order of enrichment. Top part refers to results obtained afterscaling with EMPB2; bottom part shows the results following scaling withHBD.
Additional file 14: Description of classifiers and classifierperformance evaluators used in the study. Brief descriptions of theNaïve Bayes, Logistic Regression, Random Forests and ZeroR classifiersalong with the feature selection algorithms used (Information Gain andCfs Subset evaluator) are given. Mathematical formulas for true and falsepositive and negative rates (classifier evaluation metrics) are alsoprovided.
AcknowledgementsThis work was conducted with a grant support from GlaxoSmithKline. Part ofthe study was supported by NIH grants NHLBI-5R25HL059868-10 and NIDDK-1R21DK088319-01 (Ghosh) and a grant from the Heart & Stroke Foundationof Ontario (NA-5413; McPherson, Dent and Harper).
Author details1Biomedical Biotechnology Research Institute, North Carolina CentralUniversity, Durham, USA. 2Ottawa Hospital Weight Management Clinic,Ottawa Hospital, Ottawa, Canada. 3Department of Biochemistry, Microbiologyand Immunology, Faculty of Medicine, University of Ottawa, Ottawa, Canada.4GlaxoSmithKline, Research Triangle Park, USA. 5University of Ottawa HeartInstitute, Ottawa, Canada.
Authors’ contributionsSG carried out the experimental design, data analysis, interpretation anddrafted the manuscript. RD provided phenotype information and samplesfor transcriptome analysis and edited the manuscript. MEH participated inexperimental design and interpretation of microarray data and manuscriptediting. SG(Gorman) performed the Taqman analysis. JS coordinated thesample management, RNA isolation and microarray hybridizations. RM hadoverall oversight of the study and helped prepare the final version of themanuscript. All authors read and approved the final manuscript.
Competing interestsThe authors SG, SG(Gorman), and JS are former or current employees ofGlaxoSmithKline and have equity in the company. The other authors (RD,RM, MEH) have no disclosures.
Received: 18 June 2010 Accepted: 1 December 2010Published: 1 December 2010
References1. Pausova Z, Gossard F, Gaudet D, Tremblay J, Kotchen TA, Cowley AW,
Hamet P: Heritability estimates of obesity measures in siblings with andwithout hypertension. Hypertension 2001, 38(1):41-47.
Ghosh et al. BMC Medical Genomics 2010, 3:56http://www.biomedcentral.com/1755-8794/3/56
Page 11 of 13
2. Wardle J, Carnell S, Haworth CM, Plomin R: Evidence for a strong geneticinfluence on childhood adiposity despite the force of the obesogenicenvironment. Am J Clin Nutr 2008, 87(2):398-404.
3. Rankinen T, Zuberi A, Chagnon YC, Weisnagel SJ, Argyropoulos G, Walts B,Perusse L, Bouchard C: The human obesity gene map: the 2005 update.Obesity (Silver Spring) 2006, 14(4):529-644.
4. Willer CJ, Speliotes EK, Loos RJ, Li S, Lindgren CM, Heid IM, Berndt SI,Elliott AL, Jackson AU, Lamina C, et al: Six new loci associated with bodymass index highlight a neuronal influence on body weight regulation.Nat Genet 2009, 41(1):25-34.
5. Thorleifsson G, Walters GB, Gudbjartsson DF, Steinthorsdottir V, Sulem P,Helgadottir A, Styrkarsdottir U, Gretarsdottir S, Thorlacius S, Jonsdottir I,et al: Genome-wide association yields new sequence variants at sevenloci that associate with measures of obesity. Nat Genet 2009, 41(1):18-24.
6. Meyre D, Delplanque J, Chevre JC, Lecoeur C, Lobbens S, Gallina S,Durand E, Vatin V, Degraeve F, Proenca C, et al: Genome-wide associationstudy for early-onset and morbid adult obesity identifies three new riskloci in European populations. Nat Genet 2009, 41(2):157-159.
7. Loos RJ, Lindgren CM, Li S, Wheeler E, Zhao JH, Prokopenko I, Inouye M,Freathy RM, Attwood AP, Beckmann JS, et al: Common variants near MC4Rare associated with fat mass, weight and risk of obesity. Nat Genet 2008,40(6):768-775.
8. Scuteri A, Sanna S, Wei-Min C, Uda M, Albai G, Strait J, Najjar S, Nagaraja R,Orrð M, Usala G, et al: Genome-Wide Association Scan Shows GeneticVariants in the FTO Gene Are Associated with Obesity-Related Traits. InPLoS Genetics. Volume 3. Public Library of Science; 2007:e115-1210.
9. Hinney A, Nguyen TT, Scherag A, Friedel S, Bronner G, Muller TD, Grallert H,Illig T, Wichmann HE, Rief W, et al: Genome wide association (GWA) studyfor early onset extreme obesity supports the role of fat mass andobesity associated gene (FTO) variants. PLoS ONE 2007, 2(12):e1361.
10. Frayling TM, Timpson NJ, Weedon MN, Zeggini E, Freathy RM, Lindgren CM,Perry JRB, Elliott KS, Lango H, Rayner NW, et al: A Common Variant in theFTO Gene Is Associated with Body Mass Index and Predisposes toChildhood and Adult Obesity. Science 2007, 316(5826):889-894.
11. Scherag A, Dina C, Hinney A, Vatin V, Scherag S, Vogel CI, Muller TD,Grallert H, Wichmann HE, Balkau B, et al: Two new Loci for body-weightregulation identified in a joint analysis of genome-wide associationstudies for early-onset extreme obesity in French and german studygroups. PLoS Genet 6(4):e1000916.
12. Glatt SJ, Everall IP, Kremen WS, Corbeil J, Šášik R, Khanlou N, Han M,Liew C-C, Tsuang MT: Comparative gene expression analysis of bloodand brain provides concurrent validation of SELENBP1 up-regulation inschizophrenia. Proceedings of the National Academy of Sciences of theUnited States of America 2005, 102(43):15533-15538.
13. Vernon SD, Unger ER, Dimulescu IM, Rajeevan M, Reeves WC: Utility of theblood for gene expression profiling and biomarker discovery in chronicfatigue syndrome. Dis Markers 2002, 18(4):193-199.
14. Batliwalla FM, Baechler EC, Xiao X, Li W, Balasubramanian S, Khalili H,Damle A, Ortmann WA, Perrone A, Kantor AB, et al: Peripheral blood geneexpression profiling in rheumatoid arthritis. Genes Immun 2005,6(5):388-397.
15. Batliwalla FM, Li W, Ritchlin CT, Xiao X, Brenner M, Laragione T, Shao T,Durham R, Kemshetti S, Schwarz E, et al: Microarray analyses of peripheralblood cells identifies unique gene expression signature in psoriaticarthritis. Mol Med 2005, 11(1-12):21-29.
16. DePrimo S, Wong L, Khatry D, Nicholas S, Manning W, Smolich B,O’Farrell A-M, Cherrington J: Expression profiling of blood samples froman SU5416 Phase III metastatic colorectal cancer clinical trial: a novelstrategy for biomarker identification. BMC Cancer 2003, 3(1):3.
17. Tsuang MT, Nossova N, Yager T, Tsuang M-M, Guo S-C, Shyu KG, Glatt SJ,Liew CC: Assessing the validity of blood-based gene expression profilesfor the classification of schizophrenia and bipolar disorder: A preliminaryreport. American Journal of Medical Genetics Part B: Neuropsychiatric Genetics2005, 133B(1):1-5.
18. Tusher V, Tibshirani R, Chu G: Significance analysis of microarrays appliedto the ionizing radiation response. Proc Natl Acad Sci USA 2001,98:5116-5121.
19. Amundson SA, Grace MB, McLeland CB, Epperly MW, Yeager A, Zhan Q,Greenberger JS, Fornace AJ Jr: Human In vivo Radiation-InducedBiomarkers: Gene Expression Changes in Radiotherapy Patients. CancerRes 2004, 64(18):6368-6371.
20. Forrest MS, Lan Q, Hubbard AE, Zhang L, Vermeulen R, Zhao X, Li G, Wu YY,Shen M, Yin S, et al: Discovery of novel biomarkers by microarray analysisof peripheral blood mononuclear cell gene expression in benzene-exposed workers. Environ Health Perspect 2005, 113(6):801-807.
21. Miller GE, Chen E, Fok AK, Walker H, Lim A, Nicholls EF, Cole S, Kobor MS:Low early-life social class leaves a biological residue manifested bydecreased glucocorticoid and increased proinflammatory signaling.Proceedings of the National Academy of Sciences 2009, 106(34):14716-14721.
22. Gould J, Getz G, Monti S, Reich M, Mesirov JP: Comparative gene markerselection suite. Bioinformatics 2006, 22(15):1924-1925.
23. Kalofoutis A, Jullien G, Koutselinis A, Miras C: Erythrocyte 2,3-diphosphoglycerateas related to diabetes and obesity. Clin Chem 1975, 21(10):1414-1415.
24. Snyder LR, Born S, Lechner AJ: Blood oxygen affinity in high-and low-altitude populations of the deer mouse. Respir Physiol 1982, 48(1):89-105.
25. Rao GM, Morghom LO: Erythrocyte count and hemoglobin levels indiabetic women. Eur J Appl Physiol Occup Physiol 1984, 52(3):272-275.
26. Wysocki M, Krotkiewski M, Braide M, Bagge U: Hemorheologicaldisturbances, metabolic parameters and blood pressure in differenttypes of obesity. Atherosclerosis 1991, 88(1):21-28.
27. Subramanian A, Tamayo P, Mootha VK, Mukherjee S, Ebert BL, Gillette MA,Paulovich A, Pomeroy SL, Golub TR, Lander ES, et al: Gene set enrichmentanalysis: a knowledge-based approach for interpreting genome-wideexpression profiles. Proc Natl Acad Sci USA 2005, 102(43):15545-15550.
28. Ogata H, Goto S, Sato K, Fujibuchi W, Bono H, Kanehisa M: KEGG: KyotoEncyclopedia of Genes and Genomes. Nucleic Acids Res 1999, 27(1):29-34.
29. Mootha VK, Lindgren CM, Eriksson KF, Subramanian A, Sihag S, Lehar J,Puigserver P, Carlsson E, Ridderstrale M, Laurila E, et al: PGC-1alpha-responsive genes involved in oxidative phosphorylation are coordinatelydownregulated in human diabetes. Nat Genet 2003, 34(3):267-273.
30. Schaefer CF, Anthony K, Krupa S, Buchoff J, Day M, Hannay T, Buetow KH:PID: the Pathway Interaction Database. Nucleic Acids Res 2009, , 37Database: D674-679.
31. Technote A: Signature genes for different blood subtypes. AffymetrixTechnote [http://media.affymetrix.com/support/technical/technotes/bloodappendix_technote.pdf].
32. Whitney AR, Diehn M, Popper SJ, Alizadeh AA, Boldrick JC, Relman DA,Brown PO: Individuality and variation in gene expression patterns inhuman blood. Proc Natl Acad Sci USA 2003, 100(4):1896-1901.
33. Solinas G, Vilcu C, Neels JG, Bandyopadhyay GK, Luo JL, Naugler W,Grivennikov S, Wynshaw-Boris A, Scadeng M, Olefsky JM, et al: JNK1 inhematopoietically derived cells contributes to diet-inducedinflammation and insulin resistance without affecting obesity. Cell Metab2007, 6(5):386-397.
34. Charriere G, Cousin B, Arnaud E, Andre M, Bacou F, Penicaud L, Casteilla L:Preadipocyte conversion to macrophage. Evidence of plasticity. J BiolChem 2003, 278(11):9850-9855.
35. Hoppe S, Bierhoff H, Cado I, Weber A, Tiebe M, Grummt I, Voit R: AMP-activated protein kinase adapts rRNA synthesis to cellular energy supply.Proc Natl Acad Sci USA 2009, 106(42):17781-17786.
36. Barouch LA, Gao D, Chen L, Miller KL, Xu W, Phan AC, Kittleson MM,Minhas KM, Berkowitz DE, Wei C, et al: Cardiac Myocyte Apoptosis IsAssociated With Increased DNA Damage and Decreased Survival inMurine Models of Obesity. Circ Res 2006, 98(1):119-124.
37. Lupi R, Dotta F, Marselli L, Del Guerra S, Masini M, Santangelo C,Patané G, Boggi U, Piro S, Anello M, et al: Prolonged Exposure to FreeFatty Acids Has Cytostatic and Pro-Apoptotic Effects on HumanPancreatic Islets. Diabetes 2002, 51(5):1437-1442.
38. Zhang HH, Kumar S, Barnett AH, Eggo MC: Dexamethasone Inhibits TumorNecrosis Factor-{{alpha}}-Induced Apoptosis and Interleukin-1{beta}Release in Human Subcutaneous Adipocytes and Preadipocytes. J ClinEndocrinol Metab 2001, 86(6):2817-2825.
39. Dandona P, Aljada A, Bandyopadhyay A: Inflammation: the link betweeninsulin resistance, obesity and diabetes. Trends in Immunology 2004,25(1):4-7.
40. Xu H, Barnes GT, Yang Q, Tan G, Yang D, Chou CJ, Sole J, Nichols A,Ross JS, Tartaglia LA, et al: Chronic inflammation in fat plays a crucial rolein the development of obesity-related insulin resistance. J Clin Invest2003, 112(12):1821-1830.
41. Kelley DE, He J, Menshikova EV, Ritov VB: Dysfunction of mitochondria inhuman skeletal muscle in type 2 diabetes. Diabetes 2002,51(10):2944-2950.
Ghosh et al. BMC Medical Genomics 2010, 3:56http://www.biomedcentral.com/1755-8794/3/56
Page 12 of 13

42. Patti ME, Butte AJ, Crunkhorn S, Cusi K, Berria R, Kashyap S, Miyazaki Y,Kohane I, Costello M, Saccone R, et al: Coordinated reduction of genes ofoxidative metabolism in humans with insulin resistance and diabetes:Potential role of PGC1 and NRF1. Proc Natl Acad Sci USA 2003,100(14):8466-8471.
43. Takamura T, Misu H, Matsuzawa-Nagata N, Sakurai M, Ota T, Shimizu A,Kurita S, Takeshita Y, Ando H, Honda M, et al: Obesity upregulates genesinvolved in oxidative phosphorylation in livers of diabetic patients.Obesity (Silver Spring) 2008, 16(12):2601-2609.
44. Wallace DC: A MITOCHONDRIAL PARADIGM OF METABOLIC ANDDEGENERATIVE DISEASES, AGING, AND CANCER: A Dawn forEvolutionary Medicine. Annual Review of Genetics 2005, 39(1):359-407.
45. Harper ME, Dent R, Monemdjou S, Bezaire V, Van Wyck L, Wells G,Kavaslar GN, Gauthier A, Tesson F, McPherson R: Decreased mitochondrialproton leak and reduced expression of uncoupling protein 3 in skeletalmuscle of obese diet-resistant women. Diabetes 2002, 51(8):2459-2466.
46. Abeel T, Helleputte T, Van de Peer Y, Dupont P, Saeys Y: Robust biomarkeridentification for cancer diagnosis with ensemble feature selectionmethods. Bioinformatics 26(3):392-398.
47. Golub T, Slonim D, Tamayo P, Huard C, Gaasenbeek M, Mesirov J, Coller H,Loh M, Downing J, Caligiuri M, et al: Molecular classification of cancer:class discovery and class prediction by gene expression monitoring.Science 1999, 286:531-537.
48. Dhanasekaran SM, Barrette TR, Ghosh D, Shah R, Varambally S, Kurachi K,Pienta KJ, Rubin MA, Chinnaiyan AM: Delineation of prognosticbiomarkers in prostate cancer. Nature 2001, 412(6849):822-826.
49. Pahl A, Brune K: Gene expression changes in blood after phlebotomy:implications for gene expression profiling. Blood 2002, 100(3):1094-1095.
50. Min J, Barrett A, Watts T, Pettersson F, Lockstone H, Lindgren C, Taylor J,Allen M, Zondervan K, McCarthy M: Variability of gene expression profilesin human blood and lymphoblastoid cell lines. BMC Genomics 11(1):96.
51. Raghavachari N, Xu X, Munson PJ, Gladwin MT: Characterization of WholeBlood Gene Expression Profiles as a Sequel to Globin mRNA Reductionin Patients with Sickle Cell Disease. PLoS ONE 2009, 4(8):e6484.
52. Wright C, Bergstrom D, Dai H, Marton M, Morris M, Tokiwa G, Wang Y,Fare T: Characterization of globin RNA interference in gene expressionprofiling of whole-blood samples. Clin Chem 2008, 54(2):396-405.
53. Liu J, Walter E, Stenger D, Thach D: Effects of globin mRNA reductionmethods on gene expression profiles from whole blood. J Mol Diagn2006, 8(5):551-558.
54. Irizarry RA, Wu Z, Jaffee HA: Comparison of Affymetrix GeneChipexpression measures. Bioinformatics 2006, 22(7):789-794.
55. Subramanian A, Kuehn H, Gould J, Tamayo P, Mesirov JP: GSEA-P: adesktop application for Gene Set Enrichment Analysis. Bioinformatics2007, 23(23):3251-3253.
56. Indra Devi M, Rajaram R, Selvakuberan K: Generating best features for webpage classification. Webology 2008, 5(1):Article 52.
57. Cover T, Thomas J: Elements of Information Theory New York: Wiley; 1991.58. Williams N, Zander S, Armitage G: A preliminary performance comparison
of five machine learning algorithms for practical IP traffic flowclassification. ACM SIGCOMM Computer Communication Review 2006,36(5):7-15.
59. Breiman L: Random Forests. Machine Learning 2001, 455(1):5-32.60. Del Rio A, Gasteiger J: Simple method for the prediction of the
separation of racemates with high-performance liquid chromatographyon Whelk-O1 chiral stationary phase. Journal of Chromatography A 2008,1185(1):49-58.
Pre-publication historyThe pre-publication history for this paper can be accessed here:http://www.biomedcentral.com/1755-8794/3/56/prepub
doi:10.1186/1755-8794-3-56Cite this article as: Ghosh et al.: Gene expression profiling in wholeblood identifies distinct biological pathways associated with obesity.BMC Medical Genomics 2010 3:56.
Submit your next manuscript to BioMed Centraland take full advantage of:
• Convenient online submission
• Thorough peer review
• No space constraints or color figure charges
• Immediate publication on acceptance
• Inclusion in PubMed, CAS, Scopus and Google Scholar
• Research which is freely available for redistribution
Submit your manuscript at www.biomedcentral.com/submit
Ghosh et al. BMC Medical Genomics 2010, 3:56http://www.biomedcentral.com/1755-8794/3/56
Page 13 of 13


