Embed Size (px)
Citation preview

Autho
r's
pers
onal
co
py
Genetic aspect in broodstock management of the critically endangeredMekong giant catfish, Pangasianodon gigas in Thailand
Kednapat Sriphairoj a, Wongpathom Kamonrat b, Uthairat Na-Nakorn a,⁎
a Department of Aquaculture, Faculty of Fisheries, Kasetsart University, Bangkok, Thailandb Inland Fisheries Resources Research and Development Institute, Department of Fisheries, Bangkok, Thailand
Received 21 April 2006; received in revised form 29 December 2006; accepted 30 December 2006
Abstract
A broodstock management plan was designed for the world's biggest catfish, the critically endangered Mekong giant catfish(MGC), Pangasianodon gigas, based on multilocus genotypes of seven microsatellite loci. The broodstock included a total of 129pit-tagged mature MGC from seven farms in Thailand covering approximately five year-classes. The genetic variation withinstocks was relatively low (number of alleles/locus=2.29±0.76–4.00±1.83; effective number of alleles/locus=1.84±0.51–3.04±1.04; Ho=0.58±0.34–0.80±0.12; He=0.43±0.21–0.66±0.11). The genetic relatedness (rxy: [Ritland, K., 1996. Estimators forpairwise relatedness and individual inbreeding coefficients. Genet. Res. 67, 175–185.]) was used to identify the unrelated pairswherein a minimum value of rxy for half-sib family (rxy=0.07) was considered as a critical value of unrelatedness. The average rxywithin farm (0.21±0.13–0.31±0.07) was relatively high compared to the overall average rxy (0.20±0.01), suggesting collaborativebroodstock management among farms should be carried out in future. In the short-term six scenarios were proposed based on the28 and 63 mature male and female brooders, respectively. The results suggest that the best strategy for maintaining the geneticdiversity while minimizing inbreeding of MGC was to select mating pairs based on the rxy. A long-term management plansimulation using the BOTTLESIM program showed that if a random mating scheme is adopted Ne should be kept at 100 in order topreserveN90% A for four generations (120 years). Applying the mk (minimal kinship) selection for only the first generation canreduce Ne to N30 individuals and can retain N90% A throughout the same period.© 2007 Elsevier B.V. All rights reserved.
Keywords: Mekong giant catfish; Broodstock management; Genetic relatedness; mk selection
1. Introduction
One of the world's biggest freshwater fish, theMekong giant catfish (MGC), Pangasianodon gigas isendemic to the Mekong River and its tributaries(Polprasit and Tevaratmaneekul, 1997). The wildpopulation of MGC has rapidly declined, thought due
to factors such as overexploitation (Froese and Pauly,2005), improper fishing practices such as poisoning, andenvironment modification (e.g., damming) (Mitchelland Braun, 2003). It has been listed as CriticallyEndangered in the 2005 IUCN Red List of threatenedspecies (IUCN, 2005). However, fishing of MGC is stillpracticed in Haad Khrai District, Amphur Chiangkhong,Chiangrai Province in northern Thailand as a part of acultural ceremony. The ceremony dates back more thana hundred years and as it is something of a tourist
Aquaculture 264 (2007) 36–46www.elsevier.com/locate/aqua-online
⁎ Corresponding author. Tel.: +66 2 579 2924; fax: +66 2 561 0990.E-mail address: [email protected] (U. Na-Nakorn).
0044-8486/$ - see front matter © 2007 Elsevier B.V. All rights reserved.doi:10.1016/j.aquaculture.2006.12.046

Autho
r's
pers
onal
co
py
attraction, contributes to the livelihood of the localcommunity as a whole and not only fishermen.
As conservation measure the Thai Department ofFisheries has performed artificial breeding using wildcaught broodstock since 1983 (Polprasit and Tevarat-maneekul, 1997). The mass production of fingerlingswas first achieved in 1984 (Phukasawan et al., 1984)and has continued until present with approximately3.4 million offspring produced (Sukumasavin, pers.comm.). Approximately 18,000 adult fish coveringapproximately 22 year-classes are reared as potentialbroodstock in government and private farms throughoutThailand for aquaculture and restocking purposes.
Offspring of wild caught broodstock were grown inponds and matured at about 15 years and breeding ofpond-reared broodstock was first achieved in 2001(Unakornsawad et al., 2001). Despite the fact that thiscaptive stock serves as the only long-term hope forconservation of MGC, genetic management of the stockhas not yet been initiated to date.
Improper management of broodstock could lead toreduction of effective population size (Ne), the numberof parents contributing their genes to the next genera-tion. As a consequence, this could result in a loss ofgenetic diversity which is often a case for endangeredspecies (Frankham et al., 2002), for example the captivepopulation of the endangered haplochromine cichlid,Prognathochromis perrieri with Ne represented only 1–10% of the observed census size in the gene bank(reviewed by Philippart, 1995).
In addition to the fact that the captive broodstock (G1) ofMGC originated from a small number of wild fish (G0),further decline of genetic variability may occur in suc-cessive generations due to genetic drift (Frankham et al.,2002). Moreover, the G1 fish were not systematicallytagged and hence the pedigree record is lacking. As such,the genetic diversity cannot be retained by simply maxi-mizing Ne because the variance between family sizescannot be controlled (Doyle et al., 2001).
Due to inadequate documentation on spawningrecords, there is an urgent need to employ moleculartools to facilitate proper MGC broodstock management.We selected microsatellite markers for this purposebecause of their hypervariability and due to theavailability of primers developed from DNA of thesame species (Na-Nakorn et al., 2006). Moreover,microsatellite markers have been widely applied forbroodstock selection approaches, e.g. genetic related-ness (rxy) (Ritland, 1996), minimal kinship (mk)selection (Ballou and Lacy, 1995). The rxy approachhas also been used to facilitate selection of breeding pairsto avoid inbreeding (Norris et al., 2000; Borrell et al.,
2004;McDonald et al., 2004). Selection of brooders withthe lowest mean kinship value, an average geneticrelatedness of an individual, will enable hatcheries tokeep fish with rare alleles (Ballou and Lacy, 1995; Doyleet al., 2001) hence maximizing genetic diversity andreducing divergence from the ancestral generation. Thisapproach has been proposed for broodstockmanagementof many fish species for examples, red sea bream, Pa-grus major (Doyle et al., 2001); turbot, Scophthalmusmaximus L. (Borrell et al., 2004) and Japanese flounder,Paralichthys olivaceus (Sekino et al., 2004).
In the present study seven microsatellite loci werestudied in 129 MGC individuals. Different scenariosregarding different broodstock recruitment and matingstrategies were proposed. The efficiency of eachscenario in retaining genetic diversity while minimizinginbreeding was compared. This information will beutilized for making recommendations on developmentof an MGC breeding strategy to the Department ofFisheries, Thailand, and also to private hatcheries. Inaddition, the results of the present study could serve asan important resource to develop guidelines for thegenetic management of other endangered species.
2. Materials and methods
2.1. Fish samples
The broodstock (G1) (n=129) used in this study werethe first generation offspring of wild caughtMekong giantcatfish (G0) produced during 1984–1994. Hence, thedifferent genetic structure between stocks reflects thecomposition of different year-classes rather than hatcherymanagement practices. They weighed 17–120 kg amongwhich 28males and 63 femalesweremature.We collectedG1 tissue samples only from potential brooders. Theywere reared in four government fisheries stations andthree private hatcheries as detailed in Table 1. Approx-imately 150 mg of tissue was collected from caudal fin of129 individuals and separately preserved in 90% ethanol.Then fish were tagged with microchips in the head area.
2.2. Microsatellite analysis
DNAwas extracted following a procedure described byTaggart et al. (1995). Amplification reactions were per-formed using sevenmicrosatellite primers, Pg-1, Pg-2, Pg-3, Pg-6, Pg-16 and Pg-17 developed from the Mekonggiant catfish DNA (Genbank accession numbers: AV364900-3, AV 364907-8) (Na-Nakorn et al., 2006) andPSP-G 507 developed from Pangasius species DNA pool(Hogan andMay, 2002). The conditions for the 10 μl PCR
37K. Sriphairoj et al. / Aquaculture 264 (2007) 36–46

Autho
r's
pers
onal
co
pyreactions were 5 ng DNA template, 1× PCR buffer,0.25 pmol forward/reverse primer, 1.5 mM MgCl2,100 μM dNTPs, 0.4 unit Taq polymerase (Fermentas)and dH2O to 10 μl. Temperature profiles were as follows:denaturation at 94 °C for 3 min; 35 cycles of 30 s at 94 °C,30 s at annealing temperature, 1 min at 72 °C and a finalextension at 72 °C for 5 min. The PCR condition andtemperature profile of PSP-G 507 followed Hogan andMay (2002). PCR products were separated on 4.5%denatured polyacrylamide gels and visualized by silverstaining. Allele sizes were determined according to M13sequence ladder (Promega, USA).
2.3. The referenced rxy values for full-sibs and half-sibs
Five full-sib families and one half-sib familycollected from Chiangmai Inland Fisheries Researchand Development Center (a total of 20 individuals/family) were used for calculation of referenced rxyvalues for full-sib and half-sib family, respectively.
2.4. Data analysis
2.4.1. Genetic variationParameters for genetic variation, number and effec-
tive number of alleles per locus, observed and expected
heterozygosity were calculated on the 129 individuals ofG1 using the program POPGENE (Yeh and Boyle,1997). The differences between populations were testedfor each parameter (A, Ae, Ho, He) using ANOVAincluded in the SPSS statistical package (version 10)following a post-hoc multiple comparison with Bonfer-roni corrected for multiple tests.
2.4.2. Pairwise relatedness coefficient (rxy) and meankinship value(mk)
There are at least three estimators proposed byRitland(1996), Lynch and Ritland (1999) and Queller andGoodnight (1989), for genetic relatedness based on co-dominant markers. In order to choose the best estimatorwe used these estimators to calculate mean pairwiserelatedness of five full-sib families. Then a t-test wasperformed (null hypothesis, Ho: rxy=0.5) which showedthat only rxy based on Ritland (1996) was not signi-ficantly different from 0.5 (PN0.01) (Table 2). As such,the Ritland estimator was employed and estimated usingthe MARK computer program, written by KR inFORTRAN95 for Windows, available at http://www.genetics.forestry.ubc.ca/ritland/programs.html.
The mean kinship of the ith individual, the averagekinship values for that individual with every individualin the population including itself, was estimatedfollowing Doyle et al. (2001).The mean kinship forthe whole sample of 129 G1 individuals and separatelyfor each population was calculated using MicrosoftExcel.
2.4.3. Short-term breeding schemeThe mating plan for short-term application was
designed following six scenarios based on the fact that atpresent only 91 fish, including 28 males and 63 females,were of known sex and ready for breeding and the goalwas to maximize genetic variation and minimize
Table 2Mean pairwise relatedness (r) calculated from five full-sib familiesbased on the three estimaters, Ritland, Lynch-Ritland and Queller-Goodnight, and P for t-test (Ho: r=0.5)
Family no. Ritland r(±SD)
Lynch-Ritland r(±SD)
Queller-Goodnight r(±SD)
Full-sib no. 1 0.45 (0.16) 0.14 (0.14) 0.15 (0.15)Full-sib no. 2 0.39 (0.10) 0.14 (0.14) 0.19 (0.13)Full-sib no. 3 0.41 (0.13) 0.13 (0.14) 0.12 (0.16)Full-sib no. 4 0.47 (0.12) 0.19 (0.12) 0.17 (0.14)Full-sib no. 5 0.48 (0.15) 0.21 (0.15) 0.21 (0.14)Mean 0.44ns (0.14) 0.16⁎ (0.14) 0.17⁎ (0.15)P 0.026 0.000 0.000
Note: ns=not different from 0.5 (t-test; PN0.01); ⁎ significantlydifferent from 0.5 (Pb0.01).
Table 1Details on collection sites, abbreviation, number of samples and yearclasses of Mekong Giant Catfish brooders collected from farms inThailand
Pop.no.
Pop. name Collection sites Size(kg)
No. Yearclass
1 Chiangmai Chiangmai InlandFisheries Research andDevelopment Center
40–120 31 1984
2 Phayao Phayao Inland FisheriesResearch DevelopmentCenter
50–70 14 1984
3 Ayudthaya Ayudthaya InlandFisheries ResearchDevelopment Institute
33–46 4 1984
4 Maejo Maejo University(Department of FisheriesTechnology, Faculty ofAgricultural Production)Chiangmai Province
17–22 12 1991
5 Suphanburi Chaomudcha Farm,Amphur Songpeenong,Suphanburi Province
27–35 19 1990–1991
6 Chiangrai-W Wangplabuk Farm,Amphur Wiangchai,Chiangrai Province
47–62 39 1988–1990
7 Chiangrai-J Jaran Farm, AmphurPhan, Chiangrai Province
20–22 10 1994
38 K. Sriphairoj et al. / Aquaculture 264 (2007) 36–46
Autho
r's
pers
onal
co
py
inbreeding. The scenarios were as follows: 1) single pairmating of 28 males: 28 females, pairs decided accordingto low rxy, each male used once; 2) same as 1, but eachmale mated with two females in order to make use of allavailable females; 3) single pair mating of the pairs withrxy less than 0.07, each male participated in one mating;4) same as 3, but each male mated with two females; 5)single pair mating of each of the 28 males mated tofemales with lower mean kinship value, each maleparticipated in one mating; 6) same as 5 but each malemated with two females. Genetic variation wascalculated from the genotypes of brooders selectedaccording to each of the six scenarios mentioned above.The calculation was facilitated by the POPGENEcomputer program (Yeh and Boyle, 1997).
2.4.4. Long-term breeding plan: Genetic simulationThe long-term plan was designed according to the
assumption that all 129 individuals are matured and allof them were involved in the breeding plan regardless ofsex. Two scenarios were used, 1) random mating ofdifferent effective population size, all available indivi-duals, 100, 50, 30 or 10 for 10 generations (the“RANDOM” scenario); 2) using the minimal kinshipapproach in the first generation (the “MK” scenario)wherein 100, 50, 30 or 10 individuals with the lowest
mean kinship value are used as a founder stock followedby random mating for nine generations.
We did not apply the rxy approach for the long-termplan because the simulation program (BOTTLESIM,Kuo and Janzen, 2003) did not restrict only thedesignated breeding pairs. Rather it covered all possiblecrosses of the input individuals, hence the results wouldinclude the pairs with rxy higher than the critical value(rxy=0.07). The computer program “BOTTLESIM”(Kuo and Janzen, 2003) was used to estimate thegenetic variation that resulted from each scenariowherein the Ne value was stable over a period of 10generations (300 years), with other simulation para-meters kept constant (lifespan=30 years, age atmaturity=15 years, discrete generations, dioeciousreproduction, random mating, sex ratio 1:1, 300 yearssimulated, 1000 iterations).
3. Results
3.1. Genetic diversity within and among stocks
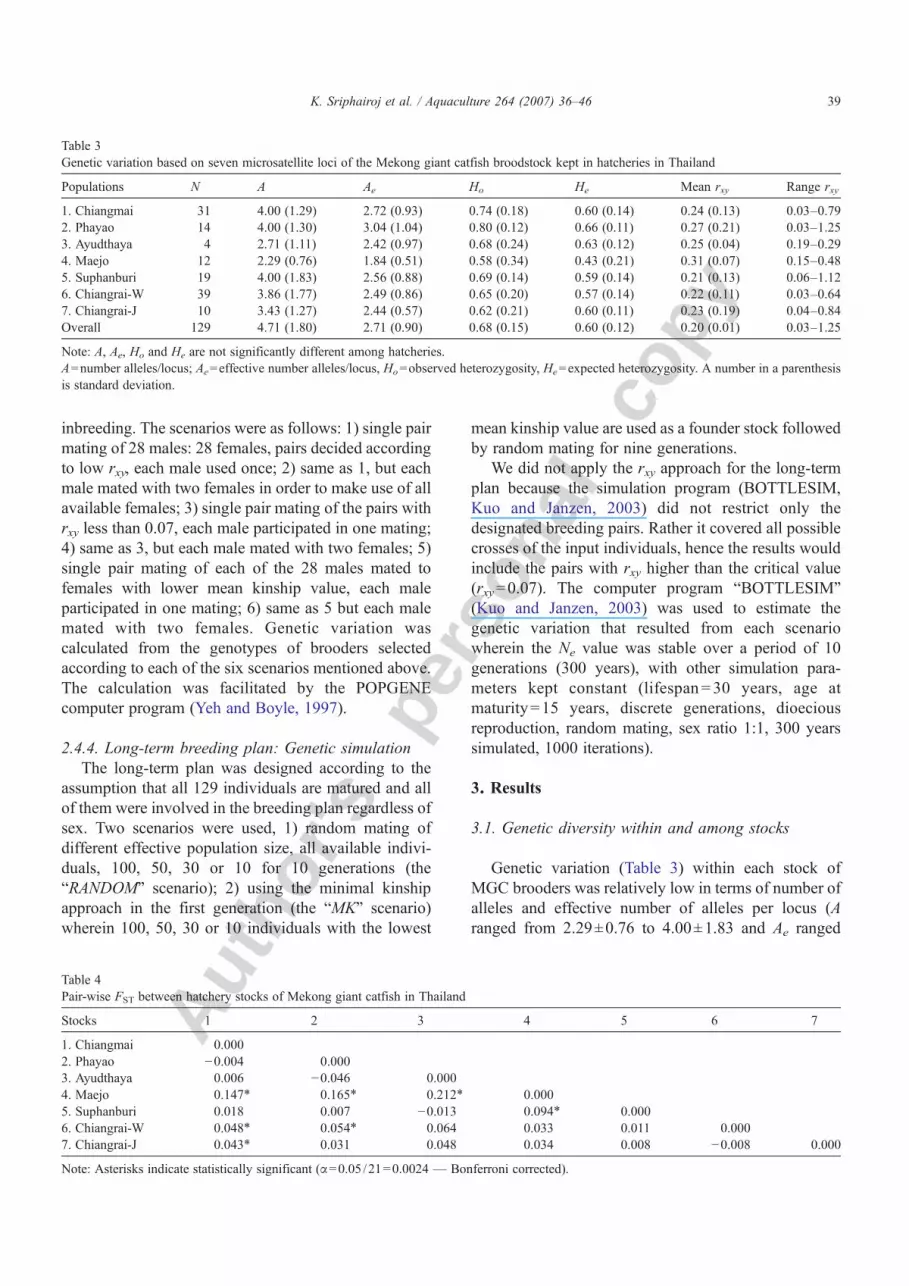
Genetic variation (Table 3) within each stock ofMGC brooders was relatively low in terms of number ofalleles and effective number of alleles per locus (Aranged from 2.29±0.76 to 4.00±1.83 and Ae ranged
Table 3Genetic variation based on seven microsatellite loci of the Mekong giant catfish broodstock kept in hatcheries in Thailand
Populations N A Ae Ho He Mean rxy Range rxy
1. Chiangmai 31 4.00 (1.29) 2.72 (0.93) 0.74 (0.18) 0.60 (0.14) 0.24 (0.13) 0.03–0.792. Phayao 14 4.00 (1.30) 3.04 (1.04) 0.80 (0.12) 0.66 (0.11) 0.27 (0.21) 0.03–1.253. Ayudthaya 4 2.71 (1.11) 2.42 (0.97) 0.68 (0.24) 0.63 (0.12) 0.25 (0.04) 0.19–0.294. Maejo 12 2.29 (0.76) 1.84 (0.51) 0.58 (0.34) 0.43 (0.21) 0.31 (0.07) 0.15–0.485. Suphanburi 19 4.00 (1.83) 2.56 (0.88) 0.69 (0.14) 0.59 (0.14) 0.21 (0.13) 0.06–1.126. Chiangrai-W 39 3.86 (1.77) 2.49 (0.86) 0.65 (0.20) 0.57 (0.14) 0.22 (0.11) 0.03–0.647. Chiangrai-J 10 3.43 (1.27) 2.44 (0.57) 0.62 (0.21) 0.60 (0.11) 0.23 (0.19) 0.04–0.84Overall 129 4.71 (1.80) 2.71 (0.90) 0.68 (0.15) 0.60 (0.12) 0.20 (0.01) 0.03–1.25
Note: A, Ae, Ho and He are not significantly different among hatcheries.A=number alleles/locus; Ae=effective number alleles/locus, Ho=observed heterozygosity, He=expected heterozygosity. A number in a parenthesisis standard deviation.
Table 4Pair-wise FST between hatchery stocks of Mekong giant catfish in Thailand
Stocks 1 2 3 4 5 6 7
1. Chiangmai 0.0002. Phayao −0.004 0.0003. Ayudthaya 0.006 −0.046 0.0004. Maejo 0.147⁎ 0.165⁎ 0.212⁎ 0.0005. Suphanburi 0.018 0.007 −0.013 0.094⁎ 0.0006. Chiangrai-W 0.048⁎ 0.054⁎ 0.064 0.033 0.011 0.0007. Chiangrai-J 0.043⁎ 0.031 0.048 0.034 0.008 −0.008 0.000
Note: Asterisks indicate statistically significant (α=0.05 /21=0.0024 — Bonferroni corrected).
39K. Sriphairoj et al. / Aquaculture 264 (2007) 36–46

Autho
r's
pers
onal
co
pyfrom 1.84±0.51 to 3.04±1.04). Heterozygosity wasmoderate (Ho ranged from 0.58±0.34 to 0.80±0.12; He
ranged from 0.43±0.21 to 0.66±0.11). Across a total of129 brooders genetic variation was A=4.71±1.80,Ae=2.71±0.90, Ho=0.68±0.15, He=0.60±0.12. Allgenetic variation parameters were not significantly
different between the seven hatchery populations (A:F=1.831, P=0.116; Ae: F=1.272, P=0.291; Ho:F=0.703, P=0.649; He: F=1.930, P=0.098). Thepair-wise FST (Table 4) showed significant geneticdifferentiation between seven pairs of population amongwhich the Maejo and Chiangmai stocks were distinct.
Fig. 1. Genetic relatedness coefficient (rxy) distributions of offspring of known parent.
Fig. 2. Genetic relatedness coefficient (rxy) distributions of captive stocks of MGC from seven farms; CR-W=Chiangrai-W, CM=Chiangmai,S=Suphanburi, PY=Phayao, CR-J=Chiangrai-J, AY=Ayudthaya, M=Maejo.
40 K. Sriphairoj et al. / Aquaculture 264 (2007) 36–46

Autho
r's
pers
onal
co
py
3.2. Genetic relatedness of full-sib, half-sib andunrelated pairs
In order to determine the cut-off value for unrelatedpairs, genetic relatedness of full-sib, half-sib andunrelated families were studied. The five full-sib familiesshowed rxy between 0.39 and 0.48 (mean=0.44±0.14)which was not significantly different from the expectedvalue of 0.5 (t-test; P=0.026) (Table 2). The rxy value forhalf-sib (average 0.38±0.11; range 0.07 to 0.85) and theunrelated (average, 0.19±0.07; range, −0.02 to 0.41)were significantly higher than the expected value 0.25
and 0 for half-sib and unrelated respectively (t-test;P=0.000).
The values of rxy for the three kinship categories wereoverlapping (Fig. 1). If the mean value of rxy for theunrelated pairs (0.19) was used as a cut-off value for beingunrelated some full-sib and half-sib pairs were included.Thus we decided to regard a pair with rxyb0.07, whichwas aminimum value of genetic relatedness of half-sib, asunrelated.
3.3. Genetic relatedness within and among stocks
Mean genetic relatedness (rxy) of G1 in the differentfarms is shown in Table 3 and Fig. 2, ranging from0.21±0.13 (Suphanburi) to 0.31±0.07 (Maejo). Inevery case this was greater than the overall geneticrelatedness (Table 3: 129 pooled sample, 0.20±0.01).
Genetic relatedness among the 129 G1 individualsregardless of farms and sexes (8256 pairs) falls between0.03 and 1.25 (mean rxy=0.20±0.01). Most of the pairsshowed the rxy within ranges for full-sib or half-sib, and6% (439 pairs) were unrelated (rxyb0.07).
3.4. Short-term breeding plan: The results of the sixbroodstock recruitment scenarios
Genetic variation of the broodstock recruited accord-ing to each scenario was shown in Table 5. All scenariosresulted in no differences in terms of genetic variation(PN0.05) even though different numbers of broodstockwere used (28 males and females each in scenario 1 and
Table 5Genetic variation of the broodstock recruited according to sixscenarios as shown in Materials and methods section
Scenario No. brooders A1 Ae1 He
1 Mean rxy2
1 28 M 4.57 2.83 0.62 0.062a
28 F (1.62) (1.00) (0.13) (0.024)2 28 M 4.71 2.70 0.60 0.085b
56 F (1.80) (0.95) (0.13) (0.041)3 20 M 4.57 2.88 0.62 0.050a
20 F (1.62) (1.07) (0.13) (0.015)4 20 M 4.57 2.85 0.62 0.053a
25 F (1.62) (1.05) (0.13) (0.015)5 28 M 4.71 2.88 0.62 0.096b
28 F (1.80) (1.09) (0.12) (0.045)6 28 M 4.71 2.68 0.60 0.088b
56 F (1.80) (0.91) (0.12) (0.038)
Note: 1no significant different between each pair of scenarios; 2mean inthe same column superscripted with different letters are significantlydifferent from each other (Pb0.05).The abbreviation as described in Table 2; SD in parentheses.
Fig. 3. Number of alleles per locus (A) over 300 years resulted from the simulation (BOTTLESIM) based on 2 scenarios (RANDOM and MK) usingdifferent Ne.
41K. Sriphairoj et al. / Aquaculture 264 (2007) 36–46

Autho
r's
pers
onal
co
py
5; 28 males and 56 females in scenario 2 and 6; 20 malesand females each in scenario 3; 20 males and 25 femalesin scenario 4) as well as different recruitment strategies.When compared to genetic variation of the overall stock(from a total of 129 fish) all scenarios gave values of A,Ae and He not significantly different from the overall(PN0.05, t-test). Mean rxywas not significantly differentamong scenarios 1, 3, 4 but they were significantlysmaller than the mean rxy for scenarios 2, 5 and 6.
3.5. Long-term breeding plan
The results of the simulation are shown in Fig. 3 forthe number of alleles per locus (A) and Fig. 4 for theobserved heterozygosity (Ho). The simulation for 10generations showed that both the “RANDOM” and the“MK” breeding plan were almost equally effective inretaining Ho (96%) if 50–100 broodstock were used. AtNe=10 and 30 the “RANDOM” gave slightly lower Ho
than the “MK”. Number of alleles per locus (A) wasretained with equal efficiency (88% A retained) in bothmethods when 100 broodstock were used. If Ne=10–50, despite the remarkable decline of A, the “MK” wasslightly more efficient in preserving A than the“RANDOM” (e.g. at Ne=50; 82% and 79% A wereretained following the “MK” and “RANDOM”respectively).
Notably the reduction of Ne to 10 individuals resultedin sharp decline of both Ho and A for both practices.After four generations (120 years) the MK with Ne=50
and 100 both preservedN90% of Awhile the RANDOMscheme required Ne=100 to retainN90% A.
4. Discussion
4.1. Genetic diversity of the captive stocks
Genetic variation of the captive populations (G1) wasnot significantly different (P, t-test of HoN0.01, Archie,1985) to that of the natural populations (A=4.43±1.62;Ho=0.677±0.140; n=15) based on the same loci (Na-Nakorn et al., pers. comm.). Generally the captive stocksoften lose genetic variation due to founder effect(Allendorf, 1986; Tave, 1999). However, in the contextof the present study the impacts of founder effect werecompensated by inclusion of samples covering a widerange of year-classes (at least four year-classes) whilethe genetic variation of the natural stock could havebeen underestimated due to limited sample size. Thesignificant FST among farmed G1 indicates that variationamong founder collections contributed substantially tothe genetic variance of the captive populations.
Based on the substantial level of genetic variation ofthe G1 (relative to the wild stock) the captive stocks aresuitable for establishing a founder stock provided thatproper strategies are applied to maintain geneticdiversity and avoid inbreeding in successive genera-tions. Stocks selected for a restocking program shouldretain high genetic diversity, which is essential for anadaptation potential (Frankham et al., 2002). Vrijenhoek
Fig. 4. Observed heterozygosity (Ho) over 300 years resulted from the simulation (BOTTLESIM) based on 2 scenarios (RANDOM and MK) usingdifferent Ne.
42 K. Sriphairoj et al. / Aquaculture 264 (2007) 36–46

Autho
r's
pers
onal
co
py
et al. (1985) and Quattro and Vrijenhoek (1989) reportedthat a failure on captive rearing of Poeciliopsisoccidentalis was attributable to a lack of geneticdiversity.
The existing captive populations did not have allalleles found in wild samples (Na-Nakorn et al., pers.comm.) implying that they did not fully represent theavailable genetic diversity. Therefore further inclusionof wild gene pool, by bringing in gametes and/oroffspring, is recommended. It is expected not only toenhance the genetic variation but also to reduce theeffect of previous domestication selection (Schonhuthet al., 2003).
4.2. The genetic relatedness within and among stocks
Mean genetic relatedness (rxy) of each stock wasrelatively high compared to the overall rxy (0.198±0.012), indicating that using breeding pairs fromdifferent hatcheries may assist in conservation of geneticdiversity. Broodstock should be managed as a singlestock and collaborative breeding programs should beestablished between hatcheries.
However, if individuals of known sex were consid-ered only 28 males and 63 females were available forbreeding in 2006. This number is much smaller than therecommended Ne to retain evolutionary potential (500,5000; Frankham et al., 2004). Therefore, the geneticallyimportant individual approach (Ballou and Lacy, 1995)might be more desirable, in which genetically uniqueindividuals are identified and included as broodstock,which is expected to maximize retention of geneticvariation.
4.3. Variation of rxy for three categories of kinship
The distribution of the rxy of each kinship categorycalculating from empirical data obtained from one half-sib and five full-sib families showed high variationwithin a category (full-sib, half-sib or unrelated pairs)and the overlapping between each category wasobvious. Our findings are similar to those previouslyreported in many fishes using rxy of Queller andGoodnight (1989), such as Atlantic salmon, Salmosalar (Norris et al., 2000), Japanese flounder (Sekinoet al., 2004), and turbot (Borrell et al., 2004). Such highlevels of variation in rxy value might be due to low levelsof polymorphism of the markers rather than a propertyof the estimator. Norris et al. (2000) clearly showed thatincreasing number of loci or using only high poly-morphic loci reduced distribution of rxy for each kinshipcategory.
4.4. The cut-off value for being unrelated
One of our purposeswas to identify unrelated presumedmating pairs to avoid inbreeding (applied for scenarios 3,4). Theoretically, the unrelated individuals should have nilgenetic relatedness (rxy=0) but the empirical data from ourstudy showed rxy range between −0.02 to 0.41(mean=0.18±0.07) for the unrelated pairs. If we use themean rxy for unrelated pairs as the cut-off value there are3780 half-sib pairs included. However, if the theoreticalrxy=0 is used all of the known sex pairs were discarded.Therefore we decided to tolerate relatedness smaller thanthose of between half-sib, i.e. minimum rxy for half-sib(rxy=0.07) as a cut-off value which resulted in identifica-tion of 20 unrelated pairs (scenario 3).
4.5. A short-term plan for MGC broodstock recruitmentand mating
The genetic variation of the stocks recruited accord-ing to each of the six scenarios was not differentregardless of different number of brooders involved. Allof the proposed scenarios were capable of retaining A,Ae and He of the overall stock.
The advantage of applying rxy was to reduceinbreeding (Norris et al., 2000; Sekino et al., 2004)while genetic variation may not be efficiently retained.However in our case the low rxy strategy was efficientfor both retaining genetic diversity and minimizeinbreeding. This was not the case for scenario 2 (matingof pairs with low rxy, males mated twice with differentfemales) which resulted in high mean rxy. This wasbecause males participated in second mating henceallowed for inclusion of pairs with relatively high rxy.The failure of increasing genetic variation as a result ofmore female inclusion in scenario 2 was explained bysmall overall genetic variation of available stock.
The application of the cut-off value for beingunrelated limited the number of breeding pairs to 20pairs, nevertheless the genetic variation was not reducedrelative to the overall genetic variation. The effort toefficiently exploit the stock was made by allowing thesame male to mate with second females whose rxy waslower than the cut-off value (scenario 4). However suchefforts would not alter genetic variation nor mean rxy.
In scenarios 4 and 5 the mk selection approach wasapplied to recruit genetically unique females whichmight improve genetic variation of the stock (Doyleet al., 2001). However genetic variation was notimproved, which may be because the number of allelesin our stock was small. Moreover, mean rxy of therecruited stock, which represented mean inbreeding
43K. Sriphairoj et al. / Aquaculture 264 (2007) 36–46
Autho
r's
pers
onal
co
py
coefficient in the offspring, was enhanced in bothscenarios.
As a conclusion we suggest a recruitment and breedingplan following scenarios 1, 3 or 4. This means that themating pairs should be decided based on low rxy with orwithout applying the cut-off value for being unrelated.
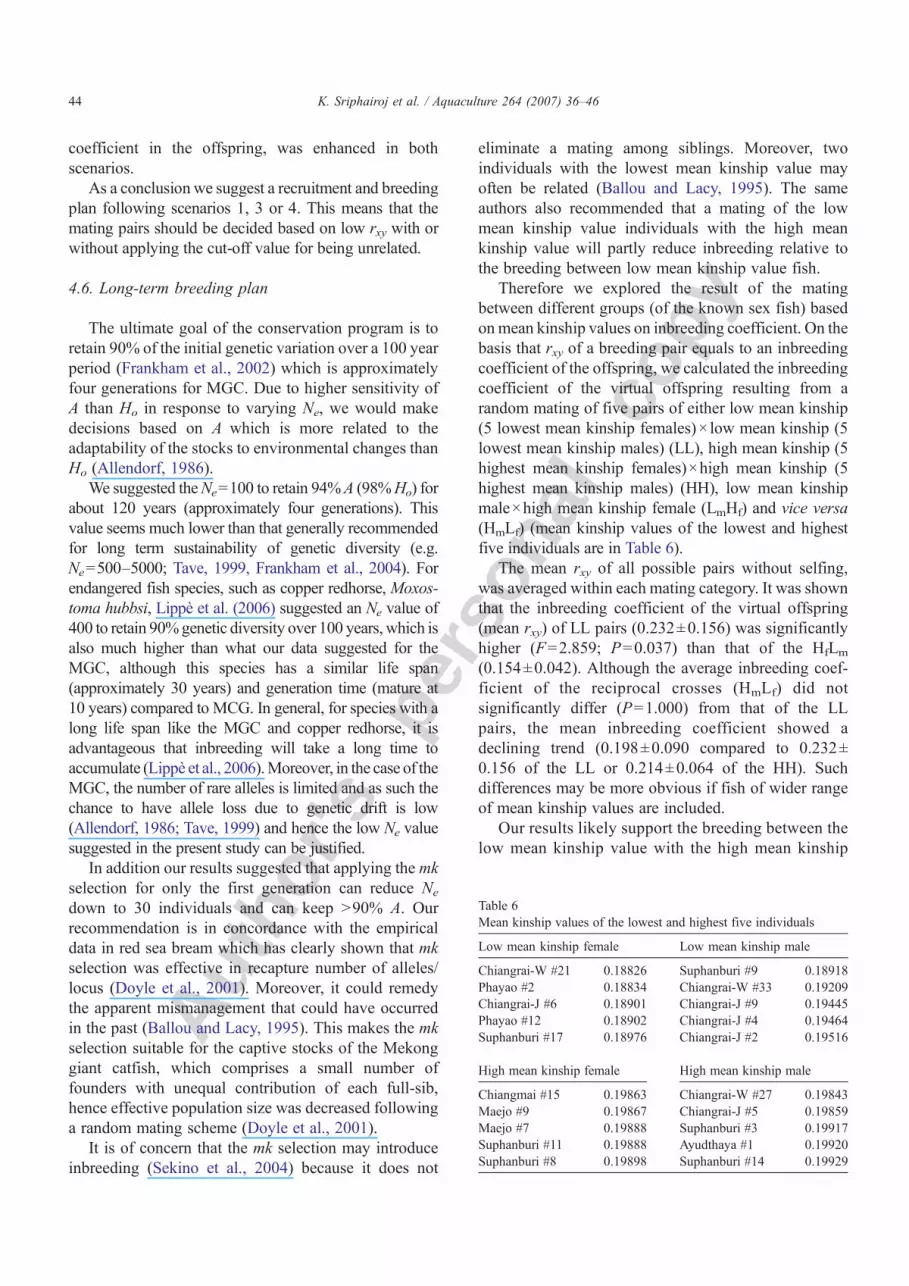
4.6. Long-term breeding plan
The ultimate goal of the conservation program is toretain 90% of the initial genetic variation over a 100 yearperiod (Frankham et al., 2002) which is approximatelyfour generations for MGC. Due to higher sensitivity ofA than Ho in response to varying Ne, we would makedecisions based on A which is more related to theadaptability of the stocks to environmental changes thanHo (Allendorf, 1986).
We suggested theNe=100 to retain 94%A (98%Ho) forabout 120 years (approximately four generations). Thisvalue seems much lower than that generally recommendedfor long term sustainability of genetic diversity (e.g.Ne=500–5000; Tave, 1999, Frankham et al., 2004). Forendangered fish species, such as copper redhorse, Moxos-toma hubbsi, Lippè et al. (2006) suggested an Ne value of400 to retain 90%genetic diversity over 100 years, which isalso much higher than what our data suggested for theMGC, although this species has a similar life span(approximately 30 years) and generation time (mature at10 years) compared to MCG. In general, for species with along life span like the MGC and copper redhorse, it isadvantageous that inbreeding will take a long time toaccumulate (Lippè et al., 2006).Moreover, in the case of theMGC, the number of rare alleles is limited and as such thechance to have allele loss due to genetic drift is low(Allendorf, 1986; Tave, 1999) and hence the low Ne valuesuggested in the present study can be justified.
In addition our results suggested that applying the mkselection for only the first generation can reduce Ne
down to 30 individuals and can keep N90% A. Ourrecommendation is in concordance with the empiricaldata in red sea bream which has clearly shown that mkselection was effective in recapture number of alleles/locus (Doyle et al., 2001). Moreover, it could remedythe apparent mismanagement that could have occurredin the past (Ballou and Lacy, 1995). This makes the mkselection suitable for the captive stocks of the Mekonggiant catfish, which comprises a small number offounders with unequal contribution of each full-sib,hence effective population size was decreased followinga random mating scheme (Doyle et al., 2001).
It is of concern that the mk selection may introduceinbreeding (Sekino et al., 2004) because it does not
eliminate a mating among siblings. Moreover, twoindividuals with the lowest mean kinship value mayoften be related (Ballou and Lacy, 1995). The sameauthors also recommended that a mating of the lowmean kinship value individuals with the high meankinship value will partly reduce inbreeding relative tothe breeding between low mean kinship value fish.
Therefore we explored the result of the matingbetween different groups (of the known sex fish) basedonmean kinship values on inbreeding coefficient. On thebasis that rxy of a breeding pair equals to an inbreedingcoefficient of the offspring, we calculated the inbreedingcoefficient of the virtual offspring resulting from arandom mating of five pairs of either low mean kinship(5 lowest mean kinship females)× low mean kinship (5lowest mean kinship males) (LL), high mean kinship (5highest mean kinship females)×high mean kinship (5highest mean kinship males) (HH), low mean kinshipmale×high mean kinship female (LmHf) and vice versa(HmLf) (mean kinship values of the lowest and highestfive individuals are in Table 6).
The mean rxy of all possible pairs without selfing,was averaged within each mating category. It was shownthat the inbreeding coefficient of the virtual offspring(mean rxy) of LL pairs (0.232±0.156) was significantlyhigher (F=2.859; P=0.037) than that of the HfLm
(0.154±0.042). Although the average inbreeding coef-ficient of the reciprocal crosses (HmLf) did notsignificantly differ (P=1.000) from that of the LLpairs, the mean inbreeding coefficient showed adeclining trend (0.198±0.090 compared to 0.232±0.156 of the LL or 0.214±0.064 of the HH). Suchdifferences may be more obvious if fish of wider rangeof mean kinship values are included.
Our results likely support the breeding between thelow mean kinship value with the high mean kinship
Table 6Mean kinship values of the lowest and highest five individuals
Low mean kinship female Low mean kinship male
Chiangrai-W #21 0.18826 Suphanburi #9 0.18918Phayao #2 0.18834 Chiangrai-W #33 0.19209Chiangrai-J #6 0.18901 Chiangrai-J #9 0.19445Phayao #12 0.18902 Chiangrai-J #4 0.19464Suphanburi #17 0.18976 Chiangrai-J #2 0.19516
High mean kinship female High mean kinship male
Chiangmai #15 0.19863 Chiangrai-W #27 0.19843Maejo #9 0.19867 Chiangrai-J #5 0.19859Maejo #7 0.19888 Suphanburi #3 0.19917Suphanburi #11 0.19888 Ayudthaya #1 0.19920Suphanburi #8 0.19898 Suphanburi #14 0.19929
44 K. Sriphairoj et al. / Aquaculture 264 (2007) 36–46

Autho
r's
pers
onal
co
py
value fish rather than the breeding between the low meankinship fish. However, this is only a short-term gain, sincethe avoidance of brother–sister mating in a random-mating population has little effect on the long-term Ne
(Falconer and Mackay, 1996). The alternative practice toavoid inbreeding would be applying mk selectionfollowing by culling of the pairs with high rxy.
4.7. Conclusions and recommendations
1. Genetic variation of the captive stocks was compa-rable to the wild stock.
2. Mean genetic relatedness (rxy) of each stock wasrelatively high compared to the overall rxy, indicatingthat using breeding pairs from different hatcheriescould assist conservation of genetic diversity.
3. For a short-term plan we suggest breeding of the 28mature males and 28 mature females that showedlowest pairwise rxy. The genetic diversity can beretained with a reduction of number of breeding pairsto 20 pairs if only the unrelated pairs (rxyb0.07) arebred.
4. For a long term plan mk selection should be appliedat least in the first generation then following by arandom mating scheme and Ne should be more than30. Accordingly it is expected that at least 90% ofgenetic variation will be preserved over 100 years.
5. As a general recommendation we suggest applyingthe mk selection approach for management of thecaptive stocks of the MGC, either for designingmating pairs or for culling of fish due to limitedhatchery resources (Ballou and Lacy, 1995).
6. In this study only 129 fish covering 5 year-classeshave been explored, further study is required to coverfish from all available year-classes.
7. Introduction of gametes from wild fish is recom-mended to increase genetic variation of the founderstock, prevent adaptation to captive environment andavoid inbreeding.
Acknowledgements
We would like to thank “Thailand Research Fund”for the funding of this research through the projectentitled “Application of Genetics and Biotechnology forSustainable Development of Aquaculture” (SeniorResearch Scholar 2004) awarded to UN. The seniorauthor was supported by the Royal Golden Jubileeprogram, TRF for her Ph.D. study. We greatlyappreciated Chiangmai Inland Fisheries Research andDevelopment Center (CIFRDC), Phayao IFRDC,Ayudthaya IFRDI, Department of Fisheries, Maejo
University, Chaomudcha Farm, Wangplabuk Farm andJaran Farm for providing samples of MGC broodstock.We thank Dr. Naruepol Sukumasavin for facilitatingsample collection, Professor Roger Doyle, Ph.D.,Genetic Computation Ltd. for his critical commentsthat substantially improved the manuscript and Dr. T.T.T.Nguyen and Mr. Simon Wilkinson, Network of Aqua-culture Centers in Asia Pacific for revision of English.Finally, we appreciate the critical comments of theanonymous referees which significantly contributed toimprovement of the manuscript.
Appendix A
Table 1
Allele frequencies of the MGC captive broodstock
Locus Allele Frequencies
Pg1 231 0.392239 0.596251 0.012
Pg2 256 0.0513258 0.1614260 0.1457264 0.0787270 0.0315272 0.0157276 0.5157
Pg3 204 0.0874206 0.0992210 0.1825212 0.2063214 0.0516218 0.0119220 0.3611
Pg6 250 0.5708252 0.1457258 0.2835
Pg16 174 0.0773176 0.0081178 0.5366182 0.0081184 0.3699
Pg17 235 0.7126241 0.0630243 0.2244
PSP-G507 251 0.4031253 0.0465255 0.1318257 0.3798261 0.0388
References
Allendorf, F.W., 1986. Genetic drift and the loss of alleles versusheterozygosity. Zoo Biol. 5, 181–190.
Archie, J.W., 1985. Statistical analysis of heterozygosity data:independent sample comparisons. Evolution 39, 623–637.
45K. Sriphairoj et al. / Aquaculture 264 (2007) 36–46
Autho
r's
pers
onal
co
py
Ballou, J.D., Lacy, R.C., 1995. Identifying genetically importantindividuals for management of genetic variation in pedigreedpopulations. In: Ballou, J.D., Gilpin, M., Foose, T.J. (Eds.),Population Management for Survival and Recovery. ColumbiaUniv. Press, New York, pp. 76–111.
Borrell, Y.J., Alvarez, J., Vazquez, E., Pato, C.F., Tapia, C.M.,Sanchez, J.A., Blanco, G., 2004. Applying microsatellites to themanagement of farmed turbot stocks (Scophthalmus maximus L.)in hatcheries. Aquaculture 241, 133–150.
Doyle, R.W., Perez-Enriquez, R., Takagi, M., Taniguchi, N., 2001.Selective recovery of founder genetic diversity in aquaculturalbroodstocks and captive, endangered fish populations. Genetica111, 291–304.
Falconer, D.S., Mackay, T.F.C., 1996. Introduction to QuantitativeGenetics, 4th ed. Addison Wesley Pub., Boston, MA. 464 pp.
Frankham, R., Ballou, J.D., Briscoe, D.A., 2002. Introduction to Conser-vation Genetics. Cambridge Univ. Press, Cambridge. 617 pp.
Frankham, R., Ballou, J.D., Briscoe, D.A., 2004. A Primer of Conser-vation Genetics. Cambridge Univ. Press, Cambridge. 220 pp.
Froese, R., Pauly, D., 2005. FishBase. Available at: www.fishbase.org,version (06/2005).
Hogan, Z.S., May, B.P., 2002. Twenty-seven new microsatellites forthe migratory Asian catfish family Pangasiidae. Mol. Ecol. Notes2, 38–41.
IUCN, 2005. 2005 IUCN Red List of Threatened Species. Available at:www.iucnredlist.org.
Kuo, C.H., Janzen, F.J., 2003. BOTTLESIM: a bottleneck simulationprogram for long-lived species with overlapping generations. Mol.Ecol. Notes 3, 669–673.
Lippè, C., Dumont, P., Bernatchez, L., 2006. High genetic diversityand no inbreeding in the endangered copper redhorse, Moxostomahubbsi (Catostomidae, Pisces): the positive sides of a longgeneration time. Mol. Ecol. 15, 1769–1780.
Lynch, M., Ritland, K., 1999. Estimation of pairwise relatedness withmolecular markers. Genetics 152, 1753–1766.
McDonald, G.J., Danzmann, R.G., Ferguson, M.M., 2004. Related-ness determination in the absence of pedigree information in threecultured strains of rainbow trout (Oncorhynchus mykiss). Aqua-culture 233, 65–78.
Mitchell, R., Braun, D., 2003. Giant catfish critically endangered, groupsays. National Geographic News. NATIONALGEOGRAPHIC.COM.
Na-Nakorn, U., Sriphairoj, K., Sukmanomon, S., Poompuang, S.,Kamonrat, K., 2006. Polymorphic microsatellite primers developedfrom DNA of the endangered Mekong giant catfish, Pangasianodongigas (Chevey) and cross-species amplification in three species ofPangasius. Mol. Ecol. Notes 6 (4), 1174–1176.
Norris, A.T., Bradley, D.G., Cunningham, E.P., 2000. Parentage andrelatedness determination in farmed Atlantic salmon (Salmo salar)using microsatellite markers. Aquaculture 182, 73–83.
Philippart, J.C., 1995. Is captive breeding an effective solution for thepreservation of endemic species. Biol. Conserv. 72, 281–295.
Phukasawan, T., Pholprasidth, S., Koocharoenphaisan, N., Supacha-lus, M., Phoorakkiat, C., Pongsirijan, S., Chatchawalchaiphan, W.,Meenakan, S., Seethasith, P., Boonyaratpalin, S., 1984. Artificialbreeding of Pla Buk (Pangasianodon gigas). Phayao FisheriesStation Annual Report 1984–1985, Freshwater Fisheries Division.Department of Fisheries, Bangkok.
Polprasit, S., Tevaratmaneekul, P., 1997. Biology and culture of theMekong giant catfish Pangasianodon gigas (Chevey, 1930). ThaiFish. Gasette 50, 441–457.
Quattro, J.M., Vrijenhoek, R.C., 1989. Fitness differences among rem-nant populations of the endangered Sonoran topminnow. cited afterPhilippart, J.C., 1995. Is captive breeding an effective solution for thepreservation of endemic species. Biol. Conserv. 72, 281–295.
Queller, D.C., Goodnight, K.F., 1989. Estimating relatedness usinggenetic markers. Evolution 43, 258–275.
Ritland, K., 1996. Estimators for pairwise relatedness and individualinbreeding coefficients. Genet. Res. 67, 175–185.
Schonhuth, S., Luikart, G., Doadrio, I., 2003. Effects of a founding eventand supplementary introductions on genetic variation in a captivebreeding population of the endangered Spanish killifish. J. Fish Biol.63, 1538–1551.
Sekino, M., Sugaya, T., Hara, M., Taniguchi, N., 2004. Relatednessinferred from microsatellite genotypes as a tool for broodstockmanagement of Japanese flounder Paralichthys olivaceus. Aqua-culture 233, 163–172.
Taggart, J.B., Hynes, R.A., Prodohl, P.A., Ferguson, A., 1995. Asimplified protocol for routine total DNA isolation from salmonidfishes. J. Fish Biol. 49, 963–965.
Tave, D., 1999. Inbreeding and Brood Stock Management. FAOFisheries Technical Paper, vol. 392. FAO, Rome. 122 pp.
Unakornsawad, Y., Pittathano, P., Khachapichat, M., 2001. Artificialpropagation of Mekong giant catfish Pangasianodon gigas(Chevey) by first felial generation broodstock (F1) rearing inearthen ponds at Phayao inland fisheries station. Inland FisheriesDivision. Department of Fisheries, Thailand.
Vrijenhoek, R.C., Douglas, M.E., Meffe, G.K., 1985. Conservationgenetics of endangered fish populations in Arizona. cited afterPhilippart, J.C., 1995. Is captive breeding an effective solution forthe preservation of endemic species. Biol. Conserv. 72, 81–295.
Yeh, F.C., Boyle, T., 1997. POPGENE Version 1.32. MicrosoftWindows-Based Software for Population Genetics Analysis (Com-puter Program). University of Alberta and Centre for InternationalForestry Research, Alberta, Canada.
46 K. Sriphairoj et al. / Aquaculture 264 (2007) 36–46


