Embed Size (px)
Citation preview

Accepted Manuscript
Protective Role of Arapaima gigas Fish Scales: Structure and Mechanical Be-havior
Wen Yang, Vincent Sherman, Bernd Gludovatz, Mason Mackey, Elizabeth A.Zimmermann, Edwin H. Chang, Eric Schaible, Zhao Qin, Markus J. Buehler,Robert O. Ritchie, Marc A. Meyers
PII: S1742-7061(14)00166-4DOI: http://dx.doi.org/10.1016/j.actbio.2014.04.009Reference: ACTBIO 3197
To appear in: Acta Biomaterialia
Received Date: 20 December 2013Revised Date: 12 March 2014Accepted Date: 8 April 2014
Please cite this article as: Yang, W., Sherman, V., Gludovatz, B., Mackey, M., Zimmermann, E.A., Chang, E.H.,Schaible, E., Qin, Z., Buehler, M.J., Ritchie, R.O., Meyers, M.A., Protective Role of Arapaima gigas Fish Scales:Structure and Mechanical Behavior, Acta Biomaterialia (2014), doi: http://dx.doi.org/10.1016/j.actbio.2014.04.009
This is a PDF file of an unedited manuscript that has been accepted for publication. As a service to our customerswe are providing this early version of the manuscript. The manuscript will undergo copyediting, typesetting, andreview of the resulting proof before it is published in its final form. Please note that during the production processerrors may be discovered which could affect the content, and all legal disclaimers that apply to the journal pertain.

Page 1
Protective Role of Arapaima gigas Fish Scales: Structure and Mechanical
Behavior
Wen Yanga, Vincent Shermana, Bernd Gludovatzb, Mason Mackeyc,
Elizabeth A. Zimmermannb*, Edwin H. Changb, Eric Schaibleb, Zhao Qind, Markus J. Buehlerd,
Robert O. Ritchieb,e,**, Marc A. Meyersa,f,g,**
a Materials Science & Engineering Program, University of California, San Diego, La Jolla, CA 92093, USA b Materials Sciences Division, Lawrence Berkeley National Laboratory, Berkeley, CA 94720, USA c. National Center for Microscope and Imaging Research Facility, University of California, San Diego, La Jolla, CA 92093, USA d Department of Civil & Environmental Engineering, Massachusetts Institute of Technology, Cambridge, MA 02139, USA e Department of Materials Science & Engineering, University of California, Berkeley, CA 94720, USA f Department of Mechanical & Aerospace Engineering, University of California, San Diego, La Jolla, CA 92093, USA g Department of NanoEngineering, University of California, San Diego, La Jolla, CA 92093, USA
Abstract
The scales of the Arapaima (Arapaima gigas), one of the largest freshwater fish in the world, can
serve as inspiration for flexible dermal armor. Each scale is composed of two layers: a laminate
composite of parallel collagen fibrils and a hard, highly mineralized surface layer. We review the
structure of the Arapaima (Arapaima gigas) scales and examine the functions of the different layers,
focusing on the mechanical behavior including tension and penetration of the scales with and without the
highly mineralized outer layer. We show that the fracture of the mineral and the stretching, rotation, and
delamination of collagen fibrils dissipate a significant amount of energy prior to catastrophic failure,
providing high toughness and resistance to penetration by predator teeth. We show that the Arapaima’s
scale has evolved to minimize damage from penetration by predator teeth through a Bouligand-like
arrangement of successive layers consisting each of parallel collagen fibrils with different orientations.
This inhibits crack propagation and restricts damage to an area adjoining the penetration. The flexibility
of the lamellae is instrumental to the redistribution of the compressive stresses in the underlying tissue,
decreasing the severity of the concentrated load produced by the action of a tooth. The experimental
results, combined with small angle x-ray scattering characterization and molecular dynamics simulations,
provide a complete picture of the mechanisms of deformation, delamination and rotation of the lamellae
during tensile extension of the scale.
Keywords: Arapaima; fish scales; armor, collagen; delamination; strength; toughness
*currently at Department of Osteology & Biomechanics, University Medical Center Hamburg-Eppendorf, 22529 Hamburg,
Germany. **
corresponding authors: Robert O. Ritchie ([email protected]), Marc A. Meyers ([email protected])

Page 2
1. Introduction
Natural protective layers, exhibited by seashells, fish scales, turtle carapaces, armadillo and alligator
osteoderms, have developed and refined over hundreds of millions of years through a process of
convergent evolution [1]. These biological materials have hierarchical architectures and exhibit excellent
properties with complex mechanisms of failure avoidance. They are inspiring man-made structural
materials that are lightweight and demonstrate outstanding toughness; good examples are nacre-inspired,
freeze-cast structures [2-4].
Dermal protection of animals ranges from rigid to flexible. Flexibility enables mobility while rigid
components maximize protection. Fish scales uniquely combine these two traits, and can be classified into
four groups: placoid [5,6], ganoid [7-9], cosmoid [10-12], and elasmoid (cycloid and ctenoid) [13-16].
Yang et al [1] reviewed the four types and gave the schematic drawing of their morphologies as well as
connection mechanisms. Placoid scales are denticles, or small modified teeth, which cover the
cartilaginous fish’s skin. They give the skin a rough feel, and may contribute to favorable water flow
while swimming. Ganoid scales are recognized by a thick surface layer of enamel or ganoine, on top of a
dentin or bony base. Cosmoid scales consist of a double bone layer-lamellar and vascular bone, the outer
layer is considered as a dentin-like cosmine. Elasmoid scales are thin, lamellar collagenous plates.
Cycloid scales are composed of concentric rings, and ctenoid scales are composed of fringed projections
along the posterior edge. In fish, scales are lightweight and enable flexibility to swim, yet are sufficiently
rigid to provide protection from predators.
Most fish scales have similar constituent materials: calcium-deficient hydroxyapatite (HAP) and type
I collagen fibrils [17-19]. The mineralized collagen fibrils form different architectures, such as the
plywood structure [20-22] or, in the case of ganoid scales, a bony structure with a complex structure
interlaced with HAP crystals [7,8]. Additionally, scales commonly exhibit a composite or graded structure
with hardness decreasing from the outer to the inner layers.
Studies on the penetration of scales using either real teeth or simulated indenters to mimic fish bites
provide a good estimate of the effectiveness of the scale’s complex structure. Zhu et al. [16] penetrated
single scales of striped bass (Morone saxatilis) with a sharp indenter, and analyzed the sequence of
events, dividing it into three stages: elastic deflection of the scale, fracture of the mineralized layer, and
penetration of the collagen lamellae. Meyers et al. [23] penetrated the Arapaima scale with a real piranha
tooth since piranha is the major predator to arapaima in Amazon River; despite being twice the hardness
of the scales, the tooth failed to penetrate them. Zhu et al. [24] found that over-lapping three scales
essentially multiplies the puncture resistance by three. Friction between the scales is negligible, and
therefore does not generate additional resistance to deformation and puncture, regardless of the

Page 3
arrangement of the scales. The force dispersal from scales prevents unstable localized deformation of the
skin and damage to underlying tissues. Finite element modeling of the penetration into ganoid [25] and
elasmoid [26] scales was conducted to establish the interactions between tooth sharpness, scale flexibility,
and other parameters.
It was established by Lin et al.[22], Meyers et al. [23], and Zimmermann et al. [27] that the structure
of the Arapaima scale consists of an external layer with a highly mineralized, rough surface and inner
foundation of collagen layers organized in a Bouligand-type structure with lamellae of parallel collagen
fibrils (~50-60 µm thick) in different orientations. However, the understanding of the fundamental
mechanisms of deformation and damage avoidance in elasmoid scales is still incomplete. The objective of
this work is to present a comprehensive evaluation of the mechanisms governing the strength, ductility
and toughness of the scales of the Arapaima fish (Fig. 1a) through three complementary methods:
experimental, analytical and computational. The damage mechanisms of the penetration by teeth are
identified and quantified through controlled experiments. The principal experimental method is the in situ
observation of the deformation of a scale. This is supplemented by an analysis based on the interaction
between the different lamellae and by molecular dynamics calculations.
2. Experimental Procedures
The Arapaima scales (Fig. 1b), which typically are 50 to 120 mm in size, were characterized using a
range of experimental procedures to determine their structure, water preservation and mechanical
performance. In particular, indentation and tensile tests were performed on whole scales and on the
collagen layer alone (after removing the outer mineral layer) to establish the individual function as well as
deformation and fracture mechanisms in each layer. Additionally, the local behavior of the collagen was
investigated using in situ small angle x-ray scattering studies during uniaxial tensile testing; this behavior
was also analyzed using molecular dynamics (MD) techniques to quantitatively predict the controlling
damage mechanisms in the inner layer.
2.1 Characterization of scales
The structure of the scales, as well as failure mechanisms and distribution of damage after
mechanical testing, were investigated in a FEI SFEG Ultra High Resolution (UHR) scanning electron
microscope (SEM) (FEI, Hillsboro, OR), Veeco scanning probe microscope (Veeco, Plainview, NY) and
a FEI Tecnai 12 transmission electron microscope (FEI, Hillsboro, OR) operating at 120kV. All samples
for SEM characterization were sputtered with iridium prior to observation.

Page 4
Two types of samples were examined to establish water preservation ability: sections of the full-
thickness scale and sections of the inner layer. The inner layer samples were prepared by grinding the
external layer away from the entire scale with 180# to 2500# silicon carbide paper. The samples were first
soaked in fresh water for more than 24 h and dried in air at relative humidity of ~78%. Weight
measurements were taken every 3-4 min for each sample.
2.2 Penetration and indentation
The penetration resistance of the entire scale including the external layer was examined using an
Instron 3367 mechanical testing machine (Instron Corp., Norwich, MA) with a load cell of 30 kN. The
scales in fish are in general designed to resist penetration by teeth. In the case of the Arapaima scales, this
necessity is extreme due to the sharp teeth of their principal predator, the piranha. It was demonstrated by
Meyers et al. [23] that the piranha tooth is unable to penetrate through the scales without being arrested or
broken by the highly mineralized external layer of the scale. A piranha tooth was removed from the fish’s
head and attached to the upper punch in order to indent the entire Arapaima scale (through the external
layer) which was glued on a synthetic rubber layer with a compressive elastic modulus of ~10 MPa
attached to the lower punch. The low modulus of the rubber simulates the muscle under the scale, which
was established by Meyers et al. [23]. The penetration tests were performed at a displacement rate of 10
mm/min. Indentation of the inner layer (lamellar structure without mineralized surface) was carried out
using an indentation load of 1 kgf and a holding time of 10 s using a LECO M-400-H1(LECO, Joseph,
MI) hardness testing machine. Both types of penetration/indentation tests were performed on wet scales
(kept in water at 25°C for 12 h).
2.3 Tensile behavior
Using a surgical blade, 15 x 2.3 mm tensile samples were cut in two orientations (Fig. 1) from the
scales with thicknesses of 0.6 to 1.2 mm. The outer layer of some samples were removed using silicon
carbide polishing paper of 180# to 2500# leading to final thicknesses between 0.6 and 0.8 mm (Fig. 1b).
In order to prevent slippage, the ends of the samples were glued between sand paper sheets using
cyanoacrylate glue resulting in a gauge length of roughly 8 mm. Uniaxial tensile tests were carried out on
an Instron 3342 mechanical testing machine (Instron Corp., Norwich, MA) with a load cell of 500 N at a
strain rate of 10-2 s-1 immediately following the removal of samples from fresh water, where they were
kept prior to testing. The tensile results were expressed in terms of engineering stress-strain curves. The
ultimate tensile stress, uniform elongation (strain at maximum stress) and the toughness, as measured by
the area beneath the stress-strain curves, were established.

Page 5
2.4 In situ observation under tensile loading
To discern the salient energy absorbing mechanisms during penetration and to visualize the
distribution of damage and corresponding resistance to cracking, both rectangular tensile samples and
single-edge notched tension (SE(T)) samples, with and without the mineral layer, were prepared in the
longitudinal direction with an 8 mm gauge length using the same dimensions and procedures as in section
2.3. The notch in the SE(T) samples was first cut using a diamond blade and sharpened by polishing with
a razor blade irrigated in 1 µm water-based diamond suspension; the resulting micro-notch had a depth of
approximately half the specimen width with a consistently sharp root radius of ~5 µm.
Uniaxial tension tests were performed at 25ºC in a Hitachi S-4300SE/N (Hitachi America,
Pleasanton, CA) SEM under wet conditions. Due to the dehydrating nature of the vacuum, some
dehydration is inevitable. To minimize this effect, the samples were soaked in water for at least 12 h
prior to testing. Testing was performed at a displacement rate of 0.5 mm/min using a Gatan Microtest 2
kN bending stage (Gatan, Abington, UK) inside the SEM; the samples were imaged in electron back-
scatter mode under variable pressure conditions at a vacuum of 35 Pa. Due to the moisture in the fish
scale, a vacuum is difficult to attain, and the 35 pressure is mostly water vapor. Under the vacuum, the
outer surfaces will quickly dehydrate, while the interior of the scale remains hydrated until exposed. Due
to the excessive deformation during testing, as well as constant and significant relaxation during imaging,
a reliable measurement of load and displacement could not be obtained; consequently, the stress-strain
curves, fracture toughness and crack-resistance curves (R-curves) could not be measured.
2.5 Small angle x-ray scattering (SAXS)
Rectangular samples, 15 x 1 mm in size with ~0.6 mm thickness, were sectioned with a razor blade
using the same polishing procedures described above. The scales were hydrated in water for 12 h prior to
mechanical testing. Gauge length of 10 mm was used in the in-situ SAXS tests.
The hydrated samples were loaded in uniaxial tension and exposed to x-rays at beamline 7.3.3 at the
Advanced Light Source (ALS) synchrotron at the Lawrence Berkeley National Laboratory (Berkeley,
CA). The mechanical tests were performed with a custom-made rig using a 10 mm displacement stage
and an Omega LC703-10 load cell, calibrated to 45N, to measure the force; this set-up permits SAXS data
collection to be recorded in real time with the simultaneous measurement of the load-displacement curve.
The mechanical tests were performed at 25°C at a displacement rate of 1 µm/s, on hydrated samples
maintained through the use of a hydration cell comprising of a strip of cellophane held to the sample
through capillary action of a few drops of water.
A Pilatus 1M detector (Dectris Ltd., Baden, Switzerland), used to collect the SAXS data, was located
at the largest allowable distance from the sample (~4 m) to permit detection of the fine changes in the

Page 6
collagen peak positions. The sample was exposed to x-rays for 0.5 s at ~5 s intervals during mechanical
testing. Further details concerning the data collection and analysis are given in Zimmermann et al. [27].
2.6 Preparation of transmission electron microscopy specimens
The preparation procedures used for biological specimens involved a number of stages. The
Arapaima scales were first immersion fixed in 3% glutaraldehyde in 0.15 M sodium cacodylate buffer
(pH 7.4) for 4 h, and then post-fixed using 1% OsO4 solution with 8% potassium ferrocyanide in 0.15 M
sodium cacodylate buffer for 12 h at 4°C . The scales were subsequently stained with 2% aqueous uranyl
acetate for 12 h and dehydrated with an ascending ethanol series (50%, 70%, 90%, and 100%), followed
by a 1/1 ratio of 100% ethanol and 100% acetone and finally 100% acetone. Samples were then
embedded in Spurr's Low Viscosity resin and polymerized at 60°C for 48 h. Samples were subsequently
sectioned perpendicular to the scale surface to generate slices 80 nm to 200 nm thick using a Leica
Ultracut UCT ultramicrotome (Leica, Wetzlar, Germany) and a Diatome diamond knife (Diatome,
Hatfield, PA). The sections were post stained with 1% uranyl acetate for 10 mins and Sato lead for 1 min.
At this stage they were ready for examination in a FEI Tecnai 12 transmission electron microscope at 120
kV.
2.7 Preparation of atomic force microscope specimens
The lamellae with the thickness of ~ 200 µm were peeled off from the inner layer of Arapaima fish
scales. The inside peeled surfaces of the lamellae samples were probed in water by Veeco scanning probe
microscope using the SNL-10 Bruker tips (Bruker, Billerica, MA).
2.8 Molecular dynamics (MD) analysis
A molecular dynamics model, based on a simple elastic network model [28,29], was used to
theoretically investigate the mechanisms of the deformation and delamination in the Arapaima scales
under uniaxial tension. This model does not take the fibrils as elements but rather considers the larger
collagen fibers to better simulate the response of the lamellae. Based on Lin et al. [22], the initial inter-
bead distance is �� =1 µm, which is the same as the average diameter of the collagen fiber dc. Each
collagen fiber is modeled as a series of beads connected by harmonic springs. Since the density of the
collagen as 1.34 × 10 kg/m3, the mass of each bead is equal to 1.05 × 10� � kg. The total deformation
energy of the simulation system is given by:
������ = �� +�� +����� . (1)
As the total energy (������) is given by the sum over all pair wise (��), three-body (��) and weak inter-
fiber interactions ( ����� ) where �� = ∑ �����, !"# �� = ∑ ���$�%#" &'%( and

Page 7
����� = ∑ ��������)*)+,-.// with ����� as the energy of inter-bead spring in tension, ���$� as the
energy of angular spring in bending and interaction energy of inter-fiber beads. Here ����� = 0�� − ���2
is the energy of each inter-bead spring in tension, where K as the stiffness of the springs is assigned
according to 0 =34
2)5 (estimated value of the Young’s modulus of collagen fiber, E = 2 GPa), and
6 =789
: as the cross section area of the collagen fiber. An angular spring between two neighboring
springs is used to define the bending stiffness of the collagen fiber, and its energy is given by �;�$� =
0;�$ − <�2 where the the bending stiffness of the thread is given by:
0; = >?%/�2��� = ><BC:/�128��� , (2)
where ?% is the area moment of inertia of the cross-section. The inter-fiber interaction is denoted by:
�������� = 4EF�G/�� 2 − �G/��HI , (3)
where E is the interaction energy between two inter-fiber beads that is given by E = BC��J as J is the
surface energy of the collagen fibers, and G = BC/√2L
decides the equilibrium distance between two
neighboring collagen fibers, which equals to d for this selection. To ensure that the collagen fibers only
interact with their nearest neighbors, the cutoff of the interaction is set as �CM%NOO = 1.5BC.
The model of the Arapaima scale is composed of multiple layers of parallel collagen fibers [22]
making specific angles which were found to vary from 35 to 85º. Considering that the mean angle
between two neighboring lamellae is ~60º, it suffices to model three lamellae with 60º (one central
sandwiched between two lamellae) to capture the most important events. For simplicity, each lamella is
modeled by three layers of collagen fibers that initially align in the same direction; the thickness of each
lamella is ~3 µm. This is much lower than the actual lamellar thickness, ~50 µm, but sufficient to capture
the essential phenomena since we also include the periodic boundary conditions in the direction
perpendicular to the lamellae.
We apply a uniaxial tensile strain to deform the entire multi-lamellar film in a quasi-static way. For
every deformation increment, we apply a uniaxial strain of 0.004 to the model, fix the single layer of
beads at the two ends of the lamellae along the pulling direction, and carry out energy minimization and
equilibrium for 20,000 integration steps. We record the total force applied to the beads at the boundaries
and obtain the stress-strain curve of the material during deformation. We also monitor the deformation of
all the collagen fibers during the entire loading process. This model enables a systematic investigation of
how different mechanical and geometric characteristics of the Arapaima scale influence its response to
loading, e.g., the angle between two lamellae, the inter-fiber interaction strength and the stiffness of a
single collagen fiber.

Page 8
3. Results
3.1 Structure characterization
The cross-sectional structure of the entire Arapaima scale is shown in Fig. 1c. Three parameters can
be used to describe the geometrical characteristics of scales [30]: aspect ratio (= total length/thickness),
degree of imbrication (= exposed length/total length) and the angle of scales with the surface plane. The
(elasmoid) scales of this fish have an aspect ratio of ~50 and a degree of imbrication of 0.4 (Figs. 1a-b).
They consist of hydroxyapatite and type I collagen arranged in two distinct layers: a rough, highly
mineralized, outer layer and a poorly mineralized collagen inner layer (Fig. 1c). Our group (Lin et al.[22])
performed FTIR and showed several strong absorption peaks, similar to previous studies (Ikoma et al.,[
14] and Torres et al.,[31]). The absorption peaks at 1637, 1546, and 1239 cm−1 are the three characteristic
peaks which correspond to amide I, amide II, and amide III of type I collagen. Lin et al.[22] present a
table (Table 1) comparing the peaks in three papers. There are also peaks at around 1000 cm−1, which
represent the phosphate groups at 872, 1401, and 1450 cm−1 and correspond to carbonate anions. Within
the inner layer, the fibrils align parallel within layers called lamellae that have a characteristic thickness
of 50~60 µm [22,31]. Neighboring lamellae are rotated to form a twisted plywood structure similar to that
proposed by Bouligand [32]; we refer to this as the Bouligand-type structure (Fig. 1d). Fig. 1e shows the
extremity of a specimen that was stretched until complete failure (strain ~0.3); the arrangement of the
different orientations of collagen fibrils in the Bouligand-type structure is clear. Collagen lamellae are
labeled from the outside to the inside as A to E. It is apparent that the angles between the fibrils of
adjacent lamellae are not equal, as would be the case for the classical Bouligand structure. Using the
nomenclature defined in Fig. 1e, these angles are: α1 = 86.7°, α2 = -34.5°, α3 = -69.2°, α4 = 66.9°, i.e.,
displaying an irregular orientation which varies from lamellae to lamellae.
The properties of the scales are highly dependent on the level of hydration [22], due to the effect of
water molecules on the bonding between fibrils, as computed by Gautieri et al. [33]. The calculated
density of collagen decreases from 1.34 to 1.19 g/cm3 with hydration and is accompanied by a decrease in
the Young’s modulus from 3.26 to 0.6 GPa.
Fig. 2 shows the individual collagen fibrils imaged by transmission electron (TEM) and atomic force
(AFM) microscopy. The fibrils imaged in Fig. 2a are not equiaxed because the foil plane is not exactly
perpendicular to the fibril axis. The fibrils, initially cylindrical, become faceted because of the necessity
of tight stacking and the lamellar orientation. In Fig. 2b two fibril orientations from two adjacent lamellae
are imaged. The fibrils in the left image are close to perpendicular to the foil plane; the ones in the right
image are close to parallel. The interface between lamellae with different orientations is abrupt, i.e., there
is no gradual transition stage. The fibrils are cylindrical and arranged in the most compact fashion. The

Page 9
surfaces at which adjacent fibrils touch are somewhat flattened, enabling a tighter stacking. The apparent
period in the collagen fibrils measured in the TEM micrograph of Fig. 2b is ~ 50 nm. The banding
consists of three white radial lines, due to the fact that the foil thickness (60-200 nm) can exceed the fibril
diameter. Thus, two or three fibrils may simultaneously be imaged, creating the unusual pattern. The d
period of the collagen in the right side of Fig. 2b is less than the expected value of 67 nm. This indicates
that this lamella is not parallel to the foil plane but at an angle. Assuming a d period of 67 nm, one obtains
an angle between the fibril and the foil of 42°. Assuming that the fibrils on the left are perpendicular to
the foil axis, the angle between the two lamellae is (90-42) = 48°, confirming that the angles between
adjacent lamellae vary.
Atomic force microscopy corroborates the TEM characterization and provides additional detail (Figs.
2c-d). Since the fibrils were peeled from the scale and the AFM tip provides an accurate representation of
the surface, the d banding observed is the actual value of 67 nm. This is shown clearly in Fig. 2d. The 3-D
rendition in the lower left hand corner of Fig. 2d shows that the fibrils are indeed cylindrical.
3.2 Protective function of the entire scale against penetration
The penetration of the scale by a piranha tooth (Figs. 3a,b) is severely hampered by the mineral layer,
amounting to ~1 mm deep indentation into the scale under a 1 kgf load applied for 10 mins, with
relatively minimal damage around the indent (shown in Fig. 3a). The surroundings of the indent were
damaged more seriously due to the severity of load concentration and serrations on the edge of the teeth
(shown by the detail in Fig. 3a). Two orientations of collagen fibrils were exposed at the wall of the
indent (circular line in Figure 3a) as the external layer became damaged (Fig. 3b); the fibrils are
delaminated, fractured, and change orientation (Fig. 3b); these processes permit the internal collagen layer
to dissipate energy during penetration.
Figs. 3c,d show the damage from penetration of a microindenter in the collagen layers (without the
mineral layer). In the vacuum of the SEM, the collagen layers dry and shrink, and separation between
collagen fibers becomes evident, which is not characteristic of the intact, water-saturated scale.
Nevertheless, the damage mechanisms around the indentation can still be clearly seen. Different
orientations of collagen fibers are observed at different levels. The potential indentation region is marked
by the dashed square in Fig. 3c. Collagen fibers are bent and fractured through the action of the indenter,
but the overall effect of the different lamellar layers is to localize damage to the immediate vicinity of the
indenter, without propagation throughout the scale. The failure of the collagen fibers is preceded by
deflection, stretching, and necking, characteristic of significant inelastic deformation prior to failure (Fig.
3d). As a result, crack initiation and propagation are avoided.
3.3 Tensile mechanical behavior of scales

Page 10
Fig. 4 shows the uniaxial tensile response of the entire scales and the collagenous lamellar layer (after
removal of the external mineralized layer) in the longitudinal and transverse orientations defined in Fig.
1b. Three specimens were tested in each condition. Additionally, the tensile response of the collagenous
lamellar layer including the load-time curve and the behavior of collagen fibrils in different lamellae is
also determined by SAXS tests which will be discussed in Section 3.5. Based on these tests, the following
results can be deduced (deformation mechanisms are discussed below in Section 3.5):
a. The strength of the scales is about 50% higher in the longitudinal than in the transverse
orientation, indicating that the lamellae are not distributed to produce in-plane isotropy. Contrary
to our results, Zhu et al.’s [24] measurements on striped bass show that specimens with an
orientation of 45° and 90° to the longitudinal axis of the fish have higher strengths (~60 MPa)
than the 0° orientation (~40 MPa). This shows that in-plane anisotropy exists in both the cycloid
and ctenoid scales. The strength of the scales including the mineralized layer in the longitudinal
direction (23.6 MPa) is considerably higher than in the transverse direction (14.2 MPa).
b. Removal of the external and highly mineralized outer layer increases the tensile strength of the
scale. Although this appears to be counter intuitive, it results from several factors. Most
importantly, the external layer is designed for compressive strength; being highly mineralized it is
brittle and weak in tension. This is consistent with the SEM images in Figs. 5a,b which show the
tension samples in the transverse orientation after failure; the external layer fractures in a brittle
manner either through the attack of a piranha or other circumstances leading to tensile stresses in
that layer (Fig. 5a: mineralized layer is labeled 1 and has a thickness of ~280 µm). Such a
fractured layer cannot carry any load which leads to a decreased strength of the entire scale
resulting from the increased cross section compared to the collagen-only samples. Additionally,
due to failure of the outer mineral layer, there is very likely significant damage evolution in the
form of delamination and separation of fibers in adjacent lamellae prior to failure of the entire
scale (Fig. 5c). Fig. 5a shows five lamellae, marked by numbers 1-5 (thickness 50~60 µm),
throughout the thickness of the scale; the lamellae close to the mineral layer might be hindered in
their ability to rotate upon tensile loading which could reduce the strength of the collagen layer.
The function of the mineralized layer can be rationalized through a comparison with modern
armor, which consists of a hard face supported by a tougher foundation. The hard layer operates
under compression and therefore resists projectile penetration, whereas the backing, being
tougher and more flexible, ensures the integrity of the structure.
c. The tensile behavior of the collagen layers was examined in the wet condition; the solid plots in
Fig. 4 represent the tensile stress-strain curves of these collagen layers. It is interesting to note
that the collagen layers in the transverse orientation have the same modulus as the scale, but a

Page 11
larger strain at failure, suggesting that when the scale is dried and bent in this orientation, cracks
are not easily generated. Table 1 shows the tensile properties of the scale in the two orientations
(longitudinal and transverse). As noted above, the collagen-only samples have a higher strength
and display higher uniform strain and energy dissipation (as measured by the area under the stress
strain curves) than the complete scale samples.
3.4 Tensile behavior of the lamellar structure in notched and unnotched specimens
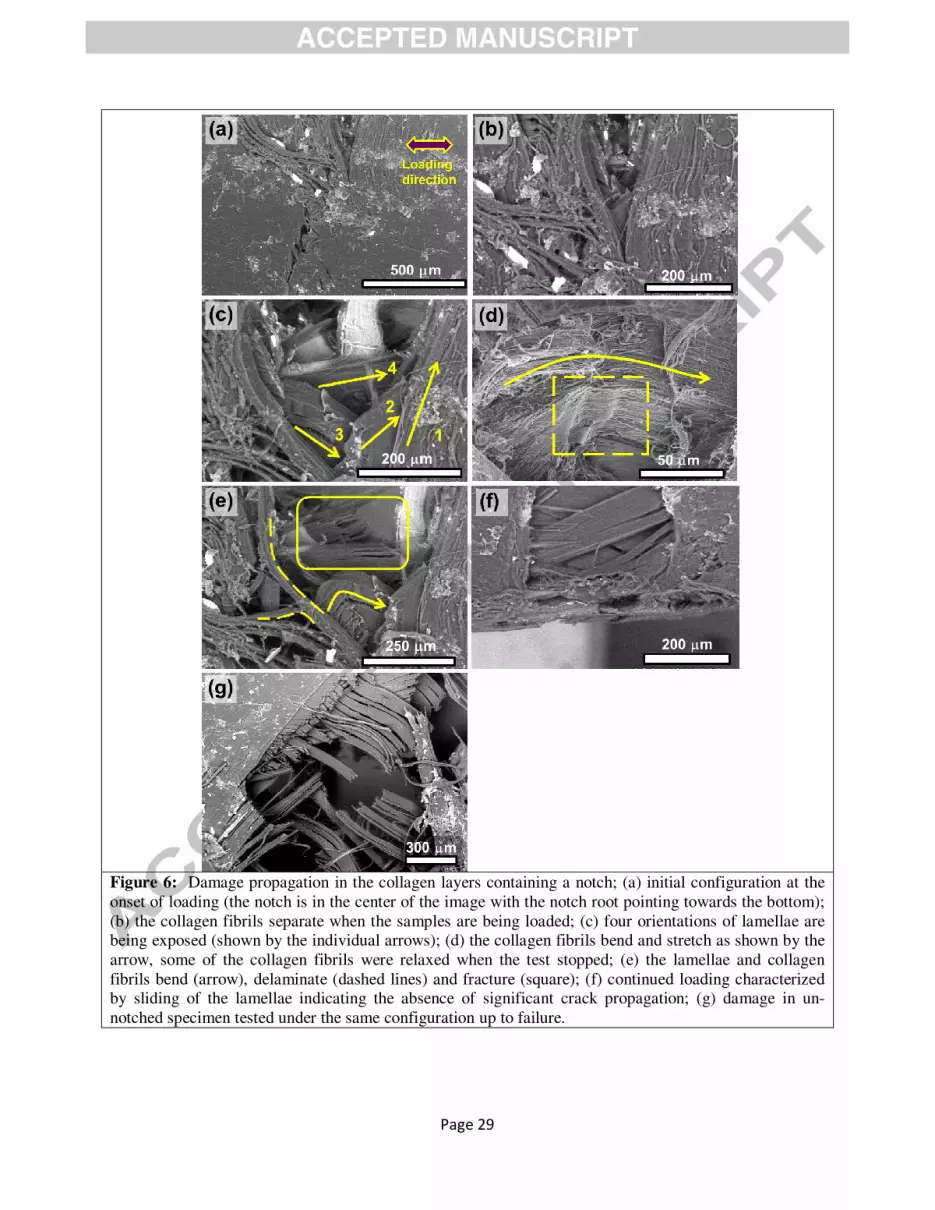
Fig. 6 shows crack propagation in a specimen in which the highly mineralized external layer was
removed, i.e., exclusively in the lamellar structure of the collagen. A crack starting from the root of the
notch is forced to grow under the action of tensile forces with a direction marked in Fig. 6a. At the onset
of crack propagation, collagen fibers in different orientations are exposed and show different damage
mechanisms (Figs. 6b-c). The top lamella (labeled 1), with an orientation of the collagen fibrils
perpendicular to the loading direction, undergoes separation by splitting. The fibers in the other
underlying orientations (labeled 2, 3, 4) are more closely aligned to the loading direction and are stretched
and rotated. The fibrils (labeled 2) close to the split lamella (labeled 1) fracture; however, some lamellae
(labeled 3 and 4) are only stretched and rotated (Figs. 6c-d). Some collagen fibrils are bent (arrow in Fig.
6d) by the loading and then relaxed and curved back after unloading or fracture (dashed square). The full
range of failure mechanisms, specifically delamination, tensile failure, rotation and bending of fibrils, is
shown in Fig. 6e. Due to the high flexibility of the collagen lamellae and excessive failure distribution
upon tensile loading tests, samples showed large crack-tip openings but negligible crack propagation.
Failure mechanisms of samples with a highly mineralized external layer occurred in a comparable manner
to samples without an outer layer and are hence not shown individually. Figs. 6e-f show the progression
of damage without any appreciable increase in the crack length.
The individual deformation process and mechanism occurring in a tensile test from an unnotched
sample are additionally shown in Fig. 6g and Figure 7 using SAXS method. The splitting of the individual
layers, their rotation and separation as well as curling of fractured fibrils can be also seen. This
demonstrates that the processes of fiber rotation, stretching, separation, and reorientation occur in the
entire specimen being subjected to deformation
3.5 Small angle x-ray scattering, diffraction, and mechanisms of collagen reorientation
Synchrotron radiation has been used previously to measure the reorientation and elastic stretching of
collagen in bone [35,36] and human aorta [37,38]. The current results for Arapaima gigas confirm the
previous analyses but importantly introduce another element: the organized reorientation of the lamellae

Page 12
of parallel collagen fibrils, a process that is significantly different from that in other biological systems
and which results from the Bouligand-like structure.
Small angle x-ray scattering (SAXS) tests were performed on the inner collagen layer to reveal and
quantify the mechanisms of collagen lamellae deformation and reorientation during tensile straining,
which are essential to the understanding of the resistance of the scale to external loading. The procedures
and detailed results are described by Zimmermann et al. [27]; only the principal mechanisms are
introduced here to highlight the modes of deformation. The uniaxial load-extension curves on the
collagen layer, taken during the SAXS experiment, show an approximately linear response, in agreement
with the tensile results of Fig. 4. As the lamellae within the scale’s inner collagen layer have a Bouligand-
type structure, each lamella will have a distinct orientation that is visible in the 2-D x-ray diffraction
pattern. Thus, the strain and orientation of the collagen fibers in each lamella can be measured during
tensile deformation; the reorientation is clearly visible through the change in the orientation of the arcs
with respect to the tensile axis and the strain can be measured by the change in the arc’s radial position
with respect to the beam center. Four points are marked in the tensile stress-strain plot measured where
small angle x-ray scattering observations were recorded (Figs. 7b-e, respectively), corresponding to points
1-4: before testing (point 1), during testing (point 2), at the peak load (point 3), and after testing (point 4).
In the SAXS images, as the collagen fibrils rotate, the angle of the arcs on the SAXS spectra changes; the
dash-two dots lines show the tensile loading direction, the dashed lines show the original orientations of
collagen fibrils before testing, the dash-dot lines show the changed orientations of collagen fibrils after
the testing starts.
Before testing, two main orientations of collagen make angles of ψ1= 43° and ϕ1=49° to the tensile
loading direction (Fig. 7b). During tensile testing, the collagen fibrils rotate towards the tensile direction
(Fig. 7c) such that ψ2= 41° and ϕ2=35°. At the peak load, the two fibril orientations rotate closer to the
tensile direction: ψ3= 21° and ϕ3=12°. At this point, the SAXS patterns (arcs) of collagen fibrils in two
orientations almost meet each other (Fig. 7d). After sample failure (Fig. 7e), one orientation of collagen
fibrils releases back to a larger angle (ϕ4=22°), whereas the other fibril orientation can no longer be seen,
which implies possible fracture.
Such rotations of collagen fibrils both towards and away from the loading direction observed in the in
situ SAXS experiments can be attributed to two principal mechanisms:
a. Collagen fibril rotation towards tensile loading through interfibrillar shear and elastic
stretching (Fig. 8a). When a bundle of collagen fibrils aligned in the same orientation rotate
towards the tensile direction, the interfibrillar hydrogen bonds break so that the collagen fibrils
can experience shear strain. Fig. 8a shows the collagen fibrils rotating toward the tensile
direction (ψ1 ≤ ψ0), as well as their elastic stretching, leading to a tensile strain ε = (L1- L0)/ L0,

Page 13
where L0 is the initial projected fibril length, L1 is its stretched length projected in the tensile
direction, d0 and d1 are the spacing characteristic of collagen fibrils (d period) before and after
stretching, respectively.
b. Orientation of collagen fibrils change due to formation of an interfibrillar gap (Fig. 8b). When
a lamella with collagen fibrils makes a large angle with the loading direction, the fibrils can
separate allowing a gap to open up; thus, regions with two new orientations of collagen fibrils
are generated with one at a larger angle (ψ1 >ψ0) and another at a smaller angle to the loading
direction (ψ2 < ψ0). In addition to the above mechanisms, Zimmermann et al. [27] consider
‘sympathetic’ fibril rotation, which can rotate the fibrils toward the tensile axis.
In summary, for collagen fibrils aligning at a small angle to the tensile direction, fibril rotation can
easily occur towards the loading direction, whereas for fibrils at a larger angle this rotation is far more
difficult. Both rotation toward and away from the tensile axis can be induced.
The rotation of the lamellae toward the tensile axis can be calculated as a function of the total applied
tensile strain when the initial angle ψ0 is small. Two components of strain are considered. The total strain
is obtained from the elastic stretching of fibrils (εel) associated with the increase in d-period of collagen
and from the fibril rotation (εr) that is the result of interfibrillar shear:
elrt εεε += . (4)
The strain due to the rotation of the fibrils (involving interfibrillar shear and ignoring the fibrillar
stretching) is directly obtained from Fig. 8a; it is equal to:
10
1
0
01 −=−
=ψ
ψε
Cos
Cos
L
LLr . (5)
The elastic strain, shown by the increase in the d period from d0 to d1 (d1 > d0), also has to be expressed in
the tensile direction, considering the fibril length Lf and its initial and deformed values, Lf0 and Lf1:
100
11
00
0011−=
−=
ψ
ψ
ψ
ψψε
CosL
CosL
CosL
CosLCosL
f
f
f
ff
el . (6)
The elastic stretching of the collagen fibers follows the linear equation, where Ef is the elastic modulus of
the fibrils, estimated to be 2 GPa by Gautieri et al. [33]. Thus:
ff
ff
EL
LL σ=
−
0
01 . (7)
Substituting Eqn. 7 into Eqn. 6 and this result with Eqn. 5 into Eqn. 4 gives the strain in the collagen
fibrils:

Page 14
220
1 −
+=
f
tECos
Cos σ
ψ
ψε . (8)
The constitutive behavior for an assembly of collagen lamellae has been expressed, as a function of strain
rate, though a viscoelastic relationship [22]. The one commonly used for biological materials is called
Ramberg-Osgood equation [39]; it was originally developed for metals but its use in the viscoelastic
response of bone is well recognized [40]. It describes the strain-rate sensitivity m of the elastic modulus E
(which is expressed as σ/ε):
m
t
C
=
•
•
0ε
ε
ε
σ, (9)
where C is an experimentally measured parameter, is the strain rate and is a normalization
parameter, which we can assume to be equal to 1 s-1. Indeed, Lin et al. [22] demonstrated that the
Arapaimas’ collagen exhibits a high value of m ~ 0.26, with the constant C = 1.5 GPa. Substituting Eqn. 9
into Eqn. 8, we obtain:
22
00
1 −
+=
•
•
f
t
m
tE
CCos
Cos ε
ε
ε
ψ
ψε , (10)
which, expressed in a format of the changing orientation of the collagen fibrils similar to that used by
Zimmermann et al. [27], gives:
( )
0
0
001
2
2arccos ψ
ε
ε
ε
εψψψ −
+
+=−
•
•
f
t
m
t
EC
Cos . (11)
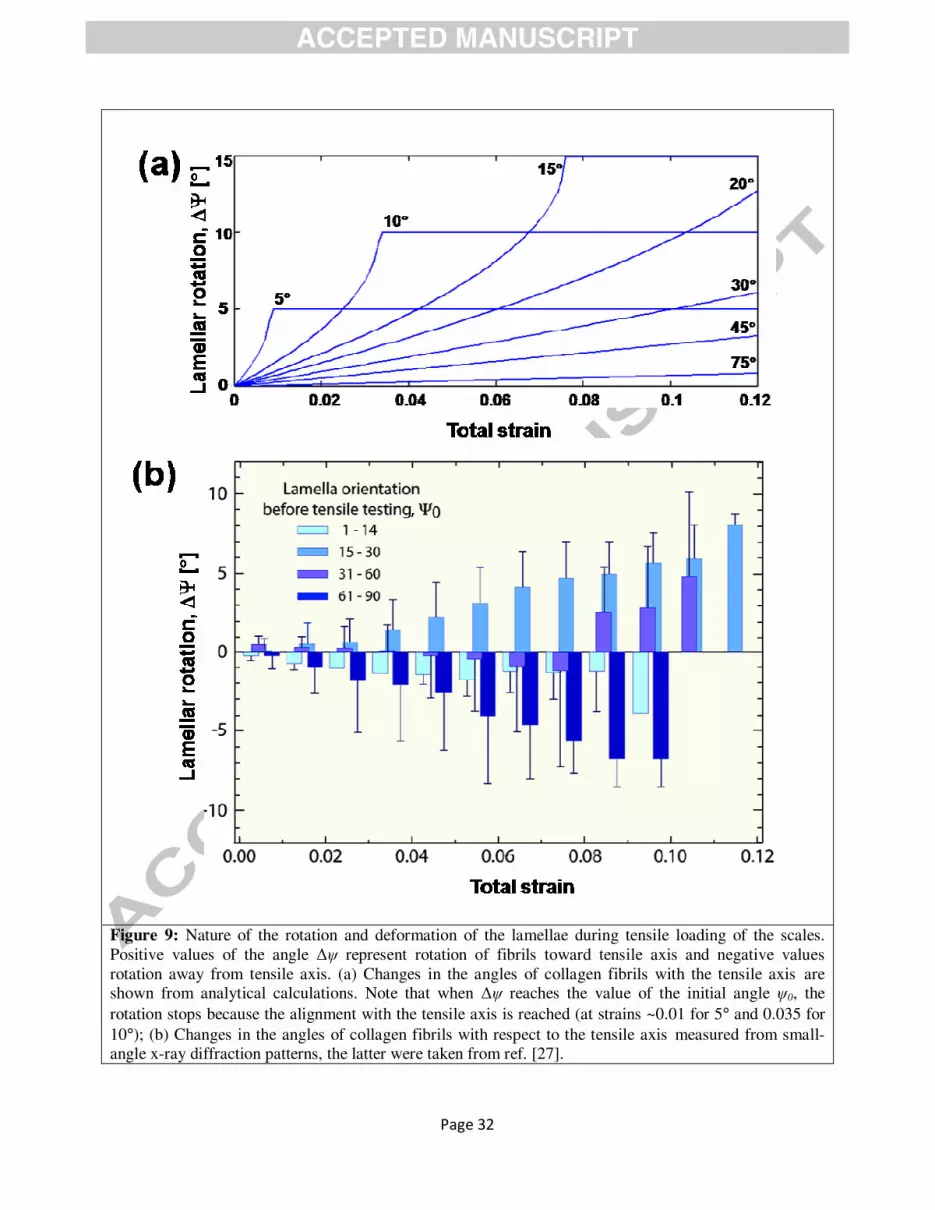
Figure 9a shows the change in collagen orientation given by Eqn. 11 vs. the total strain in the range ε ~ 0 -
0.12. The strain rate used in Eqn. 11 was 10-4 s-1 to match the experimental SAXS results. These values
are plotted for different initial values of ψ0: 5, 10, 20, 45, and 70°. It can be seen the fibrils rotate toward
the tensile axis for all cases and that rotation stops once the rotation angle reaches the original
misorientation angle. When all the collagen fibrils align towards the loading direction (ψ0 = 0°), there is
no strain contributed by the rotation of collagen fibrils. For small angles ψ0, the rotation is more
pronounced. The fibrils originally at an angle between 31° and 90° have no chance to rotate towards the
tensile axis and either do not change orientation or rotate away.
ε& 0ε&

Page 15
The results of the SAXS experiments are given in angular ranges: 0 - 14°, 15 - 30°, 31 - 60°, and 61 -
90°. During tensile testing, we can observe collagen fibrils rotating both towards (positive ∆ψ), and away
from (negative ∆ψ) the tensile direction (Fig. 9b). The positive values and the rates of rotation are well
described by the above analysis.
Negative values of ∆ψ (rotation away from tensile direction) require mechanisms not incorporated
into the analysis. Three principal mechanisms can be considered: the splitting of lamellae creates regions
of separation causing changes in the angle ψ of the lamellae to the tensile direction, as shown
schematically in Fig. 8b (the changes in the angle can be both positive and negative); sympathetic rotation
through which a layer is sandwiched between two layers which ‘drag’ it and force it to rotate away from
the tensile direction; and contraction by Poisson’s ratio effects, leading to rotation. In summary, the
analysis predicts the positive ∆ψ rotations (rotation towards the tensile direction) fairly well. It should be
noticed that the analysis uses independent values; no parameters extracted from the SAXS experiments
were employed.
3.6 Molecular dynamics calculations on collagen layers in tension
In order to confirm the rotation of the lamellae and individual fibrils observed by SAXS and in situ
SEM tensile experiments, the process was modeled at the fiber level. Molecular dynamics calculations of
the tensile deformation of the collagen layer with three orientations of collagen lamellae (42°, 78° and
18°) were performed to model the mechanisms of deformation. Periodic conditions are applied to the out-
of-plane direction and thus each collagen lamella is sandwiched between two other lamellas with a 60°
angle with each of them. This configuration is built according to the experimental observations as the
angle between two neighboring lamellas is measured to vary between 35 and 85° [22]. An earlier study
had reported ~60° but this was an oversimplification [23]. We use this model and apply uniaxial tensile
force by fixing a single layer of coarse-grained beads at each edge of the pulling direction and controlling
their displacement quasi-statically, as detailed in section 2.8 (Fig. 10a). The Young’s modulus used to
model the collagen fiber is 2 GPa, which is an average estimate from collagen microfibrils from both
computational and experimental approaches [33]. It is noted that the inter-fiber interaction energy
depends on surface chemistry (in terms of protein sequence and mineral composition), degree of
hydration, and roughness and is difficult to be directly measured experimentally. However, we are able to
model this interaction by referring to the results of full atomistic simulations. We model the inter-fiber
interaction by using the surface energy of tropocollagen molecules, which is measured to have a range
from 0.05 J/m2 to 3 J/m2 in simulations with different constraints [41].

Page 16
Using the present model, we obtain multiple stress-strain curves by using different surface energies,
as shown in Fig. 10b. These calculated curves have a typical saw tooth shape, with the stress first
increasing linearly with the increasing strain at small deformation followed by significant stress drops
before increasing again. The peak stress before the drop region depends on the surface energy; as the
surface energy increases, the stress increases, because the bonding between adjacent collagen microfibrils
increases. In Fig. 10b, it can be seen that peak stress increases to over 100 MPa when surface energies are
increased from 0.05 to 10 J/m2. For 1 J/m2, it is equal to 26.4 MPa, which is close to the magnitude of the
experimental peak stress of fish scales, as shown in Fig. 4. We therefore use this surface energy to model
the inter-fiber interaction. By comparing the simulation snapshots shown in Fig. 10c, we find that during
the linear and yielding region, all the collagen fibers in the model retain the orientation of the initial
configuration and the deformation strain is homogenously distributed in the fibers. The first stress drop
corresponds to the appearance of collagen delamination within the material; this is an important
mechanism of releasing the deformation energy stored in fibers, since it creates microcracks along the
fibers. For smaller surface energies (e.g., 0.1 J/m2 and 0.05 J/m2), the simulations show neither a
significant stress drop nor collagen delamination. The last region of the bumpy but upward trend is
principally caused by the alignment of the fibers in the third lamella; stretching of those aligned fibers
requires larger stress. It is noted that the stress can increase significantly in this region because we assume
the collagen fibers are purely elastic and non-breakable, which simplifies the mechanics but quickly
enables us to see the strain distribution and mechanism of the collagen delamination and bridging. An
improved model needs to incorporate the entire force-extension curve of the collagen fiber; this can be
obtained in future from either micro tensile test experiments or large-scale modeling of collagen fibers
using molecular simulations [42]. Fig. 10c shows the change in orientation and delamination on the
lamellae as a function of applied tensile strain. Four values were used for comparison: 0, 0.04, 0.09, and
0.15. They are labeled I, II, III, and IV, respectively. The delamination is more prominent for the first and
second lamellae, which have initial angles of 42 and 78°. In the regions at the ends of the delaminations,
the angles change significantly. This is indicated by arrows for the second lamella at strain IV. This
rotation at the end of the delamination is also considered in the analytical model of Fig. 10. For the third
lamella, which makes an initial angle of 18° to the tensile axis, the rotation towards the tensile direction
reduces the angle.
The average value and standard deviation of the angles between the fibers and the tensile direction in
each collagen lamella was computed; results are summarized in Fig. 11. It is shown that for the lamella
with the largest initial angle (78°, 2nd lamella), the average value stays at a constant level, which agrees
with the experimental observation (Fig. 11). The standard deviation of the angle in this lamella increases
significantly for large deformation, which can be understood by collagen bridging, explaining how a part

Page 17
of the collagen fibers rotates away from the tensile direction (Fig. 10c). The calculations also show that
the lamella with a smaller angle with the tensile direction (3rd lamella, making initial angle of 18°) rotates
faster than the other lamella (1st lamella, with angle of 42°) toward the tensile direction, which is also
observed in experiments (Fig. 11).
4. Discussion
The arapaima scale has two important functions: (i) it resists penetration, and (ii) it redistributes the
force from the location of the bite over a much larger area. According to Zhu et al. [16], the whole
penetration process can be divided into three stages with progressively increasing penetration depth: stage
I is essentially elastic loading which terminates with cracking of the external mineral layer, stage II
involves the penetration of collagen, while in Stage III the tip of the indenter completely traverses the
scale. This is indeed what happens in the scale of the Arapaimas. Song et al. [25] conducted a finite
element analysis of the ganoid scales where they varied tooth and scale parameters and established what
effects this had on the mechanical response. One important conclusion is that the radius of curvature of
the tip of the tooth had a profound effect on the force necessary to penetrate the scale. This was extended
to elasmoid scales by Browning et al. [26] and Varshney et al. [43]. Their conclusion was that the
redistribution of loads around the penetration point is critically dependent on the following scale
parameters: angle of the scales, degree of scale overlap, composition (volume fraction of the scales),
aspect ratio of the scales, and material properties (tissue modulus and scale modulus).
Fig. 12a shows schematically how the stresses are redistributed over a large area by the collective
action of the scales. This enables the muscle to resist the compression by the application of the bite force.
The flexibility of individual scales and their overlap are designed to increase the area of redistribution, as
was pointed out by Vernerey and Barthelat [44]. Specifically, the scales are designed to function with the
external layer under compressive stresses (Fig. 12b). Indeed, Meyers et al. [23] proposed that the design
of scales could lead to bioinspired flexible ceramic composite and suggested that, in the case of the
Arapaima scales, the surface ridges minimize the stresses in the ceramic and enables flexing without
fracture.
The foregoing results of experiments, characterization, and analysis provide an improved
understanding of the mechanisms of deformation and damage in the scales. The external mineral layer is
designed to operate under compression; the tensile strength of the scales is actually increased by its
removal. This is paradoxical but can be explained by the fact that the mineral does not contribute
significantly to the tensile strength. Thus, its effect is strictly to increase the cross sectional area, thereby
decreasing the stresses. A second effect is that the lamellae adjacent to the mineral layer do not benefit

Page 18
from the rotational mechanisms discovered by Zimmermann et al. [27]. Indeed, the mineral layer is
designed to operate in compression, as shown in Fig. 12b. The application of a force by a tooth bends the
scale in such a manner that the external mineralized layer is put under compression whereas the internal
layers are subjected to tension (Fig. 12c). In fact, penetration by a tooth is hampered significantly by this
layer, leading often to the fracture of the tooth.
The lamellar structure of the collagenous foundation is comprised of many layers in a Bouligand-like
arrangement. As a tooth penetrates, the layers separation and scale fracture are avoided through
interlamellar and interfibrillar sliding mechanisms. The reorientation of the lamellae was observed
through in situ experiments conducted on pre-notched specimens. These experiments show the sliding and
reorientation of the lamellae and the absence of crack propagation. SAXS experiments confirm the
change of orientation of the collagen fibrils. These phenomena were modeled by molecular dynamics
which confirm that at small angles (ψ < 45°) the lamellae rotate towards the tensile axis, while for larger
values, interlamellar splitting causes local increases in ψ.
The combination of a highly mineralized surface region designed to operate in compression with a
flexible foundation, which can undergo significant tensile stresses, provides mechanical properties that
minimize the penetration ability of teeth and can distribute the compressive traction effectively while
ensuring significant mobility to the fish. This is accomplished at a modest weight penalty: the scale
weight / fish weight ratio is only ~0.1.
5. Conclusions
Arapaima gigas is one of the largest fresh water fish; it is covered with elasmoid scales that act as
flexible dermal armor and provide protection, primarily from attacks by piranhas, the principal predators
in the Amazon basin. In this study, the penetration response and tensile behavior of the scales were
investigated with particular attention to the mechanisms of damage in the individual collagen layers. This
was achieved experimentally through the use of tensile tests on hydrated scales and indentation
experiments, analytically by predicting the various mechanisms that retard damage in the scales, and
computationally with molecular dynamics calculations performed to understand the response of collagen
fibrils to tensile loading. Based on these studies, the following specific conclusions can be made:
1. The microscopy (both transmission electron and atomic force) confirm that the collagen fibrils
have diameters of approximately 100 nm and are parallel in one lamella. The d band spacing of
the collagen is clearly revealed by AFM and is equal to 67 nm, characteristic of type I collagen.
2. The scales act to efficiently resist bites from other fish. As a tooth attempts to penetrate the scale,
first the brittle external layer is placed under compression and would eventually crack due to the
stress concentration and gradients, exposing the collagen layers beneath. As the penetrator enters

Page 19
more deeply into the scale, the collagen fibrils are pushed apart and separate. Since it has to
traverse several lamellae with different orientations, no macroscopic cracks are formed. In an
extreme case, eventually, individual collagen fibers fail in tension, exhibiting necking which is
characteristic of considerable permanent deformation.
3. We confirm and quantify earlier conclusions by Zimmermann et al. [27], namely that the
stretching, rotation, delamination and fracture of collagen fibrils are the principal mechanisms of
energy dissipation in the flexible foundation. Under tensile loading, most of the collagen fibrils
are stretched and rotate toward the tension direction; the collagen fibrils with a large angle to the
loading (closer to 90°) delaminated as portions can rotate away or towards the tensile direction.
An analytical model predicts the rotation of the collagen fibers toward the tensile axis that is in
good agreement with measurements by SAXS.
4. Molecular dynamics calculations of interfibril separations yield results that match quantitatively
the experimental measurements, with interaction energy between microfibrils of 1 J/m2 being
assumed. The calculations correctly predict the separation of fibrils and angular rotation toward
and away from the tensile axis for large angles, and rotation of fibrils toward the tensile axis for
small angles. Since only three lamellae are used in the computation, their splitting is accompanied
by significant load drops; the drop at a stress of 26.4 MPa corresponds closely to the maximum
stress of 30-40 MPa experimentally observed.
Acknowledgments
This work was supported by the National Science Foundation, Division of Materials Research,
Ceramics Program Grant, 1006931. The mechanical testing, in situ SEM and SAXS experiments were
supported by the Mechanical Behavior of Materials Program at the Lawrence Berkeley National
Laboratory (LBNL) funded by the Office of Science, Office of Basic Energy Sciences, Division of
Materials Sciences and Engineering of the U.S. Department of Energy under contract no. DE-AC02-
05CH11231. The SAXS experiments were performed at beam line 7.3.3 at the Advanced Light Source at
LBNL, also supported by the Office of Science of the U.S. Department of Energy under the same
contract. The computational work at MIT was funded by ARO/ISN under contract no. W911NF-07-D-
004. Wen Yang also acknowledges support from U.C. Research Laboratories Grant (09-LR-06-118456-
MEYM). We thank Mr. Gaspar Ritter, Kuryiala Lodge, Araguaia River, for providing us with the
Arapaima scales. We thank Qian Huang and Maribel Montero for the help with the AFM images.

Page 20
References
[1] Yang W, Chen IH, Gludovatz B, Zimmermann EA, Ritchie RO, Meyers MA. Natural flexible
dermal armor. Adv Mater 2013;25:31-48.
[2] Munch E, Launey M E, Alsem DH, Barth HD, Saiz E, Tomsia AP, Ritchie RO. Tough Bio-Inspired Hybrid Materials. Science 2008;322:1516-20.
[3] Launey ME, Munch E, Alsem DH, Barth HD, Saiz E, Tomsia AP, Ritchie RO. Designing highly toughened hybrid composites through nature-inspired hierarchical complexity. Acta Mater 2009;57:2919-32.
[4] Porter MM, Yeh M, Strawson J, Goehring T, Lujan S, Siripasopsotorn P, Meyers MA, McKittrick J. Magnetic freeze casting inspired by nature. Mater Sci Eng A 2012;556:741-50.
[5] Goodrich, ES. On the scales of fish, living and extinct, and their importance in classification. Proc Zool Soc Lond 1907;77:751-73. [6] J.-Y. Sire, A. Huysseune. Biol. Rev. 2003, 78, 219.
[7] Bruet BJF, Song JH, Boyce MC, Ortiz C. Materials design principles of ancient fish armour. Nature 2008; 7:748-56.
[8] Yang W, Gludovatz B, Zimmermann EA, Bale, HA, Ritchie RO, Meyers MA. Structure and fracture resistance of alligator gar (Atractosteus spatula) armored fish scales. Acta Biomater 2013b;9:5876-89.
[9] Allison PG, Chandler MQ, Rodriguez RI, Williams BA, Moser RD, Weiss Jr CA, Poda AR, Lafferty BJ, Kennedy AJ, Seiter JM, Hodo WD, Cook RF. Mechanical properties and structure of the biological multilayered material system, Atractosteus spatula scales. Acta Biomater 2013; 9:5289-96.
[10] Ørvig T. Remarks on the vertebrate fauna of the Lower Upper Devonian of Escuminac Bay, PQ, Canada, with special reference to the porolepiform crossopterygians. Arkiv Zool 1957;10:367-426.
[11] Roux GH. The microscopic anatomy of the Latimeria scale. S Afr J Med Sci 1942;7 (Biol Suppl):1-18.
[12] Smith MM, Hobdell MH, Miller WA. The structure of the scales of Latimeria chalumnae. J Zool Lond 1972;167:501-9.
[13] Onozato H, Watabe N. Studies on fish scale formation and resorption. Cell Tissue Res 1979;201:409-22.
[14] Ikoma T, Kobayashi H, Tanaka J, Wals D, Mann S. Microstructure, mechanical, and biomimetic
properties of fish scales from Pagrus major. J Struct Biol 2003;142:327-33.
[15] Bigi A, Burghammer M, Falconi R, Koch MHJ, Panzavolta S, Riekel C Twisted plywood pattern of collagen fibrils in teleost scales: an X-ray diffraction investigation. J Struct Biol 2001;136 (2):137-43
[16] Zhu D, Ortega CF, Motamedi R, Szewciw L, Vernerey F, Barthelat F. Structure and mechanical performance of a “modern” fish scale. Adv Eng Mater 2012;14:B185-94.
[17] Ørvig T. Phylogeny of tooth tissues: evolution of some calcified tissues in early vertebrates In: Miles AE, editor. Structural and chemical organization of teeth. New York: Academic Press; 1967. p 45-110.
[18] Chen PY, Schirer J, Simpson A, Nay R, Lin YS, Yang W, Lopez MI, Li JN, Olevsky EA, Meyers, MA. Predation versus protection: Fish teeth and scales evaluated by nanoindentation. J Mater Res 2012; 27(01):100-12.

Page 21
[19] Gur D, Politi Y, Sivan B, Fratzl P, Weiner S, Addadi L. Guanine-based photonic crystals in fish scales form from an amorphous precursor. Angew Chem 2013;125:406-9.
[20] Zylberberg L, Bonaventure J, Cohen-Solal L, Hartmann DJ, Bereiter-Hahn J. Organization and characterization of fibrillar collagens in fish scales in situ and in vitro. J Cell Sci 1992;103:273-85.
[21] Weiner S, Wagner HD. The material bone: structure-mechanical function relations. Annu Rev Mater Sci 1998;28:271-98.
[22] Lin YS, Wei CT, Olevsky EA, Meyers MA. Mechanical properties and the laminate structure of Arapaima gigas scales. J Mech Behav Biomed Mater 2011;4(7):1145-56.
[23] Meyers MA, Lin YS, Olevsky EA, Chen PY. Battle in the Amazon: Arapaima versus Piranha. Adv Biomater 2012;14:B279-88.
[24] Zhu D, Szewciw L, Vernerey F, Barthelat F. Puncture resistance of the scaled skin from striped bass: Collective mechanisms and inspiration for new flexible armored signs. J Mech Behav Biomed Mater 2013;24:30-40.
[25] Song J, Ortiz C, Boyce MC. Threat-protection mechanics of an armored fish. J Mech Behav Biomed Mater 2011;4(5):699-712.
[26] Browning A, Ortiz C, Boyce MC. Mechanics of composite elasmoid fish scale assemblies and their bioinspired analogues. J Mech Behav Biomed Mater 2013;19:75-86.
[27] Zimmermann EA, Gludovatz B, Schaible E, Dave NKN, Yang W, Meyers MA, Ritchie RO. Mechanical adaptability of the Bouligand-type structure in natural dermal armor. Nature Communications, 2013; 4:2634 | doi: 10.1038/ncomms3634.
[28] Qin Z, Buehler MJ. Flaw tolerance of nuclear intermediate filament lamina under extreme mechanical deformation. ACS Nano 2011;5(4):3034-42.
[29] Qin Z, Buehler MJ. Impact tolerance in mussel thread networks by heterogeneous material distribution Nature Comm 2013;4, doi:101038/ncomms3187.
[30] Burdak VD, editor. Functional morphology of scale cover in fish. Kiev: Naukova Dumka; 1979.
[31] Torres FF, Troncoso OP, Nakamatsu J, Grande CJ, Gomez CM. Characterization of the nanocomposite laminate structure occurring in fish scales from Arapaima gigas. Mater Sci Eng C 2008;28:1276-83.
[32] Bouligand Y. Twisted fibrous arrangements in biological-materials and cholesteric mesophases Tissue & Cell 1972; 4:189-217.
[33] Gautieri A, Vesentini S, Redaelli A, Buehler MJ. Hierarchical structure and nanomechanics of collagen microfibrils from the stomistic scale up. Nano Lett 2011;11 (2): 757-66.
[34] Torres FF, Troncoso OP, Amaya E. The effect of water on the thermal transitions of fish scales from Arapaima gigas. Mater Sci Eng C 2012;32:2212-14.
[35] Schmid F, Sommer G, Rappolt M, Schulze-Bauer CAJ, Regitnig P, Holzapfel GA, Laggner P, Amenitsch H. In situ tensile testing of human aortas by time resolved small-angle X-ray scattering. J Synchrotron Radiat., 2005; 12:727–33.
[36] Fratzl P, ed., Collagen: Structure and mechanics, Springer, New York, 2008.
[37] Holzapfel GA, Collagen in arterial walls: Biomechanical aspects. In Collagen: Structure and mechanics, Ed. Fratzl P, Springer, NY, 2008, pp.285-324.

Page 22
[38] Masic A, Bertinetti L, Schuetz R, Galvis L, Timofeeva N, Dunlop JWC, Seto J, Hartmann MA, Fratzl P. Observations of multiscale, stress-induced changes of collagen: Orientation in tendon by polarized Raman spectroscopy. Biomacromolecules 2011;12:3989−96.
[39] Ramberg, W, and Osgood, W R Description of stress-strain curves by three parameters. Technical
Note No. 902, National Advisory Committee For Aeronautics, Washington DC (1943).
[40] Hight TK, Brandeau JF. Mathematical modeling of the stress strain-strain rate behavior of bone using the Ramberg-Osgood equation. J Biomech. 1983;16(6):445-50.
[41] Qin Z, Gautieri A, Nair AK, Inbar H, Buehler MJ. Thickness of hydroxyapatite nanocrystal controls mechanical properties of the collagen-hydroxyapatite interface. Langmuir 2012;28(4):1982-92.
[42] Nair A, Gautieri A, Chang SW, Buehler MJ. Molecular mechanics of mineralized collagen fibrils in bone. Nature Comm 2013;4, doi: 101038/ncomms2720
[43] Varshney S, Zolotovsky E, Li YN, Boyce MC, Oxman N, Ortiz C. Morphometric origins of
biomechanical flexibility in fish armor. Integr Comp Biol 2013;53:E218.
[44] Vernerey FJ, Barthelat F. On the mechanics of fishscale structures. Int J Solids Struct 2010;47:2268-75

Page 23
Table 1: Uniaxial tensile testing results for the entire scale and for the collagen layer, loaded in the
longitudinal and transverse orientations
Longitudinal Orientation Transverse Orientation
Entire Scale Collagen layer Entire Scale Collagen layer
Young’s modulus (GPa) 0.86±0.32 0.47±0.25 0.21±0.02 0.21±0.03
Ultimate (Engineering)
Tensile Stress (MPa) 23.6±7.2 36.9±7.4 14.2±1.1 21.8±2.4
Engineering Strain at
Maximum Stress 0.08±0.07 0.14±0.06 0.12±0.01 0.18±0.01
Energy dissipation
(MPa) 1.47±1.08 3.12±0.98 1.07±0.08 2.53±0.40

Page 24
Figure 1: Arapaima fish and its scales, (a) Arapaima fish with overlapped scales on its body, (b) close-up of the overlapped scales (darker regions were exposed, lighter regions were covered by other scales) showing longitudinal and transvers directions of specimens for tensile tests, (c) scanning electron micrograph of the cross-section of a scale (note that the small cracks in the collagen layer are artifacts, formed when the scales dried out in vacuo (d) schematic drawing of the structure of the Arapaima’s scale: the outer layer is highly mineralized, whereas the inner layer has different orientations of collagen fibrils
arranged in lamellae, (e) tensile failure region of the lamellae: α1 = 86.7°, α2 = -34.5°, α3 = -69.2°, α4 =
66.9°. The yellow ellipse in (e) shows two events where lamellae separate leading to changes in the angle.

Page 25
Figure 2: Characterization of collagen by (a, b) transmission electron microscopy (TEM) and (c, d)
atomic force microscopy (AFM); (a) TEM image of the foil plane inclined to fibril axis; the smallest
dimension of the fibrils is ~100 nm. (b) Two orientations of fibrils are shown: on the right-hand side the
fibrils are inclined to the foil plane showing d bands of 50 nm (projected value of 67 nm), on the left-hand
side the fibrils are close to being perpendicular to the foil. Note the regular fibril diameter, ~100 nm; (c)
AFM of parallel fibrils; (d) higher magnification AFM showing 67 nm d bands and tridimensional
rendition of fibrils in the insert.

Page 26
Figure 3: (a, b) Penetration of the scale by a piranha tooth from the outer layer towards the inner layer. (a) Entire penetration indent of the scale; cracks were arrested at orthogonal cracks caused by fracture of the mineral (red arrows), with more serious damage at the corner of the penetration; (b) collagen fibrils exposed from the damage of the mineral observed from the circled region in (a); (c, d) Penetration of collagen layers by a microhardness indenter; the original indentation is shown by the dashed square; the fibers are displaced but the gaps on the samples are due to dehydration in the vacuum of the SEM, the ellipse in (d) is the region that was produced by the indenter tip.

Page 27
Figure 4: Uniaxial tensile stress-strain curves of the scales (solid lines) and of the collagen layers with
mineral removed (dashed lines). Tests were performed at a strain rate of 10-2s-1 in the (a) longitudinal and
(b) transverse directions, as defined in Fig. 1.

Page 28
Figure 5: SEM images of tested tensile samples. (a) side of a tensile sample of the scale after mineral failure, five lamellae were delaminated from each other labeled from 1 to 5; (b) the top view of the tensile sample shows the mineral domains separated and the collagen exposed (the arrows show two orientations); (c) fractured collagen fibrils, some of which are close to the mineral layer (shown by the ellipse); the collagen fibrils beneath are delaminated and separated.
Page 29
Figure 6: Damage propagation in the collagen layers containing a notch; (a) initial configuration at the onset of loading (the notch is in the center of the image with the notch root pointing towards the bottom); (b) the collagen fibrils separate when the samples are being loaded; (c) four orientations of lamellae are being exposed (shown by the individual arrows); (d) the collagen fibrils bend and stretch as shown by the arrow, some of the collagen fibrils were relaxed when the test stopped; (e) the lamellae and collagen fibrils bend (arrow), delaminate (dashed lines) and fracture (square); (f) continued loading characterized by sliding of the lamellae indicating the absence of significant crack propagation; (g) damage in un-notched specimen tested under the same configuration up to failure.

Page 30
Figure 7: SAXS results of arapaima collagen layer under tensile load. (a) Tensile load-time plot, SAXS images were taken at four points: (b) before testing, (c) during testing, (d) at the peak load, (e) after testing. Note that the black dashed line shows the average angle (orientation) of the lamellae in scale before tests, the red short dash-dot line shows the average angle (orientation) of the lamellae during the in-situ tension tests, orientation change of the lamellae can be observed easily from the difference between black dashed line and red short dash-dot lines in the individual (c)-(e).

Page 31
Figure 8: Mechanisms of collagen fibril deformation under tensile load. (a) Rotation through interfibrillar shear and elastic stretching of collagen fibrils. Fibril stretching and interfibrillar sliding decrease the angle
between the fibrils and the loading direction from Ψ0 to Ψ1. The initial d period along the fibrils is equal to d0; after extension, this d period increases to d1 as the overall length increases from L0 to L1; (b) the
tensile opening of interfibrillar gaps acts to change the angle, at the extremities of the fibrils, from Ψ0 to
Ψ1 and Ψ2; note the change in width from W0 to W1 that can cause Poisson contraction (adapted from ref. [27]).
Page 32
Figure 9: Nature of the rotation and deformation of the lamellae during tensile loading of the scales. Positive values of the angle ∆ψ represent rotation of fibrils toward tensile axis and negative values rotation away from tensile axis. (a) Changes in the angles of collagen fibrils with the tensile axis are shown from analytical calculations. Note that when ∆ψ reaches the value of the initial angle ψ0, the
rotation stops because the alignment with the tensile axis is reached (at strains ~0.01 for 5° and 0.035 for
10°); (b) Changes in the angles of collagen fibrils with respect to the tensile axis measured from small-angle x-ray diffraction patterns, the latter were taken from ref. [27].

Page 33
Figure 10: Molecular dynamics of collagen fibrils in three different directions with initial lamellar
angles of 42°, 78° and 18° to the tensile direction. (a) Schematic of the scale model and the loading condition used to investigate the response under uniaxial tension. (b) The stress-strain curves obtained for different surface energies used in model. It is noted that for 1 J/m2 the first stress drop is 26.4 MPa, which gives the best approximation to the stress-strain curve of collagen layer and scales as shown in Fig. 5. (c) Simulation snapshots of the deformation of each lamella in the scale model, taken at different strains as noted in panel (b) at increasing strains: (I) strain = 0, (II) strain = 0.04, (III) strain = 0.09 and (IV) strain = 0.15. Collagen delamination (noted by ii) and bridging (noted by i) are marked for lamella 2 at strain = 0.15 (IV), as illustrated. (Scale bar: 10 µm)

Page 34
Figure 11: Simulation results showing evolution of angles ψ of the collagen fibers in each lamella for increasing strains (I < II < III < IV). . The three layers have configurations shown in Fig. 10c. The four strains used here to scan the angle are 0, 0.04, 0.09 and 0.15 for strain I ~ IV (same as what is used in Fig. 10c), respectively. The variation in the angles increases with strain (marked by bars on top of each bar plot). Lamella 3 shows significant decrease in angle with increasing strain due to rotation of fibers toward the tensile axis.

Page 35
Figure 12: Protection mechanisms of the Arapaima’s scales against the penetration of a tooth; (a) schematic configuration of the scale overlap (imbrication) (b) flexing and redistribution of compressive stresses on the tissue; (c) flexure of scale leading to compressive stresses in the mineralized surface layer and tensile stresses in the flexible collagen lamellae.


