Embed Size (px)
Citation preview
Genetic Diversity and Connectivity in the ThreatenedStaghorn Coral (Acropora cervicornis) in FloridaElizabeth M. Hemond*, Steven V. Vollmer
Marine Science Center, Northeastern University, Nahant, Massachusetts, United States of America
Abstract
Over the past three decades, populations of the dominant shallow water Caribbean corals, Acropora cervicornis and A.palmata, have been devastated by white-band disease (WBD), resulting in the listing of both species as threatened underthe U.S. Endangered Species Act. A key to conserving these threatened corals is understanding how their populations aregenetically interconnected throughout the greater Caribbean. Genetic research has demonstrated that gene flow isregionally restricted across the Caribbean in both species. Yet, despite being an important site of coral reef research, littlegenetic data has been available for the Florida Acropora, especially for the staghorn coral, A. cervicornis. In this study, wepresent new mitochondrial DNA sequence data from 52 A. cervicornis individuals from 22 sites spread across the upper andlower Florida Keys, which suggest that Florida’s A. cervicornis populations are highly genetically interconnected(FST = 20.081). Comparison between Florida and existing mtDNA data from six regional Caribbean populations indicatesthat Florida possesses high levels of standing genetic diversity (h = 0.824) relative to the rest of the greater Caribbean(h = 0.70160.043). We find that the contemporary level of gene flow across the greater Caribbean, including Florida, isrestricted (WCT = 0.117), but evidence from shared haplotypes suggests the Western Caribbean has historically been asource of genetic variation for Florida. Despite the current patchiness of A. cervicornis in Florida, the relatively high geneticdiversity and connectivity within Florida suggest that this population may have sufficient genetic variation to be viable andresilient to environmental perturbation and disease. Limited genetic exchange across regional populations of the greaterCaribbean, including Florida, indicates that conservation efforts for A. cervicornis should focus on maintaining and managingpopulations locally rather than relying on larval inputs from elsewhere.
Citation: Hemond EM, Vollmer SV (2010) Genetic Diversity and Connectivity in the Threatened Staghorn Coral (Acropora cervicornis) in Florida. PLoS ONE 5(1):e8652. doi:10.1371/journal.pone.0008652
Editor: Robert DeSalle, American Museum of Natural History, United States of America
Received August 21, 2009; Accepted December 14, 2009; Published January 11, 2010
Copyright: � 2010 Hemond, Vollmer. This is an open-access article distributed under the terms of the Creative Commons Attribution License, which permitsunrestricted use, distribution, and reproduction in any medium, provided the original author and source are credited.
Funding: Fieldwork support was provided through the National Oceanic and Atmospheric Administration’s Coral Reef Conservation Program and the FloridaKeys National Marine Sanctuary. Research funding was also provided by National Science Foundation grant OCE-0751666 to S.V.V. and a Northeastern UniversityExcellence Fellowship to E.M.H. The funders had no role in study design, data collection and analysis, decision to publish, or preparation of the manuscript.
Competing Interests: Steven Vollmer is on the PLoS ONE Editorial Board.
* E-mail: [email protected]
Introduction
Coral reefs have declined rapidly over the past three decades,
due in large part to the loss of dominant reef-building corals [1,2].
A major factor contributing to the decline of coral reefs has been
the rise in coral diseases, particularly in the Caribbean, which is
now regarded as a ‘‘disease hot spot’’ [3,4]. White band disease
(WBD), in particular, has transformed Caribbean reefs by causing
an unprecedented die-off of the two dominant shallow-water
Caribbean corals, the staghorn coral (Acropora cervicornis) and the
elkhorn coral (A. palmata). Since WBD was first observed in the late
1970s, record losses of up to 95% of live Acropora cover have been
observed throughout the Caribbean [5,6], and recovery has been
slow to non-existent at most locations over the past two decades
[7](but see [8,9]). As a result, both species have been listed as
threatened under the U.S. Endangered Species Act [10,11] and as
critically endangered under the International Union for the
Conservation of Nature (IUCN) Red List criteria [12].
One key to designing appropriate management strategies and
conserving the remaining Caribbean Acropora is knowledge about
the extent to which populations of each species are interconnected
via larval dispersal. Genetic exchange over large spatial scales (i.e.
hundreds of kilometers) might allow distant healthy populations to
rescue damaged reefs; whereas, restricted gene flow would indicate
that populations rely on local recruitment and require local
management. Information about the genetic make-up of Carib-
bean Acropora populations is also important since both species rely
heavily on asexual fragmentation to propagate locally [13,14] but
must reproduce sexually during yearly mass spawning events to
produce dispersing larvae [15,16]. Because both species are largely
self-incompatible ([17], Fogarty N, Vollmer SV, unpublished
data), successful sexual reproduction requires that multiple genets
are present and spawn on a reef. While genetic surveys indicate
that multiple genets are often present in stands of both species
[18,19], it is unknown if small remnant Acropora populations have
too few individuals to spawn consistently and successfully. The
genetic make-up of Acropora populations may also affect their
resiliency. For example, recent research indicates that 6% of A.
cervicornis individuals are resistant to WBD [18], suggesting that
populations with higher frequencies of resistant individuals may be
more sustainable.
Recent genetic research on both Caribbean Acropora species
indicates that gene flow is geographically restricted among
populations separated by 500 km or more [20,21]. Microsatellite
data further indicate that A. palmata can be subdivided into distinct
Western and Eastern Caribbean subpopulations [20,22], and
PLoS ONE | www.plosone.org 1 January 2010 | Volume 5 | Issue 1 | e8652
mitochondrial and nuclear sequence data from A. cervicornis
detected fine-scale genetic differences among populations separat-
ed by as little as 2 km [21]. Regionally restricted gene flow in the
Caribbean Acropora argues for regionally-based management
[20,21], but evidence for additional fine-scale differentiation in
A. cervicornis suggests that the scale of dispersal and thus
management at some locations may need to be much smaller
(i.e. on the order of individual reefs) in this species [21]. Genetic
studies of Indo-Pacific Acroporids have found evidence for
population structure as well, but at a much larger geographic
scale and generally of a smaller magnitude [23,24] (but see
[25,26]).
One area where population genetic information from the
Caribbean Acropora is lacking is the Florida Keys reef tract, which is
the largest continuous barrier reef in the U.S. and a focal point for
U.S. coral research in the Caribbean. The Florida Keys reef tract
sits downstream of most Caribbean reefs, which makes it a possible
sink for immigrant larvae from upstream source populations [27].
The predominant currents influencing larval transport into
Florida’s reefs are the Florida Current and the Loop Current,
which is derived from the Caribbean Current after its passage
between the Yucatan peninsula and Cuba. Oceanographic models
indicate that northern Central American and Cuban reefs are the
most likely sources for larval immigration into Florida, although
larval exchange between the Bahamas and Florida is also possible
[27,28]. Microsatellite data from A. palmata support the genetic
relationship between Florida and Western Caribbean, clustering
Florida in the Western Caribbean subpopulation with Panama
and Mexico, as well as with the Bahamas [20]. DNA sequence
data for A. cervicornis also suggest a genetic connection between the
Western Caribbean and Florida, but too few samples (n = 5) were
available to estimate the extent of population genetic structure
between Florida and the greater Caribbean.
To date, the five genets from Florida used for the study by
Vollmer and Palumbi (2007) represented the entirety of our
knowledge about the genetic state of this A. cervicornis population.
Florida is at the northernmost limit of this species in the Caribbean
[29], and Florida’s A. cervicornis have a sparse and patchy
distribution and have been heavily impacted by WBD [6,30].
Due to Florida’s location upstream of many other Caribbean reefs,
genetic diversity of these corals might be influenced, and possibly
increased, by receipt of immigrant larvae from upstream spawning
populations [27]. However, within the Florida Keys, exposure to
differing environmental factors may contribute to isolation of its
populations. For example, the middle Keys reefs are exposed to
higher inputs of water from Florida Bay, while the upper Keys,
closer to the mainland, are subjected to more intensive terrestrial
and anthropogenic influences [31]. If local recruitment is the
primary source of A. cervicornis throughout the Keys, which is
possible given the observation of genetic isolation over distances as
short as 2 km in other A. cervicornis populations [21], we would
expect to see genetic differentiation within the 200 km long
Florida Keys reef tract.
Here we use mitochondrial DNA sequence data from 52
Acropora cervicornis individuals from 22 sites across the Florida Keys
to evaluate the population genetic structure within the Florida
Keys and compare these data to published sequence data from
across the greater Caribbean. Genetic comparisons between
Florida and the rest of the Caribbean allow us to estimate genetic
connectivity within Florida and between Florida and the greater
Caribbean and to evaluate the genetic diversity within Florida
relative to other Caribbean populations. Based on oceanographic
models and genetic data from A. palmata, we hypothesize that the
Florida Keys reef tract is a sink for A. cervicornis larvae and genetic
diversity from upstream sources, predominantly the Western
Caribbean. We also evaluate the possibility of local recruitment
and genetic structure within the Florida Keys reef tract, given
previous observations of genetic structure in A. cervicornis over
distances as small as 2 km [21].
Results
Fifty-two control region sequences were produced for the
Florida Keys, including 22 representing the upper Keys region,
and 30 representing the lower Keys region. In addition, two
sequences from Florida and 146 sequences from six regional
populations throughout the Caribbean from Vollmer and Palumbi
(2007) (Table 1) were used in the population genetic analyses.
Thirty unique mtDNA control region haplotypes were observed in
the Caribbean-wide sample (Figure 1, Table 2). Seventeen
haplotypes are native to A. cervicornis, whereas 13 haplotypes
represent introgressed haplotypes from A. palmata (resulting from
interspecific hybridization [21,32]). Seven native and four
introgressed haplotypes were observed in the Florida Keys. The
four native and two introgressed haplotypes found in the upper
Keys were also found in the lower Keys, and an additional three
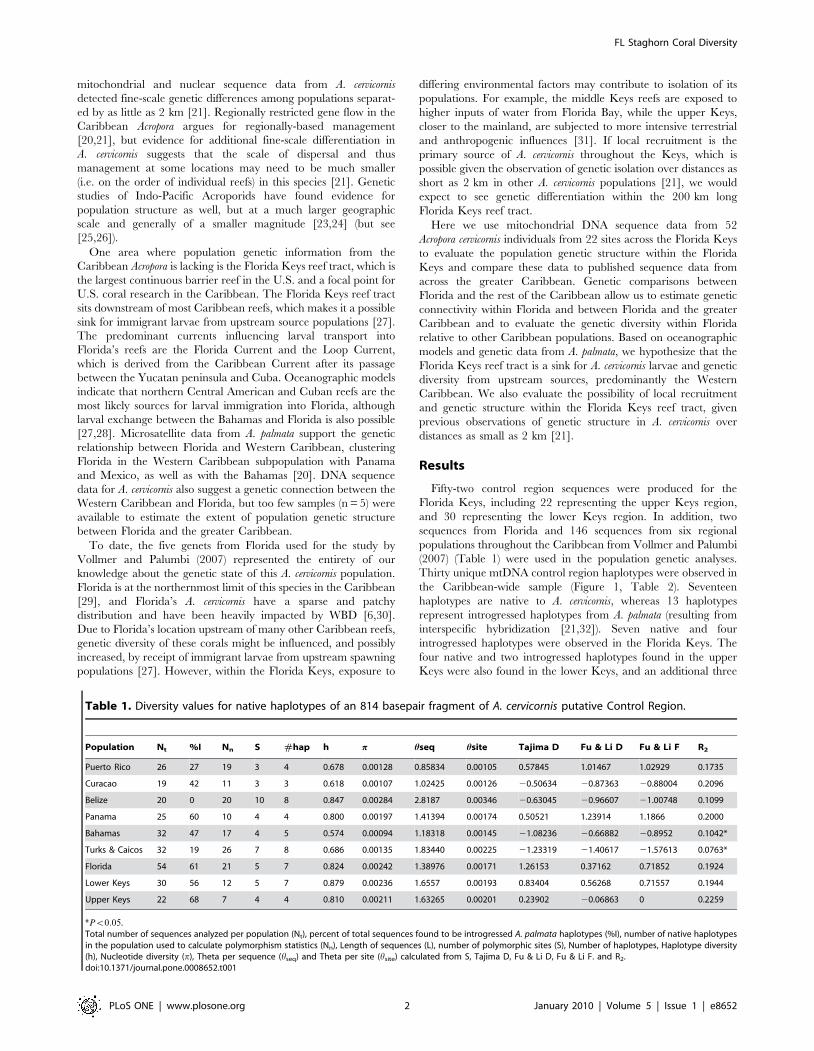
Table 1. Diversity values for native haplotypes of an 814 basepair fragment of A. cervicornis putative Control Region.
Population Nt %I Nn S #hap h p hseq hsite Tajima D Fu & Li D Fu & Li F R2
Puerto Rico 26 27 19 3 4 0.678 0.00128 0.85834 0.00105 0.57845 1.01467 1.02929 0.1735
Curacao 19 42 11 3 3 0.618 0.00107 1.02425 0.00126 20.50634 20.87363 20.88004 0.2096
Belize 20 0 20 10 8 0.847 0.00284 2.8187 0.00346 20.63045 20.96607 21.00748 0.1099
Panama 25 60 10 4 4 0.800 0.00197 1.41394 0.00174 0.50521 1.23914 1.1866 0.2000
Bahamas 32 47 17 4 5 0.574 0.00094 1.18318 0.00145 21.08236 20.66882 20.8952 0.1042*
Turks & Caicos 32 19 26 7 8 0.686 0.00135 1.83440 0.00225 21.23319 21.40617 21.57613 0.0763*
Florida 54 61 21 5 7 0.824 0.00242 1.38976 0.00171 1.26153 0.37162 0.71852 0.1924
Lower Keys 30 56 12 5 7 0.879 0.00236 1.6557 0.00193 0.83404 0.56268 0.71557 0.1944
Upper Keys 22 68 7 4 4 0.810 0.00211 1.63265 0.00201 0.23902 20.06863 0 0.2259
*Pv0:05.Total number of sequences analyzed per population (Nt), percent of total sequences found to be introgressed A. palmata haplotypes (%I), number of native haplotypesin the population used to calculate polymorphism statistics (Nn), Length of sequences (L), number of polymorphic sites (S), Number of haplotypes, Haplotype diversity(h), Nucleotide diversity (p), Theta per sequence (hseq) and Theta per site (hsite) calculated from S, Tajima D, Fu & Li D, Fu & Li F. and R2.doi:10.1371/journal.pone.0008652.t001
FL Staghorn Coral Diversity
PLoS ONE | www.plosone.org 2 January 2010 | Volume 5 | Issue 1 | e8652
native and two introgressed haplotypes were present in the lower
Keys sample.
Table 1 presents genetic diversity statistics for the native
mtDNA haplotypes and includes the percentage of introgressed
mtDNA haplotypes in each population sample. Florida had the
highest proportion of introgressed haplotypes (61%) and no
significant difference in introgression frequencies was detected
between the lower and upper Keys (G = 0.26, df = 1, P.0.5). The
high frequency of introgressed haplotypes in Florida was matched
only by Panama, with an introgression frequency of 60%. Other
Caribbean populations have introgressed haplotype frequencies
between 19%–47%. Belize was an exception with no introgressed
haplotypes (n = 20). Introgression frequencies of haplotypes varied
significantly across the seven Caribbean samplings (G = 14.02,
df = 6, P,0.05).
Nucleotide and haplotype diversity values for the native mtDNA
haplotypes were similar among populations across the greater
Caribbean (Table 1). Bahamas had the lowest haplotype and
nucleotide diversity (h = 0.574 and p = 0.00094), whereas Florida
(h = 0.824 and p = 0.00242) and the two Central American
populations (Panama, h = 0.800 and p = 0.00197; Belize, h = 0.847
and p = 0.00284) had the highest values. Within Florida, although
the upper Keys had fewer haplotypes (n = 4) than the lower Keys
(n = 7), when adjusted for sample size, both had similar levels of
haplotype and nucleotide diversity (upper Keys h = 0.810,
p = 0.00211; lower Keys h = 0.879, p = 0.00236). Theta values
were comparable across Caribbean populations, and neutrality tests
(Tajima’s D, Fu and Li’s F and D, mismatch analysis and R2) do not
suggest significant deviations from neutral expectations including
population bottlenecks or expansions, except in the Bahamas and
Turks and Caicos Islands where R2 was significant.
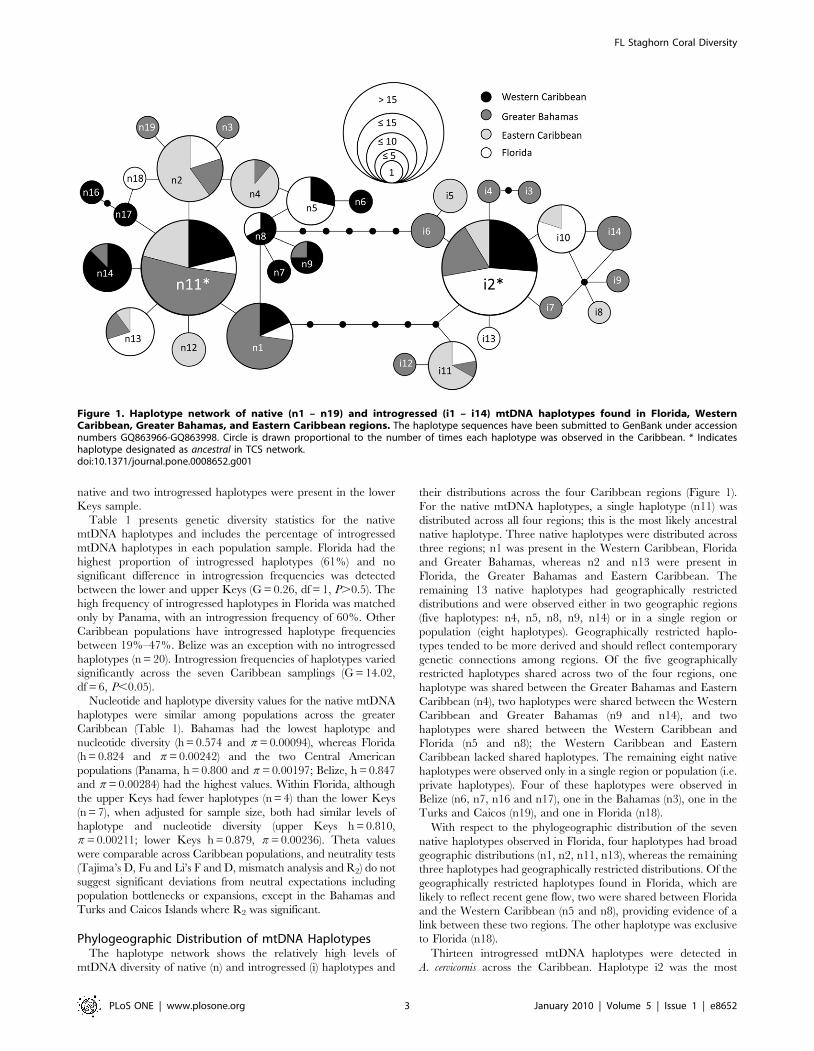
Phylogeographic Distribution of mtDNA HaplotypesThe haplotype network shows the relatively high levels of
mtDNA diversity of native (n) and introgressed (i) haplotypes and
their distributions across the four Caribbean regions (Figure 1).
For the native mtDNA haplotypes, a single haplotype (n11) was
distributed across all four regions; this is the most likely ancestral
native haplotype. Three native haplotypes were distributed across
three regions; n1 was present in the Western Caribbean, Florida
and Greater Bahamas, whereas n2 and n13 were present in
Florida, the Greater Bahamas and Eastern Caribbean. The
remaining 13 native haplotypes had geographically restricted
distributions and were observed either in two geographic regions
(five haplotypes: n4, n5, n8, n9, n14) or in a single region or
population (eight haplotypes). Geographically restricted haplo-
types tended to be more derived and should reflect contemporary
genetic connections among regions. Of the five geographically
restricted haplotypes shared across two of the four regions, one
haplotype was shared between the Greater Bahamas and Eastern
Caribbean (n4), two haplotypes were shared between the Western
Caribbean and Greater Bahamas (n9 and n14), and two
haplotypes were shared between the Western Caribbean and
Florida (n5 and n8); the Western Caribbean and Eastern
Caribbean lacked shared haplotypes. The remaining eight native
haplotypes were observed only in a single region or population (i.e.
private haplotypes). Four of these haplotypes were observed in
Belize (n6, n7, n16 and n17), one in the Bahamas (n3), one in the
Turks and Caicos (n19), and one in Florida (n18).
With respect to the phylogeographic distribution of the seven
native haplotypes observed in Florida, four haplotypes had broad
geographic distributions (n1, n2, n11, n13), whereas the remaining
three haplotypes had geographically restricted distributions. Of the
geographically restricted haplotypes found in Florida, which are
likely to reflect recent gene flow, two were shared between Florida
and the Western Caribbean (n5 and n8), providing evidence of a
link between these two regions. The other haplotype was exclusive
to Florida (n18).
Thirteen introgressed mtDNA haplotypes were detected in
A. cervicornis across the Caribbean. Haplotype i2 was the most
Figure 1. Haplotype network of native (n1 – n19) and introgressed (i1 – i14) mtDNA haplotypes found in Florida, WesternCaribbean, Greater Bahamas, and Eastern Caribbean regions. The haplotype sequences have been submitted to GenBank under accessionnumbers GQ863966-GQ863998. Circle is drawn proportional to the number of times each haplotype was observed in the Caribbean. * Indicateshaplotype designated as ancestral in TCS network.doi:10.1371/journal.pone.0008652.g001
FL Staghorn Coral Diversity
PLoS ONE | www.plosone.org 3 January 2010 | Volume 5 | Issue 1 | e8652
common introgressed haplotype and was found in all four regions;
it is also the most common and ancestral haplotype in A. palmata
[32]. Haplotype i2 was the only introgressed haplotype observed in
the Western Caribbean. Two introgressed haplotypes were found
in two (i10) or three (i11) regions, whereas the remaining 10
introgressed haplotypes were found in only one region and often
only in one population, including one introgressed haplotype
found only in Florida (i13). The relatively high proportion of
private introgressed haplotypes most likely reflects both the rarity
of local introgression events [32] and possibly the restricted
geographic distribution of these haplotypes in A. palmata.
Regarding the four introgressed haplotypes found in the Florida
sample, two haplotypes had broad geographic distributions (i2 and
i11), and two were restricted to one (i13) or two (i10) regions.
Haplotype i10 is a restricted haplotype shared between the Eastern
Caribbean and Florida; however, this could reflect gene flow in
either A. cervicornis or A. palmata. Because of the high variance in
introgression frequency across populations, the distribution of
introgressed haplotypes may not accurately reflect gene flow
among populations of A. cervicornis; rather, it may represent
differential gene flow between A. palmata and A. cervicornis occurring
in different regions.
AMOVA and Population Genetic StructureWithin Florida, due to the small sample sizes within sites,
AMOVA and analysis of population structure at the level of reefs
were not possible. To evaluate gene flow among the Florida
Keys, collection sites were classified as upper Keys or lower Keys
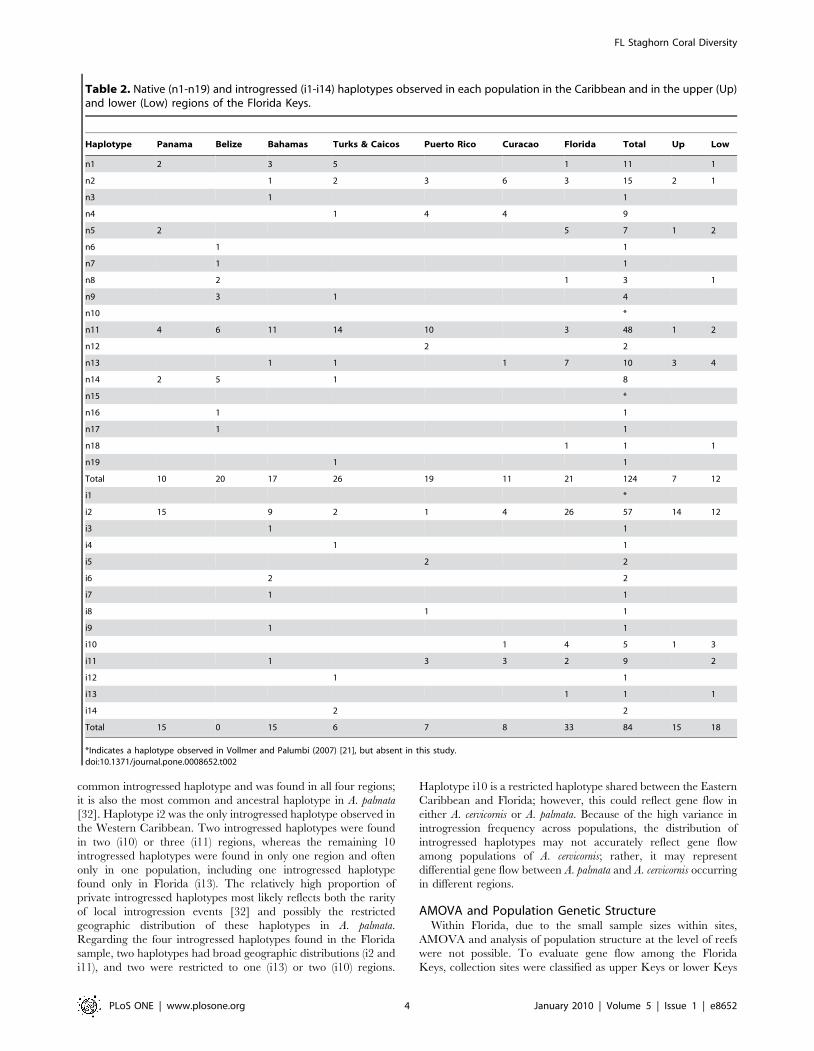
Table 2. Native (n1-n19) and introgressed (i1-i14) haplotypes observed in each population in the Caribbean and in the upper (Up)and lower (Low) regions of the Florida Keys.
Haplotype Panama Belize Bahamas Turks & Caicos Puerto Rico Curacao Florida Total Up Low
n1 2 3 5 1 11 1
n2 1 2 3 6 3 15 2 1
n3 1 1
n4 1 4 4 9
n5 2 5 7 1 2
n6 1 1
n7 1 1
n8 2 1 3 1
n9 3 1 4
n10 *
n11 4 6 11 14 10 3 48 1 2
n12 2 2
n13 1 1 1 7 10 3 4
n14 2 5 1 8
n15 *
n16 1 1
n17 1 1
n18 1 1 1
n19 1 1
Total 10 20 17 26 19 11 21 124 7 12
i1 *
i2 15 9 2 1 4 26 57 14 12
i3 1 1
i4 1 1
i5 2 2
i6 2 2
i7 1 1
i8 1 1
i9 1 1
i10 1 4 5 1 3
i11 1 3 3 2 9 2
i12 1 1
i13 1 1 1
i14 2 2
Total 15 0 15 6 7 8 33 84 15 18
*Indicates a haplotype observed in Vollmer and Palumbi (2007) [21], but absent in this study.doi:10.1371/journal.pone.0008652.t002
FL Staghorn Coral Diversity
PLoS ONE | www.plosone.org 4 January 2010 | Volume 5 | Issue 1 | e8652
according to geography (Figure 1). No evidence for significant
population structure between the upper Keys and lower Keys in
either the complete dataset (FST = 20.024, P = 0.66) or the native
only dataset (FST = 20.081, P = 0.79) was observed, and both
upper and lower Keys had similar levels of introgressed
haplotypes. As a result, the upper Keys and lower Keys samples
were combined into a single Florida population for the Caribbean-
wide population genetic analyses.
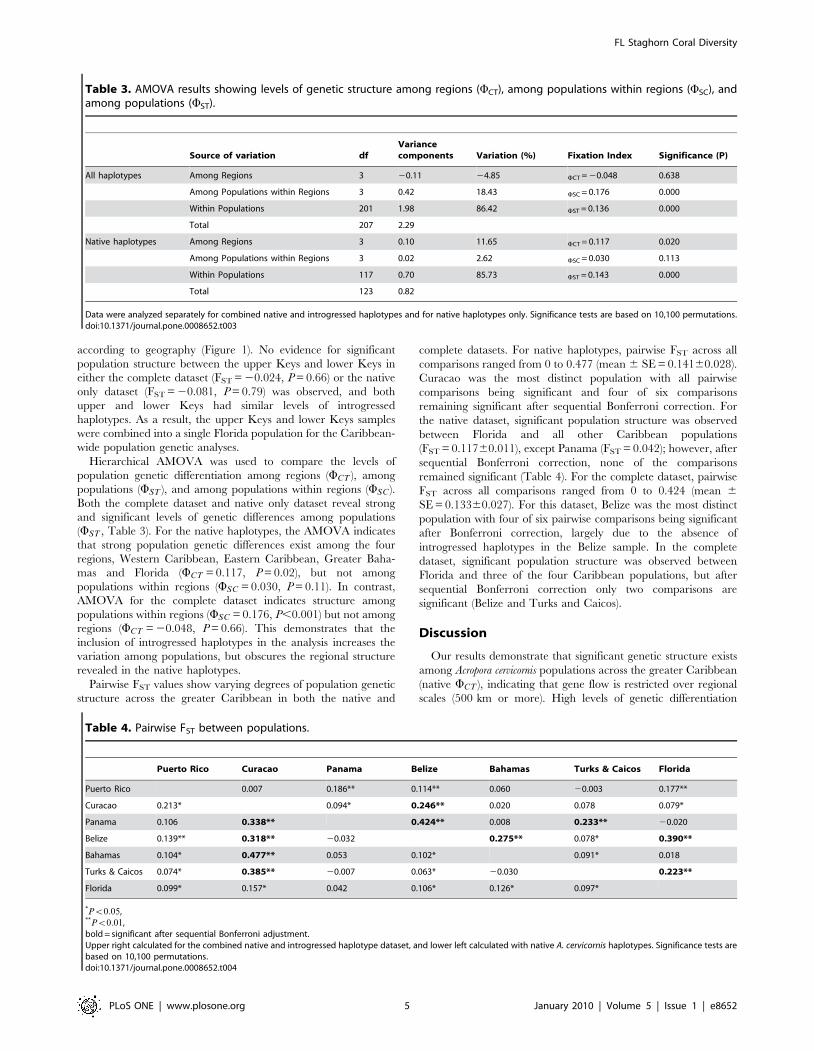
Hierarchical AMOVA was used to compare the levels of
population genetic differentiation among regions (WCT ), among
populations (WST ), and among populations within regions (WSC ).
Both the complete dataset and native only dataset reveal strong
and significant levels of genetic differences among populations
(WST , Table 3). For the native haplotypes, the AMOVA indicates
that strong population genetic differences exist among the four
regions, Western Caribbean, Eastern Caribbean, Greater Baha-
mas and Florida (WCT = 0.117, P = 0.02), but not among
populations within regions (WSC = 0.030, P = 0.11). In contrast,
AMOVA for the complete dataset indicates structure among
populations within regions (WSC = 0.176, P,0.001) but not among
regions (WCT = 20.048, P = 0.66). This demonstrates that the
inclusion of introgressed haplotypes in the analysis increases the
variation among populations, but obscures the regional structure
revealed in the native haplotypes.
Pairwise FST values show varying degrees of population genetic
structure across the greater Caribbean in both the native and
complete datasets. For native haplotypes, pairwise FST across all
comparisons ranged from 0 to 0.477 (mean 6 SE = 0.14160.028).
Curacao was the most distinct population with all pairwise
comparisons being significant and four of six comparisons
remaining significant after sequential Bonferroni correction. For
the native dataset, significant population structure was observed
between Florida and all other Caribbean populations
(FST = 0.11760.011), except Panama (FST = 0.042); however, after
sequential Bonferroni correction, none of the comparisons
remained significant (Table 4). For the complete dataset, pairwise
FST across all comparisons ranged from 0 to 0.424 (mean 6
SE = 0.13360.027). For this dataset, Belize was the most distinct
population with four of six pairwise comparisons being significant
after Bonferroni correction, largely due to the absence of
introgressed haplotypes in the Belize sample. In the complete
dataset, significant population structure was observed between
Florida and three of the four Caribbean populations, but after
sequential Bonferroni correction only two comparisons are
significant (Belize and Turks and Caicos).
Discussion
Our results demonstrate that significant genetic structure exists
among Acropora cervicornis populations across the greater Caribbean
(native WCT ), indicating that gene flow is restricted over regional
scales (500 km or more). High levels of genetic differentiation
Table 3. AMOVA results showing levels of genetic structure among regions (WCT), among populations within regions (WSC), andamong populations (WST).
Source of variation dfVariancecomponents Variation (%) Fixation Index Significance (P)
All haplotypes Among Regions 3 20.11 24.85 WCT = 20.048 0.638
Among Populations within Regions 3 0.42 18.43 WSC = 0.176 0.000
Within Populations 201 1.98 86.42 WST = 0.136 0.000
Total 207 2.29
Native haplotypes Among Regions 3 0.10 11.65 WCT = 0.117 0.020
Among Populations within Regions 3 0.02 2.62 WSC = 0.030 0.113
Within Populations 117 0.70 85.73 WST = 0.143 0.000
Total 123 0.82
Data were analyzed separately for combined native and introgressed haplotypes and for native haplotypes only. Significance tests are based on 10,100 permutations.doi:10.1371/journal.pone.0008652.t003
Table 4. Pairwise FST between populations.
Puerto Rico Curacao Panama Belize Bahamas Turks & Caicos Florida
Puerto Rico 0.007 0.186** 0.114** 0.060 20.003 0.177**
Curacao 0.213* 0.094* 0.246** 0.020 0.078 0.079*
Panama 0.106 0.338** 0.424** 0.008 0.233** 20.020
Belize 0.139** 0.318** 20.032 0.275** 0.078* 0.390**
Bahamas 0.104* 0.477** 0.053 0.102* 0.091* 0.018
Turks & Caicos 0.074* 0.385** 20.007 0.063* 20.030 0.223**
Florida 0.099* 0.157* 0.042 0.106* 0.126* 0.097*
*Pv0:05,**Pv0:01,bold = significant after sequential Bonferroni adjustment.Upper right calculated for the combined native and introgressed haplotype dataset, and lower left calculated with native A. cervicornis haplotypes. Significance tests arebased on 10,100 permutations.doi:10.1371/journal.pone.0008652.t004
FL Staghorn Coral Diversity
PLoS ONE | www.plosone.org 5 January 2010 | Volume 5 | Issue 1 | e8652
detected in the native mtDNA haplotypes among the four
Caribbean regions (native WCT = 0.117) corresponds to a rate of
inter-regional gene flow on the order of 3.8 migrants per
generation across the greater Caribbean (after [33]). The relatively
large proportion of native mtDNA haplotypes with restricted
geographic distributions [i.e. in only one or two regions (47% and
29%, respectively)] provides additional support for the regional
genetic structure detected with F-statistics and AMOVA and
reflects the limits on gene flow over large spatial scales.
Our data indicate that Florida’s A. cervicornis population is not
genetically depauperate and has similar levels of genetic diversity to
regions elsewhere in the Caribbean. We detected no evidence for
population structure within Florida (between the upper and lower
Keys) in our dataset. However, we detected relatively high levels of
genetic structure between Florida and other populations in the
Caribbean (average native pairwise FST = 0.105+0.016). Panama
was genetically most similar to Florida (native FST = 0.042), whereas
Curacao was most different (native FST = 0.157). Native FST values
for all other populations with Florida were between 0.097–0.126.
Florida and the Western Caribbean share geographically-restricted
haplotypes, suggesting that the Western Caribbean has historically
been an upstream source of genetic diversity for Florida.
Genetic Connections between Florida and the Rest of theCaribbean
Evidence presented here for restricted gene flow in Acropora
cervicornis across large swaths of the Caribbean support the previous
findings of Vollmer and Palumbi’s (2007) multi-locus Caribbean-
wide survey. In addition to the genetic structure among Caribbean
populations observed in the previous study (WCT = 0.249) and
supported here (WST = 0.143), the data demonstrate significant
structure among regional groupings (Western Caribbean, Eastern
Caribbean, Greater Bahamas and Florida, WCT = 0.117). Despite
this population structure, analysis of shared haplotypes indicates a
historical and possibly on-going connection between A. cervicornis
populations in the Western Caribbean and Florida, which Vollmer
and Palumbi (2007) tentatively suggested with a small sample of
Florida A. cervicornis (a total of five genets). While Florida, the
Greater Bahamas and the Eastern Caribbean also share some
haplotypes, strong genetic connections are not evident between
these regions. Although the Bahamas is much closer to the Florida
Keys (200 km) than the other populations, the strong Gulf Stream
current appears to act as a barrier to gene flow. Shared haplotypes
between Florida and the greater Caribbean are likely to be the
result of gene flow to Florida, rather than from Florida into the
other Caribbean regions due to prevailing currents [34]. Yet, a
protracted pelagic larval stage and favorable currents may allow
for gene flow from the Florida Keys to the Bahamas [28].
Ocean currents support a link between the Western Caribbean
and Florida [28], but coral reefs in Panama should be less
interconnected with Florida than those of Belize based on dispersal
routes and distances and the retaining influence of the Colombia-
Panama Gyre (contrary to our data). In addition, the transfer of
genetic variation between Central America and Florida (1000 km
from Belize and 1900 km from Panama) would likely require
multiple generations of dispersal in a stepping stone fashion via
intermediate populations. With a relatively short larval stage (,4
days, Vollmer SV, Fogarty N, unpublished data), the dispersal
potential of A. cervicornis larvae should be on the order of tens of
kilometers at most. Sharing of haplotypes between Western
Caribbean and Bahamas (1200 km apart) may also be accom-
plished via a similar route of connectivity along the reefs of Cuba
[28]. Larvae with such a short competency period still have a very
low probability of surviving each leg of this journey. Thus, the
phylogeographic connections in our data may reflect historical
patterns of gene flow that occurred decades, centuries or longer
ago in this species, which is both long-lived and able to propagate
indefinitely through asexual reproduction [35].
Significant differences in the frequencies of introgressed haplo-
types among populations provides another strong indication that
gene flow among these populations is geographically restricted.
With free exchange of larvae among populations, introgression
frequencies would homogenize, but the data demonstrate that this is
not the case. The extremely high introgression frequencies in
Florida and Panama distinguish these populations from elsewhere in
the Caribbean, including the Greater Bahamas. While the similarity
in introgression frequencies between Florida and Panama may be
due to ongoing gene flow, we consider this unlikely given the
distance and genetic structure of both populations with Belize, an
intermediate population. It is possible that A. cervicornis in Panama
and Florida share similar characteristics that favor introgressive
hybridization, although it is not clear what those characteristics
might be. The rarity of A. cervicornis in Florida could increase the
likelihood of inter-specific fertilization, but this cannot explain the
high introgression frequency in Panama, which has dense thickets of
A. cervicornis.
Given the relatively short dispersal potentials of the Caribbean
Acropora coral (3–5 days) and reef corals in general [22,36,37], it is
perhaps not a surprise that population genetic studies of a
diversity of Indo-Pacific and Caribbean reef coral species indicate
that gene flow tends to be restricted over hundreds of kilometers
(summarized in [21]). Regionally restricted gene flow has been
detected in both of the major reef-building Caribbean coral
groups, Acropora [20,21] and Montastrea corals [38]. Caribbean-
wide population genetic analyses for A. palmata using microsat-
ellites have shown strong genetic structure across the greater
Caribbean with a genetic break between the Western Caribbean
and the Eastern Caribbean occurring at the Mona Passage
between Puerto Rico and the Dominican Republic [20,22].
Genetic data from A. palmata support a connection between
Florida and Western Caribbean reefs [20,22] similar to A.
cervicornis [21]. But unlike for A. cervicornis, in A. palmata there
appears to be a strong genetic connection between Florida and
the Bahamas [20,22]. Microsatellites and RFLP analysis of two
Montastrea species within the same genus revealed that one
species, M. annularis, exhibits high population differentiation while
the other, M. faveolata, appears panmictic between the Western
Caribbean (Yucatan), Eastern Caribbean (Puerto Rico) and
Florida [38]. Thus, in both the Caribbean Acropora and Montastrea,
genetic data suggest that related coral species with similar
life-histories and dispersal potentials can have contrasting
population structures. Future research is needed to explain these
differences.
Differing degrees of population genetic structure have also been
detected in a variety of other Caribbean reef taxa and ascribed to a
variety of causes. Within the Florida Keys, structure was observed
in damselfish over a few meters and attributed to either a local
genetic bottleneck [39] or recruitment from genetically divergent
source populations, such as the Bahamas and Western Caribbean
[27]. Across the Caribbean, the significant population genetic
structure detected in fishes including gobies (Elacatinus spp) [40],
damselfish (Stegastes partitus) [41] and wrasses [42] has been
explained by isolation by distance [41] as well as differences in
environmental factors [42]. Invertebrates have shown varying
levels of genetic connectivity, from high genetic structure in an
octocoral (Pseudopterogorgia elisabethae) [43,44] to almost no genetic
structure in the economically important species queen conch
(Strombus gigas) [45] and spiny lobster (Panulirus argus) [46].
FL Staghorn Coral Diversity
PLoS ONE | www.plosone.org 6 January 2010 | Volume 5 | Issue 1 | e8652
Genetic Diversity and Connectivity within Florida’sStaghorn Corals
Our data revealed no significant population structure among A.
cervicornis within the Florida Keys. This is surprising, given that our
samples were collected over a distance of 200 kilometers and a
range of environmental conditions. Previous research on A.
cervicornis by Vollmer and Palumbi (2007) detected multiple
instances in which A. cervicornis populations separated by 2–15
kilometers were genetically distinct. In Florida, however, no
population genetic differences were detected between the upper
Keys and lower Keys in either native or introgressed haplotypes.
The absence of population genetic structure within Florida may
indicate that gene flow is high across the Florida Keys reef tract,
but alternate explanations are possible. In particular, barriers to
gene flow between reefs may exist at a small geographic scale, but
due to the limited sampling available from this diminished A.
cervicornis population such fine-scale analyses could not be applied.
Similar haplotype frequencies between upper and lower Keys may
also result from recent mortality due to WBD that may be
exhibiting positive selective pressure on resistant genotypes [18]
and reducing local diversity; however, our analyses indicate
relatively high diversity along the Florida Keys as a whole. While it
is possible that highly polymorphic genetic markers, such as
microsatellites, might reveal additional population genetic struc-
ture within the Florida Keys, preliminary microsatellite data for A.
cervicornis indicates that no such structure exists (I. Baums, personal
communication). Thus, it may well be the case that Florida is
characterized by having high gene flow within the region.
It is not entirely clear why Vollmer and Palumbi (2007) detected
such fine-scale differences among reefs elsewhere. Much of the
fine-scale genetic differences in their dataset were driven by highly
localized introgression signatures at one or more of the mtDNA or
nuclear intron loci surveyed, including the putative mtDNA
control surveyed here. Florida is distinctive for having the highest
frequencies of introgressed mtDNA haplotypes detected to date
across the greater Caribbean, but interestingly these high
frequencies do not differ between the upper and lower Keys
(G = 0.26, df = 1, P.0.5). The absence of localized differences in
introgression frequencies provides additional support for high gene
flow across Florida Keys reef tract; however, the low abundance of
A. cervicornis may have resulted in a higher proportion of hybrid
recruits. Additional investigation of the geographic patterns of
hybridization and introgression may shed light on this matter.
High gene flow across the Florida Keys is a possible indication
that the genetic diversity present in this population is sufficient to
allow sexual reproduction via outcrossing. Sufficient genetic
diversity and larval recruitment are essential for recovery of at
risk populations of corals, and our results indicate that Florida’s
genetic diversity of native haplotypes (h = 0.824) is comparable to,
and even higher than, the rest of Caribbean (h = 0.701+0.043). In
addition, while a number of haplotypes are regionally restricted,
Florida’s A. cervicornis population contains haplotypes found in all
other regions. Historical recruitment from the Western Caribbean
and other regions is one possible explanation for the relatively high
diversity in Florida.
The relatively high genetic diversity and the results of tests for
population size fluctuations (Tajima’s D, Fu & Li’s D, Fu & Li’s F,
and R2) do not indicate that there has been a significant loss of
gene diversity (i.e. a genetic bottleneck) associated with the recent
declines of A. cervicornis in Florida due to WBD. This may not be a
surprise given that it should take multiple generations of random
genetic drift for population size reductions to be reflected in
genetic diversity estimates [47], especially in large populations.
This could take many years in a clonal species with an indefinite
life-span. Even in species with short life spans, genetic diversity
may not immediately reflect dramatic population size reductions.
For example, Caribbean populations of the long-spined black sea
urchin (Diadema antillarum), which suffered an analogous decline of
up to 97% throughout the Caribbean as a result of disease in the
early 1980s, also retained high genetic diversity in an mtDNA
marker surveyed for individuals collected between 1987 and 1999
[48]. In both cases, it may take time before a genetic bottleneck is
evident in genetic diversity and effective population size estimates.
The effective population size of A. cervicornis in Florida can be
estimated using the estimated theta value from the native mtDNA
diversity and the equation h~2Ne fð Þu for mitochondrial DNA
[where Ne( f ) is the effective number of females, which is equiva-
lent to Ne (the effective population size) because A. cervicornis is
hermaphroditic, and u is the mutation rate per generation]. To
determine the neutral mutation rate of the putative mitochondrial
control region (u), we used the current estimated divergence time
between A. palmata and A. cervicornis of 3.6–2.6 mya, which
corresponds to 350,000 to one million generations ago using a
generation time of 3–8 years [49]. Based upon the presence of six
diagnostic mutations between A. palmata and A. cervicornis sequences
of 814 bp, we estimated a neutral mutation rate between
2.10661028 and 7.37161029 mutations per basepair per
generation. Given the estimated theta (per site) for Florida
(0.00171), this corresponds to an estimated range of effective
population size of 40,600–116,000 individuals within the Florida
Keys.
This estimate is far less than the 2007 abundance estimates of
Miller et al. (2008) [50], which indicate 13.8612.0 million colonies
of A. cervicornis in the Florida Keys. Clearly, more precise estimates
of current census population sizes are needed. One reason for the
discrepancy between census and effective population size estimates
is that the effective population size reflects effective number of
genets rather than ramets, and there are likely to be many ramets
per genet in this asexually reproducing species. In addition,
effective population size is often much smaller than the census size
due to gender imbalance (not a factor in hermaphroditic species),
variance in reproductive success [51], fluctuating population size,
population subdivision with frequent extinction and recolonization
[52] or a combination of these factors [53]. However, due to the
widespread evidence of recent population decline of A. cervicornis
and the tendency of effective population size estimates to reflect
the long-term average (harmonic mean) population size [54], our
effective population size estimate may not significantly underes-
timate the true census size of genetically distinct colonies of this
species in the Florida Keys.
The high standing genetic diversity in the Florida Keys is a
hopeful sign for future resilience of A. cervicornis along these reefs,
but over time the effect of genetic drift in a small population may
result in a future genetic bottleneck. Even with relatively high
genetic diversity, successful reproduction will occur at the level of
individual reefs and requires that multiple genotypes are present.
Future research should address the extent of localized genotypic
diversity on Florida Keys reefs with additional sampling and long-
term monitoring.
ConclusionsThe significant levels of population structure detected between
Florida and other regions in the Caribbean reveal that ongoing
rates of recruitment to the Keys from reefs elsewhere are low.
Restricted gene flow between Florida and other Caribbean
populations indicates high dependence on local larval retention
within the Florida Keys on the whole. Overall, our data suggest
that the A. cervicornis in the Florida Keys comprise a unique
FL Staghorn Coral Diversity
PLoS ONE | www.plosone.org 7 January 2010 | Volume 5 | Issue 1 | e8652
population within the Caribbean and should be treated as a
distinct management unit for conservation. Monitoring of genetic
diversity should continue for the Florida Keys region as the effect
of a genetic bottleneck may be lagging behind the observed
decrease in population size resulting from WBD. Furthermore, the
genetic make-up may shift if WBD takes a greater toll on disease
susceptible genotypes [18] or if high recruitment of larvae occurs
from elsewhere. Continued genetic analysis of additional samples,
as they become available, will help to reveal the extent of local
genotypic diversity and clarify whether barriers to gene flow exist
between individual reefs in the Florida Keys. Current data
showing limited genetic inputs from the greater Caribbean and
gene flow within the Florida Keys suggest that the persistence of
populations of this important reef-building species in Florida in the
immediate future will depend on self-recruitment, and thus must
be managed as a local resource.
Materials and Methods
Collection of coral samples for this project was approved by the
National Oceanic and Atmospheric Administration and was
conducted under permit numbers FKNMS-2008-006 and
FKNMS-2007-061.
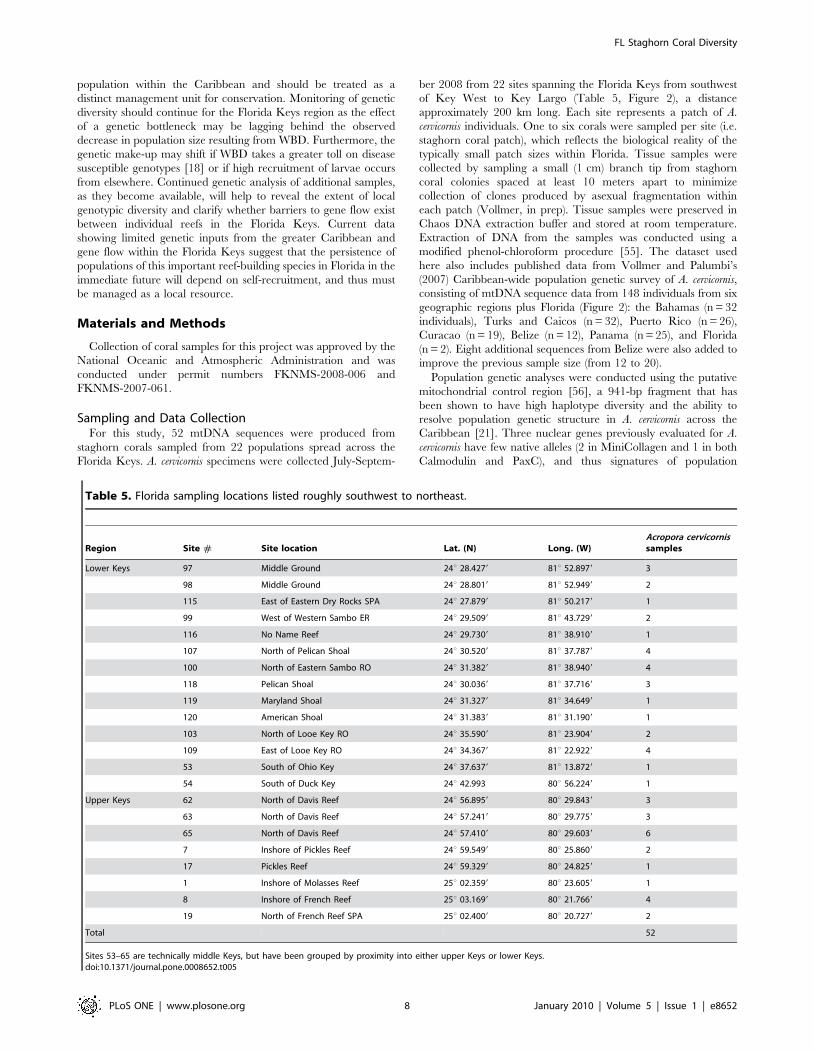
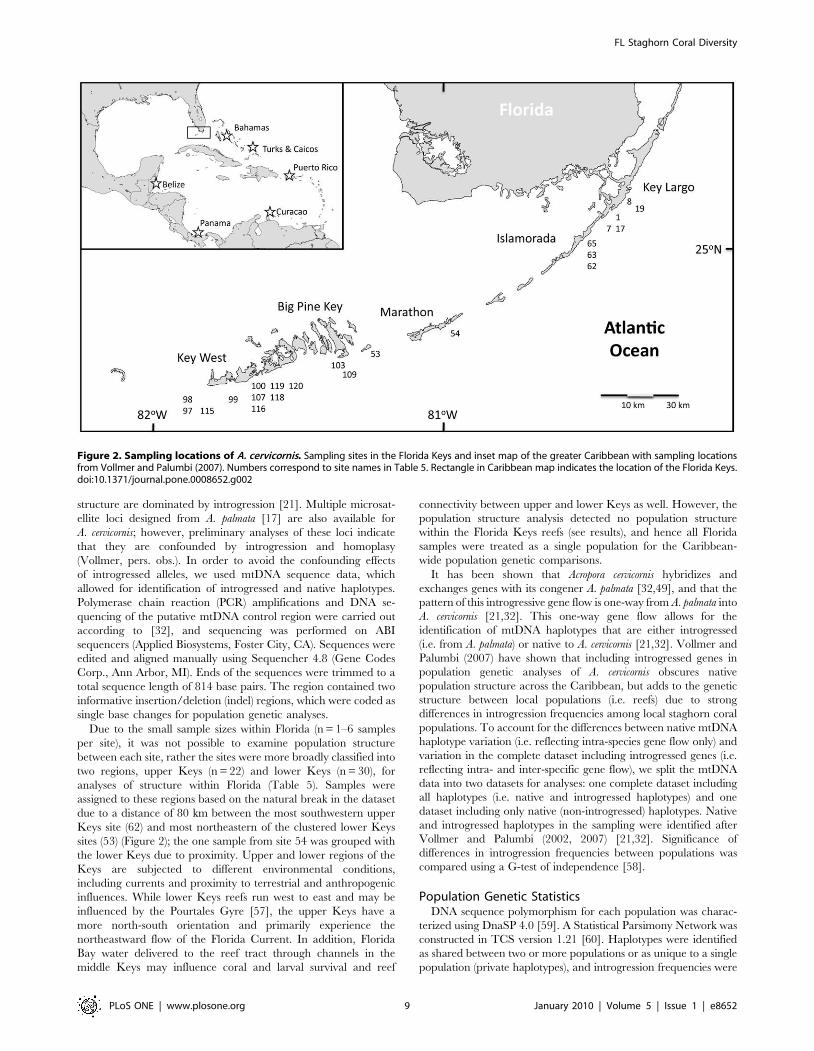
Sampling and Data CollectionFor this study, 52 mtDNA sequences were produced from
staghorn corals sampled from 22 populations spread across the
Florida Keys. A. cervicornis specimens were collected July-Septem-
ber 2008 from 22 sites spanning the Florida Keys from southwest
of Key West to Key Largo (Table 5, Figure 2), a distance
approximately 200 km long. Each site represents a patch of A.
cervicornis individuals. One to six corals were sampled per site (i.e.
staghorn coral patch), which reflects the biological reality of the
typically small patch sizes within Florida. Tissue samples were
collected by sampling a small (1 cm) branch tip from staghorn
coral colonies spaced at least 10 meters apart to minimize
collection of clones produced by asexual fragmentation within
each patch (Vollmer, in prep). Tissue samples were preserved in
Chaos DNA extraction buffer and stored at room temperature.
Extraction of DNA from the samples was conducted using a
modified phenol-chloroform procedure [55]. The dataset used
here also includes published data from Vollmer and Palumbi’s
(2007) Caribbean-wide population genetic survey of A. cervicornis,
consisting of mtDNA sequence data from 148 individuals from six
geographic regions plus Florida (Figure 2): the Bahamas (n = 32
individuals), Turks and Caicos (n = 32), Puerto Rico (n = 26),
Curacao (n = 19), Belize (n = 12), Panama (n = 25), and Florida
(n = 2). Eight additional sequences from Belize were also added to
improve the previous sample size (from 12 to 20).
Population genetic analyses were conducted using the putative
mitochondrial control region [56], a 941-bp fragment that has
been shown to have high haplotype diversity and the ability to
resolve population genetic structure in A. cervicornis across the
Caribbean [21]. Three nuclear genes previously evaluated for A.
cervicornis have few native alleles (2 in MiniCollagen and 1 in both
Calmodulin and PaxC), and thus signatures of population
Table 5. Florida sampling locations listed roughly southwest to northeast.
Region Site # Site location Lat. (N) Long. (W)Acropora cervicornissamples
Lower Keys 97 Middle Ground 24u 28.4279 81u 52.8979 3
98 Middle Ground 24u 28.8019 81u 52.9499 2
115 East of Eastern Dry Rocks SPA 24u 27.8799 81u 50.2179 1
99 West of Western Sambo ER 24u 29.5099 81u 43.7299 2
116 No Name Reef 24u 29.7309 81u 38.9109 1
107 North of Pelican Shoal 24u 30.5209 81u 37.7879 4
100 North of Eastern Sambo RO 24u 31.3829 81u 38.9409 4
118 Pelican Shoal 24u 30.0369 81u 37.7169 3
119 Maryland Shoal 24u 31.3279 81u 34.6499 1
120 American Shoal 24u 31.3839 81u 31.1909 1
103 North of Looe Key RO 24u 35.5909 81u 23.9049 2
109 East of Looe Key RO 24u 34.3679 81u 22.9229 4
53 South of Ohio Key 24u 37.6379 81u 13.8729 1
54 South of Duck Key 24u 42.993 80u 56.2249 1
Upper Keys 62 North of Davis Reef 24u 56.8959 80u 29.8439 3
63 North of Davis Reef 24u 57.2419 80u 29.7759 3
65 North of Davis Reef 24u 57.4109 80u 29.6039 6
7 Inshore of Pickles Reef 24u 59.5499 80u 25.8609 2
17 Pickles Reef 24u 59.3299 80u 24.8259 1
1 Inshore of Molasses Reef 25u 02.3599 80u 23.6059 1
8 Inshore of French Reef 25u 03.1699 80u 21.7669 4
19 North of French Reef SPA 25u 02.4009 80u 20.7279 2
Total 52
Sites 53–65 are technically middle Keys, but have been grouped by proximity into either upper Keys or lower Keys.doi:10.1371/journal.pone.0008652.t005
FL Staghorn Coral Diversity
PLoS ONE | www.plosone.org 8 January 2010 | Volume 5 | Issue 1 | e8652
structure are dominated by introgression [21]. Multiple microsat-
ellite loci designed from A. palmata [17] are also available for
A. cervicornis; however, preliminary analyses of these loci indicate
that they are confounded by introgression and homoplasy
(Vollmer, pers. obs.). In order to avoid the confounding effects
of introgressed alleles, we used mtDNA sequence data, which
allowed for identification of introgressed and native haplotypes.
Polymerase chain reaction (PCR) amplifications and DNA se-
quencing of the putative mtDNA control region were carried out
according to [32], and sequencing was performed on ABI
sequencers (Applied Biosystems, Foster City, CA). Sequences were
edited and aligned manually using Sequencher 4.8 (Gene Codes
Corp., Ann Arbor, MI). Ends of the sequences were trimmed to a
total sequence length of 814 base pairs. The region contained two
informative insertion/deletion (indel) regions, which were coded as
single base changes for population genetic analyses.
Due to the small sample sizes within Florida (n = 1–6 samples
per site), it was not possible to examine population structure
between each site, rather the sites were more broadly classified into
two regions, upper Keys (n = 22) and lower Keys (n = 30), for
analyses of structure within Florida (Table 5). Samples were
assigned to these regions based on the natural break in the dataset
due to a distance of 80 km between the most southwestern upper
Keys site (62) and most northeastern of the clustered lower Keys
sites (53) (Figure 2); the one sample from site 54 was grouped with
the lower Keys due to proximity. Upper and lower regions of the
Keys are subjected to different environmental conditions,
including currents and proximity to terrestrial and anthropogenic
influences. While lower Keys reefs run west to east and may be
influenced by the Pourtales Gyre [57], the upper Keys have a
more north-south orientation and primarily experience the
northeastward flow of the Florida Current. In addition, Florida
Bay water delivered to the reef tract through channels in the
middle Keys may influence coral and larval survival and reef
connectivity between upper and lower Keys as well. However, the
population structure analysis detected no population structure
within the Florida Keys reefs (see results), and hence all Florida
samples were treated as a single population for the Caribbean-
wide population genetic comparisons.
It has been shown that Acropora cervicornis hybridizes and
exchanges genes with its congener A. palmata [32,49], and that the
pattern of this introgressive gene flow is one-way from A. palmata into
A. cervicornis [21,32]. This one-way gene flow allows for the
identification of mtDNA haplotypes that are either introgressed
(i.e. from A. palmata) or native to A. cervicornis [21,32]. Vollmer and
Palumbi (2007) have shown that including introgressed genes in
population genetic analyses of A. cervicornis obscures native
population structure across the Caribbean, but adds to the genetic
structure between local populations (i.e. reefs) due to strong
differences in introgression frequencies among local staghorn coral
populations. To account for the differences between native mtDNA
haplotype variation (i.e. reflecting intra-species gene flow only) and
variation in the complete dataset including introgressed genes (i.e.
reflecting intra- and inter-specific gene flow), we split the mtDNA
data into two datasets for analyses: one complete dataset including
all haplotypes (i.e. native and introgressed haplotypes) and one
dataset including only native (non-introgressed) haplotypes. Native
and introgressed haplotypes in the sampling were identified after
Vollmer and Palumbi (2002, 2007) [21,32]. Significance of
differences in introgression frequencies between populations was
compared using a G-test of independence [58].
Population Genetic StatisticsDNA sequence polymorphism for each population was charac-
terized using DnaSP 4.0 [59]. A Statistical Parsimony Network was
constructed in TCS version 1.21 [60]. Haplotypes were identified
as shared between two or more populations or as unique to a single
population (private haplotypes), and introgression frequencies were
Figure 2. Sampling locations of A. cervicornis. Sampling sites in the Florida Keys and inset map of the greater Caribbean with sampling locationsfrom Vollmer and Palumbi (2007). Numbers correspond to site names in Table 5. Rectangle in Caribbean map indicates the location of the Florida Keys.doi:10.1371/journal.pone.0008652.g002
FL Staghorn Coral Diversity
PLoS ONE | www.plosone.org 9 January 2010 | Volume 5 | Issue 1 | e8652
calculated for each population as the percentage of haplotypes
sampled identified as originating in the A. palmata lineage. Using the
native haplotypes we tested for deviations from neutral expectations
using standard tests: Tajima’s D [61], Fu and Li’s D [62], and Fu
and Li’s F [62]. In addition, we ran mismatch analyses to detect
signatures of population expansion or contraction against the null
hypothesis of a constant-sized population and used coalescent
simulations to test the significance of population size changes using
the R2 statistic [63].
Population Genetic StructureHierarchical Analysis of Molecular Variance (AMOVA) [64]
was conducted using Arlequin 2.0 [65] to test for population
genetic structure among four regions across the seven sampled
populations. The regions were defined as follows: Western
Caribbean (Belize and Panama), Eastern Caribbean (Curacao
and Puerto Rico), Greater Bahamas (Bahamas and Turks and
Caicos), and Florida. To estimate genetic structure between
populations, pairwise FST (WST) values were calculated between
each population. Significance was determined by 10,100 permu-
tations and P-values were adjusted using sequential Bonferroni
[66]. Genetic structure between regions within the Florida Keys
(as stated above) was evaluated by calculating FST.
Acknowledgments
The authors would like to thank Mark Chiappone and Steven Miller for
generously providing Florida Keys samples. Field and logistics support was
provided by NOAA’s National Undersea Research Center at UNC
Wilmington (Otto Rutten), and NOAA’s Florida Keys National Marine
Sanctuary (Brian Keller and Joanne Delaney). Thank you to Rasit Bilgin,
Steven Miller, Sean Kent and two anonymous reviewers for their
comments on the manuscript.
Author Contributions
Conceived and designed the experiments: EH SV. Performed the
experiments: EH. Analyzed the data: EH. Contributed reagents/
materials/analysis tools: SV. Wrote the paper: EH SV.
References
1. Mumby PJ, Steneck RS (2008) Coral reef management and conservation in light
of rapidly evolving ecological paradigms. Trends Ecol Evol 23: 555–563.
2. Gardner TA, Cote IM, Gill JA, Grant A, Watkinson AR (2003) Long-term
region-wide declines in Caribbean corals. Science 301: 958–960.
3. Weil E (2004) Coral reef diseases in the wider Caribbean In: Rosenberg E, Y.
Loya, editor. Coral Health and Diseases. NY: Springer Verlag. pp 35–68.
4. Harvell CD, Jordan-Dahlgren E, Merkel S, Rosenberg E, Raymundo L, et al.
(2007) Coral disease, environmental drivers, and the balance between coral and
microbial associates. Oceanography 20: 172–195.
5. Green EP, Bruckner AW (2000) The significance of coral disease epizootiology
for coral reef conservation. Biol Conserv 96: 347–361.
6. Miller M, Bourque A, Bohnsack J (2002) An analysis of the loss of acroporid
corals at Looe Key, Florida, USA: 1983-2000. Coral Reefs 21: 179–182.
7. Aronson RB, Precht WF (2001) White-band disease and the changing face of
Caribbean coral reefs. Hydrobiologia 460: 25–38.
8. Zubillaga AL, Marquez LM, Croquer A, Bastidas C (2008) Ecological and
genetic data indicate recovery of the endangered coral Acropora palmata in Los
Roques, Southern Caribbean. Coral Reefs 27: 63–72.
9. Grober-Dunsmore R, Bonito V, Frazer TK (2006) Potential inhibitors to
recovery of Acropora palmata populations in St. John, US Virgin Islands. Mar Ecol
Prog Ser 321: 123.
10. Anonymous (2005) Endangered and threatened species: proposed threatened
status for elkhorn coral and staghorn coral. Federal Register 70: 24359–24365.
11. Hogarth WT (2006) Endangered and threatened species: final listing
determinations for the Elkhorn Coral and Staghorn Coral. Federal Register
71: 26852–26861.
12. Carpenter KE, Abrar M, Aeby G, Aronson RB, Banks S, et al. (2008) One-third
of reef-building corals face elevated extinction risk from climate change and local
impacts. Science 321: 560–563.
13. Highsmith RC (1982) Reproduction by fragmentation in corals. Mar Ecol Prog
Ser 7: 207–226.
14. Tunnicliffe V (1981) Breakage and propagation of the stony coral Acropora
cervicornis. Proc Natl Acad Sci U S A 78: 2427–2431.
15. Szmant AM (1986) Reproductive ecology of Caribbean reef corals. Coral Reefs
5: 43–53.
16. Vargas-Angel B, Thomas J (2002) Sexual reproduction of Acropora cervicornis in
nearshore waters off Fort Lauderdale, Florida, USA. Coral Reefs 21: 25–26.
17. Baums IB, Hughes CR, Hellberg ME (2005) Mendelian microsatellite loci for
the Caribbean coral Acropora palmata. Mar Ecol Prog Ser 288: 115–127.
18. Vollmer SV, Kline DI (2008) Natural Disease Resistance in Threatened
Staghorn Corals. PLoS ONE 3: e3718.
19. Baums IB, Miller MW, Hellberg ME (2006) Geographic variation in clonal
structure in a reef-building Caribbean coral, Acropora palmata. Ecol Monogr 76:
503–519.
20. Baums IB, Miller MW, Hellberg ME (2005) Regionally isolated populations of
an imperiled Caribbean coral, Acropora palmata. Mol Ecol 14: 1377–1390.
21. Vollmer SV, Palumbi SR (2007) Restricted gene flow in the Caribbean staghorn
coral Acropora cervicornis: implications for the recovery of endangered reefs.
J Hered 98: 40–50.
22. Baums IB, Paris CB, Cherubin LM (2006) A bio-oceanographic filter to larval
dispersal in a reef-building coral. Limnol Oceanogr 51: 1969–1981.
23. Ayre DJ, Hughes TP (2000) Genotypic diversity and gene flow in booding and
spawning corals along the Great Barrier Reef, Australia. Evolution 54:
1590–1605.
24. Mackenzie JB, Munday PL, Willis BL, Miller DJ, van Oppen MJH (2004)
Unexpected patterns of genetic structuring among locations but not colourmorphs in Acropora nasuta (Cnidaria; Scleractinia). Mol Ecol 13: 9–20.
25. Ayre DJ, Hughes TP (2004) Climate change, genotypic diversity and gene flowin reef-building corals. Ecol Lett 7: 273–278.
26. Benzie JAH, Haskell A, Lehman H (1995) Variation in the genetic compositionof coral (Pocillopora damicornis and Acropora palifera) populations from different reef
habitats. Mar Biol 121: 731–739.
27. Roberts CM (1997) Connectivity and management of Caribbean coral reefs.
Science 278: 1454.
28. Cowen RK, Paris CB, Srinivasan A (2006) Scaling of connectivity in marine
populations. Science 311: 522–527.
29. Precht WF, Aronson RB (2004) Climate flickers and range shifts of reef corals.Front Ecol Environ 2: 307–314.
30. Williams DE, Miller MW (2005) Coral disease outbreak: pattern, prevalence andtransmission in Acropora cervicornis. Mar Ecol Prog Ser 301: 119.
31. Murdoch TJT, Aronson RB (1999) Scale-dependent spatial variability of coralassemblages along the Florida Reef Tract. Coral Reefs 18: 341–351.
32. Vollmer SV, Palumbi SR (2002) Hybridization and the evolution of reef coraldiversity. Science 296: 2023–2025.
33. Wright S (1951) The genetical structure of populations. Ann Eugenic 15:323–354.
34. Hare JA, Walsh HJ (2007) Planktonic linkages among marine protected areas onthe south Florida and southeast United States continental shelves. Can J Fish
Aquat Sci 64: 1234–1247.
35. Botsford L, White JW, Coffroth MA, Paris CB, Planes S, et al. (2009)Connectivity and resilience of coral reef metapopulations in marine protected
areas: matching empirical efforts to predictive needs. Coral Reefs.
36. Wellington GM, Fitt WK (2003) Influence of UV radiation on the survival of
larvae from broadcast-spawning reef corals. Mar Biol 143: 1185–1192.
37. Nishikawa A, Katoh M, Sakai K (2003) Larval settlement rates and gene flow of
broadcast-spawning (Acropora tenuis) and planula-brooding (Stylophorapistillata) corals. Mar Ecol Prog Ser 256: 87–97.
38. Severance EG, Karl SA (2006) Contrasting population genetic structures of
sympatric, mass-spawning Caribbean corals. Mar Biol 150: 57–68.
39. Lacson JM, Morizot DC (1991) Temporal genetic variation in subpopulations of
bicolor damselfish (Stegastes partitus) inhabiting coral reefs in the Florida Keys.Mar Biol 110: 353–357.
40. Taylor MS, Hellberg ME (2006) Comparative phylogeography in a genus ofcoral reef fishes: biogeographic and genetic concordance in the Caribbean. Mol
Ecol 15: 695–707.
41. Purcell JFH, Cowen RK, Hughes CR, Williams DA (2009) Population structure
in a common Caribbean coral-reef fish: implications for larval dispersal andearly life-history traits. J Fish Biol 74: 403–417.
42. Rocha LA, Robertson DR, Roman J, Bowen BW (2005) Ecological speciation in
tropical reef fishes. P Roy Soc B-Biol Sci 272: 573.
43. Gutierrez-Rodriguez C, Barbeiros MS, Sanchez JA, Lasker HR (2009)
Phylogeography and morphological variation of the branching octocoralPseudopterogorgia elisabethae. Mol Phylogenet Evol 50: 1–15.
44. Gutierrez-Rodriguez C, Lasker HR (2004) Microsatellite variation reveals highlevels of genetic variability and population structure in the gorgonian coral
Pseudopterogorgia elisabethae across the Bahamas. Mol Ecol 13: 2211–2221.
45. Mitton JB, Berg Jr CJ, Orr KS (1989) Population structure, larval dispersal, and
gene flow in the queen conch, Strombus gigas, of the Caribbean. Biol Bull 177:
356.
FL Staghorn Coral Diversity
PLoS ONE | www.plosone.org 10 January 2010 | Volume 5 | Issue 1 | e8652
46. Silberman JD, Sarver SK, Walsh PJ (1994) Mitochondrial DNA variation and
population structure in the spiny lobster Panulirus argus. Mar Biol 120: 601–608.47. Tajima F (1989) The effect of change in population size on DNA polymorphism.
Genetics 123: 597–601.
48. Lessios HA (2001) Demographic history of Diadema antillarum, a keystoneherbivore on Caribbean reefs. P Roy Soc B-Biol Sci 268: 2347–2353.
49. Van Oppen MJH, Willis BL, Van Vugt H, Miller DJ (2000) Examination ofspecies boundaries in the Acropora cervicornis group (Scleractinia, Cnidaria) using
nuclear DNA sequence analyses. Mol Ecol 9: 1363–1374.
50. Miller S, Chiappone M, Rutten LM, Swanson DW (2008) Population status ofAcropora corals in the Florida Keys. Available: http://www.nova.edu/ncri/
11icrs/abstract_files/icrs2008-002047.pdf.51. Hedrick P (2005) Large variance in reproductive success and the Ne/N ratio.
Evolution 59: 1596–1599.52. Maruyama T, Kimura M (1980) Genetic variability and effective population size
when local extinction and recolonization of subpopulations are frequent. Proc
Natl Acad Sci U S A 77: 6710–6714.53. Avise JC (1994) Molecular Markers, Natural History and Evolution. Boston:
Kluwer Academic Publishers. 511 p.54. Hartl DL, Clark AG (1997) Principles of Population Genetics. Sunderland, MA:
Sinauer Associates, Inc. 542 p.
55. Fukami H, Budd AF, Levitan DR, Jara J, Kersanach R, et al. (2004) Geographicdifferences in species boundaries among members of the Montastraea annularis
complex based on molecular and morphological markers. Evolution 58:324–337.
56. van Oppen MJ, Hislop NR, Hagerman PJ, Miller DJ (1999) Gene content andorganization in a segment of the mitochondrial genome of the scleractinian coral
Acropora tenuis: major differences in gene order within the anthozoan subclass
zoantharia. Mol Biol Evol 16: 1812–1815.
57. Lee TN, Rooth C, Williams E, McGowan M, Szmant AM, et al. (1992)
Influence of Florida Current, gyres and wind-driven circulation on transport of
larvae and recruitment in the Florida Keys coral reefs. Cont Shelf Res 12:
971–1002.
58. Sokal RR, Rohlf FJ (1995) Biometry: the principles and practice of statistics in
biological research: WH Freeman.
59. Rozas J, Sanchez-DelBarrio JC, Messeguer X, Rozas R (2003) DnaSP, DNA
polymorphism analyses by the coalescent and other methods. Oxford Univ
Press. pp 2496–2497.
60. Clement M, Posada D, Crandall KA (2000) TCS: a computer program to
estimate gene genealogies. Mol Ecol 9: 1657–1659.
61. Tajima F (1989) Statistical method for testing the neutral mutation hypothesis by
DNA polymorphism. Genetics 123: 585–595.
62. Fu YX, Li WH (1993) Statistical tests of neutrality of mutations. Genetics 133:
693–709.
63. Ramos-Onsins SE, Rozas J (2002) Statistical properties of new neutrality tests
against population growth. Mol Biol Evol 19: 2092–2100.
64. Excoffier L, Smouse PE, Quattro JM (1992) Analysis of molecular variance
inferred from metric distances among DNA haplotypes: application to human
mitochondrial DNA restriction data. Genetics 131: 479–491.
65. Schneider S, Roessli D, Excoffier L (2000) Arlequin version 2.000: a software for
population genetics data analysis. Genetics and Biometry Laboratory, University
of Geneva, Geneva, Switzerland.
66. Rice WR (1989) Analyzing tables of statistical tests. Evolution 43: 223–225.
FL Staghorn Coral Diversity
PLoS ONE | www.plosone.org 11 January 2010 | Volume 5 | Issue 1 | e8652


