Embed Size (px)
Citation preview

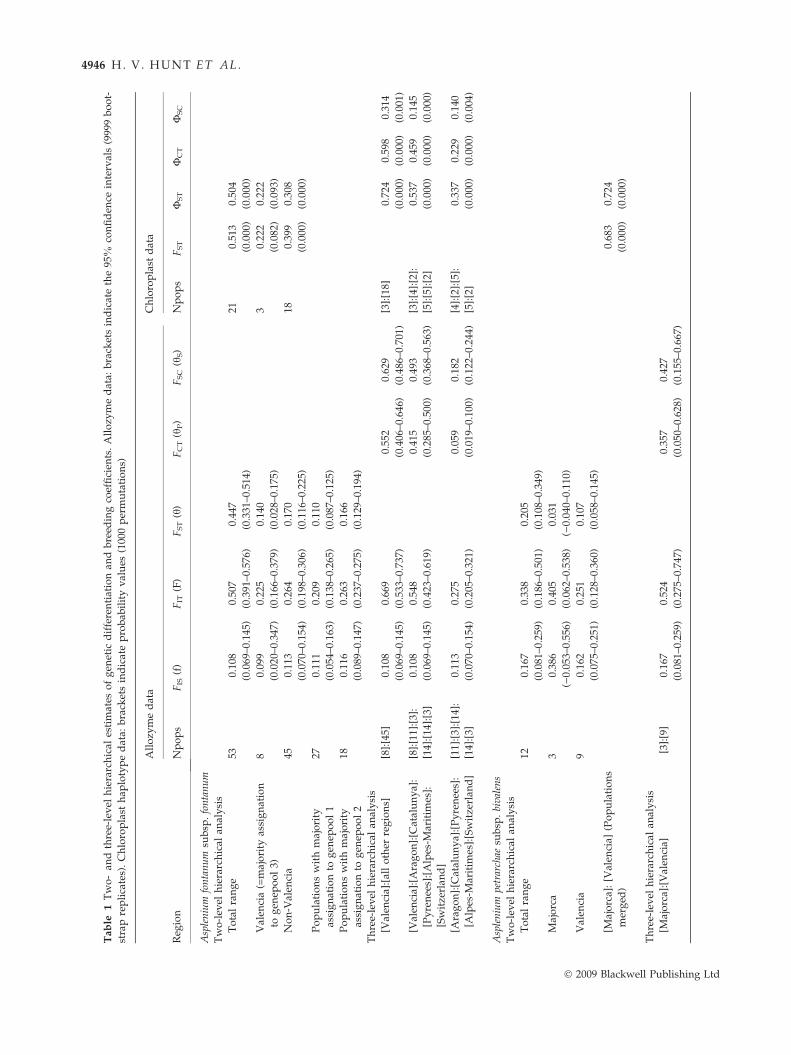
Molecular Ecology (2009) 18, 4940–4954 doi: 10.1111/j.1365-294X.2009.04402.x
Genetic diversity and phylogeography in two diploidferns, Asplenium fontanum subsp. fontanum and A.petrarchae subsp. bivalens, in the western Mediterranean
H. V. HUNT,*† S . W. ANSELL,* S . J . RUSSELL,* H. SCHNEIDER* and J . C. VOGEL*
*Department of Botany, Natural History Museum, London SW7 5BD, UK, †Department of Genetics, University of Cambridge,
Downing Street, Cambridge CB2 3EH, UK
Corresponde
E-mail: hvh2
Abstract
Asplenium fontanum subsp. fontanum and A. petrarchae subsp. bivalens are diploid rock
ferns of limestone outcrops of the western Mediterranean region. Asplenium fontanumsubsp. fontanum occurs from Valencia through northeastern Spain to the Alpes-
Maritimes and Swiss Jura. Asplenium petrarchae subsp. bivalens occurs only on Majorca,
in Valencia and possibly in southern Spain. We analysed allozyme and chloroplast
genetic marker diversity in 75 populations of A. fontanum subsp. fontanum and 12
populations of A. petrarchae subsp. bivalens sampled from across their respective ranges.
The two species show similar levels of species and population genetic diversity to one
another and to other diploid European Asplenium taxa. Both are predominantly
outbreeding, as indicated by FIS = 0.108 and 0.167 respectively. Substantial between-
population differentiation results largely from differentiation between regions. Isolation
by distance operates over limited geographic ranges, up to 50 km. In A. fontanum subsp.
fontanum, the major geographical differentiation between Valencia and the rest of the
taxon range probably represents an ancient range fragmentation. A less pronounced
differentiation divides populations in the SW from those in the NE of the range, with
evidence for a biogeographic link between the eastern Pyrenees and southeastern France.
High diversity in the Pyrenees may either represent ancient population differentiation,
or a suture zone. In A. petrarchae subsp. bivalens, populations on Majorca exhibit a
subset of the genetic diversity present in Valencia, although the two regions are strongly
differentiated by differing allele frequencies. Dispersal from the mainland may have
founded Majorcan populations, although a role for in situ island survival cannot be
excluded.
Keywords: allozyme electrophoresis, Asplenium, chloroplast DNA, fern phylogeography, rock
fern
Received 18 June 2009; revision received 26 August 2009; accepted 15 September 2009
Introduction
The western Mediterranean is one of the most biodi-
verse regions in Europe (Garcıa-Barros et al. 2002). This
high biodiversity has been attributed to the habitat
diversity resulting from the wide range of climates,
topography and underlying geology, and the complex
climatic and vegetation history of the region (Rivas-
nce: Harriet V. Hunt, Fax: +44 (0)1223 339285;
Martınez et al. 1999; Ferrer-Castan & Vetaas 2005). Paly-
nological and phylogeographic studies have established
that a wide range of plants and animals maintained
populations in the Iberian Peninsula throughout the
Pleistocene glaciation cycles (Huntley & Birks 1983;
Taberlet et al. 1998; Gomez & Lunt 2006). The moun-
tainous topography likely allowed species to respond to
climatic change by migrating along altitudinal gradients
(Gomez & Lunt 2006) and promoted differentiation of
isolated populations: the areas of highest plant species-
richness and endemism within Iberia correspond to
� 2009 Blackwell Publishing Ltd

WE STERN MEDITERRANEAN ROCK FERNS 4 94 1
mountain ranges, in particular the Pyrenees and the
Sierra Nevada (Ferrer-Castan & Vetaas 2005). Some
gene flow continued in both directions across the Pyre-
nees throughout the Pleistocene: Iberian forest popula-
tions show less extreme genetic differentiation than
those in other major refugia (Petit et al. 2003).
Ferns are currently underrepresented in phylogeo-
graphic studies, although there is considerable interest
in their ecology and biodiversity in the Iberian Penin-
sula at the species level and above (Ferrer-Castan &
Vetaas 2005; Moreno Saiz & Lobo 2008). Asplenium, the
most species-rich fern genus (Smith et al. 2006) is an
excellent model for addressing questions of species evo-
lution and response to climate change at a pan-Euro-
pean scale. The distribution of the c. 50 species and
subspecies in Europe has been extensively studied, and
areas of greatest species-richness broadly correspond to
the glacial refugia identified by Huntley and Birks
(Vogel et al. 1999). A molecular phylogeny of the genus
is established (Schneider et al. 2004).
Here we analyse the geographic structuring of allo-
zyme and chloroplast DNA (cpDNA) diversity in two
Asplenium taxa, A. fontanum (L.) Bernh. subsp. fontanum
and A. petrarchae (Guerin) DC. subsp. bivalens (D.E.
Meyer) Lovis & Reichst., across their entire respective
ranges in southwestern Europe. Both taxa are diploids
(Lovis & Reichstein 1969; Reichstein & Schneller 1982),
and are nested in the same clade in Schneider et al.’s
(2004) phylogeny of asplenioid ferns. They grow in fis-
sures and crevices of (predominantly) natural limestone
outcrops; A. fontanum reaches higher altitudes (up to
1800 m) than A. petrarchae (up to 700 m; Ibars et al.
1999). Asplenium fontanum subsp. fontanum has a rela-
tively wide geographic range extending from Valencia
province through northeastern Spain and the Pyrenees,
to the Alpes-Maritimes and Swiss Jura, with scattered
populations in Central Europe (Fig. 1A; Jalas & Suomi-
nen 1972; Tutin et al. 1993; Prelli & Boudrie 2002). Asp-
lenium petrarchae subsp. bivalens has a much narrower
distribution, recorded only from the Spanish provinces
of Majorca, Valencia, Malaga (Serranıa de Ronda), Sevil-
la (Sierras Subbaeticas) and Cadiz (Sierra de Grazalema)
(Fig. 2A) (Ibars et al. 1999).
The ranges of A. fontanum subsp. fontanum and A.
petrarchae subsp. bivalens lie almost entirely to the south
of the Pleistocene ice sheet limits, with the exception of
those areas of the Alps and Pyrenees that were covered
by ice caps. Such distributions are typical for diploid
Asplenium taxa in Europe, and have been explained by
the competitive disadvantage of obligate outbreeding in
diploid taxa, compared with their derived polyploids,
in colonizing new habitat: polyploids can establish
populations with single-spore colonization followed by
intragametophytic selfing (Vogel et al. 1999). The exten-
� 2009 Blackwell Publishing Ltd
sive distribution of an autotetraploid derived from
A. petrarchae subsp. bivalens, A. petrarchae subsp.
petrarchae, around the Mediterranean coasts of Spain
and France, and sporadically eastward to the Adriatic
and Greece (Tutin et al. 1993), supports this hypo-
thesis and may account for the restricted distribution of
the diploid cytotype.
Population genetic structure in plants is influenced
by various life-history traits including breeding system,
dispersal mechanism and life-form (Hamrick & Godt
1996). Reduced levels of genetic variation are expected
in rare plants, with small and ⁄ or fragmented popula-
tions, as a result of erosion by genetic drift (Gitzendan-
ner & Soltis 2000; Cole 2003). Here we address the
following questions: (1) Does the narrow endemic A.
petrarchae subsp. bivalens show reduced genetic diversity
compared with its widespread congener A. fontanum
subsp. fontanum? (2) How do the observed levels of
genetic diversity compare with those of other plants,
particularly other Asplenium? (3) What is the breeding
system and population structure of these taxa? (4) What
biogeographic regions do the patterns of diversity
suggest? and (5) What is the likely population history
of A. fontanum subsp. fontanum and A. petrarchae subsp.
bivalens?
Materials and methods
Plant collection
Populations of A. fontanum subsp. fontanum and A. petr-
archae subsp. bivalens were sampled throughout their
ranges. Where possible, at least 30 individuals from
each population were collected. Seventy five popula-
tions of A. fontanum subsp. fontanum (2026 plants) from
six geographic regions and 12 populations of A. petrar-
chae subsp. bivalens (621 plants) from two regions were
sampled (Table S1, Supporting information). We dis-
criminated between the diploid A. petrarchae subsp. biv-
alens and its derived autotetraploid A. petrarchae
(Guerin) DC. subsp. petrarchae using fixed heterozygos-
ity banding patterns on allozyme gels and correlation of
this data with spore size measurements and chromo-
some counts on a sub-sample of plants (Hunt 2004).
Allozymes
Allozyme variation was determined for all individuals
sampled. Proteins were extracted in a Tris-HCl (pH 7.5)
buffer (Soltis et al. 1983), and fractionated on 13.7% hy-
drolysed potato starch gels following established proto-
cols (Wendel & Weeden 1989; Vogel et al. 1999). Seven
enzymes were resolved on the lithium borate gel and
electrode buffer system 8 of Soltis et al. (1983): aconitate

B
A
C
Fig. 1 Geographical analysis of genetic variation in A. fontanum subsp. fontanum. (A) Distribution map of A. fontanum subsp. fonta-
num (blue), A. petrarchae subsp. bivalens (green), and the zone where both taxa co-occur (yellow). Proportion of assignation to gene-
pools for each sampled population under K3 Structure output (B), and neighbour-joining phenogram of Nei’s (1972) genetic
distances (Bi) showing bootstrap support values >70%. Populations referred to in the text are numbered. Distribution of chloroplast
haplotypes (C) and their minimum spanning network (Ci). Haplotype numbers are indicated in the network.
4942 H. V. HUN T ET AL.
hydratase (ACN, E.C. 4.2.1.3), acid phosphatase (ACP,
E.C. 3.1.3.2), aspartate aminotransferase (AAT, E.C.
2.6.1.1) leucine aminopeptidase (LAP, E.C. 3.4.11.1),
phosphoglucose isomerase (PGI, E.C. 5.3.1.9), phospho-
glucomutase (PGM, E.C. 5.4.2.2) and triose-phosphate
isomerase (TPI, E.C. 5.3.1.1). Six enzymes were resolved
using a morpholine citrate (pH 7.0–7.4) gel and elec-
trode buffer system (Wendel & Weeden 1989): 6-phos-
� 2009 Blackwell Publishing Ltd

B
A
C
Fig. 2 Geographical analysis of genetic variation in A. petrarchae subsp. bivalens. (A) Distribution map of A. fontanum subsp. fontanum
(blue), A. petrarchae subsp. bivalens (green), and the zone where both taxa co-occur (yellow). Proportion of assignation to genepools
for each sampled population under K3 Structure output, with assignations to genepools 2 and 3 combined into a single value (B),
and neighbour-joining phenogram of Nei’s (1972) genetic distances (Bi) showing bootstrap support values >70%. Populations
referred to in the text are numbered. Distribution of chloroplast haplotypes (C) and their minimum spanning network (Ci). Haplo-
type numbers are indicated in the network.
WE STERN MEDITERRANEAN ROCK FERNS 4 94 3
phogluconate dehydrogenase (6-PGD, E.C. 1.1.1.44),
hexokinase (HEX, 2.7.1.1), isocitrate dehydrogenase
(IDH, E.C. 1.1.1.42), malate dehydrogenase (MDH, E.C.
1.1.1.37), PGM, shikimate dehydrogenase (SKDH,
1.1.1.25) and utp-glucose pyrophosphorylase (UGPP,
E.C. 2.7.9). Allozyme banding systems were interpreted
using known enzyme sub-structuring (Kephart 1990),
taking into account the results of previous Asplenium
� 2009 Blackwell Publishing Ltd
allozyme studies (Vogel et al. 1999; Suter et al. 2000).
For enzymes with multiple loci, the most anodally
migrating isozyme was designated locus-1, except in
the case of one system (TPI) whose relative migration
rates were reversed between the two species in the
study. Correspondence of loci between A. fontanum
subsp. fontanum and A. petrarchae subsp. bivalens was
determined by the shared banding patterns in the

4944 H. V. HUN T ET AL.
hybrid, A. x protomajoricum Pangua & Prada, and the
derived allotetraploid, A. majoricum Litard., of these
species (Hunt 2004). Alleles were labelled by their rela-
tive mobility to a high-frequency ‘100’ allele; identity of
alleles was determined by running plants from an
invariant marker population of A. majoricum on all gels.
The allozyme diversity statistics percentage of poly-
morphic loci by the 95% criterion (P95), number of
alleles (A), expected heterozygosity (HE), observed het-
erozygosity (HO) and inbreeding coefficient (f) were cal-
culated in GDA version 1.1 (Lewis & Zaykin 2001).
Effective number of alleles (Ae) was calculated in Pop-
Gene version 1.32 (Yeh et al. 1999). Population structure
and breeding system were analysed using ANOVA (Weir
& Cockerham 1984), providing estimators (f, F, Q-P,
Q-S) of Wright’s (1978) F-statistics FIS, FIT, FST, FCT.
These were calculated for all populations, and sepa-
rately for Valencian vs. non-Valencian samples. F-statis-
tics and associated 95% confidence intervals (obtained
by bootstrapping with 9999 replicates) were estimated
in GDA. Nei’s (1972) genetic distance was calculated
between all pairs of populations for each data set in
GDA. Neighbour-joining phenograms were constructed
in GDA, and bootstrap support (1000 replicates) was
obtained by resampling the allelic frequency data using
DISPAN (Ota 1993). Trees were manipulated in Dend-
roscope version 2.2 (Huson et al. 2007). Mantel tests for
isolation by distance were performed in the R package
(version 4.00, Casgrain & Legendre 2001) between
matrices of log10-transformed pairwise genetic distance
(Nei 1978) and pairwise geographic distance. A modi-
fied Mantel test was performed on matrices of pairwise
genetic similarity (Nei 1978) and distance classes to
determine if genetic isolation by distance was restricted
over a particular geographic range, applying a sequen-
tial Bonferroni correction. Pairwise geographic distances
were calculated from the population location coordi-
nates (Table S1, Supporting information), using the for-
mula at http://www.cpearson.com/excel/latlong.htm.
The number of homogenous gene pools (K) was exam-
ined by Bayesian clustering, as implemented by Structure
2.2 (Pritchard et al. 2000), following the admixture model
(Falush et al. 2003), with correlated alleles, with a priori
assignment of individuals to locations. Ten simulations
were performed for each K, with 1–6 K per dataset, utiliz-
ing 400 000 Markov-Chain Monte-Carlo (MCMC) calcu-
lations per simulation, plus 100 000 MCMC replicates for
burn-in period. Evaluation of the number of K followed
the method in Evanno et al. (2005).
Chloroplast DNA
Chloroplast DNA sequence variation was analysed in
209 individuals of A. fontanum subsp. fontanum from 21
populations (Table S2, Supporting information) and in
47 individuals of A. petrarchae subsp. bivalens from nine
populations (Table S3, Supporting information), i.e. in
approximately 10% of the total number of individuals
analysed for allozyme diversity in each taxon. DNA
extraction was as described in Schneider et al. (2004)
with minor modifications. In A. fontanum subsp. fonta-
num, we sequenced the rps4-trnS intergenic spacer (IGS)
using the primers described by Schneider et al. (2005).
In A. petrarchae subsp. bivalens, we sequenced the
trnLUAA–trnFGAA region, including the trnL intron and
the intergenic spacer (IGS) between trnL and trnF
(henceforth abbreviated as ‘trnL-F’), using the primers
Fern-1 (Trewick et al. 2002) and f (Taberlet et al. 1991).
Amplifications were performed according to Trewick
et al. (2002) and Schneider et al. (2004) with minor
modifications. PCR products were sequenced for both
strands using BigDye Terminator Kits (v. 1.1 Applied
Biosystems, ABI) and an ABI 3730 capillary DNA
sequencer.
Sequences were assembled using SeqMan version
3.56 (DNASTAR, Inc.), and aligned in MegAlign version
3.14 (DNASTAR, Inc.) with manual checking. Sequences
have been submitted to GenBank (accession
numbers EU239484-EU239496 and FJ456852-FJ456857;
Tables S4 and S5, Supporting information). Variable
mononucleotide repeat regions were excluded from the
alignments prior to haplotype determination, because of
the potential for sequence reading errors, or for homo-
plasy or ancient polymorphisms whose inclusion may
result in an ambiguous network. Haplotype assignation,
network construction and AMOVA were performed in
Arlequin version 3.11 (Excoffier et al. 2005).
Results
Asplenium fontanum subsp. fontanum
Allozyme data. Thirteen loci were resolved and scored
for A. fontanum subsp. fontanum. Two loci were mono-
morphic (ACP and TPI-1), and in total 61 alleles were
identified across the 13 loci. Thirty-four of these were
rare (global frequency <5%) and eleven alleles were pri-
vate to a single population. Most alleles private to a sin-
gle population or region were found in the Pyrenees,
Aragon or Alpes-Maritimes regions (Table S6, Support-
ing information). Species-level allelic richness at the 11
polymorphic loci ranged from 2 (MDH-2) to 12 (PGI-2).
Mean species-level diversity statistics across all 13 loci
were as follows: P95 0.615, A 4.692, Ae 1.691, HE 0.272,
HO 0.137.
Twenty-two out of the 75 populations sampled con-
tained fewer than 15 individuals. To reduce sampling
error effects, these populations were excluded for all
� 2009 Blackwell Publishing Ltd

A
B
Fig. 3 Mean-population genetic diversity estimates for A. fon-
tanum subsp. fontanum (A) and A. petrarchae subsp. bivalens (B),
grouped by sampling region. Numbers of populations in each
region are shown in the key. Bars indicate standard errors of
the mean values.
WE STERN MEDITERRANEAN ROCK FERNS 4 94 5
subsequent tests, resulting in a dataset comprising 1898
individuals in 53 populations. Diversity statistics for
each population are shown in Table S7 (Supporting
information). Mean values across the 53 populations
were as follows: P95 0.448, A 1.844, Ae 1.286, HE 0.162,
HO 0.144 and f 0.108. Mean-population diversity was
substantially lower in Valencia and Switzerland than in
the four intervening regions, Aragon, Catalunya, Pyre-
nees and Alpes-Maritimes, which showed similar
mean-population diversity (Fig. 3A and Table S7, Sup-
porting information).
Hierarchical analysis (Table 1) confirmed significant
departure from Hardy–Weinberg equilibrium with
FIS = 0.108, 95% CI = 0.069–0.145. Strong inter-popula-
tion differentiation was observed (FST = 0.447, 95%
CI = 0.331–0.514), attributable primarily to differentia-
tion between the six geographic regions (FCT = 0.415,
95% CI = 0.285–0.500). The strongest differentiation was
seen between Valencian populations and those else-
where in the range (FCT = 0.552, 95% CI = 0.406–0.646).
Inter-regional differentiation reduced substantially
when Valencia was excluded (FCT = 0.059, 95%
CI = 0.019–0.100). Inter-population differentiation
within the three geographic population clusters
identified by Structure analysis (see below) was broadly
similar: cluster 1 (Alpes-Maritimes and eastern Pyre-
nees) – FST = 0.110 (95% CI = 0.087–0.125); cluster 2
(western Pyrenees and Aragon) – FST = 0.166 (95%
CI = 0.129–0.194); cluster 3 (Valencia) – FST = 0.140
(95% CI = 0.028–0.175). Mantel permutation tests
showed a weak relationship between geographical dis-
tance and genetic distance for the overall data set
(r2 = 0.008, P = 0.340). A modified Mantel test was per-
formed on the dataset excluding Valencian populations
to determine if genetic isolation by distance occurred
over a restricted geographic scale within the major por-
tion of the species’ range. A significant positive correla-
tion was detected over the first four of 15 distance
classes, covering distances up to 50 km (Fig. 4).
Modelling of the number of genetically homoge-
neous clusters in A. fontanum subsp. fontanum using
Structure gave a minimum probability with K = 1
()ln = 24019.9) and maximum probability with K = 5
()ln = 15376) when all 53 populations with N ‡ 15
were included. DK estimates (Fig. 5) supported K = 2,
which split the Valencian from non-Valencian popula-
tions. The model with K = 3 was also biogeographical-
ly meaningful. This model was supported by the
results of Structure analysis excluding Valencian popu-
lations, which gave a minimum probability with K = 1
()ln = 14360.1) and maximum probability with K = 6
()ln = 13114.6), and a DK maximum at K = 2 (Fig. 5).
We therefore propose a model for the whole geo-
graphic range of K = 3. This model additionally splits
� 2009 Blackwell Publishing Ltd
the western Aragonese and western Pyrenean popula-
tions from those in the eastern Pyrenees and the Al-
pes-Maritimes (Fig. 1B). Structure plots indicate some
admixture between these two groups throughout the
extra-Valencian range, but especially in northeastern
Spain and Switzerland (Fig. 1B). Assignation of popu-
lations to genepools was highly stable among replicate
runs (Table S7, Supporting information). Neighbour-
joining phenograms showed clusters of populations
consistent with those identified by the Structure
results, with a strong genetic differentiation (bootstrap
value of 99%) separating Valencian from non-Valen-
cian populations, and the remaining populations
broadly separating into a northeastern and two south-
western clusters (Fig. 1Bi).
Ta
ble
1T
wo
-an
dth
ree-
lev
elh
iera
rch
ical
esti
mat
eso
fg
enet
icd
iffe
ren
tiat
ion
and
bre
edin
gco
effi
cien
ts.
All
ozy
me
dat
a:b
rack
ets
ind
icat
eth
e95%
con
fid
ence
inte
rval
s(9
999
bo
ot-
stra
pre
pli
cate
s).
Ch
loro
pla
sth
aplo
typ
ed
ata:
bra
cket
sin
dic
ate
pro
bab
ilit
yv
alu
es(1
000
per
mu
tati
on
s)
Reg
ion
All
ozy
me
dat
aC
hlo
rop
last
dat
a
Np
op
sF
IS(f
)F
IT(F
)F
ST
(h)
FC
T(h
P)
FS
C(h
S)
Np
op
sF
ST
FS
TF
CT
FS
C
Asp
len
ium
fon
tan
um
sub
sp.
fon
tan
um
Tw
o-l
evel
hie
rarc
hic
alan
aly
sis
To
tal
ran
ge
530.
108
0.50
70.
447
210.
513
0.50
4
(0.0
69–0
.145
)(0
.391
–0.5
76)
(0.3
31–0
.514
)(0
.000
)(0
.000
)
Val
enci
a(=
maj
ori
tyas
sig
nat
ion
tog
enep
oo
l3)
80.
099
0.22
50.
140
30.
222
0.22
2
(0.0
20–0
.347
)(0
.166
–0.3
79)
(0.0
28–0
.175
)(0
.082
)(0
.093
)
No
n-V
alen
cia
450.
113
0.26
40.
170
180.
399
0.30
8
(0.0
70–0
.154
)(0
.198
–0.3
06)
(0.1
16–0
.225
)(0
.000
)(0
.000
)
Po
pu
lati
on
sw
ith
maj
ori
ty
assi
gn
atio
nto
gen
epo
ol
1
270.
111
0.20
90.
110
(0.0
54–0
.163
)(0
.138
–0.2
65)
(0.0
87–0
.125
)
Po
pu
lati
on
sw
ith
maj
ori
ty
assi
gn
atio
nto
gen
epo
ol
2
180.
116
0.26
30.
166
(0.0
89–0
.147
)(0
.237
–0.2
75)
(0.1
29–0
.194
)
Th
ree-
lev
elh
iera
rch
ical
anal
ysi
s
[Val
enci
a]:[
all
oth
erre
gio
ns]
[8]:
[45]
0.10
80.
669
0.55
20.
629
[3]:
[18]
0.72
40.
598
0.31
4
(0.0
69–0
.145
)(0
.533
–0.7
37)
(0.4
06–0
.646
)(0
.486
–0.7
01)
(0.0
00)
(0.0
00)
(0.0
01)
[Val
enci
a]:[
Ara
go
n]:
[Cat
alu
ny
a]:
[Py
ren
ees]
:[A
lpes
-Mar
itim
es]:
[Sw
itze
rlan
d]
[8]:
[11]
:[3]
:
[14]
:[14
]:[3
]
0.10
80.
548
0.41
50.
493
[3]:
[4]:
[2]:
[5]:
[5]:
[2]
0.53
70.
459
0.14
5
(0.0
69–0
.145
)(0
.423
–0.6
19)
(0.2
85–0
.500
)(0
.368
–0.5
63)
(0.0
00)
(0.0
00)
(0.0
00)
[Ara
go
n]:
[Cat
alu
ny
a]:[
Py
ren
ees]
:
[Alp
es-M
arit
imes
]:[S
wit
zerl
and
]
[11]
:[3]
:[14
]:
[14]
:[3]
0.11
30.
275
0.05
90.
182
[4]:
[2]:
[5]:
[5]:
[2]
0.33
70.
229
0.14
0
(0.0
70–0
.154
)(0
.205
–0.3
21)
(0.0
19–0
.100
)(0
.122
–0.2
44)
(0.0
00)
(0.0
00)
(0.0
04)
Asp
len
ium
petr
arch
aesu
bsp
.bi
vale
ns
Tw
o-l
evel
hie
rarc
hic
alan
aly
sis
To
tal
ran
ge
120.
167
0.33
80.
205
(0.0
81–0
.259
)(0
.186
–0.5
01)
(0.1
08–0
.349
)
Maj
orc
a3
0.38
60.
405
0.03
1
()0.
053–
0.55
6)(0
.062
–0.5
38)
()0.
040–
0.11
0)
Val
enci
a9
0.16
20.
251
0.10
7
(0.0
75–0
.251
)(0
.128
–0.3
60)
(0.0
58–0
.145
)
[Maj
orc
a]:
[Val
enci
a](P
op
ula
tio
ns
mer
ged
)
0.68
30.
724
(0.0
00)
(0.0
00)
Th
ree-
lev
elh
iera
rch
ical
anal
ysi
s
[Maj
orc
a]:[
Val
enci
a][3
]:[9
]0.
167
0.52
40.
357
0.42
7
(0.0
81–0
.259
)(0
.275
–0.7
47)
(0.0
50–0
.628
)(0
.155
–0.6
67)
4946 H. V. HUN T ET AL.
� 2009 Blackwell Publishing Ltd
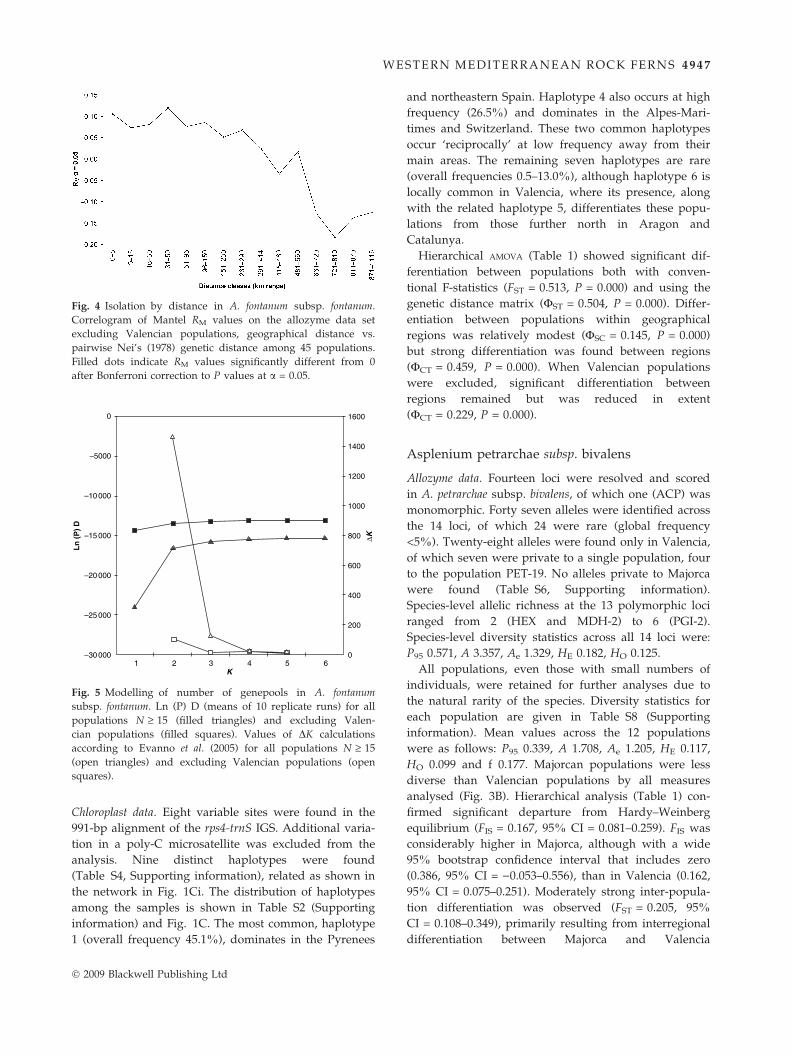
Fig. 4 Isolation by distance in A. fontanum subsp. fontanum.
Correlogram of Mantel RM values on the allozyme data set
excluding Valencian populations, geographical distance vs.
pairwise Nei’s (1978) genetic distance among 45 populations.
Filled dots indicate RM values significantly different from 0
after Bonferroni correction to P values at a = 0.05.ΔK800
1000
1200
1400
1600
600
400
200
0
Ln
(P
) D
–20 000
–15 000
–25 000
–30 000
–10 000
–5000
0
K1 2 3 4 5 6
Fig. 5 Modelling of number of genepools in A. fontanum
subsp. fontanum. Ln (P) D (means of 10 replicate runs) for all
populations N ‡ 15 (filled triangles) and excluding Valen-
cian populations (filled squares). Values of DK calculations
according to Evanno et al. (2005) for all populations N ‡ 15
(open triangles) and excluding Valencian populations (open
squares).
WE STERN MEDITERRANEAN ROCK FERNS 4 94 7
Chloroplast data. Eight variable sites were found in the
991-bp alignment of the rps4-trnS IGS. Additional varia-
tion in a poly-C microsatellite was excluded from the
analysis. Nine distinct haplotypes were found
(Table S4, Supporting information), related as shown in
the network in Fig. 1Ci. The distribution of haplotypes
among the samples is shown in Table S2 (Supporting
information) and Fig. 1C. The most common, haplotype
1 (overall frequency 45.1%), dominates in the Pyrenees
� 2009 Blackwell Publishing Ltd
and northeastern Spain. Haplotype 4 also occurs at high
frequency (26.5%) and dominates in the Alpes-Mari-
times and Switzerland. These two common haplotypes
occur ‘reciprocally’ at low frequency away from their
main areas. The remaining seven haplotypes are rare
(overall frequencies 0.5–13.0%), although haplotype 6 is
locally common in Valencia, where its presence, along
with the related haplotype 5, differentiates these popu-
lations from those further north in Aragon and
Catalunya.
Hierarchical AMOVA (Table 1) showed significant dif-
ferentiation between populations both with conven-
tional F-statistics (FST = 0.513, P = 0.000) and using the
genetic distance matrix (FST = 0.504, P = 0.000). Differ-
entiation between populations within geographical
regions was relatively modest (FSC = 0.145, P = 0.000)
but strong differentiation was found between regions
(FCT = 0.459, P = 0.000). When Valencian populations
were excluded, significant differentiation between
regions remained but was reduced in extent
(FCT = 0.229, P = 0.000).
Asplenium petrarchae subsp. bivalens
Allozyme data. Fourteen loci were resolved and scored
in A. petrarchae subsp. bivalens, of which one (ACP) was
monomorphic. Forty seven alleles were identified across
the 14 loci, of which 24 were rare (global frequency
<5%). Twenty-eight alleles were found only in Valencia,
of which seven were private to a single population, four
to the population PET-19. No alleles private to Majorca
were found (Table S6, Supporting information).
Species-level allelic richness at the 13 polymorphic loci
ranged from 2 (HEX and MDH-2) to 6 (PGI-2).
Species-level diversity statistics across all 14 loci were:
P95 0.571, A 3.357, Ae 1.329, HE 0.182, HO 0.125.
All populations, even those with small numbers of
individuals, were retained for further analyses due to
the natural rarity of the species. Diversity statistics for
each population are given in Table S8 (Supporting
information). Mean values across the 12 populations
were as follows: P95 0.339, A 1.708, Ae 1.205, HE 0.117,
HO 0.099 and f 0.177. Majorcan populations were less
diverse than Valencian populations by all measures
analysed (Fig. 3B). Hierarchical analysis (Table 1) con-
firmed significant departure from Hardy–Weinberg
equilibrium (FIS = 0.167, 95% CI = 0.081–0.259). FIS was
considerably higher in Majorca, although with a wide
95% bootstrap confidence interval that includes zero
(0.386, 95% CI = )0.053–0.556), than in Valencia (0.162,
95% CI = 0.075–0.251). Moderately strong inter-popula-
tion differentiation was observed (FST = 0.205, 95%
CI = 0.108–0.349), primarily resulting from interregional
differentiation between Majorca and Valencia

4948 H. V. HUN T ET AL.
(FCT = 0.357, 95% CI = 0.050–0.628). Interpopulation dif-
ferentiation within Majorca was not statistically signifi-
cant (FST = 0.031, 95% CI = -0.040–0.110) and was
modest within Valencia (FST = 0.107, 95% CI = 0.058–
0.145).
Bayesian analysis using Structure gave a minimum
probability with K = 1 ()ln = 5463.9) and maximum
probability with K = 5 ()ln = 4591.01), and DK calcula-
tions indicated an optimal model with three clusters
(Fig. 6). K = 3 splits the Majorcan from the Valencian
populations, the latter consisting of two clusters which
were extensively admixed among all populations. To
test this model, we repeated the analysis excluding the
Majorcan populations, whose high FIS (0.386) violates
the underlying assumption of Hardy–Weinberg equilib-
rium (HWE). Calculated probabilities ranged from a
minimum at K = 1 ()ln = 4717.6) to a maximum at
K = 4 ()ln = 4512.64).The obtained DK values were low
and gave no clear maximum (Fig. 6), providing no evi-
dence to indicate any sub-division of the Valencian
genepool. This pattern is consistent with the observed
low differentiation among Valencian populations
(FST = 0.107). We thus inferred the existence of two
genepools. Assignations of populations to these are
shown in Fig. 2B, in which we combined the propor-
tions assigned to clusters 2 and 3 under K = 3 for the
full dataset. This gives a predominantly Majorcan gene-
pool 1 and a predominantly Valencian genepool 2. This
interpretation is consistent with the neighbour-joining
phenogram (Fig. 2Bi), which supports the Valencian-
–6000
–5000
–4000
–3000
–2000
–1000
0
1 2 3 4 5 6 K
Ln
(P
)D
0
100
200
300
400
500
600
700
800
ΔK
Fig. 6 Modelling of number of genepools in A. petrarchae
subsp. bivalens. Ln (P) D (means of 10 replicate runs) for all
populations (filled squares) and excluding Majorcan popula-
tions (filled triangles). Values of DK calculations according to
Evanno et al. (2005) for all populations (open squares) and
excluding Majorcan populations (open triangles).
Majorcan split with very high bootstrap support (98%),
and gives only limited support for internal structure
within Valencia, with only the node joining populations
PET-20 and PET-33 having bootstrap support >70%.
Chloroplast data. Four polymorphic sites were found in
the 900bp alignment of the trnL-F region. Additional
variation involving indels was excluded from the analy-
sis. Five haplotypes were observed (Table S5, Support-
ing information), related as shown in the network given
in Fig. 2Ci. Their distribution among the samples is
shown in Table S3 (Supporting information) and
Fig. 2C. The most common haplotype, 4, occurs at a
frequency of 72.5% among Valencian samples, with the
remaining four haplotypes occurring at lower frequency
in this region. The seven Majorcan plants sequenced
were monomorphic for haplotype 1. An AMOVA, in
which all Majorcan plants were treated as one popula-
tion, and all Valencian plants as a second population,
found significant differentiation between Majorca and
Valencia both using haplotype frequencies only
(FST = 0.683, P = 0.000) and incorporating the genetic
distance matrix (FST = 0.724, P = 0.000) (Table 1).
Discussion
Ferns are currently underrepresented in studies of
genetic diversity and phylogeography, despite their
potential as models to explore the evolutionary
responses of plants to environmental change (Vogel
et al. 1999; Trewick et al. 2002; Shepherd et al. 2007).
Understanding these processes – including population
fragmentations and expansions, and formation and
establishment of new species – requires analysis of
populations across a taxon’s entire range. Most pub-
lished studies on fern intraspecific diversity (Werth
et al. 1985; Soltis & Soltis 1990; Ranker et al. 1994; Sch-
neller & Holderegger 1996; Suter et al. 2000; Herrero
et al. 2001; Quintanilla et al. 2007; Schneller & Liebst
2007) quantify genetic diversity from a small number of
populations and ⁄ or in a selected area of the species’
range. In the current study, we have achieved compre-
hensive sampling from across several hundred kilome-
tres for Asplenium fontanum subsp. fontanum and from
the two population clusters of A. petrarchae subsp. biva-
lens restricted to Majorca and Valencia. We did not find
any of the populations of the latter taxon reported from
southern Spain by Meyer (1964), despite extensive
searching; all populations collected from this region
were of the autotetraploid A. petrarchae subsp. petrarchae
(Hunt 2004). This discrepancy with our results may be
either the result of extinction in southern Spain or
reflect confusion of diploid and tetraploid cytotypes.
We have extended the known range of A. petrarchae
� 2009 Blackwell Publishing Ltd

WE STERN MEDITERRANEAN ROCK FERNS 4 94 9
subsp. bivalens on Majorca beyond the single site
recorded by Bennert et al. (1990).
Levels of genetic diversity in plant species are
affected by life-history, population biology (Hamrick &
Godt 1996) and evolutionary history (Gitzendanner &
Soltis 2000). Thus, comparisons between taxa sharing
reproductive traits and that belong to the same evolu-
tionary lineage are the most meaningful. Within Euro-
pean Asplenium, (typically) outbreeding diploid taxa
harbour substantially higher levels of variation than
inbreeding polyploid populations, which can be
founded by just a single spore (Schneller & Holderegger
1996; Vogel et al. 1999; Suter et al. 2000). Comparison of
species- and population-level allozyme diversity in A.
fontanum subsp. fontanum and A. petrarchae subsp. biva-
lens with other diploid European Asplenium taxa
(Table S9, Supporting information) suggests that these
two taxa support intermediate levels of variation rela-
tive to their congeners.
A. fontanum subsp. fontanum has slightly higher diver-
sity estimates than A. petrarchae subsp. bivalens by all cri-
teria considered. FIS estimates were slightly higher in A.
petrarchae subsp. bivalens than in A. fontanum subsp. fon-
tanum. Estimates of FST and FCT indicated similar levels
of between-population and between-region differentia-
tion in both species. A paired-sample t-test on species-
level allelic richness across the twelve loci analysed for
both species gave t = 0.563; t0.05(1),11 = 1.796, indicating
no statistically significant difference in allelic richness
between A. fontanum subsp. fontanum and A. petrarchae
subsp. bivalens. Differences in loci analysed and popula-
tion size criteria precluded further interspecific compar-
ative analysis of either allozyme or cpDNA data.
Pairwise comparisons of rare vs. common plant cong-
eners have found greater species- and population-level
diversity in the widespread congener in 75–85% of
cases, although a substantial minority of pairs (15–25%)
did not follow this trend (Gitzendanner & Soltis 2000;
Cole 2003). The definition of ‘rarity’ varies between
studies (Rabinowitz 1981), encompassing one or more
of: small population sizes, narrow geographic ranges,
and fragmented populations. Rare species with large,
localized populations can maintain high levels of
genetic variation (Ellstrand & Elam 1993). Asplenium
fontanum subsp. fontanum and A. petrarchae subsp. biva-
lens differ primarily in range size. Both taxa have patch-
ily-distributed populations of variable (<10 to >100
individuals) but comparable size. Theoretical consider-
ations and empirical evidence therefore support the
conclusion that A. petrarchae subsp. bivalens is not
strongly genetically depauperate, corroborating the
findings of Schneller & Holderegger (1996) that small,
isolated fern populations can maintain genetic
variability.
� 2009 Blackwell Publishing Ltd
FIS estimates from allozymes have been used to infer
breeding system in a number of fern species (Soltis &
Soltis 1989; Masuyama & Watamo 1990; Li & Haufler
1999; Vogel et al. 1999; Suter et al. 2000; Pryor et al.
2001). Our data show that both A. fontanum subsp. fon-
tanum and A. petrarchae subsp. bivalens are predomi-
nantly outbreeding. FIS was reduced when
subpopulations were considered separately (data not
shown), indicating spatial structuring within popula-
tions. Population substructuring has been demonstrated
in other rock fern species, e.g. Cheilanthes gracillima
(Soltis & Soltis 1989) and Pteris multifida (Murakami
et al. 1997) and explained by the patchy within-site
niche distribution typical of rock fern habitats (Soltis &
Soltis 1989; Pryor et al. 2001), and the strongly leptokur-
tic pattern of spore dispersal.
The strongest genetic differentiation in both taxa in
this study is between Valencia and the rest of their
respective ranges: a wide area from Aragon to the
Alpes-Maritimes in the case of A. fontanum subsp. fonta-
num, and the few populations on Majorca of A. petrar-
chae subsp. bivalens. This differentiation results from
distinct allozyme allele and haplotype frequencies, and
accounts for most of the total FST in each data set.
Genetic distinctiveness of Valencian populations has
also been noted in another seed-free land plant, the
moss Pleurochaete squarrosa (Grundmann et al. 2007).
Given the co-occurrence of A. fontanum subsp. fontanum
and A. petrarchae subsp. bivalens in Valencia, and the
recorded presence of their diploid hybrid A. x protoma-
joricum (Pangua et al. 1992; Perez Carro & Fernandez
Areces 1992), it is theoretically possible that back-
hybridisation and introgression could contribute a novel
set of alleles into one or other taxon. However, we con-
sider this scenario highly unlikely because the diploid
hybrid A. x protomajoricum shows very low fertility
(Pangua et al. 1992; Perez Carro & Fernandez Areces
1992). Side-by-side analysis of allozymes in both diploid
taxa and hybrid individuals also showed that very few
alleles are shared between A. fontanum subsp. fontanum
and A. petrarchae subsp. bivalens (Hunt 2004).
The genetic separation of Valencian populations is
likely to result from past or ongoing restricted gene
flow, and ⁄ or past allopatric fragmentation. Processes of
gene flow in ferns have been the subject of some debate.
van Zanten (1978) predicted that long-distance, wind-
mediated dispersal of spores would result in panmixia
and low genetic differentiation. The work of Soltis &
Soltis (1989) appeared to support this hypothesis, find-
ing low interpopulation differentiation in a range of
North American fern species, regardless of breeding
system. However, their FST estimates were derived from
a small number (£8) of populations for each species.
These results are consistent with our finding that,

4950 H. V. HUN T ET AL.
although A. fontanum subsp. fontanum and A. petrarchae
subsp. bivalens showed high overall population differen-
tiation, FST within each geographic or genetically homo-
geneous cluster of populations is low. However, the
small residual FST within regions is significantly differ-
ent from zero, and the spatial autocorrelation analysis
for A. fontanum subsp. fontanum indicates that an isola-
tion-by-distance model with restricted gene flow
between populations operates over distances up to
50 km. This is consistent with the expectation that exten-
sive gene flow via spore dispersal will be limited in
obligate outbreeding fern taxa with small, patchily-
distributed populations. Over middle- and long-distance
ranges, dispersal events are random and probably rare.
It was not possible to test for isolation by distance in
A. petrarchae subsp. bivalens, because of the small num-
ber of sampled populations (reflecting the species’ rar-
ity) and the discontinuous range. However, F-statistic
estimates for partitioning of genetic diversity suggest
that comparable patterns of dispersal will operate as in
A. fontanum subsp. fontanum. The low diversity, moder-
ately high FIS and non-significant FST among Majorcan
populations, together with the observations that the Ma-
jorcan haplotype and allozyme diversity are a subset of
that found in Valencia, suggest a founder effect follow-
ing dispersal from the mainland. However, the reduced
diversity estimates may result at least in part from the
small population sizes, and the high FIS estimates
depend on variation at a small number of loci, and are
not significantly different from zero. Additionally, the
Majorcan populations are differentiated from those in
Valencia by the high frequency of alleles (at two loci,
AAT and PGM) that are extremely rare in Valencia.
This differentiation could suggest an ancient dispersal
from the mainland, allowing the evolution of new
alleles in situ followed by dispersal back to Valencia, or
that colonization of Majorca also involved gene flow
from other now-extinct mainland populations (e.g. in
southern Spain), or that relict populations have sur-
vived on Majorca, perhaps representing remains of a
more extensive Mediterranean distribution during the
Pleistocene that was fragmented by rising sea levels.
Further DNA sequence analysis of these populations is
required to discriminate between these hypotheses.
In A. fontanum subsp. fontanum, there is little allele
and haplotype sharing between Valencia and the rest of
the range, suggesting that these regions are not linked
by a past dispersal event, and ancient range fragmenta-
tion is a more likely scenario. Pleistocene climate
change drove cycles of population expansion and con-
traction within Iberia ⁄ southwestern Europe in many
organisms, which may have responded to climate
change by migrating up and down the mountainous
topography of this region (Gomez & Lunt 2006). The
limestone mountains in Valencia and those to the north
in Teruel and surrounding provinces, where A. fonta-
num subsp. fontanum is relatively common, belong to
two distinct mountain systems, the Baetic ranges and
the Iberian system respectively. These are linked by a
relatively narrow limestone ‘corridor’, in which A. fonta-
num occurs sporadically (Herrero-Borgonon et al. 1997).
This corridor partially coincides with relatively low ele-
vations under 500m (Rivas-Martınez et al. 1999), sug-
gesting that the present-day climatic conditions may be
unfavourable for A. fontanum, which prefers higher and
thus cooler altitudes. In glacial periods, cooler condi-
tions might have supported more suitable habitats in
this limestone corridor; post-glacial warming, combined
with edaphic restrictions, could have effected allopatric
fragmentation between populations in the Baetic and
Iberian mountain systems.
Outside Valencia, a further genetic split between pop-
ulations to the southwest and those to the north east is
supported by both allozyme and cpDNA data. This is
less pronounced than the separation of both these clus-
ters from Valencia, with extensive sharing of alleles and
haplotypes across a wide geographic range from Ara-
gon to Switzerland. The two most common haplotypes
(4 and 1) show centres of distribution in two of the tree
refugia identified by Huntley & Birks (1983), southeast-
ern France and northeastern Spain respectively. The
dominant haplotype (1) in northeastern Spain occupies
the central position in the topology and hence may rep-
resent the ancestral haplotype. Under a K = 3 model in
the Structure analysis of allozyme data, populations
with a high assignation probability to genepool 1 (pink)
cluster in southeastern France, and those strongly
assigned to genepool 2 (blue) cluster in the Sierra de Al-
barracın in Aragon. The allozyme data show a sharp
divide in the Pyrenees between the westernmost group
of populations in Ariege (predominantly genepool 2)
and the eastern cluster in the Pyrenees-Orientales (pre-
dominantly genepool 1). This pattern is less evident in
the cpDNA, where haplotype 1 dominates all sampled
Pyrenean populations, with haplotype 4 showing a
minority presence in three of the five populations,
including two in the western Pyrenees. The small num-
bers of samples analysed for cpDNA make it difficult to
interpret whether this discrepancy between marker
types is significant. In contrast to flowering plants, the
haploid spore is the only significant unit of dispersal in
ferns, with male gametes being dispersed over at most
a few cm; hence, nuclear and chloroplast genetic pat-
terns would be expected to concur. However, we did
find haplotype 4 at 50% frequency in population 72 in
Catalunya, consistent with the allozyme genepool assig-
nations for this population showing admixture between
genepools 1 and 2.
� 2009 Blackwell Publishing Ltd

WE STERN MEDITERRANEAN ROCK FERNS 4 95 1
The geographic division between genepools 1 and 2
may be explained either by a scenario of expansions from
relict populations in southeastern France and Aragon
respectively, meeting at a suture zone that runs through
the Pyrenees and extends down the Spanish eastern sea-
board, or by a scenario of long-term survival of diverse
Pyrenean populations, isolated from one another by the
extreme topology, which then expanded to the southeast
and north west respectively. ‘Refugia within refugia’ in
the Pyrenees have been identified for a range of other
plant and animal species (Gomez & Lunt 2006). The Pyre-
nees also show a high level of endemicity (Garcıa-Barros
et al. 2002), suggesting long-term in situ survival of
organisms, either in exposed nunatak zones or in perigla-
cial regions around the ice sheets (Segarra-Moragues
et al. 2007). However, none of the A. fontanum subsp. fon-
tanum populations in Aragon, Catalunya, the Pyrenees or
the Alpes-Maritimes show characteristics of recently-
established populations. The Pyrenees have the greatest
allelic-richness, largely due to the presence of a number
of rare alleles, but the two populations from Mont Caro
in Catalunya (71 and 72) have the highest expected het-
erozygosity and effective allele number. High genetic
diversity may indicate long-term population survival
(Hewitt 1996), or represent suture zones between
recently-established populations sourced from multiple
refugia: Petit et al. (2003) found the highest intrapopula-
tion cpDNA haplotype diversity for 22 European tree
and shrub species to the north of the Alps, in regions col-
onized postglacially. In Fagus sylvatica, high isozyme alle-
lic richness corresponded with glacial refugia identified
from the pollen record, but highest expected heterozy-
gosity occurred in areas remote from these refugia
(Comps et al. 2001). Refugia may also be identified by
private alleles (Gomez & Lunt 2006). We observed the
greatest number of private alleles in A. fontanum subsp.
fontanum in the Pyrenees, both as a region and in individ-
ual populations. Aragonese and French populations also
exhibited some private alleles at notable frequencies. In
summary, the high diversity and presence of rare alleles
across a wide zone from Aragon to southeastern France
suggests that, although it is not possible to determine the
underlying process separating genepools 1 and 2, this is
likely to represent an ancient phylogeographic pattern.
Further analysis of DNA sequence markers is needed to
further explore the evolutionary relationship between the
two genepools.
The phylogeographic link we have found between the
eastern Pyrenees and southeastern France echoes bioge-
ographic connections between the Pyrenees and the
southwestern Alps that have been suggested by phylog-
eographic data for the plants Anthyllis montana and Prit-
zelago alpina and the butterflies Erebia cassioides and
Erebia epiphron (Kropf et al. 2002, 2003; Martin et al.
� 2009 Blackwell Publishing Ltd
2002; Schmitt et al. 2006). A disjunction exists in the
present-day distribution of A. fontanum subsp. fontanum
in France, separating the Pyrenean and Alpes-Maritimes
population clusters. This probably reflects the lack of
suitable habitat in the low-lying area around the Canal
du Midi and the Rhone delta. Population migration via
both coastal and inland routes would have been possi-
ble if populations belonging to genepool 1 formed part
of a continuous distribution during periods of lower sea
level during the Quaternary, extending across what is
now the Golfe de Lion. The patchy modern-day distri-
bution of A. fontanum subsp. fontanum in southwestern
Europe may reflect the closure of some of those routes
by rising sea levels, and ⁄ or by landscape changes.
The ranges of A. fontanum subsp. fontanum and A.
petrarchae subsp. bivalens mean that standard models of
south European ‘glacial refugia’ with postglacial recolo-
nisation of more northerly regions are not particularly
applicable to these taxa. However, the Swiss popula-
tions exhibit a subset of the alleles and chlorotypes
found elsewhere in the range, suggesting a more recent
population expansion into this region. The presence of
two Swiss populations (51 and 84) with >50% allocation
to genepool 2 indicates that this recolonisation may have
involved dispersal from populations several hundred
km to the southwest.
Acknowledgements
HVH is grateful for support from a Natural Environment
Research Council PhD studentship, St John’s College, Cam-
bridge, and the Department of Genetics, University of
Cambridge, and for advice from the late Professor Michael
Majerus. Thanks to Michael Grundmann and Cecılia Duraes in
the lab, Cameron Petrie and Mim Bower for assistance with
graphics, and many colleagues who collected samples.
References
Bennert HW, Rasbach H, Rasbach K (1990) Asplenium petrarchae
(Guerin) DC. subsp. bivalens und Asplenium x helii
nothosubsp. calobrense - Neufunde auf der Insel Mallorca.
Farnblatter, 21, 15–26.
Casgrain P, Legendre P (2001) The R-Package for Multivariant
and Spatial Analysis. Version 4.00 (d6). Departement de
sciences biologiques, Universite de Montreal, Montreal.
Available at http:fas.umontreal.ca ⁄ BIOL ⁄ legendre ⁄ .Cole CT (2003) Genetic variation in rare and common plants.
Annual Review of Ecology and Systematics, 34, 213–237.
Comps B, Gomory D, Letouzey J, Thiebaut B, Petit RJ (2001)
Diverging trends between heterozygosity and allelic richness
during postglacial colonization in the European beech.
Genetics, 157, 389–397.
Ellstrand NC, Elam DR (1993) Population genetic consequences
of small population size: Implications for plant conservation.
Annual Review of Ecology and Systematics, 24, 217–242.

4952 H. V. HUN T ET AL.
Evanno G, Regnaut S, Goudet J (2005) Detecting the number of
clusters of individuals using the software STRUCTURE: a
simulation study. Molecular Ecology, 14, 2611–2620.
Excoffier L, Laval G, Schneider S (2005) Arlequin ver. 3.0: An
integrated software package for population genetics data
analysis. Evolutionary Bioinformatics Online, 1, 47–50.
Falush D, Stephens M, Pritchard JK (2003) Inference of
population structure using multilocus genotype data: linked
loci and correlated allele frequencies. Genetics, 164, 1567–1587.
Ferrer-Castan D, Vetaas OR (2005) Pteridophyte richness,
climate and topography in the Iberian Peninsula: comparing
spatial and nonspatial models of richness patterns. Global
Ecology and Biogeography, 14, 155–165.
Garcıa-Barros E, Gurrea P, Lucianez MJ et al. (2002) Parsimony
analysis of endemicity and its application to animal and
plant geographical distributions in the Ibero-Balearic region
(western Mediterranean). Journal of Biogeography, 29, 109–124.
Gitzendanner MA, Soltis PS (2000) Patterns of genetic variation
in rare and widespread plant congeners. American Journal of
Botany, 87, 783–792.
Gomez A, Lunt DH (2006) Refugia within refugia: patterns of
phylogeographic concordance within the Iberian Peninsula.
In:Phylogeography in Southern European Refugia: Evolutionary
Perspectives on the Origins and Conservation of Biodiversity (eds
Weiss S, Ferrand N). pp. 155–188, Kluwer Academic
Publishers, Dordrecht.
Grundmann M, Ansell SW, Russell SJ, Koch MA, Vogel JC
(2007) Genetic structure of the widespread and common
Mediterranean bryophyte Pleurochaete squarrosa (Brid.) Lindb.
(Pottiaceae) – evidence from nuclear and plastidic DNA
sequence variation and allozymes. Molecular Ecology, 16, 709–
722.
Hamrick JL, Godt MJW (1996) Effect of life-history traits on
genetic diversity in plant species. Philosophical Transactions of
the Royal Society of London: B series, 351, 1291–1298.
Herrero A, Pajaron S, Prada C (2001) Isozyme variation and
genetic relationships among taxa in the Asplenium obovatum
group (Aspleniaceae, Pteridophyta). American Journal of
Botany, 88, 2040–2050.
Herrero-Borgonon JJ, Martınez-Solis I, Estrelles E, Ibars AM
(1997) Avance al atlas pteridologico de la comunidad
Valenciana. Flora Montiberica, 7, 72–86.
Hewitt GM (1996) Some genetic consequences of ice ages, and
their role in divergence and speciation. Biological Journal of
the Linnean Society, 58, 247–276.
Hunt HV (2004) Evolution in the Asplenium majoricum Complex.
PhD thesis, University of Cambridge, Cambridge.
Huntley B, Birks HJB (1983) An Atlas of Past and Present Pollen
Maps for Europe: 0-13000 Years ago. Cambridge University
Press, Cambridge.
Huson DH, Richter DC, Rausch C et al. (2007) Dendroscope –
An interactive viewer for large phylogenetic trees. BMC
Bioinformatics, 8, 460.
Ibars AM, Herrero-Borgonon JJ, Estrelles E, Martınez I (1999)
Helechos de la Comunidad Valenciana. Conselleria de Medio
Ambiente, Valencia, Generalitat Valenciana.
Jalas J, Suominen J (1972) Atlas Florae Europeae. 1. Pteridophyta.
Helsinki University Press, Helsinki.
Kephart SR (1990) Starch gel electrophoresis of plant isozymes:
a comparative analysis of techniques. American Journal of
Botany, 77, 693–712.
Kropf M, Kadereit JW, Comes HP (2002) Late Quaternary
distributional stasis in the submediterranean mountain plant
Anthyllis montana L. (Fabaceae) inferred from ITS sequences
and amplified fragment length polymorphism markers.
Molecular Ecology, 11, 447–463.
Kropf M, Kadereit JW, Comes HP (2003) Differential cycles of
range contraction and expansion in European high mountain
plants during the Late Quaternary: insights from Pritzelago
alpina (L.) O. Kuntze (Brassicaceae). Molecular Ecology, 12,
931–949.
Lewis PO, Zaykin D (2001) Genetic Data Analysis: computer
program for the analysis of allelic data. Version 1.0 (d16c).
http://lewis.eeb.uconn.edu/lewishome/software.html.
Li JW, Haufler CH (1999) Genetic variation, breeding systems,
and patterns of diversification in Hawaiian Polypodium
(Polypodiaceae). Systematic Botany, 24, 339–355.
Lovis JD, Reichstein T (1969) Der Farnbastard Asplenium x
orellii hybr. nov. = Asplenium majoricum Litard. x A.
trichomanes L. subsp. quadrivalens D.E. Meyer und die
Abstammung von A. majoricum. Berichte der Schweizerischen
Botanischen Gesellschaft, 79, 335–345.
Martin J-F, Gilles A, Lotscher M, Descimon H (2002)
Phylogenetics and differentiation among the western taxa of
the Erebia tyndarus group (Lepidoptera: Nymphalidae).
Biological Journal of the Linnean Society, 75, 319–332.
Masuyama S, Watamo Y (1990) Trend for inbreeding in
polyploid pteridophytes. Plant Species Biology, 5, 13–17.
Meyer DE (1964) Uber neue und seltene Asplenien Europas. 3
Mitteilung. Berichte der Deutschen Botanischen Gesellschaft, 77,
3–13.
Moreno Saiz JC, Lobo J (2008) Iberian–Balearic fern regions
and their explanatory variables. Plant Ecology, 198, 149–167.
Murakami N, Nishiyama T, Satoh H, Suzuki T (1997) Marked
spatial genetic structure in three populations of a weedy
fern, Pteris multifida Poir., and reestimation of its selfing rate.
Plant Species Biology, 12, 97–106.
Nei M (1972) Genetic distance between populations. American
Naturalist, 106, 283–292.
Nei M (1978) Estimation of average heterozygosity and genetic
distance from a small number of individuals. Genetics, 89,
583–590.
Ota T (1993) DISPAN: a computer program for the genetic
distance and phylogenetic analysis. http://
www.bio.psu.edu/people/faculty/nei/lab/software.htm.
Pangua E, Prada C, Pajaron S, Salvo E (1992) A new Asplenium
hybrid from Valencia (Spain) related to A. majoricum Litard.
Botanical Journal of the Linnean Society, 108, 1–13.
Perez Carro FJ, Fernandez Areces MP (1992) Asplenium x
protomajoricum hybr. nov. (A. fontanum x A. petrarchae subsp.
bivalens) y precisiones corologicas sobre A. majoricum en el
Levante espanol. Anales Jardın Botanico de Madrid, 49, 187–194.
Petit RJ, Aguinagalde I, de Beaulieu J-L et al. (2003) Glacial
refugia: hotspots but not melting pots of genetic diversity.
Science, 300, 1563–1565.
Prelli R, Boudrie M (2002) Les Fougeres et Plantes Allies de France
et D’Europe Occidentale. Editions Lechevalier, Paris.
Pritchard JK, Stephens M, Donelly P (2000) Inference of
population structure using multilocus genotype data.
Genetics, 155, 945–959.
Pryor KV, Young JE, Rumsey FJ et al. (2001) Diversity, genetic
structure and evidence of outcrossing in British populations
� 2009 Blackwell Publishing Ltd

WE STERN MEDITERRANEAN ROCK FERNS 4 95 3
of the rock fern Adiantum capillus-veneris using
microsatellites. Molecular Ecology, 10, 1881–1894.
Quintanilla L, Pajaron S, Pangua E, Amigo J (2007) Allozyme
variation in the sympatric ferns Culcita macrocarpa and
Woodwardia radicans at the northern extreme of their ranges.
Plant Systematics and Evolution, 263, 135–144.
Rabinowitz D (1981) Seven forms of rarity. In:The Biological
Aspects of Rare Plant Conservation (ed Synge H). pp. 205–218,
Wiley, Chichester.
Ranker TA, Floyd SK, Trapp PG (1994) Multiple colonisations
of Asplenium adiantum-nigrum onto the Hawaiian
archipelago. Evolution, 48, 1364–1370.
Reichstein T, Schneller J (1982) Asplenium pseudofontanum
Kossinsky (Aspleniaceae, Pteridophyta). Studies in Asplenium
for ‘Flora Iranica’. 3. Candollea 37, 117–128.
Rivas-Martınez S, Loidi Arregui J, Costa Talens M, Dıaz
Gonzalez TE, Penas Merino A (1999) Iter Ibericum A.D.
MIM. Itinera Geobotanica, 13, 5–347.
Schmitt T, Hewitt GM, Muller P (2006) Disjunct distributions
during glacial and interglacial periods in mountain
butterflies: Erebia epiphron as an example. Journal of
Evolutionary Biology, 19, 108–113.
Schneider H, Russell SJ, Cox CJ et al. (2004) Chloroplast
phylogeny of Asplenioid ferns based on rbcL and trnL-F
spacer sequences (Polypodiidae, Aspleniaceae) and its
implications for biogeography. Systematic Botany, 29, 260–274.
Schneider H, Ranker TA, Russell SJ et al. (2005) Origin of the
endemic fern genus Diellia coincides with the renewal of
Hawaiian terrestrial life in the Miocene. Proceedings of the
Royal Society B, 272, 455–460.
Schneller JJ, Holderegger R (1996) Genetic variation in small,
isolated fern populations. Journal of Vegetation Science, 7, 113–
120.
Schneller J, Liebst B (2007) Patterns of variation of a common
fern (Athyrium filix-femina; Woodsiaceae): population
structure along and between altitudinal gradients. American
Journal of Botany, 94, 965–971.
Segarra-Moragues JG, Palop-Esteban M, Gonzalez-Candelas F,
Catalan P (2007) Nunatak survival vs. tabula rasa in the
Central Pyrenees: a study on the endemic plant species
Bordera pyrenaica (Dioscoreaceae). Journal of Biogeography, 34,
1893–1906.
Shepherd LD, Perrie LR, Brownsey PJ (2007) Fire and ice:
volcanic and glacial impacts on the phylogeography of the
New Zealand forest fern Asplenium hookerianum. Molecular
Ecology, 16, 4536–4549.
Smith AR, Pryer KM, Schuettpelz E, Korall P, Schneider H,
Wulf PG (2006) A classification for extant ferns. Taxon, 55,
705–731.
Soltis DE, Soltis PS (1989) Polyploidy, breeding systems, and
genetic differentiation in homosporous pteridophytes.
In:Isozymes in Plant Biology (eds Soltis DE, Soltis PS). pp.
241–258, Dioscorides Press, Portland, Oregon.
Soltis PS, Soltis DE (1990) Genetic variation within and among
populations of ferns. American Fern Journal, 80, 161–172.
Soltis DE, Haufler CH, Darrow DC, Gastony GJ (1983) Starch
gel electrophoresis of ferns: a compilation of grinding
buffers, gel and electrode buffers, and staining schedules.
American Fern Journal, 73, 9–27.
Suter M, Schneller JJ, Vogel JC (2000) Investigations into the
genetic variation, population structure, and breeding systems
� 2009 Blackwell Publishing Ltd
of the fern Asplenium trichomanes subsp. quadrivalens.
International Journal of Plant Sciences, 161, 233–244.
Taberlet P, Gielly L, Pautou G, Bouvet J (1991) Universal
primers for amplification of three non-coding regions of
chloroplast DNA. Plant Molecular Biology, 17, 1105–1109.
Taberlet P, Fumagalli L, Wust-Saucy A-G, Cosson J-F (1998)
Comparative phylogeny and postglacial colonization routes
in Europe. Molecular Ecology, 7, 453–464.
Trewick SA, Morgan-Richards M, Russell SJ et al. (2002)
Polyploidy, phylogeography and Pleistocene refugia of the
rockfern Asplenium ceterach: evidence from chloroplast DNA.
Molecular Ecology, 11, 2003–2012.
Tutin TG, Heywood VH, Burges NA, Valentine DH, Moore
DM (1993) Flora Europaea. Volume 1, Psilotaceae to Platanaceae.
2nd edn. Cambridge University Press, Cambridge.
Vogel JC, Rumsey FJ, Schneller JJ, Barrett JA, Gibby M (1999)
Where are the glacial refugia in Europe? Evidence from
pteridophytes. Biological Journal of the Linnean Society, 66, 23–37.
Weir BS, Cockerham CC (1984) Estimating F-statistics for the
analysis of population structure. Evolution, 38, 1358–1370.
Wendel JF, Weeden NF (1989) Visualization and interpretation
of plant isozymes. In:Isozymes in Plant Biology (eds Soltis DE,
Soltis PS). pp. 5–45, Dioscorides Press, Portland, Oregon.
Werth CR, Guttman SI, Eshbaugh WI (1985) Electrophoretic
evidence of reticulate evolution in the Appalachian
Asplenium complex. Systematic Botany, 10, 184–192.
Wright S (1978) Evolution and Genetics of Populations, Volume 4.
Variability Within and Among Natural Populations. University
of Chicago Press, Chicago.
Yeh FC, Yang R, Boyle T (1999) POPGENE. Microsoft
Windowbased Freeware for Population Genetic Analysis. Version
1.32. Centre for International Forestry Research, University
of Alberta. Available at http://www.ualberta.ca/~fyeh/.
van Zanten BO (1978) Experimental studies of trans-oceanic long-
range dispersal of moss spores in the Southern Hemisphere.
Journal of the Hatton Biological Laboratory, 44, 455–482.
SWA, SJR, HS and JCV are researchers in the Botany Depart-
ment at the Natural History Museum, studying the evolution
of genetic diversity of ferns and other land plants in the
spatial-temporal context of Europe in the last 5 Ma. HVH was
a PhD student in this group with interests in spatial patterns
of plant genetic diversity, phylogeography, and polyploid spe-
ciation. She is now working on these topics on domesticated
cereals at the McDonald Institute for Archaeological Research,
University of Cambridge.
Supporting information
Additional supporting information may be found in the online
version of this article.
Table S1 Locality information for populations of A. fontanum
subsp. fontanum and A. petrarchae subsp. bivalens sampled for
this study. NR = information not recorded
Table S2 Chloroplast rps4 – trnS IGS haplotype data for A. fon-
tanum subsp. fontanum. Gene diversity statistics for each region
are shown

4954 H. V. HUN T ET AL.
Table S3 Chloroplast trnL-F IGS haplotype data for A. petrar-
chae subsp. bivalens
Table S4 Definition of rps4 – trnS IGS haplotypes in A. fontanum
subsp. fontanum and associated GenBank accession numbers
Table S5 Definition of trnL-F haplotypes in A. petrarchae subsp.
bivalens and associated GenBank accession numbers
Table S6 Allozyme alleles observed in A. fontanum subsp. fon-
tanum and A. petrarchae subsp. bivalens. Enzyme abbreviations
follow Wendel & Weeden (1989)
Table S7 Allozyme diversity statistics and Structure genepool
assignation proportions under K = 3 model for populations of
A. fontanum subsp. fontanum. Abbreviations: n, number of indi-
viduals; P, proportion of polymorphic loci; A, number of alleles
per locus; Ap, number of polymorphic alleles per locus; Ae,
effective number of alleles per locus; HE, expected heterozygos-
ity; HO, observed heterozygosity; f, inbreeding coefficient. 95%
criterion used for determining polymorphic loci. All values
correct to 3 d.p.
Table S8 Allozyme diversity statistics and Structure genepool
assignation proportions under K = 3 model for populations of
A. petrarchae subsp. bivalens. Assignations to clusters 2 and 3
were summed to give the yellow cluster proportion shown in
Fig. 2B. Abbreviations: n, number of individuals; P, proportion
of polymorphic loci; A, number of alleles per locus; Ap, num-
ber of polymorphic alleles per locus; Ae, effective number of
alleles per locus; HE, expected heterozygosity; HO, observed
heterozygosity; f, inbreeding coefficient. 95% criterion used for
determining polymorphic loci. All values correct to 3 d.p.
Table S9 Comparison of genetic diversity measures in A. fonta-
num subsp. fontanum and A. petrarchae subsp. bivalens with
those of other diploid European Asplenium taxa. n ⁄ a = data not
available. Unpublished data for A. ceterach subsp. bivalens, A.
trichomanes subsp. inexpectans, A. viride and A. hemionitis from
JC Vogel and C Duraes. Species information: A. hemionitis is a
Macaronesian ⁄ SW European Atlantic fringe taxon of putative
Tertiary origin. A. ceterach subsp. bivalens has a scattered east-
ern Mediterranean ⁄ Balkan distribution. Asplenium trichomanes
subsp. inexpectans has a main range in south central Europe,
with scattered southern Mediterranean populations. Asplenium
viride is a widespread Alpine taxon also found in North Amer-
ica and Asia. Diversity measures are based on a very similar
set of allozyme loci in all taxa
Please note: Wiley-Blackwell are not responsible for the content
or functionality of any supporting information supplied by the
authors. Any queries (other than missing material) should be
directed to the corresponding author for the article.
� 2009 Blackwell Publishing Ltd


![Ex situ protection of endangered Asplenium ferns species using in vitro culture [in Polish with English summary]](https://img.pdfslide.net/doc/110x75/634d4a477c06afa1b60d06cc/ex-situ-protection-of-endangered-asplenium-ferns-species-using-in-vitro-culture.jpg)