Embed Size (px)
Citation preview
African Journal of Biotechnology Vol. 11(99), pp. 16468-16477, 11 December, 2012 Available online at http://www.academicjournals.org/AJB DOI: 10.5897/AJB12.2367 ISSN 1684–5315 ©2012 Academic Journals
Full Length Research Paper
Genetic diversity of maize genotypes on the basis of morpho-physiological and simple sequence repeat
(SSR) markers
Ashish Kumar, Arunita Rakshit, Naresh. K. Mangilipelli, Y. Varalaxmi, T. Vijayalakshmi, Jainender, M. Vanaja, S. K. Yadav, B. Venkateswarlu and M. Maheswari*
Division of Crop Sciences, Central Research Institute for Dryland Agriculture, Santoshnagar,
Hyderabad-500 059, Andhra Pradesh, India.
Accepted 27 October, 2012
In this investigation, an attempt was made to assess the genetic diversity among 91 maize (Zea mays L.) genotypes using morpho-physiological and molecular markers. Variability was observed for six morpho-physiological traits namely, SPAD chlorophyll meter reading, canopy temperature, plant height, yield per plant, fodder yield and plant biomass as well as with simple sequence repeat (SSR) markers. All the amplification products with 40 SSRs were in the range of 58 to 410 bp. A total of 124 alleles were generated and the number of alleles scored for 40 SSR loci ranged from 2 to 5 with a mean of 3.1 alleles per locus. Polymorphism information content ranged from 0.054 to 0.82 with a mean of 0.55 suggesting that all the selected genotypes possessed high level of polymorphism. The study indicates that five genotypes, RJR-247, RJR-159, NSJ-179, RJR-55 and Z101-15 were most diverse, so it is suggested that they may be used as genetic resources for maize improvement programme in future quantitative trait loci (QTL) mapping for different agronomic traits and for developing new varieties with adaptation to a broad range of environments. Key words: Maize, SSR markers, genetic diversity, dendrogram.
INTRODUCTION Maize (Zea mays L.) is an important cereal and fodder crop which occupy a pivotal role in the world economy (White and Johnson, 2003). Diversity among maize germplasm is important for identifying parental lines for successful breeding programme, and hybrid development
*Corresponding author. E-mail: [email protected] or [email protected]. Tel: +91-40- 24 530 161, 24 530 163 (Ext. 209). Fax: +91-40-24 531 802.
Abbreviations: SSR, Simple sequence repeat; PIC, polymorphism information content; CTAB, cetyl tri-methyl ammonium bromide; UPGMA, unweighted pair-group method with arithmetic mean.
(Kostova et al., 2006; Losa et al., 2011). Since there is a rapid increase in climate change, so there is need to develop high yielding genotypes which can tolerate various environmental stress conditions, like drought, increased salinity in soil, cold and heat stresses. On these backgrounds plant breeders need to look deeply for sources of genotypes, which can be effectively used as parents to develop new variety with high yield and good agronomic traits with adaptation to a broad range of environments.
Several studies have been carried out on genetic diversity study in maize. Morpho-physiological markers were used to study genetic diversity in different maize landraces (Beyene et al., 2005; Comertpay et al., 2012). Among the different kind of molecular markers, simple sequence repeats (SSRs) are one of the most promising
molecular marker for genotypic studies due to their high levels of polymorphism (Senior et al., 1998), co-dominant inheritance, high polymorphism information content, high reproducibility, locus specificity, extensive genome coverage and high allelic diversity (Powell et al., 1996; Mohan et al., 1997). SSR markers have become quite useful in various aspects of molecular genetic studies in the past decade including assessment of genetic diversity in maize (Nguyen et al., 2012; Babu et al., 2012), marker assisted selection and genetic studies such as construction of linkage maps and QTL mapping (Prasanna et al., 2009a) or evolution studies (Xia et al., 2004; Prasanna et al., 2009b, 2010).
In the present study an effort was made to identify diverse genotypes for genetic enhancement of drought tolerance. Both morpho-physiological and genotypic variations among 91 maize genotypes were carried out using six phenotypic traits and SSR markers related to drought tolerance. Hence, the diverse genotypes selected based on its study could be used for the identification of QTLs for drought tolerance. MATERIALS AND METHODS
Plant materials and their field evaluation
Ninety-one maize genotypes received from three different sources viz., Directorate of Maize Research, New Delhi, India, regional station of National Bureau of Plant Genetic Resources, Hyderabad, and regional centre of CIMMYT, Hyderabad were used in the present study (Table.1). Seeds were sown in augmented block design with a row to row spacing of 60 cm and plant to plant spacing of 25 cm. Experiment was carried out at Central Research Institute for Dryland Agriculture, Hyderabad, during rainy season of 2011. The recommended fertilizer dose and cultural practices along
with plant protection measures were taken to raise the crop.
Morpho-physiological study Data was recorded from three plants of each genotype on the basis of six traits namely, SPAD chlorophyll meter reading, canopy temperature (°C), plant height (cm), yield per plant (g), fodder yield (g) and plant biomass (g). Light absorbance at specific wavelengths helps to estimate the amount of chlorophyll in leaf. There were three replications for each measurement. Leaf chlorophyll estimation and canopy temperature was carried out in three leaf stage using SPAD-502, Minolta, Tokyo, Japan and by IR-Thermometer, Fluke/568 respectively. Plant height was measured from the soil surface to the tip of the central axis. Yield, fodder yield and after drying plant biomass per plants were recorded. Pair wise similarities were calculated using Euclidean distances from the
mean values. These values were used to construct sequential agglomerative hierarchical nested (SAHN) clustering.
Genotyping
Young leaves were collected from three to four weeks old plants of each line and genomic DNA was extracted following CTAB protocol (Doyle and Doyle, 1990) with minor modification. Previously
reported 48 total SSR markers related to different agronomic traits (under drought, yield controlling traits) were selected based on repeat units and bin location to provide uniform coverage of entire
Kumar et al. 16469 maize genome. Details of SSR primers of 10 maize chromosomes were extracted using website www.maizegdb.org/. PCR amplification was carried out with 25 μl reaction mixture containing 50 ng template DNA, 2.5 μl of 10 X reaction buffer (10 mM Tris HCl, pH 8.3 and 50 mM KCl), 2.5 mM MgCl2, 0.5 U Taq DNA polymerase, 200 μM dNTPs and 0.4 μM primer. Amplification was performed in Applied Biosystem Thermal Cycler programmed as one cycle of initial denaturation at 94°C for 5 min, 40 cycles each of denaturation at 94°C for 30 s, annealing step was performed for 1 min, 30 s at an optimum temperature for each primer, about 0.8°C to 1.2°C above its Tm, and primer extension was done at 72°C for 1 min, 30 s and final elongation at 72°C for 10 min. Each SSR marker was examined by carrying out 2 to 3 independent PCR reaction and
gel analysis to ensure that the amplification obtained with the primers is reproducible and consistent. Amplified PCR products were resolved through electrophoresis at 80 volts for 1 h and 30 min using 1 X, TAE buffer in 3.5% agarose (Agarose SFR
TM) gel
containing 5 μl (1 mg/ml) ethidium bromide, then photographed under ultraviolet light with VILBER LOURMAT gel documentation system.
The SSR gel images and marker data were processed using Biovision Software. The bands were sized then binary coded by 1
or 0 for their presence or absence respectively in the selected 91 genotypes for each SSR primer pairs and it was used for calculation of similarity matrix based on Jaccard coefficients (Jaccard, 1908). Cluster analysis was based on similarity matrices obtained with the unweighted pair-group method using the arithmetic mean (UPGMA) to generate the dendrogram. All the data analysis were carried out using the software package NTSYS-pc2.0 (Rohlf, 1998). The mean PIC values for each SSR were estimated by determining the frequency of alleles per locus using the following
formula:
PIC= 1- Σ xi2 ; where xi is the relative frequency of the i
th allele of
the SSR loci; markers were classified as informative when PIC was ≥ 0.5 (Sharma et al., 2009).
RESULTS AND DISCUSSION
Analysis of genotypes based on morpho-physiological traits
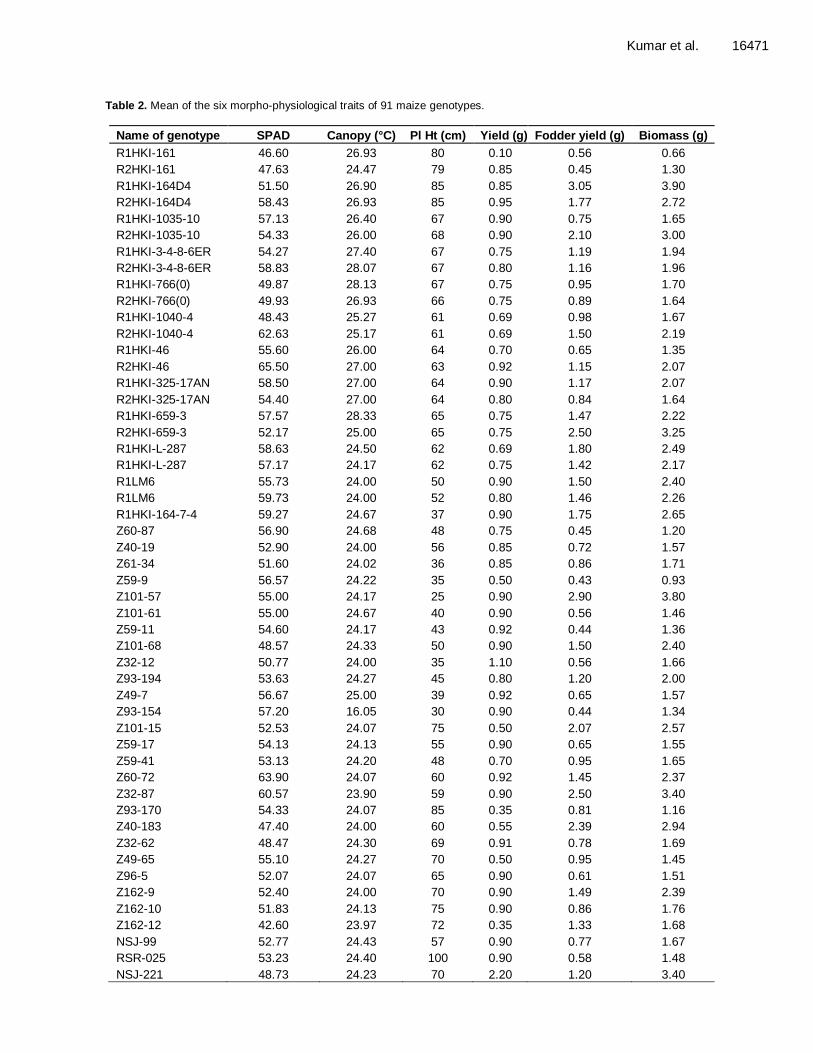
The performances of 91 maize genotypes were studied with respect to six morpho-physiological traits. SPAD chlorophyll meter reading was lowest (40.80) in genotype NSJ-179, while it was highest (65.50) in R2HKI-46. Lowest canopy temperature (16.05°C) was recorded in Z93-154 while the highest (28.33) was recorded in genotype R1HKI-659-3. Minimum (25 cm) plant height was recorded in genotype Z101-57 while maximum (273 cm) was in RJR-159. Yield per plant was recorded minimum (0.10 g) in genotype R1HKI-161 and the maximum (2.20 g) in NSJ-221. Fodder yield was minimum in genotype Z59-9 and maximum in R1HKI-164D4. Plant biomass was maximum (3.90 g) in genotype R1HKI-164D4 (Table 2).
Cluster analysis of genotypes based on morpho-physiological traits
The taxonomic distance matrix of six morpho-physiological traits for 91 maize genotypes was constructed. Euclidean distances varied widely (data
16470 Afr. J. Biotechnol.
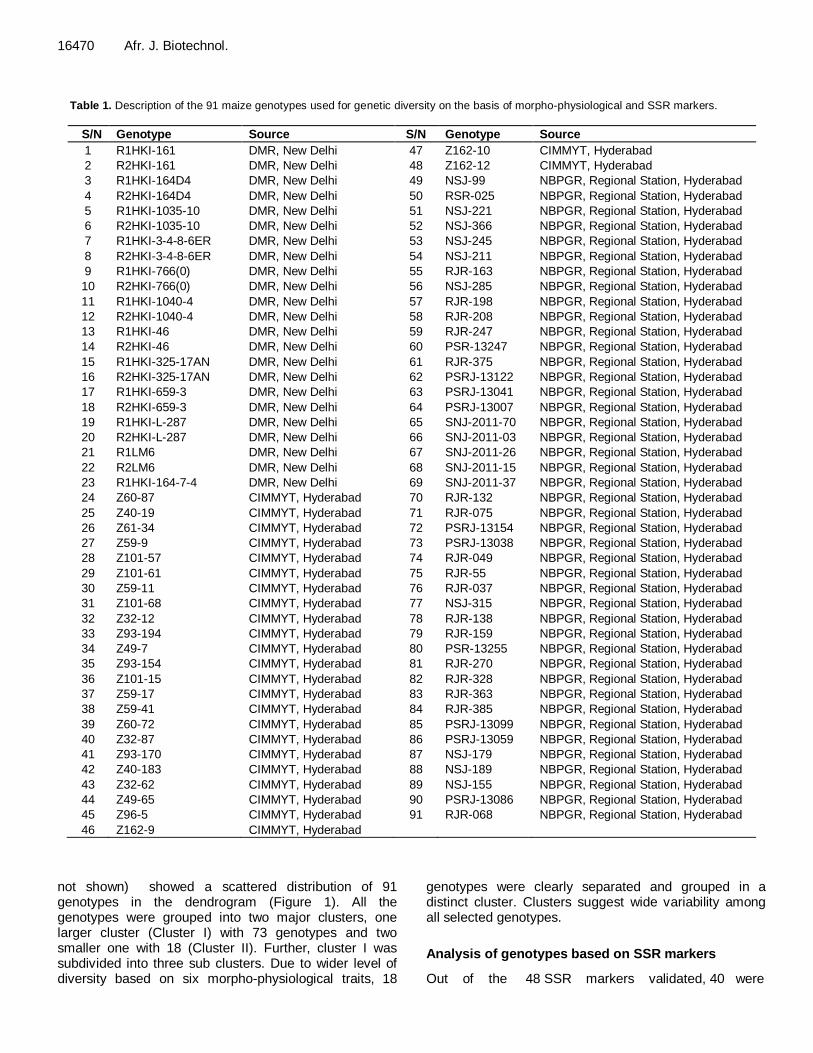
Table 1. Description of the 91 maize genotypes used for genetic diversity on the basis of morpho-physiological and SSR markers.
S/N Genotype Source S/N Genotype Source
1 R1HKI-161 DMR, New Delhi 47 Z162-10 CIMMYT, Hyderabad
2 R2HKI-161 DMR, New Delhi 48 Z162-12 CIMMYT, Hyderabad
3 R1HKI-164D4 DMR, New Delhi 49 NSJ-99 NBPGR, Regional Station, Hyderabad
4 R2HKI-164D4 DMR, New Delhi 50 RSR-025 NBPGR, Regional Station, Hyderabad
5 R1HKI-1035-10 DMR, New Delhi 51 NSJ-221 NBPGR, Regional Station, Hyderabad
6 R2HKI-1035-10 DMR, New Delhi 52 NSJ-366 NBPGR, Regional Station, Hyderabad
7 R1HKI-3-4-8-6ER DMR, New Delhi 53 NSJ-245 NBPGR, Regional Station, Hyderabad
8 R2HKI-3-4-8-6ER DMR, New Delhi 54 NSJ-211 NBPGR, Regional Station, Hyderabad
9 R1HKI-766(0) DMR, New Delhi 55 RJR-163 NBPGR, Regional Station, Hyderabad
10 R2HKI-766(0) DMR, New Delhi 56 NSJ-285 NBPGR, Regional Station, Hyderabad
11 R1HKI-1040-4 DMR, New Delhi 57 RJR-198 NBPGR, Regional Station, Hyderabad
12 R2HKI-1040-4 DMR, New Delhi 58 RJR-208 NBPGR, Regional Station, Hyderabad
13 R1HKI-46 DMR, New Delhi 59 RJR-247 NBPGR, Regional Station, Hyderabad
14 R2HKI-46 DMR, New Delhi 60 PSR-13247 NBPGR, Regional Station, Hyderabad
15 R1HKI-325-17AN DMR, New Delhi 61 RJR-375 NBPGR, Regional Station, Hyderabad
16 R2HKI-325-17AN DMR, New Delhi 62 PSRJ-13122 NBPGR, Regional Station, Hyderabad
17 R1HKI-659-3 DMR, New Delhi 63 PSRJ-13041 NBPGR, Regional Station, Hyderabad
18 R2HKI-659-3 DMR, New Delhi 64 PSRJ-13007 NBPGR, Regional Station, Hyderabad
19 R1HKI-L-287 DMR, New Delhi 65 SNJ-2011-70 NBPGR, Regional Station, Hyderabad
20 R2HKI-L-287 DMR, New Delhi 66 SNJ-2011-03 NBPGR, Regional Station, Hyderabad
21 R1LM6 DMR, New Delhi 67 SNJ-2011-26 NBPGR, Regional Station, Hyderabad
22 R2LM6 DMR, New Delhi 68 SNJ-2011-15 NBPGR, Regional Station, Hyderabad
23 R1HKI-164-7-4 DMR, New Delhi 69 SNJ-2011-37 NBPGR, Regional Station, Hyderabad
24 Z60-87 CIMMYT, Hyderabad 70 RJR-132 NBPGR, Regional Station, Hyderabad
25 Z40-19 CIMMYT, Hyderabad 71 RJR-075 NBPGR, Regional Station, Hyderabad
26 Z61-34 CIMMYT, Hyderabad 72 PSRJ-13154 NBPGR, Regional Station, Hyderabad
27 Z59-9 CIMMYT, Hyderabad 73 PSRJ-13038 NBPGR, Regional Station, Hyderabad
28 Z101-57 CIMMYT, Hyderabad 74 RJR-049 NBPGR, Regional Station, Hyderabad
29 Z101-61 CIMMYT, Hyderabad 75 RJR-55 NBPGR, Regional Station, Hyderabad
30 Z59-11 CIMMYT, Hyderabad 76 RJR-037 NBPGR, Regional Station, Hyderabad
31 Z101-68 CIMMYT, Hyderabad 77 NSJ-315 NBPGR, Regional Station, Hyderabad
32 Z32-12 CIMMYT, Hyderabad 78 RJR-138 NBPGR, Regional Station, Hyderabad
33 Z93-194 CIMMYT, Hyderabad 79 RJR-159 NBPGR, Regional Station, Hyderabad
34 Z49-7 CIMMYT, Hyderabad 80 PSR-13255 NBPGR, Regional Station, Hyderabad
35 Z93-154 CIMMYT, Hyderabad 81 RJR-270 NBPGR, Regional Station, Hyderabad
36 Z101-15 CIMMYT, Hyderabad 82 RJR-328 NBPGR, Regional Station, Hyderabad
37 Z59-17 CIMMYT, Hyderabad 83 RJR-363 NBPGR, Regional Station, Hyderabad
38 Z59-41 CIMMYT, Hyderabad 84 RJR-385 NBPGR, Regional Station, Hyderabad
39 Z60-72 CIMMYT, Hyderabad 85 PSRJ-13099 NBPGR, Regional Station, Hyderabad
40 Z32-87 CIMMYT, Hyderabad 86 PSRJ-13059 NBPGR, Regional Station, Hyderabad
41 Z93-170 CIMMYT, Hyderabad 87 NSJ-179 NBPGR, Regional Station, Hyderabad
42 Z40-183 CIMMYT, Hyderabad 88 NSJ-189 NBPGR, Regional Station, Hyderabad
43 Z32-62 CIMMYT, Hyderabad 89 NSJ-155 NBPGR, Regional Station, Hyderabad
44 Z49-65 CIMMYT, Hyderabad 90 PSRJ-13086 NBPGR, Regional Station, Hyderabad
45 Z96-5 CIMMYT, Hyderabad 91 RJR-068 NBPGR, Regional Station, Hyderabad
46 Z162-9 CIMMYT, Hyderabad
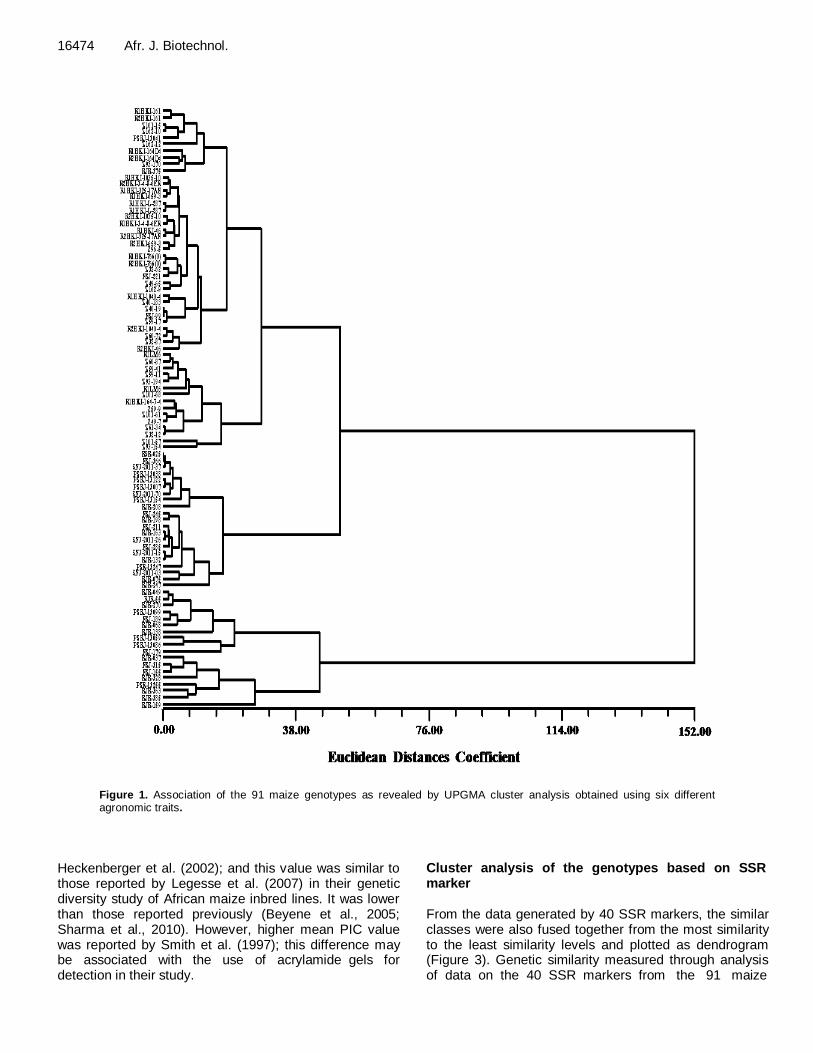
not shown) showed a scattered distribution of 91 genotypes in the dendrogram (Figure 1). All the genotypes were grouped into two major clusters, one larger cluster (Cluster I) with 73 genotypes and two smaller one with 18 (Cluster II). Further, cluster I was subdivided into three sub clusters. Due to wider level of diversity based on six morpho-physiological traits, 18
genotypes were clearly separated and grouped in a distinct cluster. Clusters suggest wide variability among all selected genotypes.
Analysis of genotypes based on SSR markers
Out of the 48 SSR markers validated, 40 were
Kumar et al. 16471
Table 2. Mean of the six morpho-physiological traits of 91 maize genotypes.
Name of genotype SPAD Canopy (°C) Pl Ht (cm) Yield (g) Fodder yield (g) Biomass (g)
R1HKI-161 46.60 26.93 80 0.10 0.56 0.66
R2HKI-161 47.63 24.47 79 0.85 0.45 1.30
R1HKI-164D4 51.50 26.90 85 0.85 3.05 3.90
R2HKI-164D4 58.43 26.93 85 0.95 1.77 2.72
R1HKI-1035-10 57.13 26.40 67 0.90 0.75 1.65
R2HKI-1035-10 54.33 26.00 68 0.90 2.10 3.00
R1HKI-3-4-8-6ER 54.27 27.40 67 0.75 1.19 1.94
R2HKI-3-4-8-6ER 58.83 28.07 67 0.80 1.16 1.96
R1HKI-766(0) 49.87 28.13 67 0.75 0.95 1.70
R2HKI-766(0) 49.93 26.93 66 0.75 0.89 1.64
R1HKI-1040-4 48.43 25.27 61 0.69 0.98 1.67
R2HKI-1040-4 62.63 25.17 61 0.69 1.50 2.19
R1HKI-46 55.60 26.00 64 0.70 0.65 1.35
R2HKI-46 65.50 27.00 63 0.92 1.15 2.07
R1HKI-325-17AN 58.50 27.00 64 0.90 1.17 2.07
R2HKI-325-17AN 54.40 27.00 64 0.80 0.84 1.64
R1HKI-659-3 57.57 28.33 65 0.75 1.47 2.22
R2HKI-659-3 52.17 25.00 65 0.75 2.50 3.25
R1HKI-L-287 58.63 24.50 62 0.69 1.80 2.49
R1HKI-L-287 57.17 24.17 62 0.75 1.42 2.17
R1LM6 55.73 24.00 50 0.90 1.50 2.40
R1LM6 59.73 24.00 52 0.80 1.46 2.26
R1HKI-164-7-4 59.27 24.67 37 0.90 1.75 2.65
Z60-87 56.90 24.68 48 0.75 0.45 1.20
Z40-19 52.90 24.00 56 0.85 0.72 1.57
Z61-34 51.60 24.02 36 0.85 0.86 1.71
Z59-9 56.57 24.22 35 0.50 0.43 0.93
Z101-57 55.00 24.17 25 0.90 2.90 3.80
Z101-61 55.00 24.67 40 0.90 0.56 1.46
Z59-11 54.60 24.17 43 0.92 0.44 1.36
Z101-68 48.57 24.33 50 0.90 1.50 2.40
Z32-12 50.77 24.00 35 1.10 0.56 1.66
Z93-194 53.63 24.27 45 0.80 1.20 2.00
Z49-7 56.67 25.00 39 0.92 0.65 1.57
Z93-154 57.20 16.05 30 0.90 0.44 1.34
Z101-15 52.53 24.07 75 0.50 2.07 2.57
Z59-17 54.13 24.13 55 0.90 0.65 1.55
Z59-41 53.13 24.20 48 0.70 0.95 1.65
Z60-72 63.90 24.07 60 0.92 1.45 2.37
Z32-87 60.57 23.90 59 0.90 2.50 3.40
Z93-170 54.33 24.07 85 0.35 0.81 1.16
Z40-183 47.40 24.00 60 0.55 2.39 2.94
Z32-62 48.47 24.30 69 0.91 0.78 1.69
Z49-65 55.10 24.27 70 0.50 0.95 1.45
Z96-5 52.07 24.07 65 0.90 0.61 1.51
Z162-9 52.40 24.00 70 0.90 1.49 2.39
Z162-10 51.83 24.13 75 0.90 0.86 1.76
Z162-12 42.60 23.97 72 0.35 1.33 1.68
NSJ-99 52.77 24.43 57 0.90 0.77 1.67
RSR-025 53.23 24.40 100 0.90 0.58 1.48
NSJ-221 48.73 24.23 70 2.20 1.20 3.40
16472 Afr. J. Biotechnol.
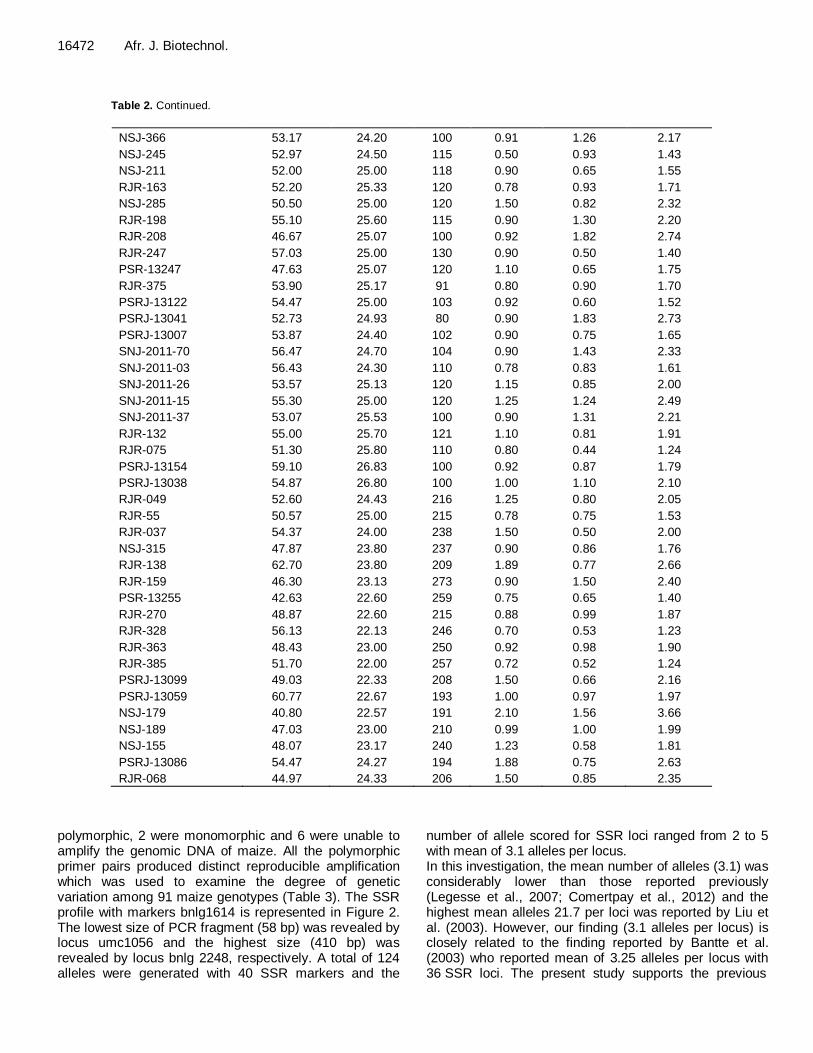
Table 2. Continued.
NSJ-366 53.17 24.20 100 0.91 1.26 2.17
NSJ-245 52.97 24.50 115 0.50 0.93 1.43
NSJ-211 52.00 25.00 118 0.90 0.65 1.55
RJR-163 52.20 25.33 120 0.78 0.93 1.71
NSJ-285 50.50 25.00 120 1.50 0.82 2.32
RJR-198 55.10 25.60 115 0.90 1.30 2.20
RJR-208 46.67 25.07 100 0.92 1.82 2.74
RJR-247 57.03 25.00 130 0.90 0.50 1.40
PSR-13247 47.63 25.07 120 1.10 0.65 1.75
RJR-375 53.90 25.17 91 0.80 0.90 1.70
PSRJ-13122 54.47 25.00 103 0.92 0.60 1.52
PSRJ-13041 52.73 24.93 80 0.90 1.83 2.73
PSRJ-13007 53.87 24.40 102 0.90 0.75 1.65
SNJ-2011-70 56.47 24.70 104 0.90 1.43 2.33
SNJ-2011-03 56.43 24.30 110 0.78 0.83 1.61
SNJ-2011-26 53.57 25.13 120 1.15 0.85 2.00
SNJ-2011-15 55.30 25.00 120 1.25 1.24 2.49
SNJ-2011-37 53.07 25.53 100 0.90 1.31 2.21
RJR-132 55.00 25.70 121 1.10 0.81 1.91
RJR-075 51.30 25.80 110 0.80 0.44 1.24
PSRJ-13154 59.10 26.83 100 0.92 0.87 1.79
PSRJ-13038 54.87 26.80 100 1.00 1.10 2.10
RJR-049 52.60 24.43 216 1.25 0.80 2.05
RJR-55 50.57 25.00 215 0.78 0.75 1.53
RJR-037 54.37 24.00 238 1.50 0.50 2.00
NSJ-315 47.87 23.80 237 0.90 0.86 1.76
RJR-138 62.70 23.80 209 1.89 0.77 2.66
RJR-159 46.30 23.13 273 0.90 1.50 2.40
PSR-13255 42.63 22.60 259 0.75 0.65 1.40
RJR-270 48.87 22.60 215 0.88 0.99 1.87
RJR-328 56.13 22.13 246 0.70 0.53 1.23
RJR-363 48.43 23.00 250 0.92 0.98 1.90
RJR-385 51.70 22.00 257 0.72 0.52 1.24
PSRJ-13099 49.03 22.33 208 1.50 0.66 2.16
PSRJ-13059 60.77 22.67 193 1.00 0.97 1.97
NSJ-179 40.80 22.57 191 2.10 1.56 3.66
NSJ-189 47.03 23.00 210 0.99 1.00 1.99
NSJ-155 48.07 23.17 240 1.23 0.58 1.81
PSRJ-13086 54.47 24.27 194 1.88 0.75 2.63
RJR-068 44.97 24.33 206 1.50 0.85 2.35
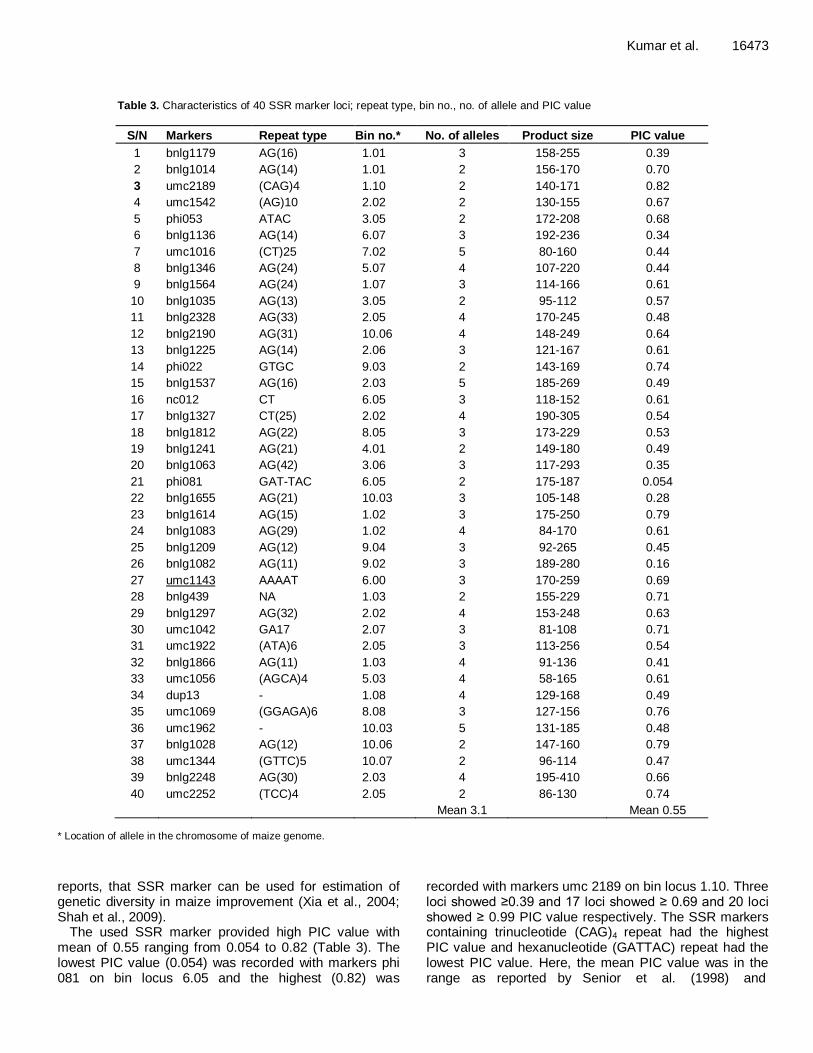
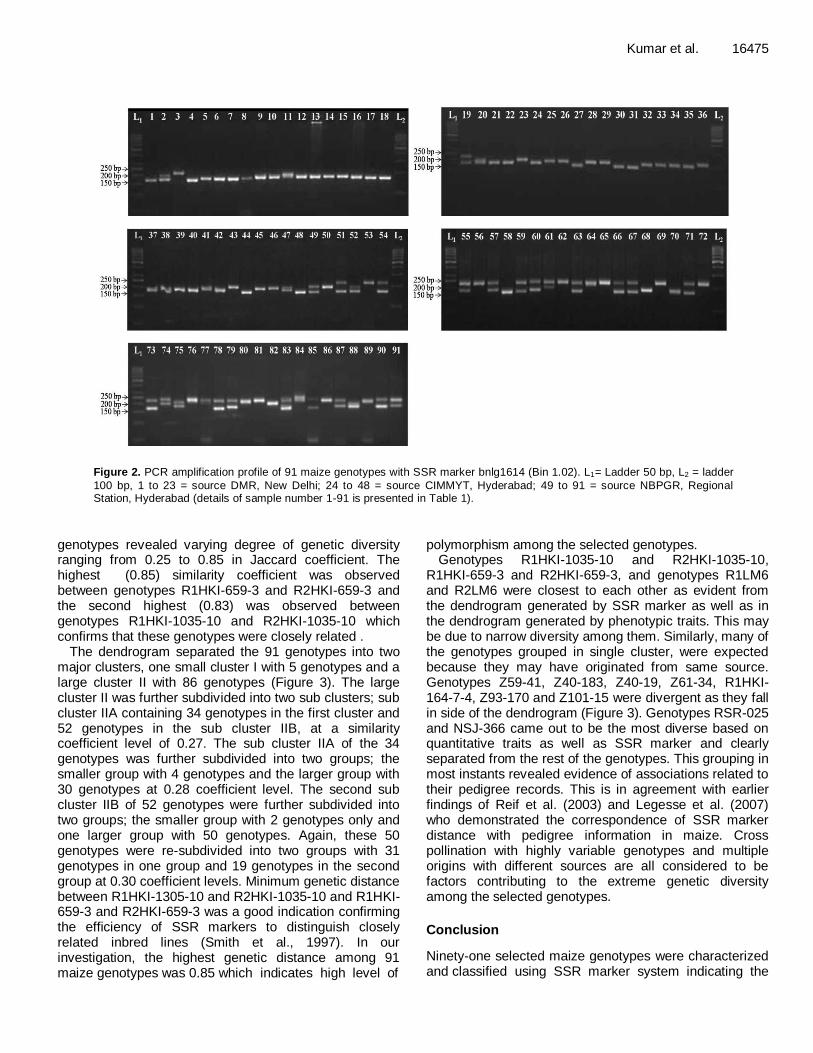
polymorphic, 2 were monomorphic and 6 were unable to amplify the genomic DNA of maize. All the polymorphic primer pairs produced distinct reproducible amplification which was used to examine the degree of genetic variation among 91 maize genotypes (Table 3). The SSR profile with markers bnlg1614 is represented in Figure 2. The lowest size of PCR fragment (58 bp) was revealed by locus umc1056 and the highest size (410 bp) was revealed by locus bnlg 2248, respectively. A total of 124 alleles were generated with 40 SSR markers and the
number of allele scored for SSR loci ranged from 2 to 5 with mean of 3.1 alleles per locus. In this investigation, the mean number of alleles (3.1) was considerably lower than those reported previously (Legesse et al., 2007; Comertpay et al., 2012) and the highest mean alleles 21.7 per loci was reported by Liu et al. (2003). However, our finding (3.1 alleles per locus) is closely related to the finding reported by Bantte et al. (2003) who reported mean of 3.25 alleles per locus with 36 SSR loci. The present study supports the previous
Kumar et al. 16473
Table 3. Characteristics of 40 SSR marker loci; repeat type, bin no., no. of allele and PIC value
S/N Markers Repeat type Bin no.* No. of alleles Product size PIC value
1 bnlg1179 AG(16) 1.01 3 158-255 0.39
2 bnlg1014 AG(14) 1.01 2 156-170 0.70
3 umc2189 (CAG)4 1.10 2 140-171 0.82
4 umc1542 (AG)10 2.02 2 130-155 0.67
5 phi053 ATAC 3.05 2 172-208 0.68
6 bnlg1136 AG(14) 6.07 3 192-236 0.34
7 umc1016 (CT)25 7.02 5 80-160 0.44
8 bnlg1346 AG(24) 5.07 4 107-220 0.44
9 bnlg1564 AG(24) 1.07 3 114-166 0.61
10 bnlg1035 AG(13) 3.05 2 95-112 0.57
11 bnlg2328 AG(33) 2.05 4 170-245 0.48
12 bnlg2190 AG(31) 10.06 4 148-249 0.64
13 bnlg1225 AG(14) 2.06 3 121-167 0.61
14 phi022 GTGC 9.03 2 143-169 0.74
15 bnlg1537 AG(16) 2.03 5 185-269 0.49
16 nc012 CT 6.05 3 118-152 0.61
17 bnlg1327 CT(25) 2.02 4 190-305 0.54
18 bnlg1812 AG(22) 8.05 3 173-229 0.53
19 bnlg1241 AG(21) 4.01 2 149-180 0.49
20 bnlg1063 AG(42) 3.06 3 117-293 0.35
21 phi081 GAT-TAC 6.05 2 175-187 0.054
22 bnlg1655 AG(21) 10.03 3 105-148 0.28
23 bnlg1614 AG(15) 1.02 3 175-250 0.79
24 bnlg1083 AG(29) 1.02 4 84-170 0.61
25 bnlg1209 AG(12) 9.04 3 92-265 0.45
26 bnlg1082 AG(11) 9.02 3 189-280 0.16
27 umc1143 AAAAT 6.00 3 170-259 0.69
28 bnlg439 NA 1.03 2 155-229 0.71
29 bnlg1297 AG(32) 2.02 4 153-248 0.63
30 umc1042 GA17 2.07 3 81-108 0.71
31 umc1922 (ATA)6 2.05 3 113-256 0.54
32 bnlg1866 AG(11) 1.03 4 91-136 0.41
33 umc1056 (AGCA)4 5.03 4 58-165 0.61
34 dup13 - 1.08 4 129-168 0.49
35 umc1069 (GGAGA)6 8.08 3 127-156 0.76
36 umc1962 - 10.03 5 131-185 0.48
37 bnlg1028 AG(12) 10.06 2 147-160 0.79
38 umc1344 (GTTC)5 10.07 2 96-114 0.47
39 bnlg2248 AG(30) 2.03 4 195-410 0.66
40 umc2252 (TCC)4 2.05 2 86-130 0.74
Mean 3.1 Mean 0.55
* Location of allele in the chromosome of maize genome.
reports, that SSR marker can be used for estimation of genetic diversity in maize improvement (Xia et al., 2004; Shah et al., 2009).
The used SSR marker provided high PIC value with mean of 0.55 ranging from 0.054 to 0.82 (Table 3). The lowest PIC value (0.054) was recorded with markers phi 081 on bin locus 6.05 and the highest (0.82) was
recorded with markers umc 2189 on bin locus 1.10. Three loci showed ≥0.39 and 17 loci showed ≥ 0.69 and 20 loci showed ≥ 0.99 PIC value respectively. The SSR markers containing trinucleotide (CAG)4 repeat had the highest PIC value and hexanucleotide (GATTAC) repeat had the lowest PIC value. Here, the mean PIC value was in the range as reported by Senior et al. (1998) and
16474 Afr. J. Biotechnol.
Figure 1. Association of the 91 maize genotypes as revealed by UPGMA cluster analysis obtained using six different agronomic traits.
Heckenberger et al. (2002); and this value was similar to those reported by Legesse et al. (2007) in their genetic diversity study of African maize inbred lines. It was lower than those reported previously (Beyene et al., 2005; Sharma et al., 2010). However, higher mean PIC value was reported by Smith et al. (1997); this difference may be associated with the use of acrylamide gels for detection in their study.
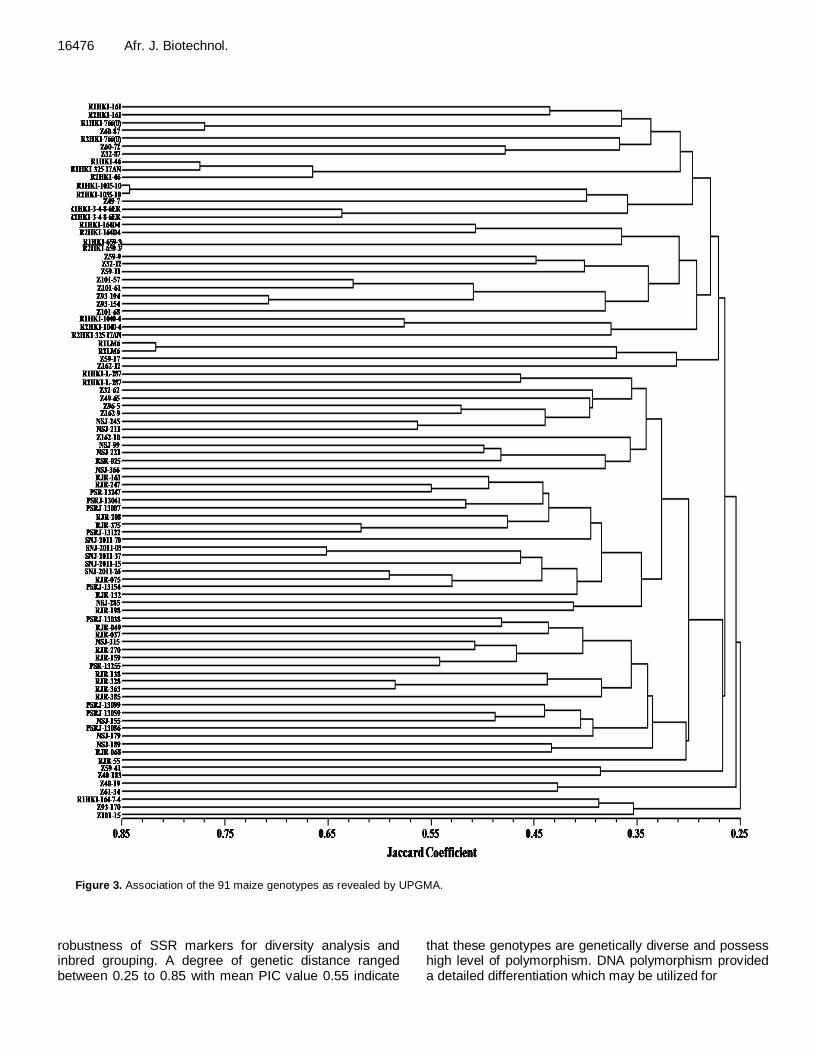
Cluster analysis of the genotypes based on SSR marker From the data generated by 40 SSR markers, the similar classes were also fused together from the most similarity to the least similarity levels and plotted as dendrogram (Figure 3). Genetic similarity measured through analysis of data on the 40 SSR markers from the 91 maize
Kumar et al. 16475
Figure 2. PCR amplification profile of 91 maize genotypes with SSR marker bnlg1614 (Bin 1.02). L1= Ladder 50 bp, L2 = ladder
100 bp, 1 to 23 = source DMR, New Delhi; 24 to 48 = source CIMMYT, Hyderabad; 49 to 91 = source NBPGR, Regional Station, Hyderabad (details of sample number 1-91 is presented in Table 1).
genotypes revealed varying degree of genetic diversity ranging from 0.25 to 0.85 in Jaccard coefficient. The highest (0.85) similarity coefficient was observed between genotypes R1HKI-659-3 and R2HKI-659-3 and the second highest (0.83) was observed between genotypes R1HKI-1035-10 and R2HKI-1035-10 which confirms that these genotypes were closely related .
The dendrogram separated the 91 genotypes into two major clusters, one small cluster I with 5 genotypes and a large cluster II with 86 genotypes (Figure 3). The large cluster II was further subdivided into two sub clusters; sub cluster IIA containing 34 genotypes in the first cluster and 52 genotypes in the sub cluster IIB, at a similarity coefficient level of 0.27. The sub cluster IIA of the 34 genotypes was further subdivided into two groups; the smaller group with 4 genotypes and the larger group with 30 genotypes at 0.28 coefficient level. The second sub cluster IIB of 52 genotypes were further subdivided into two groups; the smaller group with 2 genotypes only and one larger group with 50 genotypes. Again, these 50 genotypes were re-subdivided into two groups with 31 genotypes in one group and 19 genotypes in the second group at 0.30 coefficient levels. Minimum genetic distance between R1HKI-1305-10 and R2HKI-1035-10 and R1HKI-659-3 and R2HKI-659-3 was a good indication confirming the efficiency of SSR markers to distinguish closely related inbred lines (Smith et al., 1997). In our investigation, the highest genetic distance among 91 maize genotypes was 0.85 which indicates high level of
polymorphism among the selected genotypes. Genotypes R1HKI-1035-10 and R2HKI-1035-10,
R1HKI-659-3 and R2HKI-659-3, and genotypes R1LM6 and R2LM6 were closest to each other as evident from the dendrogram generated by SSR marker as well as in the dendrogram generated by phenotypic traits. This may be due to narrow diversity among them. Similarly, many of the genotypes grouped in single cluster, were expected because they may have originated from same source. Genotypes Z59-41, Z40-183, Z40-19, Z61-34, R1HKI-164-7-4, Z93-170 and Z101-15 were divergent as they fall in side of the dendrogram (Figure 3). Genotypes RSR-025 and NSJ-366 came out to be the most diverse based on quantitative traits as well as SSR marker and clearly separated from the rest of the genotypes. This grouping in most instants revealed evidence of associations related to their pedigree records. This is in agreement with earlier findings of Reif et al. (2003) and Legesse et al. (2007) who demonstrated the correspondence of SSR marker distance with pedigree information in maize. Cross pollination with highly variable genotypes and multiple origins with different sources are all considered to be factors contributing to the extreme genetic diversity among the selected genotypes.
Conclusion
Ninety-one selected maize genotypes were characterized and classified using SSR marker system indicating the
16476 Afr. J. Biotechnol.
Figure 3. Association of the 91 maize genotypes as revealed by UPGMA.
robustness of SSR markers for diversity analysis and inbred grouping. A degree of genetic distance ranged between 0.25 to 0.85 with mean PIC value 0.55 indicate
that these genotypes are genetically diverse and possess high level of polymorphism. DNA polymorphism provided a detailed differentiation which may be utilized for
verifying the authenticity of genotypes, selecting the best genotypes for breeding, for better estimation of heterosis and verifying the pedigree. High genetic diversity detected among the 91 maize genotypes by morpho-physiological and SSR marker suggests the opportunity to exploit the most diverse genotypes for future QTL mapping and maize improvement programme. Genetically distinct genotypes have been identified that could be potentially important sources of germplasm for drought tolerance maize improvement programme. The result could assist plant breeders in selecting diverse sources of germplasm for the maximum heterosis and making new cultivars with adaptation to a broad range of environments. ACKNOWLEDGEMENTS The authors are thankful to the Directors of NBPGR, Regional Station, Hyderabad, DMR, New Delhi, and CIMMYT, Hyderabad, for providing the seed material. The findings are the outcomes of the Research project ‘National Initiative on Climate Resilient Agriculture’ funded by the Indian Council of Agriculture Research (ICAR), New Delhi, India. REFERENCES
Babu BK, Pooja P, Bhatt JC, Agrawal PK (2012). Characterization of
Indian and exotic quality protein maize (QPM) and normal maize (Zea
mays L.) inbreds using simple sequence repeat (SSR) markers. Afr.
J. Biotechnol. 11(41):9691-9700. Bantte K, Prasanna BM (2003). Simple sequences repeat
polymorphism in quality protein maize (QTL) lines. Euphytica 129:337-344.
Beyene Y, Botha A, Alexander AM (2005). A comparative study of
molecular and morphological methods of describing genetic relationships in traditional Ethiopian highland maize. Afr. J. Biotechnol. 4(7):586-595.
Comertpay G, Baloch FS, Kilian B, Ulger AC, Ozkan H (2012). Diversity assessment of Turkish maize landraces based on fluorescent labelled SSR markers. Plant. Mol. Biol. Rep. 30:261-274.
Doyle JJ, Doyle JL (1990). A rapid DNA isolation procedure from small quantity of fresh leaf material. Phytochem. Bull. 119:11-15.
Heckenberger M, Melchinger AE, Ziegle JS, Joe LK, Hauser JD, Hutton
M, Bohn M (2002). Variation of DNA fingerprints among accessions within maize inbred genotypes with regard to the identification of essentially derived varieties. I. Genetic and technical sources of
variation in SSR data. Mol. Breed. 10:181-191. Jaccard P (1908). Nouvelles recherches sur la distribution florale. Bull.
Soc. Vaudoise Sci. Nat. 44:223-270.
Kostova А, Todorovska E, Christov N, Sevov V, Atanassov AI (2006). Molecular characterization of Bulgarian maize germplasm collection via SSR markers. Biotechnol. Biotechnol. Eq. 20(2):29-36.
Legesse BW, Myburg AA, Pixley KV, Botha AM (2007). Genetic diversity of African maize inbred lines revealed by SSR markers. Hereditas 144:10-17.
Kumar et al. 16477 Liu K, Goodman M, Muse SV, Smith JS, Buckler ES, Doebley J (2003).
Genetic structure and diversity among maize inbred lines as inferred from DNA microsatellites. Genetics 165:2117-2128.
Losa A, Hartings H, Verderio A, Motto M (2011). Assessment of genetic diversity and relationships among maize inbred genotypes developed in Italy. Maydica 56(1):95-104.
Mohan M, Nair S, Bhagwat A, Krishna TG, Yano M (1997). Genome mapping, molecular markers and marker-assisted selection in crop plants. Mol. Breed. 3:87-103.
Nguyen TV, Doan TTB, Leo AE, Bui CM, Taylor PWJ, Ford R (2012). Application of microsatellite markers to fingerprint and determine the representational diversity within recently established elite maize
inbred line breeding program. J. Agric. Sci. 4(6):258-266. Powell W, Morgante M, Andre C, Hanafey M, Vogel J, Tingey S,
Rafalski A (1996). The comparison of RFLP, RAPD, AFLP and SSR
(microsatellite) markers for germplasm analysis. Mol. Breed. 2:225-238.
Prasanna BM, Beiki AH, Sekhar JC, Srinivas A, Ribaut JM (2009a).
Mapping QTLs for component traits influencing drought stress tolerance of maize in India. J. Plant Biochem. Biotechnol. 18:151-
160.
Prasanna BM, Hettiarachchi K, Mahatman K (2009b). Molecular marker-assisted pyramiding of genes conferring resistance to Turcicum leaf blight and Polysora rust in maize inbred lines in India.
In: Proceedings of 10th Asian regional maize workshop (October 20-
23, 2008, Makassar, Indonesia). CIMMYT, Hyderabad, Mexico DF. Prasanna BM, Pixley KM, Warburton L, Xie CH (2010). Molecular
marker-assisted breeding options for maize improvement in Asia. Mol. Breed. 26:339-356.
Reif FC, Melchinger AE, Xia XC, Warburton ML, Hoisington DA, Vasal
SK, Srinivasan G, Bohn M, Frisch M (2003). Genetic distance based on simple sequence repeats and heterosis in tropical maize populations. Crop Sci. 43:1275-1282.
Rohlf FJ (1998). NTSYS-pc: Numerical taxonomy and multivariate analysis system, v. 2.0. Exeter Software. Setauket, New York.
Senior ML, Murphy JP, Goodman MM, Stuber CW (1998). Utility of
SSRs for determining genetic similarities and relationships in maize using agarose gel system. Crop Sci. 38:1088-1098.
Shah Z, Ali IMS, Iqbal A, Mumtaz S, Nwaz R, Swati ZA (2009). Genetic
diversity of Pakistani maize genotypes using chromosome specific simple sequence repeat (SSR) primer sets. Afr. J. Biotechnol. 8(3):375-379.
Sharma L, Prasanna BM, Ramesh B (2010). Analysis of phenotypic and microsattelite-based diversity of maize landraces in India, especially from the North East Himalayan region. Genetica 138:619-631.
Sharma MV, Kantartzi SK, Stewart JM (2009). Molecular diversity and polymorphism information content of selected Gossypium hirsutum
accessions, Summaries of Arkansas Cotton Research 2009. Smith JSC, Chin ECL, Shu H, Smith OS, Wall SJ, Senior ML, Mitchell
SE, Kresovitch S, Ziegle J (1997). An evaluation of the utility of SSR loci as molecular markers in maize (Zea mays L.): comparisons with data from RFLPs and pedigree. Theor. Appl. Genet. 95:163-173.
White PJ, Johnson LA (2003). Corn: Chemistry and Technology. American Association of Cereal Chemists, USA.
Xia X, Reif J, Hoisington D, Melchinger A, Frisch M, Warburton M
(2004). Genetic diversity among CIMMYT, Hyderabad maize inbred lines investigated with SSR markers: I. Lowland tropical maize. Crop Sci. 44:2230-2237.