Embed Size (px)
Citation preview

BioMed CentralBMC Genetics
ss
Open AcceResearch articleGenetic relationship and diversity in a sesame (Sesamum indicum L.) germplasm collection using amplified fragment length polymorphism (AFLP)Hernán E Laurentin*1 and Petr Karlovsky2Address: 1Biologic Sciences Department, Agronomy Faculty, Universidad Centroccidental Lisandro Alvarado, Barquisimeto, Venezuela and 2Institute of Phytopathology and Plant Protection, Georg-August-University, 37077 Goettingen, Germany
Email: Hernán E Laurentin* - [email protected]; Petr Karlovsky - [email protected]
* Corresponding author
AbstractBackground: Sesame is an important oil crop in tropical and subtropical areas. Despite itsnutritional value and historic and cultural importance, the research on sesame has been scarce,particularly as far as its genetic diversity is concerned. The aims of the present study were to clarifygenetic relationships among 32 sesame accessions from the Venezuelan Germplasm Collection,which represents genotypes from five diversity centres (India, Africa, China-Korea-Japan, CentralAsia and Western Asia), and to determine the association between geographical origin and geneticdiversity using amplified fragment length polymorphism (AFLP).
Results: Large genetic variability was found within the germplasm collection. A total of 457 AFLPmarkers were recorded, 93 % of them being polymorphic. The Jaccard similarity coefficient rangedfrom 0.38 to 0.85 between pairs of accessions. The UPGMA dendrogram grouped 25 of 32accessions in two robust clusters, but it has not revealed any association between genotype andgeographical origin. Indian, African and Chinese-Korean-Japanese accessions were distributedthroughout the dendrogram. A similar pattern was obtained using principal coordinates analysis.Genetic diversity studies considering five groups of accessions according to the geographic origindetected that only 20 % of the total diversity was due to diversity among groups using Nei'scoefficient of population differentiation. Similarly, only 5% of the total diversity was attributed todifferences among groups by the analysis of molecular variance (AMOVA). This small but significantdifference was explained by the fact that the Central Asia group had a lower genetic variation thanthe other diversity centres studied.
Conclusion: We found that our sesame collection was genetically very variable and did not showan association between geographical origin and AFLP patterns. This result suggests that there wasconsiderable gene flow among diversity centres. Future germplasm collection strategies shouldfocus on sampling a large number of plants. Covering many diversity centres is less importantbecause each centre represents a major part of the total diversity in sesame, Central Asia centrebeing the only exception. The same recommendation holds for the choice of parents for segregantpopulations used in breeding projects. The traditional assumption that selecting genotypes ofdifferent geographical origin will maximize the diversity available to a breeding project does nothold in sesame.
Published: 16 February 2006
BMC Genetics2006, 7:10 doi:10.1186/1471-2156-7-10
Received: 13 September 2005Accepted: 16 February 2006
This article is available from: http://www.biomedcentral.com/1471-2156/7/10
© 2006Laurentin and Karlovsky; licensee BioMed Central Ltd.This is an Open Access article distributed under the terms of the Creative Commons Attribution License (http://creativecommons.org/licenses/by/2.0), which permits unrestricted use, distribution, and reproduction in any medium, provided the original work is properly cited.
Page 1 of 10(page number not for citation purposes)

BMC Genetics 2006, 7:10 http://www.biomedcentral.com/1471-2156/7/10
BackgroundSesame (Sesamum indicum L.) is one of the most ancientcrops [1]. It is grown in tropical and subtropical areas [2]on 6.5 million hectares worldwide, producing more thanthree million tons of seed [3]. India, Sudan, Myanmar andChina are the most important sesame producers with 68% of the world production. Sesame seed, which is highlynutritive (50% oil and 25% protein), is traditionally usedfor direct consumption and as a source of oil of excellentquality due to the presence of natural antioxidants such assesamin and sesamol [4]. Potentially beneficial effects ofsesame on human health have recently renewed the inter-est in this ancient crop.
Despite the nutritional value and historic and culturalimportance of sesame, the research on sesame has beenscarce. For example, no international CGIAR (Consulta-tive Group on International Agricultural Research) agencyis mandated to study sesame [5]. Information on thegenetic diversity in sesame is limited as well. Sesamediversity centres have been identified as India, China,Central Asia, Near East and Abysinia in classical studies[6,7]. More recently, a high level of variability of morpho-logical characters within different sesame collections wasreported [8,9]. Genetic variability in sesame has also beenstudied by molecular techniques, including isozymes[10,11], RAPD [12,13] and ISSR [14]. Amplified fragmentlength polymorphism (AFLP) has only been used in link-age analysis [15]. AFLP is a promising technique for thecharacterization of genetic diversity in sesame because itpossesses a high degree of reproducibility and discrimina-tory power [16]. It has been successfully applied to manycultivated and wild plants, including faba bean (Vicia fabaL.) [17], grapevine (Vitis vinifera L.) [18], adzukibean(Vigna angularis Willd.) [19], squash (Cucurbita pepo L.)[20], Nicotiana attenuata [21], plantain (Musa spp.) [22],sorghum (Sorghum bicolor L.)[23], alfalfa (Medicago sativaL.) [24] wheat (Triticum turgidum L. subsp. Durum (Desf.)Husn) [25], and coffee (Coffea arabica L.) [26].
The aim of the present study was to clarify genetic rela-tionships among 32 sesame accessions from the Venezue-lan Germplasm Collection, which represents genotypesfrom 5 geographical regions, and to determine the rela-tionship between geographical distribution and geneticdiversity.
ResultsAFLP resultsA total of 457 AFLP markers were recorded using 8 primercombinations on 32 sesame accessions. Ninety-three per-cent of markers were polymorphic (Table 1). Fifty-ninepercent of the markers ranged from 100 to 300 nucle-otides in size. Forty-seven bands (10.3 %) were unique, 25belonging to African accessions, 10 to Indian accessions,8 to China-Korean-Japan accessions, 3 to Central-Asianaccessions and 1 to Western-Asian accession.
Phenetic analysisJaccard's similarity coefficients ranged from 0.38(between one accession from India and one from Korea)to 0.85 (between one accession from Turkey and one fromSyria), with an average of 0.65. Within each geographicalregion sampled similarity coefficients were 0.59 for Africa,0.61 for China-Korea-Japan, 0.63 for India, 0.68 for West-ern Asia and 0.80 for Central Asia.
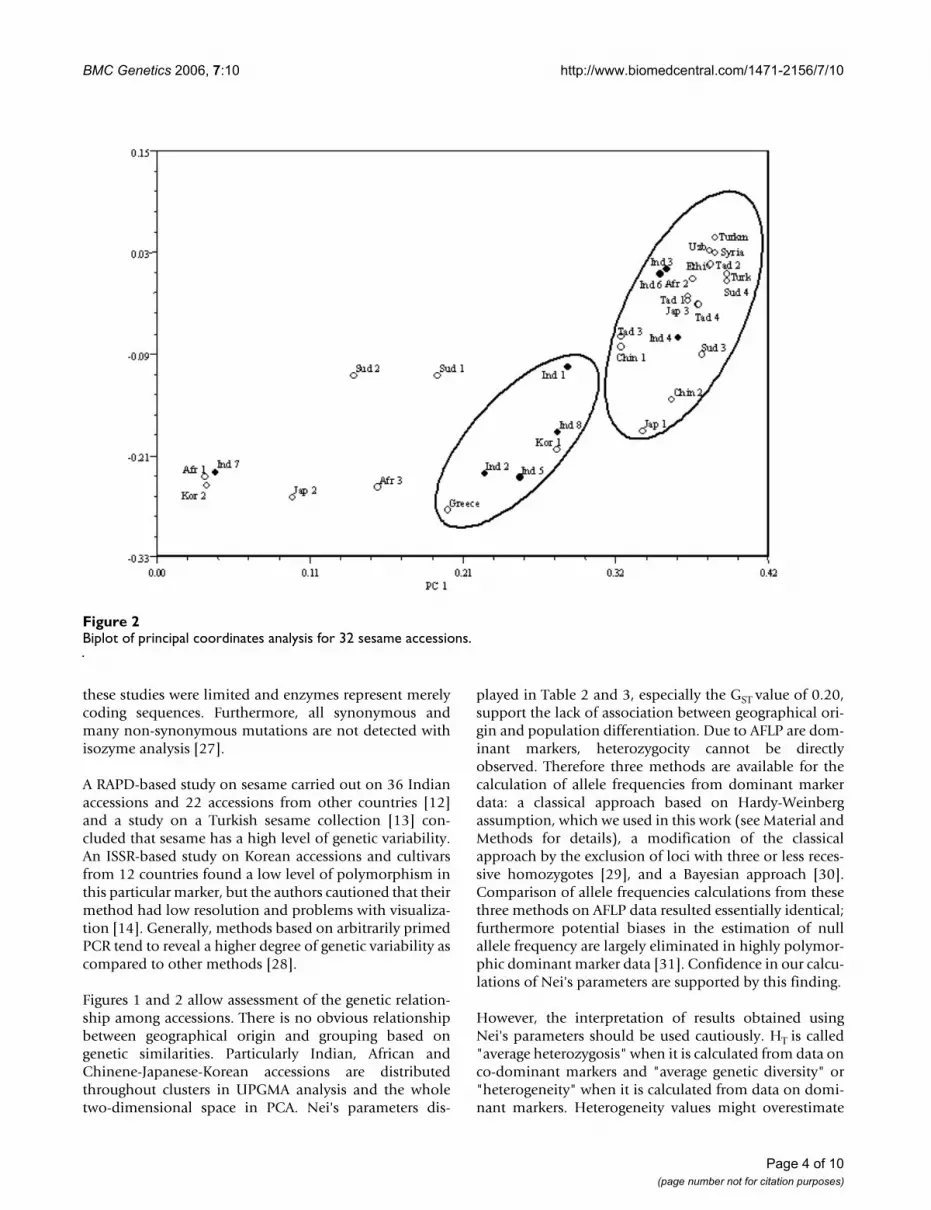
Figure 1 displays a UPGMA dendrogram obtained usingsimilarity coefficients. Two robust groups were identifiedat a similarity value of 0.65 by bootstraping (bootstrapvalues 90% and 93%). These clusters included 25 of 32accessions used in the analysis. The cophenetic correlationcoefficient (0.95) indicated little distortion between theoriginal similarity values from the similarity matrix andthe values used to construct the dendrogram. Further-more, the standard deviation for the two main clusterswas less than 4% (see legend to Figure 1). Figure 2 dis-plays the location of the same 32 accessions on a bidi-mensional space of principal coordinates analysis, whichrepresented 74 % of total variation among accessions.
Table 1: List of primer combinations used in the present study and some characteristics of the amplification products. Bands were considered polymorphic if the frequency of one of its states (present or absent) is less or equal to 0.97 (present or absent in at least 31 from 32 accessions)
Primer combination Total number of bands Polymorphic bands % of polymorphic bands
(Cy5)E_ACA+M_CTCA 48 43 90(Cy5)E_ACA+M_CAA 68 66 97(Cy5)E_ACA+M_CCA 52 52 100(Cy5)E_ACA+M_CGAA 45 38 84(Cy5)E_ACA+M_CAT 93 86 92(Cy5)E_ACA+M_CAG 57 56 98(Cy5)E_ACA+M_CCC 56 52 93(Cy5)E_ACA+M_CAC 40 32 83
Page 2 of 10(page number not for citation purposes)

BMC Genetics 2006, 7:10 http://www.biomedcentral.com/1471-2156/7/10
Genetic diversityTable 2 summarises estimated Nei's parameters related togenetic diversity, showing that only 20% of the total vari-ation in allele frequencies corresponds to differencesamong groups. Average diversity within groups (HST)ranged between 0.14 for Central Asia and 0.21 for Africa.Genetic distances among groups are very low (Table 3).Central Asia accessions had the lowest probability of shar-ing the same allele frequencies in all sampled loci with theother geographical regions.
Analysis of molecular varianceTable 4 shows the analysis of molecular variance. It indi-cates that 5% of the variance among the 32 AFLP patternswas due to differences among groups and 95% was due todifferences within groups. However, despite the small
value for variation among groups, it was statistically sig-nificant (P < 0.05). Table 5 displays that this finding canbe explained by a large difference between the variation ofCentral Asia accessions with respect to the other diversitycentres, since all of them, and only they, were significant(P < 0.05).
DiscussionSesamum indicum L. has a large genetic variability, whichshould be taken into account when planning conserva-tion strategies or when sesame variability is used in breed-ing programs. This high level of polymorphism in sesamehas been reported before for its morphology [8,9]. Earlymolecular studies have not confirmed this. Isozyme stud-ies concluded that cultivated sesame has a narrow geneticbase [10,11], However, the number of loci sampled in
Dendrogram for 32 sesame accessions (cophenetic correlation 0.95)Figure 1Dendrogram for 32 sesame accessions (cophenetic correlation 0.95). Values from bootstraping analysis are indicated. Two groups are clearly identified, and these nodes have a similarity average and standard deviation of 69.2 ± 2.6 (the upper) and 69.0 ± 1.2. (the lower)
Page 3 of 10(page number not for citation purposes)
BMC Genetics 2006, 7:10 http://www.biomedcentral.com/1471-2156/7/10
these studies were limited and enzymes represent merelycoding sequences. Furthermore, all synonymous andmany non-synonymous mutations are not detected withisozyme analysis [27].
A RAPD-based study on sesame carried out on 36 Indianaccessions and 22 accessions from other countries [12]and a study on a Turkish sesame collection [13] con-cluded that sesame has a high level of genetic variability.An ISSR-based study on Korean accessions and cultivarsfrom 12 countries found a low level of polymorphism inthis particular marker, but the authors cautioned that theirmethod had low resolution and problems with visualiza-tion [14]. Generally, methods based on arbitrarily primedPCR tend to reveal a higher degree of genetic variability ascompared to other methods [28].
Figures 1 and 2 allow assessment of the genetic relation-ship among accessions. There is no obvious relationshipbetween geographical origin and grouping based ongenetic similarities. Particularly Indian, African andChinene-Japanese-Korean accessions are distributedthroughout clusters in UPGMA analysis and the wholetwo-dimensional space in PCA. Nei's parameters dis-
played in Table 2 and 3, especially the GST value of 0.20,support the lack of association between geographical ori-gin and population differentiation. Due to AFLP are dom-inant markers, heterozygocity cannot be directlyobserved. Therefore three methods are available for thecalculation of allele frequencies from dominant markerdata: a classical approach based on Hardy-Weinbergassumption, which we used in this work (see Material andMethods for details), a modification of the classicalapproach by the exclusion of loci with three or less reces-sive homozygotes [29], and a Bayesian approach [30].Comparison of allele frequencies calculations from thesethree methods on AFLP data resulted essentially identical;furthermore potential biases in the estimation of nullallele frequency are largely eliminated in highly polymor-phic dominant marker data [31]. Confidence in our calcu-lations of Nei's parameters are supported by this finding.
However, the interpretation of results obtained usingNei's parameters should be used cautiously. HT is called"average heterozygosis" when it is calculated from data onco-dominant markers and "average genetic diversity" or"heterogeneity" when it is calculated from data on domi-nant markers. Heterogeneity values might overestimate
Biplot of principal coordinates analysis for 32 sesame accessionsFigure 2Biplot of principal coordinates analysis for 32 sesame accessions.
Page 4 of 10(page number not for citation purposes)

BMC Genetics 2006, 7:10 http://www.biomedcentral.com/1471-2156/7/10
the number of real loci, whereas the number of alleles perlocus is underestimated. Thus, heterogeneity measureshave only relative value and cannot be compared with val-ues obtained from other molecular markers [32]. Addi-tionally, reliable estimation of average heterozygosis withsmall number of individual are based on large number ofloci (>50) and low average heterozygosis (<0.1) [33]. Ourresults indicate a heterogeneity higher than 0.1, however,we are more interested in the partition of variation(within and between groups of accessions) than in thevalue by itself.
AMOVA results shown in Table 4, support the lack of asso-ciation between geographical origin and population dif-ferentiation as well. AMOVA reported differences amonggeographical regions, which were significant but repre-sented only 5% of the total variation. Table 5 shows thatthe differences between Central Asian accessions and theother centres were responsible for this part of the varia-tion. These results, together with the fact that all CentralAsian accessions were grouped in one cluster, indicate anarrow variation within this centre as compared to thevariance in AFLP patterns of the whole germplasm collec-tion. Furthermore, Central Asian accessions had the low-est HST value (0.14) though it had more polymorphic locithan Western Asia accessions. A possible explanation ofthis result is that allele frequencies in Central Asia wereclose to 0 or 1, which could be a consequence of geneticdrift. If a strong genetic flow was the cause of the lack ofassociation between geographical origin and genetic dif-ferences in sesame, the genetic flow to Central Asia inrecent time was limited.
This lack of association between geographical distributionand classification based on molecular markers in sesamewas explained by the exchange of sesame among widelyseparated locations [14]. However, this study used pre-dominantly commercial cultivars, which resulted from asystematic selection process on material of unreportedorigin, while the origin of material used in our study isknown.
The genetic variability in Indian accessions of sesame ishigh [6], as shown both for molecular [12] and morpho-logical markers [9]. Sesame seems to have been domesti-cated in India [5], which could explain the high geneticvariability among Indian accessions. In our study, Africanand Chinese-Korean-Japanese accessions showed as higha genetic variability as Indian accession.
Africa has also been considered the origin of sesame[2,34], based on the fact that most of the wild Sesamumspecies are endemic there. Reports on the variability ofcultivated sesame in Africa are controversial, claimingboth low [12] and high [[35] and our results] level of var-iability. Some authors consider Abysinia (Ethiopia) as thebasic diversity centre for sesame [6,7].
Accessions from China, Korea and Japan, which wegrouped into one diversity centre, have been studied sep-arately by some authors. A unique allele was found in Chi-nese-Japanese accessions in a study on isozymes [11].China is considered a secondary centre of diversity for ses-ame [7]. Genetic variability among Korean landraces ishigher than among Korean cultivars [14].
Table 2: Polymorphic loci and genetic diversity of five groups of sesame accessions, according their geographical distribution
Population Polymorphic loci % Hs
India 313 63 0.1957Africa 352 71 0.2129Western Asia 187 38 0.1516Central Asia 199 40 0.1445China-Korea-Japan 292 59 0.1916
Average Hs = 0.1793± 0.0266Ht = 0.2244 ± 0.0325
Gst = 0.2013
Table 3: Unbiased measures of identity and genetic distance (Nei, 1978) among groups of sesame accessions. Nei's genetic identity is shown above diagonal, genetic distance below diagonal.
India Africa Western Asia Central Asia China-Korea-Japan
India 0.978 0.956 0.925 0.979Africa 0.023 0.950 0.933 0.989Western Asia 0.045 0.051 0.928 0.951Central Asia 0.078 0.069 0.075 0.926China-Korea-Japan 0.021 0.011 0.051 0.077
Page 5 of 10(page number not for citation purposes)

BMC Genetics 2006, 7:10 http://www.biomedcentral.com/1471-2156/7/10
Central Asia and Western Asia accessions had the lowestgenetic variability in our study. Reports on the genetic var-iability of Western Asia accessions are scarce and no infor-mation has been published so far about Syrian and Greeksesame. Turkish landraces have been compared to eachother with RAPD recently [13], but the relationship toaccessions from other geographical region has not beeninvestigated. We analysed only three accessions fromWestern Asia. Remarkably, the highest similarity foundamong all 32 accessions corresponded to similarity valuesbetween two of these accessions (one from Syria and onefrom Turkey). The third accession was not closely relatedto these.
Distribution of genetic diversity in a plant species dependson its evolution and breeding system, ecological and geo-graphical factors and often on human activities [36].Cross-pollination may play a role, because it can reach upto 60% in sesame, depending on the presence of suitableinsects at flowering time [12]. Ecological and geographicalfactors obviously have not played an important role in theevolution of sesame since we have not found any associa-tion between genetic diversity and accession origin.
Sesame growers have been manipulating the crop due tomigration and trade for centuries, causing a steady geneflow among different geographical areas. The oldest rem-nants of sesame, found in the Harappa valley in theIndian subcontinent [1], date the origin of these activitiesto at least 5500 BP. Therefore, we believe that the mostimportant factor affecting the current genetic structure insesame were human activities.
ConclusionAFLP analysis revealed a high degree of genetic polymor-phism in sesame accessions within all diversity centresexcept Central Asia. Phenetic analysis has not shown anyassociation between geographic origin and AFLP patterns.According to Nei's diversity indexes, 80 % of the totalgenetic diversity in sesame is represented within diversitycentres. This result was corroborated by analysis of molec-ular variance (AMOVA) which indicated that 95 % of thevariation among accessions were due to variation withindiversity centres. These results suggest that conservationstrategies do not need to cover all diversity centres as longas they sample a sufficient number of accessions. Simi-larly, choosing parent genotypes for breeding programsfrom many diversity centres as compared to sampling justone centre (except Central Asia) is not likely to increasethe variability among progeny significantly. Regardless ofhow many diversity centres are sampled, both conserva-tion strategies and breeding programs would benefit fromusing AFLP or another genome fingerprinting techniqueto maximise the genetic variability covered by the selectedgenotype set.
MethodsPlant materialThirty-two accessions from Centro Nacional de Investiga-ciones Agropecuarias (CENIAP) Germplasm Bank (Table6) were grown in the greenhouse. These accessions origi-nate from five different geographical regions representingthe proposed diversity centres for sesame [6,7], and thegeographical areas included in the germplasm bank; theywere chosen randomly within each geographical region,using more accessions for the two proposed origin centres
Table 4: AMOVA for the partitioning AFLP variation in sesame
Source of variation Degree of freedom SS CV % total p
Among geographical areas 4 328.37 3.32 5.14 0.02Within geographical areas 27 1654.47 61.28 94.86Total 31 1982.84
Fixation index (Fst) = 0.0514
Table 5: Pairwise comparison of groups of sesame accessions by AMOVA. Genetic distance (FST) between groups of sesame accessions is shown below diagonal. Probability of random distance (FST) larger than the observed distance after 1000 permutations is shown above diagonal.
India Africa China-Korea-Japan Western Asia Central Asia
India 0.161 0.233 0.367 0.005Africa 0.027 0.455 0.540 0.008China-Korea-Japan 0.014 -0.003 0.301 0.005Western Asia 0.000 -0.022 0.014 0.012Central Asica 0.141 0.098 0.132 0.103
Page 6 of 10(page number not for citation purposes)

BMC Genetics 2006, 7:10 http://www.biomedcentral.com/1471-2156/7/10
(India and Africa). The accessions were grouped into oneof the following diversity centres: India, Africa, China-Korea-Japan, Central Asia and Western Asia.
DNA extractionThree grams of apical young leaves from 6 plants peraccession were collected and used for DNA extraction.Leaves were ground in liquid nitrogen and tissue powderwas dispersed in CTAB buffer (2.3 g sorbitol, 1 g N-lauryl-sarcosine, 0.8 g CTAB, 4.7 g sodium chloride, and 1 g pol-yvinylpolypyrolidone in total volume of 100 ml of 20 mMEDTA, 10 mM Tris, pH set to 8.0) containing 0.4 mg pro-teinase K and 20 µL mercaptoethanol. The homogenateswere incubated for 10 min at 42°C and 10 min at 65°C,cooled to room temperature and extracted with 8 ml ofchloroform-isoamylalcohol (24:1). Phases were separatedby centrifugation for 10 min at 12000 RCF (relative cen-trifugal force or g value). Polyethyleneglycol (PEG6000,SERVA Electrophoresis, Germany) stock solution (30%)was added to the aqueous phase to a final concentrationof 6 %, mixed, and after 30 min of incubation at roomtemperature the precipitated DNA was sedimented by
centrifugation for 20 min at 12,000 RCF. Pellets werewashed twice with 70% ethanol and dissolved in 200 µLTE buffer (10 mM Tris/HCl pH 8.0, 0.1 mM EDTA). 500µL of 5 M ammonium acetate solution were added andsamples were kept at 0°C for 30 min, centrifuged for 30min at 4°C and 18000 RCF. 500 µL of isopropanol wereadded to the supernatant and DNA was precipitated for 10min at room temperature. Samples were centrifuged at18000 RCF at room temperature for 10 min; pellets werewashed twice with 70% ethanol, dried and dissolved in200 µL of TE buffer. DNA concentration was determinedby electrophoresis in a 0.8 % agarose gel with lambdaDNA standard.
AFLP analysisAFLP analysis was performed as originally proposed [37]with minor modifications [38]. 250 ng of DNA were usedfor each reaction. DNA was digested with 10 U EcoRI and3 U of Tru1I (both entzymes from MBI Fermentas, Ger-many) in buffer recommended by the manufacturer in atotal volume of 15µl at 37°C for 90 min, followed by 90min at 65°C. 10 µl of a solution with a final concentration
Table 6: Accessions from CENIAP Germplasm Bank (Venezuela) and their respective origin country and diversity centre
Accessions Country of Origin Working code Diversity Centre
93-2223 India India 1 India95-465 India India 2 India95-469 India India 3 India95-447 India India 4 India89-007 India India 5 India93-2224 India India 6 India95-464 India India 7 India92-2918 India India 8 India92-3091 Korea Korea 1 China-Japan-Korea92-3093 Korea Korea 2 China-Japan-Korea92-2922 Turkey Turkey Western Asia92-3125 Greece Greece Western Asia93-2022 Syria Syria Western Asia93-2113 Sudan Sudan 1 Africa92-310 Sudan Sudan 2 Africa93-2010 Ethiopia Ethiopia Africa95-272 Unknown Africa 1 Africa92-2872 Sudan Sudan 3 Africa93-2105 Sudan Sudan 4 Africa95-234 Unknown Africa 2 Africa95-223 Unknown Africa 3 Africa92-2856 Japan Japan 1 China-Japan-Korea92-3030 Japan Japan 2 China-Japan-Korea92-3031 Japan Japan 3 China-Japan-Korea92-3108 China China 1 China-Japan-Korea95-383 China China 2 China-Japan-Korea92-2930 Tadjikistan Tadjikistan 1 Central Asia92-2947 Uzbekistan Uzbekistan Central Asia92-2952 Turkmenistan Turkmenistan 1 Central Asia92-2955 Turkmenistan Turkmenistan 2 Central Asia92-2950 Tadjikistan Tadjikistan 2 Central Asia92-2917 Tadjikistan Tadjikistan 3 Central Asia
Page 7 of 10(page number not for citation purposes)

BMC Genetics 2006, 7:10 http://www.biomedcentral.com/1471-2156/7/10
of 5 pmol of EcoRI adapter, 50 pmol of Tru1I adapter, 1×T4 DNA ligase buffer and 1U T4 DNA ligase (MBI Fermen-tas, Germany) were added to the digested DNA. The solu-tion was incubated at 20°C for 2 h, T4 ligase wasinactivated by heating to 65°C for 10 min and the mixturewas diluted 10-fold with TE buffer. Following ligation, afirst amplification was carried out with primers contain-ing one selective nucleotide (cytocine and adenine forMseI and EcoRI primers, respectively) (Table 7), dNTPs(0.125 mM, Takara Bio Inc., Japan), 1× PCR buffer (MBIFermentas, Germany), 1.5 mM MgCl2 and 1 U Taqpolymerase (MBI Fermentas, Germany) were added in atotal volume of 10 µl. PCR was performed for 20 cycles,which consisted of 30 s at 94°C, 1 min at 56°C and 1 minat 72°C in a Tpersonal thermocycler (Biometra, Göttin-gen, Germany). The PCR products were diluted 10-foldwith TE buffer. The second amplification was carried outwith eight primer combinations using labelled EcorRI-primer (Cy5)E_ACA combined with one of the eight MseIprimers listed in Table 7. The PCR mixture consisted of 2µL of diluted preamplified DNA, 4.2 ng of (Cy5)E_ACAprimer, 11.4 ng of MseI primer 0.25 mM, dNTPs (TakaraBio Inc., Japan), 1× R buffer (MBI Fermentas, Germany),1.5 mM MgCl2 and 1 U Taq polymerase (MBI Fermentas,Germany) in a total volume of 10 µL. The thermocyclerprogram consisted of two segments. The first segmentcomprised 12 cycles with the annealing temperaturedecreased from 65°C by 0.7°C in each cycle: 30 s at 94°C,30 s at 65°C to 57.3°C and 1 min at 72°C. The secondsegment consisted of 23 cycles of 30 s at 94°C, 1 min at56°C and 1 min at 72 °C. The PCR products were mixedwith 10 µL of loading buffer (98 % formamide, 10 mMEDTA and 0.025 % bromophenolblue), denatured for 4minutes at 90°C and 5 µL of this mixture were loadedonto a 7 % polyacrylamide gel ReproGel™ LongRead(Amersham Pharmacia Biotech, Uppsala, Sweden) in anALFexpress II DNA analyser (Amersham Pharmacia Bio-tech, Uppsala, Sweden). Three microliters of Genemark
500 Fluorescent DNA ladder labeled with Cy5 (Northern-biothech, Weston, USA) were loaded on each gel and theelectrophoresis was performed for 700 min at 1500 V, 25W, 60 mA and 55°C. The chromatogram recorded by soft-ware ALFwin™ Sequence Analyser 2.00 (AmershamPhar-macia Biotech, Uppsala, Sweden) was transformed to apseudogel image in TIFF-format, visualized in AdobeR
ImageReady™ version 3.0 (Adobe Systems Inc., USA) andanalyzed using GelComparII (Applied Maths, Belgium).
Statistical analysisBands were automatically recognised by GelCompar IIusing threshold values of 5 % of profiling (relative to themaximum value within each lane). Band matching wasperformed and the results were exported as a binarymatrix. It was used to study the phenetic relationshipamong AFLP patterns by means of cluster analysis (Gel-Compar II) and an ordination analysis, specifically princi-pal coordinates, using the software NTSySpc 2.11T [39].Jaccard's similarity coefficient and the unweighted pairgroup method with arithmetic mean (UPGMA) were usedto perform the clustering analysis. This was tested withthree statistical significance tests, also using GelComparII: the Bootstrap analysis [40] for the assessment of therobustness of dendrogram topology, the standard devia-tion of the cluster nodes, and cophenetic correlation as anestimation of the faithfulness of cluster analysis [41].Firstly, bootstraping analysis was carried out, and we triedto find robust groups at the same similarity level andfinally we calculated the standard deviation for thesegroups. Dendrogram-derived similarities were comparedwith experimental similarities to get cophenetic correla-tion.
To study the genetic structure of Sesamum indicum L. spe-cies, the accessions were grouped in five sets according tothe geographical distribution. Gene diversity indices suchas total diversity (HT), average diversity within group(HST), diversity among groups (DST) and coefficient ofpopulation differentiation (GST) [42] were calculated foreach band and then averaged for the total set. Heterozy-gocity cannot be directly observed in AFLP data becauseAFLP markers are dominant. To calculate allele frequen-cies, the absence of a band was considered as homozygousstate of a recessive allele (q2) and presence of a band aseither dominant homozygote (p2) or a heterozygous state(2 pq). Frequencies p and q are calculated accordingly.Also unbiased measures of genetic identity and geneticdistance between groups were calculated [33]. All Nei'sparameters, which use gene frequencies, were calculatedusing Popgene v. 1.32 software. To get another approachon the genetic structure with no assumed gene frequen-cies, analysis of molecular variance (AMOVA) [43] wascarried out using Arlequin v. 2.000 software, to estimatevariance components for the AFLP patterns and to parti-
Table 7: Primer sequences used in preamplification and amplification
Primer Sequence
Primer Sequence (Cy5)AFLP_E_ACA (Cy5)GACTGCGTACCAATTCACAAFLP_M_C GATGAGTCCTGAGTAACAFLP_M_CAA GATGAGTCCTGAGTAACAAAFLP_M_CAT GATGAGTCCTGAGTAACATAFLP_M_CAG GATGAGTCCTGAGTAACAGAFLP_M_CAC GATGAGTCCTGAGTAACACAFLP_M_CCA GATGAGTCCTGAGTAACCAAFLP_M_CCC GATGAGTCCTGAGTAACCCAFLP_M_CTCA GATGAGTCCTGAGTAACTCAAFLP_M_CGAA GATGAGTCCTGAGTAACGAA
Page 8 of 10(page number not for citation purposes)

BMC Genetics 2006, 7:10 http://www.biomedcentral.com/1471-2156/7/10
tion the total variance into 'within groups' and 'amonggroups'. Significance of variance components was testedafter 1000 permutations. Pairwise group FST (genetic dis-tances) values matrix was obtained to explain the signifi-cance of the variance components, also using 1000permutations.
Authors' contributionsHL participated in the design of the study, performedDNA extraction, AFLP and data analysis and participatedin interpretation of results and manuscript preparation.PK participated in the design of the study, designed DNAextraction and participated in the discussion for preparingthe manuscript and did the final revision.
AcknowledgementsThis work was supported by the Programme Alban, European Union Pro-gramme of High Level Scholarships for Latin America, Identification Number E03D13301VE, International PhD program for Agricultural Sci-ences in Göttingen University (IPAG) and Universidad Centroccidental Lisandro Alvarado. The authors thank Dr. Uli Hettwer for help with data processing.
References1. Bedigian D, Harlan J: Evidence for cultivation on sesame in the
ancient world. Economic Botany 1986, 40:137-154.2. Ashri A: Sesame breeding. Plant Breeding Reviews 1998,
16:179-228.3. FAO: FAOstat Databases 2005 [http://faostat.fao.org/].4. Brar G, Ahuja R: Sesame: its culture, genetics, breeding and
biochemistry. In Annu Rev Plant Sci Edited by: Malik CP. New Dehli,Kalyani publishers; 1979:285-313.
5. Bedigian D: Evolution of sesame revisited: domestication,diversity and prospects. Genetic Resources and Crop Evolution 2003,50:779-787.
6. Zeven A, Zhukovsky P: Dictionary of cultivated plants and their centresof diversity Wageningen, PUDOC; 1975.
7. Hawkes J: The diversity of crop plants Cambridge, Harvard UnirversityPress; 1983.
8. Bedigian D, Smyth C, Harlan J: Patterns of morphological varia-tion in sesame. Economic Botany 1986, 40:353-365.
9. Bisht I, Mahajan R, Loknathan T, Agrawal R: Diversity in Indian ses-ame collection and stratification of germplasm accessions indifferent diversity groups. Genetics Resources and Crop Evolution1998, 45:325-335.
10. Isshiki S, Umezake T: Genetic variations of isozymes in culti-vated sesame. Euphytica 1997, 93:375-377.
11. Diaz A, Layrisse A, Pugh T: Análisis de la diversidad genética enel ajonjolí mediante isoenzimas. Agron Trop (Maracay) 1999,49(2):169-186.
12. Bhat V, Babrekar P, Lakhanpaul S: Study of genetic diversity inIndian and exotic sesame (Sesamum indicum L.) germplasmusing random amplified polymorphic DNA (RAPD) markers.Euphytica 1999, 110:21-33.
13. Ercan A, Taskin M, Turgut K: Analyisis of genetic diversity inTurkish sesame (Sesamum indicum L.) populations usingRAPD markers. Genetic Resources and Crop Evolution 2004,51:599-607.
14. Kim D, Zur G, Danin-Poleg Y, Lee S, Shim K, Kang C, Kashi Y:Genetic relationships of sesame germplasm collection asrevealed by inter-simple sequence repeats. Plant Breeding 2002,121:259-262.
15. Uzun B, Lee D, Donini P, Cagrirgan M: Identification of a molec-ular marker linked to the closed capsule mutant trait in ses-ame using AFLP. Plant Breeding 2003, 122:95-97.
16. Savelkoul P, Aarts H, DeHaas J, Dijkshoorn L, Duim B, Otsen M,Rademaker J, Schouls L, Lenstra J: Amplified-fragment length
polymorphism analysis: the state of an art. Journal of ClinicalMicrobiology 1999, 37:3083-3091.
17. Zeid M, Shon C, Link W: Genetic diversity in recent elite fababean lines using AFLP markers. Theor Appl Genet 2003,107:1304-1314.
18. Fanizza G, Chaabane R, Lamaj F, Ricciardi L, Resta P: AFLP analysisof genetic relationships among aromatic grapevine (Vitis vin-ifera). Theor Appl Genet 2003, 107:1043-1047.
19. Zong X, Kaga A, Tomooka N, Wang X, Han O, Vaughan D: Thegenetic diversity of the Vigna angularis complex in Asia.Genome 2003, 46:647-658.
20. Ferriol M, Pico B, Nuez F: Genetic diversity of a germplasm col-lection of Cucurbita pepo using SRAP and AFLP markers.Theor Appl Genet 2003, 107:271-282.
21. Bahulikar RA, Stanculescu D, Preston CA, Baldwin ITKatzir N: ISSRand AFLP analysis of the temporal and spatial populationstructure of the post-fire annual, Nicotiana attenuata, in SWUtah. BMC Ecology 2004, 4:12.
22. Ude G, Pillay M, Ogundiwin E, Tenkouano A: Genetic diversity inan African plantain core collection using AFLP and RAPDmarkers. Theor Appl Genet 2003, 107:248-255.
23. Uptmoor R, Wenzel W, Friedt W, Donaldson G, Ayisi K, Ordon F:Comparative analysis on the genetic relatedness of Sorghumbicolor accessions from Southern Africa by RAPDs, AFLPsand SSRs. Theor Appl Genet 2003, 106:1316-1325.
24. Segovia-Lerma A, Cantrell R, Conway J, Ray I: AFLP-based assess-ment of genetic diversity among nine alfalfa germplasmusing bulk DNA templates. Genome 2003, 46:51-58.
25. Soleimani V, Baum B, Johnson D: AFLP and pedigree-basedgenetic diversity estimates in modern cultivars of durumwheat [Triticum turgidum L. subsp. Durum (Desf.) Husn].Theor Appl Genet 2002, 104:350-357.
26. Steiger L, Nagai C, Moore H, Morden W, Osgood V, Ming R: AFLPanalysis of genetic diversity within and among Coffea arabicacultivars. Theor Appl Genet 2002, 105:209-215.
27. Ovesná J, Poláková K, Leisová L: DNA analyses and their applica-tions in plant breeding. Czech J Genet Plant Breed 2002, 38:29-40.
28. Karp A, Kresovich S, Bhat K, Ayad W, Hodgkin T: Molecular tools inplant genetic resources conservation: a guide to the technologie Rome.IPGRI Technical Bulletin No. 2. International Plant Genetic ResourcesInstitute; 1997.
29. Lynch M, Milligan B: Analysis of population genetic structurewith RAPD markers. Molecular Ecology 1994, 3:91-99.
30. Zhyvotovsky L: Estimating population structure in diploidswith multilocus dominant DNA markers. Molecular Ecology1999, 8:907-913.
31. Krauss S: Accurate gene diversity estimates from amplifiedfragment length polymorphism (AFLP) markers. MolecularEcology 2000, 9:1241-1245.
32. Caicedo A, Gaitán E, Duque M, ToroChica O, Debouck D, Tohme J:AFLP fingerprinting of Phaseolus lunatus L. and related wildspecies from South America. Crop Science 1999, 39:1497-1507.
33. Nei M: Estimation of average heterozygosity and genetic dis-tance from a small number of individuals. Genetics 1978,89:583-590.
34. Weiss E: Sesame Oilseed crops 2nd edition. London. Blackwell Science;2000.
35. Bedigian D, Harlan J: Nuba agriculture and ethnobotany, withparticular reference to sesame and sorghum. Economic Botany1983, 37:384-395.
36. Ramanatha R, Hodgkin T: Genetic diversity and conservationand utilization of plant genetic resources. Plan Cell, Tissue andOrgan Culture 2002, 68:1-19.
37. Voss P, Hogers R, Bleeter M, Reijans M, van de Lee T, Hornes M, Fri-jters A, Pot J, Peleman J, Kuiper M, Zabeau M: AFLP: a new tech-nique for DNA fingerprinting. Nucleic Acids Res 1995,23:4407-4414.
38. Reineke A, Karlovsky P: Simplified AFLP protocol: replacementof primer labeling by the incoporation of alpha-labelednucleotides during PCR. BioTechniques 2000, 28:622-623.
39. Rohlf F: NTSYS-pc:numerical taxonomy and multivariate analysis system,version 2.11T New York, Exeter Software; 2004.
40. Efron B: Bootstrap methods: another look at the jackknife.Ann Statist 1979, 7:1-26.
41. Rohlf F, Sokal R: Comparing numerical taxonomic studies. Sys-tematic Zool 1981, 30:459-490.
Page 9 of 10(page number not for citation purposes)

BMC Genetics 2006, 7:10 http://www.biomedcentral.com/1471-2156/7/10
Publish with BioMed Central and every scientist can read your work free of charge
"BioMed Central will be the most significant development for disseminating the results of biomedical research in our lifetime."
Sir Paul Nurse, Cancer Research UK
Your research papers will be:
available free of charge to the entire biomedical community
peer reviewed and published immediately upon acceptance
cited in PubMed and archived on PubMed Central
yours — you keep the copyright
Submit your manuscript here:http://www.biomedcentral.com/info/publishing_adv.asp
BioMedcentral
42. Nei M: Molecular evolutionary genetics New York, Columbia UniversityPress; 1987.
43. Excoffier L, Smouse P, Quattro J: Analysis of molecular varianceinferred from metric distance among DNA haplotypes;application to human mitochondrial DNA restriction data.Genetics 1992, 131:479-491.
Page 10 of 10(page number not for citation purposes)


