Embed Size (px)
Citation preview

Genetic Relationships among Populations of Florida Bass
BRANDON L. BARTHEL*Illinois Natural History Survey, Institute of Natural Resource Sustainability; and Program in Ecology and
Evolutionary Biology, University of Illinois Urbana–Champaign, Urbana, Illinois 61802, USA
DIJAR J. LUTZ-CARRILLO AND KRISTEN E. NORBERG
Texas Parks and Wildlife Department, A. E. Wood Laboratory, San Marcos, Texas 78666, USA
WESLEY F. PORAK
Florida Fish and Wildlife Conservation Commission, Eustis Fisheries Research Laboratory,Eustis, Florida 32726, USA
MICHAEL D. TRINGALI
Florida Fish and Wildlife Conservation Commission, Fish and Wildlife Research Institute,St. Petersburg, Florida 33701, USA
TODD W. KASSLER1
Illinois Natural History Survey, Institute of Natural Resource Sustainability,University of Illinois Urbana–Champaign, Urbana, Illinois 61802, USA
WILLIAM E. JOHNSON
Florida Fish and Wildlife Conservation Commission, Eustis Fisheries Research Laboratory,Eustis, Florida 32726, USA
ANNE M. READEL
Program in Ecology and Evolutionary Biology, University of Illinois Urbana–Champaign,Urbana, Illinois 61802, USA
RICHARD A. KRAUSE
Florida Fish and Wildlife Conservation Commission, Fish and Wildlife Research Institute,Holt, Florida 32564, USA
DAVID P. PHILIPP
Illinois Natural History Survey, Institute of Natural Resource Sustainability,University of Illinois Urbana–Champaign, Urbana, Illinois 61802, USA
Abstract.—Florida bass Micropterus floridanus are endemic to peninsular Florida and co-occur with
largemouth bass M. salmoides in a natural intergrade zone in the northern portions of the state. In this study,
we resolved the genetic population structure among populations of largemouth bass, Florida bass, and their
interspecific hybrids from 48 lakes and streams across Florida, and we updated and refined the southernmost
boundary of introgression. Nuclear (allozyme and microsatellite) and mitochondrial (restriction fragment
length polymorphism) markers produced somewhat different results. Microsatellite genotypes alone and the
combination of all nuclear genotypes resolved genetic structure among four regional groups within Florida:
(1) northwest, (2) north-central, (3) central-west, and (4) south, central-east, and northeast. Allozyme
genotypes alone did not resolve well-defined groups. The distribution of mitochondrial haplotypes suggested
that populations from the St. Johns River drainage should be considered their own distinct group (rather than
be included in the south–central-east–northeast Florida group). Although mitochondrial markers failed to
* Corresponding author: [email protected]
1 Present address: Washington Department of Fish and Wildlife, Olympia, Washington 98501, USA.
Received October 4, 2009; accepted March 8, 2010Published online October 11, 2010
1615
Transactions of the American Fisheries Society 139:1615–1641, 2010� Copyright by the American Fisheries Society 2010DOI: 10.1577/T09-185.1
[Article]

detect introgression throughout much of the intergrade zone, nuclear markers revealed an expected decline in
introgression from west to east as well as from north to south. Largemouth bass alleles, however, were
detected at low frequencies in 12 populations below the southern boundary of the accepted intergrade zone,
some of which are the result of stocking. There was no evidence of nonrandom mating or selection against
hybrids in the distribution of nuclear genotypes; however, the rarity of largemouth bass mitochondrial
haplotypes suggests either assortative mating or reduced fitness in the progeny of female largemouth bass 3
male Florida bass crosses.
Animal populations are commonly influenced by
hybridization (Allendorf et al. 2001), and fishes
hybridize more frequently than do any other verte-
brates, in part due to recreational species being
translocated outside of their native ranges and into
contact with closely related species (Campton 1987;
Rhymer and Simberloff 1996). In some cases,
hybridization and introgression can be a driving force
in range expansion and speciation by introducing novel
genotypes that are fit enough to occupy new adaptive
peaks (Dobzhansky 1970; Choler et al. 2004; Grant et
al. 2005). However, when anthropogenic influences
affect the rate and magnitude of this natural phenom-
enon, introgressive hybridization can obscure the
genetic identity of endemic species (Mallet 2005) and
alter endemic biodiversity (Tanaka 2007). This is
particularly true when anthropogenic influences result
in the hybridization of spatially isolated species that
have not fully developed isolating mechanisms due to a
lack of previous reinforcement (Rubidge and Taylor
2004). Hybridization is known to have played a
substantial role in the extinction of a number of fish
species listed under the U.S. Endangered Species Act
(Rhymer and Simberloff 1996), and outbreeding
negatively affects populations that do not go extinct
(Edmands 2007). In addition to the adverse effects on
the populations themselves, decisions concerning
conservation and management become more compli-
cated when significant proportions of individuals are
hybrids (Allendorf et al. 2001).
The black basses Micropterus spp. are among the
most popular freshwater sport fishes in North America
and have been translocated widely for many decades.
Numerous studies have documented hybridization
between endemic and nonindigenous species after
introductions (Edwards 1979; Philipp et al. 1983;
Whitmore 1983; Maciena et al. 1988; Morizot et al.
1991; Dunham et al. 1992; Gilliland 1994; Koppelman
1994; Forshage and Fries 1995; Gelwick et al. 1995;
Pierce and Van Den Avyle 1997; Pipas and Bulow
1998; Barwick et al. 2006), including endemic taxa
designated as ‘‘species of special concern’’ due to
limited ranges or small population sizes (Koppelman
and Garrett 2002). In one example, the persistence of
Guadalupe bass M. treculii in central Texas is currently
threatened not only by habitat degradation but also by
competition and introgression with introduced small-
mouth bass M. dolomieu and spotted bass M.punctulatus (Morizot et al. 1991). Florida bass M.floridanus and largemouth bass M. salmoides coexist in
introgressed populations throughout a hybrid zone that
includes all of the southeastern United States, a number
of the mid-Atlantic coast states, some southwestern
states, and California (Philipp et al. 1983).2 Although
some of the introgressed populations are the result of
natural hybridization that occurred when the two taxa
came into secondary contact, stocking activities have
greatly expanded the hybrid zone (Philipp et al. 1983)
and created a patchwork of introgressed and nonintro-
gressed populations. Florida bass, which are endemic
to peninsular Florida, tend to grow to larger ultimate
sizes than do largemouth bass (Chew 1975) and have
been stocked outside of their native range to enhance
trophy bass production. As a result, nonintrogressed
populations of largemouth bass are primarily restricted
to the midwestern and northeastern United States and
southern parts of Canada, while nonintrogressed
populations of Florida bass are only found in
peninsular Florida (Philipp et al. 1983).
Although many states have been importing Florida
bass for stocking purposes for decades, the Florida Fish
and Wildlife Conservation Commission (FWC) is
presently committed to preserving the genetic integrity
of Florida bass populations within the state. Manage-
ment actions designed to limit hybridization depend on
the FWC having accurate information on the distribu-
tions of the Florida bass, largemouth bass, and hybrid
populations within the state. Using meristic and
morphometric techniques, Bailey and Hubbs (1949)
concluded that largemouth bass populations existed
north and west of the Choctawhatchee and Apalachi-
cola River drainages in northwest Florida, whereas
populations south and east of the Suwannee River
drainage in peninsular Florida (including the St. Johns
River) were exclusively composed of Florida bass; the
region between these areas was bisected by an
2 Editor’s note: Although some authorities (e.g., Kassler etal. 2002; Near et al. 2003) recognize the Florida bass as aseparate species, pending further investigation the AmericanFisheries Society’s Committee on Names of Fishes continuesto recognize it as a subspecies of the largemouth bass with thescientific name M. salmoides floridanus.
1616 BARTHEL ET AL.
intergrade zone (Bailey and Hubbs 1949). Philipp et al.
(1981, 1983) re-evaluated the range of the species and
the intergrade zone using taxon-specific allelic differ-
ences at a number of allozyme loci and found the
southern delineation to be similar to that described by
Bailey and Hubbs (1949). Philipp et al. (1981, 1983),
however, also found that all populations in northwest
Florida were introgressed, suggesting either that
molecular genetic techniques offered greater resolution
than meristics and morphometrics or that there had
been an expansion of the intergrade zone in that
direction during the period since the Bailey and Hubbs
(1949) study. This delineation (Philipp et al. 1983) has
been accepted by fisheries biologists and managers as
the boundary between Florida bass and intergrade
populations in Florida for more than two decades.
The FWC has obtained most of the broodstock for
their main hatchery from the putative range of pure
Florida bass since the early 1980s, but broodfish were
not genetically tested on a routine basis until 1999. In
the first year of genetic testing, the analysis of
broodfish collected from Lake Parker, located 150
km south of the recognized intergrade zone, docu-
mented nonnative largemouth bass alleles in 10% of
the fish tested (W. F. Porak, unpublished data). This
finding was particularly disconcerting because Lake
Parker had been used as a source for hatchery
broodstock over several years before genetic testing;
indeed, hatchery reports indicated that the lake had
been stocked with fish from a hatchery in northern
Florida—one that used intergrade broodstock—during
the 1970s. The Lake Parker example proved that
collecting broodfish south of the recognized intergrade
zone was not sufficient to prevent unintentional
hybridization within nonintrogressed Florida bass
populations and that a new approach was needed to
avoid additional hybridization events in the future.
A number of studies have recently found that both
inter- and intraspecific outbreeding can result in
reduced fitness for largemouth bass and Florida bass.
Philipp and Claussen (1995) and Philipp et al. (2002)
showed that local populations of black bass (both
Florida bass and largemouth bass) had greater growth,
survival, and reproductive success than nonlocal and
introgressed fish when they were raised in pond
environments. Others found that interstock F1
gener-
ations of largemouth bass displayed reduced cardio-
vascular, swimming, and respiratory performance
relative to parental stocks in the Midwest, which was
interpreted as a loss of local adaptation (Cooke et al.
2001; Cooke and Philipp 2005). Goldberg et al. (2005)
proposed that the disruption of coadapted genes
involved in immune function were responsible for F2
juvenile largemouth bass being significantly more
susceptible to largemouth bass virus than the parental
or F1
generation.
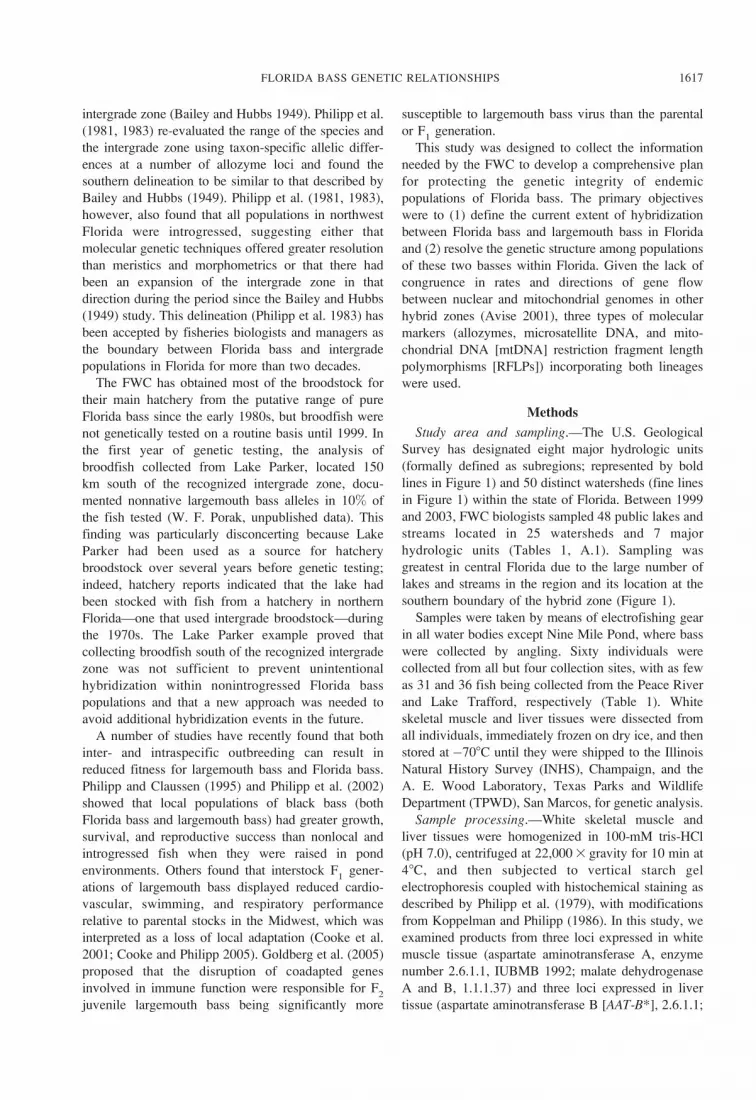
This study was designed to collect the information
needed by the FWC to develop a comprehensive plan
for protecting the genetic integrity of endemic
populations of Florida bass. The primary objectives
were to (1) define the current extent of hybridization
between Florida bass and largemouth bass in Florida
and (2) resolve the genetic structure among populations
of these two basses within Florida. Given the lack of
congruence in rates and directions of gene flow
between nuclear and mitochondrial genomes in other
hybrid zones (Avise 2001), three types of molecular
markers (allozymes, microsatellite DNA, and mito-
chondrial DNA [mtDNA] restriction fragment length
polymorphisms [RFLPs]) incorporating both lineages
were used.
Methods
Study area and sampling.—The U.S. Geological
Survey has designated eight major hydrologic units
(formally defined as subregions; represented by bold
lines in Figure 1) and 50 distinct watersheds (fine lines
in Figure 1) within the state of Florida. Between 1999
and 2003, FWC biologists sampled 48 public lakes and
streams located in 25 watersheds and 7 major
hydrologic units (Tables 1, A.1). Sampling was
greatest in central Florida due to the large number of
lakes and streams in the region and its location at the
southern boundary of the hybrid zone (Figure 1).
Samples were taken by means of electrofishing gear
in all water bodies except Nine Mile Pond, where bass
were collected by angling. Sixty individuals were
collected from all but four collection sites, with as few
as 31 and 36 fish being collected from the Peace River
and Lake Trafford, respectively (Table 1). White
skeletal muscle and liver tissues were dissected from
all individuals, immediately frozen on dry ice, and then
stored at�708C until they were shipped to the Illinois
Natural History Survey (INHS), Champaign, and the
A. E. Wood Laboratory, Texas Parks and Wildlife
Department (TPWD), San Marcos, for genetic analysis.
Sample processing.—White skeletal muscle and
liver tissues were homogenized in 100-mM tris-HCl
(pH 7.0), centrifuged at 22,000 3 gravity for 10 min at
48C, and then subjected to vertical starch gel
electrophoresis coupled with histochemical staining as
described by Philipp et al. (1979), with modifications
from Koppelman and Philipp (1986). In this study, we
examined products from three loci expressed in white
muscle tissue (aspartate aminotransferase A, enzyme
number 2.6.1.1, IUBMB 1992; malate dehydrogenase
A and B, 1.1.1.37) and three loci expressed in liver
tissue (aspartate aminotransferase B [AAT-B*], 2.6.1.1;
FLORIDA BASS GENETIC RELATIONSHIPS 1617

isocitrate dehydrogenase B [IDH-B*], 1.1.1.42; super-
oxide dismutase A [SOD-A*], 1.15.1.1). Both AAT-B*
and IDH-B* have fixed allelic differences between
Florida bass and largemouth bass (Philipp et al. 1981).
We isolated genomic DNA from either (1) a small
amount of muscle tissue (;2–3 mm3) by modifying the
methodology of Miller et al. (1988) and using
ammonium acetate in place of sodium chloride for
salting out cellular proteins or (2) 200 mg of white
skeletal muscle using a technique described by Saghai-
Maroof et al. (1984) and modified by Fields et al.
(1989). Recovered DNA was quantified by spectro-
photometry and adjusted to a concentration of 50 ng/
lL with a low tris–EDTA buffer.
The panel of nuclear markers also included 12
microsatellite loci. Three multiplex polymerase chain
reactions (PCRs) were used to amplify the following
loci: (1) Msa21, Mdo7, Lma12, and Msa29 (designed
from GenBank accession number DQ211538); (2)
Msa13, Mdo6, and Mdo3; and (3) MiSaTPW111,
MiSaTPW112, and MiSaTPW169 (Colbourne et al.
1996; DeWoody et al. 2000; Malloy et al. 2000; Lutz-
Carrillo et al. 2008). Single-locus PCRs were used to
amplify alleles at the loci MiSaTPW60 and MiS-
aTPW70 (Lutz-Carrillo et al. 2008). All PCRs were
carried out in 10-lL volumes on a Mastercycler ep
gradient S thermal cycler (Eppendorf). Reactions
consisted of 50 ng of template DNA, 13 buffer (20-
mM tris-HCl [pH 8.4], 50-mM KCl; Invitrogen), 1.5–
2.5-mM MgCl2
(Invitrogen), 0.2 mM of each deoxy-
nucleotide triphosphate (dNTP), 0.05–0.08 lM of an
unlabeled 5 0-tailed primer, 0.07–0.20 lM of an
unlabeled nontailed primer, 0.2 lM of a 25% labeled
(700 or 800 IRDye; LI-COR) fluorescent tail (M13–29
or CAG sequence), and 0.5 unit of Platinum Taq DNA
polymerase (2.7.7.7; Invitrogen). Cycling conditions
were (1) 948C for 90 s; (2) 29–33 cycles of
denaturation at 948C for 30 s, annealing for 30 s at
FIGURE 1.—Locations of the 48 lakes and streams in Florida sampled for this study; pie charts depict the frequency of
largemouth bass and Florida bass alleles at eight diagnostic loci (6 microsatellites, 2 allozymes) within populations. The thick
lines delineate the major hydrologic units designated by the U.S. Geological Survey, and the thin lines represent watershed
boundaries. Population codes are given in parentheses.
1618 BARTHEL ET AL.

primer-specific temperature, and extension at 728C for
30–60 s; and (3) a final extension at 728C for 10 min.
Amplicons with alternate fluorescent labels were
combined, and 10 lL of stop solution were added for
a final volume of 30 lL before being loaded in 0.25-lL
volumes and resolved on a NEN 4300 DNA sequencer
(LI-COR) alongside LI-COR 50–350 or 50–700 size
standards. Allele sizes were determined with BioNu-
merics version 4.6 (Applied Maths).
Digestions for RFLP analyses were performed on
PCR-amplified segments of the mitochondrial genome
that included two genes (NADH subunits 3 and 4).
Approximately 2,200 base pairs (bp) were amplified
with a light-strand primer (L9386) located in the
transfer RNAGly (tRNAGly) gene (50-GTACACGT-
CACTTCCAATCA-30; Park et al. 1993) and a heavy-
strand primer (H11540) located in the tRNAHis gene
(5 0-AGAATCACAATCTAATGTTT-3 0; Park et al.
1993). All PCRs were carried out in 50-lL volumes
on an MJ Research PTC-100–60 thermocycler. Reac-
tions consisted of approximately 25 ng of template
DNA, 103 buffer, 2.5-mM MgCl2, 100 lM of each
dNTP, 0.08-pmol/lL concentrations of the light- and
heavy-strand primers, and 15 units of Taq polymerase
(Applied Biosystems). Cycling conditions were (1)
958C for 2 min; (2) 29 cycles at 948C for 45 s and 458C
for 1 min; (3) a final extension step at 708C for 4 min;
and (4) a final holding step at 48C. Subsamples (8 lL)
of each amplicon were digested with one of six
restriction endonucleases (Dde I, Dpn II, Hae III, HhaI, Msp I, and Rsa I; New England Biolabs) following
the manufacturer’s recommendations. Digests were
separated electrophoretically on 2.0% agarose and
1.0% Synergel (Diversified Biotech) gels in tris–
acetate–EDTA buffer (0.04-M tris-HCl, 5.7% glacial
acetic acid, and 1-mM EDTA [pH 8.0]) with a 0.5-lg/
mL concentration of ethidium bromide to visualize
banding patterns under ultraviolet light. A 100-bp
DNA ladder (0.5 lg/lane) was used as a standard for
fragment size determination.
Genetic variation.—For the nuclear markers, allele
frequencies, mean number of alleles observed per
locus, and observed and expected heterozygosities
based on allozyme and microsatellite genotypes were
calculated with GENETIX version 4.0 (Belkhir et al.
2000). Tests of conformation to Hardy–Weinberg
equilibrium (HWE), linkage equilibrium, and differen-
tiation for each population pair were performed with
exact tests in ARLEQUIN version 3.1 (10,000
Markov-chain permutations; Excoffier et al. 2005),
and significance was evaluated with sequential Bon-
ferroni corrections for multiple tests (Rice 1989). For
mitochondrial markers, comparisons of haplotype
distributions for each population pair were conducted
with Fisher’s exact tests (Raymond and Rousset 1995)
in ARLEQUIN (10,000 Markov-chain permutations;
Excoffier et al. 2005).
Introgression.—Values of the hybrid index, defined
as the proportion of Florida bass alleles detected at
diagnostic loci for each individual, were calculated
with the allozyme loci AAT-B* and IDH-B* and the
microsatellite loci Mdo6, Msa21, Msa29, MiS-aTPW112, MiSaTPW111, and MiSaTPW169. Mean
hybrid index values were calculated for each popula-
tion and represent the probability that a randomly
selected allele was derived from a Florida bass
ancestor.
Genetic structure.—Estimates of nuclear genetic
structure were performed with the Bayesian model
implemented in STRUCTURE version 2.2 (Pritchard et
al. 2000; Falush et al. 2003). This model attempts to
partition multilocus genotypes into an optimal number
of groups whose composition minimizes Hardy–
Weinberg and linkage disequilibrium. Simultaneously,
genotypes are assigned to each resolved group with an
associated membership coefficient (q). An admixture
model with independent allele frequencies and non-
informative priors was used as suggested by Pritchard
et al. (2007) to minimize the chances of overestimating
the number of groups. The ad hoc statistic DK was used
in conjunction with the distribution of likelihood and avalues (i.e., admixture among resolved groups) to
evaluate each solution as suggested by Evanno et al.
(2005). After preliminary experimental runs were
conducted, 10 independent replicates of the number
of genetic clusters (K) from 1 to 10 were performed
with 104 burn-in steps and 105 Markov-chain Monte
Carlo iterations. Runs were performed with multilocus
microsatellite genotypes (9 loci) from 47 populations
(Lake Jackson was not included in analyses because
there were insufficient tissue samples to conduct
microsatellite genotyping; N ¼ 1,410), multilocus
allozyme genotypes (6 loci) from 48 populations (N¼ 2,856), and a combination of the two (15 loci) for 47
populations (N ¼ 1,410). Genotypes composing each
resolved cluster at the optimal K were then re-evaluated
under independent STRUCTURE runs as suggested for
data sets containing genotypes from contact zones
(Evanno et al. 2005). Values of q were averaged over
all 10 runs for individual fish and then over populations
to allow the assignment of populations to groups.
Genetic relationships were further explored as
genetic distances between populations. A consensus
neighbor-joining dendrogram based on 1,000 bootstrap
data sets and Cavalli-Sforza and Edwards (1967)
genetic distances based on the combined nuclear data
set were produced with PHYLIP version 3.6 (Felsen-
stein 1989) and visualized with TreeView version 1.6
FLORIDA BASS GENETIC RELATIONSHIPS 1619

(Page 1996). A similar approach was used to create a
consensus tree from the mtDNA RFLP data set; the
primary differences were that (1) pairwise genetic
differentiation index (FST
) values (ARLEQUIN; Ex-
coffier et al. 2005) were used in the place of Cavalli-
Sforza and Edwards (1967) chord distances and (2) 300
rather than 1,000 bootstraps were employed. A
haplotype network constructed by median-joining
methods (Fluxus Network version 4.5; Bandelt et al.
1999) was used to explore genetic structure based on
the mitochondrial data alone.
Analyses of molecular variance and isolation by
TABLE 1.—Sample sizes and genetic diversity parameters of the Florida bass, largemouth bass, and intergrade populations
sampled in Florida. Sample size (N), average number of alleles per locus (Na), observed heterozygosity (H
O), expected
heterozygosity (HE), inbreeding coefficient (F
IS), the proportion of individuals with hybrid genotypes (Prop. hybrid), and the
mean hybrid index (Hyb. index) for the allozyme and microsatellite loci are shown for each population. Sample size (N), number
of different haplotypes observed (Hapl.), total number of polymorphic sites (Poly. sites), and gene diversity (6SD) for
mitochondrial DNA (mtDNA) restriction fragment length polymorphism (RFLP) analyses are also presented.
Collection (code) Total (N)
Allozyme analysis
N Na
HO
HE
FIS
Prop.hybrid Hyb. index
1. Nine Mile Pond (Nine) 60 60 1.50 0.181 0.185 0.031 0.000 1.0002. Tamiami Canal (Tami) 59 59 1.40 0.210 0.196 �0.065 0.000 1.0003. Conservation Area 3 (Con3) 60 60 1.50 0.208 0.203 �0.019 0.000 1.0004. Lake Trafford (Traf) 36 36 1.67 0.259 0.203 �0.263 0.028 0.9935. Lake Okeechobee (Okee) 60 60 1.50 0.192 0.177 �0.071 0.000 1.0006. Lake Istokpoga (Isto) 60 60 1.50 0.114 0.136 0.173 0.000 1.0007. Lake Weohyakapka (Weoh) 60 60 1.67 0.194 0.178 �0.084 0.000 1.0008. East Lake Tohopekaliga (Toho) 60 60 1.67 0.208 0.188 �0.102 0.000 1.0009. Lake Down (Down) 60 60 1.50 0.147 0.156 0.065 0.000 1.000
10. Conway Chain (Conw) 60 60 1.50 0.167 0.155 �0.066 0.000 1.00011. Peace River (Peac) 31 31 1.50 0.214 0.185 �0.150 0.000 1.00012. Medard Reservoir (Meda) 59 59 1.50 0.113 0.141 0.207 0.000 1.00013. Hillsborough River (Hill) 60 60 1.50 0.206 0.207 0.017 0.000 1.00014. Lake Tarpon (Tarp) 60 60 1.50 0.169 0.173 0.027 0.000 1.00015. Lake Parker (Park) 60 60 1.83 0.161 0.171 0.068 0.033 0.98316. Lake Shipp (Ship) 60 60 1.50 0.133 0.142 0.068 0.000 1.00017. Homosassa River (Homo) 60 60 2.00 0.236 0.250 0.062 0.067 0.96318. Lake Tsala Apopka (Tsal) 60 60 1.67 0.231 0.211 �0.085 0.000 1.00019. Lake Panasoffkee (Pana) 60 60 1.83 0.211 0.215 0.026 0.067 0.99220. Lake Weir (Weir) 60 60 1.50 0.222 0.191 �0.158 0.000 1.00021. Lake Minneola (Minn) 60 60 1.50 0.242 0.222 �0.083 0.000 1.00022. Lake Harris (Harr) 60 60 1.83 0.097 0.097 0.008 0.033 0.99223. Lake Dora (Dora) 60 60 1.50 0.094 0.112 0.166 0.000 1.00024. Lake Lawne (Lawn) 60 60 1.67 0.219 0.192 �0.132 0.050 0.98825. Farm 13 Reservoir (Farm) 60 60 1.67 0.183 0.176 �0.035 0.017 0.99626. Lake Washington (Wash) 60 60 1.50 0.189 0.183 �0.022 0.000 1.00027. Lake Monroe (Monr) 60 60 1.67 0.175 0.183 0.051 0.000 1.00028. Lake Norris (Norr) 60 60 1.33 0.125 0.114 �0.084 0.000 1.00029. Lake George (Geor) 60 60 1.67 0.200 0.178 �0.116 0.017 0.99630. Lake Kerr (Kerr) 60 60 1.67 0.156 0.146 �0.055 0.283 0.92131. Lochloosa Lake (Loch) 60 60 1.67 0.119 0.121 0.020 0.050 0.98832. Rodman Reservoir (Rodm) 60 60 1.67 0.189 0.182 �0.028 0.000 1.00033. Kingsley Lake (King) 60 60 1.50 0.150 0.157 0.050 0.000 1.00034. St. Johns River (StJo) 60 60 1.67 0.269 0.259 �0.032 0.017 0.89235. Ocean Pond (Ocea) 60 60 1.67 0.172 0.172 0.009 0.517 0.99636. Lake Santa Fe (Sant) 60 60 2.00 0.231 0.220 �0.039 0.367 0.85037. Lake Sampson (Samp) 60 60 1.83 0.192 0.195 0.023 0.250 0.93238. Waccasassa River (Wacc) 60 60 2.00 0.183 0.177 �0.029 0.050 0.98839. Suwannee River (Suwa) 60 60 1.67 0.183 0.168 �0.081 0.100 0.97540. Steinhatchee River (Stei) 60 60 1.67 0.169 0.173 0.027 0.083 0.97941. Cherry Lake (Cher) 60 60 1.67 0.150 0.154 0.032 0.017 0.99242. Aucilla River (Auci) 60 60 1.83 0.134 0.186 0.292 0.194 0.92743. Lake Jackson (Jack) 60 60 2.00 0.197 0.172 �0.140 0.383 0.89444. Lake Talquin (Talq) 60 60 2.00 0.257 0.252 �0.010 0.883 0.64245. Lake Seminole (Semi) 60 60 2.00 0.286 0.289 0.019 0.867 0.58846. Lower Apalachicola River (Apal) 60 60 2.00 0.292 0.277 �0.044 0.933 0.51347. Choctawhatchee River (Choc) 60 60 2.33 0.217 0.228 0.056 0.900 0.39648. Escambia River (Esca) 60 60 2.00 0.144 0.120 �0.197 0.600 0.179
a Samples from Lake Jackson were not included in the microsatellite analysis.
1620 BARTHEL ET AL.

distance.—The significance of genetic structure ob-
served among the regional groups resolved by the
STRUCTURE analyses was determined by analyses of
molecular variance (AMOVAs). Analyses of the
allozyme, microsatellite, and mtDNA data sets with
ARLEQUIN (10,000 Markov-chain permutations; Ex-
coffier et al. 2005) were performed independently.
Mantel tests were used to evaluate the strength and
significance of correlations between pairwise FST
values and the geographic distances between collection
sites (10,000 Markov-chain permutations) at two
scales: (1) among populations sampled across the state
and (2) among populations within the resolved regional
groups.
TABLE 1.—Extended.
Collection (code)
Microsatellite analysis mtDNA RFLP analysis
N Na
HO
HE
FIS
Prop.hybrid
Hyb.index N Hapl.
Poly.sites Gene diversity
1. Nine Mile Pond (Nine) 29 7.22 0.471 0.496 0.070 0.000 1.000 20 3 8 0.195 6 0.11452. Tamiami Canal (Tami) 30 7.22 0.506 0.530 0.064 0.000 1.000 22 3 9 0.325 6 0.11733. Conservation Area 3 (Con3) 30 6.67 0.489 0.506 0.051 0.000 1.000 21 3 6 0.186 6 0.11024. Lake Trafford (Traf) 30 7.00 0.489 0.487 0.013 0.000 1.000 21 3 6 0.657 6 0.05725. Lake Okeechobee (Okee) 30 6.78 0.493 0.510 0.051 0.000 1.000 20 4 9 0.284 6 0.12846. Lake Istokpoga (Isto) 30 6.78 0.521 0.510 0.129 0.000 1.000 20 3 9 0.279 6 0.12357. Lake Weohyakapka (Weoh) 30 5.89 0.456 0.475 0.062 0.000 1.000 21 3 4 0.186 6 0.11028. East Lake Tohopekaliga (Toho) 30 6.33 0.495 0.489 0.006 0.000 1.000 20 2 5 0.100 6 0.08809. Lake Down (Down) 30 4.44 0.417 0.453 0.098 0.000 1.000 20 4 7 0.616 6 0.0671
10. Conway Chain (Conw) 30 5.00 0.386 0.425 0.112 0.000 1.000 20 2 5 0.395 6 0.100611. Peace River (Peac) 30 6.44 0.430 0.467 0.097 0.000 1.000 20 2 1 0.395 6 0.100612. Medard Reservoir (Meda) 30 5.67 0.485 0.530 0.105 0.000 1.000 21 3 2 0.667 6 0.049813. Hillsborough River (Hill) 30 4.78 0.360 0.398 0.116 0.000 1.000 20 3 3 0.626 6 0.078714. Lake Tarpon (Tarp) 30 7.78 0.485 0.500 0.049 0.000 1.000 22 5 8 0.649 6 0.064515. Lake Parker (Park) 30 8.00 0.505 0.535 0.073 0.000 1.000 21 6 9 0.752 6 0.061016. Lake Shipp (Ship) 30 7.33 0.502 0.520 0.053 0.000 1.000 20 3 2 0.542 6 0.104617. Homosassa River (Homo) 30 5.89 0.399 0.437 0.110 0.000 1.000 20 4 5 0.626 6 0.083918. Lake Tsala Apopka (Tsal) 30 7.44 0.495 0.515 0.057 0.000 1.000 20 3 2 0.532 6 0.100419. Lake Panasoffkee (Pana) 30 8.33 0.475 0.499 0.064 0.000 1.000 20 4 4 0.742 6 0.050620. Lake Weir (Weir) 30 6.00 0.490 0.509 0.055 0.000 1.000 20 3 6 0.353 6 0.122721. Lake Minneola (Minn) 30 5.56 0.493 0.466 �0.041 0.000 1.000 20 4 4 0.600 6 0.077122. Lake Harris (Harr) 30 7.00 0.551 0.557 0.029 0.000 1.000 20 2 4 0.190 6 0.108123. Lake Dora (Dora) 30 6.78 0.505 0.492 �0.006 0.000 1.000 20 3 2 0.484 6 0.112924. Lake Lawne (Lawn) 30 6.44 0.473 0.532 0.129 0.033 0.995 20 3 2 0.484 6 0.112925. Farm 13 Reservoir (Farm) 30 7.11 0.471 0.510 0.094 0.000 1.000 20 4 6 0.595 6 0.097726. Lake Washington (Wash) 30 7.22 0.483 0.536 0.116 0.000 1.000 20 4 7 0.721 6 0.065327. Lake Monroe (Monr) 30 6.89 0.485 0.503 0.057 0.033 0.996 20 4 7 0.684 6 0.063628. Lake Norris (Norr) 30 6.00 0.420 0.452 0.091 0.000 1.000 20 3 6 0.616 6 0.077029. Lake George (Geor) 30 8.67 0.516 0.537 0.056 0.067 0.993 24 6 7 0.703 6 0.062330. Lake Kerr (Kerr) 30 6.33 0.536 0.527 0.000 0.067 0.993 20 3 2 0.416 6 0.115731. Lochloosa Lake (Loch) 30 6.67 0.479 0.522 0.100 0.233 0.973 20 3 6 0.195 6 0.114532. Rodman Reservoir (Rodm) 30 8.00 0.498 0.536 0.089 0.033 0.997 20 9 7 0.895 6 0.039633. Kingsley Lake (King) 30 5.11 0.503 0.467 �0.058 0.000 1.000 20 4 5 0.705 6 0.061234. St. Johns River (StJo) 30 7.44 0.514 0.517 0.022 0.100 0.996 20 4 6 0.690 6 0.066435. Ocean Pond (Ocea) 30 7.67 0.526 0.520 0.007 0.467 0.988 20 2 1 0.190 6 0.108136. Lake Santa Fe (Sant) 30 4.89 0.426 0.442 0.054 0.033 0.943 24 5 6 0.638 6 0.060637. Lake Sampson (Samp) 30 7.11 0.462 0.494 0.081 0.133 0.982 20 4 6 0.700 6 0.061938. Waccasassa River (Wacc) 30 6.67 0.361 0.438 0.196 0.200 0.967 21 4 5 0.271 6 0.124239. Suwannee River (Suwa) 30 7.56 0.394 0.460 0.162 0.400 0.950 20 5 5 0.811 6 0.036540. Steinhatchee River (Stei) 30 4.56 0.428 0.512 0.183 0.600 0.900 20 4 13 0.600 6 0.077141. Cherry Lake (Cher) 30 5.11 0.444 0.458 0.048 0.233 0.976 20 2 3 0.100 6 0.088042. Aucilla River (Auci) 30 6.78 0.530 0.554 0.062 0.500 0.927 22 4 6 0.671 6 0.060543. Lake Jackson (Jack) 0 a 22 4 4 0.463 6 0.119944. Lake Talquin (Talq) 29 7.78 0.527 0.521 0.006 0.500 0.932 6 3 2 0.733 6 0.155245. Lake Seminole (Semi) 30 7.89 0.626 0.634 0.031 0.964 0.736 20 3 12 0.195 6 0.114546. Lower Apalachicola River (Apal) 30 6.56 0.590 0.599 0.035 0.967 0.713 20 2 1 0.100 6 0.088047. Choctawhatchee River (Choc) 30 8.89 0.655 0.689 0.066 1.000 0.581 23 1 0 0.000 6 0.000048. Escambia River (Esca) 30 7.33 0.476 0.531 0.122 0.633 0.109 20 3 11 0.353 6 0.1227
FLORIDA BASS GENETIC RELATIONSHIPS 1621

ResultsGenetic Variation
The number of alleles observed at allozyme loci
ranged from 2 to 4 alleles/locus over all samples and
from 1.33 to 2.33 alleles/locus within populations
(mean ¼ 1.69 alleles/locus; SD ¼ 0.21; Table 1). A
single population deviated from HWE at a single locus
after sequential Bonferroni correction (Lake Istokpoga,
SOD-A*: P ¼ 0.0001; Table A.2), and linkage
disequilibrium was not detected in any population.
Allele frequencies were significantly different in 72%of comparisons between pairs of populations.
The number of alleles observed at microsatellite loci
ranged from 6 to 108 alleles/locus over all samples and
from 4.44 to 8.89 alleles/locus within populations
(mean ¼ 6.70 alleles/locus; SD ¼ 1.07; Table 1). Four
populations significantly deviated from HWE at a
single locus after sequential Bonferroni correction
(Waccasassa River, Msa21: P , 0.001; Steinhatchee
River, MiSaTPW60: P , 0.001; Lake Tsala Apopka,
MiSaTPW70: P , 0.001; Choctawhatchee River,
MiSaTPW70: P , 0.001; Table A.2); no linkage
disequilibrium was detected. Allele frequencies among
populations were significantly different in 92% of
pairwise comparisons.
Analyses of mtDNA RFLPs identified 21 polymor-
phic sites distributed among 25 haplotypes. The
number of haplotypes per population ranged from 1
to 9 (mean ¼ 3.5 haplotypes/population; SD ¼ 1.3;
Table 1), which corresponded to 0–13 polymorphic
sites/collection (mean ¼ 5.3 polymorphic sites/collec-
tion; SD ¼ 2.9; Table 1). Haplotype frequencies
FIGURE 2.—Hybrid index frequency histogram for Florida bass 3 largemouth bass intergrade populations with three or more
hybrid index levels. Estimates of introgression are based on eight diagnostic loci (6 microsatellites, 2 allozymes). The values
range from 0.0 (individuals with all largemouth bass alleles) to 1.0 (individuals with all Florida bass alleles) via one-allele
increments.
1622 BARTHEL ET AL.

differed between populations in 45% of the pairwise
comparisons.
Introgression
The proportion of individuals with hybrid genotypes
in single populations ranged from 0.0 (all Florida bass)
to 1.0 (Table 1). At the six diagnostic microsatellite
loci, the proportion of largemouth bass alleles ranged
from 0.003 to 0.856 (mean¼ 0.12; SD¼ 0.210) in the
introgressed populations, and the number of overall
alleles per locus was significantly greater in intro-
gressed populations (mean ¼ 7.02 alleles/locus; SD ¼1.08) than in populations of Florida bass (mean¼ 6.31
alleles/locus; SD¼0.95; t-test: t¼�2.381, df¼45, P¼0.0215). At the two diagnostic allozyme loci, the
proportion of largemouth bass alleles ranged from
0.004 to 0.820 (mean ¼ 0.14; SD ¼ 0.220) in
introgressed populations, and the number of overall
alleles per locus was significantly greater in intro-
gressed populations (mean ¼ 1.82 alleles/locus; SD ¼0.180) than in populations of Florida bass (mean¼1.51
alleles/locus; SD¼ 0.08; t-test: t¼�7.482, df¼ 46, P, 0.0001). Mean hybrid index values ranged from
0.109 (indicating a substantial contribution of large-
mouth bass alleles) to 1.000 (indicating that all alleles
were of Florida bass descent; Table 1) for the six
diagnostic microsatellite loci and from 0.179 to 1.000
for the allozyme loci (Table 1). The frequency of
largemouth bass alleles decreased in populations from
west to east and from north to south in both the
microsatellite and allozyme data sets (Figure 1). Six
populations below the southern boundary of the
recognized intergrade zone had largemouth bass alleles
in low frequency at the microsatellite loci (Lake
Lawne, Lake Monroe, Lake George, Lake Kerr,
Rodman Reservoir, and St. Johns River; Table 1),
and 10 populations south of the intergrade zone had
largemouth bass alleles at low frequencies at the two
diagnostic allozyme loci (Lake Trafford, Lake Parker,
Homosassa River, Lake Panasoffkee, Lake Harris,
Lake Lawne, Farm 13 Reservoir, Lake George, Lake
Kerr, and St. Johns River; Table 1). The hybrid index
plots (based on the two diagnostic allozyme loci and
six diagnostic microsatellite loci) were unimodal
(Figure 2). Largemouth bass mtDNA RFLP haplotypes
were resolved for only five fish, most of which were
from the westernmost collection (Escambia River) and
none of which were from populations south of the
intergrade zone (Figure 1). Introgressed and pure
Florida bass collections (defined by nuclear markers)
did not differ in either the number of mtDNA
haplotypes (introgressed mean ¼ 3.74, SD ¼ 1.58;
Florida bass mean¼3.19, SD¼0.75; t-test: t¼�1.467,
df ¼ 46, P ¼ 0.1491) or the number of polymorphic
sites (introgressed mean ¼ 5.41, SD ¼ 3.23; Florida
bass mean ¼ 5.24, SD ¼ 2.59; t-test: t ¼�0.196, df ¼46, P¼ 0.8453).
Genetic Structure
Bayesian analyses using STRUCTURE indicated the
presence of genetic structure based on all three marker
data sets (microsatellites, allozymes, and combined).
Results from the combined data set are presented here.
Likelihood values increased substantially from a K-
value of 1 (mean ¼�41,789.9; SD ¼ 0.765) to a K-
value of 4 (mean ¼ �38,017.7; SD ¼ 24.825) and
plateaued or declined thereafter (Figure 3a). Values of
a (admixture) were minimized at a K of 3 (Figure 3a),
and the profile of DK produced a strong peak at a K-
value of 2 followed by a weaker peak at a K-value of 4
(Figure 3d). Given the presence of a contact zone in
this data set and the possible hierarchical structure, we
evaluated each of the groups defined at a K-value of 2
(individuals assigned by majority q-value to each
group) with independent STRUCTURE runs. Group 1
(consisting of genotypes from southern and eastern
Florida) produced likelihood values that plateaued after
a K-value of 3 and showed a weak optimal peak of DKat a K of 2 (Figure 3b, e). Group 2 (consisting of
genotypes from northern and northwestern Florida)
produced likelihood values that plateaued after a K of 4
and showed a strong optimal DK peak at a K of 2
(Figure 3c, f). Overall, the four resolved groups
produced clusters in (1) south, central-east, and
northeast; (2) central-west; (3) north-central; and (4)
northwest Florida (Figure 4); groups 1 and 2 and
groups 3 and 4 were initially resolved together at a
K of 2.
Individuals were assigned to each of the four
resolved groups in two ways. First, all genotypes were
partitioned at a K-value of 2 (based on majority q-
values) and then partitioned again based on subsequent
runs at a K of 2 within each group. Second, all
genotypes were partitioned at a K of 4 (based on
plurality q-values). Under each scenario, to ease
visualization of the data in a geographic context, qwas averaged within populations and the populations
(rather than individuals) were assigned to groups with
an associated probability (Figure 4). Results were
highly similar using both methods, and we present the
results from the latter method here. The strength of
each group (i.e., mean q-value among all constituents
within a group) ranged from 0.67 (SD ¼ 0.117) in
group 1 to 0.87 (SD ¼ 0.104) in group 4 (group 2:
mean q ¼ 0.68, SD ¼ 0.190; group 3: mean q ¼ 0.77,
SD ¼ 0.170).
Relationships observed in the dendrogram created
from the pairwise genetic distances observed in the
FLORIDA BASS GENETIC RELATIONSHIPS 1623

nuclear data set were highly concordant with the
STRUCTURE results (Figure 5a). The populations that
STRUCTURE assigned to the northwest group formed
a distinct cluster in the dendrogram, with the exception
that Lake Talquin, a reservoir that is known to have
been stocked in the past, was included in the grouping
rather than occurring with the collections from the
north-central group. Six of the seven populations from
FIGURE 3.—Likelihood (logeP[D]; mean 6 SD), admixture coefficient (a; mean 6 SD), and number of clusters (K) for
STRUCTURE runs using (a) all Florida bass and largemouth bass genotypes; (b) genotypes from group 1 (southern and eastern
Florida); and (c) genotypes from group 2 (northern and northwestern Florida). P(D) is the probability of the data under each
clustering solution (K). The K-values plotted in relation to DK are shown for (d) all genotypes, (e) group 1 genotypes, and (f)group 2 genotypes. All genotypes were composed of 15 nuclear markers (9 microsatellites, 6 allozymes), and all runs were
performed for K-values of 1–10, with 10 independent replicates.
1624 BARTHEL ET AL.
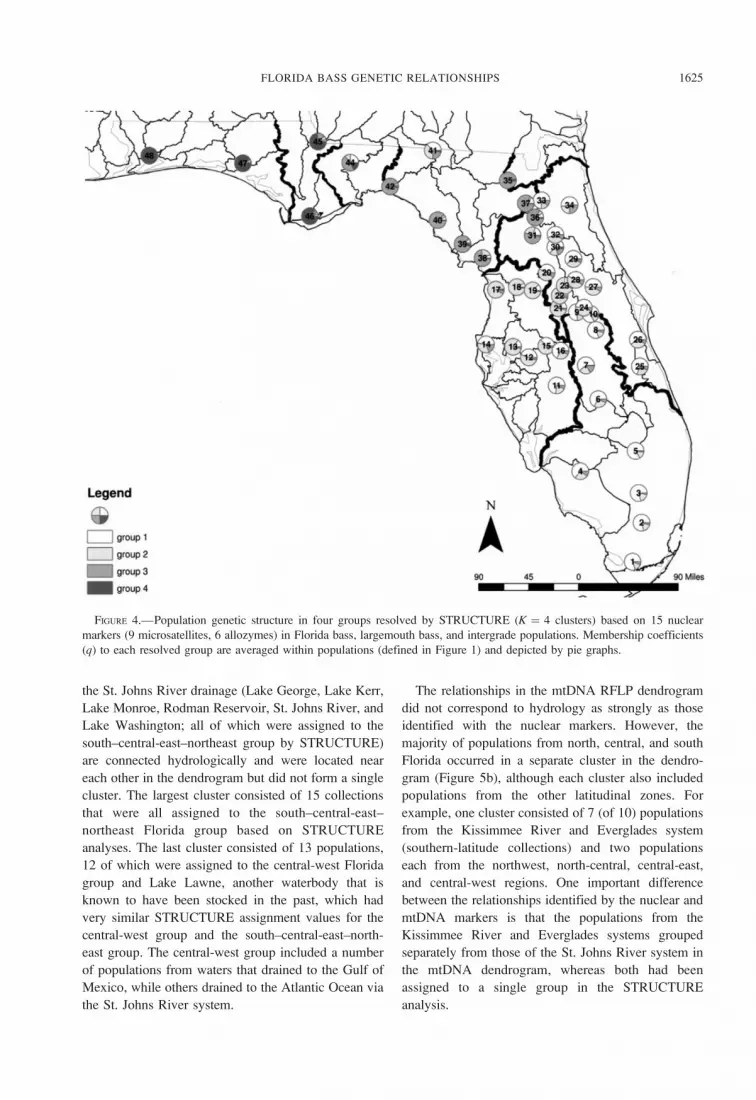
the St. Johns River drainage (Lake George, Lake Kerr,
Lake Monroe, Rodman Reservoir, St. Johns River, and
Lake Washington; all of which were assigned to the
south–central-east–northeast group by STRUCTURE)
are connected hydrologically and were located near
each other in the dendrogram but did not form a single
cluster. The largest cluster consisted of 15 collections
that were all assigned to the south–central-east–
northeast Florida group based on STRUCTURE
analyses. The last cluster consisted of 13 populations,
12 of which were assigned to the central-west Florida
group and Lake Lawne, another waterbody that is
known to have been stocked in the past, which had
very similar STRUCTURE assignment values for the
central-west group and the south–central-east–north-
east group. The central-west group included a number
of populations from waters that drained to the Gulf of
Mexico, while others drained to the Atlantic Ocean via
the St. Johns River system.
The relationships in the mtDNA RFLP dendrogram
did not correspond to hydrology as strongly as those
identified with the nuclear markers. However, the
majority of populations from north, central, and south
Florida occurred in a separate cluster in the dendro-
gram (Figure 5b), although each cluster also included
populations from the other latitudinal zones. For
example, one cluster consisted of 7 (of 10) populations
from the Kissimmee River and Everglades system
(southern-latitude collections) and two populations
each from the northwest, north-central, central-east,
and central-west regions. One important difference
between the relationships identified by the nuclear and
mtDNA markers is that the populations from the
Kissimmee River and Everglades systems grouped
separately from those of the St. Johns River system in
the mtDNA dendrogram, whereas both had been
assigned to a single group in the STRUCTURE
analysis.
FIGURE 4.—Population genetic structure in four groups resolved by STRUCTURE (K ¼ 4 clusters) based on 15 nuclear
markers (9 microsatellites, 6 allozymes) in Florida bass, largemouth bass, and intergrade populations. Membership coefficients
(q) to each resolved group are averaged within populations (defined in Figure 1) and depicted by pie graphs.
FLORIDA BASS GENETIC RELATIONSHIPS 1625

The relationships among haplotypes (based on
shared restriction sites) were depicted in a network
diagram (Figure 6). The six most abundant haplotypes
were found in 91% of individuals; 10 haplotypes were
only observed in one individual each. The most
frequent haplotype (haplotype 1 in Figure 6; present
in 447 of 971 samples) was ubiquitously distributed
throughout the region, although it was lowest in
frequency throughout central Florida and highest in
frequency in southern and northwestern Florida (Figure
6). The second most frequent haplotype (haplotype 2;
present in 219 of 971 samples) differed from haplotype
1 at a single character; haplotype 2 was absent or low
in frequency in southern and northwestern Florida but
FIGURE 5.—Genetic relationships of Florida bass, largemouth bass, and hybrid collections (population codes are defined in
Figure 1) based on (a) Cavalli-Sforza and Edwards (1967) chord distances calculated from the nuclear data set and (b) pairwise
genetic differentiation index (FST
) values calculated from the mitochondrial DNA (mtDNA) restriction fragment length
polymorphism data set. The percentages of bootstrap support are presented for nodes with greater than 50% support (nuclear and
mtDNA dendrograms were based on 1,000 and 300 bootstraps, respectively). The assigned cluster (i.e., groups 1–4) for each
collection based on the optimal solution to the STRUCTURE analysis of the combined nuclear data set is given in parentheses.
1626 BARTHEL ET AL.

was abundant in central Florida along an east–west
transect. Additional haplotypes were found to be
present or abundant over relatively small geographic
regions. For instance, haplotype 3 was concentrated in
north-central Florida, haplotype 7 occurred only
between the Suwannee and Homosassa rivers on the
west coast, and haplotype 13 occurred only near or
within the Everglades system (Table A.3). Haplotype
12, the sole largemouth bass haplotype resolved,
occurred in five samples from collections in northwest
Florida. It was also the most divergent haplotype in the
network, differing by a minimum of eight characters
from the remaining haplotypes.
Analyses of Molecular Variance and Isolation by
Distance
The AMOVAs were used to partition genetic
variation under the geographic group delineation
identified by the STRUCTURE analyses. Separate
AMOVAs were conducted for each of the three data
FIGURE 5.—Continued.
FLORIDA BASS GENETIC RELATIONSHIPS 1627

sets (microsatellites, allozymes, and mtDNA RFLPs).
The group delineation partitioned significant portions
of the total genetic variation among groups for all three
data sets (allozyme AMOVA: FCT
[the genetic
variance among groups relative to the total variance]
¼ 0.11, P , 0.001; microsatellite AMOVA: FCT¼
0.07, P , 0.001; mtDNA AMOVA: FCT¼ 0.10, P ,
0.001; Table 2).
Mantel tests identified significant correlations be-
tween genetic and geographic distances across the state
in the allozyme and microsatellite data sets (allozymes:
r¼ 0.3589, P¼ 0.0009; microsatellites: r¼ 0.5832, P
, 0.0001; Table 3) but not in the mtDNA data set (r¼�0.0219, P ¼ 0.5670; Table 3). The microsatellite
markers identified isolation by distance (IBD) within
the central-west group (r¼ 0.6559, P¼0.0299) and the
south–central-east group (r ¼ 0.3542, P ¼ 0.0039).
Significant IBD was not detected within any of the
groups in analyses conducted on the allozyme data set
(Table 3). Analyses of the mtDNA data set identified
IBD within the north-central group (r ¼ 0.3128, P ¼0.0487) and central-west group (r ¼ 0.8876, P ¼0.0082).
Discussion
This study represents the most extensive evaluation
of the genetic relationships among populations of
Florida bass and Florida bass 3 largemouth bass
hybrids within Florida. The detection of largemouth
bass alleles in 12 populations south of the intergrade
zone described by Philipp et al. (1983) could be due to
improved resolution (i.e., more populations sampled,
greater sample sizes per population, and more
diagnostic loci) or to additional hybridization that
might have occurred since the Philipp et al. (1983)
evaluation. Of the 12 hybrid collections located south
FIGURE 6.—Median-joining haplotype network based on mitochondrial DNA restriction fragment length polymorphisms in
971 samples collected from Florida bass, largemouth bass, and intergrade populations. Open nodes are observed haplotypes (H)
sized according to frequency. Closed nodes are inferred haplotypes. Linked nodes represent a single character change, with hatch
marks for each additional change. Selected nodes are labeled with diagrams illustrating their geographic distribution and
intrapopulation frequency (frequency shading: black ¼ 1.0, white¼ 0.0). The only largemouth bass haplotype is H12.
1628 BARTHEL ET AL.

of the intergrade zone, 10 had mean hybrid index
values greater than 0.980, indicating a low frequency of
largemouth bass alleles, which would have had a lower
probability of being detected under the sampling design
of Philipp et al. (1983). Four of the 12 populations (i.e.,
Farm 13 Reservoir, Lake Lawne, Lake Parker, and
Lake Trafford) were located more than 100 km south of
the intergrade zone boundary, which suggests that
stocking is more likely than natural gene flow to be
responsible for the presence of largemouth bass genes.
All four of these populations were in previously
stocked waters, and hatchery reports indicate that
largemouth bass alleles were translocated into Lake
Parker in the 1970s. The other eight hybrid populations
were located closer to the recognized boundary of the
intergrade zone, making natural gene flow a more
plausible explanation. Five of seven collections from
the St. Johns River drainage (i.e., Lake Monroe, Lake
George, Lake Kerr, Rodman Reservoir, and St. Johns
River) were found to be intergrades in this study,
whereas previous studies had not detected largemouth
bass alleles in the St. Johns River system. Largemouth
bass alleles were also detected at low frequencies in
bass sampled from Lake Harris (in the Ocklawaha
River system, central Florida) but not in those sampled
from Lake Dora, which is physically connected to Lake
Harris through a series of canals in the Harris Chain of
Lakes, or among fish sampled in Lake Minneola or
Lake Weir, which are also part of the Ocklawaha River
drainage. The collection from Lake Panasoffkee
contained largemouth bass alleles, whereas those from
nearby Lake Tsala Apopka did not, even though both
lakes are part of the Withlacoochee River system.
Ultimately, the generally low levels of introgression
and the lack of detailed stocking records mean it is not
possible to determine whether the detection of
largemouth bass alleles is the result of stocking or the
improved genetic resolution of the current study,
except for rare cases, such as Lake Parker. Even so,
this study represents a significant update of the hybrid
zone description: from this point forward, (1) the St.
Johns River drainage should be considered an
TABLE 2.—Genetic variation captured by four groups identified in the STRUCTURE analysis of genetic relationships among
Florida bass, largemouth bass, and intergrade populations. The percentage of the genetic variation that was partitioned among
defined groups, among bass populations (pops) within defined groups, and within bass populations by an analysis of molecular
variance conducted with each of three marker data sets is presented. Fixation indices and the percentage of genetically
differentiated and nondifferentiated pairs of populations that occurred in the same group or different groups are also presented for
each data set (number of tests is given in parentheses). The fixation index FST
represents the genetic variance among populations
relative to the total variance, FSC
represents the variance among populations within groups, and FCT
represents the variance
among groups relative to the total variance. Ideally, all nondifferentiated pairs of populations would occur in the same groups,
while all differentiated populations would be in different groups.
Data set
Percentage of variation
Fixation indices
Pairwise genic differentiation tests
Significantly differentiatedpopulations
Not significantlydifferentiated populations
Amonggroups
Among popswithin groups
Withinpops F
STF
SCF
CTSame group Different groups Same group Different groups
Allozymes 11.40 7.37 81.23 0.1877 0.0832 0.1140 15.2 (171) 56.0 (632) 14.9 (168) 13.9 (157)Microsatellites 6.53 5.13 88.35 0.1165 0.0549 0.0653 23.5 (254) 68.5 (741) 7.6 (82) 0.4 (4)Mitochondrial DNA 10.30 24.13 65.56 0.2691 0.3444 0.1030 5.8 (65) 39.6 (447) 25.1 (283) 29.5 (333)
TABLE 3.—Correlation coefficients (r) and P-values from Mantel tests of isolation by distance for each of three genetic marker
data sets describing the genetic relationships among Florida bass, largemouth bass, and intergrade populations. The statewide
analyses included all 48 collections in a single test for each marker data set. The intragroup analyses evaluated the strength of the
correlation among the collections assigned to each group by the STRUCTURE analysis for each marker data set. Asterisks
indicate statistical significance (P , 0.05).
Analysis
Allozymes Microsatellites Mitochondrial DNA
r P r P r P
Statewide 0.3589 0.0009* 0.5832 0.0000* �0.0219 0.5560Groups assigned by STRUCTURE
1. Northwest 0.3463 0.2489 0.5913 0.1220 �0.4017 0.74632. North-central �0.4316 0.9844 0.0045 0.4827 0.3128 0.0487*3. Central-west �0.1310 0.7421 0.6559 0.0299* 0.8876 0.0082*4. South and central-east �0.0105 0.5191 0.3542 0.0039* 0.0171 0.3994
FLORIDA BASS GENETIC RELATIONSHIPS 1629

intergrade system, (2) the Ocklawaha River and other
central Florida systems should not be assumed to
contain pure Florida bass populations, and (3) more
generally, geographic distance alone cannot be consid-
ered a reliable indicator of taxonomic status due to the
fact that low-level intergrade populations were detected
in south Florida.
Stocking has been a part of black bass management
in Florida for more than 80 years. Therefore,
evaluations of the current genetic relationships of
Florida bass and largemouth bass in Florida must
consider the potential effect of past stocking practices.
Establishment of a statewide fish hatchery system
consisting of one federal and two state hatcheries began
in 1926. Although stocking of freshwater fishes
occurred before the 1920s, the release of hatchery-
reared fish has been more widespread throughout
Florida since that time. Hatchery records (FWC,
unpublished data) indicate that from 1966 to 2005,
more than 8 million Florida bass cultured at Richloam
State Fish Hatchery (the primary facility) were stocked
into Florida waters. Before the early 1980s, bass were
translocated throughout Florida without consideration
of broodfish origins; this practice could have instigated
an expansion of the intergrade zone. Although there is
no way to definitively determine how these historical
stocking activities altered the natural distribution of
Florida bass and largemouth bass within Florida, there
are at least a few cases (i.e., introgression in south
Florida) that illustrate the effect of stocking, with Lake
Parker providing an example of unintentional genetic
contamination that has occurred in recent decades.
This study found little evidence of nonrandom
mating in the distribution of nuclear alleles in
introgressed populations. None of the collections
showed significant linkage disequilibrium. Only two
of six loci that deviated from HWE in any population
were diagnostic markers, and hybrid index distributions
were unimodal in central regions of the intergrade
zone. Four of the collections from the panhandle region
of Florida (Lake Seminole, Lower Apalachicola River,
Choctawhatchee River, and Escambia River) had
introgressed to the point that none of the sampled
individuals were fixed for Florida bass or largemouth
bass alleles at the diagnostic loci; these populations
exist as hybrid swarms because all or nearly all
individuals in each population are of hybrid origin
(Allendorf et al. 2001). These results are consistent
with a hypothesis of random mating within sampled
populations, a lack of isolating mechanisms in parental
taxa, and very weak (if present at all) disruptive
selection against hybrid genotypes. The apparent
disagreement between these results and previous
experiments reporting that intergrade and nonlocal
individuals had lower survival rates and fitness than did
local fish might be due to biogeographic effects and the
time scales involved. Whereas fish used in the previous
experiments were collected from populations that had
been genetically isolated for millions of years and
originated in environments with reasonably different
climatic conditions, hybridization has been occurring in
the systems of north Florida ever since Florida bass and
largemouth bass came into secondary contact during
the Pleistocene epoch (Near et al. 2003). The hybrid
index distributions indicate that these populations have
passed beyond the early stages of hybridization and
now consist of later-generation hybrids and, in some
systems, individuals from one of the two parental
species and their backcrosses. None of the intergrade
populations included both pure Florida bass and pure
largemouth bass, and some only included hybrids.
Although our results indicate that populations in the
natural hybrid zone may not currently face adverse
consequences from interspecific introgression, these
findings offer little insight into how populations were
affected by hybridization during earlier stages of
introgression. It is entirely possible that there was
selection against hybrids after secondary contact;
however, hybrid swarms could still have developed
as long as hybrid offspring were fertile and could mate
both with each other and with the parental taxa
(Allendorf et al. 2001). Bolnick and Near (2005) found
that hybrid viability declined more slowly in Cen-
trarchidae than in most other taxonomic groups
evaluated to date; those authors concluded that most
speciation events must have resulted from prezygotic
rather than postzygotic isolation. Weak postzygotic
isolating mechanisms would have contributed—and
continue to contribute—to the production of hybrid
progeny when Florida bass and largemouth bass, two
morphologically similar species with nearly identical
reproductive ecology, inhabit the same systems. The
reduced fitness of experimentally introgressed popula-
tions relative to parental taxa (i.e., Philipp and Claussen
1995; Cooke et al. 2001; Philipp et al. 2002; Cooke and
Philipp 2005; Goldberg et al. 2005), which provides
ample evidence of the potential for negative conse-
quences from introgression, should prompt managers
to take steps to avoid additional hybridization events in
the future.
Once foreign genes have been introduced into a
population, it can be extremely difficult and costly to
remove them. One approach that was applied to
introgressed populations of cutthroat trout Oncorhyn-chus clarkii was to poison the fish inhabiting a
waterbody and then to restore the population with
hatchery-produced pure cutthroat trout (Rinne and
Hanson 1981; Allendorf and Leary 1988). The
1630 BARTHEL ET AL.

undesirable aspects of this approach include limited
feasibility for large-scale systems, the high likelihood
that some hybrid individuals will survive, and the
destruction of large numbers of fish, including any
individuals with native genotypes that remained in the
population. A less-invasive approach is to try to reduce
the proportion of foreign genes by aggressively
stocking the native species into the population. This
approach has been used in watersheds inhabited by
Guadalupe bass, which are threatened by introgressive
swamping via breeding with introduced smallmouth
bass. In one case, 2 years of extensive stocking failed
to prevent the loss of pure Guadalupe bass from the
Blanco River (Littrell et al. 2007); however, annual
stocking over a 10-year period appears to have reduced
the proportion of hybrid genotypes in Johnson Creek,
another system where the persistence of Guadalupe
bass has been a conservation concern (Koppelman and
Garrett 2002). The different results in these two cases
are probably due to differences in the magnitude of
introgression at the time the stocking programs began.
The case of the Blanco River provides evidence that
extensive stocking activities will not be able to rescue
an endemic species once introgression has surpassed a
threshold level. It also highlights the fact that stocking
activities can lead to long-term, irreversible genetic
changes in native populations.
In the present study, most introgressed Florida bass
populations south of the natural intergrade zone had
very low frequencies of largemouth bass alleles, and it
is possible that random genetic drift may lead to the
loss of these alleles from some of the populations.
However, the potential for irreversible consequences
should be an important consideration as the new state-
of-the-art fish hatchery at the Florida Bass Conserva-
tion Center in Webster, Florida, heralds a dramatic
increase in the scope and magnitude of bass stocking
practices in the state. Protection of pure Florida bass
populations should be a high priority for black bass
management in Florida. Preventing further introduc-
tions of largemouth bass into populations south of the
natural intergrade zone and avoiding intraspecific
hybridization between genetically divergent popula-
tions of Florida bass will be critical aspects of the long-
term protection of Florida bass.
An interesting finding was that the estimates of
introgression varied widely between the nuclear and
mitochondrial markers. Although some populations
had nearly 90% of their nuclear alleles derived from
largemouth bass, only 5 of 971 fish carried a known
largemouth bass mitochondrial haplotype. Haplotype
12 differed from all other haplotypes at a minimum of
eight nucleotide positions and stood apart from all
other haplotypes in a minimum spanning network.
Kassler et al. (2002) found this haplotype to be fixed
for largemouth bass (using the same region of the
genome and four of the restriction endonucleases
included in this study), and it was the sole haplotype
observed in largemouth bass collected from the Mobile
Delta, Alabama (B. L. Barthel, unpublished data). The
discrepancy between the frequency of haplotype 12
and the frequency of largemouth bass microsatellite
and allozyme alleles (4.9% and 7.2%, respectively)
strongly suggests the possibility of cytonuclear dis-
equilibrium. Due to the low abundance of haplotype
12, a statistical evaluation of suspected cytonuclear
disequilibrium was not possible because of insufficient
statistical power. However, cytonuclear disequilibrium
can result from a number of potential causes (Excoffier
1990; Scribner et al. 2001) and is a common
phenomenon in hybrid zones (Arnold 1993). In this
case, potential causes for the discordance between
largemouth bass nuclear and mitochondrial marker
frequencies include random genetic drift, mating
asymmetry, greatly skewed sex ratios of offspring, or
selection against largemouth bass mitochondrial ge-
nomes. Drift is the least likely explanation because
each population would need to have drifted in the same
direction. Prezygotic isolating mechanisms capable of
producing mating asymmetry include (1) gametic
incompatibility between largemouth bass females and
Florida bass males, (2) assortative mating, and (3)
behavioral, temporal, or spatial differences in repro-
ductive ecology that have resulted in infrequent mating
by female largemouth bass. However, Florida bass
sperm have been documented to fertilize largemouth
bass ova when researchers have physically combined
gametes in the laboratory (Philipp et al. 1985). The two
species have also been documented to hybridize under
natural conditions, producing hybrid progeny in both
experimental ponds and public waterbodies, indicating
that there was spatial and temporal overlap in the
reproductive activity of the species (Isely et al. 1987;
Philipp et al. 2002); however, directionality of these
crosses were not determined. Bolnick and Near (2005)
found that hybrid viability was asymmetrical in nearly
all centrarchid fishes for which reciprocal crosses had
been performed; they proposed cytonuclear interaction
as the most probable explanation, but they were unable
to rule out the direct effects of sex chromosomes or
mitochondria. Experimental studies with fruit flies
Drosophila spp. have documented purifying selection
against maladaptive mtDNA genomes and have shown
that individual fitness may be reduced when nuclear
and cytoplasmic genomes are discordant (reviewed in
Rand 2001). Hybrid inviability, however, appears to
accumulate more slowly in centrarchids than in other
studied taxa, including Drosophila, birds, and anurans
FLORIDA BASS GENETIC RELATIONSHIPS 1631

(Bolnick and Near 2005). Further study is required to
identify which of a number of plausible explanations
are responsible for the observed cytonuclear disequi-
librium of introgressed bass populations in Florida
systems. Until then, the genetic composition of
intergrade populations should be considered the natural
condition in the systems of northern Florida, a
geographic region where numerous hybrid zones have
resulted from secondary contact after many of the
southeastern drainages had been isolated by interglacial
periods during the Pliocene (Bermingham and Avise
1986; Swenson and Howard 2005).
The nuclear and mitochondrial markers resolved
somewhat different genetic structure among the black
bass populations sampled in Florida. Nuclear markers
suggest four groups that are located mostly in
accordance with the major hydrologic units of Florida
except that the populations from the St. Johns River
system clustered with those from the Kissimmee River
and Everglades systems. However, although a K of 2
was the optimal solution for the south–central-east–
northeast group, the DK peak was weak; under a K-
value of 3 (the second-highest DK), the collections
from the southern drainages (Kissimmee River and
Everglades systems) and from the northern drainages
were separated into two distinct groups. Relationships
in the mtDNA data set indicated that collections from
the St. Johns River system were differentiated from
those in the southern drainages. This was particularly
evident for haplotype 2, which was abundant in the St.
Johns River system but was absent or found at very low
frequency in the Kissimmee River and Everglades
systems. Although these are discrete drainages, the
nuclear data suggest some gene flow from north to
south, possibly due to intermittent high-water events.
Under this scenario, however, we would expect to see
haplotype 2 at higher frequencies in populations from
the southern drainages. One explanation for the
different patterns resolved with the nuclear and
mitochondrial markers may be differences in the
selective pressures on these sequences. Microsatellites
are considered to be selectively neutral, whereas recent
data suggest that the mitochondrial genome, particu-
larly when in cytonuclear disequilibrium, may be under
strong selective pressures that could alter patterns of
observed gene flow (Datta et al. 1996; Dowling et al.
2008). As a result, selective pressures in the more
tropical Kissimmee River and Everglades region of
Florida may account for the low abundance of
haplotype 2 in the region.
Collections from water bodies that drain into the
Gulf of Mexico and the Atlantic Ocean were
differentiated by nuclear markers, with a few excep-
tions (e.g., Lakes Weir, Minneola, Harris, Dora, and
Norris). This pattern was previously suggested for
Micropterus spp. (Lutz-Carrillo et al. 2006) and has
been documented in other fishes (Wirgin et al. 2002),
turtles (Walker and Avise 1998), and the American
alligator Alligator mississippiensis (Davis et al. 2002);
it is commonly referred to as the Gulf versus Atlantic
division (Avise 1992, 2000). A subset of this pattern, in
which collections from the Lower Apalachicola River
and west formed distinct groups from those collections
to the east, was also resolved. This result is consistent
with genetic discontinuities noted for a number of other
taxa, including the eastern tiger salamander Ambystomatigrinum tigrinum (Church et al. 2003) and some other
centrarchids (Bermingham and Avise 1986). In our
study, the Gulf versus Atlantic division was not
supported in that the four collections from the
Ocklawaha River system (Lakes Weir, Minneola,
Harris, and Dora), which is a tributary of the St. Johns
River, grouped with collections from Gulf coast
drainages. Presently, the Ocklawaha River is the only
one of four rivers with headwaters in the Green
Swamp, central Florida, that drains to the Atlantic
Ocean (the Hillsborough, Peace, and Withlacoochee
rivers all drain to the Gulf of Mexico); an electropho-
retic study found that sheepshead minnow Cyprinodonvariegatus collected from lakes in the Ocklawaha River
system shared genetic similarities to populations from
both the Gulf of Mexico and Atlantic drainages
(Duggins et al. 1983). In the present study, there was
no Gulf versus Atlantic division apparent in the
relationships for the mtDNA data set, even though
mitochondrial markers were used in most of the work
that previously suggested the existence of such a
division (Avise 1992; Soltis et al. 2006). The nuclear
and mtDNA results indicate that there has been gene
flow between populations inhabiting Gulf of Mexico
and Atlantic drainages and that the Ocklawaha River
system, central Florida, is one place where the Gulf
versus Atlantic division has broken down at least once
in the past.
Recently, the FWC has instituted a number of
policies and procedures to protect the genetic integrity
of Florida bass populations in Florida. First, they have
developed and adopted a comprehensive genetics
policy that sets forth guidelines and policy standards
designed to protect populations of freshwater and
marine finfishes from adverse consequences resulting
from the release of cultured fishes, including the
promotion of fish hatchery protocols that minimize the
potential for inbreeding and domestication (Tringali et
al. 2007). Second, the FWC has designated five regions
as black bass genetic management units (MUs); the
regions are based on the results of the present study and
include the northwest, north-central, central-west,
1632 BARTHEL ET AL.

south, and central-east–northeast groups (the south–
central-east–northeast group from the STRUCTURE
analyses has been split due to the mtDNA differences
between collections from the St. Johns River system
and Everglades drainage). State and federal stocking
programs are prohibited from translocating bass
between MUs; this ensures that hatchery-reared fish
are released into waterbodies in the same MU from
which their parents were collected (with the exception
of a long-term research project conducted on Lake
Talquin). Prohibiting intergroup transfers is expected to
prevent the most severe outcrossing; however, it is
possible that outbreeding depression could result from
crosses between individuals from populations that
occur within the same group. Each group consists of
populations that tend to be more genetically similar to
each other than to populations in another group.
However, depending on the data set, between 6% and
24% of genetically differentiated population pairs
occurred within the same group. To that end, the
FWC considers special measures for more divergent
populations. For example, the isolated location and
unique characteristics of the St. Mary’s River have led
managers to release only the progeny of broodstock
collected from the St. Mary’s River during a recent
stock enhancement project. More general safeguards
include routine genetic testing to ensure that every
hatchery-reared fish stocked into peninsular water
bodies are pure Florida bass. The FWC is currently
implementing a number of approaches to prevent
private fish dealers from transporting largemouth bass
and largemouth bass hybrids into the Florida peninsula.
These recent steps to incorporate genetic conservation
principles into black bass management in Florida
represent a comprehensive approach to the long-term
conservation of black bass populations throughout the
state, with special concern for the endemic Florida
bass.
Acknowledgments
This project was partially funded by the Wildlife
Foundation of Florida, the Texas Parks and Wildlife
Foundation, and Federal Aid in Sport Fish Restoration
Program Grant F101 to the TPWD. The authors are
grateful for the expert field and laboratory assistance of
Andy Strickland, Gina Delpizzo, Holly Alred, Rich
Cailteux, and Steve Crawford of FWC and Olivia
Dorothy of INHS. Llyn French (FWC) provided
assistance with the production of figures. We also
thank Jim Estes and Jason Dotson from the Florida
Fish and Wildlife Research Institute and Loraine Fries
from the TPWD for providing helpful comments that
improved the quality of the manuscript. A.M.R. was
supported by a Jonathan Baldwin Turner Undergrad-
uate Research Grant and the Environmental and
Special Undergraduate Research on the Environment
Grant.
References
Allendorf, F. W., and R. F. Leary. 1988. Conservation and
distribution of genetic variation in a polytypic species,
the cutthroat trout. Conservation Biology 2:170–184.
Allendorf, F. W., R. F. Leary, P. Spruell, and J. K. Wenburg.
2001. The problem with hybrids: setting conservation
guidelines. Trends in Ecology and Evolution 16:613–
622.
Arnold, J. 1993. Cytonuclear disequilibria in hybrid zones.
Annual Reviews in Ecology and Systematics 24:521–
554.
Avise, J. C. 1992. Molecular population structure and the
biogeographic history of a regional fauna: a case history
with lessons for conservation biology. Oikos 63:62–76.
Avise, J. C. 2000. Phylogeography: the history and formation
of species. Harvard University Press, Cambridge,
Massachusetts.
Avise, J. C. 2001. Cytonuclear genetic signatures of
hybridization phenomena: rationale, utility, and empirical
examples from fishes and other aquatic animals. Reviews
in Fish Biology and Fisheries 10:253–263.
Bailey, R. M., and C. L. Hubbs. 1949. The black basses
(Micropterus) of Florida, with description of a new
species. University of Michigan Museum of Zoology,
Occasional Papers 516, Ann Arbor.
Bandelt, H.-J., P. Forster, and A. Rohl. 1999. Median-joining
networks for inferring intraspecific phylogenies. Molec-
ular Biology and Evolution 16:37–48.
Barwick, D. H., K. J. Oswald, J. M. Quattro, and R. D.
Barwick. 2006. Redeye bass (Micropterus coosae) and
Alabama spotted bass (M. punctulatus henshalli) hybrid-
ization in Keowee Reservoir. Southeastern Naturalist
5:661–668.
Belkhir, K., P. Borsa, L. Chikhi, N. Raufaste, and F.
Bonhomme. 2000. GENETIX, logiciel sous Windows
pour la genetique des populations. [GENETIX: Windows
software for population genetics.] Laboratoire Genome,
Populations, Interactions CNRS UMR 5000, Universite
de Montpellier II, Montpellier, France.
Bermingham, E., and J. C. Avise. 1986. Molecular zoogeog-
raphy of freshwater fishes in the southeastern United
States. Genetics 113:939–965.
Bolnick, D. I., and T. J. Near. 2005. Tempo of hybrid
inviability in Centrarchid fishes (Teleostei: Centrarchi-
dae). Evolution 59:1754–1767.
Campton, D. E. 1987. Natural hybridization and introgression
in fishes: methods of detection and genetic interpreta-
tions. Pages 161–192 in N. Ryman and F. Utter, editors.
Population genetics and fishery management. University
of Washington Press, Seattle.
Cavalli-Sforza, L. L., and A. W. F. Edwards. 1967.
Phylogenetic analysis: models and estimation proce-
dures. American Journal of Human Genetics 19:233–
257.
Chew, R. L. 1975. The Florida largemouth bass. Pages 450–
458 in R. H. Stroud and H. Clepper, editors. Black bass
FLORIDA BASS GENETIC RELATIONSHIPS 1633

biology and management. Sport Fishing Institute,
Washington, D.C.
Choler, P., B. Erschbamer, A. Tribesch, L. Gielly, and P.
Taberlet. 2004. Genetic introgression as a potential to
widen a species’ niche. Proceedings of the National
Academy of Sciences of the United States of America
101:171–176.
Church, S. A., J. M. Kraus, J. C. Mitchell, D. R. Church, and
D. R. Taylor. 2003. Evidence for multiple Pleistocene
refugia in the postglacial expansion of the eastern tiger
salamander, Ambystoma tigrinum tigrinum. Evolution
57:372–383.
Colbourne, J. K., B. D. Neff, J. M. Wright, and M. R. Gross.
1996. DNA fingerprinting of bluegill sunfish (Lepomismacrochirus) using (GT)n microsatellites and its poten-
tial for assessment of mating success. Canadian Journal
of Aquatic Science 53:342–349.
Cooke, S. J., T. W. Kassler, and D. P. Philipp. 2001.
Physiological performance of largemouth bass related to
local adaptation and interstock hybridization: implica-
tions for conservations and management. The Journal of
Fish Biology 59(Supplement A):248–268.
Cooke, S. J., and D. P. Philipp. 2005. Influence of local
adaptation and interstock hybridization on the cardiovas-
cular performance of largemouth bass Micropterussalmoides. The Journal of Fish Biology 208:2055–2062.
Datta, S., Y. X. Fu, and J. Arnold. 1996. Dynamics and
equilibrium behavior of cytonuclear disequilibria under
genetic drift, mutation, and migration. Theoretical
Population Biology 50:298–324.
Davis, L. M., T. C. Glenn, D. C. Strickland, L. J. Guillette Jr.,
R. M. Elsey, W. E. Rhodes, H. C. Dessauer, and R. H.
Sawyer. 2002. Microsatellite DNA analyses support east-
west phylogeographical split of American alligator
populations. Journal of Experimental Zoology Part B:
Molecular Developmental Evolution 294:352–372.
DeWoody, J. A., D. E. Fletcher, S. D. Wilkins, W. S. Nelson,
and J. C. Avise. 2000. Genetic monogamy and biparental
care in an externally fertilizing fish, the largemouth bass
(Micropterus salmoides). Proceedings of the Royal
Society of London B 267:2431–2437.
Dobzhansky, T. 1970. Genetics of the evolutionary process.
Columbia University Press, New York.
Dowling, D. K., U. Friberg, and J. Lindell. 2008. Evolutionary
implications of nonneutral mitochondrial genetic varia-
tion. Trends in Ecology and Evolution 23:546–554.
Duggins, C. F. Jr., A. A. Karlin, and K. G. Relyea. 1983.
Electrophoretic comparison of Cyprinodon variegatusLacepede and Cyprinodon hubbsi Carr, with comments
on the genus Cyprinodon (Antherinformes: Cyprinodon-
tidae). Northeast Gulf Science 6:99–107.
Dunham, R. A., C. Turner, and W. Reeves. 1992. Introgres-
sion of the Florida largemouth bass genome into native
populations in Alabama public lakes. North American
Journal of Fisheries Management 12:494–498.
Edmands, S. 2007. Between a rock and a hard place:
evaluating the relative risks of inbreeding and outbreed-
ing for conservation and management. Molecular Ecol-
ogy 16:463–475.
Edwards, R. 1979. Report of Guadalupe bass (Micropterustreculi) smallmouth bass (Micropterus dolomieui) hy-
brids from 2 localities in the Guadalupe River, Texas.
Texas Journal of Science 31:233–238.
Evanno, G., S. Regnaut, and J. Goudet. 2005. Detecting the
number of clusters of individuals using the software
STRUCTURE. Molecular Ecology 14:2611–2620.
Excoffier, L. 1990. Evolution of human mitochondrial DNA:
evidence for departure from a pure neutral model of
populations at equilibrium. Journal of Molecular Evolu-
tion 30:125–139.
Excoffier, L., G. Laval, and S. Schneider. 2005. Arlequin ver.
3.0: an integrated software package for population
genetics data analysis. Evolutionary Bioinformatics On-
line 1:47–50.
Falush, D., M. Stephens, and J. K. Pritchard. 2003. Inference
of population structure using multilocus genotype data:
linked loci and correlated allele frequencies. Genetics
164:1567–1587.
Felsenstein, J. 1989. PHYLIP - phylogeny inference package
(version 3.2). Cladistics 5:164–166.
Fields, R. D., K. R. Johnson, and G. H. Thorgaard. 1989.
DNA fingerprinting in rainbow trout detected by
hybridization with DNA bacteriophage M13. Transac-
tions of the American Fisheries Society 118:78–81.
Forshage, A., and L. T. Fries. 1995. Evaluation of the Florida
largemouth bass in Texas. Pages 484–491 in H.
Schramm Jr. and R. Piper, editors. Uses and effects of
cultured fishes in aquatic ecosystems. American Fisheries
Society, Symposium 15, Bethesda, Maryland.
Gelwick, F. P., E. R. Gilliland, and W. J. Matthews. 1995.
Introgression of the Florida largemouth bass genome into
stream populations of northern largemouth bass in
Oklahoma. Transactions of the American Fisheries
Society 124:550–562.
Gilliland, E. R. 1994. Experimental stocking of Florida
largemouth bass into small Oklahoma reservoirs. Pro-
ceedings of the Annual Conference of the Southeastern
Association of Fish and Wildlife Agencies 46(1992):
487–494.
Goldberg, T. L., E. C. Grant, K. R. Inendino, T. W. Kassler,
J. C. Claussen, and D. P. Philipp. 2005. Increased
infectious disease susceptibility resulting from outbreed-
ing depression. Conservation Biology 19:455–462.
Grant, P. R., B. R. Grant, and K. Petren. 2005. Hybridization
in the recent past. American Naturalist 166:56–67.
IUBMB (International Union of Biochemistry and Molecular
Biology). 1992. Enzyme nomenclature 1992. Academic
Press, San Diego, California.
Isely, J. J., R. L. Noble, J. B. Koppelman, and D. P. Philipp.
1987. Spawning period and first-year growth of North-
ern, Florida, and intergrade stocks of largemouth bass.
Transactions of the American Fisheries Society 116:757–
762.
Kassler, T. W., J. B. Koppelman, T. J. Near, C. B. Dillman,
J. M. Levengood, D. L. Swofford, J. L. Van Orman, J. C.
Claussen, and D. P. Philipp. 2002. Molecular and
morphological analyses of the black basses: implications
for taxonomy and conservation. Pages 291–322 in D. P.
Philipp and M. S. Ridgway, editors. Black bass: ecology,
conservation, and management. American Fisheries
Society, Symposium 31, Bethesda, Maryland.
Koppelman, J. B. 1994. Hybridization between smallmouth
bass, Micropterus dolomieu, and spotted bass, M.
1634 BARTHEL ET AL.
punctulatus, in the Missouri River system, Missouri.
Copeia 1:204–210.
Koppelman, J. B., and G. P. Garrett. 2002. Distribution,
biology, and conservation of the rare black bass species.
Pages 333–341 in D. P. Philipp and M. S. Ridgway,
editors. Black bass: ecology, conservation, and manage-
ment. American Fisheries Society, Symposium 31,
Bethesda, Maryland.
Koppelman, J. B., and D. P. Philipp. 1986. Genetic
applications in muskellunge management. Pages 111–
121 in G. E. Hall, editor. Managing muskies: a treatise on
the biology and propagation of muskellunge in North
America. American Fisheries Society, Special Publica-
tion 15, Bethesda, Maryland.
Littrell, B. M., D. J. Lutz-Carrillo, T. H. Bonner, and L. T.
Fries. 2007. Status of an introgressed Guadalupe bass
population in a central Texas stream. North American
Journal of Fisheries Management 27:785–791.
Lutz-Carrillo, D. J., C. Hagen, L. A. Dueck, and T. C. Glenn.
2008. Isolation and characterization of microsatellite loci
for Florida largemouth bass, Micropterus salmoidesfloridanus, and other micropterids. Molecular Ecology
Resources 8:178–184.
Lutz-Carrillo, D. J., C. C. Nice, T. H. Bonner, M. R. J.
Forstner, and L. T. Fries. 2006. Admixture analysis of
Florida largemouth bass and northern largemouth bass
using microsatellite loci. Transactions of the American
Fisheries Society 135:779–791.
Maciena, M. J., B. R. Murphy, and J. J. Isely. 1988. Factors
regulating Florida largemouth bass stocking success and
hybridization with Northern largemouth bass in Aquilla
Lake, Texas. Transactions of the American Fisheries
Society 117:221–231.
Mallet, J. 2005. Hybridization as an invasion of the genome.
Trends in Ecology and Evolution 20:229–237.
Malloy, T. P., R. A. van den Bussche, W. D. Coughlin, and
A. A. Echelle. 2000. Isolation and characterization of
microsatellite loci in smallmouth bass, Micropterusdolomieu (Teleostei: Centrarchidae), and cross-species
amplification in spotted bass, M. punctulatus. Molecular
Ecology 9:1946–1948.
Miller, S. A., D. D. Dykes, and H. F. Polesky. 1988. A simple
salting out procedure for extracting DNA from human
nucleated cells. Nucleic Acids Research 16:1215.
Morizot, D. C., S. C. Calhoun, L. L. Clepper, M. E. Schmidt,
and G. J. Carmichael. 1991. Multispecies hybridization
among native and introduced centrarchid basses in
central Texas. Transactions of the American Fisheries
Society 120:283–289.
Near, T. J., T. W. Kassler, J. B. Koppelman, C. B. Dillman,
and D. P. Philipp. 2003. Speciation in North American
black basses, Micropterus (Actinopterygii: Centrarchi-
dae). Evolution 57:1610–1621.
Page, R. D. M. 1996. TreeView: an application to display
phylogenetic trees on personal computers. Computer
Applications in the Biosciences 12:357–358.
Park, L. K., M. A. Brainard, D. A. Dightman, and G. A.
Winans. 1993. Low levels of intraspecific variation in the
mitochondrial DNA of chum salmon (Oncorhynchusketa). Molecular Marine Biology and Biotechnology
2:362–370.
Pierce, P. C., and M. Van Den Avyle. 1997. Hybridization
between introduced spotted bass and smallmouth bass in
reservoirs. Transactions of the American Fisheries
Society 126:939–947.
Pipas, J. C., and F. J. Bulow. 1998. Hybridization between
redeye bass and smallmouth bass in Tennessee streams.
Transactions of the American Fisheries Society 127:141–
146.
Philipp, D. P., W. F. Childers, and G. S. Whitt. 1979.
Evolution of patterns of differential gene expression: a
comparison of the temporal and spatial patterns of
isozyme locus expression in two closely related fish
species (northern largemouth bass, Micropterus sal-moides salmoides, and smallmouth bass, M. dolomieu).
Journal of Experimental Zoology 210:473–487.
Philipp, D. P., W. F. Childers, and G. S. Whitt. 1981.
Management implications for different genetic stocks of
largemouth bass (Micropterus salmoides) in the United
States. Canadian Journal of Fisheries and Aquatic
Sciences 38:1715–1723.
Philipp, D. P., W. F. Childers, and G. S. Whitt. 1983. A
biochemical genetic evaluation of the northern and
Florida subspecies of largemouth bass. Transactions of
the American Fisheries Society 112:1–20.
Philipp, D. P., and J. E. Claussen. 1995. Fitness and
performance differences between two stocks of large-
mouth bass from different river drainages within Illinois.
Pages 236–243 in H. Schramm, editor. Uses and effects
of cultured fishes in aquatic ecosystems. American
Fisheries Society, Symposium 15, Bethesda, Maryland.
Philipp, D. P., J. E. Claussen, T. W. Kassler, and J. M.
Epifanio. 2002. Mixing stocks of largemouth bass
reduces fitness through outbreeding depression. Pages
349–363 in D. P. Philipp and M. S. Ridgway, editors.
Black bass: ecology, conservation, and management.
American Fisheries Society, Symposium 31, Bethesda,
Maryland.
Philipp, D. P., C. Kaminski, and G. S. Whitt. 1985. A
comparison of the embryonic development of northern,
Florida, and reciprocal F1 hybrid largemouth bass in
different thermal environments. Illinois Natural History
Survey Bulletin 33:261–273.
Pritchard, J. K., M. Stephens, and P. Donnelly. 2000.
Inference of population structure using multilocus
genotype data. Genetics 155:945–959.
Pritchard, J. K., X. Wen, and D. Falush. 2007. Documentation
for structure software: Version 2.2. University of
Chicago. Available: pritch.bsd.uchicago.edu/software.
(November 2009).
Rand, D. M. 2001. The units of selection on mitochondrial
DNA. Annual Review of Ecology and Systematics
32:415–448.
Raymond, M., and F. Rousset. 1995. An exact test for
population differentiation. Evolution 49:1280–1283.
Rhymer, J. M., and D. Simberloff. 1996. Extinction by
hybridization and introgression. Annual Review in
Ecology and Systematics 27:83–109.
Rice, W. R. 1989. Analyzing table of statistical tests.
Evolution 43:223–225.
Rinne, J., and J. N. Hanson. 1981. Chemical treatment of Ord
Creek, Apache County, Arizona, to re-establish Arizona
trout. Journal of the Arizona-Nevada Academy of
Sciences 16:74–78.
FLORIDA BASS GENETIC RELATIONSHIPS 1635

Rubidge, E. M., and E. B. Taylor. 2004. Hybrid zone structure
and the potential role of selection in hybridizing
populations of native westslope cutthroat trout (Onco-rhynchus clarki lewisi) and introduced rainbow trout (O.mykiss). Molecular Ecology 13:3735–3749.
Saghai-Maroof, M. A., K. M. Soliman, R. A. Jorgensen, and
R. W. Allard. 1984. Ribosomal DNA spacer-length
polymorphisms in barley: mendelian inheritance, chro-
mosome location, and population dynamics. Proceedings
of the National Academy of Sciences of the United States
of America 81:8014–8018.
Scribner, K. T., K. S. Page, and M. L. Bartron. 2001.
Hybridization in freshwater fishes: a review of case
studies and cytonuclear methods of biological inference.
Reviews in Fish Biology and Fisheries 10:293–323.
Soltis, D. E., A. B. Morris, J. S. McLachlan, P. S. Manos, and
P. S. Soltis. 2006. Comparative phylogeography of
unglaciated eastern North America. Molecular Ecology
15:4261–4293.
Swenson, N. G., and D. J. Howard. 2005. Clustering of
contact zones, hybrid zones, and phylogeographic breaks
in North America. The American Naturalist 166:581–
591.
Tanaka, Y. 2007. Introgressive hybridization as the break-
down of postzygotic isolation: a theoretical perspective.
Ecological Resources 22:929–939.
Tringali, M. D., T. M. Bert, F. Cross, J. W. Dodrill, L. M.
Gregg, W. G. Halstead, R. A. Krause, K. M. Leber, K.
Mesner, W. F. Porak, D. Roberts, R. Stout, and D.
Yeager. 2007. Genetic policy for the release of finfishes
in Florida. Florida Fish and Wildlife Conservation
Commission, Florida Fish and Wildlife Research Institute
Publication IHR-2007–001, St. Petersburg.
Walker, D., and J. C. Avise. 1998. Principles of phylogeog-
raphy as illustrated by freshwater and terrestrial turtles in
the southeastern United States. Annual Review of
Ecology and Systematics 29:23–58.
Whitmore, D. H. 1983. Introgressive hybridization of small-
mouth bass (Micropterus dolomieui) and Guadalupe bass
(M. treculi). Copeia 1983:672–679.
Wirgin, I., J. Waldman, J. Stabile, B. Lubinski, and T. King.
2002. Comparison of mitochondrial DNA control region
sequence and microsatellite DNA analyses in estimating
population structure and gene flow rates in Atlantic
sturgeon Acipenser oxyrinchus. Journal of Applied
Ichthyology 18:313–319.
1636 BARTHEL ET AL.
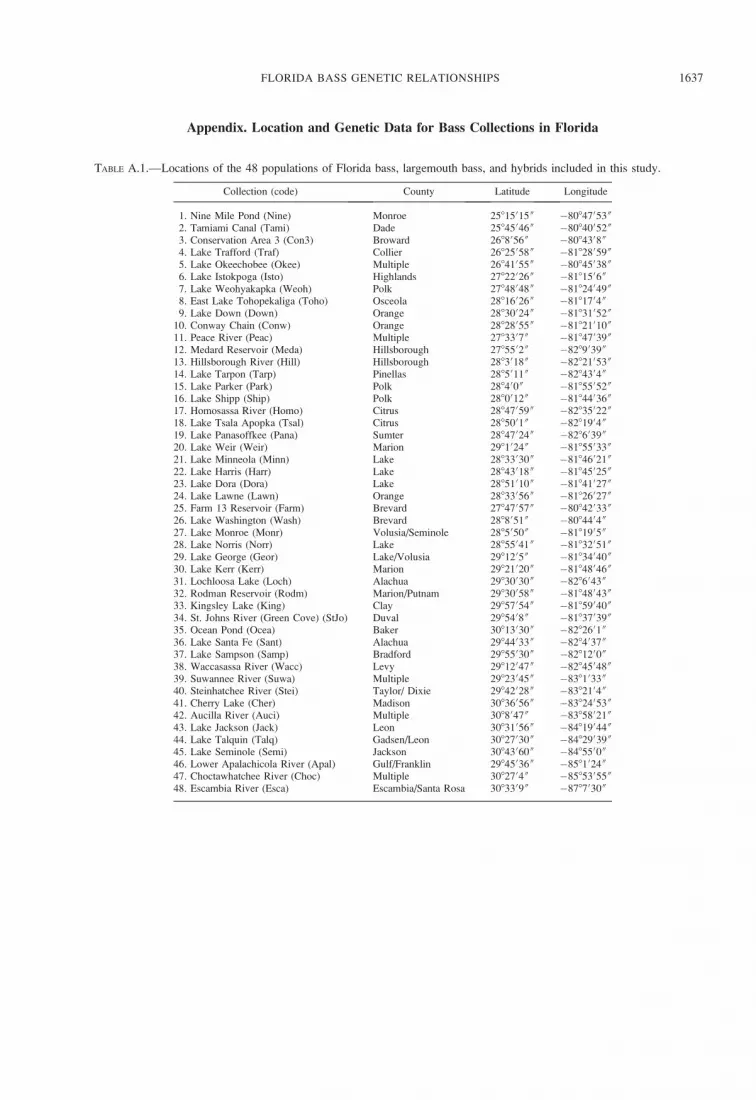
Appendix. Location and Genetic Data for Bass Collections in Florida
TABLE A.1.—Locations of the 48 populations of Florida bass, largemouth bass, and hybrids included in this study.
Collection (code) County Latitude Longitude
1. Nine Mile Pond (Nine) Monroe 25815015 00 �80847053 00
2. Tamiami Canal (Tami) Dade 25845046 00 �80840052 00
3. Conservation Area 3 (Con3) Broward 2688056 00 �8084308 00
4. Lake Trafford (Traf) Collier 26825058 00 �81828059 00
5. Lake Okeechobee (Okee) Multiple 26841055 00 �80845038 00
6. Lake Istokpoga (Isto) Highlands 27822026 00 �8181506 00
7. Lake Weohyakapka (Weoh) Polk 27848048 00 �81824049 00
8. East Lake Tohopekaliga (Toho) Osceola 28816026 00 �8181704 00
9. Lake Down (Down) Orange 28830024 00 �81831052 00
10. Conway Chain (Conw) Orange 28828055 00 �81821010 00
11. Peace River (Peac) Multiple 2783307 00 �81847039 00
12. Medard Reservoir (Meda) Hillsborough 2785502 00 �8289039 00
13. Hillsborough River (Hill) Hillsborough 2883018 00 �82821053 00
14. Lake Tarpon (Tarp) Pinellas 2885011 00 �8284304 00
15. Lake Parker (Park) Polk 288400 00 �81855052 00
16. Lake Shipp (Ship) Polk 2880012 00 �81844036 00
17. Homosassa River (Homo) Citrus 28847059 00 �82835022 00
18. Lake Tsala Apopka (Tsal) Citrus 2885001 00 �8281904 00
19. Lake Panasoffkee (Pana) Sumter 28847024 00 �8286039 00
20. Lake Weir (Weir) Marion 2981024 00 �81855033 00
21. Lake Minneola (Minn) Lake 28833030 00 �81846021 00
22. Lake Harris (Harr) Lake 28843018 00 �81845025 00
23. Lake Dora (Dora) Lake 28851010 00 �81841027 00
24. Lake Lawne (Lawn) Orange 28833056 00 �81826027 00
25. Farm 13 Reservoir (Farm) Brevard 27847057 00 �80842033 00
26. Lake Washington (Wash) Brevard 2888051 00 �8084404 00
27. Lake Monroe (Monr) Volusia/Seminole 2885050 00 �8181905 00
28. Lake Norris (Norr) Lake 28855041 00 �81832051 00
29. Lake George (Geor) Lake/Volusia 2981205 00 �81834040 00
30. Lake Kerr (Kerr) Marion 29821020 00 �81848046 00
31. Lochloosa Lake (Loch) Alachua 29830030 00 �8286043 00
32. Rodman Reservoir (Rodm) Marion/Putnam 29830058 00 �81848043 00
33. Kingsley Lake (King) Clay 29857054 00 �81859040 00
34. St. Johns River (Green Cove) (StJo) Duval 2985408 00 �81837039 00
35. Ocean Pond (Ocea) Baker 30813030 00 �8282601 00
36. Lake Santa Fe (Sant) Alachua 29844033 00 �8284037 00
37. Lake Sampson (Samp) Bradford 29855030 00 �8281200 00
38. Waccasassa River (Wacc) Levy 29812047 00 �82845048 00
39. Suwannee River (Suwa) Multiple 29823045 00 �8381033 00
40. Steinhatchee River (Stei) Taylor/ Dixie 29842028 00 �8382104 00
41. Cherry Lake (Cher) Madison 30836056 00 �83824053 00
42. Aucilla River (Auci) Multiple 3088047 00 �83858021 00
43. Lake Jackson (Jack) Leon 30831056 00 �84819044 00
44. Lake Talquin (Talq) Gadsen/Leon 30827030 00 �84829039 00
45. Lake Seminole (Semi) Jackson 30843060 00 �8485500 00
46. Lower Apalachicola River (Apal) Gulf/Franklin 29845036 00 �8581024 00
47. Choctawhatchee River (Choc) Multiple 3082704 00 �85853055 00
48. Escambia River (Esca) Escambia/Santa Rosa 3083309 00 �8787030 00
FLORIDA BASS GENETIC RELATIONSHIPS 1637
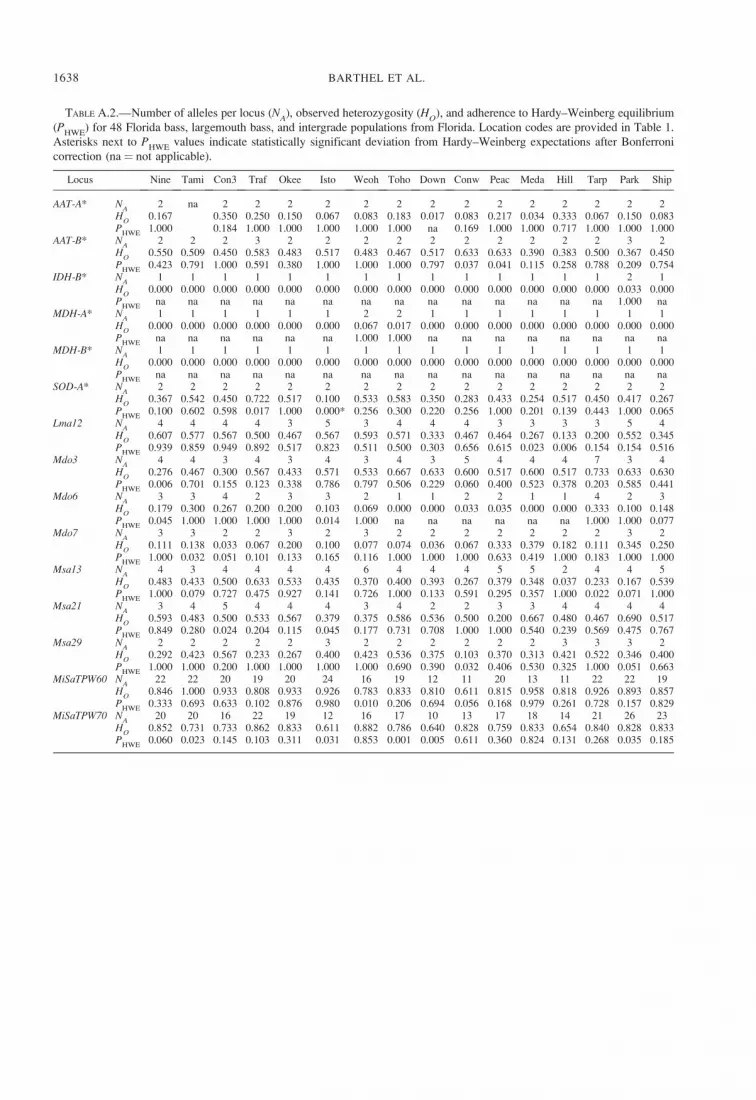
TABLE A.2.—Number of alleles per locus (NA), observed heterozygosity (H
O), and adherence to Hardy–Weinberg equilibrium
(PHWE
) for 48 Florida bass, largemouth bass, and intergrade populations from Florida. Location codes are provided in Table 1.
Asterisks next to PHWE
values indicate statistically significant deviation from Hardy–Weinberg expectations after Bonferroni
correction (na ¼ not applicable).
Locus Nine Tami Con3 Traf Okee Isto Weoh Toho Down Conw Peac Meda Hill Tarp Park Ship
AAT-A* NA
2 na 2 2 2 2 2 2 2 2 2 2 2 2 2 2H
O0.167 0.350 0.250 0.150 0.067 0.083 0.183 0.017 0.083 0.217 0.034 0.333 0.067 0.150 0.083
PHWE
1.000 0.184 1.000 1.000 1.000 1.000 1.000 na 0.169 1.000 1.000 0.717 1.000 1.000 1.000AAT-B* N
A2 2 2 3 2 2 2 2 2 2 2 2 2 2 3 2
HO
0.550 0.509 0.450 0.583 0.483 0.517 0.483 0.467 0.517 0.633 0.633 0.390 0.383 0.500 0.367 0.450P
HWE0.423 0.791 1.000 0.591 0.380 1.000 1.000 1.000 0.797 0.037 0.041 0.115 0.258 0.788 0.209 0.754
IDH-B* NA
1 1 1 1 1 1 1 1 1 1 1 1 1 1 2 1H
O0.000 0.000 0.000 0.000 0.000 0.000 0.000 0.000 0.000 0.000 0.000 0.000 0.000 0.000 0.033 0.000
PHWE
na na na na na na na na na na na na na na 1.000 naMDH-A* N
A1 1 1 1 1 1 2 2 1 1 1 1 1 1 1 1
HO
0.000 0.000 0.000 0.000 0.000 0.000 0.067 0.017 0.000 0.000 0.000 0.000 0.000 0.000 0.000 0.000P
HWEna na na na na na 1.000 1.000 na na na na na na na na
MDH-B* NA
1 1 1 1 1 1 1 1 1 1 1 1 1 1 1 1H
O0.000 0.000 0.000 0.000 0.000 0.000 0.000 0.000 0.000 0.000 0.000 0.000 0.000 0.000 0.000 0.000
PHWE
na na na na na na na na na na na na na na na naSOD-A* N
A2 2 2 2 2 2 2 2 2 2 2 2 2 2 2 2
HO
0.367 0.542 0.450 0.722 0.517 0.100 0.533 0.583 0.350 0.283 0.433 0.254 0.517 0.450 0.417 0.267P
HWE0.100 0.602 0.598 0.017 1.000 0.000* 0.256 0.300 0.220 0.256 1.000 0.201 0.139 0.443 1.000 0.065
Lma12 NA
4 4 4 4 3 5 3 4 4 4 3 3 3 3 5 4H
O0.607 0.577 0.567 0.500 0.467 0.567 0.593 0.571 0.333 0.467 0.464 0.267 0.133 0.200 0.552 0.345
PHWE
0.939 0.859 0.949 0.892 0.517 0.823 0.511 0.500 0.303 0.656 0.615 0.023 0.006 0.154 0.154 0.516Mdo3 N
A4 4 3 4 3 4 3 4 3 5 4 4 4 7 3 4
HO
0.276 0.467 0.300 0.567 0.433 0.571 0.533 0.667 0.633 0.600 0.517 0.600 0.517 0.733 0.633 0.630P
HWE0.006 0.701 0.155 0.123 0.338 0.786 0.797 0.506 0.229 0.060 0.400 0.523 0.378 0.203 0.585 0.441
Mdo6 NA
3 3 4 2 3 3 2 1 1 2 2 1 1 4 2 3H
O0.179 0.300 0.267 0.200 0.200 0.103 0.069 0.000 0.000 0.033 0.035 0.000 0.000 0.333 0.100 0.148
PHWE
0.045 1.000 1.000 1.000 1.000 0.014 1.000 na na na na na na 1.000 1.000 0.077Mdo7 N
A3 3 2 2 3 2 3 2 2 2 2 2 2 2 3 2
HO
0.111 0.138 0.033 0.067 0.200 0.100 0.077 0.074 0.036 0.067 0.333 0.379 0.182 0.111 0.345 0.250P
HWE1.000 0.032 0.051 0.101 0.133 0.165 0.116 1.000 1.000 1.000 0.633 0.419 1.000 0.183 1.000 1.000
Msa13 NA
4 3 4 4 4 4 6 4 4 4 5 5 2 4 4 5H
O0.483 0.433 0.500 0.633 0.533 0.435 0.370 0.400 0.393 0.267 0.379 0.348 0.037 0.233 0.167 0.539
PHWE
1.000 0.079 0.727 0.475 0.927 0.141 0.726 1.000 0.133 0.591 0.295 0.357 1.000 0.022 0.071 1.000Msa21 N
A3 4 5 4 4 4 3 4 2 2 3 3 4 4 4 4
HO
0.593 0.483 0.500 0.533 0.567 0.379 0.375 0.586 0.536 0.500 0.200 0.667 0.480 0.467 0.690 0.517P
HWE0.849 0.280 0.024 0.204 0.115 0.045 0.177 0.731 0.708 1.000 1.000 0.540 0.239 0.569 0.475 0.767
Msa29 NA
2 2 2 2 2 3 2 2 2 2 2 2 3 3 3 2H
O0.292 0.423 0.567 0.233 0.267 0.400 0.423 0.536 0.375 0.103 0.370 0.313 0.421 0.522 0.346 0.400
PHWE
1.000 1.000 0.200 1.000 1.000 1.000 1.000 0.690 0.390 0.032 0.406 0.530 0.325 1.000 0.051 0.663MiSaTPW60 N
A22 22 20 19 20 24 16 19 12 11 20 13 11 22 22 19
HO
0.846 1.000 0.933 0.808 0.933 0.926 0.783 0.833 0.810 0.611 0.815 0.958 0.818 0.926 0.893 0.857P
HWE0.333 0.693 0.633 0.102 0.876 0.980 0.010 0.206 0.694 0.056 0.168 0.979 0.261 0.728 0.157 0.829
MiSaTPW70 NA
20 20 16 22 19 12 16 17 10 13 17 18 14 21 26 23H
O0.852 0.731 0.733 0.862 0.833 0.611 0.882 0.786 0.640 0.828 0.759 0.833 0.654 0.840 0.828 0.833
PHWE
0.060 0.023 0.145 0.103 0.311 0.031 0.853 0.001 0.005 0.611 0.360 0.824 0.131 0.268 0.035 0.185
1638 BARTHEL ET AL.

TABLE A.2.—Extended.
Locus Hom Tsal Pana Weir Minn Harr Dora Lawn Farm Wash Monr Norr Geor Kerr Loch Rodm
AAT-A* 2 2 2 2 2 2 2 2 2 2 2 1 2 2 2 20.067 0.533 0.383 0.267 0.383 0.050 0.083 0.167 0.150 0.200 0.233 0.000 0.150 0.100 0.133 0.2001.000 0.157 0.258 0.579 1.000 1.000 0.169 1.000 1.000 1.000 1.000 Na 1.000 1.000 1.000 0.577
AAT-B* 2 2 2 2 2 2 2 2 2 2 2 2 3 3 2 20.300 0.333 0.250 0.683 0.500 0.117 0.217 0.567 0.467 0.500 0.483 0.317 0.567 0.683 0.150 0.5000.443 0.670 0.626 0.009 1.000 1.000 0.319 0.436 1.000 1.000 1.000 0.330 0.510 0.001 1.000 0.398
IDH-B* 3 2 2 1 1 2 1 2 2 1 1 1 1 1 2 10.450 0.033 0.067 0.000 0.000 0.033 0.000 0.050 0.017 0.000 0.000 0.000 0.000 0.000 0.050 0.0000.019 1.000 1.000 na na 1.000 na 1.000 1.000 na na na na na 1.000 na
MDH-A* 1 1 1 1 1 2 1 1 1 1 1 1 1 1 1 20.000 0.000 0.000 0.000 0.000 0.017 0.000 0.000 0.000 0.000 0.000 0.000 0.000 0.000 0.000 0.017
na na na na na 1.000 na na na na na na na na na 1.000MDH-B* 2 1 1 1 1 1 1 1 1 1 2 1 1 1 1 1
0.133 0.000 0.000 0.000 0.000 0.000 0.000 0.000 0.000 0.000 0.033 0.000 0.000 0.000 0.000 0.0001.000 na na na na na na na na na 1.000 na na na na na
SOD-A* 2 2 2 2 2 2 2 2 2 2 2 2 2 2 2 20.467 0.483 0.567 0.383 0.567 0.367 0.267 0.533 0.467 0.433 0.300 0.433 0.483 0.150 0.383 0.4171.000 1.000 0.435 0.543 0.163 1.000 0.221 0.259 1.000 1.000 0.162 1.000 0.380 0.396 0.544 1.000
Lma12 3 6 4 5 4 5 4 4 4 4 5 4 3 3 4 40.100 0.500 0.379 0.567 0.300 0.586 0.539 0.567 0.500 0.433 0.448 0.250 0.367 0.600 0.400 0.4140.165 0.415 0.758 0.005 0.253 0.197 0.737 0.912 1.000 0.381 0.623 0.025 1.000 1.000 0.810 0.233
Mdo3 4 3 4 3 3 3 3 3 4 4 4 4 7 4 6 50.467 0.600 0.724 0.700 0.533 0.767 0.828 0.767 0.633 0.600 0.567 0.600 0.700 0.633 0.533 0.7670.238 1.000 0.616 0.081 0.405 0.564 0.038 0.488 0.338 0.556 0.482 0.464 0.100 0.458 0.116 0.084
Mdo6 2 1 1 1 1 2 1 3 2 2 2 1 3 3 3 30.033 0.000 0.000 0.000 0.000 0.067 0.000 0.138 0.067 0.133 0.100 0.000 0.200 0.133 0.033 0.100
na na na na na 1.000 na 0.072 1.000 1.000 1.000 na 1.000 1.000 0.015 1.000Mdo7 2 2 3 2 2 2 2 2 3 3 3 2 3 2 2 2
0.400 0.367 0.286 0.233 0.533 0.250 0.044 0.100 0.133 0.233 0.310 0.039 0.133 0.148 0.100 0.1381.000 0.418 0.064 0.102 0.218 1.000 1.000 1.000 1.000 0.226 1.000 1.000 0.031 1.000 1.000 1.000
Msa13 3 4 5 4 3 3 3 3 5 3 3 4 3 3 5 40.138 0.100 0.172 0.267 0.100 0.233 0.333 0.393 0.400 0.500 0.300 0.423 0.367 0.621 0.567 0.4331.000 1.000 0.330 0.509 1.000 0.136 1.000 0.020 0.271 0.253 0.019 0.846 0.075 0.917 0.620 0.025
Msa21 5 4 4 3 4 4 4 5 3 4 5 5 6 4 5 40.600 0.633 0.483 0.500 0.733 0.667 0.792 0.500 0.500 0.500 0.600 0.680 0.567 0.500 0.633 0.5000.901 0.419 0.016 0.430 0.557 0.356 0.121 0.689 0.140 0.535 0.952 0.903 0.940 0.032 0.382 0.051
Msa29 3 4 4 2 2 3 3 4 3 3 2 5 5 2 2 30.222 0.533 0.448 0.433 0.435 0.536 0.455 0.348 0.400 0.467 0.467 0.370 0.552 0.464 0.400 0.4000.340 0.215 0.061 1.000 1.000 0.508 0.152 0.008 0.431 0.848 0.637 0.404 0.002 1.000 1.000 0.670
MiSaTPW60 13 19 26 18 14 22 26 20 19 24 21 16 22 18 22 260.767 0.923 0.897 0.846 0.900 0.917 0.889 0.808 0.846 0.926 0.905 0.690 0.828 0.920 0.852 0.9670.219 0.876 0.386 0.276 0.972 0.247 0.152 0.306 0.194 0.423 0.306 0.059 0.303 0.916 0.150 0.518
MiSaTPW70 18 24 24 16 17 19 15 14 21 18 17 13 26 18 11 210.862 0.800 0.889 0.862 0.900 0.933 0.667 0.640 0.759 0.556 0.667 0.727 0.933 0.808 0.793 0.7600.773 0.000* 0.849 0.729 0.859 0.941 0.116 0.094 0.161 0.000 0.004 0.094 0.631 0.264 0.359 0.019
FLORIDA BASS GENETIC RELATIONSHIPS 1639

TABLE A.2.—Extended.
Locus King StJo Ocea Sant Samp Wacc Suwa Stei Cher Auci Jack Talq Semi Apal Choc Esca
AAT-A* 2 2 2 2 2 2 1 1 1 2 2 2 1 2 3 20.083 0.067 0.050 0.300 0.017 0.050 0.000 0.000 0.000 0.065 0.117 0.017 0.000 0.117 0.217 0.0331.000 1.000 1.000 0.332 1.000 1.000 Na na na 1.000 1.000 1.000 na 1.000 1.000 1.000
AAT-B* 2 3 3 2 3 3 3 2 4 3 3 3 4 3 4 40.417 0.550 0.517 0.533 0.533 0.467 0.583 0.383 0.533 0.226 0.600 0.733 0.617 0.367 0.400 0.5331.000 0.277 0.007 0.796 0.888 0.772 0.524 0.543 0.010 0.010 0.281 0.784 0.935 0.891 0.772 0.018
IDH-B* 1 1 2 2 2 2 2 2 1 2 2 2 2 2 2 20.000 0.000 0.433 0.300 0.217 0.033 0.050 0.083 0.000 0.129 0.153 0.417 0.483 0.367 0.433 0.200
na na 0.756 0.442 1.000 1.000 1.000 1.000 na 0.055 1.000 0.412 0.561 0.4280 0.429 1.000MDH-A* 1 1 2 1 1 1 1 1 1 1 2 2 2 2 2 1
0.000 0.000 0.067 0.000 0.000 0.000 0.000 0.000 0.000 0.000 0.117 0.117 0.283 0.483 0.050 0.000na na 1.000 na na na na na na na 1.000 1.000 0.429 0.014 1.000 na
MDH-B* 1 1 1 1 1 2 1 1 1 1 1 1 1 1 1 10.000 0.000 0.000 0.000 0.000 0.017 0.000 0.000 0.000 0.000 0.000 0.000 0.000 0.000 0.000 0.000
na na na na na 1.000 na na na na na na na na na naSOD-A* 2 2 2 2 2 2 2 2 2 2 na na 2 2 2 2
0.400 0.417 0.317 0.483 0.383 0.533 0.467 0.517 0.367 0.387 0.333 0.417 0.200 0.1000.558 0.414 0.703 0.784 0.543 0.402 1.000 1.000 0.241 0.679 1.000 0.208 0.110 1.000
Lma12 3 4 3 4 3 3 3 2 4 3 na 3 4 3 4 30.600 0.467 0.533 0.690 0.400 0.567 0.357 0.567 0.600 0.296 0.250 0.414 0.241 0.600 0.4140.373 0.454 1.000 1.000 0.479 0.133 1.000 0.711 0.816 0.234 1.000 0.090 0.037 0.281 0.348
Mdo3 3 6 4 6 4 5 3 2 3 5 na 5 5 7 7 60.633 0.567 0.467 0.700 0.700 0.567 0.172 0.367 0.367 0.724 0.833 0.759 0.833 0.633 0.2000.181 0.577 0.060 0.242 0.431 0.434 0.165 1.000 0.352 0.966 0.232 0.432 0.796 0.136 0.037
Mdo6 1 2 2 4 3 3 3 3 4 5 na 3 4 5 5 40.000 0.100 0.267 0.233 0.172 0.133 0.286 0.333 0.233 0.333 0.133 0.750 0.633 0.600 0.400
na 1.000 0.306 0.010 0.101 1.000 0.157 0.103 0.027 0.006 0.032 0.769 0.038 0.901 0.619Mdo7 2 3 3 1 1 4 2 1 1 1 na 3 2 1 4 4
0.179 0.333 0.200 0.000 0.000 0.143 0.042 0.000 0.000 0.000 0.179 0.035 0.000 0.467 0.5191.000 1.000 1.000 Na Na 1.000 1.000 na na na 1.000 1.000 Na 0.565 0.408
Msa13 3 6 4 6 5 4 7 4 3 4 na 4 8 4 8 60.400 0.393 0.433 0.733 0.483 0.250 0.360 0.172 0.267 0.464 0.567 0.759 0.679 0.667 0.3930.368 0.176 0.411 0.589 0.327 0.532 0.163 0.002 1.000 0.379 0.194 0.571 0.509 0.778 0.017
Msa21 2 4 4 5 5 5 5 5 3 6 na 5 6 5 6 40.633 0.483 0.533 0.393 0.414 0.192 0.480 0.464 0.667 0.586 0.621 0.571 0.593 0.733 0.1380.271 0.828 1.000 0.484 0.014 0.001* 0.004 0.002 0.498 0.019 0.488 0.167 0.193 0.854 1.000
Msa29 2 3 2 2 2 3 2 2 3 3 na 4 5 5 6 40.267 0.647 0.100 0.185 0.207 0.077 0.231 0.440 0.300 0.519 0.448 0.462 0.526 0.536 0.5420.306 0.325 0.164 1.000 0.427 0.058 1.000 0.687 1.000 0.761 0.473 0.008 0.874 0.281 0.241
MiSaTPW60 16 23 14 23 19 18 25 13 12 20 na 26 20 15 19 181.000 0.897 0.833 0.933 0.963 0.800 0.833 0.652 0.862 0.880 0.933 0.958 0.938 0.900 0.7920.832 0.074 0.180 0.273 0.697 0.178 0.059 0.000* 0.205 0.217 0.773 0.173 0.557 0.227 0.050
MiSaTPW70 14 18 9 16 22 15 18 9 14 16 na 17 17 14 21 170.815 0.852 0.467 0.759 0.821 0.522 0.786 0.857 0.700 0.964 0.778 0.929 0.870 0.759 0.8890.058 0.156 0.027 0.142 0.013 0.007 0.091 0.904 0.067 0.530 0.237 0.073 0.653 0.000* 0.698
1640 BARTHEL ET AL.
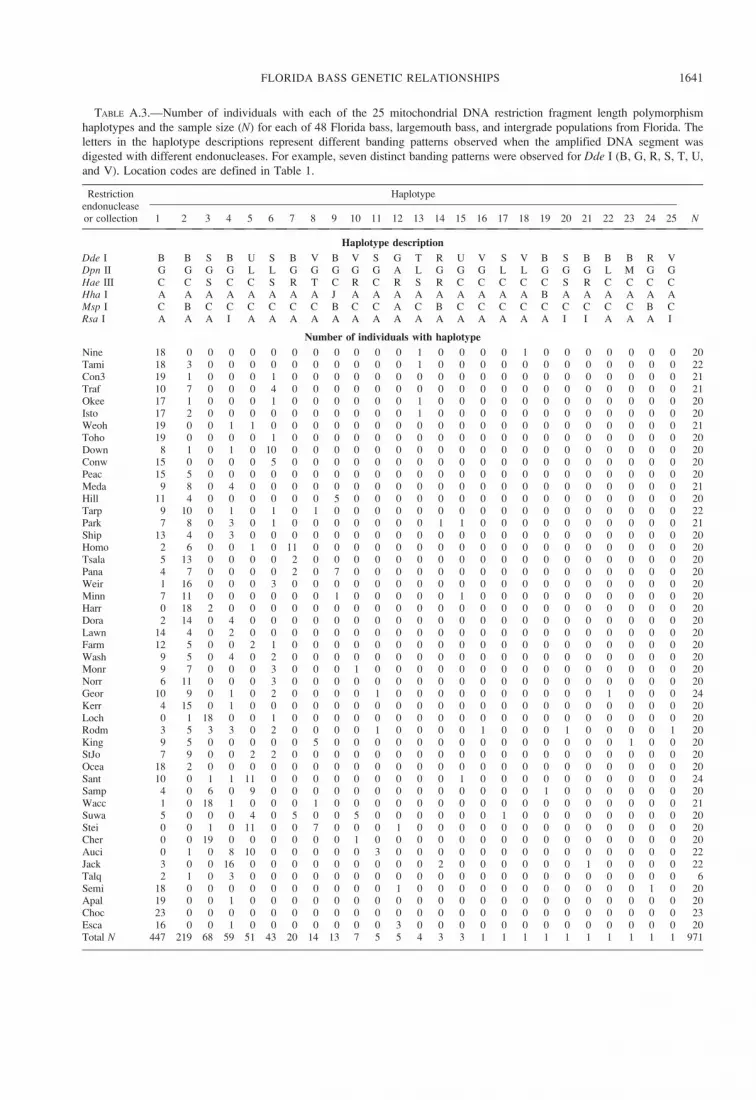
TABLE A.3.—Number of individuals with each of the 25 mitochondrial DNA restriction fragment length polymorphism
haplotypes and the sample size (N) for each of 48 Florida bass, largemouth bass, and intergrade populations from Florida. The
letters in the haplotype descriptions represent different banding patterns observed when the amplified DNA segment was
digested with different endonucleases. For example, seven distinct banding patterns were observed for Dde I (B, G, R, S, T, U,
and V). Location codes are defined in Table 1.
Restrictionendonucleaseor collection
Haplotype
N1 2 3 4 5 6 7 8 9 10 11 12 13 14 15 16 17 18 19 20 21 22 23 24 25
Haplotype description
Dde I B B S B U S B V B V S G T R U V S V B S B B B R VDpn II G G G G L L G G G G G A L G G G L L G G G L M G GHae III C C S C C S R T C R C R S R C C C C C S R C C C CHha I A A A A A A A A J A A A A A A A A A B A A A A A AMsp I C B C C C C C C B C C A C B C C C C C C C C C B CRsa I A A A I A A A A A A A A A A A A A A A I I A A A I
Number of individuals with haplotype
Nine 18 0 0 0 0 0 0 0 0 0 0 0 1 0 0 0 0 1 0 0 0 0 0 0 0 20Tami 18 3 0 0 0 0 0 0 0 0 0 0 1 0 0 0 0 0 0 0 0 0 0 0 0 22Con3 19 1 0 0 0 1 0 0 0 0 0 0 0 0 0 0 0 0 0 0 0 0 0 0 0 21Traf 10 7 0 0 0 4 0 0 0 0 0 0 0 0 0 0 0 0 0 0 0 0 0 0 0 21Okee 17 1 0 0 0 1 0 0 0 0 0 0 1 0 0 0 0 0 0 0 0 0 0 0 0 20Isto 17 2 0 0 0 0 0 0 0 0 0 0 1 0 0 0 0 0 0 0 0 0 0 0 0 20Weoh 19 0 0 1 1 0 0 0 0 0 0 0 0 0 0 0 0 0 0 0 0 0 0 0 0 21Toho 19 0 0 0 0 1 0 0 0 0 0 0 0 0 0 0 0 0 0 0 0 0 0 0 0 20Down 8 1 0 1 0 10 0 0 0 0 0 0 0 0 0 0 0 0 0 0 0 0 0 0 0 20Conw 15 0 0 0 0 5 0 0 0 0 0 0 0 0 0 0 0 0 0 0 0 0 0 0 0 20Peac 15 5 0 0 0 0 0 0 0 0 0 0 0 0 0 0 0 0 0 0 0 0 0 0 0 20Meda 9 8 0 4 0 0 0 0 0 0 0 0 0 0 0 0 0 0 0 0 0 0 0 0 0 21Hill 11 4 0 0 0 0 0 0 5 0 0 0 0 0 0 0 0 0 0 0 0 0 0 0 0 20Tarp 9 10 0 1 0 1 0 1 0 0 0 0 0 0 0 0 0 0 0 0 0 0 0 0 0 22Park 7 8 0 3 0 1 0 0 0 0 0 0 0 1 1 0 0 0 0 0 0 0 0 0 0 21Ship 13 4 0 3 0 0 0 0 0 0 0 0 0 0 0 0 0 0 0 0 0 0 0 0 0 20Homo 2 6 0 0 1 0 11 0 0 0 0 0 0 0 0 0 0 0 0 0 0 0 0 0 0 20Tsala 5 13 0 0 0 0 2 0 0 0 0 0 0 0 0 0 0 0 0 0 0 0 0 0 0 20Pana 4 7 0 0 0 0 2 0 7 0 0 0 0 0 0 0 0 0 0 0 0 0 0 0 0 20Weir 1 16 0 0 0 3 0 0 0 0 0 0 0 0 0 0 0 0 0 0 0 0 0 0 0 20Minn 7 11 0 0 0 0 0 0 1 0 0 0 0 0 1 0 0 0 0 0 0 0 0 0 0 20Harr 0 18 2 0 0 0 0 0 0 0 0 0 0 0 0 0 0 0 0 0 0 0 0 0 0 20Dora 2 14 0 4 0 0 0 0 0 0 0 0 0 0 0 0 0 0 0 0 0 0 0 0 0 20Lawn 14 4 0 2 0 0 0 0 0 0 0 0 0 0 0 0 0 0 0 0 0 0 0 0 0 20Farm 12 5 0 0 2 1 0 0 0 0 0 0 0 0 0 0 0 0 0 0 0 0 0 0 0 20Wash 9 5 0 4 0 2 0 0 0 0 0 0 0 0 0 0 0 0 0 0 0 0 0 0 0 20Monr 9 7 0 0 0 3 0 0 0 1 0 0 0 0 0 0 0 0 0 0 0 0 0 0 0 20Norr 6 11 0 0 0 3 0 0 0 0 0 0 0 0 0 0 0 0 0 0 0 0 0 0 0 20Geor 10 9 0 1 0 2 0 0 0 0 1 0 0 0 0 0 0 0 0 0 0 1 0 0 0 24Kerr 4 15 0 1 0 0 0 0 0 0 0 0 0 0 0 0 0 0 0 0 0 0 0 0 0 20Loch 0 1 18 0 0 1 0 0 0 0 0 0 0 0 0 0 0 0 0 0 0 0 0 0 0 20Rodm 3 5 3 3 0 2 0 0 0 0 1 0 0 0 0 1 0 0 0 1 0 0 0 0 1 20King 9 5 0 0 0 0 0 5 0 0 0 0 0 0 0 0 0 0 0 0 0 0 1 0 0 20StJo 7 9 0 0 2 2 0 0 0 0 0 0 0 0 0 0 0 0 0 0 0 0 0 0 0 20Ocea 18 2 0 0 0 0 0 0 0 0 0 0 0 0 0 0 0 0 0 0 0 0 0 0 0 20Sant 10 0 1 1 11 0 0 0 0 0 0 0 0 0 1 0 0 0 0 0 0 0 0 0 0 24Samp 4 0 6 0 9 0 0 0 0 0 0 0 0 0 0 0 0 0 1 0 0 0 0 0 0 20Wacc 1 0 18 1 0 0 0 1 0 0 0 0 0 0 0 0 0 0 0 0 0 0 0 0 0 21Suwa 5 0 0 0 4 0 5 0 0 5 0 0 0 0 0 0 1 0 0 0 0 0 0 0 0 20Stei 0 0 1 0 11 0 0 7 0 0 0 1 0 0 0 0 0 0 0 0 0 0 0 0 0 20Cher 0 0 19 0 0 0 0 0 0 1 0 0 0 0 0 0 0 0 0 0 0 0 0 0 0 20Auci 0 1 0 8 10 0 0 0 0 0 3 0 0 0 0 0 0 0 0 0 0 0 0 0 0 22Jack 3 0 0 16 0 0 0 0 0 0 0 0 0 2 0 0 0 0 0 0 1 0 0 0 0 22Talq 2 1 0 3 0 0 0 0 0 0 0 0 0 0 0 0 0 0 0 0 0 0 0 0 0 6Semi 18 0 0 0 0 0 0 0 0 0 0 1 0 0 0 0 0 0 0 0 0 0 0 1 0 20Apal 19 0 0 1 0 0 0 0 0 0 0 0 0 0 0 0 0 0 0 0 0 0 0 0 0 20Choc 23 0 0 0 0 0 0 0 0 0 0 0 0 0 0 0 0 0 0 0 0 0 0 0 0 23Esca 16 0 0 1 0 0 0 0 0 0 0 3 0 0 0 0 0 0 0 0 0 0 0 0 0 20Total N 447 219 68 59 51 43 20 14 13 7 5 5 4 3 3 1 1 1 1 1 1 1 1 1 1 971
FLORIDA BASS GENETIC RELATIONSHIPS 1641


