Embed Size (px)
Citation preview

Biochemical Systematics and Ecology 41 (2012) 74–82
Contents lists available at SciVerse ScienceDirect
Biochemical Systematics and Ecology
journal homepage: www.elsevier .com/locate/biochemsyseco
Genetic variability in the Sardinian population of the manila clam,Ruditapes philippinarum
L. Mura a, P. Cossu b, A. Cannas a, F. Scarpa b, D. Sanna b, G.L. Dedola b, R. Floris a, T. Lai b,B. Cristo b, M. Curini-Galletti b, N. Fois a, M. Casu b,*
aAgris Sardegna, Agenzia per la Ricerca in Agricoltura, Dipartimento per la Ricerca nelle Produzioni Animali, Località Bonassai, 07040 Olmedo (SS), ItalybDipartimento di Zoologia e Genetica Evoluzionistica, Università di Sassari, Via F. Muroni 25, 07100 Sassari (SS), Italy
a r t i c l e i n f o
Article history:Received 26 June 2011Accepted 19 November 2011Available online 11 January 2012
Keywords:Biological invasionIntroduced speciesGenetic variabilityManila clam
* Corresponding author. Tel.: þ39 (0)79 228924;E-mail address: [email protected] (M. Casu).
0305-1978/$ – see front matter � 2011 Elsevier Ltddoi:10.1016/j.bse.2011.11.002
a b s t r a c t
The genetic variability of microsatellites was investigated among allochthonous pop-ulations of Ruditapes philippinarum (Bivalvia, Veneridae) at six sites in the Gulf of Olbia(North-East Sardinia) and one site in the Lagoon of Sacca di Goro (North Adriatic Sea). Ourresults demonstrate the lack of genetic substructuring of R. philippinarum populationswithin the Gulf of Olbia. Furthermore, we found highly similar estimates of within-population genetic variability without evidence of genetic differentiation betweenSardinian and Adriatic populations. The lack of a signature of a founder effect in theSardinian samples, notwithstanding their recent introduction, indicates that the number ofR. philippinarum individuals released into the Gulf of Olbia may have been high enough toreduce the loss of genetic variability due to genetic drift. Furthermore, the absence ofgenetic differentiation observed between samples from the two areas suggests that thetwo populations belong to the same gene pool. Our results also indicated that R. philip-pinarum is rapidly colonizing the Gulf of Olbia and the neighboring areas, which is likelyfavored by its high potential for dispersal.
� 2011 Elsevier Ltd. All rights reserved.
1. Introduction
The introduction of allochthonous species in marine habitats is a traditional practice in aquaculture, particularly whenfisheries are depleted due to the overexploitation of native species (see e.g. Breber, 1985; Pellizzato et al., 1989). However, thismethod can often pose serious risks (e.g., local extinction, hybridization) to indigenous species, particularly when farming isperformedwithout separation of the farmed area from natural biotopes (seeWonham and Carlton, 2005). The introduction ofthe Manila clam Ruditapes philippinarum (Adams and Reeve, 1850) (Bivalvia: Veneridae) to Europe in the 1970s and 1980s(Gosling, 2003) from its native habitat on the West coast of the Pacific from Russia to the Philippines serves as a paradigm forsuch a phenomenon. Since then, the Manila clam has rapidly spread along European coastlines, becoming the maincontributor to local clam fisheries. The Manila clam was released in the North-East Adriatic in the 1980s (Breber, 1985) tocounter the dramatic depletion of several native species due to overexploitation and/or pollution (Savini et al., 2010). In theAdriatic, the Manila clam progressively occupied the ecological niche of the indigenous European grooved carpet shell,Ruditapes decussatus L., 1758, which led to the extinction of local populations (Jensen et al., 2004).
fax: þ39 (0)79 228665.
. All rights reserved.

L. Mura et al. / Biochemical Systematics and Ecology 41 (2012) 74–82 75
In 2008, several specimens of R. philippinarumwere found in the Gulf of Olbia (North-East Sardinia). This species has nowbecome abundant (Cannas et al., 2009) and has established the first recorded population of Manila clam in Sardinia. Theintroduction of this species was likely the result of the ‘accidental’ release of adult individuals a few years earlier due tocareless management by fishery operators that were conducting legal stabulation processes in the town of Olbia (Cannas,pers. comm.; Cristo, pers. comm.).
The amount of initial genetic variability, as well as the potential for dispersal and a high growth rate, may play animportant role in determining the spread of an invasive species by favoring its adaptation to new environments (Romanand Darling, 2007; Estoup and Guillemaud, 2010). Furthermore, a high genetic variability may overcome the deleteriouseffects of inbreeding on population growth (Bakker et al., 2009; Eales et al., 2010). Notably, the evolutionary potential ofan invasive species relies more on the initial amount of genetic variability than the number of introduction events (Ealeset al., 2010).
Despite the importance of following the evolution of genetic variability of allochthonous species, few studies onthe genetic structure of the Manila clam have been performed to date (Kijima et al., 1987; Oniwa et al., 1988;Yokogawa, 1998; Sekine et al., 2006; Vargas et al., 2008; Chiesa et al., 2011). To our knowledge, only two of thesestudies focused on Mediterranean clam populations: Hurtado et al. (2011) uncovered evidence for hybridizationbetween R. philippinarum and R. decussatus along North-West Spain, and Chiesa et al. (2011) suggested that patternsof genetic variation in clam populations from the North Adriatic Sea may have been shaped by multiple introductionevents.
Therefore, our study was designed to analyze the genetic variation of microsatellites among R. philippinarum specimenscollected at different sites in the Gulf of Olbia, with the twofold aim of detecting whether (i) genetic substructuring is presentwithin this area and whether (ii) a recent founder effect occurred in the Gulf of Olbia. To this end, we compared estimates ofwithin-population genetic variability of Sardinian samples with those of a formerly established, farmed population from theNorth Adriatic.
2. Materials and methods
A total of 195 specimens were collected from tidal flats at six different sites within the Gulf of Olbia at an average depth of5–6 m. The sediment structure at the six sites was mostly characterized by coarse sand (0.5–1.0 mm grain size). Furthermore,99 specimens were sampled within a farming area in the Lagoon of Sacca di Goro (SGR). For each individual, the total length,width, and height were measured (Table 1, Fig. 1).
Genomic DNA was isolated either from the muscle or from the mantle tissue using a modified alkaline/CTAB/NaCllysis method and subsequent silicon dioxide treatment (Neudecker and Grimm, 2000). Approximately 50 mg of frozentissue was incubated for 30 min at 65 �C in 200 ml of extraction buffer (NaOH 0.02 M, NaCl 2.5 M, CTAB 1%). The extractwas then neutralized with the addition of 0.02 M Tris–HCl buffer (0.01 M Tris pH 8.0, 0.02 M HCl).
Six microsatellite loci (Asari16, Asari24, Asari43, Asari55, Asari62, and Asari64) (Yasuda et al., 2007) were used in thisstudy. PCR was performed in a 25 ml solution containing 20–40 ng of genomic DNA,1� reaction buffer, 2 mMMgCl2, 0.2 mMof each dNTP, 1 U of EuroTaq (Euroclone), multiplexed fluorescent dye-labeled primers at different concentrations, anddeionized water. PCR was performed in a MJ DNA Engine PTC-100 thermal cycler under the following conditions: an initialcycle at 95 �C for 5 min, followed by 30 cycles of 94 �C for 30 s, 50 �C for 30 s, and 72 �C for 30 s. Microsatellite loci werevisualized on an ABI PRISM 3130xl Genetic Analyzer (Applied Biosystems) and analyzed using GENEMAPPER 4.0 software(Applied Biosystems).
Genetic relationships among the sampling sites were visualized by means of a principal coordinate analysis (PCoA).The ordination plot was built using GENALAEX 6.3 software (Peakall and Smouse, 2006) on a matrix of genotypicdistances.
Genetic structure was also investigated with an individual-based approach (Mank and Avise, 2004). Genetic sub-structuring was inferred by the Bayesian model-based clustering algorithm that is included in the STRUCTURE 2.2.3 software
Table 1Details of the sampling plan. The codes of Ruditapes philippinarum, sampling sites, coordinates, number of individuals, and shell size are reported.
Code Locality Coordinates # ofindividuals
Size range (mm)
TL TW TH
GOL1 Gulf of Olbia, NE Sardinia 40�55055.6700N; 09�31054.0800E 50 13.6–40.0 8.9–27.7 4.9–16.8GOL2 Gulf of Olbia, NE Sardinia 40�55016.5400N; 09�30047.6300E 50 15.1–33.0 10.7–23.0 6.0–16.0GOL3 Gulf of Olbia, NE Sardinia 40�55000.5900N; 09�30046.4800E 25 13.8–42.2 9.4–28.9 5.3–19.7GOL4 Gulf of Olbia, NE Sardinia 40�55009.2600N; 09�32031.6000E 25 10.3–35.0 7.3–25.8 4.2–16.7GOL5 Gulf of Olbia, NE Sardinia 40�55009.1900N; 09�33016.1300E 48 13.2–32.1 8.6–26.6 4.7–14.4GOL6 Gulf of Olbia, NE Sardinia 40�55000.2300N; 09�33019.7600E 25 13.9–38.6 9.4–29.4 5.0–21.0SGR Lagoon of Sacca di Goro, N Adriatic 44�48049.7800N; 12�16050.6300E 99 31.6–41.5 24–30.1 17.5–22.4
TL: total length; TW: total width; and TH: total height.

Fig. 1. Sampling sites of Ruditapes philippinarum. The samples from the Gulf of Olbia are reported in the inset. For the sample codes, see Table 1.
L. Mura et al. / Biochemical Systematics and Ecology 41 (2012) 74–8276
(Pritchard et al., 2000), applying the admixture model with correlated allelic frequencies (Falush et al., 2003). The most likelypopulation structure was inferred from multilocus individual genotypes by estimating the posterior probability of the data(PPD) according to Pritchard andWen (2004) and, if necessary, the consistency of results across runs. For each value of K (thenumber of assumed genetic clusters), ten independent runs were performed, each consisting of 100,000 iterations aftera burn-in period of 100,000.
Furthermore, the partitioning of genetic variation within and among sampling sites was estimated by AMOVA(Analysis of Molecular Variance) using ARLEQUIN 3.52 software (Excoffier and Lischer, 2010). The significance of geneticdifferentiation was tested by a permutation test (10,000 replicates). Overall FST was calculated, followed by a pairwisecomputation of RST values (Slatkin, 1995) between all pairs of sampling sites within the Gulf of Olbia and the Adriaticsample. The significance of the random distribution of individuals among sampling sites was evaluated with exact teststhat are analogous to Fisher’s contingency tables (Raymond and Rousset, 1995). We defined two populations fromsubsequent genetic analyses based upon the results of genetic structuring: one population was obtained by pooling thesamples from the Gulf of Olbia (SPOOL), and the other population represented the sample from the Lagoon of Sacca diGoro (SGR).
Conformity to Hardy–Weinberg equilibrium (HWE) and linkage disequilibrium (LD) were tested with the Markovchain randomization test (Guo and Thompson, 1992) using GENEPOP 4.0 (Rousset, 2008). Whenever necessary, thesequential Bonferroni correction was applied to P values to avoid type I errors that can occur due to multiple testing(Hochberg, 1988).
Estimates of genetic variability were computed using the GENALEX software. The number and size range of alleles,allelic frequencies, observed (Ho) and expected (He) heterozygosity, and inbreeding coefficient (FIS) values were estimatedat each microsatellite locus. Moreover, the mean number of alleles (Na), the number of effective alleles (Ne), and theobserved (Ho) and expected (He) heterozygosity were also calculated for the loci of each inferred population (SPOOLand SGR).
The statistical significance for differences in the expected heterozygosity was tested with a Wilcoxon rank-sum test, usingthe R 2.11.1 package (R Development Core Team, 2010).
The possibility of a founder effect due to recent colonization or expansion in SPOOL and SGR was tested using thesoftware BOTTLENECK 1.2.02 (Cornuet and Luikart, 1996; Piry et al., 1999). Indeed, after genetic bottlenecks, the number ofalleles reduced faster than heterozygosity, leading to excess of gene diversity when compared to a mutation-drift equi-librium. Conversely, an expanding population accumulates new alleles at a high rate, which contribute little to heterozy-gosity because of their low frequency, resulting in a gene diversity that was lower than expected at mutation-driftequilibrium (Luikart et al., 1998). Because the expected heterozygosity is highly dependent on the selected model ofmicrosatellite evolution (Hawley et al., 2006), the analysis was performed using both the strict stepwise mutation model(SMM) and the two-phase mutation model (TPM) (see Cornuet and Luikart, 1996). Here, the reported results are based onsimulations with a TPM model set at 95% and the infinite allele model at 5%. The significance of the tests was assessed

Fig. 2. Principal coordinate analysis (PCoA). The plot depicts the genetic relationships among all sampling sites. For the sample codes, see Table 1.
Table 2Estimation of the best-fit model of population structure. The number ofassumed genetic clusters (K), the likelihood of the posterior probability ofthe model given the data (LnP(D)), and the posterior probability of the data(PPD) are reported.
K LnP(D) PPD
1 �5575.84 12 �5757.19 w03 �6253.89 w04 �7391.75 w05 �6212.24 w0
L. Mura et al. / Biochemical Systematics and Ecology 41 (2012) 74–82 77
using Wilcoxon rank-sum test, which is the most appropriate test when fewer than 20 microsatellite loci are used (Piryet al., 1999).
3. Results
Screening 294 specimens of R. philippinarum yielded a total of 87 alleles (see the Appendix), resulting in 286 uniqueindividual multilocus genotypes (representing approximately 97% of the specimens).
A PCoA plot of the first two principal coordinates (77% of total genetic variation) did not show a clear separation betweenthe Adriatic and Sardinian samples (Fig. 2). However, the ordination of samples from the Gulf of Olbia along the first principalcoordinate appeared to confirm their geographic position (Fig. 1).
Nevertheless, the highest posterior probability of the data was obtained using the model with K¼ 1, which wasretrieved by STRUCTURE (Table 2), supporting the lack of genetic structuring both within the Gulf of Olbia and betweensamples from the Gulf of Olbia and the Lagoon of Sacca di Goro. Similar results were obtained using AMOVA(FST¼ 0.004, P> 0.05). Exact tests of population differentiation did not demonstrate divergence (i) among samplingsites within the Gulf of Olbia, and (ii) between these samples and the Adriatic sample (pairwise RST values are given inTable 3).
Table 3Pairwise RST values. The RST values are shown below the diagonal. The probability values based on an exact test of population differentiation based ona Markov chain with 100,000 steps and 10,000 dememorization steps are shown above the diagonal. For the sample codes, see Table 1.
RST GOL1 GOL2 GOL3 GOL4 GOL5 GOL6 SGR
GOL1 – 0.103 0.116 0.110 0.058 0.231 0.107GOL2 �0.0015 – 1.000 1.000 1.000 1.000 1.000GOL3 �0.0175 0.0280 – 1.000 1.000 1.000 1.000GOL4 �0.0035 0.0325 0.0054 – 1.000 1.000 1.000GOL5 �0.0036 0.0256 �0.0144 �0.0068 – 1.000 1.000GOL6 0.0047 0.0024 0.0296 0.0597 0.0354 – 1.000SGR �0.0049 0.0221 �0.0060 �0.0065 �0.0272 0.0232 –
*P< 0.05; **P< 0.01; ***P< 0.001.

Fig. 3. Histograms depicting the allelic frequencies of each microsatellite locus in the Gulf of Olbia and the Lagoon of Sacca di Goro. Alleles for each locus arereported on the x-axis and their frequencies on the y-axis. Gray bar: SPOOL (Sardinian pooled sample); black bar: SGR (Adriatic sample).
Table 4Summary of the microsatellite-based estimates of intrapopulation genetic variability. The locus name, number of alleles, size range, observed heterozygosity(HO), expected heterozygosity (HE) and their respective standard errors (SE), and inbreeding coefficient (FIS) are reported.
Locus # of alleles Size range (bp) HO (�SE) HE (�SE) FIS
Asari16 12 157–183 0.821� 0.022 0.836� 0.006 0.019Asari24 7 161–189 0.448� 0.025 0.503� 0.020 0.109Asari43 14 106–151 0.319� 0.039 0.284� 0.031 �0.121Asari55 20 188–226 0.617� 0.049 0.816� 0.015 0.245Asari62 17 213–253 0.746� 0.034 0.759� 0.013 0.018Asari64 17 110–148 0.737� 0.027 0.708� 0.014 �0.041
L. Mura et al. / Biochemical Systematics and Ecology 41 (2012) 74–8278
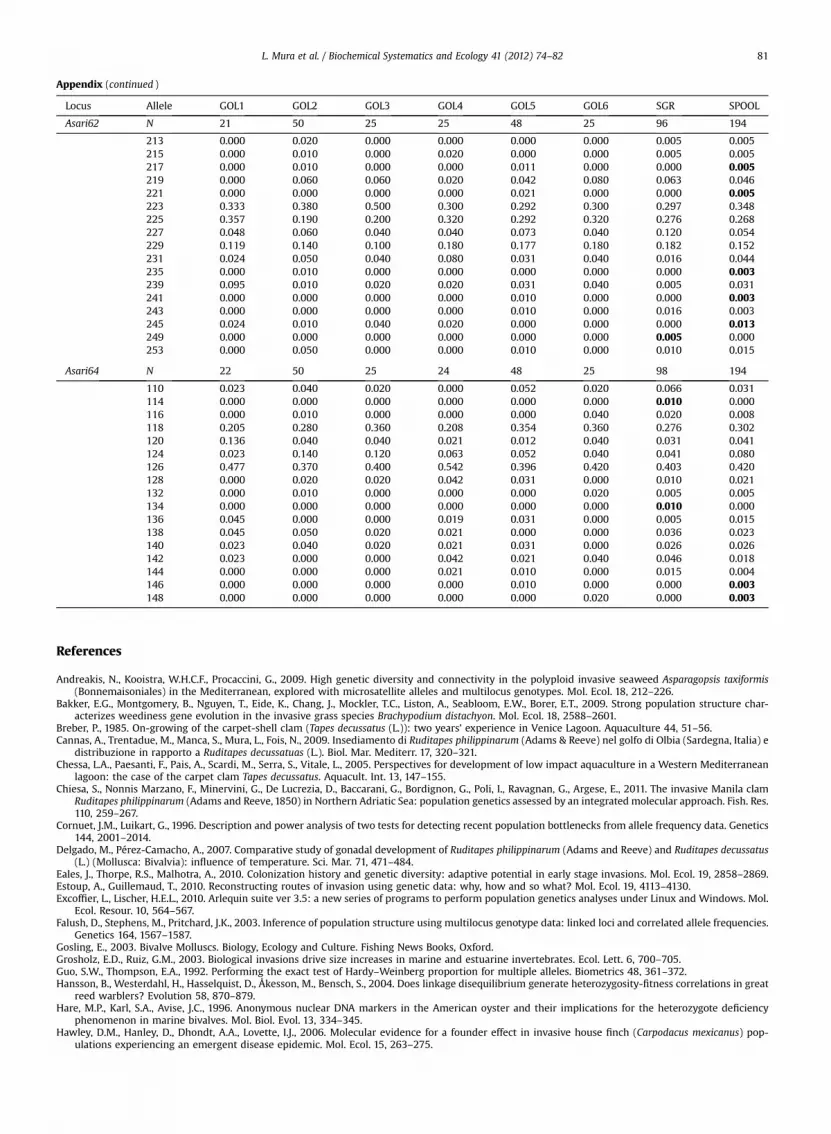
After pooling the Sardinian samples (SPOOL), we found that the allele frequencies were very similar to the Adriaticpopulation (SGR) (Appendix, Fig. 3). Although population-specific alleles (private alleles) were present in both populations(18 and 10 in SPOOL and SGR, respectively), they occurred at very low frequencies, and 20 out of 28 alleles were found ina single individual. Alleles 165 and 177 at Asari16, the private alleles with the highest frequency, were found in seven and sixspecimens in SPOOL, respectively (Appendix, Fig. 3).
Significant deviations from HWE (P< 0.05 after sequential Bonferroni correction for multiple tests) were found at locusAsari55 in SPOOL and at loci Asari24 and Asari55 in SGR. In both cases, the deviations from HWE are caused by a deficit ofheteozygotes, as evidenced by the positive FIS values at these loci (Table 4).
Only two out of the 30 pairs of loci showed a significant LD after the sequential Bonferroni correction (P< 0.05).Because pairwise comparisons at one or two loci are expected to show genotypic disequilibrium over 30 pairs by chance(specifically 1.5 out of 30, corresponding to the cut-off of 5%), the loci were considered to be unlinked. Moreover, twopairs of loci with a significant LD (Asari16-Asari55 and Asari16-Asari62) were found only in SPOOL.
The mean number and the effective number of alleles were comparable for SPOOL (Na¼ 12.833�1.797;Ne¼ 4.074� 0.892) and SGR (Na¼ 11.500�1.607; Ne¼ 4.151�0.814). In SPOOL we found Ho¼ 0.621�0.077, andHe¼ 0.662� 0.091. Comparable values were obtained in SGR (Ho¼ 0.626� 0.090; He¼ 0.680� 0.087). Indeed, the expectedheterozygosity of SPOOL was not significantly lower than SGR (P¼ 1; Wilcoxon rank-sum test). Table 5 reports the Wilcoxonrank-sum test results for mutation-drift equilibrium under the SMM and TPM models.
Table 5Wilcoxon rank-sum test of the mutation-drift equilibrium. The stepwise mutation model (SMM) and a two-phase model (TPM) were estimated at sixmicrosatellite loci in SGR (Adriatic sample) and SPOOL (Sardinian pooled sample).
Heterozygosity deficiency Heterozygosity excess
SMM TPM SMM TPM
SGR 0.016 0.016 0.992 0.992SPOOL 0.008 0.016 1.000 0.992

L. Mura et al. / Biochemical Systematics and Ecology 41 (2012) 74–82 79
4. Discussion and conclusion
This study demonstrates a high degree of genetic variability of R. philippinarum at six microsatellite loci. At each locus, thesize range of the alleles, the number of alleles, and the number of effective alleles were higher than those reported by Yasudaet al. (2007). The observed and expected heterozygosity displayed values that were comparable in magnitude to those re-ported by Yasuda et al. (2007) and Chiesa et al. (2011). In particular, although the values of expected heterozygosity werelower in our samples at Asari24, Asari43 and Asari55 (Table 4), the differences in our values and in those detected by Yasudaet al. (2007) were not significant (Wilcoxon rank-sum test, P¼ 0.394). Two out of six loci, Asari24 (in SGR) and Asari55 (inSPOOL and SGR), showed an overall deficit of heterozygosity, a phenomenon that is common in other bivalves (i.e. Hare et al.,1996; Raymond et al., 1997; Vargas et al., 2008).
Chiesa et al. (2011) found moderate levels of genetic differentiation in microsatellites among clam populations from theNorth Adriatic Sea, hypothesizing that such genetic differentiation may be the result of multiple introductions from differentgene pools. In contrast, we detected a lack of genetic substructuring within the Gulf of Olbia (Tables 2 and 3). Our results aresuggestive of (i) a single introduction event or (ii) multiple introductions either from the same source population or fromgenetically undifferentiated populations.
The results provided by model-based clustering for the whole dataset (Table 2) also identified a common origin for theSardinian and Adriatic samples. Although private alleles were found in SPOOL, the two populations share the same gene pool,likely because not enough time has elapsed to achieve a significant amount of divergence (Hutchison and Templeton 1999).
Notably, while SPOOL showed numerous loci departing from HWE that are lower than SGR, only two pairs of loci dis-playing LD were found in the Sardinian population. Assuming that LD was not due to chance, the physical linkage of the locican be ruled out because the same pairs did not display LD in SGR. Furthermore, non-random associations of loci may occur inpopulations departing from HWE (Liu et al., 2006) and determine the so-called zygotic disequilibrium (Weir, 1996). Asubstantial LD may also be found in expanding populations that were initially bottlenecked as well as in recently introducedpopulations (Hansson et al., 2004, and references therein). The latter hypothesis fits with the historical data that point toa recent introduction of the Sardinian population.
A further outcome of the present study was the great similarity in the level of within-population genetic diversityamong the Sardinian samples from the Gulf of Olbia, regardless of whether they were pooled, and also in the sample fromthe Lagoon of Sacca di Goro, as evidenced by Wilcoxon rank-sum test, which was applied to the expected heterozygosity(P¼ 1). In fact, there was little evidence of a significant loss of genetic variability in SPOOL and SGR under the SSM andTPM mutation models (Table 5). Instead, they exhibited a significant deficit of heterozygozity with respect to geneticdiversity.
This finding suggests that the ‘wild’ population of the Gulf of Olbia is currently expanding (see Ribeiro et al., 2010). Thishypothesis is supported by the presence of several alleles that occur at low frequencies; for example, 25 out of 77 alleles(w32%) in SPOOL and 29 out of 69 alleles (w28%) in SGR were found at frequencies lower than 1% (Appendix). Thus, we canconclude that the two populations are either derived from the same source, or that the Sardinian population is derived fromindividuals that were farmed in the Adriatic and released in situ.
Regardless of the source of Sardinian samples, the number of individuals of R. philippinarum that were scattered in theGulf of Olbia may have been high enough to avoid the consequence of a founder effect. Indeed, the higher fecundity ratesthat invasive or introduced species exhibit in new environments (i.a. Grosholz and Ruiz, 2003) often overcome the loss ofgenetic diversity that is caused by genetic bottlenecks or the founder effect (Andreakis et al., 2009). In this context, R.philippinarum may be considered a ‘good invader’ species due to its effective larval dispersal and high rate of reproduction.Cannas et al. (2009) reported the occurrence of R. philippinarum recruits one year after their first recorded release in the Gulfof Olbia.
Interestingly, Delgado and Pérez-Camacho (2007) have reported that under the same experimental conditions, R. phil-ippinarum demonstrates superior reproductive performance when compared to R. decussatus. This trait, coupled with highlevels of genetic diversity, may allow R. philippinarum to quickly adapt to the new environmental conditions (see Estoup andGuillemaud, 2010, and the references therein).
The previously recorded hybridization between R. philippinarum and R. decussatus (Hurtado et al., 2011) representsa further threat, because hybridization may enhance the invasiveness of an allochthonous species by producing novelgenotypes that better adapt to local conditions (see Henry et al., 2009, and the references therein).
These factors raise concerns about the conservation and management of the autochthonous R. decussatus, whose pop-ulations may suffer from competition with R. philippinarum (Chessa et al., 2005) as well as the maladaptation that occurs asa result of hybridization between the two species (Hurtado et al., 2011). Finally, the recent introduction of R. philippinarum inSardinia offers the opportunity to follow the evolution of genetic variability in a geographic area where a newly introducedinvasive species has begun to spread.
Acknowledgments
This research was financially supported by the Agris Sardegna, Agenzia per la Ricerca in Agricoltura (Sardinia, Italy) andpartially by the Comune di Olbia (Sardinia, Italy).We are grateful to the anonymous refereewhose comments and suggestionshelped improve this manuscript.

L. Mura et al. / Biochemical Systematics and Ecology 41 (2012) 74–8280
Appendix. Allele frequencies
Private alleles in SGR (Adriatic sample) and SPOOL (Sardinian pooled sample) are highlighted in bold. For the sample codes, see Table 1.
Locus Allele GOL1 GOL2 GOL3 GOL4 GOL5 GOL6 SGR SPOOL
Asari16 N 22 50 25 25 48 25 96 195
157 0.000 0.000 0.020 0.000 0.000 0.000 0.005 0.001161 0.091 0.170 0.180 0.180 0.135 0.160 0.156 0.154163 0.091 0.100 0.120 0.120 0.125 0.120 0.135 0.113165 0.068 0.000 0.020 0.080 0.000 0.000 0.000 0.021167 0.114 0.060 0.060 0.020 0.104 0.100 0.094 0.077169 0.227 0.250 0.080 0.140 0.156 0.160 0.193 0.177171 0.273 0.210 0.340 0.240 0.271 0.140 0.193 0.244173 0.000 0.070 0.040 0.060 0.073 0.180 0.073 0.072175 0.136 0.090 0.120 0.140 0.115 0.120 0.151 0.115177 0.000 0.050 0.000 0.000 0.011 0.020 0.000 0.018179 0.000 0.000 0.020 0.020 0.000 0.000 0.000 0.005183 0.000 0.000 0.000 0.000 0.010 0.000 0.000 0.003
Asari24 N 21 50 25 22 48 25 97 191
161 0.000 0.000 0.000 0.000 0.000 0.000 0.005 0.000165 0.690 0.690 0.640 0.636 0.688 0.700 0.598 0.678169 0.000 0.020 0.040 0.046 0.031 0.020 0.031 0.026171 0.000 0.000 0.000 0.046 0.010 0.000 0.015 0.008173 0.048 0.020 0.080 0.136 0.094 0.060 0.134 0.068175 0.262 0.270 0.200 0.136 0.177 0.220 0.211 0.215189 0.000 0.000 0.040 0.000 0.000 0.000 0.006 0.005
Asari43 N 22 50 25 25 45 25 96 192
106 0.023 0.000 0.000 0.000 0.000 0.000 0.000 0.003116 0.000 0.000 0.000 0.000 0.011 0.000 0.000 0.003118 0.000 0.000 0.000 0.000 0.000 0.000 0.005 0.000124 0.000 0.000 0.000 0.000 0.022 0.100 0.016 0.018126 0.818 0.880 0.800 0.920 0.767 0.840 0.839 0.836128 0.136 0.050 0.060 0.000 0.089 0.040 0.047 0.063130 0.000 0.000 0.020 0.000 0.000 0.000 0.000 0.003132 0.000 0.010 0.000 0.000 0.033 0.020 0.016 0.013134 0.023 0.050 0.120 0.080 0.067 0.000 0.057 0.057138 0.000 0.000 0.000 0.000 0.011 0.000 0.005 0.001140 0.000 0.010 0.000 0.000 0.000 0.000 0.000 0.003144 0.000 0.000 0.000 0.000 0.000 0.000 0.005 0.000149 0.000 0.000 0.000 0.000 0.000 0.000 0.005 0.000151 0.000 0.000 0.000 0.000 0.000 0.000 0.005 0.000
Asari55 N 20 50 24 24 46 25 97 189
188 0.000 0.060 0.019 0.000 0.054 0.000 0.057 0.032192 0.100 0.020 0.021 0.000 0.065 0.000 0.010 0.034194 0.100 0.110 0.042 0.042 0.196 0.100 0.072 0.111196 0.000 0.010 0.063 0.000 0.033 0.000 0.062 0.019197 0.000 0.000 0.021 0.000 0.000 0.000 0.000 0.003198 0.200 0.130 0.292 0.125 0.141 0.260 0.191 0.177200 0.350 0.330 0.396 0.333 0.228 0.160 0.294 0.294202 0.075 0.090 0.000 0.104 0.054 0.020 0.098 0.061204 0.050 0.000 0.021 0.063 0.043 0.000 0.010 0.026206 0.075 0.080 0.104 0.188 0.109 0.240 0.144 0.124208 0.025 0.070 0.021 0.021 0.000 0.040 0.021 0.032210 0.025 0.010 0.000 0.021 0.011 0.120 0.010 0.026212 0.000 0.020 0.000 0.021 0.000 0.000 0.006 0.007214 0.000 0.010 0.000 0.021 0.022 0.000 0.000 0.011216 0.000 0.000 0.000 0.000 0.000 0.000 0.005 0.000218 0.000 0.000 0.000 0.000 0.000 0.000 0.005 0.000220 0.000 0.010 0.000 0.042 0.011 0.020 0.005 0.013222 0.000 0.020 0.000 0.019 0.011 0.040 0.005 0.016224 0.000 0.030 0.000 0.000 0.011 0.000 0.005 0.011226 0.000 0.000 0.000 0.000 0.011 0.000 0.000 0.003
Appendix (continued )
Locus Allele GOL1 GOL2 GOL3 GOL4 GOL5 GOL6 SGR SPOOL
Asari62 N 21 50 25 25 48 25 96 194
213 0.000 0.020 0.000 0.000 0.000 0.000 0.005 0.005215 0.000 0.010 0.000 0.020 0.000 0.000 0.005 0.005217 0.000 0.010 0.000 0.000 0.011 0.000 0.000 0.005219 0.000 0.060 0.060 0.020 0.042 0.080 0.063 0.046221 0.000 0.000 0.000 0.000 0.021 0.000 0.000 0.005223 0.333 0.380 0.500 0.300 0.292 0.300 0.297 0.348225 0.357 0.190 0.200 0.320 0.292 0.320 0.276 0.268227 0.048 0.060 0.040 0.040 0.073 0.040 0.120 0.054229 0.119 0.140 0.100 0.180 0.177 0.180 0.182 0.152231 0.024 0.050 0.040 0.080 0.031 0.040 0.016 0.044235 0.000 0.010 0.000 0.000 0.000 0.000 0.000 0.003239 0.095 0.010 0.020 0.020 0.031 0.040 0.005 0.031241 0.000 0.000 0.000 0.000 0.010 0.000 0.000 0.003243 0.000 0.000 0.000 0.000 0.010 0.000 0.016 0.003245 0.024 0.010 0.040 0.020 0.000 0.000 0.000 0.013249 0.000 0.000 0.000 0.000 0.000 0.000 0.005 0.000253 0.000 0.050 0.000 0.000 0.010 0.000 0.010 0.015
Asari64 N 22 50 25 24 48 25 98 194
110 0.023 0.040 0.020 0.000 0.052 0.020 0.066 0.031114 0.000 0.000 0.000 0.000 0.000 0.000 0.010 0.000116 0.000 0.010 0.000 0.000 0.000 0.040 0.020 0.008118 0.205 0.280 0.360 0.208 0.354 0.360 0.276 0.302120 0.136 0.040 0.040 0.021 0.012 0.040 0.031 0.041124 0.023 0.140 0.120 0.063 0.052 0.040 0.041 0.080126 0.477 0.370 0.400 0.542 0.396 0.420 0.403 0.420128 0.000 0.020 0.020 0.042 0.031 0.000 0.010 0.021132 0.000 0.010 0.000 0.000 0.000 0.020 0.005 0.005134 0.000 0.000 0.000 0.000 0.000 0.000 0.010 0.000136 0.045 0.000 0.000 0.019 0.031 0.000 0.005 0.015138 0.045 0.050 0.020 0.021 0.000 0.000 0.036 0.023140 0.023 0.040 0.020 0.021 0.031 0.000 0.026 0.026142 0.023 0.000 0.000 0.042 0.021 0.040 0.046 0.018144 0.000 0.000 0.000 0.021 0.010 0.000 0.015 0.004146 0.000 0.000 0.000 0.000 0.010 0.000 0.000 0.003148 0.000 0.000 0.000 0.000 0.000 0.020 0.000 0.003
L. Mura et al. / Biochemical Systematics and Ecology 41 (2012) 74–82 81
References
Andreakis, N., Kooistra, W.H.C.F., Procaccini, G., 2009. High genetic diversity and connectivity in the polyploid invasive seaweed Asparagopsis taxiformis(Bonnemaisoniales) in the Mediterranean, explored with microsatellite alleles and multilocus genotypes. Mol. Ecol. 18, 212–226.
Bakker, E.G., Montgomery, B., Nguyen, T., Eide, K., Chang, J., Mockler, T.C., Liston, A., Seabloom, E.W., Borer, E.T., 2009. Strong population structure char-acterizes weediness gene evolution in the invasive grass species Brachypodium distachyon. Mol. Ecol. 18, 2588–2601.
Breber, P., 1985. On-growing of the carpet-shell clam (Tapes decussatus (L.)): two years’ experience in Venice Lagoon. Aquaculture 44, 51–56.Cannas, A., Trentadue, M., Manca, S., Mura, L., Fois, N., 2009. Insediamento di Ruditapes philippinarum (Adams & Reeve) nel golfo di Olbia (Sardegna, Italia) e
distribuzione in rapporto a Ruditapes decussatuas (L.). Biol. Mar. Mediterr. 17, 320–321.Chessa, L.A., Paesanti, F., Pais, A., Scardi, M., Serra, S., Vitale, L., 2005. Perspectives for development of low impact aquaculture in a Western Mediterranean
lagoon: the case of the carpet clam Tapes decussatus. Aquacult. Int. 13, 147–155.Chiesa, S., Nonnis Marzano, F., Minervini, G., De Lucrezia, D., Baccarani, G., Bordignon, G., Poli, I., Ravagnan, G., Argese, E., 2011. The invasive Manila clam
Ruditapes philippinarum (Adams and Reeve, 1850) in Northern Adriatic Sea: population genetics assessed by an integrated molecular approach. Fish. Res.110, 259–267.
Cornuet, J.M., Luikart, G., 1996. Description and power analysis of two tests for detecting recent population bottlenecks from allele frequency data. Genetics144, 2001–2014.
Delgado, M., Pérez-Camacho, A., 2007. Comparative study of gonadal development of Ruditapes philippinarum (Adams and Reeve) and Ruditapes decussatus(L.) (Mollusca: Bivalvia): influence of temperature. Sci. Mar. 71, 471–484.
Eales, J., Thorpe, R.S., Malhotra, A., 2010. Colonization history and genetic diversity: adaptive potential in early stage invasions. Mol. Ecol. 19, 2858–2869.Estoup, A., Guillemaud, T., 2010. Reconstructing routes of invasion using genetic data: why, how and so what? Mol. Ecol. 19, 4113–4130.Excoffier, L., Lischer, H.E.L., 2010. Arlequin suite ver 3.5: a new series of programs to perform population genetics analyses under Linux and Windows. Mol.
Ecol. Resour. 10, 564–567.Falush, D., Stephens, M., Pritchard, J.K., 2003. Inference of population structure using multilocus genotype data: linked loci and correlated allele frequencies.
Genetics 164, 1567–1587.Gosling, E., 2003. Bivalve Molluscs. Biology, Ecology and Culture. Fishing News Books, Oxford.Grosholz, E.D., Ruiz, G.M., 2003. Biological invasions drive size increases in marine and estuarine invertebrates. Ecol. Lett. 6, 700–705.Guo, S.W., Thompson, E.A., 1992. Performing the exact test of Hardy–Weinberg proportion for multiple alleles. Biometrics 48, 361–372.Hansson, B., Westerdahl, H., Hasselquist, D., Åkesson, M., Bensch, S., 2004. Does linkage disequilibrium generate heterozygosity-fitness correlations in great
reed warblers? Evolution 58, 870–879.Hare, M.P., Karl, S.A., Avise, J.C., 1996. Anonymous nuclear DNA markers in the American oyster and their implications for the heterozygote deficiency
phenomenon in marine bivalves. Mol. Biol. Evol. 13, 334–345.Hawley, D.M., Hanley, D., Dhondt, A.A., Lovette, I.J., 2006. Molecular evidence for a founder effect in invasive house finch (Carpodacus mexicanus) pop-
ulations experiencing an emergent disease epidemic. Mol. Ecol. 15, 263–275.

L. Mura et al. / Biochemical Systematics and Ecology 41 (2012) 74–8282
Henry, P., Le Lay, G., Goudet, J., Guisan, A., Jahodová, �S., Besnard, G., 2009. Reduced genetic diversity, increased isolation and multiple introductions ofinvasive giant hogweed in the western Swiss Alps. Mol. Ecol. 18, 2819–2831.
Hochberg, Y., 1988. A sharper Bonferroni procedure for multiple tests of significance. Biometrika 75, 800–802.Hurtado, N.S., Pérez-García, C., Morán, P., Pasantes, J.J., 2011. Genetic and cytological evidence of hybridization between native Ruditapes decussatus and
introduced Ruditapes philippinarum (Mollusca, Bivalvia, Veneridae) in NW Spain. Aquaculture 311, 123–128.Hutchison, D.W., Templeton, A.R., 1999. Correlation of pairwise genetic and geographic distance measures: inferring the relative influences of gene flow and
drift on the distribution of genetic variability. Evolution 53, 1898–1914.Jensen, A.C., Humphreys, J., Caldow, R.W.G., Grisley, C., Dyrynda, P.E.J., 2004. Naturalization of the Manila clam (Tapes philippinarum), an alien species, and
establishment of a clam fishery within Poole Harbour, Dorset. J. Mar. Biol. Assoc. UK 84, 1069–1073.Kijima, A., Taniguchi, N., Mori, N., Hagiwara, J., 1987. Genetic variability and breeding structure in Ruditapes philippinarum (sic.). Rep. USA Mar. Biol. Inst.
Kochi Univ. 9, 173–181.Liu, T., Todhunter, R.J., Lu, Q., Schoettinger, L., Li, H., Littell, R.C., Burton-Wurster, N., Acland, G.M., Lust, G., Wu, R., 2006. Modelling extent and distribution of
zygotic disequilibrium: implications for a multigenerational canine pedigree. Genetics 174, 439–453.Luikart, G., Allendorf, F.W., Cornuet, J.M., Sherwin, W.B., 1998. Distortion of allele frequency distributions provides a test for recent population bottlenecks. J.
Hered. 89, 238–247.Mank, J.E., Avise, J.C., 2004. Individuals organisms as units of analysis: Bayesian-clustering alternatives in population genetics. Genet. Res. 84, 135–143.Neudecker, F., Grimm, S., 2000. High-throughput method for isolating plasmid DNA with reduced lipopolysaccharide content. Biotechniques 28, 107–109.Oniwa, K., Nakano, M., Fujio, Y., 1988. Heterogeneity within and between geographical populations of the short-necked clam, Ruditapes philippinarum.
Tohoku J. Agric. Res. 38, 49–60.Peakall, R., Smouse, P.E., 2006. GENALEX 6: genetic analysis in Excel. Population genetic software for teaching and research. Mol. Ecol. Notes 6, 288–295.Pellizzato, M., Mattei, N., Renzoni, A., 1989. Allevamento su scala commerciale di Tapes philippinarum (Adams and Reeve, 1850) in alcune valli venete.
Oebalia XV-2, 735–744.Piry, S., Luikart, G., Cornuet, J.M., 1999. Bottleneck: a computer program for detecting recent reductions in the effective population size using allele
frequency data. J. Hered. 90, 502–503.Pritchard, J.K., Stephens, M., Donnelly, P., 2000. Inference of population structure using multilocus genotype data. Genetics 155, 945–959.Pritchard, J.K., Wen, W., 2004. Documentation for Structure Software: Version 2. University of Chicago Press, Chicago.R Development Core Team, 2010. R: a Language and Environment for Statistical Computing. R Foundation for Statistical Computing, Vienna, Austria, ISBN 3-
900051-07-0. http://www.R-project.org.Raymond, M., Rousset, F., 1995. An exact test for population differentiation. Evolution 49, 1280–1283.Raymond, M., Vääntö, R.L., Thomas, F., Rousset, F., De Meeüs, T., Renaud, F., 1997. Heterozygote deficiency in the mussel Mytilus edulis species complex
revisited. Mar. Ecol. Prog. Ser. 156, 225–237.Ribeiro, P.A., Branco, M., Hawkins, S.J., Santos, A.M., 2010. Recent changes in the distribution of a marine gastropod, Patella rustica, across the Iberian Atlantic
coast did not result in diminished genetic diversity or increased connectivity. J. Biogeogr. 37, 1782–1796.Roman, J., Darling, J.A., 2007. Paradox lost: genetic diversity and the success of aquatic invasions. Trends Ecol. Evol. 22, 454–464.Rousset, F., 2008. Genepop’007: a complete re-implementation of the Genepop software for Windows and Linux. Mol. Ecol. Resour. 8, 103–106.Savini, D., Occhipinti-Ambrogi, A., Marchini, A., Tricarico, E., Gherardi, F., Olenin, S., Gollasch, S., 2010. The top 27 animal alien species introduced into
Europe for aquaculture and related activities. J. Appl. Ichthyol. 26, 1–7.Sekine, Y., Yamakawa, H., Takazawa, S., Lin, Y., Toba, M., 2006. Geographic variation of the COX1 gene of the short-neck clam Ruditapes philippinarum in
coastal regions of Japan and China. Venus 65, 229–240.Slatkin, M., 1995. A measure of population subdivision based on microsatellite allele frequencies. Genetics 139, 457–462.Vargas, K., Asakura, Y., Ikeda, M., Taniguchi, N., Obata, Y., Hamasaki, K., Tsuchiya, K., Kitada, S., 2008. Allozyme variation of littleneck clam Ruditapes
philippinarum and genetic mixture analysis of foreign clams in Ariake Sea and Shiranui Sea off Kyushu Island. Jpn. Fish. Sci. 74, 533–543.Weir, B.S., 1996. Genetic Data Analysis II. Sinauer Associates, Sunderland, MA.Wonham, M.J., Carlton, J.T., 2005. Trends in marine biological invasions at local and regional scales: the Northeast Pacific Ocean as a model system. Biol.
Invasions 7, 369–392.Yasuda, N., Nagai, S., Yamaguchi, S., Lian, C.L., Hamaguchi, M., 2007. Development of microsatellite markers for the Manila clam Ruditapes philippinarum.
Mol. Ecol. Notes 7, 43–45.Yokogawa, K., 1998. Morphological variabilities and genetic features in Japanese common clam Ruditapes philippinarum. Jpn. J. Malacol. 57, 121–132.


