Embed Size (px)
Citation preview
Trombly et al. BMC Genomics (2015) 16:309 DOI 10.1186/s12864-015-1445-0
RESEARCH ARTICLE Open Access
Genome-wide co-occupancy of AML1-ETO andN-CoR defines the t(8;21) AML signature inleukemic cellsDaniel J Trombly2†, Troy W Whitfield2,3†, Srivatsan Padmanabhan2, Jonathan AR Gordon1,2, Jane B Lian1,2,Andre J van Wijnen2,4, Sayyed K Zaidi1,2, Janet L Stein1,2 and Gary S Stein1,2*
Abstract
Background: Many leukemias result from chromosomal rearrangements. The t(8;21) chromosomal translocationproduces AML1-ETO, an oncogenic fusion protein that compromises the function of AML1, a transcription factorcritical for myeloid cell differentiation. Because of the pressing need for new therapies in the treatment of acutemyleoid leukemia, we investigated the genome-wide occupancy of AML1-ETO in leukemic cells to discover novelregulatory mechanisms involving AML-ETO bound genes.
Results: We report the co-localization of AML1-ETO with the N-CoR co-repressor to be primarily on genomic regionsdistal to transcriptional start sites (TSSs). These regions exhibit over-representation of the motif for PU.1, a keyhematopoietic regulator and member of the ETS family of transcription factors. A significant discovery of ourstudy is that genes co-occupied by AML1-ETO and N-CoR (e.g., TYROBP and LAPTM5) are associated with theleukemic phenotype, as determined by analyses of gene ontology and by the observation that these genes arepredominantly up-regulated upon AML1-ETO depletion. In contrast, the AML1-ETO/p300 gene network is lessresponsive to AML1-ETO depletion and less associated with the differentiation block characteristic of leukemiccells. Furthermore, a substantial fraction of AML1-ETO/p300 co-localization occurs near TSSs in promoter regions associatedwith transcriptionally active loci.
Conclusions:Our findings establish a novel and dominant t(8;21) AML leukemia signature characterized by occupancy ofAML1-ETO/N-CoR at promoter-distal genomic regions enriched in motifs for myeloid differentiation factors, thusproviding mechanistic insight into the leukemic phenotype.
Keywords: AML, Runx1, t(8;21), Chromosomal translocation, Myeloid cell differentiation, Epigenetic control
BackgroundRunx1, also known as AML1, is a frequent target ofchromosomal translocations in myeloid progenitor cells[1]. The t(8;21) chromosomal translocation accounts forapproximately 15% of acute myeloid leukemia (AML)cases and produces the AML1-ETO fusion protein [2].AML1-ETO is comprised of the AML1 N-terminus,
* Correspondence: [email protected]†Equal contributors1Department of Biochemistry and Vermont Cancer Center, University ofVermont College of Medicine, 89 Beaumont Avenue, Burlington, VT 05405,USA2Department of Cell and Developmental Biology, University of MassachusettsMedical School, 55 Lake Avenue North, Worcester, MA 01655, USAFull list of author information is available at the end of the article
© 2015 Trombly et al.; licensee BioMed CentraCommons Attribution License (http://creativecreproduction in any medium, provided the orDedication waiver (http://creativecommons.orunless otherwise stated.
containing the conserved DNA-binding runt homologydomain (RHD), fused with almost the entire eighttwenty-one (ETO) protein [3]. ETO contains four con-served nervy homology regions (NHR) that bind differ-ent transcriptional repressive complexes includinghistone deacetylases and the silencing mediator of retin-oic acid and thyroid hormone receptor (SMRT) com-plex [4]. All four NHRs are retained in AML1-ETO, andearly reports demonstrated that the fusion proteinrepresses the transcription of AML1 target genes im-portant for myeloid differentiation [5]. This repressionis mediated, in part, by interactions between AML1-ETO and the nuclear co-repressor protein (N-CoR)[6,7]. Recruitment of histone deacetylases (HDACs) by
l. This is an Open Access article distributed under the terms of the Creativeommons.org/licenses/by/4.0), which permits unrestricted use, distribution, andiginal work is properly credited. The Creative Commons Public Domaing/publicdomain/zero/1.0/) applies to the data made available in this article,
Trombly et al. BMC Genomics (2015) 16:309 Page 2 of 13
AML1-ETO and N-CoR leads to a loss of histone modi-fications associated with transcriptional activation (e.g.,H3K9ac), whereas blockade of HDAC activity results inpartial differentiation of leukemic cells [8-10]. Inaddition, the acquisition of repressive histone modifica-tion marks, including H3K27me3, is believed to serve asan epigenetic mechanism for AML1-ETO mediatedgene repression [11,12].The repressive activity of AML1-ETO does not repre-
sent its full range of functions. The fusion protein hasalso been shown to activate genes [13-15], and a mechan-ism for this transcriptional activation involving AML1-ETO and p300 interactions has recently been described[16]. AML1-ETO affects the function of microRNAs(miRs [15,17]), DNA repair proteins [18], and growthfactors in myeloid progenitor cells [19]. The fusion pro-tein also plays a role in epigenetic-controlled cell growthvia interactions with rDNA repeats [20]. In addition toregulating gene expression directly, AML1-ETO inter-feres with the transcriptional activities of moleculesimportant for myeloid cell differentiation via protein-protein interactions and acts as an organizer of cofactorexchange [21-23]. Taken together, these studies showedthat AML1-ETO acts as a transcriptional regulator andmodifies transcription factor activity via differential co-factor recruitment, properties that maintain the onco-genic character of t(8;21) leukemic cells.Recently, genome-wide binding of AML1-ETO, AML1,
and p300 has been determined in leukemic cells [24-26].These studies have shown the following: global AML1and AML1-ETO binding sites largely overlap [24], ETS-family proteins recruit AML1-ETO [27], and that PU.1, amaster regulator of myeloid cell differentiation, is part ofthe t(8;21) core transcriptional network. AML1-ETO andthe coactivator p300 co-occupy hypoacetylated genomicloci in leukemic cells [26], yet the relevance of thisphenomenon to t(8;21) leukemia is not well-understood.In addtion, global interactions between AML1-ETO andN-CoR have not been studied. To clarify these issues, weemployed chromatin immunoprecipitation with high-throughput sequencing (ChIP-seq [28]) and determinedgenome-wide sites of enrichment for AML1, AML1-ETO, N-CoR, and p300 in Kasumi-1 cells, a model sys-tem for t(8;21) leukemia [29]. ChIP-seq libraries forhistone modifications associated with transcriptionalactivation (H3K4me3) and repression (H3K27me3) werealso generated to assess whether epigenetic mechanismsaccount for the differentiation arrest phenotype inKasumi-1 cells.From our genome-wide analysis of AML1/AML1-ETO
occupancy, we have identified and described a phenotypic-ally relevant subset of putative regulatory sequences.These sequences are characterized by abundant N-CoRco-occupancy, relative to other AML1/AML1-ETO-bound
sequences, and a significant enrichment in PU.1 motifs.Moreover, using publicly available gene expression data[24,30], we show by in silico analysis that genes associatedwith the AML1-ETO/N-CoR co-occupancy signaturedisplay significantly greater recovery of expressionupon reduction of AML1-ETO mRNA levels than doother AML1-ETO-bound genes. AML1-ETO/N-CoRco-occupied genomic loci tended to be distal fromtranscriptional start sites (TSSs) and showed little en-richment in the H3K4me3 histone modification. Finally,gene ontology analysis of genomic regions associatedwith AML1-ETO/N-CoR enrichment was more rele-vant to the differentiation block exhibited by Kasumi-1cells compared to those regions enriched in AML1-ETO/p300. Thus, although AML1-ETO both repressesand activates genes at the single-gene level [31], ourgenome-wide data show that AML1-ETO predominatlyacts as a repressor. Our studies provide a new understand-ing of the global mechanisms that regulate the t(8;21)leukemic phenotype.
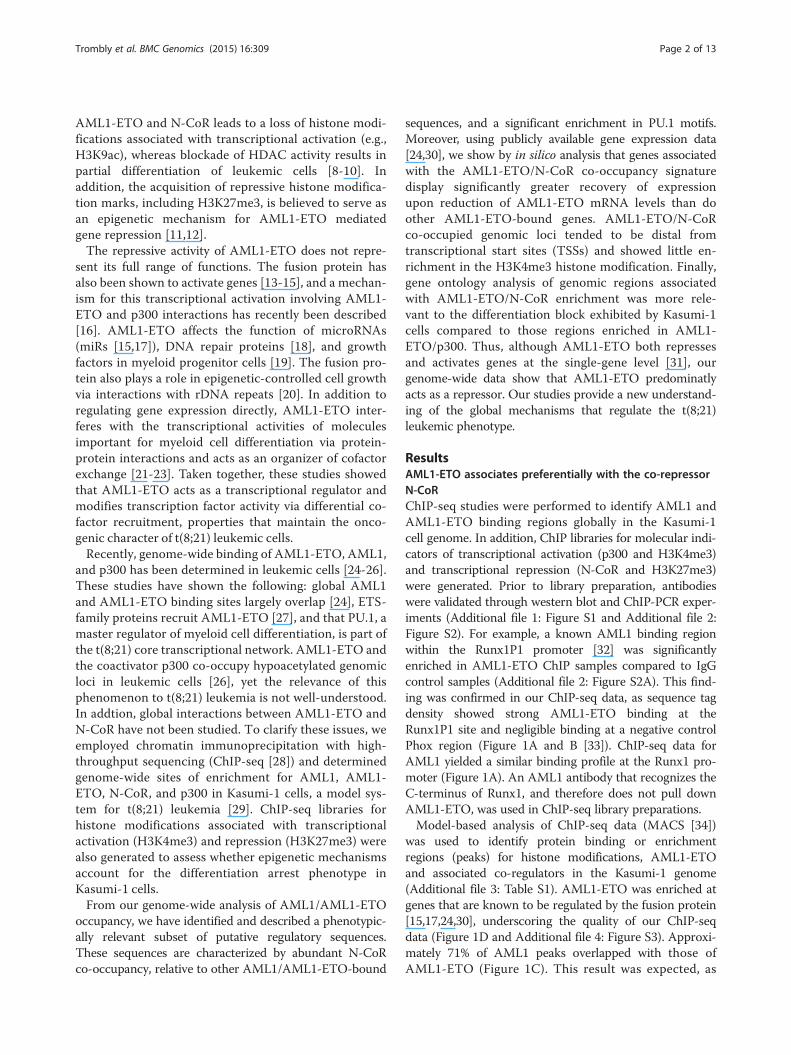
ResultsAML1-ETO associates preferentially with the co-repressorN-CoRChIP-seq studies were performed to identify AML1 andAML1-ETO binding regions globally in the Kasumi-1cell genome. In addition, ChIP libraries for molecular indi-cators of transcriptional activation (p300 and H3K4me3)and transcriptional repression (N-CoR and H3K27me3)were generated. Prior to library preparation, antibodieswere validated through western blot and ChIP-PCR exper-iments (Additional file 1: Figure S1 and Additional file 2:Figure S2). For example, a known AML1 binding regionwithin the Runx1P1 promoter [32] was significantlyenriched in AML1-ETO ChIP samples compared to IgGcontrol samples (Additional file 2: Figure S2A). This find-ing was confirmed in our ChIP-seq data, as sequence tagdensity showed strong AML1-ETO binding at theRunx1P1 site and negligible binding at a negative controlPhox region (Figure 1A and B [33]). ChIP-seq data forAML1 yielded a similar binding profile at the Runx1 pro-moter (Figure 1A). An AML1 antibody that recognizes theC-terminus of Runx1, and therefore does not pull downAML1-ETO, was used in ChIP-seq library preparations.Model-based analysis of ChIP-seq data (MACS [34])
was used to identify protein binding or enrichmentregions (peaks) for histone modifications, AML1-ETOand associated co-regulators in the Kasumi-1 genome(Additional file 3: Table S1). AML1-ETO was enriched atgenes that are known to be regulated by the fusion protein[15,17,24,30], underscoring the quality of our ChIP-seqdata (Figure 1D and Additional file 4: Figure S3). Approxi-mately 71% of AML1 peaks overlapped with those ofAML1-ETO (Figure 1C). This result was expected, as
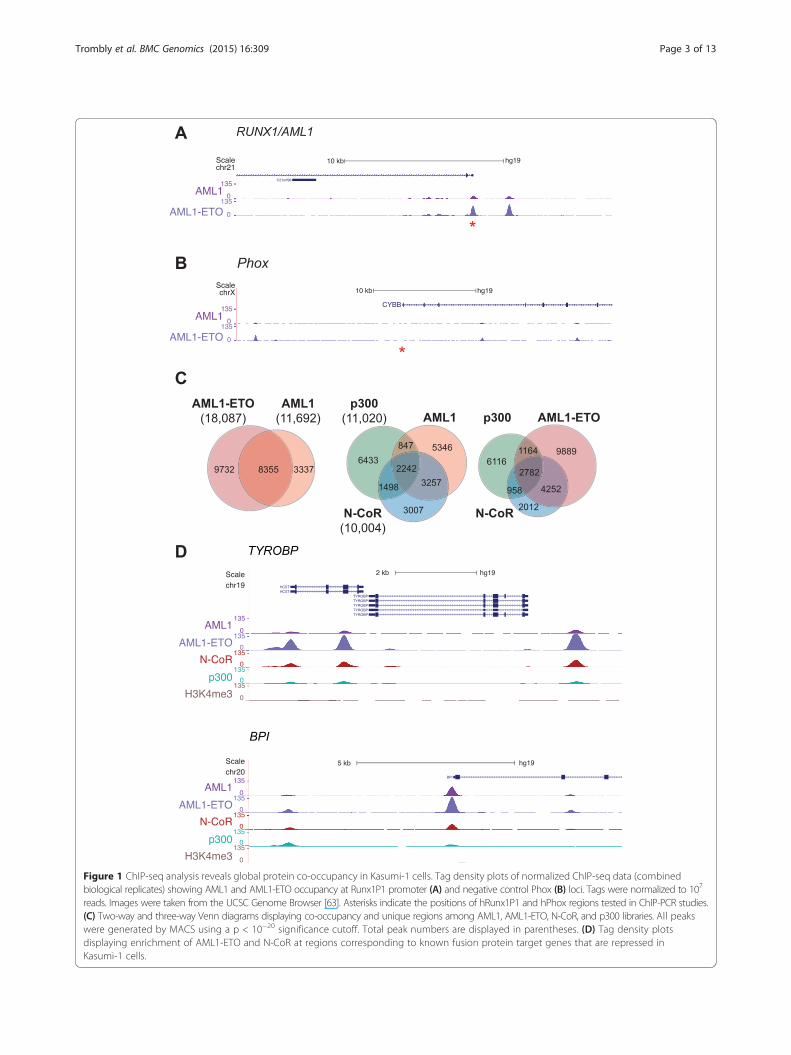
Figure 1 ChIP-seq analysis reveals global protein co-occupancy in Kasumi-1 cells. Tag density plots of normalized ChIP-seq data (combinedbiological replicates) showing AML1 and AML1-ETO occupancy at Runx1P1 promoter (A) and negative control Phox (B) loci. Tags were normalized to 107
reads. Images were taken from the UCSC Genome Browser [63]. Asterisks indicate the positions of hRunx1P1 and hPhox regions tested in ChIP-PCR studies.(C) Two-way and three-way Venn diagrams displaying co-occupancy and unique regions among AML1, AML1-ETO, N-CoR, and p300 libraries. All peakswere generated by MACS using a p < 10−20 significance cutoff. Total peak numbers are displayed in parentheses. (D) Tag density plotsdisplaying enrichment of AML1-ETO and N-CoR at regions corresponding to known fusion protein target genes that are repressed inKasumi-1 cells.
Trombly et al. BMC Genomics (2015) 16:309 Page 3 of 13
Trombly et al. BMC Genomics (2015) 16:309 Page 4 of 13
AML1-ETO retains the DNA-binding RHD found inwild-type Runx1. Interestingly, 39% of AML1-ETOpeaks overlap those of N-CoR, whereas only 22% ofAML1-ETO peaks overlap those of p300 (Figure 1C).A similar profile was observed when comparing theco-occupancy of AML1 with the two co-regulators.These findings are consistent with a correlation ana-lysis of genomic occupancy from ChIP-seq measure-ments (Additional file 5: Figure S4), which shows thatAML1-ETO and N-CoR signals are more correlatedwith one another than either is with any of the otherassayed DNA-binding proteins, co-regulators or epige-nomic modifications. A closer analysis of selectedgenes that are related to the leukemia phenotype andare deregulated upon siRNA-mediated AML1-ETOdepletion [24,30] (please see below) further confirmsan AML1-ETO/N-CoR dominant co-occupancy pat-tern that may regulate the leukemic phenotype at thegenome-wide level (Figure 1D).To evaluate the gene-sets that are likely to be per-
turbed by the binding of AML1-ETO and its cofactors,we analyzed gene ontology terms. ChIP-seq peaks with
Figure 2 AML1-ETO and N-CoR peaks relate to similar gene ontology termbiologically relevant pathways among ChIP-seq libraries using highly-ranketerms within Biological Process (A) and Molecular Signatures Database Pep-value) computed using GREAT (version 2.0.2) [35] with the default assoHOMER de novo motif analysis [54] of AML1, AML1-ETO, N-CoR, and p300log(p-value) scores. Genomic loci occupied by AML1, the fusion protein afactors that harbor these motifs (listed in the ranked list of motif results)
high statistical significance (p < 10−75) from each librarywere analyzed using the Genomic Regions Enrichmentof AnnotationsTool (GREAT [35]). Enriched gene ontologyterms germane to molecular signatures of hematopoieticand leukemic cells were similar among the AML1, AML1-ETO and N-CoR datasets, but not that of p300 (Figure 2Aand B). Importantly, ontology terms derived from genomicloci co-occupied by AML1-ETO and N-CoR were morerelevant to myeloid leukemia than those from regions ex-clusively co-occupied by AML1-ETO and p300 (Additionalfile 6: Figure S5). Ontology terms derived from regionsthat display enrichments of AML1 with p300/N-CoRand AML1-ETO with p300/N-CoR resemble those of thefusion protein and N-CoR (Additional file 6: Figure S5).Thus, AML1-ETO preferentially associates with N-CoRcompared to p300, and genes represented by these sitesreflect the leukemic phenotype of Kasumi-1 cells.Transcription factors act in a combinatorial fashion to
regulate gene expression in hematopoietic progenitorcells [36]. A similar situation likely occurs in Kasumi-1cells, where interactions between AML1-ETO and dis-tinct co-regulatory proteins at hematopoietic genes
s and motifs discovered de novo. (A) Gene ontology was used to inferd peaks (p < 10−75 from MACS). Shown are top-ranked gene ontologyrturbation (B) [64]. Values on column plots represent –log10(binomialciation rules. Note: some ontology term names were shortened. (C)libraries. Displayed are the top-ranked motifs for each library withnd N-CoR were enriched in the Runx1 motif. Candidate transcriptionare shown in parentheses.
Trombly et al. BMC Genomics (2015) 16:309 Page 5 of 13
may be necessary to maintain differentiation arrest[25,27]. In our genome-wide study, de novo motif dis-covery revealed that Runx1 and ETS family motifs weremost commonly associated with AML1 and AML1-ETO peaks (Figure 2C). ETS family motifs (please seethe Discussion section for candidate ETS motifs) werealso enriched in sites of N-CoR and p300 occupancy(Figure 2C). Taken together, our data suggest that thedifferentiation arrest in Kasumi-1 cells is caused by pu-tative global AML1-ETO/ETS interactions and throughthe repressive activity of the fusion protein on AML1-mediated transcription.
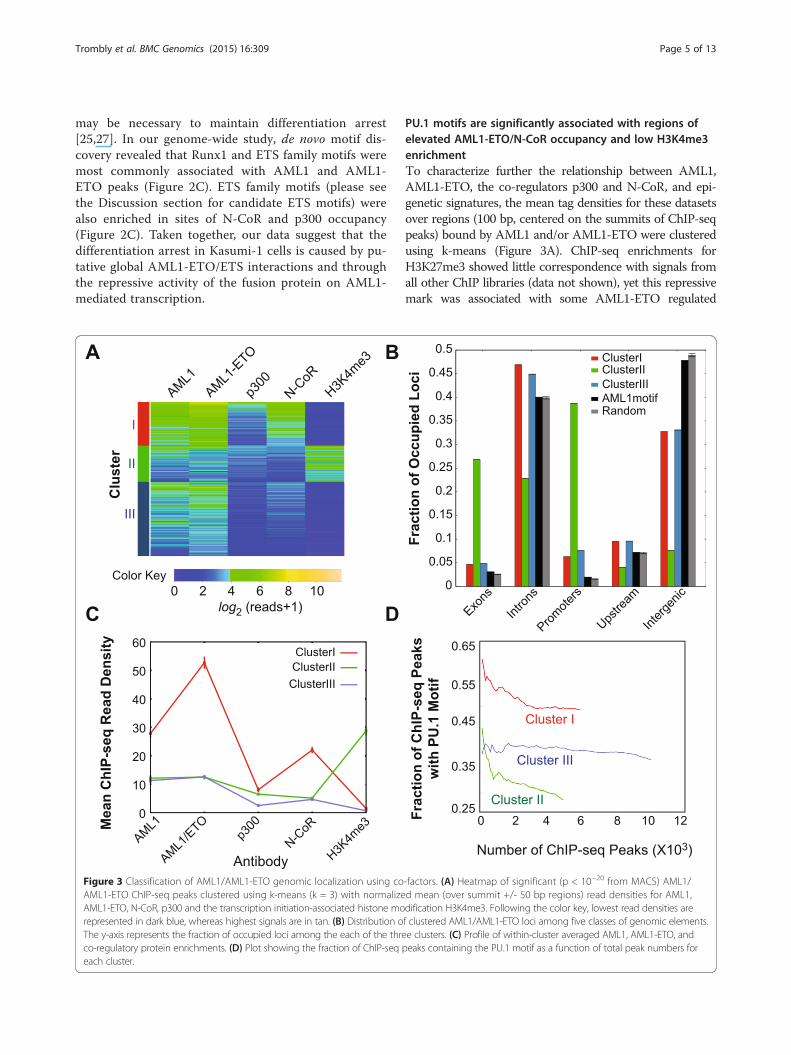
Figure 3 Classification of AML1/AML1-ETO genomic localization using coAML1-ETO ChIP-seq peaks clustered using k-means (k = 3) with normalizeAML1-ETO, N-CoR, p300 and the transcription initiation-associated histone morepresented in dark blue, whereas highest signals are in tan. (B) Distribution oThe y-axis represents the fraction of occupied loci among the each of the threco-regulatory protein enrichments. (D) Plot showing the fraction of ChIP-seqeach cluster.
PU.1 motifs are significantly associated with regions ofelevated AML1-ETO/N-CoR occupancy and low H3K4me3enrichmentTo characterize further the relationship between AML1,AML1-ETO, the co-regulators p300 and N-CoR, and epi-genetic signatures, the mean tag densities for these datasetsover regions (100 bp, centered on the summits of ChIP-seqpeaks) bound by AML1 and/or AML1-ETO were clusteredusing k-means (Figure 3A). ChIP-seq enrichments forH3K27me3 showed little correspondence with signals fromall other ChIP libraries (data not shown), yet this repressivemark was associated with some AML1-ETO regulated
-factors. (A) Heatmap of significant (p < 10−20 from MACS) AML1/d mean (over summit +/- 50 bp regions) read densities for AML1,dification H3K4me3. Following the color key, lowest read densities aref clustered AML1/AML1-ETO loci among five classes of genomic elements.e clusters. (C) Profile of within-cluster averaged AML1, AML1-ETO, andpeaks containing the PU.1 motif as a function of total peak numbers for
Trombly et al. BMC Genomics (2015) 16:309 Page 6 of 13
genes including CXCR4 and HCK (Additional file 7:Figure S6). At genomic regions where levels of AML1-ETO and N-CoR enrichment were highest (Cluster I),enrichment of the activating mark H3K4me3 was low(Figure 3A and C). This anti-correlation is expected onthe basis that only a small fraction (6.3%) of the AML1/AML1-ETO-bound loci from Cluster I are found at pro-moters of the UCSC known genes (Figure 3B [37]), whereasH3K4me3 enrichments are expected to be elevated at ac-tively transcribed genes [38]. In contrast, Cluster II wascharacterized by an inverse pattern, where occupancy ofAML1-ETO and N-CoR was lower (Figure 3C) but statisti-cally significant (p < 10−20 for AML1-ETO and/or AML1enrichment) and enrichment of H3K4me3 was high.The mean occupancy of p300 was similar among thethree clusters (Figure 3C). Comparing our ChIP-seq datawith H3K9ac (another activation-associated histone modi-fication) ChIP-seq data from Ptasinska et al [24], we ob-served that enrichment of H3K9ac was inversely correlatedwith our AML1-ETO and N-CoR occupancies (data notshown). This inverse relationship between AML1-ETO/N-CoR and activating histone marks reinforces the idea thatAML1-ETO acts as a transcriptional repressor at many lociin Kasumi-1 cells.We examined the distribution of AML1/AML1-ETO
bound loci from all three clusters among genomic ele-ments (Figure 3B). AML1/AML1-ETO occupied regionsfrom Clusters I and III are gene-distal compared to thoseof Cluster II. Yet, for each cluster the comparison with oc-cupancy expected based upon AML1/AML1-ETO bindingwith random sequences or sequences that match theAML1 motif revealed differences. For example, for allclusters AML1/AML1-ETO occupancy at promoters andexons is higher than expected (Figure 3B). As noted above,the occupancy reflected by Cluster II is much morestrongly associated with TSS-proximal elements than thatof Clusters I and III.The sequences with the greatest AML1-ETO/N-CoR
co-occupancy (Cluster I) were compared with theremaining sequences occupied by AML1/AML1-ETO(Clusters II and III) using a discriminatory motif analysis(see Methods). The ETS/PU.1 motif was over-representedamong the Cluster I sequences (p < 2.2 × 10⁻¹⁶ using aKolmogorov-Smirnov test). The resulting PU.1 motif(Additional file 8: Figure S7) was scanned across allAML1/AML1-ETO-occupied sequences using FIMO [39],which demonstrated the relative enrichment of the PU.1motif in distal, predominantly N-CoR-associated puta-tive regulatory sequences (Cluster I) and depletion inthe proximal transcriptionally active sequences (ClusterII) (Figure 3D). Thus, AML1-ETO/N-CoR interactionslikely perturb PU.1 function at multiple loci in theKasumi-1 cell genome, in turn contributing to theleukemic phenotype of these cells.
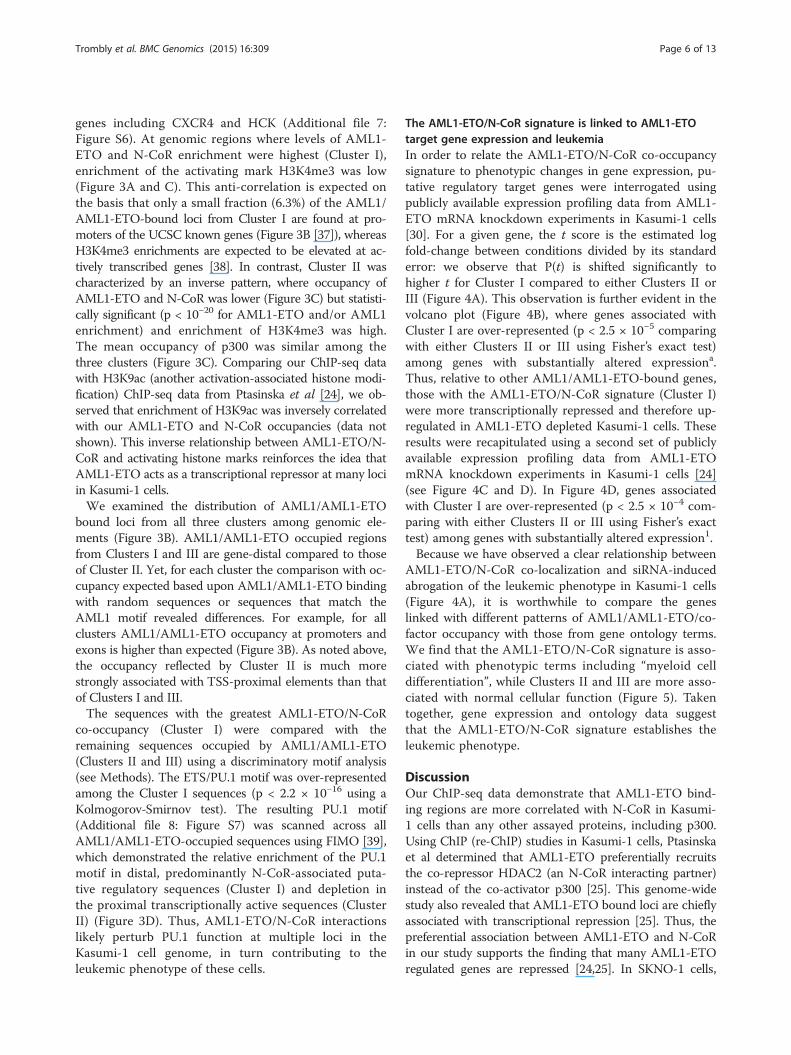
The AML1-ETO/N-CoR signature is linked to AML1-ETOtarget gene expression and leukemiaIn order to relate the AML1-ETO/N-CoR co-occupancysignature to phenotypic changes in gene expression, pu-tative regulatory target genes were interrogated usingpublicly available expression profiling data from AML1-ETO mRNA knockdown experiments in Kasumi-1 cells[30]. For a given gene, the t score is the estimated logfold-change between conditions divided by its standarderror: we observe that P(t) is shifted significantly tohigher t for Cluster I compared to either Clusters II orIII (Figure 4A). This observation is further evident in thevolcano plot (Figure 4B), where genes associated withCluster I are over-represented (p < 2.5 × 10⁻⁵ comparingwith either Clusters II or III using Fisher’s exact test)among genes with substantially altered expressiona.Thus, relative to other AML1/AML1-ETO-bound genes,those with the AML1-ETO/N-CoR signature (Cluster I)were more transcriptionally repressed and therefore up-regulated in AML1-ETO depleted Kasumi-1 cells. Theseresults were recapitulated using a second set of publiclyavailable expression profiling data from AML1-ETOmRNA knockdown experiments in Kasumi-1 cells [24](see Figure 4C and D). In Figure 4D, genes associatedwith Cluster I are over-represented (p < 2.5 × 10⁻⁴ com-paring with either Clusters II or III using Fisher’s exacttest) among genes with substantially altered expression1.Because we have observed a clear relationship between
AML1-ETO/N-CoR co-localization and siRNA-inducedabrogation of the leukemic phenotype in Kasumi-1 cells(Figure 4A), it is worthwhile to compare the geneslinked with different patterns of AML1/AML1-ETO/co-factor occupancy with those from gene ontology terms.We find that the AML1-ETO/N-CoR signature is asso-ciated with phenotypic terms including “myeloid celldifferentiation”, while Clusters II and III are more asso-ciated with normal cellular function (Figure 5). Takentogether, gene expression and ontology data suggestthat the AML1-ETO/N-CoR signature establishes theleukemic phenotype.
DiscussionOur ChIP-seq data demonstrate that AML1-ETO bind-ing regions are more correlated with N-CoR in Kasumi-1 cells than any other assayed proteins, including p300.Using ChIP (re-ChIP) studies in Kasumi-1 cells, Ptasinskaet al determined that AML1-ETO preferentially recruitsthe co-repressor HDAC2 (an N-CoR interacting partner)instead of the co-activator p300 [25]. This genome-widestudy also revealed that AML1-ETO bound loci are chieflyassociated with transcriptional repression [25]. Thus, thepreferential association between AML1-ETO and N-CoRin our study supports the finding that many AML1-ETOregulated genes are repressed [24,25]. In SKNO-1 cells,
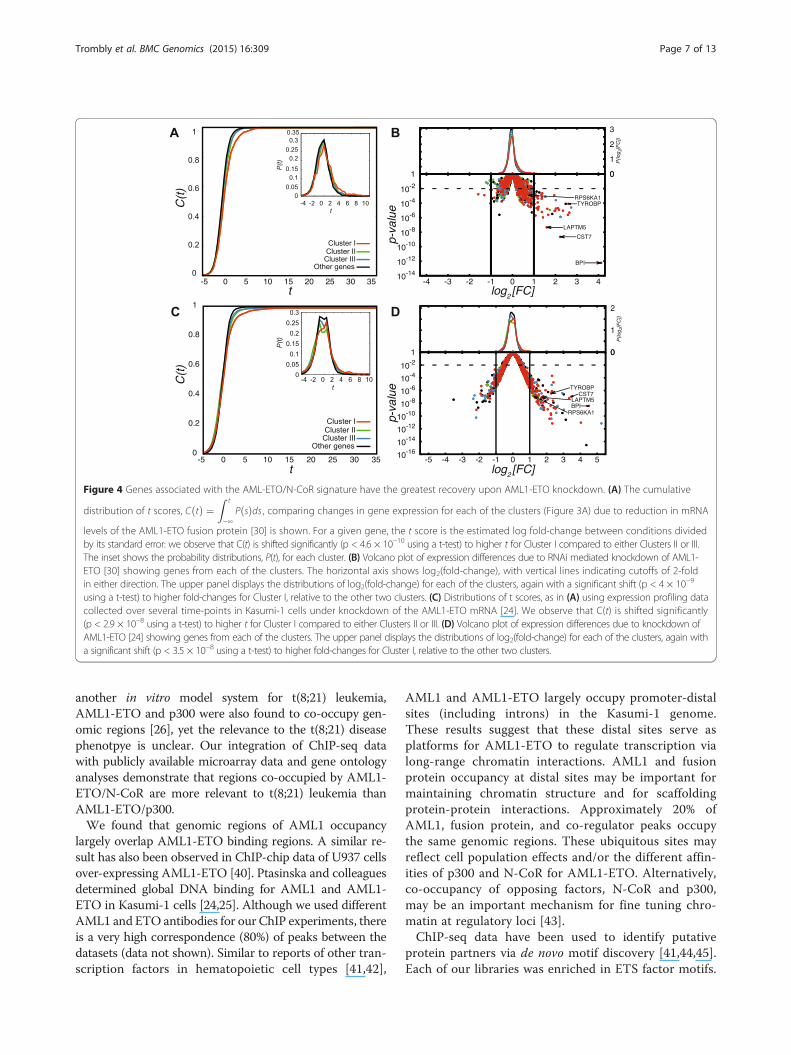
Figure 4 Genes associated with the AML-ETO/N-CoR signature have the greatest recovery upon AML1-ETO knockdown. (A) The cumulative
distribution of t scores, C tð Þ ¼Z t
−∞P sð Þds , comparing changes in gene expression for each of the clusters (Figure 3A) due to reduction in mRNA
levels of the AML1-ETO fusion protein [30] is shown. For a given gene, the t score is the estimated log fold-change between conditions dividedby its standard error: we observe that C(t) is shifted significantly (p < 4.6 × 10⁻¹⁰ using a t-test) to higher t for Cluster I compared to either Clusters II or III.The inset shows the probability distributions, P(t), for each cluster. (B) Volcano plot of expression differences due to RNAi mediated knockdown of AML1-ETO [30] showing genes from each of the clusters. The horizontal axis shows log2(fold-change), with vertical lines indicating cutoffs of 2-foldin either direction. The upper panel displays the distributions of log2(fold-change) for each of the clusters, again with a significant shift (p < 4 × 10⁻⁹
using a t-test) to higher fold-changes for Cluster I, relative to the other two clusters. (C) Distributions of t scores, as in (A) using expression profiling datacollected over several time-points in Kasumi-1 cells under knockdown of the AML1-ETO mRNA [24]. We observe that C(t) is shifted significantly(p < 2.9 × 10⁻⁸ using a t-test) to higher t for Cluster I compared to either Clusters II or III. (D) Volcano plot of expression differences due to knockdown ofAML1-ETO [24] showing genes from each of the clusters. The upper panel displays the distributions of log2(fold-change) for each of the clusters, again witha significant shift (p < 3.5 × 10⁻⁸ using a t-test) to higher fold-changes for Cluster I, relative to the other two clusters.
Trombly et al. BMC Genomics (2015) 16:309 Page 7 of 13
another in vitro model system for t(8;21) leukemia,AML1-ETO and p300 were also found to co-occupy gen-omic regions [26], yet the relevance to the t(8;21) diseasephenotpye is unclear. Our integration of ChIP-seq datawith publicly available microarray data and gene ontologyanalyses demonstrate that regions co-occupied by AML1-ETO/N-CoR are more relevant to t(8;21) leukemia thanAML1-ETO/p300.We found that genomic regions of AML1 occupancy
largely overlap AML1-ETO binding regions. A similar re-sult has also been observed in ChIP-chip data of U937 cellsover-expressing AML1-ETO [40]. Ptasinska and colleaguesdetermined global DNA binding for AML1 and AML1-ETO in Kasumi-1 cells [24,25]. Although we used differentAML1 and ETO antibodies for our ChIP experiments, thereis a very high correspondence (80%) of peaks between thedatasets (data not shown). Similar to reports of other tran-scription factors in hematopoietic cell types [41,42],
AML1 and AML1-ETO largely occupy promoter-distalsites (including introns) in the Kasumi-1 genome.These results suggest that these distal sites serve asplatforms for AML1-ETO to regulate transcription vialong-range chromatin interactions. AML1 and fusionprotein occupancy at distal sites may be important formaintaining chromatin structure and for scaffoldingprotein-protein interactions. Approximately 20% ofAML1, fusion protein, and co-regulator peaks occupythe same genomic regions. These ubiquitous sites mayreflect cell population effects and/or the different affin-ities of p300 and N-CoR for AML1-ETO. Alternatively,co-occupancy of opposing factors, N-CoR and p300,may be an important mechanism for fine tuning chro-matin at regulatory loci [43].ChIP-seq data have been used to identify putative
protein partners via de novo motif discovery [41,44,45].Each of our libraries was enriched in ETS factor motifs.
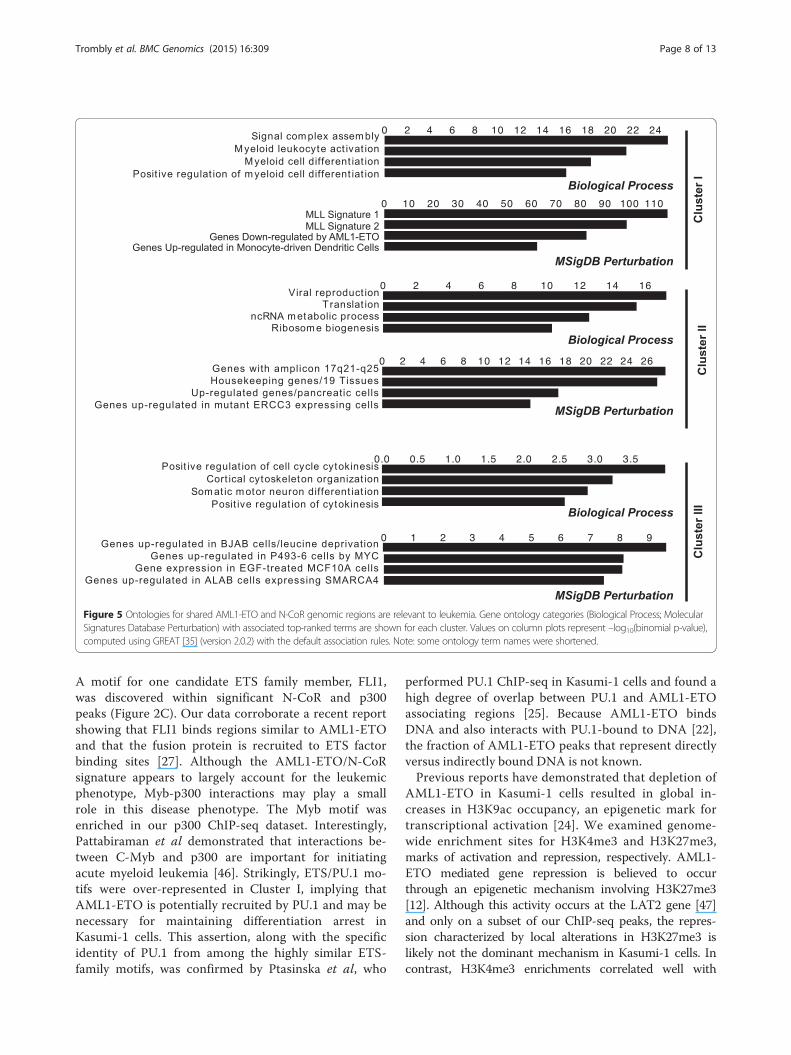
Figure 5 Ontologies for shared AML1-ETO and N-CoR genomic regions are relevant to leukemia. Gene ontology categories (Biological Process; MolecularSignatures Database Perturbation) with associated top-ranked terms are shown for each cluster. Values on column plots represent –log10(binomial p-value),computed using GREAT [35] (version 2.0.2) with the default association rules. Note: some ontology term names were shortened.
Trombly et al. BMC Genomics (2015) 16:309 Page 8 of 13
A motif for one candidate ETS family member, FLI1,was discovered within significant N-CoR and p300peaks (Figure 2C). Our data corroborate a recent reportshowing that FLI1 binds regions similar to AML1-ETOand that the fusion protein is recruited to ETS factorbinding sites [27]. Although the AML1-ETO/N-CoRsignature appears to largely account for the leukemicphenotype, Myb-p300 interactions may play a smallrole in this disease phenotype. The Myb motif wasenriched in our p300 ChIP-seq dataset. Interestingly,Pattabiraman et al demonstrated that interactions be-tween C-Myb and p300 are important for initiatingacute myeloid leukemia [46]. Strikingly, ETS/PU.1 mo-tifs were over-represented in Cluster I, implying thatAML1-ETO is potentially recruited by PU.1 and may benecessary for maintaining differentiation arrest inKasumi-1 cells. This assertion, along with the specificidentity of PU.1 from among the highly similar ETS-family motifs, was confirmed by Ptasinska et al, who
performed PU.1 ChIP-seq in Kasumi-1 cells and found ahigh degree of overlap between PU.1 and AML1-ETOassociating regions [25]. Because AML1-ETO bindsDNA and also interacts with PU.1-bound to DNA [22],the fraction of AML1-ETO peaks that represent directlyversus indirectly bound DNA is not known.Previous reports have demonstrated that depletion of
AML1-ETO in Kasumi-1 cells resulted in global in-creases in H3K9ac occupancy, an epigenetic mark fortranscriptional activation [24]. We examined genome-wide enrichment sites for H3K4me3 and H3K27me3,marks of activation and repression, respectively. AML1-ETO mediated gene repression is believed to occurthrough an epigenetic mechanism involving H3K27me3[12]. Although this activity occurs at the LAT2 gene [47]and only on a subset of our ChIP-seq peaks, the repres-sion characterized by local alterations in H3K27me3 islikely not the dominant mechanism in Kasumi-1 cells. Incontrast, H3K4me3 enrichments correlated well with
Trombly et al. BMC Genomics (2015) 16:309 Page 9 of 13
those of H3K9ac [24]; signals for both activating markswere reduced in genomic regions where AML1-ETO andN-CoR were elevated (data not shown). HDAC activitymay decrease H3K9ac signals at these regions, a changethat may be achieved by direct interactions betweenAML1-ETO and HDACs or via recruitment of HDACsby N-CoR. Similarly, in transcription start site-proximalregions, H3K4me3 enrichment may be reduced whenAML1-ETO/N-CoR occupancy is high.Given that the fusion protein occupies Kasumi-1 meta-
phase chromosomes [20], it is possible that during mi-tosis AML1-ETO associates with chromatin regulatorsat novel genes that are critical for maintaining theleukemic phenotype. This epigenetic gene bookmarkingmechanism has been described for Runx2 in osteoblasticcells [33,48,49] and for PcG proteins in Drosophila S2cells [50]. Future work on purified populations of mitoticKasumi-1 cells will shed light on whether AML1-ETOparticipates in gene bookmarking.Collectively, our data have revealed a global AML1-
ETO/N-CoR signature with two key properties: occu-pancy of promoter-distal regions of AML1-ETO-regulatedgenes, and enrichment for myeloid-related ETS factors.Genes within this regulatory network define the diseasephenotype of t(8;21) leukemia and are potential thera-peutic targets.
ConclusionsFindings presented here establish a novel t(8;21) AMLleukemia signature characterized by occupancy of AML1-ETO/N-CoR at promoter-distal genomic regions enrichedin motifs for myeloid differentiation factors. These findingsare significant because a genome-wide mechanism forAML1-ETO mediated block in myeloid differentiation re-mains poorly understood. Results reported in thisstudy provide insight into genome-wide mechanismsthat contribute to the disease phenotype of the t(8;21)carrying leukemia.
MethodsCell lines and reagentsKasumi-1 and K562 cell lines were purchased from theAmerican Type Culture Collection (ATCC, Manassas,VA) and maintained in RPMI-1640 media supplementedwith 20% FBS. AML1 antibodies were purchased fromCell Signaling Technology, Inc. (4334, Danvers, MA),Abcam (50541, Cambridge, MA), EMD Millipore (PC285,Billerica, MA), and Active Motif (39000, Carlsbad, CA).The Cell Signaling Technology and Active Motif AML1antibodies gave robust AML1 pulldowns and displayedsignificant ChIP-PCR enrichments of control genomicregions. The Cell Signaling Technology AML1 antibodyrecognizes the N-terminal region of AML1, thus pull-ing down both wildtype AML1 and AML1-ETO. In
contrast, the Active Motif AML1 antibody recognizesthe C-terminal region of AML1 and does not pull downthe AML1-ETO fusion protein. Therefore, the ActiveMotif antibody was used for AML1 ChIP-seq librarypreparations. An ETO antibody, PC283, was purchasedfrom EMD Millipore (Billerica, MA). N-CoR (SC-1609)and p300 (SC-585) antibodies were purchased fromSanta Cruz Biotechnology, Inc. (Santa Cruz, CA). Ahistone H3 (tri methyl K4) antibody (ab1012) was pur-chased from Abcam (Cambridge, MA) and a histoneH3 (tri methyl K27) antibody (ABE44) was purchasedfrom EMD Millipore (Billerica, MA).
ChIP-seq library preparationKasumi-1 cells growing in log phase were fixed with 1%formaldehyde for 10 min at room temperature and sub-sequently quenched with 0.25 M glycine. After washesin PBS, cells were flash frozen in liquid nitrogen. Thawedpellets were resuspended in Buffer A (50 mM HEPES, 140mM NaCl, 1 mM EDTA, 10% glycerol, 0.5% NP-40, 0.25%Triton X-100) and rotated at 4°C for 10 min. Followingcentrifugation, pellets were resuspended in Buffer B (10mM Tris-HCl, 200 mM NaCl, 1 mM EDTA, 1 mMEGTA) and rotated at 4°C for 10 min. Pellets from cen-trifuged samples were resuspended in Buffer C (10 mMTris-HCl, 100 mM NaCl, 1 mM EDTA, 1 mM EGTA,0.1% sodium deoxycholate, 0.5% N-lauroylsarcosine).Samples were aliquoted, 3 ml per tube, and sonicatedto a fragment size of 100-500 base pairs using a 3.2 mmsonication probe (QSonica, Newtown, CT). Shearedchromatin (from approximately 30 million cells) wasimmunoprecipitated with antibodies overnight. AllChIP experiments included either normal goat or rabbitIgG (EMD Millipore, Billerica, MA) as controls.Antibody-lysate complexes were mixed with Protein GDynabeads (Life Technologies, Grand Island, NY) fortwo hours. For AML1, ETO, H3K4me3, and H3K27me3immunoprecipitations, beads were washed once with IPbuffer, three times with RIPA buffer (50 mM HEPES, 500mM LiCl, 1 mM EDTA, 0.5% NP-40, 0.25% sodium deox-ycholate), once with PBS, and once with TE buffer. For N-CoR and p300 pulldowns, beads were washed once withIP buffer, once with high salt buffer (2 mM EDTA, 20 mMTris-HCl, 500 mM NaCl), 1 time with RIPA buffer (50mM HEPES, 250 mM LiCl, 1 mM EDTA, 0.5% NP-40,0.25% sodium deoxycholate), once with PBS, and oncewith TE buffer. Protein-DNA complexes were extractedfrom beads at 37°C in elution buffer (10 mM EDTA, 50mM Tris-HCl, 1% SDS). For reverse crosslinking, superna-tants from centrifuged samples were rotated overnight at60°C. RNAse and proteinase K treated samples wereextracted with phenol:chloroform:isoamyl alcohol. Precipi-tated DNA was resuspended in 10 mM Tris-HCl,
Trombly et al. BMC Genomics (2015) 16:309 Page 10 of 13
quantified with a Qubit fluorometer (Life Technologies,Grand Island, NY).Prior to processing raw ChIP material for deep se-
quencing, ChIP-PCR validation studies were employed.Positive and negative control binding regions wereestablished using different primers sets, and data wasexpressed as percentage of input for each region. Inaddition to site-specific enrichment for ChIP samples,IgG was used as the non-specific control. A secondround of ChIP-PCR was performed following amplifica-tion of libraries to ensure enrichment of genomicregions in ChIP samples relative to input. Primer se-quences used in ChIP-PCR studies (including ChIP-seqtarget validation) can be found in Additional file 9:Table S2.The Illumina protocol (Illumina, Inc., San Diego, CA)
for ChIP-seq library generation was used with slightmodifications. Approximately 5-10 ng chromatin wasend-repaired (EpiCentre Biotechnologies, Madison, WI).Material was then A-tailed and ligated with adapters forsingle end deep sequencing (Illumina, Inc., San Diego,CA). Adapter modified DNA was size-selected, 300-400base pair (bp) range, and then amplified using the Phu-sion polymerase (New England Biolabs, Ipswich, MA).Amplified ChIP libraries were size selected and sequencedon an Illumina GAIIx Genome Analyzer (Illumina, Inc.,San Diego, CA) at the UMass Medical School Deep Se-quencing Core Facility (Worcester, MA). Two biologicalChIP-seq replicates and inputs were collected for AML1,AML1-ETO, p300, N-CoR, H3K4me3, and H3K27me3.
Analysis of sequencing dataAs a preliminary step, the read quality from ChIP-seqexperiments was assessed using FastQC [51]. Readswere aligned to the human genome (GRCh37, hg19)using bowtie (version 0.12.8) [52], allowing up to twomismatches. Peak calling was performed using MACS(version 2.0.10.20131216) [34] with default settings anda p < 10−20 threshold. For the remainder of this report,replicates for each regulatory protein or histone modifi-cation were pooled prior to peak calling and the result-ing occupancy/enrichment profiles were normalized to10 million reads. The overlaps between ChIP-seq peaks,summarized in Figure 1, were based upon peak sum-mits ± 50 bp. Using binding loci for AML1 and/orAML1-ETO (peak summits ± 50 bp, with peaks mergedfrom the two pooled experiments), mean ChIP-seq readdensities were collected for a set of ChIP-seq experi-ments and clustered by k-means (k = 3). In order to de-termine an appropriate choice for k, we clustered oursignals, examined the sum of the squared error (SSE)for 1 ≤ k ≤ 15 and compared this error with that from aset of 250 randomized instances of the data [53]. We
observed that the difference between the actual SSE andthat for randomized data was maximal for k = 3.De novo motifs were detected for each of the assayed
proteins (Figure 2C) using HOMER (v. 3.15) [54]. Dis-tinguishing binding of specific transcription factorswithin the ETS family is difficult because ETS factor mo-tifs are similar. Therefore, our analysis makes a conser-vative assignment by designating these motifs “ETSfamily”. Candidate ETS transcription factors that relateto t(8;21) leukemia are listed in the Discussion section.To detect a de novo motif that can best distinguish be-tween sequences from Cluster I and those in Clusters IIand III, we used the area under the receiver operatingcurve (AUC) to compare candidate motifs [55] convergingfrom a random motif to an optimal one using a simulatedannealing procedure [56] with Metropolis-Hastings MonteCarlo moves [57,58]. The resulting PU.1 de novo motif(Additional file 8: Figure S7) was compared to known mo-tifs using TOMTOM (version 4.9.1) [59] and was usedwith FIMO [39] (version 4.7.0) with a significance thresh-old of p < 10−4 to scan sequences in the clusters.In order to evaluate the transcriptional effect of AML1-
ETO binding in association with N-CoR and p300, twosets of previously reported gene expression profiling data[24,30] were independently used in combination with ourclustered ChIP sequencing data. The first published ex-pression data that we compared with [30] were collectedfrom Kasumi-1 cells that had been transfected withAML1-ETO or luciferase siRNA constructs by eitherAmaxa nucleofection or using Bio-Rad siLentFect. Theraw expression data were preprocessed and normalizedusing GCRMA [60]. These Kasumi-1 microarrays wereoriginally processed in two batches on different dates andthe global expression patterns were strongly clustered bybatch. We were able to control for this effect using thelinear model “~0 + transfection + AML1-ETO”, wherethe “transfection” factor correlates with the batch datesand the “AML1-ETO” factor indexes knockdown (or not)of the AML1-ETO mRNA. Replicates were treated asblocking factors in the linear model using limma [61]and empirical Bayes-moderated t tests were performed(Figure 4A and B). The linear model was fitted only forprobe-sets that were annotated with Entrez gene IDs;when there was more than one probe-set with the samegene ID, only the probe-set with the largest interquar-tile range was retained. A regulatory target gene can beassigned to each AML1/AML1-ETO locus on the basisof locus-TSS proximity. For each gene, however, theremay be many candidate regulatory loci. Therefore, anadditional assumption was made: regulation via anAML1-ETO/N-CoR (i.e., Cluster I) locus is dominant.If a gene is putatively regulated by loci from each ofClusters I, II and III, the Cluster I locus is assumed tobe limiting in its control of expression and the gene is
Trombly et al. BMC Genomics (2015) 16:309 Page 11 of 13
assigned exclusively to Cluster I for the purposes ofcomparing aggregate changes in expression due tobinding for each of the clusters. A Fisher’s exact testwas used to measure associations between the Clustersand genes regulated by AML1-ETO.In order to reinforce the above analysis of transcrip-
tional outcomes associated with AML1-ETO/N-CoR co-localization, we carried out steps similar to those outlinedabove using another set of previously reported gene ex-pression profiling data, collected in Kasumi-1 cells underknockdown (or not) of the AML1-ETO mRNA [24].These expression data were collected, without replication,over a series of four time-points following electroporationwith either AML1-ETO siRNA or mismatch siRNA. Nor-malized expression data were collected from the NCBIGene Expression Omnibus [62]. After retaining onlyprobe-sets that were annotated with Entrez gene IDs and,when there was more than one probe-set with the samegene ID, retaining only the probe-set with the largestinterquartile range, a linear model was fitted. We usedthe linear model “~0 + time-point + AML1-ETO”. The“time-point” variable enforces explicit pairing betweenthe AML1-ETO and mismatch siRNA conditions: theresulting empirical Bayes-moderated t tests from limma[61] are, therefore, paired t tests (Figure 4C and D).
Immunoprecipitation and western blottingKasumi-1 cells were centrifuged at 300 × g, resuspendedin PBS, and centrifuged again at 300 × g. Cells werelysed in buffer (20 mM Tris, 0.15M NaCl, 1 mM EDTA,1 mM EGTA, 1% Triton X-100, 1 mM PMSF), vortexed,and kept on ice for 20 min. Samples were centrifuged at10,000 × g for 10 min. Supernatants were collected andprotein concentration was determined by the BCA Assay(Thermo Scientific, Rockford, IL). Whole cell Kasumi-1extracts (500 μg) were immunoprecipitated overnightwith 2 μg of either p300 or N-CoR antibodies (SantaCruz Biotechnologies Inc., Santa Cruz, CA). Rabbit orgoat IgG were used as controls (Millipore, Billerica,MA). Samples were rotated with 30 μl Protein GDynabeads (Life Technologies, Grand Island, NY) fortwo hours, and then washed five times with IP buffer.Protein samples were run on a 5% SDS-PAGE gel andtransferred to PVDF membranes (Thermo Scientific,Rockford, IL). Membranes were blotted with p300 andN-CoR antibodies (1:750 dilution) overnight. Second-ary antibodies conjugated with HRP were purchasedfrom EMD Millipore (Billerica, MA). Enhanced chemi-luminescence was used for protein detection (ThermoScientific, Rockford, IL).
Availability of supporting dataThe data discussed in this publication have been de-posited in NCBI’s Gene Expression Omnibus [62] and
are accessible through GEO Series accession numberGSE62847 (http://www.ncbi.nlm.nih.gov/geo/query/acc.cgi?acc=GSE62847).
EndnoteaGenes exhibiting substantially altered expression are
defined here to have log2(fold-change) > 1 and p < 0.01.
Additional files
Additional file 1: Figure S1. Antibody validation prior to ChIP librarypreparation. (A) ChIP-western experiments on crosslinked Kasumi-1cells using a panel of AML1 antibodies and an AML1-ETO antibody. AnActive Motif AML1 antibody (39000, Carlsbad, CA) was used for ChIP-seq library preparations. Blots were cropped for clarity. (B) Western blotsfor p300 and N-CoR using Kasumi-1 and K562 whole cell lysates. (C)Immunoprecipitation and western blot of N-CoR in Kasumi-1 cells(using ChIP buffer C). IgG served as the control for all experiments.
Additional file 2: Figure S2. ChIP library validation in Kasumi-1 cells.(A) ChIP-PCR experiments demonstrated significant pulldown of aregion in the Runx1P1 promoter in ChIP samples but not in IgG controlsamples. Binding was negligible at the negative control hPhox region.The strength of pulldowns are expressed as percent input. Experimentswere repeated twice and error bars represent standard deviation. (B)Representative bioanalyzer results for AML1 and AML1-ETO libraries.Each library displays a size-selected, narrow fragment range amenablefor deep sequencing.
Additional file 3: Table S1. ChIP-Seq library overview. Shown are thenumber of reads and peaks called for each replicate ChIP-Seq library.
Additional file 4: Figure S3. Tag density plots and ChIP validaton ofAML1-ETO target genes. (A) Tag density plots displaying enrichedAML1-ETO regions corresponding to known fusion protein target genes.Asterisks indicate the positions of TYROBP, LAPTM5, and RPS6KA1 regionsvalidated in ChIP-PCR studies (B). Fold enrichment indicates enrichment ofChIP samples over inputs when equivalent amounts of DNA were used inPCR reactions.
Additional file 5: Figure S4. Correlation between different ChIP-seqlibraries. Scatter plots for five ChIP-seq experiments collected usingKasumi-1 cells. Each point represents a region of enrichment (i.e. “peak”) ineither the AML1, AML1-ETO or both experiments, with the normalized meanread number, SX, plotted for five antibodies with target X on a logarithmicscale. The lower triangle of the figure is comprised of scatter plots for pair-wise comparisons, while the upper triangle reports the correspondingcorrelation coefficients (Pearson’s r).
Additional file 6: Figure S5. Ontologies for genomic regions co-occupiedby AML1-ETO and co-regulatory proteins. (A-B) Gene ontology (GO) categories(Biological Process; Molecular Signatures Database Perturbation) withassociated top-ranked terms are shown for genomic regions associatedwith exclusive AML1-ETO/N-CoR enrichments (see 4252 overlappingregions in Figure 1C) and AML1-ETO/p300 enrichments (see 1164overlapping regions in Figure 1C). These genomic regions were definedusing the Venn diagram in Figure 1C and genomic coordinates wereassociated with GO categories using GREAT [35] (version 2.0.2). Notethat no Biological Process terms were reported by GREAT (using thedefault association rules) for AML1-ETO/p300. Ontology terms reflectingregions of shared occupancy (see Figure 1C) between AML1-ETO/N-CoR/p300 (C) and AML1/N-CoR/p300 (D) are also reported. Values on columnplots represent –log10(binomial p-value), computed using GREAT with thedefault association rules. Note: some ontology term names were shortened.
Additional file 7: Figure S6. H3K27me3 ChIP-seq regions. Tag densityplots of H3K27me3 data (normalized to 107 reads) at CXCR4 and HCK loci.
Additional file 8: Figure S7. De novo discriminative motif. De novomotif (see Methods for details) to distinguish Cluster I loci from those ofthe other two clusters (see Figure 3A and D). Using TOMTOM (version4.9.1) [59] to compare this motif with those from the TRANSFAC (Matys V
Trombly et al. BMC Genomics (2015) 16:309 Page 12 of 13
et al., Nucleic Acids Res. 2006, 34(Database Issue):D108-10) and JASPAR(Mathelier A et al., Nucleic Acids Res. 2014, 42(Database Issue):D142-47)repositories, the TRANSFAC V_PU1_Q4 motif was the closest match,followed by V_PU1_01 and the JASPAR motif MA0080.2 (SPI1, alsoknown as PU.1).
Additional file 9: Table S2. Oligonucleotides used in ChIP-PCR validationstudies.
AbbreviationsTSSs: Transcriptional start sites; AML: Acutemyeloid leukemia; ChIP-Seq: Chromatinimmunoprecipitationwith high-throughput sequencing; ETO: Eight twenty-one;GREAT: Genomic regions enrichment of annotations tool; miRs: microRNAs;N-CoR: Nuclear co-repressor; NHR: Nervy homology regions; RHD: Runthomology domain; SMRT: Silencing mediator of retinoic acid and thyroidhormone receptor; t(8;21): Translocation between chromosomes 8 and 21.
Competing interestsThe authors declare that they have no competing interests.
Authors’ contributionsDJT and SP planned and executed chromatin-immunoprecipitation-sequencingexperiments. DJT, TWW, SP and JARG analyzed raw genomic datasets andgenerated final figures. DJT, TWW, JBL, AJvW, SKZ, JLS and GSS analyzedthe final figures and wrote the manuscript. All authors read and approvedthe final manuscript.
AcknowledgementsWe kindly thank Ellen Kittler, Daniella Wilmot, and Elisabeth Carr at the DeepSequencing Core (University of Massachusetts Medical School, Worcester,MA) and Jason Dobson and other members of our research group for helpfuldiscussions. TWW acknowledges Oliver D. King for helpful discussions. Authorsare deeply thankful for Drs. Constanze Bonifer, Anetta Ptasinska, and OlafHeidenreich (University of Birmingham, UK) for sharing their work prior tosubmission. This work was supported by NIH/NCI P01 CA082834 (GSS),NIH/NCI R03 CA167726 (SKZ) and the Cancer Biology Training Program T32CA130807 (DJT).
Author details1Department of Biochemistry and Vermont Cancer Center, University ofVermont College of Medicine, 89 Beaumont Avenue, Burlington, VT 05405,USA. 2Department of Cell and Developmental Biology, University ofMassachusetts Medical School, 55 Lake Avenue North, Worcester, MA 01655,USA. 3Program in Bioinformatics and Integrative Biology, University ofMassachusetts Medical School, 55 Lake Avenue North, Worcester, MA 01655,USA. 4Current address: Biomedical Sciences, Mayo Clinic, 200 First Street SW,Rochester, MN 55905, USA.
Received: 15 October 2014 Accepted: 6 March 2015
References1. Look AT. Oncogenic transcription factors in the human acute leukemias.
Science. 1997;278(5340):1059–64.2. Erickson P, Gao J, Chang KS, Look T, Whisenant E, Raimondi S, et al. Identification
of breakpoints in t(8;21) acute myelogenous leukemia and isolation of a fusiontranscript, AML1/ETO, with similarity to Drosophila segmentation gene, runt.Blood. 1992;80(7):1825–31.
3. Miyoshi H, Shimizu K, Kozu T, Maseki N, Kaneko Y, Ohki M. t(8;21) breakpointson chromosome 21 in acute myeloid leukemia are clustered within a limitedregion of a single gene, AML1. Proc Natl Acad Sci U S A. 1991;88(23):10431–4.
4. Davis JN, McGhee L, Meyers S. The ETO (MTG8) gene family. Gene. 2003;303:1–10.5. Meyers S, Lenny N, Hiebert SW. The t(8;21) fusion protein interferes with
AML-1B-dependent transcriptional activation. Mol Cell Biol. 1995;15(4):1974–82.6. Gelmetti V, Zhang J, Fanelli M, Minucci S, Pelicci PG, Lazar MA. Aberrant
recruitment of the nuclear receptor corepressor-histone deacetylase complex bythe acute myeloid leukemia fusion partner ETO. Mol Cell Biol. 1998;18(12):7185–91.
7. Wang J, Hoshino T, Redner RL, Kajigaya S, Liu JM. ETO, fusion partner int(8;21) acute myeloid leukemia, represses transcription by interaction withthe human N-CoR/mSin3/HDAC1 complex. Proc Natl Acad Sci U S A.1998;95(18):10860–5.
8. Gottlicher M, Minucci S, Zhu P, Kramer OH, Schimpf A, Giavara S, et al. Valproicacid defines a novel class of HDAC inhibitors inducing differentiation oftransformed cells. EMBO J. 2001;20(24):6969–78.
9. Liu S, Klisovic RB, Vukosavljevic T, Yu J, Paschka P, Huynh L, et al. TargetingAML1/ETO-histone deacetylase repressor complex: a novel mechanismfor valproic acid-mediated gene expression and cellular differentiation inAML1/ETO-positive acute myeloid leukemia cells. J Pharmacol Exp Ther.2007;321(3):953–60.
10. Zapotocky M, Mejstrikova E, Smetana K, Stary J, Trka J, Starkova J. Valproicacid triggers differentiation and apoptosis in AML1/ETO-positive leukemiccells specifically. Cancer Lett. 2012;319(2):144–53.
11. Buchi F, Masala E, Rossi A, Valencia A, Spinelli E, Sanna A, et al. Redistributionof H3K27me3 and acetylated histone H4 upon exposure to azacitidineand decitabine results in de-repression of the AML1/ETO target geneIL3. Epigenetics. 2014;9(3):387–95.
12. Chen J, Odenike O, Rowley JD. Leukaemogenesis: more than mutant genes.Nat Rev Cancer. 2010;10(1):23–36.
13. Klampfer L, Zhang J, Zelenetz AO, Uchida H, Nimer SD. The AML1/ETOfusion protein activates transcription of BCL-2. Proc Natl Acad Sci U S A.1996;93(24):14059–64.
14. Peterson LF, Yan M, Zhang DE. The p21Waf1 pathway is involved inblocking leukemogenesis by the t(8;21) fusion protein AML1-ETO. Blood.2007;109(10):4392–8.
15. Zaidi SK, Dowdy CR, van Wijnen AJ, Lian JB, Raza A, Stein JL, et al. AlteredRunx1 subnuclear targeting enhances myeloid cell proliferation andblocks differentiation by activating a miR-24/MKP-7/MAPK network.Cancer Res. 2009;69(21):8249–55.
16. Wang L, Gural A, Sun XJ, Zhao X, Perna F, Huang G, et al. The leukemogenicityof AML1-ETO is dependent on site-specific lysine acetylation. Science.2011;333(6043):765–9.
17. Fazi F, Racanicchi S, Zardo G, Starnes LM, Mancini M, Travaglini L, et al.Epigenetic silencing of the myelopoiesis regulator microRNA-223 by theAML1/ETO oncoprotein. Cancer Cell. 2007;12(5):457–66.
18. Liddiard K, Hills R, Burnett AK, Darley RL, Tonks A. OGG1 is a novel prognosticindicator in acute myeloid leukaemia. Oncogene. 2010;29(13):2005–12.
19. Reikvam H, Hatfield KJ, Kittang AO, Hovland R, Bruserud O. Acute myeloidleukemia with the t(8;21) translocation: clinical consequences andbiological implications. J Biomed Biotechnol. 2011;2011:104631.
20. Bakshi R, Zaidi SK, Pande S, Hassan MQ, Young DW, Montecino M, et al.The leukemogenic t(8;21) fusion protein AML1-ETO controls rRNAgenes and associates with nucleolar-organizing regions at mitoticchromosomes. J Cell Sci. 2008;121(Pt 23):3981–90.
21. Lausen J, Liu S, Fliegauf M, Lubbert M, Werner MH. ELA2 is regulated byhematopoietic transcription factors, but not repressed by AML1-ETO.Oncogene. 2006;25(9):1349–57.
22. Vangala RK, Heiss-Neumann MS, Rangatia JS, Singh SM, Schoch C, Tenen DG,et al. The myeloid master regulator transcription factor PU.1 is inactivated byAML1-ETO in t(8;21) myeloid leukemia. Blood. 2003;101(1):270–7.
23. Zhang J, Kalkum M, Yamamura S, Chait BT, Roeder RG. E proteinsilencing by the leukemogenic AML1-ETO fusion protein. Science.2004;305(5688):1286–9.
24. Ptasinska A, Assi SA, Mannari D, James SR, Williamson D, Dunne J, et al.Depletion of RUNX1/ETO in t(8;21) AML cells leads to genome-wide changesin chromatin structure and transcription factor binding. Leukemia.2012;26(8):1829–41.
25. Ptasinska A, Assi SA, Martinez-Soria N, Imperato MR, Piper J, Cauchy P,et al. Identification of a dynamic core transcriptional network in t(8;21)AML that regulates differentiation block and self-renewal. Cell Rep.2014;8(6):1974–88.
26. Saeed S, Logie C, Francoijs KJ, Frige G, Romanenghi M, Nielsen FG, et al.Chromatin accessibility, p300, and histone acetylation define PML-RARalpha and AML1-ETO binding sites in acute myeloid leukemia. Blood.2012;120(15):3058–68.
27. Martens JH, Mandoli A, Simmer F, Wierenga BJ, Saeed S, Singh AA, et al.ERG and FLI1 binding sites demarcate targets for aberrant epigeneticregulation by AML1-ETO in acute myeloid leukemia. Blood.2012;120(19):4038–48.
28. Robertson G, Hirst M, Bainbridge M, Bilenky M, Zhao Y, Zeng T, et al.Genome-wide profiles of STAT1 DNA association using chromatinimmunoprecipitation and massively parallel sequencing. Nat Methods.2007;4(8):651–7.
Trombly et al. BMC Genomics (2015) 16:309 Page 13 of 13
29. Asou H, Tashiro S, Hamamoto K, Otsuji A, Kita K, Kamada N. Establishmentof a human acute myeloid leukemia cell line (Kasumi-1) with 8;21 chromosometranslocation. Blood. 1991;77(9):2031–6.
30. Corsello SM, Roti G, Ross KN, Chow KT, Galinsky I, DeAngelo DJ, et al.Identification of AML1-ETO modulators by chemical genomics. Blood.2009;113(24):6193–205.
31. Hyde RK, Liu PP. RUNX1 repression-independent mechanisms of leukemogenesisby fusion genes CBFB-MYH11 and AML1-ETO (RUNX1-RUNX1T1). J Cell Biochem.2010;110(5):1039–45.
32. van der Deen M, Akech J, Lapointe D, Gupta S, Young DW, Montecino MA,et al. Genomic promoter occupancy of runt-related transcription factorRUNX2 in Osteosarcoma cells identifies genes involved in cell adhesionand motility. J Biol Chem.2012;287(7):4503–17.
33. Young DW, Hassan MQ, Yang XQ, Galindo M, Javed A, Zaidi SK, et al.Mitotic retention of gene expression patterns by the cell fate-determiningtranscription factor Runx2. Proc Natl Acad Sci U S A. 2007;104(9):3189–94.
34. Zhang Y, Liu T, Meyer CA, Eeckhoute J, Johnson DS, Bernstein BE, et al.Model-based analysis of ChIP-Seq (MACS). Genome Biol. 2008;9(9):R137.
35. McLean CY, Bristor D, Hiller M, Clarke SL, Schaar BT, Lowe CB, et al. GREATimproves functional interpretation of cis-regulatory regions. Nat Biotechnol.2010;28(5):495–501.
36. Wilson NK, Foster SD, Wang X, Knezevic K, Schutte J, Kaimakis P, et al.Combinatorial transcriptional control in blood stem/progenitor cells:genome-wide analysis of ten major transcriptional regulators. Cell StemCell. 2010;7(4):532–44.
37. Hsu F, Kent WJ, Clawson H, Kuhn RM, Diekhans M, Haussler D. The UCSCknown genes. Bioinformatics. 2006;22(9):1036–46.
38. Bernstein BE, Birney E, Dunham I, Green ED, Gunter C, Snyder M, et al. Anintegrated encyclopedia of DNA elements in the human genome. Nature.2012;489(7414):57–74.
39. Grant CE, Bailey TL, Noble WS. FIMO: scanning for occurrences of a givenmotif. Bioinformatics. 2011;27(7):1017–8.
40. Gardini A, Cesaroni M, Luzi L, Okumura AJ, Biggs JR, Minardi SP, et al. AML1/ETO oncoprotein is directed to AML1 binding regions and co-localizes withAML1 and HEB on its targets. PLoS Genet. 2008;4(11):e1000275.
41. Pencovich N, Jaschek R, Tanay A, Groner Y. Dynamic combinatorialinteractions of RUNX1 and cooperating partners regulates megakaryocyticdifferentiation in cell line models. Blood. 2011;117(1):e1–14.
42. Tijssen MR, Cvejic A, Joshi A, Hannah RL, Ferreira R, Forrai A, et al. Genome-wide analysis of simultaneous GATA1/2, RUNX1, FLI1, and SCL binding inmegakaryocytes identifies hematopoietic regulators. Dev Cell.2011;20(5):597–609.
43. Ram O, Goren A, Amit I, Shoresh N, Yosef N, Ernst J, et al. Combinatorialpatterning of chromatin regulators uncovered by genome-wide locationanalysis in human cells. Cell. 2011;147(7):1628–39.
44. Bailey TL, Elkan C. Fitting a mixture model by expectation maximization todiscover motifs in biopolymers. Proc Int Conf Intell Syst Mol Biol. 1994;2:28–36.
45. Mikkelsen TS, Xu Z, Zhang X, Wang L, Gimble JM, Lander ES, et al.Comparative epigenomic analysis of murine and human adipogenesis. Cell.2010;143(1):156–69.
46. Pattabiraman DR, McGirr C, Shakhbazov K, Barbier V, Krishnan K,Mukhopadhyay P, et al. Interaction of c-Myb with p300 is required for theinduction of acute myeloid leukemia (AML) by human AML oncogenes.Blood. 2014;123(17):2682–90.
47. Duque-Afonso J, Yalcin A, Berg T, Abdelkarim M, Heidenreich O, Lubbert M.The HDAC class I-specific inhibitor entinostat (MS-275) effectively relievesepigenetic silencing of the LAT2 gene mediated by AML1/ETO. Oncogene.2011;30(27):3062–72.
48. Kadauke S, Udugama MI, Pawlicki JM, Achtman JC, Jain DP, Cheng Y, et al.Tissue-specific mitotic bookmarking by hematopoietic transcription factorGATA1. Cell. 2012;150(4):725–37.
49. Zaidi SK, Young DW, Montecino M, Lian JB, Stein JL, van Wijnen AJ, et al.Architectural epigenetics: mitotic retention of mammalian transcriptionalregulatory information. Mol Cell Biol. 2010;30(20):4758–66.
50. Follmer NE, Wani AH, Francis NJ. A polycomb group protein is retained atspecific sites on chromatin in mitosis. PLoS Genet. 2012;8(12):e1003135.
51. FastQC. [http://www.bioinformatics.babraham.ac.uk/projects/fastqc/]
52. Langmead B, Trapnell C, Pop M, Salzberg SL. Ultrafast and memory-efficientalignment of short DNA sequences to the human genome. Genome Biol.2009;10(3):R25.
53. R Script for K-means cluster analysis. [http://www.mattpeeples.net/kmeans.html]54. Heinz S, Benner C, Spann N, Bertolino E, Lin YC, Laslo P, et al. Simple
combinations of lineage-determining transcription factors prime cis-regulatory elements required for macrophage and B cell identities. Mol Cell.2010;38(4):576–89.
55. Whitfield TW, Wang J, Collins PJ, Partridge EC, Aldred SF, Trinklein ND, et al.Functional analysis of transcription factor binding sites in human promoters.Genome Biol. 2012;13(9):R50.
56. Kirkpatrick S, Gelatt Jr CD, Vecchi MP. Optimization by simulated annealing.Science. 1983;220(4598):671–80.
57. Hastings WK. Monte Carlo sampling methods using Markov chains and theirapplications. Biometrika. 1970;57(1):97.
58. Metropolis N, Rosenbluth AW, Rosenbluth MN, Teller AN, Teller E. Equationof state calculations by fast computing machines. J Chem Phys. 1953;21:1087.
59. Gupta S, Stamatoyannopoulos JA, Bailey TL, Noble WS. Quantifying similaritybetween motifs. Genome Biol. 2007;8(2):R24.
60. Wu Z, Irizarry RA. Preprocessing of oligonucleotide array data. NatBiotechnol. 2004;22(6):656–8. author reply 658.
61. Smyth GK. Linear models and empirical bayes methods for assessingdifferential expression in microarray experiments. Stat Appl Genet MolBiol.2004;3. Article 3.
62. Edgar R, Domrachev M, Lash AE. Gene expression Omnibus: NCBI geneexpression and hybridization array data repository. Nucleic Acids Res.2002;30(1):207–10.
63. Kent WJ, Sugnet CW, Furey TS, Roskin KM, Pringle TH, Zahler AM, et al. Thehuman genome browser at UCSC. Genome Res. 2002;12(6):996–1006.
64. Subramanian A, Tamayo P, Mootha VK, Mukherjee S, Ebert BL, Gillette MA,et al. Gene set enrichment analysis: a knowledge-based approach forinterpreting genome-wide expression profiles. Proc Natl Acad Sci U S A.2005;102(43):15545–50.
Submit your next manuscript to BioMed Centraland take full advantage of:
• Convenient online submission
• Thorough peer review
• No space constraints or color figure charges
• Immediate publication on acceptance
• Inclusion in PubMed, CAS, Scopus and Google Scholar
• Research which is freely available for redistribution
Submit your manuscript at www.biomedcentral.com/submit


![Early assessment of treatment response in patients with AML using [18F]FLT PET imaging](https://img.pdfslide.net/doc/110x75/635089b0d2282bdce30f345d/early-assessment-of-treatment-response-in-patients-with-aml-using-18fflt-pet-imaging.jpg)