Embed Size (px)
Citation preview

Genomic and Epigenomic Responses to Chronic StressInvolve miRNA-Mediated ProgrammingOlena Babenko1,2, Andrey Golubov1, Yaroslav Ilnytskyy1, Igor Kovalchuk1., Gerlinde A. Metz2,3*.
1 Department of Biological Sciences, University of Lethbridge, Lethbridge, Alberta, Canada, 2 Canadian Centre for Behavioural Neuroscience, University of Lethbridge,
Lethbridge, Alberta, Canada, 3 Hotchkiss Brain Institute, University of Calgary, Calgary, Alberta, Canada
Abstract
Stress represents a critical influence on motor system function and has been shown to impair movement performance. Wehypothesized that stress-induced motor impairments are due to brain-specific changes in miRNA and protein-encodinggene expression. Here we show a causal link between stress-induced motor impairment and associated genetic andepigenetic responses in relevant central motor areas in a rat model. Exposure to two weeks of mild restraint stress alteredthe expression of 39 genes and nine miRNAs in the cerebellum. In line with persistent behavioural impairments, somechanges in gene and miRNA expression were resistant to recovery from stress. Interestingly, stress up-regulated theexpression of Adipoq and prolactin receptor mRNAs in the cerebellum. Stress also altered the expression of Prlr, miR-186,and miR-709 in hippocampus and prefrontal cortex. In addition, our findings demonstrate that miR-186 targets the geneEps15. Furthermore, we found an age-dependent increase in EphrinB3 and GabaA4 receptors. These data show that evenmild stress results in substantial genomic and epigenomic changes involving miRNA expression and associated gene targetsin the motor system. These findings suggest a central role of miRNA-regulated gene expression in the stress response and inassociated neurological function.
Citation: Babenko O, Golubov A, Ilnytskyy Y, Kovalchuk I, Metz GA (2012) Genomic and Epigenomic Responses to Chronic Stress Involve miRNA-MediatedProgramming. PLoS ONE 7(1): e29441. doi:10.1371/journal.pone.0029441
Editor: Christian Schonbach, Kyushu Institute of Technology, Japan
Received August 18, 2011; Accepted November 28, 2011; Published January 24, 2012
Copyright: � 2012 Babenko et al. This is an open-access article distributed under the terms of the Creative Commons Attribution License, which permitsunrestricted use, distribution, and reproduction in any medium, provided the original author and source are credited.
Funding: Funding provided by Alberta Innovates Health Solutions (http://www.ahfmr.ab.ca/), Canadian Institutes of Health Research (http://www.researchnet-recherchenet.ca/rnr16/srch.do?all = 1&search = true&org = CIHR&sort = program&masterList = true&view = currentOpps&fodAgency = CIHR&fodLanguage = E) andthe University of Lethbridge (http://www.uleth.ca/). The funders had no role in study design, data collection and analysis, decision to publish, or preparationof the manuscript.
Competing Interests: The authors have declared that no competing interests exist.
* E-mail: [email protected]
. These authors contributed equally to this work.
Introduction
Stress affects the function of most organs including the brain.
Psychological challenges are among the most powerful stimuli to
induce a cascade of complex neuroendocrine and autonomic
changes [1]. Since 1914, when Walter Bradford Cannon first
described the psychophysiology of the stress [2], abundance of
data suggested that stress can induce lasting molecular and
physiological changes in the brain and its output, behaviour. The
brain represents a central regulator which controls the behavioural
and physiological responses to stressful events [3]. In a chronic
condition, these physiological responses have the potential to
facilitate the onset and progression of disease.
Variability in the stress response and susceptibility to disease is
influenced by the genetic and epigenetic background of each
individual [4]. Epigenetic components, which regulate gene
expression, include DNA methylation, histone modification,
chromosome remodeling, and expression of small non-coding
RNAs such as microRNA (miRNA). The understanding of the
interaction between genetic and epigenetic components in the
brain under a stressful condition can provide an insight into
pathogenic processes that contribute to neurological diseases. For
instance, miRNAs may be a contributing factor to aging-related
neurodegenerative diseases [5,6,7]. It was shown that substantial
loss of mature miRNAs in the cerebellum of Dicer knock-out mice
causes progressive neurodegeneration [8]. At the same time
exposure to stress can cause changes in epigenetic machinery. For
example, maternal care alters epigenetic programming and can
determine the offspring’s adult stress response [9].
Our previous data suggest that 20 minutes of chronic mild
psychological stress, induced by restraint, causes lasting impair-
ments in skilled movement and balance in rats [10,11].
Considering that motor impairments in male rats persist even
after the cessation of the stressor [11], it is possible that epigenetic
mechanisms may be involved to permanently alter movement
performance via genomic changes in motor areas. The largest and
one of the most important motor regions is the cerebellum, which
contributes to the learning and coordination of skilled movements
[12]. It is likely that stress-induced motor impairments are related
to altered processing by the cerebellum. We hypothesized that
impaired motor control by stress is related to changes in miRNA
and protein-encoding gene expression. The results show that mild
chronic psychological stress changes cerebellar miRNA and
mRNA expression. We confirmed the expression of several
mRNA and miRNAs and demonstrate that miR-186 targets
Eps15. The expression of some genes and miRNA expression was
also changed in hippocampus and prefrontal cortex. Thus, the
present observations demonstrate that even mild stress results in
substantial changes in the expression of mRNA and miRNA in the
brain.
PLoS ONE | www.plosone.org 1 January 2012 | Volume 7 | Issue 1 | e29441

Results
Body weight and corticosterone levelsBody weight growth curves were not different between the
control and the stress groups (Fig. 1). The mean weight of animals
in the stress group (487.3625.2 g) was 3.5% lower than that of the
control group (504.5629.2 g) (Fig. 1).
Analysis of the concentration of plasma corticosterone in control
and stress animals showed significant differences (p,0.001) on the
first day of stress (Fig. 2). On the last day of stress, stress animals
had lower levels of corticosterone as compared to the first day of
stress, indicating habituation to the stress procedure. Moreover,
stress animals showed a decline in corticosterone levels after
recovery from stress compared to the first day of stress. No
difference between stress and control animals was found.
Skilled reaching successThere was a significant main effect of Group (F4,28 = 23.51,
p,0.0001). Compared to baseline, stress reduced reaching success
on the first day (day 1; t = 6.88, p,0.001) and last day of stress
treatment (day 14; t = 9.02, p,0.0001) (Fig. 3). On the first day of
recovery, rats still showed significantly reduced reaching success
(t = 7.97, p,0.0001). Reaching success did not recover to baseline
levels by day 14 of recovery from stress (t = 5.69, p,0.001).
Compared to day 1 of the recovery period, however, performance
improved by day 14 of recovery (t = 7.17, p,0.001).
mRNA microarray analysismRNA expression pattern was analyzed in the following
experimental groups: 2 weeks of daily restraint stress
(2WSTRESS, n = 3), 2 weeks controls (2WCONTROL, n = 3), 2
weeks of daily restraint stress + 2 weeks of recovery from stress
(4WSTRESS, n = 3), 4 weeks controls (4WCONTROL, n = 3).
Microarray data analysis showed that after two weeks of stress
(2WSTRESS) 39 genes changed significantly (p,0.05; 2-fold
difference) compared to respective controls (2WCONTROL): 36
were up-regulated, while three genes were down-regulated (see
Table 1, Fig. 4). To exclude the possibility that these changes were
due to changes in control values, 2WCONTROL vs. 4WCON-
TROL data were plotted, and only three genes remained changed,
all being up-regulated. The changes observed upon comparison of
RNA profile in the 2WSTRESS group of animals vs. 2WCON-
TROL of animals were nearly completely eliminated after two
weeks of recovery after stress. A comparison of the expression in
the 4WSTRESS group with the expression in the 4WCONTOL
group showed just four genes were altered and two of them were
down-regulated. All of these 4 genes were different from the group
of 39 genes. In order to find some of these genes still changed in
the 4WSTRESS group less stringent conditions were applied.
Therefore, 4WSTRESS vs. 4WCONTROL groups were plotted
using 1.3-fold change and a p-value,0.1 as cut-off. The generated
list included 803 genes (data not shown) with 7 of them being the
genes found in 2WSTRESS vs. 2WCONTROL comparison
(Table 2).
Semiquantitative RT-PCR confirmed the expression of Prlrand Adipoq genes
To confirm changes in mRNA expression level we chose two
related to stress genes from the list of genes that changed after two
weeks of stress (Table 1): prolactin receptor (Prlr) and adiponectin,
C1Q and collagen domain containing gene (Adipoq). Gamma-
aminobutyric acid (GABA) A receptor, alpha 4 gene (Gabra4) and
ephrin B3 gene (Efnb3) were used as controls. sq-RT-PCR was
performed in duplicates using the same RNA samples that were
used for microarray analysis. Sq-RT-PCR data analysis confirmed
a 2-fold difference between the stressed and non-stressed groups
Figure 1. A: Body weight growth curves. The time course of bodyweight gain in animals undergoing two weeks of stress (gray) and non-stress control animals (black). Note that stress moderately diminishedthe average rate of weight gain (mean 6 SD). B: Body weight (means 6SD) after two weeks of stress (‘‘Stress’’) and after two weeks of stressfollowed by two weeks of recovery (‘‘Recovery’’).doi:10.1371/journal.pone.0029441.g001
Figure 2. Concentration of plasma corticosterone (means ± SD;ng/ml) in control and stress animals as measured on the firstday of stress, last day of stress and after two weeks of recoveryfrom stress (‘‘Recovery’’). Asterisks represent statistical significance(*** p,0.001).doi:10.1371/journal.pone.0029441.g002
Stress-Induced Epigenetic Programming
PLoS ONE | www.plosone.org 2 January 2012 | Volume 7 | Issue 1 | e29441

for both, Adipoq and Prlr genes (Fig. 5A, B). In contrast, no
significant differences in expression of Gabra4 and Efnb3 were
observed (Fig. 5C, D). Interestingly, there were significant age-
dependent changes in the expression level of Gabra4 and Efnb3
genes. 4WSTRESS and 4WSTRESS samples showed higher
expression than 2WSTRESS and 2WCONTROL (see Fig. 5C,
D).
Quantitative RT-PCR showed changes in Prlr expressionin prefrontal cortex and hippocampus
The expression level of Prlr and Adipoq genes was assessed in
hippocampus and prefrontal cortex, brain regions important for
the regulation of the stress response. There were no significant
changes in Prlr expression in the prefrontal cortex or hippocampus
after two weeks of stress (Fig. 6A, B). Interestingly, after two weeks
of recovery from stress Prlr expression in the prefrontal cortex was
up-regulated while it was down-regulated in the hippocampus
(Fig. 6A, B). There were no significant changes in Adipoq
expression in hippocampus or prefrontal cortex at either two or
four weeks after stress (Fig. 6C, D). For more details see (Tables
S1, S2, S3, S4, Figs. S1, S2). It should be noted, however, that the
level of Adipoq expression in hippocampus is very low (C(t)
values.40 and beyond detection), which results in a high fold
change that is not significant. When dealing with very low copy
numbers, the distribution of the template is not expected to be
normal, instead, it follows a Poisson distribution. Thus, a large
number of replicates are necessary in order to provide statistical
significance (Application note, www.appliedbiosystems.com).
Analysis of gene lists using DAVID BioinformaticsResources
To describe the possible role of the changes in regulation of 39
aforementioned genes, these genes were analysed using the
Database for Annotation, Visualization and Integrated Discovery
(DAVID) [13]. Predicted open reading frames (ORFs) were
excluded from analysis by DAVID. The remaining 20 genes were
grouped into four functional clusters: positive regulation of
macromolecule metabolic process (genes: Tcf21, Msx1, Adipoq,
Cited1), protein complex assembly (genes: Prlr, Otc, Adipoq), cell
adhesion (genes: Cldn3, Itgb6, Cdh3), receptor (genes: Prlr, Osmr,
Itgb6, Ssta6) (see Table S5 and Fig. 7).
miRNA microarray analysismiRNA microarray analysis was performed using a mParafloH
Biochip, containing 832 mature miRNA sequences. The
following samples were used for analysis: 2 weeks of daily
restraint stress (2WSTRESS, n = 3) and 2 weeks controls
(2WCONTROL, n = 3). First, data with a p-value,0.1 were
analyzed. We found that nine miRNAs were changed in stressed
animals in comparison to controls (see Fig. 8). Three miRNAs
changed significantly with a p-value,0.05 in comparison to
controls. Two miRNAs, miR-186 and miR-381, were up-
regulated, while miR-709 was down-regulated. For further
analysis only miRNAs with the lowest p-value (p,0.01) were
used, which included miR-186 (log2 ratio of 0.43) and miR-709
(log2 ratio of 20.66).
qRT-PCR confirmed the expression of miR-186 and miR-709
We performed qRT-PCR analysis to confirm changes in miR-
186 and miR-709 expression after two weeks of stress, and to
investigate their expression after four weeks. The microarray
results were confirmed for miR-709, which was down-regulated
after two weeks of stress (2WSTRESS vs. 2WCONTROL) and
demonstrated that this pattern of expression persists after two
weeks of recovery from stress (4WSTRESS vs. 4WCONTROL).
Interestingly, miR-709 showed different expression patterns in
different brain regions (Fig. 9B, D, and F).
We did not observe any significant changes for miR-186 in
stress and control animals after two weeks of stress, however,
miRNA-186 was significantly up-regulated in cerebellum after two
weeks of recovery from stress (Fig. 9A). miR-186 showed similar
expression patterns in hippocampus and prefrontal cortex (Fig. 9C
and E). For more details see (Tables S6, S7, S8, S9, S10, S11, Figs.
S3, S4).
Analysis of predicted miRNA targetsCurrently there are no confirmed targets for miR-186 and
miR-709 in the brain. Computational analysis of predicted
targets for miR-186 revealed 365 putative miRNA targets, with a
total of 398 conserved sites and 271 poorly conserved sites, with
the score from 21.31 (most favorable) to 0.00 (data are not
shown). We examined the first 50 genes with the most favorable
Figure 3. Skilled reaching performance in male rats. A, B: Series of photographs illustrating forelimb and digit movements of a rat grasping afood pellet. C: skilled reaching success in rats before (baseline), during and after two weeks of stress (mean 6 SEM). Note that stress diminished skilledreaching performance after acute (day 1) and chronic (day 14) of daily stress treatment. Reaching success did not return to baseline levels within 14days of recovery. Asterisks represent statistical significance (*** p,0.001).doi:10.1371/journal.pone.0029441.g003
Stress-Induced Epigenetic Programming
PLoS ONE | www.plosone.org 3 January 2012 | Volume 7 | Issue 1 | e29441
score (,20.59). Among those we chose five targets which may be
important in the brain: Gabra4 (score: 21.31), Creb3 (21.07),
Eps15 (20.93), A2bp1 (20.65), and Map3k2 (20.81). We were
able to clone the wild and mutated binding site only of Eps15 into
the plasmid used for Luciferase Reporter Assay, and thus we
performed the analysis for Eps15 only (see Fig. S2). The 39UTR
of the Eps15 gene (NM_001009424) contains one binding site
with a poorly conserved sequence for rno-miR-186 with one
mismatch. The seed sequence is located 422–429 bp downstream
of stop codon of Eps15 CDS. To confirm that Eps15 is indeed
targeted by miR-186 we carried out a luciferase reporter assay.
Analysis of Luciferase Assay data showed that the luciferase
activity was inhibited by miR-186 after co-transfection of
mammalian cells with the construct carrying Eps-15 39UTR in a
dose-dependent manner (Fig. 10A). Co-transfection of mammalian
cells with negative control (unrelated miRNA) revealed no changes
in luciferase activity (Fig. 10C).
A similar approach was used to assess the putative target of
miR-709 (39UTR of Nab1 gene). Computational analysis of
predicted targets revealed 331 putative miRNA targets, with a
total of 347 conserved sites and 193 poorly conserved, with the
score from 20.81 (most favorable) to 0.00. We examined the first
50 genes that obtained the most favorable score (,20.42).
Among those we chose four targets which were reported of
significant relevance to brain function: Creb5 (20.56), Efnb3
(20.6), Nav1 (20.49), and Nab1 (20.43). We were not able to
clone wild and mutated seed sequences of Efnb3, Nav1 and the
mutated seed sequence of Creb5. Further work continued with
Nab1 only. The 39UTR of Nab1 gene (NM_022856) contains one
binding site with a poorly conserved sequence for rno-miR-709.
The binding site is located 84–91 bp downstream of stop codon
of Nab1 CDS. Analysis of the Luciferase Assay data revealed a
tendency to decrease in expression of luciferase in the case of
normal or mutated binding site, however, it was not significant
(Fig. 10B, D).
Discussion
The present study revealed that expression of 39 genes and nine
miRNAs was changed after two weeks of restraint treatment.
Furthermore, we verified one putative target for one of the
changed miRNAs and expression of two selected genes. These
data suggest that even a very mild stressor can cause molecular
changes in the brain, which might play an important role in the
onset and progression of neurological diseases.
Physiological and behavioural changesChronic restraint stress in the present study caused elevated
plasma corticosterone (CORT) levels on the first day of stress,
which is in line with previously reported data [14,15,16].
Furthermore, we observed that animals show habituation to stress
by 14 day of daily restraint treatment. The lack of chronic
elevation is in accordance with the notion that rats may habituate
to stress across subsequent exposures. For example, Magarinos
and colleagues reported that daily chronic restraint stress causes a
significant habituation by day 21 in the corticosterone response
[17].
The present experiments also revealed no differences in body
weight gain after two weeks of stress in the experimental group.
There also were no differences between stress and control animals
after two weeks of recovery from stress. These results are consistent
with previous results showing an absence of body weight gain after
two weeks of restraint [11]. Moreover, Jadavji and Metz (2008)
showed corresponding behavioural changes in motor perfor-
mance, which were confirmed by the present study. Interestingly,
while females readily recovered from stress-induced impairment
during a post-stress recovery period of two weeks, males did not
recover [11]. We hypothesized that the long-lasting disturbances
in motor performance in male rats might be caused by
epigenetically regulated changes in gene expression in the
cerebellum. Indeed the present results revealed that chronic stress
causes changes in the gene and miRNA expression patterns in the
brain.
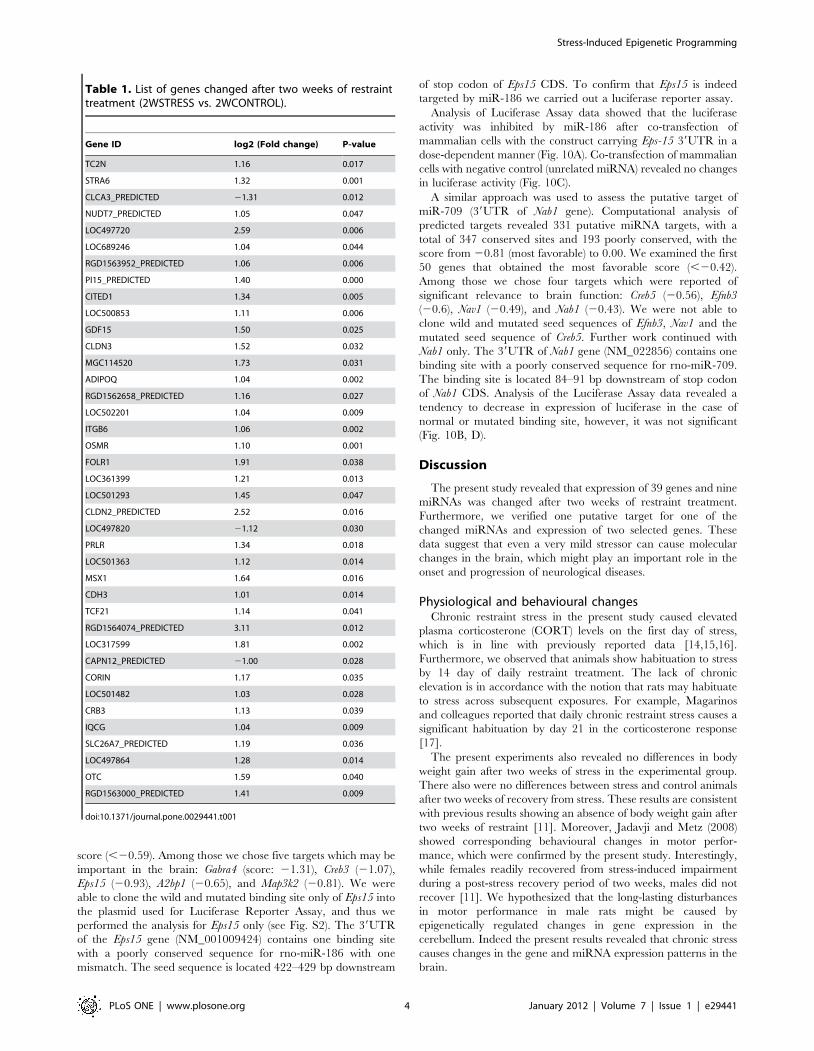
Table 1. List of genes changed after two weeks of restrainttreatment (2WSTRESS vs. 2WCONTROL).
Gene ID log2 (Fold change) P-value
TC2N 1.16 0.017
STRA6 1.32 0.001
CLCA3_PREDICTED 21.31 0.012
NUDT7_PREDICTED 1.05 0.047
LOC497720 2.59 0.006
LOC689246 1.04 0.044
RGD1563952_PREDICTED 1.06 0.006
PI15_PREDICTED 1.40 0.000
CITED1 1.34 0.005
LOC500853 1.11 0.006
GDF15 1.50 0.025
CLDN3 1.52 0.032
MGC114520 1.73 0.031
ADIPOQ 1.04 0.002
RGD1562658_PREDICTED 1.16 0.027
LOC502201 1.04 0.009
ITGB6 1.06 0.002
OSMR 1.10 0.001
FOLR1 1.91 0.038
LOC361399 1.21 0.013
LOC501293 1.45 0.047
CLDN2_PREDICTED 2.52 0.016
LOC497820 21.12 0.030
PRLR 1.34 0.018
LOC501363 1.12 0.014
MSX1 1.64 0.016
CDH3 1.01 0.014
TCF21 1.14 0.041
RGD1564074_PREDICTED 3.11 0.012
LOC317599 1.81 0.002
CAPN12_PREDICTED 21.00 0.028
CORIN 1.17 0.035
LOC501482 1.03 0.028
CRB3 1.13 0.039
IQCG 1.04 0.009
SLC26A7_PREDICTED 1.19 0.036
LOC497864 1.28 0.014
OTC 1.59 0.040
RGD1563000_PREDICTED 1.41 0.009
doi:10.1371/journal.pone.0029441.t001
Stress-Induced Epigenetic Programming
PLoS ONE | www.plosone.org 4 January 2012 | Volume 7 | Issue 1 | e29441

Chronic restraint stress causes changes in mRNAexpression in cerebellum
Our results revealed that chronic restraint stress causes changes
in gene expression in the cerebellum. After two weeks of stress we
observed up-regulation in 36 genes, while three genes were down-
regulated: Clca3 predicted, LOC497820, Capn12 predicted.
Among the total number of changed genes 19 belong to the
category of predicted genes. For further analysis using the
Database for Annotation, Visualization and Integrated Discovery
(DAVID) we considered only the remaining 20 genes with known
function. The following will discuss some of the most prominent
mRNA changes in detail.
Functional annotation clustering by DAVID revealed that
changed genes can be grouped into four clusters: regulation of
metabolic process, cell adhesion, protein complex assembly, and
receptors. Surprisingly, all of them directly or indirectly relate to
metabolism and signal transduction. Also some of these genes,
such as Tcf21 and Osmr were shown to be regulated by methylation
and involved in carcinogenesis [18,19]. One could speculate that
the set of these four clusters could indicate a link between mild
Figure 4. mRNA microarray expression analysis in animals after two weeks of stress (2WSTRESS), recovery from stress (4WSTRESS)and appropriate controls for each time point (2WCONTROL, 4WCONTROL). Genes with a 2-fold difference and a p-value of p,0.05 areshown in logarithmic scale (log2). Genes that were changed are represented as dark-red diamonds, in top-left (down-regulated) and top-right (up-regulated) parts of each figure. 2S_2C – groups of 2WSTRESS vs. 2WCONTROL, 4C_2C – 4WCONTROL vs. 2WCONROL, 4S_2S – 4WSTRESS vs.2WSTRESS, 4S_2C – 4WSTRESS vs. 2WCONTROL.doi:10.1371/journal.pone.0029441.g004
Table 2. Comparison of gene expression levels betweengroups undergoing 2 weeks of stress (2WS) and controls(2WC) and recovery from stress (4WS) and controls (4WC).
Target ID 2WS vs. 2WC 4WS vs. 4WC
log2(Foldchange) P-value
log2(Foldchange) P-value
CRB3 1.132 0.039 0.828 0.088
NUDT7_PREDICTED 1.048 0.047 0.872 0.094
ADIPOQ 1.044 0.002 0.579 0.006
CDH3 1.008 0.014 0.682 0.086
OSMR 1.101 0.001 0.883 0.088
CORIN 1.172 0.035 0.746 0.058
LOC501482 1.027 0.028 0.497 0.045
doi:10.1371/journal.pone.0029441.t002
Stress-Induced Epigenetic Programming
PLoS ONE | www.plosone.org 5 January 2012 | Volume 7 | Issue 1 | e29441

stress exposure and its possible outcomes, such as metabolic
diseases (obesity, diabetes), cardiovascular diseases and anxiety.
Anxiety may be an indirect regulator of motor skill performance
[20], while altered signal transduction in the cerebellum might be
directly related to stress-induced motor impairment and compen-
sation of these deficits.
Stress up-regulates the expression of AdipoqOur results showed a two-fold up-regulation in the expression of
Adipoq. Adipoq is a gene that encodes the protein adiponectin,
which circulates in the plasma and is important in glucose and
lipid metabolism [21]. Adipoq is expressed in white adipose tissue
and is abundantly present in human plasma [22]. Low levels of
Figure 5. sq-RT-PCR analysis. A: prolactin receptor (Prlr) gene; B: Adipoq gene. C: ephrin B3 receptor (Efnb3) gene; D: GABA (A) receptor 4 (Gabra4)gene. E: GAPDH. Data are represented as an average of three animals per group. Asterisks represent statistical significance (* p,0.05; ** p,0.01;*** p,0.001). Error bars represent standard deviation of the mean. Photographs below bars represent corresponding PCR fragments in duplicates foreach animal for three animals per group.doi:10.1371/journal.pone.0029441.g005
Stress-Induced Epigenetic Programming
PLoS ONE | www.plosone.org 6 January 2012 | Volume 7 | Issue 1 | e29441

adiponectin are associated with diabetes and there is a negative
correlation between adiponectin and glucose levels in plasma
[21,23,24]. It was reported that adiponectin activates three
downstream pathways: AMPK phosphorylation, PPAR-a and
p38-Mitogen-Activated Protein Kinase (MAPK) in liver and
skeletal muscle, where it has the highest expression [25,26].
The function of adiponectin in the brain is poorly understood,
however, adiponectin receptors have been detected in the brain
[27]. In particular, Yamauchi et al. (2003) demonstrated that the
adiponectin receptors AdipoR1 and AdipoR2 are expressed in the
hypothalamus to mediate glucose uptake by adiponectin [27].
Adiponectin receptors are expressed ubiquitously throughout the
body [28]. Adiponectin was reported to mediate increased AMP
kinase activity in the hypothalamus and stimulate food consump-
tion [27,28]. It has been shown that in leptin-deficient obese mice,
adiponectin acts in the brain to reduce plasma glucose by 71%,
insulin by 52%, triglycerides by 17% and total cholesterol by 29%
[21,29].
Currently, controversies concern adiponectin expression in the
brain. In rats, the level of adiponectin was increased in the
cerebrospinal fluid (CSF), but not in the plasma after intravenous
injection [21], suggesting that the brain might be an important
target for this hormone. According to Spranger et al. (2006),
adiponectin is not expressed in the CNS [30]. The authors failed
to detect adiponectin in human CSF samples and also did not find
evidence of adiponectin crossing the blood brain barrier (BBB)
[30]. However, brain endothelial cells express adiponectin
receptors [30]. Nevertheless, several studies reported that
adiponectin exists in human CSF at a 0.1% of serum
concentration [31,32].
Aside from direct effects via central receptors, adiponectin may
also act through cell adhesion molecules. Interestingly, it has been
proposed that adiponectin binds to the T-cadherin molecule [33].
T-cadherin can actively bind to some forms of adiponectin,
suggesting its role as a possible part of a more complex signaling
structure [29,33]. T-cadherin belongs to a large family of proteins
involved in calcium mediated cell–to-cell interactions and
extracellular signaling [33]. The function of T-cadherin in the
adiponectin system remains to be elucidated [29]. Intriguingly,
here we observed that increased expression of the Adipoq gene
occurred simultaneously with the up-regulation of the predicted
Cdh3 gene in the cerebellum. Cdh3 is a P-cadherin gene which is
overexpressed in the majority of pancreatic cancer, but not in
healthy cells [34]. Cdh3 is a novel tumor-associated antigen, which
Figure 6. qRT-PCR analysis of Prlr (A, B) and Adipoq (C, D) expression level. Data are represented as a normalized relative fold change tocontrol. Asterisks represent statistical significance (* p,0.01; *** p,0.001). Control animals are represented in black, stressed animals in grey. Formore details see (Tables S3, S4, S5, S6). It should be noted that the level of Adipoq expression in hippocampus is very low (C(t) values .40 andbeyond detection), which results in a high fold change that is not significant.doi:10.1371/journal.pone.0029441.g006
Stress-Induced Epigenetic Programming
PLoS ONE | www.plosone.org 7 January 2012 | Volume 7 | Issue 1 | e29441

can be used in cancer immunotherapy [34]. Taking into
consideration that experiments in mice suggest a role of AdipoR2
in pancreatic islet cell maintenance [22,29], there might be some
connection between Cdh3 and Adipoq functions in the process of
developing pancreatic cancer.
Among other functions adiponectin is also implicated in
regulation of blood pressure. Tanida et al. (2007) reported that
adiponectin decreases blood pressure and sympathetic nerve
activity in rats in a dose-dependent manner [35].
Interestingly, it was recently shown that adiponectin might be
implicated in the pathophysiology of autism [36]. Mori and
colleagues showed that serum levels of adiponectin in subjects with
autism were significantly lower than those of normal controls [36].
Thus, we can conclude that functions of adiponectin are diverse
and its specific role in the brain remains to be further investigated.
Stress up-regulates the expression of prolactin receptor(PRLR)
The prolactin receptors are abundant in most tissues, with the
highest expression in the liver, mammary glands, adrenal glands
and hypothalamus [37]. Our results demonstrated that chronic
Figure 7. Functional annotation clustering. Green - corresponding gene-term association positively reported; black - corresponding gene-termassociation not reported yet. A: cluster of four genes: Tcf21, Msx1, Adipoq, Cited, which were grouped based on their involvement in positiveregulation of the macromolecule metabolic process. B: cluster of three genes: Prlr, Otc, Adipoq, which were grouped based on their involvement inprotein complex assembly. C: cluster of four receptors: Prlr, Osmr, Itgb6, Ssta6. D: cluster of three genes: Cldn3, Itgb6, Cdh3, which were grouped basedon their involvement in cell adhesion.doi:10.1371/journal.pone.0029441.g007
Stress-Induced Epigenetic Programming
PLoS ONE | www.plosone.org 8 January 2012 | Volume 7 | Issue 1 | e29441

restraint stress results in a two-fold increase in expression of
prolactin receptor mRNA in the cerebellum. These findings are in
consistency with previous results reporting that restraint stress in
water causes up-regulation of the PRLR in the brain, specifically
in the choroid plexus [38]. There were no significant differences in
expression of PRLR in hippocampus and prefrontal cortex after
two weeks of stress. However, recovery from stress altered the
response in those two regions. The expression of PRLR in the
hippocampus diminished significantly, whereas it was elevated in
the prefrontal cortex. Thus, our results suggest a delayed response
to mild restraint stress in the hippocampus and prefrontal cortex.
Prolactin (PRL) is a hormone produced by the pituitary, which
is closely associated with the stress response [37,39]. This
hormone might play a role in emotional responses and HPA
axis reactivity [40]. Evidence in a rat model suggests that
prolactin is a neuromodulator of behavioural and neuroendocrine
stress-responses, since it has central actions as an endogenous
anxiolytic and anti-stress agent [40]. PRL functions are also
implicated in reproduction, development, metabolic and immune
processes, brain function and behaviour [37]. PRL levels may
also increase in response to restraint stress and move from the
blood circulation to the CSF, where it acts on the central nervous
system [38]. These authors also demonstrated that circulating
PRL causes prolactin receptor expression in the hypothalamus,
suggesting a preventive role against stress-induced hypocalcemia
and ulcerogenesis [38]. To regulate metabolic processes, PRL
and PRLR are produced in human adipose tissue [41]. Since
examination of adipose tissue from rodents and murine pre-
adipocyte cell lines failed to detect PRL expression and release,
expression of PRL in tissues other than the pituitary may be
unique to humans and primates [37].
There is a negative correlation between prolactin and its
receptors [42], suggesting that levels of prolactin in the
cerebellum may increase after stress. Alternatively, changes in
expression levels of PRLR may occur in response to changes of
other hormones or cytokines that bind to PRLR. One could
argue that on the first day of stress expression level of PRLR is
elevated along with enhanced levels of anxiety. As illustrated in
Figure 11, we propose that animals habituate to stress over time
along with overexpression of PRLR that occurs as a result of the
organism’s stress response. Also, there might be an anatropic
relation between PRLR levels in hippocampus and prefrontal
cortex. It would be interesting to investigate connection between
different brain regions in this regard, and find pathways that are
involved in the regulation of stress response and role of PRLR in
this process.
Age up-regulates ephrin B3 and GABA A4 receptorsEphrin B3 receptors. Interestingly, the present results show
up-regulation of Efnb3 expression in both stress and control
animals after two weeks in comparison to stress and controls after
four weeks. These observations suggest an age-dependent increase
in Efnb3 expression.
Ephrin receptors represent a large family of receptor protein
tyrosine kinases, which play a crucial role in neuronal survival,
axonal pathfinding and establishing neuron-target connections
during embryonic development [43]. The expression of ephrin
receptors in the CNS is higher in embryos than in adults and
differs depending on the type of receptors [44,45]. For instance,
an abundance of ephrin A receptors was shown to be expressed
in the adult CNS, while expression of only a few ephrin B
receptors was found in the adult brain [43]. There is a
controversy about the expression of the Efnb3 receptor in the
adult brain, although Efnb3 expression was reported in several
adult mouse tissues, including whole brain and adult rat spinal
cord [43,46,47]. The results of Willson et al. (2006) demonstrat-
ed that Efnb3 is abundantly expressed throughout the adult rat
brain, with the most prominent expression in the cerebellum,
suggesting that its functional role expands beyond embryonic
development [43]. Thus, ephrin B3 receptors and their ligands
might play a role in maintaining formed axonal connections and
synapses, as well as regulate synaptic plasticity in the mature
nervous system [43].
Gabra4 receptors. Similarly to ephrin B3, the expression of
GABA (A) receptor 4 was also up-regulated in two and four week
groups of control animals. c-Aminobutyric acid (GABA) receptors
are signaling proteins that represent the major inhibitory
neurotransmitter receptors in the central nervous system [48]. It
was reported that the GABA (A) receptor 4 gene (Gabra4) could
contribute to autism susceptibility in humans [49,50]. Chugani et
al. (2001) have observed age-related changes in the distribution of
the GABA (A) receptors in the brain of epileptic children [51].
Their results demonstrated the highest expression of GABA
receptors in the brain at the youngest age measured (2 years),
which decreased exponentially with age [51].
Age-dependent differences were also reported for the distribu-
tion across the brain of various GABA (A) receptor subunits in rats
[52,53,54]. Studies by Laurie et al. (1992) examined the
embryonic and postnatal expression of 13 GABA (A) receptor
subunit genes in the rat CNS, showing that each subunit exhibits a
unique regional and temporal developmental expression profile
[52]. All of these data suggest the importance of GABA receptors
during development and aging.
Figure 8. Analysis of miRNA expression in the rat cerebellum after two weeks of stress compared to controls. The microarray heatmapdemonstrates the log2 ratio of miRNA signal difference between control and stress samples. Up-regulated miRNAs are shown in red, while down-regulated miRNAs are shown in green. The first three columns on each figure represent the level of expression in control animals, while the three lastcolumns represent the level of corresponding miRNA expression in stress animals.doi:10.1371/journal.pone.0029441.g008
Stress-Induced Epigenetic Programming
PLoS ONE | www.plosone.org 9 January 2012 | Volume 7 | Issue 1 | e29441

Chronic restraint stress changes miRNA expression in thecerebellum
There were also changes in miRNA molecules whose functions
are not well known yet. In particular, miR-186 and miR-709,
which changed significantly in response to stress, do not belong to
those which are abundantly expressed in the brain, and
particularly in the cerebellum. There is a lack of data on the
expression of these miRNAs. Also, their functions and verified
targets are still unknown.
Changes in miR-186 expression. Our study revealed that
miR-186 can target Eps15 in mammalian cells. miR-186 was
reported to be expressed by postnatal oligodendrocyte lineage cells
[55]. Nowadays there is no agreement on the specific rules of
target recognition by miRNA. Some authors suggest that it
requires a perfect match between the seed sequence and the
miRNA binding site [56], while others speculate that a nearly
perfect match in the seed sequence is enough for target recognition
[57]. We have found that for the efficient regulation of a target
gene (Eps15) the seed sequence miR-186 can have one mismatch.
Epidermal growth factor (EGF) receptor pathway substrate 15
gene (Eps15) was first identified as an endogenous substrate for the
EGF1 receptor kinase [58]. Eps15 is believed to have an important
role in vesicular traffic, but its exact function is still unknown [59].
There is some evidence that Eps15 may play a role in the clathrin-
mediated endocytosis of synaptic vesicle membranes [60]. It was
shown that Eps15 is concentrated in the presynaptic nerve
Figure 9. qRT-PCR analysis of miR-186 (A,C,E) and miR-709 (B,D,F) expression level in cerebellum (A,B), hippocampus (C,D), andprefrontal cortex (E,F). Data are represented as a normalized relative fold change to control. Asterisks represent statistical significance (*p,0.1;**p,0.05; ***p,0.001). Control animals are represented in black, stressed animals in grey. For more details see (Tables S7, S8, S9, S10, S11, S12).doi:10.1371/journal.pone.0029441.g009
Stress-Induced Epigenetic Programming
PLoS ONE | www.plosone.org 10 January 2012 | Volume 7 | Issue 1 | e29441

terminals in rat brain, suggesting a role in the molecular
rearrangement of the clathrin coats [60].
Changes in miR-709 expression. Nab1 is a theoretically
predicted target for miR-709. Although there was a trend for the
decrease of Nab1 expression upon transfection of miR-709, the
difference was not significant. Thus, we cannot unambiguously
confirm that Nab1 is a target of miR-709.
miR-709 was reported to be upregulated in response to X-ray-
DNA damage in the germline in mouse testes, and in turn,
downregulates BORIS (Brother of the Regulator of Imprinted Sites)
to counteract aberrant DNA hypomethylation [61]. It was shown
that miR-709 may impact the genes involved in cytoskeletal
functions [62]. Zhang et al. (2009) reported that methyl-CpG
binding protein 2 was the common predicted target for miR-709.
Thus, miR-186 and miR-709 may trigger a cascade of molecular
reactions which are important in the regulation of the stress response.
ConclusionThe present study showed that mild chronic stress results in
molecular changes in the brain on the genetic and epigenetic levels.
The results suggests that even mild chronic stress can cause long-
lasting changes in motor function in the intact brain and recovery
from brain injury through genomic and epigenomic pathways.
Materials and Methods
Ethics statementAll procedures were performed in accordance with the
Canadian Council for Animal Care guidelines and approved by
the local animal welfare committee (protocol #1007). All data are
MIAME compliant.
AnimalsThirty-five male adult Long-Evans hooded rats, approximately four
months old (weighing approximately 460 g at the beginning of the
study), from Charles River Laboratories International Inc. (Wilming-
ton, MA, US) were used. Animals were habituated to the local
environment for a period of three weeks prior to the start of the
experiment. The rats were housed in pairs in standard polycarbonate
shoebox cages under a 12 h light/day cycle with lights on at 7:30 AM.
Experimental groupsAnimals were randomly assigned to one of the following
experimental groups: Two weeks of daily restraint stress
(2WSTRESS, n = 6), two weeks naive controls (2WCONTROL,
n = 6), two weeks of daily restraint stress + two weeks of recovery
from stress (4WSTRESS, n = 6), four weeks naive controls
Figure 10. A: Dose-dependent inhibition of Eps15 expression in the Luciferase Assay after transfection of HEK-293 cells with miR-186. B: Dose-dependent inhibition of the Nab1 gene in the Luciferase Assay after transfection of MCF7 cells with miR-709. C: Luciferase Assay withpFN4 (39UTR Eps15) and miR-186. The first bar demonstrates relative level of luciferase activity after transfection of MCF-7 cells with pFN4 only.Second bar: pFN4 + miR-186. Third bar: pFN4 mut + miR-186. Asterisks represent statistical significance (p,0.001). D: Luciferase Assay with pFN7(39UTR Nab1) and miR-709. The first bar demonstrates relative level of luciferase activity after transfection of MCF-7 cells with pFN7 only. Second bar:pFN7 + miR-709. Third bar: pFN7 mut + miR-709. Bars represent the normalized average of relative luciferase units.doi:10.1371/journal.pone.0029441.g010
Stress-Induced Epigenetic Programming
PLoS ONE | www.plosone.org 11 January 2012 | Volume 7 | Issue 1 | e29441

Figure 11. Hypothetical scheme of the stress response in the brain. A: Changes in PRLR expression. B: Changes in miRNA expression. Wehypothesize that restraint stress causes a different response in cerebellum and other brain regions, such as hippocampus and prefrontal cortex. Theremight be an immediate response in the cerebellum reflected by an increase in the level of prolactin receptors after two weeks of stress. After therecovery from stress the expression of PRLR returns to normal in cerebellum, but is down-regulated in hippocampus and up-regulated in prefrontalcortex. Negative correlation between prolactin and its receptors [42] suggests that levels of prolactin in the cerebellum may decrease after stress.Alternatively, changes in expression levels of PRLR may occur in response to changes of other hormones or cytokines that bind to PRLR. Similarily,immediate responses in the cerebellum could be reflected in a decrease of miR-709 levels after two weeks of stress. After recovery from stress theexpression of miR-709 is up-regulated in hippocampus and prefrontal cortex.doi:10.1371/journal.pone.0029441.g011
Stress-Induced Epigenetic Programming
PLoS ONE | www.plosone.org 12 January 2012 | Volume 7 | Issue 1 | e29441

(4WCONTROL, n = 6). A separate group of rats was trained and
tested in the skilled reaching task to confirm restraint stress-
induced motor impairments (n = 11).
Time courseThe 2WSTRESS group was subjected to 14 days of restraint
stress, while the 4WSTRESS group received two weeks of
recovery after two weeks of restraint treatment. Stressed and
respective control animals were sacrificed immediately after the
last day of stress and after 14 days of recovery from stress (Fig. 12).
Blood samples were collected at baseline, on the first and last day
of stress treatment, and on the last day of recovery after stress.
Physiological manipulations and testingRestraint stress. Animals were placed individually into
transparent Plexiglas tubes (diameter 8 cm, length 20 cm) for
20 minutes daily in the morning hours. The tube maintained the
animal in a standing position. Small holes in the front of the tube
allowed for ventilation. Restraint took place each day at the same
time in the morning hours and in a room different from the colony
room.
Blood sampling. Blood samples were collected between
08:30AM and 11:00AM in order to minimize effects of plasma
corticosterone circadian variations [63]. Samples were collected
approximately 30 minutes after initiation of restraint stress [64].
Rats were anesthetized with 4% isoflurane in 30% oxygen.
Syringes and butterfly catheters were rinsed with heparin prior to
use for blood sampling. An average of 0.6 ml of blood was
collected from the tail vein using a butterfly catheter. The sample
was centrifuged at 4000 rpm for 10 minutes. After centrifugation
plasma was collected and stored at 220uC.
Corticosterone enzyme immunoassay (EIA). Quantifi-
cation of corticosterone in plasma samples was performed with a
Corticosterone EIA Kit according to the manufacturer’s
instructions (Cayman Chemical Company, Ann Arbor, MI,
USA). Calculations and data analysis were performed using the
original spreadsheet supplied by Cayman.
Behavioural testing. Skilled movement performance in rats
was assessed using a pellet reaching task according to earlier
descriptions [65]. Briefly, animals were trained to extend their
forelimbs to reach for 45 mg food pellets through a vertical
opening in the middle of the front wall of a clear Plexiglas box.
Rats were trained for three weeks daily to achieve asymptotic
levels of baseline success rates. Daily tests in skilled reaching
continued while animals were exposed to 14 days of restraint.
Each training and test session required the rats to reach for 20
food pellets. A successful reach was recorded if an animal grasped
a food pellet on the first attempt and withdrew the paw with the
pellet through the slit to consume the food (Metz & Whishaw,
2000). Percent reaching success was calculated by counting the
number of successful reaches divided by the number of pellets
given in each session (20) multiplied by 100.
Brain tissue dissection and RNA extractionThe rats were deeply anaesthetized with pentobarbital (WDDC,
Edmonton, AB, Canada). After vital signs discontinued animals
were rapidly decapitated. Brains were rapidly removed. The
brains of four animals from each group were used for dissection of
cerebellum, prefrontal cortex and hippocampus. The brains of two
animals from each group were flash-frozen. Dissected cerebellum
was used for DNA/RNA extractions.
RNA extractionsThe RNA isolation was performed using TRIzol reagent
(Invitrogen, Carlsbad, CA, USA) according to manufacturer’s
instructions. The samples were treated with DNase I (Invitrogen,
Carlsbad, CA, USA) according to manufacturer’s instructions and
stored at -80uC. DNA and RNA were dissolved in RNase-free
water (NEB, Ipswich, MA, USA).
Plasmid DNA purificationPlasmid DNA was purified from overnight culture (20 ml LB
medium supplemented with corresponding antibiotics) using the
QIAprep Spin Miniprep Kit (Qiagen, Valencia, CA, USA).
cDNA synthesiscDNA synthesis was performed using the RevertAidTM H
Minus First Strand cDNA Synthesis Kit (Fermentas, Barlington,
ON, Canada). For the reaction 4.6 mg of total RNA, 1 unit of
Ribolock RNase inhibitor, 10 mM dNTPs, oligo(dT18) primers,
and 56 reaction buffer were used. The mix was incubated for 1 h
at 42uC and heat inactivated for 5 min at 70uC.
miRNA microarray expression analysisTissue from three animals per group was used for miRNA
expression analysis. Total RNA was extracted from the cerebel-
lum. The miRNA microarray analysis was performed by LC
Sciences (Houston, TX, USA; www.lcsciences.com). The assay
used from 2 to 5 mg of the total RNA sample, which was
fractionated by size using a YM-100 Microcon centrifugal filter
(Millipore, Billerica, MA, USA) and the small RNAs (,300 nt)
isolated were 39-extended with a poly(A) tail using poly(A)
polymerase. An oligonucleotide tag was then ligated to the poly(A)
Figure 12. Time course of the experimental manipulations. 24 animals were randomly assigned to one of the following experimental groups:two weeks of daily restraint stress (2WSTRESS, n = 6), two weeks naive controls (2WCONTROL, n = 6), two weeks of daily restraint stress + two weeks ofrecovery from stress (4WSTRESS, n = 6), four weeks naive controls (4WCONTROL, n = 6). Animals were sacrificed immediately after stress (2 weeks), orafter two weeks of recovery from stress (4 weeks).doi:10.1371/journal.pone.0029441.g012
Stress-Induced Epigenetic Programming
PLoS ONE | www.plosone.org 13 January 2012 | Volume 7 | Issue 1 | e29441

tail for later fluorescent dye staining. Two different tags were used
for the two RNA samples in dual-sample experiments.
Hybridization was performed overnight on a mParaflo micro-
fluidic chip (LC Sciences, Houston, TX, USA) using a micro-
circulation pump. On the microfluidic chip, each detection probe
consisted of a chemically modified nucleotide coding segment
complementary to the target miRNA (from miRBase, Welcome
Trust Sanger Institute, Cambridge, UK; http://microrna.sanger.
ac.uk/sequences/) or control RNA and a spacer segment of
polyethylene glycol to extend the coding segment away from the
substrate. The detection probes were made by in situ synthesis
using PGR (photogenerated reagent) chemistry. The hybridization
melting temperatures were balanced by chemical modifications of
the detection probes. Hybridization used 100 mL 66SSPE buffer
(0.9 M NaCl, 60 mM Na2HPO4, 6 mM EDTA, pH 6.8)
containing 25% formamide at 34uC. After hybridization detection
fluorescence labeling using tag-specific Cy3 and Cy5 dyes was
performed. Hybridization images were collected using a laser
scanner (GenePix 4000B, Molecular Devices, Sunnyvale, CA,
USA) and digitized using Array-Pro image analysis software
(Media Cybernetics, Bethesda, MD, USA). Data were analyzed by
first subtracting the background and then normalizing the signals
using a LOWESS filter10 (Locally-weighted Regression). For two-
color experiments, the ratio of the two sets of detected signals (log2
transformed, balanced) and p-values of the t-test were calculated;
differentially detected signals were those with less than 0.01 p-
values (information provided by Jason Mulcahey, LC Sciences).
mRNA microarraysThree RNA samples out of four per group were chosen for
microarray analysis based on RNA quality and concentration. The
mRNA microarray analysis was performed by Genome Quebec
(Montreal, Quebec, Canada; www. genomequebecplatforms.com).
The sample used 250 ng of starting total RNA to hybridize 750 ng
of biotin labeled cRNA on the RatRef-12 array. Amplification was
performed using the Illumina TotalPrep RNA Amplification kit
(Ambion, Austin, TX, USA). Illumina’s Gene Expression system
uses a ‘‘direct hybridization’’ assay whereby biotin-labeled samples
are hybridized individually to an array. Following hybridization
the transcripts were detected using Cy3 conjugated streptavidin
and scanned. The signal intensities generated provide an
indication of the absolute abundance of transcripts within that
population. The signal intensities generated from separate arrays
can be compared as an indication of the differences between the
two sample populations (Illumina, San Diego, CA, USA; www.
illumina.com).
Semi-quantitative reverse transcription PCR (sqRT-PCR)The sqRT-PCR was performed by using Taq DNA Polymerase
(Fermentas, Burlington, ON, Canada), specific primers and
carried out on an Eppendorf Mastercycler PCR machine
(Eppendorf, Hamburg, Germany). Primers were designed using
Primer3 v. 0.4.0 software [66] and synthesized by Integrated DNA
Technologies (San Diego, CA, USA). Each reaction contained
1 ml of cDNA, 0.5 ml of 10 mM forward and reverse primers,
2.5 ml of 106Taq Buffer, 2.5 ml of 2 mM dNTPs, and 0.25 ml of
Taq DNA polymerase (5 U/ml) in a total volume of 25 ml. For
PCR conditions and primer sets see (Table S1). PCR conditions
where empirically determined for each set of primers so that the
concentration of PCR product was below saturation point.
Agarose gel electrophoresis was carried out in 16 TAE buffer
using a 1% agarose gel with ethidium bromide. The amplified
product was visualized under UV light and quantified using
ImageQuant 5.2 software (GE Healthcare, Piscataway, NJ, USA)
and normalized to Gapdh gene expression.
Quantitative real time PCR (qRT-PCR) with miRNAsRNA purification. Total RNA was purified from 100–
150 mg of flash-frozen brain tissues using TRIzol reagent
(Invitrogen, Carlsbad, CA, USA) according to manufacturer’s
instructions. Following purification, 5 mg of each RNA sample
were treated with 2 U of DNase I (Fermentas, Burlington, ON,
Canada) at 37uC for 30 min. After treatment DNase I was heat-
inactivated (65uC for 10 min) in the presence of 5 mM EDTA,
pH 8.0.
cDNA synthesis. cDNA for qRT-PCR was synthesized as
previously described [67] using iScript Select cDNA Synthesis Kit
(Bio-Rad Laboratories Ltd., Mississauga, Ontario, Canada)
according to manufacturer’s instructions. Briefly, 100 ng of
DNase I treated RNA were reverse-transcribed with 2 ml of
iScript reverse transcriptase and RNase inhibitor protein, and
100 nM of each RT primer (Table 1), in the total volume of 40 ml.
Reaction was carried out at 42uC for 30 min. Reverse
transcriptase was heat-inactivated at 85uC for 5 min.
qRT-PCR. qPCR was done as previously described [67]
using SsoFast EvaGreen Supermix (Bio-Rad Laboratories Ltd.,
Mississauga, Ontario, Canada) and CFX96 system (Bio-Rad
Laboratories Ltd., Mississauga, Ontario, Canada). Briefly, qRT-
PCR was carried out in a total volume of 20 ml, in the presence of
10 ml of 26 SsoFast EvaGreen Supermix, 0.5 ml of 10 mM
corresponding forward and reverse primer (Table 1), and 1 ml of
each cDNA sample. Cycling conditions for qPCR: enzyme
activation 295uC for 30 sec, denaturation 295uC for 5 sec,
annealing/extension 260uC for 5 sec (45 cycles), melting curve –
65–95uC (5 sec/step). The Ct values (the threshold cycles) were
calculated with the CFX Manager 2.0 software. All miRNA
expression levels were normalized to the RNU-6 snRNA
expression.
qRT-PCR with mRNARNA purification. After purification with TRIzol reagent
(Invitrogen, Carlsbad, CA, USA) and DNase I treatment, total
RNA was additionally cleaned up with RNAeasy RNA
purification kit (QIAGEN) according to manufacturer’s
instructions.
cDNA synthesis. cDNA was synthesized using iScript Select
cDNA Synthesis Kit (Bio-Rad Laboratories Ltd., Mississauga,
Ontario, Canada) according to manufacturer’s instructions.
Briefly, 500 ng of DNase I treated RNA were reverse-
transcribed with 2 ml of iScript reverse transcriptase, RNase
inhibitor protein, and oligo(dT18), in the total volume of 40 ml.
Reaction was carried out at 42uC for 90 min. Reverse
transcriptase was heat-inactivated at 85uC for 5 min.
qRT-PCR. qRT-PCR was done using SsoFast EvaGreen
Supermix (Bio-Rad Laboratories Ltd., Mississauga, Ontario,
Canada) and CFX96 system (Bio-Rad Laboratories Ltd.,
Mississauga, Ontario, Canada) according to manufacturer’s
instructions. Briefly, qRT-PCR was carried out in a total volume
of 20 ml, in the presence of 10 ml of 26 SsoFast EvaGreen
Supermix, 0.5 ml of 10 mM corresponding forward and reverse
primer (Table 1), and 1 ml of each cDNA sample. Cycling
conditions for qPCR: enzyme activation 295uC for 30 sec,
denaturation 295uC for 5 sec, annealing/extension 251uC for
5 sec (45 cycles), melting curve – 65–95uC (5 sec/step). The Ct
values were calculated with the CFX Manager 2.0 software. All
mRNA expression levels were normalized to the b-Actin mRNA
expression.
Stress-Induced Epigenetic Programming
PLoS ONE | www.plosone.org 14 January 2012 | Volume 7 | Issue 1 | e29441
miRNA target predictionmiRNA targets for further analysis were predicted using basic
seed-based algorithms [68] from the Targetscan database
(Whitehead Institute for Biomedical Research, Cambridge, MA,
USA; www.targetscan.org). Predicted targets of a miRNA family
were calculated as published earlier [69] and sorted by total
context score. The total context score was based on the following
features: site-type contribution, 39 pairing contribution, local AU
contribution, and position contribution [69].
CloningThe 39- untranslated regions (UTR) of the Eps15 gene
(NM_001009424) with a seed sequence for the miR-186 and
Nab1 (NM_022856) genes with a binding site for miR-709 (see Fig.
S5) were amplified by PCR. They were then cloned into pGL3-
Promoter vectors downstream of the Luciferase coding sequence,
resulted in pFN4 (Eps-15 39 UTR) and pFN7 (Nab1 39 UTR)
plasmids. The PCR mix contained 10 ml of 56GC buffer, 5 ml of
2 mM dNTPs, 1 ml of 10 mM forward and reverse primers
(see,Table S12), 1 ml of cDNA, and 0.5 ml of PhusionH High-
Fidelity DNA Polymerase (NEB, Ipswich, MA, USA) in a total
volume of 50 ml. The PCR conditions were: initial denaturation
230 sec at 98uC, 25 cycles with denaturation 210 sec at 98uC,
annealing 230 sec at 63uC, polymerization 230 sec at 72uC, and
final extension 10 min at 72uC.
Binding site mutagenesisTo create mismatch controls the pFN4 plasmid was mutated
with primers MS026 and MS027, and pFN7 with primers MS044
and MS055 that carry mutated seed sequences. PCR fragments
were generated with PhusionH High-Fidelity DNA Polymerase (see
section Cloning), extracted from the 1% agarose gel with
QIAquick Gel Extraction Kit (Qiagen, Valencia, CA, USA) and
self-ligated using T4 DNA ligase (Fermentas, Burlington, ON,
Canada). Mutated plasmids (pFN4mut and pFN7mut) were
screened by colony PCR with corresponding primers: pFN4mut
– MS028 and AG264 (see Fig. S6), pFN7mut – MS046 and
AG264. Original and mutated plasmids were confirmed by DNA
sequencing.
Cell culture and Luciferase Reporter AssayHuman embryonic kidney HEK-293 cells were maintained in
DMEM (Invitrogen, Carlsbad, CA, USA), supplemented with
10% fetal bovine serum, penicillin (100 U/ml) at 37uC in a 5%
CO2 atmosphere. HEK293 cells were co-transfected in 24-well
plates with the pGL3 vector (with Firefly luciferase) or tested
construct, precursor miRNA, and control Renilla luciferase
pRL-TK vector (Promega, Madison, WI, USA), using the
Lipofectamine 2000 reagent according to the manufacturer’s
protocol (Invitrogen, Carlsbad, CA, USA). Twenty-four hours
after transfection, 16 Passive Lysis Buffer (Promega, Madison,
WI, USA) was added to the transfected cells. Renilla and Firefly
luciferase activities were measured using the dual-luciferase
reporter assay system with Stop & Glow Reagent (Promega,
Madison, WI, USA) according to the manufacturer’s instruc-
tions. A similar culture experiment was performed using another
cell line, human breast cancer MCF-7 cells. Each cell line was
tested in triplicate and reproduced twice in independent
experiments.
Data analysis and statisticsStatistical analysis was performed using Microsoft Excel
Analysis ToolPak (Microsoft Corp., Redmond, WA, USA). All
data are presented as the mean +/2 standard deviation. Details of
each type of analysis are provided in the following.
Behavioural tests. Data were analyzed using repeated
measures analyses of variance (ANOVA) using Time as a
variable. Differences between baseline and stress periods were
determined post-hoc using paired Student’s t-tests.
mRNA and miRNA microarray analysis. mRNA
microarray analysis was performed using FlexArray 1.4.1
software [70]. The data analysis was performed using the lumi
Bioconductor package [71], which was used for the pre-processing
and normalizing of Illumina microarray data. Background
correction was performed using Robust Multichip Average
(RMA) background adjustment [72,73,74]. Log2 data were
normalized using Quantile normalization. A two-sample
student’s t-test was run to compare gene expression in different
groups. Data were plotted using volcano plots of p-values. The list
of genes 2-fold up- or down-regulated with a p-value of #0.05 was
generated.
The miRNA microarray data analysis was performed by LC
Sciences (Houston, TX, USA). Data analysis included the
determination of detectable signals, calculation of signal intensities,
and calculation of differential ratios. The data analysis process
began with background subtraction, Cy3/Cy5 channel normali-
zation, detectivity determination, and then p-value calculation for
the determination of differential significance. Multiple sample
analysis involved normalization, data adjustment, t-test/ANOVA
analysis, and clustering.
qRT-PCR data analysis was done using Pfaffl method [75].
Data are presented as a fold change of each mRNA from the
tissues of stressed animals relative to non-stressed controls
corrected for internal standard.
Supporting Information
Figure S1 qRT-PCR data of Prlr expression.
(TIF)
Figure S2 qRT-PCR data of Adipoq expression.
(TIF)
Figure S3 qRT-PCR data of miR-186 expression.
(TIF)
Figure S4 qRT-PCR data of miR-709 expression.
(TIF)
Figure S5 A: Putative binding site of mir-186 in Eps15 39UTR.
B: Putative binding site of mir-709 in Nab15 39UTR. The seed
sequence is represented in blue, while the mutated seed sequence
is shown in red.
(TIF)
Figure S6 Schematic illustration of binding site muta-genesis. The PCR fragment with a mutated binding sequence
was obtained by inverse PCR with corresponding primers from
the original pFN4 plasmid. The miR-186 binding sequence
(highlighted in red) was substituted with the mutated sequence
(adenine was substituted by guanine, while thymine was
substituted by guanine).
(TIF)
Table S1 qRT-PCR data of Prlr expression in hippo-campus.
(DOC)
Table S2 qRT-PCR data of Prlr expression in prefrontalcortex.
(DOC)
Stress-Induced Epigenetic Programming
PLoS ONE | www.plosone.org 15 January 2012 | Volume 7 | Issue 1 | e29441

Table S3 qRT-PCR data of Adipoq expression inhippocampus.(DOC)
Table S4 qRT-PCR data of Adipoq expression inprefrontal cortex.(DOC)
Table S5 Functional annotation clustering analysis oftarget genes.(DOC)
Table S6 qRT-PCR data of miR-186 expression incerebellum.(DOC)
Table S7 qRT-PCR data of miR-709 expression incerebellum.(DOC)
Table S8 qRT-PCR data of miR-186 expression inhippocampus.(DOC)
Table S9 qRT-PCR data of miR-709 expression inhippocampus.
(DOC)
Table S10 qRT-PCR data of miR-186 expression inprefrontal cortex.
(DOC)
Table S11 qRT-PCR data of miR-709 expression inprefrontal cortex.
(DOC)
Table S12 Primers and PCR conditions for sq-RT-PCR,qRT-PCR, and cloning.
(DOCX)
Author Contributions
Conceived and designed the experiments: IK GM. Performed the
experiments: OB AG YI. Analyzed the data: OB YI. Contributed
reagents/materials/analysis tools: IK GM. Wrote the paper: OB IK GM.
References
1. Kovacs KJ, Miklos IH, Bali B (2005) Psychological and physiological stressors.In: Steckler T, Kalin NH, Reul JMHM, eds. Handbook of stress and the brain.
Amsterdam: ELSEVIER. pp 775–792.
2. Quick JC, Spielberger CD (1994) Walter Bradford Cannon: Pioneer of Stress
Research. International Journal of Stress Management. pp 141–143.
3. McEwen BS (2007) Physiology and neurobiology of stress and adaptation:
central role of the brain. Physiol Rev 87: 873–904.
4. DeRijk RH, Kitraki E, Kloet ERd (2010) Corticosteroid Hormones in Stress and
Anxiety - Role of Receptor Variants and Environmental Inputs. In: Soreq H,Friedman A, Kaufer D, eds. Stress - From Molecules to Behavior. Weinheim:
WILEY-VCH Verlag GmbH & Co. KGaA. pp 119–150.
5. Colvis CM, Pollock JD, Goodman RH, Impey S, Dunn J, et al. (2005)
Epigenetic mechanisms and gene networks in the nervous system. J Neurosci 25:10379–10389.
6. Nelson PT, Keller JN (2007) RNA in brain disease: no longer just ‘‘the
messenger in the middle’’. J Neuropathol Exp Neurol 66: 461–468.
7. Nelson PT, Wang WX, Rajeev BW (2008) MicroRNAs (miRNAs) in
neurodegenerative diseases. Brain Pathol 18: 130–138.
8. Schaefer A, O’Carroll D, Tan CL, Hillman D, Sugimori M, et al. (2007)
Cerebellar neurodegeneration in the absence of microRNAs. J Exp Med 204:1553–1558.
9. Weaver IC, Cervoni N, Champagne FA, D’Alessio AC, Sharma S, et al. (2004)Epigenetic programming by maternal behavior. Nat Neurosci 7: 847–854.
10. Metz GA, Schwab ME, Welzl H (2001) The effects of acute and chronic stress
on motor and sensory performance in male Lewis rats. Physiol Behav 72: 29–35.
11. Jadavji NM, Metz GA (2008) Sex differences in skilled movement in response to
restraint stress and recovery from stress. Behav Brain Res 195: 251–259.
12. Ghez C, Fahn S (1985) Principles of Neural Science. Kandel ER, Schwartz JH,
eds. New York: Elsevier.
13. Huang da W, Sherman BT, Lempicki RA (2009) Systematic and integrative
analysis of large gene lists using DAVID bioinformatics resources. Nat Protoc 4:44–57.
14. Magarinos AM, McEwen BS (1995) Stress-induced atrophy of apical dendrites
of hippocampal CA3c neurons: involvement of glucocorticoid secretion and
excitatory amino acid receptors. Neuroscience 69: 89–98.
15. Faraday MM (2002) Rat sex and strain differences in responses to stress. PhysiolBehav 75: 507–522.
16. Kirkland SW, Coma AK, Colwell KL, Metz GA (2008) Delayed recovery andexaggerated infarct size by post-lesion stress in a rat model of focal cerebral
stroke. Brain Res 1201: 151–160.
17. Magarinos AM, McEwen BS (1995) Stress-induced atrophy of apical dendrites
of hippocampal CA3c neurons: comparison of stressors. Neuroscience 69:83–88.
18. Smith LT, Lin M, Brena RM, Lang JC, Schuller DE, et al. (2006) Epigeneticregulation of the tumor suppressor gene TCF21 on 6q23-q24 in lung and head
and neck cancer. Proc Natl Acad Sci U S A 103: 982–987.
19. Hibi K, Goto T, Sakuraba K, Shirahata A, Saito M, et al. (2011) Methylation of
OSMR Gene Is Frequently Observed in Non-invasive Colorectal Cancer.Anticancer Res 31: 1293–1295.
20. Metz GA, Antonow-Schlorke I, Witte OW (2005) Motor improvements after
focal cortical ischemia in adult rats are mediated by compensatory mechanisms.
Behav Brain Res 162: 71–82.
21. Qi Y, Takahashi N, Hileman SM, Patel HR, Berg AH, et al. (2004) Adiponectinacts in the brain to decrease body weight. Nat Med 10: 524–529.
22. Liu Y, Michael MD, Kash S, Bensch WR, Monia BP, et al. (2007) Deficiency of
adiponectin receptor 2 reduces diet-induced insulin resistance but promotes type
2 diabetes. Endocrinology 148: 683–692.
23. Wang Z, Zhuo Q, Fu P, Piao J, Tian Y, et al. (2010) Are the associations of
plasma leptin and adiponectin with type 2 diabetes independent of obesity in
older Chinese adults? Diabetes Metab Res Rev 26: 109–114.
24. Tsao TS, Lodish HF, Fruebis J (2002) ACRP30, a new hormone controlling fat
and glucose metabolism. Eur J Pharmacol 440: 213–221.
25. Yoon MJ, Lee GY, Chung JJ, Ahn YH, Hong SH, et al. (2006) Adiponectin
increases fatty acid oxidation in skeletal muscle cells by sequential activation of
AMP-activated protein kinase, p38 mitogen-activated protein kinase, and
peroxisome proliferator-activated receptor alpha. Diabetes 55: 2562–2570.
26. Kadowaki T, Yamauchi T (2005) Adiponectin and adiponectin receptors.
Endocr Rev 26: 439–451.
27. Yamauchi T, Kamon J, Ito Y, Tsuchida A, Yokomizo T, et al. (2003) Cloning of
adiponectin receptors that mediate antidiabetic metabolic effects. Nature 423:
762–769.
28. Kubota N, Yano W, Kubota T, Yamauchi T, Itoh S, et al. (2007) Adiponectin
stimulates AMP-activated protein kinase in the hypothalamus and increases food
intake. Cell Metab 6: 55–68.
29. Hoyda TD (2009) THE PHYSIOLOGICAL ACTIONS OF ADIPONECTIN
IN CENTRAL AUTONOMIC NUCLEI: IMPLICATIONS FOR THE
INTEGRATIVE CONTROL OF ENERGY HOMEOSTASIS. Kingston,
Canada, Ontario: Queen’s University.
30. Spranger J, Verma S, Gohring I, Bobbert T, Seifert J, et al. (2006) Adiponectin
does not cross the blood-brain barrier but modifies cytokine expression of brain
endothelial cells. Diabetes 55: 141–147.
31. Kusminski CM, McTernan PG, Schraw T, Kos K, O’Hare JP, et al. (2007)
Adiponectin complexes in human cerebrospinal fluid: distinct complex
distribution from serum. Diabetologia 50: 634–642.
32. Kos K, Harte AL, da Silva NF, Tonchev A, Chaldakov G, et al. (2007)
Adiponectin and resistin in human cerebrospinal fluid and expression of
adiponectin receptors in the human hypothalamus. J Clin Endocrinol Metab 92:
1129–1136.
33. Hug C, Wang J, Ahmad NS, Bogan JS, Tsao TS, et al. (2004) T-cadherin is a
receptor for hexameric and high-molecular-weight forms of Acrp30/adiponec-
tin. Proc Natl Acad Sci U S A 101: 10308–10313.
34. Imai K, Hirata S, Irie A, Senju S, Ikuta Y, et al. (2008) Identification of a novel
tumor-associated antigen, cadherin 3/P-cadherin, as a possible target for
immunotherapy of pancreatic, gastric, and colorectal cancers. Clin Cancer Res
14: 6487–6495.
35. Tanida M, Shen J, Horii Y, Matsuda M, Kihara S, et al. (2007) Effects of
adiponectin on the renal sympathetic nerve activity and blood pressure in rats.
Exp Biol Med (Maywood) 232: 390–397.
36. Fujita-Shimizu A, Suzuki K, Nakamura K, Miyachi T, Matsuzaki H, et al.
(2010) Decreased serum levels of adiponectin in subjects with autism. Prog
Neuropsychopharmacol Biol Psychiatry 34: 455–458.
37. Brandebourg T, Hugo E, Ben-Jonathan N (2007) Adipocyte prolactin:
regulation of release and putative functions. Diabetes Obes Metab 9:
464–476.
38. Fujikawa T, Soya H, Yoshizato H, Sakaguchi K, Doh-Ura K, et al. (1995)
Restraint stress enhances the gene expression of prolactin receptor long form at
the choroid plexus. Endocrinology 136: 5608–5613.
Stress-Induced Epigenetic Programming
PLoS ONE | www.plosone.org 16 January 2012 | Volume 7 | Issue 1 | e29441

39. Fujikawa T, Soya H, Tamashiro KL, Sakai RR, McEwen BS, et al. (2004)
Prolactin prevents acute stress-induced hypocalcemia and ulcerogenesis by
acting in the brain of rat. Endocrinology 145: 2006–2013.
40. Torner L, Toschi N, Pohlinger A, Landgraf R, Neumann ID (2001) Anxiolytic
and anti-stress effects of brain prolactin: improved efficacy of antisense targeting
of the prolactin receptor by molecular modeling. J Neurosci 21: 3207–3214.
41. Zinger M, McFarland M, Ben-Jonathan N (2003) Prolactin expression and
secretion by human breast glandular and adipose tissue explants. J Clin
Endocrinol Metab 88: 689–696.
42. Soboleva TK, Vetharaniam I, Nixon AJ, Montenegro R, Pearson AJ, et al.
(2005) Mathematical modelling of prolactin-receptor interaction and the
corollary for prolactin receptor gene expression in skin. J Theor Biol 234:
289–298.
43. Willson CA, Foster RD, Onifer SM, Whittemore SR, Miranda JD (2006) EphB3
receptor and ligand expression in the adult rat brain. J Mol Histol 37: 369–380.
44. Carpenter MK, Shilling H, VandenBos T, Beckmann MP, Cerretti DP, et al.
(1995) Ligands for EPH-related tyrosine kinase receptors are developmentally
regulated in the CNS. J Neurosci Res 42: 199–206.
45. O’Leary DD, Wilkinson DG (1999) Eph receptors and ephrins in neural
development. Curr Opin Neurobiol 9: 65–73.
46. Miranda JD, White LA, Marcillo AE, Willson CA, Jagid J, et al. (1999)
Induction of Eph B3 after spinal cord injury. Exp Neurol 156: 218–222.
47. Ciossek T, Lerch MM, Ullrich A (1995) Cloning, characterization, and
differential expression of MDK2 and MDK5, two novel receptor tyrosine
kinases of the eck/eph family. Oncogene 11: 2085–2095.
48. Sieghart W, Fuchs K, Tretter V, Ebert V, Jechlinger M, et al. (1999) Structure
and subunit composition of GABA(A) receptors. Neurochem Int 34: 379–385.
49. Collins AL, Ma D, Whitehead PL, Martin ER, Wright HH, et al. (2006)
Investigation of autism and GABA receptor subunit genes in multiple ethnic
groups. Neurogenetics 7: 167–174.
50. Ma DQ, Whitehead PL, Menold MM, Martin ER, Ashley-Koch AE, et al.
(2005) Identification of significant association and gene-gene interaction of
GABA receptor subunit genes in autism. Am J Hum Genet 77: 377–388.
51. Chugani DC, Muzik O, Juhasz C, Janisse JJ, Ager J, et al. (2001) Postnatal
maturation of human GABAA receptors measured with positron emission
tomography. Ann Neurol 49: 618–626.
52. Laurie DJ, Wisden W, Seeburg PH (1992) The distribution of thirteen GABAA
receptor subunit mRNAs in the rat brain. III. Embryonic and postnatal
development. J Neurosci 12: 4151–4172.
53. Poulter MO, Barker JL, O’Carroll AM, Lolait SJ, Mahan LC (1992) Differential
and transient expression of GABAA receptor alpha-subunit mRNAs in the
developing rat CNS. J Neurosci 12: 2888–2900.
54. Davis AM, Penschuck S, Fritschy JM, McCarthy MM (2000) Developmental
switch in the expression of GABA(A) receptor subunits alpha(1) and alpha(2) in
the hypothalamus and limbic system of the rat. Brain Res Dev Brain Res 119:
127–138.
55. Lau P, Verrier JD, Nielsen JA, Johnson KR, Notterpek L, et al. (2008)
Identification of dynamically regulated microRNA and mRNA networks in
developing oligodendrocytes. J Neurosci 28: 11720–11730.
56. Rodriguez-Lebron E, Paulson HL (2006) Allele-specific RNA interference for
neurological disease. Gene Ther 13: 576–581.
57. Ioshikhes I, Roy S, Sen CK (2007) Algorithms for mapping of mRNA targets for
microRNA. DNA Cell Biol 26: 265–272.58. Fazioli F, Minichiello L, Matoskova B, Wong WT, Di Fiore PP (1993) eps15, a
novel tyrosine kinase substrate, exhibits transforming activity. Mol Cell Biol 13:
5814–5828.59. Cupers P, ter Haar E, Boll W, Kirchhausen T (1997) Parallel dimers and anti-
parallel tetramers formed by epidermal growth factor receptor pathway substrateclone 15. J Biol Chem 272: 33430–33434.
60. Chen H, Fre S, Slepnev VI, Capua MR, Takei K, et al. (1998) Epsin is an EH-
domain-binding protein implicated in clathrin-mediated endocytosis. Nature394: 793–797.
61. Tamminga J, Kathiria P, Koturbash I, Kovalchuk O (2008) DNA damage-induced upregulation of miR-709 in the germline downregulates BORIS to
counteract aberrant DNA hypomethylation. Cell Cycle 7: 3731–3736.62. Maes OC, An J, Sarojini H, Wang E (2008) Murine microRNAs implicated in
liver functions and aging process. Mech Ageing Dev 129: 534–541.
63. D’Agostino J, Vaeth GF, Henning SJ (1982) Diurnal rhythm of total and freeconcentrations of serum corticosterone in the rat. Acta Endocrinol (Copenh)
100: 85–90.64. Metz GA, Jadavji NM, Smith LK (2005) Modulation of motor function by stress:
a novel concept of the effects of stress and corticosterone on behavior.
Eur J Neurosci 22: 1190–1200.65. Metz GA, Whishaw IQ (2000) Skilled reaching an action pattern: stability in rat
(Rattus norvegicus) grasping movements as a function of changing food pelletsize. Behav Brain Res 116: 111–122.
66. Rozen S, Skaletsky H (2000) Primer3 on the WWW for general users and forbiologist programmers. Methods Mol Biol 132: 365–386.
67. Wan G, Lim QE, Too HP (2010) High-performance quantification of mature
microRNAs by real-time RT-PCR using deoxyuridine-incorporated oligonucle-otides and hemi-nested primers. RNA 16: 1436–1445.
68. Lewis BP, Burge CB, Bartel DP (2005) Conserved seed pairing, often flanked byadenosines, indicates that thousands of human genes are microRNA targets. Cell
120: 15–20.
69. Grimson A, Farh KK, Johnston WK, Garrett-Engele P, Lim LP, et al. (2007)MicroRNA targeting specificity in mammals: determinants beyond seed pairing.
Mol Cell 27: 91–105.70. Blazejczyk M, Miron M, Nadon R Genome. Quebec, Montreal, Canada:
FlexArray: a statistical data analysis software for gene expression microarrays2007 Available: http://genomequebec.mcgill.ca/FlexArray.
71. Du P, Kibbe WA, Lin S (2007) Using lumi, a package processing Illumina
Microarray. Available: http://bioconductor.org/packages/2.0/bioc/vignettes/lumi/inst/doc/lumi.pdf.
72. Irizarry RA, Hobbs B, Collin F, Beazer-Barclay YD, Antonellis KJ, et al. (2003)Exploration, normalization, and summaries of high density oligonucleotide array
probe level data. Biostatistics 4: 249–264.
73. Bolstad BM, Irizarry RA, Astrand M, Speed TP (2003) A comparison ofnormalization methods for high density oligonucleotide array data based on
variance and bias. Bioinformatics 19: 185–193.74. Irizarry RA, Bolstad BM, Collin F, Cope LM, Hobbs B, et al. (2003) Summaries
of Affymetrix GeneChip probe level data. Nucleic Acids Res 31: e15.75. Pfaffl MW (2001) A new mathematical model for relative quantification in real-
time RT-PCR. Nucleic Acids Res 29: e45.
Stress-Induced Epigenetic Programming
PLoS ONE | www.plosone.org 17 January 2012 | Volume 7 | Issue 1 | e29441


