Embed Size (px)
Citation preview

Geographical patterns of Triatominae (Heteroptera:Reduviidae) richness and distribution in the WesternHemisphere
JOS �E A. F. DINIZ-FILHO,1 SOLEDAD CECCARELLI,2 WALDOHASPERU �E3 and JORGE RABINOVICH2 1Departamento de Ecolog�ıa, ICB, Universidade
Federal de Goi�as, Goiania, Brazil, 2Centro de Estudios Parasitol�ogicos y de Vectores (CEPAVE), Universidad Nacional
de La Plata/CONICET, La Plata, Argentina and 3Facultad de Inform�atica, Universidad Nacional de La Plata, La Plata,
Argentina
Abstract. 1. Broad-scale spatial patterns in species richness have been widelyinvestigated with spatial statistics tools in the past few years. The primary goalof these investigations has been to understand the ecological and evolutionaryprocesses underlying such patterns. Nevertheless, most of the current (climate)explanations for these patterns actually rely on the geographical range limits ofspecies, so that a better understanding of such processes may be achieved bycoupling richness and distribution (niche) models.
2. We analysed the geographical ranges and richness patterns for 115 triato-mine species in the Neotropics, modelled as a function of 12 environmentalvariables expressing alternative hypotheses that have been used to explain rich-ness gradients. These analyses were based on spatial [spatial eigenvector map-ping (SEVM)] and non-spatial ordinary least-squares multiple regressionmodels. The geographical ranges of species were also individually analysedusing a general linear model (GLM). The coefficients of the regression modelsfor richness and distribution were then compared.
3. Spatial analyses revealed that the unique contributions of spatial eigenvec-tors and environmental variables to richness were, respectively, equal to 24.2%and 12.2%, with high coefficient values for temperature, actual evapotranspira-tion, and seasonality. Similar results were obtained using a GLM, and the meanGLM coefficients had a relatively high correlation with those obtained withSEVM (r = 0.586; P < 0.05).
4. Our analyses show that the drivers of Neotropical Triatominae richnessand of its species ranges show a high correlation, although the differencesamong the drivers may be important for understanding the emergent proper-ties (historical processes and species-specific environmental drivers) thatexplain richness patterns. Moreover, although our analyses identified animportant role for temperature and temperature seasonality in explaining bothspecies richness and distributions, other spatially structured environmentalvariables and historical factors may explain a large part of the variation indiversity patterns.
Key words. Deconstruction, distribution models, eigenvector mapping, nichemodels, richness gradients, Triatominae.
Correspondence: Jos�e A. F. Diniz-Filho, Departamento de
Ecolog�ıa, ICB, Universidade Federal de Goi�as, Goiania, Brazil.
E-mail: [email protected]
� 2013 The Royal Entomological Society 1
Insect Conservation and Diversity (2013) doi: 10.1111/icad.12025

Introduction
Different combinations of ecological and historical pro-cesses are involved in the origin and maintenance of
broad-scale species richness gradients, a problem that hasbeen studied by ecologists and biogeographers since theearly XIX century (Hawkins, 2001). In general, explana-
tions focus on why the tropics have more species thantemperate zones, and several models based on the influ-ence of alternative processes were developed in the last
200 years to explain this richness pattern. Several of thesemodels involve different components of biotic or abioticvariation in geographical space (i.e. how different compo-
nents of the environment, including energy-water balance,environmental heterogeneity, biotic interactions and habi-tat complexity, drive species patterns – see below) (seeHawkins et al., 2003a,b; Currie et al., 2004; Field et al.,
2009), whereas others involve different roles for specia-tion, extinction and niche dynamics over evolutionarytime (Mittelbach et al., 2007).
Although fully integrative models are still under devel-opment (see Mittelbach et al., 2007), processes at ecologi-cal time scales, involving niche characterisation and
adaptive responses to geographical range limits, are usu-ally cited in the attempts to explain the current geographi-cal/environmental distributions of species (althoughdispersal is usually involved in achieving these limits)
(Ara�ujo & Pearson, 2005; Guisan & Rahbek, 2011).Moreover, niche dynamics and distributions in space andtime also have important time components (Pearman
et al., 2008), and historical processes of extinction, specia-tion and range expansion (especially after the last glacialmaximum) following climatic shifts are also involved in
the origin of richness patterns at broad geographicalscales (Wiens & Donoghue, 2004; Hawkins et al., 2007;Ara�ujo et al., 2008; Hawkins & DeVries, 2009).
Although it is now relatively clear that both ecologi-cal and historical processes drive patterns at differentscales and with different degrees of relative importancefor different groups of organisms and regions of the
world (see Field et al., 2009), it is much more difficultto achieve good surrogates for historical processes in anexplicit geographical context. Recent effects of glacia-
tions are easier to evaluate, but the geographical varia-tion at these short time scales is usually highlycorrelated with current climate (Ara�ujo et al., 2008;
Hortal et al., 2011; Gouveia et al., 2013). For this rea-son, most researchers still use environmental models asprimary explanations for richness patterns and try tointerpret failures in these models as indications of
important historical effects driving species overlap (i.e.richness). This approach may serve as an initial analyti-cal strategy, but it is also becoming clear that it is criti-
cal to combine patterns and processes at distincthierarchical levels and spatial scales to achieve abroader and more integrative understanding of diversity
patterns. This follow-up strategy includes, for instance,combining models built for explaining patterns in
species geographical ranges and in richness and jointlyinterpreting them within a single framework (see Terri-bile et al., 2009; Guisan & Rahbek, 2011).The idea that deconstructing species richness (i.e. calcu-
lating richness for several groups and then interpretingtheir patterns in a comparative way) may help in inter-preting their ecological, behavioural or evolutionary driv-
ers is not new, but was formalised by Marquet et al.(2004). Since then, several studies have formally used thisapproach (e.g. see Krasnov et al., 2010; Honkanen et al.,
2011; Azeria et al., 2011; Diniz-Filho et al., 2012; forrecent studies). In general, these studies start with verylarge taxonomic groups (e.g. insects or Hemiptera) and
then investigate richness patterns at lower levels in sub-groups defined by ecological or phylogenetic data at thespecies level (e.g. different families within an order, orrichness compared between herbivorous or carnivorous
species). The idea proposed by Terribile et al. (2009) wasto take this process of subdivision to an extreme bycontinuing to subdivide the groups until each group con-
sisted of a single species. Because of the different charac-teristics of the richness data and distributional data,different modelling techniques must be used (see below),
but the overall reasoning is to determine the drivers ofspecies distribution limits to see if they match those ofrichness and interpret the relationship among drivers atthese two hierarchical levels (see also Honkanen et al.,
2011; Diniz-Filho & Bini, 2012). For instance, if there isan environmental driver that constrains most of the spe-cies distributions, it is quite reasonable to expect that rich-
ness variation in geographical space is also explained bythis same driver, but in this case the explanation must be‘reduced’ to the lower level (i.e. species) and not to emer-
gent properties at the assemblage level. In contrast, a lackof congruence of patterns at the two levels could beexplained by biotic interactions, sampling issues at the
individual species level or even historical processes such asgeographically variable balances between speciation andextinction (because of a higher ‘fitness’ of species in differ-ent environments) (see Guisan & Rahbek, 2011; Hortal
et al., 2012). The explanation at the level of each species,of course, can include historical components, primarily inthe form of niche conservatism that constrains adaptation
to new environments during the phylogenetic divergenceof new species and, thus, creates gradients in their overlap(see Wiens & Donoghue, 2004; Rangel & Diniz-Filho,
2005; Rangel et al., 2007; Wiens et al., 2010; Diniz-Filhoet al., 2012).In this study, we analysed the geographical patterns
and environmental correlates of the species richness and
distribution of Neotropical Triatominae (Heteroptera: Re-duviidae). This group of insects includes approximately140 species (Schofield & Galvao, 2009). The Triatominae
are widely distributed in the Western Hemisphere, rangingfrom Southern Argentina and Chile to the NorthernUnited States. With a few exceptions, this group of insects
has a relatively homogeneous haematophagous feedingregime based primarily on the blood of birds and
� 2013 The Royal Entomological Society, Insect Conservation and Diversity
2 Jos�e A. F. Diniz-Filho et al.

mammals (primarily rodents, edentates, and carnivores)(Carcavallo et al., 1998; Rabinovich et al., 2011).Although certain species are adapted to particular habi-tats associated with human occupation, most triatomines
are sylvatic species that inhabit a great variety of habitats(Gal�ındez-Gir�on et al., 1998; Bargues et al., 2010; Patter-son & Guhl, 2010). The variety of habitats used by triato-
mines facilitates their relationship with their principalhosts (Bar et al., 1999). Several triatomine species aredirectly related to Chagas disease, one of the most impor-
tant diseases in America, as vectors of the etiologicalagent of the disease, the protozoan Trypanosoma cruzi.This disease presently affects approximately 20 million
people in Latin America, and approximately 120 millionare at risk of infection (OPS, 2006).We tested how different environmental hypotheses,
widely discussed in the literature (e.g. Rodr�ıguez et al.,
2005; Field et al., 2009), may explain the geographicalpatterns of richness and distribution of triatomines. Theambient energy hypothesis states that direct energy inputs
affect organisms and increase diversity by several mecha-nisms that accelerate speciation or buffer local extinction.We can include the effects of water in this model. Indeed,
there is abundant evidence from several different groupsof organisms worldwide that surrogates of water-energybalance explain most of the variation in species richness(Hawkins et al., 2003b; see Fisher et al., 2011 for a recent
review). A related approach is that regions with higherproductivity (which are also those with larger energyinput and more balanced water-energy systems) can sup-
port more species because larger population sizes will buf-fer extinctions and allow species to accumulate. Habitatheterogeneity and complexity can also be a primary expla-
nation because they can encompass more species adaptedto different local environments and belonging to differentfunctional groups. Finally, seasonality and predictability
can be involved as a secondary cause because strong cli-matic and environmental fluctuations can create complexpopulation dynamics that lead to local extinctions andemigration, affecting diversity. Although it may be diffi-
cult to establish a priori which of these models are mostlikely to explain richness and distribution patterns in
insects, it is expected that insects, as ectotherms, are moresensitive to climate variation and respond more directly totemperature and other energy variables (Hawkins et al.,2003a; see Discussion). For instance, Menu et al. (2010)
have invoked environmental uncertainty as a factorinvolved in adaptation mechanisms in triatomines, such asa developmental delay bet-hedging strategy, as the result
of selection under harsh and unpredictable conditions.
Methods
Data
A grid of 2694 cells, covering the New World was analy-sed. Each cell measured 1.0° of latitude and longitude.Richness was obtained by overlaying the occurrences of
115 species of the subfamily Triatominae, using the basicinformation on species ranges in Carcavallo et al. (1999).The richness values were square-root transformed to nor-
malise the distribution of the model residuals and toachieve a linear relationship with the explanatory variables.We evaluated how species richness and distribution can
be related to seven different hypotheses about climaticeffects as drivers of species richness, and we defined 12environmental variables as surrogates for these hypotheses(see Rodr�ıguez et al., 2005) (Table 1). These hypotheses,
with their respective surrogate environmental variables,were as follows: (i) Ambient Energy, using as a surrogatemean annual potential evapotranspiration (PET) and
mean annual temperature (°C) (TEMP); (ii) water-energybalance, using actual mean annual evapotranspiration(AET) (mm) and average rainfall (mm year�1) (RAIN) as
a surrogate; (iii) Productivity, using dry matter (DM) netprimary productivity (NPP) (gDM m�2 year�1) as a sur-rogate; (iv) environmental heterogeneity, expressed by the
standard deviation in topographical relief (TOPOG) (m)and Simpson index of vegetation diversity (SIMPSON);(v) Climatic variability or seasonality, based on the coeffi-cients of variation (as a%) of the mean annual tempera-
ture (cvTEMP) (°C); (vi) Environmental predictability,expressed by Colwell’s index of precipitation predictability
Table 1. Description, units, acronym, and surrogate function of the environmental variables used.
Name Units Acronym Surrogate of
Potential evapotranspiration mm year�1 PET Ambient energy
Mean annual temperature °C TEMP Ambient energy
Actual mean annual evapotranspiration mm year�1 AET Water-energy balance
Mean annual precipitation mm year�1 RAIN Water-energy balance
Dry matter net primary productivity gDM m�2 year�1 NPP = NDVI? Productivity
Standard deviation of topographical relief M TOPOG Environmental heterogeneity
Simpson index of vegetation diversity A number SIMPSON Environmental heterogeneity
Coefficient of variation in TEMP % cvTEMP = LST.coeff? Climatic variability or seasonality
Colwell’s index of rain predictability 0 < Number < 1 COLWELL Environmental predictability
Average PET of driest months mm year�1 AvRDriest Climatic constraint
Number of driest months per year A number DRYMON Climatic constraint
Minimum temperature of coldest month °C MinTCOLD Climatic constraint
� 2013 The Royal Entomological Society, Insect Conservation and Diversity
Geographical patterns of triatomine diversity 3

(Colwell, 1974); and (vii) Climatic constraints, as a variantof climatic variability, as recently proposed by Oliveiraand Diniz-Filho (2010), and defined as the average PETof the driest months (AvRDriest), the number of the dri-
est months (DRYMON) and the minimum temperatureof the coldest (MinTCOLD) months as surrogates.The variables defined above were obtained from the
agroclimatic database of the Agromet Group of the Uni-ted Nations Food and Agriculture Organisation with thesoftware New_LocClim vers. 1.10 (Grieser, 2006) and
processed at a resolution of 0.1° of latitude and longi-tude. A special programme was developed in the Delphilanguage to obtain the altitude values and the climatic
statistics at the desired grid size. Thus, the values of themeans and standard deviations at the grid size used inthis analysis (1.0° 9 1.0°) depended on the number of0.1° coordinates that composed each grid cell (this was
not a fixed number because if a grid cell partially cov-ered a water body, only the terrestrial fraction was used;the average number of 0.1° coordinates per cell was 476,
smaller than the theoretical maximum of 625 of 0.1°coordinates). The vegetation information used in thisanalysis was based on 22 vegetation types provided by
Eva et al. (2004) for South America. These vegetationtypes were compiled from over 40 land cover classesidentified by multi-sensor satellite observations at a spa-tial resolution of 1 km, and they highlight the major veg-
etation formations. For Central and North America, theinformation was kindly provided by Mr. H. D. Eva(Joint Research Centre of the European Commission,
Ispra, Italy). In each 1° 9 1° coordinate grid cell, theenvironmental variables available at 0.1° 9 0.1° coordi-nates were averaged to produce a unique value for each
variable per grid cell. For the case of the Simpson vege-tation diversity, the index was calculated based on therelative abundance of each of the 22 vegetation types
available. For the case of the presence/absence of triato-mine species, the criterion used was that a given specieswas considered present in the 1° 9 1° coordinate cell ifat least one 0.1° coordinate within that grid cell had that
species present.
Statistical analyses
We first regressed square-root transformed richness
against the 12 predictors with a standard ordinary least-squares (OLS) multiple regression and interpreted theoverall explanatory power (R2), as well as the standar-dised partial slopes. We sought to identify the most
important explanatory variables (and associated hypothe-ses). We also used a model selection approach based onthe Akaike Information Criterion (AIC) to identify the
minimum adequate models for richness patterns (Burn-ham & Anderson, 2002; Diniz-Filho et al., 2008). All4095 possible combinations of the 12 predictors were used
to model species richness, and the AIC was computed foreach model. The relative AIC weighting (AICw) was then
computed for use as a weighting criterion for averagingmodels. The AICw also indicates the probability that eachmodel is the correct one within the selected set of models(Diniz-Filho et al., 2008).
In spite of this, the residuals of geographical analysesusually display significant spatial autocorrelation that maydisturb significance test and model selection procedures
(Diniz-Filho et al., 2003, 2008; Dormann et al., 2007). Inthis study, the spatial autocorrelation in species richnessand in the model residuals was assessed with correlograms
based on Moran’s I autocorrelation coefficients calculatedfor 10 distance classes (with a size of 1° 9 1°). Becausethe residuals of the multiple OLS regression were autocor-
related, we implemented a SEVM method analysis (Bor-card & Legendre, 2002; Diniz-Filho & Bini, 2005; Griffith& Peres-Neto, 2006) to evaluate the effects of environ-mental variables on species richness.
Although many methods are available to incorporatethe effects of spatial autocorrelation in a regression model,many analyses show that the SEVM is one of the most
powerful of such methods and offers the chief advantageof incorporating these effects without scale shifts (seeDormann et al., 2007; Bini et al., 2009). The SEVM
implemented here is actually a standard OLS model inwhich, in addition to the environmental explanatory vari-ables, a set of eigenvectors extracted from the geographi-cal distances among the cells is incorporated into the
model. These eigenvectors are mathematical constructsthat express the relationship among grid cells at distinctspatial scales: the first eigenvectors, with the largest eigen-
values, indicate patterns at coarse scales, establishing therelationship between cells at maximum distances in thedomain analysed, whereas the eigenvectors with smaller ei-
genvalues indicate short-distance relationships amongcells. Following Bini et al. (2009), the eigenvectors to enterin the model are those more correlated with the OLS
residuals because this approach increases stability in themodel. At the same time, this approach minimises theoverlap between spatial (combining spatially structurederrors, dispersal and unknown environmental predictors)
and environmental variables tested by minimising collin-earity effects that may cause misinterpretations (‘red shift’effects) of the relative importance of the variables used to
represent each hypothesis.The SEVM can be used to interpret the effects of envi-
ronmental variables on richness in several ways, including
the partial slopes of environmental drivers after incorpo-rating geographical structure. We also used the SEVM tobuild a partial regression model (Legendre & Legendre,1998). In this model, the total explanation (R2) of richness
was partitioned into environmental effects (a, given by theeffect of the original seven explanatory variables), geogra-phy or space (c, given by the eigenvector set), and the
overlap among them, expressing the geographically struc-tured environmental variation (b).In addition to the analysis of species richness, we also
modelled the geographical ranges (presence-absence data)of each of the 115 species using a generalised linear model
� 2013 The Royal Entomological Society, Insect Conservation and Diversity
4 Jos�e A. F. Diniz-Filho et al.
(GLM). We fitted a logistic regression based on a logittransformation of data that allows the estimation of theregression coefficients by maximum likelihood. The coeffi-cients were used to define whether or not the most impor-
tant explanatory variables for overall richness (i.e. rangeoverlap) were also driving the geographical ranges of thespecies under what has been termed the principle of
‘extreme deconstruction’ (see Terribile et al., 2009 for dis-cussion and methods). For GLM modelling, cells in whichthere are no records for each of the species were consid-
ered absences. We evaluated the statistical significance ofthe GLM slopes for each environmental variable anddefined the main driver (the ‘primary’ variables or
hypothesis, sensu Field et al., 2009), as well as the MacF-adden’s q2 and the associated v2, indicating overall modelfit. We then counted the ‘primary’ variables for eachhypothesis across the 115 species.
All analyses were performed in SAM 4.0, freely avail-able at www.ecoevol.ufg.br/sam (see also Rangel et al.,2006, 2010). GLM models were fit in a modified version
of the GLM from SAM 4.0, but adapted by Thiago F.Rangel to run multiple species.
Results
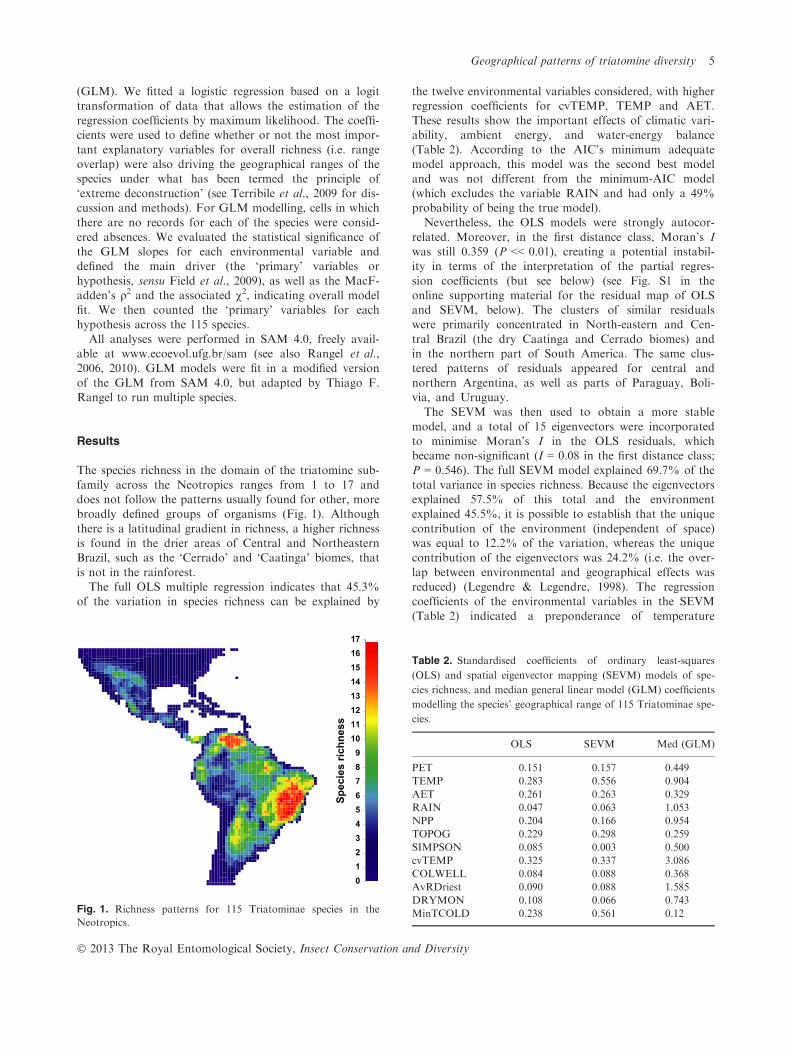
The species richness in the domain of the triatomine sub-
family across the Neotropics ranges from 1 to 17 anddoes not follow the patterns usually found for other, morebroadly defined groups of organisms (Fig. 1). Although
there is a latitudinal gradient in richness, a higher richnessis found in the drier areas of Central and NortheasternBrazil, such as the ‘Cerrado’ and ‘Caatinga’ biomes, that
is not in the rainforest.The full OLS multiple regression indicates that 45.3%
of the variation in species richness can be explained by
the twelve environmental variables considered, with higherregression coefficients for cvTEMP, TEMP and AET.These results show the important effects of climatic vari-ability, ambient energy, and water-energy balance
(Table 2). According to the AIC’s minimum adequatemodel approach, this model was the second best modeland was not different from the minimum-AIC model
(which excludes the variable RAIN and had only a 49%probability of being the true model).Nevertheless, the OLS models were strongly autocor-
related. Moreover, in the first distance class, Moran’s Iwas still 0.359 (P << 0.01), creating a potential instabil-ity in terms of the interpretation of the partial regres-
sion coefficients (but see below) (see Fig. S1 in theonline supporting material for the residual map of OLSand SEVM, below). The clusters of similar residualswere primarily concentrated in North-eastern and Cen-
tral Brazil (the dry Caatinga and Cerrado biomes) andin the northern part of South America. The same clus-tered patterns of residuals appeared for central and
northern Argentina, as well as parts of Paraguay, Boli-via, and Uruguay.The SEVM was then used to obtain a more stable
model, and a total of 15 eigenvectors were incorporatedto minimise Moran’s I in the OLS residuals, whichbecame non-significant (I = 0.08 in the first distance class;P = 0.546). The full SEVM model explained 69.7% of the
total variance in species richness. Because the eigenvectorsexplained 57.5% of this total and the environmentexplained 45.5%, it is possible to establish that the unique
contribution of the environment (independent of space)was equal to 12.2% of the variation, whereas the uniquecontribution of the eigenvectors was 24.2% (i.e. the over-
lap between environmental and geographical effects wasreduced) (Legendre & Legendre, 1998). The regressioncoefficients of the environmental variables in the SEVM
(Table 2) indicated a preponderance of temperature
Spec
ies
richn
ess
1716151413121110
9876543210
Fig. 1. Richness patterns for 115 Triatominae species in the
Neotropics.
Table 2. Standardised coefficients of ordinary least-squares
(OLS) and spatial eigenvector mapping (SEVM) models of spe-
cies richness, and median general linear model (GLM) coefficients
modelling the species’ geographical range of 115 Triatominae spe-
cies.
OLS SEVM Med (GLM)
PET 0.151 0.157 �0.449
TEMP 0.283 0.556 0.904
AET 0.261 0.263 0.329
RAIN 0.047 �0.063 �1.053
NPP 0.204 0.166 0.954
TOPOG 0.229 0.298 0.259
SIMPSON 0.085 0.003 0.500
cvTEMP �0.325 �0.337 �3.086
COLWELL �0.084 �0.088 �0.368
AvRDriest �0.090 �0.088 �1.585
DRYMON 0.108 0.066 �0.743
MinTCOLD �0.238 �0.561 �0.12
� 2013 The Royal Entomological Society, Insect Conservation and Diversity
Geographical patterns of triatomine diversity 5

variables and did not differ greatly from the original OLS(r = 0.926; P << 0.01 between the two vectors of regres-sion coefficients), although AET, TOPOG and cvTEMPstill had higher coefficients.
These results are supported by the modelling of thegeographical range of species based on a GLM (seeTable S1 in the online supporting material). Significant
coefficients for at least one of the 12 environmental pre-dictors were obtained for 68 of the 115 species. In thesemodels, the MacFadden’s q2 ranged from 15.8% to
99.5%, with an average of 50.6%. Although these coef-ficients varied greatly and indicate that environmentswere not generally a strong explanation for the distribu-
tion patterns of individual species’ ranges, the cvTEMPwas the primary explanation of range variation for 37species, whereas the minimum temperature was the prin-cipal driver for 26 other species. All species showed sig-
nificant effects for at least one of these two variables,but they were not the most important explanatory vari-ables in 14 species. In spite of this, the effect of envi-
ronmental constraints was, in general, also very strong.The average rainfall in the driest month (AvRDriest)and the number of dry months per year (DRYMON)
were the main predictors in 17 and 7 models respec-tively. Relatively high correlations were found betweenthe GLM median predictors and the OLS (Spearman’sr = 0.699; P < 0.05) and SEVM (r = 0.637; P < 0.05)
coefficients (see Table 2; Fig. 2).
Discussion
Geographical ecology of Triatominae
Our analyses of the Neotropical Triatominae supportprevious empirical models for environmental variablesdriving species richness, in which a relatively high explan-
atory power is found for water and energy variables andin which elevation variables play a minor role. Neverthe-less, seasonality also played a very important role in our
models, and the coefficient of variation in the annual tem-perature (cvTEMP) was the variable with the highest coef-ficient in the standardised regression, independently of the
minimum and mean temperatures. Although these inter-pretations are correlative and based on partial regressioncoefficients (see Hawkins, 2012), it is quite difficult to dis-entangle the unique effects of these variables because of
collinearity among variables and residual autocorrelation,which may create unstable models. Part of the difficultymay also be due to the relatively narrow taxonomic range
of our study (see Field et al., 2009), as a relatively smallnumber of species may be not enough to allow a goodevaluation of the drivers of range overlap. The reason
that the use of a narrow taxonomic range may causeinterpretive difficulty is that the idiosyncratic componentsof the response of species to environmental drivers createmore complexity in range overlap, although our extreme
deconstructive approach may help interpreting patterns(see next section). Indeed, it is worthwhile to consider thatthe environmental determinants of the geographical
ranges of approximately half of the species are not strongand show relatively low values of McFadden’s q2. Thisapparent lack of environmental determinants at the spe-
cies level appears to be due to a combination of methodo-logical issues (such as a lack of the correct environmentaldrivers or the use of low sample sizes) and ecological
issues (i.e. a lack of equilibrium between climate and spe-cies occurrences due to recent historical range shifts anddispersal failure). In both cases, the idiosyncraticresponses of species distributions explain the relatively
poor fit at higher emerging hierarchical levels of speciesrichness (see Terribile et al., 2009).Another related issue of substantial importance is that
adding spatial components to the model (by eigenvectorfiltering) appears to improve the models and to aid indistinguishing among the alternative main hypotheses.
Although it is difficult to provide an ecological interpreta-tion of the eigenvectors, as they are only a complexmathematical expression of the spatial structure of thedata at multiple scales (see Diniz-Filho & Bini, 2005), it
may be reasonable to suppose that including the eigenvec-tors helps to control for scaling effects, historicalconstraints on distributions and the lack of dispersal, as
well as unmeasured environmental effects (see Landeiroet al., 2011). Empirically, it is noteworthy that addingeigenvectors and reducing residual autocorrelation cre-
ates more stable models and, in our case, magnifies therelative importance of most important drivers that are
–1.0 –0.5 0.0 0.5 1.0
SEVM coefficients
–4
–3
–2
–1
0
1
GLM
(med
ian
coef
ficie
nts)
Fig. 2. Relationship between coefficients of median general lin-
ear models for species distribution and spatial eigenvector map-
ping coefficients for 12 variables driving species richness and
distribution of 115 Triatominae species in the Neotropics (Spear-
man’s R equal to 0.637, following a monotonic and non-linear
power function).
� 2013 The Royal Entomological Society, Insect Conservation and Diversity
6 Jos�e A. F. Diniz-Filho et al.

independent of these stochastic processes of dispersal. Onmore theoretical grounds, further analyses using metricsderived from phylogenies for cells in the grid (e.g. Haw-kins et al., 2006, 2007; Algar et al., 2008) can be useful
for revealing certain spatially structured underlying histor-ical effects driving richness patterns and linked to the ei-genvectors. Biotic interactions would be another
component to be added to the models, and in this particu-lar case an interesting starting-point would be based pri-marily on considerations of triatomine feeding habits. All
the same, as noted by Rabinovich et al. (2011), triato-mines select hosts according to the habitats that they col-onise rather than by an innate preference for particular
host species. Because of this habitat-based pattern of hostselectivity, triatomines are not obligated to consume theblood of particular species, so that the possible role ofthis particular biological interaction with the host species
would be difficult to demonstrate. For now, according toour SEVM model, the importance of the variables relatedto environmental energy is relatively not very high and
other spatial components driving richness and distribu-tions must be investigated.Despite the relatively low explanatory ability of the
environmental drivers (i.e. 12% of the unique variationindependent of space), the most important variablesrelated to patterns at both the species distribution andrichness levels for the triatomines are biologically mean-
ingful. In general, environmental drivers (and particularlythe effect of temperature and water dynamics) are impor-tant predictors of richness in hyper-diverse groups of
insects such as beetles (Lobo et al., 2002; Baselga, 2008;Hortal et al., 2011), as well as butterflies and dragonflies(e.g. Keil et al., 2008; Hawkins, 2010; see also Hawkins
et al., 2003a and Field et al., 2009 for a general discussionand Diniz-Filho et al., 2010a for a recent review and dis-cussion for patterns in insects). But, as stated above, it is
not trivial to disentangle distinct hypotheses for many rea-sons. Nevertheless, in Hawkins et al. (2003a) meta-analysis,slightly less than half of the richness gradients studied ininsects was best explained by energy variables. Note that
in our OLS model, the role of the AET was equal to thatof the other variables, although the addition of spatialcomponents changed the importance of the AET slightly
and reinforced the role of temperature and of seasonalityin temperature. The substantial influence of the AET onthe model as a whole may have resulted because the AET
is a relatively synthetic variable that tends to be correlatedmore strongly with other spatially structured historicalpatterns (see Hawkins et al., 2006, 2007).Many previous studies have shown the strong influence
of temperature on the physiological state and ecologicaladaptations of triatomines. Adult Rhodnius prolixus showa thermal preference with a mean preferred temperature
of approximately 25 °C in the presence of a temperaturegradient (Schilman & Lazzari, 2004). If the insects wereexposed to different ambient temperatures, several effects
occurred at the physiological level. For example, the rateof weight loss was affected (Schilman & Lazzari, 2004).
Garcia et al. (1999) showed that heat (40 °C) and cold(0 °C) shocks affected survival and moulting (both themoulting frequency and a decrease in the moulting rate)in Panstrongylus megistus and that this effect was a func-
tion of the temperature and duration of the shock. Thiseffect is strongly species-specific. P. megistus was lessresistant to the heat shock than Triatoma infestans. More-
over, because R. prolixus can exploit temperature differ-ences to detect hosts (Ferreira et al., 2007), the ability ofthe species to detect hosts is also affected by the ambient
temperature (triatomines perceive radiant heat from awarm source and can estimate its temperature at a certaindistance during the search for food; Lazzari & N�u~nez,1989).At the population level, Dias (1955) has shown that in
the State of Minas Gerais in Brazil, both T. infestans andP. megistus fluctuate periodically between seasons in the
field, with a peak in October–January followed by a minorpeak in February–May and a trough in June–September.These population fluctuations coincide with fluctuations
in the temperature and rainfall (maximum values inDecember–March and minimum values in May–Septem-ber). This relationship is even stronger if particular insect
stages are considered rather than the total populations.The relationship also has important epidemiological valuebecause new cases of Chagas disease also reach a maxi-mum in the same months that the triatomines reach peak
population sizes. In an analysis of the population regula-tion of T. infestans, Schofield (1980) claims that the den-sity regulation mechanism based on egg-to-adult
development time, changes in female fecundity and thenumber of hosts functions within limits set by the prevail-ing ambient temperature. Nevertheless, the temporal fluc-
tuations in R. prolixus populations in the Venezuelansavannas, where there is no seasonality in temperature,are apparently driven by the seasonality of precipitation
(Feliciangeli de Pi~nero & Torrealba, 1977). Another eco-logical process affected by temperature is dispersal. MacCord and d’Almeida (1986) showed that the exposure ofT. infestans to a source of thermal stimulation for four
hours caused dispersal to other shelters.In an approach similar to that of this study, Gorla
(2002) used a stepwise linear discriminant analysis to
show that a function with six statistical predictors (fourassociated with air temperature, one with average infraredradiation and one with the vegetation index) correctly
identified 90% of the presence/absence sites of Triatomainfestans. As this species is primarily associated withhuman habitations, Gorla (2002) anticipated that thedistribution of other species having a more direct and
causal relationship with vegetation and climate than thatof T. infestans would be even stronger. An analysis byRodriguero and Gorla (2004) based on a set of 118 triato-
mine species very similar to that used in this study foundthat species richness increased significantly from the polestowards the equator and reached a peak at latitude 5°–10°S. They also used a non-linear multiple regression analysisto factor out latitude and show that richness was
� 2013 The Royal Entomological Society, Insect Conservation and Diversity
Geographical patterns of triatomine diversity 7

correlated with habitable geographical area only in theSouthern Hemisphere. They also conducted a multipleregression analysis and found a significant relationshipbetween temperature and species richness. This effect was
relatively pronounced in the Southern Hemisphere.
Methodological issues in modelling richness andgeographical distributions
Ecological Niche Modelling (or Species DistributionModelling) (see Ara�ujo & Peterson, 2012; Peterson &Sober�on, 2012) has been one of the most active research
fields in macroecology and geographical ecology, andmany methods have been developed (see Guisan & Thuil-ler, 2005; Franklin, 2010; Peterson et al., 2011; Rangel &Loyola, 2012). All the same, the methods have been used
primarily as a predictive tool to project species distribu-tions after changes in environmental conditions in a regiondue to climate change (in the present and the past) or bio-
logical invasions (see Peterson et al., 2011). The specificmethods to be used in each case and the methods for incor-porating different sources of uncertainty have been widely
discussed (Diniz-Filho et al., 2009, 2010b). Even so, thesemodels are used with a different perspective in the extremedeconstruction approach developed by Terribile et al.(2009) and the Spatially Explicit Species Assemblage Mod-
elling (SESAM) protocol recently proposed by Guisan andRahbek (2011). In these applications, the principal outputis not the distribution of each species, but rather the rela-
tive importance of different environmental drivers.Guisan and Rahbek (2011) developed their characterisa-
tions of ‘top-down’ or ‘bottom-up’ approaches to model
richness by comparing modelled richness patterns andpatterns emerging from distribution (niche) modelling (seealso Hortal et al., 2012). Compared with Terribile et al.
(2009) approach, SESAM offers the principal advantagethat it works directly with maps predicted by ecologicalniche modeling (ENM) and with richness estimated by amacroecological model. Because all maps compared
involve estimates of richness, they are a direct function ofthe ‘coefficients’ of the environmental drivers, which areused by Terribile et al. (2009). Nonetheless, because the
analyses in SESAM always involve richness, any methodor algorithm for ENM can be used (or a combination ofthem), whereas the approach of Terribile et al. (2009) is
restricted to the use of a GLM to model distributionsbecause it provides coefficients that can be directly com-pared with the standard OLS regression coefficients forrichness. In principle, the use of the SESAM approach (i.
e. which can be based on several ENMs) makes it possibleto avoid the frequent issues of model fit and evaluation,the selection of environmental variables, the use of pres-
ence-only and pseudo-absence data and decisions aboutthe use of alternative modelling techniques.The GLM approach appears to be a straightforward
method of obtaining direct comparisons of the effects ofenvironmental drivers in a way that is relatively directly
comparable with OLS or spatial regression models builtto analyse species richness. We used the same data usedfor calculating species richness for overlapping speciesranges. The key problem with SESAM as originally pro-
posed arises in connection with macroecological model-ling. If macroecological modelling is being performed, thegeographical ranges should be known independently of
the modelling itself (as in range filling data) or should beestimated based directly on the local assemblages, perhapsthrough the use of rarefaction approaches. If the required
data are available, SESAM may be a powerful way to dis-entangle the processes that drive patterns at distinct hier-archical levels. Moreover, it allows the incorporation of
more ‘layers’ based on species trait variation so that theassemblage rules governing more restricted spatial scalescan be better understood (see Hortal et al., 2012).A topic that was not explicitly developed in Terribile
et al. (2009; see also Guisan & Rahbek, 2011) involves aprediction related to the patterns of similarity betweenrichness and distributions. These patterns yield the predic-
tion that an analysis of relatively few species in evolution-arily homogeneous groups should show a strongercorrespondence between richness and distribution models
in terms of the associated environmental drivers than thecorrespondence obtained from an analysis of more hetero-geneous groups (tribes or families). Indeed, a strong corre-spondence of this type is evident from our analysis of the
triatomines. In this analysis, temperature, and especiallytemperature seasonality, is both the primary driver forrichness and the primary driver for most of the species
distributions analysed. This analysis demonstrates astrong correspondence between the drivers of richness andindividual species richness.
Concluding remarks
Our analyses of the richness of Neotropical Triatomi-nae and the distribution patterns of the species in thisgroup demonstrate a strong correspondence between rich-
ness and distribution and allow the identification of themost important environmental drivers of these patterns.Although other environmental variables and ecological
components, such as biotic interactions, may explain moreof the variation in diversity patterns, our analyses of spe-cies richness and distributions demonstrate the important
role of temperature and temperature seasonality. It isimportant to note that although the relative importancefound for these environmental variables makes biologicaland ecological sense, the explanatory ability of the vari-
ables is relatively low, so that further investigations of theevolutionary components of these drivers, as well as theirphysiological and behavioural basis at both the individual
and population levels, are still needed. Nevertheless, webelieve that our analyses represent a first step towardscombining macroecological and experimental data to
explain the broad-scale diversity patterns of NeotropicalTriatominae.
� 2013 The Royal Entomological Society, Insect Conservation and Diversity
8 Jos�e A. F. Diniz-Filho et al.

Acknowledgements
We thank J. M. Lobo, Andre Baselga and thee anonymousreviewers for suggestions and criticisms on different ver-
sions of the manuscript. The research programme in mac-roecology by J. A. F. D.-F. has been continuouslysupported by several fellowships and research grants from
CNPq and CAPES. Work by J.R. was also supported bythe the ‘Agencia Nacional de Promoci�on Cient�ıfica y Tec-nol�ogica’ of Argentina (grant PICT2008-0035). This work
has received partial support from the French NationalResearch Agency (grant ANR-08-MIE-007), CentreNational de la Recherche Scientifique (CNRS, UMR 5558).
Supporting Information
Additional Supporting Information may be found in the onlineversion of this article under the DOI reference: doi: 10.1111/icad.12025:
Figure S1. Maps of residuals of OLS (a) and SEVM(b), modeling triatomine species richness.Table S1. Species analyzed here and results for GLM
(logistic) modeling of species distributions, including Mac-Faddens rho and the coefficients of the 12 environmentalpredictors.
References
Algar, A.C., Kerr, J.T. & Currie, D.J. (2008) Evolutionary con-
straints on regional faunas: whom, but not how many. Ecology
Letters, 12, 57–65.Ara�ujo, M.B., Nogu�es-Bravo, D., Diniz-Filho, J.A.F., Haywood,
A.M., Valdes, P.J. & Rahbek, C. (2008) Quaternaty climate
changes explain diversity among reptiles and amphibians. Ecog-
raphy, 31, 8–15.Ara�ujo, M.B. & Pearson, R.G. (2005) Equilibrium of species’ dis-
tributions with climate. Ecography, 28, 693–695.Ara�ujo, M.B. & Peterson, A.T. (2012) Uses and misuses of biocli-
matic envelope modelling. Ecology, 93, 1527–1539.Azeria, E.T., Bouchard, M., Pothier, D., Fortin, D. & Herbert,
C. (2011) Using biodiversity deconstruction to disentangle
assembly and diversity dynamics of understorey plants along
post-fire succession in boreal forest. Global Ecology & Biogeog-
raphy, 20, 119–133.Bar, M.E., Alvarez, B.M., Oscherov, E.B., Damborsky, M.P. &
J€org, M.E. (1999) Contribuci�on al conocimiento de los reservo-
rios del Trypanosoma cruzi (Chagas, 1909) en la Provincia de
Corrientes, Argentina. Revista da Sociedade Brasileira de Medi-
cina Tropical, 32, 271–276.Bargues, M.D., Schofield, C.J. & Dujardin, J.P. (2010) Classifica-
tion and phylogeny of the triatominae. American Trypanosomia-
sis: Chagas Disease One Hundred Years of Research (ed. by J.
Telleria and M. Tibayrenc), pp. 117–148. Elsevier, London, UK.
Baselga, A. (2008) Determinants of species richness, endemism
and turnover in European longhorn beetles. Ecography, 31,
263–271.Bini, L.M., Diniz-Filho, J.A.F., Rangel, T.F.L.V.B., Akre, T.S.
B., Albaladejo, R.G., Albuquerque, F.S., Aparicio, A., Ara�ujo,
M.B., Baselga, A., Beck, J., Bellocq, M.I., B€ohning-Gaese, K.,
Borges, P.A.V., Castro-Parga, I., Chey, V.K., Chown, S.L,
Marco Jr, P., Dobkin, D.S., Ferrer-Cast�an, D., Field, R., Fil-
loy, J., Fleishman, E., G�omez, J.F., Hortal, J., Iverson, J.B.,
Kerr, J.T., Kissling, W.D., Kitching, I.J., Le�on-Cort�es, J.L.,
Lobo, J.M., Montoya, D., Morales-Castilla, I., Moreno, J.C.,
Oberdorff, T., Olalla-T�arraga, M.�A., Pausas, J.G., Qian, H.,
Rahbek, C., Rodr�ıguez, M.A., Rueda, M., Ruggiero, A., Sack-
mann, P., Sanders, N.J., Terribile, L.C., Vetaas, O.R. & Haw-
kins, B.A. (2009) Coefficients ships in geographical ecology: an
empirical evaluation of spatial and non-spatial regression.
Ecography, 32, 193–204.Borcard, D. & Legendre, P. (2002) All-scale spatial analysis of
ecological data by means of principal coordinates of neighbour
matrices. Ecological Modelling, 153, 51–68.Burnham, K.P. & Anderson, D.R. (2002) Model Selection and
Multimodel Inference. A Practical Information – Theoretical
Approach. Springer, New York, New York.
Carcavallo, R.U., Curto de Casas, S.I., Sherlock, I.A., Gal�ındez
Gir�on, I., Jurberg, J., Galvao, C. & Mena Segura, C.A. (1999)
Geographical distribution and alti-latitudinal dispersion of
Triatominae. Atlas of Chagas’ Disease Vectors in the Americas
(ed. by R.U. Carcavallo, I. Gal�ındez Gir�on, J. Jurberg and H.
Lent), pp. 747–792. Editorial Fiocruz, Rio de Janeiro, Brazil.
Carcavallo, R.U., Da Silva Rocha, D., Gal�ındez-Gir�on, I., Sher-
lock, I., Galvao, C., Mart�ınez, A., Tonn, R.J. & Cort�on, E.
(1998) Feedingsources and patterns. Atlas of Chagas’ Disease
Vectors in the Americas (ed. by R.U. Carcavallo, I. Gal�ındez-
Gir�on, J. Jurberg and H. Lent), pp. 53–73. Fiocruz, Rio de
Janeiro, Brazil.
Colwell, R.K. (1974) Predictability, constancy, and contingency
of periodic phenomena. Ecology, 55, 1148–1153.Currie, D.J., Mittelbach, G.G., Cornell, H.V., Field, R., Gu�egan,
J.-F., Hawkins, B.A., Kaufman, D.M., Kerr, J.T., Oberdoff,
T., O’Brien, E. & Turner, J.R.G. (2004) Predictions and tests
of climate-based hypotheses of broad-scale variation in taxo-
nomic richness. Ecology Letters, 7, 1121–1134.Dias, E. (1955) Variacoes Mensais da Incidencia das Formas
Evolutivas do Triatoma infestans e do Panstrongylus megistus
no Municipio de Bambui, Estado de Minas Gerais. Mem�orias
do Instituto Oswaldo Cruz, 53, 457–472.Diniz-Filho, J.A.F. & Bini, L.M. (2005) Modelling geographical
patterns in species richness using eigenvector-based spatial fil-
ters. Global Ecology and Biogeography, 14, 177–185.Diniz-Filho, J.A.F. & Bini, L.M. (2012) Geographical patterns in
biodiversity: towards na integration of concepts and methods
from genes to species diversity. Natureza & Conservacao, 9,
179–187.Diniz-Filho, J.A.F., Bini, L.M. & Hawkins, B.A. (2003) Spatial
autocorrelation and red herrings in geographical ecology. Glo-
bal Ecology and Biogeography, 12, 53–64.Diniz-Filho, J.A.F., DeMarco, P. & Hawkins, B.A. (2010a) Defy-
ing the curse of ignorance: perspectives in insect macroecology
and conservation biogeography. Insect Conservation and Diver-
sity, 3, 172–179.Diniz-Filho, J.A.F., Nabout, J.C., Bini, L.M., Loyola, R.D.,
Rangel, T.F., Nogu�es-Bravo, D. & Ara�ujo, M.B. (2010b)
Ensemble forecasting shifts in climatically suitable areas for
Tropidacris cristata (Orthoptera: Acridoidea: Romaleidae).
Insect Conservation and Diversity, 3, 213–221.Diniz-Filho, J.A.F., Rangel, T.F.L.V.B. & Bini, L.M. (2008)
Model selection and information theory in geographical ecol-
ogy. Global Ecology and Biogeography, 17, 479–488.
� 2013 The Royal Entomological Society, Insect Conservation and Diversity
Geographical patterns of triatomine diversity 9
Diniz-Filho, J.A.F., Rangel, T.F. & Santos, M.R. (2012) Extreme
deconstruction supports niche conservatism driving New World
bird diversity. Acta Oecologica, 43, 16–21.Diniz-Filho, J.A.F., Rodr�ıguez, M.�A., Bini, L.M., Olalla-T�arraga,
M.A., Cardillo, M., Nabout, J.C., Hortal, J. & Hawkins, B.A.
(2009) Climate history, human impacts and global body size of
Carnivora (Mammalia: Eutheria) at multiple evolutionary
scales. Journal of Biogeography, 36, 2222–2236.Dormann, C.F., McPherson, J., Ara�ujo, M.B., Bivand, R., Bol-
liger, J., Carl, G., Davies, R.G., Hirzel, A., Jetz, W., Kissling,
D., Kuhn, I., Ohlemuller, R., Peres-Neto, P., Reineking, B.,
Schroder, B., Schurr, F.M. & Wilson, R. (2007) Methods to
account for spatial autocorrelation in the analysis of distribu-
tional species data: a review. Ecography, 30, 609–628.Eva, H.D., Belward, A.S., De Miranda, E.E., Di Bellaz, C.M.,
Gond, V., Huber, O., Jonesk, S., Sgrenzaroli, M. & Fritz, S.
(2004) A land cover map of South America. Global Change
Biology, 10, 731–744.Feliciangeli de Pi~nero, D. & Torrealba, J.W. (1977) Observaci-
ones sobre Rhodnius prolixus (Hemiptera: Reduviidae) en su
Biotopo Silvestre Copernicia tectorum. Bolet�ın de la Direcci�on
de Malariolog�ıa y Saneamiento Ambiental, 17, 198–205.Ferreira, R.A., Lazzari, C.R., Lorenzo, M.G. & Pereira, M.H.
(2007) Do haematophagous bugs assess skin surface tempera-
ture to detect blood vessels? PLoS ONE, 2, 1–6.Field, R., Hawkins, B.A., Cornell, H.V., Currie, D.J., Diniz-Filho,
J.A.F., Gu�egan, J.-F., Kaufman, D.M., Kerr, J.T., Mittelbach,
G.G., Oberdorff, T., O’Brien, E.M. & Turner, J.R.G. (2009)
Spatial species-richness gradients across scales: a meta-analysis.
Journal of Biogeography, 36, 132–147.Fisher, J.B., Whittaker, R.J. & Yadvinder, M. (2011) ET come
home: potential evapotranspiration in geographical ecology.
Global Ecology & Biogeography, 20, 1–18.Franklin, J. (2010) Mapping Species Distributions: Spatial Infer-
ence and Prediction. Cambridge University Press, Cambridge,
UK.
Gal�ındez-Gir�on, I., Carcavallo, R.U., Jurberg, J., Galvao, C.,
Lent, H., Barata, J.M.S., Pinto Serra, O. & Valderrama, A.
(1998) Morfology and external anatomy. Atlas of Chagas’ Dis-
ease Vectors in the Americas (ed. by R.U. Carcavallo, I. Gal�ın-
dez-Gir�on, J. Jurberg and H. Lent), pp. 53–73. Fiocruz, Rio de
Janeiro, Brazil.
Garcia, S.L., Rodrigues, V.L.C.C., Garcia, N.L., Ferraz Filho,
A.N. & Mello, M.L.S. (1999) Survival and molting incidence
after heat and cold shocks in Panstrongylus megistus Burmei-
ster. Mem�orias do Instituto Oswaldo Cruz, 94, 131–137.Gorla, D.E. (2002) Variables ambientales registradas por sensores
remotos como indicadores de la distribuci�on geogr�afica de
Triatoma infestans (Heteroptera: Reduviidae). Ecolog�ıa Austral,
12, 117–127.Gouveia, S.F., Hortal, J., Cassemiro, F.A.S., Rangel, T.F. &
Diniz-Filho, J.A.F. (2013) Non-stationary effects of productiv-
ity, seasonality, and historical climate change on global
amphibian diversity. Ecography, 35, in press.
Grieser, J. (2006) New_LocClim Vers. 1.10 Local Climnate Esti-
mator. Agrometeorology Group, FAO/SDRN, Rome, Italy.
Griffith, D.A. & Peres-Neto, P. (2006) Spatial modeling in ecol-
ogy: the flexibility of eigenfunction spatial analyses. Ecology,
87, 2603–2613.Guisan, A. & Rahbek, C. (2011) SESAM: a new framework inte-
grating macroecological and species distribution models for
predicting spatio-temporal patterns in species assemblages.
Journal of Biogeography, 38, 1433–1444.
Guisan, A. & Thuiller, W. (2005) Predicting species distribution:
offering more than simple habitat models. Ecology Letters, 8,
993–1009.Hawkins, B.A. (2001) Ecology’s oldest pattern? Trends in Ecology
and Evolution, 16, 470.
Hawkins, B.A. (2010) Multiregional comparison of the ecological
and phylogenetic structure of butterfly species richness gradi-
ents. Journal of Biogeography, 37, 647–656.Hawkins, B.A. (2012) Eight (and a half) deadly sins of spatial
analysis. Journal of Biogeography, 39, 1–9.Hawkins, B.A. & DeVries, P.J. (2009) Tropical niche conserva-
tism and the species richness gradient of North American but-
terflies. Journal of Biogeography, 36, 1698–1711.Hawkins, B.A., Diniz-Filho, J.A.F., Jaramillo, C.A. & Soeller, S.
A. (2006) Post-eocene climate change, niche conservatism, and
the latitudinal diversity gradient of New World birds. Journal
of Biogeography, 33, 770–780.Hawkins, B.A., Diniz-Filho, J.A.F., Jaramillo, C.A. & Soeller, S.
A. (2007) Climate, niche conservatism, and the global bird
diversity gradient. American Naturalist, 170, 16–27.Hawkins, B.A., Field, R., Cornell, H.V., Currie, D.J., Gu�egan,
J.-F., Kaufman, D.M., Kerr, J.T., Mittelbach, G.G., Obe-
rdorff, T., O’Brien, E.M., Porter, E.E. & Turner, J.R.G.
(2003a) Energy, water, and broad-scale geographic patterns of
species richness. Ecology, 84, 3105–3117.Hawkins, B.A., Porter, E.E. & Diniz-Filho, J.A.F. (2003b) Pro-
ductivity and history as predictors of the latitudinal diversity
gradient of terrestrial birds. Ecology, 84, 1608–1623.Honkanen, M., Sorjanen, A.-M. & Monkkonen, M. (2011) Decon-
structing responses of dragonfly species richness to area, nutri-
ents, water plant diversity and forestry. Oecologia, 166, 457–467.Hortal, J., De Marco, P., Santos, A.M.C. & Diniz-Filho, J.A.F.
(2012) Integrating biogeographical processes and local commu-
nity assemblage. Journal of Biogeography, 39, 627–628.Hortal, J., Diniz-Filho, J.A.F., Bini, L.M., Rodriguez, M.A., Base-
lga, A., Nogu�es-Bravo, D., Hawkins, B.A. & Lobo, J.M. (2011)
Ice age climate, evolutionary constraints anddiversity patterns
of European dung beetles. Ecology Letters, 14, 741–748.Keil, P., Simova, I. & Hawkins, B.A. (2008) Water-energy and
the geographical species richness pattern of European and
North African dragonflies. Insect Conservation and Diversity, 1,
142–150.Krasnov, B.R., Mouillot, D., Shenbrot, G.I., Khokhova, I.S. &
Poulin, R. (2010) Deconstructing spatial patterns in species
composition of ectoparasite communities: the relative contribu-
tion of host composition, environmental variables and geogra-
phy. Global Ecology & Biogeography, 19, 515–526.Landeiro, V.L., Magnusson, W.E., Melo, A.S., Esp�ırito-Santo,
H.V. & Bini, L.M. (2011) Spatial eigenfunction analyses of
stream networks: do watercourse and overland distances pro-
duce different results? Freshwater Biology, 56, 1184–1192.Lazzari, C. & N�u~nez, J.A. (1989) The response to radiant heat
and the estimation of the temperature of distant sources in
Triatoma infestans. Journal of Insect Physiology, 35, 525–529.Legendre, P. & Legendre, L. (1998) Numerical Ecology. Develop-
ments in Environmental Modelling 20. Elsevier, Amsterdam.
Lobo, J.M., Lumaret, J.P. & Robert, J.P. (2002) Modelling the
species richness distribution of French dung beetles (Coleop-
tera, Scarabaeidae) and delimiting the predictive capacity of
different groups of explanatory variables. Global Ecology and
Biogeography, 11, 265–277.Mac Cord, J.R. & d’Almeida, S.C.G.R. (1986) The influence of
temperature on the behaviour of Triatoma infestans (Klug,
� 2013 The Royal Entomological Society, Insect Conservation and Diversity
10 Jos�e A. F. Diniz-Filho et al.

1834) (Hemiptera, Reduviidae) under laboratory conditions:
dispersion. Mem�orias do Instituto Oswaldo Cruz, 81, VE4.
Marquet, P.A., Fern�andez, M., Navarrete, S.A. & Valdovinos, C.
(2004) Diversity emerging: toward a deconstruction of biodiver-
sity patterns. Frontiers of Biogeography: New Directions in the
Geography of Nature (ed. by M. Lomolino and L.R. Heaney),
pp. 191–209. Sinauer Associates, Sunderland, Massachusetts.
Menu, F., Ginoux, M., Rajon, E., Lazzari, C.R. & Rabinovich,
J.E. (2010) Adaptive developmental delay in Chagas disease
vectors: an evolutionary ecology approach. PLoS Neglected
Tropical Diseases, 4, 1–10.Mittelbach, G.G., Schemske, D.W., Cornell, H.V., Allen, A.P.
Brown, J.M., Bush, M.B., Harrison, S.P., Hurlbert, A.H.,
Knowlton, N., Lessios, H.A., McCain C.M., McCune, A.R.,
McDade, L.A., McPeek, M.A., Near, T.J., Price, T.D., Rick-
lefs, R.E., Roy, K., Sax, D.F., Schluter, D., Sobels, J.M. &
Turelli, M. (2007) Evolution and the latitudinal diversity gradi-
ent: speciation, extinction and biogeography. Ecology Letters,
10, 315–331.Oliveira, G. & Diniz-Filho, J.A.F. (2010) Spatial patterns of ter-
restrial vertebrates richness in Brazilian semiarid, Northeastern
Brazil: selecting hypotheses and revealing constraints. Journal
of Arid Environments, 74, 1418–1426.OPS (2006) Estimaci�on cuantitativa de la enfermedad de Chagas
en las Am�ericas. OPS, Montevideo. OPS/.HDM/CD/425-06.
Patterson, J.S. & Guhl, F. (2010) Geographical distribution of
chagas disease. American Trypanosomiasis: Chagas Disease One
Hundred Years of Research (ed. by J. Telleria and M. Tibay-
rent), pp. 83–114. Elsevier, London, UK.
Pearman, P.B., Guisan, A., Broennimann, O. & Randin, C.F.
(2008) Niche dynamics in space and time. Trends in Ecology
and Evolution, 23, 149–158.Peterson, A.T. & Sober�on, J. (2012) Species distribution modeling
and ecological niche modeling: getting the concepts right. Na-
tureza & Conservac�~ao, 10, 102–107.Peterson, A.T., Sober�on, J., Pearson, R.G., Anderson, R.P.,
Mart�ınez-Meyer, E., Nakamura, M. & Ara�ujo, M.B. (2011)
Ecological Niches and Geographic Distributions. Princeton Uni-
versity Press, Princeton, New Jersey.
Rabinovich, J.E., Kitron, U., Obed, Y., Yoshioka, M., Gottden-
ker, N. & Chaves, L.F. (2011) Ecological patterns of blood-
feeding by kissing-bugs (Hemiptera: Reduviidae: Triatominae).
Mem�orias do Instituto Oswaldo Cruz, 106, 479–494.Rangel, T.F. & Diniz-Filho, J.A.F. (2005) An evolutionary toler-
ance model explaning spatial patterns in species richness under
environmental gradients and geometric constraints. Ecography,
28, 253–263.
Rangel, T.F., Diniz-Filho, J.A.F. & Bini, L.M. (2006) Towards
an integrated computational tool for spatial analysis in macroe-
cology and biogeography. Global Ecology and Biogeography,
15, 321–327.Rangel, T.F.L.V.B., Diniz-Filho, J.A.F. & Bini, L.M. (2010)
SAM: a comprehensive application for Spatial Analysis in
Macroecology. Ecography, 33, 1–5.Rangel, T.F.L.V.B., Diniz-Filho, J.A.F. & Colwell, R.K. (2007)
Species richness and evolutionary niche dynamics: a spatial pat-
tern–oriented simulation experiment. American Naturalist, 170,
602–616.Rangel, T.F. & Loyola, R.D. (2012) Labeling ecological niche
models. Natureza & Conservac�~ao, 10, 119–126.Rodriguero, M.S. & Gorla, D.E. (2004) Latitudinal gradient in
species richness of the New World Triatominae (Reduviidae).
Global Ecology and Biogeography, 13, 75–84.Rodr�ıguez, M.A., Belmontes, J.A. & Hawkins, B.A. (2005)
Energy, water and large-scale patterns of reptile and amphibian
species richness in Europe. Acta Oecologica, 28, 65–70.Schilman, P.E. & Lazzari, C.R. (2004) Temperature preference in
Rhodnius prolixus, effects and possible consequences. Acta
Tropica, 90, 115–122.Schofield, C.J. (1980) Density regulation of domestic populations
of Triatoma infestans in Brazil. Transactions of the Royal Soci-
ety of Tropical Medicine and Hygiene, 74, 761–769.Schofield, C.J. & Galvao, C. (2009) Classification, evolution, and
species groups within the Triatominae. Acta Tropica, 110, 88–100.
Terribile, L.C., Diniz-Filho, J.A.F., Rodr�ıguez, M.A. & Rangel,
T.F.L.V.B. (2009) Richness patterns, species distribution mod-
els and the principle of extreme deconstruction. Global Ecology
& Biogeography, 18, 123–136.Wiens, J.J. & Donoghue, M.J. (2004) Historical biogeography,
ecology, and species richness. Trends in Ecology & Evolution,
19, 639–644.Wiens, J.J., Ackerly, D.D., Allen, A.P., Anacker, B.L., Buckley,
L.B., Cornell, H.V., Damschen, E. I., Davies, T.J., Grytnes,
J.-A., Harrison, S.P., Hawkins, B.A., Holt, R.D., McCain,
C.M. & Stephens, P.R. (2010) Niche conservatism as an emerg-
ing principle in ecology and conservation biology. Ecology Let-
ters, 13, 1310–1324.
Accepted 11 January 2013
Editor: Simon R. Leather
Associate editor: Jorge M. Lobo
� 2013 The Royal Entomological Society, Insect Conservation and Diversity
Geographical patterns of triatomine diversity 11


