Embed Size (px)
Citation preview

GEOMAGNETIC FIELD VARIATIONS AS DETERMINED FROMBULGARIAN ARCHAEOMAGNETIC DATA. PART II: THE LAST 8000
YEARS
MARY KOVACHEVA, NELI JORDANOVA and VASSIL KARLOUKOVSKIGeophysical Institute, bl. 3, Acad. Bonchev str., 1113 Sofia
Abstract. The knowledge about past secular variations of the geomagnetic field is achieved on thebasis of archaeomagnetic researches of which the Bulgarian studies form an extended data set. InPart I (Kovacheva and Toshkov, 1994), the methodology used in the Sofia palaeomagnetic laboratorywas described and the secular variation curves for the last 2000 years were shown. In Part II (thispaper), the basic characteristics of the prehistoric materials used in the archaeomagnetic studies areemphasised, particularly in the context of the rock magnetic studies used in connection with palaeoin-tensity determinations. The results of magnetic anisotropy studies of the prehistoric ovens and otherfired structures are summarised, including the anisotropy correction of the palaeointensity results forprehistoric materials, different from bricks and pottery. Curves of the direction and intensity of thegeomagnetic field during the last 8000 years in Bulgaria are given. The available directional andintensity values have been used to calculate the variation curve of the virtual dipole moment (VDM)for the last 8000 years based on different time interval averages. The path of virtual geomagneticpole (VGP) positions is discussed.
Keywords: Archaeomagnetism, secular variations, rock-magnetic properties, prehistory
1. Introduction
Geomagnetic field behaviour prior to the availability of direct measurements canbe determined from archaeomagnetic and palaeomagnetic studies. These can becarried out on different materials: archaeological artefacts, dated lava flows, lakeor marine sediments. Each of these has its own advantages and disadvantages.Archaeological artefacts and lava flows are more or less reliable for dating butprovide only spot readings of the direction and intensity of the geomagnetic field. Incontrast, sediments provide continuous records of the secular variation in directionat one site, but absolute dating of their features based on the sedimentation ratesis not always reliable and estimates of only relative palaeointensity changes canbe determined from sediments (Levi and Banerjee, 1976; King et al., 1983). Inall these materials, recovery of past directional changes of the geomagnetic fieldis much easier than the determination of past absolute intensities (Chauvin et al.,1991). Consequently, archaeomagnetic studies of direction are much more abun-dant than those for palaeointensity (Daly and Le Goff, 1996). The difficulties inarchaeointensity determination lead each laboratory to elaborate stringent criteria
Surveys in Geophysics19: 431–460, 1998.© 1998Kluwer Academic Publishers. Printed in the Netherlands.

432 MARY KOVACHEVA ET AL.
for acceptance or rejection of individual experimental results (Aitken et al., 1986;Kovacheva and Kanarchev, 1986; Kovacheva and Toshkov, 1994). Considerableeffort has lately been given to develop acceptance-rejection criteria for the materialto be used in archaeointensity determination on the basis of rock-magnetic studies(Cui and Verosub, 1995; Cui et al., 1997; Jordanova et al., 1997), but no definitesolution has been achieved so far.
For elucidation of the geomagnetic field secular variation, reliable sets of dataof the complete vector – inclination (I), declination (D) and past field intensity arebadly needed.
This review summarizes the present stage of the long experience in archaeomag-netism of the Sofia palaeomagnetic laboratory, which includes studies that supplya longer, almost continuous record during the prehistoric past than is availableelsewhere. As such, it is an extension of Part I (Kovacheva and Toshkov, 1994),where only the last 2000 years were considered. The older data discussed here havebeen revised several times (Kovacheva, 1980; Kovacheva and Kanarchev, 1986;Kovacheva, 1992; Kovacheva, 1997) with the aim of providing an increasinglycomplete history of variations of the geomagnetic field vector. The older data arefurther improved here and new data added. In particular, new rock-magnetic stud-ies are considered in assessing the reliability of the palaeointensity determinations(Cui et al., 1997; Jordanova et al., 1997). The entire local database, covering thedirection and intensity determinations of the past geomagnetic field during the last8000 years is given in Kovacheva (1997).
2. Basic Characteristics of the Material Used in Archaeomagnetic Studiesfrom the Prehistoric Past
The material used for archaeomagnetic studies of the prehistoric past is baked clay,sampled from oven plasters, burnt house floors, fire destruction remains and burntlayers after an ancient fire. Such material is completely random in the sense thatthe clay has not been specially chosen for its quality as is the case of bricks andparticularly pottery. Consequently, coarse particles are likely to be present, whichcan be in a multidomain state. A second characteristic is that such material is oftennot completely burnt. Thirdly, being old, it is likely to be more weathered (Barbettiet al., 1977) and buried in the earth for far longer so that coarse iron oxyhydroxidegrains are also probably present (Sigalas et al., 1978). These characteristics meanthat archaeomagnetic materials from prehistoric time are more likely to have acomplex mineralogy than those from the recent past. This complex mineralogymakes the determination of the ancient geomagnetic field intensity more difficultand sometimes impossible. At the same time, the determination of the directionalvalues remains relatively easy because almost all the features sampled are still insitu. There is only one additional peculiarity connected with the directional results:many prehistoric ovens often have some tilt towards their entrance, which the ar-
GEOMAGNETIC FIELD VARIATIONS 433
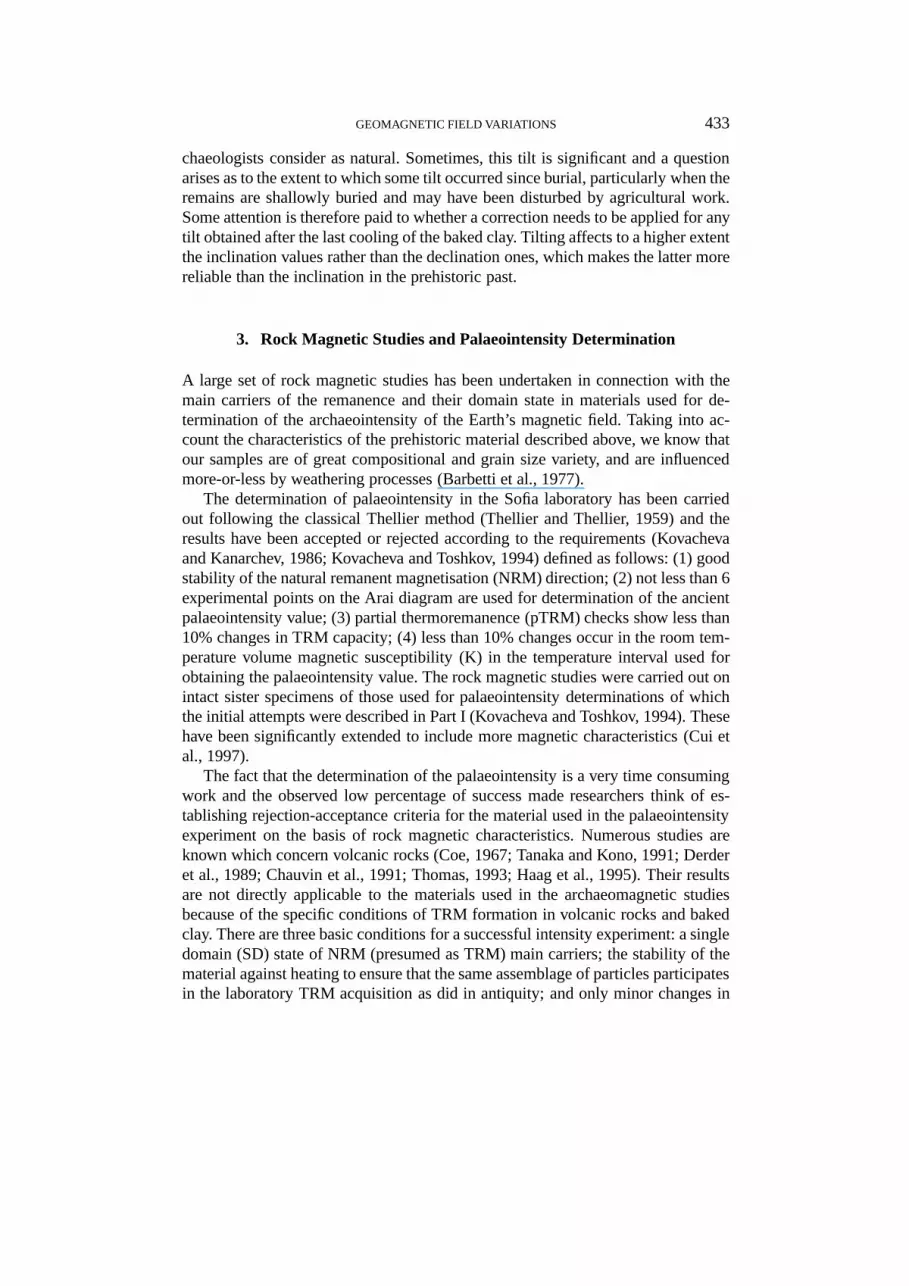
chaeologists consider as natural. Sometimes, this tilt is significant and a questionarises as to the extent to which some tilt occurred since burial, particularly when theremains are shallowly buried and may have been disturbed by agricultural work.Some attention is therefore paid to whether a correction needs to be applied for anytilt obtained after the last cooling of the baked clay. Tilting affects to a higher extentthe inclination values rather than the declination ones, which makes the latter morereliable than the inclination in the prehistoric past.
3. Rock Magnetic Studies and Palaeointensity Determination
A large set of rock magnetic studies has been undertaken in connection with themain carriers of the remanence and their domain state in materials used for de-termination of the archaeointensity of the Earth’s magnetic field. Taking into ac-count the characteristics of the prehistoric material described above, we know thatour samples are of great compositional and grain size variety, and are influencedmore-or-less by weathering processes (Barbetti et al., 1977).
The determination of palaeointensity in the Sofia laboratory has been carriedout following the classical Thellier method (Thellier and Thellier, 1959) and theresults have been accepted or rejected according to the requirements (Kovachevaand Kanarchev, 1986; Kovacheva and Toshkov, 1994) defined as follows: (1) goodstability of the natural remanent magnetisation (NRM) direction; (2) not less than 6experimental points on the Arai diagram are used for determination of the ancientpalaeointensity value; (3) partial thermoremanence (pTRM) checks show less than10% changes in TRM capacity; (4) less than 10% changes occur in the room tem-perature volume magnetic susceptibility (K) in the temperature interval used forobtaining the palaeointensity value. The rock magnetic studies were carried out onintact sister specimens of those used for palaeointensity determinations of whichthe initial attempts were described in Part I (Kovacheva and Toshkov, 1994). Thesehave been significantly extended to include more magnetic characteristics (Cui etal., 1997).
The fact that the determination of the palaeointensity is a very time consumingwork and the observed low percentage of success made researchers think of es-tablishing rejection-acceptance criteria for the material used in the palaeointensityexperiment on the basis of rock magnetic characteristics. Numerous studies areknown which concern volcanic rocks (Coe, 1967; Tanaka and Kono, 1991; Derderet al., 1989; Chauvin et al., 1991; Thomas, 1993; Haag et al., 1995). Their resultsare not directly applicable to the materials used in the archaeomagnetic studiesbecause of the specific conditions of TRM formation in volcanic rocks and bakedclay. There are three basic conditions for a successful intensity experiment: a singledomain (SD) state of NRM (presumed as TRM) main carriers; the stability of thematerial against heating to ensure that the same assemblage of particles participatesin the laboratory TRM acquisition as did in antiquity; and only minor changes in

434 MARY KOVACHEVA ET AL.
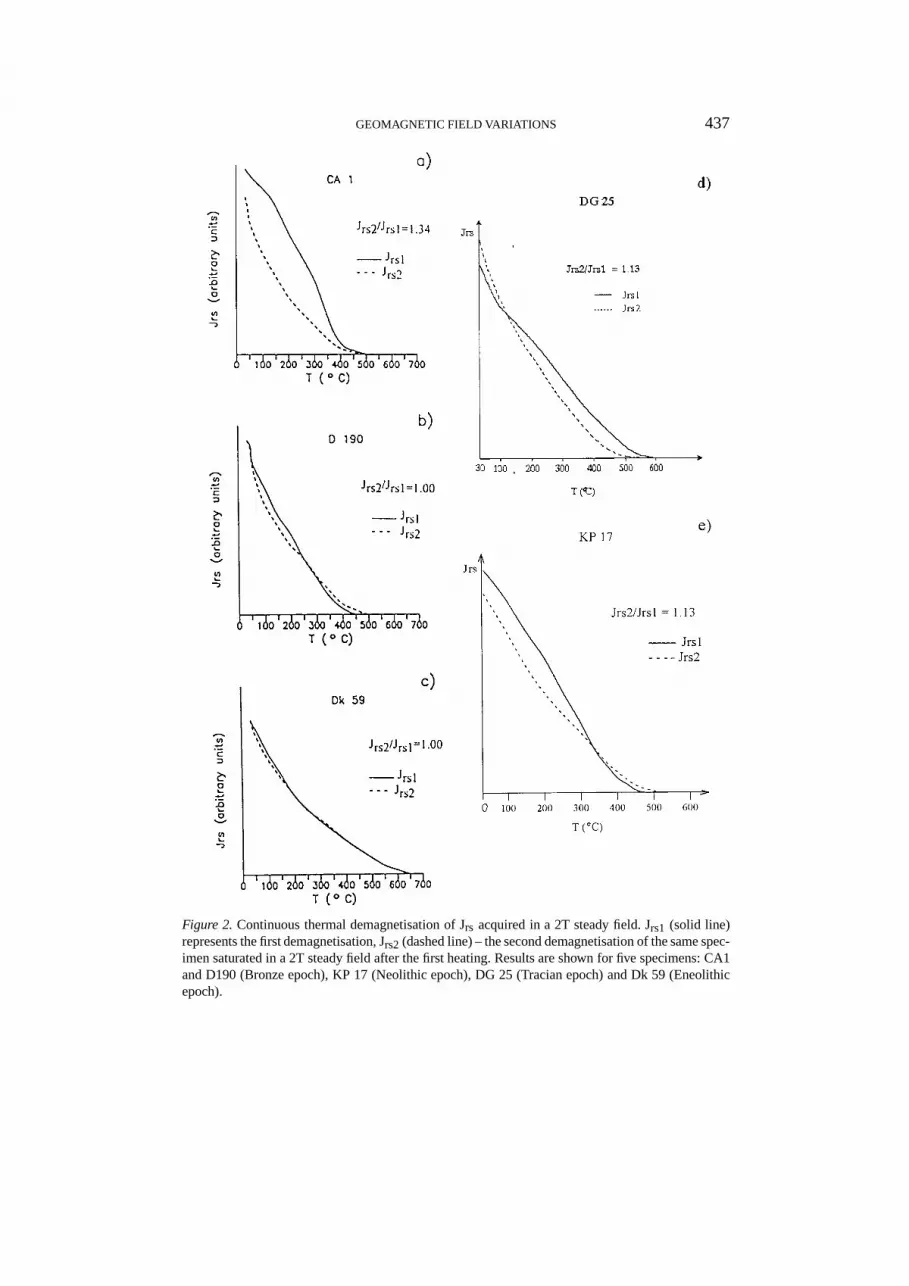
the mineralogy after the last prehistoric heating (during the buried time). Some pa-pers have appeared recently that are concerned with the rock magnetic properties ofarchaeological materials used for palaeointensity determinations. Cui and Verosub(1995) examined the rock magnetic properties of Egyptian and Athenian potterysamples previously studied by M.J. Aitken in the Oxford laboratory. These sampleshave been classified as “bad” or “good” according to the criteria for acceptanceof the experimental result (Aitken et al., 1986; Aitken et al., 1988). The authorsfound a linear relationship (Figure 1a) between the frequency-dependent suscep-tibility (χfd) and median destructive temperature (MDT), and concluded that thepresence of super paramagnetic (SP) particles in the samples did not prevent thesuccessful determination of the palaeointensity when a broad spectrum of blockingtemperatures is observed. The latter also proves the presence of particles with a sizein the limits of super-paramagnetic – single domain state (SP/SD) up to pseudo-single domain state (PSD). We decided to examine the same relationship in a largerBulgarian collection of samples studied in Cui et al. (1997). The results are shownin Figure 1b. Figure 1a is for pottery samples all of the BC period, whereas Figure1b shows results from samples from prehistoric ovens and burnt floors as wellas samples from bricks and furnaces of the AD period. No systematic relation-ship betweenχfd and MDT is observed in Figure 1b. Our explanation is that thematerial in the second collection has much more complex magnetic mineralogyand a broader grain-size distribution than pottery made with well-chosen fine clay(Figure 1a). To illustrate the great variety of magnetic phases in the prehistoricmaterial other than pottery, the results of thermal demagnetisation of saturationremanence (Jrs) induced twice in a magnetic field of 2T in representative speci-mens from five sites are shown in Figure 2. The demagnetisation has been carriedout twice: first after initial saturation (Figure 2 – solid lines) and second after thesaturation of the already-heated sample. It can be seen that the mineralogy involvedas well as the grain size distribution is quite variable from site to site. For samplesCA1, KP17 and D190 it could be supposed that the main ferrimagnetic carrier istitanomagnetite, since the final unblocking temperatures vary between 400–500◦C.However, sample Dk59 showsTb ∼ 620◦C – higher than that of magnetite. Takinginto account results from supplementary rock-magnetic experiments (results notshown here), we exclude hematite as a possible carrier of magnetization. This highTb, observed on both heating curves can reflect the presence of highly oxidizedmagnetite with composition close to that of maghemite. For sample DG 25,Tb of∼570◦C points to the presence of magnetite. Final unblocking temperatures remainunchanged after the first heating (Figure 2a, b, e), while the lowTbs disappear(Figure 2b, d). Narrow unblocking temperature spectra (e.g., samples CA1, KP17)obtained during the the first demagnetisation run, becomes wider after heating -the second demagnetisation curves are concave. This points to a change in grainsize distribution and/or growth of SP garins up to stable SD sizes. Thus, the mag-netic capacity is changed (judging from Jrs2/Jrs1 ratio: 1.34 for CA1 and 1.13for KP17). At the same time, simultaneous oxidation of titanomagnetites present

GEOMAGNETIC FIELD VARIATIONS 435
is highly probable. Consequently, sample showing magnetic properties similar tothese for sample CA1 could be “difficult” for the palaeointensity determination,if the mineralogical changes initiate at low temperatures. In contrast, samples likeD190 and Dk59 show stable magnetic mineralogy during thermal treatment.
The unblocking temperatures obtained, combined with the other diagnostic ex-periments (as alternating field (AF) demagnetization) lead to the conclusion thatthe main magnetic carriers in the collections studied are mostly magnetically softmagnetite or titanomagnetites, as well as some maghemite, which is stable to hightemperatures (Osipov, 1978; Ozdemir and Banerjee, 1984; Ozdemir and Dunlop,1993; De Boer and Dekkers, 1996), iron oxyhydroxides, which are a product ofweathering, and, very rarely, hematite. This conclusion coincides with that of Evansand Jiang (1996) for other archaeomagnetic material, although the presence ofmaghemite and iron oxyhydroxides was not identified by those authors in the softand hard components respectively. This is understandable because of the similarityof the coercivity spectra of maghemite and magnetite (De Boer and Dekkers, 1996).Figure 3 shows examples of thermal demagnetisation of three-component isother-mal laboratory induced magnetisations (IRM) (Lowrie, 1990), which confirm theabove statement of the predominance of magnetically soft magnetite or titanomag-netites in different prehistoric materials. They also indicate a very high variationin actual composition and grain size, taking into account the relative contributionof the intermediate and hard components which varies for the different samples.Low unblocking temperatures in the soft component (Figure 3) is probably dueto the unblocking of some coarse (MD) particles or maghemite that are unstableto heating. The high unblocking temperatures,Tb > 600◦C, observed on the softand intermediate IRM components (Figure 3a, b – samples D 180b and Dk 31v)are probably due to maghemite, which is stable with respect to inversion. If sucha stable maghemite is of secondary origin (such as weathering processes after theTRM acquisition), then its persistence throughout the entire experiment could bea serious problem for the palaeointensity determination. It should be noted thatthe “low” limit of the hard component is quite a weak magnetic field (0.27T),so some high coercivity magnetite might be included in this component. If so, itcan dominate the demagnetisation of the magnetically weaker hematite and ironoxyhydroxides, normally included in the hard component of composite 3-axesmagnetisation.
The materials studied show mostly SD behaviour on the classification by Dun-lop (1983) based on the Lowrie and Fuller (1971) test. The cases with multidomain(MD) behaviour are not common when the cases of the so called bimodal or mixedbehaviour are quite frequent. The latter further confirms the presence of a mixtureof particles with very different sizes – as also concluded by Evans and Jiang (1996).Hysteresis studies frequently show wasp-wasted hysteresis curves which can beexplained by mixture of SP and SD particles, SD and MD particles, or mineralswith contrasting coercivities (Roberts et al., 1995). The combined use of the resultsof the Lowrie and Fuller test and the commonly used hysteresis parameters - the

436 MARY KOVACHEVA ET AL.
Figure 1.Relationship between frequency-dependent susceptibility (χfd) and the median destructivetemperature (MDT): (a) the pottery samples (reprinted from Physics of the Earth and PlanetaryInteriors 91, 1995, Cui and Verosub: A mineral magnetic study of some pottery samples: possibleimplications for a sample selection in archaeointensity studies, Figure 8, p. 268 with kind permissionof Elsevier Science – Nl, Sara Burgerhartstraat 25, 1055 KV Amsterdam, the Netherlands): a1, a2and a3 – “bad”, b1, b2 and b3 – “good”; (b) the Bulgarian historic and prehistoric samples. Thevalues ofχfd and MDT are taken from Table 2 of Cui et al., 1997 and their qualification as “bad” (×)or “good” (#) is according to the criteria of the Sofia laboratory.
GEOMAGNETIC FIELD VARIATIONS 437
Figure 2.Continuous thermal demagnetisation of Jrs acquired in a 2T steady field. Jrs1 (solid line)represents the first demagnetisation, Jrs2(dashed line) – the second demagnetisation of the same spec-imen saturated in a 2T steady field after the first heating. Results are shown for five specimens: CA1and D190 (Bronze epoch), KP 17 (Neolithic epoch), DG 25 (Tracian epoch) and Dk 59 (Eneolithicepoch).

438 MARY KOVACHEVA ET AL.
Figure 3. Examples of stepwise thermal demagnetisation of composed 3-axis laboratory- inducedIRM. The inducing magnetic fields used are shown in the right hand corners of the graphs.
ratios of saturation remanence to saturation magnetisation (Jrs/Js) and remanencecoercivity to coercivity (Hcr/Hc) – as diagnostic of the material domain state (Dayet al., 1977) often show contradictory results. This can be explained by the presenceof high coercivity carriers, which might invalidate the Lowrie and Fuller test (Xuand Dunlop, 1995). It can be concluded that the hysteresis parameters alone donot give unambiguous information about the domain state of the ferromagneticparticles. The presence of wasp-wasted hysteresis loops (WWL) connected withthe failure of Thellier experiment in the collection investigated in Cui et al. (1997)is due most probably to the presence of high coercivity iron oxyhydroxides together

GEOMAGNETIC FIELD VARIATIONS 439
with the main magnetically soft carriers of TRM. On the other hand, the WWLsin the collection studied by Jordanova et al. (1997) can be attributed mostly tothe contribution of SP particles, which do not interfere to such an extent with thesuccess of the Thellier experiment (Pick and Tauxe, 1993).
Going further in our studies of rock magnetic properties of prehistoric materialin connection with the archaeointensity determination, extensive work has beendone in the Sofia laboratory by one of the authors of this paper (Jordanova, 1996).The procedure used, similar to the method proposed by Van Velzen & Zijderveld(1992) for detecting chemical changes, consists of: (i) inducing IRM in 2 T, mea-suring both IRM and K – the initial values; (ii) heating to the temperature Ti andmeasuring the remaining IRM; (iii) re-inducing IRM(2T) and measuring it andK; and (iv) repeating the steps (ii) and (iii) for each successive temperature. Asister specimen of each of these specimens, subjected to the above procedure, wasgiven an IRM in a field of 2T and was only subjected to stepwise thermal de-magnetisation. The comparison of the decay curves of IRM of the sister specimenwith the part of the re-induced IRM remaining after each heating step was usedto detect whether a new magnetic mineral, that carries remanent magnetisationoriginated during heating (Jordanova et al., 1997). For example, in Figure 4 weshow the results from the above procedure for detection of mineralogical changesin samples during heating. The curve of re-induced magnetisation (Figure 4a,b,c,d– top, solid diamonds) reflects the contribution from both newly-formed magneticphases and the ferromagnetic phases initially present. This curve can give evidenceof the creation of new magnetic grains which grow up to stable SD sizes, or whichare the result of chemical transformations. The curve of remaining SIRM (Figure4a, b, c, d – bottom, solid squares) reflects also the contribution both of the newly-formed magnetic phases, but only those havingTb higher than the temperaturestep, and of the ferrimagnetic phases initially present. When comparing this curvewith the thermal decay curve of IRM (Figure 4a, b, c, d – bottom, open squares)induced only once to a sister specimen before heating steps, we can detect thechanges in the magnetic fraction capable of carrying stable remanence. Significantchanges are seen in the case of specimens Gv 5 and 2270 (Figure 4a, b). They aremore pronounced in 2270, where considerable changes occur in K and SIRM (2T)induced at each step even at low temperatures. The important difference betweenthe two IRM curves (the one induced before heating and the remaining SIRMre-induced at a previous temperature step) indicates the formation of a new fer-rimagnetic phase capable to carry a remanence. Particles growing from SP to astable SD state can contribute to the additional remanence. This supposition issupported also by the opposite trend in K and SIRM re-induced (Figure 4b – top),where K decreases (smaller SP contribution), when SIRM increases (increase ofthe quantity of particles carrying the remanence). The chemical changes are alsovery probable at the very beginning of the heating procedure. The final productof all changes is a ferrimagnetic phase with a highTb (>600◦C), which can behematite or stable-to-inversion maghemite.

440 MARY KOVACHEVA ET AL.
Figure 4.Results from the IRM method applied to detect mineralogical changes during laboratoryheatings. Solid diamonds are the IRM, induced in 2T, after each temperature step; open diamonds arethe room temperature magnetic susceptibility K; solid squares are the IRM remaining after heating;open squares are thermal demagnetisation of IRM(2T), induced only once before heatings in a sisterspecimen.

GEOMAGNETIC FIELD VARIATIONS 441
The importance of the described procedure for detecting possible mineralogicalchanges which cause the failure of the intensity experiment is seen by the followingexamples. The result from the specimen subjected to Thellier experiment (shownin Figure 5b) has been discarded according to the criteria of the laboratory. Thechange in the mineralogy and grain size distribution demonstrated by the aboveIRM tests (Figure 4b) explains the cause of the failure of the intensity experiment.
The case of specimen Gv 5 is similar. There is an abrupt decrease of the IRM(Figure 4a – bottom), which indicates an important quantity of unstable particles,including some MD carriers. Note that K does not change significantly (it remainswithin 10% of its initial value), even though the difference between the two decaycurves (Figure 4a – bottom) points to changes of the magnetic capacity duringthe heating. Consequently, using only the behaviour of K during heating (Tanaka,1990; Tanaka and Kono, 1991) as a criterion can be misleading in the case ofarchaeological materials. The opposed processes are possible: as a formation ofSD particles, diminishing the presence of SP particles, which causes the decreaseof K; simultaneously the oxidation of titanomagnetites or the formation of a smallquantity of magnetite, can occur which lead to K growth. As a result, we had oftencases of failed Thellier experiments with a “good” behaviour of K during the entireheating procedure. Such is the case for the Thellier experiment of a neighbouringsample Gv 6a (Figure 5a) in which the behaviour of K could be accepted up to500◦C, while the IRM experiment proposed here shows unambiguously (Figure4a – bottom) that the magnetic capacity changes from a much lower temperature(200◦C). In a study of volcanic rocks, Schnepp (1994) also mentioned that thestability of K often is accompanied by failure of the intensity experiment.
Two examples (Figure 4c, d) show a stable mineralogy in general. The Thellierexperiments on the neighbouring samples are acceptable and good (Figure 5c, d).The change in K (Figure 4c – top) might reflect some formation (above 400◦C)of new ferrimagnetic grains which, however, do not grow up to stable SD sizes soas to carry remanent magnetization. Such a supposition is supported by the goodcoincidence of the two IRM decay curves (Figure 4c, d – bottom).
To conclude, the work done by us and other authors highlights the essentialdifference between the magnetic mineralogy of prehistoric pottery samples andthat of the baked clay from other prehistoric archaeological structures used inarchaeomagnetic studies. Screening of samples for non-ideal magnetic propertiesremains, in our opinion, a problem because of the comparable experimental timenecessary for a good examination of the behaviour of magnetic carriers, duringheating and the Thellier experiment itslef. The acceptance-rejection criteria ofthe individual experimental result must still be satisfied and internal consistencyof intensity results must also be achieved. We believe that the thorough insightinto possible processes in prehistoric archaeological material during the heatingprocedure summarised in Jordanova et al. (1997) gives a realistic picture of thedifficulties in determining palaeointensity.

442 MARY KOVACHEVA ET AL.
Figure 5.Four examples of Thellier experiments: (a) and (b) are the samples for which the Thellierresults are discarded, (c) and (d) are for those accepted. The PTRM checks are shown with dashedlines. In the upper corners, the volume magnetic susceptibility K, monitored at each temperature step,is shown. The temperature interval used for the calculation of the palaeointensity is given in bracketson the left of NRM-TRM line.

GEOMAGNETIC FIELD VARIATIONS 443
4. Anisotropy Studies
Anisotropy of magnetic susceptibility (AMS) and anisotropy of remanence havebeen well studied for archaeological samples of ceramics (Rogers et al., 1979) andbricks (Veitch et al., 1984), but only a few such studies have been made on samplestaken from ancient ovens (Jordanova et al., 1997; Kovacheva et al., in press).
AMS of all samples studied in the Sofia Laboratory has been measured using aKLY-2.02 kappa bridge (Geofyzika, Brno) and the orientation of the susceptibilityellipsoid and associated anisotropy parameters calculated using the ANISO 21 pro-gram designed by Jelinek (1981). Several studies (Stephenson et al., 1986; Potter &Stephenson, 1990 a, b; Potter & Stephenson, 1988; Jackson, 1991; Rochette et al.,1992) have shown that the shape of the susceptibility ellipsoid depends strongly onthe type of ferromagnetic particles and their domain state. For the archaeomagneticsamples studied here, the values of K vary between 3.10−3 SI and 100.10−3 SI. Forthe strongly magnetic samples, the influence of paramagnetic minerals can be ruledout, while in other cases it should be considered as well. For most of the samples,the main ferromagnetic minerals are of magnetite type and commonly show a widegrain-size spectrum. Therefore, it is expected that an intermediate fabric would beobserved (Rochette et al., 1992). Instead, the magnetic fabric obtained is stronglyrelated to the oven’s surface (Figure 6). In all cases for samples taken from differentparts of the oven’s floor, Kmin axes are in the vertical plane, while Kmax and Kint
lie in the horizontal plane which coincides with the oven’s surface (Figure 6a). Wesuppose that the magnetic fabric observed is due to an alignment of ferrimagneticgrains towards the clayey particles rather than to the actual shape of ferrimagneticgrains. An explanation for the causes of such a magnetic fabric is connected withthe way that the plaster of clay material was laid by the builder prior to the initialburning of the oven. In a few cases, the susceptibility axes are more scattered (Fig-ure 6b) probably associated with poorer plastering of the oven floor, non-indicatedin the field inclined parts of the floor, or the influence of the silicate minerals (K isin the order of (1–2)× 10−3 SI).
There are some cases when a slope of the oven is observed and is reflected inthe magnetic fabric also (Figure 7a). In most cases the slope of the surface obtainedby AMS measurements coincides well with that of the oven measured in the field.The question about the time when this inclination had taken place could be testedby comparison of the consistency of the directional results (D and I) before andafter the correction for dip of the surface, as mentioned before. Samples takenfrom archaeological features destroyed by an ancient fire (i.e. they are not found“in situ”) show a random distribution of the principal susceptibility axes (Figure7b), which means that there is no definite magnetic order in the material. In thisway, AMS measurements could be used to identify non-“in situ” samples.
AMS of selected samples was measured after heating to 700◦C also. It wasfound that generally no changes in orientation of susceptibility axes occur (Ta-ble I), no matter how strong the changes in K. We suppose that this observation

444 MARY KOVACHEVA ET AL.
Figure 6. Stereographic projection of the principle axes of the magnetic susceptibility ellipsoid:(a) an example of most frequent distribution for the oven’s surface (samples Gv33–Gv53 from anEarly Bronze Age site); (b) an example of a rarely found distribution for the oven’s surface (samples2231–2240 from a Thracian altar).

GEOMAGNETIC FIELD VARIATIONS 445
Figure 7.Stereographic projection of the principle axes of the magnetic susceptibility ellipsoid: (a)an example of a inclined oven’s surface (samples D232–D247 from a Bronze Age site); (b) exampleof a completely random distribution, proving that the samples have been collected from destructionremains and were no longerin situ.

446 MARY KOVACHEVA ET AL.
TABLE I
Directions of the principal susceptibility axes of the AMS ellipsoids, before and afterheating up to 700◦C
Sample No. Treatment K× 10-6 SI Kmax Kint Kmin
D I D I D I
Before heating 7886.5 206 5 297 3 56 84Dk 31 g After heating 6903.2 177 2 267 5 61 85
Before heating 9265.6 63 0 153 2 327 88Dk 33 v After heating 8862.4 248 0 338 1 138 89
Before heating 9466.5 212 5 120 9 315 71Dk 36 a After heating 8500.7 211 6 119 19 318 70
Before heating 9536.9 10 1 280 14 102 76Dk 40 a After heating 6353.2 193 3 283 1 112 87
Before heating 9362.3 13 0 283 3 104 87Dk 42 b After heating 6507.8 10 1 280 3 112 87
Before heating 3319.3 287 1 197 10 23 80Dk 46 b After heating 2958.5 109 1 199 7 10 83
Before heating 7666.5 204 6 294 6 70 82Dk 53 After heating 6926.5 213 6 303 3 55 83
Before heating 775.4 308 7 218 4 99 83Dk 55 After heating 592.6 297 8 207 2 100 82
Before heating 14884.5 272 6 3 3 120 83Dk 59 a After heating 13201.5 270 5 0 0 90 85
Before heating 20770.6 119 1 29 4 228 86Dk 79 After heating 14584.9 126 0 36 3 224 87
Before heating 1320.0 4 18 97 10 216 69CA 5 After heating 2122.0 357 17 88 16 219 66
Before healing 1955.0 157 9 250 17 40 70CA 8 After heating 2683.0 168 12 261 14 40 71
Before heating 3731.0 292 5 201 15 42 74CA 11 After heating 4453.0 306 4 215 15 50 74
demonstrates the importance of silicate particles controlling the magnetic fabricof the burnt clay. It can be supposed that the newly formed ferromagnetic phasesretain the shape of the mother phase and/or the new ferromagnetic grains grown areconstrained by the inherited texture determined by the silicate matrix. The degreeof anisotropy P′ for the samples belonging to different collections varies in therange 1.02–1.05, and only in a few cases reaches 1.08–1.15. The shape factor T(Jelinek, 1981), which reflects the shape of the ellipsoid, shows positive values(T > 0), i.e. oblate. Samples from some sites are characterised by almost disc-likeshape of the susceptibility ellipsoid (T = 0.8–0.9) while for the samples from others

GEOMAGNETIC FIELD VARIATIONS 447
it is closer to neutral (T = 0.2–0.3). The strongly oblate fabric probably indicates avery well-worked clay before the initial burning.
The sources of anisotropy of remanence are ferrimagnetic particles only, unlikethe case for magnetic susceptibility (Jackson, 1991; Rochette et al., 1992) and themaximum principal axis is always directed along the particle’s long axis. In thissense, it is easier to determine the reasons for the observed shape of the rema-nence ellipsoid. The remanence ellipsoid was obtained for 38 specimens usingthe isothermal remanence (IRM) and the method proposed by Stephenson et al.(1986). A field of 30 mT or 60 mT was applied along the sample’s three axesin turn. In no cases did the anisotropy ellipsoids of K and IRM coincide, neitheris there any relationship between the directions of the Kmax and IRMmin axes, asexpected for elongated SD particles (Potter & Stephenson, 1988). The obviousnon coincidence between the principle directions of the ellipsoids of AMS andanisotropy ellipsoids of IRM confirms that the remanences are not associated withsignificant quantities of MD particles. This is an important indirect conclusion inconnection with the palaeointensity determination. The orientation of the IRM-ellipsoid is not affected by the mechanical forces that aligned the grains carryingthe susceptibility ellipsoid. We suppose that it is due to the near neutral shape ofthe ferrimagnetic grains, although the accuracy of the evaluation of the principalaxes directions should be checked. It is usually considered that the principal axesof the IRM ellipsoid coincide with those of the TRM ellipsoid (Stephenson et al.,1986). To make a correction of the palaeointensity value obtained by the classicalThellier method, a correction factor (f) was calculated using the method proposedby Veitch et al. (1984) but slightly modified (Jordanova et al., 1995; Kovacheva etal., in press). Instead of using a TRM-ellipsoid and a laboratory field of the Thellierexperiment, we take the IRM-ellipsoid and the laboratory field (its direction wasmeasured by a 3-component fluxgate). The correction factor was calculated as aratio between the IRM induced in a direction of the laboratory field of the Thellierexperiment (unit vectorl) and the IRM, induced in a direction of NRM (unit vectorh), i.e. f = |KRl| / |KRh|, where KR is the IRM-tensor. The f-values obtainedvary between 0.3% and 5%. Clearly the correction is not big - generally about 2–5% and only in one on the 28 samples studied did it reach 15%. The correctedpalaeointensity values (Facorr. = f. Fa) show either more consistent results (i.e. thestandard deviation of the Facorr is less than that for Fa) or practically no changesof the results (Table II). Therefore, as it was also shown by Veitch et al. (1984),the anisotropy correction for archaeomagnetic samples is a small but an importantfactor for obtaining high quality palaeointensity results.

448 MARY KOVACHEVA ET AL.
TABLE II
Anisotropy corrections to the geomagnetic field palaeointensity determinations
SITE Sample FA/FD s f FA/FD xf (FA/FD)aver (FA/FDxf) aver
No ± standard dev.± standard dev.
Durankulak Dk 59 b 0.953 0.013 0.992 0.945
Dk 68 a 1.060 0.027 0.993 1.053 0.977± 0.056 0.980± 0.069
Dk 71 b 0.887 0.033 1.011 0.897
Dk 90 v 1.059 0.027 1.053 1.115
Madrec M3 a 0.883 0.035 1.022 0.902
M4 a 0.909 0.033 0.997 0.906 0.897± 0.013 0.904± 0.002
M23 v 1.120 0.048 0.983 1.101 1.069± 0.049 1.081± 0.020
M29 g 1.021 0.047 1.039 1.061
2115a 1.464 0.111 1.000 1.464
Isperih 2122b 1.576 0.072 1.001 1.578 1.567± 0.048 1.571± 0.047
2124b 1.630 0.045 1.003 1.635
2125a 1.580 0.030 0.996 1.574
2127a 1.496 0.040 1.009 1.509
2134a 1.589 0.064 1.020 1.621
D 144a 0 876 0.049 0.985 0.863 0.840± 0.019 0.848± 0.008
D 145b 0.830 0.026 1.017 0.844
Djadovo D150b 0.703 0.034 1.145 0.805 0.844± 0.178 0.903± 0.124
D 153 1.069 0.043 0.992 1.060
D 174 v 0.851 0.019 1.016 0.865 0.863± 0.026 0.877± 0.027
D 192a 0.920 0.041 1.009 0.935
CA 52a 1.228 0.047 1.003 1.232
Sarovka CA 54b 1.198 0.060 0.970 1.162 1.157± 0.026 1.134± 0.034
CA 57a 1.146 0.016 0.978 1.121
2141b 2.045 0.145 1.022 2.090
2144b 1.681 0.039 1.037 1.743 1.616± 0.102 1.612± 0.104
Blagoevgrad 2145a 1.550 0.061 1.027 1.592
2149v 1.68 0.033 0.943 1.584
2151a 1.496 0.034 1.018 1.523

GEOMAGNETIC FIELD VARIATIONS 449
Figure 8.The distribution of the Bulgarian archaeological sites used. Different symbols correspondto different dating intervals.
5. Organisation of a Local Database
The database and its structure described in Part I of this paper (Kovacheva andToshkov, 1994) has been modified, excluding the fields for which we have noinformation. The new structure is shown in Table III.
Numerous archaeological sites from Bulgaria have been archaeomagneticallystudied (Figure 8). Different symbols in this Figure correspond to different datingintervals. Several sites, dated in the same dating interval, are often hidden behindone symbol. Several revisions and up-dates of the Bulgarian database have beenperformed. The latest is in Kovacheva (1997), where all determinations can befound.
6. Secular Variation Curves
As previously stated (Kovacheva and Toshkov, 1994), the ultimate aim of this studyis to construct long-term reliable secular variation curves of the three geomagneticelements. It is not easy to find a good sequence of well dated material, without time-gaps for any given territory. In spite of the large number of sites studied, there areseveral major difficulties remain for deriving reliable secular variation curves. Ingeneral, the archaeological sites suffer from the absence of precise dating. As men-

450 MARY KOVACHEVA ET AL.
TABLE III
The structure of the local database. 1-LABNO is the feature number – “Feature is a volume ofmaterial that can be considered to have been magnetised at the same time” (Tarling, 1983); 2 and3-SLAT and SLONG are the geographic latitude and longitude for the feature location; 4-COUNTRYis the country; 5-PLACE is name of the site location; 6-SITE_HORIZON: site is the archaeologicalarea and for the AD period mostly meets the meaning of feature, but for the BC period, differentfeatures with different LABNO correspond to different excavating horizons in a multilevel tells;7-MATERIAL is coded as: BR for brick; BC for baked clay; HR for a heart or oven; KL for a kilnor furnace; MI for miscellaneous; 8-LOMAGAGE is the most ancient of the age range; 9-HIMA-GAGE is the more recent limit of the age range; 10-DTPOINT is the middle of the dating range towhich the available results are associated; 11-NDIR is the number of samples used to compute thefeature’s average direction; 12-DEC is the average declination; 13-INC is the average inclination;14-ALPHA95 is the precision (α95; Fisher, 1953) for the feature presented with both the declinationand inclination; for I results (no data for D), standard deviation (s) stands instead ofα95 (Kovachevaand Toshkov, 1994); 15- NOPI is the number of samples studied; 16-NPI is the number of the resultsaccepted to compute the average palaeointensity; 17-PI is the weighted average palaeointensity inSI units (Kovacheva and Kanarchev, 1986); 18-STDPI is the standard deviation of the weightedaverage palaeointensity; 19-PI_PIDIPOL is the normalised palaeointensity result to the dipole valuefor the corresponding geographical latitude (Creer et al., 1983); 20-FIELDNUMBER consists offield numbers of the samples of the corresponding feature; 21-DATING describes the used methodfor dating
Num Field name Field type Width Dec Index
1 LABNO Numeric 10 0 N
2 SLAT Numeric 5 2 N
3 SLONG Numeric 5 2 N
4 COUNTRY Character 13 N
5 PLACE Character 20 N
6 SITE_HORIZ Character 45 N
7 MATERIAL Character 8 N
8 LOMAGAGE Numeric 6 0 N
9 HIMAGAGE Numeric 6 0 N
10 DTPOINT Numeric 8 1 N
11 NDIR Numeric 3 0 N
12 DEC Numeric 6 2 N
13 INC Numeric 6 2 N
14 ALFA95 Numeric 5 2 N
15 NOPI Numeric 3 0 N
16 NPI Numeric 3 0 N
17 PI Numeric 6 2 N
18 STDPI Numeric 5 2 N
19 P1_PIDIPOL Numeric 5 3 N
20 FLDNUMBER Character 25 N
21 DATING Character 20 N

GEOMAGNETIC FIELD VARIATIONS 451
tioned in Part I, a deficiency of data, especially for the declination in the AD period,still remains. As far as the prehistoric period of time is concerned, one of the prob-lems is the contradictions in the calibrated14C dates (Boyadziev, 1995; Kovacheva,1995), especially for the Eneolithic period in Bulgaria (ca 5000–4000 BC). For thisperiod, the well-established relative chronology of prehistoric cultures and mostlythe numerous multilevel sites studied with a clear vertical stratigraphy greatlyhelped the chronological arrangement of the data on an absolute scale of time.It must also be emphasised that there are still methodological difficulties in thepalaeointensity determinations (Jordanova et al., 1997; Cui et al., 1997). Usingthe algorithm described in Part I of the paper (Kovacheva and Toshkov, 1994),all our Bulgarian data (Kovacheva, 1997) have been averaged and smoothed. The100-year weighted averages of site results are calculated taking into account theuncertainty of both dating and experimental errors. The smoothing is made using100-year overlapping windows with a step of 25 years. The secular variation curvesobtained are shown in Fig.9. The inclination and declination directions vary aroundthe present day values for Bulgaria for the last 3000 years (I(1988.5) = 59.7◦ shownwith the horizontal line in Figure 9a). For the more remote past the inclination val-ues remain generally shallower than the present day value. Kovacheva and Toshkov(1994) note the tendency of variations of inclination and declination to be in anti-phase to each other for most of the last 2000 years. This tendency is valid alsofor the more distant past, i.e. the declination is most easterly when the inclinationis shallowest and vice-versa (Figure 9a, b). Regarding intensity (Figure 9c), thevariations with shorter characteristic times are superimposed over a long periodvariation. The intensity shows an increase from the most remote past to around 500BC, after which it has tended to decrease. There is weak evidence for an overallquasi-cyclical variation with a period of the order of 104 years. Two gaps still occurin the record (3700–3200 BC and ca. 1400 BC).
7. Virtual Dipole Moment
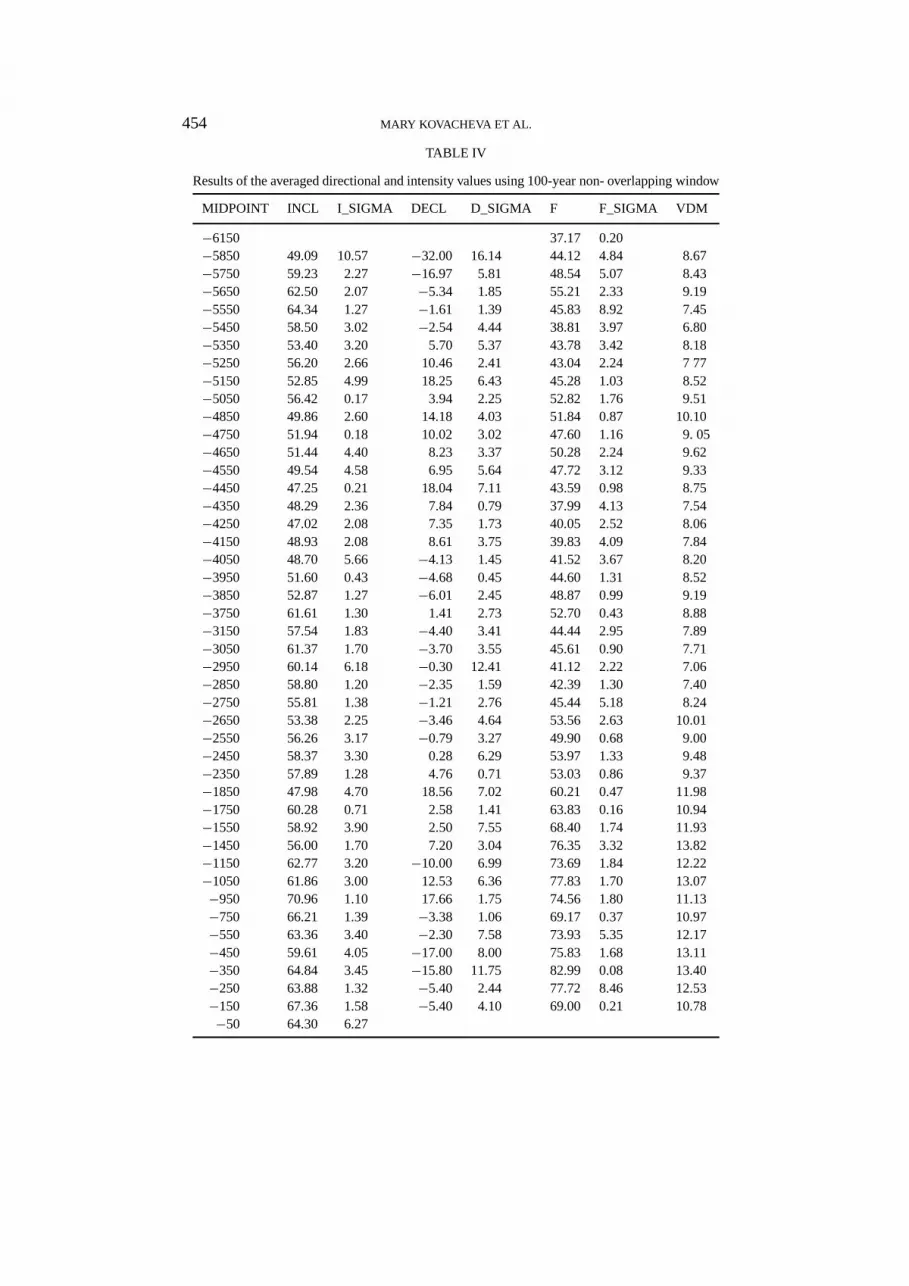
The virtual dipole moment (VDM) variation of the geomagnetic field encompassesboth the changes in the Earth’s dipole moment and a contribution from the non-dipole field when calculated with a window of 100 years (Table IV last column– here the non-overlapping windows are used). The advantage of VDM presenta-tion of the geomagnetic field variation is that wobble of the main dipole does notintroduce a scatter. Global archaeomagnetic intensity data have been analysed byMcElhinny and Senanayake (1982) using the largest data set available at that time.They found the mean dipole moment for the last 10000 years to be 8.75×10²²Am2.Taking the Bulgarian data, the averaged VDM over the last 8000 years is 9.93±1.85× 10²²Am2, which is higher than the above cited value for the last 10000years. This is not surprising because the global mean VDM in the time intervalfrom 10000 BC to 8000 BC remain less than the present day value of 8× 10²²Am2

452 MARY KOVACHEVA ET AL.
Figure 9. (a) Inclination (I), (b) declination (D) and (c) intensity (F) for Bulgaria for the last 8000years obtained from archaeomagnetic measurements. The solid lines correspond to the mean val-ues and the dashed lines mark their corresponding uncertainty (one standard deviation). The solidhorizontal line in Figure 9a represents the contemporary value I(1988.5) = 59.7◦.

GEOMAGNETIC FIELD VARIATIONS 453
Figure 10.The variation of the virtual dipole moment (VDM) using a 500 year window (solid line).The dashed line represents the now-day value (∼ 8× 10²² Am2).
(Figure 2 of McElhinny and Senanayake, 1982). The Bulgarian data is, therefore,consistent with the previous global determination. The growth and decay of thenon-dipole field isoporic foci produces scatter of the field strength and direction.To try to remove the non-dipole contribution from the VDM variation, we have av-eraged our results over 500-year intervals. The resulting variation of VDM is shownin Figure 10. The changes in time of this “local” VDM repeat to a great extent thoseof the global mean VDM of McElhinny and Senanayake (1982), which suggeststhat the non dipole contribution has been successfully removed by averaging with a500-year window. This suggestion is consistent with the established characteristictime (τc) of the non-dipole contribution based on historic geomagnetic data (Hulotand Le Mouel, 1994), namelyτc(2) ∼= 150 years andτc(3) ∼= 130 years for the 2ndand 3rd Gauss coefficient of the geomagnetic field. Recently these characteristictimes have been confirmed on the basis of the archaeomagnetic data analysis aswell (Hongre et al., 1998). Thus, time averaging within 500 years cuts off mostof the larger changes in the non-dipole field while leaving unaffected the signalassociated with the 1st Gaussian coefficientτc(1) ∼= 666 years (Hongre et al., inpress). The missing point between 4000 and 3000 BC (Figure 10) corresponds tothe biggest gap in our data set (Figure 9).
8. Virtual Geomagnetic Pole Positions
Palaeosecular variations in direction can be expressed as changes of the virtualgeomagnetic pole (VGP) position, and are usually represented as a stereographicprojection. Such positions are influenced simultaneously by the variations in thedirection and intensity of the non-dipole field as well as by the variations in themoment and orientation of the geocentric dipole. Many compilations are made ofthe global results of VGP (Dawson and Newitt, 1982; Burlatskaja, 1984; Ohnoand Hamano, 1992) with the aim to evaluate different features of the geomagneticfield behaviour. The calculated positions of the global VGP depend strongly on thetime scale involved. VGP’s averaged over short time scales should group aroundthe mean geomagnetic pole. When averaged over a sufficiently long time, i.e. over
454 MARY KOVACHEVA ET AL.
TABLE IV
Results of the averaged directional and intensity values using 100-year non- overlapping window
MIDPOINT INCL I_SIGMA DECL D_SIGMA F F_SIGMA VDM
−6150 37.17 0.20−5850 49.09 10.57 −32.00 16.14 44.12 4.84 8.67−5750 59.23 2.27 −16.97 5.81 48.54 5.07 8.43−5650 62.50 2.07 −5.34 1.85 55.21 2.33 9.19−5550 64.34 1.27 −1.61 1.39 45.83 8.92 7.45−5450 58.50 3.02 −2.54 4.44 38.81 3.97 6.80−5350 53.40 3.20 5.70 5.37 43.78 3.42 8.18−5250 56.20 2.66 10.46 2.41 43.04 2.24 7 77−5150 52.85 4.99 18.25 6.43 45.28 1.03 8.52−5050 56.42 0.17 3.94 2.25 52.82 1.76 9.51−4850 49.86 2.60 14.18 4.03 51.84 0.87 10.10−4750 51.94 0.18 10.02 3.02 47.60 1.16 9. 05−4650 51.44 4.40 8.23 3.37 50.28 2.24 9.62−4550 49.54 4.58 6.95 5.64 47.72 3.12 9.33−4450 47.25 0.21 18.04 7.11 43.59 0.98 8.75−4350 48.29 2.36 7.84 0.79 37.99 4.13 7.54−4250 47.02 2.08 7.35 1.73 40.05 2.52 8.06−4150 48.93 2.08 8.61 3.75 39.83 4.09 7.84−4050 48.70 5.66 −4.13 1.45 41.52 3.67 8.20−3950 51.60 0.43 −4.68 0.45 44.60 1.31 8.52−3850 52.87 1.27 −6.01 2.45 48.87 0.99 9.19−3750 61.61 1.30 1.41 2.73 52.70 0.43 8.88−3150 57.54 1.83 −4.40 3.41 44.44 2.95 7.89−3050 61.37 1.70 −3.70 3.55 45.61 0.90 7.71−2950 60.14 6.18 −0.30 12.41 41.12 2.22 7.06−2850 58.80 1.20 −2.35 1.59 42.39 1.30 7.40−2750 55.81 1.38 −1.21 2.76 45.44 5.18 8.24−2650 53.38 2.25 −3.46 4.64 53.56 2.63 10.01−2550 56.26 3.17 −0.79 3.27 49.90 0.68 9.00−2450 58.37 3.30 0.28 6.29 53.97 1.33 9.48−2350 57.89 1.28 4.76 0.71 53.03 0.86 9.37−1850 47.98 4.70 18.56 7.02 60.21 0.47 11.98−1750 60.28 0.71 2.58 1.41 63.83 0.16 10.94−1550 58.92 3.90 2.50 7.55 68.40 1.74 11.93−1450 56.00 1.70 7.20 3.04 76.35 3.32 13.82−1150 62.77 3.20 −10.00 6.99 73.69 1.84 12.22−1050 61.86 3.00 12.53 6.36 77.83 1.70 13.07−950 70.96 1.10 17.66 1.75 74.56 1.80 11.13−750 66.21 1.39 −3.38 1.06 69.17 0.37 10.97−550 63.36 3.40 −2.30 7.58 73.93 5.35 12.17−450 59.61 4.05 −17.00 8.00 75.83 1.68 13.11−350 64.84 3.45 −15.80 11.75 82.99 0.08 13.40−250 63.88 1.32 −5.40 2.44 77.72 8.46 12.53−150 67.36 1.58 −5.40 4.10 69.00 0.21 10.78−50 64.30 6.27

GEOMAGNETIC FIELD VARIATIONS 455
TABLE IV
Continued
MIDPOINT INCL I_SIGMA DECL D_SIGMA F F_SIGMA VDM
50 60.55 3.41 70.04 0.93 11.96
150 59.63 4.32 −8.27 2.29 66.53 5.24 11.50
250 50.48 1.40 −7.31 2.74 64.54 5.41 12.49
350 50.55 5.11 −1.61 5.27 60.91 4.04 11.78
450 55.87 5.30 −0.58 1.06 62.44 2.34 11.32
550 62.89 6.04 4.26 2.48 61.71 5.10 10.22
650 63.17 3.38 −7.09 4.80 76.41 7.55 12.61
850 58.06 1.65 10.29 0.44 61.76 0.04 10.89
950 67.68 2.49 12.31 5.41 76.02 4.79 11.83
1050 62.01 1.25 3.17 7.56 61.68 1.58 10.33
1150 58.39 3.84 12.17 1.69 55.87 4.07 9.81
1250 58.41 3.13 14.85 0.00 53.14 1.47 9.33
1350 52.86 2.85 14.60 4.23 58.79 3.08 11.06
1450 55.15 1.10 41.21 2.83 7.54
1550 66.21 2.57 61.46 0.92 9.75
1650 61.14 3.25 69.79 6.39 11.83
1750 61.72 2.75 −11.57 5.21 58.37 1.32 9.82
1850 59.43 1.43 43.96 2.36 7.62
some 104 years, their mean should correspond to the geographic pole. Taking theBulgarian data as spot readings over the last 8000 years, the mean 500-year VGPcan be calculated using the 100-year averages of our directional data (2nd and 4thcolumns of Table IV). These are clearly distributed around the geographic pole(Figure 11). If the same 100-years non-overlapping averages are used to calcu-late the mean position of the VGP, its latitude is8 = 85.7◦N, very close to thegeographic pole. Thus our data confirm the general idea that the time-averagedgeomagnetic field, to a first approximation, is that of an axial geocentric dipole.
9. Summary
A detailed archaeomagnetic study on a large number of collections from the his-toric and prehistoric past in Bulgaria has been undertaken in the Sofia palaeomag-netic laboratory during the last three decades. These have now be supplemented byextensive rock-magnetic studies, which provide some explanation for many failedexperiments for intensity determination. These studies have shown that specificcharacters of the burnt clay used for the bricks, pottery or simple plastering of

456 MARY KOVACHEVA ET AL.
Figure 11.Stereographic projection of the virtual geomagnetic pole (VGP) positions using a 500-yearwindow.
prehistoric ovens must be taken into account. It appears that there is consider-able heterogeneity in samples from kilns and ovens that have been studied. Themain carriers of remanence are magnetically soft magnetite (or titanomagnetites),maghemite – both stable and unstable towards heating, iron oxyhydroxides and,rarely, hematite. The predominant state of the carriers is pseudo single domain,but the so-called bimodal (Dunlop, 1983) or mixed behaviour is common. Recentpapers on the subject of magnetic mineralogy of archaeological materials usedfor archaeomagnetic studies are revised and conclusions drawn. Possible changesin the mineralogy of samples during heating for the intensity determination aredescribed and an experiment is proposed for their detecting (see also Jordanova etal., 1997). It is stressed that the mineralogy and grain size distribution of the non-preselected burnt clay are particularly complex, but such materials are commonlyused for archaeomagnetic studies of prehistoric past. Thus the acceptance-rejectioncriteria for the material to be used in palaeointensity studies could not be easilydefined (Kovacheva et al., in press).
Two conclusions can be drawn from the anisotropy studies carried out. Firstly,measurements of the AMS of samples from ovens show that their magnetic fabricis related to the oven’s surface, Kmin being perpendicular to the surface and Kmax
and Kint lying in the plane of the oven. This magnetic texture probably reflects thedistribution anisotropy of ferrimagnetic grains. Secondly, the correction factor for

GEOMAGNETIC FIELD VARIATIONS 457
the palaeointensity value is relatively small (2–5%) but it provides more consistentpalaeointensity results.
The current Bulgarian data for secular variation studies (Kovacheva, 1997) stillcontains two gaps (ca 3500 and ca 1400 BC) but the general trends are clear.Smoothing was undertaken using various algorithms such as those of Daly and LeGoff (1996) and Lanos (in press). The comparative study of the three smoothingalgorithms – simple to sophisticated – has shown a good agreement of the meancurves (Le Goff et al., in press). The geophysical implications of our VDM varia-tions and VGP path are: (1) the local data set conforms with the broad high dipolemoment around the beginning of our era suggested by global data set (McElhinnyand Senanayake, 1982); (2) averaging the local set of archaeomagnetic data over500-year intervals largely removes the non-dipole contribution; and (3) averagingthe local directional results for the last 8000 years gives an average VGP positionvery close to the geographic pole, confirming the important hypothesis that thetime-averaged geomagnetic field over a sufficiently long interval of time, approxi-mates to a geocentric axial dipole. We hope that the Bulgarian data set is one of thebest regional archaeomagnetic data sets in the world and tends to provide detailedsecular variation information.
Acknowledgements
The help of the entire community of Bulgarian archaeologists is highly appreciatedand special thank are due to Dr Javor Boyadziev, dealing with the 14C dating inprehistory. It is a pleasure to thank once more to Institute of Physics of the Earthin Paris (IPGP) and namely to Prof. V. Courtillot for a given possibility for a threemonths fruitful stay there in 1996 of one of the authors (M.K.). The useful remarksmade by the reviewers helped the improvement of the paper. Special thanks are dueto Prof. D.Tarling who brushed considerably the English style.
References
Aitken, M., Allsop, A., Bussell, G. and Winter, M.: 1986, ‘Palaeointensity determination using theThellier Technique: Reliability criteria’,J. Geomag. Geoelectr. 38, 1353–1363.
Aitken, M., Allsop, A., Bussell, G., and Winter, M.: 1988, ‘Determination of the intensity of theEarth’s magnetic field during archaeological times. Reliability of the Thellier technique’,Rev.Geophys. 26(1), 3–12.
Barbetti, M.F., McElhinny, M.W., Eduards, D.J., and Schmidt, P.W.: 1977, ‘Weathering processesin baked sediments and their effects on archaeomagnetic field-intensity measurements’,Phys.Earth Plan. Inter. 13, 346–356.
Boyadziev, Y.: 1995, ‘Chronology of prehistoric cultures in Bulgaria’, in D. Bailey and I. Panay-otov (eds),Prehistoric Bulgaria, Monographs in World Archaeology, No. 22, Prehistory Press,Madison Wisconsin, pp. 149–192.

458 MARY KOVACHEVA ET AL.
Burlatskaja, S.: 1984, ‘Movement of the virtual geomagnetic pole’,Izvestia Acad. Nauk SSSR, Physicof the Earth2, 41–50 (in Russian).
Chauvin, A., Gillot, P.Y., and Bonhommet, N.: 1991, ‘Palaeointensity of the Earth’s magnetic field,recorded by two late quaternary sequences at the island of La Reunion (Indian Ocean)’,J.Geophys. Res.96, B2, 1981–2006.
Coe, R.S.: 1967, ‘The determination of paleo-intensities of the Earth’s magnetic field with empha-sis on mechanisms which could cause non-ideal behaviour in Thellier’s method’,J. Geomagn.Geoelectr.19(3), 157–179.
Cui, Y. and Verosub, K.L.: 1995, ‘A mineral magnetic study of some pottery samples: possibleimplications for sample selection in archaeointensity studies’,Phys. Earth Plan. Inter. 91,261–271.
Cui, Y., Verosub, K.L., Roberts, A.P., and Kovacheva, M.: 1997, ‘Rock magnetic studies of ar-chaeological samples: implications for sample selection for paleointensity determinations’,J.Geomagn. Geoelectr. 49, 567–585.
Daly, L. and Le Goff, M.: 1996, ‘An updated and homogeneous world secular variation data base. 1.Smoothing of the archaeomagnetic results’,Phys. Earth Plan. Inter.93, 159–190.
Dawson, E. and Newitt, L.: 1982, ‘The magnetic Poles of the Earth’,J. Geomag. Geoelectr. 34,225–240.
Day, R., Fuller, M., and Schmidt, V.A.:1977, ‘Hysteresis properties of titanomagnetites: grain-sizeand compositional dependence’,Phys. Earth Plan.Inter.13, 260–267.
De Boer, C.B. and Dekkers, M.J.: 1996, ‘Grain-size dependence of the rock magnetic properties fora natural maghemite’,Geophys. Research Lett.23(20), 2815– 2818.
Derder, M., Messaoud, El., Thompson, J., Prevot, M., and McWilliams, M.:1989, ‘Geomagneticfield intensity in Early Jurassic – investigation of the Newarc Supergroup (ENA)’,Phys. EarthPlan.Inter.58, 126–136.
Dunlop, D.: 1983, ‘Determination of domain structure in igneous rocks by alternating field and othermethods’,Earth Plan. Sci. Lett.63, 353–367.
Evans, M. and Jiang, L.: 1996, ‘Magnetomineralogy of archaeomagnetic minerals’,J. Geomag.Geoelectr.48, 1531–1540.
Fisher, R.A.: 1953, ‘Dispersion on a sphere’,Proceedings of Royal Society, London A217, p. 295.Haag, M., Dunn, J.R., and Fuller, M.: 1995, ‘A new quality check for absolute palaeointensities of
the Earth magnetic field’,Geophys. Res. Lett. 22, 3549–3552.Hongre, L., Hulot, G., and Khokhlov, A.: 1998, ‘An analysis of the geomagnetic field over the past
2000 years’,Phys. Earth Plan. Inter.106(3–4), 311–335.Hulot, G. and Le Mouel, J.: 1994, ‘A statistical approach to the Earth’s main magnetic field’,Phys.
Earth Plan.Inter.82, 167–183.Jackson, M.: 1991, ‘Anisotropy of magnetic remanence: A brief review of mineralogical sources,
physical origins and geological applications, and comparison with susceptibility anisotropy’,Pageoph.136(1), 1–28.
Jelinek, V.: 1981, ‘Characterisation of the magnetic fabrics of rocks’,Tectonophysics79, T63–T67.Jordanova, N.: 1996, ‘Rock magnetic studies in archaeomagnetism and their contribution to the
problem of reliable determination of the ancient geomagnetic field intensity’, Ph.D., Sofia (inBulgarian).
Jordanova, N., Karloukovski V., and Spatharas, V.: 1995, ‘Magnetic anisotropy studies on Greekpottery and bricks’,Bulg. Geophys. J. XXI (4), 49–58.
Jordanova, N., Petrovsky, E., and Kovacheva, M.: 1997, ‘Preliminary rock magnetic study ofarchaeomagnetic samples from Bulgarian prehistoric sites’,J. Geomag. Geoelectr.49, 543–566.
King, J.W., Banerjee, S.K., and Marvin, J.: 1983, ‘A new rockmagnetic approach to selecting sed-iments for geomagnetic paleointensity studies: Application to paleointensity for the last 40,000years’,J. Geophys. Res.88, 5911–5921.

GEOMAGNETIC FIELD VARIATIONS 459
Kovacheva, M.: 1980, ‘Summarized results of the archaeomagnetic investigation of the geomagneticfield variation for the last 8,000 years in South Eastern Europe’,Geophys. J. R. Astr. Soc., 61,57–64.
Kovacheva, M.: 1992, ‘Updated archaeomagnetic results from Bulgaria: the last 2000 years’,Phys.Earth Plan. Inter.70, 219–223.
Kovacheva, M.: 1995, ‘Bulgarian Archaeomagnetic studies’, in D. Bailey and I. . Panayotov (eds),Prehistoric Bulgaria, Monographs in World Archaeology, No. 22, Prehistory Press, MadisonWisconsin, pp. 209–224.
Kovacheva, M.: 1997, ‘Archaeomagnetic database from Bulgaria: the last 8000 years’,Phys. EarthPlan. Inter. 102, 145–151.
Kovacheva, M. and Kanarchev, M.: 1986, ‘Revised archaeointensity data from Bulgaria’,J. Geomag.Geoelectr. 38, 1297–1310.
Kovacheva, M. and Toshkov, A.: 1994, ‘Geomagnetic field variations as determined from Bulgarianarchaeomagnetic data. Part I: The last 2000 years AD’,Surveys in Geophysics15, 673–701.
Kovacheva, M., Chauvin, A., Jordanova, N., and Karloukovski, V.: ‘Archaeointensity study: interlaboratory comparison, anisotropy effect in the baked clay from ovens and ancient fires’,Phys.Earth Plan. Inter, in press.
Lanos, P.: in press, ‘Bayesian approach using penalized maximum likelihood to smoothing timeseries carring errors both on time and measure’.
Le Goff, M., Kovacheva, M., Lanos, P., and Daly, L.: ‘Bulgarian archaeomagnetic data covering aneight millennia period: a comparison of smoothing procedures’, in press.
Levi, S. and Banerjee, S.K.: 1976, ‘On the possibility of obtaining relative paleointensities from lakesediments’,Earth Planet. Sci. Lett.29, 219–2226.
Lowrie, W. and Fuller, M.: 1971, ‘On the alternating field demagnetization characteristics ofmultidomain thermoremanent magnetization in magnetite’,J. Geophys. Res. 76(26), 6339–6349.
Lowrie, W.: 1990, ‘Identification of ferromagnetic minerals in a rock by coercivity and unblockingtemperature properties’,Geophys. Res. Lett. 17(2), 159–162.
McElhinny, M. and Senanayake, W.: 1982, ‘Variations in the geomagnetic dipole I: The past 50,000years’,J. Geomag. Geoelectr. 34, 39–51.
Ohno, M. and Humano, Y.: 1992, ‘Geomagnetic poles over the past 10,000 years’,Geophys. Res.Lett.19, 1715–1718.
Osipov, J.B.: 1978, ‘ Magnetism of soils’,Nedra, Moskow(in Russian).Ozdemir, O. and Banerjee, S.K.: 1984, ‘High temperature stability of maghemite (γ -Fe2O3)’,
Geophys. Res. Lett. 11(3), 161–164.Ozdemir, O. and Dunlop, D.: 1993, ‘Chemical remanent magnetization duringγFeOOH phase
transformations’,J. Geophys. Res. 98, B3, 4191–4198.Pick, T. and Tauxe, L.: 1993, ‘Holocene paleointensities: Thellier experiments on submarine basaltic
glass from the East Pacific Rise’,J. Geophys. Res.98, 17,949–17,964.Potter, D. and Stephenson, A.: 1988, ‘Single-domain particles in rocks and magnetic fabric analysis’,
Geophys. Res. Lett.15(10), 1097–1100.Potter, D.K. and Stephenson, A.: 1990a, ‘Field-impressed anisotropies of magnetic susceptibility and
remanence in minerals’,J. Geophys. Res.95, B10, 15,573–15,588.Potter, D.K. and Stephenson, A.:1990b, ‘Field-impressed magnetic anisotropy in rocks’,Geophys.
Res. Lett.17(12), 2437–2440.Roberts, A.P., Cui, Y., and Verosub, K.L.: 1995, ‘Wasp-waisted hysteresis loops: Mineral magnetic
characteristics and discrimination of components in mixed magnetic systems’,J. Geophys. Res.100, 17,909–17,924.
Rochette, R., Jackson, M., and Aubourg, C.: 1992, ‘Rock magnetism and the interpretation ofmagnetic susceptibility’,Review of geophysics30, 3, 209–226.
Rogers, J., Fox, J.M.W., and Aitken, M.J.: 1979, ‘Magnetic anisotropy in ancient pottery’,Nature227(5698), 644–646.

460 MARY KOVACHEVA ET AL.
Sigalas, I., Gangas, N-H.J., and Danon, J.: 1978, ‘Weathering model in paleomagnetic field intensitymeasurements on ancient fired clays’,Physi. Earth Planet. Inter.16, 15–19.
Schnepp, E.: 1994, ‘Determination of geomagnetic palaeointensities from the Quaternary West Eifelvolcanic field, Germany’,Geophys. J. Int.116, 668–714.
Stephenson, A., Sadikun, S., and Porter, D.K.: 1986, ‘A theoretical and experimental comparison ofthe anisotropies of magnetic susceptibility and remanence in rocks and minerals’,Geophys. J. R.Astr. Soc.84, 185–200.
Tarling, D.: 1983,Paleomagnetism, Chapman and Hall, London, New York.Tanaka, H.: 1990, ‘Paleointensity high at 9000 years ago from volcanic rocks in Japan’,J. Geophys.
Research95, B11, 17,517–17,531.Tanaka, H. and Kono, M.: 1991, ‘Preliminary results and reliability of palaeointensity studies on
historic and 14C dated Hawaiian lavas’,J. Geomag. Geoelectr.43, 375–388.Thellier, E. and Thellier, O.: 1959, ‘Sur l’intensite du shamp magnetique terrestre dans le passe
historique et geologique’,Ann. Geophysique15, 285–376.Thomas, N.: 1993, ‘An integrated rock magnetic approach to the selection or rejection of ancient
basalt samples for palaeointensity experiments’,Phys. Earth Plan. Inter. 75, 329–342.Van Velzen, A.J. and Zijderveld, J.D.A.: 1992, ‘A method to study alterations of magnetic minerals
during thermal demagnetization applied to a fine-grained marine marl (Trubi formation, Sicily)’,Geophys. J. Int. 110, 79–90.
Veitch, R.J., Hedley, I.G., and Wagner, J.J.: 1984, ‘An investigation of the intensity of the geomag-netic field during roman times using magnetically anisotropic bricks and tiles’,Arch. Sc. Geneve37, Fasc.3, 359–373.
Xu, S. and Dunlop, D.: 1995, ‘Toward a better understanding of the Lowrie-Fuller test’,J. Geophys.Res.100, B11, 22,533–22,542.


