Embed Size (px)
Citation preview

Tectonophysics xxx (2016) xxx–xxx
TECTO-127161; No of Pages 14
Contents lists available at ScienceDirect
Tectonophysics
j ourna l homepage: www.e lsev ie r .com/ locate / tecto
Geophysical-petrological modelling of the East Greenland Caledonides –Isostatic support from crust and upper mantle
Christian Schiffer a,c,⁎, Niels Balling a, Jörg Ebbing b, Bo Holm Jacobsen a, Søren Bom Nielsen a
a Department of Geoscience, Aarhus University, Høegh-Guldbergs gade 2, DK-8000 Aarhus C, Denmarkb Department of Geoscience, Christian-Albrechts-University Kiel, Otto-Hahn-Platz 1, D-24118 Kiel, Germanyc Department of Earth Sciences, Durham University, Science Labs, Durham DH1 3LE, UK
⁎ Corresponding author at: Department of Earth SciencLabs, Durham DH1 3LE, UK.
E-mail address: [email protected] (C. Schiffe
http://dx.doi.org/10.1016/j.tecto.2016.06.0230040-1951/© 2016 Elsevier B.V. All rights reserved.
Please cite this article as: Schiffer, C., et al., Gand upper mantle, Tectonophysics (2016), h
a b s t r a c t
a r t i c l e i n f oArticle history:Received 16 January 2016Received in revised form 13 May 2016Accepted 18 June 2016Available online xxxx
Teleseismic receiver function analysis imaged a complex upper mantle structure in the Central Fjord Region ofEast Greenland, including an east-dipping high velocity layer and a mantle wedge of high crustal or low mantlevelocities. This was interpreted as a fossil Caledonian subduction complex, including a slab of eclogitised maficcrust and an overlying wedge of serpentinised mantle. In this paper, we use a multi-disciplinary geophysicaland petrological modelling approach to test this proposed fossil subduction model.The consistency of the obtained velocity model with the regional gravity field is tested by forward densitymodelling and isostatic calculations. The models show that the sub-crustal structure, given by themore buoyantmantle wedge and the dipping high velocity/density layer, yield in a markedly better fit as compared to ahomogeneous mantle lithosphere.Petrological-geophysical modelling is performed by testing different upper mantle compositions with regard totopography, gravity and seismic velocities using Litmod2D. This suggests that the observed lower crustal/uppermost mantle bodies could be a combination of mafic intrusions, serpentinised peridotite and metamor-phosed mafic crust. The preferred composition for the dipping structure is eclogitised mafic crust, and hydratedperidotite filling the overlying mantle wedge. Models lacking an eclogite layer or a hydrated upper mantlecomposition showan inferiorfit and, therefore, are not favoured representatives. This supports the interpretationas a fossil subduction zone complex. The spatial relationswith Caledonian structures suggest an early Caledonianorigin.
© 2016 Elsevier B.V. All rights reserved.
Keywords:Geophysical-petrological modellingGravity-isostatic modellingFossil subductionEast GreenlandCaledonides
1. Introduction
The North Atlantic Realm (NAR) experienced a number of majortectonic events during the past 500 Ma which shaped the present-daytopographic and crustal and upper mantle structure of the NorthAtlantic passive margins. While the general geodynamic evolution isknown, various issues are still a matter of discussion. This applies todetails of accretionary events associatedwith the Palaeozoic Caledonianorogeny, deep processes in the mantle related to the formation of theNorth Atlantic Igneous Province and the present-day state of isostasyof the high topography along the magma-rich passive margins of EastGreenland and Scandinavia.
Recently, it has been suggested that remnants of an early Caledonianeast-dipping subduction zone are entrained in the lithosphere of theCentral Fjord (CF) region of East Greenland (Schiffer et al., 2014,2015a). Teleseismic receiver functions of theCF array indicate eclogitised
es, Durham University, Science
r).
eophysical-petrological modettp://dx.doi.org/10.1016/j.tec
mafic crust in the dipping layer and an overlying serpentinised mantlewedge. This structure could be part of a once contiguous eastward dip-ping Caledonian (or older) subduction zone along the eastern marginof Laurentia, connected with the so-called “Flannan reflector”, offshorenorthern Scotland (Smythe et al., 1982; Snyder and Flack, 1990;Warner et al., 1996) that shows very similar geometrical and geophysicalproperties (Schiffer et al., 2015b).
In this study, we will substantiate the interpretation of a fossilsubduction zone in East Greenland, by a detailed multi-disciplinaryapproach, including density, isostatic and petrological modelling. Inparticular, we will quantitatively differentiate between a set of selectedend-member models that include a fossil subduction setting and alter-native geometries and compositions.
2. Geological setting
The geological and topographic expression of the North AtlanticRealm (NAR) is considered to be mainly shaped during the past500Ma, with the Palaeozoic Caledonian orogeny (circa 425Ma), rifting,continental break-up accompanied by an extreme magmatic outburst
lling of the East Greenland Caledonides – Isostatic support from crustto.2016.06.023
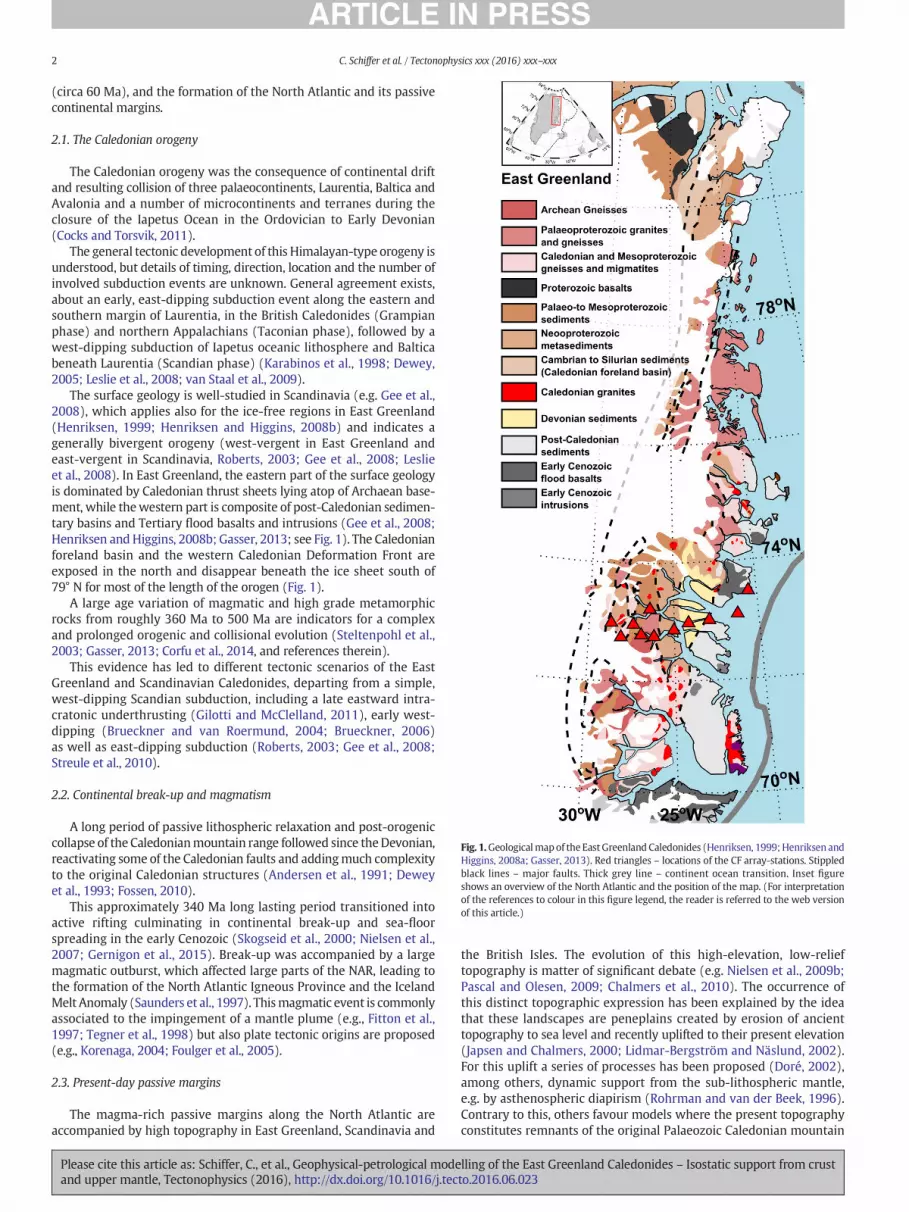
Fig. 1.Geologicalmapof the East Greenland Caledonides (Henriksen, 1999;Henriksen andHiggins, 2008a; Gasser, 2013). Red triangles – locations of the CF array-stations. Stippledblack lines – major faults. Thick grey line – continent ocean transition. Inset figureshows an overview of the North Atlantic and the position of the map. (For interpretationof the references to colour in this figure legend, the reader is referred to the web versionof this article.)
2 C. Schiffer et al. / Tectonophysics xxx (2016) xxx–xxx
(circa 60 Ma), and the formation of the North Atlantic and its passivecontinental margins.
2.1. The Caledonian orogeny
The Caledonian orogeny was the consequence of continental driftand resulting collision of three palaeocontinents, Laurentia, Baltica andAvalonia and a number of microcontinents and terranes during theclosure of the Iapetus Ocean in the Ordovician to Early Devonian(Cocks and Torsvik, 2011).
The general tectonic development of this Himalayan-type orogeny isunderstood, but details of timing, direction, location and the number ofinvolved subduction events are unknown. General agreement exists,about an early, east-dipping subduction event along the eastern andsouthern margin of Laurentia, in the British Caledonides (Grampianphase) and northern Appalachians (Taconian phase), followed by awest-dipping subduction of Iapetus oceanic lithosphere and Balticabeneath Laurentia (Scandian phase) (Karabinos et al., 1998; Dewey,2005; Leslie et al., 2008; van Staal et al., 2009).
The surface geology is well-studied in Scandinavia (e.g. Gee et al.,2008), which applies also for the ice-free regions in East Greenland(Henriksen, 1999; Henriksen and Higgins, 2008b) and indicates agenerally bivergent orogeny (west-vergent in East Greenland andeast-vergent in Scandinavia, Roberts, 2003; Gee et al., 2008; Leslieet al., 2008). In East Greenland, the eastern part of the surface geologyis dominated by Caledonian thrust sheets lying atop of Archaean base-ment, while thewestern part is composite of post-Caledonian sedimen-tary basins and Tertiary flood basalts and intrusions (Gee et al., 2008;Henriksen andHiggins, 2008b; Gasser, 2013; see Fig. 1). The Caledonianforeland basin and the western Caledonian Deformation Front areexposed in the north and disappear beneath the ice sheet south of79° N for most of the length of the orogen (Fig. 1).
A large age variation of magmatic and high grade metamorphicrocks from roughly 360 Ma to 500 Ma are indicators for a complexand prolonged orogenic and collisional evolution (Steltenpohl et al.,2003; Gasser, 2013; Corfu et al., 2014, and references therein).
This evidence has led to different tectonic scenarios of the EastGreenland and Scandinavian Caledonides, departing from a simple,west-dipping Scandian subduction, including a late eastward intra-cratonic underthrusting (Gilotti and McClelland, 2011), early west-dipping (Brueckner and van Roermund, 2004; Brueckner, 2006)as well as east-dipping subduction (Roberts, 2003; Gee et al., 2008;Streule et al., 2010).
2.2. Continental break-up and magmatism
A long period of passive lithospheric relaxation and post-orogeniccollapse of the Caledonianmountain range followed since theDevonian,reactivating some of the Caledonian faults and addingmuch complexityto the original Caledonian structures (Andersen et al., 1991; Deweyet al., 1993; Fossen, 2010).
This approximately 340 Ma long lasting period transitioned intoactive rifting culminating in continental break-up and sea-floorspreading in the early Cenozoic (Skogseid et al., 2000; Nielsen et al.,2007; Gernigon et al., 2015). Break-up was accompanied by a largemagmatic outburst, which affected large parts of the NAR, leading tothe formation of the North Atlantic Igneous Province and the IcelandMelt Anomaly (Saunders et al., 1997). Thismagmatic event is commonlyassociated to the impingement of a mantle plume (e.g., Fitton et al.,1997; Tegner et al., 1998) but also plate tectonic origins are proposed(e.g., Korenaga, 2004; Foulger et al., 2005).
2.3. Present-day passive margins
The magma-rich passive margins along the North Atlantic areaccompanied by high topography in East Greenland, Scandinavia and
Please cite this article as: Schiffer, C., et al., Geophysical-petrological modeand upper mantle, Tectonophysics (2016), http://dx.doi.org/10.1016/j.tec
the British Isles. The evolution of this high-elevation, low-relieftopography is matter of significant debate (e.g. Nielsen et al., 2009b;Pascal and Olesen, 2009; Chalmers et al., 2010). The occurrence ofthis distinct topographic expression has been explained by the ideathat these landscapes are peneplains created by erosion of ancienttopography to sea level and recently uplifted to their present elevation(Japsen and Chalmers, 2000; Lidmar-Bergström and Näslund, 2002).For this uplift a series of processes has been proposed (Doré, 2002),among others, dynamic support from the sub-lithospheric mantle,e.g. by asthenospheric diapirism (Rohrman and van der Beek, 1996).Contrary to this, others favour models where the present topographyconstitutes remnants of the original Palaeozoic Caledonian mountain
lling of the East Greenland Caledonides – Isostatic support from crustto.2016.06.023

Fig. 2. Topography in the Central Fjord region. (a) topography including ice. (b) topographyof the bedrock surface, without ice coverage. White line – edge of the Greenland ice sheet.Black triangles – station positions of the CF seismological array.
3C. Schiffer et al. / Tectonophysics xxx (2016) xxx–xxx
ranges preserved due to slow, climatically controlled pre-quaternaryerosion and faster fjord-incisions during the Quaternary compensatedby isostatic rebound (Egholm et al., 2009; Nielsen et al., 2009b;Pedersen et al., 2010).
Densely distributed geophysical studies in Scandinavia have imagedthe crustal structure of the Scandinavian Caledonides (seeMaupin et al.,2013 and references therein) providing important evidence thatthe high topography is isostatically supported by thick crust as well aslateral variations of crustal density and lithospheric composition andthickness (Ebbing et al., 2012; Gradmann et al., 2013). This is in generalagreement with negative gravity anomalies correlating with hightopography (Balling, 1980; Ebbing, 2007).
The much sparser, mainly active source seismic studies in EastGreenland do as well indicate thick crust of 40–48 km beneath mostthe Caledonian high topography from 70° N to 74° N (Voss et al., 2009and references therein), supported by region-wide gravity analysis(Schmidt-Aursch and Jokat, 2005; Braun et al., 2007) and receiver func-tions analysis (Dahl-Jensen et al., 2003, p.; Kumar et al., 2007; Schifferet al., 2015a). Regional surface wave studies using the available perma-nent stations in Greenland and the surrounding areas provide limitedindications for the thickness of the lithosphere (Darbyshire et al., 2004).
Significant parts of the original Caledonian mountains have beeneroded, which consequently caused uplift due to isostatic adjustments(Nielsen et al., 2009a; Gołędowski et al., 2013; Medvedev et al., 2013;Medvedev and Hartz, 2015).
3. Gravity and isostasy
Previously published results from receiver function modelling(Schiffer et al., 2015a) will be the base for detailed forward densitymodelling. Firstly, the available gravity data is shortly described andquality checked (Section 3.1). Then, the residual gravity field will becomputed and analysed (Section 3.2). Finally, the gravity response of aset of different forward density models, based on the receiver functionresults, will be tested (Section 3.3).
3.1. Gravity data
A compilation of gravity data of the Arctic region – ArcGP (Forsbergand Kenyon, 2004; Kenyon et al., 2008) –was used to perform the pres-ent study and includes free-air (FA) and Bouguer gravity anomalies (BA).In the study area, the data consist of a large number of onshoremeasure-ments supplemented by offshore mapping (Forsberg, 1986; Andersenet al., 2009). The BA is obtained using a Bouguer-plate correctionfor the topography with a density of 2670 kg/m3 and a density of970 kg/m3 for the ice cover (Gaina et al., 2011), but a terrain correctionwas not applied. After studying recent available topography models(including ice thickness and bathymetry), we found that a sufficientlydetailed terrain correction is not applicable, given the low resolutionof the models in the offshore areas. The most advanced available bathy-metric model is the IBCAO model (Jakobsson et al., 2012), but the datacoverage in the fjords of Central East Greenland is still insufficient.
Eighty-three terrain corrected gravity stations, whichwere availablefrom Forsberg and Strykowski (pers. Comm., 2008), show terraincorrections of up to 40 mGal. However, most of the terrain correctionsshow values smaller than 20 mGal and the median is 7.99 mGal.Hence, we expect the BA to be typically 20 mGal too low for singlestationmeasurements in rough terrain,much less elsewhere, andmostlyaffecting short wavelengths (b25 km).
3.2. Isostatic gravity anomaly
We estimated the isostatic gravity residual of the wider study area.For this purpose, we used the topography (ETOPO1, Fig. 2) to calculatean Airy-isostatic Moho depth (Fig. 3b) by weighting the thicknessof the ice (density of 970 kg/m3) and bedrock (2670 kg/m3) above
Please cite this article as: Schiffer, C., et al., Geophysical-petrological modeand upper mantle, Tectonophysics (2016), http://dx.doi.org/10.1016/j.tec
sea-level with a crustal root (2800 kg/m3) with a reference crustalthickness of 35 km and a density contrast of 500 kg/m3 between crustand mantle. The bedrock topography beneath the ice sheet and the icethickness is expected to have a rather large uncertainty (20–200 mhorizontal and ~1 m vertical for the top ice; 5–50 km horizontal and10–100 m vertical resolution for the bedrock elevation, http://nsidc.org/). The RMS error of the bedrock topography of the newer modelfrom Bamber et al. (2013) is given at N150 m in East Greenland. Thegravity response (Isoreg) of this isostatic Moho model was calculatedwith the software LithoFlex (Braitenberg et al., 2007) using the abovementioned reference crustal thickness and density contrast. The Airy-isostatic Moho was not smoothed and shows high frequent variationcorresponding to the topography. However, because of the depthof the Moho, Isoreg will be smooth. The isostatic anomaly (gisores) iscalculated by subtracting Isoreg from the observed BA (Fig. 3c).
The isostatic anomalymaymainly reflect non-isostatic sources in thelithosphere and asthenosphere, but also flexural effects and differencesin crustal and uppermantlemass distribution not included in this rathersimple model. Errors in topography or ice thickness and density willresult in a corresponding error in the gravity residual. Therefore, gravityresiduals in the area of the ice sheet were not in the scope of our study.
We identify a number of significant features in the estimated gravityisostatic residual (Fig. 3c): (i) a clear negative residual is observed alongthe approximate extension of the Greenland ice sheet (white line)which we relate to the deflection of the crust and lithosphere dueto flexural loading at the edge. (ii) The fjord systems in central EastGreenland are clearly not locally isostatically compensated, which isreflected by the strongly negative gravity residuals in the fjords and pos-itive gravity residuals in the surrounding topographic highs, correlatedwith changes in elevation. The short wavelengths of these anomalies,
lling of the East Greenland Caledonides – Isostatic support from crustto.2016.06.023

Fig. 3. Gravity and isostasy of the Central Fjord region. (a) observed Bouguer gravityanomaly. (b) isostatic Moho with local compensation of observed topography. See textfor details. (c) Isostatic gravity residual. White line – edge of the Greenland ice sheet.Oceanic domain is cut out. Black triangles – station positions of the CF array.
4 C. Schiffer et al. / Tectonophysics xxx (2016) xxx–xxx
well below 50 km, are the reason why the topography probably iscarried mostly by the stiff lithosphere. (iii) An area of ~50–100 kmwidth of outstanding higher residuals can be identified situated almostcoast-parallel, starting at ~27° W in the south (71° N) and at ~22° Win the north (75° N). A reason could be high densities of the rocks inthis area, which consists of gneisses, granites and old metasediments.(iv) Similarly, an area of isostatic anomaly lows is situated directly tothe east and extending from ~72–73° N. The location of this anomalycorresponds rather well with the Devonian basin (cf. Fig. 1), whichmight be causing the isostatic anomaly.
Despite the mentioned distinct zones of high (both negative andpositive) isostatic anomalies, the general regional trend is close to zeroindicating close to isostatic compensation of long wavelength topo-graphic features.
3.3. Density and isostatic modelling
Density modelling was performed with the software IGMAS+(Schmidt et al., 2010). Similar to Schiffer et al. (2015a), we averaged
Please cite this article as: Schiffer, C., et al., Geophysical-petrological modeand upper mantle, Tectonophysics (2016), http://dx.doi.org/10.1016/j.tec
theBAover a distance of 25 km to the north and south of the defined po-sition of the CF array in order to assess the 2D regional gravity field. Thisaveraging also decreases the error of themissing terrain correction. Theresulting averaged BA shows a clear trend starting at circa−200 mGalin the west and gradually increasing to +50 mGal in the eastern endof the profile, close to the coast line. The central part of the CF array com-prises a close to constant BA at −50 mGal along a ~75 km wide seg-ment. The topography was averaged, accordingly, and the ice columnwas replaced by the same mass of rock column at 2670 kg/m3 density,because the software Litmod2D does not allow an ice layer in themodel. Including this “rock-for-icemasses”, topography reaches a max-imum of approx. 1700 m in the west (100–200 m of replaced ice cover)and decreases almost linearly to sea-level in the eastern end of theprofile.
Schiffer et al. (2015a) presented a first-order test of the obtained P-wave velocity model (Fig. 4a), by directly translating P-wave velocitiesto densities using the Nafe-Drake relation. The calculated gravity re-sponse is in good agreement with the observed data, however, as tobe expected, some variations and local anomalies were not recovered,such as the steeper gradients around the flanks of the profile as wellas the flat BA in the central part.
Based on this preliminary model, we performed a more detailedgravity-isostatic analysis. We produced two forward models, whichwere based on the obtained receiver functionmodel and correspondingdensities. The models are constructed with a number of polygons, eachwith constant density. Layer boundaries and shape of the polygonswerechosen in accordance with the seismic velocity models. The 2.5Dmodelof about 255 km length was extrapolated with 500 km in all lateraldirections in order to avoid edge effects. Gravity and topography datawere prepared in an area 150 km around the extent of the CF array(see Fig. 4b–c, lowermost panels). The whole density structure alongthis entire approx. 555 km long profile was modelled, with the seismo-logical receiver functions providing constraints only in the central255 km part (Fig. 4, second panel from bottom). The initial referencemodel consists of polygons with constant densities, such as differentsedimentary layers (metasediments – 2650 kg/m3, older sediments –2550 kg/m3 and younger sediments – 2250–2450 kg/m3), upper crust(2750 kg/m3) and lower crust (2950 kg/m3), as well as three layers inthe mantle wedge with successively increasing density (3100 kg/m3,3200 kg/m3 and 3300 kg/m3), a high density dipping slab (3400 kg/m3)and finally continental (3350 kg/m3) and oceanic mantle lithosphere(3325 kg/m3) and asthenosphere (3300 kg/m3) (see Table 1).
When, after some adjustments (see below), a model fulfilled theobserved BA, its isostatic topographic response was calculated (Fig. 4,upper panel, stippled red lines), balanced with a reference model. Forthe isostatic model, the density structure was averaged over a lateralmoving window 50 km width. The reference model consisted of apure asthenosphere belowa layer of 2500mof air (“free asthenosphericsurface”) (Lachenbruch and Morgan, 1990).
The first forward model (Fig. 4b) comprises all structural elementsand the geometry followed the receiver function velocity models.Uncertainty in the receiver function modelling and interpolationbetween the stations translates into the density model. Not manyadjustments were necessary to obtain a good fit between observedand modelled gravity (Fig. 4b). The depth of the lithosphere-asthenosphere-boundary (LAB) was chosen at 175 km in the west, ingeneral agreement with seismological results, (e.g. Darbyshire et al.,2004; Conrad and Lithgow-Bertelloni, 2006), decreasing towards thecoastline. This LAB depth decrease and the introduction of a slightlyless dense “oceanic” lithosphere clearly facilitates fitting the observedregional gravity trend. The resultant model shows that no substantialadjustments to the initial receiver function based model have to beapplied to describe the regional gravity field (Fig. 4b, second row).
In the second forward model all “sub-crustal elements” wereremoved (Fig. 4d, third and fourth row). Muchmore substantial crustaladjustmentswere needed in order tomake thismodel alternativefitting
lling of the East Greenland Caledonides – Isostatic support from crustto.2016.06.023
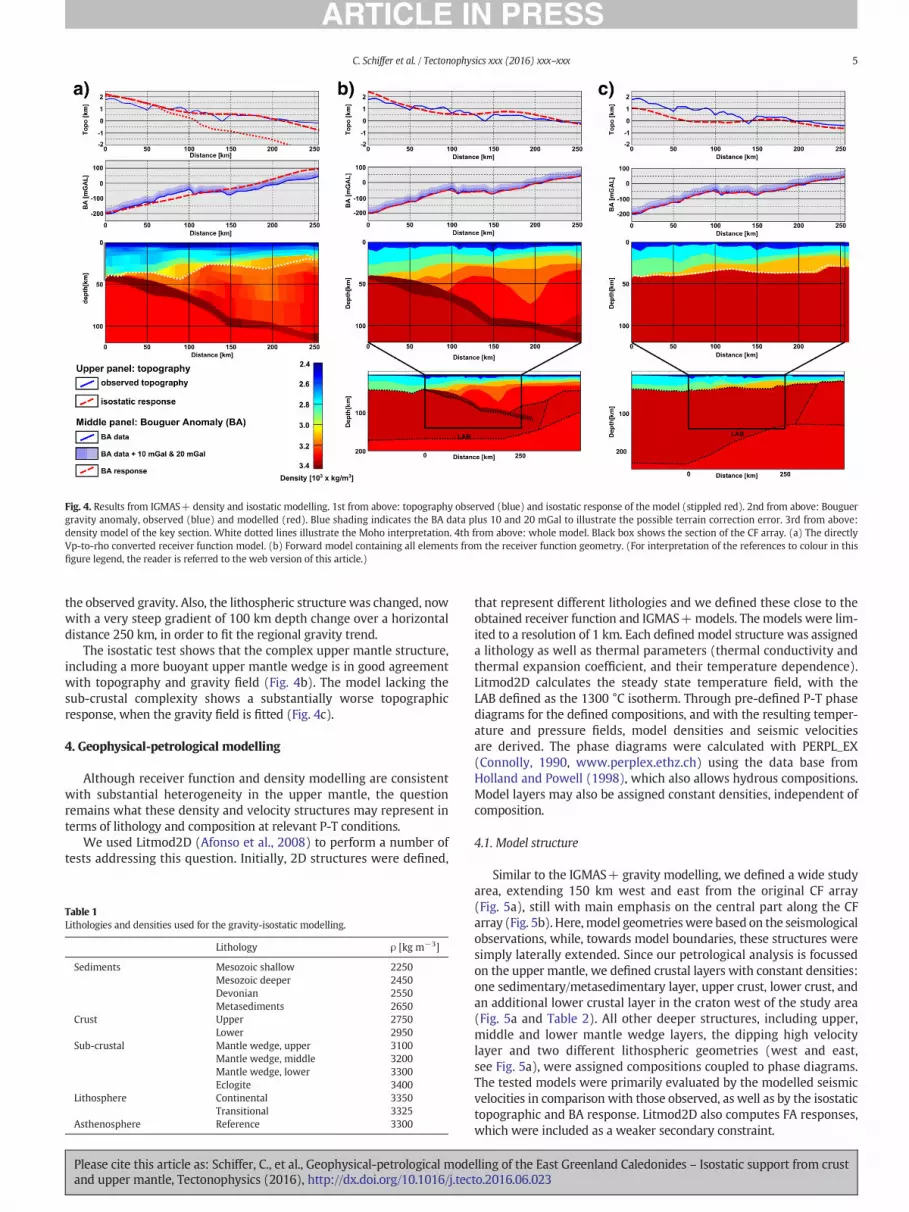
Fig. 4. Results from IGMAS+ density and isostatic modelling. 1st from above: topography observed (blue) and isostatic response of the model (stippled red). 2nd from above: Bouguergravity anomaly, observed (blue) and modelled (red). Blue shading indicates the BA data plus 10 and 20 mGal to illustrate the possible terrain correction error. 3rd from above:density model of the key section. White dotted lines illustrate the Moho interpretation. 4th from above: whole model. Black box shows the section of the CF array. (a) The directlyVp-to-rho converted receiver function model. (b) Forward model containing all elements from the receiver function geometry. (For interpretation of the references to colour in thisfigure legend, the reader is referred to the web version of this article.)
5C. Schiffer et al. / Tectonophysics xxx (2016) xxx–xxx
the observed gravity. Also, the lithospheric structure was changed, nowwith a very steep gradient of 100 km depth change over a horizontaldistance 250 km, in order to fit the regional gravity trend.
The isostatic test shows that the complex upper mantle structure,including a more buoyant upper mantle wedge is in good agreementwith topography and gravity field (Fig. 4b). The model lacking thesub-crustal complexity shows a substantially worse topographicresponse, when the gravity field is fitted (Fig. 4c).
4. Geophysical-petrological modelling
Although receiver function and density modelling are consistentwith substantial heterogeneity in the upper mantle, the questionremains what these density and velocity structures may represent interms of lithology and composition at relevant P-T conditions.
We used Litmod2D (Afonso et al., 2008) to perform a number oftests addressing this question. Initially, 2D structures were defined,
Table 1Lithologies and densities used for the gravity-isostatic modelling.
Lithology ρ [kg m−3]
Sediments Mesozoic shallow 2250Mesozoic deeper 2450Devonian 2550Metasediments 2650
Crust Upper 2750Lower 2950
Sub-crustal Mantle wedge, upper 3100Mantle wedge, middle 3200Mantle wedge, lower 3300Eclogite 3400
Lithosphere Continental 3350Transitional 3325
Asthenosphere Reference 3300
Please cite this article as: Schiffer, C., et al., Geophysical-petrological modeand upper mantle, Tectonophysics (2016), http://dx.doi.org/10.1016/j.tec
that represent different lithologies and we defined these close to theobtained receiver function and IGMAS+models. The models were lim-ited to a resolution of 1 km. Each defined model structure was assigneda lithology as well as thermal parameters (thermal conductivity andthermal expansion coefficient, and their temperature dependence).Litmod2D calculates the steady state temperature field, with theLAB defined as the 1300 °C isotherm. Through pre-defined P-T phasediagrams for the defined compositions, and with the resulting temper-ature and pressure fields, model densities and seismic velocitiesare derived. The phase diagrams were calculated with PERPL_EX(Connolly, 1990, www.perplex.ethz.ch) using the data base fromHolland and Powell (1998), which also allows hydrous compositions.Model layers may also be assigned constant densities, independent ofcomposition.
4.1. Model structure
Similar to the IGMAS+ gravity modelling, we defined a wide studyarea, extending 150 km west and east from the original CF array(Fig. 5a), still with main emphasis on the central part along the CFarray (Fig. 5b). Here,model geometrieswere based on the seismologicalobservations, while, towards model boundaries, these structures weresimply laterally extended. Since our petrological analysis is focussedon the upper mantle, we defined crustal layers with constant densities:one sedimentary/metasedimentary layer, upper crust, lower crust, andan additional lower crustal layer in the craton west of the study area(Fig. 5a and Table 2). All other deeper structures, including upper,middle and lower mantle wedge layers, the dipping high velocitylayer and two different lithospheric geometries (west and east,see Fig. 5a), were assigned compositions coupled to phase diagrams.The tested models were primarily evaluated by the modelled seismicvelocities in comparison with those observed, as well as by the isostatictopographic and BA response. Litmod2D also computes FA responses,which were included as a weaker secondary constraint.
lling of the East Greenland Caledonides – Isostatic support from crustto.2016.06.023

Fig. 5. Model set up for the integrated petrological-geophysical modelling (Litmod2D).(a) Overview of the whole model section, with emphasis on mantle structure. Wedistinguish between a continental lithosphere beneath the Greenland landmass and atransitional lithosphere further east, while approaching the continent-ocean-boundary.(b) Detailed model section with emphasis on the lithospheric structure. Eight differentstructural elements (I–VIII) are defined to represent the obtained velocity structure inthe Central Fjord region and which are tested with different compositions. I–III aresedimentary and crustal layers, which will comprise fixed, pre-defined densities, notexposed to phase diagrams. IV–VIII are sub-crustal structures, which are tested withdifferent lithologies (see Table 3).
6 C. Schiffer et al. / Tectonophysics xxx (2016) xxx–xxx
4.2. Model compositions
Table 2, item 5 to 14 specify 10 different lithologies from which weselected five at a time to fill each of the model zones IV to VIII (Fig. 5).First, revisiting Anderson (2007), Christensen and Mooney (1995)and Christensen (1996), we considered possible compositions oftendiscussed in relation to the observed seismic velocities. P-wave veloci-ties of 7.3–7.8 km/s and S-wave velocities of 4.0–4.4 km/s in themantlemay represent compositions which include hydrated and partlyserpentinised mantle, partly eclogitised mafic crust as well as intrudedlower crust. “Dry”mantle lithologies can in principle also show seismicvelocities of down to Vp≈ 7.7 (Vs≈ 4.4), such as pyroxene richmantlecompositions. However, this only represents the upper limit of the
Table 2Tested lithologies in the integrated petrological-geophysical modelling. Sediments and crustal ldiagrams, as all other lithologies.
Lithology SiO2 Al2O3 FeO MgO CaO Na2O
1 Sediments – – – – – –2 Upper crust – – – – – –3 Lower crust – – – – – –4 LCL (craton) – – – – – –5 Mafic crust 53.4 16.9 8.57 7.24 9.59 2.656 Wet mantle 1 43.0 2.7 6.6 39.1 2.2 0.237 Wet mantle 2 43.3 2.8 6.9 39.4 2.3 0.238 Wet mantle 3 43.8 2.9 7.6 39.8 2.5 0.239 Cpx-Ol rich mantle 48.0 3.6 8.2 28.1 10.0 1.110 Eclogite 47.0 18.0 8.0 11.0 11.0 2.211 Proton 44.6 1.9 7.9 42.6 1.7 0.1212 Harzburgite 36.0 0.6 6.0 56.5 0.8 0.013 Tecton 44.5 3.5 8.0 39.8 3.1 0.24
Please cite this article as: Schiffer, C., et al., Geophysical-petrological modeand upper mantle, Tectonophysics (2016), http://dx.doi.org/10.1016/j.tec
observed velocities in the mantle wedge. The presence of meltswas not considered because of the absence of any present-day activevolcanism in the CF region.
We tested a number of different compositions that might be feasiblefor more accurate tests. We investigated the role of serpentinite andadded gradually more water to a Phanerozoic mantle composition(Afonso et al., 2008), while an average serpentinite composition wasassumed (Miyashiro et al., 1969; Deschamps et al., 2013). Addingsuccessively less serpentinite to the mantle from top to bottom(e.g. 25%, 20%, 10%, corresponding to a water content of 2.9%, 2.3% and1.2%) was able to produce the observed velocity ranges. We also testeddifferent crustal compositions that might have been exposed toeclogitisation and found that the lower crustal composition suggestedby Rudnick andGao (2003) yields a good fit. Finally,we tested a numberof mantle compositions to obtain low seismic velocities. This showedthat the only tested compositionwhichwas able to explain the requiredlow mantle velocities, without having very high densities, was a mixedcomposition of clinopyroxene (Cpx) and magnesium (Mg)-rich olivine(forsterite, Ol).
Then, we tested numerous different mafic crustal compositions,basalts as well as eclogite compositions found in the North Atlanticregion (Bryhni et al., 1969; Mysen and Heier, 1972; Mørk, 1986; Markland Bucher, 1997), which might produce velocities similar to thoseobserved in the dipping slab. These tests showed that an aluminium-and thereby garnet-rich composition is sufficient to create the highvelocities. Also different mantle compositions were tested, wheremany were rejected, mainly because of unrealistic densities, and wefinally chose a harzburgitic composition (Xu et al., 2008) to representmantle with seismic velocities larger than normal (N8.3 km/s). Unlessdescribed otherwise, the standard lithospheric compositionwas chosenas a standard “Proton” (Proterozoic lithosphere), beneath the westernpart of the study area (Fig. 5) and as a standard “Tecton” (Phanerozoiclithosphere, Afonso et al., 2008) beneath the eastern part that formsthe transition to the ocean (Fig. 5a). Table 2 shows the resulting short-list of composition candidates for the sub-crustal structures.
4.3. Forward modelling
The Litmod2D modelling proceeded in two stages. In stage 1 wefixedmodel geometries and tested 12 different combinations of litholo-gies from Table 2. In stage 2we selected the 6most promising combina-tions of lithologies forwhich the layer boundarieswere then adjusted toimprove the fit of the isostatic topography response.
4.3.1. Stage 1 – test of principle compositions and combinationsIn thefirstmodelling stage themodel geometry, based on the receiver
function results, was fixed. Densities and velocities in the crustal layers
ayers comprise pre-defined homogeneous densities and are not calculated after P-T phase
K2O H2O A[10−6 Wm−3]
λ[Wm−1 K−1]
α[10−5 K−1]
ρ[103 kg m−3]
– – 0.500 2.0 2.5 2.55/2.65– – 1.500 2.4 2.2 2.75– – 0.400 2.0 2.0 2.90– – 0.400 2.0 2.0 3.000.62 0.00 0.050 2.6 2.1 –0.01 2.92 0.010 3.2 2.1 –0.01 2.34 0.010 3.3 2.2 –0.00 1.16 0.005 3.4 2.3 –0.00 0.00 0.005 3.4 2.3 –0.40 0.00 0.050 2.0 2.0 –0.00 0.00 0.001 3.5 2.4 –0.00 0.00 0.001 3.5 2.4 –0.00 0.00 0.005 3.4 2.3 –
lling of the East Greenland Caledonides – Isostatic support from crustto.2016.06.023

Fig. 6. Results of the first test for combinationswithout eclogite in the dipping structure. Panels successively from top to bottom: FA [mGal], BA [mGal], topography [km], densities [kg/m3], Vp [km/s], Vs [km/s]. Blue lines show observed data; red linesshowmodelled values; red shading emphasisesmodel differences; insets in the corners of each plot show the RMSE of each comparable data set. Green indicates the best fittingmodels; orange indicates rejection of themodel because of a highmisfitof this quantity. (For interpretation of the references to colour in this figure legend, the reader is referred to the web version of this article.)
7C.Schiffer
etal./Tectonophysicsxxx
(2016)xxx–xxx
Pleasecite
thisarticle
as:Schiffer,C.,etal.,Geophysical-petrologicalm
odellingofthe
EastGreenland
Caledonides–Isostatic
supportfromcrust
andupper
mantle,Tectonophysics
(2016),http://dx.doi.org/10.1016/j.tecto.2016.06.023

Fig.
7.Re
sultsof
thefirst
test
forco
mbina
tion
swithan
eclogite
laye
r.Otherwise,sameas
Fig.
6.
8 C. Schiffer et al. / Tectonophysics xxx (2016) xxx–xxx
Please cite this article as: Schiffer, C., et al., Geophysical-petrological modelling of the East Greenland Caledonides – Isostatic support from crustand upper mantle, Tectonophysics (2016), http://dx.doi.org/10.1016/j.tecto.2016.06.023

9C. Schiffer et al. / Tectonophysics xxx (2016) xxx–xxx
(Fig. 5, items I–III) were fixed as well, as defined in Table 2 (items 1–4).Lithologies in the deeper layerswere combined systematically as follows.Structural element IV: Mafic crust (indicated by “C”) or wet mantle 1(“S”). Element V: Mafic crust (“C”) or wet mantle 2 (“S”). Element VI:Wet mantle 3 (“S”) or Cpx-Ol (“M”). Element VII + VIII: Eclogite overProterozoic type mantle (“E”) or both harzburgite (“M”). Each suchmodel is abbreviated with the corresponding letters in elements IV–VII.SSSE, for instance, indicates a model with three hydrated mantle layersin elements IV–VI and an eclogite layer (VII) above lithosphere (VIII).From these 16 possible combinations we ruled out combinations thatconsist of hydrated mantle above mafic crust in the elements IV–VI(mantle wedge), which does not make tectonically sense.
The remaining 12 combinations and their model result are shown inFig. 6 (without eclogite composition in the dipping layer) and Fig. 7(with eclogite) and are summarised in Table 3 together with theresulting misfits between Litmod2D-predictions and observed Bouguergravity, observed topography, and the seismologically derived P- and S-velocities (Vp and Vs). The misfit is measured by the root mean square
error of individual parameter p (RMSE ¼ffiffiffiffiffiffiffiffiffiffiffiffiffiffiffiffiffiffiffiffiffiffiffiffiffiffiffiffiffiffiffiffiffiffiffiffiffiffiffiffiffiffiffi1=n∑ðpobs−pcalcÞ2Þ
q). The
RMSEdiffers strongly between themodels, but less for seismic velocitiesbecause the lithologies were chosen accordingly. Orange shading showsrejected models due to violations of a chosen gravity misfit b50 mGaland/or topography misfit b1000 m.
Table 3Tested model combinations and their RMSE with regard to observed data for test 1. Latin numTable 2). Model codes indicate the composition in layers IV–VII. S: serpentinite (or wet mantlevelocities is uniformly good because candidate lithologies were selected so. The fit to Bouguerejected models due to violations of gravity with misfit larger than 50 mGal and/or topography
Model I II III IV V VI VII VIII
No
ecl
og
ite
SSSM 1 2 3 6 7 8 12 12
SSMM 1 2 3 6 7 9 12 12
CSSM 1 2 3 5 7 8 12 12
CCSM 1 2 3 5 5 8 12 12
CSMM 1 2 3 5 7 9 12 12
CCMM 1 2 3 5 5 9 12 12
Wit
h e
clo
git
e
SSSE 1 2 3 6 7 8 10 11
SSME 1 2 3 6 7 8 10 11
CSSE 1 2 3 5 7 9 10 11
CCSE 1 2 3 5 5 8 10 11
CSME 1 2 3 5 7 9 10 11
CCME 1 2 3 5 5 9 10 11
Please cite this article as: Schiffer, C., et al., Geophysical-petrological modeand upper mantle, Tectonophysics (2016), http://dx.doi.org/10.1016/j.tec
Models comprising a layer of eclogite show a generally better fitthan models without (Table 3, orange rejected models and rejectioncriterion). No clear pattern can be observed with regard to the compo-sition of the “mantle wedge”, where mafic crust, hydrated mantle and“slow” mantle all may be plausible candidates. The best fitting modelcomprises differently hydrated mantle layers in the mantle wedge andeclogitised dipping layer (model SSSE).
4.3.2. Stage 2 – model optimisationIn the second stage, we focussed on improving the fit to gravity
and especially, to topography. This was performed by adjusting layerboundaries and also by allowing a change of crustal densities withinthe moderate limits of ±50 kg/m3. We performed these adjustmentsto the 6 models which were not rejected after the first stage (Table 3).
The results of this second stage modelling are shown in Fig. 8 andTable 4. The topography, whichwasmainly optimised by themodelling,shows very low (b100 m) RMSE for all models. The RMSEs of the otherquantities (BA, FA, Vs, Vp) isolate two models that show a superior fit –SSSE′ and CSSE′. Model SSSE′ comprises hydrated mantle peridotite inthe mantle wedge (IV–VI) and eclogite in the dipping structure (VII)and shows the best fit to the seismic velocities and also a small errorof the gravity response. Model CSSE′, where the uppermost mantlewedge layer (IV) is substituted with mafic lower crust, shows less well
bers indicate the structure (see Fig. 5). Arabic numbers indicate the tested lithology (see); C: crust; M: dry mantle; E: eclogite. The fit to the seismological receiver-function basedr gravity (RMSEBA) and topography (RMSETopo) differs strongly. Orange shading showswith misfit larger than 1000 m (see Figs. 6 and 7).
RMSEBA [mGal]
RMSETopo[m]
RMSEVp[km/s]
RMSEVs[km/s]
45.1 995 0.29 0.16
53.2 873 0.29 0.16
62.2 1482 0.33 0.17
61.9 1835 0.38 0.20
56.0 952 0.33 0.17
40.9 1123 0.37 0.20
27.0 398 0.27 0.15
34.3 1264 0.27 0.15
29.3 830 0.31 0.16
57.1 1126 0.35 0.20
31.3 866 0.31 0.16
27.6 516 0.35 0.20
lling of the East Greenland Caledonides – Isostatic support from crustto.2016.06.023

Fig. 8. Results of the second test. The models are based on the not rejected petrological combinations of test 1 (Figs. 6 and 7, Table 4), but were adjusted mostly in the geometry of the layer interfaces to fit topography sufficiently well. Light greenshading: second best model results; light orange shading: second worst model results. Otherwise, same as Fig. 6. (For interpretation of the references to colour in this figure legend, the reader is referred to the web version of this article.)
10C.Schiffer
etal./Tectonophysicsxxx
(2016)xxx–xxx
Pleasecite
thisarticle
as:Schiffer,C.,etal.,Geophysical-petrologicalm
odellingofthe
EastGreenland
Caledonides–Isostatic
supportfromcrust
andupper
mantle,Tectonophysics
(2016),http://dx.doi.org/10.1016/j.tecto.2016.06.023

Table 4Testedmodel combinations and their RMSEwith regard to observed data for test 2. Romannumbers indicate the structure (see Fig. 5a). Arabic numbers indicate the tested lithology(see Table 2). Model codes indicate the composition in layers IV–VII. S: serpentinite (orwet mantle); C: crust; M: dry mantle; E: eclogite. Red shading shows the worst data fitand orange the second worst RMSE of the tested model. Dark green shading shows thebest RMSE and light green shading second best RMSE of the tested models.
Model I II III IV V VI VII VIII RMSETopo RMSEBA RMSEVp RMSEVs
SSSM′ 1 2 3 6 7 9 12 12 96 32.6 0.39 0.21
CCMM′ 1 2 3 5 7 9 12 12 93 29.0 0.43 0.24
SSSE′ 1 2 3 6 7 8 10 11 87 31.2 0.29 0.16
CSSE′ 1 2 3 5 7 9 10 11 95 27.7 0.36 0.21
CSME′ 1 2 3 5 7 9 10 11 97 31.9 0.33 0.17
CCME′ 1 2 3 5 5 9 10 11 94 31.5 0.37 0.21
11C. Schiffer et al. / Tectonophysics xxx (2016) xxx–xxx
fitting seismic velocities but obtains the best fit for the gravity. Themodel with the largest misfits is SSSM′, which shows an especiallypoor fit of the gravity data. The gravity of CCMM′ fits the observationsrather well, but the seismic velocities are poorly recovered. Thus wedeem models SSSM′ and CCMM′ as unlikely representatives of theupper mantle structure of the CF region. Both models have no eclogiteslab, which is strong support for the presence of such a structure.
The models CSME′ and CCME′ show varying but overall acceptabledata fit. Model CSME′ has a close to average gravity response fit, butgood fit to seismic velocities, while model CCME′ shows about averagefit for all data sets. Model CSME′ has mafic crust and hydrated mantlein the upper two mantle wedge layers (IV–V) on top of “dry mantle”(VI) with a slab of eclogitised crust. Model CCME′ is similar to CSME′,but comprises mafic crustal composition also in the middle mantlewedge layer (V). We deem these two models to be acceptable, but notfavourable representatives of this region. In case higher temperaturesare present, a phase transition, now at 40 kmdepth,might be shallower,which could result in a much better fit of these models (Fig. 8, CCME′ inthe density, Vs and Vp plots).
We suggest that a combination of both favoured models, SSSE′ andCSSE′, and possibly an additional different lithospheric composition inthe eastern part of the profile (models CSME′ and CCME′) might bea realistic representation of the subsurface in the study area. Hence,the uppermost mantle wedge layer may represent a physically orcompositionally mixed structure. The lower continental crust maycontinue to slightly larger depths than assumed in our model or it hasexperienced some physical alternation and/or chemical exchange withthe underlying serpentinised mantle.
5. Discussion
Analysis of the gravityfield in central East Greenland reveals that thearea is close to isoststic compensation on a large scale, whereas small-scale topograpohic features, such as the short-wavelength fjords andhighs are clearly not in local isostatic equilibrium. Forward densitymodelling shows that the upper mantle complexity in the central EastGreenland Caledonides suggested by receiver function analysis is agree-able to the gravity field. All structural elements, suggestive of a fossilsubduction zone complex, obtain a notably better fit as compared to amodel comprising only crustal layers atop of a homogeneous mantlelithosphere. The RMSE of the isostatic topography response is estimatedat 281m suggestive of a limited present-day dynamic support from sub-lithospheric sources, in agreement with a recent estimate of b300 m ofdynamic support in the East Greenland Caledonides (Schiffer andNielsen, 2016). Another important result is that the crust alone is insuf-ficient to support the topography in the eastern part of the CF array,
Please cite this article as: Schiffer, C., et al., Geophysical-petrological modeand upper mantle, Tectonophysics (2016), http://dx.doi.org/10.1016/j.tec
close to the coastline. Here additional buoyancy from the low-densitymantle wedge is present, while to the west the high topographyseems to be compensated by the ~40 km thick crust.
In ourmodel, local isostasy is assumedwith a 50 kmsmoothed topo-graphic response. This is a simplification, and some regional, flexuralcomponents may exist. Glacial isostatic adjustment of the present icesheetwill have an effect on the regional isostatic state in East Greenland.However, our assumptions seem to provide a good first order estimateof the main isostatic components along our profile. A study, addressingthe geodynamic, thermal and isostatic evolution of the study region,including the proposed slab, from its emplacement, over rifting andcontinental break-up to the present day, could give further insightinto this question.
Integrated petrological-geophysical modelling showed which com-positions might be associated to the seismologically obtained velocitiesand associated densities. Two models were favoured (SSSE′ and CSSE′)and another two models also showed satisfying results (CSME′ andCCME′).We suggest that a combination of the two bestmodels, possiblyin addition to two different lithospheric compositions in the west andeast of the dipping structure, is the most favourable solution.
The high velocity lower crustal units probably require partlyeclogitisation or igneous intrusions, or both. The igneous activitymight be the consequence of melting in a subduction setting or duringrifting and continental break-up. Lower crustal bodies have beenattributed to a number of different rocks andmechanisms. One assumedmodel is magmatic underplating or the emplacement of lower crustalintrusions associated to rifting (Mjelde et al., 2002; Thybo andArtemieva, 2013), as commonly suggested for the East Greenlandmargin (Voss et al., 2009 and references therein). Such early Cenozoic,break-up related lower crustal igneous intrusions may have causedvertical movements during emplacement and the subsequent isostaticreadjustment of the crust. However, also serpentinite bodies, nowentrained into the lower crust, are suggested for parts of the NorthAtlantic passive margins, commonly interpreted to be formed duringsyn-rift mantle hydration (Osmundsen and Ebbing, 2008; Reynissonet al., 2010; Lundin and Doré, 2011; Peron-Pinvidic et al., 2013; Rüpkeet al., 2013). In a strict sense, these would not be lower crustal bodies,but since they often are indistinguishable from metamorphosed orintruded lower crust, we will still use this expression for simplicity.Also, older inherited pre-rift structures have been proposed in thisdiscussion, such as metamorphosed crust, older igneous intrusions orserpentinite bodies of, for instance, Caledonian age (Gernigon et al.,2004; Fichler et al., 2011; Mjelde et al., 2013). Recent studies suggest,that the lower crustal bodies at the Norwegian margin are a combina-tion of multiple of the proposed models, often showing differencesbetween distal and proximal margin domains (Mjelde et al., 2013;Nirrengarten et al., 2014). Therefore, our preferred model includeslower crustal bodies of physically or chemically mixed serpentinisedmantle and metamorphosed crustal bodies, and mafic intrusions.Details of the exact structure, extent and relative amount of thepotential compositions in this layer remain uncertain, given the limitedresolution of the receiver function image.
The high velocities in the dipping structure may be explained byeclogitised, mafic crust, which can explain the apparent velocityincrease at the upper interface aswell as the drop at the lower interface.A different mantle composition with higher seismic velocities ispossible, but is lacking an explanation for the additional velocity drop,which cannot be sufficiently recovered by thermal effects.
Beneath the crust, to different degrees hydrated and serpentinisedmantle wedge is favoured, which fills the space between the crust anda dipping layer of eclogitised mafic crust (Fig. 9). The low seismicvelocities may be additionally attributed to a different lithosphericcomposition.
The presented model alternatives do support the existence of asubduction, collision and/or suture zone between two differentcontinental lithospheric blocks. The observed geophysical properties
lling of the East Greenland Caledonides – Isostatic support from crustto.2016.06.023

Fig. 9. Overview of the preferred interpretation and modelling results. (a) Simplified illustration showing the preferred model, including structures and their interpretation.(b) Topography. Blue – observed topography (50 km latitudinal average). Shaded blue area indicates the ice thickness. Stippled blue line – observed topography (100 km latitudinalaverage). Light grey – 50 km average topography south of the study profile. Dark grey line – 50 km average topography north of the study profile. Upper lines indicate ice topography,lower lines indicate bedrock topography. Red – isostatic topography using a running window of 50 km width to average the lithospheric density structure illustrated in d. (c) Bougueranomaly (BA). Blue line – observed BA (50 km latitudinal average). Dotted blue line – observed BA (100 km latitudinal average). Light grey line: 50 km averaged BA, south of theprofile. Dark grey line: 50 km averaged BA north of the study profile. Red – modelled BA from the lithospheric density structure illustrated in d. (d) Lithospheric density model givingrise to the modelled topography in b and BA in c. (For interpretation of the references to colour in this figure legend, the reader is referred to the web version of this article.)
12 C. Schiffer et al. / Tectonophysics xxx (2016) xxx–xxx
and the structure of the crust and upper mantle are well explained bysubduction related processes (Duesterhoeft et al., 2014). As argued inour previous studies, an early Caledonian east-dipping subduction,equivalent to the Grampian and Taconian phases in Britain andNorth America, respectively, is our preferred scenario. An earlier,e.g. Neoproterozoic origin (Cawood et al., 2010) or a younger, intra-cratonic subduction (Gilotti and McClelland, 2011), can also not beruled out at this stage.
6. Conclusions
Receiver function analysis has revealed substantial heterogeneityand structure in the upper mantle of the Central Fjord region in EastGreenland, including a dipping high velocity layer (Vp N 8.3 km/s)
Please cite this article as: Schiffer, C., et al., Geophysical-petrological modeand upper mantle, Tectonophysics (2016), http://dx.doi.org/10.1016/j.tec
below a mantle wedge of intermediate velocities (Vp = 7.3–7.8 km/s).Detailed gravity and isostatic modelling corroborate this result. Further,petrological modelling of different compositions shows which litholo-gies may be associated with the observed velocities.
Themost consistentmodels comprise alternating lower crustal bodiesof intruded, mafic lower crust and serpentinised peridotite on top of ahydratedmantlewedge, and terminated at depth by a layer of eclogitisedmafic crust. The crustal intrusionsmay be subduction related in the prox-imal margin domain, while break-up related intrusions may be expectedin a more distal part of the margin, further east of the study area.
The models confirm that the lithosphere is close to isostaticcompensation and therefore additional dynamic support from thesub-lithospheric mantle is limited. Our analysis showed that the crustof up to approximately 40 km thickness in the west of the profile is
lling of the East Greenland Caledonides – Isostatic support from crustto.2016.06.023

13C. Schiffer et al. / Tectonophysics xxx (2016) xxx–xxx
able to support the highest topography of 1000–1500m,while the iden-tifiedmantle wedge is accounting for additionally support of the topog-raphy in the east. Models including a homogeneous mantle lithosphere,lacking of a hydrated mantle wedge and a dipping eclogite layer, resultin a poor fit, both of the gravity-isostatic models and the geophysical-petrological models.
In summary, our results support the existence of a fossil Caledoniansubduction complex. The topography is isostatically supported fromwithin the lithosphere. The implications of this for the bigger pictureof the orogenic evolution and structural relations lie open for furtherdiscussions and testing.
Acknowledgements
The Central Fjord Array in East Greenland, the project and theproduction of this paper were part of the project “Topography of theNorth Atlantic Realm” (TOPOREAL, financed by the Danish Council forIndependent Research (DFF). We thank DFF, all involved participantsof TOPOREAL and all others who contributed to the discussion of theresults. We want to thank Thorsten Nagel (Aarhus University), FolkerPappa and Erik Duesterhoeft (both Kiel University) for the help withthe usage of Litmod2D, PERPL_EX and for productive discussions. Themanuscript was finalised during C. Schiffer's Carlsberg PostdoctoralFellowship at Durham University. We thank two anonymous reviewersfor constructive comments.
References
Afonso, J.C., Fernàndez, M., Ranalli, G., Griffin, W.L., Connolly, J.a.D., 2008. Integratedgeophysical-petrological modeling of the lithosphere and sublithospheric uppermantle: methodology and applications. Geochem. Geophys. Geosyst. 9 (5), Q05008.http://dx.doi.org/10.1029/2007GC001834.
Andersen, T.B., Jamtveit, B., Dewey, J.F., Swensson, E., 1991. Subduction and eduction ofcontinental crust: major mechanisms during continent-continent collision and oro-genic extensional collapse, a model based on the south Norwegian Caledonides.Terra Nova 3 (3), 303–310. http://dx.doi.org/10.1111/j.1365-3121.1991.tb00148.x.
Andersen, O.B., Knudsen, P., Berry, P.A.M., 2009. The DNSC08GRA global marine gravityfield from double retracked satellite altimetry. J. Geod. 84 (3), 191–199. http://dx.doi.org/10.1007/s00190-009-0355-9.
Anderson, D.L., 2007. New Theory of the Earth. Cambridge University Press, Cambridge,UK ; New York.
Balling, N., 1980. The land uplift in Fennoscandia, gravity field anomalies and isostasy. In:Mörner, N.-A. (Ed.), Earth Rheology, Isostasy and Eustasy. Jon Wiley & Sons, NewYork, pp. 297–321.
Bamber, J.L., Griggs, J.A., Hurkmans, R.T.W.L., Dowdeswell, J.A., Gogineni, S.P., Howat, I.,Mouginot, J., Paden, J., Palmer, S., Rignot, E., Steinhage, D., 2013. A new bed elevationdataset for Greenland. Cryosphere 7 (2), 499–510. http://dx.doi.org/10.5194/tc-7-499-2013.
Braitenberg, C.,Wienecke, S., Ebbing, J., Born,W., Redfield, T., 2007. Joint gravity and isostaticanalysis for basement studies - a novel tool. InternationalWorkshop, Innovation in EM,Grav and Mag Methods: A New Perspective for Exploration Extendended Abstracts.
Braun, A., Kim, H.R., Csatho, B., von Frese, R.R.B., 2007. Gravity-inferred crustal thicknessof Greenland. Earth Planet. Sci. Lett. 262 (1–2), 138–158. http://dx.doi.org/10.1016/j.epsl.2007.07.050.
Brueckner, H.K., 2006. Dunk, dunkless and re-dunk tectonics: a model for metamorphism,lack of metamorphism, and repeated metamorphism of HP/UHP terranes. Int. Geol.Rev. 48 (11), 978–995. http://dx.doi.org/10.2747/0020-6814.48.11.978.
Brueckner, H.K., van Roermund, H.L.M., 2004. Dunk tectonics: a multiple subduction/eduction model for the evolution of the Scandinavian Caledonides. Tectonics 23 (2),TC2004. http://dx.doi.org/10.1029/2003TC001502.
Bryhni, I., Bollingberg, H.J., Graff, P.R., 1969. Eclogites in quartzo-feldspatic gneisses ofNordfjord, West Norway. Nor. Geol. Tidsskr. 49, 193–225.
Cawood, P.A., Strachan, R., Cutts, K., Kinny, P.D., Hand, M., Pisarevsky, S., 2010.Neoproterozoic orogeny along the margin of Rodinia: Valhalla orogen, North Atlantic.Geology 38 (2), 99–102. http://dx.doi.org/10.1130/G30450.1.
Chalmers, J.A., Green, P., Japsen, P., Rasmussen, E.S., 2010. The Scandinavian mountainshave not persisted since the Caledonian orogeny. A comment on Nielsen et al.(2009a). J. Geodyn. 50 (2), 94–101. http://dx.doi.org/10.1016/j.jog.2010.02.001.
Christensen, N.I., 1996. Poisson's ratio and crustal seismology. J. Geophys. Res. Solid Earth101 (B2), 3139–3156. http://dx.doi.org/10.1029/95JB03446.
Christensen, N.I., Mooney, W.D., 1995. Seismic velocity structure and composition of thecontinental crust: a global view. J. Geophys. Res. Solid Earth 100 (B6), 9761–9788.http://dx.doi.org/10.1029/95JB00259.
Cocks, L.R.M., Torsvik, T.H., 2011. The Palaeozoic geography of Laurentia and westernLaurussia: a stable craton with mobile margins. Earth Sci. Rev. 106 (1–2), 1–51.http://dx.doi.org/10.1016/j.earscirev.2011.01.007.
Please cite this article as: Schiffer, C., et al., Geophysical-petrological modeand upper mantle, Tectonophysics (2016), http://dx.doi.org/10.1016/j.tec
Connolly, J.a.D., 1990. Multivariable phase diagrams; an algorithm based on generalizedthermodynamics. Am. J. Sci. 290 (6), 666–718. http://dx.doi.org/10.2475/ajs.290.6.666.
Conrad, C.P., Lithgow-Bertelloni, C., 2006. Influence of continental roots and astheno-sphere on plate-mantle coupling. Geophys. Res. Lett. 33 (5), L05312. http://dx.doi.org/10.1029/2005GL025621.
Corfu, F., Andersen, T.B., Gasser, D., 2014. The Scandinavian Caledonides: main features,conceptual advances and critical questions. Geol. Soc. Lond., Spec. Publ. 390, 9–43.http://dx.doi.org/10.1144/SP390.25.
Dahl-Jensen, T., Larsen, T.B., Woelbern, I., Bach, T., Hanka, W., Kind, R., Gregersen, S.,Mosegaard, K., Voss, P., Gudmundsson, O., 2003. Depth to Moho in Greenland:receiver-function analysis suggests two Proterozoic blocks in Greenland. Earth Planet.Sci. Lett. 205 (3–4), 379–393. http://dx.doi.org/10.1016/S0012-821X(02)01080-4.
Darbyshire, F.A., Larsen, T.B., Mosegaard, K., Dahl-Jensen, T., Gudmundsson, Ó., Bach, T.,Gregersen, S., Pedersen, H.A., Hanka, W., 2004. A first detailed look at the Greenlandlithosphere and upper mantle, using Rayleigh wave tomography. Geophys. J. Int. 158(1), 267–286. http://dx.doi.org/10.1111/j.1365-246X.2004.02316.x.
Deschamps, F., Godard, M., Guillot, S., Hattori, K., 2013. Geochemistry of subduction zoneserpentinites: a review. Lithos 178, 96–127. http://dx.doi.org/10.1016/j.lithos.2013.05.019.
Dewey, J.F., 2005. Orogeny can be very short. Proc. Natl. Acad. Sci. 102 (43), 15286–15293.http://dx.doi.org/10.1073/pnas.0505516102.
Dewey, J.F., Ryan, P.D., Andersen, T.B., 1993. Orogenic uplift and collapse, crustal thick-ness, fabrics and metamorphic phase changes: the role of eclogites. Geol. Soc. Lond.,Spec. Publ. 76 (1), 325–343. http://dx.doi.org/10.1144/GSL.SP.1993.076.01.16.
Doré, A.G., 2002. Exhumation of the North Atlantic Margin: Timing, Mechanisms and Im-plications for Petroleum Exploration. Geological Society of London.
Duesterhoeft, E., Quinteros, J., Oberhänsli, R., Bousquet, R., de Capitani, C., 2014. Relativeimpact of mantle densification and eclogitization of slabs on subduction dynamics:a numerical thermodynamic/thermokinematic investigation of metamorphic densityevolution. Tectonophysics 637, 20–29. http://dx.doi.org/10.1016/j.tecto.2014.09.009.
Ebbing, J., 2007. Isostatic density modelling explains the missing root of the Scandes. Nor.J. Geol. 87, 13–20.
Ebbing, J., England, R.W., Korja, T., Lauritsen, T., Olesen, O., Stratford, W., Weidle, C., 2012.Structure of the Scandes lithosphere from surface to depth. Tectonophysics 536–537,1–24. http://dx.doi.org/10.1016/j.tecto.2012.02.016.
Egholm, D.L., Nielsen, S.B., Pedersen, V.K., Lesemann, J.-E., 2009. Glacial effects limitingmountain height. Nature 460 (7257), 884–887. http://dx.doi.org/10.1038/nature08263.
Fichler, C., Odinsen, T., Rueslåtten, H., Olesen, O., Vindstad, J.E., Wienecke, S., 2011. Crustalinhomogeneities in the Northern North Sea from potential field modeling: inheritedstructure and serpentinites? Tectonophysics 510 (1–2), 172–185. http://dx.doi.org/10.1016/j.tecto.2011.06.026.
Fitton, J.G., Saunders, A.D., Norry, M.J., Hardarson, B.S., Taylor, R.N., 1997. Thermal andchemical structure of the Iceland plume. Earth Planet. Sci. Lett. 153 (3–4), 197–208.http://dx.doi.org/10.1016/S0012-821X(97)00170-2.
Forsberg, R., 1986. Gravity measurements in Jameson Land and neighbouring parts of EastGreenland. Monogr. Greenl. Geosci. 253.
Forsberg, R., Kenyon, S., 2004. Gravity and geoid in the Arctic region - the northern polargap now filled. ESA-ESRIN Proc. Second International GOCE User Workshop “GOCE,The Geoid and Oceanography.”.
Fossen, H., 2010. Extensional tectonics in the North Atlantic Caledonides: a regionalview. Geol. Soc. Lond., Spec. Publ. 335 (1), 767–793. http://dx.doi.org/10.1144/SP335.31.
Foulger, G.R., Natland, J.H., Anderson, D.L., 2005. A source for Icelandic magmas inremelted Iapetus crust. J. Volcanol. Geotherm. Res. 141 (1–2), 23–44. http://dx.doi.org/10.1016/j.jvolgeores.2004.10.006.
Gaina, C., Werner, S.C., Saltus, R., Maus, S., 2011. Chapter 3 Circum-Arctic Mapping Pro-ject: New Magnetic and Gravity Anomaly Maps of the Arctic. Geol. Soc. Lond. Mem.35 (1), 39–48. http://dx.doi.org/10.1144/M35.3.
Gasser, D., 2013. The Caledonides of Greenland, Svalbard and other Arctic areas: status ofresearch and open questions. Geol. Soc. Lond., Spec. Publ. 390, 93–129. http://dx.doi.org/10.1144/SP390.17.
Gee, D.G., Fossen, H., Henriksen, N., Higgins, A.K., 2008. From the early Paleozoic platformsof Baltica and Laurentia to the Caledonide orogen of Scandinavia and Greenland. Ep-isodes, Episodes.
Gernigon, L., Ringenbach, J.-C., Planke, S., Le Gall, B., 2004. Deep structures and breakupalong volcanic riftedmargins: insights from integrated studies along the outer VøringBasin (Norway). Mar. Pet. Geol. 21 (3), 363–372. http://dx.doi.org/10.1016/j.marpetgeo.2004.01.005.
Gernigon, L., Blischke, A., Nasuti, A., Sand,M., 2015. Conjugate volcanic riftedmargins, sea-floor spreading andmicrocontinent: insights fromnewhigh-resolution aeromagneticsurveys in the Norway Basin. Tectonics http://dx.doi.org/10.1002/2014TC003717(p. 2014TC003717).
Gilotti, J.A., McClelland, W.C., 2011. Geochemical and geochronological evidence that theNorth-East Greenland ultrahigh-pressure terrane is Laurentian crust. J. Geol. 119 (5),439–456.
Gołędowski, B., Egholm, D.L., Nielsen, S.B., Clausen, O.R., McGregor, E.D., 2013. Cenozoicerosion and flexural isostasy of Scandinavia. J. Geodyn. 70, 49–57. http://dx.doi.org/10.1016/j.jog.2013.05.004.
Gradmann, S., Ebbing, J., Fullea, J., 2013. Integrated geophysical modelling of a lateral tran-sition zone in the lithospheric mantle under Norway and Sweden. Geophys. J. Int. 194(3), 1358–1373. http://dx.doi.org/10.1093/gji/ggt213.
Henriksen, N., 1999, Conclusion of the 1:500 000 mapping project in the Caledonian foldbelt in North-East Greenland: Geology of Greenland Survey Bulletin, v. 183, p. 10–22.
Henriksen, N., and Higgins, A.K., 2008a, Caledonian orogen of East Greenland 70°N–82°N:geological map at 1:1,000,000—concepts and principles of compilation: GeologicalSociety of America Memoirs, v. 202, p. 345–368, doi: 10.1130/2008.1202(14).
lling of the East Greenland Caledonides – Isostatic support from crustto.2016.06.023

14 C. Schiffer et al. / Tectonophysics xxx (2016) xxx–xxx
Henriksen, N., Higgins, A.K., 2008b. Geological research and mapping in the Caledonianorogen of East Greenland, 70°N–82°N. Geol. Soc. Am. Mem. 202, 1–27. http://dx.doi.org/10.1130/2008.1202(01).
Holland, T.J.B., Powell, R., 1998. An internally consistent thermodynamic data set forphases of petrological interest. J. Metamorph. Geol. 16 (3), 309–343. http://dx.doi.org/10.1111/j.1525-1314.1998.00140.x.
Jakobsson, M., Mayer, L., Coakley, B., Dowdeswell, J.A., Forbes, S., Fridman, B., Hodnesdal,H., Noormets, R., Pedersen, R., Rebesco, M., Schenke, H.W., Zarayskaya, Y., Accettella,D., Armstrong, A., et al., 2012. The International Bathymetric Chart of the ArcticOcean (IBCAO) version 3.0. Geophys. Res. Lett. 39 (12), L12609. http://dx.doi.org/10.1029/2012GL052219.
Japsen, P., Chalmers, J.A., 2000. Neogene uplift and tectonics around the North Atlantic:overview. Glob. Planet. Chang. 24 (3–4), 165–173. http://dx.doi.org/10.1016/S0921-8181(00)00006-0.
Karabinos, P., Samson, S.D., Hepburn, J.C., Stoll, H.M., 1998. Taconian orogeny in the NewEngland Appalachians: collision between Laurentia and the Shelburne Falls arc. Geology26 (3), 215–218. http://dx.doi.org/10.1130/0091-7613(1998)026b0215:TOITNEN2.3.CO;2.
Kenyon, S., Forsberg, R., Coakley, B., 2008. New gravity field for the Arctic. EOS Trans. Am.Geophys. Union 89 (32), 289–290. http://dx.doi.org/10.1029/2008EO320002.
Korenaga, J., 2004. Mantle mixing and continental breakup magmatism. Earth Planet. Sci.Lett. 218 (3–4), 463–473. http://dx.doi.org/10.1016/S0012-821X(03)00674-5.
Kumar, P., Kind, R., Priestley, K., Dahl-Jensen, T., 2007. Crustal structure of Iceland andGreenland from receiver function studies. J. Geophys. Res. Solid Earth 112 (B3).http://dx.doi.org/10.1029/2005JB003991 (p. n/a–n/a).
Lachenbruch, A.H., Morgan, P., 1990. Continental extension, magmatism and elevation;formal relations and rules of thumb. Tectonophysics 174 (1–2), 39–62. http://dx.doi.org/10.1016/0040-1951(90)90383-J.
Leslie, A.G., Smith, M., Scoper, N.J., 2008. Laurentian margin evolution and the Caledonianorogeny - a template for Scotland and East Greenland. The GreenlandCaledonidesGSA Memoirs Vol. 202. The Geological Society of America.
Lidmar-Bergström, K., Näslund, J.O., 2002. Landforms and uplift in Scandinavia. Geol. Soc.Lond., Spec. Publ. 196 (1), 103–116. http://dx.doi.org/10.1144/GSL.SP.2002.196.01.07.
Lundin, E.R., Doré, A.G., 2011. Hyperextension, serpentinization, and weakening: a newparadigm for rifted margin compressional deformation. Geology 39 (4), 347–350.http://dx.doi.org/10.1130/G31499.1.
Markl, G., Bucher, K., 1997. Proterozoic eclogites from the Lofoten islands, northernNorway. Lithos 42 (1–2), 15–35. http://dx.doi.org/10.1016/S0024-4937(97)00034-0.
Maupin, V., Agostini, A., Artemieva, I., Balling, N., Beekman, F., Ebbing, J., England, R.W.,Frassetto, A., Gradmann, S., Jacobsen, B.H., Köhler, A., Kvarven, T., Medhus, A.B.,Mjelde, R., et al., 2013. The deep structure of the Scandes and its relation to tectonichistory and present-day topography. Tectonophysics 602, 15–37. http://dx.doi.org/10.1016/j.tecto.2013.03.010.
Medvedev, S., Hartz, E.H., 2015. Evolution of topography of post-Devonian Scandinavia:effects and rates of erosion. Geomorphology 231, 229–245. http://dx.doi.org/10.1016/j.geomorph.2014.12.010.
Medvedev, S., Souche, A., Hartz, E.H., 2013. Influence of ice sheet and glacial erosion onpassive margins of Greenland. Geomorphology 193, 36–46. http://dx.doi.org/10.1016/j.geomorph.2013.03.029.
Miyashiro, A., Shido, F., Ewing, M., 1969. Composition and origin of serpentinites from theMid-Atlantic Ridge near 24° and 30° North Latitude. Contrib. Mineral. Petrol. 23 (2),117–127. http://dx.doi.org/10.1007/BF00375173.
Mjelde, R., Kasahara, J., Shimamura, H., Kamimura, A., Kanazawa, T., Kodaira, S., Raum, T.,Shiobara, H., 2002. Lower crustal seismic velocity-anomalies; magmatic underplatingor serpentinized peridotite? Evidence from the Vøring Margin, NE Atlantic. Mar.Geophys. Res. 23 (2), 169–183. http://dx.doi.org/10.1023/A:1022480304527.
Mjelde, R., Goncharov, A., Müller, R.D., 2013. The Moho: boundary above upper mantle pe-ridotites or lower crustal eclogites? A global review and new interpretations for passivemargins. Tectonophysics 609, 636–650. http://dx.doi.org/10.1016/j.tecto.2012.03.001.
Mørk, M.B.E., 1986. Coronite and eclogite formation in olivine gabbro (western Norway):reaction paths and garnet zoning. Mineral. Mag. 50 (3), 417–426.
Mysen, B.O., Heier, K.S., 1972. Petrogenesis of eclogites in high grade metamorphicgneisses, exemplified by the Hareidland eclogite, western Norway. Contrib. Mineral.Petrol. 36 (1), 73–94. http://dx.doi.org/10.1007/BF00372836.
Nielsen, S.B., Stephenson, R., Thomsen, E., 2007. Dynamics of Mid-Palaeocene North At-lantic rifting linked with European intra-plate deformations. Nature 450 (7172),1071–1074. http://dx.doi.org/10.1038/nature06379.
Nielsen, S.B., Gallagher, K., Egholm, D.L., Clausen, O.R., Summerfield, M., 2009a. Reply tocomment regarding the ICE-hypothesis. J. Geodyn. 48 (2), 101–106. http://dx.doi.org/10.1016/j.jog.2009.06.004.
Nielsen, S.B., Gallagher, K., Leighton, C., Balling, N., Svenningsen, L., Jacobsen, B.H., Thomsen,E., Nielsen, O.B., Heilmann-Clausen, C., Egholm, D.L., Summerfield, M.A., Clausen, O.R.,Piotrowski, J.A., Thorsen, M.R., et al., 2009b. The evolution of western Scandinaviantopography: a review of Neogene uplift versus the ICE (isostasy–climate–erosion)hypothesis. J. Geodyn. 47 (2–3), 72–95. http://dx.doi.org/10.1016/j.jog.2008.09.001.
Nirrengarten, M., Gernigon, L., Manatschal, G., 2014. Lower crustal bodies in the Møre vol-canic rifted margin: geophysical determination and geological implications.Tectonophysics 636, 143–157. http://dx.doi.org/10.1016/j.tecto.2014.08.004.
Osmundsen, P.T., Ebbing, J., 2008. Styles of extension offshore mid-Norway and implica-tions for mechanisms of crustal thinning at passive margins. Tectonics 27 (6),TC6016. http://dx.doi.org/10.1029/2007TC002242.
Please cite this article as: Schiffer, C., et al., Geophysical-petrological modeand upper mantle, Tectonophysics (2016), http://dx.doi.org/10.1016/j.tec
Pascal, C., Olesen, O., 2009. Are the Norwegian mountains compensated by a mantle ther-mal anomaly at depth? Tectonophysics 475 (1), 160–168. http://dx.doi.org/10.1016/j.tecto.2009.01.015.
Pedersen, V.K., Egholm, D.L., Nielsen, S.B., 2010. Alpine glacial topography and the rate ofrock column uplift: a global perspective. Geomorphology 122 (1–2), 129–139. http://dx.doi.org/10.1016/j.geomorph.2010.06.005.
Peron-Pinvidic, G., Manatschal, G., Osmundsen, P.T., 2013. Structural comparison of arche-typal Atlantic rifted margins: a review of observations and concepts. Mar. Pet. Geol.43, 21–47. http://dx.doi.org/10.1016/j.marpetgeo.2013.02.002.
Reynisson, R.F., Ebbing, J., Lundin, E., Osmundsen, P.T., 2010. Properties and distribution oflower crustal bodies on the mid-Norwegian margin. Geol. Soc. Lond. Pet. Geol. Conf.Ser. 7, 843–854. http://dx.doi.org/10.1144/0070843.
Roberts, D., 2003. The Scandinavian Caledonides: event chronology, palaeogeographicsettings and likely modern analogues. Tectonophysics 365 (1–4), 283–299. http://dx.doi.org/10.1016/S0040-1951(03)00026-X.
Rohrman, M., van der Beek, P., 1996. Cenozoic postrift domal uplift of North Atlantic mar-gins: an asthenospheric diapirism model. Geology 24 (10), 901. http://dx.doi.org/10.1130/0091-7613(1996)024b0901:CPDUONN2.3.CO;2.
Rudnick, R.L., Gao, S., 2003. 3.01 - composition of the continental crust. In: Turekian,H.D.H.K. (Ed.), Treatise on Geochemistry. Pergamon, Oxford, pp. 1–64.
Rüpke, L.H., Schmid, D.W., Perez-Gussinye, M., Hartz, E., 2013. Interrelation betweenrifting, faulting, sedimentation, and mantle serpentinization during continental mar-gin formation—including examples from the Norwegian Sea. Geochem. Geophys.Geosyst. 14 (10), 4351–4369. http://dx.doi.org/10.1002/ggge.20268.
Saunders, A.D., Fitton, J.G., Kerr, A.C., Norry, M.J., Kent, R.W., 1997. The North Atlantic Ig-neous Province. In: J.honey, J., Coffin, M.F. (Eds.), Large Igneous Provinces: Continen-tal, Oceanic, and Planetary Flood Volcanism. American Geophysical Union, pp. 45–93.
Schiffer, C., Nielsen, S.B., 2016. Implications for anomalous mantle pressure and dynamictopography from lithospheric stress patterns in the North Atlantic Realm. J. Geodyn.98, 53–69. http://dx.doi.org/10.1016/j.jog.2016.03.014.
Schiffer, C., Balling, N., Jacobsen, B.H., Stephenson, R.A., Nielsen, S.B., 2014. Seismologicalevidence for a fossil subduction zone in the East Greenland Caledonides. Geology42 (4), 311–314. http://dx.doi.org/10.1130/G35244.1.
Schiffer, C., Jacobsen, B.H., Balling, N., Ebbing, J., Nielsen, S.B., 2015a. The East GreenlandCaledonides—teleseismic signature, gravity and isostasy. Geophys. J. Int. 203 (2),1400–1418. http://dx.doi.org/10.1093/gji/ggv373.
Schiffer, C., Stephenson, R.A., Petersen, K.D., Nielsen, S.B., Jacobsen, B.H., Balling, N.,Macdonald, D.I.M., 2015b. A sub-crustal piercing point for North Atlantic reconstruc-tions and tectonic implications. Geology 43 (12), 1087–1090. http://dx.doi.org/10.1130/G37245.1.
Schmidt, S., Götze, H.J., Fichler, C., Alvers, M., 2010. IGMAS+ – a new 3D Gravity,FTG and Magnetic Modeling Software. Konferenzband GEO-INFORMATIK 2010 DieWelt im Netz, Herausgeber. Akademische Verlagsgesellschaft AKA GmbH, pp. 57–63.
Schmidt-Aursch, M.C., Jokat, W., 2005. The crustal structure of central East Greenland—II:from the Precambrian shield to the recent mid-oceanic ridges. Geophys. J. Int. 160(2), 753–760. http://dx.doi.org/10.1111/j.1365-246X.2005.02515.x.
Skogseid, J., Planke, S., Faleide, J.I., Pedersen, T., Eldholm, O., Neverdal, F., 2000. NE Atlanticcontinental rifting and volcanic margin formation. Geol. Soc. Lond., Spec. Publ. 167(1), 295–326. http://dx.doi.org/10.1144/GSL.SP.2000.167.01.12.
Smythe, D.K., Dobinson, A., McQuillin, R., Brewer, J.A., Matthews, D.H., Blundell, D.J., Kelk,B., 1982. Deep structure of the Scottish Caledonides revealed by the MOIST reflectionprofile. Nature 299 (5881), 338–340. http://dx.doi.org/10.1038/299338a0.
Snyder, D.B., Flack, C.A., 1990. A Caledonian age for reflectors within the mantle litho-sphere north and west of Scotland. Tectonics 9 (4), 903–922. http://dx.doi.org/10.1029/TC009i004p00903.
Steltenpohl, M., Hames, W., Andresen, A., Markl, G., 2003. New Caledonian eclogite prov-ince in Norway and potential Laurentian (Taconic) and Baltic links. Geology 31 (11),985–988. http://dx.doi.org/10.1130/G19744.1.
Streule, M.J., Strachan, R.A., Searle, M.P., Law, R.D., 2010. Comparing Tibet-Himalayan andCaledonian crustal architecture, evolution and mountain building processes. Geol.Soc. Lond., Spec. Publ. 335 (1), 207–232. http://dx.doi.org/10.1144/SP335.10.
Tegner, C., Lesher, C.E., Larsen, L.M., Watt, W.S., 1998. Evidence from the rare-earth-element record of mantle melting for cooling of the Tertiary Iceland plume. Nature395 (6702), 591–594. http://dx.doi.org/10.1038/26956.
Thybo, H., Artemieva, I.M., 2013. Moho and magmatic underplating in continental litho-sphere. Tectonophysics 609, 605–619. http://dx.doi.org/10.1016/j.tecto.2013.05.032.
van Staal, C.R.,Whalen, J.B., Valverde-Vaquero, P., Zagorevski, A., Rogers, N., 2009. Pre-Car-boniferous, episodic accretion-related, orogenesis along the Laurentian margin of thenorthern Appalachians. Geol. Soc. Lond., Spec. Publ. 327 (1), 271–316. http://dx.doi.org/10.1144/SP327.13.
Voss, M., Schmidt-Aursch, M.C., Jokat, W., 2009. Variations in magmatic processes alongthe East Greenland volcanic margin. Geophys. J. Int. 177 (2), 755–782. http://dx.doi.org/10.1111/j.1365-246X.2009.04077.x.
Warner, M., Morgan, J., Barton, P., Morgan, P., Price, C., Jones, K., 1996. Seismic reflectionsfrom themantle represent relict subduction zones within the continental lithosphere.Geology 24 (1), 39–42. http://dx.doi.org/10.1130/0091-7613(1996)024b0039:SRFTMRN2.3.CO;2.
Xu, W., Lithgow-Bertelloni, C., Stixrude, L., Ritsema, J., 2008. The effect of bulk composi-tion and temperature on mantle seismic structure. Earth Planet. Sci. Lett. 275 (1–2),70–79. http://dx.doi.org/10.1016/j.epsl.2008.08.012.
lling of the East Greenland Caledonides – Isostatic support from crustto.2016.06.023


