Embed Size (px)
Citation preview

Geophysical Research Letters
RESEARCH LETTER10.1002/2014GL062401
Key Points:• New seismic method reveals crustal
variations across North AnatolianFault
• Fault strands follow existinggeological terrane boundaries
• Complex isostatic state due toheterogeneous crust and mantledensity
Supporting Information:• Table S1
Correspondence to:A. W. Frederiksen,[email protected]
Citation:Frederiksen, A. W., et al. (2015), Crustalthickness variations and isostaticdisequilibrium across the NorthAnatolian Fault, westernTurkey, Geophys. Res. Lett., 42,doi:10.1002/2014GL062401.
Received 3 NOV 2014
Accepted 13 JAN 2015
Accepted article online 16 JAN 2015
This is an open access article underthe terms of the Creative Com-mons Attribution License, whichpermits use, distribution and repro-duction in any medium, providedthe original work is properly cited.
Crustal thickness variations and isostatic disequilibriumacross the North Anatolian Fault, western TurkeyA. W. Frederiksen1, D. A. Thompson2,3, S. Rost3, D. G. Cornwell2, L. Gülen4, G. A. Houseman3,M. Kahraman5, S. A. Poyraz5, U. M. Teoman5, N. Türkelli5, and M. Utkucu4
1Department of Geological Sciences, University of Manitoba, Winnipeg, Manitoba, Canada, 2School of Geosciences,University of Aberdeen, Aberdeen, UK, 3School of Earth and Environment, University of Leeds, Leeds, UK, 4Department ofGeophysical Engineering, Sakarya University, Sakarya, Turkey, 5Geophysics Department, Kandilli Observatory andEarthquake Research Institute, Bogazici University, Istanbul, Turkey
Abstract We use teleseismic recordings from a dense array of seismometers straddling both strandsof the North Anatolian Fault Zone to determine crustal thickness, P/S velocity ratio and sedimentary layerthickness. To do this, we implement a new grid search inversion scheme based on the use of transferfunctions, removing the need for deconvolution for source normalization and therefore eliminatingcommon problems associated with crustal-scale receiver function analysis. We achieve a good fit to thedata except at several stations located in Quaternary sedimentary basins, where our two-layer crustalmodel is likely to be inaccurate. We find two zones of thick sedimentary material: one north of the northernfault branch, and one straddling the southern branch. The crustal thickness increases sharply north of thenorthern strand of the North Anatolian Fault Zone (NAFZ), where the fault nearly coincides with the traceof the Intra-Pontide Suture; the velocity ratio changes across the southern fault strand, indicating a changein basement composition. We interpret these changes to indicate that both strands of the NAFZ followpreexisting geological boundaries rather than being ideally aligned with the stress field. The thick crustnorth of the northern NAFZ strand is associated with low topography and so is inconsistent with simplemodels of isostatic equilibrium, requiring a contribution from mantle density variations, such as possibleloading from underthrust Black Sea oceanic lithosphere.
1. Introduction
The formation and evolution of active interplate faults is a balance between accommodation of the requiredstrain field and exploitation of preexisting weak zones from past geological processes. How this balance isresolved in particular cases and in three dimensions is the source of considerable debate. A good exampleof this type of setting is the North Anatolian Fault Zone (NAFZ), a ≈1500 km long right-lateral strike-slipsystem which forms the northern boundary of the Anatolian Plate [Salah et al., 2007]. The NAFZ is a younggeologic feature that formed by westward propagation, reaching western Turkey circa 200 ka [Sengör et al.,2005]; its seismicity also displays a westward progression and represents a major source of seismic hazard.In western Turkey, the NAFZ divides into northern and southern strands [Karimi et al., 2014] whoserelationship is not entirely clear. The northern strand is currently the more seismically active of the twoand was the location of two devastating earthquakes near Izmit and Düzce in 1999 [Barka et al., 2002; Gülenet al., 2002].
Turkey consists, for the most part, of an amalgam of continental fragments and oceanic remnants thatassembled in the late Tertiary, due to the closing of the Tethyan Ocean and the Alpide orogenic system[Sengör and Yilmaz, 1981; Okay, 2008]. The NAFZ approximately parallels the resulting east-west tectonicfabric; in western Turkey, the NAFZ follows the trend of Tethyside accretionary complexes [Sengör et al.,2005], with the northern branch lying close to the Intra-Pontide Suture (IPS) between the accretionarySakarya Terrane and the Istanbul Zone (a continental fragment with Late Proterozoic basement) [Okay,2008]. Sedimentary cover of variable age and thickness is prominent in western Turkey. Notably, extensionalong a number of east-west trending grabens resulted in thick deposits of Neogene sediments [Sari andSalk, 2006], in places up to 4 km thick.
Researchers from the University of Leeds, the Kandilli Observatory, and Sakarya University installed adense array of broadband seismometers in western Turkey from May 2012 through September 2013,
FREDERIKSEN ET AL. ©2015. The Authors. 1

Geophysical Research Letters 10.1002/2014GL062401
Figure 1. Study area and instrumentation. The SEIS-UK Dense Array forNorth Anatolia instrumentation (circles) is supplemented by temporarystations KO01 through KO07 (diamonds) and permanent stations GULT,SAUV, and SPNC, operated by Kandilli Observatory, Bogaziçi University(triangles). Background shading is topography from the NASA ShuttleRadar Topographic Mission [Jarvis et al., 2008]. Thick black lines are faulttraces; dashed black lines are major sutures [Okay, 2008], and red linesindicate the rupture zone of the 1999 Izmit earthquake [Barka et al., 2002].Thin black lines outline Quaternary basins [Oguz and Sasatani, 2004; Doganet al., 2014].
in order to examine crustal andmantle structures associated withthe NAFZ. The array consisted of66 stations with a nominal stationspacing of 7 km (DA01 throughDF11; Figure 1) and included threestations of the Kandilli Observatoryand Earthquake Research Institutenetwork (GULT, SAUV, and SPNC).The stations were deployed on sixnorth-south trending lines, eachcontaining 11 stations. This densearray was supplemented by sevenstations forming a semicircle aroundthe east side of the dense grid(KO01 through KO07). The arraywas deployed across the rupture ofthe 1999 Izmit (Kocaeli) earthquake[Barka et al., 2002] and crosses bothsurface strands of the NAFZ in thisregion. The array straddles the IPS andsamples three main crustal blocks:the Istanbul Zone in the north andthe Sakarya Terrane in the south,separated by the Armutlu-AlmacıkBlock in the center of the array.
2. Data and Analysis
From the 16 months of recordeddata, teleseismic events with
magnitudes greater than 5.5 were visually examined for P wave signal-to-noise ratio on the vertical andhorizontal components. A total of 21 high-quality events were retained for further analysis, from whichwe retained a time window stretching from 10 s prior to the IASP91-predicted P wave arrival to 30 s afterthe predicted arrival. A few traces were removed at individual stations due to noise problems or wereabsent due to data loss. The retained time windows are dominated by the P arrival and its associated coda(see, e.g., Figure 2b).
Crustal thickness is commonly measured from the teleseismic P coda using the popular H-k stackingmethod [Zhu and Kanamori, 2000]. This is a two-stage process in which receiver functions are generated bydeconvolution of (most commonly) the vertical component from the radial component, followed bystacking along predicted arrival-time curves for Ps conversions and reverberations for a grid of assumedMoho depths (H) and crustal P/S velocity ratios (k). The total stacked amplitude is expected to reach amaximum when the predicted arrival-time curves are most accurate, i.e., when the Moho depth (H) andP/S velocity ratio (k) values are closest to being correct.
The assumptions of H-k stacking are violated in the presence of complex crustal structures, particularly incases where strong intracrustal velocity contrasts are present, as is often the case in sedimentary basins.Sedimentary basins can introduce a strongly oscillatory character to receiver functions [Zelt and Ellis, 1999],which can complicate H-k analysis and yield inaccurate or ambiguous results [Yeck et al., 2013]. In lieu of H-kstacking, we apply a recently developed transfer function technique which avoids deconvolution and allowsfor the inclusion of a sedimentary layer in the analysis.
The transfer function technique involves using ray theory to predict the transfer function Tzr , which relatesthe vertical to the radial component of teleseismic data, for a given assumed Earth model. If the radialand vertical Green’s functions of the receiver-side structure are represented by Gr and Gz , and the sourcewaveform is S, the recorded teleseismic traces are, in the frequency domain, R = SGr and Z = SGz for the
FREDERIKSEN ET AL. ©2015. The Authors. 2

Geophysical Research Letters 10.1002/2014GL062401
1.6 1.7 1.8 1.930
35
40
45
Tot
al c
rust
al th
ickn
ess
(km
)
Basement P/S velocity ratio
0 5 10 15 20 25 30
2
4
6
8
10
12
14
16
18
20
Eve
nt n
umbe
r
Time relative to expected P arrival (s)
a) DA01 misfit surface
b) DA01 data fit
Figure 2. Sample result of a transfer function grid search at a stationwith good data quality. (a) Misfit surface (lighter colors: lower misfit)plotted against the crustal thickness and P/S velocity ratio axes. Eachpoint on this 2-D grid is assigned a value representing the lowestmisfit obtained on the third axis (sediment thickness). The best fittingmodel is indicated by an asterisk, surrounded by a 95% confidencecontour (dashed); symmetric error bars (gray) are derived from theconfidence contour. (b) The predicted radial component (dashed)corresponding to the best fitting model from the search in Figure 2a,and the corresponding true radial component (solid). The fit shownhere corresponds to a normalized misfit of 0.0902.
radial and vertical components, respec-tively. The transfer function is then simplythe spectral ratio of the Green’s functions:
Tzr(𝜔) =Gr(𝜔)Gz(𝜔)
(1)
and the relation between the radial (R)and vertical (Z) components is given by
R(𝜔)=S(𝜔)Gr(𝜔)=Z(𝜔)
Gz(𝜔)Gr(t)=Tzr(𝜔)Z(𝜔)
(2)where the source contribution S iscanceled out. For a given Earth structure,we can use ray theory to generate atransfer function and then use it topredict the radial component from thevertical. This approach makes it possibleto determine the consistency of a dataset with a range of models withoutneeding to deconvolve, in similar fashionto the cross-convolution approach ofBodin et al. [2014]. It also becomespossible to include a multilayered crust inthe analysis.
We used the transfer function techniqueto perform a grid search over threeparameters: the total crustal thickness(H), the P/S velocity ratio of the basement(k), and the thickness of an overlyingsedimentary layer. We held thesedimentary P and S velocities fixed,in this case at 5.0 km/s and 2.9 km/s,respectively, in line with the valuesused by Salah et al. [2007] in the samearea. Crustal thickness was variedfrom 30 to 45 km at 0.5 km intervals,the range being selected to be in linewith past studies of crustal thicknessin western Turkey [Mutlu and Karabulut,2011; Tezel et al., 2013; Vanacore et al.,2013]. The P/S velocity ratio was allowedto vary from 1.6 to 1.9 at intervals of 0.02;the sediment thickness range used was0 to 5.5 km at 0.5 km intervals [Sari and
Salk, 2006; Tigli et al., 2012]. The misfit we used was the variance of the difference between the predictedand measured radial traces:
mL2 = 1NtNs
Nt∑j=1
Ns∑k=1
(rj,k − r p
j,k
)2(3)
allowing us to calculate error bars using the F test approach commonly used in shear wave splitting analysis[Walsh et al., 2013]. The square root of this value (root-mean-square misfit) is given in the table and plots.
A sample grid search result for a good quality station (DA01) is shown in Figure 2; the misfit (a root-mean-square measure) obtained in this case was 0.0902, with a recovered sedimentary thickness of 3.0 km.
FREDERIKSEN ET AL. ©2015. The Authors. 3

Geophysical Research Letters 10.1002/2014GL062401
Figure 3. (a) Lowest value of misfit between real and predicted radial component seismograms achieved at each station.Stations in black exceeded a misfit threshold of 0.18 and were excluded from further analysis. (b) Best fit sedimentarythickness at retained stations. Faults (black) and basin outlines (magenta) are indicated on both panels. (c) Error bar ofrecovered crustal thickness. (d) Error bar of recovered P/S velocity ratio.
Figure 3a shows the variation in misfit across the instrument array; stations in black were removed fromthe data set due to misfits exceeding a threshold of 0.18, which were often accompanied by an obviousvisual mismatch between the observed and predicted radial components (generally in the form of a majordifference in amplitude). Figures 3c and 3d show the error bars on crustal thickness and velocity ratio, whichare generally larger for noisier stations. The majority of these high-misfit stations lies within the QuaternaryAdapazarı and Pamukova basins, where the near-surface velocity is very low [Komazawa et al., 2002] and ourtwo-layer model is likely inadequate, particularly given the considerable basement topography under thesebasins. Our assumed sedimentary velocities are more appropriate for older basins containing sedimentaryrock than for unconsolidated Quaternary material.
In order to test the sensitivity of the results to variations in sediment velocity, we ran three additionalanalyses with different P velocities (3.5, 4, and 4.5 km/s) in the uppermost layer, with the P/S ratio fixedat 1.73. The final misfit was insensitive to the sediment velocity, varying on average by 4% between thebest and worst values. We found that the sediment thickness trades off with velocity (for example, DA01’srecovered sediment thickness ranges from 2 km at low sediment velocities to 3 km at the 5 km/s velocityused in the final results) and is therefore only interpretable in a relative sense. The overall crustal thicknessis similarly affected, though by a proportionally smaller amount (32.5 to 34.5 km at DA01), and its overallpattern is not changed. The pattern of basement P/S ratio shows changes at low sediment velocities(3.5 or 4 km/s) and so should be interpreted with some caution. We conclude that the teleseismic data aresensitive to aspects of the near-surface structure that they cannot constrain; our preferred approach is
FREDERIKSEN ET AL. ©2015. The Authors. 4
Geophysical Research Letters 10.1002/2014GL062401
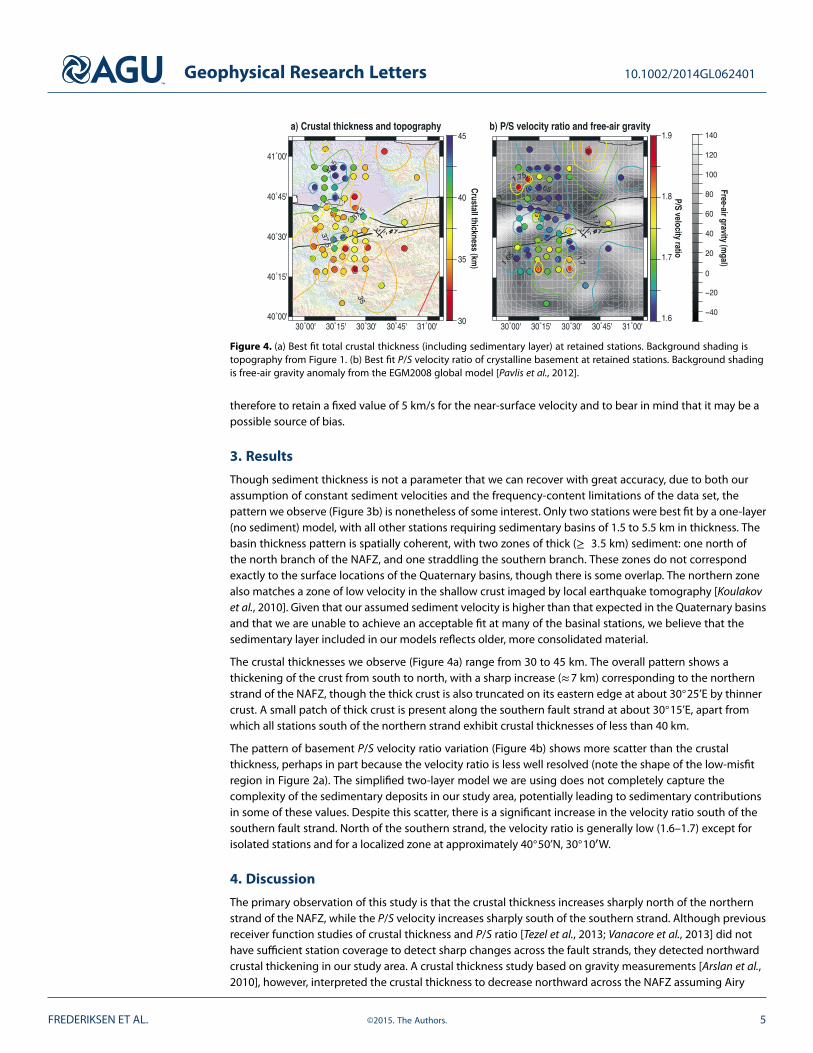
Figure 4. (a) Best fit total crustal thickness (including sedimentary layer) at retained stations. Background shading istopography from Figure 1. (b) Best fit P/S velocity ratio of crystalline basement at retained stations. Background shadingis free-air gravity anomaly from the EGM2008 global model [Pavlis et al., 2012].
therefore to retain a fixed value of 5 km/s for the near-surface velocity and to bear in mind that it may be apossible source of bias.
3. Results
Though sediment thickness is not a parameter that we can recover with great accuracy, due to both ourassumption of constant sediment velocities and the frequency-content limitations of the data set, thepattern we observe (Figure 3b) is nonetheless of some interest. Only two stations were best fit by a one-layer(no sediment) model, with all other stations requiring sedimentary basins of 1.5 to 5.5 km in thickness. Thebasin thickness pattern is spatially coherent, with two zones of thick (≥ 3.5 km) sediment: one north ofthe north branch of the NAFZ, and one straddling the southern branch. These zones do not correspondexactly to the surface locations of the Quaternary basins, though there is some overlap. The northern zonealso matches a zone of low velocity in the shallow crust imaged by local earthquake tomography [Koulakovet al., 2010]. Given that our assumed sediment velocity is higher than that expected in the Quaternary basinsand that we are unable to achieve an acceptable fit at many of the basinal stations, we believe that thesedimentary layer included in our models reflects older, more consolidated material.
The crustal thicknesses we observe (Figure 4a) range from 30 to 45 km. The overall pattern shows athickening of the crust from south to north, with a sharp increase (≈7 km) corresponding to the northernstrand of the NAFZ, though the thick crust is also truncated on its eastern edge at about 30◦25’E by thinnercrust. A small patch of thick crust is present along the southern fault strand at about 30◦15’E, apart fromwhich all stations south of the northern strand exhibit crustal thicknesses of less than 40 km.
The pattern of basement P/S velocity ratio variation (Figure 4b) shows more scatter than the crustalthickness, perhaps in part because the velocity ratio is less well resolved (note the shape of the low-misfitregion in Figure 2a). The simplified two-layer model we are using does not completely capture thecomplexity of the sedimentary deposits in our study area, potentially leading to sedimentary contributionsin some of these values. Despite this scatter, there is a significant increase in the velocity ratio south of thesouthern fault strand. North of the southern strand, the velocity ratio is generally low (1.6–1.7) except forisolated stations and for a localized zone at approximately 40◦50’N, 30◦10′W.
4. Discussion
The primary observation of this study is that the crustal thickness increases sharply north of the northernstrand of the NAFZ, while the P/S velocity increases sharply south of the southern strand. Although previousreceiver function studies of crustal thickness and P/S ratio [Tezel et al., 2013; Vanacore et al., 2013] did nothave sufficient station coverage to detect sharp changes across the fault strands, they detected northwardcrustal thickening in our study area. A crustal thickness study based on gravity measurements [Arslan et al.,2010], however, interpreted the crustal thickness to decrease northward across the NAFZ assuming Airy
FREDERIKSEN ET AL. ©2015. The Authors. 5

Geophysical Research Letters 10.1002/2014GL062401
isostasy. The large thickness jump we observe at the northern strand of the NAFZ also corresponds to thelocation of the Intra-Pontide Suture (IPS) and so may predate the NAFZ; it is also possible that the fault’strajectory was influenced by the presence of the suture.
Though our P/S velocity ratio measurements are more scattered (and likely have greater uncertainties)than our thickness measurements, they indicate a change in velocity ratio (and so presumably crustalcomposition) across the southern strand of the NAFZ. The tomographic models of Salah et al. [2007] andKoulakov et al. [2010] also show significant P/S velocity ratio variations in the area, though the variationsthey observe are less systematic. The velocity ratio generally decreases with increasing felsic content, due tothe very low ratio for quartz [Christensen, 1996], indicating more mafic material south of the southern faultstrand. Given that we see a compositional change, which is unlikely to be related to the fault itself, it seemslikely that both strands of the NAFZ follow preexisting geological boundaries. If this is the case, the resultingimperfect alignment with the stress field would potentially produce localized uplift and pop-up structuresand so affect the pattern of topography. The coincidence between the surface location of the fault strandsand the changes in crustal properties that we observe suggests that both strands of the NAFZ are verticalor near vertical through much of the crust. Models of fault zone deformation [Platt and Behr, 2011] suggestthat plate-boundary strike-slip faults become broad shear zones in the midcrust, which would imply thatthe NAFZ strands merge at depth; our results suggest that this is not the case.
A peculiarity of the thickness change that we observe is that the thickest crust is associated with low ratherthan high topography (Figure 4a), indicating that under the assumption of constant-density crust and nomantle variations, the crust is not in Airy isostatic equilibrium. This observation is the presumed causeof differences between our crustal thickness pattern and that determined by Arslan et al. [2010]. A likelyexplanation is that both of these assumptions are incorrect: the crustal density is likely to be nonuniform,given that the northern strand of the NAFZ corresponds to a suture and the southern strand correspondsto a change in velocity ratio, and the mantle is likely to contain significant density variations. Notably,Fichtner et al. [2013] used waveform tomography to resolve a linear low-velocity zone in the lithospherebelow the eastern and central portion of the NAFZ, extending to a depth of 100 km, which they interpretas the lithospheric expression of Tethyan sutures (including the IPS) as well as a zone of weakness that mayhave played a role in determining the trajectory of the NAFZ. If this low-velocity zone represents a zone ofhigher temperature than the surrounding lithosphere and continues westward beneath our target area,then it may provide isostatic support for the thinner crust between the fault strands and so account for theassociation of thinner crust with higher topography [Flament et al., 2013]. There is also evidence that oceaniclithosphere from the Black Sea underlies the crust north of the NAFZ [Gülen et al., 2002] and may be a causeof isostatic loading and low topography.
5. Conclusions
We have successfully measured crustal thickness and P/S velocity ratio over a densely sampled section ofthe North Anatolian Fault Zone, using a new transfer function approach that avoids deconvolution artifactsand accounts for a near-surface sediment layer. Our results show changes in crustal properties at bothstrands of the NAFZ: an increase in crustal thickness north of the northern strand, and an increase in velocityratio south of the southern strand. Given that the northern strand lies close to the Intra-Pontide Suture, weinterpret both strands of the NAFZ to follow preexisting geological features related to Tethyan accretionand to continue vertically through the full thickness of the crust. The association of thick crust with lowtopography at the north end of the study area indicates that a simple Airy isostatic model of the region isinsufficient and that the isostatic situation is likely to be complex, with a potentially significant influencefrom mantle density variations.
ReferencesArslan, S., U. Akin, and A. Alaca (2010), Investigation of crustal structure of Turkey by means of gravity data, Miner. Res. Expl. Bull., 140,
55–71.Barka, A., H. S. Akyüz, E. Altunel, and G. Sunal (2002), The surface rupture and slip distribution of the 17 August 1999 Izmit earthquake
(M 7.4) North Anatolian Fault, Bull. Seismol. Soc. Am., 92, 43–60.Bodin, T., H. Yuan, and B. Romanowicz (2014), Inversion of receiver functions without deconvolution—Application to the Indian craton,
Geophys. J. Int., 196, 1025–1033, doi:10.1093/gji/ggt431.Christensen, N. (1996), Poisson’s ratio and crustal seismology, J. Geophys. Res., 101, 3139–3156.
AcknowledgmentsFieldwork for this project was madepossible by NERC grant NE/I028017/1,Bogaziçi University Research Fund(BAP-project 6922), and SakaryaUniversity Research Fund (BAP-project2012-01-14-006). Instrumentationprovided by SEIS-UK and by KandilliObservatory and Earthquake ResearchInstitute. Data from this project will bearchived by the IRIS Data ManagementCentre.
The Editor thanks Andreas Fichtnerand an anonymous reviewer for theirassistance in evaluating this paper.
FREDERIKSEN ET AL. ©2015. The Authors. 6

Geophysical Research Letters 10.1002/2014GL062401
Dogan, B., O. Tüysüz, and F. B. Sanlı (2014), Tectonostratigraphic evolution of the basins on the southern branch of the North AnatolianFault System in the SE Marmara Region, Turkey, Int. J. Earth Sci., doi:10.1007/s00531-014-1083-9.
Fichtner, A., E. Saygin, T. Taymaz, P. Cupillard, Y. Capdeville, and J. Trampert (2013), The deep structure of the North Anatolian Fault Zone,Earth Planet. Sci. Lett., 373, 109–117, doi:10.1016/j.epsl.2013.04.027.
Flament, N., M. Gurnis, and R. D. Muller (2013), A review of observations and models of dynamic topography, Lithosphere, 5, 189–210,doi:10.1130/L245.1.
Gülen, L., A. Pınar, D. Kalafat, N. Özel, G. Horasan, M. Yılmazer, and A. M. Isıkara (2002), Surface fault breaks, aftershock distribution, andrupture process of the August 17 1999 Izmit, Turkey Earthquake, Bull. Seismol. Soc. Am., 92, 230–244.
Jarvis, A., H. I. Reuter, A. Nelson, and E. Guevara (2008), Hole-filled seamless SRTM data V4, International Centre for Tropical Agriculture(CIAT). [Available at http://srtm.csi.cgiar.org.]
Karimi, B., N. McQuarrie, J.-S. Lin, and W. Harbert (2014), Determining the geometry of the North Anatolian Fault east of the Marmara Seathrough integrated stress modeling and remote sensing techniques, Tectonophysics, 623, 14–22, doi:10.1016/j.tecto.2014.03.015.
Komazawa, M., H. Morikawa, and K. Nakamura (2002), Bedrock structure in Adapazarı, Turkey—A possible cause of severe damage bythe 1999 Kociaeli earthquake, Soil Dyn. Earthquake Eng., 22, 829–836.
Koulakov, I., D. Bindi, S. Parolai, H. Grosser, and C. Milkereit (2010), Distribution of seismic velocities and attenuation in the crust beneaththe North Anatolian Fault (Turkey) from Local Earthquake Tomography, Bull. Seismol. Soc. Am., 100, 207–224, doi:10.1785/0120090105.
Mutlu, A. K., and H. Karabulut (2011), Anisotropic Pn tomography of Turkey and adjacent regions, Geophys. J. Int., 187, 1743–1758,doi:10.1111/j.1365-246X.2011.05235.x.
Oguz, O., and T. Sasatani (2004), A site effect study of the Adapazarı basin, Turkey, from strong-and weak-motion data, J. Seismolog., 8,559–572.
Okay, A. I. (2008), Geology of Turkey: A synopsis, Anschnitt, 21, 19–42.Pavlis, N. K., S. A. Holmes, S. C. Kenyon, and J. K. Factor (2012), The development and evaluation of the Earth Gravitational Model 2008
(EGM2008), J. Geophys. Res., 117, B04406, doi:10.1029/2011JB008916.Platt, J. P., and W. M. Behr (2011), Deep structure of lithospheric fault zones, Geophys. Res. Lett., 38, L24308, doi:10.1029/2011GL049719.Salah, M. K., S. Sahin, and M. Kaplan (2007), Seismic velocity structure along the western segment of the North Anatolian fault zone
imaged by seismic tomography, Bull. Earthquake Res. Inst. Univ. Tokyo, 82, 209–223.Sari, C., and M. Salk (2006), Sediment thicknesses of the western Anatolia graben structures determined by 2D and 3D analysis using
gravity data, J. Asian Earth Sci., 26, 39–48, doi:10.1016/j.jseaes.2004.09.011.Sengör, A., O. Tüysüz, C. Imren, M. Sakınç, H. Eyidogan, N. Görür, X. Le Pichon, and C. Rangin (2005), The North Aanatolian Fault: A new
look, Annu. Rev. Earth Planet. Sci., 33, 37–112, doi:10.1146/annurev.earth.32.101802.120415.Sengör, A. M., and Y. Yilmaz (1981), Tethyan evolution of Turkey: A plate tectonic approach, Tectonophysics, 75, 181–241.Tezel, T., T. Shibutani, and B. Kaypak (2013), Crustal thickness of Turkey determined by receiver function, J. Asian Earth Sci., 75, 36–45,
doi:10.1016/j.jseaes.2013.06.016.Tigli, C. S., A. Ate, and A. Aydemir (2012), Geophysical investigations on the gravity and aeromagnetic anomalies of the region between
Sapanca and Düzce, along the North Anatolian Fault, Turkey, Phys. Earth Planet. Inter., 212–213, 19–31, doi:10.1016/j.pepi.2012.08.008.Vanacore, E. A., T. Taymaz, and E. Saygin (2013), Moho structure of the Anatolian Plate from receiver function analysis, Geophys. J. Int.,
193, 329–337, doi:10.1093/gji/ggs107.Walsh, E., R. Arnold, and M. K. Savage (2013), Silver and Chan revisited, J. Geophys. Res. Solid Earth, 118, 5500–5515,
doi:10.1002/jgrb.50386.Yeck, W. L., A. F. Sheehan, and V. Schulte-Pelkum (2013), Sequential H-k stacking to obtain accurate crustal thicknesses beneath
sedimentary basins, Bull. Seismol. Soc. Am., 103, 2142–2150, doi:10.1785/0120120290.Zelt, B. C., and R. M. Ellis (1999), Receiver-function studies in the Trans-Hudson orogen, Saskatchewan, Can. J. Earth Sci., 36, 585–603.Zhu, L., and H. Kanamori (2000), Moho depth variation in southern California from teleseismic receiver functions, J. Geophys. Res., 105,
2969–2980.
FREDERIKSEN ET AL. ©2015. The Authors. 7